| UNITED STATES | |||
| SECURITIES AND EXCHANGE COMMISSION | |||
| Washington, D.C. 20549 | |||
| FORM N-CSR | |||
| CERTIFIED SHAREHOLDER REPORT OF REGISTERED | |||
| MANAGEMENT INVESTMENT COMPANIES | |||
| Investment Company Act file number: (811-03386) | |||
| Exact name of registrant as specified in charter: | Putnam Global Health Care Fund | ||
| Address of principal executive offices: One Post Office Square, Boston, Massachusetts 02109 | |||
| Name and address of agent for service: | Beth S. Mazor, Vice President | ||
| One Post Office Square | |||
| Boston, Massachusetts 02109 | |||
| Copy to: | John W. Gerstmayr, Esq. | ||
| Ropes & Gray LLP | |||
| 800 Boylston Street | |||
| Boston, Massachusetts 02199-3600 | |||
| Registrant’s telephone number, including area code: | (617) 292-1000 | ||
| Date of fiscal year end: August 31, 2011 | |||
| Date of reporting period: September 1, 2010 — February 28, 2011 | |||
Item 1. Report to Stockholders:
The following is a copy of the report transmitted to stockholders pursuant to Rule 30e-1 under the Investment Company Act of 1940:
Putnam
Global Health Care
Fund
Semiannual report
2 | 28 | 11
| Message from the Trustees | 1 | ||
| About the fund | 2 | ||
| Performance snapshot | 4 | ||
| Interview with your fund’s portfolio managers | 5 | ||
| Your fund’s performance | 10 | ||
| Your fund’s expenses | 12 | ||
| Terms and definitions | 14 | ||
| Other information for shareholders | 15 | ||
| Financial statements | 16 | ||
Message from the Trustees
Dear Fellow Shareholder:
The U.S. economy and stock market continue to show resilience, even in the face of rising head winds around the globe. On March 9, 2011, U.S. equities marked the two-year anniversary of the beginning of the most powerful bull market since the 1950s, with the S&P 500 Index doubling from its 2009 low.
While Putnam maintains a positive outlook for U.S. equities and the overall economy in 2011, we believe volatility will punctuate the year ahead. Civil unrest in the Middle East and North Africa, high unemployment, rising oil prices, and Japan’s earthquake, tsunami, and nuclear crisis have all created a climate of uncertainty. In addition, the U.S. fixed-income market continues to struggle, as yields have risen and bond prices have fallen. We believe that Putnam’s active, research-intensive approach is well suited to uncovering opportunities in this environment.
In developments affecting oversight of your fund, we wish to thank Richard B. Worley and Myra R. Drucker, who have retired from the Board of Trustees, for their many years of dedicated and thoughtful leadership.
Lastly, we would like to take this opportunity to welcome new shareholders to the fund and to thank all of our investors for your continued confidence in Putnam.

About the fund
Investing in the health-care sector for almost 30 years
Since 1982, Putnam Global Health Care Fund has sought to capitalize on the growth potential of stocks in the health-care sector.
The fund invests across a range of industries, including manufacturers of medical devices, pharmaceutical firms that are developing innovative drugs and treatments, and health-care providers that can deliver high-quality care at a reasonable cost. Since many medical innovations happen overseas, the fund can invest in international as well as U.S. companies.
Besides its wide range of opportunities, the health-care sector offers another advantage for investors: Its products and services tend to stay in demand regardless of economic conditions. The fund invests in businesses at different stages of growth, from small, rapidly growing companies to large, established global corporations.
The fund’s portfolio managers invest with a long-term view and seek stocks that can help investors build wealth over time. Their disciplined investment process includes analyzing each company’s valuation, financial strength, competitive positioning, earnings, and cash flow. They conduct their intensive fundamental research with support from analysts on Putnam’s Global Equity Research team.
Consider these risks before investing: International investing involves certain risks, such as currency fluctuations, economic instability, and political developments. Additional risks may be associated with emerging-market securities, including illiquidity and volatility. The use of derivatives involves special risks and may result in losses. Growth stocks may be more susceptible to earnings disappointments, and value stocks may fail to rebound. The use of short selling may result in losses if the securities appreciate in value. The fund’s policy of concentrating on a limited group of industries and the fund’s non-diversified status, which means the fund may invest in fewer issuers, can increase the fund’s vulnerability to common economic forces and may result in greater losses and volatility.
Sector investing at Putnam
In recent decades, innovation and business growth have propelled stocks in different industries to market-leading performance. Finding these stocks, many of which are in international markets, requires rigorous research and in-depth knowledge of global markets.
Putnam’s sector funds invest in nine sectors worldwide and offer active management, risk controls, and the expertise of dedicated sector analysts. The funds’ managers invest with flexibility and precision, using fundamental research to hand select stocks for the portfolios.
All sectors in one fund:
Putnam Global Sector Fund
A portfolio of individual Putnam Global Sector Funds that provides exposure to all sectors of the MSCI World Index.
Individual sector funds:
Global Consumer Fund
Retail, hotels, restaurants, media, food and beverages
Global Energy Fund
Oil and gas, energy equipment and services
Global Financials Fund
Commercial banks, insurance, diversified financial services, mortgage finance
Global Health Care Fund
Pharmaceuticals, biotechnology, health-care services
Global Industrials Fund
Airlines, railroads, trucking, aerospace and defense, construction, commercial services
Global Natural Resources Fund
Metals, chemicals, oil and gas, forest products
Global Technology Fund
Software, computers, Internet services
Global Telecommunications Fund
Diversified and wireless telecommunications services
Global Utilities Fund
Electric, gas, and water utilities

| 2 | 3 |

Current performance may be lower or higher than the quoted past performance, which cannot guarantee future results. Share price, principal value, and return will fluctuate, and you may have a gain or a loss when you sell your shares. Performance of class A shares assumes reinvestment of distributions and does not account for taxes. Fund returns in the bar chart do not reflect a sales charge of 5.75%; had they, returns would have been lower. See pages 5 and 10–11 for additional performance information. For a portion of the periods, the fund had expense limitations, without which returns would have been lower. A short-term trading fee of 1% may apply to redemptions or exchanges from certain funds within the time period specified in the fund’s prospectus. To obtain the most recent month-end performance, visit putnam.com.
* The fund’s benchmark, the MSCI World Health Care Index (ND), was introduced on 1/1/01, which post-dates the inception of the fund’s class A shares.
† Returns for the six-month period are not annualized, but cumulative.
4
Interview with your fund’s portfolio managers
Kelsey Chen and Christopher Stevo
How did Putnam Global Health Care Fund perform for the six months ended February 28, 2011?
Kelsey: The fund’s class A shares delivered a solid return of 15.45% at net asset value for the period. However, the fund’s performance lagged that of its benchmark, which gained 16.33%, and the average 18.36% return of the fund’s Lipper peer group.
How did health-care stocks fare during the semiannual period?
Kelsey: The broad stock market delivered strong performance during the six-month period, with U.S. stocks advancing nearly 28%, as measured by the S&P 500 Index. Health-care stocks worldwide, however, struggled with some sector-specific issues and underperformed the broader market.
In the United States, health-care reform and the economic downturn continued to weigh on investors’ minds. The magnitude of the downturn made people less willing or less able to use health-care services and products, and we saw a sharp decrease in doctor visits and hospital procedures, especially elective procedures that could be easily postponed. We saw this trend even among those who remained employed and had health insurance coverage. In terms of health-care reform, uncertainty over its impact on business models dampened the performance of some stocks.
Chris: Health-care stocks in international markets also came under pressure during the period. This was particularly true in Europe, where many governments are cutting health-care spending in an effort to reduce budget deficits. In many cases, this means imposing
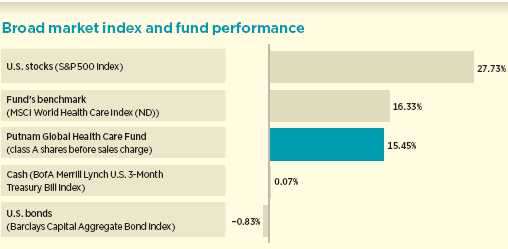
This comparison shows your fund’s performance in the context of broad market indexes for the six months ended 2/28/11. See pages 4 and 10–11 for additional fund performance information. Index descriptions can be found on page 14.
5
deeper price cuts on pharmaceuticals. This pricing pressure had a negative impact on companies that have significant exposure to the region.
Could you highlight some stock holdings that helped performance for the period?
Chris: One of the top performers for the fund was the stock of Covidien, a medical supply company headquartered in Dublin, Ireland. The company has been delivering earnings above expectations, and investors reacted positively when Standard & Poor’s announced that Covidien would be added to its S&P 500 Index. We continue to hold Covidien in the portfolio because we believe it is a reasonably valued stock and a fundamentally strong company that can continue growing at a healthy rate.
Kelsey: Another stock worth noting is that of United Therapeutics, a biotechnology company that specializes in treatments for chronic diseases. The company has delivered two quarters of strong financial results, and investors are optimistic about prospects for its most important product in development — oral Remodulin, a treatment for pulmonary arterial hypertension.
Low expectations actually led to strong performance for the stock of Aetna, a health-care benefits company, that serves approximately 35.3 million people. Health-care reform and the high unemployment rate led many investors to believe health-care benefits companies would suffer. However, Aetna has been able to deliver solid financial results that exceeded expectations and drove the stock’s performance during the period.
Which stock holdings detracted from returns during the period?
Chris: One detractor among the fund’s international holdings was the stock of Teva Pharmaceutical, an Israel-based generic drug company. Teva’s recent struggles have been related to one of its branded drugs, Copaxone, the number-one prescribed treatment for multiple sclerosis. Investors

Country allocations are shown as a percentage of the fund’s net assets. Summary information may differ from the portfolio schedule included in the financial statements due to the inclusion of derivative securities and the exclusion of as-of trades, if any, and the use of different classifications of securities for presentation purposes. Weightings will vary over time.
6
have become increasingly concerned about generic competition for the drug, which is a highly profitable product for Teva. The regulatory pathway is still unclear for generic competitors, but speculation has created negative sentiment toward Teva. We continued to hold Teva in the portfolio at the close of the period, primarily because of its attractive valuation.

Suzuken, a Japan-based drug distributor, also dampened fund performance for the period. The company’s financial performance has been disappointing to investors, and pressure on Suzuken’s operating margins has been more severe than expected. By the close of the period, we had sold Suzuken from the portfolio.
Kelsey: Two biotechnology firms that were standout performers during the fund’s last fiscal year — Dendreon and Human Genome Sciences — detracted from returns over the past six months. Last April, Dendreon’s stock rallied after the company received FDA approval for Provenge, a vaccine that stimulates a patient’s immune system to target and attack prostate cancer. Just after the close of the period, the FDA gave Dendreon approval to quadruple the production capacity of the drug, which extends the life of prostate cancer patients. However, the stock underperformed during the period mainly because of investor concerns about government reimbursement. Because of the high cost of the treatment, Medicare has undertaken a review to decide if it will cover the costs of Provenge. Dendreon stock declined as investors awaited this decision.
Human Genome Sciences stock got a boost last year after it completed two successful FDA Phase III trials for Benlysta, a drug that treats systemic lupus. However, the stock

This table shows the fund’s top 10 holdings and the percentage of the fund’s net assets that each represented as of 2/28/11. Short-term holdings are excluded. Holdings will vary over time.
7
was a detractor for the period as investors awaited FDA approval of Benlysta, which had been delayed as the FDA sought more time for further study. Shortly after the close of the semiannual period, in mid March, the FDA approved Benlysta to treat lupus, the first medication sanctioned for the condition in the United States since 1955.
How did you use derivatives in the portfolio?
Chris: Currency exchange rates had a slight positive effect on the fund’s returns. Generally, we use currency forward contracts as a low-cost way to hedge a portion of our currency exposure relative to our benchmark.
A significant portion of your portfolio is pharmaceutical companies, many of which will see patents expire on key drugs in the coming years. What is your perspective on this situation?
Kelsey: The patents on many of the world’s leading drugs are set to expire in 2011 and 2012, paving the way for lower-cost generic drugs. The loss of exclusivity on many of these top sellers means a potential loss of millions of dollars of revenue for the drug makers. We have been analyzing the strategies that companies have implemented to prepare for patent expirations. In some cases, cost-cutting measures introduced as a result of the recession have meant leaner, more efficient firms, which continue to generate profits. In the long term, the drive to make acquisitions and expand business may help pharmaceutical companies become more diversified and create more stable sources of income. While we are aware of the risks, we believe there may be long-term investment rewards as companies adjust. As always, we are closely monitoring the impact of industry pressures and analyzing individual holdings based on company fundamentals.
What is your outlook for the health-care sector overall?
Kelsey: We believe the health-care environment should be more stable this year than last year, when investors were dealing with so

This chart shows how the fund’s top weightings have changed over the past six months. Weightings are shown as a percentage of net assets. Summary information may differ from the portfolio schedule included in the financial statements due to the inclusion of derivative securities and the exclusion of as-of trades, if any, and the use of different classifications of securities for presentation purposes. Holdings will vary over time.
8
much uncertainty. Right now, we believe the key issues to watch are pricing pressures and use of health-care products and services. It appears certain that the pricing pressures will continue, but they are well understood; most companies have already provided estimates of the potential impact of health-care reform and austerity measures on their businesses.
As the economic recovery continues and employment picks up, we are hopeful that utilization will improve. And, over the longer term, as health-care reform takes effect, we anticipate that millions more people will have access to health insurance, which should boost that utilization.
Kelsey and Chris, thank you for your time and insights today.
The views expressed in this report are exclusively those of Putnam Management. They are not meant as investment advice.
Please note that the holdings discussed in this report may not have been held by the fund for the entire period. Portfolio composition is subject to review in accordance with the fund’s investment strategy and may vary in the future. Current and future portfolio holdings are subject to risk.

Portfolio Manager Kelsey Chen is Health Care Sector Team Leader at Putnam. She holds an M.B.A. from the Wharton School of the University of Pennsylvania, a Ph.D. from the University of Texas Medical School, and a B.S. from Wuhan University in Wuhan, China. Kelsey joined Putnam in 2000 and has been in the investment industry since 1999.

Portfolio Manager Christopher Stevo has an M.B.A. from The University of Chicago Booth School of Business and a B.S. from the Wharton School of the University of Pennsylvania. A CFA charterholder, he has been in the investment industry since he joined Putnam in 1999.
IN THE NEWS
Oil prices have surged in the past several months, pushed higher by political strife in Egypt and Libya and rising demand from around the globe. A barrel of Brent crude jumped to $111.80 on February 28, 2011, from $82.31 at the end of September 2010. With the United States showing signs of economic growth, the concern is that rising oil prices could tip the economy back into recession. If oil remains elevated for an extended time, consumer spending — the primary engine of GDP growth — could be significantly reduced. A more manageable price for oil today is generally considered to be between $90 and $100. This is not the first time in recent years that oil prices have exhibited significant price swings. In early July 2008, oil peaked at $146.08, but the global economic slowdown diminished worldwide demand for oil, knocking down the price to a low of $36.61 by late December of that year.
9
Your fund’s performance
This section shows your fund’s performance, price, and distribution information for periods ended February 28, 2011, the end of the first half of its current fiscal year. In accordance with regulatory requirements for mutual funds, we also include performance as of the most recent calendar quarter-end and expense information taken from the fund’s current prospectus. Performance should always be considered in light of a fund’s investment strategy. Data represent past performance. Past performance does not guarantee future results. More recent returns may be less or more than those shown. Investment return and principal value will fluctuate, and you may have a gain or a loss when you sell your shares. Performance information does not reflect any deduction for taxes a shareholder may owe on fund distributions or on the redemption of fund shares. For the most recent month-end performance, please visit the Individual Investors section at putnam.com or call Putnam at 1-800-225-1581. Class R and class Y shares are not available to all investors. See the Terms and Definitions section in this report for definitions of the share classes offered by your fund.
Fund performance Total return for periods ended 2/28/11
| Class A | Class B | Class C | Class M | Class R | Class Y | |||||
| (inception dates) | (5/28/82) | (3/1/93) | (7/26/99) | (7/3/95) | (1/21/03) | (4/4/00) | ||||
| NAV | POP | NAV | CDSC | NAV | CDSC | NAV | POP | NAV | NAV | |
| Annual average | ||||||||||
| (life of fund) | 11.42% | 11.19% | 10.51% | 10.51% | 10.59% | 10.59% | 10.79% | 10.65% | 11.14% | 11.53% |
| 10 years | 18.21 | 11.41 | 9.69 | 9.69 | 9.68 | 9.68 | 12.50 | 8.57 | 15.34 | 21.22 |
| Annual average | 1.69 | 1.09 | 0.93 | 0.93 | 0.93 | 0.93 | 1.18 | 0.83 | 1.44 | 1.94 |
| 5 years | 10.39 | 4.04 | 6.33 | 4.99 | 6.33 | 6.33 | 7.69 | 3.92 | 9.01 | 11.78 |
| Annual average | 2.00 | 0.80 | 1.24 | 0.98 | 1.24 | 1.24 | 1.49 | 0.77 | 1.74 | 2.25 |
| 3 years | 13.29 | 6.77 | 10.78 | 8.16 | 10.77 | 10.77 | 11.60 | 7.69 | 12.45 | 14.13 |
| Annual average | 4.25 | 2.21 | 3.47 | 2.65 | 3.47 | 3.47 | 3.73 | 2.50 | 3.99 | 4.50 |
| 1 year | 4.86 | –1.17 | 4.09 | –0.73 | 4.06 | 3.09 | 4.32 | 0.67 | 4.59 | 5.11 |
| 6 months | 15.45 | 8.82 | 15.04 | 10.04 | 15.03 | 14.03 | 15.17 | 11.14 | 15.34 | 15.61 |
Current performance may be lower or higher than the quoted past performance, which cannot guarantee future results. After-sales-charge returns (public offering price, or POP) for class A and M shares reflect a maximum 5.75% and 3.50% load, respectively. Class B share returns reflect the applicable contingent deferred sales charge (CDSC), which is 5% in the first year, declining over time to 1% in the sixth year, and is eliminated thereafter. Class C shares reflect a 1% CDSC for the first year that is eliminated thereafter. Class R and Y shares have no initial sales charge or CDSC. Performance for class B, C, M, R, and Y shares before their inception is derived from the historical performance of class A shares, adjusted for the applicable sales charge (or CDSC) and the higher operating expenses for such shares, except for class Y shares, for which 12b-1 fees are not applicable.
For a portion of the periods, the fund had expense limitations, without which returns would have been lower.
Class B share performance does not reflect conversion to class A shares.
A short-term trading fee of 1% may apply to redemptions or exchanges from certain funds within the time period specified in the fund’s prospectus.
10
Comparative index returns For periods ended 2/28/11
| MSCI World Health | Lipper Global Health/Biotechnology | |
| Care Index (ND) | Funds category average* | |
| Annual average (life of fund) | —† | 11.42% |
| 10 years | 21.39% | 38.55 |
| Annual average | 1.96 | 3.02 |
| 5 years | 11.62 | 12.57 |
| Annual average | 2.22 | 2.33 |
| 3 years | 5.70 | 10.11 |
| Annual average | 1.86 | 3.25 |
| 1 year | 7.10 | 8.24 |
| 6 months | 16.33 | 18.36 |
Index and Lipper results should be compared to fund performance at net asset value.
* Over the 6-month, 1-year, 3-year, 5-year, 10-year, and life-of-fund periods ended 2/28/11, there were 38, 37, 31, 26, 21, and 1 fund(s), respectively, in this Lipper category.
† The fund’s benchmark, the MSCI World Health Care Index (ND), was introduced on 1/1/01, which post-dates the inception of the fund’s class A shares.
Fund price and distribution information For the six-month period ended 2/28/11
| Distributions | Class A | Class B | Class C | Class M | Class R | Class Y | ||
| Number | 1 | 1 | 1 | 1 | 1 | 1 | ||
| Income | — | — | — | — | — | — | ||
| Capital gains — Long term | 2.350 | 2.350 | 2.350 | 2.350 | 2.350 | 2.350 | ||
| Capital gains — Short term | 0.600 | 0.600 | 0.600 | 0.600 | 0.600 | 0.600 | ||
| Total | $2.950 | $2.950 | $2.950 | $2.950 | $2.950 | $2.950 | ||
| Share value | NAV | POP | NAV | NAV | NAV | POP | NAV | NAV |
| 8/31/10 | $42.86 | $45.47 | $35.82 | $38.89 | $39.15 | $40.57 | $41.86 | $43.98 |
| 2/28/11 | 46.43 | 49.26 | 38.16 | 41.69 | 42.04 | 43.56 | 45.23 | 47.79 |
The classification of distributions, if any, is an estimate. Final distribution information will appear on your year-end tax forms.
11
Fund performance as of most recent calendar quarter
Total return for periods ended 3/31/11
| Class A | Class B | Class C | Class M | Class R | Class Y | |||||
| (inception dates) | (5/28/82) | (3/1/93) | (7/26/99) | (7/3/95) | (1/21/03) | (4/4/00) | ||||
| NAV | POP | NAV | CDSC | NAV | CDSC | NAV | POP | NAV | NAV | |
| Annual average | ||||||||||
| (life of fund) | 11.47% | 11.24% | 10.55% | 10.55% | 10.64% | 10.64% | 10.84% | 10.70% | 11.19% | 11.58% |
| 10 years | 36.77 | 28.92 | 26.92 | 26.92 | 26.93 | 26.93 | 30.18 | 25.63 | 33.44 | 40.26 |
| Annual average | 3.18 | 2.57 | 2.41 | 2.41 | 2.41 | 2.41 | 2.67 | 2.31 | 2.93 | 3.44 |
| 5 years | 13.87 | 7.33 | 9.68 | 8.31 | 9.71 | 9.71 | 11.10 | 7.23 | 12.47 | 15.34 |
| Annual average | 2.63 | 1.42 | 1.87 | 1.61 | 1.87 | 1.87 | 2.13 | 1.41 | 2.38 | 2.90 |
| 3 years | 19.57 | 12.70 | 16.91 | 14.15 | 16.93 | 16.93 | 17.82 | 13.71 | 18.69 | 20.50 |
| Annual average | 6.14 | 4.07 | 5.35 | 4.51 | 5.35 | 5.35 | 5.62 | 4.38 | 5.88 | 6.41 |
| 1 year | 2.91 | –3.01 | 2.17 | –2.56 | 2.16 | 1.20 | 2.41 | –1.16 | 2.66 | 3.18 |
| 6 months | 8.38 | 2.14 | 7.99 | 2.99 | 7.99 | 6.99 | 8.13 | 4.34 | 8.24 | 8.52 |
Your fund’s expenses
As a mutual fund investor, you pay ongoing expenses, such as management fees, distribution fees (12b-1 fees), and other expenses. Using the following information, you can estimate how these expenses affect your investment and compare them with the expenses of other funds. You may also pay one-time transaction expenses, including sales charges (loads) and redemption fees, which are not shown in this section and would have resulted in higher total expenses. For more information, see your fund’s prospectus or talk to your financial representative.
Expense ratios
| Class A | Class B | Class C | Class M | Class R | Class Y | |
| Total annual operating expenses for the fiscal year | ||||||
| ended 8/31/10 | 1.31% | 2.06% | 2.06% | 1.81% | 1.56% | 1.06% |
| Annualized expense ratio for the six-month period | ||||||
| ended 2/28/11 | 1.26% | 2.01% | 2.01% | 1.76% | 1.51% | 1.01% |
Fiscal-year expense information in this table is taken from the most recent prospectus, is subject to change, and may differ from that shown for the annualized expense ratio and in the financial highlights of this report. Expenses are shown as a percentage of average net assets.
12
Expenses per $1,000
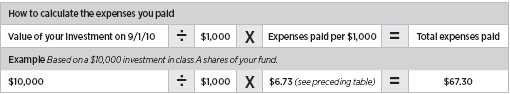
The following table shows the expenses you would have paid on a $1,000 investment in the fund from September 1, 2010, to February 28, 2011. It also shows how much a $1,000 investment would be worth at the close of the period, assuming actual returns and expenses.
| Class A | Class B | Class C | Class M | Class R | Class Y | |
| Expenses paid per $1,000*† | $6.73 | $10.72 | $10.72 | $9.39 | $8.06 | $5.40 |
| Ending value (after expenses) | $1,154.50 | $1,150.40 | $1,150.30 | $1,151.70 | $1,153.40 | $1,156.10 |
* Expenses for each share class are calculated using the fund’s annualized expense ratio for each class, which represents the ongoing expenses as a percentage of average net assets for the six months ended 2/28/11. The expense ratio may differ for each share class.
† Expenses are calculated by multiplying the expense ratio by the average account value for the period; then multiplying the result by the number of days in the period; and then dividing that result by the number of days in the year.
Estimate the expenses you paid
To estimate the ongoing expenses you paid for the six months ended February 28, 2011, use the following calculation method. To find the value of your investment on September 1, 2010, call Putnam at 1-800-225-1581.
Compare expenses using the SEC’s method
The Securities and Exchange Commission (SEC) has established guidelines to help investors assess fund expenses. Per these guidelines, the following table shows your fund’s expenses based on a $1,000 investment, assuming a hypothetical 5% annualized return. You can use this information to compare the ongoing expenses (but not transaction expenses or total costs) of investing in the fund with those of other funds. All mutual fund shareholder reports will provide this information to help you make this comparison. Please note that you cannot use this information to estimate your actual ending account balance and expenses paid during the period.
| Class A | Class B | Class C | Class M | Class R | Class Y | |
| Expenses paid per $1,000*† | $6.31 | $10.04 | $10.04 | $8.80 | $7.55 | $5.06 |
| Ending value (after expenses) | $1,018.55 | $1,014.83 | $1,014.83 | $1,016.07 | $1,017.31 | $1,019.79 |
* Expenses for each share class are calculated using the fund’s annualized expense ratio for each class, which represents the ongoing expenses as a percentage of average net assets for the six months ended 2/28/11. The expense ratio may differ for each share class.
† Expenses are calculated by multiplying the expense ratio by the average account value for the period; then multiplying the result by the number of days in the period; and then dividing that result by the number of days in the year.
13
Terms and definitions
Important terms
Total return shows how the value of the fund’s shares changed over time, assuming you held the shares through the entire period and reinvested all distributions in the fund.
Net asset value (NAV) is the price, or value, of one share of a mutual fund, without a sales charge. NAVs fluctuate with market conditions. NAV is calculated by dividing the net assets of each class of shares by the number of outstanding shares in the class.
Public offering price (POP) is the price of a mutual fund share plus the maximum sales charge levied at the time of purchase. POP performance figures shown here assume the 5.75% maximum sales charge for class A shares and 3.50% for class M shares.
Contingent deferred sales charge (CDSC) is generally a charge applied at the time of the redemption of class B or C shares and assumes redemption at the end of the period. Your fund’s class B CDSC declines over time from a 5% maximum during the first year to 1% during the sixth year. After the sixth year, the CDSC no longer applies. The CDSC for class C shares is 1% for one year after purchase.
Share classes
Class A shares are generally subject to an initial sales charge and no CDSC (except on certain redemptions of shares bought without an initial sales charge).
Class B shares are not subject to an initial sales charge. They may be subject to a CDSC.
Class C shares are not subject to an initial sales charge and are subject to a CDSC only if the shares are redeemed during the first year.
Class M shares have a lower initial sales charge and a higher 12b-1 fee than class A shares and no CDSC (except on certain redemptions of shares bought without an initial sales charge).
Class R shares are not subject to an initial sales charge or CDSC and are available only to certain defined contribution plans.
Class Y shares are not subject to an initial sales charge or CDSC, and carry no 12b-1 fee. They are generally only available to corporate and institutional clients and clients in other approved programs.
Comparative indexes
Barclays Capital Aggregate Bond Index is an unmanaged index of U.S. investment-grade fixed-income securities.
BofA (Bank of America) Merrill Lynch U.S. 3-Month Treasury Bill Index is an unmanaged index that seeks to measure the performance of U.S. Treasury bills available in the marketplace.
MSCI World Health Care Index (ND) is a free float-adjusted market capitalization weighted index that is designed to measure the equity market performance of developed markets in the health-care sector.
S&P 500 Index is an unmanaged index of common stock performance.
Indexes assume reinvestment of all distributions and do not account for fees. Securities and performance of a fund and an index will differ. You cannot invest directly in an index.
Lipper is a third-party industry-ranking entity that ranks mutual funds. Its rankings do not reflect sales charges. Lipper rankings are based on total return at net asset value relative to other funds that have similar current investment styles or objectives as determined by Lipper. Lipper may change a fund’s category assignment at its discretion. Lipper category averages reflect performance trends for funds within a category.
14
Other information for shareholders
Important notice regarding delivery of shareholder documents
In accordance with SEC regulations, Putnam sends a single copy of annual and semiannual shareholder reports, prospectuses, and proxy statements to Putnam shareholders who share the same address, unless a shareholder requests otherwise. If you prefer to receive your own copy of these documents, please call Putnam at 1-800-225-1581, and Putnam will begin sending individual copies within 30 days.
Proxy voting
Putnam is committed to managing our mutual funds in the best interests of our shareholders. The Putnam funds’ proxy voting guidelines and procedures, as well as information regarding how your fund voted proxies relating to portfolio securities during the 12-month period ended June 30, 2010, are available in the Individual Investors section of putnam.com, and on the SEC’s website, www.sec.gov. If you have questions about finding forms on the SEC’s website, you may call the SEC at 1-800-SEC-0330. You may also obtain the Putnam funds’ proxy voting guidelines and procedures at no charge by calling Putnam’s Shareholder Services at 1-800-225-1581.
Fund portfolio holdings
The fund will file a complete schedule of its portfolio holdings with the SEC for the first and third quarters of each fiscal year on Form N-Q. Shareholders may obtain the fund’s Forms N-Q on the SEC’s website at www.sec.gov. In addition, the fund’s Forms N-Q may be reviewed and copied at the SEC’s Public Reference Room in Washington, D.C. You may call the SEC at 1-800-SEC-0330 for information about the SEC’s website or the operation of the Public Reference Room.
Trustee and employee fund ownership
Putnam employees and members of the Board of Trustees place their faith, confidence, and, most importantly, investment dollars in Putnam mutual funds. As of February 28, 2011, Putnam employees had approximately $372,000,000 and the Trustees had approximately $69,000,000 invested in Putnam mutual funds. These amounts include investments by the Trustees’ and employees’ immediate family members as well as investments through retirement and deferred compensation plans.
15
Financial statements
A guide to financial statements
These sections of the report, as well as the accompanying Notes, constitute the fund’s financial statements.
The fund’s portfolio lists all the fund’s investments and their values as of the last day of the reporting period. Holdings are organized by asset type and industry sector, country, or state to show areas of concentration and diversification.
Statement of assets and liabilities shows how the fund’s net assets and share price are determined. All investment and non-investment assets are added together. Any unpaid expenses and other liabilities are subtracted from this total. The result is divided by the number of shares to determine the net asset value per share, which is calculated separately for each class of shares. (For funds with preferred shares, the amount subtracted from total assets includes the liquidation preference of preferred shares.)
Statement of operations shows the fund’s net investment gain or loss. This is done by first adding up all the fund’s earnings — from dividends and interest income — and subtracting its operating expenses to determine net investment income (or loss). Then, any net gain or loss the fund realized on the sales of its holdings — as well as any unrealized gains or losses over the period — is added to or subtracted from the net investment result to determine the fund’s net gain or loss for the fiscal period.
Statement of changes in net assets shows how the fund’s net assets were affected by the fund’s net investment gain or loss, by distributions to shareholders, and by changes in the number of the fund’s shares. It lists distributions and their sources (net investment income or realized capital gains) over the current reporting period and the most recent fiscal year-end. The distributions listed here may not match the sources listed in the Statement of operations because the distributions are determined on a tax basis and may be paid in a different period from the one in which they were earned. Dividend sources are estimated at the time of declaration. Actual results may vary. Any non-taxable return of capital cannot be determined until final tax calculations are completed after the end of the fund’s fiscal year.
Financial highlights provide an overview of the fund’s investment results, per-share distributions, expense ratios, net investment income ratios, and portfolio turnover in one summary table, reflecting the five most recent reporting periods. In a semiannual report, the highlights table also includes the current reporting period.
16
The fund’s portfolio 2/28/11 (Unaudited)
| COMMON STOCKS (99.2%)* | Shares | Value |
| Biotechnology (27.5%) | ||
| Acorda Therapeutics, Inc. † | 182,300 | $3,822,831 |
| Amarin Corp. PLC ADR (United Kingdom) † | 254,100 | 1,964,193 |
| Amgen, Inc. † | 287,300 | 14,747,109 |
| Amylin Pharmaceuticals, Inc. † | 294,500 | 4,505,850 |
| Arqule, Inc. † S | 593,905 | 3,783,175 |
| Auxilium Pharmaceuticals, Inc. † S | 1,008,200 | 22,654,254 |
| AVEO Pharmaceuticals, Inc. † S | 523,100 | 7,208,318 |
| BioMarin Pharmaceuticals, Inc. † S | 297,900 | 7,286,634 |
| Celgene Corp. † | 887,600 | 47,131,560 |
| Complete Genomics, Inc. † S | 325,280 | 2,374,544 |
| Dendreon Corp. † | 1,040,870 | 34,962,823 |
| Dyax Corp. † | 992,844 | 1,707,692 |
| Genzyme Corp. † | 992,324 | 74,870,846 |
| Human Genome Sciences, Inc. † | 1,027,500 | 25,718,325 |
| Incyte Corp., Ltd. † | 110,100 | 1,506,168 |
| Ironwood Pharmaceuticals, Inc. † | 898,239 | 10,985,463 |
| Momenta Pharmaceuticals, Inc. † S | 380,400 | 5,279,952 |
| United Therapeutics Corp. † S | 386,100 | 26,034,723 |
| Vertex Pharmaceuticals, Inc. † | 145,400 | 6,785,818 |
| WuXi PharmaTech (Cayman), Inc. ADR (China) † | 277,400 | 4,216,480 |
| 307,546,758 | ||
| Chemicals (0.3%) | ||
| Codexis, Inc. † | 270,822 | 2,886,963 |
| 2,886,963 | ||
| Electronics (0.1%) | ||
| Agilent Technologies, Inc. † | 26,100 | 1,098,288 |
| 1,098,288 | ||
| Food (0.5%) | ||
| Mead Johnson Nutrition Co. Class A | 28,500 | 1,705,725 |
| Synutra International, Inc. † S | 350,824 | 4,301,102 |
| 6,006,827 | ||
| Health-care services (11.7%) | ||
| Aetna, Inc. | 813,400 | 30,388,624 |
| AmerisourceBergen Corp. | 497,700 | 18,867,807 |
| Cardinal Health, Inc. | 248,860 | 10,362,530 |
| CIGNA Corp. | 394,700 | 16,605,029 |
| Coventry Health Care, Inc. † | 125,800 | 3,799,160 |
| Express Scripts, Inc. † | 40,700 | 2,288,154 |
| Fresenius Medical Care AG & Co., KGaA (Germany) | 76,542 | 5,068,604 |
| Fresenius Medical Care AG & Co., KGaA ADR (Germany) S | 21,210 | 1,407,920 |
| McKesson Corp. | 93,500 | 7,412,680 |
| Quest Diagnostics, Inc. | 284,500 | 16,145,375 |
| Sinopharm Group Co. (China) | 310,800 | 1,130,998 |
| WellPoint, Inc. † | 270,200 | 17,960,194 |
| 131,437,075 | ||
17
| COMMON STOCKS (99.2%)* cont. | Shares | Value |
| Medical technology (22.4%) | ||
| Baxter International, Inc. | 891,100 | $47,361,966 |
| Becton, Dickinson and Co. | 78,900 | 6,312,000 |
| China Kanghui Holdings, Inc. ADR (China) † | 96,439 | 1,616,318 |
| China Medical Technologies, Inc. ADR (China) † S | 944,800 | 12,414,673 |
| Covidien PLC (Ireland) | 796,800 | 40,995,360 |
| CSL, Ltd. (Australia) | 343,176 | 12,479,406 |
| Edwards Lifesciences Corp. † | 80,370 | 6,834,665 |
| Hospira, Inc. † | 280,900 | 14,845,566 |
| Life Technologies Corp. † | 395,200 | 21,091,824 |
| Medtronic, Inc. | 938,700 | 37,472,905 |
| Microport Scientific Corp. (China) † | 678,000 | 473,919 |
| Smith & Nephew PLC (United Kingdom) | 305,954 | 3,541,319 |
| St. Jude Medical, Inc. † | 263,400 | 12,611,592 |
| Synthes, Inc. (Switzerland) | 195 | 26,768 |
| Thermo Fisher Scientific, Inc. † | 266,200 | 14,859,284 |
| West Pharmaceutical Services, Inc. | 189,600 | 7,794,456 |
| Zimmer Holdings, Inc. † | 150,800 | 9,400,872 |
| 250,132,893 | ||
| Miscellaneous (0.5%) | ||
| ShangPharma Corp. ADR (China) † | 435,284 | 5,219,055 |
| 5,219,055 | ||
| Pharmaceuticals (35.4%) | ||
| Abbott Laboratories | 873,200 | 42,000,920 |
| Actelion NV (Switzerland) † | 79,636 | 4,419,936 |
| Astellas Pharma, Inc. (Japan) | 322,500 | 12,674,622 |
| Bayer AG (Germany) | 99,969 | 7,752,123 |
| Chelsea Therapeutics International, Ltd. † | 542,574 | 2,240,831 |
| GlaxoSmithKline PLC (United Kingdom) | 1,233,839 | 23,705,131 |
| Impax Laboratories, Inc. † | 52,800 | 1,087,152 |
| Johnson & Johnson | 803,500 | 49,367,040 |
| Merck & Co., Inc. | 1,067,300 | 34,761,962 |
| Mitsubishi Tanabe Pharma (Japan) | 229,500 | 3,896,417 |
| Novartis AG (Switzerland) | 626,234 | 35,127,898 |
| Pfizer, Inc. | 4,868,901 | 93,677,655 |
| Pharmasset, Inc. † | 108,602 | 5,430,100 |
| Roche Holding AG (Switzerland) | 38,484 | 5,804,919 |
| Sanofi-Aventis (France) | 351,455 | 24,255,673 |
| Sihuan Pharmaceutical Holdings Group, Ltd. (China) † | 1,928,000 | 1,176,251 |
| Somaxon Pharmaceuticals, Inc. † S | 1,961,700 | 5,983,185 |
| Teva Pharmaceutical Industries, Ltd. ADR (Israel) | 804,865 | 40,323,737 |
| Watson Pharmaceuticals, Inc. † | 42,700 | 2,390,773 |
| 396,076,325 | ||
| Retail (0.8%) | ||
| CVS Caremark Corp. | 277,100 | 9,160,926 |
| 9,160,926 | ||
| Total common stocks (cost $850,387,817) | $1,109,565,110 | |
18
| SHORT-TERM INVESTMENTS (5.6%)* | Principal amount/shares | Value |
| Putnam Cash Collateral Pool, LLC 0.21% d | 56,367,124 | $56,367,124 |
| Putnam Money Market Liquidity Fund 0.17% e | 3,190,266 | 3,190,266 |
| U.S. Treasury Bills for effective yields from 0.24 | ||
| to 0.26%, October 20, 2011 ## | $2,710,000 | 2,706,475 |
| U.S. Treasury Bills for an effective yield 0.31%, | ||
| March 10, 2011 | 801,000 | 800,937 |
| Total short-term investments (cost $63,060,220) | $63,064,802 | |
| TOTAL INVESTMENTS | ||
| Total investments (cost $913,448,037) | $1,172,629,912 | |
Key to holding’s abbreviations
| ADR | American Depository Receipts |
Notes to the fund’s portfolio
Unless noted otherwise, the notes to the fund’s portfolio are for the close of the fund’s reporting period, which ran from September 1, 2010 through February 28, 2011 (the reporting period).
* Percentages indicated are based on net assets of $1,118,471,642.
† Non-income-producing security.
## This security, in part or in entirety, was pledged and segregated with the custodian for collateral on certain derivatives contracts at the close of the reporting period.
d See Note 1 to the financial statements regarding securities lending. The rate quoted in the security description is the annualized 7-day yield of the fund at the close of the reporting period.
e See Note 6 to the financial statements regarding investments in Putnam Money Market Liquidity Fund. The rate quoted in the security description is the annualized 7-day yield of the fund at the close of the reporting period.
S Securities on loan, in part or in entirety, at the close of the reporting period.
At the close of the reporting period, the fund maintained liquid assets totaling $135,433 to cover certain derivatives contracts.
ADR after the name of a foreign holding represents ownership of foreign securities on deposit with a custodian bank.
| DIVERSIFICATION BY COUNTRY |
Distribution of investments by country of risk at the close of the reporting period (as a percentage of Portfolio Value):
| United States | 77.8% | France | 2.2% | |
| Switzerland | 4.0 | Japan | 1.4 | |
| Ireland | 3.7 | Germany | 1.3 | |
| Israel | 3.6 | Australia | 1.1 | |
| United Kingdom | 2.6 | Total | 100.0% | |
| China | 2.3 | |||
19
FORWARD CURRENCY CONTRACTS at 2/28/11 (aggregate face value $125,332,369) (Unaudited)
| Unrealized | ||||||
| Contract | Delivery | Aggregate | appreciation/ | |||
| Counterparty | Currency | type | date | Value | face value | (depreciation) |
| Bank of America, N.A. | ||||||
| Euro | Buy | 3/16/11 | $33,114,762 | $33,090,310 | $24,452 | |
| Citibank, N.A. | ||||||
| British Pound | Buy | 3/16/11 | 29,120,117 | 28,899,737 | 220,380 | |
| Danish Krone | Buy | 3/16/11 | 15,434,962 | 15,421,628 | 13,334 | |
| Credit Suisse AG | ||||||
| Japanese Yen | Buy | 3/16/11 | 18,732,462 | 18,824,594 | (92,132) | |
| HSBC Bank USA, National Association | ||||||
| Australian Dollar | Buy | 3/16/11 | 16,294,958 | 16,167,367 | 127,591 | |
| JPMorgan Chase Bank, N.A. | ||||||
| Swiss Franc | Buy | 3/16/11 | 13,023,623 | 12,928,733 | 94,890 | |
| Total | $388,515 | |||||
Accounting Standards Codification ASC 820 Fair Value Measurements and Disclosures (ASC 820) establishes a three-level hierarchy for disclosure of fair value measurements. The valuation hierarchy is based upon the transparency of inputs to the valuation of the fund’s investments. The three levels are defined as follows:
Level 1 — Valuations based on quoted prices for identical securities in active markets.
Level 2 — Valuations based on quoted prices in markets that are not active or for which all significant inputs are observable, either directly or indirectly.
Level 3 — Valuations based on inputs that are unobservable and significant to the fair value measurement.
The following is a summary of the inputs used to value the fund’s net assets as of the close of the reporting period:
| Valuation inputs | ||||||
| Investments in securities: | Level 1 | Level 2 | Level 3 | |||
| Common stocks: | ||||||
| Basic materials | $2,886,963 | $— | $— | |||
| Consumer staples | 15,167,753 | — | — | |||
| Health care | 1,053,361,438 | 31,831,613 | — | |||
| Miscellaneous | 5,219,055 | — | — | |||
| Technology | 1,098,288 | — | — | |||
| Total common stocks | 1,077,733,497 | 31,831,613 | — | |||
| Short-term investments | 3,190,266 | 59,874,536 | — | |||
| Totals by level | $1,080,923,763 | $91,706,149 | $— | |||
| Valuation inputs | ||||||
| Other financial instruments: | Level 1 | Level 2 | Level 3 | |||
| Forward currency contracts | — | 388,515 | — | |||
| Totals by level | $— | $388,515 | $— | |||
The accompanying notes are an integral part of these financial statements.
20
Statement of assets and liabilities 2/28/11 (Unaudited)
| ASSETS | |
| Investment in securities, at value, including $54,889,753 of securities on loan (Note 1): | |
| Unaffiliated issuers (identified cost $853,890,647) | $1,113,072,522 |
| Affiliated issuers (identified cost $59,557,390) (Notes 1 and 6) | 59,557,390 |
| Dividends, interest and other receivables | 4,220,337 |
| Receivable for shares of the fund sold | 176,159 |
| Receivable for investments sold | 5,320,460 |
| Foreign tax reclaim | 1,182,573 |
| Unrealized appreciation on forward currency contracts (Note 1) | 480,647 |
| Total assets | 1,184,010,088 |
| LIABILITIES | |
| Payable to custodian | 468,411 |
| Payable for investments purchased | 4,682,707 |
| Payable for shares of the fund repurchased | 2,109,113 |
| Payable for compensation of Manager (Note 2) | 539,331 |
| Payable for investor servicing fees (Note 2) | 264,861 |
| Payable for custodian fees (Note 2) | 13,034 |
| Payable for Trustee compensation and expenses (Note 2) | 358,210 |
| Payable for administrative services (Note 2) | 4,117 |
| Payable for distribution fees (Note 2) | 468,318 |
| Collateral on securities loaned, at value (Note 1) | 56,367,124 |
| Unrealized depreciation on forward currency contracts (Note 1) | 92,132 |
| Other accrued expenses | 171,088 |
| Total liabilities | 65,538,446 |
| Net assets | $1,118,471,642 |
| REPRESENTED BY | |
| Paid-in capital (Unlimited shares authorized) (Notes 1 and 4) | $831,459,240 |
| Undistributed net investment income (Note 1) | 4,371,636 |
| Accumulated net realized gain on investments and foreign currency transactions (Note 1) | 22,950,924 |
| Net unrealized appreciation of investments and assets and liabilities in foreign currencies | 259,689,842 |
| Total — Representing net assets applicable to capital shares outstanding | $1,118,471,642 |
(Continued on next page)
21
Statement of assets and liabilities (Continued)
| COMPUTATION OF NET ASSET VALUE AND OFFERING PRICE | |
| Net asset value and redemption price per class A share ($1,026,247,285 divided by 22,102,870 shares) | $46.43 |
| Offering price per class A share (100/94.25 of $46.43)* | $49.26 |
| Net asset value and offering price per class B share ($41,013,931 divided by 1,074,909 shares)** | $38.16 |
| Net asset value and offering price per class C share ($18,709,132 divided by 448,775 shares)** | $41.69 |
| Net asset value and redemption price per class M share ($10,942,436 divided by 260,276 shares) | $42.04 |
| Offering price per class M share (100/96.50 of $42.04)* | $43.56 |
| Net asset value, offering price and redemption price per class R share | |
| ($2,110,969 divided by 46,677 shares) | $45.23 |
| Net asset value, offering price and redemption price per class Y share | |
| ($19,447,889 divided by 406,921 shares) | $47.79 |
* On single retail sales of less than $50,000. On sales of $50,000 or more the offering price is reduced.
** Redemption price per share is equal to net asset value less any applicable contingent deferred sales charge.
The accompanying notes are an integral part of these financial statements.
22
Statement of operations Six months ended 2/28/11 (Unaudited)
| INVESTMENT INCOME | |
| Dividends (net of foreign tax of $267,020) | $9,271,535 |
| Interest (including interest income of $34,204 from investments in affiliated issuers) (Note 6) | 38,723 |
| Securities lending | 302,681 |
| Total investment income | 9,612,939 |
| EXPENSES | |
| Compensation of Manager (Note 2) | 3,506,953 |
| Investor servicing fees (Note 2) | 1,882,774 |
| Custodian fees (Note 2) | 13,032 |
| Trustee compensation and expenses (Note 2) | 59,880 |
| Administrative services (Note 2) | 8,715 |
| Distribution fees — Class A (Note 2) | 1,270,694 |
| Distribution fees — Class B (Note 2) | 216,676 |
| Distribution fees — Class C (Note 2) | 94,475 |
| Distribution fees — Class M (Note 2) | 41,262 |
| Distribution fees — Class R (Note 2) | 4,736 |
| Other | 167,163 |
| Total expenses | 7,266,360 |
| Expense reduction (Note 2) | (26,994) |
| Net expenses | 7,239,366 |
| Net investment income | 2,373,573 |
| Net realized gain on investments (Notes 1 and 3) | 27,737,488 |
| Net realized gain on foreign currency transactions (Note 1) | 6,942,731 |
| Net realized gain on written options (Notes 1 and 3) | 846,090 |
| Net unrealized appreciation of assets and liabilities in foreign currencies during the period | 2,920,564 |
| Net unrealized appreciation of investments and written options during the period | 118,123,064 |
| Net gain on investments | 156,569,937 |
| Net increase in net assets resulting from operations | $158,943,510 |
The accompanying notes are an integral part of these financial statements.
23
Statement of changes in net assets
| INCREASE (DECREASE) IN NET ASSETS | Six months ended 2/28/11* | Year ended 8/31/10 |
| Operations: | ||
| Net investment income | $2,373,573 | $2,577,592 |
| Net realized gain on investments and foreign | ||
| currency transactions | 35,526,309 | 70,667,563 |
| Net unrealized appreciation (depreciation) of investments | ||
| and assets and liabilities in foreign currencies | 121,043,628 | (76,334,871) |
| Net increase (decrease) in net assets resulting from operations | 158,943,510 | (3,089,716) |
| Distributions to shareholders (Note 1): | ||
| Net realized short-term gain on investments | ||
| Class A | (12,895,435) | — |
| Class B | (646,934) | — |
| Class C | (264,638) | — |
| Class M | (152,282) | — |
| Class R | (24,378) | — |
| Class Y | (243,517) | — |
| From net realized long-term gain on investments | ||
| Class A | (50,507,120) | (3,742,830) |
| Class B | (2,533,823) | (263,800) |
| Class C | (1,036,499) | (78,585) |
| Class M | (596,437) | (45,345) |
| Class R | (95,480) | (6,082) |
| Class Y | (953,776) | (63,570) |
| Increase in capital from settlement payments | 4,655 | 48,618 |
| Redemption fees (Note 1) | 4,067 | 11,845 |
| Decrease from capital share transactions (Note 4) | (28,488,345) | (135,253,521) |
| Total increase (decrease) in net assets | 60,513,568 | (142,482,986) |
| NET ASSETS | ||
| Beginning of period | 1,057,958,074 | 1,200,441,060 |
| End of period (including undistributed net investment income | ||
| of $4,371,636 and $1,998,063, respectively) | $1,118,471,642 | $1,057,958,074 |
* Unaudited
The accompanying notes are an integral part of these financial statements.
24
| This page left blank intentionally. |
25
Financial highlights (For a common share outstanding throughout the period)
| INVESTMENT OPERATIONS: | LESS DISTRIBUTIONS: | RATIOS AND SUPPLEMENTAL DATA: | |||||||||||||
| Ratio | |||||||||||||||
| Net asset | Net realized | Ratio | of net investment | ||||||||||||
| value, | and unrealized | Total from | From | From | Total return | Net assets, | of expenses | income (loss) | |||||||
| beginning | Net investment | gain (loss) | investment | net investment | net realized gain | Total | Redemption | Non-recurring | Net asset value, | at net asset | end of period | to average | to average | Portfolio | |
| Period ended | of period | income (loss) a | on investments | operations | income | on investments | distributions | fees b | reimbursements | end of period | value (%) c | (in thousands) | net assets (%) d | net assets (%) | turnover (%) |
| Class A | |||||||||||||||
| February 28, 2011** | $42.86 | .11 | 6.41 | 6.52 | — | (2.95) | (2.95) | — | — g | $46.43 | 15.45 * | $1,026,247 | .63* | .23* | 19* |
| August 31, 2010 | 43.37 | .12 | (.48) | (.36) | — | (.15) | (.15) | — | — h | 42.86 | (.85) | 965,357 | 1.33 | .27 | 40 |
| August 31, 2009 | 53.94 | .07 | (5.55) | (5.48) | — | (5.09) | (5.09) | — | — i | 43.37 | (8.11) | 1,074,478 | 1.38 j | .17 j | 27 |
| August 31, 2008 | 58.65 | .01 | 1.61 | 1.62 | (.29) | (6.04) | (6.33) | — | — | 53.94 | 2.84 | 1,371,196 | 1.23 j | .02 j | 19 |
| August 31, 2007 | 63.67 | .31 e | .78 | 1.09 | (.24) | (5.87) | (6.11) | — | — | 58.65 | 1.83 | 1,593,722 | 1.17 j | .51 e,j | 12 |
| August 31, 2006 | 64.87 | .02 f | 3.29 | 3.31 | — | (4.51) | (4.51) | — | — | 63.67 | 5.28 f | 1,792,142 | 1.10 f,j | .04 f,j | 17 |
| Class B | |||||||||||||||
| February 28, 2011** | $35.82 | (.06) | 5.35 | 5.29 | — | (2.95) | (2.95) | — | — g | $38.16 | 15.04 * | $41,014 | 1.00* | (.15)* | 19* |
| August 31, 2010 | 36.54 | (.20) | (.37) | (.57) | — | (.15) | (.15) | — | — h | 35.82 | (1.59) | 43,666 | 2.08 | (.48) | 40 |
| August 31, 2009 | 46.82 | (.20) | (4.99) | (5.19) | — | (5.09) | (5.09) | — | — i | 36.54 | (8.79) | 73,170 | 2.13 j | (.57) j | 27 |
| August 31, 2008 | 51.80 | (.34) | 1.40 | 1.06 | — | (6.04) | (6.04) | — | — | 46.82 | 2.06 | 149,621 | 1.98 j | (.74) j | 19 |
| August 31, 2007 | 57.11 | (.16) e | .72 | .56 | — | (5.87) | (5.87) | — | — | 51.80 | 1.06 | 280,338 | 1.92 j | (.28) e,j | 12 |
| August 31, 2006 | 59.06 | (.41) f | 2.97 | 2.56 | — | (4.51) | (4.51) | — | — | 57.11 | 4.49 f | 568,991 | 1.85 f,j | (.72) f,j | 17 |
| Class C | |||||||||||||||
| February 28, 2011** | $38.89 | (.06) | 5.81 | 5.75 | — | (2.95) | (2.95) | — | — g | $41.69 | 15.03 * | $18,709 | 1.00* | (.14)* | 19* |
| August 31, 2010 | 39.67 | (.20) | (.43) | (.63) | — | (.15) | (.15) | — | — h | 38.89 | (1.61) | 18,049 | 2.08 | (.48) | 40 |
| August 31, 2009 | 50.24 | (.21) | (5.27) | (5.48) | — | (5.09) | (5.09) | — | — i | 39.67 | (8.77) | 21,171 | 2.13 j | (.57) j | 27 |
| August 31, 2008 | 55.15 | (.36) | 1.49 | 1.13 | — | (6.04) | (6.04) | — | — | 50.24 | 2.06 | 26,421 | 1.98 j | (.73) j | 19 |
| August 31, 2007 | 60.42 | (.14) e | .74 | .60 | — | (5.87) | (5.87) | — | — | 55.15 | 1.07 | 31,829 | 1.92 j | (.24) e,j | 12 |
| August 31, 2006 | 62.22 | (.43) f | 3.14 | 2.71 | — | (4.51) | (4.51) | — | — | 60.42 | 4.50 f | 39,632 | 1.85 f,j | (.71) f,j | 17 |
| Class M | |||||||||||||||
| February 28, 2011** | $39.15 | (.01) | 5.85 | 5.84 | — | (2.95) | (2.95) | — | — g | $42.04 | 15.17 * | $10,942 | .88* | (.02)* | 19* |
| August 31, 2010 | 39.83 | (.10) | (.43) | (.53) | — | (.15) | (.15) | — | — h | 39.15 | (1.35) | 10,530 | 1.83 | (.23) | 40 |
| August 31, 2009 | 50.30 | (.12) | (5.26) | (5.38) | — | (5.09) | (5.09) | — | — i | 39.83 | (8.54) | 12,299 | 1.88 j | (.33) j | 27 |
| August 31, 2008 | 55.08 | (.24) | 1.50 | 1.26 | — | (6.04) | (6.04) | — | — | 50.30 | 2.32 | 16,981 | 1.73 j | (.48) j | 19 |
| August 31, 2007 | 60.21 | — b,e | .74 | .74 | — | (5.87) | (5.87) | — | — | 55.08 | 1.33 | 21,567 | 1.67 j | (.01) e,j | 12 |
| August 31, 2006 | 61.88 | (.28) f | 3.12 | 2.84 | — | (4.51) | (4.51) | — | — | 60.21 | 4.75 f | 27,134 | 1.60 f,j | (.47) f,j | 17 |
| Class R | |||||||||||||||
| February 28, 2011** | $41.86 | .06 | 6.26 | 6.32 | — | (2.95) | (2.95) | — | — g | $45.23 | 15.34 * | $2,111 | .75* | .13* | 19* |
| August 31, 2010 | 42.47 | .01 | (.47) | (.46) | — | (.15) | (.15) | — | — h | 41.86 | (1.11) | 1,766 | 1.58 | .02 | 40 |
| August 31, 2009 | 53.08 | (.03) | (5.49) | (5.52) | — | (5.09) | (5.09) | — | — i | 42.47 | (8.34) | 1,638 | 1.63 j | (.07) j | 27 |
| August 31, 2008 | 57.87 | (.12) | 1.58 | 1.46 | (.21) | (6.04) | (6.25) | — | — | 53.08 | 2.57 | 1,254 | 1.48 j | (.24) j | 19 |
| August 31, 2007 | 62.97 | .16 e | .77 | .93 | (.16) | (5.87) | (6.03) | — | — | 57.87 | 1.58 | 993 | 1.42 j | .27 e,j | 12 |
| August 31, 2006 | 64.36 | (.12) f | 3.24 | 3.12 | — | (4.51) | (4.51) | — | — | 62.97 | 5.02 f | 733 | 1.35 f,j | (.19) f,j | 17 |
| Class Y | |||||||||||||||
| February 28, 2011** | $43.98 | .17 | 6.59 | 6.76 | — | (2.95) | (2.95) | — | — g | $47.79 | 15.61 * | $19,448 | .50* | .35* | 19* |
| August 31, 2010 | 44.40 | .25 | (.52) | (.27) | — | (.15) | (.15) | — | — h | 43.98 | (.63) | 18,590 | 1.08 | .52 | 40 |
| August 31, 2009 | 54.93 | .18 | (5.62) | (5.44) | — | (5.09) | (5.09) | — | — i | 44.40 | (7.87) | 17,685 | 1.13 j | .43 j | 27 |
| August 31, 2008 | 59.63 | .15 | 1.64 | 1.79 | (.45) | (6.04) | (6.49) | — | — | 54.93 | 3.10 | 17,761 | .98 j | .27 j | 19 |
| August 31, 2007 | 64.64 | .44 e | .82 | 1.26 | (.40) | (5.87) | (6.27) | — | — | 59.63 | 2.09 | 18,835 | .92 j | .71 e,j | 12 |
| August 31, 2006 | 65.64 | .18 f | 3.33 | 3.51 | — | (4.51) | (4.51) | — | — | 64.64 | 5.54 f | 25,591 | .85 f,j | .28 f,j | 17 |
See notes to financial highlights at the end of this section.
The accompanying notes are an integral part of these financial statements.
| 26 | 27 |
Financial highlights (Continued)
* Not annualized.
** Unaudited.
a Per share net investment income (loss) has been determined on the basis of the weighted average number of shares outstanding during the period.
b Amount represents less than $0.01 per share.
c Total return assumes dividend reinvestment and does not reflect the effect of sales charges.
d Includes amounts paid through expense offset and brokerage service arrangements (Note 2).
e Reflects a special dividend received by the fund which amounted to the following amounts:
| Percentage of | ||
| Per share | average net assets | |
| Class A | $0.33 | 0.54% |
| Class B | 0.29 | 0.53 |
| Class C | 0.31 | 0.54 |
| Class M | 0.31 | 0.53 |
| Class R | 0.32 | 0.53 |
| Class Y | 0.31 | 0.51 |
f Reflects a non-recurring accrual related to a reimbursement from Putnam Investments relating to the calculation of certain amounts paid by the fund to Putnam in previous years for transfer agent services, which amounted to $0.01 per share and 0.02% of average net assets for the period ended August 31, 2006.
g Reflects a non-recurring reimbursement pursuant to a settlement between the Securities and Exchange Commission (the SEC) and Zurich Capital Markets, Inc., which amounted to less than $0.01 per share outstanding as of December 21, 2010.
h Reflects a non-recurring reimbursement pursuant to a settlement between the SEC and Prudential Securities, Inc., which amounted to less than $0.01 per share outstanding on March 31, 2010.
i Reflects non-recurring reimbursement pursuant to a settlement between the SEC and Bear Stearns & Co., Inc. and Bear Stearns Securities Corp. which amounted to less than $0.01 per share outstanding as of May 21, 2009.
j Reflects an involuntary contractual expense limitation and/or waivers of certain fund expenses in connection with investments in Putnam Prime Money Market Fund in effect during the period. As a result of such limitation and/or waivers, the expenses of each class reflect a reduction of the following amounts:
| Percentage of | |
| average net assets | |
| August 31, 2009 | <0.01% |
| August 31, 2008 | <0.01 |
| August 31, 2007 | <0.01 |
| August 31, 2006 | <0.01 |
The accompanying notes are an integral part of these financial statements.
28
Notes to financial statements 2/28/11 (Unaudited)
Note 1: Significant accounting policies
Putnam Global Health Care Fund (the fund), is a Massachusetts business trust, which is registered under the Investment Company Act of 1940, as amended, as a non-diversified, open-end management investment company. The investment objective of the fund is to seek capital appreciation by investing primarily in the common stocks of companies worldwide in the health care industries that Putnam Investment Management, LLC (Putnam Management), the fund’s manager, an indirect wholly-owned subsidiary of Putnam Investments, LLC, believes have favorable potential. The fund concentrates its investments in one sector which involves more risk than a fund that invests more broadly.
The fund offers class A, class B, class C, class M, class R and class Y shares. Class A and class M shares are sold with a maximum front-end sales charge of 5.75% and 3.50%, respectively, and generally do not pay a contingent deferred sales charge. Class B shares, which convert to class A shares after approximately eight years, do not pay a front-end sales charge and are subject to a contingent deferred sales charge if those shares are redeemed within six years of purchase. Class C shares have a one-year 1.00% contingent deferred sales charge and do not convert to class A shares. Class R shares, which are not available to all investors, are sold at net asset value. The expenses for class A, class B, class C, class M and class R shares may differ based on the distribution fee of each class, which is identified in Note 2. Class Y shares, which are sold at net asset value, are generally subject to the same expenses as class A, class B, class C, class M and class R shares, but do not bear a distribution fee. Class Y shares are not available to all investors.
A 1.00% redemption fee may apply on any shares that are redeemed (either by selling or exchanging into another fund) within 90 days of purchase. The redemption fee is accounted for as an addition to paid-in-capital.
Investment income, realized and unrealized gains and losses and expenses of the fund are borne pro-rata based on the relative net assets of each class to the total net assets of the fund, except that each class bears expenses unique to that class (including the distribution fees applicable to such classes). Each class votes as a class only with respect to its own distribution plan or other matters on which a class vote is required by law or determined by the Trustees. If the fund were liquidated, shares of each class would receive their pro-rata share of the net assets of the fund. In addition, the Trustees declare separate dividends on each class of shares.
In the normal course of business, the fund enters into contracts that may include agreements to indemnify another party under given circumstances. The fund’s maximum exposure under these arrangements is unknown as this would involve future claims that may be, but have not yet been, made against the fund. However, the fund’s management team expects the risk of material loss to be remote.
The following is a summary of significant accounting policies consistently followed by the fund in the preparation of its financial statements. The preparation of financial statements is in conformity with accounting principles generally accepted in the United States of America and requires management to make estimates and assumptions that affect the reported amounts of assets and liabilities in the financial statements and the reported amounts of increases and decreases in net assets from operations. Actual results could differ from those estimates. Subsequent events after the Statement of assets and liabilities date through the date that the financial statements were issued have been evaluated in the preparation of the financial statements. Unless otherwise noted, the “reporting period” represents the period from September 1, 2010 through February 28, 2011.
A) Security valuation Investments for which market quotations are readily available are valued at the last reported sales price on their principal exchange, or official closing price for certain markets, and are classified as Level 1 securities. If no sales are reported — as in the case of some securities traded over-the-counter — a security is valued at its last reported bid price and is generally categorized as a Level 2 security.
Many securities markets and exchanges outside the U.S. close prior to the close of the New York Stock Exchange and therefore the closing prices for securities in such markets or on such exchanges may not fully reflect events that occur after such close but before the close of the New York Stock Exchange. Accordingly, on certain days, the fund will fair value foreign equity securities taking into account multiple factors, including movements in the U.S. securities markets, currency valuations and comparisons to the valuation of American Depository Receipts, exchange-traded funds and futures contracts. These securities, which will generally represent a transfer from a Level 1 to a Level 2 security, will be classified as Level 2. The number of days on which fair value prices will be used will depend on market activity and it is possible that fair value prices will be used by the fund to a significant
29
extent. At the close of the reporting period, fair value pricing was used for certain foreign securities in the portfolio. Securities quoted in foreign currencies, if any, are translated into U.S. dollars at the current exchange rate.
To the extent a pricing service or dealer is unable to value a security or provides a valuation that Putnam Management does not believe accurately reflects the security’s fair value, the security will be valued at fair value by Putnam Management. Certain investments, including certain restricted and illiquid securities and derivatives, are also valued at fair value following procedures approved by the Trustees. These valuations consider such factors as significant market or specific security events such as interest rate or credit quality changes, various relationships with other securities, discount rates, U.S. Treasury, U.S. swap and credit yields, index levels, convexity exposures and recovery rates. These securities are classified as Level 2 or as Level 3 depending on the priority of the significant inputs.
Such valuations and procedures are reviewed periodically by the Trustees. The fair value of securities is generally determined as the amount that the fund could reasonably expect to realize from an orderly disposition of such securities over a reasonable period of time. By its nature, a fair value price is a good faith estimate of the value of a security in a current sale and does not reflect an actual market price, which may be different by a material amount.
B) Security transactions and related investment income Security transactions are recorded on the trade date (the date the order to buy or sell is executed). Gains or losses on securities sold are determined on the identified cost basis. Interest income is recorded on the accrual basis. Dividend income, net of applicable withholding taxes, is recognized on the ex-dividend date except that certain dividends from foreign securities, if any, are recognized as soon as the fund is informed of the ex-dividend date.
Non-cash dividends, if any, are recorded at the fair market value of the securities received. Dividends representing a return of capital or capital gains, if any, are reflected as a reduction of cost and/or as a realized gain.
C) Foreign currency translation The accounting records of the fund are maintained in U.S. dollars. The market value of foreign securities, currency holdings, and other assets and liabilities is recorded in the books and records of the fund after translation to U.S. dollars based on the exchange rates on that day. The cost of each security is determined using historical exchange rates. Income and withholding taxes are translated at prevailing exchange rates when earned or incurred. The fund does not isolate that portion of realized or unrealized gains or losses resulting from changes in the foreign exchange rate on investments from fluctuations arising from changes in the market prices of the securities. Such gains and losses are included with the net realized and unrealized gain or loss on investments. Net realized gains and losses on foreign currency transactions represent net realized exchange gains or losses on closed forward currency contracts, disposition of foreign currencies, currency gains and losses realized between the trade and settlement dates on securities transactions and the difference between the amount of investment income and foreign withholding taxes recorded on the fund’s books and the U.S. dollar equivalent amounts actually received or paid. Net unrealized appreciation and depreciation of assets and liabilities in foreign currencies arise from changes in the value of open forward currency contracts and assets and liabilities other than investments at the period end, resulting from changes in the exchange rate. Investments in foreign securities involve certain risks, including those related to economic instability, unfavorable political developments, and currency fluctuations, not present with domestic investments. The fund may be subject to taxes imposed by governments of countries in which it invests. Such taxes are generally based on either income or gains earned or repatriated. The fund accrues and applies such taxes to net investment income, net realized gains and net unrealized gains as income and/or capital gains are earned. In some cases, the fund may be entitled to reclaim all or a portion of such taxes, and such reclaim amounts, if any, are reflected as an asset on the fund’s books. In many cases, however, the fund may not receive such amounts for an extended period of time, depending on the country of investment.
D) Options contracts The fund uses options contracts to hedge against changes in values of securities it owns, owned or expects to own. The potential risk to the fund is that the change in value of options contracts may not correspond to the change in value of the hedged instruments. In addition, losses may arise from changes in the value of the underlying instruments if there is an illiquid secondary market for the contracts, if interest or exchange rates move unexpectedly or if the counterparty to the contract is unable to perform. Realized gains and losses on purchased options are included in realized gains and losses on investment securities. If a written call option is exercised, the premium originally received is recorded as an addition to sales proceeds. If a written put option is exercised, the premium originally received is recorded as a reduction to the cost of investments.
Exchange traded options are valued at the last sale price or, if no sales are reported, the last bid price for purchased options and the last ask price for written options. Options traded over-the-counter are valued using prices supplied by dealers. Written option contracts outstanding at period end, if any, are listed after the fund’s portfolio. See Note 3 for the volume of written options contracts activity for the reporting period. The fund had an average contract amount of approximately 200,000 on purchased options contracts for the reporting period.
30
E) Forward currency contracts The fund buys and sells forward currency contracts, which are agreements between two parties to buy and sell currencies at a set price on a future date. These contracts are used to hedge foreign exchange risk. The U.S. dollar value of forward currency contracts is determined using current forward currency exchange rates supplied by a quotation service. The market value of the contract will fluctuate with changes in currency exchange rates. The contract is marked to market daily and the change in market value is recorded as an unrealized gain or loss. When the contract is closed, the fund records a realized gain or loss equal to the difference between the value of the contract at the time it was opened and the value at the time it was closed. The fund could be exposed to risk if the value of the currency changes unfavorably, if the counterparties to the contracts are unable to meet the terms of their contracts or if the fund is unable to enter into a closing position. Risks may exceed amounts recognized on the Statement of assets and liabilities. Forward currency contracts outstanding at period end, if any, are listed after the fund’s portfolio. Outstanding contracts on forward currency contracts at the close of the reporting period are indicative of the volume of activity during the period.
F) Master agreements The fund is a party to ISDA (International Swap and Derivatives Association, Inc.) Master Agreements (Master Agreements) with certain counterparties that govern over-the-counter derivative and foreign exchange contracts entered into from time to time. The Master Agreements may contain provisions regarding, among other things, the parties’ general obligations, representations, agreements, collateral requirements, events of default and early termination. With respect to certain counterparties, in accordance with the terms of the Master Agreements, collateral posted to the fund is held in a segregated account by the fund’s custodian and with respect to those amounts which can be sold or repledged, are presented in the fund’s portfolio. Collateral pledged by the fund is segregated by the fund’s custodian and identified in the fund’s portfolio. Collateral can be in the form of cash or debt securities issued by the U.S. Government or related agencies or other securities as agreed to by the fund and the applicable counterparty. Collateral requirements are determined based on the fund’s net position with each counterparty. Termination events applicable to the fund may occur upon a decline in the fund’s net assets below a specified threshold over a certain period of time. Termination events applicable to counterparties may occur upon a decline in the counterparty’s long-term and short-term credit ratings below a specified level. In each case, upon occurrence, the other party may elect to terminate early and cause settlement of all derivative and foreign exchange contracts outstanding, including the payment of any losses and costs resulting from such early termination, as reasonably determined by the terminating party. Any decision by one or more of the fund’s counterparties to elect early termination could impact the fund’s future derivative activity.
At the close of the reporting period, the fund had a net liability position of $92,132 on derivative contracts subject to the Master Agreements. Collateral posted by the fund totaled $530,363.
G) Securities lending The fund may lend securities, through its agent, to qualified borrowers in order to earn additional income. The loans are collateralized by cash in an amount at least equal to the market value of the securities loaned. The market value of securities loaned is determined daily and any additional required collateral is allocated to the fund on the next business day. The risk of borrower default will be borne by the fund’s agent; the fund will bear the risk of loss with respect to the investment of the cash collateral. Income from securities lending is included in investment income on the Statement of operations. Effective August 2010, cash collateral is invested in Putnam Cash Collateral Pool, LLC, a limited liability company managed by an affiliate of Putnam Management. Investments in Putnam Cash Collateral Pool, LLC are valued at its closing net asset value each business day. There are no management fees charged by Putnam Cash Collateral Pool, LLC. At the close of the reporting period, the value of securities loaned amounted to $54,889,753 and the fund received cash collateral of $56,367,124.
H) Interfund lending Effective July 2010, the fund, along with other Putnam funds, may participate in an interfund lending program pursuant to an exemptive order issued by the Securities and Exchange Commission (SEC). This program allows the fund to borrow from other Putnam funds that permit such transactions. Interfund lending transactions are subject to each fund’s investment policies and borrowing and lending limits. Interest earned or paid on the interfund lending transaction will be based on the average of certain current market rates. During the reporting period, the fund did not utilize the program.
I) Line of credit Effective July 2010, the fund participates, along with other Putnam funds, in a $285 million unsecured committed line of credit and a $165 million unsecured uncommitted line of credit, both provided by State Street Bank and Trust Company (State Street). Borrowings may be made for temporary or emergency purposes, including the funding of shareholder redemption requests and trade settlements. Interest is charged to the fund based on the fund’s borrowing at a rate equal to the Federal Funds rate plus 1.25% for the committed line of credit and the Federal Funds rate plus 1.30% for the uncommitted line of credit. A closing fee equal to 0.03% of the committed line of credit and $100,000 for the uncommitted line of credit has been paid by the participating funds.
31
In addition, a commitment fee of 0.15% per annum on any unutilized portion of the committed line of credit is allocated to the participating funds based on their relative net assets and paid quarterly. During the reporting period, the fund had no borrowings against these arrangements.
J) Federal taxes It is the policy of the fund to distribute all of its taxable income within the prescribed time period and otherwise comply with the provisions of the Internal Revenue Code of 1986, as amended (the Code), applicable to regulated investment companies. It is also the intention of the fund to distribute an amount sufficient to avoid imposition of any excise tax under Section 4982 of the Code. The fund is subject to the provisions of Accounting Standards Codification ASC 740 Income Taxes (ASC 740). ASC 740 sets forth a minimum threshold for financial statement recognition of the benefit of a tax position taken or expected to be taken in a tax return. The fund did not have a liability to record for any unrecognized tax benefits in the accompanying financial statements. No provision has been made for federal taxes on income, capital gains or unrealized appreciation on securities held nor for excise tax on income and capital gains. Each of the fund’s federal tax returns for the prior three fiscal years remains subject to examination by the Internal Revenue Service.
The aggregate identified cost on a tax basis is $917,929,899, resulting in gross unrealized appreciation and depreciation of $288,234,008 and $33,533,995, respectively, or net unrealized appreciation of $254,700,013.
K) Distributions to shareholders Distributions to shareholders from net investment income are recorded by the fund on the ex-dividend date. Distributions from capital gains, if any, are recorded on the ex-dividend date and paid at least annually. The amount and character of income and gains to be distributed are determined in accordance with income tax regulations, which may differ from generally accepted accounting principles. Dividend sources are estimated at the time of declaration. Actual results may vary. Any non-taxable return of capital cannot be determined until final tax calculations are completed after the end of the fund’s fiscal year. Reclassifications are made to the fund’s capital accounts to reflect income and gains available for distribution (or available capital loss carryovers) under income tax regulations.
Note 2: Management fee, administrative services and other transactions
The fund pays Putnam Management a management fee (based on the fund’s average net assets and computed and paid monthly) at annual rates that may vary based on the average of the aggregate net assets of most open-end funds, as defined in the fund’s management contract, sponsored by Putnam Management. Such annual rates may vary as follows:
| 0.780% | of the first $5 billion, |
| 0.730% | of the next $5 billion, |
| 0.680% | of the next $10 billion, |
| 0.630% | of the next $10 billion, |
| 0.580% | of the next $50 billion, |
| 0.560% | of the next $50 billion, |
| 0.550% | of the next $100 billion, |
| 0.545% | of any excess thereafter. |
Putnam Management has contractually agreed, through June 30, 2011, to waive fees or reimburse the fund’s expenses to the extent necessary to limit the cumulative expenses of the fund, exclusive of brokerage, interest, taxes, investment-related expenses, extraordinary expenses and payments under the fund’s investor servicing contract, investment management contract and distribution plans, on a fiscal year-to-date basis to an annual rate of 0.20% of the fund’s average net assets over such fiscal year-to-date period. During the reporting period, the fund’s expenses were not reduced as a result of this limit.
Putnam Investments Limited (PIL), an affiliate of Putnam Management, is authorized by the Trustees to manage a separate portion of the assets of the fund as determined by Putnam Management from time to time. Putnam Management pays a quarterly sub-management fee to PIL for its services at an annual rate of 0.35% of the average net assets of the portion of the fund managed by PIL.
The Putnam Advisory Company, LLC (PAC), an affiliate of Putnam Management, is authorized by the Trustees to manage a separate portion of the assets of the fund, as designated from time to time by Putnam Management or PIL. Putnam Management or PIL, as applicable, pays a quarterly sub-advisory fee to PAC for its services at the annual rate of 0.35% of the average net assets of the portion of the fund’s assets for which PAC is engaged as sub-adviser.
32
The fund reimburses Putnam Management an allocated amount for the compensation and related expenses of certain officers of the fund and their staff who provide administrative services to the fund. The aggregate amount of all such reimbursements is determined annually by the Trustees.
Custodial functions for the fund’s assets are provided by State Street. Custody fees are based on the fund’s asset level, the number of its security holdings and transaction volumes.
Putnam Investor Services, Inc., an affiliate of Putnam Management, provides investor servicing agent functions to the fund. Putnam Investor Services, Inc. received fees for investor servicing based on the fund’s retail asset level, the number of shareholder accounts in the fund and the level of defined contribution plan assets in the fund. Investor servicing fees will not exceed an annual rate of 0.375% of the fund’s average net assets. The amounts incurred for investor servicing agent functions during the reporting period are included in Investor servicing fees in the Statement of operations.
The fund has entered into expense offset arrangements with Putnam Investor Services, Inc. and State Street whereby Putnam Investor Services, Inc.’s and State Street’s fees are reduced by credits allowed on cash balances. The fund also reduced expenses through brokerage/service arrangements. For the reporting period, the fund’s expenses were reduced by $2,250 under the expense offset arrangements and by $24,744 under the brokerage/service arrangements.
Each independent Trustee of the fund receives an annual Trustee fee, of which $703 as a quarterly retainer, has been allocated to the fund, and an additional fee for each Trustees meeting attended. Trustees also are reimbursed for expenses they incur relating to their services as Trustees.
The fund has adopted a Trustee Fee Deferral Plan (the Deferral Plan) which allows the Trustees to defer the receipt of all or a portion of Trustees fees payable on or after July 1, 1995. The deferred fees remain invested in certain Putnam funds until distribution in accordance with the Deferral Plan.
The fund has adopted an unfunded noncontributory defined benefit pension plan (the Pension Plan) covering all Trustees of the fund who have served as a Trustee for at least five years and were first elected prior to 2004. Benefits under the Pension Plan are equal to 50% of the Trustee’s average annual attendance and retainer fees for the three years ended December 31, 2005. The retirement benefit is payable during a Trustee’s lifetime, beginning the year following retirement, for the number of years of service through December 31, 2006. Pension expense for the fund is included in Trustee compensation and expenses in the Statement of operations. Accrued pension liability is included in Payable for Trustee compensation and expenses in the Statement of assets and liabilities. The Trustees have terminated the Pension Plan with respect to any Trustee first elected after 2003.
The fund has adopted distribution plans (the Plans) with respect to its class A, class B, class C, class M and class R shares pursuant to Rule 12b-1 under the Investment Company Act of 1940. The purpose of the Plans is to compensate Putnam Retail Management Limited Partnership, a wholly-owned subsidiary of Putnam Investments, LLC and Putnam Retail Management GP, Inc., for services provided and expenses incurred in distributing shares of the fund. The Plans provide for payments by the fund to Putnam Retail Management Limited Partnership at an annual rate of up to 0.35%, 1.00%, 1.00%, 1.00% and 1.00% of the average net assets attributable to class A, class B, class C, class M and class R shares, respectively. The Trustees have approved payment by the fund at an annual rate of 0.25%, 1.00%, 1.00%, 0.75% and 0.50% of the average net assets attributable to class A, class B, class C, class M and class R shares, respectively.
For the reporting period, Putnam Retail Management Limited Partnership, acting as underwriter, received net commissions of $ 17,587 and $208 from the sale of class A and class M shares, respectively, and received $ 17,186 and $456 in contingent deferred sales charges from redemptions of class B and class C shares, respectively.
A deferred sales charge of up to 1.00% and 0.65% is assessed on certain redemptions of class A and class M shares, respectively. For the reporting period, Putnam Retail Management Limited Partnership, acting as underwriter, received no monies on class A and class M redemptions, respectively.
Note 3: Purchases and sales of securities
During the reporting period, cost of purchases and proceeds from sales of investment securities other than short-term investments aggregated $204,923,849 and $258,147,682, respectively. There were no purchases or proceeds from sales of long-term U.S. government securities.
33
Written option transactions during the reporting period are summarized as follows:
| Contract amounts | Premiums received | |
| Written options outstanding | ||
| at beginning of the reporting period | — | $— |
| Options opened | 423,045 | 846,099 |
| Options expired | (423,045) | (846,099) |
| Written options outstanding | ||
| at end of the reporting period | — | $— |
Note 4: Capital shares
At the close of the reporting period, there was an unlimited number of shares of beneficial interest authorized.
Transactions in capital shares were as follows:
| Six months ended 2/28/11 | Year ended 8/31/10 | |||
| Class A | Shares | Amount | Shares | Amount |
| Shares sold | 355,975 | $16,343,294 | 1,343,130 | $61,743,972 |
| Shares issued in connection with | ||||
| reinvestment of distributions | 1,247,023 | 55,966,397 | 70,443 | 3,305,885 |
| 1,602,998 | 72,309,691 | 1,413,573 | 65,049,857 | |
| Shares repurchased | (2,026,111) | (93,472,914) | (3,661,850) | (166,882,306) |
| Net decrease | (423,113) | $(21,163,223) | (2,248,277) | $(101,832,449) |
| Six months ended 2/28/11 | Year ended 8/31/10 | |||
| Class B | Shares | Amount | Shares | Amount |
| Shares sold | 29,596 | $1,127,680 | 95,411 | $3,668,044 |
| Shares issued in connection with | ||||
| reinvestment of distributions | 78,676 | 2,906,322 | 6,184 | 243,774 |
| 108,272 | 4,034,002 | 101,595 | 3,911,818 | |
| Shares repurchased | (252,535) | (9,703,753) | (884,731) | (34,142,068) |
| Net decrease | (144,263) | $(5,669,751) | (783,136) | $(30,230,250) |
| Six months ended 2/28/11 | Year ended 8/31/10 | |||
| Class C | Shares | Amount | Shares | Amount |
| Shares sold | 16,271 | $674,099 | 38,347 | $1,622,916 |
| Shares issued in connection with | ||||
| reinvestment of distributions | 27,135 | 1,095,188 | 1,533 | 65,624 |
| 43,406 | 1,769,287 | 39,880 | 1,688,540 | |
| Shares repurchased | (58,752) | (2,453,195) | (109,498) | (4,521,012) |
| Net decrease | (15,346) | $(683,908) | (69,618) | $(2,832,472) |
| Six months ended 2/28/11 | Year ended 8/31/10 | |||
| Class M | Shares | Amount | Shares | Amount |
| Shares sold | 2,864 | $120,159 | 6,945 | $293,544 |
| Shares issued in connection with | ||||
| reinvestment of distributions | 16,899 | 687,452 | 965 | 41,493 |
| 19,763 | 807,611 | 7,910 | 335,037 | |
| Shares repurchased | (28,467) | (1,200,427) | (47,715) | (2,001,459) |
| Net decrease | (8,704) | $(392,816) | (39,805) | $(1,666,422) |
34
| Six months ended 2/28/11 | Year ended 8/31/10 | |||
| Class R | Shares | Amount | Shares | Amount |
| Shares sold | 11,659 | $521,196 | 27,825 | $1,229,171 |
| Shares issued in connection with | ||||
| reinvestment of distributions | 2,698 | 117,992 | 127 | 5,848 |
| 14,357 | 639,188 | 27,952 | 1,235,019 | |
| Shares repurchased | (9,860) | (443,563) | (24,326) | (1,094,878) |
| Net increase | 4,497 | $195,625 | 3,626 | $140,141 |
| Six months ended 2/28/11 | Year ended 8/31/10 | |||
| Class Y | Shares | Amount | Shares | Amount |
| Shares sold | 27,037 | $1,281,793 | 76,911 | $3,627,581 |
| Shares issued in connection with | ||||
| reinvestment of distributions | 20,398 | 942,002 | 1,058 | 50,876 |
| 47,435 | 2,223,795 | 77,969 | 3,678,457 | |
| Shares repurchased | (63,181) | (2,998,067) | (53,648) | (2,510,526) |
| Net increase (decrease) | (15,746) | $(774,272) | 24,321 | $1,167,931 |
Note 5: Summary of derivative activity
The following is a summary of the market values of derivative instruments as of the close of the reporting period:
Market values of derivative instruments as of the close of the reporting period
| Asset derivatives | Liability derivatives | |||
| Derivatives not | ||||
| accounted for as | Statement of | Statement of | ||
| hedging instruments | assets and | assets and | ||
| under ASC 815 | liabilities location | Market value | liabilities location | Market value |
| Foreign exchange | ||||
| contracts | Receivables | $480,647 | Payables | $92,132 |
| Total | $480,647 | $92,132 | ||
The following is a summary of realized and change in unrealized gains or losses of derivative instruments on the Statement of operations for the reporting period (see Note 1):
Amount of realized gain or (loss) on derivatives recognized in net gain or (loss) on investments
| Derivatives not accounted | |||
| for as hedging instruments | Forward currency | ||
| under ASC 815 | Options | contracts | Total |
| Foreign exchange | |||
| contracts | $— | $6,798,902 | $6,798,902 |
| Equity contracts | (489,040) | — | $(489,040) |
| Total | $(489,040) | $6,798,902 | $6,309,862 |
Change in unrealized appreciation or (depreciation) on derivatives recognized in net gain or (loss) on investments
| Derivatives not accounted for as | ||
| hedging instruments under ASC 815 | Forward currency contracts | Total |
| Foreign exchange contracts | $2,935,413 | $2,935,413 |
| Total | $2,935,413 | $2,935,413 |
35
Note 6: Investment in Putnam Money Market Liquidity Fund
The fund invested in Putnam Money Market Liquidity Fund, an open-end management investment company managed by Putnam Management. Investments in Putnam Money Market Liquidity Fund are valued at its closing net asset value each business day. Income distributions earned by the fund are recorded as interest income in the Statement of operations and totaled $34,204 for the reporting period. During the reporting period, cost of purchases and proceeds of sales of investments in Putnam Money Market Liquidity Fund aggregated $123,831,593 and $161,930,109, respectively. Management fees charged to Putnam Money Market Liquidity Fund have been waived by Putnam Management.
Note 7: Regulatory matters and litigation
In late 2003 and 2004, Putnam Management settled charges brought by the SEC and the Massachusetts Securities Division in connection with excessive short-term trading in Putnam funds. Distribution of payments from Putnam Management to certain open-end Putnam funds and their shareholders is expected to be completed in the next several months. These allegations and related matters have served as the general basis for certain lawsuits, including purported class action lawsuits against Putnam Management and, in a limited number of cases, some Putnam funds. Putnam Management believes that these lawsuits will have no material adverse effect on the funds or on Putnam Management’s ability to provide investment management services. In addition, Putnam Management has agreed to bear any costs incurred by the Putnam funds as a result of these matters.
Note 8: Market and credit risk
In the normal course of business, the fund trades financial instruments and enters into financial transactions where risk of potential loss exists due to changes in the market (market risk) or failure of the contracting party to the transaction to perform (credit risk). The fund may be exposed to additional credit risk that an institution or other entity with which the fund has unsettled or open transactions will default.
36
Fund information
Founded over 70 years ago, Putnam Investments was built around the concept that a balance between risk and reward is the hallmark of a well-rounded financial program. We manage over 100 funds across income, value, blend, growth, asset allocation, absolute return, and global sector categories.
| Investment Manager | Charles B. Curtis | Mark C. Trenchard |
| Putnam Investment | Robert J. Darretta | Vice President and |
| Management, LLC | Paul L. Joskow | BSA Compliance Officer |
| One Post Office Square | Kenneth R. Leibler | |
| Boston, MA 02109 | Robert E. Patterson | Francis J. McNamara, III |
| George Putnam, III | Vice President and | |
| Investment Sub-Manager | Robert L. Reynolds | Chief Legal Officer |
| Putnam Investments Limited | W. Thomas Stephens | |
| 57–59 St James’s Street | James P. Pappas | |
| London, England SW1A 1LD | Officers | Vice President |
| Robert L. Reynolds | ||
| Investment Sub-Advisor | President | Judith Cohen |
| The Putnam Advisory | Vice President, Clerk and | |
| Company, LLC | Jonathan S. Horwitz | Assistant Treasurer |
| One Post Office Square | Executive Vice President, | |
| Boston, MA 02109 | Principal Executive | Michael Higgins |
| Officer, Treasurer and | Vice President, Senior Associate | |
| Marketing Services | Compliance Liaison | Treasurer and Assistant Clerk |
| Putnam Retail Management | ||
| One Post Office Square | Steven D. Krichmar | Nancy E. Florek |
| Boston, MA 02109 | Vice President and | Vice President, Assistant Clerk, |
| Principal Financial Officer | Assistant Treasurer and | |
| Custodian | Proxy Manager | |
| State Street Bank | Janet C. Smith | |
| and Trust Company | Vice President, Assistant | Susan G. Malloy |
| Treasurer and Principal | Vice President and | |
| Legal Counsel | Accounting Officer | Assistant Treasurer |
| Ropes & Gray LLP | ||
| Beth S. Mazor | ||
| Trustees | Vice President | |
| John A. Hill, Chairman | ||
| Jameson A. Baxter, | Robert R. Leveille | |
| Vice Chairman | Vice President and | |
| Ravi Akhoury | Chief Compliance Officer | |
| Barbara M. Baumann |
This report is for the information of shareholders of Putnam Global Health Care Fund. It may also be used as sales literature when preceded or accompanied by the current prospectus, the most recent copy of Putnam’s Quarterly Performance Summary, and Putnam’s Quarterly Ranking Summary. For more recent performance, please visit putnam.com. Investors should carefully consider the investment objective, risks, charges, and expenses of a fund, which are described in its prospectus. For this and other information or to request a prospectus, or a summary prospectus if available, call 1-800-225-1581 toll free. Please read the prospectus carefully before investing. The fund’s Statement of Additional Information contains additional information about the fund’s Trustees and is available without charge upon request by calling 1-800-225-1581.

Item 2. Code of Ethics:
Not applicable
Item 3. Audit Committee Financial Expert:
Not applicable
Item 4. Principal Accountant Fees and Services:
Not applicable
Item 5. Audit Committee of Listed Registrants
Not applicable
Item 6. Schedule of Investments:
The registrant’s schedule of investments in unaffiliated issuers is included in the report to shareholders in Item 1 above.
Item 7. Disclosure of Proxy Voting Policies and Procedures For Closed-End Management Investment Companies:
Not applicable
Item 8. Portfolio Managers of Closed-End Investment Companies
Not Applicable
Item 9. Purchases of Equity Securities by Closed-End Management Investment Companies and Affiliated Purchasers:
Not applicable
Item 10. Submission of Matters to a Vote of Security Holders:
Not applicable
Item 11. Controls and Procedures:
(a) The registrant's principal executive officer and principal financial officer have concluded, based on their evaluation of the effectiveness of the design and operation of the registrant's disclosure controls and procedures as of a date within 90 days of the filing date of this report, that the design and operation of such procedures are generally effective to provide reasonable assurance that information required to be disclosed by the registrant in this report is recorded, processed, summarized and reported within the time periods specified in the Commission's rules and forms.
(b) Changes in internal control over financial reporting: Not applicable
Item 12. Exhibits:
(a)(1) Not applicable
(a)(2) Separate certifications for the principal executive officer and principal financial officer of the registrant as required by Rule 30a-2(a) under the Investment Company Act of 1940, as amended, are filed herewith.
(b) The certifications required by Rule 30a-2(b) under the Investment Company Act of 1940, as amended, are filed herewith.
Putnam Global Health Care Fund
By (Signature and Title):
/s/Janet C. Smith
Janet C. Smith
Principal Accounting Officer
Date: April 28, 2011
Pursuant to the requirements of the Securities Exchange Act of 1934 and the Investment Company Act of 1940, this report has been signed below by the following persons on behalf of the registrant and in the capacities and on the dates indicated.
By (Signature and Title):
/s/Jonathan S. Horwitz
Jonathan S. Horwitz
Principal Executive Officer
Date: April 28, 2011
By (Signature and Title):
/s/Steven D. Krichmar
Steven D. Krichmar
Principal Financial Officer
Date: April 28, 2011