| UNITED STATES SECURITIES AND EXCHANGE COMMISSION | ||
| Washington, D.C. 20549 | ||
FORM N-CSR | ||
| CERTIFIED SHAREHOLDER REPORT OF REGISTERED MANAGEMENT INVESTMENT COMPANIES | ||
| Investment Company Act file number: | (811-03386) |
| Exact name of registrant as specified in charter: | Putnam Global Health Care Fund |
| Address of principal executive offices: | One Post Office Square, Boston, Massachusetts 02109 |
| Name and address of agent for service: | Robert T. Burns, Vice President One Post Office Square Boston, Massachusetts 02109 |
| Copy to: | John W. Gerstmayr, Esq. Ropes & Gray LLP 800 Boylston Street Boston, Massachusetts 02199-3600 |
| Registrant’s telephone number, including area code: | (617) 292-1000 |
| Date of fiscal year end: | August 31, 2012 |
| Date of reporting period: | September 1, 2011 — February 29, 2012 |
Item 1. Report to Stockholders: |
| The following is a copy of the report transmitted to stockholders pursuant to Rule 30e-1 under the Investment Company Act of 1940: | |||
Putnam
Global Health Care
Fund
Semiannual report
2 | 29 | 12
| Message from the Trustees | 1 | ||
| About the fund | 2 | ||
| Performance snapshot | 4 | ||
| Interview with your fund’s portfolio manager | 5 | ||
| Your fund’s performance | 10 | ||
| Your fund’s expenses | 12 | ||
| Terms and definitions | 14 | ||
| Other information for shareholders | 15 | ||
| Financial statements | 16 | ||
Message from the Trustees
Dear Fellow Shareholder:
Stock markets around the world have rebounded in 2012, despite concerns over the threat of another recession in Europe.
U.S. stocks posted their strongest February in years, thanks to improving industrial output, consumer confidence, and unemployment data. Even the beleaguered housing market is showing signs of a turnaround. Asia is benefiting from the global recovery, with China in particular seeing some improvements in manufacturing activity. While the eurozone may slip into another recession this year, economists believe the region could return to growth by the second half of 2012 if European officials devise a lasting plan to address the sovereign debt problem.
We believe that the market turmoil in recent years presents opportunities to pursue returns for our shareholders. Putnam’s bottom-up, fundamental investment approach is designed for this type of environment, and our investment team is committed to uncovering returns, while seeking to guard against downside risk.
Please join us in welcoming the return of Elizabeth T. Kennan to the Board of Trustees. Dr. Kennan, who served as a Trustee from 1992 until 2010, has rejoined the Board, effective January 1, 2012. Dr. Kennan is a Partner of Cambus-Kenneth Farm (thoroughbred horse breeding and general farming), and is also President Emeritus of Mount Holyoke College.
We would also like to take this opportunity to welcome new shareholders to the fund and to thank all of our investors for your continued confidence in Putnam.

About the fund
Investing in the health-care sector for 30 years
Since 1982, Putnam Global Health Care Fund has sought to capitalize on the growth potential of stocks in the health-care sector.
The fund invests across a range of industries, including manufacturers of medical devices, pharmaceutical firms that are developing innovative drugs and treatments, and health-care providers that can deliver high-quality care at a reasonable cost. Since many medical innovations happen overseas, the fund can invest in international as well as U.S. companies.
Besides its wide range of opportunities, the health-care sector offers another advantage for investors: Its products and services tend to stay in demand regardless of economic conditions. The fund invests in businesses at different stages of growth, from small, rapidly growing companies to large, established global corporations.
The fund’s portfolio manager invests with a long-term view and seeks stocks that can help investors build wealth over time. Her disciplined investment process includes analyzing each company’s valuation, financial strength, competitive positioning, earnings, and cash flow. She conducts intensive fundamental research with support from analysts on Putnam’s Global Equity Research team.
Consider these risks before investing: International investing involves certain risks, such as currency fluctuations, economic instability, and political developments. Additional risks may be associated with emerging-market securities, including illiquidity and volatility. The fund’s policy of concentrating on a limited group of industries and the fund’s non-diversified status, which means the fund may invest in fewer issuers, can increase the fund’s vulnerability to common economic forces and may result in greater losses and volatility. The use of derivatives involves additional risks, such as the potential inability to terminate or sell derivatives positions and the potential failure of the other party to the instrument to meet its obligations. Growth stocks may be more susceptible to earnings disappointments, and value stocks may fail to rebound. These risks are generally greater for small and midsize companies. The use of short selling may result in losses if the securities appreciate in value. The prices of stocks in the fund’s portfolio may fall or fail to rise over extended periods of time for a variety of reasons, including both general financial market conditions and factors related to a specific issuer or industry.
Sector investing at Putnam
In recent decades, innovation and business growth have propelled stocks in different industries to market-leading performance. Finding these stocks, many of which are in international markets, requires rigorous research and in-depth knowledge of global markets.
Putnam’s sector funds invest in nine sectors worldwide and offer active management, risk controls, and the expertise of dedicated sector analysts. The funds’ managers invest with flexibility and precision, using fundamental research to hand select stocks for the portfolios.
All sectors in one fund:
Putnam Global Sector Fund
A portfolio of individual Putnam Global Sector Funds that provides exposure to all sectors of the MSCI World Index.
Individual sector funds:
Global Consumer Fund
Retail, hotels, restaurants, media, food and beverages
Global Energy Fund
Oil and gas, energy equipment and services
Global Financials Fund
Commercial banks, insurance, diversified financial services, mortgage finance
Global Health Care Fund
Pharmaceuticals, biotechnology, health-care services
Global Industrials Fund
Airlines, railroads, trucking, aerospace and defense, construction, commercial services
Global Natural Resources Fund
Metals, chemicals, oil and gas, forest products
Global Technology Fund
Software, computers, Internet services
Global Telecommunications Fund
Diversified and wireless telecommunications services
Global Utilities Fund
Electric, gas, and water utilities

| 2 | 3 |
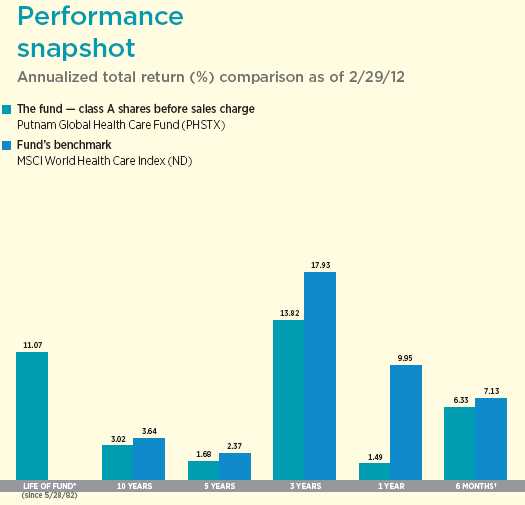
Current performance may be lower or higher than the quoted past performance, which cannot guarantee future results. Share price, principal value, and return will fluctuate, and you may have a gain or a loss when you sell your shares. Performance of class A shares assumes reinvestment of distributions and does not account for taxes. Fund returns in the bar chart do not reflect a sales charge of 5.75%; had they, returns would have been lower. See pages 5 and 10–12 for additional performance information. For a portion of the periods, the fund had expense limitations, without which returns would have been lower. A short-term trading fee of 1% may apply to redemptions or exchanges from certain funds within the time period specified in the fund’s prospectus. To obtain the most recent month-end performance, visit putnam.com.
* The fund’s benchmark, the MSCI World Health Care Index (ND), was introduced on 1/1/01, which post-dates the inception of the fund’s class A shares.
† Returns for the six-month period are not annualized, but cumulative.
4
Interview with your fund’s portfolio manager

Kelsey, how did health-care stocks perform for the six-month period?
Health-care stocks slightly underperformed the broader world market. Particularly toward the close of the period, the sector began to lag as economic conditions appeared to be improving and investors became less interested in health-care stocks. Health care is traditionally viewed as a defensive sector; investors tend to seek out these stocks as a “safe haven” when economic growth is weakening and stock markets are volatile. In early 2012, stocks rallied and investors sought opportunities in sectors that tend to be more risky.
Within health care, biotechnology was the best-performing subsector, a result of positive product news and a number of mergers and acquisitions. Among the significant deals was Gilead Sciences’ plan to acquire Pharmasset for $11 billion, which was beneficial for the fund’s results. Also, Bristol-Myers Squibb acquired Inhibitex, a maker of hepatitis C treatments, for $2.5 billion. This activity — and investor anticipation of the deals — was the main driver of the outperformance of biotechnology stocks for the period.
The weakest subsector was health-care equipment and supplies, as companies continued to feel the effects of low utilization. Following the economic downturn that began in 2008, utilization of health-care products and services — as measured by doctor visits,
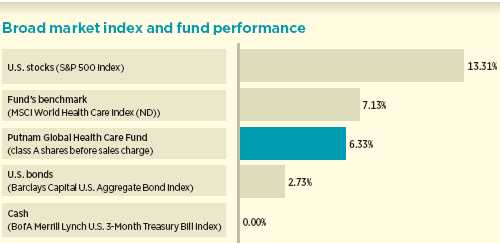
This comparison shows your fund’s performance in the context of broad market indexes for the six months ended 2/29/12. See pages 4 and 10–12 for additional fund performance information. Index descriptions can be found on page 14.
5
elective surgeries, hospital admissions, and lab tests — declined significantly. This is typical for recessionary periods, when people have lost their health insurance coverage or are simply less willing to spend money on health care. However, although the economic picture is improving, we have yet to see a meaningful uptick in utilization, and this has hurt many health-care companies, especially makers of medical devices.
The fund’s performance lagged that of its benchmark index. What are some holdings that detracted from returns during the period?
One of the largest detractors was the stock of Human Genome Sciences, a biotechnology company. The stock’s underperformance was largely due to disappointing initial sales of Benlysta, a key new drug for the company and the first medication sanctioned for treating systemic lupus in over 50 years. One major issue has been uncertainty about reimbursement, which has presented a logistic hurdle for physicians. As an injectable drug, Benlysta requires a certain type of Medicare reimbursement code, which hadn’t been assigned until recently. The code, which went into effect on January 1, simplifies the reimbursement process and should encourage more physicians to begin prescribing Benlysta.
Another disappointment in the biotechnology subsector was Amarin, a company that specializes in treatments for cardiovascular disease. For Amarin, the struggle has been securing patent protection for a lipid-lowering drug, AMR101. The drug is currently under FDA review, with a potential approval in the second half of 2012. However, the company has encountered delays with the patent application process, which is needed to protect the product from generic competition. While these patent delays caused the stock to underperform recently, we believe the product is innovative and offers long-term growth potential, and we continued to hold Amarin in the portfolio at period-end.
Fund performance was also dampened by our position in Hospira, a hospital supply

Country allocations are shown as a percentage of the fund’s net assets. Summary information may differ from the portfolio schedule included in the financial statements due to the inclusion of derivative securities and the exclusion of as-of trades, if any. Weightings will vary over time.
6
company that focuses on injectable drugs. Hospira’s earnings have been pressured as the company works to resolve some manufacturing issues in response to warnings from the Food and Drug Administration [FDA]. Although fixing the problems will be costly and has resulted in production and shipping delays, we believe the stock remains an attractive investment and we continued to hold it in the portfolio at the close of the period. In fact, Hospira stock rebounded considerably in the final weeks of the period, when it appeared that the company was working hard to resolve the issues.

Tell us about some stocks that helped returns for the period.
One highlight was Pharmasset, a biotechnology company that specializes in the treatment of hepatitis C. This stock has been a strong performer for some time — it was one of the top performers for the fund’s previous fiscal year. Pharmassett has promising hepatitis C compounds in development, and we believed a successful launch of these drugs could help the company gain a significant share of the hepatitis C market. The primary driver of the stock’s recent outperformance, however, was the acquisition of Pharmasset by Gilead Sciences, which paid a significant premium for its shares in a deal that was finalized in January.
One of the fund’s largest holdings, Celgene, was also a top performer. A biotechnology company that produces treatments for cancer and immune-inflammatory diseases, Celegene has delivered strong financial performance. Along with a drug pipeline that is gaining more recognition from investors,

This table shows the fund’s top 10 holdings by percentage of the fund’s net assets as of 2/29/12. Short-term holdings are excluded. Holdings will vary over time.
7
the company has delivered earnings that continue to exceed expectations.
Another large fund holding — and outstanding performer — was Aetna, a health-care benefits company that serves approximately 35.3 million people. Unlike many health-care companies, HMOs like Aetna benefit from declines in utilization trends. Health insurers generally have lower expenses when people visit the doctor less frequently, have fewer elective surgeries, or otherwise cut back on health-related spending. Therefore, for several quarters, Aetna has been able to deliver solid financial results. In addition, the stock continues to be attractively priced, in our view, and it remained among the portfolio’s top holdings at period-end.
As the fund enters the second half of its fiscal year, what is your outlook for the health-care sector?
At the start of 2012, we began to see some relative underperformance in the health-care sector as the macroeconomic picture brightened, but we remain optimistic about growth potential and investment opportunities across a range of stocks. Importantly, health-care stocks in most subsectors are attractively priced, in our view.
In the United States, the fact that this is an election year could create uncertainty for the sector, as debate escalates around the Patient Protection and Affordable Care Act — the health-care legislation that was enacted in March 2010. Investors are again faced with uncertainty as the U.S. Supreme Court considers the constitutionality of the legislation. In international markets, challenges remain with respect to debt crises, where many governments are cutting health-care spending in an effort to reduce budget deficits.
Along with the challenges, there are exciting developments that could bring positive momentum to health-care stocks, including many innovative products that have moved through clinical trials and are expected to launch soon. As always, we continue to conduct bottom-up research to find the
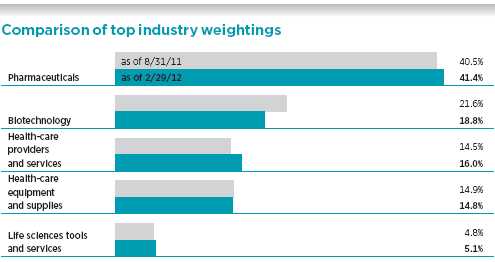
This chart shows how the fund’s top weightings have changed over the past six months. Weightings are shown as a percentage of net assets. Summary information may differ from the portfolio schedule included in the financial statements due to the inclusion of derivative securities and the exclusion of as-of trades, if any. Holdings will vary over time.
8
best growth opportunities within the health-care sector, with a focus on each company’s business fundamentals.
Thank you, Kelsey, for your time and insights today.
The views expressed in this report are exclusively those of Putnam Management and are subject to change. They are not meant as investment advice.
Please note that the holdings discussed in this report may not have been held by the fund for the entire period. Portfolio composition is subject to review in accordance with the fund’s investment strategy and may vary in the future. Current and future portfolio holdings are subject to risk.
Portfolio Manager Kelsey Chen holds an M.B.A. from the Wharton School of the University of Pennsylvania, a Ph.D. from the University of Texas Medical School, and a B.S. from Wuhan University in Wuhan, China. Kelsey joined Putnam in 2000 and has been in the investment industry since 1999.
IN THE NEWS
Europe looks as if it may be headed back into recession. Sharp declines in household spending, exports, and manufacturing activity led to an economic downdraft in the final months of 2011. Economic output for the 17 eurozone countries contracted 0.3% from October to December, according to Eurostat, the European Union’s statistics office. Officials are forecasting a recession in 2012, the region’s second slowdown in three years. However, there are vast differences in health among the various eurozone economies. Officials warn that Greece is likely to remain in recession in 2012 and will likely not return to growth until 2014. Conversely, Germany and France, the eurozone’s largest and healthiest economies, are seen avoiding recession this year. If European officials can find a solution to stave off financial crises for the region’s most indebted member countries, economists believe that growth could turn positive in the second half of 2012.
9
Your fund’s performance
This section shows your fund’s performance, price, and distribution information for periods ended February 29, 2012, the end of the first half of its current fiscal year. In accordance with regulatory requirements for mutual funds, we also include performance as of the most recent calendar quarter-end and expense information taken from the fund’s current prospectus. Performance should always be considered in light of a fund’s investment strategy. Data represent past performance. Past performance does not guarantee future results. More recent returns may be less or more than those shown. Investment return and principal value will fluctuate, and you may have a gain or a loss when you sell your shares. Performance information does not reflect any deduction for taxes a shareholder may owe on fund distributions or on the redemption of fund shares. For the most recent month-end performance, please visit the Individual Investors section at putnam.com or call Putnam at 1-800-225-1581. Class R and class Y shares are not available to all investors. See the Terms and Definitions section in this report for definitions of the share classes offered by your fund.
Fund performance Total return for periods ended 2/29/12
| Class A | Class B | Class C | Class M | Class R | Class Y | |||||
| (inception dates) | (5/28/82) | (3/1/93) | (7/26/99) | (7/3/95) | (1/21/03) | (4/4/00) | ||||
| Before | After | Before | After | Net | Net | |||||
| sales | sales | Before | After | Before | After | sales | sales | asset | asset | |
| charge | charge | CDSC | CDSC | CDSC | CDSC | charge | charge | value | value | |
| Annual average | ||||||||||
| (life of fund) | 11.07% | 10.85% | 10.16% | 10.16% | 10.24% | 10.24% | 10.44% | 10.31% | 10.79% | 11.18% |
| 10 years | 34.70 | 26.94 | 24.91 | 24.91 | 24.94 | 24.94 | 28.14 | 23.67 | 31.39 | 38.13 |
| Annual average | 3.02 | 2.41 | 2.25 | 2.25 | 2.25 | 2.25 | 2.51 | 2.15 | 2.77 | 3.28 |
| 5 years | 8.67 | 2.43 | 4.64 | 3.38 | 4.67 | 4.67 | 6.00 | 2.30 | 7.33 | 10.06 |
| Annual average | 1.68 | 0.48 | 0.91 | 0.67 | 0.92 | 0.92 | 1.17 | 0.46 | 1.42 | 1.94 |
| 3 years | 47.45 | 39.00 | 44.15 | 41.15 | 44.15 | 44.15 | 45.23 | 40.16 | 46.32 | 48.54 |
| Annual average | 13.82 | 11.60 | 12.96 | 12.17 | 12.96 | 12.96 | 13.24 | 11.91 | 13.53 | 14.10 |
| 1 year | 1.49 | –4.34 | 0.70 | –3.64 | 0.72 | –0.16 | 0.97 | –2.55 | 1.22 | 1.75 |
| 6 months | 6.33 | 0.22 | 5.92 | 1.35 | 5.93 | 5.00 | 6.04 | 2.34 | 6.20 | 6.46 |
Current performance may be lower or higher than the quoted past performance, which cannot guarantee future results. After-sales-charge returns for class A and M shares reflect the deduction of the maximum 5.75% and 3.50% sales charge, respectively, levied at the time of purchase. Class B share returns after contingent deferred sales charge (CDSC) reflect the applicable CDSC, which is 5% in the first year, declining over time to 1% in the sixth year, and is eliminated thereafter. Class C share returns after CDSC reflect a 1% CDSC for the first year that is eliminated thereafter. Class R and Y shares have no initial sales charge or CDSC.
For a portion of the periods, the fund had expense limitations, without which returns would have been lower.
Class B share performance does not reflect conversion to class A shares.
A short-term trading fee of 1% may apply to redemptions or exchanges from certain funds within the time period specified in the fund’s prospectus.
10
Comparative index returns For periods ended 2/29/12
| MSCI World Health Care Index (ND) | |
| Annual average (life of fund) | —* |
| 10 years | 43.05% |
| Annual average | 3.64 |
| 5 years | 12.45 |
| Annual average | 2.37 |
| 3 years | 64.00 |
| Annual average | 17.93 |
| 1 year | 9.95 |
| 6 months | 7.13 |
Index results should be compared with fund performance before sales charge, before CDSC, or at net asset value.
* The fund’s benchmark, the MSCI World Health Care Index (ND), was introduced on 1/1/01, which post-dates the inception of the fund’s class A shares.
Fund price and distribution information For the six-month period ended 2/29/12
| Distributions | Class A | Class B | Class C | Class M | Class R | Class Y | ||
| Number | 1 | 1 | 1 | 1 | 1 | 1 | ||
| Income | $1.150 | $0.818 | $0.847 | $0.938 | $1.069 | $1.273 | ||
| Capital gains — Long-term | 3.708 | 3.708 | 3.708 | 3.708 | 3.708 | 3.708 | ||
| Capital gains — Short-term | 0.355 | 0.355 | 0.355 | 0.355 | 0.355 | 0.355 | ||
| Total | $5.213 | $4.881 | $4.910 | $5.001 | $5.132 | $5.336 | ||
| Before | After | Net | Net | Before | After | Net | Net | |
| sales | sales | asset | asset | sales | sales | asset | asset | |
| Share value | charge | charge | value | value | charge | charge | value | value |
| 8/31/11 | $44.32 | $47.02 | $36.28 | $39.64 | $40.03 | $41.48 | $43.11 | $45.68 |
| 2/29/12 | 41.51 | 44.04 | 33.18 | 36.71 | 37.07 | 38.41 | 40.26 | 42.88 |
The classification of distributions, if any, is an estimate. Before-sales-charge share value and current dividend rate for class A and M shares, if applicable, do not take into account any sales charge levied at the time of purchase. After-sales-charge share value, current dividend rate, and current 30-day SEC yield, if applicable, are calculated assuming that the maximum sales charge (5.75% for class A shares and 3.50% for class M shares) was levied at the time of purchase. Final distribution information will appear on your year-end tax forms.
11
Fund performance as of most recent calendar quarter
Total return for periods ended 3/31/12
| Class A | Class B | Class C | Class M | Class R | Class Y | |||||
| (inception dates) | (5/28/82) | (3/1/93) | (7/26/99) | (7/3/95) | (1/21/03) | (4/4/00) | ||||
| Before | After | Before | After | Net | Net | |||||
| sales | sales | Before | After | Before | After | sales | sales | asset | asset | |
| charge | charge | CDSC | CDSC | CDSC | CDSC | charge | charge | value | value | |
| Annual average | ||||||||||
| (life of fund) | 11.18% | 10.95% | 10.26% | 10.26% | 10.35% | 10.35% | 10.55% | 10.42% | 10.90% | 11.29% |
| 10 years | 38.62 | 30.63 | 28.60 | 28.60 | 28.62 | 28.62 | 31.90 | 27.30 | 35.25 | 42.15 |
| Annual average | 3.32 | 2.71 | 2.55 | 2.55 | 2.55 | 2.55 | 2.81 | 2.44 | 3.07 | 3.58 |
| 5 years | 13.56 | 7.04 | 9.39 | 8.07 | 9.40 | 9.40 | 10.80 | 6.91 | 12.19 | 15.01 |
| Annual average | 2.58 | 1.37 | 1.81 | 1.56 | 1.81 | 1.81 | 2.07 | 1.35 | 2.33 | 2.84 |
| 3 years | 43.85 | 35.58 | 40.68 | 37.68 | 40.66 | 40.66 | 41.72 | 36.77 | 42.82 | 44.94 |
| Annual average | 12.89 | 10.68 | 12.05 | 11.25 | 12.04 | 12.04 | 12.33 | 11.00 | 12.62 | 13.17 |
| 1 year | 3.00 | –2.93 | 2.22 | –2.20 | 2.22 | 1.33 | 2.47 | –1.12 | 2.75 | 3.25 |
| 6 months | 18.85 | 12.01 | 18.40 | 13.40 | 18.39 | 17.39 | 18.52 | 14.36 | 18.69 | 18.97 |
Your fund’s expenses
As a mutual fund investor, you pay ongoing expenses, such as management fees, distribution fees (12b-1 fees), and other expenses. Using the following information, you can estimate how these expenses affect your investment and compare them with the expenses of other funds. You may also pay one-time transaction expenses, including sales charges (loads) and redemption fees, which are not shown in this section and would have resulted in higher total expenses. For more information, see your fund’s prospectus or talk to your financial representative.
Expense ratios
| Class A | Class B | Class C | Class M | Class R | Class Y | |
| Total annual operating expenses for the fiscal year | ||||||
| ended 8/31/11 | 1.26% | 2.01% | 2.01% | 1.76% | 1.51% | 1.01% |
| Annualized expense ratio for the six-month period | ||||||
| ended 2/29/12 | 1.30% | 2.05% | 2.05% | 1.80% | 1.55% | 1.05% |
Fiscal-year expense information in this table is taken from the most recent prospectus, is subject to change, and may differ from that shown for the annualized expense ratio and in the financial highlights of this report. Expenses are shown as a percentage of average net assets.
12
Expenses per $1,000
The following table shows the expenses you would have paid on a $1,000 investment in the fund from September 1, 2011, to February 29, 2012. It also shows how much a $1,000 investment would be worth at the close of the period, assuming actual returns and expenses.
| Class A | Class B | Class C | Class M | Class R | Class Y | |
| Expenses paid per $1,000*† | $6.67 | $10.50 | $10.50 | $9.22 | $7.95 | $5.39 |
| Ending value (after expenses) | $1,063.30 | $1,059.20 | $1,059.30 | $1,060.40 | $1,062.00 | $1,064.60 |
* Expenses for each share class are calculated using the fund’s annualized expense ratio for each class, which represents the ongoing expenses as a percentage of average net assets for the six months ended 2/29/12. The expense ratio may differ for each share class.
† Expenses are calculated by multiplying the expense ratio by the average account value for the period; then multiplying the result by the number of days in the period; and then dividing that result by the number of days in the year.
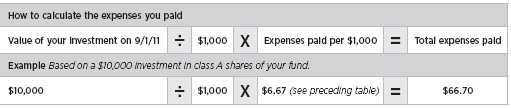
Estimate the expenses you paid
To estimate the ongoing expenses you paid for the six months ended February 29, 2012, use the following calculation method. To find the value of your investment on September 1, 2011, call Putnam at 1-800-225-1581.
Compare expenses using the SEC’s method
The Securities and Exchange Commission (SEC) has established guidelines to help investors assess fund expenses. Per these guidelines, the following table shows your fund’s expenses based on a $1,000 investment, assuming a hypothetical 5% annualized return. You can use this information to compare the ongoing expenses (but not transaction expenses or total costs) of investing in the fund with those of other funds. All mutual fund shareholder reports will provide this information to help you make this comparison. Please note that you cannot use this information to estimate your actual ending account balance and expenses paid during the period.
| Class A | Class B | Class C | Class M | Class R | Class Y | |
| Expenses paid per $1,000*† | $6.52 | $10.27 | $10.27 | $9.02 | $7.77 | $5.27 |
| Ending value (after expenses) | $1,018.40 | $1,014.67 | $1,014.67 | $1,015.91 | $1,017.16 | $1,019.64 |
* Expenses for each share class are calculated using the fund’s annualized expense ratio for each class, which represents the ongoing expenses as a percentage of average net assets for the six months ended 2/29/12. The expense ratio may differ for each share class.
† Expenses are calculated by multiplying the expense ratio by the average account value for the period; then multiplying the result by the number of days in the period; and then dividing that result by the number of days in the year.
13
Terms and definitions
Important terms
Total return shows how the value of the fund’s shares changed over time, assuming you held the shares through the entire period and reinvested all distributions in the fund.
Before sales charge, or net asset value, is the price, or value, of one share of a mutual fund, without a sales charge. Before-sales-charge figures fluctuate with market conditions, and are calculated by dividing the net assets of each class of shares by the number of outstanding shares in the class.
After sales charge is the price of a mutual fund share plus the maximum sales charge levied at the time of purchase. After-sales-charge performance figures shown here assume the 5.75% maximum sales charge for class A shares and 3.50% for class M shares.
Contingent deferred sales charge (CDSC) is generally a charge applied at the time of the redemption of class B or C shares and assumes redemption at the end of the period. Your fund’s class B CDSC declines over time from a 5% maximum during the first year to 1% during the sixth year. After the sixth year, the CDSC no longer applies. The CDSC for class C shares is 1% for one year after purchase.
Share classes
Class A shares are generally subject to an initial sales charge and no CDSC (except on certain redemptions of shares bought without an initial sales charge).
Class B shares are not subject to an initial sales charge. They may be subject to a CDSC.
Class C shares are not subject to an initial sales charge and are subject to a CDSC only if the shares are redeemed during the first year.
Class M shares have a lower initial sales charge and a higher 12b-1 fee than class A shares and no CDSC (except on certain redemptions of shares bought without an initial sales charge).
Class R shares are not subject to an initial sales charge or CDSC and are available only to certain defined contribution plans.
Class Y shares are not subject to an initial sales charge or CDSC, and carry no 12b-1 fee. They are generally only available to corporate and institutional clients and clients in other approved programs.
Comparative indexes
Barclays Capital U.S. Aggregate Bond Index is an unmanaged index of U.S. investment-grade fixed-income securities.
BofA (Bank of America) Merrill Lynch U.S. 3-Month Treasury Bill Index is an unmanaged index that seeks to measure the performance of U.S. Treasury bills available in the marketplace.
MSCI World Health Care Index (ND) is a free float-adjusted market capitalization weighted index that is designed to measure the equity market performance of developed markets in the health care sector.
S&P 500 Index is an unmanaged index of common stock performance.
Indexes assume reinvestment of all distributions and do not account for fees. Securities and performance of a fund and an index will differ. You cannot invest directly in an index.
14
Other information for shareholders
Important notice regarding delivery of shareholder documents
In accordance with Securities and Exchange Commission (SEC) regulations, Putnam sends a single copy of annual and semiannual shareholder reports, prospectuses, and proxy statements to Putnam shareholders who share the same address, unless a shareholder requests otherwise. If you prefer to receive your own copy of these documents, please call Putnam at 1-800-225-1581, and Putnam will begin sending individual copies within 30 days.
Proxy voting
Putnam is committed to managing our mutual funds in the best interests of our shareholders. The Putnam funds’ proxy voting guidelines and procedures, as well as information regarding how your fund voted proxies relating to portfolio securities during the 12-month period ended June 30, 2011, are available in the Individual Investors section of putnam.com, and on the SEC’s website, www.sec.gov. If you have questions about finding forms on the SEC’s website, you may call the SEC at 1-800-SEC-0330. You may also obtain the Putnam funds’ proxy voting guidelines and procedures at no charge by calling Putnam’s Shareholder Services at 1-800-225-1581.
Fund portfolio holdings
The fund will file a complete schedule of its portfolio holdings with the SEC for the first and third quarters of each fiscal year on Form N-Q. Shareholders may obtain the fund’s Forms N-Q on the SEC’s website at www.sec.gov. In addition, the fund’s Forms N-Q may be reviewed and copied at the SEC’s Public Reference Room in Washington, D.C. You may call the SEC at 1-800-SEC-0330 for information about the SEC’s website or the operation of the Public Reference Room.
Trustee and employee fund ownership
Putnam employees and members of the Board of Trustees place their faith, confidence, and, most importantly, investment dollars in Putnam mutual funds. As of February 29, 2012, Putnam employees had approximately $345,000,000 and the Trustees had approximately $78,000,000 invested in Putnam mutual funds. These amounts include investments by the Trustees’ and employees’ immediate family members as well as investments through retirement and deferred compensation plans.
15
Financial statements
A guide to financial statements
These sections of the report, as well as the accompanying Notes, constitute the fund’s financial statements.
The fund’s portfolio lists all the fund’s investments and their values as of the last day of the reporting period. Holdings are organized by asset type and industry sector, country, or state to show areas of concentration and diversification.
Statement of assets and liabilities shows how the fund’s net assets and share price are determined. All investment and non-investment assets are added together. Any unpaid expenses and other liabilities are subtracted from this total. The result is divided by the number of shares to determine the net asset value per share, which is calculated separately for each class of shares. (For funds with preferred shares, the amount subtracted from total assets includes the liquidation preference of preferred shares.)
Statement of operations shows the fund’s net investment gain or loss. This is done by first adding up all the fund’s earnings — from dividends and interest income — and subtracting its operating expenses to determine net investment income (or loss). Then, any net gain or loss the fund realized on the sales of its holdings — as well as any unrealized gains or losses over the period — is added to or subtracted from the net investment result to determine the fund’s net gain or loss for the fiscal period.
Statement of changes in net assets shows how the fund’s net assets were affected by the fund’s net investment gain or loss, by distributions to shareholders, and by changes in the number of the fund’s shares. It lists distributions and their sources (net investment income or realized capital gains) over the current reporting period and the most recent fiscal year-end. The distributions listed here may not match the sources listed in the Statement of operations because the distributions are determined on a tax basis and may be paid in a different period from the one in which they were earned. Dividend sources are estimated at the time of declaration. Actual results may vary. Any non-taxable return of capital cannot be determined until final tax calculations are completed after the end of the fund’s fiscal year.
Financial highlights provide an overview of the fund’s investment results, per-share distributions, expense ratios, net investment income ratios, and portfolio turnover in one summary table, reflecting the five most recent reporting periods. In a semiannual report, the highlights table also includes the current reporting period.
16
The fund’s portfolio 2/29/12 (Unaudited)
| COMMON STOCKS (98.8%)* | Shares | Value |
| Biotechnology (18.8%) | ||
| Achillion Pharmaceuticals, Inc. † | 89,600 | $940,800 |
| Acorda Therapeutics, Inc. † | 224,300 | 5,867,688 |
| Actelion NV (Switzerland) † | 79,636 | 3,002,525 |
| Affymax, Inc. † | 724,000 | 7,392,040 |
| Amarin Corp. PLC ADR (Ireland) † | 636,000 | 4,929,000 |
| Amgen, Inc. | 119,335 | 8,108,813 |
| Amylin Pharmaceuticals, Inc. † S | 294,500 | 5,033,005 |
| Anthera Pharmaceuticals, Inc. † | 136,843 | 905,901 |
| Ariad Pharmaceuticals, Inc. † | 204,703 | 2,935,441 |
| Arqule, Inc. † | 593,905 | 4,216,726 |
| AVEO Pharmaceuticals, Inc. † | 308,615 | 4,024,340 |
| BioMarin Pharmaceuticals, Inc. † | 297,900 | 10,649,925 |
| Celgene Corp. † | 582,400 | 42,704,480 |
| Codexis, Inc. † | 270,822 | 1,067,039 |
| Dendreon Corp. † S | 1,175,670 | 13,238,044 |
| Dyax Corp. † S | 992,844 | 1,479,338 |
| Human Genome Sciences, Inc. † | 812,900 | 6,405,652 |
| Neurocrine Biosciences, Inc. † | 248,660 | 1,956,954 |
| Onyx Pharmaceuticals, Inc. † | 121,000 | 4,636,720 |
| Pharmacyclics, Inc. † S | 280,400 | 7,063,276 |
| Spectrum Pharmaceuticals, Inc. † | 556,500 | 7,896,735 |
| Synageva BioPharma Corp. † S | 27,134 | 1,012,641 |
| Synta Pharmaceuticals Corp. † | 926,395 | 4,428,168 |
| United Therapeutics Corp. † | 510,400 | 24,361,392 |
| Verastem, Inc. | 355,447 | 4,123,185 |
| Vertex Pharmaceuticals, Inc. † | 127,300 | 4,954,516 |
| 183,334,344 | ||
| Food and staples retail (2.1%) | ||
| CVS Caremark Corp. | 460,400 | 20,764,040 |
| 20,764,040 | ||
| Health-care equipment and supplies (14.8%) | ||
| Baxter International, Inc. | 856,900 | 49,811,597 |
| CareFusion Corp. † | 77,900 | 2,010,599 |
| China Kanghui Holdings, Inc. ADR (China) † S | 96,439 | 1,790,872 |
| China Medical Technologies, Inc. ADR (China) † S | 944,800 | 1,275,480 |
| Covidien PLC (Ireland) | 796,800 | 41,632,800 |
| Medtronic, Inc. | 322,100 | 12,278,452 |
| Microport Scientific Corp. (China) | 678,000 | 356,812 |
| OraSure Technologies, Inc. † | 98,000 | 982,940 |
| Smith & Nephew PLC (United Kingdom) | 305,954 | 3,008,067 |
| St. Jude Medical, Inc. | 244,000 | 10,277,280 |
| Stryker Corp. | 237,300 | 12,728,772 |
| West Pharmaceutical Services, Inc. | 189,600 | 7,887,360 |
| 144,041,031 | ||
17
| COMMON STOCKS (98.8%)* cont. | Shares | Value |
| Health-care providers and services (16.0%) | ||
| Aetna, Inc. | 1,062,100 | $49,663,796 |
| AmerisourceBergen Corp. | 497,700 | 18,589,095 |
| Cardinal Health, Inc. | 88,760 | 3,687,978 |
| CIGNA Corp. | 592,500 | 26,135,175 |
| Coventry Health Care, Inc. † | 228,100 | 7,456,589 |
| Express Scripts, Inc. † S | 232,100 | 12,377,893 |
| Fresenius Medical Care AG & Co. KGaA (Germany) | 76,542 | 5,361,944 |
| Fresenius Medical Care AG & Co. KGaA ADR (Germany) | 21,210 | 1,491,487 |
| McKesson Corp. | 40,324 | 3,367,457 |
| Medco Health Solutions, Inc. † | 104,400 | 7,056,396 |
| Quest Diagnostics, Inc. | 96,200 | 5,584,410 |
| Sinopharm Group Co. (China) | 310,800 | 844,255 |
| WellPoint, Inc. | 212,500 | 13,946,375 |
| 155,562,850 | ||
| Health-care technology (0.2%) | ||
| MedAssets, Inc. † | 168,300 | 2,403,324 |
| 2,403,324 | ||
| Life sciences tools and services (5.1%) | ||
| Agilent Technologies, Inc. † | 55,500 | 2,420,910 |
| Complete Genomics, Inc. † S | 250,780 | 932,902 |
| Life Technologies Corp. † | 439,400 | 20,788,014 |
| Sequenom, Inc. † S | 284,000 | 1,226,880 |
| ShangPharma Corp. ADR (China) † | 531,484 | 4,411,317 |
| Thermo Fisher Scientific, Inc. † | 267,000 | 15,117,540 |
| WuXi PharmaTech (Cayman), Inc. ADR (China) † | 354,442 | 4,582,935 |
| 49,480,498 | ||
| Personal products (0.2%) | ||
| Synutra International, Inc. † | 350,824 | 2,129,502 |
| 2,129,502 | ||
| Pharmaceuticals (41.4%) | ||
| Abbott Laboratories | 508,500 | 28,786,185 |
| Astellas Pharma, Inc. (Japan) | 322,500 | 13,265,124 |
| Auxilium Pharmaceuticals, Inc. † S | 1,174,400 | 23,206,144 |
| Bayer AG (Germany) | 26,483 | 1,958,222 |
| Cempra, Inc. † | 271,257 | 2,034,428 |
| ChemoCentryx, Inc. † | 180,888 | 1,852,293 |
| Endocyte, Inc. † | 244,900 | 869,395 |
| GlaxoSmithKline PLC (United Kingdom) | 1,233,839 | 27,225,625 |
| Hospira, Inc. † | 137,300 | 4,890,626 |
| Johnson & Johnson | 1,054,000 | 68,594,320 |
| Merck & Co., Inc. | 1,067,300 | 40,738,840 |
| Mitsubishi Tanabe Pharma (Japan) | 209,600 | 2,864,725 |
| Novartis AG (Switzerland) | 626,234 | 34,118,574 |
| Pfizer, Inc. | 3,883,801 | 81,948,200 |
| Roche Holding AG (Switzerland) | 3,963 | 689,922 |
| Sanofi (France) | 369,169 | 27,302,242 |
| Sanofi CVR (France) † | 2,268,524 | 2,949,081 |
| Sihuan Pharmaceutical Holdings Group, Ltd. (China) | 1,928,000 | 760,100 |
| Somaxon Pharmaceuticals, Inc. † S | 1,961,700 | 1,196,637 |
18
| COMMON STOCKS (98.8%)* cont. | Shares | Value |
| Pharmaceuticals cont. | ||
| Teva Pharmaceutical Industries, Ltd. ADR (Israel) | 560,765 | $25,127,880 |
| Warner Chilcott PLC Class A (Ireland) † | 95,300 | 1,594,369 |
| Watson Pharmaceuticals, Inc. † | 194,300 | 11,331,576 |
| 403,304,508 | ||
| Total common stocks (cost $791,636,981) | $961,020,097 | |
| SHORT-TERM INVESTMENTS (5.7%)* | Principal amount/shares | Value |
| Putnam Cash Collateral Pool, LLC 0.18% d | 40,933,625 | $40,933,625 |
| Putnam Money Market Liquidity Fund 0.09% e | 8,680,194 | 8,680,194 |
| SSgA Prime Money Market Fund 0.13% P | 1,060,000 | 1,060,000 |
| U.S. Treasury Bills with effective yields ranging from 0.091% | ||
| to 0.106%, November 15, 2012 ## | $1,464,000 | 1,462,501 |
| U.S. Treasury Bills with effective yields ranging from 0.085% | ||
| to 0.104%, October 18, 2012 ## | 2,433,000 | 2,430,893 |
| U.S. Treasury Bills with effective yields ranging from 0.055% | ||
| to 0.072%, July 26, 2012 | 517,000 | 516,773 |
| U.S. Treasury Bills with an effective yield of 0.072%, May 3, 2012 | 200,000 | 199,974 |
| Total short-term investments (cost $55,285,192) | $55,283,960 | |
| TOTAL INVESTMENTS | ||
| Total investments (cost $846,922,173) | $1,016,304,057 | |
| Key to holding’s abbreviations | |
| ADR | American Depository Receipts: represents ownership of foreign securities on deposit with a |
| custodian bank | |
| CVR | Contingent Value Rights |
Notes to the fund’s portfolio
Unless noted otherwise, the notes to the fund’s portfolio are for the close of the fund’s reporting period, which ran from September 1, 2011 through February 29, 2012 (the reporting period). Within the following notes to the portfolio, references to “ASC 820” represent Accounting Standards Codification ASC 820 Fair Value Measurements and Disclosures.
* Percentages indicated are based on net assets of $973,086,105.
† Non-income-producing security.
## This security, in part or in entirety, was pledged and segregated with the custodian for collateral on certain derivative contracts at the close of the reporting period.
d See Note 1 to the financial statements regarding securities lending. The rate quoted in the security description is the annualized 7-day yield of the fund at the close of the reporting period.
e See Note 6 to the financial statements regarding investments in Putnam Money Market Liquidity Fund. The rate quoted in the security description is the annualized 7-day yield of the fund at the close of the reporting period.
P Security purchased with cash or security received, that was pledged to the fund for collateral on certain derivatives contracts. The rate quoted in the security description is the annualized 7-day yield of the fund at the close of the reporting period (Note 1).
S Security on loan, in part or in entirety, at the close of the reporting period.
At the close of the reporting period, the fund maintained liquid assets totaling $1,191,782 to cover certain derivatives contracts.
19
| DIVERSIFICATION BY COUNTRY* | ||||
| Distribution of investments by country of risk at the close of the reporting period, excluding collateral received, if any (as a percentage of Portfolio Value): | ||||
| United States | 78.4% | Israel | 2.6% | |
| Ireland | 4.9 | Japan | 1.7 | |
| Switzerland | 3.9 | China | 1.4 | |
| France | 3.1 | Germany | 0.9 | |
| United Kingdom | 3.1 | Total | 100.0% | |
* Methodology differs from that used for purposes of complying with the fund’s policy regarding investments in securities of foreign issuers, as discussed further in the fund’s prospectus.
FORWARD CURRENCY CONTRACTS at 2/29/12 (aggregate face value $125,231,856) (Unaudited)
| Unrealized | ||||||
| Contract | Delivery | Aggregate | appreciation/ | |||
| Counterparty | Currency | type | date | Value | face value | (depreciation) |
| Bank of America, N.A. | ||||||
| Euro | Buy | 3/22/12 | $31,971,935 | $31,678,882 | $293,053 | |
| Citibank, N.A. | ||||||
| British Pound | Buy | 3/22/12 | 28,477,045 | 28,331,387 | 145,658 | |
| Danish Krone | Buy | 3/22/12 | 14,943,882 | 14,760,962 | 182,920 | |
| Credit Suisse AG | ||||||
| Japanese Yen | Buy | 3/22/12 | 18,838,696 | 20,116,740 | (1,278,044) | |
| HSBC Bank USA, National Association | ||||||
| Australian Dollar | Buy | 3/22/12 | 17,144,957 | 17,110,882 | 34,075 | |
| JPMorgan Chase Bank, N.A. | ||||||
| Swiss Franc | Buy | 3/22/12 | 13,371,506 | 13,233,003 | 138,503 | |
| Total | $(483,835) | |||||
20
ASC 820 establishes a three-level hierarchy for disclosure of fair value measurements. The valuation hierarchy is based upon the transparency of inputs to the valuation of the fund’s investments. The three levels are defined as follows:
Level 1: Valuations based on quoted prices for identical securities in active markets.
Level 2: Valuations based on quoted prices in markets that are not active or for which all significant inputs are observable, either directly or indirectly.
Level 3: Valuations based on inputs that are unobservable and significant to the fair value measurement.
The following is a summary of the inputs used to value the fund’s net assets as of the close of the reporting period:
| Valuation inputs | ||||||
| Investments in securities: | Level 1 | Level 2 | Level 3 | |||
| Common stocks: | ||||||
| Consumer staples | $22,893,542 | $— | $— | |||
| Health care | 920,035,539 | 18,091,016 | — | |||
| Total common stocks | 942,929,081 | 18,091,016 | — | |||
| Short-term investments | 9,740,194 | 45,543,766 | — | |||
| Totals by level | $952,669,275 | $63,634,782 | $— | |||
| Valuation inputs | ||||||
| Other financial instruments: | Level 1 | Level 2 | Level 3 | |||
| Forward currency contracts | $— | $(483,835) | $— | |||
| Totals by level | $— | $(483,835) | $— | |||
The accompanying notes are an integral part of these financial statements.
21
Statement of assets and liabilities 2/29/12 (Unaudited)
| ASSETS | |
| Investment in securities, at value, including $39,122,143 of securities on loan (Note 1): | |
| Unaffiliated issuers (identified cost $797,308,354) | $966,690,238 |
| Affiliated issuers (identified cost $49,613,819) (Notes 1 and 6) | 49,613,819 |
| Cash | 1,949 |
| Dividends, interest and other receivables | 4,064,652 |
| Receivable for shares of the fund sold | 201,491 |
| Receivable for investments sold | 1,497,197 |
| Unrealized appreciation on forward currency contracts (Note 1) | 794,209 |
| Total assets | 1,022,863,555 |
| LIABILITIES | |
| Payable for investments purchased | 2,708,671 |
| Payable for shares of the fund repurchased | 2,097,026 |
| Payable for compensation of Manager (Note 2) | 495,042 |
| Payable for investor servicing fees (Note 2) | 263,130 |
| Payable for custodian fees (Note 2) | 11,564 |
| Payable for Trustee compensation and expenses (Note 2) | 368,715 |
| Payable for administrative services (Note 2) | 3,764 |
| Payable for distribution fees (Note 2) | 412,128 |
| Unrealized depreciation on forward currency contracts (Note 1) | 1,278,044 |
| Collateral on securities loaned, at value (Note 1) | 40,933,625 |
| Collateral on certain derivative contracts, at value (Note 1) | 1,060,000 |
| Other accrued expenses | 145,741 |
| Total liabilities | 49,777,450 |
| Net assets | $973,086,105 |
| REPRESENTED BY | |
| Paid-in capital (Unlimited shares authorized) (Notes 1 and 4) | $787,102,267 |
| Undistributed net investment income (Note 1) | 3,780,484 |
| Accumulated net realized gain on investments and foreign currency transactions (Note 1) | 13,302,088 |
| Net unrealized appreciation of investments and assets and liabilities in foreign currencies | 168,901,266 |
| Total — Representing net assets applicable to capital shares outstanding | $973,086,105 |
(Continued on next page)
22
Statement of assets and liabilities (Continued)
| COMPUTATION OF NET ASSET VALUE AND OFFERING PRICE | |
| Net asset value and redemption price per class A share | |
| ($895,405,174 divided by 21,572,613 shares) | $41.51 |
| Offering price per class A share (100/94.25 of $41.51)* | $44.04 |
| Net asset value and offering price per class B share ($27,966,925 divided by 842,820 shares)** | $33.18 |
| Net asset value and offering price per class C share ($17,212,348 divided by 468,869 shares)** | $36.71 |
| Net asset value and redemption price per class M share ($9,526,527 divided by 256,976 shares) | $37.07 |
| Offering price per class M share (100/96.50 of $37.07)* | $38.41 |
| Net asset value, offering price and redemption price per class R share | |
| ($2,648,515 divided by 65,786 shares) | $40.26 |
| Net asset value, offering price and redemption price per class Y share | |
| ($20,326,616 divided by 474,072 shares) | $42.88 |
* On single retail sales of less than $50,000. On sales of $50,000 or more the offering price is reduced.
** Redemption price per share is equal to net asset value less any applicable contingent deferred sales charge.
The accompanying notes are an integral part of these financial statements.
23
Statement of operations Six months ended 2/29/12 (Unaudited)
| INVESTMENT INCOME | |
| Dividends (net of foreign tax of $319,074) | $9,477,800 |
| Interest (including interest income of $5,279 from investments in affiliated issuers) (Note 6) | 7,583 |
| Securities lending (Note 1) | 425,980 |
| Total investment income | 9,911,363 |
| EXPENSES | |
| Compensation of Manager (Note 2) | 3,011,732 |
| Investor servicing fees (Note 2) | 1,674,557 |
| Custodian fees (Note 2) | 8,578 |
| Trustee compensation and expenses (Note 2) | 40,783 |
| Administrative services (Note 2) | 12,596 |
| Distribution fees — Class A (Note 2) | 1,091,316 |
| Distribution fees — Class B (Note 2) | 141,807 |
| Distribution fees — Class C (Note 2) | 82,563 |
| Distribution fees — Class M (Note 2) | 34,768 |
| Distribution fees — Class R (Note 2) | 5,653 |
| Other | 205,059 |
| Total expenses | 6,309,412 |
| Expense reduction (Note 2) | (1,024) |
| Net expenses | 6,308,388 |
| Net investment income | 3,602,975 |
| Net realized gain on investments (Notes 1 and 3) | 25,550,033 |
| Net realized loss on foreign currency transactions (Note 1) | (6,511,350) |
| Net unrealized depreciation of assets and liabilities in foreign currencies during the period | (417,941) |
| Net unrealized appreciation of investments during the period | 34,721,747 |
| Net gain on investments | 53,342,489 |
| Net increase in net assets resulting from operations | $56,945,464 |
The accompanying notes are an integral part of these financial statements.
24
Statement of changes in net assets
| DECREASE IN NET ASSETS | Six months ended 2/29/12* | Year ended 8/31/11 |
| Operations: | ||
| Net investment income | $3,602,975 | $6,184,305 |
| Net realized gain on investments | ||
| and foreign currency transactions | 19,038,683 | 110,471,742 |
| Net unrealized appreciation (depreciation) of investments | ||
| and assets and liabilities in foreign currencies | 34,303,806 | (4,048,754) |
| Net increase in net assets resulting from operations | 56,945,464 | 112,607,293 |
| Distributions to shareholders (Note 1): | ||
| From ordinary income | ||
| Net investment income | ||
| Class A | (22,689,836) | (12,895,435) |
| Class B | (638,643) | (646,934) |
| Class C | (359,478) | (264,638) |
| Class M | (218,341) | (152,282) |
| Class R | (55,740) | (24,378) |
| Class Y | (529,534) | (243,517) |
| Net realized short-term gain on investments | ||
| Class A | (7,004,254) | — |
| Class B | (277,162) | — |
| Class C | (150,667) | — |
| Class M | (82,634) | — |
| Class R | (18,510) | — |
| Class Y | (147,670) | — |
| From net realized long-term gain on investments | ||
| Class A | (73,159,921) | (50,507,120) |
| Class B | (2,894,975) | (2,533,823) |
| Class C | (1,573,724) | (1,036,499) |
| Class M | (863,123) | (596,437) |
| Class R | (193,343) | (95,480) |
| Class Y | (1,542,428) | (953,776) |
| Increase in capital from settlement payments (Note 8) | 137,436 | 762,168 |
| Redemption fees (Note 1) | 5,381 | 12,486 |
| Increase (decrease) from capital share transactions (Note 4) | 31,674,628 | (104,666,523) |
| Total decrease in net assets | (23,637,074) | (61,234,895) |
| NET ASSETS | ||
| Beginning of period | 996,723,179 | 1,057,958,074 |
| End of period (including undistributed net investment | ||
| income of $3,780,484 and $24,669,081, respectively) | $973,086,105 | $996,723,179 |
* Unaudited
The accompanying notes are an integral part of these financial statements.
25
Financial highlights (For a common share outstanding throughout the period)
| INVESTMENT OPERATIONS: | LESS DISTRIBUTIONS: | RATIOS AND SUPPLEMENTAL DATA: | |||||||||||||
| Ratio | |||||||||||||||
| Net asset | Net realized | Ratio | of net investment | ||||||||||||
| value, | and unrealized | Total from | From | From | Total return | Net assets, | of expenses | income (loss) | |||||||
| beginning | Net investment | gain (loss) | investment | net investment | net realized gain | Total | Redemption | Non-recurring | Net asset value, | at net asset | end of period | to average | to average | Portfolio | |
| Period ended | of period | income (loss) a | on investments | operations | income | on investments | distributions | fees b | reimbursements | end of period | value (%) c | (in thousands) | net assets (%) d | net assets (%) | turnover (%) |
| Class A | |||||||||||||||
| February 29, 2012 ** | $44.32 | .17 | 2.22 | 2.39 | (1.15) | (4.06) | (5.21) | — | .01 f | $41.51 | 6.33 * | $895,405 | .64 * | .40 * | 7 * |
| August 31, 2011 | 42.86 | .28 | 4.10 | 4.38 | — | (2.95) | (2.95) | — | .03 g,h | 44.32 | 10.20 | 916,644 | 1.26 | .59 | 35 |
| August 31, 2010 | 43.37 | .12 | (.48) | (.36) | — | (.15) | (.15) | — | — i | 42.86 | (.85) | 965,357 | 1.33 | .27 | 40 |
| August 31, 2009 | 53.94 | .07 | (5.55) | (5.48) | — | (5.09) | (5.09) | — | — j | 43.37 | (8.11) | 1,074,478 | 1.38 k | .17 k | 27 |
| August 31, 2008 | 58.65 | .01 | 1.61 | 1.62 | (.29) | (6.04) | (6.33) | — | — | 53.94 | 2.84 | 1,371,196 | 1.23 k | .02 k | 19 |
| August 31, 2007 | 63.67 | .31 e | .78 | 1.09 | (.24) | (5.87) | (6.11) | — | — | 58.65 | 1.83 | 1,593,722 | 1.17 k | .51 e,k | 12 |
| Class B | |||||||||||||||
| February 29, 2012 ** | $36.28 | .01 | 1.76 | 1.77 | (.82) | (4.06) | (4.88) | — | .01 f | $33.18 | 5.92 * | $27,967 | 1.02 * | .02 * | 7 * |
| August 31, 2011 | 35.82 | (.07) | 3.45 | 3.38 | — | (2.95) | (2.95) | — | .03 g,h | 36.28 | 9.37 | 31,192 | 2.01 | (.18) | 35 |
| August 31, 2010 | 36.54 | (.20) | (.37) | (.57) | — | (.15) | (.15) | — | — i | 35.82 | (1.59) | 43,666 | 2.08 | (.48) | 40 |
| August 31, 2009 | 46.82 | (.20) | (4.99) | (5.19) | — | (5.09) | (5.09) | — | — j | 36.54 | (8.79) | 73,170 | 2.13 k | (.57) k | 27 |
| August 31, 2008 | 51.80 | (.34) | 1.40 | 1.06 | — | (6.04) | (6.04) | — | — | 46.82 | 2.06 | 149,621 | 1.98 k | (.74) k | 19 |
| August 31, 2007 | 57.11 | (.16) e | .72 | .56 | — | (5.87) | (5.87) | — | — | 51.80 | 1.06 | 280,338 | 1.92 k | (.28) e,k | 12 |
| Class C | |||||||||||||||
| February 29, 2012 ** | $39.64 | .01 | 1.96 | 1.97 | (.85) | (4.06) | (4.91) | — | .01 f | $36.71 | 5.93 * | $17,212 | 1.02 * | .03 * | 7 * |
| August 31, 2011 | 38.89 | (.07) | 3.74 | 3.67 | — | (2.95) | (2.95) | — | .03 g,h | 39.64 | 9.38 | 17,156 | 2.01 | (.16) | 35 |
| August 31, 2010 | 39.67 | (.20) | (.43) | (.63) | — | (.15) | (.15) | — | — i | 38.89 | (1.61) | 18,049 | 2.08 | (.48) | 40 |
| August 31, 2009 | 50.24 | (.21) | (5.27) | (5.48) | — | (5.09) | (5.09) | — | — j | 39.67 | (8.77) | 21,171 | 2.13 k | (.57) k | 27 |
| August 31, 2008 | 55.15 | (.36) | 1.49 | 1.13 | — | (6.04) | (6.04) | — | — | 50.24 | 2.06 | 26,421 | 1.98 k | (.73) k | 19 |
| August 31, 2007 | 60.42 | (.14) e | .74 | .60 | — | (5.87) | (5.87) | — | — | 55.15 | 1.07 | 31,829 | 1.92 k | (.24) e,k | 12 |
| Class M | |||||||||||||||
| February 29, 2012 ** | $40.03 | .06 | 1.97 | 2.03 | (.94) | (4.06) | (5.00) | — | .01 f | $37.07 | 6.04 * | $9,527 | .89 * | .15 * | 7 * |
| August 31, 2011 | 39.15 | .04 | 3.76 | 3.80 | — | (2.95) | (2.95) | — | .03 g,h | 40.03 | 9.66 | 9,754 | 1.76 | .09 | 35 |
| August 31, 2010 | 39.83 | (.10) | (.43) | (.53) | — | (.15) | (.15) | — | — i | 39.15 | (1.35) | 10,530 | 1.83 | (.23) | 40 |
| August 31, 2009 | 50.30 | (.12) | (5.26) | (5.38) | — | (5.09) | (5.09) | — | — j | 39.83 | (8.54) | 12,299 | 1.88 k | (.33) k | 27 |
| August 31, 2008 | 55.08 | (.24) | 1.50 | 1.26 | — | (6.04) | (6.04) | — | — | 50.30 | 2.32 | 16,981 | 1.73 k | (.48) k | 19 |
| August 31, 2007 | 60.21 | — b,e | .74 | .74 | — | (5.87) | (5.87) | — | — | 55.08 | 1.33 | 21,567 | 1.67 k | (.01) e,k | 12 |
| Class R | |||||||||||||||
| February 29, 2012 ** | $43.11 | .12 | 2.15 | 2.27 | (1.07) | (4.06) | (5.13) | — | .01 f | $40.26 | 6.20 * | $2,649 | .77 * | .30 * | 7 * |
| August 31, 2011 | 41.86 | .17 | 4.00 | 4.17 | — | (2.95) | (2.95) | — | .03 g,h | 43.11 | 9.93 | 2,123 | 1.51 | .37 | 35 |
| August 31, 2010 | 42.47 | .01 | (.47) | (.46) | — | (.15) | (.15) | — | — i | 41.86 | (1.11) | 1,766 | 1.58 | .02 | 40 |
| August 31, 2009 | 53.08 | (.03) | (5.49) | (5.52) | — | (5.09) | (5.09) | — | — j | 42.47 | (8.34) | 1,638 | 1.63 k | (.07) k | 27 |
| August 31, 2008 | 57.87 | (.12) | 1.58 | 1.46 | (.21) | (6.04) | (6.25) | — | — | 53.08 | 2.57 | 1,254 | 1.48 k | (.24) k | 19 |
| August 31, 2007 | 62.97 | .16 e | .77 | .93 | (.16) | (5.87) | (6.03) | — | — | 57.87 | 1.58 | 993 | 1.42 k | .27 e,k | 12 |
| Class Y | |||||||||||||||
| February 29, 2012 ** | $45.68 | .23 | 2.29 | 2.52 | (1.27) | (4.06) | (5.33) | — | .01 f | $42.88 | 6.46 * | $20,327 | .52 * | .53 * | 7 * |
| August 31, 2011 | 43.98 | .41 | 4.21 | 4.62 | — | (2.95) | (2.95) | — | .03 g,h | 45.68 | 10.50 | 19,853 | 1.01 | .85 | 35 |
| August 31, 2010 | 44.40 | .25 | (.52) | (.27) | — | (.15) | (.15) | — | — i | 43.98 | (.63) | 18,590 | 1.08 | .52 | 40 |
| August 31, 2009 | 54.93 | .18 | (5.62) | (5.44) | — | (5.09) | (5.09) | — | — j | 44.40 | (7.87) | 17,685 | 1.13 k | .43 k | 27 |
| August 31, 2008 | 59.63 | .15 | 1.64 | 1.79 | (.45) | (6.04) | (6.49) | — | — | 54.93 | 3.10 | 17,761 | .98 k | .27 k | 19 |
| August 31, 2007 | 64.64 | .44 e | .82 | 1.26 | (.40) | (5.87) | (6.27) | — | — | 59.63 | 2.09 | 18,835 | .92 k | .71 e,k | 12 |
See notes to financial highlights at the end of this section.
The accompanying notes are an integral part of these financial statements.
| 26 | 27 |
Financial highlights (Continued)
* Not annualized.
** Unaudited.
a Per share net investment income (loss) has been determined on the basis of the weighted average number of shares outstanding during the period.
b Amount represents less than $0.01 per share.
c Total return assumes dividend reinvestment and does not reflect the effect of sales charges.
d Includes amounts paid through expense offset and brokerage service arrangements (Note 2).
e Reflects a special dividend received by the fund which amounted to the following amounts:
| Percentage of | ||
| Per share | average net assets | |
| Class A | $0.33 | 0.54% |
| Class B | 0.29 | 0.53 |
| Class C | 0.31 | 0.54 |
| Class M | 0.31 | 0.53 |
| Class R | 0.32 | 0.53 |
| Class Y | 0.31 | 0.51 |
f Reflects a non-recurring reimbursement pursuant to a settlement between the SEC and Canadian Imperial Holdings, Inc./CIBC World Markets Corp. which amounted to $0.01 per share outstanding on November 29, 2011.
g Reflects a non-recurring reimbursement related to restitution amounts in connection with a distribution plan approved by the Securities and Exchange Commission (the SEC) which amounted to $0.03 per share outstanding on July 21, 2011. Also reflects a non-recurring reimbursement related to short-term trading related lawsuits, which amounted to less than $0.01 per share outstanding on May 11, 2011 (Note 8).
h Reflects a non-recurring reimbursement pursuant to a settlement between the SEC and Zurich Capital Markets, Inc., which amounted to less than $0.01 per share outstanding as of December 21, 2010.
i Reflects a non-recurring reimbursement pursuant to a settlement between the SEC and Prudential Securities, Inc., which amounted to less than $0.01 per share outstanding on March 31, 2010.
j Reflects non-recurring reimbursement pursuant to a settlement between the SEC and Bear Stearns & Co., Inc. and Bear Stearns Securities Corp. which amounted to less than $0.01 per share outstanding as of May 21, 2009.
k Reflects an involuntary contractual expense limitation and/or waivers of certain fund expenses in connection with investments in Putnam Prime Money Market Fund in effect during the period. As a result of such limitation and/or waivers, the expenses of each class reflect a reduction of the following amounts:
| Percentage of | |
| average net assets | |
| August 31, 2009 | <0.01% |
| August 31, 2008 | <0.01 |
| August 31, 2007 | <0.01 |
The accompanying notes are an integral part of these financial statements.
28
Notes to financial statements 2/29/12 (Unaudited)
Note 1: Significant accounting policies
Within the following Notes to financial statements, references to “State Street” represent State Street Bank and Trust Company, references to “the SEC” represent the Securities and Exchange Commission, and references to “Putnam Management” represent Putnam Investment Management, LLC, the fund’s manager, an indirect wholly-owned subsidiary of Putnam Investments, LLC.
Putnam Global Health Care Fund (the fund) is a Massachusetts business trust, registered under the Investment Company Act of 1940, as amended, as a non-diversified, open-end management investment company. The investment objective of the fund is to seek capital appreciation by investing primarily in the common stocks of companies worldwide in the health care industries that Putnam Management believes have favorable potential.
The fund offers class A, class B, class C, class M, class R and class Y shares. Class A and class M shares are sold with a maximum front-end sales charge of 5.75% and 3.50%, respectively, and generally do not pay a contingent deferred sales charge. Class B shares, which convert to class A shares after approximately eight years, do not pay a front-end sales charge and are subject to a contingent deferred sales charge if those shares are redeemed within six years of purchase. Class C shares have a one-year 1.00% contingent deferred sales charge and do not convert to class A shares. Class R shares, which are not available to all investors, are sold at net asset value. The expenses for class A, class B, class C, class M and class R shares may differ based on the distribution fee of each class, which is identified in Note 2. Class Y shares, which are sold at net asset value, are generally subject to the same expenses as class A, class B, class C, class M and class R shares, but do not bear a distribution fee. Class Y shares are not available to all investors.
A 1.00% redemption fee may apply on any shares that are redeemed (either by selling or exchanging into another fund) within 90 days of purchase. The redemption fee is accounted for as an addition to paid-in-capital.
Investment income, realized and unrealized gains and losses and expenses of the fund are borne pro-rata based on the relative net assets of each class to the total net assets of the fund, except that each class bears expenses unique to that class (including the distribution fees applicable to such classes). Each class votes as a class only with respect to its own distribution plan or other matters on which a class vote is required by law or determined by the Trustees. If the fund were liquidated, shares of each class would receive their pro-rata share of the net assets of the fund. In addition, the Trustees declare separate dividends on each class of shares.
In the normal course of business, the fund enters into contracts that may include agreements to indemnify another party under given circumstances. The fund’s maximum exposure under these arrangements is unknown as this would involve future claims that may be, but have not yet been, made against the fund. However, the fund’s management team expects the risk of material loss to be remote.
The following is a summary of significant accounting policies consistently followed by the fund in the preparation of its financial statements. The preparation of financial statements is in conformity with accounting principles generally accepted in the United States of America and requires management to make estimates and assumptions that affect the reported amounts of assets and liabilities in the financial statements and the reported amounts of increases and decreases in net assets from operations. Actual results could differ from those estimates. Subsequent events after the Statement of assets and liabilities date through the date that the financial statements were issued have been evaluated in the preparation of the financial statements. Unless otherwise noted, the “reporting period” represents the period from September 1, 2011 through February 29, 2012.
Security valuation Investments for which market quotations are readily available are valued at the last reported sales price on their principal exchange, or official closing price for certain markets, and are classified as Level 1 securities. If no sales are reported, as in the case of some securities traded over-the-counter, a security is valued at its last reported bid price and is generally categorized as a Level 2 security. Investments in other open-end investment companies, which are classified as Level 1 securities, are based on their net asset value. The net asset value of an investment company equals the total value of its assets less its liabilities and divided by the number of its outstanding shares. Shares are only valued as of the close of regular trading on the New York Stock Exchange each day that the exchange is open.
29
Many securities markets and exchanges outside the U.S. close prior to the close of the New York Stock Exchange and therefore the closing prices for securities in such markets or on such exchanges may not fully reflect events that occur after such close but before the close of the New York Stock Exchange. Accordingly, on certain days, the fund will fair value foreign equity securities taking into account multiple factors including movements in the U.S. securities markets, currency valuations and comparisons to the valuation of American Depository Receipts, exchange-traded funds and futures contracts. These securities, which will generally represent a transfer from a Level 1 to a Level 2 security, will be classified as Level 2. The number of days on which fair value prices will be used will depend on market activity and it is possible that fair value prices will be used by the fund to a significant extent. At the close of the reporting period, fair value pricing was used for certain foreign securities in the portfolio Securities quoted in foreign currencies, if any, are translated into U.S. dollars at the current exchange rate.
To the extent a pricing service or dealer is unable to value a security or provides a valuation that Putnam Management does not believe accurately reflects the security’s fair value, the security will be valued at fair value by Putnam Management. Certain investments, including certain restricted and illiquid securities and derivatives, are also valued at fair value following procedures approved by the Trustees. These valuations consider such factors as significant market or specific security events such as interest rate or credit quality changes, various relationships with other securities, discount rates, U.S. Treasury, U.S. swap and credit yields, index levels, convexity exposures and recovery rates. These securities are classified as Level 2 or as Level 3 depending on the priority of the significant inputs.
Such valuations and procedures are reviewed periodically by the Trustees. The fair value of securities is generally determined as the amount that the fund could reasonably expect to realize from an orderly disposition of such securities over a reasonable period of time. By its nature, a fair value price is a good faith estimate of the value of a security in a current sale and does not reflect an actual market price, which may be different by a material amount.
Security transactions and related investment income Security transactions are recorded on the trade date (the date the order to buy or sell is executed). Gains or losses on securities sold are determined on the identified cost basis. Interest income is recorded on the accrual basis. Dividend income, net of applicable withholding taxes, is recognized on the ex-dividend date except that certain dividends from foreign securities, if any, are recognized as soon as the fund is informed of the ex-dividend date. Non-cash dividends, if any, are recorded at the fair market value of the securities received. Dividends representing a return of capital or capital gains, if any, are reflected as a reduction of cost and/or as a realized gain.
Foreign currency translation The accounting records of the fund are maintained in U.S. dollars. The market value of foreign securities, currency holdings, and other assets and liabilities is recorded in the books and records of the fund after translation to U.S. dollars based on the exchange rates on that day. The cost of each security is determined using historical exchange rates. Income and withholding taxes are translated at prevailing exchange rates when earned or incurred. The fund does not isolate that portion of realized or unrealized gains or losses resulting from changes in the foreign exchange rate on investments from fluctuations arising from changes in the market prices of the securities. Such gains and losses are included with the net realized and unrealized gain or loss on investments. Net realized gains and losses on foreign currency transactions represent net realized exchange gains or losses on closed forward currency contracts, disposition of foreign currencies, currency gains and losses realized between the trade and settlement dates on securities transactions and the difference between the amount of investment income and foreign withholding taxes recorded on the fund’s books and the U.S. dollar equivalent amounts actually received or paid. Net unrealized appreciation and depreciation of assets and liabilities in foreign currencies arise from changes in the value of open forward currency contracts and assets and liabilities other than investments at the period end, resulting from changes in the exchange rate.
Forward currency contracts The fund buys and sells forward currency contracts, which are agreements between two parties to buy and sell currencies at a set price on a future date. These contracts are used to hedge foreign exchange risk.
The U.S. dollar value of forward currency contracts is determined using current forward currency exchange rates supplied by a quotation service. The market value of the contract will fluctuate with changes in currency exchange rates. The contract is marked to market daily and the change in market value is recorded as an unrealized gain or loss. The fund records a realized gain or loss equal to the difference between the value of the contract at the time it was opened and the value at the time it was closed when the contract matures or by delivery of the currency. The fund could be exposed to risk if the value of the currency changes unfavorably, if the counterparties to the contracts are unable to meet the terms of their contracts or if the fund is unable to enter into a closing position. Risks may exceed amounts recognized on the Statement of assets and liabilities.
30
Forward currency contracts outstanding at period end, if any, are listed after the fund’s portfolio. The fund had an average contract amount of approximately $125,800,000 on forward currency contracts for the reporting period.
Master agreements The fund is a party to ISDA (International Swaps and Derivatives Association, Inc.) Master Agreements (Master Agreements) with certain counterparties that govern over-the-counter derivative and foreign exchange contracts entered into from time to time. The Master Agreements may contain provisions regarding, among other things, the parties’ general obligations, representations, agreements, collateral requirements, events of default and early termination. With respect to certain counterparties, in accordance with the terms of the Master Agreements, collateral posted to the fund is held in a segregated account by the fund’s custodian and with respect to those amounts which can be sold or repledged, are presented in the fund’s portfolio.
Collateral pledged by the fund is segregated by the fund’s custodian and identified in the fund’s portfolio. Collateral can be in the form of cash or debt securities issued by the U.S. Government or related agencies or other securities as agreed to by the fund and the applicable counterparty. Collateral requirements are determined based on the fund’s net position with each counterparty.
Termination events applicable to the fund may occur upon a decline in the fund’s net assets below a specified threshold over a certain period of time. Termination events applicable to counterparties may occur upon a decline in the counterparty’s long-term and short-term credit ratings below a specified level. In each case, upon occurrence, the other party may elect to terminate early and cause settlement of all derivative and foreign exchange contracts outstanding, including the payment of any losses and costs resulting from such early termination, as reasonably determined by the terminating party. Any decision by one or more of the fund’s counterparties to elect early termination could impact the fund’s future derivative activity.
At the close of the reporting period, the fund had a net liability position of $1,278,044 on derivative contracts subject to the Master Agreements. Collateral posted by the fund totaled $1,138,782.
Securities lending The fund may lend securities, through its agent, to qualified borrowers in order to earn additional income. The loans are collateralized by cash in an amount at least equal to the market value of the securities loaned. The market value of securities loaned is determined daily and any additional required collateral is allocated to the fund on the next business day. The risk of borrower default will be borne by the fund’s agent; the fund will bear the risk of loss with respect to the investment of the cash collateral. Income from securities lending is included in investment income on the Statement of operations. Cash collateral is invested in Putnam Cash Collateral Pool, LLC, a limited liability company managed by an affiliate of Putnam Management. Investments in Putnam Cash Collateral Pool, LLC are valued at its closing net asset value each business day. There are no management fees charged to Putnam Cash Collateral Pool, LLC. At the close of the reporting period, the value of securities loaned amounted to $39,122,143 and the fund received cash collateral of $40,933,625.
Interfund lending The fund, along with other Putnam funds, may participate in an interfund lending program pursuant to an exemptive order issued by the SEC. This program allows the fund to borrow from or lend to other Putnam funds that permit such transactions. Interfund lending transactions are subject to each fund’s investment policies and borrowing and lending limits. Interest earned or paid on the interfund lending transaction will be based on the average of certain current market rates. During the reporting period, the fund did not utilize the program.
Line of credit The fund participates, along with other Putnam funds, in a $325 million unsecured committed line of credit and a $185 million unsecured uncommitted line of credit, both provided by State Street. Borrowings may be made for temporary or emergency purposes, including the funding of shareholder redemption requests and trade settlements. Interest is charged to the fund based on the fund’s borrowing at a rate equal to the Federal Funds rate plus 1.25% for the committed line of credit and the Federal Funds rate plus 1.30% for the uncommitted line of credit. A closing fee equal to 0.02% of the committed line of credit and $50,000 for the uncommitted line of credit has been paid by the participating funds. In addition, a commitment fee of 0.13% per annum on any unutilized portion of the committed line of credit is allocated to the participating funds based on their relative net assets and paid quarterly. During the reporting period, the fund had no borrowings against these arrangements.
Federal taxes It is the policy of the fund to distribute all of its taxable income within the prescribed time period and otherwise comply with the provisions of the Internal Revenue Code of 1986, as amended (the Code), applicable to regulated investment companies. It is also the intention of the fund to distribute an amount sufficient to avoid imposition of any excise tax under Section 4982 of the Code.
The fund is subject to the provisions of Accounting Standards Codification ASC 740 Income Taxes (ASC 740). ASC 740 sets forth a minimum threshold for financial statement recognition of the benefit of a tax position taken or expected to be taken in a tax return. The fund did not have a liability to record for any unrecognized tax benefits in
31
the accompanying financial statements. No provision has been made for federal taxes on income, capital gains or unrealized appreciation on securities held nor for excise tax on income and capital gains. Each of the fund’s federal tax returns for the prior three fiscal years remains subject to examination by the Internal Revenue Service.
The fund may also be subject to taxes imposed by governments of countries in which it invests. Such taxes are generally based on either income or gains earned or repatriated. The fund accrues and applies such taxes to net investment income, net realized gains and net unrealized gains as income and/or capital gains are earned. In some cases, the fund may be entitled to reclaim all or a portion of such taxes, and such reclaim amounts, if any, are reflected as an asset on the fund’s books. In many cases, however, the fund may not receive such amounts for an extended period of time, depending on the country of investment.
The aggregate identified cost on a tax basis is $851,075,061, resulting in gross unrealized appreciation and depreciation of $250,612,323 and $85,383,327, respectively, or net unrealized appreciation of $165,228,996.
Distributions to shareholders Distributions to shareholders from net investment income are recorded by the fund on the ex-dividend date. Distributions from capital gains, if any, are recorded on the ex-dividend date and paid at least annually. The amount and character of income and gains to be distributed are determined in accordance with income tax regulations, which may differ from generally accepted accounting principles. Dividend sources are estimated at the time of declaration. Actual results may vary. Any non-taxable return of capital cannot be determined until final tax calculations are completed after the end of the fund’s fiscal year. Reclassifications are made to the fund’s capital accounts to reflect income and gains available for distribution (or available capital loss carryovers) under income tax regulations.
Note 2: Management fee, administrative services and other transactions
The fund pays Putnam Management a management fee (based on the fund’s average net assets and computed and paid monthly) at annual rates that may vary based on the average of the aggregate net assets of most open-end funds, as defined in the fund’s management contract, sponsored by Putnam Management. Such annual rates may vary as follows:
| 0.780% | of the first $5 billion, |
| 0.730% | of the next $5 billion, |
| 0.680% | of the next $10 billion, |
| 0.630% | of the next $10 billion, |
| 0.580% | of the next $50 billion, |
| 0.560% | of the next $50 billion, |
| 0.550% | of the next $100 billion and |
| 0.545% | of any excess thereafter. |
Putnam Management has contractually agreed, through June 30, 2012, to waive fees or reimburse the fund’s expenses to the extent necessary to limit the cumulative expenses of the fund, exclusive of brokerage, interest, taxes, investment-related expenses, extraordinary expenses and payments under the fund’s investor servicing contract, investment management contract and distribution plans, on a fiscal year-to-date basis to an annual rate of 0.20% of the fund’s average net assets over such fiscal year-to-date period.
Putnam Investments Limited (PIL), an affiliate of Putnam Management, is authorized by the Trustees to manage a separate portion of the assets of the fund as determined by Putnam Management from time to time. Putnam Management pays a quarterly sub-management fee to PIL for its services at an annual rate of 0.35% of the average net assets of the portion of the fund managed by PIL.
The Putnam Advisory Company, LLC (PAC), an affiliate of Putnam Management, is authorized by the Trustees to manage a separate portion of the assets of the fund, as designated from time to time by Putnam Management or PIL. Putnam Management or PIL, as applicable, pays a quarterly sub-advisory fee to PAC for its services at the annual rate of 0.35% of the average net assets of the portion of the fund’s assets for which PAC is engaged as sub-adviser.
The fund reimburses Putnam Management an allocated amount for the compensation and related expenses of certain officers of the fund and their staff who provide administrative services to the fund. The aggregate amount of all such reimbursements is determined annually by the Trustees.
32
Custodial functions for the fund’s assets are provided by State Street. Custody fees are based on the fund’s asset level, the number of its security holdings and transaction volumes.
Putnam Investor Services, Inc., an affiliate of Putnam Management, provides investor servicing agent functions to the fund. Putnam Investor Services, Inc. received fees for investor servicing based on the fund’s retail asset level, the number of shareholder accounts in the fund and the level of defined contribution plan assets in the fund. Investor servicing fees will not exceed an annual rate of 0.375% of the fund’s average net assets. The amounts incurred for investor servicing agent functions during the reporting period are included in Investor servicing fees in the Statement of operations. Effective March 1, 2012, investor servicing fees will not exceed an annual rate of 0.32% of the fund’s average net assets.
The fund has entered into expense offset arrangements with Putnam Investor Services, Inc. and State Street whereby Putnam Investor Services, Inc.’s and State Street’s fees are reduced by credits allowed on cash balances. For the reporting period, the fund’s expenses were reduced by $1,024 under the expense offset arrangements.
Each independent Trustee of the fund receives an annual Trustee fee, of which $719, as a quarterly retainer, has been allocated to the fund, and an additional fee for each Trustees meeting attended. Trustees also are reimbursed for expenses they incur relating to their services as Trustees.
The fund has adopted a Trustee Fee Deferral Plan (the Deferral Plan) which allows the Trustees to defer the receipt of all or a portion of Trustees fees payable on or after July 1, 1995. The deferred fees remain invested in certain Putnam funds until distribution in accordance with the Deferral Plan.
The fund has adopted an unfunded noncontributory defined benefit pension plan (the Pension Plan) covering all Trustees of the fund who have served as a Trustee for at least five years and were first elected prior to 2004. Benefits under the Pension Plan are equal to 50% of the Trustee’s average annual attendance and retainer fees for the three years ended December 31, 2005. The retirement benefit is payable during a Trustee’s lifetime, beginning the year following retirement, for the number of years of service through December 31, 2006. Pension expense for the fund is included in Trustee compensation and expenses in the Statement of operations. Accrued pension liability is included in Payable for Trustee compensation and expenses in the Statement of assets and liabilities. The Trustees have terminated the Pension Plan with respect to any Trustee first elected after 2003.
The fund has adopted distribution plans (the Plans) with respect to its class A, class B, class C, class M and class R shares pursuant to Rule 12b–1 under the Investment Company Act of 1940. The purpose of the Plans is to compensate Putnam Retail Management Limited Partnership, a wholly-owned subsidiary of Putnam Investments, LLC and Putnam Retail Management GP, Inc., for services provided and expenses incurred in distributing shares of the fund. The Plans provide for payments by the fund to Putnam Retail Management Limited Partnership at an annual rate of up to 0.35%, 1.00%, 1.00%, 1.00% and 1.00% of the average net assets attributable to class A, class B, class C, class M and class R shares, respectively. The Trustees have approved payment by the fund at an annual rate of 0.25%, 1.00%, 1.00%, 0.75% and 0.50% of the average net assets attributable to class A, class B, class C, class M and class R shares, respectively.
For the reporting period, Putnam Retail Management Limited Partnership, acting as underwriter, received net commissions of $10,447 and $80 from the sale of class A and class M shares, respectively, and received $9,575 and $252 in contingent deferred sales charges from redemptions of class B and class C shares, respectively.
A deferred sales charge of up to 1.00% and 0.65% is assessed on certain redemptions of class A and class M shares, respectively. For the reporting period, Putnam Retail Management Limited Partnership, acting as underwriter, received no monies on class A and class M redemptions.
Note 3: Purchases and sales of securities
During the reporting period, cost of purchases and proceeds from sales of investment securities other than short-term investments aggregated $69,672,914 and $149,974,671, respectively. There were no purchases or proceeds from sales of long-term U.S. government securities.
33
Note 4: Capital shares
At the close of the reporting period, there was an unlimited number of shares of beneficial interest authorized. Transactions in capital shares were as follows:
| Six months ended 2/29/12 | Year ended 8/31/11 | |||
| Class A | Shares | Amount | Shares | Amount |
| Shares sold | 406,468 | $16,479,044 | 694,285 | $32,696,178 |
| Shares issued in connection with | ||||
| reinvestment of distributions | 2,376,263 | 91,604,902 | 1,247,023 | 55,966,398 |
| 2,782,731 | 108,083,946 | 1,941,308 | 88,662,576 | |
| Shares repurchased | (1,893,246) | (79,183,790) | (3,784,163) | (177,742,752) |
| Net increase (decrease) | 889,485 | $28,900,156 | (1,842,855) | $(89,080,176) |
| Six months ended 2/29/12 | Year ended 8/31/11 | |||
| Class B | Shares | Amount | Shares | Amount |
| Shares sold | 40,635 | $1,364,766 | 60,126 | $2,342,249 |
| Shares issued in connection with | ||||
| reinvestment of distributions | 113,323 | 3,497,151 | 78,676 | 2,906,327 |
| 153,958 | 4,861,917 | 138,802 | 5,248,576 | |
| Shares repurchased | (170,846) | (5,809,282) | (498,266) | (19,409,053) |
| Net decrease | (16,888) | $(947,365) | (359,464) | $(14,160,477) |
| Six months ended 2/29/12 | Year ended 8/31/11 | |||
| Class C | Shares | Amount | Shares | Amount |
| Shares sold | 31,462 | $1,157,875 | 40,669 | $1,734,563 |
| Shares issued in connection with | ||||
| reinvestment of distributions | 52,035 | 1,776,460 | 27,119 | 1,094,505 |
| 83,497 | 2,934,335 | 67,788 | 2,829,068 | |
| Shares repurchased | (47,409) | (1,759,886) | (99,128) | (4,182,734) |
| Net increase (decrease) | 36,088 | $1,174,449 | (31,340) | $(1,353,666) |
| Six months ended 2/29/12 | Year ended 8/31/11 | |||
| Class M | Shares | Amount | Shares | Amount |
| Shares sold | 3,855 | $137,748 | 4,400 | $187,222 |
| Shares issued in connection with | ||||
| reinvestment of distributions | 31,402 | 1,082,104 | 16,899 | 687,452 |
| 35,257 | 1,219,852 | 21,299 | 874,674 | |
| Shares repurchased | (21,965) | (823,801) | (46,595) | (1,991,815) |
| Net increase (decrease) | 13,292 | $396,051 | (25,296) | $(1,117,141) |
| Six months ended 2/29/12 | Year ended 8/31/11 | |||
| Class R | Shares | Amount | Shares | Amount |
| Shares sold | 19,722 | $793,421 | 20,897 | $948,663 |
| Shares issued in connection with | ||||
| reinvestment of distributions | 6,875 | 257,201 | 2,698 | 117,992 |
| 26,597 | 1,050,622 | 23,595 | 1,066,655 | |
| Shares repurchased | (10,045) | (407,828) | (16,541) | (753,473) |
| Net increase | 16,552 | $642,794 | 7,054 | $313,182 |
34
| Six months ended 2/29/12 | Year ended 8/31/11 | |||
| Class Y | Shares | Amount | Shares | Amount |
| Shares sold | 27,795 | $1,166,247 | 117,034 | $5,739,929 |
| Shares issued in connection with | ||||
| reinvestment of distributions | 48,461 | 1,928,765 | 20,398 | 942,002 |
| 76,256 | 3,095,012 | 137,432 | 6,681,931 | |
| Shares repurchased | (36,822) | (1,586,469) | (125,461) | (5,950,176) |
| Net increase | 39,434 | $1,508,543 | 11,971 | $731,755 |
Note 5: Summary of derivative activity
The following is a summary of the market values of derivative instruments as of the close of the reporting period:
Market values of derivative instruments as of the close of the reporting period
| Asset derivatives | Liability derivatives | |||
| Derivatives not | ||||
| accounted for as | Statement of | Statement of | ||
| hedging instruments | assets and | assets and | ||
| under ASC 815 | liabilities location | Market value | liabilities location | Market value |
| Foreign exchange | ||||
| contracts | Receivables | $794,209 | Payables | $1,278,044 |
| Total | $794,209 | $1,278,044 | ||
The following is a summary of realized and change in unrealized gains or losses of derivative instruments on the Statement of operations for the reporting period (see Note 1):
| Derivatives not accounted for as hedging | Forward currency | |
| instruments under ASC 815 | contracts | Total |
| Foreign exchange contracts | $(6,457,979) | $(6,457,979) |
| Total | $(6,457,979) | $(6,457,979) |
Change in unrealized appreciation or (depreciation) on derivatives recognized in net gain or (loss) on investments
| Derivatives not accounted for as hedging | Forward currency | |
| instruments under ASC 815 | contracts | Total |
| Foreign exchange contracts | $(371,324) | $(371,324) |
| Total | $(371,324) | $(371,324) |
Note 6: Investment in Putnam Money Market Liquidity Fund
The fund invested in Putnam Money Market Liquidity Fund, an open-end management investment company managed by Putnam Management. Investments in Putnam Money Market Liquidity Fund are valued at its closing net asset value each business day. Income distributions earned by the fund are recorded as interest income in the Statement of operations and totaled $5,279 for the reporting period. During the reporting period, cost of purchases and proceeds of sales of investments in Putnam Money Market Liquidity Fund aggregated $94,908,172 and $96,559,318, respectively. Management fees charged to Putnam Money Market Liquidity Fund have been waived by Putnam Management.
Note 7: Market, credit and other risks
In the normal course of business, the fund trades financial instruments and enters into financial transactions where risk of potential loss exists due to changes in the market (market risk) or failure of the contracting party to the transaction to perform (credit risk). The fund may be exposed to additional credit risk that an institution or other entity with which the fund has unsettled or open transactions will default. Investments in foreign securities involve certain risks, including those related to economic instability, unfavorable political developments, and currency fluctuations, not present with domestic investments. The fund concentrates its investments in one sector, which involves more risk than a fund that invests more broadly.
35
Note 8: Regulatory matters and litigation
In late 2003 and 2004, Putnam Management settled charges brought by the SEC and the Massachusetts Securities Division in connection with excessive short-term trading in Putnam funds. In July 2011, the fund recorded a receivable of $744,995 related to restitution amounts in connection with a distribution plan approved by the SEC.
This amount is reported in the Increase in capital from settlement payments line on the Statement of changes in net assets. These allegations and related matters have served as the general basis for certain lawsuits, including purported class action lawsuits against Putnam Management and, in a limited number of cases, some Putnam funds. In May 2011, the fund received a payment of $12,516 related to settlement of those lawsuits. This amount is reported in the Increase in capital from settlement payments line on the Statement of changes in net assets. Putnam Management has agreed to bear any costs incurred by the Putnam funds as a result of these matters.
Note 9: New accounting pronouncement
In May 2011, the Financial Accounting Standards Board (FASB) issued Accounting Standards Update (ASU) 2011–04 “Fair Value Measurements and Disclosures (Topic 820) — Amendments to Achieve Common Fair Value Measurement and Disclosure Requirements in U.S. GAAP and IFRS”. ASU 2011–04 amends FASB Topic 820 “Fair Value Measurement” and seeks to develop common requirements for measuring fair value and for disclosing information about fair value measurements in accordance with GAAP. ASU 2011–04 is effective for fiscal years and interim periods beginning after December 15, 2011. Putnam Management is currently evaluating the application of ASU 2011–04 and its impact, if any, on the fund’s financial statements.
36
Fund information
Founded over 70 years ago, Putnam Investments was built around the concept that a balance between risk and reward is the hallmark of a well-rounded financial program. We manage over 100 funds across income, value, blend, growth, asset allocation, absolute return, and global sector categories.
| Investment Manager | Robert J. Darretta | Mark C. Trenchard |
| Putnam Investment | John A. Hill | Vice President and |
| Management, LLC | Paul L. Joskow | BSA Compliance Officer |
| One Post Office Square | Elizabeth T. Kennan | |
| Boston, MA 02109 | Kenneth R. Leibler | Robert T. Burns |
| Robert E. Patterson | Vice President and | |
| Investment Sub-Manager | George Putnam, III | Chief Legal Officer |
| Putnam Investments Limited | Robert L. Reynolds | |
| 57–59 St James’s Street | W. Thomas Stephens | James P. Pappas |
| London, England SW1A 1LD | Vice President | |
| Officers | ||
| Investment Sub-Advisor | Robert L. Reynolds | Judith Cohen |
| The Putnam Advisory | President | Vice President, Clerk and |
| Company, LLC | Assistant Treasurer | |
| One Post Office Square | Jonathan S. Horwitz | |
| Boston, MA 02109 | Executive Vice President, | Michael Higgins |
| Principal Executive | Vice President, Senior Associate | |
| Marketing Services | Officer, Treasurer and | Treasurer and Assistant Clerk |
| Putnam Retail Management | Compliance Liaison | |
| One Post Office Square | Nancy E. Florek | |
| Boston, MA 02109 | Steven D. Krichmar | Vice President, Assistant Clerk, |
| Vice President and | Assistant Treasurer and | |
| Custodian | Principal Financial Officer | Proxy Manager |
| State Street Bank | ||
| and Trust Company | Janet C. Smith | Susan G. Malloy |
| Vice President, Assistant | Vice President and | |
| Legal Counsel | Treasurer and Principal | Assistant Treasurer |
| Ropes & Gray LLP | Accounting Officer | |
| Trustees | Robert R. Leveille | |
| Jameson A. Baxter, Chair | Vice President and | |
| Ravi Akhoury | Chief Compliance Officer | |
| Barbara M. Baumann | ||
| Charles B. Curtis |
This report is for the information of shareholders of Putnam Global Health Care Fund. It may also be used as sales literature when preceded or accompanied by the current prospectus, the most recent copy of Putnam’s Quarterly Performance Summary, and Putnam’s Quarterly Ranking Summary. For more recent performance, please visit putnam.com. Investors should carefully consider the investment objectives, risks, charges, and expenses of a fund, which are described in its prospectus. For this and other information or to request a prospectus or summary prospectus, call 1-800-225-1581 toll free. Please read the prospectus carefully before investing. The fund’s Statement of Additional Information contains additional information about the fund’s Trustees and is available without charge upon request by calling 1-800-225-1581.

| Item 2. Code of Ethics: |
| Not applicable |
| Item 3. Audit Committee Financial Expert: |
| Not applicable |
| Item 4. Principal Accountant Fees and Services: |
| Not applicable |
| Item 5. Audit Committee of Listed Registrants |
| Not applicable |
| Item 6. Schedule of Investments: |
| The registrant’s schedule of investments in unaffiliated issuers is included in the report to shareholders in Item 1 above. |
| Item 7. Disclosure of Proxy Voting Policies and Procedures For Closed-End Management Investment Companies: |
| Not applicable |
| Item 8. Portfolio Managers of Closed-End Investment Companies |
| Not Applicable |
| Item 9. Purchases of Equity Securities by Closed-End Management Investment Companies and Affiliated Purchasers: |
| Not applicable |
| Item 10. Submission of Matters to a Vote of Security Holders: |
| Not applicable |
| Item 11. Controls and Procedures: |
| (a) The registrant’s principal executive officer and principal financial officer have concluded, based on their evaluation of the effectiveness of the design and operation of the registrant’s disclosure controls and procedures as of a date within 90 days of the filing date of this report, that the design and operation of such procedures are generally effective to provide reasonable assurance that information required to be disclosed by the registrant in this report is recorded, processed, summarized and reported within the time periods specified in the Commission’s rules and forms. |
| (b) Changes in internal control over financial reporting: Not applicable |
| Item 12. Exhibits: |
| (a)(1) Not applicable |
| (a)(2) Separate certifications for the principal executive officer and principal financial officer of the registrant as required by Rule 30a-2(a) under the Investment Company Act of 1940, as amended, are filed herewith. |
| (b) The certifications required by Rule 30a-2(b) under the Investment Company Act of 1940, as amended, are filed herewith. |
| Putnam Global Health Care Fund |
| By (Signature and Title): |
| /s/Janet C. Smith Janet C. Smith Principal Accounting Officer |
| Date: April 27, 2012 |
| Pursuant to the requirements of the Securities Exchange Act of 1934 and the Investment Company Act of 1940, this report has been signed below by the following persons on behalf of the registrant and in the capacities and on the dates indicated. |
| By (Signature and Title): |
| /s/Jonathan S. Horwitz Jonathan S. Horwitz Principal Executive Officer |
| Date: April 27, 2012 |
| By (Signature and Title): |
| /s/Steven D. Krichmar Steven D. Krichmar Principal Financial Officer |
| Date: April 27, 2012 |