UNITED STATES
SECURITIES AND EXCHANGE COMMISSION
Washington, DC 20549
FORM N-CSR
CERTIFIED SHAREHOLDER REPORT OF REGISTERED MANAGEMENT INVESTMENT COMPANIES
Investment Company Act file number 811-03395
Franklin Federal Tax-Free Income Fund
(Exact name of registrant as specified in charter)
_One Franklin Parkway, San Mateo, CA 94403-1906
(Address of principal executive offices) (Zip code)
_Craig S. Tyle, One Franklin Parkway, San Mateo, CA 94403-1906
(Name and address of agent for service)
Registrant's telephone number, including area code: 650 312-2000
Date of fiscal year end: _4/30
Date of reporting period: _4/30/14
Item 1. Reports to Stockholders.
| Contents | |||||||
| Shareholder Letter | 1 | Annual Report | Financial Highlights and | Report of Independent | |||
| Statement of Investments | 14 | Registered Public | |||||
| Franklin Federal Tax-Free | Accounting Firm | 58 | |||||
| Income Fund | 4 | ||||||
| Financial Statements | 46 | ||||||
| Tax Information | 59 | ||||||
| Performance Summary | 8 | Notes to | |||||
| Financial Statements | 49 | Board Members and Officers | 60 | ||||
| Your Fund’s Expenses | 12 | ||||||
| Shareholder Information | 65 | ||||||
Annual Report
Franklin Federal Tax-Free Income Fund
Your Fund’s Goal and Main Investments: Franklin Federal Tax-Free Income Fund
seeks to provide as high a level of income exempt from federal income taxes as is consistent with prudent investment management and preservation of capital by investing at least 80% of its total assets in investment-grade municipal securities that pay interest free from such taxes.1
Performance data represent past performance, which does not guarantee future results. Investment return and principal value will fluctuate, and you may have a gain or loss when you sell your shares. Current performance may differ from figures shown. Please visit franklintempleton.com or call (800) 342-5236 for most recent month-end performance.
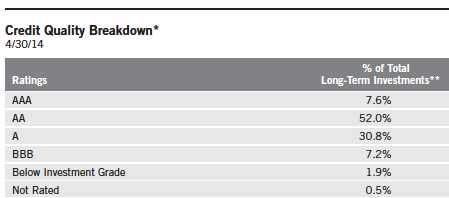
*Standard & Poor’s (S&P) is used as the primary independent rating agency source. Moody’s is secondary, and Fitch, if available, is used for securities not rated by Moody’s or S&P. The ratings are an indication of an issuer’s creditwor-thiness, with long-term ratings typically ranging from AAA (highest) to Below Investment Grade (lowest; includes ratings BB to D). This methodology differs from that used in Fund marketing materials.
**Does not include short-term investments and other net assets.
This annual report for Franklin Federal Tax-Free Income Fund covers the fiscal year ended April 30, 2014.
Performance Overview
The Fund’s Class A share price, as measured by net asset value, decreased from $12.79 on April 30, 2013, to $12.22 on April 30, 2014. The Fund’s Class A shares paid dividends totaling 48.72 cents per share for the reporting period.2 The Performance Summary beginning on page 8 shows that at the end of this reporting period the Fund’s Class A shares’ distribution rate was 3.89% based on an annualization of April’s 4.14 cent per share dividend and the maximum offering price of $12.76 on April 30, 2014. An investor in the 2014 maximum
The dollar value, number of shares or principal amount, and names of all portfolio holdings are listed in the Fund’s Statement of Investments (SOI). The SOI begins on page 17.
4 | Annual Report
| Dividend Distributions2 | |||
| 5/1/13–4/30/14 | |||
| Dividend per Share (cents) | |||
| Month | Class A | Class C | Advisor Class |
| May | 3.90 | 3.31 | 4.01 |
| June | 3.90 | 3.33 | 4.00 |
| July | 3.90 | 3.33 | 4.00 |
| August | 4.00 | 3.43 | 4.10 |
| September | 4.05 | 3.51 | 4.15 |
| October | 4.15 | 3.61 | 4.25 |
| November | 4.15 | 3.61 | 4.25 |
| December | 4.15 | 3.60 | 4.24 |
| January | 4.10 | 3.55 | 4.19 |
| February | 4.14 | 3.59 | 4.23 |
| March | 4.14 | 3.59 | 4.26 |
| April | 4.14 | 3.59 | 4.26 |
| Total | 48.72 | 42.05 | 49.94 |
federal personal income tax bracket of 39.60% (plus 3.8% Medicare tax) would need to earn a distribution rate of 6.87% from a taxable investment to match the Fund’s Class A tax-free distribution rate. For the Fund’s Class C and Advisor shares’ performance, please see the Performance Summary.
Municipal Bond Market Overview
For the 12-month period ended April 30, 2014, the municipal bond market increased in value. The Barclays Municipal Bond Index, which tracks investment-grade municipal securities, posted a +0.50% total return for the 12-month period.3, 4 In comparison, the Barclays U.S. Treasury Index had a 12-month return of -1.59%.3, 4
Municipal bond and Treasury markets suffered steep declines beginning in late May 2013 following comments by Federal Reserve Board (Fed) Chairman Ben Bernanke that the Fed could begin tapering its bond buying in the coming months. Fears of declining bond prices increased when minutes from the Fed’s July meeting included more discussion of tapering. Municipal bond mutual funds experienced persistent, large outflows that accelerated during August. Selling in the Treasury and municipal bond markets caused yields on longer term bonds to rise faster than yields on shorter maturity bonds in both markets, but the yield difference was more pronounced for municipal bonds. Because bond prices move in the opposite direction from yields, the yield changes led to two significant developments during the sell-off — municipal bonds underper-formed Treasury bonds, and longer term municipal bonds fared worse than
Annual Report | 5
| Portfolio Breakdown | ||
| 4/30/14 | ||
| % of Total | ||
| Long-Term Investments* | ||
| Utilities | 18.4 | % |
| General Obligation | 16.1 | % |
| Transportation | 15.8 | % |
| Subject to Government Appropriations | 12.5 | % |
| Hospital & Health Care | 10.7 | % |
| Higher Education | 6.7 | % |
| Tax-Supported | 6.5 | % |
| Other Revenue | 5.8 | % |
| Refunded | 5.4 | % |
| Corporate-Backed | 1.3 | % |
| Housing | 0.8 | % |
*Does not include short-term investments and other net assets.
6 | Annual Report
shorter term municipal bonds. At its September meeting, the Fed decided to maintain its monthly level of bond purchases and wait for more evidence of sustained economic growth before tapering. Investors welcomed the news, and the municipal bond market posted positive returns for the month. At its December meeting, the Fed announced it would modestly reduce the pace of its bond buying program beginning in January 2014 while maintaining historically low interest rates. Municipal bond and Treasury markets showed little reaction to the news initially, but prices in both markets increased substantially during the first four months of 2014.
Other factors contributed to municipal bond price volatility during the period under review. Several headline stories shook investor confidence in the municipal bond asset class. The City of Detroit, Michigan, filed for bankruptcy, the largest municipal bankruptcy filing in U.S. history. Independent credit rating agencies Standard & Poor’s, Moody’s Investors Service and Fitch Ratings downgraded Puerto Rico general obligation debt to below investment grade. The City of Chicago suffered a three-notch downgrade by Moody’s. In addition, reports from rating agencies and research organizations mentioned underfunded pensions that could affect the fiscal stability of several states and large municipalities. Bonds issued by municipalities involved in such stories have often experienced price erosion in secondary trading, but the extent of price erosion and the contagion to related issues have been unpredictable. Fallout from such headlines during the reporting period was no exception.
As Puerto Rico debt traded at higher yields than similarly rated taxable securities, nontraditional buyers entered the market. Despite the entrance of these new buyers, Puerto Rico bonds experienced particularly poor performance and highly volatile trading. Puerto Rico bonds had a -15.36% total return for the reporting period, as measured by the Barclays Puerto Rico Municipal Bond Index.3, 4
At period-end, we maintained our positive view of the municipal bond market. We believe municipal bonds continue to be an attractive asset class among fixed income securities, and we intend to follow our solid discipline of investing to maximize income while seeking value in the municipal bond market.
Investment Strategy
We use a consistent, disciplined strategy in an effort to maximize tax-exempt income for our shareholders by seeking to maintain exposure to higher coupon securities while balancing risk and return within the Fund’s range of allowable investments. We generally employ a buy-and-hold approach and invest in securities we believe should provide the most relative value in the market. We do not use leverage or derivatives, nor do we use hedging techniques that could add volatility and contribute to underperformance in adverse markets.
Manager’s Discussion
Our value-oriented philosophy of investing primarily for income and stability of principal, when combined with a positive-sloping municipal yield curve, in which yields for longer term bonds are higher than those for shorter term bonds, led us to favor longer term bonds during the 12 months under review. Consistent with our strategy, we sought to remain invested in bonds ranging from 15 to 30 years in maturity with good call features. Our relative-value, income-oriented philosophy also led the Fund to maintain its positions in higher coupon bonds, which provided income performance during the reporting period. We believe our conservative, buy-and-hold investment strategy can help us achieve high, current, tax-free income for shareholders.
With the Puerto Rico credit downgrade, the Fund is not required to sell securities that have been downgraded to below investment grade, but it is prohibited from making further purchases of such securities as long as the securities are not rated investment grade by at least one U.S. nationally recognized rating service. Rating actions combined with news related to the commonwealth’s financial position and future financing endeavors caused the Puerto Rico bond market to experience sharp declines in the latter half of 2013 and contrasting positive performance year-to-date in 2014.
Thank you for your continued participation in Franklin Federal Tax-Free Income Fund. We look forward to serving your future investment needs.
The foregoing information reflects our analysis, opinions and portfolio holdings as of April 30, 2014, the end of the
reporting period. The way we implement our main investment strategies and the resulting portfolio holdings may
change depending on factors such as market and economic conditions. These opinions may not be relied upon as
investment advice or an offer for a particular security. The information is not a complete analysis of every aspect
of any market, country, industry, security or the Fund. Statements of fact are from sources considered reliable, but
the investment manager makes no representation or warranty as to their completeness or accuracy. Although his-
torical performance is no guarantee of future results, these insights may help you understand our investment
management philosophy.
1. Dividends are generally subject to state and local taxes, if any. For investors subject to alternative minimum tax, a
small portion of Fund dividends may be taxable. Distributions of capital gains are generally taxable. To avoid imposi-
tion of 28% backup withholding on all Fund distributions and redemption proceeds, U.S. investors must be properly
certified on Form W-9 and non-U.S. investors on Form W-8BEN.
2. All Fund distributions will vary depending upon current market conditions, and past distributions are not indicative
of future trends.
3. Source: © 2014 Morningstar. All Rights Reserved. The information contained herein: (1) is proprietary to Morningstar
and/or its content providers; (2) may not be copied or distributed; and (3) is not warranted to be accurate, complete or
timely. Neither Morningstar nor its content providers are responsible for any damages or losses arising from any use of
this information.
4. Source: Barclays Global Family of Indices. © 2014 Barclays Capital Inc. Used with permission.
Annual Report | 7
Performance Summary as of 4/30/14
Your dividend income will vary depending on dividends or interest paid by securities in the Fund’s portfolio, adjusted for operating expenses of each class. Capital gain distributions are net profits realized from the sale of portfolio securities. The performance table and graphs do not reflect any taxes that a shareholder would pay on Fund dividends, capital gain distributions, if any, or any realized gains on the sale of Fund shares. Total return reflects reinvestment of the Fund’s dividends and capital gain distributions, if any, and any unrealized gains or losses.
| Net Asset Value | ||||||||
| Share Class | 4/30/14 | 4/30/13 | Change | |||||
| A (FKTIX) | $ | 12.22 | $ | 12.79 | -$ | 0.57 | ||
| C (FRFTX) | $ | 12.21 | $ | 12.78 | -$ | 0.57 | ||
| Advisor (FAFTX) | $ | 12.23 | $ | 12.80 | -$ | 0.57 | ||
| Distributions | ||||||||
| Share Class | Dividend Income | |||||||
| A | (5/1/13–4/30/14) | $ | 0.4872 | |||||
| C | (5/1/13–4/30/14) | $ | 0.4205 | |||||
| Advisor (5/1/13–4/30/14) | $ | 0.4994 | ||||||
8 | Annual Report
Performance Summary (continued)
Performance
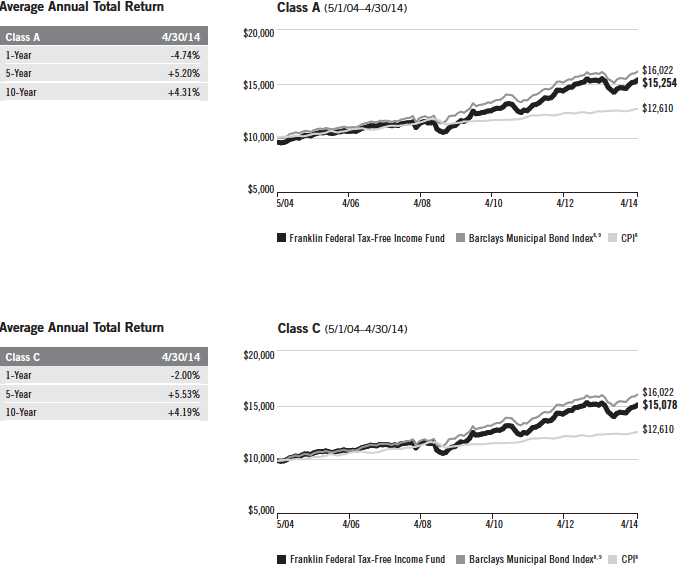
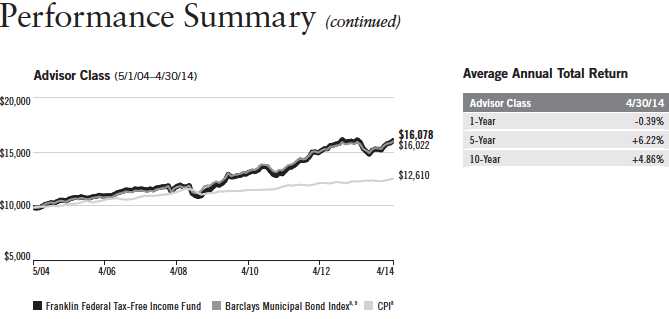
Cumulative total return excludes sales charges. Average annual total returns include maximum sales charges. Class A: 4.25% maximum initial sales charge. Class C: 1% contingent deferred sales charge in first year only; Advisor Class: no sales charges.
| Average Annual | |||||||||||
| Cumulative | Average Annual | Total Return | Total Annual | ||||||||
| Share Class | Total Return1 | Total Return2 | (3/31/14 | )3 | Operating Expenses4 | ||||||
| A | 0.61 | % | |||||||||
| 1-Year | -0.49 | % | -4.74 | % | -4.71 | % | |||||
| 5-Year | +34.61 | % | +5.20 | % | +5.39 | % | |||||
| 10-Year | +59.33 | % | +4.31 | % | +3.94 | % | |||||
| C | 1.16 | % | |||||||||
| 1-Year | -1.05 | % | -2.00 | % | -1.92 | % | |||||
| 5-Year | +30.87 | % | +5.53 | % | +5.73 | % | |||||
| 10-Year | +50.78 | % | +4.19 | % | +3.83 | % | |||||
| Advisor | 0.51 | % | |||||||||
| 1-Year | -0.39 | % | -0.39 | % | -0.39 | % | |||||
| 5-Year | +35.24 | % | +6.22 | % | +6.41 | % | |||||
| 10-Year | +60.78 | % | +4.86 | % | +4.50 | % |
| Taxable | Taxable Equivalent | |||||||
| Equivalent | 30-day | 30-Day | ||||||
| Distribution | Distribution | Standardized | Standardized | |||||
| Share Class | Rate5 | Rate6 | Yield7 | Yield6 | ||||
| A | 3.89 | % | 6.87 | % | 2.86 | % | 5.05 | % |
| C | 3.53 | % | 6.24 | % | 2.43 | % | 4.29 | % |
| Advisor | 4.18 | % | 7.39 | % | 3.07 | % | 5.42 | % |
Performance data represent past performance, which does not guarantee future results. Investment return and principal value will fluctuate, and you may have a gain or loss when you sell your shares. Current performance may differ from figures shown. For most recent month-end performance, go to franklintempleton.com or call (800) 342-5236.
Annual Report | 9
Performance Summary (continued)
Total Return Index Comparison for a Hypothetical $10,000 Investment
Total return represents the change in value of an investment over the periods shown. It includes any applicable, maximum sales charge, Fund expenses, account fees and reinvested distributions. The unmanaged index includes reinvestment of any income or distributions. It differs from the Fund in composition and does not pay management fees or expenses. One cannot invest directly in an index.
10 | Annual Report
All investments involve risks, including possible loss of principal. Because municipal bonds are sensitive to interest rate movements, the Fund’s yield and share price will fluctuate with market conditions. Bond prices generally move in the opposite direction of interest rates. Thus, as prices of bonds in the Fund adjust to a rise in interest rates, the Fund’s share price may decline. Changes in the credit rating of a bond, or in the credit rating or financial strength of a bond’s issuer, insurer or guarantor, may affect the bond’s value. The Fund holds a small portion of its assets in Puerto Rico municipal bonds that have been impacted by recent adverse economic and market changes, which may cause the Fund’s share price to decline. The Fund may invest a significant part of its assets in municipal securities that finance similar types of projects, such as utilities, hospitals, higher education and transportation. A change that affects one project would likely affect all similar projects, thereby increasing market risk. The Fund is actively managed but there is no guarantee that the manager’s investment decisions will produce the desired results. The Fund’s prospectus also includes a description of the main investment risks.
Class C: These shares have higher annual fees and expenses than Class A shares.
Advisor Class: Shares are available to certain eligible investors as described in the prospectus
1. Cumulative total return represents the change in value of an investment over the periods indicated.
2. Average annual total return represents the average annual change in value of an investment over the periods indicated.
3. In accordance with SEC rules, we provide standardized average annual total return information through the latest
calendar quarter.
4. Figures are as stated in the Fund’s current prospectus. In periods of market volatility, assets may decline significantly,
causing total annual Fund operating expenses to become higher than the figures shown.
5. Distribution rate is based on an annualization of the respective class’s April dividend and the maximum offering
price (NAV for Classes C and Advisor) per share on 4/30/14.
6. Taxable equivalent distribution rate and yield assume the 2014 maximum federal income tax rate of 39.60% plus
3.8% Medicare tax.
7. The 30-day standardized yield for the 30 days ended 4/30/14 reflects an estimated yield to maturity (assuming all
portfolio securities are held to maturity). It should be regarded as an estimate of the Fund’s rate of investment income,
and it may not equal the Fund’s actual income distribution rate (which reflects the Fund’s past dividends paid to
shareholders) or the income reported in the Fund’s financial statements.
8. Source: © 2014 Morningstar. The Barclays Municipal Bond Index is a market value-weighted index engineered for
the long-term tax-exempt bond market. To be included in the index, bonds must be fixed rate, have at least one year to
final maturity and be rated investment grade (Baa3/BBB- or higher) by at least two of the following agencies: Moody’s,
S&P and Fitch. The Consumer Price Index (CPI), calculated by the Bureau of Labor Statistics, is a commonly used
measure of the inflation rate.
9. Source: Barclays Global Family of Indices. © 2014 Barclays Capital Inc. Used with permission.
Annual Report | 11
Your Fund’s Expenses
As a Fund shareholder, you can incur two types of costs:
- Transaction costs, including sales charges (loads) on Fund purchases; and
- Ongoing Fund costs, including management fees, distribution and service (12b-1) fees, and other Fund expenses. All mutual funds have ongoing costs, sometimes referred to as operating expenses.
The following table shows ongoing costs of investing in the Fund and can help you understand these costs and compare them with those of other mutual funds. The table assumes a $1,000 investment held for the six months indicated.
Actual Fund Expenses
The first line (Actual) for each share class listed in the table provides actual account values and expenses. The “Ending Account Value” is derived from the Fund’s actual return, which includes the effect of Fund expenses.
You can estimate the expenses you paid during the period by following these steps. Of course, your account value and expenses will differ from those in this illustration:
| 1. | Divide your account value by $1,000. |
| If an account had an $8,600 value, then $8,600 ÷ $1,000 = 8.6. | |
| 2. | Multiply the result by the number under the heading “Expenses Paid During Period.” |
| If Expenses Paid During Period were $7.50, then 8.6 x $7.50 = $64.50. |
In this illustration, the estimated expenses paid this period are $64.50.
Hypothetical Example for Comparison with Other Funds
Information in the second line (Hypothetical) for each class in the table can help you compare ongoing costs of investing in the Fund with those of other mutual funds. This information may not be used to estimate the actual ending account balance or expenses you paid during the period. The hypothetical “Ending Account Value” is based on the actual expense ratio for each class and an assumed 5% annual rate of return before expenses, which does not represent the Fund’s actual return. The figure under the heading “Expenses Paid During Period” shows the hypothetical expenses your account would have incurred under this scenario. You can compare this figure with the 5% hypothetical examples that appear in shareholder reports of other funds.
12 | Annual Report
Your Fund’s Expenses (continued)
Please note that expenses shown in the table are meant to highlight ongoing costs and do not reflect any transaction costs, such as sales charges. Therefore, the second line for each class is useful in comparing ongoing costs only, and will not help you compare total costs of owning different funds. In addition, if transaction costs were included, your total costs would have been higher. Please refer to the Fund prospectus for additional information on operating expenses.
| Beginning Account | Ending Account | Expenses Paid During | ||||
| Share Class | Value 11/1/13 | Value 4/30/14 | Period* 11/1/13–4/30/14 | |||
| A | ||||||
| Actual | $ | 1,000 | $ | 1,050.30 | $ | 3.25 |
| Hypothetical (5% return before expenses) | $ | 1,000 | $ | 1,021.62 | $ | 3.21 |
| C | ||||||
| Actual | $ | 1,000 | $ | 1,047.40 | $ | 6.04 |
| Hypothetical (5% return before expenses) | $ | 1,000 | $ | 1,018.89 | $ | 5.96 |
| Advisor | ||||||
| Actual | $ | 1,000 | $ | 1,050.80 | $ | 2.75 |
| Hypothetical (5% return before expenses) | $ | 1,000 | $ | 1,022.12 | $ | 2.71 |
*Expenses are calculated using the most recent expense ratio, annualized for each class (A: 0.64%; C: 1.19%; and Advisor: 0.54%), multiplied by the average account value over the period, multiplied by 181/365 to reflect the one-half year period.
Annual Report | 13
Franklin Federal Tax-Free Income Fund
Financial Highlights
| Year Ended April 30, | |||||||||||||||
| Class A | 2014 | 2013 | 2012 | 2011 | 2010 | ||||||||||
| Per share operating performance | |||||||||||||||
| (for a share outstanding throughout the year) | |||||||||||||||
| Net asset value, beginning of year | $ | 12.79 | $ | 12.48 | $ | 11.47 | $ | 11.89 | $ | 11.21 | |||||
| Income from investment operationsa: | |||||||||||||||
| Net investment incomeb | 0.49 | 0.48 | 0.51 | 0.52 | 0.52 | ||||||||||
| Net realized and unrealized gains (losses) | (0.57 | ) | 0.31 | 1.02 | (0.43 | ) | 0.69 | ||||||||
| Total from investment operations | (0.08 | ) | 0.79 | 1.53 | 0.09 | 1.21 | |||||||||
| Less distributions from net investment income | (0.49 | ) | (0.48 | ) | (0.52 | ) | (0.51 | ) | (0.53 | ) | |||||
| Net asset value, end of year | $ | 12.22 | $ | 12.79 | $ | 12.48 | $ | 11.47 | $ | 11.89 | |||||
| Total returnc | (0.49 | )% | 6.44 | % | 13.61 | % | 0.78 | % | 11.00 | % | |||||
| Ratios to average net assets | |||||||||||||||
| Expenses | 0.62 | % | 0.61 | % | 0.62 | % | 0.62 | % | 0.61 | % | |||||
| Net investment income | 4.11 | % | 3.76 | % | 4.25 | % | 4.41 | % | 4.51 | % | |||||
| Supplemental data | |||||||||||||||
| Net assets, end of year (000’s) | $ | 8,243,367 | $ | 9,414,734 | $ | 8,758,460 | $ | 7,925,674 | $ | 8,768,920 | |||||
| Portfolio turnover rate | 8.51 | % | 6.31 | % | 8.55 | % | 14.14 | % | 8.16 | % | |||||
aThe amount shown for a share outstanding throughout the period may not correlate with the Statement of Operations for the period due to the timing of sales and repurchases of
the Fund shares in relation to income earned and/or fluctuating fair value of the investments of the Fund.
bBased on average daily shares outstanding.
cTotal return does not reflect sales commissions or contingent deferred sales charges, if applicable.
14 | The accompanying notes are an integral part of these financial statements. | Annual Report
Franklin Federal Tax-Free Income Fund
Financial Highlights (continued)
| Year Ended April 30, | |||||||||||||||
| Class C | 2014 | 2013 | 2012 | 2011 | 2010 | ||||||||||
| Per share operating performance | |||||||||||||||
| (for a share outstanding throughout the year) | |||||||||||||||
| Net asset value, beginning of year | $ | 12.78 | $ | 12.47 | $ | 11.46 | $ | 11.88 | $ | 11.21 | |||||
| Income from investment operationsa: | |||||||||||||||
| Net investment incomeb | 0.43 | 0.41 | 0.45 | 0.45 | 0.46 | ||||||||||
| Net realized and unrealized gains (losses) | (0.58 | ) | 0.31 | 1.01 | (0.42 | ) | 0.67 | ||||||||
| Total from investment operations | (0.15 | ) | 0.72 | 1.46 | 0.03 | 1.13 | |||||||||
| Less distributions from net investment income | (0.42 | ) | (0.41 | ) | (0.45 | ) | (0.45 | ) | (0.46 | ) | |||||
| Net asset value, end of year | $ | 12.21 | $ | 12.78 | $ | 12.47 | $ | 11.46 | $ | 11.88 | |||||
| Total returnc | (1.05 | )% | 5.87 | % | 13.00 | % | 0.22 | % | 10.31 | % | |||||
| Ratios to average net assets | |||||||||||||||
| Expenses | 1.17 | % | 1.16 | % | 1.17 | % | 1.17 | % | 1.17 | % | |||||
| Net investment income | 3.56 | % | 3.21 | % | 3.70 | % | 3.86 | % | 3.95 | % | |||||
| Supplemental data | |||||||||||||||
| Net assets, end of year (000’s) | $ | 1,120,471 | $ | 1,525,083 | $ | 1,319,527 | $ | 1,116,089 | $ | 1,222,493 | |||||
| Portfolio turnover rate | 8.51 | % | 6.31 | % | 8.55 | % | 14.14 | % | 8.16 | % | |||||
aThe amount shown for a share outstanding throughout the period may not correlate with the Statement of Operations for the period due to the timing of sales and repurchases of
the Fund shares in relation to income earned and/or fluctuating fair value of the investments of the Fund.
bBased on average daily shares outstanding.
cTotal return does not reflect sales commissions or contingent deferred sales charges, if applicable.
Annual Report | The accompanying notes are an integral part of these financial statements. | 15
Franklin Federal Tax-Free Income Fund
Financial Highlights (continued)
| Year Ended April 30, | |||||||||||||||
| Advisor Class | 2014 | 2013 | 2012 | 2011 | 2010 | ||||||||||
| Per share operating performance | |||||||||||||||
| (for a share outstanding throughout the year) | |||||||||||||||
| Net asset value, beginning of year | $ | 12.80 | $ | 12.49 | $ | 11.48 | $ | 11.89 | $ | 11.22 | |||||
| Income from investment operationsa: | |||||||||||||||
| Net investment incomeb | 0.50 | 0.49 | 0.52 | 0.53 | 0.54 | ||||||||||
| Net realized and unrealized gains (losses) | (0.57 | ) | 0.31 | 1.02 | (0.42 | ) | 0.67 | ||||||||
| Total from investment operations | (0.07 | ) | 0.80 | 1.54 | 0.11 | 1.21 | |||||||||
| Less distributions from net investment income | (0.50 | ) | (0.49 | ) | (0.53 | ) | (0.52 | ) | (0.54 | ) | |||||
| Net asset value, end of year | $ | 12.23 | $ | 12.80 | $ | 12.49 | $ | 11.48 | $ | 11.89 | |||||
| Total return | (0.39 | )% | 6.54 | % | 13.71 | % | 0.96 | % | 11.01 | % | |||||
| Ratios to average net assets | |||||||||||||||
| Expenses | 0.52 | % | 0.51 | % | 0.52 | % | 0.52 | % | 0.52 | % | |||||
| Net investment income | 4.21 | % | 3.86 | % | 4.35 | % | 4.51 | % | 4.60 | % | |||||
| Supplemental data | |||||||||||||||
| Net assets, end of year (000’s) | $ | 1,314,233 | $ | 1,755,892 | $ | 1,389,908 | $ | 1,079,061 | $ | 875,566 | |||||
| Portfolio turnover rate | 8.51 | % | 6.31 | % | 8.55 | % | 14.14 | % | 8.16 | % | |||||
aThe amount shown for a share outstanding throughout the period may not correlate with the Statement of Operations for the period due to the timing of sales and repurchases of
the Fund shares in relation to income earned and/or fluctuating fair value of the investments of the Fund.
bBased on average daily shares outstanding.
16 | The accompanying notes are an integral part of these financial statements. | Annual Report
Franklin Federal Tax-Free Income Fund
Statement of Investments, April 30, 2014
| Principal Amount | Value | ||||
| Municipal Bonds 97.1% | |||||
| Alabama 1.3% | |||||
| Alabama State Incentives Financing Authority Special Obligation Revenue, Series A, 5.00%, | |||||
| 9/01/42 | $ | 14,300,000 | $ | 15,034,162 | |
| Alabama State Port Authority Docks Facilities Revenue, Refunding, 6.00%, 10/01/40 | 6,000,000 | 6,769,440 | |||
| Birmingham Waterworks Board Water Revenue, | |||||
| Series A, Assured Guaranty, 5.125%, 1/01/34 | 5,600,000 | 6,159,272 | |||
| Series B, 5.00%, 1/01/38 | 3,500,000 | 3,791,060 | |||
| Series B, 5.00%, 1/01/43 | 8,000,000 | 8,586,080 | |||
| Courtland IDB Solid Waste Disposal Revenue, Champion International Corp. Project, | |||||
| Refunding, 6.00%, 8/01/29 | 12,000,000 | 12,014,160 | |||
| East Alabama Health Care Authority Health Care Facilities Revenue, Mandatory Put 9/01/18, | |||||
| Series B, 5.50%, 9/01/33 | 18,500,000 | 20,840,620 | |||
| Mobile GO, wts., Refunding and Improvement, AMBAC Insured, 5.00%, 2/15/30 | 5,000,000 | 5,331,300 | |||
| Montgomery County PBA Revenue, wts., Montgomery County Facilities Project, NATL Insured, | |||||
| 5.00%, 3/01/31 | 6,250,000 | 6,623,000 | |||
| Tuscaloosa Public Educational Building Authority Student Housing Revenue, Ridgecrest | |||||
| Student Housing LLC, University of Alabama Ridgecrest Residential Project, Assured | |||||
| Guaranty, 6.75%, 7/01/38 | 10,000,000 | 11,082,900 | |||
| University of Alabama General Revenue, Series A, | |||||
| NATL Insured, Pre-Refunded, 5.00%, 7/01/29 | 10,000,000 | 10,067,700 | |||
| NATL Insured, Pre-Refunded, 5.00%, 7/01/34 | 10,500,000 | 10,567,095 | |||
| XLCA Insured, 5.00%, 7/01/28 | 5,000,000 | 5,417,550 | |||
| XLCA Insured, 5.00%, 7/01/32 | 5,500,000 | 5,834,290 | |||
| University of South Alabama University Tuition Revenue, Capital Improvement, Refunding, | |||||
| AMBAC Insured, 5.00%, 12/01/36 | 11,570,000 | 12,138,434 | |||
| 140,257,063 | |||||
| Alaska 0.6% | |||||
| Alaska State HFC Revenue, General Housing Purpose, Series A, FGIC Insured, | |||||
| Pre-Refunded, 5.00%, | |||||
| 12/01/29 | 4,000,000 | 4,110,440 | |||
| 12/01/30 | 3,500,000 | 3,596,635 | |||
| Alaska State Industrial Development and Export Authority Revenue, Providence Health and | |||||
| Services, Series A, 5.00%, 10/01/40 | 10,000,000 | 10,628,500 | |||
| Alaska State International Airports Revenue, | |||||
| Series B, NATL Insured, 5.00%, 10/01/28 | 5,100,000 | 5,114,127 | |||
| Series C, 5.00%, 10/01/33 | 12,565,000 | 13,370,668 | |||
| Matanuska-Susitna Borough Lease Revenue, Goose Creek Correctional Center Project, | |||||
| Assured Guaranty, 6.00%, 9/01/32 | 20,000,000 | 23,004,400 | |||
| 59,824,770 | |||||
| Arizona 2.8% | |||||
| Arizona State COP, Department of Administration, Series A, AGMC Insured, 5.00%, | |||||
| 10/01/27 | 14,440,000 | 15,795,483 | |||
| Arizona State Lottery Revenue, Series A, AGMC Insured, 5.00%, 7/01/27 | 15,000,000 | 16,831,200 | |||
| Downtown Phoenix Hotel Corp. Revenue, Senior Series A, FGIC Insured, 5.00%, 7/01/29 | 14,465,000 | 14,564,519 | |||
| Glendale Municipal Property Corp. Excise Tax Revenue, Subordinate, Refunding, Series C, | |||||
| 5.00%, 7/01/38 | 15,500,000 | 15,993,520 | |||
| Maricopa County PCC, PCR, El Paso Electric Co. Palo Verde Project, Series A, 7.25%, | |||||
| 2/01/40 | 10,000,000 | 11,233,500 |
Annual Report | 17
Franklin Federal Tax-Free Income Fund
Statement of Investments, April 30, 2014 (continued)
| Principal Amount | Value | ||||
| Municipal Bonds (continued) | |||||
| Arizona (continued) | |||||
| Mesa Utility Systems Revenue, 4.00%, 7/01/36 | $ | 19,000,000 | $ | 19,223,630 | |
| Navajo County PCC Revenue, Mandatory Put 6/01/16, Series E, 5.75%, 6/01/34 | 7,200,000 | 7,842,024 | |||
| Phoenix Civic Improvement Corp. Airport Revenue, | |||||
| junior lien, Series A, 5.00%, 7/01/40 | 24,000,000 | 24,793,920 | |||
| senior lien, Series A, 5.00%, 7/01/33 | 28,000,000 | 30,058,280 | |||
| Phoenix Civic Improvement Corp. Distribution Revenue, Capital Appreciation, Civic Plaza | |||||
| Expansion Project, Series B, NATL RE, FGIC Insured, 5.50%, | |||||
| 7/01/32 | 6,000,000 | 7,391,340 | |||
| 7/01/34 | 5,000,000 | 6,133,100 | |||
| 7/01/35 | 9,860,000 | 12,069,330 | |||
| Phoenix Civic Improvement Corp. Water System Revenue, junior lien, Refunding, Series A, | |||||
| 5.00%, | |||||
| 7/01/32 | 21,095,000 | 23,782,925 | |||
| 7/01/34 | 10,000,000 | 11,120,000 | |||
| Pima County IDA Lease Revenue, | |||||
| Clark County Detention Facility Project, 5.00%, 9/01/39 | 20,000,000 | 20,466,200 | |||
| Metro Police Facility, Nevada Project, Series A, 5.25%, 7/01/31 | 8,900,000 | 9,413,174 | |||
| Metro Police Facility, Nevada Project, Series A, 5.50%, 7/01/39 | 22,500,000 | 23,597,325 | |||
| Pinal County Electrical District No. 3 Revenue, Electric System, Refunding, 5.25%, | |||||
| 7/01/36 | 10,000,000 | 10,880,900 | |||
| Salt River Project Agricultural Improvement and Power District Electric System Revenue, | |||||
| Salt River Project, Series A, 5.00%, 1/01/38 | 10,000,000 | 10,730,200 | |||
| University Medical Center Corp. Hospital Revenue, Tucson, 5.00%, 7/01/35 | 7,000,000 | 7,019,810 | |||
| 298,940,380 | |||||
| Arkansas 0.1% | |||||
| University of Arkansas Revenue, Various Facilities, Fayetteville Campus, Series B, 5.00%, | |||||
| 11/01/37 | 3,100,000 | 3,365,360 | |||
| 11/01/42 | 9,360,000 | 10,060,877 | |||
| 13,426,237 | |||||
| California 13.0% | |||||
| Bay Area Toll Authority Toll Bridge Revenue, San Francisco Bay Area, | |||||
| Refunding, Series F-1, 5.00%, 4/01/28 | 24,000,000 | 27,132,000 | |||
| Refunding, Series F-1, 5.00%, 4/01/34 | 20,250,000 | 21,871,215 | |||
| Refunding, Series F-1, 5.00%, 4/01/34 | 9,530,000 | 10,429,632 | |||
| Refunding, Series F-1, 5.00%, 4/01/39 | 14,000,000 | 14,859,740 | |||
| Refunding, Series F-1, 5.50%, 4/01/43 | 30,000,000 | 32,171,400 | |||
| Series F, Pre-Refunded, 5.00%, 4/01/31 | 20,000,000 | 21,788,800 | |||
| California Educational Facilities Authority Revenue, Carnegie Institution of Washington, | |||||
| Refunding, Series A, 5.00%, 7/01/40 | 24,525,000 | 26,488,717 | |||
| California Infrastructure and Economic Development Bank Revenue, Bay Area Toll Bridges | |||||
| Seismic Retrofit, first lien, Series A, AMBAC Insured, Pre-Refunded, 5.00%, 7/01/33 | 24,500,000 | 30,707,810 | |||
| California State Economic Recovery GO, Refunding, Series A, 5.25%, 7/01/21 | 28,580,000 | 33,799,565 | |||
| California State GO, Various Purpose, | |||||
| 6.00%, 5/01/18 | 535,000 | 549,268 | |||
| 5.90%, 4/01/23 | 1,200,000 | 1,227,768 | |||
| 5.00%, 10/01/29 | 15,000,000 | 16,447,050 | |||
| 6.00%, 4/01/38 | 100,000,000 | 117,424,000 |
18 | Annual Report
Franklin Federal Tax-Free Income Fund
Statement of Investments, April 30, 2014 (continued)
| Principal Amount | Value | ||||
| Municipal Bonds (continued) | |||||
| California (continued) | |||||
| California State GO, Various Purpose, (continued) | |||||
| 6.00%, 11/01/39 | $ | 25,000,000 | $ | 29,772,500 | |
| 5.25%, 11/01/40 | 50,000,000 | 55,560,500 | |||
| FGIC Insured, 6.00%, 5/01/20 | 850,000 | 874,506 | |||
| Refunding, 5.25%, 3/01/30 | 30,000,000 | 34,198,800 | |||
| Refunding, 6.00%, 3/01/33 | 12,000,000 | 14,610,600 | |||
| Refunding, 5.25%, 3/01/38 | 20,000,000 | 21,650,400 | |||
| Refunding, 5.50%, 3/01/40 | 25,000,000 | 28,101,750 | |||
| California State Health Facilities Financing Authority Revenue, Children’s Hospital of Orange | |||||
| County, Series A, 6.50%, | |||||
| 11/01/24 | 5,000,000 | 6,074,200 | |||
| 11/01/38 | 8,000,000 | 9,367,520 | |||
| California State Public Works Board Lease Revenue, | |||||
| Department of Education, Riverside Campus Project, Series B, 6.125%, 4/01/28 | 2,740,000 | 3,220,706 | |||
| Department of General Services, Office Buildings 8 and 9 Renovation, Series A, 6.00%, | |||||
| 4/01/27 | 3,980,000 | 4,685,614 | |||
| Department of General Services, Office Buildings 8 and 9 Renovation, Series A, 6.125%, | |||||
| 4/01/29 | 5,000,000 | 5,851,900 | |||
| Various Capital Projects, Series A, 5.00%, 4/01/30 | 18,000,000 | 19,732,860 | |||
| Various Capital Projects, Series A, 5.00%, 4/01/33 | 12,475,000 | 13,453,165 | |||
| Various Capital Projects, Series I, 6.125%, 11/01/29 | 29,300,000 | 34,782,030 | |||
| California Statewide CDA, PCR, Refunding, 4.50%, 9/01/29 | 14,830,000 | 15,340,449 | |||
| California Statewide CDA Revenue, | |||||
| Adventist Health System/West, Series B, Assured Guaranty, 5.00%, 3/01/37 | 10,000,000 | 10,253,700 | |||
| St. Joseph Health System, Series B, FGIC Insured, 5.75%, 7/01/47 | 5,000,000 | 5,506,500 | |||
| St. Joseph Health System, Series E, AGMC Insured, 5.25%, 7/01/47 | 10,000,000 | 10,296,000 | |||
| Colton Joint USD, GO, San Bernardino and Riverside Counties, Election of 2008, Series A, | |||||
| Assured Guaranty, 5.375%, 8/01/34 | 15,000,000 | 16,282,350 | |||
| Corona-Norco USD, GO, Riverside County, Capital Appreciation, Election of 2006, Series C, | |||||
| AGMC Insured, | |||||
| zero cpn., 8/01/39 | 7,500,000 | 2,204,775 | |||
| zero cpn. to 8/01/17, 6.20% thereafter, 8/01/29 | 3,250,000 | 3,254,647 | |||
| zero cpn. to 8/01/17, 6.80% thereafter, 8/01/39 | 8,500,000 | 8,347,765 | |||
| Foothill/Eastern Transportation Corridor Agency Toll Road Revenue, | |||||
| Capital Appreciation, Refunding, Series A, 5.75%, 1/15/46 | 25,000,000 | 26,602,500 | |||
| Capital Appreciation, Refunding, Series A, zero cpn. to 1/15/24, 5.40% thereafter, | |||||
| 1/15/30 | 15,475,000 | 10,073,142 | |||
| Refunding, Series A, 6.00%, 1/15/49 | 20,000,000 | 21,583,800 | |||
| Refunding, Series A, zero cpn. to 1/14/24, 6.85% thereafter, 1/15/42 | 20,000,000 | 11,485,800 | |||
| Golden State Tobacco Securitization Corp. Tobacco Settlement Revenue, Enhanced, | |||||
| Asset-Backed, Refunding, Series A, AMBAC Insured, 5.00%, 6/01/45 | 13,255,000 | 13,270,906 | |||
| Hartnell Community College District GO, Monterey and San Benito Counties, Capital | |||||
| Appreciation, Election of 2002, Series D, zero cpn., 8/01/39 | 45,000,000 | 9,055,350 | |||
| Jefferson UHSD San Mateo County GO, Capital Appreciation, Election of 2006, Series D, | |||||
| zero cpn., | |||||
| 8/01/35 | 10,500,000 | 2,408,070 | |||
| 8/01/40 | 10,000,000 | 1,496,500 | |||
| 8/01/41 | 13,590,000 | 1,867,538 | |||
| Los Angeles Community College District GO, Election of 2008, Series C, 5.25%, 8/01/39 | 30,000,000 | 33,006,300 | |||
| Annual Report | 19 | |||||
Franklin Federal Tax-Free Income Fund
Statement of Investments, April 30, 2014 (continued)
| Principal Amount | Value | ||||||
| Municipal Bonds (continued) | |||||||
| California (continued) | |||||||
| Los Angeles Department of Airports Revenue, Los Angeles International Airport, Senior, | |||||||
| Refunding, Series A, 5.00%, 5/15/40 | $ | 25,485,000 | $ | 27,260,030 | |||
| Series D, 5.00%, 5/15/40 | 50,000,000 | 53,594,000 | |||||
| Los Angeles Department of Water and Power Revenue, Power System, Series B, 5.00%, | |||||||
| 7/01/31 | 20,000,000 | 22,734,600 | |||||
| Los Angeles USD, GO, | |||||||
| Election of 2002, Series B, AMBAC Insured, 4.50%, 7/01/31 | 28,745,000 | 30,949,741 | |||||
| Election of 2004, Series F, AGMC Insured, 5.00%, 7/01/30 | 52,475,000 | 56,845,643 | |||||
| Election of 2004, Series G, AMBAC Insured, 5.00%, 7/01/26 | 10,250,000 | 11,147,285 | |||||
| Election of 2004, Series G, AMBAC Insured, 5.00%, 7/01/31 | 10,000,000 | 10,821,700 | |||||
| Series KRY, 5.25%, 7/01/34 | 36,625,000 | 41,158,076 | |||||
| M-S-R Energy Authority Gas Revenue, Series B, 6.50%, 11/01/39 | 12,500,000 | 16,268,500 | |||||
| New Haven USD, GO, Alameda County, Capital Appreciation, Assured Guaranty, zero cpn., | |||||||
| 8/01/31 | 2,055,000 | 919,489 | |||||
| 8/01/32 | 7,830,000 | 3,296,430 | |||||
| 8/01/33 | 7,660,000 | 3,029,607 | |||||
| Placentia-Yorba Linda USD, GO, Orange County, Election of 2008, Series A, 5.25%, | |||||||
| 8/01/32 | 24,490,000 | 27,496,392 | |||||
| Pomona USD, GO, Los Angeles County, Election of 2008, Series A, Assured Guaranty, | |||||||
| 5.00%, 8/01/29 | 5,585,000 | 6,049,281 | |||||
| Rialto USD, GO, San Bernardino County, Series A, AGMC Insured, zero cpn., 8/01/36 | 20,000,000 | 6,727,000 | |||||
| Sacramento County Airport System Revenue, Senior, Series B, AGMC Insured, 5.25%, | |||||||
| 7/01/33 | 16,355,000 | 17,257,796 | |||||
| San Diego Public Facilities Financing Authority Water Revenue, Series B, 5.375%, | |||||||
| 8/01/34 | 15,000,000 | 16,791,600 | |||||
| San Francisco City and County COP, Multiple Capital Improvement Projects, Series A, | |||||||
| 5.25%, 4/01/31 | 10,000,000 | 11,110,600 | |||||
| San Joaquin Hills Transportation Corridor Agency Toll Road Revenue, | |||||||
| Capital Appreciation, Refunding, Series A, 5.75%, 1/15/21 | 50,000,000 | 51,064,000 | |||||
| Capital Appreciation, senior lien, ETM, zero cpn., 1/01/23 | 7,000,000 | 5,679,380 | |||||
| Orange County, Capital Appreciation, senior lien, 5.00%, 1/01/33 | 5,000,000 | 4,732,600 | |||||
| San Mateo UHSD, GO, Capital Appreciation, Election of 2010, | |||||||
| Refunding, Series A, zero cpn. to 9/01/28, 6.70% thereafter, 9/01/41 | 20,000,000 | 11,314,200 | |||||
| Series A, zero cpn. to 9/01/28, 6.45% thereafter, 9/01/33 | 5,725,000 | 3,211,153 | |||||
| San Mateo-Foster City School District GO, Capital Appreciation, Election of 2008, Series A, | |||||||
| zero cpn. to 8/01/26, 6.625% thereafter, 8/01/42 | 40,000,000 | 22,590,800 | |||||
| Santa Ana USD, GO, Orange County, Capital Appreciation, Election of 2008, Series B, | |||||||
| Assured Guaranty, zero cpn., | |||||||
| 8/01/35 | 10,000,000 | 3,517,800 | |||||
| 8/01/36 | 18,865,000 | 6,182,249 | |||||
| 8/01/37 | 10,000,000 | 3,081,600 | |||||
| Santa Clara County GO, Election of 2008, Series A, 5.00%, 8/01/34 | 25,000,000 | 27,855,000 | |||||
| Upland USD, GO, San Bernardino County, Election of 2008, Series B, zero cpn., 8/01/39 | 50,075,000 | 10,864,773 | |||||
| Washington Township Health Care District Revenue, Series A, 6.25%, 7/01/39 | 3,000,000 | 3,251,880 | |||||
| West Contra Costa USD, GO, Election of 2005, Series C-1, Assured Guaranty, zero cpn., | |||||||
| 8/01/29 | 10,000,000 | 5,244,800 | |||||
| 8/01/30 | 20,845,000 | 10,265,120 | |||||
| 8/01/31 | 20,000,000 | 9,224,200 | |||||
| 8/01/32 | 10,730,000 | 4,647,914 | |||||
| 20 | | | Annual Report | |||||
Franklin Federal Tax-Free Income Fund
Statement of Investments, April 30, 2014 (continued)
| Principal Amount | Value | ||||
| Municipal Bonds (continued) | |||||
| California (continued) | |||||
| Whittier UHSD, GO, Los Angeles County, Capital Appreciation, Election of 2008, Refunding, | |||||
| Series A, zero cpn., 8/01/34 | $ | 20,000,000 | $ | 6,282,200 | |
| 1,391,637,547 | |||||
| Colorado 2.4% | |||||
| Aurora Water Improvement Revenue, first lien, Series A, AMBAC Insured, 5.00%, | |||||
| 8/01/32 | 10,000,000 | 11,002,200 | |||
| 8/01/36 | 41,235,000 | 44,288,452 | |||
| 8/01/39 | 26,930,000 | 28,587,811 | |||
| Colorado State Board of Governors University Enterprise System Revenue, Series A, | |||||
| AGMC Insured, 5.00%, 3/01/37 | 10,000,000 | 10,380,200 | |||
| NATL RE, FGIC Insured, 5.00%, 3/01/37 | 1,700,000 | 1,764,634 | |||
| NATL RE, FGIC Insured, Pre-Refunded, 5.00%, 3/01/37 | 8,300,000 | 9,322,892 | |||
| Colorado State COP, UCDHSC Fitzsimons Academic Projects, Refunding, Series A, 5.00%, | |||||
| 11/01/28 | 10,000,000 | 11,245,200 | |||
| 11/01/29 | 5,000,000 | 5,584,000 | |||
| Colorado State Health Facilities Authority Revenue, | |||||
| Health Facility Authority, Hospital, Refunding, Series B, AGMC Insured, 5.25%, 3/01/36 | 10,000,000 | 10,503,500 | |||
| Valley View Hospital Assn. Project, Refunding, 5.50%, 5/15/28 | 5,000,000 | 5,240,400 | |||
| Valley View Hospital Assn. Project, Refunding, 5.75%, 5/15/36 | 7,000,000 | 7,282,380 | |||
| Colorado State Higher Education Capital Construction Lease Purchase Financing Program | |||||
| COP, | |||||
| 5.50%, 11/01/27 | 7,335,000 | 8,263,904 | |||
| Pre-Refunded, 5.50%, 11/01/27 | 2,665,000 | 3,166,899 | |||
| Colorado Water Resources and Power Development Authority Water Resources Revenue, | |||||
| Arapahoe County Water and Wastewater Public Improvement District Project, Series E, | |||||
| NATL Insured, 5.00%, 12/01/35 | 10,000,000 | 10,100,500 | |||
| Denver City and County Airport System Revenue, | |||||
| Series B, 4.00%, 11/15/43 | 10,250,000 | 9,591,950 | |||
| Subordinate, Series B, 5.25%, 11/15/33 | 16,405,000 | 18,374,912 | |||
| Mesa State College Auxiliary Facilities System Enterprise Revenue, XLCA Insured, | |||||
| Pre-Refunded, 5.00%, 5/15/35 | 9,950,000 | 10,442,227 | |||
| Park Creek Metropolitan District Revenue, Senior Limited Property Tax Supported, Refunding | |||||
| and Improvement, Assured Guaranty, 6.25%, 12/01/30 | 6,000,000 | 6,696,660 | |||
| Public Authority for Colorado Energy Natural Gas Purchase Revenue, 6.50%, 11/15/38 | 20,000,000 | 26,011,200 | |||
| Regional Transportation District Sales Tax Revenue, FasTracks Project, Series A, 5.00%, | |||||
| 11/01/32 | 10,000,000 | 11,108,900 | |||
| University of Colorado Enterprise System Revenue, University of Colorado Regents, Series A, | |||||
| 5.375%, 6/01/32 | 3,500,000 | 4,023,285 | |||
| 252,982,106 | |||||
| District of Columbia 2.8% | |||||
| District of Columbia Ballpark Revenue, Series B-1, BHAC Insured, 5.00%, | |||||
| 2/01/24 | 12,120,000 | 12,545,897 | |||
| 2/01/25 | 7,000,000 | 7,237,580 | |||
| 2/01/26 | 9,950,000 | 10,267,206 | |||
| District of Columbia Hospital Revenue, Children’s Hospital Obligated Group Issue, Sub | |||||
| Series 1, AGMC Insured, 5.45%, 7/15/35 | 23,900,000 | 25,067,754 |
Annual Report | 21
Franklin Federal Tax-Free Income Fund
Statement of Investments, April 30, 2014 (continued)
| Principal Amount | Value | |||
| Municipal Bonds (continued) | ||||
| District of Columbia (continued) | ||||
| District of Columbia Income Tax Secured Revenue, | ||||
| Refunding, Series A, 5.00%, 12/01/31 | $ | 10,000,000 | $ | 11,102,500 |
| Series A, 5.25%, 12/01/34 | 11,000,000 | 12,582,570 | ||
| Series C, 4.00%, 12/01/37 | 8,900,000 | 9,015,967 | ||
| District of Columbia Revenue, | ||||
| Assn. of American Medical Colleges Issue, Series B, 5.25%, 10/01/41 | 15,000,000 | 15,875,550 | ||
| Deed Tax, Housing Production Trust Fund, New Communities Project, Series A, NATL | ||||
| Insured, 5.00%, 6/01/32 | 5,000,000 | 5,203,200 | ||
| Georgetown University Issue, Growth and Income Securities, AMBAC Insured, zero cpn. | ||||
| to 4/01/18, 5.00% thereafter, 4/01/32 | 15,370,000 | 13,323,484 | ||
| Medlantic/Helix Issue, Series B, AGMC Insured, 5.00%, 8/15/38 | 20,000,000 | 20,700,800 | ||
| National Academy of Sciences Project, Series A, 5.00%, 4/01/35 | 10,905,000 | 11,573,258 | ||
| National Academy of Sciences Project, Series A, 5.00%, 4/01/40 | 16,960,000 | 17,843,616 | ||
| National Public Radio Inc. Issue, 5.00%, 4/01/35 | 7,750,000 | 8,288,315 | ||
| District of Columbia Tobacco Settlement FICO Revenue, Asset-Backed, Refunding, 6.50%, | ||||
| 5/15/33 | 35,000,000 | 39,184,950 | ||
| District of Columbia University Revenue, Georgetown University Issue, Refunding, Series D, | ||||
| 5.50%, 4/01/36 | 5,000,000 | 5,390,000 | ||
| District of Columbia Water and Sewer Authority Public Utility Revenue, senior lien, | ||||
| Refunding, Series A, 6.00%, 10/01/35 | 8,000,000 | 9,204,240 | ||
| Metropolitan Washington D.C. Airports Authority Airport System Revenue, | ||||
| Refunding, Series A, 5.375%, 10/01/29 | 5,000,000 | 5,651,750 | ||
| Refunding, Series A, 5.00%, 10/01/35 | 5,000,000 | 5,394,150 | ||
| Refunding, Series C, 5.25%, 10/01/27 | 10,745,000 | 12,283,577 | ||
| Series A, 5.00%, 10/01/39 | 5,000,000 | 5,314,750 | ||
| Series C, 5.00%, 10/01/26 | 10,235,000 | 11,597,483 | ||
| Metropolitan Washington D.C. Airports Authority Dulles Toll Road Revenue, Capital | ||||
| Appreciation, second lien, Series C, Assured Guaranty, zero cpn. to 10/01/16, 6.50% | ||||
| thereafter, 10/01/41 | 25,000,000 | 26,073,500 | ||
| 300,722,097 | ||||
| Florida 6.9% | ||||
| Brevard County Health Facilities Authority Health Facilities Revenue, Health First Inc. | ||||
| Project, Series B, 7.00%, 4/01/39 | 6,500,000 | 7,394,595 | ||
| Brevard County Local Option Fuel Tax Revenue, NATL RE, FGIC Insured, 5.00%, 8/01/37 | 12,245,000 | 12,631,575 | ||
| Broward County Water and Sewer Utility Revenue, Series A, 5.25%, 10/01/34 | 8,800,000 | 9,834,528 | ||
| Cape Coral Water and Sewer Revenue, | ||||
| AMBAC Insured, 5.00%, 10/01/36 | 5,000,000 | 5,219,600 | ||
| Refunding, Series A, AGMC Insured, 5.00%, 10/01/42 | 21,510,000 | 22,932,886 | ||
| Citizens Property Insurance Corp. Revenue, | ||||
| Costal Account, senior secured, Series A-1, 5.00%, 6/01/20 | 20,000,000 | 23,302,400 | ||
| High-Risk Account, senior secured, Series A-1, 5.25%, 6/01/17 | 24,250,000 | 27,352,545 | ||
| High-Risk Account, senior secured, Series A-1, 5.50%, 6/01/17 | 10,000,000 | 11,354,800 | ||
| High-Risk Account, senior secured, Series A-1, 6.00%, 6/01/17 | 25,000,000 | 28,731,250 | ||
| Clearwater City Water and Sewer Revenue, Series A, 5.25%, 12/01/39 | 7,000,000 | 7,443,730 | ||
| Florida State Board of Education Public Education GO, Capital Outlay, Refunding, Series D, | ||||
| 6.00%, 6/01/23 | 17,500,000 | 22,674,575 |
22 | Annual Report
Franklin Federal Tax-Free Income Fund
Statement of Investments, April 30, 2014 (continued)
| Principal Amount | Value | |||
| Municipal Bonds (continued) | ||||
| Florida (continued) | ||||
| Florida State Mid-Bay Bridge Authority Revenue, Series A, | ||||
| AMBAC Insured, zero cpn., 10/01/23 | $ | 4,950,000 | $ | 3,059,991 |
| AMBAC Insured, zero cpn., 10/01/24 | 2,970,000 | 1,729,253 | ||
| Pre-Refunded, zero cpn., 10/01/23 | 50,000 | 35,654 | ||
| Pre-Refunded, zero cpn., 10/01/24 | 30,000 | 20,204 | ||
| Florida State Municipal Loan Council Revenue, Series D, AGMC Insured, 5.50%, | ||||
| 10/01/41 | 4,750,000 | 5,086,252 | ||
| Hernando County School Board COP, NATL Insured, 5.00%, 7/01/30 | 10,000,000 | 10,238,800 | ||
| Hillsborough County Aviation Authority Revenue, Series A, Assured Guaranty, 5.50%, | ||||
| 10/01/38 | 5,000,000 | 5,453,850 | ||
| Hillsborough County IDA, PCR, Tampa Electric Co. Project, Series A, 5.65%, 5/15/18 | 6,500,000 | 7,569,055 | ||
| Hillsborough County School Board COP, Master Lease Program, Refunding, Series A, 5.00%, | ||||
| 7/01/28 | 17,650,000 | 19,395,232 | ||
| Indian River County School Board COP, NATL RE, FGIC Insured, 5.00%, 7/01/27 | 16,485,000 | 18,042,668 | ||
| Jacksonville Economic Development Commission Health Care Facilities Revenue, Mayo | ||||
| Clinic, 5.00%, 11/15/36 | 17,950,000 | 18,871,912 | ||
| Jacksonville Excise Taxes Revenue, Series A, AMBAC Insured, 5.00%, 10/01/32 | 6,015,000 | 6,291,149 | ||
| Lee County Transportation Facilities Revenue, Sanibel Bridges and Causeway Project, | ||||
| Series B, CIFG Insured, 5.00%, 10/01/35 | 10,645,000 | 10,854,493 | ||
| Martin County Health Facilities Authority Hospital Revenue, Martin Memorial Medical Center, | ||||
| 5.50%, 11/15/42 | 3,800,000 | 4,000,640 | ||
| Miami-Dade County Aviation Revenue, Miami International Airport, Hub of the Americas, | ||||
| Refunding, Series A, | ||||
| 5.50%, 10/01/36 | 20,000,000 | 22,036,600 | ||
| Assured Guaranty, 5.25%, 10/01/33 | 11,000,000 | 12,061,610 | ||
| Assured Guaranty, 5.25%, 10/01/38 | 13,000,000 | 13,790,010 | ||
| Miami-Dade County Educational Facilities Authority Revenue, University of Miami Issue, | ||||
| Series A, 5.50%, 4/01/38 | 12,500,000 | 13,377,000 | ||
| Miami-Dade County Expressway Authority Toll System Revenue, | ||||
| Refunding, Series A, 5.00%, 7/01/29 | 10,000,000 | 10,981,400 | ||
| Refunding, Series A, 5.00%, 7/01/32 | 6,375,000 | 6,869,764 | ||
| Series A, 5.00%, 7/01/40 | 30,265,000 | 31,448,059 | ||
| Miami-Dade County GO, Building Better Communities Program, Series B-1, 5.75%, | ||||
| 7/01/33 | 20,000,000 | 22,157,600 | ||
| Miami-Dade County Public Facilities Revenue, Jackson Health System, Series A, NATL | ||||
| Insured, 5.00%, 6/01/30 | 10,630,000 | 10,887,565 | ||
| Miami-Dade County School Board COP, | ||||
| Refunding, Series A, 5.00%, 5/01/31 | 10,000,000 | 10,858,900 | ||
| Series A, Assured Guaranty, 5.25%, 2/01/27 | 10,000,000 | 11,000,500 | ||
| Miami-Dade County Special Obligation Revenue, | ||||
| Juvenile Courthouse Project, Series A, AMBAC Insured, 5.00%, 4/01/32 | 10,000,000 | 10,025,000 | ||
| sub. bond, Refunding, Series B, 5.00%, 10/01/31 | 5,000,000 | 5,446,850 | ||
| sub. bond, Refunding, Series B, 5.00%, 10/01/32 | 4,500,000 | 4,875,165 | ||
| sub. bond, Refunding, Series B, 5.00%, 10/01/35 | 3,250,000 | 3,472,755 | ||
| Miami-Dade County Transit System Sales Surtax Revenue, Refunding, AGMC Insured, 5.00%, | ||||
| 7/01/38 | 18,845,000 | 19,661,554 | ||
| Miami-Dade County Water and Sewer System Revenue, Refunding, Series A, 5.00%, | ||||
| 10/01/42 | 20,000,000 | 21,079,000 |
Annual Report | 23
Franklin Federal Tax-Free Income Fund
Statement of Investments, April 30, 2014 (continued)
| Principal Amount | Value | |||
| Municipal Bonds (continued) | ||||
| Florida (continued) | ||||
| Orange County Health Facilities Authority Hospital Revenue, Orlando Regional Healthcare | ||||
| System, Refunding, Series B, AGMC Insured, 5.00%, 12/01/32 | $ | 20,000,000 | $ | 21,125,800 |
| Orange County School Board COP, Series A, Assured Guaranty, 5.50%, 8/01/34 | 15,000,000 | 16,386,300 | ||
| Orlando Tourist Development Tax Revenue, 6th Cent Contract Payments, second lien sub. | ||||
| bonds, Series B, Assured Guaranty, 5.50%, 11/01/38 | 18,490,000 | 18,943,375 | ||
| Orlando-Orange County Expressway Authority Revenue, | ||||
| Series A, 5.00%, 7/01/40 | 5,000,000 | 5,250,700 | ||
| Series A, AGMC Insured, 5.00%, 7/01/32 | 12,000,000 | 12,705,840 | ||
| Series C, 5.00%, 7/01/40 | 15,000,000 | 15,669,000 | ||
| Palm Beach County Solid Waste Authority Revenue, Improvement, Series B, 5.50%, | ||||
| 10/01/28 | 10,000,000 | 11,620,100 | ||
| Pensacola Airport Revenue, Refunding, 6.25%, 10/01/38 | 16,500,000 | 17,985,165 | ||
| Port St. Lucie Utility System Revenue, Refunding, Assured Guaranty, 5.25%, 9/01/35 | 3,000,000 | 3,265,230 | ||
| South Broward Hospital District Revenue, South Broward Hospital District Obligated Group, | ||||
| Refunding, | ||||
| 4.75%, 5/01/28 | 10,000,000 | 10,392,100 | ||
| 5.00%, 5/01/36 | 12,500,000 | 12,849,875 | ||
| South Lake County Hospital District Revenue, South Lake Hospital Inc., Series A, 6.25%, | ||||
| 4/01/39 | 5,735,000 | 6,290,951 | ||
| South Miami Health Facilities Authority Hospital Revenue, Baptist Health South Florida | ||||
| Obligated Group, 5.00%, 8/15/32 | 31,070,000 | 32,470,325 | ||
| St. Lucie County Transportation Revenue, AMBAC Insured, 5.00%, 8/01/27 | 5,785,000 | 6,022,995 | ||
| Tallahassee Energy System Revenue, Refunding, NATL Insured, 5.00%, 10/01/37 | 20,000,000 | 21,218,600 | ||
| Town of Davie Water and Sewer Revenue, AGMC Insured, 5.00%, 10/01/32 | 8,575,000 | 9,256,455 | ||
| 741,003,780 | ||||
| Georgia 3.6% | ||||
| Athens-Clarke County Unified Government Water and Sewerage Revenue, 5.50%, 1/01/38 | 14,500,000 | 16,003,795 | ||
| Atlanta Airport General Revenue, Refunding, Series C, 6.00%, 1/01/30 | 15,000,000 | 17,865,450 | ||
| Atlanta Airport Passenger Facility Charge Revenue, General, sub. lien, | ||||
| Series C, AGMC Insured, Pre-Refunded, 5.00%, 1/01/33 | 19,500,000 | 19,647,030 | ||
| Series J, AGMC Insured, Pre-Refunded, 5.00%, 1/01/29 | 10,000,000 | 10,315,600 | ||
| Atlanta Development Authority Revenue, Tuff Yamacraw LLC Project, Refunding, Series A, | ||||
| AMBAC Insured, 5.00%, | ||||
| 1/01/24 | 6,385,000 | 6,999,109 | ||
| 1/01/25 | 6,955,000 | 7,622,819 | ||
| 1/01/26 | 5,000,000 | 5,466,800 | ||
| 1/01/27 | 5,000,000 | 5,487,300 | ||
| Atlanta Water and Wastewater Revenue, | ||||
| Refunding, Series A, 6.25%, 11/01/34 | 20,000,000 | 23,577,200 | ||
| Refunding, Series B, AGMC Insured, 5.25%, 11/01/34 | 30,000,000 | 32,742,000 | ||
| Series A, NATL Insured, 5.00%, 11/01/33 | 5,720,000 | 5,734,300 | ||
| Bleckley-Dodge County Joint Development Authority Student Housing Facilities Revenue, | ||||
| MGC Real Estate Foundation II LLC Project, | ||||
| 5.00%, 7/01/33 | 5,000,000 | 5,168,150 | ||
| 5.25%, 7/01/38 | 10,000,000 | 10,342,000 |
24 | Annual Report
Franklin Federal Tax-Free Income Fund
Statement of Investments, April 30, 2014 (continued)
| Principal Amount | Value | |||
| Municipal Bonds (continued) | ||||
| Georgia (continued) | ||||
| Bulloch County Development Authority Student Housing Revenue, Georgia Southern | ||||
| University Housing Foundation Four LLC Project, Assured Guaranty, 5.375%, 7/01/39 | $ | 23,075,000 | $ | 24,304,436 |
| Burke County Development Authority PCR, Oglethorpe Power Corp. Vogtle Project, | ||||
| Series B, 5.50%, 1/01/33 | 15,000,000 | 15,851,400 | ||
| Series E, 7.00%, 1/01/23 | 25,000,000 | 28,735,750 | ||
| Clark County Hospital Authority Revenue, Athens Regional Medical Center Project, NATL | ||||
| Insured, 5.00%, 1/01/27 | 5,000,000 | 5,255,850 | ||
| Clayton County Development Authority Student Housing and Activity Center Revenue, CSU | ||||
| Foundation Real Estate I LLC Project, XLCA Insured, 5.00%, 7/01/33 | 11,125,000 | 11,514,597 | ||
| DeKalb Newton and Gwinnett Counties Joint Development Authority Revenue, Georgia | ||||
| Gwinnett College Foundation LLC Project, 6.00%, 7/01/34 | 10,000,000 | 10,884,000 | ||
| Georgia State Higher Education Facilities Authority Revenue, | ||||
| USG Real Estate Foundation I LLC Project, 6.25%, 6/15/40 | 13,970,000 | 15,277,313 | ||
| USG Real Estate Foundation I LLC Project, Assured Guaranty, 5.625%, 6/15/38 | 5,000,000 | 5,371,650 | ||
| USG Real Estate Foundation II LLC Project, Series A, 5.50%, 6/15/34 | 10,000,000 | 10,787,400 | ||
| USG Real Estate Foundation III LLC Project, Series A, 5.00%, 6/15/40 | 5,000,000 | 5,177,950 | ||
| Houston County Hospital Authority Revenue, Anticipation Certificates, Houston Healthcare | ||||
| Project, 5.25%, 10/01/35 | 10,485,000 | 10,810,350 | ||
| Jefferson PBA Revenue, Jackson County Facilities, Series A, XLCA Insured, | ||||
| 5.00%, 3/01/32 | 1,805,000 | 1,952,829 | ||
| Pre-Refunded, 5.00%, 3/01/32 | 4,270,000 | 4,796,235 | ||
| Main Street Natural Gas Inc. Revenue, Gas Project, Series A, 5.50%, 9/15/28 | 5,000,000 | 5,819,050 | ||
| Medical Center Hospital Authority Revenue, Anticipation Certificates, Columbus Regional | ||||
| Healthcare System Inc. Project, Refunding, Assured Guaranty, 6.50%, 8/01/38 | 10,000,000 | 10,920,300 | ||
| Private Colleges and Universities Authority Revenue, Emory University, Refunding, | ||||
| Series A, 5.00%, 9/01/41 | 10,000,000 | 10,947,500 | ||
| Series A, 5.00%, 10/01/43 | 10,000,000 | 11,016,000 | ||
| Series C, 5.25%, 9/01/39 | 21,000,000 | 23,220,330 | ||
| Richmond County Development Authority Educational Facilities Revenue, MCG-PPG Cancer | ||||
| Research Center LLC Project, Series A, AMBAC Insured, 5.00%, 12/15/29 | 5,000,000 | 5,052,950 | ||
| 384,667,443 | ||||
| Hawaii 0.5% | ||||
| Hawaii State Department of Budget and Finance Special Purpose Revenue, Hawaiian | ||||
| Electric Co. and Subsidiary Projects, 6.50%, 7/01/39 | 7,500,000 | 8,335,725 | ||
| Hawaii State GO, Series EE, 4.00%, 11/01/32 | 7,000,000 | 7,239,470 | ||
| Honolulu City and County Board of Water Supply Water System Revenue, Refunding, | ||||
| Series A, NATL Insured, 5.00%, 7/01/36 | 20,000,000 | 20,879,200 | ||
| Honolulu City and County GO, ETM, 6.00%, 12/01/14 | 150,000 | 154,999 | ||
| Honolulu City and County MFHR, Waipahu Towers Project, Series A, GNMA Secured, 6.90%, | ||||
| 6/20/35 | 1,090,000 | 1,091,548 | ||
| Honolulu City and County Wastewater System Revenue, First Bond Resolution, Senior | ||||
| Series A, 5.00%, 7/01/38 | 10,000,000 | 10,777,700 | ||
| 48,478,642 | ||||
| Idaho 0.1% | ||||
| Idaho Health Facilities Authority Revenue, St. Luke’s Health System Project, Series A, | ||||
| 6.75%, 11/01/37 | 12,500,000 | 13,986,750 |
Annual Report | 25
Franklin Federal Tax-Free Income Fund
Statement of Investments, April 30, 2014 (continued)
| Principal Amount | Value | |||
| Municipal Bonds (continued) | ||||
| Illinois 6.0% | ||||
| Aurora Waterworks and Sewerage Revenue, XLCA Insured, 4.75%, 12/01/36 | $ | 7,765,000 | $ | 7,800,486 |
| Bolingbrook GO, Will and DuPage Counties, Capital Appreciation, Refunding, Series A, | ||||
| zero cpn., 1/01/36 | 19,000,000 | 6,107,550 | ||
| Bourbonnais Industrial Project Revenue, Olivet Nazarene University Project, | ||||
| 5.00%, 11/01/44 | 2,000,000 | 1,966,180 | ||
| Radian Insured, 5.125%, 11/01/37 | 5,000,000 | 5,018,150 | ||
| Chicago Board of Education GO, | ||||
| Refunding, Series C, AGMC Insured, 5.25%, 12/01/23 | 15,860,000 | 17,366,541 | ||
| Series A, 5.50%, 12/01/39 | 6,500,000 | 6,731,530 | ||
| Series A, 5.00%, 12/01/42 | 5,500,000 | 5,417,500 | ||
| Chicago GO, | ||||
| Lakefront Millennium Project, Parking Facilities, NATL Insured, ETM, 5.75%, 1/01/23 | 8,955,000 | 11,194,825 | ||
| Refunding, Series A, AGMC Insured, 5.00%, 1/01/28 | 13,445,000 | 14,028,916 | ||
| Refunding, Series A, AGMC Insured, 5.00%, 1/01/29 | 26,000,000 | 26,969,800 | ||
| Chicago Midway Airport Revenue, Refunding, Series C, Assured Guaranty, 5.50%, 1/01/24 | 18,460,000 | 21,962,047 | ||
| Chicago O’Hare International Airport Revenue, General, third lien, | ||||
| Series A, 5.75%, 1/01/39 | 5,000,000 | 5,479,050 | ||
| Series C, AGMC Insured, 5.25%, 1/01/35 | 12,850,000 | 13,715,447 | ||
| Chicago Park District GO, Series A, 5.00%, 1/01/33 | 4,500,000 | 4,693,230 | ||
| Chicago Transit Authority Sales Tax Receipts Revenue, 5.25%, 12/01/40 | 10,000,000 | 10,681,400 | ||
| Chicago Wastewater Transmission Revenue, second lien, Series A, BHAC Insured, 5.50%, | ||||
| 1/01/38 | 18,000,000 | 19,002,780 | ||
| Chicago Waterworks Revenue, second lien, Refunding, 5.00%, 11/01/42 | 10,000,000 | 10,264,300 | ||
| Cook County GO, Refunding, Series A, 5.25%, 11/15/33 | 8,720,000 | 9,258,373 | ||
| Illinois Health Facilities Authority Revenue, | ||||
| Loyola University Health System, Series A, NATL Insured, ETM, 5.625%, 7/01/18 | 2,105,000 | 2,492,720 | ||
| South Suburban Hospital, ETM, 7.00%, 2/15/18 | 2,160,000 | 2,401,639 | ||
| Illinois State Finance Authority Revenue, | ||||
| Alexian Brothers Health System, Refunding, Series A, AGMC Insured, 5.50%, 1/01/28 | 45,000,000 | 47,825,550 | ||
| Art Institute of Chicago, Refunding, Series A, 5.25%, 3/01/40 | 16,000,000 | 17,062,880 | ||
| Columbia College, NATL Insured, 5.00%, 12/01/32 | 15,440,000 | 15,671,291 | ||
| Resurrection Health Care, Series B, AGMC Insured, 5.25%, 5/15/29 | 28,650,000 | 30,242,367 | ||
| Riverside Health System, 6.25%, 11/15/35 | 5,000,000 | 5,490,550 | ||
| Roosevelt University Project, Refunding, 6.50%, 4/01/39 | 15,000,000 | 15,557,550 | ||
| Rush University Medical Center Obligated Group, Refunding, Series B, NATL Insured, | ||||
| 5.75%, 11/01/28 | 2,500,000 | 2,720,950 | ||
| Rush University Medical Center Obligated Group, Refunding, Series B, NATL Insured, | ||||
| 5.25%, 11/01/35 | 3,000,000 | 3,127,650 | ||
| Rush University Medical Center Obligated Group, Series B, 7.25%, 11/01/38 | 10,000,000 | 11,744,900 | ||
| Sherman Health Systems, Series A, 5.50%, 8/01/37 | 5,000,000 | 5,455,000 | ||
| Illinois State Finance Authority Student Housing Revenue, | ||||
| CHF-DeKalb II LLC, Northern Illinois University Project, 6.875%, 10/01/43 | 15,000,000 | 16,860,150 | ||
| CHF-Normal LLC, Illinois State University Project, 7.00%, 4/01/43 | 7,500,000 | 8,292,675 | ||
| Illinois State GO, | ||||
| 5.25%, 7/01/30 | 16,915,000 | 18,494,523 | ||
| 5.50%, 7/01/33 | 5,000,000 | 5,493,550 | ||
| 5.50%, 7/01/38 | 20,000,000 | 21,579,400 |
26 | Annual Report
Franklin Federal Tax-Free Income Fund
Statement of Investments, April 30, 2014 (continued)
| Principal Amount | Value | |||
| Municipal Bonds (continued) | ||||
| Illinois (continued) | ||||
| Illinois State GO, (continued) | ||||
| AGMC Insured, 5.00%, 9/01/29 | $ | 12,000,000 | $ | 12,280,080 |
| Assured Guaranty, 5.25%, 4/01/34 | 10,000,000 | 10,356,000 | ||
| Refunding, 5.00%, 1/01/24 | 12,820,000 | 13,907,905 | ||
| Illinois State Municipal Electric Agency Power Supply System Revenue, Series A, NATL RE, | ||||
| FGIC Insured, 5.00%, 2/01/35 | 20,000,000 | 20,813,200 | ||
| Illinois State Revenue, Build Illinois, Sales Tax Bonds, Series B, 5.25%, 6/15/34 | 15,000,000 | 16,131,000 | ||
| Illinois State Toll Highway Authority Toll Highway Revenue, Senior, Refunding, Series A-1, | ||||
| 5.00%, 1/01/31 | 10,245,000 | 11,015,936 | ||
| Metropolitan Pier and Exposition Authority Dedicated State Tax Revenue, | ||||
| Capital Appreciation, McCormick Place Expansion Project, Refunding, Series B, NATL | ||||
| Insured, 5.50%, 6/15/20 | 8,240,000 | 9,172,356 | ||
| Capital Appreciation, McCormick Place Expansion Project, Refunding, Series B, NATL | ||||
| Insured, 5.55%, 6/15/21 | 6,000,000 | 6,666,720 | ||
| Capital Appreciation, McCormick Place Expansion Project, Refunding, Series B, NATL | ||||
| Insured, zero cpn. to 6/14/17, 5.65% thereafter, 6/15/22 | 30,000,000 | 29,172,000 | ||
| McCormick Place Expansion Project, Series A, 5.50%, 6/15/50 | 15,000,000 | 15,743,850 | ||
| Metropolitan Pier and Exposition Authority Hospitality Facilities Revenue, McCormick Place | ||||
| Convention Center, ETM, 7.00%, 7/01/26 | 12,000,000 | 16,112,160 | ||
| Metropolitan Pier and Exposition Authority Revenue, McCormick Place Expansion Project, | ||||
| Series A, 5.00%, 6/15/42 | 5,000,000 | 5,195,650 | ||
| Railsplitter Tobacco Settlement Authority Revenue, Refunding, 6.00%, 6/01/28 | 14,530,000 | 16,866,860 | ||
| Regional Transportation Authority Revenue, Series A, AMBAC Insured, 7.20%, 11/01/20 | 720,000 | 855,547 | ||
| Southwestern Illinois Development Authority Revenue, Capital Appreciation, Local | ||||
| Government Program, AGMC Insured, zero cpn., | ||||
| 12/01/24 | 3,850,000 | 2,468,120 | ||
| 12/01/26 | 7,700,000 | 4,438,665 | ||
| University of Illinois University Revenue, Auxiliary Facilities System, | ||||
| Refunding, Series A, 5.125%, 4/01/36 | 2,950,000 | 3,192,815 | ||
| Refunding, Series A, 5.25%, 4/01/41 | 5,000,000 | 5,389,300 | ||
| Series A, 5.75%, 4/01/38 | 7,000,000 | 7,936,740 | ||
| Upper River Valley Development Authority Environmental Facilities Revenue, General Electric | ||||
| Co. Project, 5.45%, 2/01/23 | 3,600,000 | 3,612,456 | ||
| 639,498,810 | ||||
| Indiana 1.1% | ||||
| Carmel RDA Lease Rental Revenue, Multipurpose, Series A, 4.00%, 2/01/38 | 5,220,000 | 5,241,611 | ||
| Indiana Bond Bank Revenue, Special Program, Hendricks Regional Health Project, Series A, | ||||
| 5.50%, 2/01/29 | 9,000,000 | 10,122,030 | ||
| Indiana Finance Authority Hospital Revenue, Deaconess Hospital Obligated Group, Series A, | ||||
| 6.75%, 3/01/39 | 9,750,000 | 10,896,503 | ||
| Indiana Health and Educational Facility Financing Authority Hospital Revenue, 5.50%, | ||||
| 3/01/27 | 6,500,000 | 7,057,570 | ||
| Indiana State Finance Authority Environmental Revenue, Duke Energy Indiana Inc. Project, | ||||
| Refunding, Series B, 6.00%, 8/01/39 | 10,000,000 | 10,946,000 | ||
| Indiana State Finance Authority Revenue, Educational Facilities, Marian University Project, | ||||
| 6.375%, 9/15/41 | 12,500,000 | 12,909,500 |
Annual Report | 27
Franklin Federal Tax-Free Income Fund
Statement of Investments, April 30, 2014 (continued)
| Principal Amount | Value | |||
| Municipal Bonds (continued) | ||||
| Indiana (continued) | ||||
| Indiana State Finance Authority Wastewater Utility Revenue, CWA Authority Project, first lien, | ||||
| Series A, | ||||
| 5.00%, 10/01/37 | $ | 5,000,000 | $ | 5,443,100 |
| 5.25%, 10/01/38 | 12,000,000 | 13,186,680 | ||
| 4.00%, 10/01/42 | 22,615,000 | 21,722,838 | ||
| Indiana State Municipal Power Agency Power Supply System Revenue, Series B, 6.00%, | ||||
| 1/01/39 | 4,000,000 | 4,495,400 | ||
| Indianapolis Local Public Improvement Bond Bank Revenue, Pilot Infrastructure Project, | ||||
| Series F, Assured Guaranty, 5.00%, 1/01/35 | 10,000,000 | 10,907,800 | ||
| Jasper County PCR, Northern Indiana Public Service Co. Project, Refunding, Series C, NATL | ||||
| Insured, 5.60%, 11/01/16 | 5,000,000 | 5,445,100 | ||
| University of Southern Indiana Revenue, Student Fee, Series J, Assured Guaranty, 5.75%, | ||||
| 10/01/28 | 2,000,000 | 2,316,840 | ||
| 120,690,972 | ||||
| Kansas 0.3% | ||||
| Burlington PCR, Kansas Gas and Electric Co. Project, Refunding, Series A, NATL Insured, | ||||
| 5.30%, 6/01/31 | 18,000,000 | 18,024,120 | ||
| Kansas State Development Finance Authority Hospital Revenue, Adventist Health | ||||
| System/Sunbelt Obligated Group, Refunding, Series C, 5.75%, 11/15/38 | 6,250,000 | 6,901,562 | ||
| Wyandotte County Kansas City Unified Government Utility System Revenue, Series A, BHAC | ||||
| Insured, 5.25%, 9/01/34 | 5,000,000 | 5,405,650 | ||
| 30,331,332 | ||||
| Kentucky 0.9% | ||||
| Carroll County Environmental Facilities Revenue, Kentucky Utilities Co. Project, Series A, | ||||
| AMBAC Insured, 5.75%, 2/01/26 | 12,500,000 | 13,285,125 | ||
| Jefferson County Capital Projects Corp. Lease Revenue, Refunding, Series A, zero cpn., | ||||
| 8/15/14 | 6,860,000 | 6,830,776 | ||
| 8/15/16 | 7,005,000 | 6,720,317 | ||
| 8/15/17 | 7,115,000 | 6,635,520 | ||
| Kentucky Economic Development Finance Authority Health System Revenue, Norton | ||||
| Healthcare Inc., Refunding, Series B, NATL Insured, zero cpn., 10/01/18 | 8,585,000 | 7,611,719 | ||
| Kentucky Economic Development Finance Authority Louisville Arena Project Revenue, | ||||
| Louisville Arena Authority Inc., Series A, Sub Series A-1, Assured Guaranty, 6.00%, | ||||
| 12/01/38 | 4,000,000 | 4,175,480 | ||
| Kentucky State Municipal Power Agency Power System Revenue, Prairie State Project, | ||||
| Series A, NATL Insured, 5.00%, 9/01/32 | 10,000,000 | 10,562,600 | ||
| Kentucky State Property and Buildings Commission Revenues, Project No. 90, Refunding, | ||||
| 5.50%, 11/01/28 | 15,000,000 | 17,411,100 | ||
| Louisville/Jefferson County Metro Government College Revenue, Bellarmine University | ||||
| Project, Refunding and Improvement, Series A, 6.00%, 5/01/33 | 3,000,000 | 3,135,900 | ||
| Louisville/Jefferson County Metro Government Health Facilities Revenue, Jewish Hospital and | ||||
| St. Mary’s HealthCare Inc. Project, Pre-Refunded, 6.125%, 2/01/37 | 11,500,000 | 13,694,775 | ||
| Paducah Electric Plant Board Revenue, Series A, Assured Guaranty, 5.25%, 10/01/35 | 7,000,000 | 7,485,660 | ||
| 97,548,972 |
28 | Annual Report
Franklin Federal Tax-Free Income Fund
Statement of Investments, April 30, 2014 (continued)
| Principal Amount | Value | |||
| Municipal Bonds (continued) | ||||
| Louisiana 2.0% | ||||
| East Baton Rouge Sewerage Commission Revenue, Refunding, Series A, 5.25%, 2/01/39 | $ | 6,000,000 | $ | 6,459,960 |
| Lafayette Communications Systems Revenue, XLCA Insured, 5.25%, 11/01/27 | 12,485,000 | 13,464,823 | ||
| Lafayette Public Improvement Sales Tax GO, Series B, NATL Insured, 4.75%, 3/01/30 | 5,055,000 | 5,230,105 | ||
| Lafayette Public Trust Financing Authority Revenue, Ragin’ Cajun Facilities, Housing and | ||||
| Package Project, Assured Guaranty, 5.50%, 10/01/35 | 6,000,000 | 6,592,740 | ||
| Louisiana Local Government Environmental Facilities and CDA Revenue, Bossier City Public | ||||
| Improvement Projects, AMBAC Insured, 5.00%, 11/01/32 | 6,730,000 | 7,270,082 | ||
| Louisiana Public Facilities Authority Hospital Revenue, Franciscan Missionaries of Our Lady | ||||
| Health System Project, Series A, 6.75%, 7/01/39 | 10,000,000 | 11,214,600 | ||
| Louisiana Public Facilities Authority Revenue, | ||||
| Millennium Housing LLC Student Housing, Student Housing and Auxiliary Facilities | ||||
| Project, Assured Guaranty, 5.00%, 11/01/30 | 10,000,000 | 10,270,100 | ||
| Ochsner Clinic Foundation Project, 6.75%, 5/15/41 | 15,500,000 | 17,601,025 | ||
| Ochsner Clinic Foundation Project, Series B, 5.25%, 5/15/38 | 10,260,000 | 10,580,830 | ||
| Ochsner Clinic Foundation Project, Series B, 5.50%, 5/15/47 | 10,000,000 | 10,348,600 | ||
| Ochsner Clinic Foundation Project, Series B, ETM, 5.75%, 5/15/23 | 10,000,000 | 12,816,700 | ||
| Louisiana State Gasoline and Fuels Tax Revenue, | ||||
| second lien, Series B, 5.00%, 5/01/45 | 13,690,000 | 14,502,365 | ||
| Series A, AGMC Insured, Pre-Refunded, 5.00%, 5/01/35 | 31,040,000 | 32,517,504 | ||
| St. Charles Parish Consolidated Waterworks and Wastewater District No. 1 Revenue, Series A, | ||||
| AMBAC Insured, 5.00%, 7/01/36 | 6,230,000 | 6,373,664 | ||
| St. John the Baptist Parish Revenue, Marathon Oil Corp. Project, Series A, 5.125%, | ||||
| 6/01/37 | 40,500,000 | 42,513,660 | ||
| 207,756,758 | ||||
| Maine 0.3% | ||||
| Maine State Educational Loan Authority Student Loan Revenue, Supplemental Education | ||||
| Loan Program, Series A-3, Assured Guaranty, 5.875%, 12/01/39 | 13,075,000 | 14,107,794 | ||
| Maine State Health and Higher Educational Facilities Authority Revenue, | ||||
| Maine General Medical Center Issue, 6.75%, 7/01/36 | 4,250,000 | 4,602,113 | ||
| Maine General Medical Center Issue, 7.00%, 7/01/41 | 10,000,000 | 10,913,500 | ||
| Series A, NATL Insured, 5.00%, 7/01/32 | 540,000 | 540,907 | ||
| 30,164,314 | ||||
| Maryland 0.7% | ||||
| Baltimore Project Revenue, | ||||
| Wastewater Projects, Series C, 5.00%, 7/01/38 | 5,000,000 | 5,519,200 | ||
| Wastewater Projects, Series C, 5.00%, 7/01/43 | 10,000,000 | 10,953,400 | ||
| Water Projects, Series C, AMBAC Insured, 5.00%, 7/01/37 | 8,130,000 | 8,704,466 | ||
| Maryland State EDC Student Housing Revenue, University of Maryland College Park Projects, | ||||
| Refunding, Assured Guaranty, 5.00%, 6/01/33 | 15,000,000 | 15,783,600 | ||
| Maryland State EDC, PCR, Potomac Electric Project, Refunding, 6.20%, 9/01/22 | 5,000,000 | 5,872,550 | ||
| Maryland State Health and Higher Educational Facilities Authority Revenue, | ||||
| Anne Arundel Health System Issue, Series A, 6.75%, 7/01/39 | 3,000,000 | 3,522,570 | ||
| LifeBridge Health Issue, Refunding, Assured Guaranty, 5.00%, 7/01/28 | 3,000,000 | 3,168,120 | ||
| Upper Chesapeake Hospitals Issue, Series C, 6.00%, 1/01/38 | 5,000,000 | 5,421,600 | ||
| Western Maryland Health System Issue, Series A, NATL Insured, 5.00%, 7/01/34 | 19,345,000 | 19,564,179 | ||
| 78,509,685 |
Annual Report | 29
Franklin Federal Tax-Free Income Fund
Statement of Investments, April 30, 2014 (continued)
| Principal Amount | Value | ||||
| Municipal Bonds (continued) | |||||
| Massachusetts 2.9% | |||||
| Massachusetts Bay Transportation Authority Revenue, Assessment, Refunding, Series A, | |||||
| 5.25%, 7/01/34 | $ | 27,630,000 | $ | 31,005,005 | |
| Massachusetts Bay Transportation Authority Sales Tax Revenue, Refunding, Senior Series A, | |||||
| 5.00%, 7/01/28 | 10,000,000 | 12,214,800 | |||
| Massachusetts State Department of Transportation Metropolitan Highway System Revenue, | |||||
| Senior, Refunding, Series B, 5.00%, 1/01/37 | 31,000,000 | 32,585,650 | |||
| Massachusetts State Development Finance Agency Revenue, | |||||
| Brandeis University Issue, Refunding, Series O-1, 5.00%, 10/01/40 | 19,865,000 | 21,179,269 | |||
| Massachusetts/Saltonstall Redevelopment Building Corp. Project, 100 Cambridge Street | |||||
| Redevelopment, Series A, NATL Insured, 5.125%, 8/01/28 | 6,735,000 | 6,738,031 | |||
| Wellesley College Issue, Series J, 5.00%, 7/01/42 | 10,000,000 | 11,040,900 | |||
| Worcester Polytechnic Institute Issue, Refunding, NATL Insured, 5.00%, 9/01/37 | 10,000,000 | 10,450,100 | |||
| Massachusetts State Educational Financing Authority Education Loan Revenue, | |||||
| Issue I, 6.00%, 1/01/28 | 13,680,000 | 14,900,119 | |||
| Refunding, Series K, 5.25%, 7/01/29 | 10,000,000 | 10,534,600 | |||
| Series H, Assured Guaranty, 6.35%, 1/01/30 | 5,045,000 | 5,359,505 | |||
| Massachusetts State GO, Consolidated Loan, Series C, AMBAC Insured, 5.00%, 8/01/37 | 10,000,000 | 10,802,000 | |||
| Massachusetts State Health and Educational Facilities Authority Revenue, | |||||
| Berklee College of Music Issue, Refunding, Series A, 5.00%, 10/01/37 | 10,000,000 | 10,676,100 | |||
| Emmanuel College Issue, NATL Insured, 5.00%, 7/01/37 | 10,000,000 | 10,139,100 | |||
| Northeastern University Issue, Series A, 5.00%, 10/01/35 | 20,000,000 | 21,108,000 | |||
| Northeastern University Issue, Series R, 5.00%, 10/01/33 | 6,830,000 | 7,259,061 | |||
| Springfield College Issue, 5.50%, 10/15/31 | 1,710,000 | 1,796,765 | |||
| Springfield College Issue, 5.625%, 10/15/40 | 7,000,000 | 7,352,170 | |||
| Massachusetts State HFA Housing Revenue, Series B, 7.00%, 12/01/38 | 9,140,000 | 9,847,527 | |||
| Massachusetts State School Building Authority Dedicated Sales Tax Revenue, Series A, | |||||
| AGMC Insured, Pre-Refunded, 5.00%, 8/15/30 | 2,005,000 | 2,127,746 | |||
| AMBAC Insured, 4.50%, 8/15/35 | 30,000,000 | 30,732,900 | |||
| Massachusetts State Transportation Fund Revenue, Accelerated Bridge Program, Series A, | |||||
| 4.00%, | |||||
| 6/01/35 | 12,795,000 | 13,039,640 | |||
| 6/01/36 | 10,000,000 | 10,147,600 | |||
| Massachusetts State Water Pollution Abatement Trust Revenue, MWRA Program, Series A, | |||||
| 5.00%, 8/01/32 | 225,000 | 225,637 | |||
| Massachusetts State Water Pollution Abatement Trust Water Pollution Abatement Revenue, | |||||
| MWRA Program, Refunding, Sub Series A, 5.75%, 8/01/29 | 450,000 | 451,584 | |||
| University of Massachusetts Building Authority Project Revenue, Senior Series 1, 5.00%, | |||||
| 11/01/39 | 20,000,000 | 22,372,400 | |||
| 314,086,209 | |||||
| Michigan 3.4% | |||||
| Detroit City School District GO, School Building and Site Improvement, Refunding, Series A, | |||||
| 5.00%, | |||||
| 5/01/30 | 1,245,000 | 1,305,109 | |||
| 5/01/33 | 1,500,000 | 1,559,040 | |||
| Detroit GO, Distribution State Aid, 5.00%, 11/01/30 | 22,500,000 | 23,177,925 | |||
| Detroit Sewage Disposal System Revenue, second lien, Series A, NATL Insured, 5.00%, | |||||
| 7/01/30 | 5,470,000 | 5,368,586 |
30 | Annual Report
Franklin Federal Tax-Free Income Fund
Statement of Investments, April 30, 2014 (continued)
| Principal Amount | Value | |||
| Municipal Bonds (continued) | ||||
| Michigan (continued) | ||||
| Detroit Water and Sewerage Department Sewage Disposal System Revenue, senior lien, | ||||
| Refunding, Series A, 5.25%, 7/01/39 | $ | 12,000,000 | $ | 11,688,600 |
| Detroit Water Supply System Revenue, | ||||
| second lien, Series B, AGMC Insured, 7.00%, 7/01/36 | 5,000,000 | 5,409,000 | ||
| senior lien, Refunding, Series B, Assured Guaranty, 5.00%, 7/01/21 | 10,000,000 | 10,109,200 | ||
| senior lien, Refunding, Series D, AGMC Insured, 5.00%, 7/01/32 | 32,650,000 | 31,886,316 | ||
| senior lien, Series A, NATL RE, FGIC Insured, 5.00%, 7/01/30 | 17,575,000 | 17,286,946 | ||
| Grand Rapids Public Schools GO, School Building and Site, AGMC Insured, 4.50%, | ||||
| 5/01/31 | 21,800,000 | 22,639,518 | ||
| Michigan State Building Authority Revenue, Facilities Program, | ||||
| Refunding, Series I, 6.25%, 10/15/38 | 15,000,000 | 17,324,700 | ||
| Refunding, Series I-A, 5.375%, 10/15/36 | 6,730,000 | 7,597,564 | ||
| Refunding, Series I-A, 5.25%, 10/15/44 | 20,655,000 | 22,549,890 | ||
| Refunding, Series IA, NATL RE, FGIC Insured, 5.00%, 10/15/31 | 9,475,000 | 10,142,703 | ||
| Series H, 5.125%, 10/15/33 | 12,500,000 | 13,550,250 | ||
| Series H, AGMC Insured, 5.00%, 10/15/26 | 5,000,000 | 5,670,650 | ||
| Michigan State Finance Authority Revenue, | ||||
| Hospital, Trinity Health Credit Group, Refunding, Series MI, 5.00%, 12/01/39 | 29,750,000 | 31,141,705 | ||
| School District of the City of Detroit, Refunding, 5.00%, 6/01/18 | 2,400,000 | 2,625,048 | ||
| School District of the City of Detroit, Refunding, 5.00%, 6/01/19 | 1,900,000 | 2,090,665 | ||
| School District of the City of Detroit, Refunding, 5.00%, 6/01/20 | 1,500,000 | 1,663,620 | ||
| School District of the City of Detroit, Refunding, 5.50%, 6/01/21 | 10,000,000 | 11,209,700 | ||
| Michigan State GO, Environmental Program, Refunding, Series A, | ||||
| 6.00%, 11/01/24 | 1,000,000 | 1,181,210 | ||
| 5.50%, 11/01/25 | 1,000,000 | 1,143,420 | ||
| Michigan State HDA, SFMR, Series A, 5.00%, 12/01/19 | 405,000 | 423,606 | ||
| Michigan State Hospital Finance Authority Revenue, | ||||
| MidMichigan Obligated Group, Series A, 6.00%, 6/01/29 | 4,000,000 | 4,540,480 | ||
| MidMichigan Obligated Group, Series A, 6.125%, 6/01/39 | 5,000,000 | 5,459,250 | ||
| Trinity Health Credit Group, Refunding, Series C, 5.00%, 12/01/34 | 10,000,000 | 10,676,700 | ||
| Michigan State Strategic Fund Limited Obligation Revenue, The Detroit Edison Co. Exempt | ||||
| Facilities Project, Refunding, Series KT, 5.625%, 7/01/20 | 7,000,000 | 8,346,310 | ||
| Michigan Tobacco Settlement Finance Authority Revenue, Tobacco Settlement Asset-Backed, | ||||
| Senior Series A, 6.00%, 6/01/34 | 42,680,000 | 35,435,497 | ||
| Royal Oak Hospital Finance Authority Hospital Revenue, William Beaumont Hospital | ||||
| Obligated Group, Refunding, | ||||
| Series V, 8.25%, 9/01/39 | 20,000,000 | 24,379,600 | ||
| Series W, 6.375%, 8/01/29 | 10,000,000 | 11,629,600 | ||
| Wayne State University Revenue, General, AMBAC Insured, 5.00%, 11/15/36 | 5,000,000 | 5,356,400 | ||
| 364,568,808 | ||||
| Minnesota 0.2% | ||||
| Minneapolis Health Care System Revenue, Fairview Health Services, Series A, | ||||
| 6.625%, 11/15/28 | 11,000,000 | 12,864,170 | ||
| 6.75%, 11/15/32 | 6,250,000 | 7,255,438 | ||
| 20,119,608 |
Annual Report | 31
Franklin Federal Tax-Free Income Fund
Statement of Investments, April 30, 2014 (continued)
| Principal Amount | Value | |||
| Municipal Bonds (continued) | ||||
| Mississippi 0.6% | ||||
| Mississippi Business Finance Corp. PCR, System Energy Resource Inc. Project, Refunding, | ||||
| 5.875%, 4/01/22 | $ | 45,000,000 | $ | 45,025,650 |
| Mississippi Development Bank Special Obligation Revenue, | ||||
| City of Jackson GO Capital City Convention Center Project, Refunding, Series A, 5.00%, | ||||
| 3/01/36 | 10,000,000 | 11,719,400 | ||
| City of Jackson Water and Sewer System Project, AGMC Insured, 6.875%, 12/01/40 | 3,400,000 | 4,313,716 | ||
| 61,058,766 | ||||
| Missouri 0.4% | ||||
| Missouri State Joint Municipal Electric Utility Commission Power Project Revenue, | ||||
| Iatan 2 Project, Series A, AMBAC Insured, 5.00%, 1/01/34 | 14,000,000 | 14,266,420 | ||
| Plum Point Project, NATL Insured, 5.00%, 1/01/34 | 13,000,000 | 13,471,900 | ||
| Missouri State Health and Educational Facilities Authority Health Facilities Revenue, St. | ||||
| Luke’s Health System, Series B, AGMC Insured, 5.50%, 11/15/35 | 15,000,000 | 16,064,250 | ||
| 43,802,570 | ||||
| Nebraska 1.7% | ||||
| Adams County School District No. 018 GO, Hastings Public Schools, AGMC Insured, | ||||
| Pre-Refunded, 5.00%, 12/15/31 | 5,795,000 | 6,469,016 | ||
| Lancaster County Correctional Facility Joint Public Agency GO, Building, 5.00%, 12/01/28 | 5,000,000 | 5,626,600 | ||
| Lancaster County School District No. 001 GO, Lincoln Public Schools, 5.00%, 1/15/36 | 24,725,000 | 26,519,046 | ||
| Lincoln Electric System Revenue, Pre-Refunded, 5.00%, 9/01/31 | 8,645,000 | 9,192,661 | ||
| Madison County Hospital Authority No. 001 Hospital Revenue, Faith Regional Health | ||||
| Services Project, Series A-1, 6.00%, 7/01/33 | 12,000,000 | 12,817,320 | ||
| Municipal Energy Agency of Nebraska Power Supply System Revenue, Refunding, Series A, | ||||
| BHAC Insured, 5.375%, 4/01/39 | 5,000,000 | 5,482,800 | ||
| Omaha Convention Hotel Corp. Revenue, Convention Center, first tier, Refunding, AMBAC | ||||
| Insured, 5.00%, 2/01/35 | 30,000,000 | 30,926,400 | ||
| Omaha Public Facilities Corp. Lease Revenue, Baseball Stadium Project, 5.00%, 6/01/36 | 9,000,000 | 9,596,340 | ||
| Omaha Public Power District Revenue, Electric System, Series C, 5.00%, 2/01/39 | 23,305,000 | 25,009,994 | ||
| Omaha Public Power District Separate Electric System Revenue, Nebraska City 2, Series A, | ||||
| AMBAC Insured, 5.00%, 2/01/30 | 12,165,000 | 12,804,514 | ||
| University of Nebraska Revenue, | ||||
| Kearney Student Fees and Facilities, 5.00%, 7/01/30 | 5,000,000 | 5,289,250 | ||
| Lincoln Student Fees and Facilities, 5.00%, 7/01/37 | 5,000,000 | 5,485,550 | ||
| Lincoln Student Fees and Facilities, 5.00%, 7/01/42 | 7,500,000 | 8,154,900 | ||
| Lincoln Student Fees and Facilities, Series A, 5.25%, 7/01/34 | 5,000,000 | 5,533,350 | ||
| Omaha Student Facilities Project, 5.00%, 5/15/32 | 5,000,000 | 5,374,400 | ||
| University of Nebraska Omaha Health and Recreation Project, 5.00%, 5/15/38 | 5,000,000 | 5,279,450 | ||
| 179,561,591 | ||||
| Nevada 0.4% | ||||
| Clark County Airport Revenue, sub. lien, Series A-2, NATL RE, FGIC Insured, Pre-Refunded, | ||||
| 5.125%, 7/01/27 | 10,000,000 | 10,077,300 | ||
| Clark County School District GO, | ||||
| Refunding, Series A, NATL RE, FGIC Insured, 5.00%, 6/15/24 | 15,000,000 | 16,846,800 | ||
| Series C, AGMC Insured, Pre-Refunded, 5.00%, 6/15/21 | 10,000,000 | 10,758,200 |
32 | Annual Report
Franklin Federal Tax-Free Income Fund
Statement of Investments, April 30, 2014 (continued)
| Principal Amount | Value | |||
| Municipal Bonds (continued) | ||||
| Nevada (continued) | ||||
| Nevada State GO, Municipal Bond Bank Project No. 40-41, Series A, ETM, 6.375%, | ||||
| 12/01/17 | $ | 6,015,000 | $ | 6,039,361 |
| 43,721,661 | ||||
| New Hampshire 0.2% | ||||
| Nashua Housing Authority MFR, Clocktower Project, Refunding, GNMA Secured, 6.25%, | ||||
| 6/20/33 | 4,881,000 | 4,885,588 | ||
| New Hampshire Health and Education Facilities Authority Revenue, The Memorial Hospital | ||||
| Issue, Refunding, 5.25%, | ||||
| 6/01/26 | 1,000,000 | 1,015,240 | ||
| 6/01/36 | 1,100,000 | 1,099,956 | ||
| New Hampshire Higher Educational and Health Facilities Authority Revenue, New Hampshire | ||||
| Catholic Charities Issue, 5.80%, 8/01/22 | 970,000 | 970,611 | ||
| New Hampshire Municipal Bond Bank Revenue, Series B, 5.00%, 8/15/39 | 11,250,000 | 12,372,750 | ||
| New Hampshire State Business Finance Authority Revenue, Elliot Hospital Obligated Group, | ||||
| Series A, 6.125%, 10/01/39 | 5,000,000 | 5,277,800 | ||
| 25,621,945 | ||||
| New Jersey 3.4% | ||||
| Bayonne GO, General Improvement, Refunding, 5.75%, 7/01/35 | 9,000,000 | 9,735,390 | ||
| New Jersey EDA Revenue, | ||||
| Cigarette Tax, Pre-Refunded, 5.75%, 6/15/29 | 20,000,000 | 20,125,400 | ||
| Motor Vehicle Surcharges, Series A, NATL Insured, 5.00%, 7/01/29 | 10,000,000 | 10,085,300 | ||
| Motor Vehicle Surcharges, Series A, NATL Insured, 5.00%, 7/01/34 | 5,000,000 | 5,033,000 | ||
| School Facilities Construction, Refunding, Series NN, 5.00%, 3/01/30 | 15,000,000 | 16,420,200 | ||
| School Facilities Construction, Refunding, Series NN, 5.00%, 3/01/31 | 14,775,000 | 16,104,307 | ||
| School Facilities Construction, Series NN, 5.00%, 3/01/28 | 22,000,000 | 24,414,720 | ||
| School Facilities Construction, Series O, Pre-Refunded, 5.125%, 3/01/28 | 20,000,000 | 20,812,200 | ||
| School Facilities Construction, Series U, 5.00%, 9/01/37 | 22,000,000 | 22,766,920 | ||
| New Jersey Health Care Facilities Financing Authority State Contract Revenue, Hospital | ||||
| Asset Transformation Program, Series A, 5.25%, 10/01/38 | 10,000,000 | 10,637,000 | ||
| New Jersey State COP, Equipment Lease Purchase, Series A, 5.25%, | ||||
| 6/15/25 | 20,305,000 | 22,853,887 | ||
| 6/15/26 | 8,000,000 | 8,959,520 | ||
| 6/15/27 | 4,000,000 | 4,459,520 | ||
| 6/15/28 | 2,000,000 | 2,211,700 | ||
| New Jersey State Housing and Mortgage Finance Agency Revenue, Series AA, 6.375%, | ||||
| 10/01/28 | 3,300,000 | 3,349,434 | ||
| New Jersey State Transportation Trust Fund Authority Revenue, Transportation System, | ||||
| Series A, 6.00%, 12/15/38 | 39,505,000 | 45,676,866 | ||
| Series A, Pre-Refunded, 6.00%, 12/15/38 | 20,495,000 | 24,997,956 | ||
| Series B, 5.25%, 6/15/36 | 10,000,000 | 10,792,300 | ||
| Series D, 5.25%, 12/15/23 | 50,000,000 | 59,654,000 | ||
| New Jersey State Turnpike Authority Turnpike Revenue, | ||||
| Growth and Income Securities, Series B, AMBAC Insured, zero cpn. to 1/01/15, 5.15% | ||||
| thereafter, 1/01/35 | 10,000,000 | 9,896,800 | ||
| Series E, 5.25%, 1/01/40 | 13,925,000 | 14,993,883 | ||
| 363,980,303 |
Annual Report | 33
Franklin Federal Tax-Free Income Fund
Statement of Investments, April 30, 2014 (continued)
| Principal Amount | Value | |||
| Municipal Bonds (continued) | ||||
| New York 7.7% | ||||
| Long Island Power Authority Electric System Revenue, General, Refunding, Series A, 6.00%, | ||||
| 5/01/33 | $ | 12,500,000 | $ | 14,188,375 |
| MTA Dedicated Tax Fund Revenue, Series B, | ||||
| 5.25%, 11/15/28 | 6,000,000 | 6,897,000 | ||
| 5.25%, 11/15/29 | 4,000,000 | 4,566,800 | ||
| 5.25%, 11/15/30 | 3,000,000 | 3,411,810 | ||
| 5.00%, 11/15/34 | 15,000,000 | 16,184,400 | ||
| MTA Revenue, Transportation, | ||||
| Refunding, Series D, 5.25%, 11/15/40 | 15,000,000 | 15,979,050 | ||
| Series A, 5.00%, 11/15/37 | 25,000,000 | 26,302,000 | ||
| Series A, 5.00%, 11/15/38 | 11,800,000 | 12,594,494 | ||
| Series C, 6.50%, 11/15/28 | 15,000,000 | 17,800,650 | ||
| Series D, 5.00%, 11/15/34 | 10,000,000 | 10,705,800 | ||
| Series D, 5.00%, 11/15/36 | 9,500,000 | 10,093,085 | ||
| Sub Series A-1, 5.00%, 11/15/40 | 30,000,000 | 31,903,500 | ||
| New York City GO, | ||||
| Fiscal 2002, Series D, 5.50%, 6/01/24 | 185,000 | 185,673 | ||
| Fiscal 2009, Series E, Sub Series E-1, 6.25%, 10/15/28 | 10,000,000 | 11,845,400 | ||
| Fiscal 2010, Refunding, Series C, 5.00%, 8/01/23 | 24,620,000 | 28,447,918 | ||
| Fiscal 2013, Series F, Sub Series F-1, 5.00%, 3/01/30 | 20,000,000 | 22,388,200 | ||
| Series F, 5.25%, 1/15/23 | 5,000 | 5,017 | ||
| New York City Municipal Water Finance Authority Water and Sewer System Revenue, | ||||
| Fiscal 2009, Series A, 5.75%, 6/15/40 | 6,000,000 | 6,782,220 | ||
| Second General Resolution, Fiscal 2008, Refunding, Series AA, 5.00%, 6/15/37 | 10,000,000 | 10,718,700 | ||
| Second General Resolution, Fiscal 2009, Refunding, Series EE, 5.25%, 6/15/40 | 64,970,000 | 71,201,922 | ||
| Second General Resolution, Fiscal 2009, Refunding, Series FF-2, 5.50%, 6/15/40 | 15,000,000 | 16,689,000 | ||
| Second General Resolution, Fiscal 2012, Refunding, Series AA, 5.00%, 6/15/34 | 10,000,000 | 10,989,500 | ||
| Second General Resolution, Fiscal 2013, Refunding, Series DD, 5.00%, 6/15/35 | 30,705,000 | 33,817,259 | ||
| Second General Resolution, Fiscal 2014, Refunding, Series BB, 5.00%, 6/15/46 | 15,000,000 | 16,123,500 | ||
| New York City Transitional Finance Authority Building Aid Revenue, | ||||
| Fiscal 2009, Series S-2, 6.00%, 7/15/38 | 20,000,000 | 22,770,200 | ||
| Fiscal 2009, Series S-3, 5.25%, 1/15/34 | 10,170,000 | 11,296,328 | ||
| Fiscal 2009, Series S-4, 5.50%, 1/15/34 | 12,890,000 | 14,580,137 | ||
| Fiscal 2011, Series S-2, Sub Series S-2A, 5.00%, 7/15/40 | 35,000,000 | 37,734,550 | ||
| Fiscal 2012, Series S-1, Sub Series S-1A, 5.25%, 7/15/37 | 5,300,000 | 5,842,614 | ||
| New York City Transitional Finance Authority Revenue, Future Tax Secured, | ||||
| Fiscal 2011, sub. bond, Series C, 5.00%, 11/01/39 | 15,000,000 | 16,359,600 | ||
| Fiscal 2014, sub. bond, Series A, Sub Series A-1, 5.00%, 11/01/34 | 15,000,000 | 16,649,850 | ||
| New York Convention Center Development Corp. Revenue, Hotel Unit Fee Secured, AMBAC | ||||
| Insured, 5.00%, 11/15/30 | 10,000,000 | 10,508,000 | ||
| New York Liberty Development Corp. Liberty Revenue, | ||||
| One World Trade Center, Port Authority Consolidated, Secured, 5.25%, 12/15/43 | 25,000,000 | 27,066,250 | ||
| Second Priority, Bank of America Tower at One Bryant Park Project, Class 1, Refunding, | ||||
| 5.625%, 1/15/46 | 25,000,000 | 27,368,500 | ||
| Seven World Trade Center Project, Refunding, 5.00%, 9/15/43 | 6,500,000 | 6,809,270 | ||
| New York Liberty Development Corp. Revenue, Goldman Sachs Headquarters Issue, | ||||
| 5.25%, 10/01/35 | 40,000,000 | 45,706,400 | ||
| 5.50%, 10/01/37 | 24,995,000 | 29,269,645 |
34 | Annual Report
Franklin Federal Tax-Free Income Fund
Statement of Investments, April 30, 2014 (continued)
| Principal Amount | Value | |||
| Municipal Bonds (continued) | ||||
| New York (continued) | ||||
| New York State Dormitory Authority Lease Revenues, State University Dormitory Facilities, | ||||
| Series A, 5.00%, 7/01/41 | $ | 10,000,000 | $ | 10,862,600 |
| New York State Dormitory Authority Revenues, State Supported Debt, Upstate Community | ||||
| Colleges, Series C, 6.00%, 7/01/31 | 23,215,000 | 26,930,329 | ||
| New York State Dormitory Authority State Personal Income Tax Revenue, General Purpose, | ||||
| Series A, 5.00%, 2/15/36 | 15,000,000 | 16,414,050 | ||
| New York State HFAR, Housing Project Mortgage, Refunding, Series A, AGMC Insured, | ||||
| 6.10%, 11/01/15 | 120,000 | 120,317 | ||
| 6.125%, 11/01/20 | 240,000 | 240,458 | ||
| New York State Urban Development Corp. Revenue, State Personal Income Tax, | ||||
| General Purpose, Series A, 5.00%, 3/15/31 | 10,000,000 | 11,165,800 | ||
| State Facilities and Equipment, Series B-1, 5.00%, 3/15/36 | 5,000,000 | 5,418,400 | ||
| Port Authority of New York and New Jersey Revenue, Consolidated, One Hundred | ||||
| Seventy-Ninth Series, 5.00%, 12/01/38 | 20,000,000 | 22,130,200 | ||
| Triborough Bridge and Tunnel Authority Revenue, General Purpose, Series B, Pre-Refunded, | ||||
| 5.50%, 1/01/30 | 15,000,000 | 18,696,300 | ||
| Triborough Bridge and Tunnel Authority Revenues, General, MTA Bridges and Tunnels, | ||||
| Series A, 5.25%, 11/15/38 | 25,000,000 | 27,317,500 | ||
| Series A-2, 5.25%, 11/15/34 | 7,500,000 | 8,353,875 | ||
| 819,432,446 | ||||
| North Carolina 2.4% | ||||
| Charlotte Airport Revenue, Series A, NATL Insured, 5.00%, 7/01/34 | 6,000,000 | 6,016,320 | ||
| Charlotte COP, | ||||
| Cultural Arts Facilities, Refunding, Series E, 5.00%, 6/01/34 | 13,000,000 | 13,762,320 | ||
| Transit Projects, Phase II, Series E, 5.00%, 6/01/30 | 15,940,000 | 16,553,690 | ||
| North Carolina Eastern Municipal Power Agency Power System Revenue, | ||||
| Refunding, Series B, 6.00%, 1/01/22 | 1,250,000 | 1,535,463 | ||
| Refunding, Series B, 6.25%, 1/01/23 | 39,030,000 | 49,041,585 | ||
| Series A, 5.50%, 1/01/26 | 4,500,000 | 4,989,375 | ||
| North Carolina Medical Care Commission Revenue, Rowan Regional Medical Center Project, | ||||
| FHA Insured, Pre-Refunded, 4.75%, 9/01/24 | 6,970,000 | 7,073,226 | ||
| North Carolina State Capital Improvement Limited Obligation Revenue, Series A, 5.00%, | ||||
| 5/01/23 | 20,000,000 | 23,444,600 | ||
| 5/01/24 | 5,500,000 | 6,313,505 | ||
| 5/01/25 | 5,750,000 | 6,576,907 | ||
| 5/01/26 | 20,000,000 | 23,126,200 | ||
| 5/01/27 | 4,500,000 | 5,128,785 | ||
| 5/01/28 | 4,250,000 | 4,824,388 | ||
| North Carolina Turnpike Authority Triangle Expressway System Revenue, | ||||
| Capital Appreciation, Series B, Assured Guaranty, zero cpn., 1/01/33 | 25,000,000 | 11,019,000 | ||
| Capital Appreciation, Series B, Assured Guaranty, zero cpn., 1/01/34 | 15,000,000 | 6,254,850 | ||
| Capital Appreciation, Series B, Assured Guaranty, zero cpn., 1/01/35 | 15,215,000 | 5,995,166 | ||
| Series A, Assured Guaranty, 5.50%, 1/01/29 | 6,750,000 | 7,465,500 | ||
| Series A, Assured Guaranty, 5.75%, 1/01/39 | 10,380,000 | 11,328,213 | ||
| Raleigh Combined Enterprise System Revenue, 5.00%, 3/01/40 | 13,115,000 | 14,241,054 | ||
| Wake County GO, Refunding, Series C, 5.00%, 3/01/25 | 21,780,000 | 27,077,767 | ||
| 251,767,914 |
Annual Report | 35
Franklin Federal Tax-Free Income Fund
Statement of Investments, April 30, 2014 (continued)
| Principal Amount | Value | ||||
| Municipal Bonds (continued) | |||||
| North Dakota 0.3% | |||||
| Grand Forks Health Care System Revenue, Altru Health System Obligated Group, | |||||
| Assured Guaranty, 5.00%, 12/01/26 | $ | 8,385,000 | $ | 8,701,869 | |
| Refunding, 5.50%, 12/01/20 | 8,870,000 | 9,710,166 | |||
| Refunding, 5.50%, 12/01/24 | 13,945,000 | 14,844,592 | |||
| 33,256,627 | |||||
| Ohio 2.9% | |||||
| Akron Income Tax Revenue, Community Learning Centers, Refunding, Series A, 5.00%, | |||||
| 12/01/29 | 10,000,000 | 11,226,000 | |||
| American Municipal Power-Ohio Inc. Revenue, Prairie State Energy Campus Project, | |||||
| Refunding, Series A, 5.00%, 2/15/38 | 22,500,000 | 23,773,275 | |||
| Bowling Green Student Housing Revenue, CFP I LLC, State University Project, 6.00%, | |||||
| 6/01/45 | 6,750,000 | 6,935,895 | |||
| Buckeye Tobacco Settlement Financing Authority Revenue, Asset-Backed, | |||||
| Senior Capital Appreciation Turbo Term Bond, Series A-3, 6.25%, 6/01/37 | 15,000,000 | 12,868,800 | |||
| Senior Current Interest Turbo Term Bond, Series A-2, 5.75%, 6/01/34 | 11,250,000 | 9,253,238 | |||
| Cleveland State University General Receipt Revenue, NATL RE, FGIC Insured, Pre-Refunded, | |||||
| 5.00%, 6/01/29 | 5,000,000 | 5,017,500 | |||
| Cleveland-Cuyahoga County Port Authority Development Lease Revenue, Administrative | |||||
| Headquarters Project, 5.00%, 7/01/37 | 6,000,000 | 6,763,440 | |||
| Hamilton County Sewer System Revenue, The Metropolitan Sewer District of Greater | |||||
| Cincinnati, Improvement and Refunding, Series A, 5.00%, 12/01/38 | 12,000,000 | 13,176,480 | |||
| JobsOhio Beverage System Statewide Liquor Profits Revenue, senior lien, Series A, 5.00%, | |||||
| 1/01/38 | 21,060,000 | 22,523,249 | |||
| Kent State University Revenues, General Receipts, Series A, 5.00%, 5/01/37 | 10,500,000 | 11,130,840 | |||
| Little Miami Local School District GO, School Improvement, AGMC Insured, Pre-Refunded, | |||||
| 5.00%, 12/01/34 | 4,000,000 | 4,458,360 | |||
| Maple Heights City School District GO, School Facilities Improvement, | |||||
| 5.00%, 1/15/37 | 23,890,000 | 25,154,975 | |||
| Pre-Refunded, 5.00%, 1/15/37 | 5,480,000 | 6,117,214 | |||
| Marysville Wastewater Treatment System Revenue, Refunding, XLCA Insured, 5.00%, | |||||
| 12/01/31 | 8,000,000 | 8,395,120 | |||
| 12/01/36 | 13,725,000 | 14,285,255 | |||
| Ohio State Air Quality Development Authority Revenue, | |||||
| Environmental Improvement, Buckeye Power Inc. Project, 6.00%, 12/01/40 | 15,000,000 | 16,187,700 | |||
| Pollution Control, FirstEnergy Generation Corp. Project, Refunding, Series C, 5.625%, | |||||
| 6/01/18 | 8,500,000 | 9,335,465 | |||
| Ohio State GO, Infrastructure Improvement, Series A, 5.375%, 9/01/28 | 10,000,000 | 11,223,900 | |||
| Ohio State Turnpike Commission Revenue, junior lien, Series A-3, zero cpn. to 2/14/23, | |||||
| 5.75% thereafter, 2/15/35 | 35,000,000 | 24,266,900 | |||
| Ohio State University Revenue, Special Purpose General Receipts, Series A, 5.00%, | |||||
| 6/01/38 | 10,000,000 | 10,977,700 | |||
| Ohio State Water Development Authority PCR, FirstEnergy Nuclear Generation Corp. Project, | |||||
| Mandatory Put 6/01/16, Refunding, Series A, 5.875%, 6/01/33 | 13,000,000 | 14,033,890 | |||
| Scioto County Hospital Facilities Revenue, Southern Ohio Medical Center, Refunding, 5.75%, | |||||
| 2/15/38 | 17,000,000 | 17,989,570 | |||
| Toledo Water System Revenue, Improvement and Refunding, 5.00%, 11/15/38 | 20,000,000 | 21,835,400 | |||
| 306,930,166 | |||||
36 | Annual Report
Franklin Federal Tax-Free Income Fund
Statement of Investments, April 30, 2014 (continued)
| Principal Amount | Value | |||
| Municipal Bonds (continued) | ||||
| Oregon 0.9% | ||||
| Oregon Health and Science University Revenue, Series A, 5.75%, 7/01/39 | $ | 5,000,000 | $ | 5,576,150 |
| Oregon State Department of Transportation Highway User Tax Revenue, senior lien, Series A, | ||||
| 4.50%, 11/15/32 | 30,000,000 | 31,536,600 | ||
| Oregon State GO, State Board of Higher Education, Series A, Pre-Refunded, 5.00%, | ||||
| 8/01/26 | 6,630,000 | 7,021,419 | ||
| 8/01/27 | 6,955,000 | 7,365,606 | ||
| Port of Portland International Airport Revenue, Series Nineteen, 5.50%, 7/01/38 | 25,000,000 | 27,229,750 | ||
| Portland Sewer System Revenue, second lien, Series A, 5.00%, 3/01/35 | 11,540,000 | 12,686,383 | ||
| 91,415,908 | ||||
| Pennsylvania 2.6% | ||||
| Centennial School District Bucks County GO, Series B, AGMC Insured, 5.25%, 12/15/37 | 13,655,000 | 15,223,823 | ||
| Coatesville Area School District GO, AGMC Insured, 5.00%, 8/01/24 | 6,420,000 | 6,829,532 | ||
| Commonwealth Financing Authority Revenue, Series B, 5.00%, 6/01/42 | 5,400,000 | 5,685,444 | ||
| Delaware Valley Regional Finance Authority Local Government Revenue, Series B, AMBAC | ||||
| Insured, 5.60%, 7/01/17 | 5,000,000 | 5,596,550 | ||
| Northampton County General Purpose Authority Hospital Revenue, St. Luke’s Hospital Project, | ||||
| Series A, 5.375%, 8/15/28 | 5,000,000 | 5,207,650 | ||
| Pennsylvania State Economic Development Financing Authority Water Facilities Revenue, | ||||
| Aqua Pennsylvania Inc. Project, Series B, 5.00%, 12/01/43 | 20,000,000 | 21,157,200 | ||
| Pennsylvania State Economic Development Financing Authority Water Facility Revenue, | ||||
| Pennsylvania-American Water Co. Project, 6.20%, 4/01/39 | 12,500,000 | 13,754,250 | ||
| Pennsylvania State Higher Educational Facilities Authority Revenue, Temple University, | ||||
| Refunding, NATL Insured, 5.00%, 4/01/33 | 13,225,000 | 13,901,988 | ||
| Pennsylvania State Turnpike Commission Turnpike Revenue, | ||||
| Capital Appreciation, Series C, AGMC Insured, zero cpn. to 6/01/16, 6.25% thereafter, | ||||
| 6/01/33 | 5,000,000 | 5,453,350 | ||
| Motor License Fund-Enhanced, Subordinate, Series A, 5.00%, 12/01/37 | 3,000,000 | 3,202,320 | ||
| Motor License Fund-Enhanced, Subordinate, Series A, Sub Series A-1, 5.00%, | ||||
| 12/01/38 | 20,000,000 | 21,050,800 | ||
| Refunding, Series C, Sub Series C-1, Assured Guaranty, 6.00%, 6/01/28 | 5,000,000 | 5,677,600 | ||
| Refunding, Series C, Sub Series C-1, Assured Guaranty, 6.25%, 6/01/38 | 15,000,000 | 16,739,400 | ||
| sub. bond, Series B, 5.75%, 6/01/39 | 20,000,000 | 21,957,200 | ||
| Philadelphia Gas Works Revenue, Fifth Series A-1, AGMC Insured, 5.00%, 9/01/29 | 5,000,000 | 5,024,700 | ||
| Philadelphia GO, Refunding, Series A, Assured Guaranty, 5.00%, 8/01/24 | 11,000,000 | 12,103,520 | ||
| Philadelphia Hospitals and Higher Educational Facilities Authority Revenue, Mortgage, | ||||
| North Philadelphia Health Systems, Refunding, Series A, FHA Insured, | ||||
| 5.30%, 1/01/18 | 965,000 | 968,078 | ||
| 5.35%, 1/01/23 | 5,690,000 | 5,707,753 | ||
| 5.375%, 1/01/28 | 3,700,000 | 3,705,217 | ||
| Philadelphia Municipal Authority Lease Revenue, 6.375%, 4/01/29 | 4,500,000 | 5,046,255 | ||
| Philadelphia RDAR, Neighborhood Transformation Initiative, Series C, NATL RE, FGIC | ||||
| Insured, 5.00%, | ||||
| 4/15/29 | 10,965,000 | 11,128,488 | ||
| 4/15/30 | 12,000,000 | 12,168,840 | ||
| Philadelphia School District GO, Series E, 6.00%, 9/01/38 | 25,000,000 | 27,130,250 |
Annual Report | 37
Franklin Federal Tax-Free Income Fund
Statement of Investments, April 30, 2014 (continued)
| Principal Amount | Value | |||
| Municipal Bonds (continued) | ||||
| Pennsylvania (continued) | ||||
| Philadelphia Water and Wastewater Revenue, Series A, | ||||
| 5.25%, 1/01/25 | $ | 1,000,000 | $ | 1,106,670 |
| 5.00%, 1/01/26 | 5,000,000 | 5,429,050 | ||
| 5.00%, 1/01/27 | 1,750,000 | 1,891,470 | ||
| 5.25%, 1/01/32 | 5,000,000 | 5,390,500 | ||
| Pittsburgh and Allegheny County Sports and Exhibition Authority Hotel Room Regional | ||||
| Enterprise Tower Revenue, Refunding, Assured Guaranty, 5.00%, 2/01/35 | 18,000,000 | 18,761,940 | ||
| 276,999,838 | ||||
| Rhode Island 1.2% | ||||
| Narragansett Bay Commission Wastewater System Revenue, Series A, NATL Insured, 5.00%, | ||||
| 8/01/30 | 7,990,000 | 8,269,650 | ||
| Rhode Island Convention Center Authority Revenue, Refunding, Series A, Assured Guaranty, | ||||
| 5.50%, 5/15/27 | 17,300,000 | 19,125,842 | ||
| Rhode Island Housing and Mortgage Finance Corp. Revenue, Homeownership Opportunity, | ||||
| Refunding, Series 15-A, 6.85%, 10/01/24 | 155,000 | 155,251 | ||
| Series 10-A, 6.50%, 10/01/22 | 220,000 | 220,233 | ||
| Series 10-A, 6.50%, 4/01/27 | 130,000 | 130,145 | ||
| Rhode Island State EDC Airport Revenue, Series B, NATL Insured, 5.00%, | ||||
| 7/01/27 | 12,280,000 | 12,763,095 | ||
| 7/01/30 | 14,965,000 | 15,142,934 | ||
| Rhode Island State Health and Educational Building Corp. Higher Education Facilities | ||||
| Revenue, Brown University Issue, Refunding, Series A, 5.00%, 9/01/39 | 9,000,000 | 9,795,780 | ||
| Rhode Island State Health and Educational Building Corp. Higher Education Facility Revenue, | ||||
| New England Institute of Technology Issue, Series A, 5.125%, 3/01/40 | 16,435,000 | 17,125,763 | ||
| Rhode Island State Health and Educational Building Corp. Revenue, | ||||
| Higher Education Facility, Board of Governors for Higher Education, University of Rhode | ||||
| Island, Educational and General Issue, Refunding, Series G, AMBAC, 5.00%, | ||||
| 9/15/30 | 10,000,000 | 10,295,500 | ||
| Hospital Financing, Lifespan Obligated Group Issue, Refunding, Series A, AGMC Insured, | ||||
| 5.00%, 5/15/26 | 5,000,000 | 5,249,650 | ||
| Hospital Financing, Lifespan Obligated Group Issue, Refunding, Series A, AGMC Insured, | ||||
| 5.00%, 5/15/32 | 12,440,000 | 12,928,270 | ||
| Hospital Financing, Lifespan Obligated Group Issue, Series A, 7.00%, 5/15/39 | 8,200,000 | 9,113,152 | ||
| Public Schools, Bond Financing Program, Town of East Greenwich Issue, Series A, 5.00%, | ||||
| 5/15/37 | 10,585,000 | 11,517,750 | ||
| 131,833,015 | ||||
| South Carolina 1.6% | ||||
| Charleston Educational Excellence Finance Corp. Revenue, Charleston County School | ||||
| District Project, Pre-Refunded, 5.25%, 12/01/30 | 8,000,000 | 8,623,280 | ||
| Greenville County School District Installment Purchase Revenue, Building Equity Sooner for | ||||
| Tomorrow, Refunding, 5.00%, 12/01/28 | 7,500,000 | 8,082,825 | ||
| Greenwood Fifty School Facilities Inc. Installment Purchase Revenue, Greenwood School | ||||
| District No. 50, South Carolina Project, Refunding, Assured Guaranty, 4.50%, 12/01/32 | 7,030,000 | 7,304,732 | ||
| Lancaster Educational Assistance Program Inc. Revenue, School District of Lancaster County | ||||
| Project, Pre-Refunded, 5.00%, 12/01/26 | 12,300,000 | 12,639,603 |
38 | Annual Report
Franklin Federal Tax-Free Income Fund
Statement of Investments, April 30, 2014 (continued)
| Principal Amount | Value | |||
| Municipal Bonds (continued) | ||||
| South Carolina (continued) | ||||
| Medical University of South Carolina Hospital Authority Hospital Facilities Revenue, | ||||
| Mortgage, Series A, NATL Insured, Pre-Refunded, 5.00%, 8/15/31 | $ | 10,910,000 | $ | 11,056,849 |
| Newberry Investing in Children’s Education Installment Revenue, Newberry County School | ||||
| District Project, 5.00%, 12/01/30 | 4,000,000 | 4,154,400 | ||
| Piedmont Municipal Power Agency Electric Revenue, Series A-2, 5.00%, 1/01/24 | 10,000,000 | 10,701,500 | ||
| SCAGO Educational Facilities Corp. for Beaufort School District Revenue, Installment | ||||
| Purchase, School District of Beaufort County Project, Refunding, AGMC Insured, 5.00%, | ||||
| 12/01/31 | 5,340,000 | 5,629,481 | ||
| SCAGO Educational Facilities Corp. for Chesterfield School District Revenue, Installment | ||||
| Purchase, Chesterfield County School District Project, Assured Guaranty, 5.00%, | ||||
| 12/01/29 | 7,500,000 | 7,921,875 | ||
| SCAGO Educational Facilities Corp. for Colleton School District Revenue, Installment | ||||
| Purchase, School District of Colleton County Project, Assured Guaranty, 5.00%, | ||||
| 12/01/25 | 3,340,000 | 3,547,581 | ||
| 12/01/26 | 4,000,000 | 4,236,280 | ||
| SCAGO Educational Facilities Corp. for Pickens School District Revenue, Installment | ||||
| Purchase, School District of Pickens County Project, AGMC Insured, 5.00%, | ||||
| 12/01/25 | 18,900,000 | 20,089,188 | ||
| 12/01/31 | 10,000,000 | 10,365,700 | ||
| South Carolina Jobs EDA Hospital Revenue, | ||||
| AnMed Health Project, Refunding and Improvement, Series B, Assured Guaranty, 5.375%, | ||||
| 2/01/29 | 4,000,000 | 4,455,840 | ||
| Palmetto Health, Refunding and Improvement, 5.75%, 8/01/39 | 3,000,000 | 3,203,340 | ||
| Palmetto Health, Refunding, Series A, AGMC Insured, 5.00%, 8/01/35 | 20,000,000 | 20,400,000 | ||
| South Carolina State Public Service Authority Revenue, Refunding, | ||||
| Series A, 5.50%, 1/01/38 | 7,500,000 | 8,343,225 | ||
| Series B, 5.25%, 1/01/34 | 6,000,000 | 6,436,560 | ||
| University of South Carolina Higher Education Revenue, Special Moore School Business | ||||
| Project, 5.00%, 5/01/32 | 11,490,000 | 12,783,659 | ||
| 169,975,918 | ||||
| South Dakota 0.4% | ||||
| Huron School District No. 2-2 GO, 5.00%, 6/15/39 | 4,000,000 | 4,195,880 | ||
| South Dakota State Health and Educational Facilities Authority Revenue, | ||||
| Avera Health Issue, Series B, 5.50%, 7/01/35 | 3,000,000 | 3,164,670 | ||
| Avera Health Issue, Series B, 5.25%, 7/01/38 | 5,000,000 | 5,215,450 | ||
| Sanford Health, 5.00%, 11/01/27 | 2,355,000 | 2,494,228 | ||
| Sanford Health, 5.00%, 11/01/40 | 12,945,000 | 13,233,026 | ||
| Vocational Education Program, Refunding, Series A, 5.00%, 8/01/46 | 6,005,000 | 6,259,792 | ||
| Vocational Education Program, Series A, 5.125%, 8/01/46 | 7,000,000 | 7,386,680 | ||
| 41,949,726 | ||||
| Tennessee 0.2% | ||||
| Knox County Health Educational and Housing Facility Board Revenue, University Health | ||||
| System Inc., Refunding, 5.25%, 4/01/27 | 17,500,000 | 18,323,725 | ||
| Metropolitan Government of Nashville and Davidson County Water and Sewer Revenue, | ||||
| Refunding, 5.00%, 7/01/40 | 5,000,000 | 5,480,300 | ||
| 23,804,025 |
Annual Report | 39
Franklin Federal Tax-Free Income Fund
Statement of Investments, April 30, 2014 (continued)
| Principal Amount | Value | |||
| Municipal Bonds (continued) | ||||
| Texas 8.8% | ||||
| Allen ISD, GO, Collin County, School Building Unlimited Tax, Series A, 5.00%, 2/15/39 | $ | 11,575,000 | $ | 12,782,273 |
| Austin Community College District Public Facility Corp. Revenue, | ||||
| Educational Facility Project, Round Rock Campus, 5.25%, 8/01/33 | 8,675,000 | 9,610,078 | ||
| Hays New Campus Project, 5.00%, 8/01/36 | 5,700,000 | 6,158,679 | ||
| Austin ISD, GO, Travis County, Refunding, 5.00%, 8/01/33 | 10,000,000 | 10,952,800 | ||
| Austin Water and Wastewater System Revenue, Refunding, Series A, 5.00%, 11/15/38 | 20,000,000 | 21,803,400 | ||
| Bexar County GO, Certificates of Obligation, Combined Flood Control Tax and Revenue, | ||||
| AGMC Insured, 5.00%, 6/15/37 | 20,000,000 | 21,354,000 | ||
| Bexar County Hospital District GO, Certificates of Obligation, Combination Tax and Revenue, | ||||
| 5.00%, 2/15/38 | 10,000,000 | 10,439,500 | ||
| Central Texas Regional Mobility Authority Revenue, senior lien, Refunding, 6.00%, | ||||
| 1/01/41 | 14,000,000 | 15,474,760 | ||
| Corpus Christi Utility System Revenue, | ||||
| Improvement, junior lien, 5.00%, 7/15/38 | 6,000,000 | 6,343,860 | ||
| Improvement, junior lien, 5.00%, 7/15/43 | 7,000,000 | 7,363,020 | ||
| junior lien, Refunding, 5.00%, 7/15/37 | 12,625,000 | 13,480,849 | ||
| Crowley ISD, GO, Tarrant and Johnson Counties, Unlimited Tax School Building, PSF | ||||
| Guarantee, 5.00%, 8/01/36 | 13,900,000 | 15,218,554 | ||
| Dallas Civic Center Revenue, Refunding and Improvement, Assured Guaranty, 5.25%, | ||||
| 8/15/34 | 18,975,000 | 20,325,261 | ||
| Dallas County Utility and Reclamation District GO, Refunding, Series A, AMBAC Insured, | ||||
| 5.375%, 2/15/29 | 28,325,000 | 29,542,125 | ||
| Dallas Waterworks and Sewer System Revenue, Refunding, 5.00%, 10/01/35 | 10,000,000 | 11,034,800 | ||
| Dallas/Fort Worth International Airport Revenue, | ||||
| Joint Improvement, Series A, 5.00%, 11/01/42 | 25,000,000 | 26,241,500 | ||
| Joint, Refunding, Series D, 5.25%, 11/01/32 | 10,000,000 | 11,333,500 | ||
| Denton ISD, GO, School Building, PSF Guarantee, 5.00%, 8/15/38 | 15,710,000 | 16,902,075 | ||
| Ector County ISD, GO, School Building, PSF Guarantee, 5.00%, 8/15/36 | 10,355,000 | 11,541,165 | ||
| Forney ISD, GO, School Building, Series A, PSF Guarantee, 6.00%, 8/15/37 | 2,000,000 | 2,311,240 | ||
| Goose Creek Consolidated ISD, GO, Schoolhouse, PSF Guarantee, 5.00%, 2/15/38 | 6,045,000 | 6,783,155 | ||
| Grand Parkway Transportation Corp. System Toll Revenue, Series B, zero cpn. to 9/30/23, | ||||
| 5.80% thereafter, 10/01/45 | 10,000,000 | 6,682,500 | ||
| Harris County Health Facilities Development Corp. Hospital Revenue, Memorial Hermann | ||||
| Healthcare System, Series B, Pre-Refunded, 7.25%, 12/01/35 | 13,500,000 | 17,157,555 | ||
| Harris County Hospital District Revenue, senior lien, Refunding, Series A, NATL Insured, | ||||
| 5.125%, 2/15/32 | 10,215,000 | 10,663,949 | ||
| Harris County MTA Revenue, Contractual Obligations, Series B, 5.00%, 11/01/33 | 10,000,000 | 10,748,300 | ||
| Hays County GO, Road, 5.00%, 2/15/36 | 6,960,000 | 7,445,112 | ||
| Hidalgo County Regional Mobility Authority Vehicle Registration Revenue, senior lien, | ||||
| Refunding, | ||||
| 5.25%, 12/01/38 | 5,000,000 | 5,513,750 | ||
| 5.00%, 12/01/43 | 5,000,000 | 5,292,250 | ||
| Houston Airport System Revenue, Refunding, second lien, Series A, 5.50%, | ||||
| 7/01/34 | 5,000,000 | 5,460,200 | ||
| 7/01/39 | 30,850,000 | 33,526,546 | ||
| Houston Utility System Revenue, Combined, first lien, Refunding, Series D, 5.00%, | ||||
| 11/15/36 | 10,000,000 | 10,867,800 | ||
| Keller ISD, GO, School Building, 5.50%, 2/15/35 | 10,000,000 | 11,701,300 |
40 | Annual Report
Franklin Federal Tax-Free Income Fund
Statement of Investments, April 30, 2014 (continued)
| Principal Amount | Value | |||
| Municipal Bonds (continued) | ||||
| Texas (continued) | ||||
| Laredo Waterworks Sewer System Revenue, | ||||
| 5.25%, 3/01/40 | $ | 16,535,000 | $ | 18,091,936 |
| AGMC Insured, 5.00%, 3/01/41 | 2,500,000 | 2,626,500 | ||
| Lower Colorado River Authority Revenue, Improvement, Refunding, Series A, NATL Insured, | ||||
| 5.00%, 5/15/26 | 55,000 | 55,113 | ||
| Lower Colorado River Authority Transmission Contract Revenue, LCRA Transmission Services | ||||
| Corp. Project, Refunding, | ||||
| 5.50%, 5/15/36 | 15,310,000 | 16,570,932 | ||
| Series A, 5.00%, 5/15/36 | 10,000,000 | 10,775,000 | ||
| Lufkin Health Facilities Development Corp. Revenue, Memorial Health System of East Texas, | ||||
| Refunding and Improvement, 6.25%, 2/15/37 | 5,000,000 | 5,398,750 | ||
| Manor ISD, GO, School Building, PSF Guarantee, 5.00%, 8/01/37 | 8,175,000 | 8,688,717 | ||
| Matagorda County Hospital District Revenue, FHA Insured, 5.00%, 2/15/35 | 10,000,000 | 10,286,000 | ||
| North Fort Bend Water Authority Water System Revenue, Assured Guaranty, 5.25%, | ||||
| 12/15/34 | 20,000,000 | 21,599,000 | ||
| North Harris County Regional Water Authority Revenue, senior lien, | ||||
| 5.25%, 12/15/33 | 27,000,000 | 29,054,430 | ||
| 5.50%, 12/15/38 | 25,000,000 | 27,000,500 | ||
| North Texas Tollway Authority Revenue, | ||||
| Special Projects System, Capital Appreciation, first tier, Refunding, Series I, zero cpn. to | ||||
| 1/01/15, 6.50% thereafter, 1/01/43 | 25,000,000 | 28,646,250 | ||
| Special Projects System, Capital Appreciation, Series B, zero cpn., 9/01/37 | 7,500,000 | 2,085,600 | ||
| Special Projects System, Capital Appreciation, Series B, zero cpn., 9/01/43 | 7,500,000 | 1,304,775 | ||
| Special Projects System, Capital Appreciation, Series C, zero cpn. to 9/01/21, 6.75% | ||||
| thereafter, 9/01/45 | 25,000,000 | 21,164,750 | ||
| System, first tier, Refunding, Series A, 6.25%, 1/01/39 | 12,500,000 | 14,055,750 | ||
| System, first tier, Refunding, Series A, 5.75%, 1/01/40 | 35,000,000 | 38,832,500 | ||
| System, first tier, Refunding, Series K, Sub Series K-2, 6.00%, 1/01/38 | 15,000,000 | 16,516,050 | ||
| System, second tier, Refunding, Series F, 5.75%, 1/01/38 | 30,000,000 | 32,650,500 | ||
| Port of Houston Authority Harris County GO, Refunding, Series A, 5.625%, 10/01/38 | 14,000,000 | 15,026,900 | ||
| Rio Grande City Consolidated ISD, GO, School Building, PSF Guarantee, 5.00%, 8/15/37 | 10,510,000 | 11,181,694 | ||
| San Antonio Electric and Gas Systems Revenue, junior lien, 5.00%, 2/01/38 | 10,000,000 | 10,846,000 | ||
| San Antonio Public Facilities Corp. Lease Revenue, Refunding and Improvement, Convention | ||||
| Center Refinancing and Expansion Project, 4.00%, | ||||
| 9/15/34 | 9,000,000 | 9,044,190 | ||
| 9/15/42 | 41,000,000 | 38,800,760 | ||
| San Jacinto River Authority Special Project Revenue, Group Project, AGMC Insured, 5.00%, | ||||
| 10/01/32 | 5,000,000 | 5,250,650 | ||
| 10/01/37 | 3,000,000 | 3,122,220 | ||
| Southwest Higher Education Authority Revenue, Southern Methodist University Project, | ||||
| Series A, 5.00%, 10/01/38 | 24,380,000 | 26,715,116 | ||
| Tarrant County Cultural Education Facilities Finance Corp. Hospital Revenue, | ||||
| Cook Children’s Medical Center, Refunding, Series A, 5.25%, 12/01/39 | 10,000,000 | 10,985,700 | ||
| Hendrick Medical Center Obligation Group, Refunding, 5.50%, 9/01/43 | 5,350,000 | 5,595,672 | ||
| Tarrant County Health Facilities Development Corp. Health System Revenue, Harris Methodist | ||||
| Health System, FGIC Insured, ETM, 6.00%, 9/01/24 | 4,000,000 | 4,842,320 | ||
| Tarrant Regional Water District Water Revenue, Refunding and Improvement, 5.00%, | ||||
| 3/01/37 | 10,000,000 | 10,982,300 |
Annual Report | 41
Franklin Federal Tax-Free Income Fund
Statement of Investments, April 30, 2014 (continued)
| Principal Amount | Value | |||
| Municipal Bonds (continued) | ||||
| Texas (continued) | ||||
| Texas City IDC Marine Terminal Revenue, ARCO Pipe Line Co. Project, Refunding, 7.375%, | ||||
| 10/01/20 | $ | 500,000 | $ | 664,355 |
| Texas State GO, Water Financial Assistance, Refunding, Series C-1, 5.00%, 8/01/34 | 7,000,000 | 7,824,880 | ||
| Texas State Municipal Power Agency Revenue, Transmission, sub. lien, Refunding, 5.00%, | ||||
| 9/01/40 | 15,250,000 | 16,093,630 | ||
| Texas State Revenue, Transportation Commission-Mobility Fund, Series A, 5.00%, 4/01/33 | 10,000,000 | 10,884,000 | ||
| Texas State Turnpike Authority Central Turnpike System Revenue, Capital Appreciation, | ||||
| AMBAC Insured, zero cpn., 8/15/31 | 43,500,000 | 15,546,900 | ||
| Texas State University System Financing Revenue, Refunding, AGMC Insured, 5.00%, | ||||
| 3/15/26 | 6,425,000 | 6,866,783 | ||
| Tyler Health Facilities Development Corp. Hospital Revenue, East Texas Medical Center, | ||||
| Regional Healthcare System Project, Refunding and Improvement, Series A, 5.25%, | ||||
| 11/01/32 | 6,250,000 | 6,265,750 | ||
| 933,998,729 | ||||
| Utah 1.4% | ||||
| Intermountain Power Agency Power Supply Revenue, ETM, 6.15%, 7/01/14 | 4,305,000 | 4,337,632 | ||
| Jordan Valley Water Conservancy District Water Revenue, Series B, 5.00%, 10/01/41 | 15,000,000 | 16,159,350 | ||
| Metropolitan Water District Salt Lake and Sandy Water Revenue, Refunding, Series A, 5.00%, | ||||
| 7/01/37 | 13,950,000 | 15,195,456 | ||
| South Valley Water Reclamation Facility Sewer Revenue, AMBAC Insured, 5.00%, | ||||
| 8/15/30 | 5,730,000 | 5,842,652 | ||
| St. George Electric Revenue, AGMC Insured, 5.00%, | ||||
| 6/01/33 | 5,000,000 | 5,212,750 | ||
| 6/01/38 | 5,000,000 | 5,167,050 | ||
| State Board of Regents University of Utah Revenue, General, Refunding, Series A, 5.00%, | ||||
| 8/01/43 | 21,975,000 | 24,101,960 | ||
| Uintah County Municipal Building Authority Lease Revenue, 5.50%, 6/01/37 | 5,000,000 | 5,218,000 | ||
| Utah Associated Municipal Power Systems Revenue, Central St. George Project, Refunding, | ||||
| 5.25%, 12/01/27 | 9,735,000 | 10,387,245 | ||
| Utah State Transit Authority Sales Tax Revenue, Series A, | ||||
| 5.25%, 6/15/38 | 13,185,000 | 14,511,543 | ||
| AGMC Insured, 5.00%, 6/15/36 | 33,000,000 | 36,352,470 | ||
| Weber Basin Water Conservancy District Water Revenue, Series B, 5.00%, 4/01/39 | 7,180,000 | 7,808,609 | ||
| 150,294,717 | ||||
| Vermont 0.6% | ||||
| University of Vermont and State Agricultural College Revenue, Refunding, NATL Insured, | ||||
| 5.00%, 10/01/30 | 12,210,000 | 12,720,134 | ||
| Vermont Educational and Health Buildings Financing Agency Revenue, | ||||
| Hospital, Fletcher Allen Health Care Project, Refunding, Series B, AGMC Insured, 5.00%, | ||||
| 12/01/34 | 5,500,000 | 5,727,700 | ||
| Hospital, Fletcher Allen Health Care Project, Series A, 4.75%, 12/01/36 | 5,000,000 | 5,015,450 | ||
| Middlebury College Project, Refunding, 5.00%, 11/01/38 | 10,000,000 | 10,691,600 | ||
| Middlebury College Project, Refunding, 5.00%, 11/01/40 | 26,565,000 | 28,620,334 | ||
| 62,775,218 |
42 | Annual Report
Franklin Federal Tax-Free Income Fund
Statement of Investments, April 30, 2014 (continued)
| Principal Amount | Value | ||||
| Municipal Bonds (continued) | |||||
| Virginia 0.3% | |||||
| Fairfax County EDA Facility Revenue, Community Services Facilities Project, Series A, | |||||
| 4.50%, 3/01/37 | $ | 11,130,000 | $ | 11,546,373 | |
| Greater Richmond Convention Center Authority Hotel Tax Revenue, Refunding, NATL Insured, | |||||
| 5.00%, 6/15/30 | 6,000,000 | 6,157,860 | |||
| Norfolk Parking System Revenue, Series A, NATL Insured, Pre-Refunded, 5.00%, | |||||
| 2/01/27 | 5,000,000 | 5,177,850 | |||
| Virginia State Resources Authority Infrastructure Revenue, Virginia Pooled Financing Program, | |||||
| Series A, 5.00%, 11/01/39 | 12,355,000 | 13,440,758 | |||
| 36,322,841 | |||||
| Washington 2.9% | |||||
| Bellingham Housing Authority Revenue, Pacific Rim and Cascade Meadows Project, | |||||
| Refunding, NATL Insured, 5.20%, 11/01/27 | 200,000 | 200,330 | |||
| Central Puget Sound Regional Transportation Authority Sales and Use Tax Revenue, Series A, | |||||
| 5.00%, 11/01/34 | 11,405,000 | 12,205,973 | |||
| FYI Properties Lease Revenue, Washington State District Project, 5.50%, | |||||
| 6/01/34 | 11,935,000 | 12,965,826 | |||
| 6/01/39 | 16,250,000 | 17,489,712 | |||
| Goat Hill Properties Lease Revenue, Government Office Building Project, NATL Insured, | |||||
| Pre-Refunded, 5.00%, 12/01/33 | 18,500,000 | 19,016,335 | |||
| King County GO, Sewer Revenues, 5.125%, 1/01/33 | 10,000,000 | 11,287,300 | |||
| King County Public Hospital District No. 1 GO, Series B, 5.25%, 12/01/37 | 5,000,000 | 5,303,950 | |||
| King County Sewer Revenue, Refunding, 5.00%, 1/01/32 | 7,085,000 | 7,758,996 | |||
| NJB Properties Lease Revenue, King County Washington Project, Series A, 5.00%, | |||||
| 12/01/36 | 10,000,000 | 10,717,100 | |||
| Washington State GO, | |||||
| Motor Vehicle Fuel Tax, Senior 520 Corridor Program Toll, Series C, 5.00%, 6/01/33 | 5,000,000 | 5,585,600 | |||
| Motor Vehicle Fuel Tax, Series B-1, 4.00%, 8/01/42 | 14,530,000 | 14,480,453 | |||
| Various Purpose, Series A, 5.00%, 7/01/33 | 44,300,000 | 48,828,346 | |||
| Washington State Health Care Facilities Authority Revenue, | |||||
| Central Washington Health Services Assn., 6.75%, 7/01/29 | 5,000,000 | 5,619,650 | |||
| Fred Hutchinson Cancer Research Center, Refunding, Series A, 6.00%, 1/01/33 | 7,500,000 | 8,137,575 | |||
| MultiCare Health System, Series B, AGMC Insured, 5.00%, 8/15/34 | 17,550,000 | 17,873,095 | |||
| MultiCare Health System, Series B, AGMC Insured, 5.00%, 8/15/41 | 9,170,000 | 9,345,972 | |||
| MultiCare Health System, Series B, Assured Guaranty, 6.00%, 8/15/39 | 1,500,000 | 1,635,405 | |||
| Providence Health and Services, Refunding, Series A, 5.00%, 10/01/42 | 10,175,000 | 10,797,914 | |||
| Providence Health and Services, Refunding, Series A, NATL RE, FGIC Insured, 5.00%, | |||||
| 10/01/36 | 9,750,000 | 9,955,433 | |||
| Providence Health and Services, Refunding, Series C, AGMC Insured, 5.25%, | |||||
| 10/01/33 | 10,000,000 | 10,776,500 | |||
| Providence Health and Services, Series A, FGIC Insured, Pre-Refunded, 5.00%, | |||||
| 10/01/36 | 250,000 | 276,230 | |||
| Virginia Mason Medical Center, Series B, ACA Insured, 6.00%, 8/15/37 | 30,000,000 | 31,616,400 | |||
| Virginia Mason Medical Center, Series C, Radian Insured, 5.50%, 8/15/36 | 16,000,000 | 16,644,640 | |||
| Washington State Higher Education Facilities Authority Revenue, Whitworth University | |||||
| Project, Refunding, | |||||
| 5.375%, 10/01/29 | 3,000,000 | 3,244,050 | |||
| 5.875%, 10/01/34 | 6,000,000 | 6,618,360 |
Annual Report | 43
Franklin Federal Tax-Free Income Fund
Statement of Investments, April 30, 2014 (continued)
| Principal Amount | Value | |||||
| Municipal Bonds (continued) | ||||||
| Washington (continued) | ||||||
| Washington State Public Power Supply System Revenue, Nuclear Project No. 3, Capital | ||||||
| Appreciation, | ||||||
| Refunding, Series B, zero cpn., 7/01/14 | $ | 12,450,000 | $ | 12,446,887 | ||
| Series B, ETM, zero cpn., 7/01/14 | 2,550,000 | 2,549,006 | ||||
| 313,377,038 | ||||||
| West Virginia 0.5% | ||||||
| County Commission of Harrison County Solid Waste Disposal Revenue, Allegheny Energy | ||||||
| Supply Co. LLC Harrison Station Project, Refunding, Series D, 5.50%, 10/15/37 | 9,000,000 | 9,137,610 | ||||
| Pleasants County PCR, County Commission, Series F, 5.25%, 10/15/37 | 14,000,000 | 14,259,700 | ||||
| West Virginia EDA Lottery Revenue, Series A, 5.00%, 6/15/35 | 9,415,000 | 10,414,685 | ||||
| West Virginia State GO, Series A, NATL RE, FGIC Insured, 5.20%, 11/01/26 | 10,000,000 | 11,653,900 | ||||
| West Virginia University Revenue, Improvement, West Virginia University Projects, Series C, | ||||||
| NATL RE, FGIC Insured, Pre-Refunded, 5.00%, 10/01/34 | 10,000,000 | 10,196,500 | ||||
| 55,662,395 | ||||||
| Wisconsin 0.8% | ||||||
| Monroe RDAR, 6.00%, 2/15/39 | 11,790,000 | 12,614,946 | ||||
| Wisconsin State General Fund Annual Appropriation Revenue, Series A, 6.00%, 5/01/33 | 25,290,000 | 29,780,998 | ||||
| Wisconsin State Health and Educational Facilities Authority Revenue, | ||||||
| Marquette University, Refunding, Series B-1, 5.00%, 10/01/30 | 6,865,000 | 7,405,276 | ||||
| Marquette University, Refunding, Series B-1, 5.00%, 10/01/33 | 1,500,000 | 1,599,840 | ||||
| Marquette University, Refunding, Series B-2, 5.00%, 10/01/30 | 3,470,000 | 3,743,089 | ||||
| Marquette University, Series B-3, 5.00%, 10/01/30 | 2,150,000 | 2,319,205 | ||||
| Marquette University, Series B-3, 5.00%, 10/01/33 | 1,750,000 | 1,866,480 | ||||
| Ministry Health Care Inc., AGMC Insured, 5.00%, 8/01/31 | 1,500,000 | 1,585,545 | ||||
| Ministry Health Care Inc., AGMC Insured, 5.00%, 8/01/34 | 8,000,000 | 8,187,600 | ||||
| Thedacare Inc., AMBAC Insured, 5.00%, 12/15/30 | 10,000,000 | 10,216,900 | ||||
| Thedacare Inc., Series A, 5.50%, 12/15/38 | 5,000,000 | 5,357,800 | ||||
| 84,677,679 | ||||||
| Wyoming 0.1% | ||||||
| Campbell County Solid Waste Facilities Revenue, Basin Electric Power Cooperative, Dry Fork | ||||||
| Station Facilities, Series A, 5.75%, 7/15/39 | 5,500,000 | 6,060,835 | ||||
| U.S. Territories 2.9% | ||||||
| Puerto Rico 2.8% | ||||||
| Children’s Trust Fund Tobacco Settlement Revenue, Asset-Backed, Refunding, 5.375%, | ||||||
| 5/15/33 | 15,740,000 | 15,739,213 | ||||
| Puerto Rico Commonwealth Highways and Transportation Authority Highway Revenue, | ||||||
| Series Y, Pre-Refunded, | ||||||
| 5.00%, 7/01/36 | 62,000,000 | 68,227,900 | ||||
| 5.50%, 7/01/36 | 7,000,000 | 7,778,260 | ||||
| Puerto Rico Commonwealth Highways and Transportation Authority Transportation Revenue, | ||||||
| Refunding, Series K, 5.00%, 7/01/30 | 19,190,000 | 10,011,039 | ||||
| Puerto Rico Electric Power Authority Power Revenue, | ||||||
| Refunding, Series A, 5.00%, 7/01/42 | 18,925,000 | 11,073,207 | ||||
| Series XX, 5.25%, 7/01/40 | 15,000,000 | 8,812,500 | ||||
| Puerto Rico Industrial Tourist Educational Medical and Environmental Control Facilities | ||||||
| Financing Authority Industrial Revenue, Guaynabo Warehouse for Emergencies Project, | ||||||
| Series A, 5.15%, 7/01/19 | 595,000 | 497,521 | ||||
| 44 | | | Annual Report |
Franklin Federal Tax-Free Income Fund
Statement of Investments, April 30, 2014 (continued)
| Principal Amount | Value | |||
| Municipal Bonds (continued) | ||||
| U.S. Territories (continued) | ||||
| Puerto Rico (continued) | ||||
| Puerto Rico PBA Guaranteed Revenue, Government Facilities, Refunding, | ||||
| Series D, 5.25%, 7/01/27 | $ | 3,265,000 | $ | 2,371,696 |
| Series N, 5.00%, 7/01/37 | 20,000,000 | 13,499,000 | ||
| Puerto Rico Public Finance Corp. Revenue, Commonwealth Appropriation, Refunding, | ||||
| Series B, 5.50%, 8/01/31 | 21,000,000 | 13,001,730 | ||
| Puerto Rico Sales Tax FICO Sales Tax Revenue, | ||||
| Capital Appreciation, first subordinate, Series A, zero cpn. to 8/01/16, 6.75% thereafter, | ||||
| 8/01/32 | 25,000,000 | 19,127,750 | ||
| Capital Appreciation, first subordinate, Series A, zero cpn. to 8/01/19, 6.25% thereafter, | ||||
| 8/01/33 | 36,500,000 | 20,388,900 | ||
| first subordinate, Series A, 5.50%, 8/01/42 | 40,000,000 | 29,559,200 | ||
| first subordinate, Series A, 6.00%, 8/01/42 | 22,500,000 | 17,902,800 | ||
| first subordinate, Series C, 5.50%, 8/01/40 | 50,000,000 | 37,230,000 | ||
| Refunding, Senior Series C, 5.00%, 8/01/40 | 27,825,000 | 22,216,871 | ||
| Senior Series C, 5.25%, 8/01/40 | 7,150,000 | 5,853,491 | ||
| 303,291,078 | ||||
| U.S. Virgin Islands 0.1% | ||||
| Virgin Islands PFAR, Virgin Islands Matching Fund Loan Note, Working Capital, sub. lien, | ||||
| Refunding, Series B, 5.25%, 10/01/29 | 5,750,000 | 6,016,742 | ||
| Total U.S. Territories | 309,307,820 | |||
| Total Municipal Bonds (Cost $9,678,932,307) 97.1% | 10,366,791,974 | |||
| Other Assets, less Liabilities 2.9% | 311,278,593 | |||
| Net Assets 100.0% | $ | 10,678,070,567 | ||
| See Abbreviations on page 57. | ||||
Annual Report | The accompanying notes are an integral part of these financial statements. | 45
Franklin Federal Tax-Free Income Fund
Financial Statements
Statement of Assets and Liabilities
April 30, 2014
| Assets: | ||||
| Investments in securities: | ||||
| Cost | $ | 9,678,932,307 | ||
| Value | $ | 10,366,791,974 | ||
| Cash | 147,343,633 | |||
| Receivables: | ||||
| Investment securities sold | 19,594,250 | |||
| Capital shares sold | 15,908,928 | |||
| Interest | 147,585,798 | |||
| Other assets | 6,159 | |||
| Total assets | 10,697,230,742 | |||
| Liabilities: | ||||
| Payables: | ||||
| Capital shares redeemed | 12,456,393 | |||
| Management fees | 3,991,995 | |||
| Distribution fees | 1,269,878 | |||
| Transfer agent fees | 1,033,675 | |||
| Accrued expenses and other liabilities | 408,234 | |||
| Total liabilities | 19,160,175 | |||
| Net assets, at value | $ | 10,678,070,567 | ||
| Net assets consist of: | ||||
| Paid-in capital | $ | 10,163,218,544 | ||
| Undistributed net investment income | 8,148,516 | |||
| Net unrealized appreciation (depreciation) | 687,859,667 | |||
| Accumulated net realized gain (loss) | (181,156,160 | ) | ||
| Net assets, at value | $ | 10,678,070,567 | ||
| Class A: | ||||
| Net assets, at value | $ | 8,243,366,887 | ||
| Shares outstanding | 674,777,337 | |||
| Net asset value per sharea | $ | 12.22 | ||
| Maximum offering price per share (net asset value per share ÷ 95.75%) | $ | 12.76 | ||
| Class C: | ||||
| Net assets, at value | $ | 1,120,470,676 | ||
| Shares outstanding | 91,785,965 | |||
| Net asset value and maximum offering price per sharea | $ | 12.21 | ||
| Advisor Class: | ||||
| Net assets, at value | $ | 1,314,233,004 | ||
| Shares outstanding | 107,499,542 | |||
| Net asset value and maximum offering price per share | $ | 12.23 | ||
| aRedemption price is equal to net asset value less contingent deferred sales charges, if applicable. | ||||
46 | The accompanying notes are an integral part of these financial statements. | Annual Report
Franklin Federal Tax-Free Income Fund
Financial Statements (continued)
Statement of Operations
for the year ended April 30, 2014
| Investment income: | |||
| Interest | $ | 523,426,399 | |
| Expenses: | |||
| Management fees (Note 3a) | 49,250,086 | ||
| Distribution fees: (Note 3c) | |||
| Class A | 8,301,549 | ||
| Class C | 7,933,645 | ||
| Transfer agent fees: (Note 3e) | |||
| Class A | 5,063,493 | ||
| Class C | 743,343 | ||
| Advisor Class | 929,544 | ||
| Custodian fees | 97,467 | ||
| Reports to shareholders | 421,136 | ||
| Registration and filing fees | 509,028 | ||
| Professional fees | 165,205 | ||
| Trustees’ fees and expenses | 124,429 | ||
| Other | 441,160 | ||
| Total expenses | 73,980,085 | ||
| Net investment income | 449,446,314 | ||
| Realized and unrealized gains (losses): | |||
| Net realized gain (loss) from investments | (133,548,602 | ) | |
| Net change in unrealized appreciation (depreciation) on investments | (477,200,838 | ) | |
| Net realized and unrealized gain (loss) | (610,749,440 | ) | |
| Net increase (decrease) in net assets resulting from operations | $ | (161,303,126 | ) |
Annual Report | The accompanying notes are an integral part of these financial statements. | 47
Franklin Federal Tax-Free Income Fund
Financial Statements (continued)
| Statements of Changes in Net Assets | ||||||
| Year Ended April 30, | ||||||
| 2014 | 2013 | |||||
| Increase (decrease) in net assets: | ||||||
| Operations: | ||||||
| Net investment income | $ | 449,446,314 | $ | 453,034,131 | ||
| Net realized gain (loss) from investments | (133,548,602 | ) | (4,415,893 | ) | ||
| Net change in unrealized appreciation (depreciation) on investments | (477,200,838 | ) | 291,551,990 | |||
| Net increase (decrease) in net assets resulting from operations | (161,303,126 | ) | 740,170,228 | |||
| Distributions to shareholders from: | ||||||
| Net investment income: | ||||||
| Class A | (338,916,803 | ) | (346,901,032 | ) | ||
| Class B | — | (159,375 | ) | |||
| Class C | (43,100,658 | ) | (46,966,222 | ) | ||
| Advisor Class | (63,773,911 | ) | (60,078,936 | ) | ||
| Total distributions to shareholders | (445,791,372 | ) | (454,105,565 | ) | ||
| Capital share transactions: (Note 2) | ||||||
| Class A | (730,497,906 | ) | 439,110,665 | |||
| Class B | — | (10,120,888 | ) | |||
| Class C | (326,845,365 | ) | 172,320,075 | |||
| Advisor Class | (353,200,936 | ) | 330,523,371 | |||
| Total capital share transactions | (1,410,544,207 | ) | 931,833,223 | |||
| Net increase (decrease) in net assets | (2,017,638,705 | ) | 1,217,897,886 | |||
| Net assets: | ||||||
| Beginning of year | 12,695,709,272 | 11,477,811,386 | ||||
| End of year | $ | 10,678,070,567 | $ | 12,695,709,272 | ||
| Undistributed net investment income included in net assets: | ||||||
| End of year | $ | 8,148,516 | $ | 4,747,623 | ||
48 | The accompanying notes are an integral part of these financial statements. | Annual Report
Franklin Federal Tax-Free Income Fund
Notes to Financial Statements
1. ORGANIZATION AND SIGNIFICANT ACCOUNT POLICIES
Franklin Federal Tax-Free Income Fund (Fund) is registered under the Investment Company Act of 1940, as amended, (1940 Act) as an open-end management investment company. The Fund offers three classes of shares: Class A, Class C, and Advisor Class. Each class of shares differs by its initial sales load, contingent deferred sales charges, voting rights on matters affecting a single class, its exchange privilege and fees primarily due to differing arrangements for distribution and transfer agent fees.
The following summarizes the Fund’s significant accounting policies.
a. Financial Instrument Valuation
The Fund’s investments in financial instruments are carried at fair value daily. Fair value is the price that would be received to sell an asset or paid to transfer a liability in an orderly transaction between market participants on the measurement date. The Fund calculates the net asset value per share at the close of the New York Stock Exchange (NYSE), generally at 4 p.m. Eastern time (NYSE close) on each day the NYSE is open for trading. Under procedures approved by the Fund’s Board of Trustees (the Board), the Fund’s administrator, investment manager and other affiliates have formed the Valuation and Liquidity Oversight Committee (VLOC). The VLOC provides administration and oversight of the Fund’s valuation policies and procedures, which are approved annually by the Board. Among other things, these procedures allow the Fund to utilize independent pricing services, quotations from securities and financial instrument dealers, and other market sources to determine fair value.
Debt securities generally trade in the over-the-counter market rather than on a securities exchange. The Fund’s pricing services use multiple valuation techniques to determine fair value. In instances where sufficient market activity exists, the pricing services may utilize a market-based approach through which quotes from market makers are used to determine fair value. In instances where sufficient market activity may not exist or is limited, the pricing services also utilize proprietary valuation models which may consider market characteristics such as benchmark yield curves, credit spreads, estimated default rates, anticipated market interest rate volatility, coupon rates, anticipated timing of principal repayments, underlying collateral, and other unique security features in order to estimate the relevant cash flows, which are then discounted to calculate the fair value.
The Fund has procedures to determine the fair value of financial instruments for which market prices are not reliable or readily available. Under these procedures, the VLOC convenes on a regular basis to review such financial instruments and considers a number of factors, including significant unobservable valuation inputs, when arriving at fair value. The VLOC primarily employs a market-based approach which may use related or comparable assets or liabilities, recent transactions, market multiples, book values, and other relevant information for the investment to determine the fair value of the investment. An income-based valuation approach
Annual Report | 49
Franklin Federal Tax-Free Income Fund
Notes to Financial Statements (continued)
| 1. | ORGANIZATION AND SIGNIFICANT ACCOUNT POLICIES (continued) |
| a. | Financial Instrument Valuation (continued) |
may also be used in which the anticipated future cash flows of the investment are discounted to calculate fair value. Discounts may also be applied due to the nature or duration of any restrictions on the disposition of the investments. Due to the inherent uncertainty of valuations of such investments, the fair values may differ significantly from the values that would have been used had an active market existed. The VLOC employs various methods for calibrating these valuation approaches including a regular review of key inputs and assumptions, transactional back-testing or disposition analysis, and reviews of any related market activity.
b. Income Taxes
It is the Fund’s policy to qualify as a regulated investment company under the Internal Revenue Code. The Fund intends to distribute to shareholders substantially all of its income and net realized gains to relieve it from federal income and excise taxes. As a result, no provision for U.S. federal income taxes is required.
The Fund recognizes the tax benefits of uncertain tax positions only when the position is “more likely than not” to be sustained upon examination by the tax authorities based on the technical merits of the tax position. As of April 30, 2014, and for all open tax years, the Fund has determined that no liability for unrecognized tax benefits is required in the Fund’s financial statements related to uncertain tax positions taken on a tax return (or expected to be taken on future tax returns). Open tax years are those that remain subject to examination and are based on each tax jurisdiction statute of limitation.
c. Security Transactions, Investment Income, Expenses and Distributions
Security transactions are accounted for on trade date. Realized gains and losses on security transactions are determined on a specific identification basis. Interest income and estimated expenses are accrued daily. Amortization of premium and accretion of discount on debt securities are included in interest income. Distributions to shareholders are recorded on the ex-dividend date and are determined according to income tax regulations (tax basis). Distributable earnings determined on a tax basis may differ from earnings recorded in accordance with accounting principles generally accepted in the United States of America. These differences may be permanent or temporary. Permanent differences are reclassified among capital accounts to reflect their tax character. These reclassifications have no impact on net assets or the results of operations. Temporary differences are not reclassified, as they may reverse in subsequent periods.
Realized and unrealized gains and losses and net investment income, not including class specific expenses, are allocated daily to each class of shares based upon the relative proportion of net assets of each class. Differences in per share distributions, by class, are generally due to differences in class specific expenses.
50 | Annual Report
Franklin Federal Tax-Free Income Fund
Notes to Financial Statements (continued)
| 1. | ORGANIZATION AND SIGNIFICANT ACCOUNT POLICIES (continued) |
| d. | Insurance |
The scheduled payments of interest and principal for each insured municipal security in the Fund are insured by either a new issue insurance policy or a secondary insurance policy. Some municipal securities in the Fund are secured by collateral guaranteed by an agency of the U.S. government. Depending on the type of coverage, premiums for insurance are either added to the cost basis of the security or paid by a third party.
Insurance companies typically insure municipal bonds that tend to be of very high quality, with the majority of underlying municipal bonds rated A or better. However, an event involving an insurer could have an adverse effect on the value of the securities insured by that insurance company. There is no guarantee the insurer will be able to fulfill its obligations under the terms of the policy.
e. Accounting Estimates
The preparation of financial statements in accordance with accounting principles generally accepted in the United States of America requires management to make estimates and assumptions that affect the reported amounts of assets and liabilities at the date of the financial statements and the amounts of income and expenses during the reporting period. Actual results could differ from those estimates.
f. Guarantees and Indemnifications
Under the Fund’s organizational documents, its officers and trustees are indemnified by the Fund against certain liabilities arising out of the performance of their duties to the Fund. Additionally, in the normal course of business, the Fund enters into contracts with service providers that contain general indemnification clauses. The Fund’s maximum exposure under these arrangements is unknown as this would involve future claims that may be made against the Fund that have not yet occurred. Currently, the Fund expects the risk of loss to be remote.
2. SHARES OF BENEFICIAL INTEREST
At April 30, 2014, there were an unlimited number of shares authorized (without par value).
Transactions in the Fund’s shares were as follows:
| Year Ended April 30, | ||||||||||
| 2014 | 2013 | a | ||||||||
| Shares | Amount | Shares | Amount | |||||||
| Class A Shares: | ||||||||||
| Shares sold | 126,987,593 | $ | 1,512,426,000 | 108,067,502 | $ | 1,374,998,094 | ||||
| Shares issued in reinvestment | ||||||||||
| of distributions | 24,038,774 | 287,863,451 | 22,378,223 | 283,844,703 | ||||||
| Shares redeemed | (212,506,889 | ) | (2,530,787,357 | ) | (95,883,553 | ) | (1,219,732,132 | ) | ||
| Net increase (decrease) | (61,480,522 | ) | $ | (730,497,906 | ) | 34,562,172 | $ | 439,110,665 | ||
Annual Report | 51
Franklin Federal Tax-Free Income Fund
Notes to Financial Statements (continued)
| 2. SHARES OF BENEFICIAL INTEREST (continued) | |||||||||||
| Year Ended April 30, | |||||||||||
| 2014 | 2013 | a | |||||||||
| Shares | Amount | Shares | Amount | ||||||||
| Class B Shares: | |||||||||||
| Shares sold | 18,109 | $ | 229,907 | ||||||||
| Shares issued in reinvestment of | |||||||||||
| distributions | 11,184 | 141,422 | |||||||||
| Shares redeemed | (823,586 | ) | (10,492,217 | ) | |||||||
| Net increase (decrease) | (794,293 | ) | $ | (10,120,888 | ) | ||||||
| Class C Shares: | |||||||||||
| Shares sold | 11,234,248 | $ | 135,129,834 | 27,019,793 | $ | 343,371,936 | |||||
| Shares issued in reinvestment | |||||||||||
| of distributions | 3,049,740 | 36,536,890 | 3,053,658 | 38,720,936 | |||||||
| Shares redeemed | (41,853,867 | ) | (498,512,089 | ) | (16,506,185 | ) | (209,772,797 | ) | |||
| Net increase (decrease) | (27,569,879 | ) | $ | (326,845,365 | ) | 13,567,266 | $ | 172,320,075 | |||
| Advisor Class Shares: | |||||||||||
| Shares sold | 46,340,565 | $ | 555,154,397 | 52,529,184 | $ | 669,189,921 | |||||
| Shares issued in reinvestment | |||||||||||
| of distributions | 4,782,816 | 57,278,697 | 4,196,412 | 53,270,859 | |||||||
| Shares redeemed | (80,833,312 | ) | (965,634,030 | ) | (30,788,474 | ) | (391,937,409 | ) | |||
| Net increase (decrease) | (29,709,931 | ) | $ | (353,200,936 | ) | 25,937,122 | $ | 330,523,371 | |||
| aEffective March 21, 2013, all Class B shares were converted to Class A. | |||||||||||
3. TRANSACTIONS WITH AFFILIATES
Franklin Resources, Inc. is the holding company for various subsidiaries that together are referred to as Franklin Templeton Investments. Certain officers and trustees of the Fund are also officers and/or directors of the following subsidiaries:
| Subsidiary | Affiliation |
| Franklin Advisers, Inc. (Advisers) | Investment manager |
| Franklin Templeton Services, LLC (FT Services) | Administrative manager |
| Franklin Templeton Distributors, Inc. (Distributors) | Principal underwriter |
| Franklin Templeton Investor Services, LLC (Investor Services) | Transfer agent |
52 | Annual Report
Franklin Federal Tax-Free Income Fund
Notes to Financial Statements (continued)
| 3. | TRANSACTIONS WITH AFFILIATES (continued) |
| a. | Management Fees |
The Fund pays an investment management fee to Advisers based on the month-end net assets of the Fund as follows:
| Annualized Fee Rate | Net Assets | |
| 0.625 | % | Up to and including $100 million |
| 0.500 | % | Over $100 million, up to and including $250 million |
| 0.450 | % | Over $250 million, up to and including $7.5 billion |
| 0.440 | % | Over $7.5 billion, up to and including $10 billion |
| 0.430 | % | Over $10 billion, up to and including $12.5 billion |
| 0.420 | % | Over $12.5 billion, up to and including $15 billion |
| 0.400 | % | Over $15 billion, up to and including $17.5 billion |
| 0.380 | % | Over $17.5 billion, up to and including $20 billion |
| 0.360 | % | In excess of $20 billion |
b. Administrative Fees
Under an agreement with Advisers, FT Services provides administrative services to the Fund. The fee is paid by Advisers based on the Fund’s average daily net assets, and is not an additional expense of the Fund.
c. Distribution Fees
The Board has adopted distribution plans for each share class, with the exception of Advisor Class shares, pursuant to Rule 12b-1 under the 1940 Act. Distribution fees are not charged on shares held by affiliates. Under the Fund’s Class A reimbursement distribution plan, the Fund reimburses Distributors for costs incurred in connection with the servicing, sale and distribution of the Fund’s shares up to the maximum annual plan rate. Under the Class A reimbursement distribution plan, costs exceeding the maximum for the current plan year cannot be reimbursed in subsequent periods. In addition, under the Fund’s Class C compensation distribution plan, the Fund pays Distributors for costs incurred in connection with the servicing, sale and distribution of the Fund’s shares up to the maximum annual plan rate. The plan year, for purposes of monitoring compliance with the maximum annual plan rate, is February 1 through January 31.
The maximum annual plan rates, based on the average daily net assets, for each class, are as follows:
| Class A | 0.10 | % |
| Class C | 0.65 | % |
Annual Report | 53
Franklin Federal Tax-Free Income Fund
Notes to Financial Statements (continued)
| 3. | TRANSACTIONS WITH AFFILIATES (continued) |
| d. | Sales Charges/Underwriting Agreements |
Front-end sales charges and contingent deferred sales charges (CDSC) do not represent expenses of the Fund. These charges are deducted from the proceeds of sales of Fund shares prior to investment or from redemption proceeds prior to remittance, as applicable. Distributors has advised the Fund of the following commission transactions related to the sales and redemptions of the Fund’s shares for the year:
| Sales charges retained net of commissions paid to unaffiliated | ||
| broker/dealers | $ | 1,179,248 |
| CDSC retained | $ | 454,141 |
e. Transfer Agent Fees
Each class of shares pays transfer agent fees to Investor Services for its performance of shareholder servicing obligations and reimburses Investor Services for out of pocket expenses incurred, including shareholding servicing fees paid to third parties. These fees are allocated daily based upon their relative proportion of such classes’ aggregate net assets.
For the year ended April 30, 2014, the Fund paid transfer agent fees of $6,736,380, of which $2,203,726 was retained by Investor Services.
4. INCOME TAXES
For tax purposes, capital losses may be carried over to offset future capital gains. Capital loss carryforwards with no expiration, if any, must be fully utilized before those losses with expiration dates.
At April 30, 2014, the capital loss carryforwards were as follows:
| Capital loss carryforwards subject to expiration: | ||
| 2017 | $ | 15,858,622 |
| 2018 | 3,803,336 | |
| 2019 | 17,435,155 | |
| Capital loss carryforwards not subject to expiration: | ||
| Short term | 88,398,022 | |
| Long term | 50,032,740 | |
| Total capital loss carryforwards | $ | 175,527,875 |
The tax character of distributions paid during the years ended April 30, 2014 and 2013, was as follows:
| 2014 | 2013 | |||
| Distributions paid from tax exempt income | $ | 445,791,372 | $ | 454,105,565 |
54 | Annual Report
Franklin Federal Tax-Free Income Fund
Notes to Financial Statements (continued)
4. INCOME TAXES (continued)
At April 30, 2014, the cost of investments, net unrealized appreciation (depreciation), undistributed tax exempt and ordinary income for income tax purposes were as follows:
| Cost of investments | $ | 9,683,230,582 | |
| Unrealized appreciation | $ | 786,935,501 | |
| Unrealized depreciation | (103,374,109 | ) | |
| Net unrealized appreciation (depreciation) | $ | 683,561,392 | |
| Undistributed tax exempt income | $ | 6,657,537 | |
| Undistributed ordinary income | 160,961 | ||
| Distributable earnings | $ | 6,818,498 | |
Differences between income and/or capital gains as determined on a book basis and a tax basis are primarily due to differing treatments of bond discounts and wash sales.
5. INVESTMENT TRANSACTIONS
Purchases and sales of investments (excluding short term securities) for the year ended April 30, 2014, aggregated $929,201,415 and $2,349,403,791, respectively.
6. CREDIT FACILITY
The Fund, together with other U.S. registered and foreign investment funds (collectively, Borrowers), managed by Franklin Templeton Investments, are borrowers in a joint syndicated senior unsecured credit facility totaling $1.5 billion (Global Credit Facility) which matures on February 13, 2015. This Global Credit Facility provides a source of funds to the Borrowers for temporary and emergency purposes, including the ability to meet future unanticipated or unusually large redemption requests.
Under the terms of the Global Credit Facility, the Fund shall, in addition to interest charged on any borrowings made by the Fund and other costs incurred by the Fund, pay its share of fees and expenses incurred in connection with the implementation and maintenance of the Global Credit Facility, based upon its relative share of the aggregate net assets of all of the Borrowers, including an annual commitment fee of 0.07% based upon the unused portion of the Global Credit Facility. These fees are reflected in other expenses on the Statement of Operations. During the year ended April 30, 2014, the Fund did not use the Global Credit Facility.
Annual Report | 55
Franklin Federal Tax-Free Income Fund
Notes to Financial Statements (continued)
7. FAIR VALUE MEASUREMENTS
The Fund follows a fair value hierarchy that distinguishes between market data obtained from independent sources (observable inputs) and the Fund’s own market assumptions (unobservable inputs). These inputs are used in determining the value of the Fund’s financial instruments and are summarized in the following fair value hierarchy:
- Level 1 – quoted prices in active markets for identical financial instruments
- Level 2 – other significant observable inputs (including quoted prices for similar financial instruments, interest rates, prepayment speed, credit risk, etc.)
- Level 3 – significant unobservable inputs (including the Fund’s own assumptions in determining the fair value of financial instruments)
The input levels are not necessarily an indication of the risk or liquidity associated with financial instruments at that level
For movements between the levels within the fair value hierarchy, the Fund has adopted a policy of recognizing the transfers as of the date of the underlying event which caused the movement.
At April 30, 2014, all of the Fund’s investments in financial instruments carried at fair value were valued using Level 2 inputs.
8. NEW ACCOUNTING PRONOUNCEMENTS
In June 2013, the Financial Accounting Standards Board issued Accounting Standards Update (ASU) No. 2013-08, Investment Companies (Topic 946): Amendments to the Scope, Measurement, and Disclosure Requirements. The ASU modifies the criteria used in defining an investment company under U.S. Generally Accepted Accounting Principles and also sets forth certain measurement and disclosure requirements. Under the ASU, an entity that is registered under the 1940 Act automatically qualifies as an investment company. The ASU is effective for interim and annual reporting periods beginning after December 15, 2013. Management has reviewed the requirements and believes the adoption of this ASU will not have a material impact on the financial statements.
9. SUBSEQUENT EVENTS
The Fund has evaluated subsequent events through the issuance of the financial statements and determined that no events have occurred that require disclosure.
56 | Annual Report
Franklin Federal Tax-Free Income Fund
Notes to Financial Statements (continued)
ABBREVIATIONS
Selected Portfolio
| ACA | - | American Capital Access Holdings Inc. |
| AGMC | - | Assured Guaranty Municipal Corp. |
| AMBAC | - | American Municipal Bond Assurance Corp. |
| BHAC | - | Berkshire Hathaway Assurance Corp. |
| CDA | - | Community Development Authority/Agency |
| CIFG | - | CDC IXIS Financial Guaranty |
| COP | - | Certificate of Participation |
| EDA | - | Economic Development Authority |
| EDC | - | Economic Development Corp. |
| ETM | - | Escrow to Maturity |
| FGIC | - | Financial Guaranty Insurance Co. |
| FHA | - | Federal Housing Authority/Agency |
| FICO | - | Financing Corp. |
| GNMA | - | Government National Mortgage Association |
| GO | - | General Obligation |
| HDA | - | Housing Development Authority/Agency |
| HFA | - | Housing Finance Authority/Agency |
| HFAR | - | Housing Finance Authority Revenue |
| HFC | - | Housing Finance Corp. |
| IDA | - | Industrial Development Authority/Agency |
| IDB | - | Industrial Development Bond/Board |
| IDC | - | Industrial Development Corp. |
| ISD | - | Independent School District |
| MFHR | - | Multi-Family Housing Revenue |
| MFR | - | Multi-Family Revenue |
| MTA | - | Metropolitan Transit Authority |
| NATL | - | National Public Financial Guarantee Corp. |
| NATL RE | - | National Public Financial Guarantee Corp. Reinsured |
| PBA | - | Public Building Authority |
| PCC | - | Pollution Control Corp. |
| PCR | - | Pollution Control Revenue |
| PFAR | - | Public Financing Authority Revenue |
| PSF | - | Permanent School Fund |
| RDA | - | Redevelopment Agency/Authority |
| RDAR | - | Redevelopment Agency Revenue |
| SFMR | - | Single Family Mortgage Revenue |
| UHSD | - | Unified/Union High School District |
| USD | - | Unified/Union School District |
| XLCA | - | XL Capital Assurance |
Annual Report | 57
Franklin Federal Tax-Free Income Fund
Report of Independent Registered Public Accounting Firm
To the Board of Trustees and Shareholders of Franklin Federal Tax-Free Income Fund
In our opinion, the accompanying statement of assets and liabilities, including the statement of investments, and the related statements of operations and of changes in net assets and the financial highlights present fairly, in all material respects, the financial position of The Franklin Federal Tax-Free Income Fund (the “Fund”) at April 30, 2014, the results of its operations for the year then ended, the changes in its net assets for each of the two years in the period then ended and the financial highlights for each of the five years in the period then ended, in conformity with accounting principles generally accepted in the United States of America. These financial statements and financial highlights (hereafter referred to as “financial statements”) are the responsibility of the Fund’s management. Our responsibility is to express an opinion on these financial statements based on our audits. We conducted our audits of these financial statements in accordance with the standards of the Public Company Accounting Oversight Board (United States). Those standards require that we plan and perform the audit to obtain reasonable assurance about whether the financial statements are free of material misstatement. An audit includes examining, on a test basis, evidence supporting the amounts and disclosures in the financial statements, assessing the accounting principles used and significant estimates made by management, and evaluating the overall financial statement presentation. We believe that our audits, which included confirmation of securities at April 30, 2014 by correspondence with the custodian and brokers, provide a reasonable basis for our opinion.
PricewaterhouseCoopers LLP
San Francisco, California
June 13, 2014
58 | Annual Report
Franklin Federal Tax-Free Income Fund
Tax Information (unaudited)
Under Section 852(b)(5)(A) of the Internal Revenue Code, the Fund hereby reports 100% of the distributions paid from net investment income as exempt-interest dividends for the fiscal year ended April 30, 2014. A portion of the Fund’s exempt-interest dividends may be subject to the federal alternative minimum tax. By mid-February 2015, shareholders will be notified of amounts for use in preparing their 2014 income tax returns.
Annual Report | 59
Franklin Federal Tax-Free Income Fund
Board Members and Officers
The name, year of birth and address of the officers and board members, as well as their affiliations, positions held with the Trust, principal occupations during at least the past five years and number of portfolios overseen in the Franklin Templeton Investments fund complex are shown below. Generally, each board member serves until that person’s successor is elected and qualified.
| Independent Board Members | ||||
| Number of Portfolios in | ||||
| Name, Year of Birth | Length of | Fund Complex Overseen | Other Directorships Held | |
| and Address | Position | Time Served | by Board Member* | During at Least the Past 5 Years |
| Harris J. Ashton (1932) | Trustee | Since 1982 | 139 | Bar-S Foods (meat packing company) |
| One Franklin Parkway | (1981-2010). | |||
| San Mateo, CA 94403-1906 | ||||
Principal Occupation During at Least the Past 5 Years:
Director of various companies; and formerly, Director, RBC Holdings, Inc. (bank holding company) (until 2002); and President, Chief Executive Officer and Chairman of the Board, General Host Corporation (nursery and craft centers) (until 1998).
| Sam Ginn (1937) | Trustee | Since 2007 | 113 | ICO Global Communications |
| One Franklin Parkway | (Holdings) Limited (satellite company) | |||
| San Mateo, CA 94403-1906 | (2006-2010), Chevron Corporation | |||
| (global energy company) (1989-2009), | ||||
| Hewlett-Packard Company (technology | ||||
| company) (1996-2002), Safeway, Inc. | ||||
| (grocery retailer) (1991-1998) and | ||||
| TransAmerica Corporation (insurance | ||||
| company) (1989-1999). |
Principal Occupation During at Least the Past 5 Years:
Private investor; Chairman, First Responder Network Authority (FirstNet) (interoperable wireless broadband network) (2012); and formerly, Chairman of the Board, Vodafone AirTouch, PLC (wireless company) (1999-2000); Chairman of the Board and Chief Executive Officer, AirTouch Communications (cellular communications) (1993-1998) and Pacific Telesis Group (telephone holding company) (1988-1994).
| Edith E. Holiday (1952) | Trustee | Since 2005 | 139 | Hess Corporation (exploration and |
| One Franklin Parkway | refining of oil and gas), H.J. Heinz | |||
| San Mateo, CA 94403-1906 | Company (processed foods and | |||
| allied products) (1994-2013), RTI | ||||
| International Metals, Inc. (manu- | ||||
| facture and distribution of titanium), | ||||
| Canadian National Railway (railroad) | ||||
| and White Mountains Insurance | ||||
| Group, Ltd. (holding company). |
Principal Occupation During at Least the Past 5 Years:
Director or Trustee of various companies and trusts; and formerly, Assistant to the President of the United States and Secretary of the Cabinet (1990-1993); General Counsel to the United States Treasury Department (1989-1990); and Counselor to the Secretary and Assistant Secretary for Public Affairs and Public Liaison – United States Treasury Department (1988-1989).
| J. Michael Luttig (1954) | Trustee | Since 2009 | 139 | Boeing Capital Corporation (aircraft |
| One Franklin Parkway | financing) (2006-2013). | |||
| San Mateo, CA 94403-1906 |
Principal Occupation During at Least the Past 5 Years:
Executive Vice President, General Counsel and member of the Executive Council, The Boeing Company (aerospace company); and formerly, Federal Appeals Court Judge, U.S. Court of Appeals for the Fourth Circuit (1991-2006).
60 | Annual Report
| Number of Portfolios in | ||||
| Name, Year of Birth | Length of | Fund Complex Overseen | Other Directorships Held | |
| and Address | Position | Time Served | by Board Member* | During at Least the Past 5 Years |
| Frank A. Olson (1932) | Trustee | Since 2007 | 139 | Hess Corporation (exploration and |
| One Franklin Parkway | refining of oil and gas) (1998-2013). | |||
| San Mateo, CA 94403-1906 |
Principal Occupation During at Least the Past 5 Years:
Chairman Emeritus, The Hertz Corporation (car rental) (since 2000) (Chairman of the Board (1980-2000) and Chief Executive Officer (1977-1999)); and formerly, Chairman of the Board, President and Chief Executive Officer, UAL Corporation (airlines) (until 1987).
| Larry D. Thompson (1945) | Trustee | Since 2007 | 139 | Cbeyond, Inc. (business commu- |
| One Franklin Parkway | nications provider) (2010-2012), | |||
| San Mateo, CA 94403-1906 | The Southern Company (energy | |||
| company) (2010-2012) and Graham | ||||
| Holdings Company (formerly, | ||||
| The Washington Post Company) | ||||
| (education and media organization). |
Principal Occupation During at Least the Past 5 Years:
Executive Vice President – Government Affairs, General Counsel and Corporate Secretary, PepsiCo, Inc. (consumer products) (2012-present); and formerly, John A. Sibley Professor of Corporate and Business Law, University of Georgia School of Law (2011-2012); Senior Vice President – Government Affairs, General Counsel and Secretary, PepsiCo, Inc. (2004-2011); Senior Fellow of The Brookings Institution (2003-2004); Visiting Professor, University of Georgia School of Law (2004); and Deputy Attorney General, U.S. Department of Justice (2001-2003).
| John B. Wilson (1959) | Lead | Trustee since | 113 | None |
| One Franklin Parkway | Independent | 2006 and Lead | ||
| San Mateo, CA 94403-1906 | Trustee | Independent | ||
| Trustee since | ||||
| 2008 | ||||
Principal Occupation During at Least the Past 5 Years:
President, Staples Europe (office supplies) (2012-present); President and Founder, Hyannis Port Capital, Inc. (real estate and private equity investing); serves on private and non-profit boards; and formerly, Chief Operating Officer and Executive Vice President, Gap, Inc. (retail) (1996-2000); Chief Financial Officer and Executive Vice President – Finance and Strategy, Staples, Inc. (1992-1996); Senior Vice President –Corporate Planning, Northwest Airlines, Inc. (airlines) (1990-1992); and Vice President and Partner, Bain & Company (consulting firm) (1986-1990).
| Interested Board Members and Officers | ||||
| Number of Portfolios in | ||||
| Name, Year of Birth | Length of | Fund Complex Overseen | Other Directorships Held | |
| and Address | Position | Time Served | by Board Member* | During at Least the Past 5 Years |
| **Gregory E. Johnson (1961) | Trustee | Since 2007 | 149 | None |
| One Franklin Parkway | ||||
| San Mateo, CA 94403-1906 | ||||
Principal Occupation During at Least the Past 5 Years:
Chairman of the Board, Member – Office of the Chairman, Director, President and Chief Executive Officer, Franklin Resources, Inc.; officer and/or director or trustee, as the case may be, of some of the other subsidiaries of Franklin Resources, Inc. and of 44 of the investment companies in Franklin Templeton Investments; and Chairman, Investment Company Institute.
Annual Report | 61
| Number of Portfolios in | ||||
| Name, Year of Birth | Length of | Fund Complex Overseen | Other Directorships Held | |
| and Address | Position | Time Served | by Board Member* | During at Least the Past 5 Years |
| **Rupert H. Johnson, Jr. (1940) | Chairman of | Chairman of the | 139 | None |
| One Franklin Parkway | the Board and | Board and Trustee | ||
| San Mateo, CA 94403-1906 | Trustee | since June 2013 |
Principal Occupation During at Least the Past 5 Years:
Vice Chairman, Member – Office of the Chairman and Director, Franklin Resources, Inc.; Director, Franklin Advisers, Inc.; Senior Vice President, Franklin Advisory Services, LLC; and officer and/or director or trustee, as the case may be, of some of the other subsidiaries of Franklin Resources, Inc. and of 41 of the investment companies in Franklin Templeton Investments.
| Sheila Amoroso (1959) | Vice President | Since 1999 | Not Applicable | Not Applicable |
| One Franklin Parkway | ||||
| San Mateo, CA 94403-1906 |
Principal Occupation During at Least the Past 5 Years:
Senior Vice President, Franklin Advisers, Inc.; and officer of seven of the investment companies in Franklin Templeton Investments.
| Alison E. Baur (1964) | Vice President | Since 2012 | Not Applicable | Not Applicable |
| One Franklin Parkway | ||||
| San Mateo, CA 94403-1906 |
Principal Occupation During at Least the Past 5 Years:
Deputy General Counsel, Franklin Templeton Investments; and officer of some of the other subsidiaries of Franklin Resources, Inc. and of 46 of the investment companies in Franklin Templeton Investments.
| Rafael R. Costas, Jr. (1965) | Vice President | Since 1999 | Not Applicable | Not Applicable |
| One Franklin Parkway | ||||
| San Mateo, CA 94403-1906 |
Principal Occupation During at Least the Past 5 Years:
Senior Vice President, Franklin Advisers, Inc.; and officer of seven of the investment companies in Franklin Templeton Investments.
| Laura F. Fergerson (1962) | Chief | Since 2009 | Not Applicable | Not Applicable |
| One Franklin Parkway | Executive | |||
| San Mateo, CA 94403-1906 | Officer – | |||
| Finance and | ||||
| Administration |
Principal Occupation During at Least the Past 5 Years:
Senior Vice President, Franklin Templeton Services, LLC; and officer of 46 of the investment companies in Franklin Templeton Investments.
| Gaston Gardey (1967) | Treasurer, | Since 2009 | Not Applicable | Not Applicable |
| One Franklin Parkway | Chief Financial | |||
| San Mateo, CA 94403-1906 | Officer and | |||
| Chief | ||||
| Accounting | ||||
| Officer |
Principal Occupation During at Least the Past 5 Years:
Director, Fund Accounting, Franklin Templeton Investments; and officer of 27 of the investment companies in Franklin Templeton Investments.
62 | Annual Report
| Number of Portfolios in | ||||
| Name, Year of Birth | Length of | Fund Complex Overseen | Other Directorships Held | |
| and Address | Position | Time Served | by Board Member* | During at Least the Past 5 Years |
| Aliya S. Gordon (1973) | Vice President | Since 2009 | Not Applicable | Not Applicable |
| One Franklin Parkway | ||||
| San Mateo, CA 94403-1906 |
Principal Occupation During at Least the Past 5 Years:
Senior Associate General Counsel, Franklin Templeton Investments; officer of 46 of the investment companies in Franklin Templeton Investments; and formerly, Litigation Associate, Steefel, Levitt & Weiss, LLP (2000-2004).
| Steven J. Gray (1955) | Vice President | Since 2009 | Not Applicable | Not Applicable |
| One Franklin Parkway | ||||
| San Mateo, CA 94403-1906 |
Principal Occupation During at Least the Past 5 Years:
Senior Associate General Counsel, Franklin Templeton Investments; Vice President, Franklin Templeton Distributors, Inc. and Franklin Alternative Strategies Advisers, LLC; and officer of 46 of the investment companies in Franklin Templeton Investments.
| Selena L. Holmes (1965) | Vice President | Since 2012 | Not Applicable | Not Applicable |
| 100 Fountain Parkway | – AML | |||
| St. Petersburg, FL 33716-1205 | Compliance |
Principal Occupation During at Least the Past 5 Years:
Director, Global Compliance Monitoring; Deputy Chief Compliance Officer, Franklin Alternative Strategies Advisers, LLC; and officer of 46 of the investment companies in Franklin Templeton Investments.
| Christopher J. Molumphy (1962) | President and | Since 2010 | Not Applicable | Not Applicable |
| One Franklin Parkway | Chief | |||
| San Mateo, CA 94403-1906 | Executive | |||
| Officer – | ||||
| Investment | ||||
| Management |
Principal Occupation During at Least the Past 5 Years:
Director and Executive Vice President, Franklin Advisers, Inc.; Executive Vice President, Franklin Templeton Institutional, LLC; and officer of some of the other subsidiaries of Franklin Resources, Inc. and of 22 of the investment companies in Franklin Templeton Investments.
| Kimberly H. Novotny (1972) | Vice President | Since 2013 | Not Applicable | Not Applicable |
| 300 S.E. 2nd Street | ||||
| Fort Lauderdale, FL 33301-1923 |
Principal Occupation During at Least the Past 5 Years:
Associate General Counsel, Franklin Templeton Investments; Vice President and Secretary, Fiduciary Trust International of the South; Vice President, Templeton Investment Counsel, LLC; Assistant Secretary, Franklin Resources, Inc.; and officer of 46 of the investment companies in Franklin Templeton Investments.
| Robert C. Rosselot (1960) | Chief | Since 2013 | Not Applicable | Not Applicable |
| 300 S.E. 2nd Street | Compliance | |||
| Fort Lauderdale, FL 33301-1923 | Officer |
Principal Occupation During at Least the Past 5 Years:
Director, Global Compliance, Franklin Templeton Investments; Vice President, Franklin Templeton Companies, LLC; officer of 46 of the investment companies in Franklin Templeton Investments; and formerly, Senior Associate General Counsel, Franklin Templeton Investments (2007-2013); and Secretary and Vice President, Templeton Group of Funds (2004-2013).
Annual Report | 63
| Number of Portfolios in | ||||
| Name, Year of Birth | Length of | Fund Complex Overseen | Other Directorships Held | |
| and Address | Position | Time Served | by Board Member* | During at Least the Past 5 Years |
| Karen L. Skidmore (1952) | Vice President | Since 2006 | Not Applicable | Not Applicable |
| One Franklin Parkway | and Secretary | |||
| San Mateo, CA 94403-1906 |
Principal Occupation During at Least the Past 5 Years:
Senior Associate General Counsel, Franklin Templeton Investments; and officer of 46 of the investment companies in Franklin Templeton Investments.
| Craig S. Tyle (1960) | Vice President | Since 2005 | Not Applicable | Not Applicable |
| One Franklin Parkway | ||||
| San Mateo, CA 94403-1906 |
Principal Occupation During at Least the Past 5 Years:
General Counsel and Executive Vice President, Franklin Resources, Inc.; and officer of some of the other subsidiaries of Franklin Resources, Inc. and of 46 of the investment companies in Franklin Templeton Investments.
| Thomas Walsh (1961) | Vice President | Since 1999 | Not Applicable | Not Applicable |
| One Franklin Parkway | ||||
| San Mateo, CA 94403-1906 |
Principal Occupation During at Least the Past 5 Years:
Senior Vice President, Franklin Advisers, Inc.; and officer of seven of the investment companies in Franklin Templeton Investments.
| Lori A. Weber (1964) | Vice President | Since 2011 | Not Applicable | Not Applicable |
| 300 S.E. 2nd Street | ||||
| Fort Lauderdale, FL 33301-1923 |
Principal Occupation During at Least the Past 5 Years:
Senior Associate General Counsel, Franklin Templeton Investments; Assistant Secretary, Franklin Resources, Inc.; Vice President and
Secretary, Templeton Investment Counsel, LLC; Vice President, Fiduciary Trust International of the South; and officer of 46 of the investment
companies in Franklin Templeton Investments.
*We base the number of portfolios on each separate series of the U.S. registered investment companies within the Franklin Templeton Investments fund complex. These portfolios
have a common investment manager or affiliated investment managers.
**Gregory E. Johnson is considered to be an interested person of the Fund under the federal securities laws due to his position as an officer and director of Franklin Resources, Inc.
(Resources), which is the parent company of the Fund’s investment manager and distributor. Rupert H. Johnson, Jr. is considered to be an interested person of the Fund under the
federal securities laws due to his position as officer and director and major shareholder of Resources.
Note 1: Rupert H. Johnson, Jr. is the uncle of Gregory E. Johnson.
Note 2: Officer information is current as of the date of this report. It is possible that after this date, information about officers may change.
Note 3: Effective June 13, 2013, Charles B. Johnson ceased to be a trustee of the Fund.
The Sarbanes-Oxley Act of 2002 and Rules adopted by the Securities and Exchange Commission require the Fund to disclose whether the Fund’s Audit Committee includes
at least one member who is an audit committee financial expert within the meaning of such Act and Rules. The Fund’s Board has determined that there is at least one such
financial expert on the Audit Committee and has designated John B. Wilson as its audit committee financial expert. The Board believes that Mr. Wilson qualifies as such an
expert in view of his extensive business background and experience, including service as chief financial officer of Staples, Inc. from 1992 to 1996. Mr. Wilson has been a
Member and Chairman of the Fund’s Audit Committee since 2006. As a result of such background and experience, the Board believes that Mr. Wilson has acquired an under-
standing of generally accepted accounting principles and financial statements, the general application of such principles in connection with the accounting estimates,
accruals and reserves, and analyzing and evaluating financial statements that present a breadth and level of complexity of accounting issues generally comparable to those
of the Fund, as well as an understanding of internal controls and procedures for financial reporting and an understanding of audit committee functions. Mr. Wilson is an
independent Board member as that term is defined under the relevant Securities and Exchange Commission Rules and Releases.
The Statement of Additional Information (SAI) includes additional information about the board members and is available, without charge, upon request. Shareholders may
call (800) DIAL BEN/342-5236 to request the SAI.
64 | Annual Report
Franklin Federal Tax-Free Income Fund
Shareholder Information
Board Review of Investment Management Agreement
At a meeting held February 25, 2014, the Board of Trustees (Board), including a majority of non-interested or independent Trustees, approved renewal of the investment management agreement for the Fund. In reaching this decision, the Board took into account information furnished throughout the year at regular Board meetings, as well as information prepared specifically in connection with the annual renewal review process. Information furnished and discussed throughout the year included investment performance reports and related financial information for the Fund, along with periodic reports on expenses, shareholder services, legal and compliance matters, pricing, and other services provided by the Investment Manager (Manager) and its affiliates. Information furnished specifically in connection with the renewal process included a report for the Fund prepared by Lipper, Inc. (Lipper), an independent organization, as well as additional material, including a Fund profitability analysis prepared by management. The Lipper report compared the Fund’s investment performance and expenses with those of other mutual funds deemed comparable to the Fund as selected by Lipper. The Fund profitability analysis discussed the profitability to Franklin Templeton Investments from its overall U.S. fund operations, as well as on an individual fund-by-fund basis. Additional material accompanying such profitability analysis included information on a fund-by-fund basis listing portfolio managers and other accounts they manage, as well as information on management fees charged by the Manager and its affiliates to U.S. mutual funds and other accounts, including management’s explanation of differences where relevant. Such material also included a memorandum prepared by management describing project initiatives and capital investments relating to the services provided to the Fund by the Franklin Templeton Investments organization, as well as a memorandum relating to economies of scale and an analysis concerning transfer agent fees charged by an affiliate of the Manager.
In considering such materials, the independent Trustees received assistance and advice from and met separately with independent counsel. In approving continuance of the investment management agreement for the Fund, the Board, including a majority of independent Trustees, determined that the existing management fee structure was fair and reasonable and that continuance of the investment management agreement was in the best interests of the Fund and its shareholders. While attention was given to all information furnished, the following discusses some primary factors relevant to the Board’s decision.
NATURE, EXTENT AND QUALITY OF SERVICES. The Board was satisfied with the nature and quality of the overall services provided by the Manager and its affiliates to the Fund and its shareholders. In addition to investment performance and expenses discussed later, the Board’s opinion was based, in part, upon periodic reports furnished it showing that the investment policies and restrictions for the Fund were consistently complied with as well as other reports periodically furnished the Board covering matters such as the compliance of portfolio managers and other management personnel with the code of ethics adopted throughout the Franklin Templeton fund complex, the adherence to fair value pricing procedures established by the Board, and the accuracy of net asset value calculations. The Board also noted the extent of benefits provided Fund shareholders from being part of the Franklin Templeton family of funds, including the right to exchange investments between the same class of funds without a sales charge, the ability to reinvest Fund
Annual Report | 65
Franklin Federal Tax-Free Income Fund
Shareholder Information (continued)
Board Review of Investment Management Agreement (continued)
dividends into other funds and the right to combine holdings in other funds to obtain a reduced sales charge. Favorable consideration was given to management’s continual efforts and expenditures in establishing back-up systems and recovery procedures to function in the event of a natural disaster, it being noted that such systems and procedures had functioned well during the Florida hurricanes and blackouts experienced in previous years, and that those operations in the New York/New Jersey area ran smoothly during the period of the 2012 Hurricane Sandy. Consideration was also given to the experience of the Fund’s portfolio management team, the number of accounts managed and general method of compensation. In this latter respect, the Board noted that a primary factor in management’s determination of a portfolio manager’s bonus compensation was the relative investment performance of the funds he or she managed and that a portion of such bonus was required to be invested in a predesignated list of funds within such person’s fund management area so as to be aligned with the interests of shareholders. The Board also took into account the quality of transfer agent and shareholder services provided Fund shareholders by an affiliate of the Manager and the continual enhancements to the Franklin Templeton website. Particular attention was given to management’s conservative approach and diligent risk management procedures, including continual monitoring of counterparty credit risk and attention given to derivatives and other complex instruments. The Board also took into account, among other things, management’s efforts in establishing a global credit facility for the benefit of the Fund and other accounts managed by Franklin Templeton Investments to provide a source of cash for temporary and emergency purposes or to meet unusual redemption requests as well as the strong financial position of the Manager’s parent company and its commitment to the mutual fund business as evidenced by its subsidization of money market funds.
INVESTMENT PERFORMANCE. The Board placed significant emphasis on the investment performance of the Fund in view of its importance to shareholders. While consideration was given to performance reports and discussions with portfolio managers at Board meetings during the year, particular attention in assessing such performance was given to the Lipper report furnished for the agreement renewal. The Lipper report prepared for the Fund showed the investment performance of its Class A shares during 2013 as well as the previous 10 years ended December 31, 2013, in comparison to a performance universe consisting of all retail and institutional general and insured municipal debt funds as selected by Lipper. The Lipper report showed the income performance for the Fund during 2013 to be in the second-highest performing quintile of its performance universe, and on an annualized basis in each of the previous three-, five- and 10-year periods to be in either the highest performing or second-highest performing quintile of its Lipper performance universe. The Lipper report showed the Fund’s total return during 2013 to be in the second-lowest performing quintile of its Lipper performance universe, but on an annualized basis to be in the second-highest performing quintile of such universe for the previous three-year period, the middle performing quintile of such universe for the five-year period, and the highest performing quintile of its Lipper performance universe for the previous 10-year period. The Board expressed its satisfaction with the Fund’s comparative performance as shown in the Lipper report, noting its income oriented objective.
66 | Annual Report
Franklin Federal Tax-Free Income Fund
Shareholder Information (continued)
Board Review of Investment Management Agreement (continued)
COMPARATIVE EXPENSES. Consideration was given to a comparative analysis of the management fees and total expense ratio of the Fund compared with those of a group of other funds selected by Lipper as its appropriate Lipper expense group under the Lipper report. Lipper expense data is based upon information taken from each fund’s most recent annual report, which reflects historical asset levels that may be quite different from those currently existing, particularly in a period of market volatility. While recognizing such inherent limitation and the fact that expense ratios generally increase as assets decline and decrease as assets grow, the Board believed the independent analysis conducted by Lipper to be an appropriate measure of comparative expenses. In reviewing comparative costs, Lipper provides information on the Fund’s contractual investment management fee in comparison with the contractual investment management fee that would have been charged by other funds within its Lipper expense group assuming they were similar in size to the Fund, as well as the actual total expenses of the Fund in comparison with those of its Lipper expense group. The Lipper contractual investment management fee analysis includes administrative charges as being part of a management fee, and total expenses, for comparative consistency, are shown by Lipper for Fund Class A shares. The results of such expense comparisons showed the contractual investment management fee rate for the Fund to be approximately four basis points above its Lipper expense group median, but its actual total expense ratio to be approximately 12 basis points below the expense group median, with its total expense ratio excluding 12b-1 fees being approximately one basis point above the expense group median excluding such fees. The Board found the level of expenses of the Fund in comparison to its expense group as shown in the Lipper report to be acceptable.
MANAGEMENT PROFITABILITY. The Board also considered the level of profits realized by the Manager and its affiliates in connection with the operation of the Fund. In this respect, the Board reviewed the Fund profitability analysis that addresses the overall profitability of Franklin Templeton’s U.S. fund business, as well as its profits in providing management and other services to each of the individual funds during the 12-month period ended September 30, 2013, being the most recent fiscal year-end for Franklin Resources, Inc., the Manager’s parent. In reviewing the analysis, the Board recognized that allocation methodologies are inherently subjective and various allocation methodologies may be reasonable while producing different results. In this respect, the Board noted that while management continually makes refinements to its methodologies in response to organizational and product related changes, the overall approach as defined by the primary drivers and activity measurements has remained consistent with that used in the Fund’s profitability report presentations from prior years. Additionally, the Fund’s independent registered public accounting firm had been engaged by the Manager to periodically review the reasonableness of the allocation methodologies to be used solely by the Fund’s Board in reference to the profitability analysis. In reviewing and discussing such analysis, management discussed with the Board its belief that costs incurred in establishing the infrastructure necessary for the type of mutual fund operations conducted by the Manager and its affiliates may not be fully reflected in the expenses allocated to the Fund in determining its profitability, as well as the fact that the level of profits, to a certain extent, reflected operational cost savings and efficiencies initiated by management.
Annual Report | 67
Franklin Federal Tax-Free Income Fund
Shareholder Information (continued)
Board Review of Investment Management Agreement (continued)
The Board also took into account management’s expenditures in improving shareholder services provided the Fund, as well as the need to implement systems and meet additional regulatory and compliance requirements resulting from statutes such as the Sarbanes-Oxley and Dodd-Frank Acts and recent SEC and other regulatory requirements. In addition, the Board considered a third-party study comparing the profitability of the Manager’s parent on an overall basis to other publicly held managers broken down to show profitability from management operations exclusive of distribution expenses, as well as profitability including distribution expenses. The Board also considered the extent to which the Manager and its affiliates might derive ancillary benefits from fund operations, including revenues generated from transfer agent services. Based upon its consideration of all these factors, the Board determined that the level of profits realized by the Manager and its affiliates from providing services to the Fund was not excessive in view of the nature, quality and extent of services provided.
ECONOMIES OF SCALE. The Board also considered whether economies of scale are realized by the Manager as the Fund grows larger and the extent to which this is reflected in the level of management fees charged. While recognizing that any precise determination is inherently subjective, the Board noted that based upon the Fund profitability analysis, it appears that as some funds get larger, at some point economies of scale do result in the Manager realizing a larger profit margin on management services provided such a fund. The Board also noted that economies of scale are shared with a fund and its shareholders through management fee breakpoints so that as a fund grows in size, its effective management fee rate declines. The fee structure under the Fund’s investment management agreement provides an initial fee of 0.625% on the first $100 million of assets; 0.50% on the next $150 million of assets; 0.45% on the next $7.25 billion of assets; 0.44% on the next $2.5 billion of assets, with breakpoints continuing in stages thereafter until declining to a final breakpoint of 0.36% on assets in excess of $20 billion. The Fund had assets of approximately $10.6 billion at the end of 2013 and the Board believes that to the extent any economies of scale may be realized by the Manager and its affiliates, the schedule of fees under the investment management agreement provides a sharing of benefits with the Fund and its shareholders.
Proxy Voting Policies and Procedures
The Fund’s investment manager has established Proxy Voting Policies and Procedures (Policies) that the Fund uses to determine how to vote proxies relating to portfolio securities. Shareholders may view the Fund’s complete Policies online at franklintempleton.com. Alternatively, shareholders may request copies of the Policies free of charge by calling the Proxy Group collect at (954) 527-7678 or by sending a written request to: Franklin Templeton Companies, LLC, 300 S.E. 2nd Street, Fort Lauderdale, FL 33301, Attention: Proxy Group. Copies of the Fund’s proxy voting records are also made available online at franklintempleton.com and posted on the U.S. Securities and Exchange Commission’s website at sec.gov and reflect the most recent 12-month period ended June 30.
68 | Annual Report
Franklin Federal Tax-Free Income Fund
Shareholder Information (continued)
Quarterly Statement of Investments
The Fund files a complete statement of investments with the U.S. Securities and Exchange Commission for the first and third quarters for each fiscal year on Form N-Q. Shareholders may view the filed Form N-Q by visiting the Commission’s website at sec.gov. The filed form may also be viewed and copied at the Commission’s Public Reference Room in Washington, DC. Information regarding the operations of the Public Reference Room may be obtained by calling (800) SEC-0330.
Householding of Reports and Prospectuses
You will receive the Fund’s financial reports every six months as well as an annual updated summary prospectus (prospectus available upon request). To reduce Fund expenses, we try to identify related shareholders in a household and send only one copy of the financial reports and summary prospectus. This process, called “householding,” will continue indefinitely unless you instruct us otherwise. If you prefer not to have these documents householded, please call us at (800) 632-2301. At any time you may view current prospectuses/summary prospectuses and financial reports on our website. If you choose, you may receive these documents through electronic delivery.
Annual Report | 69
This page intentionally left blank.
This page intentionally left blank.
This page intentionally left blank.
Item 2. Code of Ethics.
(a) The Registrant has adopted a code of ethics that applies to its principal executive officers and principal financial and accounting officer.
(c) N/A
(d) N/A
(f) Pursuant to Item 12(a)(1), the Registrant is attaching as an exhibit a copy of its code of ethics that applies to its principal executive officers and principal financial and accounting officer.
Item 3. Audit Committee Financial Expert.
(a)(1) The Registrant has an audit committee financial expert serving on its audit committee.
(2) The audit committee financial expert is John B. Wilson and he is "independent" as defined under the relevant Securities and Exchange Commission Rules and Releases.
Item 4. Principal Accountant Fees and Services.
(a) Audit Fees
The aggregate fees paid to the principal accountant for professional services rendered by the principal accountant for the audit of the registrant’s annual financial statements or for services that are normally provided by the principal accountant in connection with statutory and regulatory filings or engagements were $61,415 for the fiscal year ended April 30, 2014 and $63,680 for the fiscal year ended April 30, 2013.
(b) Audit-Related Fees
There were no fees paid to the principal accountant for assurance and related services rendered by the principal accountant to the registrant that are reasonably related to the performance of the audit of the registrant's financial statements and are not reported under paragraph (a) of Item 4.
There were no fees paid to the principal accountant for assurance and related services rendered by the principal accountant to the registrant's investment adviser and any entity controlling, controlled by or under common control with the investment adviser that provides ongoing services to the registrant that are reasonably related to the performance of the audit of their financial statements.
(c) Tax Fees
There were no fees paid to the principal accountant for professional services rendered by the principal accountant to the registrant for tax compliance, tax advice and tax planning.
The aggregate fees paid to the principal accountant for professional services rendered by the principal accountant to the registrant’s investment adviser and any entity controlling, controlled by or under common control with the investment adviser that provides ongoing services to the registrant for tax compliance, tax advice and tax planning were $6,930 for the fiscal year ended April 30, 2014 and $4,600 for the fiscal year ended April 30, 2013. The services for which these fees were paid included technical tax consultation for capital gain tax reporting to foreign governments and requirements on local country’s self-certification forms.
(d) All Other Fees
The aggregate fees paid to the principal accountant for products and services rendered by the principal accountant to the registrant not reported in paragraphs (a)-(c) of Item 4 were $3,140 for the fiscal year ended April 30, 2014 and $0 for the fiscal year ended April 30, 2013. The services for which these fees were paid included review of materials provided to the fund Board in connection with the investment management contract renewal process.
The aggregate fees paid to the principal accountant for products and services rendered by the principal accountant to the registrant’s investment adviser and any entity controlling, controlled by or under common control with the investment adviser that provides ongoing services to the registrant other than services reported in paragraphs (a)-(c) of Item 4 were $156,596 for the fiscal year ended April 30, 2014 and $39,194 for the fiscal year ended April 30, 2013. The services for which these fees were paid included preparation and review of materials provided to the fund Board in connection with the investment management contract renewal process.
(e) (1) The registrant’s audit committee is directly responsible for approving the services to be provided by the auditors, including:
(i) pre-approval of all audit and audit related services;
(ii) pre-approval of all non-audit related services to be provided to the Fund by the auditors;
(iii) pre-approval of all non-audit related services to be provided to the registrant by the auditors to the registrant’s investment adviser or to any entity that controls, is controlled by or is under common control with the registrant’s investment adviser and that provides ongoing services to the registrant where the non-audit services relate directly to the operations or financial reporting of the registrant; and
(iv) establishment by the audit committee, if deemed necessary or appropriate, as an alternative to committee pre-approval of services to be provided by the auditors, as required by paragraphs (ii) and (iii) above, of policies and procedures to permit such services to be pre-approved by other means, such as through establishment of guidelines or by action of a designated member or members of the committee; provided the policies and procedures are detailed as to the particular service and the committee is informed of each service and such policies and procedures do not include delegation of audit committee responsibilities, as contemplated under the Securities Exchange Act of 1934, to management; subject, in the case of (ii) through (iv), to any waivers, exceptions or exemptions that may be available under applicable law or rules.
(e) (2) None of the services provided to the registrant described in paragraphs (b)-(d) of Item 4 were approved by the audit committee pursuant to paragraph (c)(7)(i)(C) of Rule 2-01 of regulation S-X.
(f) No disclosures are required by this Item 4(f).
(g) The aggregate non-audit fees paid to the principal accountant for services rendered by the principal accountant to the registrant and the registrant’s investment adviser and any entity controlling, controlled by or under common control with the investment adviser that provides ongoing services to the registrant were $166,666 for the fiscal year ended April 30, 2014 and $43,794 for the fiscal year ended April 30, 2013.
(h) The registrant’s audit committee of the board has considered whether the provision of non-audit services that were rendered to the registrant’s investment adviser (not including any sub-adviser whose role is primarily portfolio management and is subcontracted with or overseen by another investment adviser), and any entity controlling, controlled by, or under common control with the investment adviser that provides ongoing services to the registrant that were not pre-approved pursuant to paragraph (c)(7)(ii) of Rule 2-01 of Regulation S-X is compatible with maintaining the principal accountant’s independence.
Item 5. Audit Committee of Listed Registrants. N/A
Item 6. Schedule of Investments. N/A
Item 7. Disclosure of Proxy Voting Policies and Procedures for Closed-End Management Investment Companies. N/A
Item 8. Portfolio Managers of Closed-End Management Investment Companies. N/A
Item 9. Purchases of Equity Securities by Closed-End Management Investment Company and Affiliated Purchasers. N/A
Item 10. Submission of Matters to a Vote of Security Holders.
There have been no changes to the procedures by which shareholders may recommend nominees to the Registrant's Board of Trustees that would require disclosure herein.
Item 11. Controls and Procedures.
(a) Evaluation of Disclosure Controls and Procedures. The Registrant maintains disclosure controls and procedures that are designed to ensure that information required to be disclosed in the Registrant’s filings under the Securities Exchange Act of 1934 and the Investment Company Act of 1940 is recorded, processed, summarized and reported within the periods specified in the rules and forms of the Securities and Exchange Commission. Such information is accumulated and communicated to the Registrant’s management, including its principal executive officer and principal financial officer, as appropriate, to allow timely decisions regarding required disclosure. The Registrant’s management, including the principal executive officer and the principal financial officer, recognizes that any set of controls and procedures, no matter how well designed and operated, can provide only reasonable assurance of achieving the desired control objectives.
Within 90 days prior to the filing date of this Shareholder Report on Form N-CSR, the Registrant had carried out an evaluation, under the supervision and with the participation of the Registrant’s management, including the Registrant’s principal executive officer and the Registrant’s principal financial officer, of the effectiveness of the design and operation of the Registrant’s disclosure controls and procedures. Based on such evaluation, the Registrant’s principal executive officer and principal financial officer concluded that the Registrant’s disclosure controls and procedures are effective.
(b) Changes in Internal Controls. There have been no changes in the Registrant’s internal controls or in other factors that could materially affect the internal controls over financial reporting subsequent to the date of their evaluation in connection with the preparation of this Shareholder Report on Form N-CSR.
Item 12. Exhibits.
(a) (1) Code of Ethics
(a) (2) Certifications pursuant to Section 302 of the Sarbanes-Oxley Act of 2002 of Laura F. Fergerson, Chief Executive Officer - Finance and Administration, and Gaston Gardey, Chief Financial Officer and Chief Accounting Officer
(b) Certifications pursuant to Section 906 of the Sarbanes-Oxley Act of 2002 of Laura F. Fergerson, Chief Executive Officer - Finance and Administration, and Gaston Gardey, Chief Financial Officer and Chief Accounting Officer
SIGNATURES
Pursuant to the requirements of the Securities Exchange Act of 1934 and the Investment Company Act of 1940, the registrant has duly caused this report to be signed on its behalf by the undersigned, thereunto duly authorized.
FRANKLIN FEDERAL TAX-FREE INCOME FUND
By /s/ Laura F. Fergerson
Laura F. Fergerson
Chief Executive Officer – Finance and Administration
Date June 26, 2014
Pursuant to the requirements of the Securities Exchange Act of 1934 and the Investment Company Act of 1940, this report has been signed below by the following persons on behalf of the registrant and in the capacities and on the dates indicated.
By /s/ Laura F. Fergerson
Laura F. Fergerson
Chief Executive Officer – Finance and Administration
Date June 26, 2014
By /s/ Gaston Gardey
Gaston Gardey
Chief Financial Officer and Chief Accounting Officer
Date June 26, 2014