UNITED STATES
SECURITIES AND EXCHANGE COMMISSION
Washington, DC 20549
FORM N-CSR
CERTIFIED SHAREHOLDER REPORT OF REGISTERED
MANAGEMENT INVESTMENT COMPANIES
Investment Company Act file number 811-03395
Franklin Federal Tax-Free Income Fund
(Exact name of registrant as specified in charter)
One Franklin Parkway, San Mateo, CA 94403-1906
(Address of principal executive offices) (Zip code)
Craig S. Tyle, One Franklin Parkway, San Mateo, CA 94403-1906
(Name and address of agent for service)
Registrant’s telephone number, including area code: 650 312-2000
Date of fiscal year end: 4/30
Date of reporting period: 4/30/17
Item 1. Reports to Stockholders.
| Annual Report and Shareholder Letter
April 30, 2017 | |||||

Sign up for electronic delivery at franklintempleton.com/edelivery
Franklin Templeton Investments
Gain From Our Perspective®
At Franklin Templeton Investments, we’re dedicated to one goal: delivering exceptional asset management for our clients. By bringing together multiple, world-class investment teams in a single firm, we’re able to offer specialized expertise across styles and asset classes, all supported by the strength and resources of one of the world’s largest asset managers. This has helped us to become a trusted partner to individual and institutional investors across the globe.
Dear Shareholder:
Overall, the 12 months ended April 30, 2017, benefited from mostly upbeat economic data and better corporate earnings in the U.S., signs of improvement in the Chinese and European economies and ongoing expansionary monetary policies from key central banks. The U.S. job market remained healthy and the unemployment rate declined. Plentiful jobs and rising wages spurred consumer spending in the retail, housing and vehicle markets, all of which set all-time sales records. Additionally, business and consumer confidence readings rose on optimism related to the Trump administration’s pro-growth agenda.
After maintaining its target interest rate in the 0.25%–0.50% range for nearly a year, the U.S. Federal Reserve (Fed), at its December meeting, increased its target range for the federal funds rate to 0.50%–0.75%, as policymakers noted improvement in the U.S. labor market and rising inflation. In March, the Fed raised its target range 0.25% for the second time in three months to a target range of 0.75%–1.00%. The Fed made this widely anticipated move amid ongoing economic expansion and hints of rising inflation. The 10-year U.S. Treasury yield began the period at 1.83% and rose to 2.29% at period-end. Fixed income markets, as measured by the Bloomberg Barclays U.S. Aggregate Bond Index, had a +0.83% total return for the 12 months ended April 30, 2017.1
Investment-grade municipal bonds, as measured by the Bloomberg Barclays Municipal Bond Index, had a +0.14% total return for the 12-month period.1
Despite well-publicized financial problems with issuers like Puerto Rico, overall credit quality in the municipal sector continues to slowly improve along with the U.S. economy.
In addition, Franklin Federal Tax-Free Income Fund’s annual report includes more detail about municipal bond market conditions and discussions from the portfolio managers. On our website, franklintempleton.com, you can find updated commentary by our municipal bond experts. Municipal bonds can provide tax-free income and diversification from equities. Despite periods of volatility, municipal bonds historically have had a solid long-term record of performance, driven mostly by their income component. Please remember all securities markets fluctuate, as do mutual fund share prices.
As always, we recommend investors consult their financial advisors to help them make the best decisions for the long term. In a constantly changing market environment, we remain committed to our disciplined strategy as we manage the Fund, keeping in mind the trust you have placed in us. We appreciate your confidence in us and encourage you to contact us when
1. Source: Morningstar.
See www.franklintempletondatasources.com for additional data provider information.
| Not FDIC Insured | | | May Lose Value | | | No Bank Guarantee |
| franklintempleton.com | Not part of the annual report | 1 | ||
you have questions about your Franklin Templeton tax-free investment.
Sincerely,

Rupert H. Johnson, Jr.
Chairman
Franklin Federal Tax-Free Income Fund

Sheila Amoroso

Rafael R. Costas, Jr.
Senior Vice Presidents and Co-Directors
Franklin Municipal Bond Department
This letter reflects our analysis and opinions as of April 30, 2017, unless otherwise indicated. The information is not a complete analysis of every aspect of any market, state, industry, security or fund. Statements of fact are from sources considered reliable.
Annual Report
Visit franklintempleton.com for fund updates, to access your account, or to find helpful financial planning tools.
| 2 | Not part of the annual report | franklintempleton.com | ||
Annual Report
Franklin Federal Tax-Free Income Fund
This annual report for Franklin Federal Tax-Free Income Fund covers the fiscal year ended April 30, 2017. We welcome the former shareholders of Franklin Insured Tax-Free Income Fund who now own shares of Franklin Federal Tax-Free Income Fund as a result of Franklin Insured Tax-Free Income Fund’s reorganization that took effect on December 2, 2016.
Your Fund’s Goal and Main Investments
The Fund seeks to provide as high a level of income exempt from federal income taxes as is consistent with prudent investment management and preservation of capital by investing at least 80% of its total assets in investment-grade municipal securities that pay interest free from such taxes.1
Credit Quality Composition*
4/30/17
| Ratings | % of Total Investments | |||
| AAA | 9.14% | |||
| AA | 47.78% | |||
| A | 17.58% | |||
| BBB | 5.39% | |||
| Below Investment Grade | 1.68% | |||
| Refunded | 17.55% | |||
| Not Rated | 0.88% | |||
*Securities, except for those labeled Not Rated, are assigned ratings by one or more Nationally Recognized Statistical Credit Rating Organizations (NRSROs), such as Standard & Poor’s, Moody’s and Fitch, that can be considered by the investment manager as part of its independent securities analysis. When ratings from multiple agencies are available, the highest is used, consistent with the portfolio investment process. Ratings reflect an NRSRO’s opinion of an issuer’s creditworthiness and typically range from AAA (highest) to D (lowest). The Below Investment Grade category consists of bonds rated below BBB-. The Refunded category generally consists of refunded bonds secured by U.S. government or other high-quality securities and not rerated by an NRSRO. The Not Rated category consists of ratable securities that have not been rated by an NRSRO. Cash and equivalents are excluded from this composition.
Performance Overview
The Fund’s Class A share price, as measured by net asset value, decreased from $12.48 on April 30, 2016, to $12.02 on April 30, 2017. The Fund’s Class A shares paid dividends totaling 46.25 cents per share for the reporting period.2 The Performance Summary beginning on page 7 shows that at the end of this reporting period the Fund’s Class A shares’ distribution rate was 3.78% based on an annualization of April’s 3.95 cent per share dividend and the maximum offering price of $12.55 on April 30, 2017. An investor in the 2017 maximum federal personal income tax bracket of 39.60% (plus 3.8% Medicare tax) would need to earn a distribution rate of 6.68% from a taxable investment to match the Fund’s Class A tax-free distribution rate. For other performance data, please see the Performance Summary.
Performance data represent past performance, which does not guarantee future results. Investment return and principal value will fluctuate, and you may have a gain or loss when you sell your shares. Current performance may differ from figures shown. For most recent month-end performance, go to franklintempleton.com or call (800) 342-5236.
Municipal Bond Market Overview
The municipal bond market outperformed the U.S. Treasury market, but underperformed U.S. stock markets during the 12-month period ended April 30, 2017. Investment-grade municipal bonds, as measured by the Bloomberg Barclays Municipal Bond Index, posted a +0.14% total return for the period, while U.S. Treasuries, as measured by the Bloomberg Barclays U.S. Treasury Index, had a -0.65% total return.3 U.S. equities, as represented by the Standard & Poor’s® 500 Index, outperformed both municipals and U.S. Treasuries with a +17.92% total return for the reporting period.3
Donald Trump’s U.S. presidential victory in November shocked financial markets and pushed U.S. equities to all-time highs on the promise of lower taxes, de-regulation and
1. Dividends are generally subject to state and local taxes, if any. For investors subject to alternative minimum tax, a small portion of Fund dividends may be taxable. Distributions of capital gains are generally taxable. To avoid imposition of 28% backup withholding on all Fund distributions and redemption proceeds, U.S. investors must be properly certified on Form W-9 and non-U.S. investors on Form W-8BEN.
2. The distribution amount is the sum of all distributions to shareholders for the period shown and includes only net investment income. All Fund distributions will vary depending upon current market conditions, and past distributions are not indicative of future trends.
3. Source: Morningstar. Treasuries, if held to maturity, offer a fixed rate of return and a fixed principal value; their interest payments and principal are guaranteed.
The dollar value, number of shares or principal amount, and names of all portfolio holdings are listed in the Fund’s Statement of Investments (SOI). The SOI begins on page 14.
| franklintempleton.com | Annual Report | 3 | ||
FRANKLIN FEDERAL TAX-FREE INCOME FUND
| Distributions* | ||||||||||||
| 5/1/16–4/30/17 | ||||||||||||
| Distributions per Share (cents) | ||||||||||||
| Month | Class A | Class C | Advisor Class | |||||||||
| May | 3.95 | 3.37 | 4.05 | |||||||||
| June | 3.85 | 3.29 | 3.96 | |||||||||
| July | 3.75 | 3.19 | 3.86 | |||||||||
| August | 3.75 | 3.19 | 3.86 | |||||||||
| September | 3.75 | 3.17 | 3.85 | |||||||||
| October | 3.75 | 3.17 | 3.85 | |||||||||
| November | 3.80 | 3.22 | 3.90 | |||||||||
| December | 3.85 | 3.28 | 3.95 | |||||||||
| January | 3.95 | 3.38 | 4.05 | |||||||||
| February | 3.95 | 3.38 | 4.05 | |||||||||
| March | 3.95 | 3.39 | 4.05 | |||||||||
| April | 3.95 | 3.39 | 4.05 | |||||||||
| Total | 46.25 | 39.42 | 47.48 | |||||||||
*The distribution amount is the sum of all distributions to shareholders for the period shown and includes only net investment income. All Fund distributions will vary depending upon current market conditions, and past distributions are not indicative of future trends.
significant infrastructure spending. These same factors stoked fears among bond investors of inflation and higher interest rates. As a result, both the municipal bond market and U.S. Treasury market sold off sharply immediately following the election. Fixed income markets quickly stabilized, however, and generated positive returns from December through the end of the reporting period.
The election also resulted in Republican control of both the White House and Congress, marking the first time in six years that one party has controlled both the Executive and Legislative branches. Many forecasters believe that the Trump presidency could usher in a new era of higher growth for the U.S. economy. As of period-end, however, there are still more questions than answers about the new administration’s ability to implement its agenda and the timing of any related legislation.
The Federal Reserve (Fed) raised its target range for the federal funds rate by 0.25% two times during the reporting period: once in December and again in March. The target range of the federal funds rate currently stands at 0.75%–1.00%. The Fed also increased the discount rate by 0.25% to 1.50% in March. After raising its target range by 0.25% just once in both 2015 and 2016, in March the Fed indicated that it expects three
such increases in 2017. In its March press release, the central bank cited expanding economic activity and strong labor markets, while noting that monetary policy will remain accommodative until its desired 2% inflation target is attained.
Municipal bond funds experienced 13 consecutive months of inflows before significant outflows in November and December. Fund flows turned positive again in January, reflecting resilient demand for tax-exempt debt. Investors displayed a healthy appetite for risky assets through most of the period. Municipal bonds with shorter maturities generally performed better than bonds with longer maturities and high yield tax-exempt bonds outperformed their investment-grade counterparts. The Bloomberg Barclays High Yield Municipal Bond Index generated a +4.38% total return for the period and the Bloomberg Barclays Long (22+ Years) Bond Index returned +0.08%.3
Approximately $380 billion in municipal bonds were issued over the past 12 months. However, this was offset by the approximately $350 billion in municipal bonds that either matured or were called out of the market, making net supply slightly positive for the period at $30 billion.4 This net positive supply picture created a somewhat weaker technical backdrop that contributed to tepid returns for the period.
Overall, benchmark 10-year and 30-year tax-exempt interest rates ended the period higher than where they began, despite touching record low levels in July. Bond prices will decline as interest rates rise, impacting total return performance.
In our continuing efforts to keep our shareholders informed about events in Puerto Rico, we are pleased to provide this update.
On May 3, 2017, the Puerto Rico federal Oversight Board filed for Title III (bankruptcy) under the Puerto Rico Oversight, Management, and Economic Stability Act (PROMESA) for Puerto Rico’s central government, and followed with a similar filing for COFINA on May 5, 2017. In doing so, the Oversight Board made the determination that Puerto Rico and COFINA each met the requirements for commencing a Title III proceeding, including that good faith efforts to reach a consensual restructuring with creditors were made without having reached an agreement. Judge Laura Taylor Swain, a district court judge in the Southern District of New York, is presiding over the process, and the first hearing was held on May 17, 2017 in San Juan. Legal counsel for Franklin,
4. Source: Goldman Sachs Securities Division, Bloomberg.
See www.franklintempletondatasources.com for additional data provider information.
| 4 | Annual Report | franklintempleton.com | ||
FRANKLIN FEDERAL TAX-FREE INCOME FUND
| Portfolio Composition | ||||
| 4/30/17 | ||||
| % of Total Investments* | ||||
| Refunded** | 27.2% | |||
| Utilities | 16.4% | |||
| Transportation | 12.5% | |||
| General Obligation | 10.5% | |||
| Hospital & Health Care | 10.2% | |||
| Subject to Government Appropriations | 8.9% | |||
| Higher Education | 4.9% | |||
| Tax-Supported | 4.2% | |||
| Other Revenue | 3.5% | |||
| Corporate-Backed | 1.1% | |||
| Housing | 0.6% | |||
*Does not include cash and cash equivalents.
**Includes all refunded bonds; the percentage may differ from that in the Credit Quality Composition.
OppenheimerFunds and First Puerto Rico Funds appeared on their behalf at the May 17th hearing to represent their interests with respect to their COFINA holdings.
On June 30, 2016, President Obama signed PROMESA, a bipartisan congressional effort that created the independent, seven-member Oversight Board. The board, appointed by the House of Representatives, Senate and President Obama, has fiscal oversight over Puerto Rico’s finances for an initial term of five years and its term will expire once Puerto Rico has posted four structurally balanced budgets in a row and is deemed to have “adequate access… at reasonable interest rates” to the capital markets. The board has the power to approve or reject the general government’s proposed budgets until the board is satisfied that the budgets are structurally responsible and based on reasonable expectations and accounting standards.
Additionally, Title III of PROMESA provides Puerto Rico with a path for restructuring its debts following a process based on Chapter 9 of the U.S. Bankruptcy Code, with some important protections and safeguards that are not available to creditors in a Chapter 9 proceeding. This is important as the U.S. Supreme Court affirmed in June 2016 that neither Puerto Rico nor its municipalities or agencies can file for bankruptcy under Chapter 9. Title III is available to Puerto Rico and its related issuers only if negotiations under Title VI of PROMESA do not result in consensual agreements with creditors following good faith efforts to reach a consensual restructuring.
On Monday, March 13, 2017, the Oversight Board certified a 10-year Fiscal Plan for Puerto Rico, as required by PROMESA.
As part of the Puerto Rico Electric Power Authority (PREPA) forbearing creditor group (Ad Hoc Group), we have been participating in discussions related to the PREPA bonds owned by our managed funds and accounts.
After months of negotiation, PREPA and more than 70% of its creditors signed an Amended and Restated Restructuring Support Agreement (RSA) that would provide, among other things, for a restructuring of some of PREPA’s outstanding debt at 85 cents on the dollar. In our view, the implementation of the RSA would provide the basis for PREPA to provide more reliable and lower-cost service, fund its capital needs for the medium term, help ensure environmental compliance, diversify generation resources to include more natural gas, and provide jobs.
The new RSA sets forth numerous milestones, including approval from the Oversight Board by May 26, 2017, and is scheduled to expire September 1, 2017, the date on which the exchange is expected to take place. The RSA provides that existing bondholders will receive new securities representing 85% of the face value of the current bonds.
COFINA, the Spanish name for debt secured by a dedicated portion of the sales and use tax, has to date made all principal and interest payments on time and in full.
On July 1, 2016, Puerto Rico defaulted on the entire payment due on its General Obligation (GO) Bonds, making it the first state or territory-level issuer to do so since the Great Depression. The government has continued to default on GO bonds, including the payment due February 1, 2017. Reportedly, Puerto Rico Governor Ricardo Roselló Nevares made the March 1, 2017 debt service payment of $1.4 million.
On November 22, 2016, certain Franklin Municipal Bond Funds that own COFINA bonds joined other bondholders in filing a Motion to Intervene in a lawsuit in Puerto Rico between a group of GO hedge fund bondholders and the government, in an effort to uphold the validity of the COFINA bond structure. The motion was granted on February 17, 2017. On April 4, 2017, the First Circuit Court of Appeals, in a related motion, stayed all aspects of the lawsuit until May 1, 2017. The Title III filing discussed above has further stayed this lawsuit and other litigation related to Puerto Rico’s GO and COFINA debt.
In additional to the debt discussed above, Puerto Rico has defaulted on debt issued by several different issuers including Puerto Rico Public Building Authority bonds, Puerto Rico Infrastructure Finance Authority Special Tax: Federal Excise Tax bonds, Public Finance Corporation bonds and Government Development Bank bonds. As of this writing, all defaults
| franklintempleton.com | Annual Report | 5 | ||
FRANKLIN FEDERAL TAX-FREE INCOME FUND
mentioned in this paragraph remain uncured; however, some debt service payments have been made from insurance companies.
At period-end, we maintained our positive view of the municipal bond market. We believe municipal bonds continue to be an attractive asset class among fixed income securities, and we intend to follow our solid discipline of investing to maximize income, while seeking value in the municipal bond market.
Investment Strategy
We use a consistent, disciplined strategy in an effort to maximize tax-exempt income for our shareholders by seeking to maintain exposure to higher coupon securities while balancing risk and return within the Fund’s range of allowable investments. We generally employ a buy-and-hold approach and invest in securities we believe should provide the most relative value in the market. We do not use leverage or derivatives, nor do we use hedging techniques that could add volatility and contribute to underperformance in adverse markets.
Manager’s Discussion
Our value-oriented philosophy of investing primarily for income and stability of principal, when combined with a positive-sloping municipal yield curve, in which yields for longer term bonds are higher than those for shorter term bonds, led us to favor longer term bonds during the period under review. Consistent with our strategy, we sought to remain invested in bonds ranging from 15 to 30 years in maturity with good call features. Our relative-value, income-oriented philosophy also led the Fund to maintain its positions in higher coupon bonds, which provided income performance during the reporting period. We believe our conservative, buy-and-hold investment strategy can help us achieve high, current, tax-free income for shareholders.
The Fund holds a small portion of its assets in Puerto Rico bonds, including COFINA bonds, which increased in price over the period. However, these bonds declined substantially before period-end. Additionally, Puerto Rico and its municipal issuers continued to experience significant financial difficulties, which we discussed in the Municipal Bond Market Overview. We continue to closely monitor developments in Puerto Rico; however, the municipal bond market’s overall fundamentals, such as general creditworthiness and low default rates, remained stable.
Thank you for your continued participation in Franklin Federal Tax-Free Income Fund. We look forward to serving your future investment needs.
The foregoing information reflects our analysis, opinions and portfolio holdings as of April 30, 2017, the end of the reporting period. The way we implement our main investment strategies and the resulting portfolio holdings may change depending on factors such as market and economic conditions. These opinions may not be relied upon as investment advice or an offer for a particular security. The information is not a complete analysis of every aspect of any market, state, industry, security or the Fund. Statements of fact are from sources considered reliable, but the investment manager makes no representation or warranty as to their completeness or accuracy. Although historical performance is no guarantee of future results, these insights may help you understand our investment management philosophy.
| 6 | Annual Report | franklintempleton.com | ||
FRANKLIN FEDERAL TAX-FREE INCOME FUND
Performance Summary as of April 30, 2017
The performance tables and graphs do not reflect any taxes that a shareholder would pay on Fund dividends, capital gain distributions, if any, or any realized gains on the sale of Fund shares. Total return reflects reinvestment of the Fund’s dividends and capital gain distributions, if any, and any unrealized gains or losses. Your dividend income will vary depending on dividends or interest paid by securities in the Fund’s portfolio, adjusted for operating expenses of each class. Capital gain distributions are net profits realized from the sale of portfolio securities.
Performance as of 4/30/17
Cumulative total return excludes sales charges. Average annual total return includes maximum sales charges. Sales charges will vary depending on the size of the investment and the class of share purchased. The maximum is 4.25% and the minimum is 0%. Class A: 4.25% maximum initial sales charge; Advisor Class: no sales charges. For other share classes, visit franklintempleton.com.
| Share Class | Cumulative Total Return1 | Average Annual Total Return2 | ||||||
A | ||||||||
1-Year | +0.01% | -4.21% | ||||||
5-Year | +16.75% | +2.26% | ||||||
10-Year | +50.62% | +3.73% | ||||||
Advisor | ||||||||
1-Year | +0.11% | +0.11% | ||||||
5-Year | +17.32% | +3.25% | ||||||
10-Year | +52.04% | +4.28% | ||||||
| Share Class | Distribution Rate3 | Taxable Equivalent Distribution Rate4 | 30-Day Standardized Yield5 | Taxable Equivalent 30-Day Standardized Yield4 | ||||||||||||
A | 3.78% | 6.68% | 1.78% | 3.14% | ||||||||||||
Advisor | 4.04% | 7.14% | 1.96% | 3.46% | ||||||||||||
Performance data represent past performance, which does not guarantee future results. Investment return and principal value will fluctuate, and you may have a gain or loss when you sell your shares. Current performance may differ from figures shown. For most recent month-end performance, go to franklintempleton.com or call (800) 342-5236.
See page 9 for Performance Summary footnotes.
| franklintempleton.com | Annual Report | 7 | ||
FRANKLIN FEDERAL TAX-FREE INCOME FUND
PERFORMANCE SUMMARY
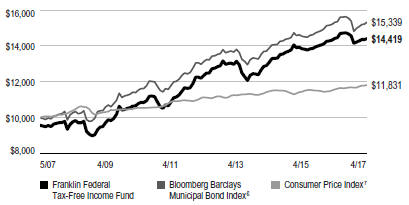
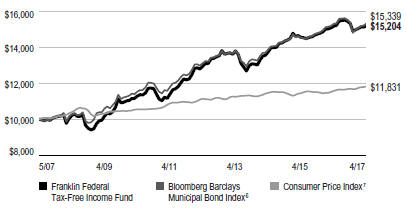
Total Return Index Comparison for a Hypothetical $10,000 Investment
Total return represents the change in value of an investment over the periods shown. It includes any applicable maximum sales charge, Fund expenses, account fees and reinvested distributions. The unmanaged indexes include reinvestment of any income or distributions. They differ from the Fund in composition and do not pay management fees or expenses. One cannot invest directly in an index.
Class A (5/1/07–4/30/17)
Advisor Class (5/1/07–4/30/17)
| 8 | Annual Report | franklintempleton.com | ||
FRANKLIN FEDERAL TAX-FREE INCOME FUND
PERFORMANCE SUMMARY
Net Asset Value
| Share Class (Symbol) | 4/30/17 | 4/30/16 | Change | |||||||||
A (FKTIX) | $12.02 | $12.48 | -$0.46 | |||||||||
C (FRFTX) | $12.01 | $12.47 | -$0.46 | |||||||||
Advisor (FAFTX) | $12.03 | $12.49 | -$0.46 | |||||||||
Distributions (5/1/16–4/30/17)
|
| |||||||||||
| Share Class | Net Investment Income | |||||||||||
A | $0.4625 | |||||||||||
C | $0.3942 | |||||||||||
Advisor | $0.4748 | |||||||||||
Total Annual Operating Expenses8
|
| |||||||||||
| Share Class | ||||||||||||
A | 0.61% | |||||||||||
Advisor | 0.51% | |||||||||||
Each class of shares is available to certain eligible investors and has different annual fees and expenses, as described in the prospectus.
All investments involve risks, including possible loss of principal. Because municipal bonds are sensitive to interest rate movements, the Fund’s yield and share price will fluctuate with market conditions. Bond prices generally move in the opposite direction of interest rates. Thus, as prices of bonds in the Fund adjust to a rise in interest rates, the Fund’s share price may decline. Changes in the credit rating of a bond, or in the credit rating or financial strength of a bond’s issuer, insurer or guarantor, may affect the bond’s value. The Fund holds a small portion of its assets in Puerto Rico municipal bonds that have been impacted by recent adverse economic and market changes, which may cause the Fund’s share price to decline. The Fund may invest a significant part of its assets in municipal securities that finance similar types of projects, such as utilities, hospitals, higher education and transportation. A change that affects one project would likely affect all similar projects, thereby increasing market risk. The Fund is actively managed but there is no guarantee that the manager’s investment decisions will produce the desired results. The Fund’s prospectus also includes a description of the main investment risks.
1. Cumulative total return represents the change in value of an investment over the periods indicated.
2. Average annual total return represents the average annual change in value of an investment over the periods indicated. Return for less than one year, if any, has not been annualized.
3. Distribution rate is based on an annualization of the respective class’s April dividend and the maximum offering price (NAV for Advisor Class) per share on 4/30/17.
4. Taxable equivalent distribution rate and yield assume the 2016 maximum federal income tax rate of 39.60% plus 3.8% Medicare tax.
5. The Fund’s 30-day standardized yield is calculated over a trailing 30-day period using the yield to maturity on bonds and/or the dividends accrued on stocks. It may not equal the Fund’s actual income distribution rate, which reflects the Fund’s past dividends paid to shareholders.
6. Source: Morningstar. The Barclays Municipal Bond Index is a market value-weighted index engineered for the long-term tax-exempt bond market. To be included in the index, bonds must be fixed rate, have at least one year to final maturity and be rated investment grade (Baa3/BB- or higher) by at least two of the following agencies: Moody’s, Standard & Poor’s and Fitch.
7. Source: Bureau of Labor Statistics, bls.gov/cpi. The Consumer Price Index is a commonly used measure of the inflation rate.
8. Figures are as stated in the Fund’s current prospectus and may differ from the expense ratios disclosed in the Your Fund’s Expenses and Financial Highlights sections in this report. In periods of market volatility, assets may decline significantly, causing total annual Fund operating expenses to become higher than the figures shown. See www.franklintempletondatasources.com for additional data provider information.
| franklintempleton.com | Annual Report | 9 | ||
FRANKLIN FEDERAL TAX-FREE INCOME FUND
As a Fund shareholder, you can incur two types of costs: (1) transaction costs, including sales charges (loads) on Fund purchases and redemptions; and (2) ongoing Fund costs, including management fees, distribution and service (12b-1) fees, and other Fund expenses. All mutual funds have ongoing costs, sometimes referred to as operating expenses. The table below shows ongoing costs of investing in the Fund and can help you understand these costs and compare them with those of other mutual funds. The table assumes a $1,000 investment held for the six months indicated.
Actual Fund Expenses
The table below provides information about actual account values and actual expenses in the columns under the heading “Actual.” In these columns the Fund’s actual return, which includes the effect of Fund expenses, is used to calculate the “Ending Account Value” for each class of shares. You can estimate the expenses you paid during the period by following these steps (of course, your account value and expenses will differ from those in this illustration): Divide your account value by $1,000 (if your account had an $8,600 value, then $8,600 ÷ $1,000 = 8.6). Then multiply the result by the number in the row for your class of shares under the headings “Actual” and “Expenses Paid During Period” (if Actual Expenses Paid During Period were $7.50, then 8.6 x $7.50 = $64.50). In this illustration, the actual expenses paid this period are $64.50.
Hypothetical Example for Comparison with Other Funds
Under the heading “Hypothetical” in the table, information is provided about hypothetical account values and hypothetical expenses based on the Fund’s actual expense ratio and an assumed rate of return of 5% per year before expenses, which is not the Fund’s actual return. This information may not be used to estimate the actual ending account balance or expenses you paid for the period, but it can help you compare ongoing costs of investing in the Fund with those of other funds. To do so, compare this 5% hypothetical example for the class of shares you hold with the 5% hypothetical examples that appear in the shareholder reports of other funds.
Please note that expenses shown in the table are meant to highlight ongoing costs and do not reflect any transactional costs. Therefore, information under the heading “Hypothetical” is useful in comparing ongoing costs only, and will not help you compare total costs of owning different funds. In addition, if transactional costs were included, your total costs would have been higher.
Actual (actual return after expenses) | Hypothetical (5% annual return before expenses) | |||||||||||||||||
Share Class | Beginning Account Value 11/1/16 | Ending Account Value 4/30/17 | Expenses Paid During Period 11/1/16–4/30/171 | Ending Account Value 4/30/17 | Expenses Paid During Period 11/1/16–4/30/171 | Annualized Expense Ratio | ||||||||||||
A | $1,000 | $990.00 | $3.06 | $1,021.72 | $3.11 | 0.62% | ||||||||||||
C | $1,000 | $987.20 | $5.76 | $1,018.99 | $5.86 | 1.17% | ||||||||||||
Advisor | $1,000 | $990.50 | $2.57 | $1,022.22 | $2.61 | 0.52% | ||||||||||||
1. Expenses are equal to the annualized expense ratio for the six-month period as indicated above—in the far right column—multiplied by the simple average account value over the period indicated, and then multiplied by 181/365 to reflect the one-half year period.
| 10 | Annual Report | franklintempleton.com | ||
FRANKLIN FEDERAL TAX-FREE INCOME FUND
| Year Ended April 30, | ||||||||||||||||||||
| 2017 | 2016 | 2015 | 2014 | 2013 | ||||||||||||||||
Class A | ||||||||||||||||||||
| Per share operating performance | ||||||||||||||||||||
(for a share outstanding throughout the year) | ||||||||||||||||||||
Net asset value, beginning of year | $12.48 | $12.45 | $12.22 | $12.79 | $12.48 | |||||||||||||||
|
| |||||||||||||||||||
| Income from investment operationsa: | ||||||||||||||||||||
Net investment incomeb | 0.47 | 0.48 | 0.47 | 0.49 | 0.48 | |||||||||||||||
Net realized and unrealized gains (losses) | (0.47 | ) | 0.02 | 0.23 | (0.57 | ) | 0.31 | |||||||||||||
|
| |||||||||||||||||||
Total from investment operations | — | 0.50 | 0.70 | (0.08 | ) | 0.79 | ||||||||||||||
|
| |||||||||||||||||||
| Less distributions from net investment income | (0.46 | ) | (0.47 | ) | (0.47 | ) | (0.49 | ) | (0.48) | |||||||||||
|
| |||||||||||||||||||
Net asset value, end of year | $12.02 | $12.48 | $12.45 | $12.22 | $12.79 | |||||||||||||||
|
| |||||||||||||||||||
Total returnc | 0.01% | 4.16% | 5.82% | (0.49)% | 6.44% | |||||||||||||||
| Ratios to average net assets | ||||||||||||||||||||
Expenses | 0.62% | 0.61% | 0.62% | 0.62% | 0.61% | |||||||||||||||
Net investment income | 3.82% | 3.87% | 3.80% | 4.11% | 3.76% | |||||||||||||||
| Supplemental data | ||||||||||||||||||||
Net assets, end of year (000’s) | $9,342,715 | $8,384,079 | $8,505,853 | $8,243,367 | $9,414,734 | |||||||||||||||
Portfolio turnover rate | 13.86% | 6.07% | 5.49% | 8.51% | 6.31% | |||||||||||||||
aThe amount shown for a share outstanding throughout the period may not correlate with the Statement of Operations for the period due to the timing of sales and repurchases of the Fund’s shares in relation to income earned and/or fluctuating fair value of the investments of the Fund.
bBased on average daily shares outstanding.
cTotal return does not reflect sales commissions or contingent deferred sales charges, if applicable.
| franklintempleton.com | The accompanying notes are an integral part of these financial statements. | Annual Report | 11 | ||||
FRANKLIN FEDERAL TAX-FREE INCOME FUND
FINANCIAL HIGHLIGHTS
| Year Ended April 30, | ||||||||||||||||||||
| 2017 | 2016 | 2015 | 2014 | 2013 | ||||||||||||||||
Class C | ||||||||||||||||||||
| Per share operating performance | ||||||||||||||||||||
(for a share outstanding throughout the year) | ||||||||||||||||||||
Net asset value, beginning of year | $12.47 | $12.44 | $12.21 | $12.78 | $12.47 | |||||||||||||||
|
| |||||||||||||||||||
| Income from investment operationsa: | ||||||||||||||||||||
Net investment incomeb | 0.40 | 0.41 | 0.40 | 0.43 | 0.41 | |||||||||||||||
Net realized and unrealized gains (losses) | (0.47 | ) | 0.03 | 0.23 | (0.58 | ) | 0.31 | |||||||||||||
|
| |||||||||||||||||||
Total from investment operations | (0.07 | ) | 0.44 | 0.63 | (0.15 | ) | 0.72 | |||||||||||||
|
| |||||||||||||||||||
| Less distributions from net investment income | (0.39 | ) | (0.41 | ) | (0.40 | ) | (0.42 | ) | (0.41) | |||||||||||
|
| |||||||||||||||||||
Net asset value, end of year | $12.01 | $12.47 | $12.44 | $12.21 | $12.78 | |||||||||||||||
|
| |||||||||||||||||||
Total returnc | (0.55)% | 3.59% | 5.24% | (1.05)% | 5.87% | |||||||||||||||
| Ratios to average net assets | ||||||||||||||||||||
Expenses | 1.17% | 1.16% | 1.17% | 1.17% | 1.16% | |||||||||||||||
Net investment income | 3.27% | 3.32% | 3.25% | 3.56% | 3.21% | |||||||||||||||
| Supplemental data | ||||||||||||||||||||
Net assets, end of year (000’s) | $1,411,391 | $1,215,034 | $1,166,771 | $1,120,471 | $1,525,083 | |||||||||||||||
Portfolio turnover rate | 13.86% | 6.07% | 5.49% | 8.51% | 6.31% | |||||||||||||||
aThe amount shown for a share outstanding throughout the period may not correlate with the Statement of Operations for the period due to the timing of sales and repurchases of the Fund’s shares in relation to income earned and/or fluctuating fair value of the investments of the Fund.
bBased on average daily shares outstanding.
cTotal return does not reflect sales commissions or contingent deferred sales charges, if applicable.
| 12 | Annual Report | The accompanying notes are an integral part of these financial statements. | franklintempleton.com | ||
FRANKLIN FEDERAL TAX-FREE INCOME FUND
FINANCIAL HIGHLIGHTS
| Year Ended April 30, | ||||||||||||||||||||
| 2017 | 2016 | 2015 | 2014 | 2013 | ||||||||||||||||
Advisor Class | ||||||||||||||||||||
| Per share operating performance | ||||||||||||||||||||
(for a share outstanding throughout the year) | ||||||||||||||||||||
Net asset value, beginning of year | $12.49 | $12.46 | $12.23 | $12.80 | $12.49 | |||||||||||||||
|
| |||||||||||||||||||
| Income from investment operationsa: | ||||||||||||||||||||
Net investment incomeb | 0.48 | 0.49 | 0.49 | 0.50 | 0.49 | |||||||||||||||
Net realized and unrealized gains (losses) | (0.47 | ) | 0.03 | 0.22 | (0.57 | ) | 0.31 | |||||||||||||
|
| |||||||||||||||||||
Total from investment operations | 0.01 | 0.52 | 0.71 | (0.07 | ) | 0.80 | ||||||||||||||
|
| |||||||||||||||||||
| Less distributions from net investment income | (0.47 | ) | (0.49 | ) | (0.48 | ) | (0.50 | ) | (0.49) | |||||||||||
|
| |||||||||||||||||||
Net asset value, end of year | $12.03 | $12.49 | $12.46 | $12.23 | $12.80 | |||||||||||||||
|
| |||||||||||||||||||
Total return | 0.11% | 4.26% | 5.92% | (0.39)% | 6.54% | |||||||||||||||
| Ratios to average net assets | ||||||||||||||||||||
Expenses | 0.52% | 0.51% | 0.52% | 0.52% | 0.51% | |||||||||||||||
Net investment income | 3.92% | 3.97% | 3.90% | 4.21% | 3.86% | |||||||||||||||
| Supplemental data | ||||||||||||||||||||
Net assets, end of year (000’s) | $1,633,602 | $1,443,272 | $1,689,267 | $1,314,233 | $1,755,892 | |||||||||||||||
Portfolio turnover rate | 13.86% | 6.07% | 5.49% | 8.51% | 6.31% | |||||||||||||||
aThe amount shown for a share outstanding throughout the period may not correlate with the Statement of Operations for the period due to the timing of sales and repurchases of the Fund’s shares in relation to income earned and/or fluctuating fair value of the investments of the Fund.
bBased on average daily shares outstanding.
| franklintempleton.com | The accompanying notes are an integral part of these financial statements. | Annual Report | 13 | ||||
FRANKLIN FEDERAL TAX-FREE INCOME FUND
Statement of Investments, April 30, 2017
| Principal Amount | Value | |||||||||
Municipal Bonds 98.1% |
| |||||||||
| Alabama 1.6% | ||||||||||
Alabama State Incentives Financing Authority Special Obligation Revenue, Series A, 5.00%, 9/01/42 | $ | 14,300,000 | $ | 15,831,530 | ||||||
Alabama State Port Authority Docks Facilities Revenue, Pre-Refunded, 6.00%, 10/01/40 | 6,000,000 | 6,940,020 | ||||||||
Alabama State Public Health Care Authority Lease Revenue, Department of Public Health Facilities, Refunding, 5.00%, 9/01/44 | 17,085,000 | 18,605,907 | ||||||||
Birmingham Airport Authority Airport Revenue, AGMC Insured, 5.50%, 7/01/40 | 20,000,000 | 21,959,200 | ||||||||
Birmingham Water Works Board Water Revenue, | ||||||||||
Series A, Assured Guaranty, Pre-Refunded, 5.125%, 1/01/34 | 5,600,000 | 5,978,560 | ||||||||
Series A, Assured Guaranty, Pre-Refunded, 5.25%, 1/01/39 | 5,000,000 | 5,348,250 | ||||||||
Series B, 5.00%, 1/01/38 | 3,500,000 | 3,879,120 | ||||||||
Series B, 5.00%, 1/01/43 | 8,000,000 | 8,822,640 | ||||||||
Subordinate, Refunding, Series B, 5.00%, 1/01/43 | 10,000,000 | 11,237,600 | ||||||||
Chatom IDB Gulf Opportunity Zone Revenue, | ||||||||||
PowerSouth Energy Cooperative, Refunding, Series A, Assured Guaranty, 5.00%, 8/01/30 | 5,250,000 | 5,737,042 | ||||||||
PowerSouth Energy Cooperative, Refunding, Series A, Assured Guaranty, 5.00%, 8/01/37 | 5,000,000 | 5,431,000 | ||||||||
Chilton County Health Care Authority Limited Obligation Sales Tax Revenue, Chilton County Hospital Project, Series A, 5.00%, 11/01/40 | 8,425,000 | 8,786,095 | ||||||||
East Alabama Health Care Authority Health Care Facilities Revenue, Mandatory Put 9/01/18, Series B, 5.50%, 9/01/33 | 18,500,000 | 19,433,695 | ||||||||
Leeds Public Educational Building Authority Educational Facilities Revenue, Assured Guaranty, Pre-Refunded, 5.125%, 4/01/38 | 10,865,000 | 11,279,500 | ||||||||
Limestone County Water and Sewer Authority Water Revenue, BAM Insured, 5.00%, 12/01/45 | 10,500,000 | 11,529,945 | ||||||||
Mobile Water and Sewer Commissioners Water and Sewer Revenue, Refunding, 5.00%, 1/01/36 | 11,300,000 | 12,636,677 | ||||||||
Phenix City Water and Sewer Revenue, | ||||||||||
wts., Refunding, Series A, BAM Insured, 5.00%, 8/15/27 | 2,900,000 | 3,359,360 | ||||||||
wts., Series A, AGMC Insured, 5.00%, 8/15/40 | 8,090,000 | 8,814,217 | ||||||||
Tuscaloosa Public Educational Building Authority Student Housing Revenue, Ridgecrest Student Housing LLC, University of Alabama Ridgecrest Residential Project, Assured Guaranty, Pre-Refunded, 6.75%, 7/01/38 | 15,000,000 | 16,002,000 | ||||||||
|
| |||||||||
| 201,612,358 | ||||||||||
|
| |||||||||
| Alaska 0.8% | ||||||||||
Alaska Energy Authority Power Revenue, Bradley Lake Project, Refunding, NATL Insured, 6.25%, 7/01/21 | 5,000 | 5,020 | ||||||||
Alaska Municipal Bond Bank Authority Revenue, | ||||||||||
Refunding, Series 3, 5.25%, 10/01/36 | 16,045,000 | 18,147,697 | ||||||||
Refunding, Series 3, 5.00%, 10/01/39 | 12,950,000 | 14,206,797 | ||||||||
Alaska State Industrial Development and Export Authority Revenue, Providence Health and Services, Series A, 5.00%, 10/01/40 | 10,000,000 | 10,713,500 | ||||||||
Alaska State International Airports Revenue, Series C, 5.00%, 10/01/33 | 12,565,000 | 13,827,908 | ||||||||
Anchorage Electric Revenue, senior lien, Refunding, Series A, 5.00%, 12/01/41 | 8,875,000 | 9,948,520 | ||||||||
Matanuska-Susitna Borough Lease Revenue, Goose Creek Correctional Center Project, Assured Guaranty, Pre-Refunded, 6.00%, 9/01/32 | 30,000,000 | 33,368,700 | ||||||||
|
| |||||||||
| 100,218,142 | ||||||||||
|
| |||||||||
| Arizona 2.7% | ||||||||||
Arizona Board of Regents Arizona State University System Revenue, Series C, 5.00%, 7/01/42 | 9,000,000 | 10,261,800 | ||||||||
Arizona Board of Regents University of Arizona Revenue, Stimulus Plan for Economic and Educational Development, 5.00%, 8/01/44 | 10,000,000 | 11,032,800 | ||||||||
Arizona State COP, | ||||||||||
Department of Administration, Series A, AGMC Insured, 5.25%, 10/01/26 | 8,500,000 | 9,285,825 | ||||||||
Department of Administration, Series A, AGMC Insured, 5.00%, 10/01/27 | 14,440,000 | 15,678,808 | ||||||||
Department of Administration, Series A, AGMC Insured, 5.25%, 10/01/28 | 10,000,000 | 10,919,500 | ||||||||
Department of Administration, Series A, AGMC Insured, 5.00%, 10/01/29 | 5,000,000 | 5,421,500 | ||||||||
| 14 | Annual Report | franklintempleton.com | ||
FRANKLIN FEDERAL TAX-FREE INCOME FUND
STATEMENT OF INVESTMENTS
| Principal Amount | Value | |||||||||
Municipal Bonds (continued) |
| |||||||||
| Arizona (continued) | ||||||||||
Arizona State COP, (continued) | ||||||||||
Department of Administration, Series B, AGMC Insured, 5.00%, 10/01/27 | $ | 8,000,000 | $ | 8,823,440 | ||||||
Arizona State Lottery Revenue, Series A, AGMC Insured, 5.00%, 7/01/27 | 15,000,000 | 16,434,300 | ||||||||
Glendale Municipal Property Corp. Excise Tax Revenue, Subordinate, Refunding, Series C, 5.00%, 7/01/38 | 15,500,000 | 17,255,995 | ||||||||
Lake Havasu Wastewater System Revenue, senior lien, Refunding, Series B, AGMC Insured, 5.00%, 7/01/40 | 15,000,000 | 16,810,800 | ||||||||
Maricopa County IDA Senior Living Facilities Revenue, Christian Care Retirement Apartments Inc. Project, Refunding, Series A, 5.00%, 1/01/36 | 5,000,000 | 5,487,800 | ||||||||
Maricopa County PCC, PCR, El Paso Electric Co. Palo Verde Project, Series A, 7.25%, 2/01/40 | 10,000,000 | 10,888,000 | ||||||||
Mesa Utility Systems Revenue, 4.00%, 7/01/36 | 19,000,000 | 20,050,510 | ||||||||
Phoenix Civic Improvement Corp. Airport Revenue, | ||||||||||
junior lien, Series A, 5.00%, 7/01/40 | 24,000,000 | 26,279,280 | ||||||||
senior lien, Series A, 5.00%, 7/01/33 | 28,000,000 | 29,196,160 | ||||||||
Phoenix Civic Improvement Corp. Distribution Revenue, | ||||||||||
Capital Appreciation, Civic Plaza Expansion Project, Series B, NATL Insured, 5.50%, 7/01/32 | 6,000,000 | 7,450,380 | ||||||||
Capital Appreciation, Civic Plaza Expansion Project, Series B, NATL Insured, 5.50%, 7/01/34 | 5,000,000 | 6,222,700 | ||||||||
Capital Appreciation, Civic Plaza Expansion Project, Series B, NATL Insured, 5.50%, 7/01/35 | 9,860,000 | 12,432,277 | ||||||||
Phoenix Civic Improvement Corp. Water System Revenue, | ||||||||||
junior lien, Series A, Pre-Refunded, 5.00%, 7/01/32 | 21,095,000 | 22,861,073 | ||||||||
junior lien, Series A, Pre-Refunded, 5.00%, 7/01/34 | 10,000,000 | 10,837,200 | ||||||||
Pima County IDA Lease Revenue, Clark County Detention Facility Project, 5.00%, 9/01/39 | 20,000,000 | 20,558,200 | ||||||||
Pima County Sewer System Revenue, Obligations, AGMC Insured, Pre-Refunded, 5.00%, 7/01/25 | 7,000,000 | 7,808,710 | ||||||||
Pinal County Electrical District No. 3 Electric System Revenue, Pre-Refunded, 5.25%, 7/01/36 | 10,000,000 | 11,585,900 | ||||||||
Salt River Project Agricultural Improvement and Power District Electric System Revenue, Salt River Project, Series A, Pre-Refunded, 5.00%, 1/01/38 | 10,000,000 | 10,270,900 | ||||||||
Tucson Water System Revenue, Series B, AGMC Insured, Pre-Refunded, 5.00%, 7/01/32 | 12,000,000 | 12,079,800 | ||||||||
|
| |||||||||
| 335,933,658 | ||||||||||
|
| |||||||||
| Arkansas 0.2% | ||||||||||
Benton Regional Public Water Authority Water Revenue, Refunding and Improvement, XLCA Insured, Pre-Refunded, 5.00%, 10/01/35 | 5,230,000 | 5,313,785 | ||||||||
University of Arkansas Revenue, | ||||||||||
Athletic Facilities, Fayetteville Campus, Series A, 5.00%, 9/15/36 | 8,330,000 | 9,607,822 | ||||||||
Various Facilities, Fayetteville Campus, Series B, 5.00%, 11/01/37 | 3,100,000 | 3,527,304 | ||||||||
Various Facilities, Fayetteville Campus, Series B, 5.00%, 11/01/42 | 9,360,000 | 10,522,418 | ||||||||
|
| |||||||||
| 28,971,329 | ||||||||||
|
| |||||||||
| California 12.2% | ||||||||||
Bay Area Toll Authority Toll Bridge Revenue, | ||||||||||
San Francisco Bay Area, Series F-1, Pre-Refunded, 5.00%, 4/01/28 | 24,000,000 | 25,817,280 | ||||||||
San Francisco Bay Area, Series F-1, Pre-Refunded, 5.00%, 4/01/34 | 20,250,000 | 21,008,970 | ||||||||
San Francisco Bay Area, Series F-1, Pre-Refunded, 5.00%, 4/01/34 | 9,530,000 | 10,251,612 | ||||||||
San Francisco Bay Area, Series F-1, Pre-Refunded, 5.00%, 4/01/39 | 14,000,000 | 14,524,720 | ||||||||
San Francisco Bay Area, Series F-1, Pre-Refunded, 5.50%, 4/01/43 | 30,000,000 | 31,260,300 | ||||||||
California Infrastructure and Economic Development Bank Revenue, Bay Area Toll Bridges Seismic Retrofit, first lien, Series A, AMBAC Insured, Pre-Refunded, 5.00%, 7/01/33 | 24,500,000 | 30,669,345 | ||||||||
California State Economic Recovery GO, Series A, Pre-Refunded, 5.25%, 7/01/21 | 28,580,000 | 31,189,355 | ||||||||
California State Educational Facilities Authority Revenue, Carnegie Institution of Washington, Refunding, Series A, 5.00%, 7/01/40 | 24,525,000 | 26,973,085 | ||||||||
| franklintempleton.com | Annual Report | 15 | ||
FRANKLIN FEDERAL TAX-FREE INCOME FUND
STATEMENT OF INVESTMENTS
| Principal Amount | Value | |||||||||
Municipal Bonds (continued) |
| |||||||||
| California (continued) | ||||||||||
California State GO, | ||||||||||
Refunding, NATL Insured, 5.00%, 10/01/32 | $ | 20,000 | $ | 20,052 | ||||||
Various Purpose, 6.00%, 5/01/18 | 370,000 | 379,494 | ||||||||
Various Purpose, 5.90%, 4/01/23 | 1,200,000 | 1,223,952 | ||||||||
Various Purpose, 5.00%, 10/01/29 | 15,000,000 | 16,320,450 | ||||||||
Various Purpose, 6.00%, 4/01/38 | 100,000,000 | 109,360,000 | ||||||||
Various Purpose, 6.00%, 11/01/39 | 25,000,000 | 28,039,000 | ||||||||
Various Purpose, 5.25%, 11/01/40 | 50,000,000 | 56,178,500 | ||||||||
Various Purpose, AGMC Insured, 6.00%, 4/01/38 | 30,000,000 | 32,808,000 | ||||||||
Various Purpose, FGIC Insured, 6.00%, 5/01/20 | 850,000 | 871,208 | ||||||||
Various Purpose, Pre-Refunded, 5.25%, 3/01/38 | 13,135,000 | 13,610,618 | ||||||||
Various Purpose, Refunding, 5.25%, 3/01/30 | 30,000,000 | 33,190,800 | ||||||||
Various Purpose, Refunding, 6.00%, 3/01/33 | 12,000,000 | 13,549,920 | ||||||||
Various Purpose, Refunding, 5.25%, 3/01/38 | 6,865,000 | 7,082,758 | ||||||||
Various Purpose, Refunding, 5.50%, 3/01/40 | 25,000,000 | 27,758,000 | ||||||||
California State Health Facilities Financing Authority Revenue, | ||||||||||
Children’s Hospital of Orange County, Series A, 6.50%, 11/01/24 | 5,000,000 | 5,649,300 | ||||||||
Children’s Hospital of Orange County, Series A, 6.50%, 11/01/38 | 8,000,000 | 8,915,200 | ||||||||
California State Public Works Board Lease Revenue, | ||||||||||
Department of Education, Riverside Campus Project, Series B, 6.125%, 4/01/28 | 2,740,000 | 2,988,710 | ||||||||
Department of General Services, Office Buildings 8 and 9 Renovation, Series A, | 3,980,000 | 4,360,528 | ||||||||
Department of General Services, Office Buildings 8 and 9 Renovation, Series A, | 5,000,000 | 5,489,850 | ||||||||
Various Capital Projects, Series A, 5.00%, 4/01/30 | 18,000,000 | 20,459,520 | ||||||||
Various Capital Projects, Series A, 5.00%, 4/01/33 | 12,475,000 | 14,098,621 | ||||||||
Various Capital Projects, Series A, AGMC Insured, 5.00%, 4/01/28 | 13,030,000 | 14,895,505 | ||||||||
Various Capital Projects, Series A, AGMC Insured, 5.00%, 4/01/29 | 21,000,000 | 23,943,150 | ||||||||
Various Capital Projects, Series G, Subseries G-1, Assured Guaranty, 5.25%, 10/01/24 | 5,000,000 | 5,491,100 | ||||||||
Various Capital Projects, Series I, Pre-Refunded, 6.125%, 11/01/29 | 29,300,000 | 32,936,130 | ||||||||
California State University Revenue, Systemwide, Series A, AGMC Insured, Pre-Refunded, 5.00%, 11/01/39 | 10,000,000 | 10,407,000 | ||||||||
California Statewide CDA, PCR, Refunding, 4.50%, 9/01/29 | 14,830,000 | 16,002,608 | ||||||||
California Statewide CDA Revenue, | ||||||||||
Adventist Health System/West, Series B, Assured Guaranty, Pre-Refunded, 5.00%, 3/01/37 | 9,800,000 | 10,148,488 | ||||||||
St. Joseph Health System, Series B, FGIC Insured, Pre-Refunded, 5.75%, 7/01/47 | 5,000,000 | 5,279,400 | ||||||||
St. Joseph Health System, Series E, AGMC Insured, Pre-Refunded, 5.25%, 7/01/47 | 10,000,000 | 10,501,200 | ||||||||
Colton Joint USD, GO, San Bernardino and Riverside Counties, Election of 2008, Series A, Assured Guaranty, Pre-Refunded, 5.375%, 8/01/34. | 25,000,000 | 27,403,500 | ||||||||
Corona-Norco USD, | ||||||||||
GO, Riverside County, Capital Appreciation, Election of 2006, Series C, AGMC Insured, zero cpn., 8/01/39 | 7,500,000 | 2,963,850 | ||||||||
GO, Riverside County, Capital Appreciation, Election of 2006, Series C, AGMC Insured, zero cpn. to 8/01/17, 6.20% thereafter, 8/01/29 | 3,250,000 | 4,275,050 | ||||||||
GO, Riverside County, Capital Appreciation, Election of 2006, Series C, AGMC Insured, zero cpn. to 8/01/17, 6.80% thereafter, 8/01/39 | 8,500,000 | 11,261,905 | ||||||||
East Side UHSD Santa Clara County GO, Election of 2008, Series B, Assured Guaranty, | 23,800,000 | 26,022,206 | ||||||||
| 16 | Annual Report | franklintempleton.com | ||
FRANKLIN FEDERAL TAX-FREE INCOME FUND
STATEMENT OF INVESTMENTS
| Principal Amount | Value | |||||||||
Municipal Bonds (continued) |
| |||||||||
| California (continued) | ||||||||||
Foothill/Eastern Transportation Corridor Agency Toll Road Revenue, | ||||||||||
Capital Appreciation, Refunding, Series A, AGMC Insured, zero cpn. to 1/15/24, 5.40% thereafter, 1/15/30 | $ | 15,475,000 | $ | 13,484,760 | ||||||
Capital Appreciation, Refunding, Series A, zero cpn. to 1/14/24, 6.85% thereafter, 1/15/42 | 20,000,000 | 16,652,400 | ||||||||
Refunding, Series A, 5.75%, 1/15/46 | 25,000,000 | 28,460,250 | ||||||||
Refunding, Series A, 6.00%, 1/15/49 | 20,000,000 | 23,000,600 | ||||||||
Hartnell Community College District GO, Monterey and San Benito Counties, Capital Appreciation, Election of 2002, Series D, Pre-Refunded, zero cpn., 8/01/39 | 45,000,000 | 10,173,600 | ||||||||
Jefferson UHSD San Mateo County GO, | ||||||||||
Capital Appreciation, Election of 2006, Series D, Pre-Refunded, zero cpn., 8/01/35 | 10,500,000 | 3,143,910 | ||||||||
Capital Appreciation, Election of 2006, Series D, Pre-Refunded, zero cpn., 8/01/40 | 10,000,000 | 1,977,400 | ||||||||
Capital Appreciation, Election of 2006, Series D, Pre-Refunded, zero cpn., 8/01/41 | 13,590,000 | 2,471,206 | ||||||||
Los Angeles Community College District GO, Election of 2008, Series C, Pre-Refunded, 5.25%, 8/01/39 | 30,000,000 | 33,885,000 | ||||||||
Los Angeles Department of Airports Revenue, | ||||||||||
Los Angeles International Airport, Senior, Refunding, Series A, 5.00%, 5/15/40 | 25,485,000 | 28,064,337 | ||||||||
Los Angeles International Airport, Senior, Series D, 5.00%, 5/15/40 | 50,000,000 | 55,060,500 | ||||||||
Los Angeles Department of Water and Power Revenue, Power System, Series B, 5.00%, 7/01/31 | 20,000,000 | 23,398,000 | ||||||||
Los Angeles USD, | ||||||||||
GO, Election of 2002, Series B, AMBAC Insured, Pre-Refunded, 4.50%, 7/01/31 | 28,745,000 | 28,915,170 | ||||||||
GO, Election of 2004, Series H, AGMC Insured, Pre-Refunded, 5.00%, 7/01/32 | 32,565,000 | 32,783,837 | ||||||||
GO, Series KRY, 5.25%, 7/01/34 | 36,625,000 | 40,969,457 | ||||||||
Montebello USD, GO, Election of 2004, Series A-1, Assured Guaranty, Pre-Refunded, 5.25%, 8/01/34 | 5,000,000 | 5,466,850 | ||||||||
M-S-R Energy Authority Gas Revenue, Series B, 6.50%, 11/01/39 | 12,500,000 | 17,455,000 | ||||||||
New Haven USD, | ||||||||||
GO, Alameda County, Capital Appreciation, Assured Guaranty, zero cpn., 8/01/31 | 2,055,000 | 1,243,131 | ||||||||
GO, Alameda County, Capital Appreciation, Assured Guaranty, zero cpn., 8/01/32 | 7,830,000 | 4,517,910 | ||||||||
GO, Alameda County, Capital Appreciation, Assured Guaranty, zero cpn., 8/01/33 | 7,660,000 | 4,209,170 | ||||||||
Placentia-Yorba Linda USD, GO, Orange County, Election of 2008, Series A, Pre-Refunded, 5.25%, 8/01/32 | 24,490,000 | 25,801,929 | ||||||||
Pomona USD, GO, Los Angeles County, Election of 2008, Series A, Assured Guaranty, Pre-Refunded, 5.00%, 8/01/29 | 5,585,000 | 6,075,586 | ||||||||
Rialto USD, GO, Capital Appreciation, Election of 2010, Series A, AGMC Insured, zero cpn., 8/01/36 | 20,000,000 | 9,393,000 | ||||||||
Richmond Joint Powers Financing Authority Lease Revenue, Civic Center Project, Refunding, Assured Guaranty, 5.75%, 8/01/29 | 13,315,000 | 14,559,020 | ||||||||
Sacramento County Airport System Revenue, Senior, Series B, AGMC Insured, 5.25%, 7/01/33 | 16,355,000 | 17,013,616 | ||||||||
San Diego Public Facilities Financing Authority Water Revenue, Series B, Pre-Refunded, 5.375%, 8/01/34 | 15,000,000 | 16,442,100 | ||||||||
San Francisco City and County COP, Multiple Capital Improvement Projects, Series A, 5.25%, 4/01/31 | 10,000,000 | 10,727,300 | ||||||||
San Joaquin Hills Transportation Corridor Agency Toll Road Revenue, | ||||||||||
Capital Appreciation, senior lien, ETM, zero cpn., 1/01/23 | 7,000,000 | 6,363,910 | ||||||||
senior lien, Refunding, Series A, 5.00%, 1/15/34 | 50,000,000 | 55,021,500 | ||||||||
San Jose RDA Tax Allocation, Merged Area Redevelopment Project, Refunding, Series D, Assured Guaranty, 5.00%, 8/01/22 | 10,000,000 | 10,092,500 | ||||||||
San Mateo UHSD, | ||||||||||
GO, Capital Appreciation, Election of 2010, Refunding, Series A, zero cpn. to 9/01/28, 6.70% thereafter, 9/01/41 | 20,000,000 | 15,757,800 | ||||||||
GO, Capital Appreciation, Election of 2010, Series A, zero cpn. to 9/01/28, 6.45% thereafter, 9/01/33 | 6,065,000 | 4,603,214 | ||||||||
San Mateo-Foster City School District GO, Capital Appreciation, Election of 2008, Series A, zero cpn. to 8/01/26, 6.625% thereafter, 8/01/42 | 50,000,000 | 40,506,500 | ||||||||
| franklintempleton.com | Annual Report | 17 | ||
FRANKLIN FEDERAL TAX-FREE INCOME FUND
STATEMENT OF INVESTMENTS
| Principal Amount | Value | |||||||||
Municipal Bonds (continued) |
| |||||||||
| California (continued) | ||||||||||
Santa Ana USD, | ||||||||||
GO, Orange County, Capital Appreciation, Election of 2008, Series B, Assured Guaranty, zero cpn., 8/01/35 | $ | 10,000,000 | $ | 4,777,500 | ||||||
GO, Orange County, Capital Appreciation, Election of 2008, Series B, Assured Guaranty, zero cpn., 8/01/36 | 18,865,000 | 8,557,730 | ||||||||
GO, Orange County, Capital Appreciation, Election of 2008, Series B, Assured Guaranty, zero cpn., 8/01/37 | 10,000,000 | 4,319,400 | ||||||||
Santa Clara County GO, Election of 2008, Series A, 5.00%, 8/01/34 | 25,000,000 | 26,998,500 | ||||||||
Upland USD, GO, San Bernardino County, Election of 2008, Series B, Pre-Refunded, zero cpn., 8/01/39 | 50,075,000 | 13,505,728 | ||||||||
Washington Township Health Care District Revenue, Series A, 6.25%, 7/01/39 | 3,000,000 | 3,197,220 | ||||||||
West Contra Costa USD, | ||||||||||
GO, Election of 2005, Series C-1, Assured Guaranty, zero cpn., 8/01/29 | 10,000,000 | 6,515,100 | ||||||||
GO, Election of 2005, Series C-1, Assured Guaranty, zero cpn., 8/01/30 | 20,845,000 | 13,011,866 | ||||||||
GO, Election of 2005, Series C-1, Assured Guaranty, zero cpn., 8/01/31 | 20,000,000 | 11,880,600 | ||||||||
GO, Election of 2005, Series C-1, Assured Guaranty, zero cpn., 8/01/32 | 10,730,000 | 6,044,746 | ||||||||
Whittier UHSD, GO, Los Angeles County, Capital Appreciation, Election of 2008, Refunding, Series A, zero cpn., 8/01/34 | 20,000,000 | 7,563,600 | ||||||||
|
| |||||||||
| 1,509,642,693 | ||||||||||
|
| |||||||||
| Colorado 2.3% | ||||||||||
Aurora Water Improvement Revenue, | ||||||||||
first lien, Series A, AMBAC Insured, Pre-Refunded, 5.00%, 8/01/32 | 10,000,000 | 10,101,000 | ||||||||
first lien, Series A, AMBAC Insured, Pre-Refunded, 5.00%, 8/01/36 | 41,235,000 | 41,651,473 | ||||||||
first lien, Series A, AMBAC Insured, Pre-Refunded, 5.00%, 8/01/39 | 26,930,000 | 27,201,993 | ||||||||
Colorado Health Facilities Authority Revenue, | ||||||||||
Catholic Health Initiatives, Series C-7, AGMC Insured, Pre-Refunded, 5.00%, 9/01/36 | 20,000,000 | 20,803,800 | ||||||||
Children’s Hospital Colorado Project, Series A, 5.00%, 12/01/41 | 5,000,000 | 5,566,500 | ||||||||
Children’s Hospital Colorado Project, Series A, 5.00%, 12/01/44 | 10,200,000 | 11,330,568 | ||||||||
The Evangelical Lutheran Good Samaritan Society Project, Refunding, Series A, 5.00%, 6/01/45 | 10,000,000 | 10,383,200 | ||||||||
Health Facility Authority, Hospital, Refunding, Series B, AGMC Insured, 5.25%, 3/01/36 | 20,000,000 | 21,195,400 | ||||||||
Hospital, Adventist Health System Sunbelt Obligated Group, Refunding, Series A, 5.00%, 11/15/41 | 30,505,000 | 33,872,447 | ||||||||
Valley View Hospital Assn. Project, Refunding, 5.50%, 5/15/28 | 5,000,000 | 5,174,400 | ||||||||
Valley View Hospital Assn. Project, Refunding, 5.75%, 5/15/36 | 7,000,000 | 7,213,150 | ||||||||
Colorado State Higher Education Capital Construction Lease Purchase Financing Program COP, | 10,000,000 | 10,668,900 | ||||||||
Denver City and County Airport System Revenue, | ||||||||||
Series C, NATL Insured, ETM, 6.125%, 11/15/25 | 3,590,000 | 4,517,118 | ||||||||
Series C, NATL Insured, Pre-Refunded, 6.125%, 11/15/25 | 4,410,000 | 4,427,067 | ||||||||
Subordinate, Series B, 5.25%, 11/15/33 | 16,405,000 | 19,303,271 | ||||||||
Park Creek Metropolitan District Revenue, Senior Limited Property Tax Supported, Improvement, Assured Guaranty, Pre-Refunded, 6.25%, 12/01/30 | 6,000,000 | 6,778,260 | ||||||||
Public Authority for Colorado Energy Natural Gas Purchase Revenue, 6.50%, 11/15/38 | 20,000,000 | 27,349,600 | ||||||||
Regional Transportation District Sales Tax Revenue, FasTracks Project, Series A, 5.00%, 11/01/32 | 10,000,000 | 11,598,800 | ||||||||
University of Colorado Enterprise Revenue, Series A, Pre-Refunded, 5.375%, 6/01/32 | 3,500,000 | 3,809,540 | ||||||||
|
| |||||||||
| 282,946,487 | ||||||||||
|
| |||||||||
Connecticut 0.1% | ||||||||||
Connecticut State GO, Series B, 5.00%, 6/15/35 | 7,000,000 | 7,720,440 | ||||||||
Connecticut State Health and Educational Facilities Authority Revenue, Child Care Facilities | 5,000,000 | 5,290,800 | ||||||||
|
| |||||||||
| 13,011,240 | ||||||||||
|
| |||||||||
| 18 | Annual Report | franklintempleton.com | ||
FRANKLIN FEDERAL TAX-FREE INCOME FUND
STATEMENT OF INVESTMENTS
| Principal Amount | Value | |||||||||
Municipal Bonds (continued) |
| |||||||||
| District of Columbia 2.6% | ||||||||||
District of Columbia Ballpark Revenue, | ||||||||||
Series B-1, BHAC Insured, 5.00%, 2/01/24 | $ | 12,120,000 | $ | 12,160,481 | ||||||
Series B-1, BHAC Insured, 5.00%, 2/01/25 | 7,000,000 | 7,023,380 | ||||||||
Series B-1, BHAC Insured, 5.00%, 2/01/26 | 9,950,000 | 9,983,034 | ||||||||
District of Columbia Hospital Revenue, | ||||||||||
Children’s Hospital Obligated Group Issue, Refunding, 5.00%, 7/15/40 | 6,830,000 | 7,554,595 | ||||||||
Children’s Hospital Obligated Group Issue, SubSeries 1, AGMC Insured, Pre-Refunded, 5.45%, 7/15/35 | 41,240,000 | 43,101,986 | ||||||||
District of Columbia Income Tax Secured Revenue, | ||||||||||
Refunding, Series A, 5.00%, 12/01/31 | 10,000,000 | 11,042,400 | ||||||||
Series A, 5.25%, 12/01/34 | 11,000,000 | 12,109,680 | ||||||||
District of Columbia Revenue, | ||||||||||
Assn. of American Medical Colleges Issue, Series B, 5.25%, 10/01/41 | 15,000,000 | 16,521,150 | ||||||||
Deed Tax, Housing Production Trust Fund, New Communities Project, Series A, NATL Insured, 5.00%, 6/01/32 | 5,000,000 | 5,012,900 | ||||||||
Georgetown University Issue, Growth and Income Securities, AMBAC Insured, zero cpn. to 4/01/18, 5.00% thereafter, 4/01/32 | 15,370,000 | 15,758,554 | ||||||||
Medlantic/Helix Issue, Series B, AGMC Insured, Pre-Refunded, 5.00%, 8/15/38 | 20,000,000 | 20,231,200 | ||||||||
National Academy of Sciences Project, Series A, 5.00%, 4/01/35 | 10,905,000 | 11,942,284 | ||||||||
National Academy of Sciences Project, Series A, 5.00%, 4/01/40 | 16,960,000 | 18,517,437 | ||||||||
National Public Radio Inc. Issue, Pre-Refunded, 5.00%, 4/01/35 | 7,750,000 | 8,585,295 | ||||||||
District of Columbia Tobacco Settlement FICO Revenue, Asset-Backed, Refunding, 6.50%, 5/15/33 | 34,180,000 | 38,771,741 | ||||||||
District of Columbia University Revenue, Georgetown University Issue, Series D, Pre-Refunded, 5.50%, 4/01/36 | 5,000,000 | 5,316,650 | ||||||||
District of Columbia Water and Sewer Authority Public Utility Revenue, senior lien, Series A, Pre-Refunded, 6.00%, 10/01/35 | 8,000,000 | 8,568,400 | ||||||||
Metropolitan Washington Airports Authority Airport System Revenue, | ||||||||||
Refunding, Series A, 5.375%, 10/01/29 | 5,000,000 | 5,250,750 | ||||||||
Refunding, Series A, 5.00%, 10/01/35 | 5,000,000 | 5,506,050 | ||||||||
Refunding, Series C, 5.25%, 10/01/27 | 10,745,000 | 11,331,784 | ||||||||
Series A, 5.00%, 10/01/39 | 5,000,000 | 5,473,100 | ||||||||
Series C, 5.00%, 10/01/26 | 10,235,000 | 10,759,748 | ||||||||
Metropolitan Washington Airports Authority Dulles Toll Road Revenue, Convertible Capital Appreciation, second senior lien, Series C, Assured Guaranty, 6.50%, 10/01/41 | 25,000,000 | 31,868,000 | ||||||||
|
| |||||||||
| 322,390,599 | ||||||||||
|
| |||||||||
| Florida 6.5% | ||||||||||
Brevard County Health Facilities Authority Health Facilities Revenue, Health First Inc. Project, Series B, Pre-Refunded, 7.00%, 4/01/39 | 6,500,000 | 7,224,490 | ||||||||
Brevard County Local Option Fuel Tax Revenue, | ||||||||||
NATL Insured, Pre-Refunded, 5.00%, 8/01/32 | 12,440,000 | 12,565,644 | ||||||||
NATL Insured, Pre-Refunded, 5.00%, 8/01/37 | 25,245,000 | 25,499,974 | ||||||||
Broward County HFAR, | ||||||||||
MFH, Heron Pointe Apartments Project, Series A, 5.65%, 11/01/22 | 400,000 | 401,352 | ||||||||
MFH, Heron Pointe Apartments Project, Series A, 5.70%, 11/01/29 | 225,000 | 225,700 | ||||||||
Broward County Water and Sewer Utility Revenue, Series A, Pre-Refunded, 5.25%, 10/01/34 | 8,800,000 | 9,326,504 | ||||||||
Cape Coral Water and Sewer Revenue, Refunding, Series A, AGMC Insured, 5.00%, 10/01/42 | 21,510,000 | 23,808,774 | ||||||||
Celebration CDD Special Assessment, Series B, NATL Insured, 5.50%, 5/01/19 | 40,000 | 40,129 | ||||||||
Citizens Property Insurance Corp. Revenue, | ||||||||||
Costal Account, senior secured, Series A-1, 5.00%, 6/01/20 | 20,000,000 | 22,167,600 | ||||||||
High-Risk Account, senior secured, Series A-1, 5.25%, 6/01/17 | 24,250,000 | 24,329,782 | ||||||||
High-Risk Account, senior secured, Series A-1, 5.50%, 6/01/17 | 10,000,000 | 10,034,800 | ||||||||
High-Risk Account, senior secured, Series A-1, 6.00%, 6/01/17 | 25,000,000 | 25,096,750 | ||||||||
| franklintempleton.com | Annual Report | 19 | ||
FRANKLIN FEDERAL TAX-FREE INCOME FUND
STATEMENT OF INVESTMENTS
| Principal Amount | Value | |||||||||
Municipal Bonds (continued) |
| |||||||||
| Florida (continued) | ||||||||||
Clearwater City Water and Sewer Revenue, Series A, Pre-Refunded, 5.25%, 12/01/39 | $ | 7,000,000 | $ | 7,730,590 | ||||||
Dade County HFA, MFMR, Siesta Pointe Apartments, Series A, AGMC Insured, 5.75%, 9/01/29 | 1,890,000 | 1,896,785 | ||||||||
Deltona Utility System Revenue, Refunding, AGMC Insured, 5.125%, 10/01/39 | 5,000,000 | 5,634,000 | ||||||||
Florida Gulf Coast University FICO Capital Improvement Revenue, Housing Project, Series A, NATL Insured, 5.00%, 2/01/37 | 10,000,000 | 10,010,600 | ||||||||
Florida State Board of Education Public Education GO, Capital Outlay, Refunding, Series D, 6.00%, 6/01/23 | 17,500,000 | 21,781,725 | ||||||||
Florida State Mid-Bay Bridge Authority Revenue, | ||||||||||
Capital Appreciation, Series A, AMBAC Insured, Pre-Refunded, zero cpn., 10/01/23 | 5,000,000 | 3,679,600 | ||||||||
Capital Appreciation, Series A, AMBAC Insured, Pre-Refunded, zero cpn., 10/01/24 | 3,000,000 | 2,085,060 | ||||||||
Florida State Municipal Loan Council Revenue, Series D, AGMC Insured, 5.50%, 10/01/41 | 4,750,000 | 5,439,842 | ||||||||
Hillsborough County Aviation Authority Revenue, | ||||||||||
Tampa International Airport, Series A, Assured Guaranty, 5.50%, 10/01/38 | 5,000,000 | 5,254,400 | ||||||||
Tampa International Airport, Subordinated, Refunding, Series B, 5.00%, 10/01/44 | 10,000,000 | 11,095,400 | ||||||||
Hillsborough County IDA, PCR, Tampa Electric Co. Project, Series A, 5.65%, 5/15/18 | 6,500,000 | 6,781,710 | ||||||||
Hillsborough County School Board COP, Master Lease Program, Refunding, Series A, 5.00%, 7/01/28 | 17,650,000 | 20,516,007 | ||||||||
Indian River County School Board COP, NATL Insured, Pre-Refunded, 5.00%, 7/01/27 | 16,485,000 | 16,593,306 | ||||||||
Lee Memorial Health System Hospital Revenue, Series A, AMBAC Insured, 5.00%, 4/01/37 | 11,000,000 | 11,022,330 | ||||||||
Martin County Health Facilities Authority Hospital Revenue, | ||||||||||
Martin Memorial Medical Center, 5.50%, 11/15/42 | 3,800,000 | 4,142,608 | ||||||||
Martin Memorial Medical Center, AGMC Insured, 5.50%, 11/15/42 | 3,800,000 | 4,189,652 | ||||||||
Miami Beach RDA Tax Increment Revenue, City Center, Refunding, Series A, AGMC Insured, 5.00%, 2/01/44 | 12,000,000 | 13,072,440 | ||||||||
Miami Beach Resort Tax Revenue, 5.00%, 9/01/40 | 11,000,000 | 12,266,650 | ||||||||
Miami Beach Water and Sewer Revenue, AMBAC Insured, 5.00%, 9/01/30 | 3,000,000 | 3,007,530 | ||||||||
Miami-Dade County Aviation Revenue, | ||||||||||
Miami International Airport, Hub of the Americas, Refunding, Series A, 5.50%, 10/01/36 | 20,000,000 | 21,772,800 | ||||||||
Miami International Airport, Hub of the Americas, Refunding, Series A, Assured Guaranty, 5.25%, 10/01/33 | 8,625,000 | 9,043,830 | ||||||||
Miami International Airport, Hub of the Americas, Series A, Assured Guaranty, Pre-Refunded, 5.25%, 10/01/38 | 5,640,000 | 5,965,146 | ||||||||
Miami International Airport, Refunding, Series A, Assured Guaranty, 5.25%, 10/01/38 | 7,360,000 | 7,704,742 | ||||||||
Miami International Airport, Series A, Assured Guaranty, Pre-Refunded, 5.25%, 10/01/33 | 2,375,000 | 2,511,919 | ||||||||
Miami-Dade County Expressway Authority Toll System Revenue, | ||||||||||
Refunding, Series A, 5.00%, 7/01/29 | 10,000,000 | 11,463,900 | ||||||||
Refunding, Series A, 5.00%, 7/01/32 | 6,375,000 | 7,237,856 | ||||||||
Series A, 5.00%, 7/01/40 | 30,265,000 | 32,954,348 | ||||||||
Miami-Dade County GO, Building Better Communities Program, Series B-1, Pre-Refunded, 5.75%, 7/01/33 | 20,000,000 | 21,117,600 | ||||||||
Miami-Dade County School Board COP, | ||||||||||
Master Lease Purchase Agreement, Series A, NATL Insured, Pre-Refunded, 5.00%, 5/01/25 | 5,000,000 | 5,000,000 | ||||||||
Refunding, Series A, 5.00%, 5/01/31 | 10,000,000 | 11,312,300 | ||||||||
Series A, Assured Guaranty, Pre-Refunded, 5.25%, 2/01/27 | 10,000,000 | 10,738,400 | ||||||||
Miami-Dade County Special Obligation Revenue, | ||||||||||
sub. bond, Refunding, Series B, 5.00%, 10/01/31 | 5,000,000 | 5,672,200 | ||||||||
sub. bond, Refunding, Series B, 5.00%, 10/01/32 | 4,500,000 | 5,097,645 | ||||||||
sub. bond, Refunding, Series B, 5.00%, 10/01/35 | 3,250,000 | 3,622,158 | ||||||||
Miami-Dade County Transit System Sales Surtax Revenue, | ||||||||||
AGMC Insured, 5.00%, 7/01/38 | 18,845,000 | 19,554,326 | ||||||||
Refunding, 5.00%, 7/01/35 | 7,000,000 | 7,919,870 | ||||||||
Miami-Dade County Water and Sewer System Revenue, Refunding, Series A, 5.00%, 10/01/42 | 20,000,000 | 22,099,400 | ||||||||
| 20 | Annual Report | franklintempleton.com | ||
FRANKLIN FEDERAL TAX-FREE INCOME FUND
STATEMENT OF INVESTMENTS
| Principal Amount | Value | |||||||||
Municipal Bonds (continued) |
| |||||||||
| Florida (continued) | ||||||||||
Orange County Health Facilities Authority Revenue, | ||||||||||
Hospital, Orlando Health Obligated Group, Refunding, Series A, 5.00%, 10/01/39 | $ | 6,000,000 | $ | 6,640,080 | ||||||
Hospital, Orlando Health Obligated Group, Refunding, Series B, AGMC Insured, 5.00%, 12/01/32 | 15,780,000 | 16,498,621 | ||||||||
Hospital, Orlando Health Obligated Group, Series B, AGMC Insured, Pre-Refunded, 5.00%, 12/01/32 | 11,220,000 | 11,904,757 | ||||||||
Presbyterian Retirement Communities, 5.00%, 8/01/47 | 14,000,000 | 14,971,600 | ||||||||
Orange County School Board COP, Series A, Assured Guaranty, Pre-Refunded, 5.50%, 8/01/34 | 15,000,000 | 16,465,950 | ||||||||
Orlando Tourist Development Tax Revenue, 6th Cent Contract Payments, second lien, Subordinate, Series B, Assured Guaranty, 5.50%, 11/01/38 | 18,490,000 | 18,821,526 | ||||||||
Orlando-Orange County Expressway Authority Revenue, | ||||||||||
Series A, 5.00%, 7/01/40 | 3,005,000 | 3,285,547 | ||||||||
Series A, AGMC Insured, Pre-Refunded, 5.00%, 7/01/32 | 12,000,000 | 12,079,800 | ||||||||
Series A, Pre-Refunded, 5.00%, 7/01/40 | 1,995,000 | 2,222,191 | ||||||||
Series C, Pre-Refunded, 5.00%, 7/01/40 | 15,000,000 | 16,732,950 | ||||||||
Palm Beach County Solid Waste Authority Revenue, Improvement, Series B, Pre-Refunded, 5.50%, 10/01/28 | 10,000,000 | 10,626,000 | ||||||||
Pensacola Airport Revenue, Refunding, 6.25%, 10/01/38 | 16,500,000 | 17,216,265 | ||||||||
Pinellas County Sewer Revenue, AGMC Insured, 5.00%, 10/01/32 | 610,000 | 611,604 | ||||||||
Port St. Lucie Utility System Revenue, | ||||||||||
Assured Guaranty, Pre-Refunded, 5.25%, 9/01/35 | 2,755,000 | 2,910,134 | ||||||||
Refunding, 4.00%, 9/01/33 | 4,000,000 | 4,183,800 | ||||||||
Refunding, 4.00%, 9/01/34 | 2,500,000 | 2,598,650 | ||||||||
Refunding, 4.00%, 9/01/36 | 4,000,000 | 4,125,640 | ||||||||
Refunding, Assured Guaranty, 5.25%, 9/01/35 | 245,000 | 257,162 | ||||||||
South Broward Hospital District Revenue, | ||||||||||
South Broward Hospital District Obligated Group, Pre-Refunded, 5.00%, 5/01/36 | 12,500,000 | 13,002,375 | ||||||||
South Broward Hospital District Obligated Group, Refunding, 4.75%, 5/01/28 | 10,000,000 | 10,000,000 | ||||||||
South Lake County Hospital District Revenue, South Lake Hospital Inc., Series A, 6.25%, 4/01/39 | 5,735,000 | 6,117,123 | ||||||||
South Miami Health Facilities Authority Hospital Revenue, Baptist Health South Florida Obligated Group, 5.00%, 8/15/32 | 31,070,000 | 31,308,307 | ||||||||
St. Lucie County Transportation Revenue, AMBAC Insured, Pre-Refunded, 5.00%, 8/01/27 | 5,785,000 | 5,843,428 | ||||||||
Sunrise Utilities System Revenue, | ||||||||||
AMBAC Insured, Pre-Refunded, 5.20%, 10/01/22 | 860,000 | 948,571 | ||||||||
Refunding, AMBAC Insured, 5.20%, 10/01/22 | 1,140,000 | 1,205,254 | ||||||||
Tallahassee Energy System Revenue, Refunding, NATL Insured, 5.00%, 10/01/37 | 20,000,000 | 20,297,200 | ||||||||
Tohopekaliga Water Authority Utility System Revenue, Refunding, 5.00%, 10/01/46 | 5,000,000 | 5,635,250 | ||||||||
Town of Davie Water and Sewer Revenue, AGMC Insured, 5.00%, 10/01/32 | 8,575,000 | 9,694,552 | ||||||||
|
| |||||||||
| 803,914,511 | ||||||||||
|
| |||||||||
| Georgia 4.1% | ||||||||||
Albany Dougherty Payroll Development Authority Revenue, Darton College Project, AGMC Insured, 5.75%, 6/15/41 | 5,550,000 | 6,232,983 | ||||||||
Athens-Clarke County Unified Government Water and Sewerage Revenue, Pre-Refunded, 5.50%, 1/01/38 | 14,500,000 | 15,569,520 | ||||||||
Atlanta Airport General Revenue, | ||||||||||
Refunding, Series C, 6.00%, 1/01/30 | 15,000,000 | 17,308,500 | ||||||||
Series A, AGMC Insured, 5.00%, 1/01/40 | 9,215,000 | 10,005,186 | ||||||||
The Atlanta Development Authority Revenue, | ||||||||||
New Downtown Atlanta Stadium Project, senior lien, Series A-1, 5.25%, 7/01/44 | 3,000,000 | 3,431,580 | ||||||||
Tuff Yamacraw LLC Project, Refunding, Series A, AMBAC Insured, 5.00%, 1/01/24 | 6,385,000 | 7,253,743 | ||||||||
Tuff Yamacraw LLC Project, Refunding, Series A, AMBAC Insured, 5.00%, 1/01/25 | 6,955,000 | 7,925,988 | ||||||||
Tuff Yamacraw LLC Project, Refunding, Series A, AMBAC Insured, 5.00%, 1/01/26 | 5,000,000 | 5,712,500 | ||||||||
Tuff Yamacraw LLC Project, Refunding, Series A, AMBAC Insured, 5.00%, 1/01/27 | 5,000,000 | 5,711,400 | ||||||||
| franklintempleton.com | Annual Report | 21 | ||
FRANKLIN FEDERAL TAX-FREE INCOME FUND
STATEMENT OF INVESTMENTS
| Principal Amount | Value | |||||||||
Municipal Bonds (continued) |
| |||||||||
| Georgia (continued) | ||||||||||
Atlanta Water and Wastewater Revenue, | ||||||||||
Refunding, 5.00%, 11/01/40 | $ | 30,000,000 | $ | 34,122,600 | ||||||
Refunding, Series B, AGMC Insured, 5.25%, 11/01/34 | 30,000,000 | 32,852,700 | ||||||||
Refunding, Series B, AGMC Insured, 5.375%, 11/01/39 | 23,000,000 | 25,174,190 | ||||||||
Series A, Pre-Refunded, 6.25%, 11/01/34 | 20,000,000 | 22,517,000 | ||||||||
Bleckley-Dodge County Joint Development Authority Student Housing Facilities Revenue, | ||||||||||
MGC Real Estate Foundation II LLC Project, 5.00%, 7/01/33 | 5,000,000 | 5,197,050 | ||||||||
MGC Real Estate Foundation II LLC Project, 5.25%, 7/01/38 | 10,000,000 | 10,419,200 | ||||||||
Bulloch County Development Authority Student Housing Revenue, | ||||||||||
Georgia Southern University Housing Foundation Four LLC Project, Assured Guaranty, 5.25%, 7/01/33 | 14,825,000 | 15,467,516 | ||||||||
Georgia Southern University Housing Foundation Four LLC Project, Assured Guaranty, 5.375%, 7/01/39 | 23,075,000 | 24,072,532 | ||||||||
Burke County Development Authority PCR, | ||||||||||
Oglethorpe Power Corp. Vogtle Project, Series B, 5.50%, 1/01/33 | 15,000,000 | 15,359,700 | ||||||||
Oglethorpe Power Corp. Vogtle Project, Series E, 7.00%, 1/01/23 | 25,000,000 | 25,912,250 | ||||||||
Cherokee County Water and Sewerage Authority Revenue, NATL Insured, 6.90%, 8/01/18 | 15,000 | 15,064 | ||||||||
Clarke County Hospital Authority Revenue, Piedmont Health Care, Refunding, Series A, 5.00%, 7/01/46 | 10,835,000 | 11,938,220 | ||||||||
Clayton County Development Authority Student Housing and Activity Center Revenue, CSU Foundation Real Estate I LLC Project, XLCA Insured, 5.00%, 7/01/33 | 11,125,000 | 11,184,964 | ||||||||
Dahlonega Water and Wastewater Revenue, Series A, Assured Guaranty, Pre-Refunded, 5.50%, 9/01/37 | 6,450,000 | 6,834,420 | ||||||||
DeKalb Newton and Gwinnett Counties Joint Development Authority Revenue, Georgia Gwinnett College Foundation LLC Project, Pre-Refunded, 6.00%, 7/01/34 | 10,000,000 | 11,050,300 | ||||||||
Fayette County Hospital Authority Revenue, Anticipation Certificates, Piedmont Fayette Hospital Project, Refunding, Series A, 5.00%, 7/01/39 | 11,420,000 | 12,549,324 | ||||||||
Fulton County Development Authority Revenue, Piedmont Healthcare Inc. Project, Refunding, Series A, 5.00%, 7/01/46 | 11,005,000 | 12,125,529 | ||||||||
Gainesville and Hall County Hospital Authority Revenue, Anticipation Certificates, Northeast Georgia Health System Inc. Project, Refunding, Series A, 5.00%, 2/15/45 | 9,040,000 | 9,888,042 | ||||||||
Georgia State Higher Education Facilities Authority Revenue, | ||||||||||
USG Real Estate Foundation I LLC Project, Assured Guaranty, Pre-Refunded, 5.625%, 6/15/38 | 5,000,000 | 5,259,550 | ||||||||
USG Real Estate Foundation I LLC Project, Pre-Refunded, 6.25%, 6/15/40 | 13,970,000 | 14,791,855 | ||||||||
USG Real Estate Foundation II LLC Project, Series A, 5.50%, 6/15/34 | 10,000,000 | 10,825,800 | ||||||||
USG Real Estate Foundation III LLC Project, Series A, 5.00%, 6/15/40 | 3,700,000 | 3,937,799 | ||||||||
USG Real Estate Foundation III LLC Project, Series A, Assured Guaranty, 5.00%, 6/15/38 | 6,845,000 | 7,369,806 | ||||||||
USG Real Estate Foundation III LLC Project, Series A, Assured Guaranty, Pre-Refunded, 5.00%, 6/15/38 | 2,405,000 | 2,683,715 | ||||||||
USG Real Estate Foundation III LLC Project, Series A, Pre-Refunded, 5.00%, 6/15/40 | 1,300,000 | 1,450,657 | ||||||||
Houston County Hospital Authority Revenue, Anticipation Certificates, Houston Healthcare Project, Pre-Refunded, 5.25%, 10/01/35 | 10,485,000 | 10,672,472 | ||||||||
Main Street Natural Gas Inc. Revenue, Gas Project, Series A, 5.50%, 9/15/28 | 5,000,000 | 5,936,100 | ||||||||
Medical Center Hospital Authority Revenue, | ||||||||||
Anticipation Certificates, Columbus Regional Healthcare System Inc. Project, Assured Guaranty, Pre-Refunded, 6.50%, 8/01/38 | 10,000,000 | 10,683,500 | ||||||||
Anticipation Certificates, Columbus Regional Healthcare System Inc. Project, Refunding, AGMC Insured, 5.00%, 8/01/41 | 7,500,000 | 7,955,325 | ||||||||
Private Colleges and Universities Authority Revenue, | ||||||||||
Emory University, Refunding, Series A, 5.00%, 9/01/41 | 10,000,000 | 11,317,400 | ||||||||
Emory University, Refunding, Series A, 5.00%, 10/01/43 | 10,000,000 | 11,446,700 | ||||||||
Emory University, Refunding, Series C, 5.25%, 9/01/39 | 21,000,000 | 22,819,650 | ||||||||
| 22 | Annual Report | franklintempleton.com | ||
FRANKLIN FEDERAL TAX-FREE INCOME FUND
STATEMENT OF INVESTMENTS
| Principal Amount | Value | |||||||||
Municipal Bonds (continued) |
| |||||||||
| Georgia (continued) | ||||||||||
Savannah EDA Revenue, SSU Community Development I LLC Project, Assured Guaranty, 5.75%, 6/15/41 | $ | 10,000,000 | $ | 11,220,900 | ||||||
|
| |||||||||
| 504,203,230 | ||||||||||
|
| |||||||||
| Hawaii 0.2% | ||||||||||
Hawaii State Department of Budget and Finance Special Purpose Revenue, Hawaiian Electric Co. Inc.and Subsidiary Projects, 6.50%, 7/01/39 | 7,500,000 | 8,135,250 | ||||||||
Honolulu City and County MFHR, Waipahu Towers Project, Series A, GNMA Secured, 6.90%, 6/20/35 | 1,020,000 | 1,024,335 | ||||||||
Honolulu City and County Wastewater System Revenue, First Bond Resolution, Senior Series A, 5.00%, 7/01/38 | 10,000,000 | 11,242,900 | ||||||||
|
| |||||||||
| 20,402,485 | ||||||||||
|
| |||||||||
| Idaho 0.1% | ||||||||||
Idaho State Health Facilities Authority Revenue, St. Luke’s Health System Project, Series A, 6.75%, 11/01/37 | 12,500,000 | 13,392,875 | ||||||||
|
| |||||||||
| Illinois 6.0% | ||||||||||
Bolingbrook GO, Will and DuPage Counties, Capital Appreciation, Refunding, Series A, zero cpn., 1/01/36 | 19,000,000 | 7,358,890 | ||||||||
Bourbonnais Industrial Project Revenue, Olivet Nazarene University Project, Assured Guaranty, 5.125%, 11/01/37 | 5,000,000 | 5,090,200 | ||||||||
Chicago GO, Lakefront Millennium Project, Parking Facilities, NATL Insured, ETM, 5.75%, 1/01/23 | 8,955,000 | 10,685,733 | ||||||||
Chicago Midway Airport Revenue, | ||||||||||
Refunding, Series B, 5.00%, 1/01/46 | 18,420,000 | 20,122,745 | ||||||||
Refunding, Series C, Assured Guaranty, 5.50%, 1/01/24 | 18,460,000 | 21,528,421 | ||||||||
Chicago O’Hare International Airport Revenue, | ||||||||||
General Airport, senior lien, Series D, 5.25%, 1/01/42 | 10,000,000 | 11,476,600 | ||||||||
General Airport, senior lien, Series D, 5.00%, 1/01/47 | 18,000,000 | 20,040,120 | ||||||||
General Airport, third lien, Series A, 5.75%, 1/01/39 | 5,000,000 | 5,639,700 | ||||||||
General Airport, third lien, Series A, AGMC Insured, Pre-Refunded, 5.00%, 1/01/28 | 24,915,000 | 25,589,947 | ||||||||
General Airport, third lien, Series C, Assured Guaranty, 5.25%, 1/01/35 | 39,485,000 | 42,548,246 | ||||||||
Chicago Transit Authority Sales Tax Receipts Revenue, 5.25%, 12/01/40 | 10,000,000 | 10,738,400 | ||||||||
Chicago Wastewater Transmission Revenue, | ||||||||||
Project, second lien, 5.00%, 1/01/42 | 10,525,000 | 10,990,731 | ||||||||
second lien, Series A, BHAC Insured, 5.50%, 1/01/38 | 18,000,000 | 18,403,920 | ||||||||
Illinois Health Facilities Authority Revenue, | ||||||||||
Loyola University Health System, Series A, NATL Insured, ETM, 5.625%, 7/01/18 | 2,105,000 | 2,214,565 | ||||||||
South Suburban Hospital, ETM, 7.00%, 2/15/18 | 590,000 | 617,830 | ||||||||
Illinois State Finance Authority Revenue, | ||||||||||
Alexian Brothers Health System, Series A, AGMC Insured, Pre-Refunded, 5.50%, 1/01/28 | 45,000,000 | 46,943,550 | ||||||||
Art Institute of Chicago, Refunding, Series A, 5.25%, 3/01/40 | 16,000,000 | 16,955,040 | ||||||||
Carle Foundation, Refunding, Series A, 5.00%, 2/15/45 | 20,000,000 | 21,498,400 | ||||||||
Columbia College, NATL Insured, Pre-Refunded, 5.00%, 12/01/32 | 15,440,000 | 15,805,619 | ||||||||
Edward Hospital Obligated Group, Series A, AMBAC Insured, Pre-Refunded, 5.50%, 2/01/40 | 4,000,000 | 4,136,440 | ||||||||
Mercy Health System Obligated Group, Refunding, 5.00%, 12/01/46 | 40,000,000 | 42,455,200 | ||||||||
Northwest Community Hospital, Refunding, Series A, 5.00%, 7/01/36 | 7,490,000 | 8,228,140 | ||||||||
Resurrection Health Care, Series B, AGMC Insured, Pre-Refunded, 5.25%, 5/15/29 | 26,695,000 | 27,878,122 | ||||||||
Riverside Health System, Pre-Refunded, 6.25%, 11/15/35 | 2,930,000 | 3,292,617 | ||||||||
Riverside Health System, Refunding, 6.25%, 11/15/35 | 2,070,000 | 2,286,791 | ||||||||
Rush University Medical Center Obligated Group, Series B, NATL Insured, Pre-Refunded, 5.75%, 11/01/28 | 2,500,000 | 2,676,475 | ||||||||
Rush University Medical Center Obligated Group, Series B, NATL Insured, Pre-Refunded, 5.25%, 11/01/35 | 3,000,000 | 3,189,570 | ||||||||
Rush University Medical Center Obligated Group, Series B, Pre-Refunded, 7.25%, 11/01/38 | 10,000,000 | 10,927,900 | ||||||||
| franklintempleton.com | Annual Report | 23 | ||
FRANKLIN FEDERAL TAX-FREE INCOME FUND
STATEMENT OF INVESTMENTS
| Principal Amount | Value | |||||||||
Municipal Bonds (continued) |
| |||||||||
| Illinois (continued) | ||||||||||
Illinois State Finance Authority Revenue, (continued) | ||||||||||
Sherman Health Systems, Series A, Pre-Refunded, 5.50%, 8/01/37 | $ | 5,000,000 | $ | 5,052,800 | ||||||
Southern Illinois HealthCare Enterprise Inc., AGMC Insured, 5.375%, 3/01/35 | 8,500,000 | 9,191,900 | ||||||||
Illinois State Finance Authority Student Housing Revenue, | ||||||||||
CHF-DeKalb II LLC, Northern Illinois University Project, 6.875%, 10/01/43 | 15,000,000 | 16,695,300 | ||||||||
CHF-Normal LLC, Illinois State University Project, 7.00%, 4/01/43 | 7,500,000 | 8,370,075 | ||||||||
Illinois State GO, | ||||||||||
5.25%, 7/01/30 | 16,915,000 | 17,415,684 | ||||||||
5.50%, 7/01/33 | 5,000,000 | 5,214,200 | ||||||||
5.50%, 7/01/38 | 20,000,000 | 20,417,000 | ||||||||
AGMC Insured, 5.00%, 3/01/26 | 4,000,000 | 4,244,120 | ||||||||
AGMC Insured, 5.00%, 3/01/27 | 11,500,000 | 12,149,635 | ||||||||
AGMC Insured, 5.00%, 9/01/29 | 9,965,000 | 9,978,652 | ||||||||
Assured Guaranty, 5.25%, 4/01/34 | 10,000,000 | 10,154,400 | ||||||||
Refunding, 5.00%, 1/01/24 | 12,820,000 | 13,231,522 | ||||||||
Refunding, AGMC Insured, 5.00%, 1/01/23 | 10,000,000 | 10,567,900 | ||||||||
Illinois State Sales Tax Revenue, Build Illinois, Series B, Pre-Refunded, 5.25%, 6/15/34 | 15,000,000 | 16,295,400 | ||||||||
Illinois State Toll Highway Authority Toll Highway Revenue, Senior, Refunding, Series A-1, 5.00%, 1/01/31 | 10,245,000 | 11,168,382 | ||||||||
Metropolitan Pier and Exposition Authority Dedicated State Tax Revenue, | ||||||||||
Capital Appreciation, McCormick Place Expansion Project, Refunding, Series B, NATL Insured, 5.50%, 6/15/20 | 6,680,000 | 6,778,196 | ||||||||
Capital Appreciation, McCormick Place Expansion Project, Refunding, Series B, NATL Insured, 5.55%, 6/15/21 | 4,215,000 | 4,277,424 | ||||||||
Capital Appreciation, McCormick Place Expansion Project, Refunding, Series B, NATL Insured,zero cpn. to 6/14/17, 5.65% thereafter, 6/15/22 | 27,355,000 | 30,701,337 | ||||||||
Capital Appreciation, McCormick Place Expansion Project, Series B, NATL Insured, ETM, zero cpn. to 6/14/17, 5.65% thereafter, 6/15/22 | 2,645,000 | 3,143,292 | ||||||||
Capital Appreciation, McCormick Place Expansion Project, Series B, NATL Insured, Pre-Refunded, 5.50%, 6/15/20 | 1,560,000 | 1,584,008 | ||||||||
Capital Appreciation, McCormick Place Expansion Project, Series B, NATL Insured, Pre-Refunded, 5.55%, 6/15/21 | 1,785,000 | 1,812,578 | ||||||||
Metropolitan Pier and Exposition Authority Hospitality Facilities Revenue, McCormick Place Convention Center, ETM, 7.00%, 7/01/26 | 12,000,000 | 15,154,800 | ||||||||
Metropolitan Pier and Exposition Authority Revenue, | ||||||||||
McCormick Place Expansion Project, Series A, 5.00%, 6/15/42 | 5,000,000 | 5,033,350 | ||||||||
McCormick Place Expansion Project, Series A, 5.50%, 6/15/50 | 15,000,000 | 15,339,000 | ||||||||
Northern Illinois Municipal Power Agency Power Project Revenue, Refunding, Series A, 5.00%, 12/01/41 | 5,500,000 | 5,970,360 | ||||||||
Railsplitter Tobacco Settlement Authority Revenue, Refunding, 6.00%, 6/01/28 | 14,530,000 | 16,604,739 | ||||||||
Regional Transportation Authority GO, Cook DuPage Kane Lake McHenry and Will Counties, Series A, AMBAC Insured, 7.20%, 11/01/20 | 610,000 | 673,867 | ||||||||
Saline Valley Conservancy District Waterworks Revenue, Saline, Gallatin, Hamilton, Hardin, | ||||||||||
Williamson, Pope, Johnson and White Counties, Refunding, Series A, AMBAC Insured, 5.00%, 1/01/41 | 7,000,000 | 7,059,430 | ||||||||
Southwestern Illinois Development Authority Revenue, | ||||||||||
Capital Appreciation, Local Government Program, AGMC Insured, zero cpn., 12/01/24 | 3,850,000 | 3,060,866 | ||||||||
Capital Appreciation, Local Government Program, AGMC Insured, zero cpn., 12/01/26 | 7,700,000 | 5,590,893 | ||||||||
St. Clair County School District No. 189 East St. Louis GO, Alternate Revenue Source, Refunding, AMBAC Insured, 5.125%, 1/01/28 | 7,135,000 | 7,196,718 | ||||||||
| 24 | Annual Report | franklintempleton.com | ||
FRANKLIN FEDERAL TAX-FREE INCOME FUND
STATEMENT OF INVESTMENTS
| Principal Amount | Value | |||||||||
Municipal Bonds (continued) |
| |||||||||
| Illinois (continued) | ||||||||||
University of Illinois University Revenue, | ||||||||||
Auxiliary Facilities System, Refunding, Series A, 5.125%, 4/01/36 | $ | 2,950,000 | $ | 3,216,061 | ||||||
Auxiliary Facilities System, Refunding, Series A, 5.25%, 4/01/41 | 5,000,000 | 5,460,400 | ||||||||
Auxiliary Facilities System, Series A, Pre-Refunded, 5.75%, 4/01/38 | 7,000,000 | 7,622,230 | ||||||||
Upper River Valley Development Authority Environmental Facilities Revenue, General Electric Co. Project, 5.45%, 2/01/23 | 3,600,000 | 3,611,160 | ||||||||
|
| |||||||||
| 739,357,591 | ||||||||||
|
| |||||||||
| Indiana 1.8% | ||||||||||
Indiana Bond Bank Revenue, Special Program, Hendricks Regional Health Project, Series A, 5.50%, 2/01/29 | 9,000,000 | 9,588,330 | ||||||||
Indiana Finance Authority Revenue, | ||||||||||
BHI Senior Living, Series A, 5.25%, 11/15/46 | 5,000,000 | 5,348,050 | ||||||||
Deaconess Health System Obligated Group, Refunding, Series A, 5.00%, 3/01/39 | 5,000,000 | 5,527,450 | ||||||||
Educational Facilities, Marian University Project, 6.375%, 9/15/41 | 12,500,000 | 13,804,375 | ||||||||
Stadium Project, Refunding, Series A, 5.25%, 2/01/37 | 10,000,000 | 11,466,900 | ||||||||
Indiana Finance Authority Wastewater Utility Revenue, | ||||||||||
CWA Authority Project, first lien, Refunding, Series A, 5.00%, 10/01/39 | 30,000,000 | 34,281,000 | ||||||||
CWA Authority Project, first lien, Series A, 5.00%, 10/01/37 | 5,000,000 | 5,666,750 | ||||||||
CWA Authority Project, first lien, Series A, 5.25%, 10/01/38 | 12,000,000 | 13,660,320 | ||||||||
CWA Authority Project, first lien, Series A, 4.00%, 10/01/42 | 22,615,000 | 22,922,112 | ||||||||
Indiana Health and Educational Facility Financing Authority Revenue, Sisters of St. Francis Health Services Inc. Obligated Group, Series E, AGMC Insured, Pre-Refunded, 5.25%, 5/15/41 | 3,750,000 | 3,909,975 | ||||||||
Indiana State Finance Authority Environmental Revenue, Duke Energy Indiana Inc. Project, Refunding, Series B, 6.00%, 8/01/39 | 10,000,000 | 10,788,500 | ||||||||
Indiana State Finance Authority Hospital Revenue, Deaconess Hospital Obligated Group, Series A, Pre-Refunded, 6.75%, 3/01/39 | 9,750,000 | 10,738,260 | ||||||||
Indiana State Municipal Power Agency Revenue, | ||||||||||
Power Supply System, Refunding, Series A, 4.00%, 1/01/42 | 5,860,000 | 5,918,073 | ||||||||
Power Supply System, Refunding, Series A, 5.00%, 1/01/42 | 21,290,000 | 23,933,366 | ||||||||
Power Supply System, Series B, Pre-Refunded, 6.00%, 1/01/39 | 4,000,000 | 4,327,920 | ||||||||
Indianapolis Local Public Improvement Bond Bank Revenue, | ||||||||||
Pilot Infrastructure Project, Series F, AGMC Insured, 5.00%, 1/01/35 | 10,000,000 | 10,776,100 | ||||||||
Waterworks Project, Refunding, Series A, Assured Guaranty, 5.50%, 1/01/38 | 7,030,000 | 7,471,484 | ||||||||
Waterworks Project, Series A, Assured Guaranty, Pre-Refunded, 5.50%, 1/01/38 | 1,620,000 | 1,740,884 | ||||||||
Indianapolis Water System Revenue, first lien, Refunding, Series B, 5.00%, 10/01/37 | 15,000,000 | 17,035,050 | ||||||||
Northern Indiana Commuter Transportation District Industrial Revenue, Limited Obligation, 5.00%, 7/01/41 | 6,000,000 | 6,675,060 | ||||||||
University of Southern Indiana Revenue, Student Fee, Series J, Assured Guaranty, 5.75%, 10/01/28 | 2,000,000 | 2,203,520 | ||||||||
|
| |||||||||
| 227,783,479 | ||||||||||
|
| |||||||||
| Kansas 0.7% | ||||||||||
Butler County USD No. 490 GO, School Building, Series B, BAM Insured, 4.00%, 9/01/43 | 10,000,000 | 10,226,500 | ||||||||
Kansas State Development Finance Authority Hospital Revenue, Adventist Health System/Sunbelt Obligated Group, Refunding, Series C, 5.75%, 11/15/38 | 6,250,000 | 6,814,750 | ||||||||
a | University of Kansas Hospital Authority Health Facilities Revenue, Kansas University Health System, Refunding, Series A, 5.00%, 3/01/47 | 23,115,000 | 25,586,918 | |||||||
Wyandotte County Kansas City Unified Government Utility System Revenue, | ||||||||||
Improvement, Refunding, Series A, 5.00%, 9/01/44 | 3,000,000 | 3,308,880 | ||||||||
Improvement, Series A, 5.00%, 9/01/45 | 10,000,000 | 11,075,000 | ||||||||
Improvement, Series C, 5.00%, 9/01/41 | 5,000,000 | 5,588,050 | ||||||||
Improvement, Series C, 5.00%, 9/01/46 | 16,565,000 | 18,443,471 | ||||||||
| franklintempleton.com | Annual Report | 25 | ||
FRANKLIN FEDERAL TAX-FREE INCOME FUND
STATEMENT OF INVESTMENTS
| Principal Amount | Value | |||||||||
Municipal Bonds (continued) |
| |||||||||
| Kansas (continued) | ||||||||||
Wyandotte County Kansas City Unified Government Utility System Revenue, (continued) | ||||||||||
Series A, BHAC Insured, Pre-Refunded, 5.25%, 9/01/34 | $ | 5,000,000 | $ | 5,381,000 | ||||||
|
| |||||||||
| 86,424,569 | ||||||||||
|
| |||||||||
| Kentucky 0.9% | ||||||||||
Carroll County Environmental Facilities Revenue, Kentucky Utilities Co. Project, Series A, AMBAC Insured, 5.75%, 2/01/26 | 12,500,000 | 13,025,875 | ||||||||
Jefferson County Capital Projects Corp. Lease Revenue, Refunding, Series A, zero cpn., 8/15/17 | 7,115,000 | 7,088,105 | ||||||||
Kentucky Economic Development Finance Authority Health System Revenue, Norton Healthcare Inc., Capital Appreciation, Refunding, Series B, NATL Insured, zero cpn., 10/01/18 | 8,585,000 | 8,415,275 | ||||||||
Kentucky Economic Development Finance Authority Louisville Arena Project Revenue, Louisville Arena Authority Inc., Series A, Subseries A-1, Assured Guaranty, 6.00%, 12/01/38 | 4,000,000 | 4,138,760 | ||||||||
Kentucky State Municipal Power Agency Power System Revenue, | ||||||||||
Prairie State Project, Refunding, Series A, NATL Insured, 5.00%, 9/01/35 | 7,750,000 | 8,602,810 | ||||||||
Prairie State Project, Refunding, Series A, NATL Insured, 5.00%, 9/01/42 | 10,000,000 | 10,871,600 | ||||||||
Prairie State Project, Series A, NATL Insured, Pre-Refunded, 5.00%, 9/01/32 | 10,000,000 | 10,135,100 | ||||||||
Prairie State Project, Series A, NATL Insured, Pre-Refunded, 5.00%, 9/01/37 | 10,000,000 | 10,135,100 | ||||||||
Kentucky State Property and Buildings Commission Revenues, | ||||||||||
Project No. 90, Pre-Refunded, 5.50%, 11/01/28 | 13,230,000 | 14,104,768 | ||||||||
Project No. 90, Refunding, 5.50%, 11/01/28 | 1,770,000 | 1,879,120 | ||||||||
Louisville/Jefferson County Metro Government Revenue, | ||||||||||
College, Bellarmine University Project, Refunding and Improvement, Series A, 6.00%, 5/01/33 | 3,000,000 | 3,082,770 | ||||||||
Health Facilities, Jewish Hospital and St. Mary’s Healthcare Inc. Project, Pre-Refunded, 6.125%, 2/01/37 | 11,500,000 | 11,949,880 | ||||||||
Paducah Electric Plant Board Revenue, Series A, Assured Guaranty, Pre-Refunded, 5.25%, 10/01/35 | 7,000,000 | 7,556,150 | ||||||||
|
| |||||||||
| 110,985,313 | ||||||||||
|
| |||||||||
Louisiana 2.5% | ||||||||||
East Baton Rouge Sewerage Commission Revenue, Series A, Pre-Refunded, 5.25%, 2/01/39 | 6,000,000 | 6,437,640 | ||||||||
Lafayette Communications System Revenue, | ||||||||||
Refunding, AGMC Insured, 5.00%, 11/01/30 | 5,000,000 | 5,668,750 | ||||||||
XLCA Insured, Pre-Refunded, 5.25%, 11/01/27 | 12,485,000 | 12,750,431 | ||||||||
Lafayette Public Trust Financing Authority Revenue, | ||||||||||
Ragin’ Cajun Facilities Inc., Housing and Parking Project, AGMC Insured, Pre-Refunded, 5.00%, 10/01/25 | 5,500,000 | 6,188,545 | ||||||||
Ragin’ Cajun Facilities Inc., Housing and Parking Project, AGMC Insured, Pre-Refunded, 5.50%, 10/01/41 | 15,000,000 | 17,127,600 | ||||||||
Ragin’ Cajun Facilities Inc., Housing and Parking Project, Assured Guaranty, Pre-Refunded, 5.50%, 10/01/35 | 6,000,000 | 6,851,040 | ||||||||
Louisiana Local Government Environmental Facilities and CDA Revenue, | ||||||||||
Bossier City Public Improvement Projects, AMBAC Insured, Pre-Refunded, 5.00%, 11/01/32 | 6,730,000 | 6,868,167 | ||||||||
East Baton Rouge Sewerage Commission Projects, sub. lien, Series A, 5.00%, 2/01/44 | 5,820,000 | 6,310,975 | ||||||||
LCTCS Act 360 Project, 5.00%, 10/01/39 | 10,000,000 | 11,012,600 | ||||||||
LCTCS Facilities Corp. Project, Series B, Assured Guaranty, 5.00%, 10/01/26 | 2,750,000 | 2,964,803 | ||||||||
Southeastern Louisiana University, Student Union/University Facilities Inc. Project, Series A, AGMC Insured, 5.00%, 10/01/40 | 8,545,000 | 9,309,350 | ||||||||
Louisiana Public Facilities Authority Hospital Revenue, Franciscan Missionaries of Our Lady Health System Project, Series A, Pre-Refunded, 6.75%, 7/01/39 | 10,000,000 | 11,152,900 | ||||||||
Louisiana Public Facilities Authority Revenue, | ||||||||||
Millennium Housing LLC Student Housing, Student Housing and Auxiliary Facilities Project, Assured Guaranty, 5.00%, 11/01/30 | 10,000,000 | 10,137,900 | ||||||||
Ochsner Clinic Foundation Project, Pre-Refunded, 6.75%, 5/15/41 | 15,500,000 | 18,781,660 | ||||||||
Ochsner Clinic Foundation Project, Refunding, 5.00%, 5/15/47 | 7,500,000 | 8,037,450 | ||||||||
| 26 | Annual Report | franklintempleton.com | ||
FRANKLIN FEDERAL TAX-FREE INCOME FUND
STATEMENT OF INVESTMENTS
| Principal Amount | Value | |||||||||
Municipal Bonds (continued) |
| |||||||||
| Louisiana (continued) | ||||||||||
Louisiana Public Facilities Authority Revenue, (continued) | ||||||||||
Ochsner Clinic Foundation Project, Series B, 5.25%, 5/15/38 | $ | 7,405,000 | $ | 7,422,846 | ||||||
Ochsner Clinic Foundation Project, Series B, 5.50%, 5/15/47 | 7,205,000 | 7,223,445 | ||||||||
Ochsner Clinic Foundation Project, Series B, ETM, 5.75%, 5/15/23 | 10,000,000 | 12,255,100 | ||||||||
Ochsner Clinic Foundation Project, Series B, Pre-Refunded, 5.25%, 5/15/38 | 2,855,000 | 2,859,111 | ||||||||
Ochsner Clinic Foundation Project, Series B, Pre-Refunded, 5.50%, 5/15/47 | 2,795,000 | 2,799,276 | ||||||||
Louisiana State Citizens Property Insurance Corp. Assessment Revenue, Series C-2, Assured Guaranty, Pre-Refunded, 6.75%, 6/01/26 | 21,000,000 | 22,305,150 | ||||||||
Louisiana State Gasoline and Fuels Tax Revenue, second lien, Series B, 5.00%, 5/01/45 | 13,690,000 | 14,866,519 | ||||||||
Louisiana State Public Facilities Authority Lease Revenue, Provident Group, Flagship Property, Louisiana University Nicholson Gateway, Series A, 5.00%, 7/01/51 | 26,145,000 | 28,111,627 | ||||||||
Shreveport Water and Sewer Revenue, Series B, 5.00%, 12/01/41 | 10,000,000 | 10,888,500 | ||||||||
St. Charles Parish Consolidated Waterworks and Wastewater District No. 1 Revenue, Series A, AMBAC Insured, Pre-Refunded, 5.00%, 7/01/36 | 6,230,000 | 6,271,429 | ||||||||
St. John the Baptist Parish Revenue, Marathon Oil Corp. Project, Series A, 5.125%, 6/01/37 | 49,100,000 | 49,255,647 | ||||||||
|
| |||||||||
| 303,858,461 | ||||||||||
|
| |||||||||
Maine 0.4% | ||||||||||
Maine State Educational Loan Authority Student Loan Revenue, Supplemental Education Loan Program, Series A-3, Assured Guaranty, 5.875%, 12/01/39 | 19,360,000 | 20,739,594 | ||||||||
Maine State Health and Higher Educational Facilities Authority Revenue, | ||||||||||
Maine General Medical Center Issue, 6.75%, 7/01/36 | 4,250,000 | 4,605,512 | ||||||||
Maine General Medical Center Issue, 7.00%, 7/01/41 | 10,000,000 | 10,946,200 | ||||||||
Portland Airport Revenue, | ||||||||||
General, AGMC Insured, 5.25%, 1/01/35 | 3,000,000 | 3,232,740 | ||||||||
General, AGMC Insured, 5.00%, 1/01/40 | 6,000,000 | 6,375,660 | ||||||||
|
| |||||||||
| 45,899,706 | ||||||||||
|
| |||||||||
Maryland 0.8% | ||||||||||
Baltimore Project Revenue, | ||||||||||
Subordinate Project, Wastewater Projects, Series C, 5.00%, 7/01/39 | 10,000,000 | 11,192,400 | ||||||||
Subordinate Project, Wastewater Projects, Series C, 5.00%, 7/01/44 | 10,000,000 | 11,113,500 | ||||||||
Subordinate Project, Water Projects, Series A, 5.00%, 7/01/39 | 9,430,000 | 10,554,433 | ||||||||
Subordinate Project, Water Projects, Series A, 5.00%, 7/01/44 | 5,500,000 | 6,112,425 | ||||||||
Wastewater Projects, Series C, 5.00%, 7/01/38 | 5,000,000 | 5,634,900 | ||||||||
Wastewater Projects, Series C, 5.00%, 7/01/43 | 10,000,000 | 11,205,400 | ||||||||
Maryland State EDC, PCR, Potomac Electric Project, Refunding, 6.20%, 9/01/22 | 5,000,000 | 5,450,550 | ||||||||
Maryland State Health and Higher Educational Facilities Authority Revenue, | ||||||||||
Adventist HealthCare Issue, Series A, 5.50%, 1/01/46 | 12,500,000 | 14,021,500 | ||||||||
Anne Arundel Health System Issue, Series A, Pre-Refunded, 6.75%, 7/01/39 | 3,000,000 | 3,363,000 | ||||||||
LifeBridge Health Issue, Assured Guaranty, 5.00%, 7/01/34 | 7,715,000 | 7,756,970 | ||||||||
LifeBridge Health Issue, Assured Guaranty, Pre-Refunded, 5.00%, 7/01/28 | 1,125,000 | 1,132,481 | ||||||||
LifeBridge Health Issue, Assured Guaranty, Pre-Refunded, 5.00%, 7/01/34 | 1,285,000 | 1,293,545 | ||||||||
LifeBridge Health Issue, Refunding, Assured Guaranty, 5.00%, 7/01/28 | 1,875,000 | 1,886,250 | ||||||||
University of Maryland Medical System Issue, Series B, NATL Insured, ETM, 7.00%, 7/01/22 | 150,000 | 178,176 | ||||||||
Upper Chesapeake Hospitals Issue, Series C, Pre-Refunded, 6.00%, 1/01/38 | 5,000,000 | 5,166,600 | ||||||||
|
| |||||||||
| 96,062,130 | ||||||||||
|
| |||||||||
Massachusetts 3.3% | ||||||||||
Massachusetts Bay Transportation Authority Revenue, | ||||||||||
Assessment, Series A, Pre-Refunded, 5.25%, 7/01/34 | 19,520,000 | 20,498,343 | ||||||||
Assessment, Series A, Pre-Refunded, 5.25%, 7/01/34 | 8,110,000 | 8,506,822 | ||||||||
Massachusetts Bay Transportation Authority Sales Tax Revenue, Refunding, Senior Series A, 5.00%, 7/01/28 | 10,000,000 | 12,366,400 | ||||||||
| franklintempleton.com | Annual Report | 27 | ||
FRANKLIN FEDERAL TAX-FREE INCOME FUND
STATEMENT OF INVESTMENTS
| Principal Amount | Value | |||||||||
Municipal Bonds (continued) |
| |||||||||
| Massachusetts (continued) | ||||||||||
Massachusetts State Department of Transportation Metropolitan Highway System Revenue, Senior, Refunding, Series B, 5.00%, 1/01/37 | $ | 31,000,000 | $ | 33,347,320 | ||||||
Massachusetts State Development Finance Agency Revenue, | ||||||||||
Brandeis University Issue, Refunding, Series O-1, 5.00%, 10/01/40 | 19,865,000 | 21,387,255 | ||||||||
Dana-Farber Cancer Institute, Series N, 5.00%, 12/01/41 | 10,135,000 | 11,275,593 | ||||||||
Partners Healthcare System Issue, Refunding, Series Q, 5.00%, 7/01/47 | 15,000,000 | 16,539,600 | ||||||||
Wellesley College Issue, Series J, 5.00%, 7/01/42 | 10,000,000 | 11,192,800 | ||||||||
Worcester Polytechnic Institute Issue, NATL Insured, Pre-Refunded, 5.00%, 9/01/37 | 7,470,000 | 7,570,920 | ||||||||
Worcester Polytechnic Institute Issue, NATL Insured, Pre-Refunded, 5.00%, 9/01/47 | 19,010,000 | 19,266,825 | ||||||||
Worcester Polytechnic Institute Issue, Refunding, NATL Insured, 5.00%, 9/01/37 | 2,530,000 | 2,557,931 | ||||||||
Worcester Polytechnic Institute Issue, Refunding, NATL Insured, 5.00%, 9/01/47 | 6,040,000 | 6,104,084 | ||||||||
Massachusetts State Educational Financing Authority Education Loan Revenue, | ||||||||||
Issue I, 6.00%, 1/01/28 | 7,885,000 | 8,340,122 | ||||||||
Refunding, Series K, 5.25%, 7/01/29 | 6,940,000 | 7,511,995 | ||||||||
Series H, Assured Guaranty, 6.35%, 1/01/30 | 2,735,000 | 2,785,871 | ||||||||
Massachusetts State GO, | ||||||||||
Consolidated Loan, Series C, AMBAC Insured, Pre-Refunded, 5.00%, 8/01/37 | 10,000,000 | 10,101,000 | ||||||||
Consolidated Loan, Series G, 4.00%, 9/01/42 | 20,000,000 | 20,580,400 | ||||||||
Massachusetts State Health and Educational Facilities Authority Revenue, | ||||||||||
Berklee College of Music Issue, Refunding, Series A, 5.00%, 10/01/37 | 490,000 | 496,894 | ||||||||
Berklee College of Music Issue, Series A, Pre-Refunded, 5.00%, 10/01/37 | 9,510,000 | 9,672,336 | ||||||||
CareGroup Issue, Series A, NATL Insured, Pre-Refunded, 5.00%, 7/01/25 | 750,000 | 837,158 | ||||||||
Emmanuel College Issue, NATL Insured, Pre-Refunded, 5.00%, 7/01/37 | 31,685,000 | 31,895,705 | ||||||||
Harvard Pilgrim Health Care Issue, Series A, AGMC Insured, 5.00%, 7/01/18 | 1,585,000 | 1,587,599 | ||||||||
Northeastern University Issue, Series A, 5.00%, 10/01/35 | 20,000,000 | 21,975,400 | ||||||||
Northeastern University Issue, Series R, 5.00%, 10/01/33 | 6,830,000 | 7,157,567 | ||||||||
Springfield College Issue, Pre-Refunded, 5.50%, 10/15/31 | 1,710,000 | 1,890,935 | ||||||||
Springfield College Issue, Pre-Refunded, 5.625%, 10/15/40 | 7,000,000 | 7,761,740 | ||||||||
Massachusetts State HFAR, Housing, Series B, 7.00%, 12/01/38 | 9,140,000 | 9,613,543 | ||||||||
Massachusetts State School Building Authority Dedicated Sales Tax Revenue, Series A, AMBAC Insured, Pre-Refunded, 4.50%, 8/15/35 | 30,000,000 | 30,308,700 | ||||||||
Massachusetts State Transportation Fund Revenue, Accelerated Bridge Program, Series A, 4.00%, 6/01/35 | 10,000,000 | 10,431,700 | ||||||||
Massachusetts State Water Pollution Abatement Trust Revenue, Massachusetts State Water Resources Authority Program, Series A, 5.00%, 8/01/32 | 225,000 | 225,567 | ||||||||
Massachusetts State Water Pollution Abatement Trust Water Pollution Abatement Revenue, | ||||||||||
Massachusetts Water Resources Authority Program, Subordinate, Refunding, Series A, 5.75%, 8/01/29 | 450,000 | 451,517 | ||||||||
Massachusetts Water Resources Authority Revenue, General, Green Bond, Refunding, Series C, 5.00%, 8/01/40 | 30,000,000 | 34,549,800 | ||||||||
University of Massachusetts Building Authority Project Revenue, Senior Series 1, 5.00%, 11/01/39 | 20,000,000 | 22,509,600 | ||||||||
|
| |||||||||
| 411,299,042 | ||||||||||
|
| |||||||||
Michigan 2.7% | ||||||||||
Detroit City School District GO, | ||||||||||
School Building and Site Improvement, Refunding, Series A, 5.00%, 5/01/30 | 1,245,000 | 1,354,274 | ||||||||
School Building and Site Improvement, Refunding, Series A, 5.00%, 5/01/33 | 1,500,000 | 1,615,095 | ||||||||
Detroit Sewage Disposal System Revenue, second lien, Series B, NATL Insured, 5.00%, 7/01/36 | 10,000 | 10,037 | ||||||||
Detroit Water and Sewerage Department Sewage Disposal System Revenue, | ||||||||||
senior lien, Refunding, Series A, 5.25%, 7/01/39 | 12,000,000 | 13,287,600 | ||||||||
senior lien, Refunding, Series A, AGMC Insured, 5.00%, 7/01/39 | 10,000,000 | 10,899,400 | ||||||||
| 28 | Annual Report | franklintempleton.com | ||
FRANKLIN FEDERAL TAX-FREE INCOME FUND
STATEMENT OF INVESTMENTS
| Principal Amount | Value | |||||||||
Municipal Bonds (continued) |
| |||||||||
| Michigan (continued) | ||||||||||
Detroit Water Supply System Revenue,second lien, | ||||||||||
Series B, AGMC Insured, Pre-Refunded, 7.00%, 7/01/36 | $ | 5,000,000 | $ | 5,625,900 | ||||||
senior lien, Series B, NATL Insured, 5.00%, 7/01/34 | 10,000 | 10,027 | ||||||||
Jackson County Hospital Finance Authority Revenue, W.A. Foote Memorial Hospital, Series C, Assured Guaranty, Pre-Refunded, 5.00%, 6/01/26 | 15,000,000 | 16,693,050 | ||||||||
Michigan Finance Authority Revenue, | ||||||||||
Beaumont Health Credit Group, Series A, 5.00%, 11/01/44 | 20,925,000 | 22,860,353 | ||||||||
School District of the City of Detroit, Pre-Refunded, 5.50%, 6/01/21 | 10,000,000 | 10,335,400 | ||||||||
Michigan Hospital Finance Authority Revenue, | ||||||||||
Ascension Health Senior Credit Group, Refunding, Series F-8, 5.00%, 11/15/47 | 10,000,000 | 11,104,100 | ||||||||
MidMichigan Obligated Group, Series A, Pre-Refunded, 6.00%, 6/01/29 | 4,000,000 | 4,404,960 | ||||||||
MidMichigan Obligated Group, Series A, Pre-Refunded, 6.125%, 6/01/39 | 5,000,000 | 5,519,050 | ||||||||
Trinity Health Credit Group, Refunding, Series A-1, 6.50%, 12/01/33 | 745,000 | 804,317 | ||||||||
Trinity Health Credit Group, Refunding, Series C, 5.00%, 12/01/34 | 9,230,000 | 10,166,383 | ||||||||
Trinity Health Credit Group, Refunding, Series MI, 5.00%, 12/01/39 | 29,610,000 | 32,230,485 | ||||||||
Trinity Health Credit Group, Refunding, Series MI, 5.00%, 12/01/45 | 10,000,000 | 11,043,000 | ||||||||
Trinity Health Credit Group, Series A-1, Pre-Refunded, 6.50%, 12/01/33 | 24,255,000 | 26,281,748 | ||||||||
Trinity Health Credit Group, Series C, Pre-Refunded, 5.00%, 12/01/34 | 770,000 | 898,821 | ||||||||
Trinity Health Credit Group, Series MI, Pre-Refunded, 5.00%, 12/01/39 | 140,000 | 161,665 | ||||||||
Michigan State Building Authority Revenue, | ||||||||||
Facilities Program, Refunding, Series I, 6.25%, 10/15/38 | 440,000 | 471,249 | ||||||||
Facilities Program, Refunding, Series I-A, 5.375%, 10/15/36 | 6,730,000 | 7,661,634 | ||||||||
Facilities Program, Refunding, Series I-A, 5.25%, 10/15/44 | 20,655,000 | 23,309,994 | ||||||||
Facilities Program, Series H, 5.125%, 10/15/33 | 12,500,000 | 13,523,000 | ||||||||
Facilities Program, Series H, AGMC Insured, 5.00%, 10/15/26 | 5,000,000 | 5,435,800 | ||||||||
Facilities Program, Series I, Pre-Refunded, 6.25%, 10/15/38 | 14,560,000 | 15,653,165 | ||||||||
Michigan State GO, | ||||||||||
Environmental Program, Series A, Pre-Refunded, 6.00%, 11/01/24 | 1,000,000 | 1,097,440 | ||||||||
Environmental Program, Series A, Pre-Refunded, 5.50%, 11/01/25 | 1,000,000 | 1,087,600 | ||||||||
Michigan State Strategic Fund Limited Obligation Revenue, | ||||||||||
The Detroit Edison Co. Exempt Facilities Project, Refunding, Series KT, 5.625%, 7/01/20 | 7,000,000 | 7,860,370 | ||||||||
The Detroit Edison Co. Pollution Control Bonds Project, Refunding, Collateralized Series BB, | 250,000 | 299,355 | ||||||||
Michigan Tobacco Settlement Finance Authority Revenue, Tobacco Settlement Asset-Backed, Senior Series A, 6.00%, 6/01/34 | 40,000,000 | 38,834,400 | ||||||||
Royal Oak Hospital Finance Authority Hospital Revenue, | ||||||||||
William Beaumont Hospital Obligated Group, Series V, Pre-Refunded, 8.25%, 9/01/39 | 20,000,000 | 21,901,800 | ||||||||
William Beaumont Hospital Obligated Group, Series W, Pre-Refunded, 6.375%, 8/01/29 | 10,000,000 | 11,159,000 | ||||||||
|
| |||||||||
| 333,600,472 | ||||||||||
|
| |||||||||
Minnesota 0.2% | ||||||||||
Minneapolis Health Care System Revenue, | ||||||||||
Fairview Health Services, Series A, Pre-Refunded, 6.625%, 11/15/28 | 11,000,000 | 11,933,790 | ||||||||
Fairview Health Services, Series A, Pre-Refunded, 6.75%, 11/15/32 | 6,250,000 | 6,792,437 | ||||||||
St. Cloud Health Care Revenue, CentraCare Health System, Refunding, Series A, 5.00%, 5/01/46 | 5,000,000 | 5,529,750 | ||||||||
|
| |||||||||
| 24,255,977 | ||||||||||
|
| |||||||||
Mississippi 0.7% | ||||||||||
Mississippi Business Finance Corp. PCR, System Energy Resource Inc. Project, Refunding, 5.875%, 4/01/22 | 27,930,000 | 28,004,573 | ||||||||
Mississippi Development Bank Special Obligation Revenue, | ||||||||||
City of Jackson Capital City Convention Center Project, Refunding, Series A, 5.00%, 3/01/36 | 10,000,000 | 11,535,600 | ||||||||
City of Jackson Water and Sewer System Project, AGMC Insured, 6.875%, 12/01/40 | 3,400,000 | 4,325,378 | ||||||||
| franklintempleton.com | Annual Report | 29 | ||
FRANKLIN FEDERAL TAX-FREE INCOME FUND
STATEMENT OF INVESTMENTS
| Principal Amount | Value | |||||||||
Municipal Bonds (continued) | ||||||||||
Mississippi (continued) | ||||||||||
Mississippi Hospital Equipment and Facilities Authority Revenue, | ||||||||||
Baptist Memorial Health Care, Series A, 5.00%, 9/01/36 | $ | 6,350,000 | $ | 7,059,422 | ||||||
Baptist Memorial Health Care, Series A, 5.00%, 9/01/46 | 34,500,000 | 37,809,240 | ||||||||
|
| |||||||||
| 88,734,213 | ||||||||||
|
| |||||||||
Missouri 0.5% | ||||||||||
Bi-State Development Agency Missouri-Illinois Metropolitan District Mass Transit Sales Tax Appropriation Revenue, Metrolink Cross County Extension Project, Assured Guaranty, 5.00%, 10/01/39 | 6,000,000 | 6,442,080 | ||||||||
Missouri State Health and Educational Facilities Authority Health Facilities Revenue, | ||||||||||
Mercy Health, Series F, 5.00%, 11/15/45 | 25,000,000 | 27,222,250 | ||||||||
St. Luke’s Health System Inc., Series B, AGMC Insured, Pre-Refunded, 5.50%, 11/15/35 | 30,000,000 | 32,034,600 | ||||||||
|
| |||||||||
| 65,698,930 | ||||||||||
|
| |||||||||
Montana 0.0%† | ||||||||||
Montana State Facility Finance Authority Revenue, Benefis Health System Obligated Group, Refunding, 5.00%, 2/15/41 | 2,650,000 | 2,894,065 | ||||||||
|
| |||||||||
Nebraska 1.1% | ||||||||||
Douglas County Hospital Authority No. 2 Revenue, Health Facilities, Children’s Hospital Obligated Group, 5.00%, 11/15/47 | 10,000,000 | 11,134,400 | ||||||||
Lancaster County Correctional Facility Joint Public Agency GO, Building, 5.00%, 12/01/28 | 5,000,000 | 5,319,100 | ||||||||
Lancaster County Hospital Authority Revenue, Bryan Memorial Hospital Project No. 1, NATL Insured, ETM, 6.70%, 6/01/22 | 1,675,000 | 1,897,909 | ||||||||
Madison County Hospital Authority No. 001 Hospital Revenue, Faith Regional Health Services Project, Series A-1, 6.00%, 7/01/33 | 12,000,000 | 12,648,960 | ||||||||
Municipal Energy Agency of Nebraska Power Supply System Revenue, Series A, BHAC Insured, Pre-Refunded, 5.375%, 4/01/39 | 5,000,000 | 5,404,100 | ||||||||
Omaha Public Facilities Corp. Lease Revenue, Baseball Stadium Project, Pre-Refunded, 5.00%, 6/01/36 | 9,000,000 | 9,726,750 | ||||||||
Omaha Public Power District Electric System Revenue, Series C, 5.00%, 2/01/39 | 23,305,000 | 25,850,139 | ||||||||
Omaha Public Power District Separate Electric System Revenue, | ||||||||||
Nebraska City 2, Refunding, Series A, 5.00%, 2/01/49 | 10,000,000 | 11,089,200 | ||||||||
Nebraska City 2, Series A, 5.25%, 2/01/42 | 10,000,000 | 11,344,500 | ||||||||
Public Power Generation Agency Revenue, | ||||||||||
Whelan Energy Center Unit 2, Refunding, Series A, 5.00%, 1/01/39 | 7,340,000 | 8,171,916 | ||||||||
Whelan Energy Center Unit 2, Refunding, Series A, 5.00%, 1/01/41 | 5,140,000 | 5,709,820 | ||||||||
University of Nebraska Revenue, | ||||||||||
Lincoln Student Fees and Facilities, 5.00%, 7/01/37 | 5,000,000 | 5,645,250 | ||||||||
Lincoln Student Fees and Facilities, 5.00%, 7/01/42 | 7,500,000 | 8,375,925 | ||||||||
Lincoln Student Fees and Facilities, Series A, Pre-Refunded, 5.25%, 7/01/34 | 5,000,000 | 5,348,250 | ||||||||
Omaha Student Facilities Project, Pre-Refunded, 5.00%, 5/15/32 | 5,000,000 | 5,006,900 | ||||||||
University of Nebraska Omaha Health and Recreation Project, Pre-Refunded, 5.00%, 5/15/38 | 5,000,000 | 5,208,800 | ||||||||
|
| |||||||||
| 137,881,919 | ||||||||||
|
| |||||||||
Nevada 0.4% | ||||||||||
Clark County GO, Transportation Improvement, Series A, AMBAC Insured, 6.50%, 6/01/17 | 250,000 | 251,095 | ||||||||
Clark County Passenger Facility Charge Revenue, | ||||||||||
Las Vegas, McCarran International Airport, Series A, AGMC Insured, 5.25%, 7/01/39 | 20,000,000 | 21,894,000 | ||||||||
Las Vegas, McCarran International Airport, Series A, AGMC Insured, 5.25%, 7/01/42 | 5,000,000 | 5,474,850 | ||||||||
Clark County School District GO, Refunding, Series A, NATL Insured, 5.00%, 6/15/24 | 15,000,000 | 15,515,400 | ||||||||
Nevada State GO, Municipal Bond Bank Project No. 40-41, Series A, ETM, 6.375%, 12/01/17 | 1,625,000 | 1,630,817 | ||||||||
| 30 | Annual Report | franklintempleton.com | ||
FRANKLIN FEDERAL TAX-FREE INCOME FUND
STATEMENT OF INVESTMENTS
| Principal Amount | Value | |||||||||
Municipal Bonds (continued) | ||||||||||
Nevada (continued) | ||||||||||
Reno Hospital Revenue, | ||||||||||
Washoe Medical Center Project, Refunding, Series C, AGMC Insured, 5.375%, 6/01/39 | $ | 1,535,000 | $ | 1,673,012 | ||||||
Washoe Medical Center Project, Series C, AGMC Insured, Pre-Refunded, 5.375%, 6/01/39 | 3,465,000 | 3,900,793 | ||||||||
|
| |||||||||
| 50,339,967 | ||||||||||
|
| |||||||||
New Hampshire 0.5% | ||||||||||
Manchester GARB, Refunding, Series A, AGMC Insured, 5.125%, 1/01/30 | 6,000,000 | 6,325,920 | ||||||||
Nashua Housing Authority MFR, Clocktower Project, Refunding, GNMA Secured, 6.25%, 6/20/33 | 4,469,000 | 4,486,206 | ||||||||
New Hampshire Municipal Bond Bank Revenue, Series B, Pre-Refunded, 5.00%, 8/15/39 | 11,250,000 | 12,614,400 | ||||||||
New Hampshire State Business Finance Authority Revenue, Elliot Hospital Obligated Group, Series A, Pre-Refunded, 6.125%, 10/01/39 | 5,000,000 | 5,588,500 | ||||||||
New Hampshire State Health and Education Facilities Authority Revenue, | ||||||||||
Elliot Hospital, Refunding, 5.00%, 10/01/38 | 4,000,000 | 4,337,080 | ||||||||
University System of New Hampshire Issue, Refunding, 5.00%, 7/01/45 | 10,350,000 | 11,575,854 | ||||||||
New Hampshire State Municipal Bond Bank Revenue, Refunding, Series D, 4.00%, 8/15/39 | 10,000,000 | 10,393,000 | ||||||||
|
| |||||||||
| 55,320,960 | ||||||||||
|
| |||||||||
New Jersey 2.8% | ||||||||||
Bayonne GO, General Improvement, Pre-Refunded, 5.75%, 7/01/35 | 9,000,000 | 9,887,130 | ||||||||
New Jersey EDA Revenue, | ||||||||||
Motor Vehicle Surcharges, Series A, NATL Insured, 5.00%, 7/01/29 | 13,450,000 | 13,587,190 | ||||||||
Motor Vehicle Surcharges, Series A, NATL Insured, 5.00%, 7/01/34 | 26,250,000 | 26,517,750 | ||||||||
Municipal Rehabilitation, Series A, AMBAC Insured, 5.00%, 4/01/28 | 4,000,000 | 4,008,640 | ||||||||
School Facilities, Series U, Pre-Refunded, 5.00%, 9/01/37 | 14,285,000 | 14,477,990 | ||||||||
School Facilities Construction, Refunding, Series NN, 5.00%, 3/01/31 | 14,775,000 | 15,020,265 | ||||||||
School Facilities Construction, Series AAA, 5.00%, 6/15/41 | 26,000,000 | 25,962,300 | ||||||||
School Facilities Construction, Series NN, 5.00%, 3/01/28 | 22,000,000 | 22,739,200 | ||||||||
New Jersey Health Care Facilities Financing Authority State Contract Revenue, | ||||||||||
Hospital Asset Transformation Program, Series A, 5.25%, 10/01/38 | 7,770,000 | 7,859,122 | ||||||||
Hospital Asset Transformation Program, Series A, Pre-Refunded, 5.25%, 10/01/38 | 2,230,000 | 2,363,421 | ||||||||
New Jersey Housing and Mortgage Finance Agency, SFHR, Series AA, 6.375%, 10/01/28 | 265,000 | 267,300 | ||||||||
New Jersey State COP, | ||||||||||
Equipment Lease Purchase Agreement, Series A, Pre-Refunded, 5.25%, 6/15/25 | 20,305,000 | 22,058,540 | ||||||||
Equipment Lease Purchase Agreement, Series A, Pre-Refunded, 5.25%, 6/15/26 | 8,000,000 | 8,690,880 | ||||||||
Equipment Lease Purchase Agreement, Series A, Pre-Refunded, 5.25%, 6/15/27 | 4,000,000 | 4,345,440 | ||||||||
Equipment Lease Purchase Agreement, Series A, Pre-Refunded, 5.25%, 6/15/28 | 2,000,000 | 2,172,720 | ||||||||
New Jersey State Educational Facilities Authority Revenue, Higher Education Capital Improvement Fund Issue, Series B, 5.00%, 9/01/36 | 14,000,000 | 14,102,900 | ||||||||
New Jersey State Transportation Trust Fund Authority Revenue, | ||||||||||
Transportation Program, Series AA, 5.00%, 6/15/45 | 15,000,000 | 15,009,150 | ||||||||
Transportation System, Series A, 6.00%, 12/15/38 | 49,125,000 | 51,911,370 | ||||||||
Transportation System, Series A, AMBAC Insured, 5.00%, 12/15/32 | 9,705,000 | 9,896,868 | ||||||||
Transportation System, Series A, Pre-Refunded, 6.00%, 12/15/38 | 25,875,000 | 27,970,358 | ||||||||
Transportation System, Series B, 5.25%, 6/15/36 | 10,000,000 | 10,339,200 | ||||||||
Transportation System, Series C, 5.25%, 6/15/32 | 11,000,000 | 11,497,640 | ||||||||
New Jersey State Turnpike Authority Revenue, | ||||||||||
Turnpike, Series E, 5.25%, 1/01/40 | 13,925,000 | 14,672,076 | ||||||||
Turnpike, Series E, 5.00%, 1/01/45 | 11,475,000 | 12,703,628 | ||||||||
|
| |||||||||
| 348,061,078 | ||||||||||
|
| |||||||||
New Mexico 0.1% | ||||||||||
New Mexico State Hospital Equipment Loan Council Hospital Revenue, Presbyterian Healthcare Services Obligated Group, Refunding, 5.00%, 8/01/44 | 10,000,000 | 11,050,600 | ||||||||
|
| |||||||||
| franklintempleton.com | Annual Report | 31 | ||
FRANKLIN FEDERAL TAX-FREE INCOME FUND
STATEMENT OF INVESTMENTS
| Principal Amount | Value | |||||||||
Municipal Bonds (continued) | ||||||||||
New York 8.6% | ||||||||||
Hudson Yards Infrastructure Corp. Revenue, Hudson Yards, Senior, Series A, AGMC Insured, 5.00%, 2/15/47 | $ | 16,475,000 | $ | 18,089,879 | ||||||
Long Island Power Authority Electric System Revenue, | ||||||||||
General, Refunding, Series B, 5.00%, 9/01/46 | 13,000,000 | 14,452,360 | ||||||||
General, Series A, Pre-Refunded, 6.00%, 5/01/33 | 12,500,000 | 13,725,875 | ||||||||
MTA Dedicated Tax Fund Revenue, | ||||||||||
Series B, 5.00%, 11/15/34 | 15,000,000 | 16,351,050 | ||||||||
Series B, Pre-Refunded, 5.25%, 11/15/28 | 6,000,000 | 6,621,960 | ||||||||
Series B, Pre-Refunded, 5.25%, 11/15/29 | 4,000,000 | 4,414,640 | ||||||||
Series B, Pre-Refunded, 5.25%, 11/15/30 | 3,000,000 | 3,310,980 | ||||||||
MTA Revenue, | ||||||||||
Transportation, Refunding, Series D, 5.25%, 11/15/40 | 15,000,000 | 16,763,850 | ||||||||
Transportation, Series A, 5.00%, 11/15/38 | 11,800,000 | 13,141,660 | ||||||||
Transportation, Series A, AGMC Insured, Pre-Refunded, 5.00%, 11/15/33 | 20,000,000 | 20,446,000 | ||||||||
Transportation, Series A, Pre-Refunded, 5.00%, 11/15/37 | 25,000,000 | 25,549,570 | ||||||||
Transportation, Series C, 6.50%, 11/15/28 | 2,805,000 | 3,033,327 | ||||||||
Transportation, Series C, Pre-Refunded, 6.50%, 11/15/28 | 12,195,000 | 13,232,551 | ||||||||
Transportation, Series D, 5.00%, 11/15/34 | 10,000,000 | 11,090,600 | ||||||||
Transportation, Series D, 5.00%, 11/15/36 | 9,500,000 | 10,733,670 | ||||||||
Transportation, Series D, Sub Series D-1, 5.00%, 11/15/39 | 15,000,000 | 16,815,900 | ||||||||
Transportation, Sub Series A-1, 5.00%, 11/15/40 | 30,000,000 | 33,306,000 | ||||||||
New York City GO, | ||||||||||
Fiscal 2002, Series D, 5.50%, 6/01/24 | 180,000 | 180,616 | ||||||||
Fiscal 2010, Refunding, Series C, 5.00%, 8/01/23 | 24,620,000 | 26,702,360 | ||||||||
Series E, Subseries E-1, 6.25%, 10/15/28 | 480,000 | 516,326 | ||||||||
Series E, Subseries E-1, Pre-Refunded, 6.25%, 10/15/28. | 9,520,000 | 10,239,046 | ||||||||
Series F, 5.25%, 1/15/23 | 5,000 | 5,016 | ||||||||
New York City Municipal Water Finance Authority Water and Sewer System Revenue, | ||||||||||
Fiscal 2009, Series A, 5.75%, 6/15/40 | 4,580,000 | 4,819,351 | ||||||||
Fiscal 2009, Series A, Pre-Refunded, 5.75%, 6/15/40 | 1,420,000 | 1,495,345 | ||||||||
Second General Resolution, Fiscal 2008, Refunding, Series AA, 5.00%, 6/15/37 | 10,000,000 | 10,048,500 | ||||||||
Second General Resolution, Fiscal 2009, Refunding, Series EE, 5.25%, 6/15/40 | 64,970,000 | 70,153,956 | ||||||||
Second General Resolution, Fiscal 2009, Refunding, Series FF, Subseries FF-2, 5.50%, 6/15/40 | 15,000,000 | 16,324,050 | ||||||||
Second General Resolution, Fiscal 2011, Refunding, Series GG, 5.00%, 6/15/43 | 25,000,000 | 27,460,750 | ||||||||
Second General Resolution, Fiscal 2012, Refunding, Series AA, 5.00%, 6/15/34 | 10,000,000 | 11,137,700 | ||||||||
Second General Resolution, Fiscal 2012, Refunding, Series AA, 5.00%, 6/15/44 | 21,550,000 | 23,635,609 | ||||||||
Second General Resolution, Fiscal 2013, Refunding, Series DD, 5.00%, 6/15/35 | 30,705,000 | 34,753,761 | ||||||||
Second General Resolution, Fiscal 2014, Refunding, Series BB, 5.00%, 6/15/46 | 15,000,000 | 16,682,400 | ||||||||
Second General Resolution, Fiscal 2015, Refunding, Series FF, 5.00%, 6/15/39 | 10,000,000 | 11,407,800 | ||||||||
Second General Resolution, Fiscal 2015, Refunding, Series HH, 5.00%, 6/15/39 | 15,000,000 | 17,134,950 | ||||||||
Second General Resolution, Fiscal 2017, Series CC, Subseries CC-2, 5.00%, 6/15/46 | 32,500,000 | 37,010,350 | ||||||||
New York City Transitional Finance Authority Building Aid Revenue, | ||||||||||
Fiscal 2009, Series S-2, 6.00%, 7/15/38 | 20,000,000 | 21,159,800 | ||||||||
Fiscal 2009, Series S-3, 5.25%, 1/15/34 | 10,170,000 | 10,835,932 | ||||||||
Fiscal 2009, Series S-4, 5.50%, 1/15/34 | 12,890,000 | 13,819,756 | ||||||||
Fiscal 2011, Series S-2, Sub Series S-2A, 5.00%, 7/15/40 | 35,000,000 | 39,328,800 | ||||||||
Fiscal 2012, Series S-1, Sub Series S-1A, 5.25%, 7/15/37 | 30,300,000 | 34,260,210 | ||||||||
New York City Transitional Finance Authority Revenue, | ||||||||||
Future Tax Secured, Subordinate, Fiscal 2011, Series C, 5.00%, 11/01/39 | 15,000,000 | 16,629,300 | ||||||||
Future Tax Secured, Subordinate, Fiscal 2014, Series A, Subseries A-1, 5.00%, 11/01/34 | 15,000,000 | 17,361,750 | ||||||||
Future Tax Secured, Subordinate, Fiscal 2016, Series E, Subseries E-1, 5.00%, 2/01/38 | 10,000,000 | 11,404,000 | ||||||||
Future Tax Secured, Subordinate, Fiscal 2017, Series B, Subseries B-1, 5.00%, 8/01/36 | 10,000,000 | 11,525,300 | ||||||||
| 32 | Annual Report | franklintempleton.com | ||
FRANKLIN FEDERAL TAX-FREE INCOME FUND
STATEMENT OF INVESTMENTS
| Principal Amount | Value | |||||||||
Municipal Bonds (continued) | ||||||||||
New York (continued) | ||||||||||
New York City Transitional Finance Authority Revenue, (continued) | ||||||||||
Future Tax Secured, Subordinate, Fiscal 2017, Series B, Subseries B-1, 5.00%, 8/01/38 | $ | 10,000,000 | $ | 11,473,300 | ||||||
New York Liberty Development Corp. Liberty Revenue, | ||||||||||
One World Trade Center, Port Authority Consolidated, Secured, 5.25%, 12/15/43 | 25,000,000 | 28,553,750 | ||||||||
Second Priority, Bank of America Tower at One Bryant Park Project, Class 1, Refunding, 5.625%, 1/15/46 | 25,000,000 | 27,718,250 | ||||||||
Seven World Trade Center Project, Refunding, 5.00%, 9/15/43 | 6,500,000 | 7,041,450 | ||||||||
New York Liberty Development Corp. Revenue, | ||||||||||
Goldman Sachs Headquarters Issue, 5.25%, 10/01/35 | 40,000,000 | 48,524,000 | ||||||||
Goldman Sachs Headquarters Issue, 5.50%, 10/01/37 | 24,995,000 | 30,546,889 | ||||||||
New York State Dormitory Authority Revenues, Lease, | ||||||||||
State University Dormitory Facilities, Series A, 5.00%, 7/01/41 | 10,000,000 | 11,157,900 | ||||||||
State Supported Debt, Upstate Community Colleges, Series C, 6.00%, 7/01/31 | 23,215,000 | 25,069,878 | ||||||||
New York State Dormitory Authority State Personal Income Tax Revenue, | ||||||||||
General Purpose, Series A, 5.00%, 2/15/36 | 15,000,000 | 16,981,200 | ||||||||
Group C, Series B, 5.00%, 2/15/40 | 20,000,000 | 22,564,800 | ||||||||
New York State HFAR, Housing Project Mortgage, Refunding, Series A, AGMC Insured, 6.125%, 11/01/20 | 75,000 | 75,293 | ||||||||
New York State Thruway Authority General Junior Indebtedness Obligations Revenue, junior lien, Series A, 5.25%, 1/01/56 | 10,000,000 | 11,249,600 | ||||||||
New York State Urban Development Corp. Revenue, | ||||||||||
State Personal Income Tax, General Purpose, Series A, 5.00%, 3/15/31 | 10,000,000 | 11,265,700 | ||||||||
State Personal Income Tax, State Facilities and Equipment, Series B-1, Pre-Refunded, 5.00%, 3/15/36 | 5,000,000 | 5,373,750 | ||||||||
Port Authority of New York and New Jersey Revenue, Consolidated, Refunding, One Hundred Seventy-Ninth Series, 5.00%, 12/01/38 | 20,000,000 | 22,910,600 | ||||||||
Triborough Bridge and Tunnel Authority Revenues, | ||||||||||
General, MTA Bridges and Tunnels, Series A, Pre-Refunded, 5.25%, 11/15/38 | 25,000,000 | 26,129,250 | ||||||||
General, Series A-2, 5.25%, 11/15/34 | 4,620,000 | 4,923,857 | ||||||||
General, Series A-2, Pre-Refunded, 5.25%, 11/15/34 | 2,880,000 | 3,068,064 | ||||||||
General Purpose, Series B, Pre-Refunded, 5.50%, 1/01/30 | 15,000,000 | 17,455,350 | ||||||||
|
| |||||||||
| 1,069,195,487 | ||||||||||
|
| |||||||||
North Carolina 1.8% | ||||||||||
Charlotte COP, Cultural Arts Facilities, Refunding, Series E, 5.00%, 6/01/34 | 13,000,000 | 13,968,890 | ||||||||
North Carolina Eastern Municipal Power Agency Power System Revenue, | ||||||||||
Series A, Pre-Refunded, 5.50%, 1/01/26 | 4,500,000 | 4,835,790 | ||||||||
Series B, ETM, 6.00%, 1/01/22 | 1,250,000 | 1,502,288 | ||||||||
Series B, ETM, 6.25%, 1/01/23 | 39,030,000 | 48,718,417 | ||||||||
North Carolina State Capital Improvement Limited Obligation Revenue, | ||||||||||
Series A, 5.00%, 5/01/23 | 20,000,000 | 22,191,400 | ||||||||
Series A, 5.00%, 5/01/26 | 20,000,000 | 22,172,600 | ||||||||
Series A, Pre-Refunded, 5.00%, 5/01/24 | 5,500,000 | 5,922,015 | ||||||||
Series A, Pre-Refunded, 5.00%, 5/01/25 | 5,750,000 | 6,191,197 | ||||||||
Series A, Pre-Refunded, 5.00%, 5/01/27 | 4,500,000 | 4,845,285 | ||||||||
Series A, Pre-Refunded, 5.00%, 5/01/28 | 4,250,000 | 4,576,102 | ||||||||
North Carolina Turnpike Authority Triangle Expressway System Revenue, | ||||||||||
Capital Appreciation, Series B, Assured Guaranty, zero cpn., 1/01/33 | 25,000,000 | 13,779,500 | ||||||||
Capital Appreciation, Series B, Assured Guaranty, zero cpn., 1/01/34 | 15,000,000 | 7,855,800 | ||||||||
Capital Appreciation, Series B, Assured Guaranty, zero cpn., 1/01/35 | 15,215,000 | 7,559,573 | ||||||||
Series A, Assured Guaranty, Pre-Refunded, 5.50%, 1/01/29 | 6,750,000 | 7,247,880 | ||||||||
Series A, Assured Guaranty, Pre-Refunded, 5.75%, 1/01/39 | 10,380,000 | 11,188,291 | ||||||||
Raleigh Combined Enterprise System Revenue, Pre-Refunded, 5.00%, 3/01/40 | 15,830,000 | 18,035,436 | ||||||||
| franklintempleton.com | Annual Report | 33 | ||
FRANKLIN FEDERAL TAX-FREE INCOME FUND
STATEMENT OF INVESTMENTS
| Principal Amount | Value | |||||||||
Municipal Bonds (continued) | ||||||||||
North Carolina (continued) | ||||||||||
Wake County GO, Refunding, Series C, 5.00%, 3/01/25 | $ | 21,780,000 | $ | 26,686,598 | ||||||
|
| |||||||||
| 227,277,062 | ||||||||||
|
| |||||||||
North Dakota 0.5% | ||||||||||
Cass County Health Care Facilities Revenue, Essentia Health Obligated Group, Series D, Assured Guaranty, Pre-Refunded, 5.00%, 2/15/40 | 31,970,000 | 32,993,040 | ||||||||
Grand Forks Health Care System Revenue, | ||||||||||
Altru Health System Obligated Group, Assured Guaranty, 5.00%, 12/01/26 | 8,385,000 | 8,672,103 | ||||||||
Altru Health System Obligated Group, Refunding, 5.50%, 12/01/20 | 8,870,000 | 9,084,654 | ||||||||
Altru Health System Obligated Group, Refunding, 5.50%, 12/01/24 | 13,945,000 | 14,280,098 | ||||||||
|
| |||||||||
| 65,029,895 | ||||||||||
|
| |||||||||
Ohio 2.9% | ||||||||||
Akron Income Tax Revenue, Community Learning Centers, Refunding, Series A, 5.00%, 12/01/29 | 10,000,000 | 11,535,569 | ||||||||
American Municipal Power Inc. Revenue, | ||||||||||
Combined Hydroelectric Projects, Green Bonds, Refunding, Series A, 5.00%, 2/15/46 | 20,000,000 | 22,091,400 | ||||||||
Prairie State Energy Campus Project, Refunding, Series A, 5.00%, 2/15/38 | 1,215,000 | 1,245,363 | ||||||||
Prairie State Energy Campus Project, Refunding, Series A, 5.00%, 2/15/39 | 5,000,000 | 5,496,650 | ||||||||
Prairie State Energy Campus Project, Refunding, Series A, 5.00%, 2/15/42 | 2,500,000 | 2,741,950 | ||||||||
Prairie State Energy Campus Project, Series A, Pre-Refunded, 5.00%, 2/15/38 | 21,285,000 | 21,966,120 | ||||||||
Bowling Green Student Housing Revenue, CFP I LLC, State University Project, 6.00%, 6/01/45 | 6,750,000 | 7,097,085 | ||||||||
Buckeye Tobacco Settlement Financing Authority Revenue, | ||||||||||
Tobacco Settlement, Senior, Capital Appreciation, Turbo Term, Series A-3, 6.25%, 6/01/37 | 15,000,000 | 14,982,000 | ||||||||
Tobacco Settlement, Senior Current Interest Turbo Term, Series A-2, 5.75%, 6/01/34 | 10,000,000 | 9,580,200 | ||||||||
Butler County Hospital Facilities Revenue, UC Health, Refunding, 5.00%, 11/15/45 | 7,500,000 | 8,232,900 | ||||||||
Cleveland Airport System Revenue, Refunding, Series A, AGMC Insured, 5.00%, 1/01/28 | 9,500,000 | 10,631,735 | ||||||||
Cleveland-Cuyahoga County Port Authority Development Lease Revenue, Administrative Headquarters Project, 5.00%, 7/01/37 | 6,000,000 | 7,174,440 | ||||||||
Franklin County Hospital Facilities Revenue, OhioHealth Corp., 5.00%, 5/15/40 | 10,000,000 | 10,998,300 | ||||||||
Franklin County Revenue, Trinity Health Credit Group, Series 2017, 5.00%, 12/01/46 | 10,000,000 | 11,165,300 | ||||||||
Hamilton County Healthcare Facilities Revenue, The Christ Hospital Project, AGMC Insured, 5.00%, 6/01/42 | 22,500,000 | 24,905,925 | ||||||||
Hamilton County Sewer System Revenue, The Metropolitan Sewer District of Greater Cincinnati, Improvement and Refunding, Series A, 5.00%, 12/01/38 | 12,000,000 | 13,691,760 | ||||||||
JobsOhio Beverage System Statewide Liquor Profits Revenue, senior lien, Series A, 5.00%, 1/01/38 | 21,060,000 | 23,364,385 | ||||||||
Kent State University Revenues, General Receipts, Series A, 5.00%, 5/01/37 | 10,500,000 | 11,647,230 | ||||||||
Ohio State Air Quality Development Authority Revenue, | ||||||||||
Environmental Improvement, Buckeye Power Inc. Project, 6.00%, 12/01/40 | 15,000,000 | 17,325,600 | ||||||||
Pollution Control, FirstEnergy Generation Corp. Project, Refunding, Series C, 5.625%, 6/01/18 | 8,500,000 | 8,245,680 | ||||||||
Ohio State GO, | ||||||||||
Infrastructure Improvement, Series A, Pre-Refunded, 5.375%, 9/01/28 | 6,235,000 | 6,464,511 | ||||||||
Infrastructure Improvement, Series A, Pre-Refunded, 5.375%, 9/01/28 | 3,765,000 | 3,902,008 | ||||||||
Ohio State Higher Educational Facility Commission Revenue, Hospital Facilities, Summa Health System, 2010 Project, Refunding, AGMC Insured, 5.25%, 11/15/40 | 15,000,000 | 16,029,900 | ||||||||
Ohio State Hospital Revenue, University Hospitals Health System Inc., Refunding, Series A, AGMC Insured, 5.00%, 1/15/41 | 7,000,000 | 7,535,920 | ||||||||
Ohio State Turnpike and Infrastructure Commission Revenue, Infrastructure Projects, Capital Appreciation, junior lien, Series A-3, zero cpn. to 2/14/23, 5.75% thereafter, 2/15/35 | 35,000,000 | 32,498,200 | ||||||||
Ohio State University Revenue, Special Purpose General Receipts, Series A, 5.00%, 6/01/38 | 10,000,000 | 11,335,000 | ||||||||
Scioto County Hospital Facilities Revenue, Southern Ohio Medical Center, Pre-Refunded, 5.75%, 2/15/38 | 17,000,000 | 17,643,280 | ||||||||
Toledo Water System Revenue, Improvement and Refunding, 5.00%, 11/15/38 | 20,000,000 | 22,332,600 | ||||||||
|
| |||||||||
| 361,861,011 | ||||||||||
|
| |||||||||
| 34 | Annual Report | franklintempleton.com | ||
FRANKLIN FEDERAL TAX-FREE INCOME FUND
STATEMENT OF INVESTMENTS
| Principal Amount | Value | |||||||||
Municipal Bonds (continued) | ||||||||||
Oklahoma 0.1% | ||||||||||
McGee Creek Authority Water Revenue, NATL Insured, 6.00%, 1/01/23 | $ | 220,000 | $ | 242,156 | ||||||
Oklahoma Development Finance Authority Revenue, Provident Education Resources Inc. Cross Village Student Housing Project, Series A, 5.00%, 8/01/47 | 8,000,000 | 8,541,600 | ||||||||
Oklahoma Municipal Power Authority Revenue, | ||||||||||
Refunding, Series A, 5.00%, 1/01/32 | 650,000 | 737,867 | ||||||||
Refunding, Series A, 5.00%, 1/01/33 | 1,250,000 | 1,411,913 | ||||||||
Refunding, Series A, 4.00%, 1/01/36 | 100,000 | 104,925 | ||||||||
Refunding, Series A, 5.00%, 1/01/47 | 3,100,000 | 3,403,397 | ||||||||
|
| |||||||||
| 14,441,858 | ||||||||||
|
| |||||||||
Oregon 0.8% | ||||||||||
Medford Hospital Facilities Authority Revenue, Hospital, Asante Health System, Series A, AGMC Insured, 5.00%, 8/15/40 | 4,935,000 | 5,257,108 | ||||||||
Oregon Health and Science University Revenue, Series A, Pre-Refunded, 5.75%, 7/01/39 | 5,000,000 | 5,498,500 | ||||||||
Oregon State Department of Transportation Highway User Tax Revenue, senior lien, Series A, Pre-Refunded, 4.50%, 11/15/32 | 30,000,000 | 30,568,500 | ||||||||
Port of Portland International Airport Revenue, Series Nineteen, Pre-Refunded, 5.50%, 7/01/38 | 25,000,000 | 26,310,000 | ||||||||
Portland Sewer System Revenue, second lien, Series A, 5.00%, 3/01/35 | 11,540,000 | 12,613,566 | ||||||||
University of Oregon General Revenue, Series A, 5.00%, 4/01/46 | 17,000,000 | 19,313,360 | ||||||||
|
| |||||||||
| 99,561,034 | ||||||||||
|
| |||||||||
Pennsylvania 3.7% | ||||||||||
Allegheny County Sanitary Authority Sewer Revenue, BAM Insured, 5.25%, 12/01/44 | 5,000,000 | 5,695,700 | ||||||||
Bucks County Water and Sewer Authority Water System Revenue, | ||||||||||
AGMC Insured, 5.00%, 12/01/33 | 5,500,000 | 6,177,270 | ||||||||
AGMC Insured, 5.00%, 12/01/37 | 10,520,000 | 11,752,102 | ||||||||
AGMC Insured, 5.00%, 12/01/41 | 5,110,000 | 5,652,273 | ||||||||
Centennial School District Bucks County GO, Series B, AGMC Insured, Pre-Refunded, 5.25%, 12/15/37 | 13,655,000 | 14,596,922 | ||||||||
Coatesville Area School District GO, AGMC Insured, Pre-Refunded, 5.00%, 8/01/24 | 6,420,000 | 6,484,842 | ||||||||
Commonwealth Financing Authority Revenue, | ||||||||||
Series A, 5.00%, 6/01/33 | 4,550,000 | 5,050,136 | ||||||||
Series B, 5.00%, 6/01/42 | 5,400,000 | 5,947,830 | ||||||||
Delaware County Regional Water Quality Control Authority Revenue, | ||||||||||
Sewer, 5.00%, 11/01/41 | 5,000,000 | 5,635,850 | ||||||||
Sewer, 5.00%, 11/01/46 | 10,315,000 | 11,582,301 | ||||||||
Delaware River Port Authority Revenue, Series D, AGMC Insured, 5.00%, 1/01/40 | 15,000,000 | 16,269,900 | ||||||||
Delaware Valley Regional Finance Authority Local Government Revenue, Series B, AMBAC Insured, 5.60%, 7/01/17 | 5,000,000 | 5,038,350 | ||||||||
Erie Water Authority Water Revenue, Refunding, 5.00%, 12/01/43 | 5,000,000 | 5,558,400 | ||||||||
Lackawanna County GO, Series B, AGMC Insured, 5.00%, 9/01/35 | 7,500,000 | 7,912,950 | ||||||||
Montour School District GO, | ||||||||||
Series A, AGMC Insured, 5.00%, 4/01/40 | 3,170,000 | 3,545,613 | ||||||||
Series A, AGMC Insured, 5.00%, 4/01/41 | 2,000,000 | 2,233,880 | ||||||||
Series A, AGMC Insured, 5.00%, 4/01/42 | 2,000,000 | 2,232,320 | ||||||||
Northampton County General Purpose Authority Hospital Revenue, St. Luke’s Hospital Project, Series A, Pre-Refunded, 5.375%, 8/15/28 | 5,000,000 | 5,277,500 | ||||||||
Pennsylvania Convention Center Authority Revenue, Series A, FGIC Insured, ETM, 6.00%, 9/01/19 | 500,000 | 530,805 | ||||||||
Pennsylvania State Economic Development Financing Authority Water Facilities Revenue, Aqua Pennsylvania Inc. Project, Series B, 5.00%, 12/01/43 | 20,000,000 | 21,844,200 | ||||||||
Pennsylvania State Economic Development Financing Authority Water Facility Revenue, Pennsylvania-American Water Co. Project, 6.20%, 4/01/39 | 12,500,000 | 13,597,625 | ||||||||
Pennsylvania State GO, Refunding, First Series, AGMC Insured, 5.00%, 8/15/26 | �� | 20,805,000 | 24,759,823 | |||||||
| franklintempleton.com | Annual Report | 35 | ||
FRANKLIN FEDERAL TAX-FREE INCOME FUND
STATEMENT OF INVESTMENTS
| Principal Amount | Value | |||||||||
Municipal Bonds (continued) | ||||||||||
Pennsylvania (continued) | ||||||||||
Pennsylvania State Turnpike Commission Turnpike Revenue, | ||||||||||
Series C, Subseries C-1, Assured Guaranty, Pre-Refunded, 6.00%, 6/01/28 | $ | 5,000,000 | $ | 5,273,400 | ||||||
Series C, Subseries C-1, Assured Guaranty, Pre-Refunded, 6.25%, 6/01/38 | 25,000,000 | 26,434,000 | ||||||||
Subordinate, Convertible Capital Appreciation, Series C, AGMC Insured, 6.25%, 6/01/33 | 5,000,000 | 6,255,750 | ||||||||
Subordinate, Motor License Fund-Enhanced, Series A, 5.00%, 12/01/37 | 3,000,000 | 3,315,600 | ||||||||
Subordinate, Motor License Fund-Enhanced, Series A, Subseries A-1, 5.00%, 12/01/38 | 20,000,000 | 21,562,800 | ||||||||
Subordinate, Series B, Pre-Refunded, 5.75%, 6/01/39 | 20,000,000 | 21,944,200 | ||||||||
Subseries A, Assured Guaranty, 5.00%, 6/01/39 | 8,690,000 | 9,223,305 | ||||||||
Subseries A, Assured Guaranty, Pre-Refunded, 5.00%, 6/01/39 | 1,310,000 | 1,417,197 | ||||||||
Philadelphia GO, | ||||||||||
Refunding, Series A, AGMC Insured, 5.00%, 8/01/24 | 9,805,000 | 10,552,631 | ||||||||
Series A, AGMC Insured, Pre-Refunded, 5.00%, 8/01/24 | 1,195,000 | 1,298,583 | ||||||||
Philadelphia Hospitals and Higher Educational Facilities Authority Revenue, | ||||||||||
Mortgage, North Philadelphia Health Systems, Refunding, Series A, FHA Insured, 5.30%, 1/01/18 | 370,000 | 351,500 | ||||||||
Mortgage, North Philadelphia Health Systems, Refunding, Series A, FHA Insured, 5.35%, 1/01/23 | 4,600,000 | 4,370,000 | ||||||||
Mortgage, North Philadelphia Health Systems, Refunding, Series A, FHA Insured, 5.375%, 1/01/28 | 3,700,000 | 3,515,000 | ||||||||
Philadelphia Municipal Authority Lease Revenue, Pre-Refunded, 6.375%, 4/01/29 | 4,500,000 | 4,953,060 | ||||||||
Philadelphia School District GO, | ||||||||||
Refunding, Series F, 5.00%, 9/01/33 | 6,415,000 | 6,935,962 | ||||||||
Refunding, Series F, 5.00%, 9/01/36 | 4,090,000 | 4,366,198 | ||||||||
Series E, Pre-Refunded, 6.00%, 9/01/38 | 24,645,000 | 26,276,006 | ||||||||
Series E, Pre-Refunded, 6.00%, 9/01/38 | 355,000 | 378,249 | ||||||||
Philadelphia Water and Wastewater Revenue, | ||||||||||
Series A, 5.00%, 7/01/45 | 15,000,000 | 16,583,700 | ||||||||
Series A, Pre-Refunded, 5.25%, 1/01/25 | 1,000,000 | 1,069,650 | ||||||||
Series A, Pre-Refunded, 5.00%, 1/01/26 | 5,000,000 | 5,327,750 | ||||||||
Series A, Pre-Refunded, 5.00%, 1/01/27 | 1,750,000 | 1,864,713 | ||||||||
Series A, Pre-Refunded, 5.25%, 1/01/32 | 5,000,000 | 5,348,250 | ||||||||
Series C, AGMC Insured, 5.00%, 8/01/40 | 7,000,000 | 7,640,150 | ||||||||
Pittsburgh and Allegheny County Sports and Exhibition Authority Hotel Room Regional Enterprise Tower Revenue, Refunding, AGMC Insured, 5.00%, 2/01/35 | 18,000,000 | 19,681,740 | ||||||||
South Fork Municipal Authority Hospital Revenue, Conemaugh Valley Memorial Hospital, Series B, Assured Guaranty, Pre-Refunded, 5.375%, 7/01/35 | 15,000,000 | 16,857,000 | ||||||||
State Public School Building Authority Revenue, Commonwealth of Pennsylvania, School Lease, The School District of Philadelphia Project, Refunding, Series A, AGMC Insured, 5.00%, 6/01/32 | 10,000,000 | 11,099,700 | ||||||||
Westmoreland County Municipal Authority Revenue, | ||||||||||
Municipal Service, Refunding, BAM Insured, 5.00%, 8/15/38 | 1,200,000 | 1,341,204 | ||||||||
Municipal Service, Refunding, BAM Insured, 5.00%, 8/15/42 | 17,205,000 | 19,137,466 | ||||||||
|
| |||||||||
| 451,751,356 | ||||||||||
|
| |||||||||
| Rhode Island 0.8% | ||||||||||
Rhode Island Convention Center Authority Revenue, Refunding, Series A, Assured Guaranty, 5.50%, 5/15/27 | 17,300,000 | 18,709,604 | ||||||||
Rhode Island Health and Educational Building Corp. Revenue, Hospital Financing, Lifespan Obligation Group, Refunding, 5.00%, 5/15/39 | 5,500,000 | 5,815,150 | ||||||||
Rhode Island Housing and Mortgage Finance Corp. Revenue, | ||||||||||
Homeownership Opportunity, Refunding, Series 15-A, 6.85%, 10/01/24 | 155,000 | 155,688 | ||||||||
Homeownership Opportunity, Series 10-A, 6.50%, 10/01/22 | 220,000 | 220,917 | ||||||||
Homeownership Opportunity, Series 10-A, 6.50%, 4/01/27 | 130,000 | 130,532 | ||||||||
Rhode Island State EDC Special Facility Revenue, Rhode Island Airport Corp. Project, first lien, CIFG Insured, 5.00%, 7/01/31 | 5,720,000 | 5,734,586 | ||||||||
| 36 | Annual Report | franklintempleton.com | ||
FRANKLIN FEDERAL TAX-FREE INCOME FUND
STATEMENT OF INVESTMENTS
| Principal Amount | Value | |||||||||
Municipal Bonds (continued) | ||||||||||
Rhode Island (continued) | ||||||||||
Rhode Island State Health and Educational Building Corp. Higher Education Facilities Revenue, Brown University Issue, Refunding, Series A, 5.00%, 9/01/39 | $ | 9,000,000 | $ | 9,704,880 | ||||||
Rhode Island State Health and Educational Building Corp. Higher Education Facility Revenue, | ||||||||||
Board of Governors for Higher Education, University of Rhode Island, Auxiliary Enterprise Issue, Series B, AGMC Insured, 5.00%, 9/15/30 | 7,535,000 | 8,319,092 | ||||||||
Board of Governors for Higher Education, University of Rhode Island, Auxiliary Enterprise Issue, Series B, AGMC Insured, 5.00%, 9/15/35 | 4,500,000 | 4,945,050 | ||||||||
Board of Governors for Higher Education, University of Rhode Island, Auxiliary Enterprise Issue, Series B, AGMC Insured, 5.00%, 9/15/40 | 10,270,000 | 11,246,985 | ||||||||
New England Institute of Technology Issue, Series A, Pre-Refunded, 5.125%, 3/01/40 | 16,435,000 | 18,242,357 | ||||||||
Rhode Island State Health and Educational Building Corp. Revenue, | ||||||||||
Hospital Financing, Lifespan Obligated Group Issue, Series A, Pre-Refunded, 7.00%, 5/15/39 | 8,200,000 | 9,161,286 | ||||||||
Public Schools, Bond Financing Program, Town of East Greenwich Issue, Series A, 5.00%, 5/15/37 | 10,000,000 | 11,362,900 | ||||||||
|
| |||||||||
| 103,749,027 | ||||||||||
|
| |||||||||
South Carolina 1.1% | ||||||||||
Greenwood Fifty School Facilities Inc. Installment Purchase Revenue, Greenwood School District No. 50, South Carolina Project, Assured Guaranty, Pre-Refunded, 4.50%, 12/01/32 | 7,030,000 | 7,176,294 | ||||||||
Piedmont Municipal Power Agency Electric Revenue, | ||||||||||
Refunding, NATL Insured, 6.25%, 1/01/21 | 200,000 | 233,636 | ||||||||
Refunding, Series A-2, 5.00%, 1/01/24 | 7,240,000 | 7,409,778 | ||||||||
Series A-2, Pre-Refunded, 5.00%, 1/01/24 | 2,760,000 | 2,833,830 | ||||||||
Richland County Hospital Facilities Revenue, Community Provider, Pooled Loan Program, Series A, AGMC Insured, ETM, 7.125%, 7/01/17 | 280,000 | 282,817 | ||||||||
Rock Hill Utility System Revenue, | ||||||||||
Combined Utility System, Refunding, 5.00%, 1/01/41 | 7,690,000 | 8,496,681 | ||||||||
Combined Utility System, Refunding, 5.00%, 1/01/47 | 5,000,000 | 5,528,400 | ||||||||
South Carolina Jobs EDA Hospital Revenue, | ||||||||||
AnMed Health Project, Improvement, Series B, Assured Guaranty, Pre-Refunded, 5.375%, 2/01/29 | 4,000,000 | 4,289,520 | ||||||||
Palmetto Health, Refunding, Series A, AGMC Insured, 5.00%, 8/01/35 | 40,000,000 | 40,816,000 | ||||||||
Palmetto Health, Refunding and Improvement, 5.75%, 8/01/39 | 3,000,000 | 3,158,250 | ||||||||
South Carolina State Public Service Authority Revenue, | ||||||||||
Refunding and Improvement, Series A, 5.00%, 12/01/55 | 20,000,000 | 21,142,000 | ||||||||
Refunding and Improvement, Series B, 5.00%, 12/01/50 | 15,000,000 | 15,919,800 | ||||||||
Series A, Pre-Refunded, 5.50%, 1/01/38 | 7,500,000 | 8,053,200 | ||||||||
Series B, Pre-Refunded, 5.25%, 1/01/34 | 6,000,000 | 6,423,120 | ||||||||
Spartanburg Water System Revenue, Assured Guaranty, 5.00%, 6/01/39 | 6,000,000 | 6,420,300 | ||||||||
Woodruff Roebuck Water District Revenue, South Carolina Water System Improvement, AGMC Insured, Pre-Refunded, 5.00%, 6/01/40 | 3,000,000 | 3,343,440 | ||||||||
|
| |||||||||
| 141,527,066 | ||||||||||
|
| |||||||||
South Dakota 0.4% | ||||||||||
Huron School District No. 2-2 GO, 5.00%, 6/15/39 | 4,000,000 | 4,546,160 | ||||||||
South Dakota State Health and Educational Facilities Authority Revenue, | ||||||||||
Avera Health Issue, Series B, 5.50%, 7/01/35 | 3,000,000 | 3,123,000 | ||||||||
Avera Health Issue, Series B, 5.25%, 7/01/38 | 5,000,000 | 5,166,150 | ||||||||
Sanford Health, Pre-Refunded, 5.00%, 11/01/27 | 2,355,000 | 2,355,000 | ||||||||
Sanford Health, Pre-Refunded, 5.00%, 11/01/40 | 12,945,000 | 12,945,000 | ||||||||
Vocational Education Program, Refunding, Series A, 5.00%, 8/01/38 | 3,475,000 | 3,855,825 | ||||||||
Vocational Education Program, Refunding, Series A, 5.00%, 8/01/46 | 6,005,000 | 6,782,528 | ||||||||
| franklintempleton.com | Annual Report | 37 | ||
FRANKLIN FEDERAL TAX-FREE INCOME FUND
STATEMENT OF INVESTMENTS
| Principal Amount | Value | |||||||||
Municipal Bonds (continued) | ||||||||||
South Dakota (continued) | ||||||||||
South Dakota State Health and Educational Facilities Authority Revenue, (continued) | ||||||||||
Vocational Education Program, Series A, 5.125%, 8/01/46 | $ | 7,000,000 | $ | 7,891,800 | ||||||
|
| |||||||||
| 46,665,463 | ||||||||||
|
| |||||||||
Tennessee 0.3% | ||||||||||
Johnson City Health and Educational Facilities Board Hospital Revenue, | ||||||||||
Johnson City Medical Center Hospital, Improvement, Series C, NATL Insured, ETM, 5.25%, 7/01/28 | 8,500,000 | 8,517,085 | ||||||||
Johnson City Medical Center Hospital, Improvement, Series C, NATL Insured, Pre-Refunded, 5.125%, 7/01/25 | 240,000 | 240,490 | ||||||||
Knox County Health Educational and Housing Facility Board Hospital Revenue, Covenant Health, Refunding, Series A, 5.00%, 1/01/42 | 30,000,000 | 33,193,800 | ||||||||
|
| |||||||||
| 41,951,375 | ||||||||||
|
| |||||||||
Texas 11.3% | ||||||||||
Alamo Regional Mobility Authority Revenue, | ||||||||||
junior lien, 5.00%, 6/15/39 | 6,235,000 | 7,040,936 | ||||||||
senior lien, 5.00%, 6/15/46 | 11,115,000 | 12,484,146 | ||||||||
Allen ISD, GO, Collin County, School Building, Series A, Pre-Refunded, 5.00%, 2/15/39 | 11,575,000 | 12,386,871 | ||||||||
Austin Community College District Public Facility Corp. Revenue, | ||||||||||
Educational Facility Project, Round Rock Campus, Pre-Refunded, 5.25%, 8/01/33 | 8,675,000 | 9,134,168 | ||||||||
Hays New Campus Project, 5.00%, 8/01/36 | 5,700,000 | 6,483,237 | ||||||||
Austin Electric Utility System Revenue, Refunding, Series A, 5.00%, 11/15/45 | 10,000,000 | 11,294,900 | ||||||||
Austin Water and Wastewater System Revenue, Travis Williamson and Hays Counties, Refunding, Series A, 5.00%, 11/15/38 | 20,000,000 | 22,712,000 | ||||||||
Bexar County Hospital District GO, | ||||||||||
Certificates of Obligation, Combination Tax and Revenue, 5.00%, 2/15/38 | 1,910,000 | 1,964,588 | ||||||||
Certificates of Obligation, Combination Tax and Revenue, Pre-Refunded, 5.00%, 2/15/38 | 8,090,000 | 8,348,880 | ||||||||
Central Texas Regional Mobility Authority Revenue, | ||||||||||
senior lien, Pre-Refunded, 6.00%, 1/01/41 | 14,000,000 | 16,273,880 | ||||||||
senior lien, Refunding, 5.00%, 1/01/40 | 12,505,000 | 13,777,634 | ||||||||
senior lien, Refunding, 5.00%, 1/01/46 | 11,245,000 | 12,345,548 | ||||||||
senior lien, Series A, 5.00%, 1/01/45 | 5,000,000 | 5,479,850 | ||||||||
Clifton Higher Education Finance Corp. Education Revenue, Idea Public Schools, Series A, PSF Guarantee, 5.00%, 8/15/46 | 5,000,000 | 5,585,650 | ||||||||
Corpus Christi Utility System Revenue, | ||||||||||
Improvement, junior lien, 5.00%, 7/15/38 | 6,000,000 | 6,681,240 | ||||||||
Improvement, junior lien, 5.00%, 7/15/43 | 7,000,000 | 7,744,660 | ||||||||
Improvement, junior lien, Series A, 5.00%, 7/15/40 | 13,200,000 | 14,600,124 | ||||||||
Crowley ISD, GO, Tarrant and Johnson Counties, Unlimited Tax School Building, PSF Guarantee, Pre-Refunded, 5.00%, 8/01/36 | 13,900,000 | 14,601,672 | ||||||||
Dallas Area Rapid Transit Sales Tax Revenue, | ||||||||||
Refunding, Series A, 5.00%, 12/01/46 | 10,000,000 | 11,268,700 | ||||||||
Refunding, Series A, 5.00%, 12/01/48 | 12,200,000 | 13,728,416 | ||||||||
Dallas Civic Center Revenue, Refunding and Improvement, Assured Guaranty, 5.25%, 8/15/34 | 18,975,000 | 20,476,871 | ||||||||
Dallas Waterworks and Sewer System Revenue, | ||||||||||
Pre-Refunded, 5.00%, 10/01/35 | 4,515,000 | 5,072,196 | ||||||||
Refunding, 5.00%, 10/01/35 | 5,485,000 | 6,097,729 | ||||||||
Dallas/Fort Worth International Airport Revenue, | ||||||||||
Joint, Refunding, Series D, 5.25%, 11/01/32 | 10,000,000 | 11,678,200 | ||||||||
Joint Improvement, Series A, 5.00%, 11/01/42 | 25,000,000 | 27,581,500 | ||||||||
Ector County ISD, GO, School Building, PSF Guarantee, 5.00%, 8/15/36 | 10,355,000 | 11,614,375 | ||||||||
| 38 | Annual Report | franklintempleton.com | ||
FRANKLIN FEDERAL TAX-FREE INCOME FUND
STATEMENT OF INVESTMENTS
| Principal Amount | Value | |||||||||
Municipal Bonds (continued) | ||||||||||
Texas (continued) | ||||||||||
Forney ISD, | ||||||||||
GO, Refunding, PSF Guarantee, 5.00%, 8/15/37 | $ | 15,000,000 | $ | 17,008,650 | ||||||
GO, School Building, Series A, PSF Guarantee, Pre-Refunded, 6.00%, 8/15/37 | 2,000,000 | 2,128,220 | ||||||||
Frisco ISD, | ||||||||||
GO, Collin and Denton Counties, School Building, Refunding, Series B, PSF Guarantee, 5.00%, 8/15/41 | 10,000,000 | 11,426,700 | ||||||||
GO, Collin and Denton Counties, School Building, Refunding, Series B, PSF Guarantee, 5.00%, 8/15/46 | 15,000,000 | 17,062,650 | ||||||||
Goose Creek Consolidated ISD, GO, Schoolhouse, PSF Guarantee, 5.00%, 2/15/38 | 6,045,000 | 6,757,101 | ||||||||
Grand Parkway Transportation Corp. System Toll Revenue, Capital Appreciation, Series B, zero cpn. to 9/30/23, 5.80% thereafter, 10/01/45 | 10,000,000 | 8,556,000 | ||||||||
Harris County Cultural Education Facilities Finance Corp. Revenue, | ||||||||||
Houston Methodist Hospital, 5.00%, 12/01/45 | 30,000,000 | 32,613,600 | ||||||||
Memorial Hermann Health System, 5.00%, 7/01/45 | 15,000,000 | 16,478,250 | ||||||||
Harris County Health Facilities Development Corp. Hospital Revenue, Memorial Hermann Healthcare | ||||||||||
System, Series B, Pre-Refunded, 7.25%, 12/01/35 | 13,500,000 | 14,819,625 | ||||||||
Harris County MTA Revenue, Sales and Use Tax, Contractual Obligations, Series B, Pre-Refunded, 5.00%, 11/01/33 | 10,000,000 | 10,938,900 | ||||||||
Hays County GO, Road, 5.00%, 2/15/36 | 6,960,000 | 7,598,650 | ||||||||
Hidalgo County Regional Mobility Authority Vehicle Registration Revenue, | ||||||||||
senior lien, Refunding, 5.25%, 12/01/38 | 5,000,000 | 5,855,600 | ||||||||
senior lien, Refunding, 5.00%, 12/01/43 | 5,000,000 | 5,672,600 | ||||||||
Houston Airport System Revenue, | ||||||||||
Refunding, second lien, Series A, 5.50%, 7/01/34 | 5,000,000 | 5,239,350 | ||||||||
Refunding, second lien, Series A, 5.50%, 7/01/39 | 30,850,000 | 32,293,780 | ||||||||
Houston Utility System Revenue, Combined, first lien, Refunding, Series D, 5.00%, 11/15/36 | 10,000,000 | 11,373,000 | ||||||||
Hutto ISD, GO, Refunding, Series A, PSF Guarantee, 5.00%, 8/01/39 | 10,000,000 | 11,225,600 | ||||||||
Keller ISD, GO, School Building, Pre-Refunded, 5.50%, 2/15/35 | 10,000,000 | 10,780,300 | ||||||||
Laredo Waterworks Sewer System Revenue, | ||||||||||
AGMC Insured, 5.00%, 3/01/41 | 2,500,000 | 2,718,125 | ||||||||
Pre-Refunded, 5.25%, 3/01/40 | 16,535,000 | 18,386,259 | ||||||||
Refunding, 4.00%, 3/01/41 | 5,210,000 | 5,302,999 | ||||||||
Lower Colorado River Authority Transmission Contract Revenue, | ||||||||||
LCRA Transmission Services Corp. Project, Refunding, 5.50%, 5/15/36 | 15,310,000 | 16,493,310 | ||||||||
LCRA Transmission Services Corp. Project, Refunding, Series A, 5.00%, 5/15/36 | 10,000,000 | 11,231,100 | ||||||||
Lubbock-Cooper ISD, GO, Refunding, PSF Guarantee, 5.00%, 2/15/41 | 12,500,000 | 14,121,500 | ||||||||
Lufkin Health Facilities Development Corp. Revenue, Memorial Health System of East Texas, Pre-Refunded, 6.25%, 2/15/37 | 5,000,000 | 5,456,200 | ||||||||
Matagorda County Hospital District Revenue, FHA Insured, 5.00%, 2/15/35 | 10,000,000 | 10,276,300 | ||||||||
Midlothian ISD, GO, School Building, Series A, PSF Guarantee, 5.00%, 2/15/47 | 11,865,000 | 13,433,078 | ||||||||
New Hope Cultural Education Facilities Finance Corp. Revenue, Texas A&M University Project, Series A-1, 5.00%, 4/01/46 | 6,000,000 | 6,712,920 | ||||||||
New Hope Cultural Education Facilities Finance Corp. Student Housing Revenue, | ||||||||||
Collegiate Housing Corpus Christi II, Texas A&M University Corpus Christi Project, Series A, 5.00%, 4/01/48 | 1,250,000 | 1,293,563 | ||||||||
NCCD-College Station Properties LLC, Texas A&M University Project, | ||||||||||
Series A, 5.00%, 7/01/47 | 10,000,000 | 10,547,400 | ||||||||
North East Regional Mobility Authority Revenue, senior lien, 5.00%, 1/01/41 | 16,750,000 | 18,130,702 | ||||||||
North Fort Bend Water Authority Water System Revenue, Assured Guaranty, 5.25%, 12/15/34 | 40,000,000 | 43,683,200 | ||||||||
North Harris County Regional Water Authority Revenue,senior lien, 5.00%, 12/15/46 | 18,685,000 | 21,021,186 | ||||||||
senior lien, Pre-Refunded, 5.25%, 12/15/33 | 27,000,000 | 28,839,780 | ||||||||
senior lien, Pre-Refunded, 5.50%, 12/15/38 | 25,000,000 | 26,803,500 | ||||||||
| franklintempleton.com | Annual Report | 39 | ||
FRANKLIN FEDERAL TAX-FREE INCOME FUND
STATEMENT OF INVESTMENTS
| Principal Amount | Value | |||||||||
Municipal Bonds (continued) | ||||||||||
Texas (continued) | ||||||||||
North Harris County Regional Water Authority Revenue, (continued) | ||||||||||
senior lien, Refunding, 4.00%, 12/15/41 | $ | 20,000,000 | $ | 20,222,400 | ||||||
North Texas Tollway Authority Revenue, | 2,270,000 | 2,444,245 | ||||||||
first tier, Series A, Pre-Refunded, 6.25%, 1/01/39 | 10,230,000 | 11,084,000 | ||||||||
Refunding, Series A, 5.00%, 1/01/39 | 10,000,000 | 11,255,100 | ||||||||
Special Projects System, Capital Appreciation, first tier, Refunding, Series I, 6.50%, 1/01/43 | 25,000,000 | 31,025,250 | ||||||||
Special Projects System, Capital Appreciation, Series B, zero cpn., 9/01/37 | 7,500,000 | 2,851,275 | ||||||||
Special Projects System, Capital Appreciation, Series B, zero cpn., 9/01/43 | 7,500,000 | 1,786,875 | ||||||||
Special Projects System, Capital Appreciation, Series C, zero cpn. to 9/01/21, 6.75% thereafter, 9/01/45 | 25,000,000 | 27,698,500 | ||||||||
System, first tier, Refunding, Series A, 5.75%, 1/01/40 | 4,825,000 | 4,962,223 | ||||||||
System, first tier, Series A, Pre-Refunded, 5.75%, 1/01/40 | 30,175,000 | 31,135,369 | ||||||||
System, first tier, Series K, Subseries K-2, Assured Guaranty, Pre-Refunded, 6.00%, 1/01/38 | 15,000,000 | 16,203,750 | ||||||||
System, second tier, Refunding, Series A, 5.00%, 1/01/35 | 10,000,000 | 11,199,600 | ||||||||
System, second tier, Refunding, Series A, 5.00%, 1/01/38 | 10,000,000 | 11,120,600 | ||||||||
System, second tier, Series F, Pre-Refunded, 5.75%, 1/01/38 | 30,000,000 | 30,960,600 | ||||||||
Palestine ISD, GO, Anderson County, School Building, Assured Guaranty, Pre-Refunded, 5.50%, 2/15/39 | 12,530,000 | 13,507,716 | ||||||||
Port Neches-Groves ISD, GO, Jefferson County, Unlimited Tax School Building, Assured Guaranty, Pre-Refunded, 5.00%, 2/15/34 | 11,375,000 | 11,739,000 | ||||||||
Port of Houston Authority Harris County GO, Refunding, Series A, 5.625%, 10/01/38 | 14,000,000 | 14,901,320 | ||||||||
Prosper ISD, GO, School Building, PSF Guarantee, 5.00%, 2/15/47 | 9,725,000 | 11,141,057 | ||||||||
Red River Education Financing Corp. Higher Education Revenue, St. Edwards University Project, Refunding, 5.00%, 6/01/46 | 2,250,000 | 2,423,340 | ||||||||
San Antonio Airport System Revenue, Improvement, Passenger Facility Charge, sub. lien, Refunding and Improvement, AGMC Insured, 5.375%, 7/01/40 | 5,000,000 | 5,453,250 | ||||||||
San Antonio Electric and Gas Systems Revenue, junior lien, 5.00%, 2/01/38 | 10,000,000 | 11,221,500 | ||||||||
San Antonio Public Facilities Corp. Lease Revenue, Refunding and Improvement, Convention Center Refinancing and Expansion Project, 4.00%, 9/15/42 | 36,500,000 | 36,885,440 | ||||||||
San Antonio Water System Revenue, junior lien, Refunding, Series C, 5.00%, 5/15/46 | 13,000,000 | 14,840,540 | ||||||||
San Jacinto River Authority Special Project Revenue, | ||||||||||
Group Project, AGMC Insured, 5.00%, 10/01/32 | 5,000,000 | 5,378,250 | ||||||||
Group Project, AGMC Insured, 5.00%, 10/01/37 | 3,000,000 | 3,216,630 | ||||||||
San Marcos Electric Utility System Revenue, Hays Caldwell and Guadalupe Counties, BAM Insured, 5.00%, 11/01/33 | 6,300,000 | 7,121,142 | ||||||||
Schertz-Cibolo-Universal City ISD, GO, School Building, PSF Guarantee, 5.00%, 2/01/42 | 10,000,000 | 11,322,300 | ||||||||
Southwest Higher Education Authority Revenue, Southern Methodist University Project, Series A, 5.00%, 10/01/38 | 24,380,000 | 27,583,532 | ||||||||
Tarrant County Cultural Education Facilities Finance Corp. Hospital Revenue, | ||||||||||
Cook Children’s Medical Center, Refunding, Series A, 5.25%, 12/01/39 | 10,000,000 | 11,207,100 | ||||||||
Hendrick Medical Center Obligation Group, Refunding, 5.50%, 9/01/43 | 5,350,000 | 5,926,730 | ||||||||
Tarrant County Cultural Education Facilities Finance Corp. Revenue, Texas Health Resources System, | ||||||||||
Series A, 5.00%, 11/15/52 | 5,000,000 | 5,440,850 | ||||||||
Tarrant County Health Facilities Development Corp. Health System Revenue, | ||||||||||
Harris Methodist Health System, FGIC Insured, ETM, 6.00%, 9/01/24 | 3,385,000 | 3,926,769 | ||||||||
Harris Methodist Health System, NATL Insured, ETM, 6.00%, 9/01/24 | 2,790,000 | 3,242,594 | ||||||||
Tarrant Regional Water District Water Revenue, Refunding and Improvement, 5.00%, 3/01/37 | 10,000,000 | 11,398,500 | ||||||||
Texas City IDC Marine Terminal Revenue, ARCO Pipe Line Co. Project, Refunding, 7.375%, 10/01/20 | 500,000 | 594,925 | ||||||||
| 40 | Annual Report | franklintempleton.com | ||
FRANKLIN FEDERAL TAX-FREE INCOME FUND
STATEMENT OF INVESTMENTS
| Principal Amount | Value | |||||||||
Municipal Bonds (continued) | ||||||||||
Texas (continued) | ||||||||||
Texas State GO, | ||||||||||
Transportation Commission, Highway Improvement, 5.00%, 4/01/39 | $ | 40,000,000 | $ | 45,198,800 | ||||||
Transportation Commission, Mobility Fund, Refunding, Series A, 5.00%, 10/01/39 | 30,000,000 | 34,152,000 | ||||||||
Water Financial Assistance, Refunding, Series C-1, 5.00%, 8/01/34 | 7,000,000 | 7,566,090 | ||||||||
Texas State Municipal Power Agency Revenue, Transmission, sub. lien, Refunding, 5.00%, 9/01/40 | 15,250,000 | 16,658,642 | ||||||||
Texas State Transportation Commission Turnpike System Revenue, | ||||||||||
first tier, Refunding, Series A, AGMC Insured, 5.00%, 8/15/41 | 16,000,000 | 17,576,640 | ||||||||
first tier, Refunding, Series A, BAM Insured, 5.00%, 8/15/41 | 9,665,000 | 10,617,389 | ||||||||
first tier, Refunding, Series B, 5.00%, 8/15/37 | 10,000,000 | 11,085,300 | ||||||||
second tier, Refunding, Series C, 5.00%, 8/15/37 | 15,000,000 | 16,536,150 | ||||||||
second tier, Refunding, Series C, 5.00%, 8/15/42 | 10,000,000 | 10,997,000 | ||||||||
Ysleta ISD, GO, School Building, PSF Guarantee, 5.00%, 8/15/45 | 15,000,000 | 16,950,300 | ||||||||
|
| |||||||||
| 1,398,498,252 | ||||||||||
|
| |||||||||
Utah 1.1% | ||||||||||
Jordan Valley Water Conservancy District Water Revenue, Series B, 5.00%, 10/01/41 | 15,000,000 | 16,726,500 | ||||||||
Salt Lake City Airport Revenue, Series A, 5.00%, 7/01/42 | 15,000,000 | 16,950,450 | ||||||||
St. George Electric Revenue, | ||||||||||
AGMC Insured, Pre-Refunded, 5.00%, 6/01/33 | 5,000,000 | 5,217,150 | ||||||||
AGMC Insured, Pre-Refunded, 5.00%, 6/01/38 | 5,000,000 | 5,217,150 | ||||||||
State Board of Regents University of Utah Revenue, General, Refunding, Series A, 5.00%, 8/01/43 | 21,975,000 | 24,982,279 | ||||||||
Uintah County Municipal Building Authority Lease Revenue, Pre-Refunded, 5.50%, 6/01/37 | 5,000,000 | 5,238,350 | ||||||||
Utah Associated Municipal Power Systems Revenue, Central St. George Project, Pre-Refunded, 5.25%, 12/01/27 | 9,735,000 | 10,751,042 | ||||||||
Utah State Municipal Power Agency Supply System Revenue, Series B, 5.00%, 7/01/38 | 12,105,000 | 13,557,358 | ||||||||
Utah State Transit Authority Sales Tax Revenue, Series A, AGMC Insured, Pre-Refunded, 5.00%, 6/15/36 | 33,000,000 | 34,484,340 | ||||||||
Weber Basin Water Conservancy District Water Revenue, Series B, 5.00%, 4/01/39 | 7,180,000 | 8,198,698 | ||||||||
|
| |||||||||
| 141,323,317 | ||||||||||
|
| |||||||||
Vermont 0.4% | ||||||||||
Vermont Educational and Health Buildings Financing Agency Revenue, | ||||||||||
Hospital, Fletcher Allen Health Care Project, Series B, AGMC Insured, Pre-Refunded, 5.00%, 12/01/34 | 5,500,000 | 5,735,840 | ||||||||
Middlebury College Project, Refunding, 5.00%, 11/01/38 | 10,000,000 | 10,843,500 | ||||||||
Middlebury College Project, Refunding, 5.00%, 11/01/40 | 26,565,000 | 29,498,307 | ||||||||
The University of Vermont Medical Center Project, Refunding, Series A, 5.00%, 12/01/36 | 5,000,000 | 5,501,200 | ||||||||
|
| |||||||||
| 51,578,847 | ||||||||||
|
| |||||||||
Virginia 0.3% | ||||||||||
Chesterfield County EDA Revenue, Bon Secours Health System Inc., Series C-2, Assured Guaranty, 5.00%, 11/01/42 | 8,000,000 | 8,538,000 | ||||||||
Fairfax County EDA Facility Revenue, Community Services Facilities Project, Series A, 4.50%, 3/01/37 | 11,130,000 | 11,774,538 | ||||||||
Virginia State Resources Authority Infrastructure Revenue, | ||||||||||
Virginia Pooled Financing Program, Refunding, Series A, 5.00%, 11/01/39 | 8,045,000 | 9,169,048 | ||||||||
Virginia Pooled Financing Program, Series A, Pre-Refunded, 5.00%, 11/01/39 | 4,310,000 | 5,095,282 | ||||||||
|
| |||||||||
| 34,576,868 | ||||||||||
|
| |||||||||
Washington 2.5% | ||||||||||
Central Puget Sound Regional Transportation Authority Sales and Use Tax Revenue, Series A, Pre-Refunded, 5.00%, 11/01/34 | 11,405,000 | 11,639,145 | ||||||||
FYI Properties Lease Revenue, | ||||||||||
Washington State District Project, 5.50%, 6/01/34 | 11,935,000 | 12,951,504 | ||||||||
Washington State District Project, 5.50%, 6/01/39 | 16,250,000 | 17,602,488 | ||||||||
| franklintempleton.com | Annual Report | 41 | ||
FRANKLIN FEDERAL TAX-FREE INCOME FUND
STATEMENT OF INVESTMENTS
| Principal Amount | Value | |||||||||
Municipal Bonds (continued) | ||||||||||
Washington (continued) | ||||||||||
King County GO, Sewer Revenues, Pre-Refunded, 5.125%, 1/01/33 | $ | 10,000,000 | $ | 10,684,600 | ||||||
King County Public Hospital District No. 1 GO, Series B, Pre-Refunded, 5.25%, 12/01/37 | 5,000,000 | 5,230,500 | ||||||||
King County Sewer Revenue, Pre-Refunded, 5.00%, 1/01/32 | 7,085,000 | 7,915,220 | ||||||||
NJB Properties Lease Revenue, King County Washington Project, Series A, 5.00%, 12/01/36 | 5,000 | 5,014 | ||||||||
Washington State GO, | ||||||||||
Motor Vehicle Fuel Tax, Senior 520 Corridor Program Toll, Series C, 5.00%, 6/01/33 | 5,000,000 | 5,657,850 | ||||||||
Various Purpose, Series A, Pre-Refunded, 5.00%, 7/01/33 | 44,300,000 | 46,366,152 | ||||||||
Washington State Health Care Facilities Authority Revenue, | ||||||||||
Central Washington Health Services Assn., Pre-Refunded, 6.75%, 7/01/29 | 5,000,000 | 5,587,850 | ||||||||
Fred Hutchinson Cancer Research Center, Refunding, Series A, 5.00%, 1/01/47 | 10,000,000 | 10,827,600 | ||||||||
Fred Hutchinson Cancer Research Center, Series A, Pre-Refunded, 6.00%, 1/01/33 | 7,500,000 | 8,287,725 | ||||||||
MultiCare Health System, Series B, AGMC Insured, 5.00%, 8/15/41 | 9,170,000 | 9,466,833 | ||||||||
MultiCare Health System, Series B, AGMC Insured, Pre-Refunded, 5.00%, 8/15/34 | 17,550,000 | 18,451,894 | ||||||||
MultiCare Health System, Series B, Assured Guaranty, Pre-Refunded, 6.00%, 8/15/39 | 3,000,000 | 3,328,350 | ||||||||
Providence Health and Services, Refunding, Series A, 5.00%, 10/01/42 | 10,175,000 | 11,014,946 | ||||||||
Providence Health and Services, Refunding, Series C, AGMC Insured, 5.25%, 10/01/33 | 10,000,000 | 10,482,200 | ||||||||
Providence Health and Services, Refunding, Series D, 5.00%, 10/01/41 | 10,000,000 | 10,896,500 | ||||||||
Providence Health and Services, Refunding, Series D, AGMC Insured, 5.25%, 10/01/33 | 18,000,000 | 18,888,840 | ||||||||
Seattle Children’s Hospital, Refunding, Series B, 5.00%, 10/01/38 | 15,000,000 | 16,806,750 | ||||||||
Virginia Mason Medical Center, Series B, ACA Insured, 6.00%, 8/15/37 | 30,000,000 | 30,287,400 | ||||||||
Virginia Mason Medical Center, Series B, NATL Insured, 5.00%, 2/15/27 | 4,280,000 | 4,315,310 | ||||||||
Virginia Mason Medical Center, Series C, Assured Guaranty, 5.50%, 8/15/36 | 16,000,000 | 16,149,280 | ||||||||
Washington State Higher Education Facilities Authority Revenue, | ||||||||||
Whitworth University Project, Pre-Refunded, 5.375%, 10/01/29 | 3,000,000 | 3,299,760 | ||||||||
Whitworth University Project, Pre-Refunded, 5.875%, 10/01/34 | 6,000,000 | 6,670,680 | ||||||||
|
| |||||||||
| 302,814,391 | ||||||||||
|
| |||||||||
| West Virginia 0.8% | ||||||||||
Berkeley County Public Service Sewer District Sewer Revenue, Refunding, Series B, BAM Insured, 5.00%, 6/01/36 | 1,000,000 | 1,123,210 | ||||||||
County Commission of Harrison County Solid Waste Disposal Revenue, Allegheny Energy Supply Co. | ||||||||||
LLC Harrison Station Project, Refunding, Series D, 5.50%, 10/15/37 | 9,000,000 | 9,062,820 | ||||||||
Pleasants County PCR, County Commission, Series F, 5.25%, 10/15/37 | 14,000,000 | 13,523,020 | ||||||||
West Virginia EDA Lottery Revenue, Series A, 5.00%, 6/15/35 | 9,415,000 | 10,296,997 | ||||||||
West Virginia Hospital Finance Authority Revenue, | ||||||||||
Improvement, West Virginia University Health System, Series A, 5.00%, 6/01/42 | 7,000,000 | 7,722,330 | ||||||||
Improvement, West Virginia University Health System, Series A, 5.00%, 6/01/47 | 5,000,000 | 5,493,950 | ||||||||
West Virginia State GO, Series A, NATL Insured, Pre-Refunded, 5.20%, 11/01/26 | 10,000,000 | 10,821,600 | ||||||||
West Virginia State University Revenues, West Virginia University Projects, Series A, 5.00%, 10/01/44 | 21,800,000 | 24,127,586 | ||||||||
West Virginia State Water Development Authority Infrastructure Revenue, | ||||||||||
West Virginia Infrastructure and Jobs Development Council Program, Refunding, Series A, 5.00%, 10/01/36 | 5,000,000 | 5,567,100 | ||||||||
West Virginia Infrastructure and Jobs Development Council Program, Refunding, Series A, 5.00%, 10/01/45 | 5,435,000 | 5,973,880 | ||||||||
|
| |||||||||
| 93,712,493 | ||||||||||
|
| |||||||||
| 42 | Annual Report | franklintempleton.com | ||
FRANKLIN FEDERAL TAX-FREE INCOME FUND
STATEMENT OF INVESTMENTS
| Principal Amount | Value | |||||||||
Municipal Bonds (continued) | ||||||||||
Wisconsin 0.8% | ||||||||||
Monroe RDAR, Monroe Clinic Inc., Pre-Refunded, 6.00%, 2/15/39 | $ | 11,790,000 | $ | 12,824,808 | ||||||
Superior Limited Obligation Revenue, Midwest Energy Resources Company Project, Refunding, | ||||||||||
Series E, NATL Insured, 6.90%, 8/01/21 | 3,000,000 | 3,606,060 | ||||||||
Wisconsin State General Fund Annual Appropriation Revenue, | ||||||||||
Refunding, Series A, 6.00%, 5/01/33 | 22,780,000 | 24,937,949 | ||||||||
Series A, Pre-Refunded, 6.00%, 5/01/33 | 2,510,000 | 2,751,964 | ||||||||
Series A, Pre-Refunded, 6.00%, 5/01/36 | 20,000,000 | 21,948,800 | ||||||||
Wisconsin State Health and Educational Facilities Authority Revenue, | ||||||||||
Marquette University, Refunding, Series B-1, 5.00%, 10/01/30 | 3,880,000 | 4,213,176 | ||||||||
Marquette University, Refunding, Series B-2, 5.00%, 10/01/30 | 2,540,000 | 2,758,110 | ||||||||
Marquette University, Series B-1, Pre-Refunded, 5.00%, 10/01/30 | 2,985,000 | 3,280,366 | ||||||||
Marquette University, Series B-1, Pre-Refunded, 5.00%, 10/01/33 | 1,500,000 | 1,648,425 | ||||||||
Marquette University, Series B-2, Pre-Refunded, 5.00%, 10/01/30 | 930,000 | 1,022,024 | ||||||||
Marquette University, Series B-3, 5.00%, 10/01/30 | 1,570,000 | 1,704,816 | ||||||||
Marquette University, Series B-3, Pre-Refunded, 5.00%, 10/01/30 | 580,000 | 637,391 | ||||||||
Marquette University, Series B-3, Pre-Refunded, 5.00%, 10/01/33 | 1,750,000 | 1,923,162 | ||||||||
Ministry Health Care Inc., AGMC Insured, Pre-Refunded, 5.00%, 8/01/31 | 1,500,000 | 1,558,665 | ||||||||
Ministry Health Care Inc., AGMC Insured, Pre-Refunded, 5.00%, 8/01/34 | 8,000,000 | 8,312,880 | ||||||||
Thedacare Inc., Series A, 5.50%, 12/15/38 | 5,000,000 | 5,309,550 | ||||||||
|
| |||||||||
| 98,438,146 | ||||||||||
|
| |||||||||
Wyoming 0.1% | ||||||||||
Campbell County Solid Waste Facilities Revenue, Basin Electric Power Cooperative, Dry Fork Station Facilities, Series A, 5.75%, 7/15/39 | 5,500,000 | 5,872,790 | ||||||||
Wyoming Municipal Power Agency Power Supply System Revenue, Series A, BAM Insured, 5.00%, 1/01/42 | 7,000,000 | 7,823,690 | ||||||||
|
| |||||||||
| 13,696,480 | ||||||||||
|
| |||||||||
U.S. Territories 1.0% | ||||||||||
Puerto Rico 1.0% | ||||||||||
Puerto Rico Electric Power Authority Power Revenue, | ||||||||||
Refunding, Series A, 5.00%, 7/01/42 | 18,925,000 | 13,389,437 | ||||||||
Series XX, 5.25%, 7/01/40 | 15,000,000 | 10,612,500 | ||||||||
| b | Puerto Rico PBA Guaranteed Revenue, | |||||||||
Government Facilities, Refunding, Series D, 5.25%, 7/01/27 | 3,265,000 | 1,812,075 | ||||||||
Government Facilities, Refunding, Series N, 5.00%, 7/01/37 | 20,000,000 | 10,800,000 | ||||||||
| b | Puerto Rico Public Finance Corp. Revenue, Commonwealth Appropriation, Refunding, Series B, 5.50%, 8/01/31 | 21,000,000 | 1,123,500 | |||||||
Puerto Rico Sales Tax FICO Sales Tax Revenue, | ||||||||||
Capital Appreciation, First Subordinate, Series A, zero cpn. to 8/01/19, 6.25% thereafter, 8/01/33 | 36,500,000 | 9,581,250 | ||||||||
Convertible Capital Appreciation, First Subordinate, Series A, 6.75%, 8/01/32 | 25,000,000 | 9,593,750 | ||||||||
First Subordinate, Series A, 5.50%, 8/01/42 | 40,000,000 | 13,700,000 | ||||||||
First Subordinate, Series A, 6.00%, 8/01/42 | 22,500,000 | 8,218,125 | ||||||||
First Subordinate, Series C, 5.50%, 8/01/40 | 50,000,000 | 17,375,000 | ||||||||
Senior, Refunding, Series C, 5.00%, 8/01/40 | 27,825,000 | 17,947,125 | ||||||||
Senior, Series C, 5.25%, 8/01/40 | 7,150,000 | 4,647,500 | ||||||||
|
| |||||||||
| 118,800,262 | ||||||||||
|
| |||||||||
Total Municipal Bonds before Short Term Investments | 12,152,597,769 | |||||||||
|
| |||||||||
| franklintempleton.com | Annual Report | 43 | ||
FRANKLIN FEDERAL TAX-FREE INCOME FUND
STATEMENT OF INVESTMENTS
| Principal Amount | Value | |||||||||
| Short Term Investments 0.8% | ||||||||||
Municipal Bonds 0.8% | ||||||||||
Arizona 0.2% | ||||||||||
| c Phoenix IDA Healthcare Facilities Revenue, | ||||||||||
Mayo Clinic, Series A, Daily VRDN and Put, 0.82%, 11/15/52 | $ | 10,000,000 | $ | 10,000,000 | ||||||
Mayo Clinic, Series B, Daily VRDN and Put, 0.84%, 11/15/52 | 12,000,000 | 12,000,000 | ||||||||
|
| |||||||||
| 22,000,000 | ||||||||||
|
| |||||||||
Florida 0.3% | ||||||||||
c St. Lucie County PCR, Florida Power and Light Co. Project, Refunding, Daily VRDN and Put, 0.91%, 9/01/28 | 37,800,000 | 37,800,000 | ||||||||
|
| |||||||||
Maryland 0.0%† | ||||||||||
c Montgomery County GO, Consolidated Public Improvement, BAN, Refunding, Series B, Daily VRDN and Put, 0.84%, 6/01/26 | 4,800,000 | 4,800,000 | ||||||||
|
| |||||||||
New York 0.0%† | ||||||||||
c New York City GO, Fiscal 2015, Series F, Subseries F-6, Daily VRDN and Put, 0.89%, 6/01/44 | 4,000,000 | 4,000,000 | ||||||||
|
| |||||||||
North Carolina 0.1% | ||||||||||
c The Charlotte-Mecklenburg Hospital Authority Health Care Revenue, Carolinas HealthCare System, | ||||||||||
Refunding, Series B, Daily VRDN and Put, 0.82%, 1/15/38 | 8,280,000 | 8,280,000 | ||||||||
|
| |||||||||
Tennessee 0.2% | ||||||||||
c Shelby County Health Educational and Housing Facility Board Revenue, Methodist Le Bonheur | ||||||||||
Healthcare, Refunding, Series A, AGMC Insured, Daily VRDN and Put, 0.86%, 6/01/42 | 26,000,000 | 26,000,000 | ||||||||
|
| |||||||||
| Total Short Term Investments (Cost $102,880,000) | 102,880,000 | |||||||||
|
| |||||||||
| Total Investments (Cost $11,620,989,015) 98.9% | 12,255,477,769 | |||||||||
|
| |||||||||
| Other Assets, less Liabilities 1.1% | 132,230,634 | |||||||||
|
| |||||||||
| Net Assets 100.0% | $ | 12,387,708,403 | ||||||||
|
| |||||||||
See Abbreviations on page 55.
†Rounds to less than 0.1% of net assets.
aSecurity purchased on a when-issued basis. See Note 1(b).
bSee Note 6 regarding defaulted securities.
cVariable rate demand notes (VRDNs) are tax-exempt obligations which contain a floating or variable interest rate adjustment formula and an unconditional right of demand to receive payment of the principal balance plus accrued interest at specified dates. The coupon rate shown represents the rate at period end.
| 44 | Annual Report | The accompanying notes are an integral part of these financial statements. | franklintempleton.com | ||
FRANKLIN FEDERAL TAX-FREE INCOME FUND
Statement of Assets and Liabilities
April 30, 2017
Assets: |
| |||
Investments in securities: |
| |||
Cost - Unaffiliated issuers | $ | 11,620,989,015 | ||
|
| |||
Value - Unaffiliated issuers | $ | 12,255,477,769 | ||
Cash | 280,052 | |||
Receivables: |
| |||
Capital shares sold | 14,258,497 | |||
Interest | 169,854,604 | |||
Other assets | 10,321 | |||
|
| |||
Total assets | 12,439,881,243 | |||
|
| |||
Liabilities: |
| |||
Payables: | ||||
Investment securities purchased | 25,901,887 | |||
Capital shares redeemed | 18,468,288 | |||
Management fees | 4,606,515 | |||
Distribution fees | 1,495,682 | |||
Transfer agent fees | 1,166,076 | |||
Accrued expenses and other liabilities | 534,392 | |||
|
| |||
Total liabilities | 52,172,840 | |||
|
| |||
Net assets, at value | $ | 12,387,708,403 | ||
|
| |||
Net assets consist of: |
| |||
Paid-in capital | $ | 11,985,058,014 | ||
Undistributed net investment income | 22,954,834 | |||
Net unrealized appreciation (depreciation) | 634,488,754 | |||
Accumulated net realized gain (loss) | (254,793,199 | ) | ||
|
| |||
Net assets, at value | $ | 12,387,708,403 | ||
|
| |||
Class A: |
| |||
Net assets, at value | $ | 9,342,715,386 | ||
|
| |||
Shares outstanding | 777,130,989 | |||
|
| |||
Net asset value per sharea | $12.02 | |||
|
| |||
Maximum offering price per share (net asset value per share ÷ 95.75%) | $12.55 | |||
|
| |||
Class C: |
| |||
Net assets, at value | $ | 1,411,391,057 | ||
|
| |||
Shares outstanding | 117,478,900 | |||
|
| |||
Net asset value and maximum offering price per sharea | $12.01 | |||
|
| |||
Advisor Class : |
| |||
Net assets, at value | $ | 1,633,601,960 | ||
|
| |||
Shares outstanding | 135,766,000 | |||
|
| |||
Net asset value and maximum offering price per share | $12.03 | |||
|
| |||
aRedemption price is equal to net asset value less contingent deferred sales charges, if applicable.
| franklintempleton.com | The accompanying notes are an integral part of these financial statements. | Annual Report | 45 | ||||
FRANKLIN FEDERAL TAX-FREE INCOME FUND
FINANCIAL STATEMENTS
Statement of Operations
for the year ended April 30, 2017
Investment income: |
| |||
Interest | $ | 518,654,157 | ||
|
| |||
Expenses: |
| |||
Management fees (Note 3a) | 52,289,331 | |||
Distribution fees: (Note 3c) |
| |||
Class A | 8,855,645 | |||
Class C | 8,596,839 | |||
Transfer agent fees: (Note 3e) |
| |||
Class A | 4,748,896 | |||
Class C | 709,101 | |||
Advisor Class | 799,093 | |||
Custodian fees | 101,636 | |||
Reports to shareholders | 412,170 | |||
Registration and filing fees | 444,881 | |||
Professional fees | 498,421 | |||
Trustees’ fees and expenses | 111,088 | |||
Other | 526,227 | |||
|
| |||
Total expenses | 78,093,328 | |||
|
| |||
Net investment income | 440,560,829 | |||
|
| |||
Realized and unrealized gains (losses): |
| |||
Net realized gain (loss) from investments | (24,031,855 | ) | ||
Net change in unrealized appreciation (depreciation) on investments | (383,188,451 | ) | ||
|
| |||
Net realized and unrealized gain (loss) | (407,220,306 | ) | ||
|
| |||
Net increase (decrease) in net assets resulting from operations | $ | 33,340,523 | ||
|
| |||
| 46 | Annual Report | The accompanying notes are an integral part of these financial statements. | franklintempleton.com | ||
FRANKLIN FEDERAL TAX-FREE INCOME FUND
FINANCIAL STATEMENTS
Statements of Changes in Net Assets
| Year Ended April 30, | ||||||||
| 2017 | 2016 | |||||||
Increase (decrease) in net assets: | ||||||||
Operations: | ||||||||
Net investment income | $ | 440,560,829 | $ | 420,252,842 | ||||
Net realized gain (loss) | (24,031,855 | ) | (6,530,948 | ) | ||||
Net change in unrealized appreciation (depreciation) | (383,188,451 | ) | 23,567,487 | |||||
|
| |||||||
Net increase (decrease) in net assets resulting from operations | 33,340,523 | 437,289,381 | ||||||
|
| |||||||
Distributions to shareholders from: | ||||||||
Net investment income: | ||||||||
Class A | (331,153,686 | ) | (318,461,145 | ) | ||||
Class C | (42,107,969 | ) | (38,197,482 | ) | ||||
Advisor Class | (57,250,896 | ) | (59,596,706 | ) | ||||
|
| |||||||
Total distributions to shareholders | (430,512,551 | ) | (416,255,333 | ) | ||||
|
| |||||||
Capital share transactions: (Note 2) | ||||||||
Class A | 1,257,433,741 | (140,750,827 | ) | |||||
Class C | 241,141,581 | 45,176,670 | ||||||
Advisor Class | 243,919,209 | (244,965,010 | ) | |||||
|
| |||||||
Total capital share transactions | 1,742,494,531 | (340,539,167 | ) | |||||
|
| |||||||
Net increase (decrease) in net assets | 1,345,322,503 | (319,505,119 | ) | |||||
Net assets: | ||||||||
Beginning of year | 11,042,385,900 | 11,361,891,019 | ||||||
|
| |||||||
End of year | $ | 12,387,708,403 | $ | 11,042,385,900 | ||||
|
| |||||||
Undistributed net investment income included in net assets: | ||||||||
End of year | $ | 22,954,834 | $ | 13,300,226 | ||||
|
| |||||||
| franklintempleton.com | The accompanying notes are an integral part of these financial statements. | Annual Report | 47 |
FRANKLIN FEDERAL TAX-FREE INCOME FUND
1. Organization and Significant Accounting Policies
Franklin Federal Tax-Free Income Fund (Fund) is registered under the Investment Company Act of 1940 (1940 Act) as an open-end management investment company and applies the specialized accounting and reporting guidance in U.S. Generally Accepted Accounting Principles (U.S. GAAP). The Fund offers three classes of shares: Class A, Class C, and Advisor Class. Each class of shares may differ by its initial sales load, contingent deferred sales charges, voting rights on matters affecting a single class, its exchange privilege and fees primarily due to differing arrangements for distribution and transfer agent fees.
The following summarizes the Fund’s significant accounting policies.
a. Financial Instrument Valuation
The Fund’s investments in financial instruments are carried at fair value daily. Fair value is the price that would be received to sell an asset or paid to transfer a liability in an orderly transaction between market participants on the measurement date. The Fund calculates the net asset value (NAV) per share as of 4 p.m. Eastern time each day the New York Stock Exchange (NYSE) is open for trading. Under compliance policies and procedures approved by the Fund’s Board of Trustees (the Board), the Fund’s administrator has responsibility for oversight of valuation, including leading the cross-functional Valuation Committee (VC). The VC provides administration and oversight of the Fund’s valuation policies and procedures, which are approved annually by the Board. Among other things, these procedures allow the Fund to utilize independent pricing services, quotations from securities and financial instrument dealers, and other market sources to determine fair value.
Debt securities generally trade in the over-the-counter market rather than on a securities exchange. The Fund’s pricing services use multiple valuation techniques to determine fair value. In instances where sufficient market activity exists, the pricing services may utilize a market-based approach through which quotes from market makers are used to determine fair value. In instances where sufficient market activity may not exist or is limited, the pricing services also utilize proprietary valuation models which may consider market characteristics such as benchmark yield curves, credit spreads, estimated default rates, anticipated market interest rate volatility, coupon
rates, anticipated timing of principal repayments, underlying collateral, and other unique security features in order to estimate the relevant cash flows, which are then discounted to calculate the fair value.
The Fund has procedures to determine the fair value of financial instruments for which market prices are not reliable or readily available. Under these procedures, the VC convenes on a regular basis to review such financial instruments and considers a number of factors, including significant unobservable valuation inputs, when arriving at fair value. The VC primarily employs a market-based approach which may use related or comparable assets or liabilities, recent transactions, market multiples, book values, and other relevant information for the investment to determine the fair value of the investment. An income-based valuation approach may also be used in which the anticipated future cash flows of the investment are discounted to calculate fair value. Discounts may also be applied due to the nature or duration of any restrictions on the disposition of the investments. Due to the inherent uncertainty of valuations of such investments, the fair values may differ significantly from the values that would have been used had an active market existed. The VC employs various methods for calibrating these valuation approaches including a regular review of key inputs and assumptions, transactional back-testing or disposition analysis, and reviews of any related market activity.
b. Securities Purchased on a When-Issued Basis
The Fund purchases securities on a when-issued basis, with payment and delivery scheduled for a future date. These transactions are subject to market fluctuations and are subject to the risk that the value at delivery may be more or less than the trade date purchase price. Although the Fund will generally purchase these securities with the intention of holding the securities, it may sell the securities before the settlement date. Sufficient assets have been segregated for these securities.
c. Income Taxes
It is the Fund’s policy to qualify as a regulated investment company under the Internal Revenue Code. The Fund intends to distribute to shareholders substantially all of its income and net realized gains to relieve it from federal income and excise taxes. As a result, no provision for U.S. federal income taxes is required.
| 48 | Annual Report | franklintempleton.com | ||
FRANKLIN FEDERAL TAX-FREE INCOME FUND
NOTES TO FINANCIAL STATEMENTS
The Fund may recognize an income tax liability related to its uncertain tax positions under U.S. GAAP when the uncertain tax position has a less than 50% probability that it will be sustained upon examination by the tax authorities based on its technical merits. As of April 30, 2017, the Fund has determined that no tax liability is required in its financial statements related to uncertain tax positions for any open tax years (or expected to be taken in future tax years). Open tax years are those that remain subject to examination and are based on each tax jurisdiction’s statute of limitation.
d. Security Transactions, Investment Income, Expenses and Distributions
Security transactions are accounted for on trade date. Realized gains and losses on security transactions are determined on a specific identification basis. Interest income and estimated expenses are accrued daily. Amortization of premium and accretion of discount on debt securities are included in interest income. Distributions to shareholders are recorded on the ex-dividend date and are determined according to income tax regulations (tax basis). Distributable earnings determined on a tax basis may differ from earnings recorded in accordance with U.S. GAAP. These differences may be permanent or temporary. Permanent differences are reclassified among capital accounts to reflect their tax character. These reclassifications have no impact on net assets or the results of operations. Temporary differences are not reclassified, as they may reverse in subsequent periods.
Realized and unrealized gains and losses and net investment income, not including class specific expenses, are allocated daily to each class of shares based upon the relative proportion of net assets of each class. Differences in per share distributions, by class, are generally due to differences in class specific expenses.
e. Insurance
The scheduled payments of interest and principal for each insured municipal security in the Fund are insured by either a new issue insurance policy or a secondary insurance policy. Depending on the type of coverage, premiums for insurance are either added to the cost basis of the security or paid by a third party.
Insurance companies typically insure municipal bonds that tend to be of very high quality, with the majority of underlying municipal bonds rated A or better. However, an event involving an insurer could have an adverse effect on the value of the securities insured by that insurance company. There can be no assurance the insurer will be able to fulfill its obligations under the terms of the policy.
f. Accounting Estimates
The preparation of financial statements in accordance with U.S. GAAP requires management to make estimates and assumptions that affect the reported amounts of assets and liabilities at the date of the financial statements and the amounts of income and expenses during the reporting period. Actual results could differ from those estimates.
g. Guarantees and Indemnifications
Under the Fund’s organizational documents, its officers and trustees are indemnified by the Fund against certain liabilities arising out of the performance of their duties to the Fund. Additionally, in the normal course of business, the Fund enters into contracts with service providers that contain general indemnification clauses. The Fund’s maximum exposure under these arrangements is unknown as this would involve future claims that may be made against the Fund that have not yet occurred. Currently, the Fund expects the risk of loss to be remote.
| franklintempleton.com | Annual Report | 49 | ||
FRANKLIN FEDERAL TAX-FREE INCOME FUND
NOTES TO FINANCIAL STATEMENTS
2. Shares of Beneficial Interest
At April 30, 2017, there were an unlimited number of shares authorized (without par value). Transactions in the Fund’s shares were as follows:
| Year Ended April 30, | ||||||||||||||||
| 2017 | 2016 | |||||||||||||||
| Shares | Amount | Shares | Amount | |||||||||||||
| Class A Shares: | ||||||||||||||||
Shares sold | 90,539,595 | $ | 1,109,317,525 | 73,278,237 | $ | 906,090,435 | ||||||||||
Shares issued in reinvestment of distributions | 23,991,962 | 293,857,679 | 22,616,000 | 279,118,681 | ||||||||||||
Shares issued on reorganization (Note 7) | 128,179,562 | 1,526,626,933 | — | — | ||||||||||||
Shares redeemed | (137,377,476 | ) | (1,672,368,396 | ) | (107,355,306 | ) | (1,325,959,943 | ) | ||||||||
|
| |||||||||||||||
Net increase (decrease) | 105,333,643 | $ | 1,257,433,741 | (11,461,069 | ) | $ | (140,750,827 | ) | ||||||||
|
| |||||||||||||||
| Class C Shares: | ||||||||||||||||
Shares sold | 15,472,829 | $ | 190,807,233 | 14,835,143 | $ | 183,448,788 | ||||||||||
Shares issued in reinvestment of distributions | 3,021,130 | 36,978,463 | 2,668,410 | 32,918,668 | ||||||||||||
Shares issued on reorganization (Note 7) | 20,739,803 | 247,011,073 | — | — | ||||||||||||
Shares redeemed | (19,189,681 | ) | (233,655,188 | ) | (13,863,413 | ) | (171,190,786 | ) | ||||||||
|
| |||||||||||||||
Net increase (decrease) | 20,044,081 | $ | 241,141,581 | 3,640,140 | $ | 45,176,670 | ||||||||||
|
| |||||||||||||||
| Advisor Class Shares: | ||||||||||||||||
Shares sold | 53,426,552 | $ | 652,653,037 | 33,457,419 | $ | 414,012,249 | ||||||||||
Shares issued in reinvestment of distributions | 3,892,888 | 47,733,709 | 4,103,097 | 50,661,005 | ||||||||||||
Shares issued on reorganization (Note 7) | 4,902,948 | 58,443,306 | — | — | ||||||||||||
Shares redeemed | (42,008,684 | ) | (514,910,843 | ) | (57,598,502 | ) | (709,638,264 | ) | ||||||||
|
| |||||||||||||||
Net increase (decrease) | 20,213,704 | $ | 243,919,209 | (20,037,986 | ) | $ | (244,965,010 | ) | ||||||||
|
| |||||||||||||||
3. Transactions with Affiliates
Franklin Resources, Inc. is the holding company for various subsidiaries that together are referred to as Franklin Templeton Investments. Certain officers and trustees of the Fund are also officers and/or directors of the following subsidiaries:
| Subsidiary | Affiliation | |
Franklin Advisers, Inc. (Advisers) | Investment manager | |
Franklin Templeton Services, LLC (FT Services) | Administrative manager | |
Franklin Templeton Distributors, Inc. (Distributors) | Principal underwriter | |
Franklin Templeton Investor Services, LLC (Investor Services) | Transfer agent |
| 50 | Annual Report | franklintempleton.com | ||
FRANKLIN FEDERAL TAX-FREE INCOME FUND
NOTES TO FINANCIAL STATEMENTS
a. Management Fees
The Fund pays an investment management fee to Advisers based on the month-end net assets of the Fund as follows:
| Annualized Fee Rate | Net Assets | |
0.625% | Up to and including $100 million | |
0.500% | Over $100 million, up to and including $250 million | |
0.450% | Over $250 million, up to and including $7.5 billion | |
0.440% | Over $7.5 billion, up to and including $10 billion | |
0.430% | Over $10 billion, up to and including $12.5 billion | |
0.420% | Over $12.5 billion, up to and including $15 billion | |
0.400% | Over $15 billion, up to and including $17.5 billion | |
0.380% | Over $17.5 billion, up to and including $20 billion | |
0.360% | In excess of $20 billion |
For the year ended April 30, 2017, the effective investment management fee rate was 0.447% of the Fund’s average daily net assets.
b. Administrative Fees
Under an agreement with Advisers, FT Services provides administrative services to the Fund. The fee is paid by Advisers based on the Fund’s average daily net assets, and is not an additional expense of the Fund.
c. Distribution Fees
The Board has adopted distribution plans for each share class, with the exception of Advisor Class shares, pursuant to Rule 12b-1 under the 1940 Act. Under the Fund’s Class A reimbursement distribution plan, the Fund reimburses Distributors for costs incurred in connection with the servicing, sale and distribution of the Fund’s shares up to the maximum annual plan rate. Under the Class A reimbursement distribution plan, costs exceeding the maximum for the current plan year cannot be reimbursed in subsequent periods. In addition, under the Fund’s Class C compensation distribution plan, the Fund pays Distributors for costs incurred in connection with the servicing, sale and distribution of the Fund’s shares up to the maximum annual plan rate . The plan year, for purposes of monitoring compliance with the maximum annual plan rate, is February 1 through January 31.
The maximum annual plan rates, based on the average daily net assets, for each class, are as follows:
Class A | 0.10% | |||
Class C | 0.65% |
d. Sales Charges/Underwriting Agreements
Front-end sales charges and contingent deferred sales charges (CDSC) do not represent expenses of the Fund. These charges are deducted from the proceeds of sales of Fund shares prior to investment or from redemption proceeds prior to remittance, as applicable. Distributors has advised the Fund of the following commission transactions related to the sales and redemptions of the Fund’s shares for the year:
Sales charges retained net of commissions paid to unaffiliated brokers/dealers | $1,940,492 | |||
CDSC retained | $ 187,051 |
| franklintempleton.com | Annual Report | 51 | ||
FRANKLIN FEDERAL TAX-FREE INCOME FUND
NOTES TO FINANCIAL STATEMENTS
3. Transactions with Affiliates (continued)
e. Transfer Agent Fees
Each class of shares pays transfer agent fees to Investor Services for its performance of shareholder servicing obligations and reimburses Investor Services for out of pocket expenses incurred, including shareholder servicing fees paid to third parties. These fees are allocated daily based upon their relative proportion of such classes’ aggregate net assets.
For the year ended April 30, 2017, the Fund paid transfer agent fees of $6,257,090, of which $1,933,705 was retained by Investor Services.
f. Interfund Transactions
The Fund engaged in purchases and sales of investments with funds or other accounts that have common investment manager (or affiliated investment managers), directors, trustees or officers. During the year ended April 30, 2017, the purchase and sale transactions aggregated $163,414,400 and $268,235,505 respectively.
4. Income Taxes
For tax purposes, capital losses may be carried over to offset future capital gains. Capital loss carryforwards with no expiration, if any, must be fully utilized before those losses with expiration dates.
At April 30, 2017, capital loss carryforwards were as follows:
| Capital loss carryforwards subject to expiration: | ||||
2018 | $ | 3,803,336 | ||
2019 | 17,435,155 | |||
| Capital loss carryforwards not subject to expiration: | ||||
Short term | 149,597,947 | |||
Long term | 59,865,858 | |||
|
| |||
Total capital loss carryforwards | $ | 230,702,296a | ||
|
|
aIncludes $54,890,384 from the merged Franklin Insured Tax-Free Income Fund, which may be carried over to offset future capital gains, subject to certain limitations.
On April 30, 2017, the Fund had expired capital loss carryforwards of $21,376,807, which were reclassified to paid-in capital.
The tax character of distributions paid during the years ended April 30, 2017 and 2016, was as follows:
| 2017 | 2016 | |||||||
|
| |||||||
Distributions paid from tax exempt income | $ | 430,512,551 | $ | 416,255,333 | ||||
|
| |||||||
At April 30, 2017, the cost of investments, net unrealized appreciation (depreciation), undistributed tax exempt and ordinary income for income tax purposes were as follows:
Cost of investments | $ | 11,644,011,731 | ||
|
| |||
Unrealized appreciation | $ | 823,715,673 | ||
Unrealized depreciation | (212,249,635 | ) | ||
|
| |||
Net unrealized appreciation (depreciation) | $ | 611,466,038 | ||
|
| |||
Undistributed tax exempt income | $ | 25,356,871 | ||
Undistributed ordinary income | 98,232 | |||
|
| |||
Distributable earnings | $ | 25,455,103 | ||
|
| |||
| 52 | Annual Report | franklintempleton.com | ||
FRANKLIN FEDERAL TAX-FREE INCOME FUND
NOTES TO FINANCIAL STATEMENTS
Differences between income and/or capital gains as determined on a book basis and a tax basis are primarily due to differing treatments of defaulted securities, bond discounts and premiums, wash sales and bond workout expenditures.
5. Investment Transactions
Purchases and sales of investments (excluding short term securities) for the year ended April 30, 2017, aggregated $1,763,986,626 and $1,584,127,197, respectively.
6. Defaulted Securities
The Fund held defaulted securities and/or other securities for which the income has been deemed uncollectible. At April 30, 2017, the aggregate value of these securities was $13,735,575 representing 0.1% of the Fund’s net assets. The Fund discontinues accruing income on securities for which income has been deemed uncollectible and provides an estimate for losses on interest receivable. The securities have been identified in the accompanying Statement of Investments.
7. Reorganization
On December 2, 2016, the Fund, pursuant to a plan of reorganization approved on November 7, 2016, by shareholders of Franklin Insured Tax-Free Income Fund (Acquired Fund), a series of Franklin Tax-Free Trust, acquired 100% of the Acquired Fund’s net assets, primarily made up of investment securities, which included $99,145,147 of unrealized appreciation, through a tax-free exchange of 153,822,313 shares of the Fund (valued at $1,832,081,312). Immediately after the completion of the reorganization, the combined net assets of the Fund were $12,517,460,660.
The primary purpose for the reorganization was to combine the Acquired Fund with a fund that has identical investment goals, and similar principal investment strategies and principal risks, a larger asset size that is open to investors, similar annual fund operating expenses (on a pro forma combined basis), generally comparable credit quality, similar average annual total return, and more favorable sales prospects. The estimated cost of the reorganization was $305,000 of which the Fund and the Acquired Fund each paid 25% and Advisers paid 50%. The allocated portion of the Fund’s reorganization expenses are included with other expenses in the Statement of Operations.
Assuming the reorganization had been completed on May 1, 2016, the Fund’s pro forma results of operations, would have been as follows:
| Period | Net Investment Income | Net Realized and Unrealized Gain (Loss) | Net Increase (Decrease) in Net Assets from Operations | |||||||||
For the period May 1, 2016 through April 30, 2017 | $483,004,055 | ($468,068,148 | ) | $14,935,907 | ||||||||
Subsequent to the reorganization, the Fund has been managed as a single entity. Accordingly, it is impracticable to identify the amounts of investment income and net investment income attributable to the Acquired Fund’s assets after the completion of the reorganization
8. Credit Facility
The Fund, together with other U.S. registered and foreign investment funds (collectively, Borrowers), managed by Franklin Templeton Investments, are borrowers in a joint syndicated senior unsecured credit facility totaling $2 billion (Global Credit Facility) which matures on February 9, 2018. This Global Credit Facility provides a source of funds to the Borrowers for temporary and emergency purposes, including the ability to meet future unanticipated or unusually large redemption requests.
| franklintempleton.com | Annual Report | 53 | ||
FRANKLIN FEDERAL TAX-FREE INCOME FUND
NOTES TO FINANCIAL STATEMENTS
8. Credit Facility (continued)
Under the terms of the Global Credit Facility, the Fund shall, in addition to interest charged on any borrowings made by the Fund and other costs incurred by the Fund, pay its share of fees and expenses incurred in connection with the implementation and maintenance of the Global Credit Facility, based upon its relative share of the aggregate net assets of all of the Borrowers, including an annual commitment fee of 0.15% based upon the unused portion of the Global Credit Facility.These fees are reflected in other expenses in the Statement of Operations. During the year ended April 30, 2017, the Fund did not use the Global Credit Facility.
9. Fair Value Measurements
The Fund follows a fair value hierarchy that distinguishes between market data obtained from independent sources (observable inputs) and the Fund’s own market assumptions (unobservable inputs). These inputs are used in determining the value of the Fund’s financial instruments and are summarized in the following fair value hierarchy:
| • | Level 1 – quoted prices in active markets for identical financial instruments |
| • | Level 2 – other significant observable inputs (including quoted prices for similar financial instruments, interest rates, prepayment speed, credit risk, etc.) |
| • | Level 3 – significant unobservable inputs (including the Fund’s own assumptions in determining the fair value of financial instruments) |
The input levels are not necessarily an indication of the risk or liquidity associated with financial instruments at that level.
For movements between the levels within the fair value hierarchy, the Fund has adopted a policy of recognizing the transfers as of the date of the underlying event which caused the movement.
At April 30, 2017, all of the Fund’s investments in financial instruments carried at fair value using Level 2 inputs.
10. New Accounting Pronouncements
In March 2017, the Financial Accounting Standards Board (FASB) issued Accounting Standards Update (ASU) No. 2017-08, Receivables—Nonrefundable Fees and Other Costs (Subtopic 310-20): Premium Amortization on Purchased Callable Debt Securities. The amendments in the ASU shorten the amortization period for certain callable debt securities, held at a premium, to be amortized to the earliest call date. The ASU does not require an accounting change for securities held at a discount; which continues to be amortized to maturity. The ASU is effective for fiscal years and interim periods within those fiscal years beginning after December 15, 2018. Management is currently evaluating the impact, if any, of applying this provision.
11. Investment Company Reporting Modernization
In October 2016, the U.S. Securities and Exchange Commission adopted new rules and amended existing rules (together, final rules) intended to modernize the reporting and disclosure of information by registered investment companies. In part, the final rules amend Regulation S-X and require standardized, enhanced disclosures about derivatives in investment company financial statements, as well as other amendments. The compliance date for the amendments to Regulation S-X is August 1, 2017. Management is currently evaluating the impact that the adoption of the amendments to Regulation S-X will have on the Fund’s financial statements and related disclosures.
| 54 | Annual Report | franklintempleton.com | ||
FRANKLIN FEDERAL TAX-FREE INCOME FUND
NOTES TO FINANCIAL STATEMENTS
12. Subsequent Events
The Fund has evaluated subsequent events through the issuance of the financial statements and determined that no events have occurred that require disclosure.
Abbreviations
| Selected Portfolio | ||||||
| ACA | American Capital Access Holdings Inc. | IDA | Industrial Development Authority/Agency | |||
| AGMC | Assured Guaranty Municipal Corp. | IDB | Industrial Development Bond/Board | |||
| AMBAC | American Municipal Bond Assurance Corp. | IDC | Industrial Development Corp. | |||
| BAM | Build America Mutual Assurance Co. | ISD | Independent School District | |||
| BAN | Bond Anticipation Note | MFH | Multi-Family Housing | |||
| BHAC | Berkshire Hathaway Assurance Corp. | MFHR | Multi-Family Housing Revenue | |||
| CDA | Community Development Authority/Agency | MFMR | Multi-Family Mortgage Revenue | |||
| CDD | Community Development District | MFR | Multi-Family Revenue | |||
| CIFG | CDC IXIS Financial Guaranty | MTA | Metropolitan Transit Authority | |||
| COP | Certificate of Participation | NATL | National Public Financial Guarantee Corp. | |||
| EDA | Economic Development Authority | PBA | Public Building Authority | |||
| EDC | Economic Development Corp. | PCC | Pollution Control Corp. | |||
| ETM | Escrow to Maturity | PCR | Pollution Control Revenue | |||
| FGIC | Financial Guaranty Insurance Co. | PSF | Permanent School Fund | |||
| FHA | Federal Housing Authority/Agency | RDA | Redevelopment Agency/Authority | |||
| FICO | Financing Corp. | RDAR | Redevelopment Agency Revenue | |||
| GARB | General Airport Revenue Bonds | SFHR | Single Family Housing Revenue | |||
| GNMA | Government National Mortgage Association | UHSD | Unified/Union High School District | |||
| GO | General Obligation | USD | Unified/Union School District | |||
| HFA | Housing Finance Authority/Agency | XLCA | XL Capital Assurance | |||
| HFAR | Housing Finance Authority Revenue | |||||
| franklintempleton.com | Annual Report | 55 | ||
FRANKLIN FEDERAL TAX-FREE INCOME FUND
Report of Independent Registered Public Accounting Firm
To the Board of Trustees and Shareholders of Franklin Federal Tax-Free Income Fund
In our opinion, the accompanying statement of assets and liabilities, including the statement of investments, and the related statements of operations and of changes in net assets and the financial highlights present fairly, in all material respects, the financial position of Franklin Federal Tax-Free Income Fund (the “Fund”) at April 30, 2017, the results of its operations for the year then ended, the changes in its net assets for each of the two years in the period then ended and the financial highlights for each of the five years in the period then ended, in conformity with accounting principles generally accepted in the United States of America. These financial statements and financial highlights (hereafter referred to as “financial statements”) are the responsibility of the Fund’s management. Our responsibility is to express an opinion on these financial statements based on our audit. We conducted our audit of these financial statements in accordance with the standards of the Public Company Accounting Oversight Board (United States). Those standards require that we plan and perform the audit to obtain reasonable assurance about whether the financial statements are free of material misstatement. An audit includes examining, on a test basis, evidence supporting the amounts and disclosures in the financial statements, assessing the accounting principles used and significant estimates made by management, and evaluating the overall financial statement presentation. We believe that our audit, which included confirmation of securities at April 30, 2017 by correspondence with the custodian and brokers, provide a reasonable basis for our opinion.
PricewaterhouseCoopers LLP
San Francisco, California
June 20, 2017
| 56 | Annual Report | franklintempleton.com | ||
FRANKLIN FEDERAL TAX-FREE INCOME FUND
Under Section 852(b)(5)(A) of the Internal Revenue Code, the Fund hereby reports 100% of the distributions paid from net investment income as exempt-interest dividends for the fiscal year ended April 30, 2017. A portion of the Fund’s exempt-interest dividends may be subject to the federal alternative minimum tax. By mid-February 2018, shareholders will be notified of amounts for use in preparing their 2017 income tax returns.
| franklintempleton.com | Annual Report | 57 | ||
FRANKLIN FEDERAL TAX-FREE INCOME FUND
The name, year of birth and address of the officers and board members, as well as their affiliations, positions held with the Fund, principal occupations during at least the past five years and number of U.S. registered portfolios overseen in the Franklin Templeton Investments fund complex, are shown below. Generally, each board member serves until that person’s successor is elected and qualified.
Independent Board Members
| Name, Year of Birth and Address | Position | Length of Time Served | Number of Portfolios in Fund Complex Overseen by Board Member* | Other Directorships Held During at Least the Past 5 Years | ||||
Harris J. Ashton (1932) One Franklin Parkway San Mateo, CA 94403-1906 | Trustee | Since 1982 | 142 | Bar-S Foods (meat packing company) (1981-2010). | ||||
| Principal Occupation During at Least the Past 5 Years: | ||||||||
Director of various companies; and formerly, Director, RBC Holdings, Inc. (bank holding company) (until 2002); and President, Chief Executive Officer and Chairman of the Board, General Host Corporation (nursery and craft centers) (until 1998).
| ||||||||
Mary C. Choksi (1950) One Franklin Parkway San Mateo, CA 94403-1906 | Trustee | Since 2014 | 136 | Avis Budget Group Inc. (car rental) (2007-present), Omnicom Group Inc. (advertising and marketing communications services) (2011-present) and H.J. Heinz Company (processed foods and allied products) (1998-2006). | ||||
| Principal Occupation During at Least the Past 5 Years: | ||||||||
Senior Advisor, Strategic Investment Group (investment management group) (2015–present); director of various companies; and formerly, Founding Partner and Senior Managing Director, Strategic Investment Group (1987-2015); Founding Partner and Managing Director, Emerging Markets Management LLC (investment management firm) (1987-2011); and Loan Officer/Senior Loan Officer/Senior Pension Investment Officer, World Bank Group (international financial institution) (1977-1987).
| ||||||||
Edith E. Holiday (1952) One Franklin Parkway San Mateo, CA 94403-1906 | Trustee | Since 2005 | 142 | Hess Corporation (exploration and refining of oil and gas) (1993-present), Canadian National Railway (railroad) (2001-present), White Mountains Insurance Group, Ltd. (holding company) (2004-present), Santander Consumer USA Holdings, Inc. (consumer finance) (2016-present), RTI International Metals, Inc. (manufacture and distribution of titanium) (1999-2015) and H.J. Heinz Company (processed foods and allied products) (1994-2013). | ||||
| Principal Occupation During at Least the Past 5 Years: | ||||||||
Director or Trustee of various companies and trusts; and formerly, Assistant to the President of the United States and Secretary of the Cabinet (1990-1993); General Counsel to the United States Treasury Department (1989-1990); and Counselor to the Secretary and Assistant Secretary for Public Affairs and Public Liaison – United States Treasury Department (1988-1989).
| ||||||||
J. Michael Luttig (1954) One Franklin Parkway San Mateo, CA 94403-1906 | Trustee | Since 2009 | 142 | Boeing Capital Corporation (aircraft financing) (2006-2013). | ||||
| Principal Occupation During at Least the Past 5 Years: | ||||||||
Executive Vice President, General Counsel and member of the Executive Council, The Boeing Company (aerospace company) (2006-present);and formerly, Federal Appeals Court Judge, U.S. Court of Appeals for the Fourth Circuit (1991-2006).
| ||||||||
| 58 | Annual Report | franklintempleton.com | ||
FRANKLIN FEDERAL TAX-FREE INCOME FUND
Independent Board Members (continued)
| Name, Year of Birth and Address | Position | Length of Time Served | Number of Portfolios in Fund Complex Overseen by Board Member* | Other Directorships Held During at Least the Past 5 Years | ||||
Larry D. Thompson (1945) One Franklin Parkway San Mateo, CA 94403-1906 | Trustee | Since 2007 | 142 | The Southern Company (energy company) (2014-present); previously 2010-2012), Graham Holdings Company (education and media organization) (2011-present) and Cbeyond, Inc. (business communications provider) (2010-2012). | ||||
| Principal Occupation During at Least the Past 5 Years: | ||||||||
| Director of various companies; John A. Sibley Professor of Corporate and Business Law, University of Georgia School of Law (2015-present; previously 2011-2012); and formerly, Executive Vice President — Government Affairs, General Counsel and Corporate Secretary, PepsiCo, Inc. (consumer products) (2012-2014); Senior Vice President Government Affairs, General Counsel and Corporate Secretary, PepsiCo, Inc. (consumer products) (2012-2014); Senior Vice President — Government Affairs, General Counsel and Secretary, PepsiCo, Inc. (2004-2011); Senior Fellow of The Brookings Institution (2003-2004); Visiting Professor, University of Georgia School of Law (2004); and Deputy Attorney General, U.S. Department of Justice (2001-2003). | ||||||||
John B. Wilson (1959) One Franklin Parkway San Mateo, CA 94403-1906 | Lead Independent Trustee | Trustee sice 2006 and lead Independent Trustee sice 2008 | 116 | None | ||||
| Principal Occupation During at Least the Past 5 Years: | ||||||||
| President, Staples Europe (office supplies) (2012-present); President and Founder, Hyannis Port Capital, Inc. (real estate and private equity investing); serves on private and non-profit boards; and formerly, Chief Operating Officer and Executive Vice President, Gap, Inc. (retail) (1996-2000); Chief Financial Officer and Executive Vice President – Finance and Strategy, Staples, Inc. (1992-1996); Senior Vice President – Corporate Planning, Northwest Airlines, Inc. (airlines) (1990-1992); and Vice President and Partner, Bain & Company (consulting firm) (1986-1990). | ||||||||
Interested Board Members and Officers
| Name, Year of Birth and Address | Position | Length of Time Served | Number of Portfolios in Fund Complex Overseen by Board Member* | Other Directorships Held During at Least the Past 5 Years | ||||
**Gregory E. Johnson (1961) One Franklin Parkway San Mateo, CA 94403-1906 | Trustee | Since 2007 | 158 | None | ||||
| Principal Occupation During at Least the Past 5 Years: | ||||||||
| Chairman of the Board, Member - Office of the Chairman, Director and Chief Executive Officer, Franklin Resources, Inc.; officer and/or director or trustee, as the case may be, of some of the other subsidiaries of Franklin Resources, Inc. and of 44 of the investment companies in Franklin Templeton Investments; Vice Chairman, Investment Company Institute; and formerly, President, Franklin Resources, Inc. (1994-2015). | ||||||||
**Rupert H. Johnson, Jr. (1940) One Franklin Parkway San Mateo, CA 94403-1906 | Chairman of the Board and Trustee | Chairman of the Board and Trustee since 2013 | 142 | None | ||||
| Principal Occupation During at Least the Past 5 Years: | ||||||||
| Vice Chairman, Member – Office of the Chairman and Director, Franklin Resources, Inc.; Director, Franklin Advisers, Inc.; Senior Vice President, Franklin Advisory Services, LLC; and officer and/or director or trustee, as the case may be, of some of the other subsidiaries of Franklin Resources, Inc. and of 42 of the investment companies in Franklin Templeton Investments. | ||||||||
Sheila Amoroso (1959) One Franklin Parkway San Mateo, CA 94403-1906 | Vice President | Since 1999 | Not Applicable | Not Applicable | ||||
| Principal Occupation During at Least the Past 5 Years: | ||||||||
| Senior Vice President, Franklin Advisers, Inc.; and officer of seven of the investment companies in Franklin Templeton Investments. | ||||||||
| franklintempleton.com | Annual Report | 59 | ||
FRANKLIN FEDERAL TAX-FREE INCOME FUND
Interested Board Members and Officers (continued)
Name, Year of Birth and Address | Position | Length of Time Served | Number of Portfolios in Fund Complex Overseen by Board Member* | Other Directorships Held During at Least the Past 5 Years | ||||
Alison E. Baur (1964) One Franklin Parkway San Mateo, CA 94403-1906 | Vice President | Since 2012 | Not Applicable | Not Applicable | ||||
| Principal Occupation During at Least the Past 5 Years: | ||||||||
Deputy General Counsel, Franklin Templeton Investments; and officer of some of the other subsidiaries of Franklin Resources, Inc. and of 45 of the investment companies in Franklin Templeton Investments.
| ||||||||
Rafael R. Costas, Jr. (1965) One Franklin Parkway San Mateo, CA 94403-1906 | Vice President | Since 1999 | Not Applicable | Not Applicable | ||||
| Principal Occupation During at Least the Past 5 Years: | ||||||||
Senior Vice President, Franklin Advisers, Inc.; and officer of seven of the investment companies in Franklin Templeton Investments.
| ||||||||
Laura F. Fergerson (1962) One Franklin Parkway San Mateo, CA 94403-1906 | Chief Executive Officer – Finance and Administration | Since 2009 | Not Applicable | Not Applicable | ||||
| Principal Occupation During at Least the Past 5 Years: | ||||||||
Senior Vice President, Franklin Templeton Services, LLC; Vice President, Franklin Advisers, Inc. and Franklin Templeton Institutional, LLC; and officer of 45 of the investment companies in Franklin Templeton Investments.
| ||||||||
Gaston Gardey (1967) One Franklin Parkway San Mateo, CA 94403-1906 | Treasurer, Chief Financial Officer and Chief Accounting Officer | Since 2009 | Not Applicable | Not Applicable | ||||
| Principal Occupation During at Least the Past 5 Years: | ||||||||
Treasurer, U.S. Fund Administration & Reporting, Franklin Templeton Investments; and officer of 27 of the investment companies in Franklin Templeton Investments.
| ||||||||
Aliya S. Gordon (1973) One Franklin Parkway San Mateo, CA 94403-1906 | Vice President | Since 2009 | Not Applicable | Not Applicable | ||||
| Principal Occupation During at Least the Past 5 Years: | ||||||||
Senior Associate General Counsel, Franklin Templeton Investments; and officer of 45 of the investment companies in Franklin Templeton Investments.
| ||||||||
Steven J. Gray (1955) One Franklin Parkway San Mateo, CA 94403-1906 | Vice President | Since 2009 | Not Applicable | Not Applicable | ||||
| Principal Occupation During at Least the Past 5 Years: | ||||||||
Senior Associate General Counsel, Franklin Templeton Investments; Vice President, Franklin Templeton Distributors, Inc.; and officer of 45 of the investment companies in Franklin Templeton Investments.
| ||||||||
Robert Lim (1948) One Franklin Parkway San Mateo, CA 94403-1906 | Vice President – AML Compliance | Since 2016 | Not Applicable | Not Applicable | ||||
| Principal Occupation During at Least the Past 5 Years: | ||||||||
| Vice President, Franklin Templeton Companies, LLC; Chief Compliance Officer, Franklin Templeton Distributors, Inc. and Franklin Templeton Investor Services, LLC; and officer of 45 of the investment companies in Franklin Templeton Investments. | ||||||||
| 60 | Annual Report | franklintempleton.com | ||
FRANKLIN FEDERAL TAX-FREE INCOME FUND
Interested Board Members and Officers (continued)
Name, Year of Birth and Address | Position | Length of Time Served | Number of Portfolios in Fund Complex Overseen by Board Member* | Other Directorships Held During at Least the Past 5 Years | ||||
Christopher J. Molumphy (1962) One Franklin Parkway San Mateo, CA 94403-1906 | President and Chief Executive Officer – Investment Management | Since 2010 | Not Applicable | Not Applicable | ||||
| Principal Occupation During at Least the Past 5 Years: | ||||||||
| Director and Executive Vice President, Franklin Advisers, Inc.; Executive Vice President, Franklin Templeton Institutional, LLC; and officer of some of the other subsidiaries of Franklin Resources, Inc. and of 22 of the investment companies in Franklin Templeton Investments. | ||||||||
Kimberly H. Novotny (1972) 300 S.E. 2nd Street Fort Lauderdale, FL 33301-1923 | Vice President | Since 2013 | Not Applicable | Not Applicable | ||||
| Principal Occupation During at Least the Past 5 Years: | ||||||||
Associate General Counsel, Franklin Templeton Investments; Vice President and Corporate Secretary, Fiduciary Trust International of the South; Vice President, Templeton Investment Counsel, LLC; Assistant Secretary, Franklin Resources, Inc.; and officer of 45 of the investment companies in Franklin Templeton Investments.
| ||||||||
Robert C. Rosselot (1960) 300 S.E. 2nd Street Fort Lauderdale, FL 33301-1923 | Chief Compliance Officer | Since 2013 | Not Applicable | Not Applicable | ||||
| Principal Occupation During at Least the Past 5 Years: | ||||||||
Director, Global Compliance, Franklin Templeton Investments; Vice President, Franklin Templeton Companies, LLC; officer of 45 of the investment companies in Franklin Templeton Investments; and formerly, Senior Associate General Counsel, Franklin Templeton Investments (2007-2013); and Secretary and Vice President, Templeton Group of Funds (2004-2013).
| ||||||||
Karen L. Skidmore (1952) One Franklin Parkway San Mateo, CA 94403-1906 | Vice President and Secretary | Since 2006 | Not Applicable | Not Applicable | ||||
| Principal Occupation During at Least the Past 5 Years: | ||||||||
Senior Associate General Counsel, Franklin Templeton Investments; and officer of 45 of the investment companies in Franklin Templeton Investments.
| ||||||||
Navid J. Tofigh (1972) One Franklin Parkway San Mateo, CA 94403-1906 | Vice President | Since 2015 | Not Applicable | Not Applicable | ||||
| Principal Occupation During at Least the Past 5 Years: | ||||||||
Associate General Counsel, Franklin Templeton Investments; and officer of 45 of the investment companies in Franklin Templeton Investments.
| ||||||||
Craig S. Tyle (1960) One Franklin Parkway San Mateo, CA 94403-1906 | Vice President | Since 2005 | Not Applicable | Not Applicable | ||||
| Principal Occupation During at Least the Past 5 Years: | ||||||||
General Counsel and Executive Vice President, Franklin Resources, Inc.; and officer of some of the other subsidiaries of Franklin Resources, Inc. and of 45 of the investment companies in Franklin Templeton Investments.
| ||||||||
Thomas Walsh (1961) One Franklin Parkway San Mateo, CA 94403-1906 | Vice President | Since 1999 | Not Applicable | Not Applicable | ||||
| Principal Occupation During at Least the Past 5 Years: | ||||||||
Senior Vice President, Franklin Advisers, Inc.; and officer of seven of the investment companies in Franklin Templeton Investments.
| ||||||||
| franklintempleton.com | Annual Report | 61 | ||
FRANKLIN FEDERAL TAX-FREE INCOME FUND
Interested Board Members and Officers (continued)
Name, Year of Birth and Address | Position | Length of Time Served | Number of Portfolios in Fund Complex Overseen by Board Member* | Other Directorships Held During at Least the Past 5 Years | ||||
Lori A. Weber (1964) 300 S.E. 2nd Street Fort Lauderdale, FL 33301-1923 | Vice President | Since 2011 | Not Applicable | Not Applicable | ||||
| Principal Occupation During at Least the Past 5 Years: | ||||||||
| Senior Associate General Counsel, Franklin Templeton Investments; Assistant Secretary, Franklin Resources, Inc.; Vice President and Secretary, Templeton Investment Counsel, LLC; and officer of 45 of the investment companies in Franklin Templeton Investments. | ||||||||
*We base the number of portfolios on each separate series of the U.S. registered investment companies within the Franklin Templeton Investments fund complex. These portfolios have a common investment manager or affiliated investment managers.
**Gregory E. Johnson is considered to be an interested person of the Fund under the federal securities laws due to his position as an officer and director of Franklin Resources, Inc. (Resources), which is the parent company of the Fund’s investment manager and distributor. Rupert H. Johnson, Jr. is considered to be an interested person of the Fund under the federal securities laws due to his position as officer and director and major shareholder of Resources.
Note 1: Rupert H. Johnson, Jr. is the uncle of Gregory E. Johnson.
Note 2: Officer information is current as of the date of this report. It is possible that after this date, information about officers may change.
Note 3: Effective November 1, 2016, Frank Olson ceased to be a trustee of the trust.
The Sarbanes-Oxley Act of 2002 and Rules adopted by the Securities and Exchange Commission require the Fund to disclose whether the Fund’s Audit Committee includes at least one member who is an audit committee financial expert within the meaning of such Act and Rules. The Fund’s Board has determined that there is at least one such financial expert on the Audit Committee and has designated John B. Wilson as its audit committee financial expert. The Board believes that Mr. Wilson qualifies as such an expert in view of his extensive business background and experience, including service as chief financial officer of Staples, Inc. from 1992 to 1996. Mr. Wilson has been a Member and Chairman of the Fund’s Audit Committee since 2006. As a result of such background and experience, the Board believes that Mr. Wilson has acquired an understanding of generally accepted accounting principles and financial statements, the general application of such principles in connection with the accounting estimates, accruals and reserves, and analyzing and evaluating financial statements that present a breadth and level of complexity of accounting issues generally comparable to those of the Fund, as well as an understanding of internal controls and procedures for financial reporting and an understanding of audit committee functions. Mr. Wilson is an independent Board member as that term is defined under the relevant Securities and Exchange Commission Rules and Releases.
The Statement of Additional Information (SAI) includes additional information about the board members and is available, without charge, upon request. Shareholders may call (800) DIAL BEN/342-5236 to request the SAI.
| 62 | Annual Report | franklintempleton.com | ||
FRANKLIN FEDERAL TAX-FREE INCOME FUND
Board Approval of Investment Management Agreements
FRANKLIN FEDERAL TAX-FREE INCOME FUND
(Fund)
At an in-person meeting held on February 28, 2017 (Meeting), the Board of Trustees (Board) of the Fund, including a majority of the trustees who are not “interested persons” as defined in the Investment Company Act of 1940 (Independent Trustees), reviewed and approved the continuance of the investment management agreement between Franklin Advisers, Inc. (Manager) and the Fund (Management Agreement) for an additional one-year period. The Independent Trustees received advice from and met separately with Independent Trustee counsel in considering whether to approve the continuation of the Management Agreement.
In considering the continuation of the Management Agreement, the Board reviewed and considered information provided by the Manager at the Meeting and throughout the year at meetings of the Board and its committees. The Board also reviewed and considered information provided in response to a detailed set of requests for information submitted to the Manager by Independent Trustee counsel on behalf of the Independent Trustees in connection with the annual contract renewal process. In addition, prior to the Meeting, the Independent Trustees held a telephonic contract renewal meeting at which the Independent Trustees conferred amongst themselves and Independent Trustee counsel about contract renewal matters. The Board reviewed and considered all of the factors it deemed relevant in approving the continuance of the Management Agreement, including, but not limited to: (i) the nature, extent, and quality of the services provided by the Manager; (ii) the investment performance of the Fund; (iii) the costs of the services provided and profits realized by the Manager and its affiliates from the relationship with the Fund; (iv) the extent to which economies of scale are realized as the Fund grows; and (v) whether fee levels reflect these economies of scale for the benefit of Fund investors.
In approving the continuance of the Management Agreement, the Board, including a majority of the Independent Trustees, determined that the existing management fees are fair and reasonable and that the continuance of such Management Agreement is in the interests of the Fund and its shareholders. While attention was given to all information furnished, the following discusses some primary factors relevant to the Board’s determination.
Nature, Extent and Quality of Services
The Board reviewed and considered information regarding the nature, extent and quality of investment management services provided by the Manager and its affiliates to the Fund and its shareholders. This information included, among other things, the qualifications, background and experience of the senior management and investment personnel of the Manager; the structure of investment personnel compensation; oversight of third-party service providers; investment performance reports and related financial information for the Fund; reports on expenses, shareholder services, marketing support payments made to financial intermediaries and third party servicing arrangements; legal and compliance matters; risk controls; pricing and other services provided by the Manager and its affiliates; and management fees charged by the Manager and its affiliates to U.S. funds and other accounts, including management’s explanation of differences among accounts where relevant. The Board noted management’s continual efforts and expenditures in establishing effective business continuity plans and developing strategies to address areas of heightened concern in the mutual fund industry, such as cybersecurity, derivatives and liquidity risk management.
The Board also reviewed and considered the benefits provided to Fund shareholders of investing in a fund that is part of the Franklin Templeton family of funds. The Board noted the financial position of Franklin Resources, Inc. (FRI), the Manager’s parent, and its commitment to the mutual fund business as evidenced by its continued introduction of new funds, reassessment of the fund offerings in response to the market environment and project initiatives and capital investments relating to the services provided to the Fund by the Franklin Templeton Investments (FTI) organization.
Following consideration of such information, the Board was satisfied with the nature, extent and quality of services provided by the Manager and its affiliates to the Fund and its shareholders.
Fund Performance
The Board reviewed and considered the performance results of the Fund over various time periods ended December 31, 2016. The Board considered the performance returns for the Fund in comparison to the performance returns of mutual funds deemed comparable to the Fund included in a universe (Performance Universe) selected by Broadridge Financial Solutions, Inc. (Broadridge), an independent provider of investment company data. The Board received a description of the methodology used by Broadridge to select the mutual funds included in a
| franklintempleton.com | Annual Report | 63 | ||
FRANKLIN FEDERAL TAX-FREE INCOME FUND
SHAREHOLDER INFORMATION
Performance Universe. The Board also reviewed and considered Fund performance reports provided and discussions that occurred with portfolio managers at Board meetings throughout the year. A summary of the Fund’s performance results is below.
The Performance Universe for the Fund included the Fund and all retail and institutional general & insured municipal debt funds. The Board noted that the Fund’s annualized income return and annualized total return for the one-, three-, five- and 10-year periods were above the medians of its Performance Universe. The Board concluded that the Fund’s performance was satisfactory.
Comparative Fees and Expenses
The Board reviewed and considered information regarding the Fund’s actual total expense ratio and its various components, including, as applicable, management fees; transfer agent expenses; underlying fund expenses; Rule 12b-1 and non-Rule 12b-1 service fees; and other non-management fees. The Board also noted that at its February meeting each year, it receives an annual report on all marketing support payments made by FTI to financial intermediaries. The Board considered the actual total expense ratio and, separately, the contractual management fee rate, without the effect of fee waivers, if any (Management Rate) of the Fund in comparison to the median ratio and median Management Rate, respectively, of other mutual funds deemed comparable to and with a similar expense structure as the Fund selected by Broadridge (Expense Group). Broadridge fee and expense data is based upon information taken from the fund’s most recent annual report, which reflects historical asset levels that may be quite different from those currently existing, particularly in a period of market volatility. While recognizing such inherent limitation and the fact that expense ratios and Management Rates generally increase as assets decline and decrease as assets grow, the Board believed the independent analysis conducted by Broadridge to be an appropriate measure of comparative fees and expenses. The Broadridge Management Rate includes administrative charges, and the actual total expense ratio, for comparative consistency, was shown for Class A shares for funds with multiple classes of shares. The Board received a description of the methodology used by Broadridge to select the mutual funds included in an Expense Group.
The Expense Group for the Fund included the Fund and ten other general & insured municipal debt funds. The Board noted that the Management Rate for the Fund was above the median of its Expense Group, but its actual total expense ratio was
below the median of its Expense Group. The Board concluded that the Management Rate charged to the Fund is fair and reasonable.
Profitability
The Board reviewed and considered information regarding the profits realized by the Manager and its affiliates in connection with the operation of the Fund. In this respect, the Board considered the Fund profitability analysis provided by the Manager that addresses the overall profitability of FTI’s U.S. fund business, as well as its profits in providing investment management and other services to each of the individual funds during the 12-month period ended September 30, 2016, being the most recent fiscal year-end for FRI. The Board noted that although management continually makes refinements to its methodologies used in calculating profitability in response to organizational and product related changes, the overall methodology has remained consistent with that used in the Fund’s profitability report presentations from prior years. Additionally, the Fund’s independent registered public accounting firm has been engaged by the Manager to periodically review the reasonableness of the allocation methodologies to be used solely by the Fund’s Board with respect to the profitability analysis.
The Board noted management’s belief that costs incurred in establishing the infrastructure necessary for the type of mutual fund operations conducted by the Manager and its affiliates may not be fully reflected in the expenses allocated to the Fund in determining its profitability, as well as the fact that the level of profits, to a certain extent, reflected operational cost savings and efficiencies initiated by management. The Board also noted management’s expenditures in improving shareholder services provided to the Fund, as well as the need to implement systems and meet additional regulatory and compliance requirements resulting from recent SEC and other regulatory requirements.
The Board also considered the extent to which the Manager and its affiliates might derive ancillary benefits from fund operations, including revenues generated from transfer agent services, potential benefits resulting from personnel and systems enhancements necessitated by fund growth, as well as increased leverage with service providers and counterparties. Based upon its consideration of all these factors, the Board concluded that the level of profits realized by the Manager and its affiliates from providing services to the Fund was not excessive in view of the nature, quality and extent of services provided to the Fund.
| 64 | Annual Report | franklintempleton.com | ||
FRANKLIN FEDERAL TAX-FREE INCOME FUND
SHAREHOLDER INFORMATION
Economies of Scale
The Board reviewed and considered the extent to which the Manager may realize economies of scale, if any, as the Fund grows larger and whether the Fund’s management fee structure reflects any economies of scale for the benefit of shareholders. With respect to possible economies of scale, the Board noted the existence of management fee breakpoints, which operate generally to share any economies of scale with a Fund’s shareholders by reducing the Fund’s effective management fees as the Fund grows in size. The Board considered the Manager’s view that any analyses of potential economies of scale in managing a particular fund are inherently limited in light of the joint and common costs and investments the Manager incurs across the Franklin Templeton family of funds as a whole. The Board concluded that to the extent economies of scale may be realized by the Manager and its affiliates, the Fund’s management fee structure provided a sharing of benefits with the Fund and its shareholders as the Fund grows.
Conclusion
Based on its review, consideration and evaluation of all factors it believed relevant, including the above-described factors and conclusions, the Board unanimously approved the continuation of the Management Agreement for an additional one-year period.
Proxy Voting Policies and Procedures
The Fund’s investment manager has established Proxy Voting Policies and Procedures (Policies) that the Fund uses to determine how to vote proxies relating to portfolio securities. Shareholders may view the Fund’s complete Policies online at franklintempleton.com. Alternatively, shareholders may request copies of the Policies free of charge by calling the Proxy Group collect at (954) 527-7678 or by sending a written request to: Franklin Templeton Companies, LLC, 300 S.E. 2nd Street, Fort Lauderdale, FL 33301, Attention: Proxy Group. Copies of the Fund’s proxy voting records are also made available online at franklintempleton.com and posted on the U.S. Securities and Exchange Commission’s website at sec.gov and reflect the most recent 12-month period ended June 30.
Quarterly Statement of Investments
The Fund files a complete statement of investments with the U.S. Securities and Exchange Commission for the first and third quarters for each fiscal year on Form N-Q. Shareholders may view the filed Form N-Q by visiting the Commission’s website at sec.gov. The filed form may also be viewed and copied at the Commission’s Public Reference Room in
Washington, DC. Information regarding the operations of the Public Reference Room may be obtained by calling (800) SEC-0330.
Householding of Reports and Prospectuses
You will receive the Fund’s financial reports every six months as well as an annual updated summary prospectus (prospectus available upon request). To reduce Fund expenses, we try to identify related shareholders in a household and send only one copy of the financial reports and summary prospectus. This process, called “householding,” will continue indefinitely unless you instruct us otherwise. If you prefer not to have these documents householded, please call us at (800) 632-2301. At any time you may view current prospectuses/summary prospectuses and financial reports on our website. If you choose, you may receive these documents through electronic delivery.
| franklintempleton.com | Annual Report | 65 | ||
This page intentionally left blank.
This page intentionally left blank.
This page intentionally left blank.
 | Annual Report and Shareholder Letter Franklin Federal Tax-Free Income Fund
| |||
Investment Manager Franklin Advisers, Inc.
| ||||
| Distributor | ||||
Franklin Templeton Distributors, Inc. (800) DIAL BEN® / 342-5236 franklintempleton.com
| ||||
Shareholder Services (800) 632-2301 |
Authorized for distribution only when accompanied or preceded by a summary prospectus and/or prospectus. Investors should carefully consider a fund’s investment goals, risks, charges and expenses before investing. A prospectus contains this and other information; please read it carefully before investing.
To help ensure we provide you with quality service, all calls to and from our service areas are monitored and/or recorded.
| © 2017 Franklin Templeton Investments. All rights reserved. | 116 A 06/17 |
Item 2. Code of Ethics.
(a) The Registrant has adopted a code of ethics that applies to its principal executive officers and principal financial and accounting officer.
(c) N/A
(d) N/A
(f) Pursuant to Item 12(a)(1), the Registrant is attaching as an exhibit a copy of its code of ethics that applies to its principal executive officers and principal financial and accounting officer.
Item 3. Audit Committee Financial Expert.
(a)(1) The Registrant has an audit committee financial expert serving on its audit committee.
(2) The audit committee financial expert is John B. Wilson and he is “independent” as defined under the relevant Securities and Exchange Commission Rules and Releases.
Item 4. Principal Accountant Fees and Services.
(a) Audit Fees
The aggregate fees paid to the principal accountant for professional services rendered by the principal accountant for the audit of the registrant’s annual financial statements or for services that are normally provided by the principal accountant in connection with statutory and regulatory filings or engagements were $73,931 for the fiscal year ended April 30, 2017 and $65,859 for the fiscal year ended April 30, 2016.
(b) Audit-Related Fees
There were no fees paid to the principal accountant for assurance and related services rendered by the principal accountant to the registrant that are reasonably related to the performance of the audit of the registrant’s financial statements and are not reported under paragraph (a) of Item 4.
There were no fees paid to the principal accountant for assurance and related services rendered by the principal accountant to the registrant’s investment adviser and any entity controlling, controlled by or under common control with the investment adviser that provides ongoing services to the registrant that are reasonably related to the performance of the audit of their financial statements.
(c) Tax Fees
There were no fees paid to the principal accountant for professional services rendered by the principal accountant to the registrant for tax compliance, tax advice and tax planning.
There were no fees paid to the principal accountant for professional services rendered by the principal accountant to the registrant’s investment adviser and any entity controlling, controlled by or under common control with the investment adviser that provides ongoing services to the registrant for tax compliance, tax advice and tax planning.
(d) All Other Fees
The aggregate fees paid to the principal accountant for products and services rendered by the principal accountant to the registrant not reported in paragraphs (a)-(c) of Item 4 were $0 for the fiscal year ended April 30, 2017 and $4,008 for the fiscal year ended April 30, 2016. The services for which these fees were paid include review of materials provided to the fund Board in connection with the investment management contract renewal process.
The aggregate fees paid to the principal accountant for products and services rendered by the principal accountant to the registrant’s investment adviser and any entity controlling, controlled by or under common control with the investment adviser that provides ongoing services to the registrant other than services reported in paragraphs (a)-(c) of Item 4 were $255,000 for the fiscal year ended April 30, 2017 and $672,151 for the fiscal year ended April 30, 2016. The services for which these fees were paid included preparation and review of materials provided to the fund Board in connection with the investment management contract renewal process and derivatives assessments, and review of system processes related to fixed income securities.
(e) (1) The registrant’s audit committee is directly responsible for approving the services to be provided by the auditors, including:
(i) pre-approval of all audit and audit related services;
(ii) pre-approval of all non-audit related services to be provided to the Fund by the auditors;
(iii) pre-approval of all non-audit related services to be provided to the registrant by the auditors to the registrant’s investment adviser or to any entity that controls, is controlled by or is under common control with the registrant’s investment adviser and that provides ongoing services to the registrant where the non-audit services relate directly to the operations or financial reporting of the registrant; and
(iv) establishment by the audit committee, if deemed necessary or appropriate, as an alternative to committee pre-approval of services to be provided by the auditors, as required by paragraphs (ii) and (iii) above, of policies and procedures to permit such services to be pre-approved by other means, such as through establishment of guidelines or by action of a designated member or members of the committee; provided the policies and procedures are detailed as to the particular service and the committee is informed of each service and such policies and procedures do not include delegation of audit committee responsibilities, as contemplated under the Securities Exchange Act of 1934, to management; subject, in the case of (ii) through (iv), to any waivers, exceptions or exemptions that may be available under applicable law or rules.
(e) (2) None of the services provided to the registrant described in paragraphs (b)-(d) of Item 4 were approved by the audit committee pursuant to paragraph (c)(7)(i)(C) of Rule 2-01 of regulation S-X.
(f) No disclosures are required by this Item 4(f).
(g) The aggregate non-audit fees paid to the principal accountant for services rendered by the principal accountant to the registrant and the registrant’s investment adviser and any entity controlling, controlled by or under common control with the investment adviser that provides ongoing services to the registrant were $255,000 for the fiscal year ended April 30, 2017 and $676,159 for the fiscal year ended April 30, 2016.
(h) The registrant’s audit committee of the board has considered whether the provision of non-audit services that were rendered to the registrant’s investment adviser (not including any sub-adviser whose role is primarily portfolio management and is subcontracted with or overseen by another investment adviser), and any entity controlling, controlled by, or under common control with the investment adviser that provides ongoing services to the registrant that were not pre-approved pursuant to paragraph (c)(7)(ii) of Rule 2-01 of Regulation S-X is compatible with maintaining the principal accountant’s independence.
Item 5. Audit Committee of Listed Registrants. N/A
Item 6. Schedule of Investments. N/A
Item 7. Disclosure of Proxy Voting Policies and Procedures for Closed-End Management Investment Companies. N/A
Item 8. Portfolio Managers of Closed-End Management Investment Companies. N/A
Item 9. Purchases of Equity Securities by Closed-End Management Investment Company and Affiliated Purchasers. N/A
Item 10. Submission of Matters to a Vote of Security Holders.
There have been no changes to the procedures by which shareholders may recommend nominees to the Registrant’s Board of Trustees that would require disclosure herein.
Item 11. Controls and Procedures.
(a) Evaluation of Disclosure Controls and Procedures. The Registrant maintains disclosure controls and procedures that are designed to ensure that information required to be disclosed in the Registrant’s filings under the Securities Exchange Act of 1934 and the Investment Company Act of 1940 is recorded, processed, summarized and reported within the periods specified in the rules and forms of the Securities and Exchange Commission. Such information is accumulated and communicated to the Registrant’s management, including its principal executive officer and principal financial officer, as appropriate, to allow timely decisions regarding required disclosure. The Registrant’s management, including the principal executive officer and the principal financial officer, recognizes that any set of controls and procedures, no matter how well designed and operated, can provide only reasonable assurance of achieving the desired control objectives.
Within 90 days prior to the filing date of this Shareholder Report on Form N-CSR, the Registrant had carried out an evaluation, under the supervision and with the participation of the Registrant’s management, including the Registrant’s principal executive officer and the Registrant’s principal financial officer, of the effectiveness of the design and operation of the Registrant’s disclosure controls and procedures. Based on such evaluation, the Registrant’s principal executive officer and principal financial officer concluded that the Registrant’s disclosure controls and procedures are effective.
(b) Changes in Internal Controls. There have been no changes in the Registrant’s internal controls or in other factors that could materially affect the internal controls over financial reporting subsequent to the date of their evaluation in connection with the preparation of this Shareholder Report on Form N-CSR.
Item 12. Exhibits.
(a) (1) Code of Ethics
(a) (2) Certifications pursuant to Section 302 of the Sarbanes-Oxley Act of 2002 of Matthew T. Hinkle, Chief Executive Officer—Finance and Administration, and Gaston Gardey, Chief Financial Officer and Chief Accounting Officer
(b) Certifications pursuant to Section 906 of the Sarbanes-Oxley Act of 2002 of Matthew T. Hinkle, Chief Executive Officer—Finance and Administration, and Gaston Gardey, Chief Financial Officer and Chief Accounting Officer
SIGNATURES
Pursuant to the requirements of the Securities Exchange Act of 1934 and the Investment Company Act of 1940, the registrant has duly caused this report to be signed on its behalf by the undersigned, thereunto duly authorized.
FRANKLIN FEDERAL TAX-FREE INCOME FUND
| By | /S/ MATTHEW T. HINKLE | |
| Matthew T. Hinkle | ||
| Chief Executive Officer – | ||
| Finance and Administration |
Date June 26, 2017
Pursuant to the requirements of the Securities Exchange Act of 1934 and the Investment Company Act of 1940, this report has been signed below by the following persons on behalf of the registrant and in the capacities and on the dates indicated.
| By | /S/ MATTHEW T. HINKLE | |
| Matthew T. Hinkle | ||
| Chief Executive Officer – | ||
| Finance and Administration |
Date June 26, 2017
| By | /S/ GASTON GARDEY | |
| Gaston Gardey | ||
| Chief Financial Officer and | ||
| Chief Accounting Officer |
Date June 26, 2017