UNITED STATES
SECURITIES AND EXCHANGE COMMISSION
Washington, D.C. 20549
FORM N-CSR
CERTIFIED SHAREHOLDER REPORT
OF
REGISTERED MANAGEMENT INVESTMENT COMPANIES
| Investment Company Act file number: | 811-2652 |
| Name of Registrant: | Vanguard Index Funds |
| Address of Registrant: | P.O. Box 2600
Valley Forge, PA 19482 |
| Name and address of agent for service: | Heidi Stam, Esquire
P.O. Box 876
Valley Forge, PA 19482 |
Registrant’s telephone number, including area code: (610) 669-1000
| Date of fiscal year end: | December 31 |
| Date of reporting period: | January 1, 2007 - June 30, 2007 |
| Item 1: | Reports to Shareholders |
|
|
Vanguard® 500 Index Fund |
|
|
> Semiannual Report |
|
|
|
|
|
June 30, 2007 |
|
|
> | During the fiscal half-year ended June 30, 2007, Vanguard 500 Index Fund |
| returned 6.9%, closely tracking the performance of its benchmark. |
> | Every sector contributed to the fund’s overall returns except for financials, which |
| produced a slight loss. |
> | The benchmark S&P 500 Index climbed to its first new highs since 2000, although |
| it pulled back somewhat by the end of the period. |
Contents | |
| |
Your Fund’s Total Returns | 1 |
Chairman’s Letter | 2 |
Fund Profile | 6 |
Performance Summary | 7 |
Financial Statements | 8 |
About Your Fund’s Expenses | 23 |
Trustees Approve Advisory Arrangement | 25 |
Glossary | 26 |
Please note: The opinions expressed in this report are just that—informed opinions. They should not be considered promises or advice. Also, please keep in mind that the information and opinions cover the period through the date on the cover of this report. Of course, the risks of investing in your fund are spelled out in the prospectus.
Your Fund’s Total Returns
Six Months Ended June 30, 2007 | | |
| Ticker | Total |
| Symbol | Returns |
Vanguard 500 Index Fund | | |
Investor Shares | VFINX | 6.9% |
Admiral™ Shares1 | VFIAX | 6.9 |
Signal™ Shares2 | VIFSX | 6.9 |
S&P 500 Index | | 7.0 |
Average Large-Cap Core Fund3 | | 6.9 |
Your Fund’s Performance at a Glance | | | |
December 31, 2006–June 30, 2007 | | | | |
| | | Distributions Per Share |
| Starting | Ending | Income | Capital |
| Share Price | Share Price | Dividends | Gains |
Vanguard 500 Index Fund | | | | |
Investor Shares | $130.59 | $138.42 | $1.120 | $0.000 |
Admiral Shares | 130.59 | 138.43 | 1.174 | 0.000 |
Signal Shares | 107.86 | 114.34 | 0.966 | 0.000 |
1 A lower-cost class of shares available to many longtime shareholders and to those with significant investments in the fund.
2 Signal Shares also carry lower costs and are available to certain institutional shareholders who meet specific administrative, service, and account-size criteria.
3 Derived from data provided by Lipper Inc.
1

Chairman’s Letter
Dear Shareholder,
For the six months ended June 30, 2007, Vanguard 500 Index Fund delivered a return of 6.9%. The fund met its goal of tracking the return of its benchmark during a period of generally steady stock-market growth. Your fund’s result also matched the average return of large-cap core funds.
The stock market’s ascent was driven by global liquidity
The broad U.S. stock market notched impressive gains in the year’s first half, when an abundance of cash drove record numbers of mergers and acquisitions around the globe. The gains came amid increased volatility. In February, markets worldwide fell sharply following a sell-off in China, only to recover quickly and continue upward. The six-month period closed with two dips in June, owing to fears of accelerating inflation and slowing economic growth.
The best performers in the U.S. market were the so-called mega-caps—broadly diversified companies that are well-positioned to thrive during periods of economic transition. International stocks, particularly those in emerging markets, outperformed U.S. equities. The dollar slid against the euro and the British pound, further enhancing gains for Americans investing abroad.
2
Bond investors were hobbled by a shift in sentiment
The relationship between yield and maturity returned to normal during the half-year, as yields of intermediate- and longer-term bonds moved higher than short-term yields. The accompanying drop in prices was steepest for long-term and intermediate-term bonds.
Earlier in the year, bond yields seemed to reflect an assumption that the Federal Reserve Board might cut interest rates in response to weaker economic growth. As the year progressed, inflationary pressures and economic growth looked more substantial, producing a change in market sentiment, which resulted in higher yields and lower prices.
The broad taxable bond market returned 1.0% for the period, while municipal bonds posted a return of 0.1%. The Citigroup 3-Month Treasury Bill Index—a proxy for money market yields—returned 2.5% for the half-year.
Most of the fund’s gain came during the second quarter
The 500 Index Fund closely tracked the performance of its benchmark throughout the half-year, increasing modestly in the first quarter (by less than 1%) and robustly in the second quarter. The period included new highs for the S&P 500 Index, as it edged past its March 2000 peak.
The half-year ended, however, on a down note. The index and the fund declined in June as investors grew concerned about
Market Barometer | | | |
| | | Total Returns |
| | Periods Ended June 30, 2007 |
| Six Months | One Year | Five Years1 |
Stocks | | | |
Russell 1000 Index (Large-caps) | 7.2% | 20.4% | 11.3% |
Russell 2000 Index (Small-caps) | 6.4 | 16.4 | 13.9 |
Dow Jones Wilshire 5000 Index (Entire market) | 7.6 | 20.4 | 12.0 |
MSCI All Country World Index ex USA (International) | 12.6 | 30.1 | 19.9 |
| | | |
| | | |
Bonds | | | |
Lehman U.S. Aggregate Bond Index (Broad taxable market) | 1.0% | 6.1% | 4.5% |
Lehman Municipal Bond Index | 0.1 | 4.7 | 4.6 |
Citigroup 3-Month Treasury Bill Index | 2.5 | 5.1 | 2.7 |
| | | |
| | | |
CPI | | | |
Consumer Price Index | 3.2% | 2.7% | 3.0% |
1. Annualized.
3
signs of global inflationary pressures and the broader impact of the U.S. housing industry’s downturn. Almost all of the economic sectors represented in the fund—with the exception being financials—contributed to the 6.9% return for the period. The biggest boosts came from the energy, information technology, and industrials sectors, which together represent more than one-third of the index capitalization.
Reflecting growing demand and higher prices for oil, the energy sector returned 17%. Big oil firms, such as ExxonMobil and Chevron, and oil-field service company Schlumberger were standout performers. The IT sector outpaced the broad market with a 9% return, which, combined with its large weighting (15% of assets on average), made it the second-largest contributor to the fund’s performance. Computer maker Apple and semiconductor manufacturer Intel were bright spots among the sector’s stocks.
Financials, the index’s largest sector, fell –1%, holding back returns for the period. The largest declines were posted by diversified commercial banks, such as Citigroup and Bank of America. Rising interest rates created a headwind for companies in this industry as the yield on the benchmark 10-year U.S. Treasury bond increased from 4.7% to slightly over 5% over the six months. Investors continued to be concerned about how the troubles in the subprime mortgage market and among
Annualized Expense Ratios1 | | | | |
Your fund compared with its peer group | | | | |
| | | | Average |
| Investor | Admiral | Signal | Large-Cap |
| Shares | Shares | Shares | Core Fund |
500 Index Fund | 0.16% | 0.08% | 0.08% | 1.35% |
1.Fund expense ratios reflect the six months ended June 30, 2007. Peer-group expense ratio is derived from data provided by Lipper Inc. and captures information through year-end 2006.
4
some hedge funds might affect the market in general and the financial sector in particular.
For effective investing, stick to basic principles
During the half-year ended June 30, your fund did its job: Its performance nearly matched that of its index. The difference reflected expenses, which of course a benchmark doesn‘t have. For the 12 months ended June 30, the fund returned a bit more than 20%.
Whether these handsome recent returns will persist in the near term is anyone’s guess, but you can be sure that they will not last indefinitely. As we continually remind shareholders, however, overfocusing on short-term returns actually takes your eye off the ball. When you adopt a long-term perspective, the market’s month-to-month ups and downs loom less large, and you can assess your investments more effectively.
We believe that the 500 Index Fund offers a combination of investment characteristics that can make it a wise investment for the long term. The fund provides comprehensive exposure to of the broad U.S. stock market through diverse group of stocks—offering a chance to participate in the long-term growth of the economy. Further, the has provided an especially efficient of gaining this exposure because of its historically low expenses and its low turnover, which can mitigate tax impact in nonretirement accounts.
Thank you, as always, for investing with Vanguard.
Sincerely,

John J. Brennan
Chairman and Chief Executive Officer
July 12, 2007
5
Fund Profile
As of June 30, 2007
Portfolio Characteristics | | |
| | Target |
| Fund | Index1 |
Number of Stocks | 507 | 500 |
Median Market Cap | $59.9B | $59.9B |
Price/Earnings Ratio | 17.1x | 17.1x |
Price/Book Ratio | 2.9x | 2.9x |
Yield | | 1.8% |
Investor Shares | 1.7% | |
Admiral Shares | 1.8% | |
Signal Shares | 1.8% | |
Return on Equity | 19.4% | 19.4% |
Earnings Growth Rate | 20.9% | 20.9% |
Foreign Holdings | 0.0% | 0.0% |
Turnover Rate | 4%2 | — |
Expense Ratio | | — |
Investor Shares | 0.16%2 | |
Admiral Shares | 0.08%2 | |
Signal Shares | 0.08%2 | |
Short-Term Reserves | 0% | — |
Sector Diversification (% of portfolio) | |
| | Target |
| Fund | Index1 |
Consumer Discretionary | 10% | 10% |
Consumer Staples | 9 | 9 |
Energy | 11 | 11 |
Financials | 21 | 21 |
Health Care | 12 | 12 |
Industrials | 11 | 11 |
Information Technology | 15 | 15 |
Materials | 3 | 3 |
Telecommunication Services | 4 | 4 |
Utilities | 4 | 4 |
Volatility Measures3 | |
| Fund Versus |
| Target Index1 |
R-Squared | 1.00 |
Beta | 1.00 |
Ten Largest Holdings4 (% of total net assets) |
| | |
ExxonMobil Corp. | integrated oil | |
| and gas | 3.5% |
General Electric Co. | industrial | |
| conglomerates | 2.9 |
AT&T Inc. | integrated | |
| telecommunication | |
| services | 1.9 |
Citigroup, Inc. | diversified | |
| financial services | 1.9 |
Microsoft Corp. | systems software | 1.9 |
Bank of America Corp. | diversified | |
| financial services | 1.6 |
The Procter & Gamble Co. | household products | 1.4 |
American International | | |
Group, Inc. | multi-line insurance | 1.4 |
Chevron Corp. | integrated oil | |
| and gas | 1.4 |
Pfizer Inc. | pharmaceuticals | 1.3 |
Top Ten | | 19.2% |
Investment Focus
1 S&P 500 Index.
2 Annualized.
3 For an explanation of R-squared, beta, and other terms used here, see the Glossary on page 26.
4 Ten Largest Holdings” excludes any temporary cash investments and equity index products.
6
Performance Summary
All of the returns in this report represent past performance, which is not a guarantee of future results that may be achieved by the fund. (Current performance may be lower or higher than the performance data cited. For performance data current to the most recent month-end, visit our website at www.vanguard.com/performance.) Note, too, that both investment returns and principal value can fluctuate widely, so an investor’s shares, when sold, could be worth more or less than their original cost. The returns shown do not reflect taxes that a shareholder would pay on fund distributions or on the sale of fund shares.
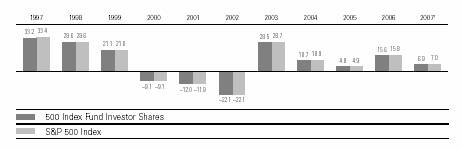
Fiscal-Year Total Returns (%): December 31, 1996–June 30, 2007
Average Annual Total Returns: Periods Ended June 30, 2007 | | | |
| | | | |
| Inception Date | One Year | Five Years | Ten Years |
Investor Shares2 | 8/31/1976 | 20.41% | 10.58% | 7.05% |
Admiral Shares | 11/13/2000 | 20.51 | 10.67 | 3.323 |
Signal Shares | 9/29/2006 | 14.073 | — | — |
1 Six months ended June 30, 2007
2 Total returns do not include the account service fee that may be applicable to certain accounts with balances below $10,000.
3 Return since inception
Note: See Financial Highlights tables on pages 17–19 for dividend and capital gains information.
7
Financial Statements (unaudited)
Statement of Net Assets
As of June 30, 2007
The fund provides a complete list of its holdings four times in each fiscal year, at the quarter-ends. For the second and fourth fiscal quarters, the lists appear in the fund’s semiannual and annual reports to shareholders. For the first and third fiscal quarters, the fund files the lists with the Securities and Exchange Commission on Form N-Q. Shareholders can look up the fund’s Forms N-Q on the SEC’s website at www.sec.gov. Forms N-Q may also be reviewed and copied at the SEC’s Public Reference Room (see the back cover of this report for further information).
| | | Market |
| | | Value• |
| | Shares | ($000) |
Common Stocks (99.7%)1 | | |
Consumer Discretionary (10.2%) | |
* | Comcast Corp. Class A | 29,216,939 | 821,580 |
| Time Warner, Inc. | 35,722,757 | 751,607 |
| Home Depot, Inc. | 18,629,595 | 733,075 |
| The Walt Disney Co. | 18,700,176 | 638,424 |
| McDonald’s Corp. | 11,266,385 | 571,882 |
| Target Corp. | 8,035,331 | 511,047 |
| News Corp., Class A | 21,970,408 | 465,992 |
| Lowe’s Cos., Inc. | 14,202,729 | 435,882 |
* | Viacom Inc. Class B | 6,431,489 | 267,743 |
| CBS Corp. | 6,841,175 | 227,948 |
| The McGraw-Hill Cos., Inc. | 3,238,690 | 220,490 |
* | Kohl’s Corp. | 3,044,537 | 216,253 |
| Johnson Controls, Inc. | 1,861,860 | 215,548 |
| NIKE, Inc. Class B | 3,577,738 | 208,546 |
| Carnival Corp. | 4,174,835 | 203,607 |
| General Motors Corp. | 5,338,801 | 201,807 |
* | Amazon.com, Inc. | 2,934,855 | 200,774 |
* | Starbucks Corp. | 6,990,526 | 183,431 |
| Best Buy Co., Inc. | 3,820,108 | 178,284 |
| Clear Channel | | |
| Communications, Inc. | 4,684,089 | 177,152 |
| Macy’s Inc. | 4,337,346 | 172,540 |
* | DIRECTV Group, Inc. | 7,275,573 | 168,138 |
| Ford Motor Co. | 17,742,559 | 167,135 |
* | Coach, Inc. | 3,502,332 | 165,976 |
| Omnicom Group Inc. | 3,121,684 | 165,200 |
| Yum! Brands, Inc. | 4,942,952 | 161,733 |
| Staples, Inc. | 6,749,410 | 160,163 |
| J.C. Penney Co., Inc. | | |
| (Holding Co.) | 2,123,014 | 153,664 |
| Harrah’s | | |
| Entertainment, Inc. | 1,761,689 | 150,202 |
| Harley-Davidson, Inc. | 2,430,472 | 144,880 |
| Starwood Hotels & | | |
| Resorts Worldwide, Inc. | 2,029,873 | 136,144 |
| Marriott International, Inc. | | |
| Class A | 3,099,647 | 134,029 |
* | Sears Holdings Corp. | 777,018 | 131,705 |
| | | | | |
| | | Market |
| | | Value• |
| | Shares | ($000) |
| International | | |
| Game Technology | 3,137,172 | 124,546 |
| Hilton Hotels Corp. | 3,677,949 | 123,101 |
| Gannett Co., Inc. | 2,214,469 | 121,685 |
| Fortune Brands, Inc. | 1,441,517 | 118,738 |
| TJX Cos., Inc. | 4,292,498 | 118,044 |
| Nordstrom, Inc. | 2,118,116 | 108,278 |
| The Gap, Inc. | 5,003,080 | 95,559 |
| Mattel, Inc. | 3,711,805 | 93,872 |
* | Bed Bath & Beyond, Inc. | 2,584,613 | 93,020 |
| Limited Brands, Inc. | 3,229,530 | 88,651 |
| Whirlpool Corp. | 744,658 | 82,806 |
| Genuine Parts Co. | 1,607,739 | 79,744 |
* | Office Depot, Inc. | 2,609,081 | 79,055 |
| Newell Rubbermaid, Inc. | 2,631,871 | 77,456 |
* | Apollo Group, Inc. Class A | 1,320,594 | 77,162 |
| VF Corp. | 840,754 | 76,996 |
| ^Eastman Kodak Co. | 2,714,820 | 75,553 |
| Harman International | | |
| Industries, Inc. | 615,129 | 71,847 |
* | IAC/InterActiveCorp | 2,061,885 | 71,362 |
| H & R Block, Inc. | 3,047,371 | 71,217 |
| Sherwin-Williams Co. | 1,032,968 | 68,661 |
| Tiffany & Co. | 1,290,318 | 68,464 |
* | The Goodyear Tire & | | |
| Rubber Co. | 1,946,817 | 67,671 |
| Dollar General Corp. | 2,972,370 | 65,154 |
* | Wyndham | | |
| Worldwide Corp. | 1,722,449 | 62,456 |
* | AutoZone Inc. | 451,358 | 61,665 |
| Abercrombie & Fitch Co. | 833,874 | 60,856 |
| Darden Restaurants Inc. | 1,335,820 | 58,763 |
| Polo Ralph Lauren Corp. | 579,004 | 56,806 |
| Black & Decker Corp. | 623,370 | 55,050 |
| D. R. Horton, Inc. | 2,582,105 | 51,461 |
* | Interpublic Group | | |
| of Cos., Inc. | 4,430,425 | 50,507 |
| Family Dollar Stores, Inc. | 1,424,037 | 48,873 |
| Lennar Corp. Class A | 1,315,603 | 48,098 |
| The Stanley Works | 787,908 | 47,826 |
| Hasbro, Inc. | 1,503,957 | 47,239 |
8
| | | Market |
| | | Value• |
| | Shares | ($000) |
| Centex Corp. | 1,128,609 | 45,257 |
| Pulte Homes, Inc. | 2,007,435 | 45,067 |
| RadioShack Corp. | 1,280,135 | 42,424 |
| Liz Claiborne, Inc. | 987,709 | 36,842 |
| Leggett & Platt, Inc. | 1,667,665 | 36,772 |
| E.W. Scripps Co. Class A | 783,202 | 35,784 |
| Dow Jones & Co., Inc. | 614,068 | 35,278 |
| ^New York Times Co. | | |
| Class A | 1,352,756 | 34,360 |
* | AutoNation, Inc. | 1,427,596 | 32,035 |
| Wendy’s International, Inc. | 824,457 | 30,299 |
* | Big Lots Inc. | 1,027,285 | 30,223 |
| Jones Apparel Group, Inc. | 1,029,019 | 29,070 |
| KB Home | 722,603 | 28,449 |
| OfficeMax, Inc. | 711,926 | 27,979 |
| Brunswick Corp. | 852,880 | 27,829 |
| Snap-On Inc. | 547,773 | 27,668 |
| Tribune Co. | 798,494 | 23,476 |
| Meredith Corp. | 366,234 | 22,560 |
| Dillard’s Inc. | 569,322 | 20,456 |
| Circuit City Stores, Inc. | 1,306,698 | 19,705 |
* | Comcast Corp. Special | | |
| Class A | 150,777 | 4,216 |
* | Viacom Inc. Class A | 71,693 | 2,982 |
| CBS Corp. Class A | 71,693 | 2,390 |
| News Corp., Class B | 9,800 | 225 |
| | | 12,852,169 |
Consumer Staples (9.3%) | | |
| The Procter & Gamble Co. | 29,715,738 | 1,818,306 |
| Altria Group, Inc. | 19,847,909 | 1,392,132 |
| Wal-Mart Stores, Inc. | 22,876,487 | 1,100,588 |
| PepsiCo, Inc. | 15,371,834 | 996,863 |
| The Coca-Cola Co. | 18,964,023 | 992,008 |
| Kraft Foods Inc. | 15,137,630 | 533,601 |
| CVS/Caremark Corp. | 14,565,551 | 530,914 |
| Walgreen Co. | 9,444,569 | 411,217 |
| Anheuser-Busch Cos., Inc. | 7,169,996 | 373,987 |
| Colgate-Palmolive Co. | 4,826,793 | 313,018 |
| Kimberly-Clark Corp. | 4,304,429 | 287,923 |
| Costco Wholesale Corp. | 4,214,836 | 246,652 |
| Archer-Daniels-Midland Co. | 6,159,649 | 203,823 |
| Sysco Corp. | 5,831,501 | 192,381 |
| General Mills, Inc. | 3,268,514 | 190,947 |
| The Kroger Co. | 6,680,823 | 187,932 |
| Avon Products, Inc. | 4,141,343 | 152,194 |
| H.J. Heinz Co. | 3,065,486 | 145,519 |
| Safeway, Inc. | 4,167,277 | 141,812 |
| ConAgra Foods, Inc. | 4,700,295 | 126,250 |
| Kellogg Co. | 2,363,795 | 122,421 |
| Sara Lee Corp. | 6,932,030 | 120,617 |
| ^Reynolds American Inc. | 1,612,815 | 105,156 |
| SuperValu Inc. | 1,961,044 | 90,836 |
| Wm. Wrigley Jr. Co. | 1,618,571 | 89,523 |
| The Clorox Co. | 1,432,057 | 88,931 |
| The Hershey Co. | 1,617,715 | 81,889 |
| UST, Inc. | 1,509,704 | 81,086 |
| | | Market |
| | | Value• |
| | Shares | ($000) |
| Campbell Soup Co. | 2,047,453 | 79,462 |
| Coca-Cola Enterprises, Inc. | 2,635,728 | 63,257 |
| Tyson Foods, Inc. | 2,388,706 | 55,036 |
| Brown-Forman Corp. | | |
| Class B | 744,612 | 54,416 |
| ^Whole Foods Market, Inc. | 1,335,746 | 51,159 |
| The Estee Lauder | | |
| Cos. Inc. Class A | 1,114,794 | 50,734 |
| McCormick & Co., Inc. | 1,223,932 | 46,730 |
* | Constellation Brands, Inc. | | |
| Class A | 1,825,403 | 44,321 |
| The Pepsi Bottling | | |
| Group, Inc. | 1,235,895 | 41,625 |
| Molson Coors | | |
| Brewing Co. Class B | 447,423 | 41,369 |
| Dean Foods Co. | 1,228,396 | 39,149 |
| Wm. Wrigley Jr. Co. | | |
| Class B | 415,980 | 22,879 |
| | | 11,708,663 |
Energy (10.7%) | | |
| ExxonMobil Corp. | 53,160,102 | 4,459,069 |
| Chevron Corp. | 20,281,949 | 1,708,551 |
| ConocoPhillips Co. | 15,423,472 | 1,210,743 |
| Schlumberger Ltd. | 11,121,816 | 944,687 |
| Occidental | | |
| Petroleum Corp. | 7,868,484 | 455,428 |
| Marathon Oil Corp. | 6,473,206 | 388,133 |
| Valero Energy Corp. | 5,180,710 | 382,647 |
| Devon Energy Corp. | 4,197,569 | 328,628 |
| Halliburton Co. | 8,625,710 | 297,587 |
* | Transocean Inc. | 2,719,198 | 288,181 |
| Apache Corp. | 3,125,077 | 254,975 |
| Baker Hughes, Inc. | 3,022,855 | 254,313 |
| Anadarko | | |
| Petroleum Corp. | 4,377,924 | 227,608 |
| XTO Energy, Inc. | 3,617,673 | 217,422 |
| Williams Cos., Inc. | 5,651,274 | 178,693 |
* | Weatherford | | |
| International Ltd. | 3,183,033 | 175,831 |
* | National Oilwell Varco Inc. | 1,676,033 | 174,710 |
| EOG Resources, Inc. | 2,308,129 | 168,632 |
| Spectra Energy Corp. | 5,962,373 | 154,783 |
| Hess Corp. | 2,574,909 | 151,817 |
| Chesapeake Energy Corp. | 3,864,007 | 133,695 |
| Noble Corp. | 1,264,487 | 123,313 |
| Peabody Energy Corp. | 2,500,389 | 120,969 |
| El Paso Corp. | 6,607,978 | 113,855 |
| Smith International, Inc. | 1,891,783 | 110,934 |
| Murphy Oil Corp. | 1,775,229 | 105,520 |
| Sunoco, Inc. | 1,146,006 | 91,314 |
* | Nabors Industries, Inc. | 2,656,631 | 88,678 |
| ENSCO International, Inc. | 1,406,847 | 85,832 |
| CONSOL Energy, Inc. | 1,715,486 | 79,101 |
| BJ Services Co. | 2,768,096 | 78,725 |
| Rowan Cos., Inc. | 1,045,498 | 42,845 |
| | | 13,597,219 |
9
| | Market |
| | Value• |
| Shares | ($000) |
Financials (20.8%) | | |
Citigroup, Inc. | 46,678,587 | 2,394,145 |
Bank of America Corp. | 41,878,381 | 2,047,434 |
American International | | |
Group, Inc. | 24,481,277 | 1,714,424 |
JPMorgan Chase & Co. | 32,237,244 | 1,561,894 |
Wells Fargo & Co. | 31,516,570 | 1,108,438 |
Wachovia Corp. | 18,055,959 | 925,368 |
The Goldman Sachs | | |
Group, Inc. | 3,854,656 | 835,497 |
Morgan Stanley | 9,945,712 | 834,246 |
Merrill Lynch & Co., Inc. | 8,217,601 | 686,827 |
American Express Co. | 11,216,642 | 686,234 |
Fannie Mae | 9,182,392 | 599,886 |
U.S. Bancorp | 16,407,947 | 540,642 |
MetLife, Inc. | 6,998,409 | 451,257 |
Prudential Financial, Inc. | 4,412,611 | 429,038 |
Freddie Mac | 6,242,743 | 378,935 |
Lehman Brothers | | |
Holdings, Inc. | 5,026,161 | 374,550 |
Washington Mutual, Inc. | 8,389,627 | 357,734 |
The Allstate Corp. | 5,731,962 | 352,573 |
The Travelers Cos., Inc. | 6,265,985 | 335,230 |
Capital One Financial Corp. | 3,899,588 | 305,884 |
The Bank of | | |
New York Co., Inc. | 7,133,801 | 295,625 |
The Hartford Financial | | |
Services Group Inc. | 2,988,223 | 294,370 |
SunTrust Banks, Inc. | 3,365,355 | 288,546 |
AFLAC Inc. | 4,615,874 | 237,256 |
PNC Financial | | |
Services Group | 3,254,898 | 232,986 |
State Street Corp. | 3,383,957 | 231,463 |
SLM Corp. | 3,882,358 | 223,546 |
Regions Financial Corp. | 6,650,178 | 220,121 |
Loews Corp. | 4,206,269 | 214,436 |
BB&T Corp. | 5,120,004 | 208,282 |
Fifth Third Bancorp | 5,190,910 | 206,442 |
Franklin Resources Corp. | 1,554,721 | 205,954 |
The Chubb Corp. | 3,788,660 | 205,118 |
Countrywide | | |
Financial Corp. | 5,599,678 | 203,548 |
Simon Property | | |
Group, Inc. REIT | 2,107,972 | 196,126 |
Charles Schwab Corp. | 9,548,395 | 195,933 |
ACE Ltd. | 3,072,189 | 192,073 |
Lincoln National Corp. | 2,555,165 | 181,289 |
National City Corp. | 5,433,356 | 181,039 |
The Chicago | | |
Mercantile Exchange | 335,085 | 179,056 |
Mellon Financial Corp. | 3,928,766 | 172,866 |
Progressive Corp. of Ohio | 6,947,508 | 166,254 |
Marsh & McLennan | | |
Cos., Inc. | 5,241,369 | 161,853 |
Bear Stearns Co., Inc. | 1,123,204 | 157,249 |
XL Capital Ltd. Class A | 1,754,720 | 147,905 |
| | | Market |
| | | Value• |
| | Shares | ($000) |
| The Principal Financial | | |
| Group, Inc. | 2,527,020 | 147,300 |
| Ameriprise Financial, Inc. | 2,219,973 | 141,124 |
| ProLogis REIT | 2,421,422 | 137,779 |
| Genworth Financial Inc. | 3,947,726 | 135,802 |
| Vornado Realty Trust REIT | 1,232,397 | 135,366 |
| Moody’s Corp. | 2,170,333 | 134,995 |
| T. Rowe Price Group Inc. | 2,506,570 | 130,066 |
| KeyCorp | 3,701,997 | 127,090 |
| Equity Residential REIT | 2,743,659 | 125,193 |
| Archstone-Smith | | |
| Trust REIT | 2,103,592 | 124,343 |
| Legg Mason Inc. | 1,240,942 | 122,084 |
| Aon Corp. | 2,770,690 | 118,059 |
| Marshall & Ilsley Corp. | 2,445,120 | 116,461 |
| Boston | | |
| Properties, Inc. REIT | 1,122,989 | 114,691 |
| Northern Trust Corp. | 1,780,574 | 114,384 |
| Host Hotels & | | |
| Resorts Inc. REIT | 4,926,477 | 113,900 |
| CIT Group Inc. | 1,809,743 | 99,228 |
| Synovus Financial Corp. | 3,085,631 | 94,729 |
| Avalonbay | | |
| Communities, Inc. REIT | 751,526 | 89,341 |
* | E*TRADE Financial Corp. | 4,028,162 | 88,982 |
| Public Storage, Inc. REIT | 1,158,283 | 88,979 |
| Comerica, Inc. | 1,471,600 | 87,516 |
| Compass Bancshares Inc. | 1,242,851 | 85,732 |
| Unum Group | 3,234,952 | 84,465 |
| Ambac Financial | | |
| Group, Inc. | 961,864 | 83,865 |
| Kimco Realty Corp. REIT | 2,140,355 | 81,483 |
| Zions Bancorp | 1,037,983 | 79,831 |
| Huntington | | |
| Bancshares Inc. | 3,450,273 | 78,459 |
| MBIA, Inc. | 1,234,309 | 76,799 |
| M & T Bank Corp. | 714,959 | 76,429 |
| Sovereign Bancorp, Inc. | 3,407,612 | 72,037 |
| Cincinnati Financial Corp. | 1,620,084 | 70,312 |
| Plum Creek | | |
| Timber Co. Inc. REIT | 1,665,875 | 69,400 |
| Commerce Bancorp, Inc. | 1,808,298 | 66,889 |
* | CB Richard Ellis Group, Inc. | 1,769,314 | 64,580 |
| General Growth | | |
| Properties Inc. REIT | 1,214,192 | 64,291 |
| Safeco Corp. | 1,003,284 | 62,464 |
| Developers Diversified | | |
| Realty Corp. REIT | 1,180,574 | 62,228 |
| Torchmark Corp. | 902,345 | 60,457 |
| Hudson City Bancorp, Inc. | 4,578,085 | 55,944 |
| Assurant, Inc. | 937,579 | 55,242 |
| Janus Capital Group Inc. | 1,751,780 | 48,770 |
| First Horizon National Corp. | 1,188,169 | 46,339 |
| Apartment Investment & Management Co. | | |
| Class A REIT | 916,343 | 46,202 |
10
| | | Market |
| | | Value• |
| | Shares | ($000) |
| MGIC Investment Corp. | 784,939 | 44,632 |
| Federated Investors, Inc. | 837,211 | 32,090 |
| | | 26,275,924 |
Health Care (11.6%) | | |
| Pfizer Inc. | 66,230,015 | 1,693,501 |
| Johnson & Johnson | 27,334,239 | 1,684,336 |
| Merck & Co., Inc. | 20,452,106 | 1,018,515 |
| Abbott Laboratories | 14,536,022 | 778,404 |
| Wyeth | 12,693,939 | 727,870 |
| UnitedHealth Group Inc. | 12,645,754 | 646,704 |
* | Amgen, Inc. | 10,943,285 | 605,054 |
| Bristol-Myers Squibb Co. | 18,572,238 | 586,140 |
| Medtronic, Inc. | 10,867,064 | 563,566 |
| Eli Lilly & Co. | 9,310,440 | 520,267 |
* | WellPoint Inc. | 5,790,931 | 462,290 |
| Schering-Plough Corp. | 14,055,072 | 427,836 |
| Baxter International, Inc. | 6,148,188 | 346,389 |
* | Gilead Sciences, Inc. | 8,812,390 | 341,656 |
| Cardinal Health, Inc. | 3,629,799 | 256,409 |
| Aetna Inc. | 4,873,160 | 240,734 |
* | Medco Health | | |
| Solutions, Inc. | 2,643,515 | 206,168 |
* | Thermo Fisher | | |
| Scientific, Inc. | 3,981,636 | 205,930 |
* | Celgene Corp. | 3,584,984 | 205,527 |
* | Zimmer Holdings, Inc. | 2,234,339 | 189,673 |
| Stryker Corp. | 2,818,092 | 177,793 |
* | Biogen Idec Inc. | 3,288,847 | 175,953 |
| Becton, Dickinson & Co. | 2,311,828 | 172,231 |
* | Boston Scientific Corp. | 11,197,271 | 171,766 |
| Allergan, Inc. | 2,901,910 | 167,266 |
| McKesson Corp. | 2,787,592 | 166,252 |
* | Genzyme Corp. | 2,480,482 | 159,743 |
| CIGNA Corp. | 2,715,818 | 141,820 |
* | Forest Laboratories, Inc. | 2,999,536 | 136,929 |
* | St. Jude Medical, Inc. | 3,192,644 | 132,463 |
* | Express Scripts Inc. | 2,570,774 | 128,564 |
| Biomet, Inc. | 2,316,635 | 105,917 |
* | Humana Inc. | 1,585,717 | 96,586 |
| AmerisourceBergen Corp. | 1,803,187 | 89,204 |
* | Laboratory Corp. of | | |
| America Holdings | 1,109,671 | 86,843 |
* | Coventry Health Care Inc. | 1,475,214 | 85,046 |
| C.R. Bard, Inc. | 974,526 | 80,525 |
| Quest Diagnostics, Inc. | 1,492,612 | 77,093 |
| IMS Health, Inc. | 1,854,297 | 59,579 |
* | Hospira, Inc. | 1,472,239 | 57,476 |
* | Waters Corp. | 952,152 | 56,520 |
| Applera Corp.–Applied | | |
| Biosystems Group | 1,734,418 | 52,969 |
* | Barr Pharmaceuticals Inc. | 1,036,993 | 52,088 |
* | Varian Medical | | |
| Systems, Inc. | 1,202,820 | 51,132 |
* | Patterson Cos. | 1,314,661 | 48,997 |
* | King Pharmaceuticals, Inc. | 2,302,297 | 47,105 |
| Manor Care, Inc. | 691,441 | 45,144 |
| | | Market |
| | | Value• |
| | Shares | ($000) |
| Mylan Laboratories, Inc. | 2,347,175 | 42,695 |
* | Millipore Corp. | 510,091 | 38,303 |
| Bausch & Lomb, Inc. | 510,285 | 35,434 |
* | Watson | | |
| Pharmaceuticals, Inc. | 964,198 | 31,365 |
| PerkinElmer, Inc. | 1,131,533 | 29,488 |
* | Tenet Healthcare Corp. | 4,469,422 | 29,096 |
| | | 14,736,354 |
Industrials (11.4%) | | |
| General Electric Co. | 97,087,383 | 3,716,505 |
| United Parcel Service, Inc. | 9,993,966 | 729,560 |
| The Boeing Co. | 7,430,520 | 714,519 |
| United Technologies Corp. | 9,384,187 | 665,620 |
| Tyco International Ltd. | 18,708,011 | 632,144 |
| 3M Co. | 6,796,361 | 589,856 |
| Caterpillar, Inc. | 6,043,265 | 473,188 |
| Honeywell | | |
| International Inc. | 7,357,992 | 414,108 |
| Emerson Electric Co. | 7,504,689 | 351,219 |
| FedEx Corp. | 2,904,652 | 322,329 |
| Lockheed Martin Corp. | 3,348,978 | 315,239 |
| General Dynamics Corp. | 3,820,226 | 298,818 |
| Union Pacific Corp. | 2,555,003 | 294,209 |
| Burlington Northern | | |
| Santa Fe Corp. | 3,360,540 | 286,116 |
| Deere & Co. | 2,123,026 | 256,334 |
| Northrop Grumman Corp. | 3,256,710 | 253,600 |
| Raytheon Co. | 4,188,515 | 225,719 |
| Illinois Tool Works, Inc. | 3,887,650 | 210,672 |
| PACCAR, Inc. | 2,343,229 | 203,955 |
| Norfolk Southern Corp. | 3,710,671 | 195,070 |
| Waste Management, Inc. | 4,882,822 | 190,674 |
| CSX Corp. | 4,125,291 | 185,968 |
| Danaher Corp. | 2,246,657 | 169,623 |
| Precision Castparts Corp. | 1,298,337 | 157,566 |
| Ingersoll-Rand Co. | 2,846,325 | 156,036 |
| Textron, Inc. | 1,183,758 | 130,344 |
| Eaton Corp. | 1,382,449 | 128,568 |
| ITT Industries, Inc. | 1,714,813 | 117,087 |
| L-3 Communications | | |
| Holdings, Inc. | 1,178,934 | 114,816 |
| Rockwell Collins, Inc. | 1,579,191 | 111,554 |
| Southwest Airlines Co. | 7,368,491 | 109,864 |
| Parker Hannifin Corp. | 1,093,000 | 107,016 |
| Rockwell Automation, Inc. | 1,488,656 | 103,372 |
| Masco Corp. | 3,564,240 | 101,474 |
| Cummins Inc. | 983,945 | 99,585 |
| Dover Corp. | 1,928,986 | 98,668 |
| Cooper Industries, Inc. | | |
| Class A | 1,727,321 | 98,613 |
| American | | |
| Standard Cos., Inc. | 1,659,460 | 97,875 |
| Pitney Bowes, Inc. | 2,071,042 | 96,966 |
| Fluor Corp. | 832,055 | 92,666 |
| R.R. Donnelley & Sons Co. | 2,076,981 | 90,369 |
11
| | | Market |
| | | Value• |
| | Shares | ($000) |
| C.H. Robinson | | |
| Worldwide Inc. | 1,615,186 | 84,830 |
* | Terex Corp. | 972,889 | 79,096 |
| Goodrich Corp. | 1,181,132 | 70,348 |
| W.W. Grainger, Inc. | 670,220 | 62,364 |
| Equifax, Inc. | 1,374,557 | 61,058 |
| Avery Dennison Corp. | 865,853 | 57,562 |
| Robert Half | | |
| International, Inc. | 1,568,853 | 57,263 |
| Pall Corp. | 1,155,083 | 53,122 |
* | Monster Worldwide Inc. | 1,233,965 | 50,716 |
| Cintas Corp. | 1,272,503 | 50,175 |
* | Allied Waste | | |
| Industries, Inc. | 2,396,638 | 32,259 |
| Ryder System, Inc. | 577,800 | 31,086 |
* | Raytheon Co. | | |
| Warrants Exp. 6/16/11 | 60,569 | 1,117 |
| | | 14,398,480 |
Information Technology (15.4%) | |
| Microsoft Corp. | 79,446,534 | 2,341,289 |
* | Cisco Systems, Inc. | 57,293,310 | 1,595,619 |
| International Business | | |
| Machines Corp. | 12,890,878 | 1,356,765 |
| Intel Corp. | 54,827,874 | 1,302,710 |
| Hewlett-Packard Co. | 24,713,927 | 1,102,735 |
* | Google Inc. | 2,058,013 | 1,077,123 |
* | Apple Computer, Inc. | 8,162,307 | 996,128 |
* | Oracle Corp. | 37,355,259 | 736,272 |
| QUALCOMM Inc. | 15,728,877 | 682,476 |
* | Dell Inc. | 21,436,797 | 612,021 |
| Texas Instruments, Inc. | 13,529,596 | 509,119 |
| Motorola, Inc. | 21,842,572 | 386,614 |
* | Corning, Inc. | 14,842,026 | 379,214 |
* | EMC Corp. | 19,802,710 | 358,429 |
* | eBay Inc. | 10,682,291 | 343,756 |
* | Yahoo! Inc. | 11,413,504 | 309,648 |
| Applied Materials, Inc. | 13,041,290 | 259,131 |
| Automatic Data | | |
| Processing, Inc. | 5,220,723 | 253,048 |
| First Data Corp. | 7,119,186 | 232,584 |
* | Adobe Systems, Inc. | 5,548,895 | 222,788 |
* | Sun Microsystems, Inc. | 33,691,707 | 177,218 |
* | Symantec Corp. | 8,502,692 | 171,754 |
* | Xerox Corp. | 8,845,543 | 163,466 |
| Western Union Co. | 7,291,362 | 151,879 |
* | Agilent Technologies, Inc. | 3,736,509 | 143,632 |
* | NVIDIA Corp. | 3,424,696 | 141,474 |
* | Electronic Arts Inc. | 2,925,777 | 138,448 |
* | Juniper Networks, Inc. | 5,343,995 | 134,508 |
| Electronic Data | | |
| Systems Corp. | 4,802,010 | 133,160 |
* | MEMC Electronic | | |
| Materials, Inc. | 2,117,507 | 129,422 |
* | Broadcom Corp. | 4,390,569 | 128,424 |
| Paychex, Inc. | 3,207,684 | 125,485 |
| Analog Devices, Inc. | 3,086,740 | 116,185 |
| | | Market |
| | | Value• |
| | Shares | ($000) |
* | SanDisk Corp. | 2,153,602 | 105,397 |
* | Autodesk, Inc. | 2,181,701 | 102,715 |
* | Network Appliance, Inc. | 3,501,554 | 102,245 |
* | Cognizant Technology | | |
| Solutions Corp. | 1,356,540 | 101,863 |
| Maxim Integrated | | |
| Products, Inc. | 3,026,262 | 101,107 |
| CA, Inc. | 3,881,664 | 100,263 |
| KLA-Tencor Corp. | 1,808,267 | 99,364 |
* | Intuit, Inc. | 3,232,740 | 97,241 |
* | Computer Sciences Corp. | 1,634,508 | 96,681 |
* | Fiserv, Inc. | 1,587,168 | 90,151 |
* | Micron Technology, Inc. | 7,137,562 | 89,434 |
* | NCR Corp. | 1,697,662 | 89,195 |
| ^Linear Technology Corp. | 2,395,239 | 86,660 |
| Fidelity National | | |
| Information Services, Inc. | 1,543,765 | 83,796 |
| Xilinx, Inc. | 2,811,031 | 75,251 |
| National | | |
| Semiconductor Corp. | 2,632,966 | 74,434 |
* | ^Advanced Micro | | |
| Devices, Inc. | 5,194,300 | 74,279 |
| Altera Corp. | 3,353,247 | 74,207 |
* | VeriSign, Inc. | 2,313,234 | 73,399 |
* | Avaya Inc. | 4,245,251 | 71,490 |
* | BMC Software, Inc. | 1,927,238 | 58,395 |
* | Citrix Systems, Inc. | 1,706,360 | 57,453 |
* | LSI Corp. | 7,278,826 | 54,664 |
* | Affiliated Computer | | |
| Services, Inc. Class A | 937,081 | 53,151 |
* | Tellabs, Inc. | 4,136,441 | 44,508 |
* | Lexmark International, Inc. | 893,497 | 44,058 |
| Molex, Inc. | 1,337,992 | 40,153 |
| Jabil Circuit, Inc. | 1,693,288 | 37,371 |
* | Novellus Systems, Inc. | 1,193,917 | 33,871 |
* | Compuware Corp. | 2,845,474 | 33,747 |
* | Teradyne, Inc. | 1,784,983 | 31,380 |
* | Solectron Corp. | 8,499,272 | 31,277 |
* | Convergys Corp. | 1,287,804 | 31,216 |
* | Unisys Corp. | 3,285,858 | 30,033 |
* | Ciena Corp. | 800,003 | 28,904 |
* | ^JDS Uniphase Corp. | 1,981,241 | 26,608 |
| Tektronix, Inc. | 771,206 | 26,020 |
* | Novell, Inc. | 3,290,959 | 25,637 |
* | QLogic Corp. | 1,494,935 | 24,891 |
* | ^PMC Sierra Inc. | 746,307 | 5,769 |
* | Sanmina-SCI Corp. | 1,407,599 | 4,406 |
| Molex, Inc. Class A | 4,051 | 108 |
| | | 19,425,316 |
Materials (3.1%) | | |
| E.I. du Pont de | | |
| Nemours & Co. | 8,716,517 | 443,148 |
| Dow Chemical Co. | 8,995,501 | 397,781 |
| Monsanto Co. | 5,128,906 | 346,406 |
| Alcoa Inc. | 8,205,502 | 332,569 |
12
| | | Market |
| | | Value• |
| | Shares | ($000) |
| Freeport-McMoRan | | |
| Copper & Gold, Inc. | | |
| Class B | 3,542,736 | 293,409 |
| Praxair, Inc. | 3,007,510 | 216,511 |
| Nucor Corp. | 2,847,091 | 166,982 |
| Newmont Mining Corp. | | |
| (Holding Co.) | 4,256,908 | 166,275 |
| Air Products & | | |
| Chemicals, Inc. | 2,044,100 | 164,284 |
| Weyerhaeuser Co. | 2,037,438 | 160,815 |
| International Paper Co. | 4,110,322 | 160,508 |
| United States Steel Corp. | 1,116,418 | 121,410 |
| PPG Industries, Inc. | 1,549,209 | 117,910 |
| Vulcan Materials Co. | 899,191 | 102,993 |
| Allegheny Technologies Inc. | 963,929 | 101,097 |
| Rohm & Haas Co. | 1,343,108 | 73,441 |
| Ecolab, Inc. | 1,653,924 | 70,623 |
| MeadWestvaco Corp. | 1,742,733 | 61,553 |
| Temple-Inland Inc. | 999,852 | 61,521 |
| Sigma-Aldrich Corp. | 1,239,168 | 52,875 |
| Ball Corp. | 963,360 | 51,222 |
| Eastman Chemical Co. | 794,927 | 51,138 |
| Sealed Air Corp. | 1,526,505 | 47,352 |
* | Pactiv Corp. | 1,231,906 | 39,285 |
| International Flavors & | | |
| Fragrances, Inc. | 732,708 | 38,203 |
| Ashland, Inc. | 524,262 | 33,527 |
| Bemis Co., Inc. | 983,845 | 32,644 |
* | Hercules, Inc. | 1,093,240 | 21,482 |
| | | 3,926,964 |
Telecommunication Services (3.7%) | |
| AT&T Inc. | 58,183,214 | 2,414,603 |
| Verizon | | |
| Communications Inc. | 27,398,484 | 1,127,996 |
| Sprint Nextel Corp. | 27,306,662 | 565,521 |
| Alltel Corp. | 3,260,207 | 220,227 |
* | Qwest Communications | | |
| International Inc. | 14,658,358 | 142,186 |
| Embarq Corp. | 1,425,507 | 90,334 |
| Windstream Corp. | 4,498,790 | 66,402 |
| CenturyTel, Inc. | 1,034,841 | 50,759 |
| Citizens | | |
| Communications Co. | 3,235,420 | 49,405 |
| | | 4,727,433 |
Utilities (3.5%) | | |
| Exelon Corp. | 6,347,665 | 460,840 |
| TXU Corp. | 4,332,868 | 291,602 |
| Dominion Resources, Inc. | 3,305,860 | 285,329 |
| Southern Co. | 7,094,636 | 243,275 |
| FPL Group, Inc. | 3,835,198 | 217,609 |
| Duke Energy Corp. | 11,885,205 | 217,499 |
| Public Service Enterprise | | |
| Group, Inc. | 2,385,328 | 209,384 |
| Entergy Corp. | 1,861,537 | 199,836 |
| FirstEnergy Corp. | 2,876,616 | 186,203 |
| Edison International | 3,074,595 | 172,546 |
| | | Market |
| | | Value• |
| | Shares | ($000) |
| PPL Corp. | 3,634,006 | 170,035 |
| American Electric | | |
| Power Co., Inc. | 3,763,057 | 169,488 |
| PG&E Corp. | 3,316,996 | 150,260 |
| Constellation Energy | | |
| Group, Inc. | 1,704,947 | 148,620 |
| Sempra Energy | 2,489,457 | 147,451 |
* | AES Corp. | 6,299,843 | 137,841 |
| Consolidated Edison Inc. | 2,552,821 | 115,183 |
| Progress Energy, Inc. | 2,398,784 | 109,361 |
| Ameren Corp. | 1,946,398 | 95,393 |
| Questar Corp. | 1,626,961 | 85,985 |
* | Allegheny Energy, Inc. | 1,563,733 | 80,908 |
| DTE Energy Co. | 1,661,441 | 80,115 |
| Xcel Energy, Inc. | 3,858,841 | 78,990 |
| KeySpan Corp. | 1,658,626 | 69,629 |
| NiSource, Inc. | 2,589,652 | 53,632 |
| CenterPoint Energy Inc. | 3,031,061 | 52,740 |
| Pinnacle West Capital Corp. | 947,164 | 37,744 |
| CMS Energy Corp. | 2,121,306 | 36,486 |
| Integrys Energy Group, Inc. | 715,141 | 36,279 |
* | Dynegy, Inc. | 3,781,131 | 35,694 |
| TECO Energy, Inc. | 1,966,847 | 33,790 |
| Nicor Inc. | 422,155 | 18,119 |
| | | 4,427,866 |
Total Common Stocks | | |
(Cost $72,172,652) | 126,076,388 |
Temporary Cash Investments (0.4%)1 | |
Money Market Fund (0.4%) | | |
2 | Vanguard Market Liquidity | | |
| Fund, 5.281% | 289,489,370 | 289,489 |
2 | Vanguard Market Liquidity | | |
| Fund, 5.281%—Note E | 154,550,900 | 154,551 |
| | | 444,040 |
| | | | |
13
| | Face | Market |
| | Amount | Value• |
| | ($000) | ($000) |
U.S. Agency Obligations (0.0%) | | |
3 | Federal Home Loan | | |
| Mortgage Corp. | | |
4 | 5.197%, 7/9/2007 | 33,000 | 32,967 |
4 | 5.189%, 7/13/2007 | 10,000 | 9,985 |
| | | 42,952 |
Total Temporary Cash Investments | |
(Cost $486,986) | | 486,992 |
Total Investments (100.1%) | | |
(Cost $72,659,638) | 126,563,380 |
Other Assets and Liabilities (–0.1%) | |
Other Assets—Note B | | 692,031 |
Liabilities—Note E | | (845,813) |
| | | (153,782) |
Net Assets (100%) | 126,409,598 |
| | | | | | |
At June 30, 2007, net assets consisted of:5 | |
| Amount |
| ($000) |
Paid-in Capital | 79,103,783 |
Overdistributed Net Investment Income | (111,391) |
Accumulated Net Realized Losses | (6,486,661) |
Unrealized Appreciation | |
Investment Securities | 53,903,742 |
Futures Contracts | 125 |
Net Assets | 126,409,598 |
| |
| |
Investor Shares—Net Assets | |
Applicable to 514,686,351 outstanding | |
$.001 par value shares of beneficial | |
interest (unlimited authorization) | 71,245,279 |
Net Asset Value Per Share— | |
Investor Shares | $138.42 |
| |
| |
Admiral Shares—Net Assets | |
Applicable to 368,066,140 outstanding | |
$.001 par value shares of beneficial | |
interest (unlimited authorization) | 50,950,616 |
Net Asset Value Per Share— | |
Admiral Shares | $138.43 |
| |
| |
Signal Shares—Net Assets | |
Applicable to 36,852,554 outstanding | |
$.001 par value shares of beneficial | |
interest (unlimited authorization) | 4,213,703 |
Net Asset Value Per Share— | |
Signal Shares | $114.34 |
• See Note A in Notes to Financial Statements.
* Non-income-producing security.
^ Part of security position is on loan to broker/dealers. See Note E in Notes to Financial Statements.
1 The fund invests a portion of its cash reserves in equity markets through the use of index futures contracts. After giving effect to futures investments, the fund’s effective common stock and temporary cash investment positions represent 100.0% and 0.1%, respectively, of net assets. See Note C in Notes to Financial Statements.
2 Affiliated money market fund available only to Vanguard funds and certain trusts and accounts managed by Vanguard. Rate shown is the 7-day yield.
3 The issuer operates under a congressional charter; its securities are neither issued nor guaranteed by the U.S. government. If needed, access to additional funding from the U.S. Treasury (beyond the issuer’s line of credit) would require congressional action.
4 Securities with a value of $42,952,000 have been segregated as initial margin for open futures contracts.
5 See Note C in Notes to Financial Statements for the tax-basis components of net assets.
REIT—Real Estate Investment Trust.
14
Statement of Operations
| Six Months Ended |
| June 30, 2007 |
| ($000) |
Investment Income | |
Income | |
Dividends | 1,149,933 |
Interest1 | 18,025 |
Security Lending | 890 |
Total Income | 1,168,848 |
Expenses | |
The Vanguard Group—Note B | |
Investment Advisory Services | 1,936 |
Management and Administrative | |
Investor Shares | 48,263 |
Admiral Shares | 14,536 |
Signal Shares | 690 |
Marketing and Distribution | |
Investor Shares | 7,753 |
Admiral Shares | 4,200 |
Signal Shares | 63 |
Custodian Fees | 84 |
Shareholders’ Reports | |
Investor Shares | 582 |
Admiral Shares | 41 |
Signal Shares | 5 |
Trustees’ Fees and Expenses | 77 |
Total Expenses | 78,230 |
Net Investment Income | 1,090,618 |
Realized Net Gain (Loss) | |
Investment Securities Sold | 128,211 |
Futures Contracts | 36,927 |
Realized Net Gain (Loss) | 165,138 |
Change in Unrealized Appreciation (Depreciation) | |
Investment Securities | 6,984,987 |
Futures Contracts | (1,324) |
Change in Unrealized Appreciation (Depreciation) | 6,983,663 |
Net Increase (Decrease) in Net Assets Resulting from Operations | 8,239,419 |
1 Interest income from an affiliated company of the fund was $17,015,000.
15
Statement of Changes in Net Assets | | |
| | |
| Six Months Ended | Year Ended |
| June 30, | December 31, |
| 2007 | 2006 |
| ($000) | ($000) |
Increase (Decrease) in Net Assets | | |
Operations | | |
Net Investment Income | 1,090,618 | 1,973,649 |
Realized Net Gain (Loss) | 165,138 | (746,123) |
Change in Unrealized Appreciation (Depreciation) | 6,983,663 | 15,119,814 |
Net Increase (Decrease) in Net Assets Resulting from Operations | 8,239,419 | 16,347,340 |
Distributions | | |
Net Investment Income | | |
Investor Shares | (594,069) | (1,208,833) |
Admiral Shares | (431,774) | (780,509) |
Signal Shares | (19,921) | (3,554) |
Realized Capital Gain | | |
Investor Shares | — | — |
Admiral Shares | — | — |
Signal Shares | — | — |
Total Distributions | (1,045,764) | (1,992,896) |
Capital Share Transactions—Note F | | |
Investor Shares | (5,001,821) | (6,327,783) |
Admiral Shares | 1,641,922 | 3,047,783 |
Signal Shares | 3,383,611 | 714,446 |
Net Increase (Decrease) from Capital Share Transactions | 23,712 | (2,565,554) |
Total Increase (Decrease) | 7,217,367 | 11,788,890 |
Net Assets | | |
Beginning of Period | 119,192,231 | 107,403,341 |
End of Period1 | 126,409,598 | 119,192,231 |
1 Net Assets—End of Period includes undistributed (overdistributed) net investment income of ($111,391,000) and ($156,245,000).
16
Financial Highlights
Investor Shares | | | | | | |
| | | | | | |
| Six Months | | | | | |
| Ended | | | |
For a Share Outstanding | June 30, | Year Ended December 31, |
Throughout Each Period | 2007 | 2006 | 2005 | 2004 | 2003 | 2002 |
Net Asset Value, Beginning of Period | $130.59 | $114.92 | $111.64 | $102.67 | $81.15 | $105.89 |
Investment Operations | | | | | | |
Net Investment Income | 1.17 | 2.11 | 1.95 | 1.951 | 1.44 | 1.32 |
Net Realized and Unrealized Gain (Loss) | | | | | | |
on Investments | 7.78 | 15.70 | 3.31 | 8.97 | 21.51 | (24.70) |
Total from Investment Operations | 8.95 | 17.81 | 5.26 | 10.92 | 22.95 | (23.38) |
Distributions | | | | | | |
Dividends from Net Investment Income | (1.12) | (2.14) | (1.98) | (1.95) | (1.43) | (1.36) |
Distributions from Realized Capital Gains | — | — | — | — | — | — |
Total Distributions | (1.12) | (2.14) | (1.98) | (1.95) | (1.43) | (1.36) |
Net Asset Value, End of Period | $138.42 | $130.59 | $114.92 | $111.64 | $102.67 | $81.15 |
| | | | | | |
| | | | | | |
Total Return2 | 6.88% | 15.64% | 4.77% | 10.74% | 28.50% | –22.15% |
| | | | | | |
| | | | | | |
Ratios/Supplemental Data | | | | | | |
Net Assets, End of Period (Millions) | $71,245 | $72,013 | $69,375 | $84,167 | $75,342 | $56,224 |
Ratio of Total Expenses to | | | | | | |
Average Net Assets | 0.16%* | 0.18% | 0.18% | 0.18% | 0.18% | 0.18% |
Ratio of Net Investment | | | | | | |
Income to Average Net Assets | 1.74%* | 1.74% | 1.75% | 1.86%1 | 1.61% | 1.43% |
Portfolio Turnover Rate3 | 4%* | 5% | 6% | 3% | 1% | 6% |
| | | | | | | | |
1 Net investment income per share and the ratio of net investment income to average net assets include $0.32 and 0.31%, respectively, resulting from a special dividend from Microsoft Corp. in November 2004.
2 Total returns do not include the account service fee that may be applicable to certain accounts with balances below $10,000.
3 Excludes the value of portfolio securities received or delivered as a result of in-kind purchases or redemptions of the fund’s capital shares.
* Annualized.
16
Admiral Shares | | | | | | |
| | | | | | |
| Six Months | | | | | |
| Ended | | | |
For a Share Outstanding | June 30, | | Year Ended December 31, |
Throughout Each Period | 2007 | 2006 | 2005 | 2004 | 2003 | 2002 |
Net Asset Value, Beginning of Period | $130.59 | $114.92 | $111.64 | $102.68 | $81.15 | $105.89 |
Investment Operations | | | | | | |
Net Investment Income | 1.234 | 2.222 | 2.052 | 2.031 | 1.507 | 1.374 |
Net Realized and Unrealized Gain (Loss) | | | | | | |
on Investments | 7.780 | 15.700 | 3.310 | 8.97 | 21.510 | (24.700) |
Total from Investment Operations | 9.014 | 17.922 | 5.362 | 11.00 | 23.017 | (23.326) |
Distributions | | | | | | |
Dividends from Net Investment Income | (1.174) | (2.252) | (2.082) | (2.04) | (1.487) | (1.414) |
Distributions from Realized Capital Gains | — | — | — | — | — | — |
Total Distributions | (1.174) | (2.252) | (2.082) | (2.04) | (1.487) | (1.414) |
Net Asset Value, End of Period | $138.43 | $130.59 | $114.92 | $111.64 | $102.68 | $81.15 |
| | | | | | |
| | �� | | | | |
Total Return | 6.93% | 15.75% | 4.87% | 10.82% | 28.59% | –22.10% |
| | | | | | |
| | | | | | |
Ratios/Supplemental Data | | | | | | |
Net Assets, End of Period (Millions) | $50,951 | $46,467 | $38,028 | $22,412 | $18,098 | $11,922 |
Ratio of Total Expenses to | | | | | | |
Average Net Assets | 0.08%* | 0.09% | 0.09% | 0.09% | 0.12% | 0.12% |
Ratio of Net Investment Income to | | | | | | |
Average Net Assets | 1.82%* | 1.83% | 1.84% | 1.96%1 | 1.67% | 1.50% |
Portfolio Turnover Rate2 | 4%* | 5% | 6% | 3% | 1% | 6% |
| | | | | | | | |
1 Net investment income per share and the ratio of net investment income to average net assets include $0.32 and 0.31%, respectively, resulting from a special dividend from Microsoft Corp. in November 2004.
2 Excludes the value of portfolio securities received or delivered as a result of in-kind purchases or redemptions of the fund’s capital shares.
* Annualized.
18
Signal Shares | | |
| Six Months | Sept. 29, |
| Ended | 20061 to |
| June 30, | Dec. 31, |
For a Share Outstanding Throughout Each Period | 2007 | 2006 |
Net Asset Value, Beginning of Period | $107.86 | $101.61 |
Investment Operations | | |
Net Investment Income | 1.008 | .502 |
Net Realized and Unrealized Gain (Loss) on Investments | 6.438 | 6.287 |
Total from Investment Operations | 7.446 | 6.789 |
Distributions | | |
Dividends from Net Investment Income | (.966) | (.539) |
Distributions from Realized Capital Gains | — | — |
Total Distributions | (.966) | (.539) |
Net Asset Value, End of Period | $114.34 | $107.86 |
| | |
Total Return | 6.93% | 6.68% |
| | |
Ratios/Supplemental Data | | |
Net Assets, End of Period (Millions) | $4,214 | $713 |
Ratio of Total Expenses to Average Net Assets | 0.08%* | 0.09%* |
Ratio of Net Investment Income to Average Net Assets | 1.82%* | 1.83%* |
Portfolio Turnover Rate2 | 4%* | 5% |
1 Inception.
2 Excludes the value of portfolio securities received or delivered as a result of in-kind purchases or redemptions of the fund’s capital shares.
* Annualized.
See accompanying Notes, which are an integral part of the Financial Statements.
19
Notes to Financial Statements
Vanguard 500 Index Fund is registered under the Investment Company Act of 1940 as an open-end investment company, or mutual fund. The fund offers three classes of shares: Investor Shares, Admiral Shares, and Signal Shares. Investor Shares are available to any investor who meets the fund’s minimum purchase requirements. Admiral Shares are designed for investors who meet certain administrative, service, tenure, and account-size criteria. Signal Shares are designed for institutional investors who meet certain administrative, service, and account-size criteria.
A. The following significant accounting policies conform to generally accepted accounting principles for U.S. mutual funds. The fund consistently follows such policies in preparing its financial statements.
1. Security Valuation: Securities are valued as of the close of trading on the New York Stock Exchange (generally 4 p.m., Eastern time) on the valuation date. Equity securities are valued at the latest quoted sales prices or official closing prices taken from the primary market in which each security trades; such securities not traded on the valuation date are valued at the mean of the latest quoted bid and asked prices. Securities for which market quotations are not readily available, or whose values have been materially affected by events occurring before the fund’s pricing time but after the close of the securities’ primary markets, are valued by methods deemed by the board of trustees to represent fair value. Investments in Vanguard Market Liquidity Fund are valued at that fund’s net asset value. Temporary cash investments acquired over 60 days to maturity are valued using the latest bid prices or using valuations based on a matrix system (which considers such factors as security prices, yields, maturities, and ratings), both as furnished by independent pricing services. Other temporary cash investments are valued at amortized cost, which approximates market value.
2. Futures Contracts: The fund uses index futures contracts to a limited extent, with the objectives of maintaining full exposure to the stock market, enhancing returns, maintaining liquidity, and minimizing transaction costs. The fund may purchase futures contracts to immediately invest incoming cash in the market, or sell futures in response to cash outflows, thereby simulating a fully invested position in the underlying index while maintaining a cash balance for liquidity. The fund may seek to enhance returns by using futures contracts instead of the underlying securities when futures are believed to be priced more attractively than the underlying securities. The primary risks associated with the use of futures contracts are imperfect correlation between changes in market values of stocks held by the fund and the prices of futures contracts, and the possibility of an illiquid market.
Futures contracts are valued at their quoted daily settlement prices. The aggregate principal amounts of the contracts are not recorded in the Statement of Net Assets. Fluctuations in the value of the contracts are recorded in the Statement of Net Assets as an asset (liability) and in the Statement of Operations as unrealized appreciation (depreciation) until the contracts are closed, when they are recorded as realized futures gains (losses).
3. Federal Income Taxes: The fund intends to continue to qualify as a regulated investment company and distribute all of its taxable income. Accordingly, no provision for federal income taxes is required in the financial statements.
4. Distributions: Distributions to shareholders are recorded on the ex-dividend date.
5. Security Lending: The fund may lend its securities to qualified institutional borrowers to earn additional income. Security loans are required to be secured at all times by collateral at least equal to the market value of securities loaned. The fund invests cash collateral received in Vanguard Market Liquidity Fund, and records a liability for the return of the collateral, during the period the securities are on loan. Security lending income represents the income earned on investing cash collateral, less expenses associated with the loan.
20
6. Other: Dividend income is recorded on the ex-dividend date. Interest income includes income distributions received from Vanguard Market Liquidity Fund and is accrued daily. Security transactions are accounted for on the date securities are bought or sold. Costs used to determine realized gains (losses) on the sale of investment securities are those of the specific securities sold.
Each class of shares has equal rights as to assets and earnings, except that each class separately bears certain class-specific expenses related to maintenance of shareholder accounts (included in Management and Administrative expenses) and shareholder reporting. Marketing and distribution expenses are allocated to each class of shares based on a method approved by the board of trustees. Income, other non-class-specific expenses, and gains and losses on investments are allocated to each class of shares based on its relative net assets.
B. The Vanguard Group furnishes at cost investment advisory, corporate management, administrative, marketing, and distribution services. The costs of such services are allocated to the fund under methods approved by the board of trustees. The fund has committed to provide up to 0.40% of its net assets in capital contributions to Vanguard. At June 30, 2007, the fund had contributed capital of $11,190,000 to Vanguard (included in Other Assets), representing 0.01% of the fund’s net assets and 11.19% of Vanguard’s capitalization. The fund’s trustees and officers are also directors and officers of Vanguard.
C. Distributions are determined on a tax basis and may differ from net investment income and realized capital gains for financial reporting purposes. Differences may be permanent or temporary. Permanent differences are reclassified among capital accounts in the financial statements to reflect their tax character. Temporary differences arise when certain items of income, expense, gain, or loss are recognized in different periods for financial statement and tax purposes; these differences will reverse at some time in the future. Differences in classification may also result from the treatment of short-term gains as ordinary income for tax purposes.
During the six months ended June 30, 2007, the fund realized $41,585,000 of net capital gains resulting from in-kind redemptions—in which shareholders exchange fund shares for securities held by the fund rather than for cash. Because such gains are not taxable to the fund, and are not distributed to shareholders, they have been reclassified from accumulated net realized losses to paid-in capital.
The fund’s tax-basis capital gains and losses are determined only at the end of each fiscal year. For tax purposes, at December 31, 2006, the fund had available realized losses of $6,571,975,000 to offset future net capital gains of $193,358,000 through December 31, 2008, $890,248,000 through December 31, 2009, $3,087,963,000 through December 31, 2010, $145,498,000 through December 31, 2011, $44,874,000 through December 31, 2012, $757,853,000 through December 31, 2013, $1,156,454,000 through December 31, 2014, and $295,727,000 through December 31, 2015. The fund will use these capital losses to offset net taxable capital gains, if any, realized during the year ending December 31, 2007; should the fund realize net capital losses for the year, the losses will be added to the loss carryforward balances above.
At June 30, 2007, the cost of investment securities for tax purposes was $72,659,638,000. Net unrealized appreciation of investment securities for tax purposes was $53,903,742,000, consisting of unrealized gains of $57,792,785,000 on securities that had risen in value since their purchase and $3,889,043,000 in unrealized losses on securities that had fallen in value since their purchase.
21
At June 30, 2007, the aggregate settlement value of open futures contracts expiring in September 2007 and the related unrealized appreciation (depreciation) were:
| | | ($000) |
| | Aggregate | Unrealized |
| Number of | Settlement | Appreciation |
Futures Contracts | Long Contracts | Value | (Depreciation) |
S&P 500 Index | 690 | 261,407 | 206 |
E-mini S&P 500 Index | 460 | 34,854 | (81) |
Unrealized appreciation (depreciation) on open futures contracts is required to be treated as realized gain (loss) for tax purposes.
D. During the six months ended June 30, 2007, the fund purchased $2,945,168,000 of investment securities and sold $2,607,749,000 of investment securities other than temporary cash investments.
E. The market value of securities on loan to broker-dealers at June 30, 2007, was $149,089,000, for which the fund received cash collateral of $154,551,000.
F. Capital share transactions for each class of shares were:
| Six Months Ended | Year Ended |
| June 30, 2007 | December 31, 2006 |
| Amount | Shares | Amount | Shares |
| ($000) | (000) | ($000) | (000) |
Investor Shares | | | | |
Issued | 4,994,840 | 37,309 | 8,512,324 | 70,581 |
Issued in Lieu of Cash Distributions | 574,577 | 4,249 | 1,161,025 | 9,522 |
Redeemed | (10,571,238) | (78,319) | (16,001,132) | (132,338) |
Net Increase (Decrease)—Investor Shares | (5,001,821) | (36,761) | (6,327,783) | (52,235) |
Admiral Shares | | | | |
Issued | 5,038,295 | 37,363 | 8,509,544 | 70,199 |
Issued in Lieu of Cash Distributions | 380,164 | 2,810 | 682,499 | 5,590 |
Redeemed | (3,776,537) | (27,925) | (6,144,260) | (50,873) |
Net Increase (Decrease)—Admiral Shares | 1,641,922 | 12,248 | 3,047,783 | 24,916 |
Signal Shares | | | | |
Issued | 3,518,771 | 31,450 | 717,342 | 6,636 |
Issued in Lieu of Cash Distributions | 19,498 | 173 | 3,554 | 33 |
Redeemed | (154,658) | (1,379) | (6,450) | (60) |
Net Increase (Decrease)—Signal Shares | 3,383,611 | 30,244 | 714,446 | 6,609 |
G. In June 2006, the Financial Accounting Standards Board issued Interpretation No. 48 (“FIN 48”), “Accounting for Uncertainty in Income Taxes.” FIN 48 establishes the minimum threshold for recognizing, and a system for measuring, the benefits of tax-return positions in financial statements, effective for the fund’s current fiscal year. Management has analyzed the fund’s tax positions taken on federal income tax returns for all open tax years (tax years ended December 31, 2004–2006) for purposes of implementing FIN 48, and has concluded that no provision for income tax is required in the fund’s financial statements.
22
About Your Fund’s Expenses
As a shareholder of the fund, you incur ongoing costs, which include costs for portfolio management, administrative services, and shareholder reports (like this one), among others. Operating expenses, which are deducted from a fund’s gross income, directly reduce the investment return of the fund.
A fund’s expenses are expressed as a percentage of its average net assets. This figure is known as the expense ratio. The following examples are intended to help you understand the ongoing costs (in dollars) of investing in your fund and to compare these costs with those of other mutual funds. The examples are based on an investment of $1,000 made at the beginning of the period shown and held for the entire period.
The table below illustrates your fund’s costs in two ways:
• Based on actual fund return. This section helps you to estimate the actual expenses that you paid over the period. The “Ending Account Value” shown is derived from the fund’s actual return, and the third column shows the dollar amount that would have been paid by an investor who started with $1,000 in the fund. You may use the information here, together with the amount you invested, to estimate the expenses that you paid over the period.
To do so, simply divide your account value by $1,000 (for example, an $8,600 account value divided by $1,000 = 8.6), then multiply the result by the number given for your fund under the heading “Expenses Paid During Period.”
• Based on hypothetical 5% yearly return. This section is intended to help you compare your fund’s costs with those of other mutual funds. It assumes that the fund had a yearly return of 5% before expenses, but that the expense ratio is unchanged. In this case—because the return used is not the fund’s actual return—the results do not apply to your investment. The example is useful in making comparisons because the Securities and Exchange Commission requires all mutual funds to calculate expenses based on a 5% return. You can assess your fund’s costs by comparing this hypothetical example with the hypothetical examples that appear in shareholder reports of other funds.
Six Months Ended June 30, 2007 | | | |
| Beginning | Ending | Expenses |
| Account Value | Account Value | Paid During |
500 Index Fund | 12/31/2006 | 6/30/2007 | Period1 |
Based on Actual Fund Return | | | |
Investor Shares | $1,000.00 | $1,068.75 | $0.82 |
Admiral Shares | 1,000.00 | 1,069.26 | 0.41 |
Signal Shares | 1,000.00 | 1,069.26 | 0.41 |
Based on Hypothetical 5% Yearly Return | | | |
Investor Shares | $1,000.00 | $1,024.00 | $0.80 |
Admiral Shares | 1,000.00 | 1,024.40 | 0.40 |
Signal Shares | 1,000.00 | 1,024.40 | 0.40 |
1. The calculations are based on expenses incurred in the most recent six-month period. The fund’s annualized six-month expense ratios for that period are 0.16% for Investor Shares, 0.08% for Admiral Shares, and 0.08% for Signal Shares. The dollar amounts shown as “Expenses Paid” are equal to the annualized expense ratio multiplied by the average account value over the period, multiplied by the number of days in the most recent six-month period, then divided by the number of days in the most recent 12-month period.
23
Note that the expenses shown in the table on page 23 are meant to highlight and help you compare ongoing costs only and do not reflect transaction costs incurred by the fund for buying and selling securities. Further, the expenses do not include any account service fee described in the prospectus. If such a fee were applied to your account, your costs would be higher. Your fund does not charge transaction fees, such as purchase or redemption fees, nor does it carry a “sales load.”
The calculations assume no shares were bought or sold during the period. Your actual costs may have been higher or lower, depending on the amount of your investment and the timing of any purchases or redemptions.
You can find more information about the fund’s expenses, including annual expense ratios, in the Financial Statements section of this report. For additional information on operating expenses and other shareholder costs, please refer to your fund’s current prospectus.
24
Trustees Approve Advisory Arrangement
The board of trustees of Vanguard 500 Index Fund has renewed the fund’s investment advisory arrangement with The Vanguard Group, Inc. Vanguard—through its Quantitative Equity Group—serves as the investment advisor for the fund. The board determined that continuing the fund’s internalized management structure was in the best interests of the fund and its shareholders.
The board based its decision upon an evaluation of the advisor’s investment staff, portfolio management process, and performance. The trustees considered the factors discussed below, among others. However, no single factor determined whether the board approved the arrangement. Rather, it was the totality of the circumstances that drove the board’s decision.
Nature, extent, and quality of services
The board considered the quality of the fund’s investment management over both short- and long-term periods, and took into account the organizational depth and stability of the advisor. Vanguard has been managing investments for more than two decades. George U. Sauter, Vanguard managing director and chief investment officer, has been in the investment management business since 1985. Mr. Sauter has led the Quantitative Equity Group since 1987. The Quantitative Equity Group adheres to a sound, disciplined investment management process; the team has considerable experience, stability, and depth.
The board concluded that Vanguard’s experience, stability, depth, and performance, among other factors, warranted continuation of the advisory arrangement.
Investment performance
The board considered the short- and long-term performance of the fund, including any periods of outperformance or underperformance of its target benchmark and peer group. The board concluded that the fund has performed in line with expectations, and that its results have been consistent with its investment strategies. Information about the fund’s most recent performance can be found in the Performance Summary section of this report.
Cost
The board concluded that the fund’s expense ratio was far below the average expense ratio charged by funds in its peer group. The board noted that the fund’s advisory expense ratio was also well below its peer-group average. Information about the fund’s expense ratio appears in the About Your Fund’s Expenses section of this report as well as in the Financial Statements section.
The board does not conduct a profitability analysis of Vanguard because of Vanguard’s unique “at-cost” structure. Unlike most other mutual fund management companies, Vanguard is owned by the funds it oversees, and produces “profits” only in the form of reduced expenses for fund shareholders.
The benefit of economies of scale
The board concluded that the fund’s low-cost arrangement with Vanguard ensures that the fund will realize economies of scale as it grows, with the cost to shareholders declining as fund assets increase.
The board will consider whether to renew the advisory arrangement again after a one-year period.
25
Glossary
Beta. A measure of the magnitude of a fund’s past share-price fluctuations in relation to the ups and downs of a given market index. The index is assigned a beta of 1.00. Compared with a given index, a fund with a beta of 1.20 typically would have seen its share price rise or fall by 12% when the index rose or fell by 10%. A fund’s beta should be reviewed in conjunction with its R-squared (see definition below). The lower the R-squared, the less correlation there is between the fund and the index, and the less reliable beta is as an indicator of volatility.
Earnings Growth Rate. The average annual rate of growth in earnings over the past five years for the stocks now in a fund.
Expense Ratio. The percentage of a fund’s average net assets used to pay its annual administrative and advisory expenses. These expenses directly reduce returns to investors.
Foreign Holdings. The percentage of a fund represented by stocks or depositary receipts of companies based outside the United States.
Inception Date. The date on which the assets of a fund (or one of its share classes) are first invested in accordance with the fund’s investment objective. For funds with a subscription period, the inception date is the day after that period ends. Investment performance is measured from the inception date.
Median Market Cap. An indicator of the size of companies in which a fund invests; the midpoint of market capitalization (market price x shares outstanding) of a fund’s stocks, weighted by the proportion of the fund’s assets invested in each stock. Stocks representing half of the fund’s assets have market capitalizations above the median, and the rest are below it.
Price/Book Ratio. The share price of a stock divided by its net worth, or book value, per share. For a fund, the weighted average price/book ratio of the stocks it holds.
Price/Earnings Ratio. The ratio of a stock’s current price to its per-share earnings over the past year. For a fund, the weighted average P/E of the stocks it holds. P/E is an indicator of market expectations about corporate prospects; the higher the P/E, the greater the expectations for a company’s future growth.
R-Squared. A measure of how much of a fund’s past returns can be explained by the returns from the market in general, as measured by a given index. If a fund’s total returns were precisely synchronized with an index’s returns, its R-squared would be 1.00. If the fund’s returns bore no relationship to the index’s returns, its R-squared would be 0.
Return on Equity. The annual average rate of return generated by a company during the past five years for each dollar of shareholder’s equity (net income divided by shareholder’s equity). For a fund, the weighted average return on equity for the companies whose stocks it holds.
Short-Term Reserves. The percentage of a fund invested in highly liquid, short-term securities that can be readily converted to cash.
Turnover Rate. An indication of the fund’s trading activity. Funds with high turnover rates incur higher transaction costs and may be more likely to distribute capital gains (which may be taxable to investors). The turnover rate excludes in-kind transactions, which have minimal impact on costs.
Yield. A snapshot of a fund’s income from interest and dividends. The yield, expressed as a percentage of the fund’s net asset value, is based on income earned over the past 30 days and is annualized, or projected forward for the coming year. The index yield is based on the current annualized rate of income provided by securities in the index.
26
This page intentionally left blank.
The People Who Govern Your Fund
The trustees of your mutual fund are there to see that the fund is operated and managed in your best interests since, as a shareholder, you are a part owner of the fund. Your fund’s trustees also serve on the board of directors of The Vanguard Group, Inc., which is owned by the Vanguard funds and provides services to them on an at-cost basis.
A majority of Vanguard’s board members are independent, meaning that they have no affiliation with Vanguard or the funds they oversee, apart from the sizable personal investments they have made as private individuals.
Our independent board members bring distinguished backgrounds in business, academia, and public service to their task of working with Vanguard officers to establish the policies and oversee the activities of the funds. Among board members’ responsibilities are selecting investment advisors for the funds; monitoring fund operations, performance, and costs; reviewing contracts; nominating and selecting new trustees/directors; and electing Vanguard officers.
Each trustee serves a fund until its termination; or until the trustee’s retirement, resignation, or death; or otherwise as specified in the fund’s organizational documents. Any trustee may be removed at a shareholders’ meeting by a vote representing two-thirds of the net asset value of all shares of the fund together with shares of other Vanguard funds organized within the same trust. The table on these two pages shows information for each trustee and executive officer of the fund. The mailing address of the trustees and officers is P.O. Box 876, Valley Forge, PA 19482.
Chairman of the Board, Chief Executive Officer, and Trustee |
| |
John J. Brennan1 | |
Born 1954 | Principal Occupation(s) During the Past Five Years: Chairman of the Board, Chief |
Trustee since May 1987; | Executive Officer, and Director/Trustee of The Vanguard Group, Inc., and of each |
Chairman of the Board and | of the investment companies served by The Vanguard Group. |
Chief Executive Officer | |
147 Vanguard Funds Overseen | |
| |
Independent Trustees | |
| |
Charles D. Ellis | |
Born 1937 | Principal Occupation(s) During the Past Five Years: Applecore Partners (pro bono |
Trustee since January 2001 | ventures in education); Senior Advisor to Greenwich Associates (international |
147 Vanguard Funds Overseen | business strategy consulting); Successor Trustee of Yale University; Overseer of |
| the Stern School of Business at New York University; Trustee of the Whitehead |
| Institute for Biomedical Research. |
Rajiv L. Gupta | |
Born 1945 | Principal Occupation(s) During the Past Five Years: Chairman and Chief |
Trustee since December 20012 | Executive Officer of Rohm and Haas Co. (chemicals); Board Member of the |
147 Vanguard Funds Overseen | American Chemistry Council;Director of Tyco International, Ltd. (diversified |
| manufacturing and services) since 2005;Trustee of Drexel University and of the |
| Chemical Heritage Foundation. |
Amy Gutmann | |
Born 1949 | Principal Occupation(s) During the Past Five Years: President of the University of |
Trustee since June 2006 | Pennsylvania since 2004; Professor in the School of Arts and Sciences, |
147 Vanguard Funds Overseen | Annenberg School for Communication, and Graduate School of Education of the |
| University of Pennsylvania since 2004; Provost (2001–2004) and Laurance S. |
| Rockefeller Professor of Politics and the University Center for Human Values |
| (1990–2004), Princeton University; Director of Carnegie Corporation of New York |
| since 2005 and of Schuylkill River Development Corporation and Greater |
| Philadelphia Chamber of Commerce since 2004. |
JoAnn Heffernan Heisen | |
Born 1950 | Principal Occupation(s) During the Past Five Years: Corporate Vice President and |
Trustee since July 1998 | Chief Global Diversity Officer since 2006, Vice President and Chief Information |
147 Vanguard Funds Overseen | Officer (1997–2005), and Member of the Executive Committee of Johnson & |
| Johnson (pharmaceuticals/consumer products); Director of the University Medical |
| Center at Princeton and Women’s Research and Education Institute. |
| |
André F. Perold | |
Born 1952 | Principal Occupation(s) During the Past Five Years: George Gund Professor of |
Trustee since December 2004 | Finance and Banking, Harvard Business School; Senior Associate Dean, Director |
147 Vanguard Funds Overseen | of Faculty Recruiting, and Chair of Finance Faculty, Harvard Business School; |
| Director and Chairman of UNX, Inc. (equities trading firm) since 2003; Chair of the |
| Investment Committee of HighVista Strategies LLC (private investment firm) since |
| 2005. |
| |
Alfred M. Rankin, Jr. | |
Born 1941 | Principal Occupation(s) During the Past Five Years: Chairman, President, Chief |
Trustee since January 1993 | Executive Officer, and Director of NACCO Industries, Inc. (forklift |
147 Vanguard Funds Overseen | trucks/housewares/lignite); Director of Goodrich Corporation (industrial |
| products/aircraft systems and services). |
| |
J. Lawrence Wilson | |
Born 1936 | Principal Occupation(s) During the Past Five Years: Retired Chairman and Chief |
Trustee since April 1985 | Executive Officer of Rohm and Haas Co. (chemicals); Director of Cummins Inc. |
147 Vanguard Funds Overseen | (diesel engines) and AmerisourceBergen Corp. (pharmaceutical distribution); |
| Trustee of Vanderbilt University and of Culver Educational Foundation. |
Executive Officers1 | | |
| | |
Heidi Stam | | |
Born 1956 | Principal Occupation(s) During the Past Five Years: Managing Director of The |
Secretary since July 2005 | Vanguard Group, Inc., since 2006; General Counsel of The Vanguard Group since |
147 Vanguard Funds Overseen | 2005; Secretary of The Vanguard Group, and of each of the investment companies |
| served by The Vanguard Group, since 2005; Principal of The Vanguard Group |
| (1997–2006). | |
| | |
Thomas J. Higgins | | |
Born 1957 | Principal Occupation(s) During the Past Five Years: Principal of The Vanguard |
Treasurer since July 1998 | Group, Inc.;Treasurer of each of the investment companies served by The |
147 Vanguard Funds Overseen | Vanguard Group. | |
| | |
Vanguard Senior Management Team | |
| | |
R. Gregory Barton | Kathleen C. Gubanich | Michael S. Miller |
Mortimer J. Buckley | Paul A. Heller | Ralph K. Packard |
James H. Gately | F. William McNabb, III | George U. Sauter |
| | |
Founder | | |
| | |
John C. Bogle | | |
Chairman and Chief Executive Officer, 1974–1996 | |
1 Officers of the funds are “interested persons” as defined in the Investment Company Act of 1940.
2 December 2002 for Vanguard Equity Income Fund, Vanguard Growth Equity Fund, the Vanguard Municipal Bond Funds, and the Vanguard State Tax-Exempt Funds.
More information about the trustees is in the Statement of Additional Information, available from The Vanguard Group.

| Valley Forge, PA 19482-2600 |
Connect with Vanguard® > www.vanguard.com
Fund Information > 800-662-7447 | Vanguard, Admiral, Signal, Connect with Vanguard, and |
| the ship logo are trademarks of The Vanguard Group, |
| Inc. |
Direct Investor Account Services > 800-662-2739 | |
| S&P 500® , Standard & Poor’s 500, and 500 are |
Institutional Investor Services > 800-523-1036 | |
| trademarks of The McGraw-Hill Companies, Inc., and |
Text Telephone for People | have been licensed for use by The Vanguard Group, Inc. |
With Hearing Impairment > 800-952-3335 | Vanguard mutual funds are not sponsored, endorsed, |
| sold, or promoted by Standard & Poor’s, and Standard & |
| Poor’s makes no representation regarding the |
| advisability of investing in the funds. |
This material may be used in conjunction | |
with the offering of shares of any Vanguard | All other marks are the exclusive property of their |
fund only if preceded or accompanied by | |
the fund’s current prospectus. | respective owners. All comparative mutual fund data are |
| from Lipper Inc. or Morningstar, Inc., unless otherwise |
| noted. |
| |
| You can obtain a free copy of Vanguard’s proxy voting |
You can review and copy information about your fund | guidelines by visiting our website, www.vanguard.com, |
at the SEC’s Public Reference Room in Washington, | and searching for “proxy voting guidelines,” or by calling |
D.C.To find out more about this public service, call the | Vanguard at 800-662-2739. They are also available from |
SEC at 202-551-8090. Information about your fund is | the SEC’s website, www.sec.gov. In addition, you may |
also available on the SEC’s website, and you can receive | obtain a free report on how your fund voted the proxies |
copies of this information, for a fee, by sending a | for securities it owned during the 12 months ended June |
request in either of two ways: via e-mail addressed to | 30. To get the report, visit either www.vanguard.com |
publicinfo@sec.gov or via regular mail addressed to the | or www.sec.gov. |
Public Reference Section, Securities and Exchange | |
Commission, Washington, DC 20549-0102. | |
| |
| |
| |
| |
| |
| |
| |
| |
| © 2007 The Vanguard Group, Inc. |
| All rights reserved. |
| Vanguard Marketing Corporation, Distributor. |
| |
| Q402 082007 |
| |
Vanguard® U.S. Stock Index Funds | |
Small-Capitalization Portfolios | |
| |
| |
> Semiannual Report | |
| |
| |
| |
June 30, 2007 | |
| |
| 
|
| | |
| | |
| Vanguard Small-Cap Index Fund | |
| | |
| Vanguard Small-Cap Growth Index Fund | |
| | |
| Vanguard Small-Cap Value Index Fund | |
| | |
| | |
| | |
| | |
| | |
| | |
| | |
| | |
| | |
| | |
| | |
| | |
| | |
| | |
| | |
| | | |
> | For the six months ended June 30, 2007, Vanguard Small-Cap Index Fund returned 9.2%, the Small-Cap Growth Index Fund returned 13.4%, and the Small-Cap Value Index Fund returned 5.0%, in each case for Investor Shares. |
> | The returns of small-capitalization stocks lagged those of their large- and mid-cap counterparts. In a turnaround from recent years, growth stocks generally outperformed value stocks. |
> | The three funds met their objectives of closely tracking their target indexes. The Small-Cap Value Fund was the only one that lagged the average return of its peers. |
Contents | |
| |
Your Fund’s Total Returns | 1 |
Chairman’s Letter | 2 |
Small-Cap Index Fund | 8 |
Small-Cap Growth Index Fund | 25 |
Small-Cap Value Index Fund | 39 |
About Your Fund’s Expenses | 53 |
Trustees Approve Advisory Arrangement | 55 |
Glossary | 56 |

Small-Cap Index Fund
Small-Cap Growth Index Fund
Small-Cap Value Index Fund
Please note: The opinions expressed in this report are just that—informed opinions. They should not be considered promises or advice. Also, please keep in mind that the information and opinions cover the period through the date on the cover of this report. Of course, the risks of investing in your fund are spelled out in the prospectus.
Your Fund’s Total Returns
Six Months Ended June 30, 2007 | | |
| | Ticker | Total |
| | Symbol | Returns |
Vanguard Small-Cap Index Fund | | |
| Investor Shares | NAESX | 9.2% |
| Admiral™ Shares1 | VSMAX | 9.2 |
| Signal™ Shares2 | VSISX | 9.2 |
| Institutional Shares3 | VSCIX | 9.2 |
| ETF Shares4 | VB | |
| Market Price | | 9.3 |
| Net Asset Value | | 9.2 |
MSCI US Small Cap 1750 Index | | 9.2 |
Average Small-Cap Core Fund5 | | 8.3 |
| | | |
Vanguard Small-Cap Growth Index Fund | | |
| Investor Shares | VISGX | 13.4% |
| Institutional Shares | VSGIX | 13.5 |
| ETF Shares | VBK | |
| Market Price | | 13.6 |
| Net Asset Value | | 13.5 |
MSCI US Small Cap Growth Index | | 13.5 |
Average Small-Cap Growth Fund5 | | 11.0 |
| | | |
Vanguard Small-Cap Value Index Fund | | |
| Investor Shares | VISVX | 5.0% |
| Institutional Shares | VSIIX | 5.1 |
| ETF Shares | VBR | |
| Market Price | | 5.2 |
| Net Asset Value | | 5.0 |
MSCI US Small Cap Value Index | | 5.0 |
Average Small-Cap Value Fund5 | | 7.7 |
1 A lower-cost class of shares available to many longtime shareholders and to those with significant investments in the fund.
2 Signal Shares also carry lower costs and are available to certain Institutional shareholders who meet specific administrative, service, and account-size criteria.
3 This class of shares also carries low expenses and is available for a minimum initial investment of $5 million.
4 Vanguard ETF shares are traded on the American Stock Exchange and are available only through brokers. The table shows ETF returns based on both the AMEX market price and the net asset value for a share. U.S. Pat. No. 6,879,964 B2.
5 Derived from data provided by Lipper Inc.
1

Chairman’s Letter
Dear Shareholder,
In the first half of 2007, Vanguard’s three small-capitalization index funds met the goal of closely tracking their respective indexes. Each fund captured the vast majority of its target benchmark’s return.
The Investor Shares of Vanguard Small-Cap Index Fund returned 9.2% and outpaced the average return of competing funds. The Investor Shares of the Small-Cap Growth Index and Small-Cap Value Index Funds returned 13.4% and 5.0%, respectively. The growth fund surpassed the average result of its competitive group, but the value fund fell short of its average peer by a couple of percentage points.
Stock market’s ascent was driven by global liquidity
The broad U.S. stock market notched impressive gains in the year’s first half, when an abundance of cash drove record numbers of mergers and acquisitions around the globe. The gains came amid increased volatility. In February, markets worldwide fell sharply following a sell-off in China, only to recover quickly and continue upward. The six-month period closed with two dips in June, owing to real-estate woes and inflation concerns.
The best performers in the U.S. market were the so-called mega-caps—broadly diversified companies that are well-positioned to weather periods of economic transition. International stocks, particularly those in emerging markets, outperformed U.S. equities. The euro and the British
2
pound appreciated against the dollar, further enhancing gains for Americans investing abroad.
Bond investors were hobbled by a shift in sentiment
The relationship between yield and maturity returned to normal during the past six months, as yields of intermediate-and longer-term bonds moved higher than short-term yields. The accompanying drop in prices was steepest for long-term and intermediate-term bonds.
Earlier in the year, bond yields seemed to reflect an assumption that the Federal Reserve Board might cut interest rates in response to weaker economic growth. As the year progressed, inflationary pressures and economic growth looked more substantial, producing a change in market sentiment, which resulted in higher yields and lower prices.
The broad taxable bond market returned 1.0% for the period, while municipal bonds posted a return of 0.1%. The Citigroup 3-Month Treasury Bill Index—a proxy for money market yields—returned 2.5% for the half-year.
Growth stocks were stronger than value stocks in the period
During the period, small-cap stocks lost some of the momentum that had been driving their solid performance over the past few years. They were beaten out by the returns of large- and mid-cap stocks, as investors seemed drawn to the relative safety that more established companies provided.
Market Barometer | | | |
| | | Total Returns |
| | Periods Ended June 30, 2007 |
| Six Months | One Year | Five Years1 |
Stocks | | | |
Russell 1000 Index (Large-caps) | 7.2% | 20.4% | 11.3% |
Russell 2000 Index (Small-caps) | 6.4 | 16.4 | 13.9 |
Dow Jones Wilshire 5000 Index (Entire market) | 7.6 | 20.4 | 12.0 |
MSCI All Country World Index ex USA (International) | 12.6 | 30.1 | 19.9 |
| | | |
Bonds | | | |
Lehman U.S. Aggregate Bond Index (Broad taxable market) | 1.0% | 6.1% | 4.5% |
Lehman Municipal Bond Index | 0.1 | 4.7 | 4.6 |
Citigroup 3-Month Treasury Bill Index | 2.5 | 5.1 | 2.7 |
| | | |
CPI | | | |
Consumer Price Index | 3.2% | 2.7% | 3.0% |
| | | | |
1 Annualized.
3
In general, the differences in the funds’ returns were due to their varying weightings of industry groups, some of which did better than others. With one noteworthy exception, each of the ten sectors represented in the Vanguard Small-Cap Index Funds recorded positive returns during the half-year. That exception was the financials sector; the group represented more than one-third of the target index of the Small-Cap Value Index Fund, for example, and had a return of –5.4%, shaving close to 2 percentage points from the index’s—and thus the fund’s—performance.
The Small-Cap Growth Index Fund, with a 13.4% return for its Investor Shares, benefited from the solid results of the industrials and energy stocks in its target index. Industrials stocks profited from strong demand for machinery and strength in transportation services, including railroads and trucking companies. Energy stocks were, of course, aided by the continued strength of global demand for energy and oil-based products. Materials stocks, particularly those associated with metals and mining, also performed quite well, but the impact was less because of their relatively small weighting in the index.
Annualized Expense Ratios1 | |
Your fund compared with its peer group | |
| |
| Expense |
| Ratio |
Small-Cap Index Fund | |
Investor Shares | 0.22% |
Admiral Shares | 0.12 |
Signal Shares | 0.12 |
Institutional Shares | 0.07 |
ETF Shares | 0.10 |
Average Small-Cap Core Fund | 1.50 |
| |
Small-Cap Growth Index Fund | |
Investor Shares | 0.22% |
Institutional Shares | 0.07 |
ETF Shares | 0.12 |
Average Small-Cap Growth Fund | 1.64 |
| |
Small-Cap Value Index Fund | |
Investor Shares | 0.22% |
Institutional Shares | 0.07 |
ETF Shares | 0.12 |
Average Small-Cap Value Fund | 1.54 |
1 The fund expense ratios reflect the six-months ended June 30, 2007. Peer-group expense ratios are derived from data provided by Lipper Inc. and capture information through year-end 2006.
4
The Small-Cap Value Index Fund, with a return of 5.0% for its Investor Shares, benefited most from strength in industrials, materials, and information technology stocks. Energy stocks also made a sizable contribution to return, despite their small index representation. As noted earlier, the fund was hampered by the weakness of financials stocks—many of them affected by the turmoil in the subprime lending market as well as by uncertainty about the future course of interest rates. The fund’s consumer discretionary holdings also did poorly, as businesses that rely on the weakened real-estate market provided disappointing returns.
The Small-Cap Index Fund, which represents the union of the growth and value styles characterized by the other two funds, posted a 9.2% return, essentially occupying the midpoint between their six-month results.
Each of the three Small-Cap Index Funds very closely tracked its target index, an accomplishment made possible by the talents of the indexing team in Vanguard’s Quantitative Equity Group, which manages the funds. The funds’ close tracking of their respective benchmarks is also aided by their extremely low expense ratios, which allow them to pass along a greater portion of their returns to shareholders.
Small-cap exposure can enhance portfolio diversification
Small-cap stocks respond somewhat differently to the systemic forces and trade dynamics that drive the broad market. In contrast to larger companies, for example, the success of small-cap companies often depends on one product or service that can make or break their businesses. With less capital and resources, these businesses may be more vulnerable to periods of economic weakness than the market’s giants are.
For the long-term investor, however, these differences present an opportunity to diversify a stock portfolio that may be made up mostly of large-cap holdings. Gaining exposure to smaller companies through a broadly diversified mutual fund—such as one of the Small-Cap Index Funds—can be appealing if you already hold a balanced and diversified portfolio that includes stocks, bonds, and cash investments in proportions appropriate for your risk tolerance and objectives.
Thank you for investing with Vanguard.
Sincerely,

John J. Brennan
Chairman and Chief Executive Officer
July 18, 2007
5
Your Fund’s Performance at a Glance |
December 31, 2006–June 30, 2007 | | | | |
| | | Distributions Per Share |
| Starting | Ending | Income | Capital |
| Share Price | Share Price | Dividends | Gains |
Small-Cap Index Fund | | | | |
Investor Shares | $32.62 | $35.61 | $0.006 | $0.000 |
Admiral Shares | 32.64 | 35.64 | 0.007 | 0.000 |
Signal Shares | 29.42 | 32.13 | 0.005 | 0.000 |
Institutional Shares | 32.65 | 35.66 | 0.007 | 0.000 |
ETF Shares | 68.16 | 74.44 | 0.014 | 0.000 |
Small-Cap Growth Index Fund | | | | |
Investor Shares | $18.34 | $20.80 | $0.002 | $0.000 |
Institutional Shares | 18.37 | 20.85 | 0.003 | 0.000 |
ETF Shares | 65.24 | 74.04 | 0.010 | 0.000 |
Small-Cap Value Index Fund | | | | |
Investor Shares | $17.05 | $17.89 | $0.013 | $0.000 |
Institutional Shares | 17.09 | 17.94 | 0.014 | 0.000 |
ETF Shares | 71.16 | 74.68 | 0.058 | 0.000 |
| | | | | |
6
Small-Cap ETF | | | | |
Premium/Discount: January 26, 20041–June 30, 2007 | | | |
| | | | |
| Market Price Above or | Market Price Below |
| Equal to Net Asset Value | | Net Asset Value |
| Number | Percentage | Number | Percentage |
Basis Point Differential2 | of Days | of Total Days | of Days | of Total Days |
0–24.9 | 337 | 38.95% | 510 | 58.95% |
25–49.9 | 1 | 0.12 | 14 | 1.62 |
50–74.9 | 0 | 0.00 | 0 | 0.00 |
75–100.0 | 0 | 0.00 | 1 | 0.12 |
>100.0 | 1 | 0.12 | 1 | 0.12 |
Total | 339 | 39.19% | 526 | 60.81% |
| | | | | |
Small-Cap Growth ETF | | | | |
Premium/Discount: January 26, 20041–June 30, 2007 | | | |
| | | | |
| Market Price Above or | Market Price Below |
| Equal to Net Asset Value | | Net Asset Value |
| Number | Percentage | Number | Percentage |
Basis Point Differential2 | of Days | of Total Days | of Days | of Total Days |
0–24.9 | 354 | 40.92% | 482 | 55.73% |
25–49.9 | 1 | 0.12 | 15 | 1.73 |
50–74.9 | 0 | 0.00 | 1 | 0.12 |
75–100.0 | 0 | 0.00 | 2 | 0.23 |
>100.0 | 2 | 0.23 | 8 | 0.92 |
Total | 357 | 41.27% | 508 | 58.73% |
| | | | | |
Small-Cap Value ETF | | | | |
Premium/Discount: January 26, 20041–June 30, 2007 | | | |
| | | | |
| Market Price Above or | Market Price Below |
| Equal to Net Asset Value | | Net Asset Value |
| Number | Percentage | Number | Percentage |
Basis Point Differential2 | of Days | of Total Days | of Days | of Total Days |
0–24.9 | 373 | 43.12% | 475 | 54.91% |
25–49.9 | 1 | 0.12 | 15 | 1.73 |
50–74.9 | 0 | 0.00 | 1 | 0.12 |
75–100.0 | 0 | 0.00 | 0 | 0.00 |
>100.0 | 0 | 0.00 | 0 | 0.00 |
Total | 374 | 43.24% | 491 | 56.76% |
| | | | | |
1 Inception.
2 One basis point equals 1/100 of a percentage point.
7
Vanguard Small-Cap Index Fund
Fund Profile
As of June 30, 2007
Portfolio Characteristics | | |
| | Target | Broad |
| Fund | Index1 | Index2 |
Number of Stocks | 1,728 | 1,721 | 4,921 |
Median Market Cap | $1.8B | $1.8B | $32.6B |
Price/Earnings Ratio | 24.0x | 24.0x | 18.2x |
Price/Book Ratio | 2.5x | 2.5x | 2.9x |
Yield | | 1.2% | 1.7% |
Investor Shares | 1.1% | | |
Admiral Shares | 1.2% | | |
Signal Shares | 1.2% | | |
Institutional Shares | 1.3% | | |
ETF Shares | 1.2% | | |
Return on Equity | 11.8% | 11.8% | 18.2% |
Earnings Growth Rate | 17.8% | 17.8% | 20.7% |
Foreign Holdings | 0.7% | 0.7% | 0.0% |
Turnover Rate | 16%3 | — | — |
Expense Ratio | | — | — |
Investor Shares | 0.22%3 | | |
Admiral Shares | 0.12%3 | | |
Signal Shares | 0.12%3 | | |
Institutional Shares | 0.07%3 | | |
ETF Shares | 0.10%3 | | |
Short-Term Reserves | 0% | — | — |
Sector Diversification (% of portfolio) | |
| | Target | Broad |
| Fund | Index1 | Index2 |
Consumer Discretionary | 15% | 15% | 12% |
Consumer Staples | 3 | 3 | 8 |
Energy | 8 | 8 | 10 |
Financials | 19 | 19 | 21 |
Health Care | 10 | 10 | 11 |
Industrials | 17 | 17 | 12 |
Information Technology | 17 | 17 | 15 |
Materials | 6 | 6 | 4 |
Telecommunication | | | |
Services | 1 | 1 | 3 |
Utilities | 4 | 4 | 4 |
Volatility Measures4 | |
| Fund Versus | Fund Versus |
| Target Index1 | Broad Index2 |
R-Squared | 1.00 | 0.87 |
Beta | 1.00 | 1.42 |
Ten Largest Holdings5 (% of total net assets) |
| | |
The Manitowoc Co., Inc. | construction and farm machinery and heavy trucks | 0.2% |
Cytyc Corp. | health care equipment | 0.2 |
ITT Educational Services, Inc. | education services | 0.2 |
Frontier Oil Corp. | oil and gas refining and marketing | 0.2 |
aQuantive, Inc. | Internet software and services | 0.2 |
Dade Behring Holdings Inc. | health care equipment | 0.2 |
Denbury Resources, Inc. | oil and gas exploration and production | 0.2 |
Lubrizol Corp. | specialty chemicals | 0.2 |
Harsco Corp. | industrial machinery | 0.2 |
Flowserve Corp. | industrial machinery | 0.2 |
Top Ten | | 2.0% |
Investment Focus
1 MSCI US Small Cap 1750 Index.
2 Dow Jones Wilshire 5000 Index.
3 Annualized.
4 For an explanation of R-squared, beta, and other terms used here, see the Glossary on page 56.
5 “Ten Largest Holdings” excludes any temporary cash investments and equity index products.
8
Vanguard Small Cap Index Fund
Performance Summary
All of the returns in this report represent past performance, which is not a guarantee of future results that may be achieved by the fund. (Current performance may be lower or higher than the performance data cited. For performance data current to the most recent month-end, visit our website at www.vanguard.com/performance.) Note, too, that both investment returns and principal value can fluctuate widely, so an investor’s shares, when sold, could be worth more or less than their original cost. The returns shown do not reflect taxes that a shareholder would pay on fund distributions or on the sale of fund shares.
Fiscal-Year Total Returns (%): December 31, 1996–June 30, 2007
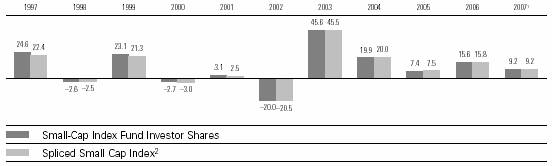
Average Annual Total Returns: Periods Ended June 30, 2007 |
| | | | |
| Inception Date | One Year | Five Years | Ten Years |
Investor Shares3 | 10/3/1960 | 18.12% | 14.58% | 9.79% |
Admiral Shares | 11/13/2000 | 18.25 | 14.70 | 11.014 |
Signal Shares | 12/15/2006 | 8.334 | — | — |
Institutional Shares | 7/7/1997 | 18.25 | 14.76 | 9.944 |
ETF Shares | 1/26/2004 | | | |
Market Price | | 18.68 | 13.054 | — |
Net Asset Value | | 18.25 | 13.054 | — |
1 Six months ended June 30, 2007.
2 Russell 2000 Index through May 16, 2003; MSCI US Small Cap 1750 Index thereafter.
3 Total returns do not include the account service fee that may be applicable to certain accounts with balances below $10,000.
4 Since inception.
Note: See Financial Highlights tables on pages 16 through 20 for dividend and capital gains information.
9
Vanguard Small-Cap Index Fund
Financial Statements (unaudited)
Statement of Net Assets—Investments Summary
As of June 30, 2007
This Statement summarizes the fund’s holdings by asset type (common stocks, bonds, etc.) and by industry sector. Details are reported for each of the fund’s 50 largest individual holdings and for investments that, in total for any issuer, represent more than 1% of the fund’s net assets. The total value of smaller holdings is reported as a single amount within each category.
The fund provides a complete list of its holdings four times in each fiscal year, at the quarter-ends. For the second and fourth fiscal quarters, the complete listing of the fund’s holdings is available electronically on Vanguard.com and on the Securities and Exchange Commission’s website (www.sec.gov), or you can have it mailed to you without charge by calling 800-662-7447. For the first and third fiscal quarters, the fund files the lists with the SEC on Form N-Q. Shareholders can look up the fund’s Forms N-Q on the SEC’s website. Forms N-Q may also be reviewed and copied at the SEC’s Public Reference Room (see the back cover of this report for further information).
| | | Market | Percentage |
| | | Value• | of Net |
| | Shares | ($000) | Assets |
Common Stocks | | | |
Consumer Discretionary | | | |
* | ITT Educational Services, Inc. | 328,613 | 38,573 | 0.2% |
| Service Corp. International | 2,325,567 | 29,721 | 0.2% |
| Phillips-Van Heusen Corp. | 439,966 | 26,649 | 0.2% |
† | Other—Consumer Discretionary | | 2,244,341 | 14.3% |
| | | 2,339,284 | 14.9% |
Consumer Staples | | | |
| J.M. Smucker Co. | 428,659 | 27,288 | 0.2% |
*^ | Rite Aid Corp. | 4,227,638 | 26,972 | 0.2% |
| Corn Products International, Inc. | 589,675 | 26,801 | 0.2% |
† | Other—Consumer Staples | | 441,095 | 2.7% |
| | | 522,156 | 3.3% |
Energy | | | |
| Frontier Oil Corp. | 876,461 | 38,363 | 0.2% |
* | Denbury Resources, Inc. | 953,329 | 35,750 | 0.2% |
| Tidewater Inc. | 433,758 | 30,745 | 0.2% |
| Helmerich & Payne, Inc. | 835,648 | 29,599 | 0.2% |
* | Plains Exploration & Production Co. | 609,362 | 29,134 | 0.2% |
| Holly Corp. | 379,089 | 28,125 | 0.2% |
* | Helix Energy Solutions Group, Inc. | 704,524 | 28,118 | 0.2% |
| Cabot Oil & Gas Corp. | 760,697 | 28,055 | 0.2% |
* | Superior Energy Services, Inc. | 675,136 | 26,951 | 0.2% |
† | Other—Energy | | 896,535 | 5.6% |
| | | 1,171,375 | 7.4% |
Financials | | | |
| Jones Lang LaSalle Inc. | 290,122 | 32,929 | 0.2% |
*^ | Affiliated Managers Group, Inc. | 239,823 | 30,880 | 0.2% |
| Annaly Mortgage Management Inc. REIT | 2,028,429 | 29,250 | 0.2% |
| Rayonier Inc. REIT | 608,909 | 27,486 | 0.2% |
† | Other—Financials | | 2,846,238 | 18.0% |
| | | 2,966,783 | 18.8% |
10
Vanguard Small Cap Index Fund
| | | Market | Percentage |
| | | Value• | of Net |
| | Shares | ($000) | Assets |
Health Care | | | |
* | Cytyc Corp. | 894,785 | 38,574 | 0.3% |
| Dade Behring Holdings Inc. | 681,864 | 36,221 | 0.2% |
† | Other—Health Care | | 1,528,436 | 9.7% |
| | | 1,603,231 | 10.2% |
Industrials | | | |
| The Manitowoc Co., Inc. | 489,346 | 39,334 | 0.2% |
| Harsco Corp. | 666,877 | 34,678 | 0.2% |
| Flowserve Corp. | 461,933 | 33,074 | 0.2% |
* | AGCO Corp. | 724,204 | 31,438 | 0.2% |
* | Stericycle, Inc. | 705,110 | 31,349 | 0.2% |
* | General Cable Corp. | 409,844 | 31,046 | 0.2% |
* | Corrections Corp. of America | 482,405 | 30,445 | 0.2% |
* | BE Aerospace, Inc. | 718,285 | 29,665 | 0.2% |
* | Shaw Group, Inc. | 639,456 | 29,600 | 0.2% |
* | Quanta Services, Inc. | 934,173 | 28,651 | 0.2% |
* | Thomas & Betts Corp. | 475,824 | 27,598 | 0.2% |
| Trinity Industries, Inc. | 633,665 | 27,590 | 0.2% |
† | Other—Industrials | | 2,310,539 | 14.6% |
| | | 2,685,007 | 17.0% |
Information Technology | | | |
* | aQuantive, Inc. | 585,676 | 37,366 | 0.2% |
* | Synopsys, Inc. | 1,144,348 | 30,245 | 0.2% |
* | Trimble Navigation Ltd. | 930,121 | 29,950 | 0.2% |
* | Mettler-Toledo International Inc. | 312,190 | 29,817 | 0.2% |
* | CommScope, Inc. | 473,599 | 27,635 | 0.2% |
| Diebold, Inc. | 519,598 | 27,123 | 0.2% |
* | Cypress Semiconductor Corp. | 1,142,880 | 26,618 | 0.2% |
† | Other—Information Technology | | 2,418,025 | 15.3% |
| | | 2,626,779 | 16.7% |
Materials | | | |
| Lubrizol Corp. | 546,579 | 35,282 | 0.2% |
* | AK Steel Holding Corp. | 875,972 | 32,735 | 0.2% |
| Nalco Holding Co. | 1,136,328 | 31,192 | 0.2% |
| Reliance Steel & Aluminum Co. | 539,975 | 30,379 | 0.2% |
| Commercial Metals Co. | 892,114 | 30,127 | 0.2% |
| Airgas, Inc. | 557,751 | 26,716 | 0.2% |
† | Other—-Materials | | 763,493 | 4.8% |
| | | 949,924 | 6.0% |
| | | | |
† Telecommunication Services | | 177,670 | 1.1% |
| | | | |
Utilities | | | |
* | Sierra Pacific Resources | 1,755,117 | 30,820 | 0.2% |
| CMS Energy Corp. | 1,766,995 | 30,392 | 0.2% |
| Energen Corp. | 546,111 | 30,003 | 0.2% |
| National Fuel Gas Co. | 629,457 | 27,262 | 0.2% |
† | Other—Utilities | | 505,526 | 3.2% |
| | | 624,003 | 4.0% |
Total Common Stocks (Cost $11,340,804) | | 15,666,212 | 99.4%1 |
11
Vanguard Small-Cap Index Fund
| | Market | Percentage |
| | Value• | of Net |
| Shares | ($000) | Assets |
| | | |
Temporary Cash Investments | | | |
Money Market Fund | | | |
2 Vanguard Market Liquidity Fund, 5.281% | 93,760,714 | 93,761 | 0.6% |
2 Vanguard Market Liquidity Fund, 5.281%—Note E | 972,772,841 | 972,773 | 6.2% |
| | 1,066,534 | 6.8% |
| | | |
†3U.S. Agency Obligation | | 3,899 | 0.0% |
Total Temporary Cash Investments (Cost $1,070,433) | | 1,070,433 | 6.8%1 |
Total Investments (Cost $12,411,237) | | 16,736,645 | 106.2% |
Other Assets and Liabilities | | | |
Other Assets—Note B | | 75,625 | 0.5% |
Security Lending Collateral Payable to Brokers—Note E | | (972,773) | (6.2%) |
Other Liabilities | | (85,251) | (0.5%) |
| | (982,399) | (6.2%) |
Net Assets | | 15,754,246 | 100.0% |
At June 30, 2007, net assets consisted of:4 | |
| Amount |
| ($000) |
Paid-in Capital | 11,797,453 |
Undistributed Net Investment Income | 76,104 |
Accumulated Net Realized Losses | (445,899) |
Unrealized Appreciation | |
Investment Securities | 4,325,408 |
Futures Contracts | 1,180 |
Net Assets | 15,754,246 |
| |
Investor Shares—Net Assets | |
Applicable to 202,675,049 outstanding $.001 par value shares of | |
beneficial interest (unlimited authorization) | 7,217,220 |
Net Asset Value Per Share—Investor Shares | $35.61 |
| |
Admiral Shares—Net Assets | |
Applicable to 101,071,529 outstanding $.001 par value shares of | |
beneficial interest (unlimited authorization) | 3,602,081 |
Net Asset Value Per Share—Admiral Shares | $35.64 |
12
Vanguard Small Cap Index Fund
| Amount |
| ($000) |
Signal Shares—Net Assets | |
Applicable to 10,279,810 outstanding $.001 par value shares of | |
beneficial interest (unlimited authorization) | 330,296 |
Net Asset Value Per Share—Signal Shares | $32.13 |
| |
Institutional Shares—Net Assets | |
Applicable to 102,641,228 outstanding $.001 par value shares of | |
beneficial interest (unlimited authorization) | 3,660,560 |
Net Asset Value Per Share—Institutional Shares | $35.66 |
| |
ETF Shares—Net Assets | |
Applicable to 12,683,067 outstanding $.001 par value shares of | |
beneficial interest (unlimited authorization) | 944,089 |
Net Asset Value Per Share—ETF Shares | $74.44 |
• | See Note A in Notes to Financial Statements. |
* | Non-income-producing security. |
^ | Part of security position is on loan to broker-dealers. See Note E in Notes to Financial Statements. |
† Represents the aggregate value, by category, of securities that are not among the 50 largest holdings and, in total for any issuer, represent 1% or less of net assets.
1 The fund invests a portion of its cash reserves in equity markets through the use of index futures contracts. After giving effect to futures investments, the fund’s effective common stock and temporary cash investment positions represent 100.0% and 6.2%, respectively, of net assets. See Note C in Notes to Financial Statements.
2 Affiliated money market fund available only to Vanguard funds and certain trusts and accounts managed by Vanguard. Rate shown is the 7-day yield.
3 Securities with a value of $3,899,000 have been segregated as initial margin for open futures contracts.
4 See Note C in Notes to Financial Statements for the tax-basis components of net assets.
REIT—Real Estate Investment Trust.
13
Vanguard Small-Cap Index Fund
Statement of Operations
| Six Months Ended |
| June 30, 2007 |
| ($000) |
Investment Income | |
Income | |
Dividends | 92,894 |
Interest1 | 1,638 |
Security Lending | 7,694 |
Total Income | 102,226 |
Expenses | |
The Vanguard Group—Note B | |
Investment Advisory Services | 277 |
Management and Administrative | |
Investor Shares | 6,570 |
Admiral Shares | 1,505 |
Signal Shares | 113 |
Institutional Shares | 625 |
ETF Shares | 245 |
Marketing and Distribution | |
Investor Shares | 836 |
Admiral Shares | 369 |
Signal Shares | 11 |
Institutional Shares | 431 |
ETF Shares | 98 |
Custodian Fees | 292 |
Shareholders’ Reports | |
Investor Shares | 90 |
Admiral Shares | 6 |
Signal Shares | 7 |
Institutional Shares | 11 |
ETF Shares | 10 |
Trustees’ Fees and Expenses | 9 |
Total Expenses | 11,505 |
Net Investment Income | 90,721 |
Realized Net Gain (Loss) | |
Investment Securities Sold | 582,326 |
Futures Contracts | (1,833) |
Realized Net Gain (Loss) | 580,493 |
Change in Unrealized Appreciation (Depreciation) | |
Investment Securities | 636,450 |
Futures Contracts | 1,217 |
Change in Unrealized Appreciation (Depreciation) | 637,667 |
Net Increase (Decrease) in Net Assets Resulting From Operations | 1,308,881 |
1 Interest income from an affiliated company of the fund was $1,549,000.
14
Vanguard Small-Cap Index Fund
Statement of Changes in Net Assets
| Six Months Ended | Year Ended |
| June 30, | December 31, |
| 2007 | 2006 |
| ($000) | ($000) |
Increase (Decrease) in Net Assets | | |
Operations | | |
Net Investment Income | 90,721 | 156,255 |
Realized Net Gain (Loss) | 580,493 | 674,364 |
Change in Unrealized Appreciation (Depreciation) | 637,667 | 929,905 |
Net Increase (Decrease) in Net Assets Resulting from Operations | 1,308,881 | 1,760,524 |
Distributions | | |
Net Investment Income | | |
Investor Shares | (1,253) | (74,014) |
Admiral Shares | (690) | (36,085) |
Signal Shares | (27) | (1,656) |
Institutional Shares | (689) | (37,704) |
ETF Shares | (158) | (8,004) |
Realized Capital Gain | | |
Investor Shares | — | — |
Admiral Shares | — | — |
Signal Shares | — | — |
Institutional Shares | — | — |
ETF Shares | — | — |
Total Distributions | (2,817) | (157,463) |
Capital Share Transactions—Note F | | |
Investor Shares | (212,883) | 54,559 |
Admiral Shares | 229,107 | 332,227 |
Signal Shares | 128,323 | 159,629 |
Institutional Shares | 257,214 | 682,549 |
ETF Shares | 226,312 | 349,999 |
Net Increase (Decrease) from Capital Share Transactions | 628,073 | 1,578,963 |
Total Increase (Decrease) | 1,934,137 | 3,182,024 |
Net Assets | | |
Beginning of Period | 13,820,109 | 10,638,085 |
End of Period1 | 15,754,246 | 13,820,109 |
1 Net Assets—End of Period includes undistributed (overdistributed) net investment income of $76,104,000 and ($11,800,000).
15
Vanguard Small-Cap Index Fund
Financial Highlights
Investor Shares | | | | | | |
| Six Months | | | | | |
| Ended | | | |
For a Share Outstanding | June 30, | Year Ended December 31, |
Throughout Each Period | 2007 | 2006 | 2005 | 2004 | 2003 | 2002 |
Net Asset Value, Beginning of Period | $32.62 | $28.52 | $26.83 | $22.60 | $15.66 | $19.82 |
Investment Operations | | | | | | |
Net Investment Income | .194 | .357 | .29 | .267 | .200 | .192 |
Net Realized and Unrealized Gain | | | | | | |
(Loss) on Investments | 2.802 | 4.101 | 1.69 | 4.228 | 6.944 | (4.160) |
Total from Investment Operations | 2.996 | 4.458 | 1.98 | 4.495 | 7.144 | (3.968) |
Distributions | | | | | | |
Dividends from Net Investment Income | (.006) | (.358) | (.29) | (.265) | (.204) | (.192) |
Distributions from Realized Capital Gains | — | — | — | — | — | — |
Total Distributions | (.006) | (.358) | (.29) | (.265) | (.204) | (.192) |
Net Asset Value, End of Period | $35.61 | $32.62 | $28.52 | $26.83 | $22.60 | $15.66 |
| | | | | | |
Total Return1 | 9.19% | 15.64% | 7.36% | 19.90% | 45.63% | –20.02% |
| | | | | | |
Ratios/Supplemental Data | | | | | | |
Net Assets, End of Period (Millions) | $7,217 | $6,808 | $5,902 | $6,247 | $4,871 | $2,943 |
Ratio of Total Expenses to | | | | | | |
Average Net Assets | 0.22%* | 0.23% | 0.23% | 0.23% | 0.27% | 0.27% |
Ratio of Net Investment | | | | | | |
Income to Average Net Assets | 1.16%* | 1.18% | 1.08% | 1.13% | 1.17% | 1.11% |
Portfolio Turnover Rate2 | 16%* | 13% | 18% | 19% | 39%3 | 32% |
1 Total returns do not include the account service fee that may be applicable to certain accounts with balances below $10,000.
2 Excludes the value of portfolio securities received or delivered as a result of in-kind purchases or redemptions of the fund’s capital shares, including ETF Creation Units.
3 Includes activity related to a change in the fund’s target index.
16
Vanguard Small-Cap Index Fund
Admiral Shares | | | | | | |
| Six Months | | | | | |
| Ended | | | |
For a Share Outstanding | June 30, | Year Ended December 31, |
Throughout Each Period | 2007 | 2006 | 2005 | 2004 | 2003 | 2002 |
Net Asset Value, Beginning of Period | $32.64 | $28.53 | $26.83 | $22.60 | $15.66 | $19.82 |
Investment Operations | | | | | | |
Net Investment Income | .205 | .395 | .325 | .294 | .220 | .207 |
Net Realized and Unrealized Gain | | | | | | |
(Loss) on Investments | 2.802 | 4.101 | 1.690 | 4.228 | 6.944 | (4.160) |
Total from Investment Operations | 3.007 | 4.496 | 2.015 | 4.522 | 7.164 | (3.953) |
Distributions | | | | | | |
Dividends from Net Investment Income | (.007) | (.386) | (.315) | (.292) | (.224) | (.207) |
Distributions from Realized Capital Gains | — | — | — | — | — | — |
Total Distributions | (.007) | (.386) | (.315) | (.292) | (.224) | (.207) |
Net Asset Value, End of Period | $35.64 | $32.64 | $28.53 | $26.83 | $22.60 | $15.66 |
| | | | | | |
Total Return | 9.21% | 15.77% | 7.49% | 20.02% | 45.76% | –19.95% |
| | | | | | |
Ratios/Supplemental Data | | | | | | |
Net Assets, End of Period (Millions) | $3,602 | $3,078 | $2,382 | $1,451 | $1,056 | $591 |
Ratio of Total Expenses to | | | | | | |
Average Net Assets | 0.12%* | 0.13% | 0.13% | 0.13% | 0.18% | 0.18% |
Ratio of Net Investment Income to | | | | | | |
Average Net Assets | 1.26%* | 1.28% | 1.18% | 1.25% | 1.26% | 1.22% |
Portfolio Turnover Rate1 | 16%* | 13% | 18% | 19% | 39%2 | 32% |
1 Excludes the value of portfolio securities received or delivered as a result of in-kind purchases or redemptions of the fund’s capital shares, including ETF Creation Units.
2 Includes activity related to a change in the fund’s target index.
17
Vanguard Small-Cap Index Fund
Signal Shares | | |
| Six Months | Dec. 15, |
| Ended | 20061 to |
| June. 30, | Dec. 31, |
For a Share Outstanding Throughout Each Period | 2007 | 2006 |
Net Asset Value, Beginning of Period | $29.42 | $29.98 |
Investment Operations | | |
Net Investment Income | .194 | .004 |
Net Realized and Unrealized Gain (Loss) on Investments | 2.521 | (.251) |
Total from Investment Operations | 2.715 | (.247) |
Distributions | | |
Dividends from Net Investment Income | (.005) | (.313) |
Distributions from Realized Capital Gains | — | — |
Total Distributions | (.005) | (.313) |
Net Asset Value, End of Period | $32.13 | $29.42 |
| | |
Total Return | 9.23% | –0.82% |
| | |
Ratios/Supplemental Data | | |
Net Assets, End of Period (Millions) | $330 | $157 |
Ratio of Total Expenses to Average Net Assets | 0.12%* | 0.13%* |
Ratio of Net Investment Income to Average Net Assets | 1.26%* | 1.28%* |
Portfolio Turnover Rate2 | 16%* | 13% |
1 Inception.
2 Excludes the value of portfolio securities received or delivered as a result of in-kind purchases or redemptions of the fund’s capital shares, including ETF Creation Units.
18
Vanguard Small-Cap Index Fund
Institutional Shares | | | | | | |
| Six Months | | | | | |
| Ended | | | | | |
For a Share Outstanding | June 30, | Year Ended December 31, |
Throughout Each Period | 2007 | 2006 | 2005 | 2004 | 2003 | 2002 |
Net Asset Value, Beginning of Period | $32.65 | $28.54 | $26.84 | $22.61 | $15.66 | $19.82 |
Investment Operations | | | | | | |
Net Investment Income | .215 | .411 | .343 | .306 | .240 | .219 |
Net Realized and Unrealized Gain | | | | | | |
(Loss) on Investments | 2.802 | 4.101 | 1.690 | 4.228 | 6.944 | (4.160) |
Total from Investment Operations | 3.017 | 4.512 | 2.033 | 4.534 | 7.184 | (3.941) |
Distributions | | | | | | |
Dividends from Net Investment Income | (.007) | (.402) | (.333) | (.304) | (.234) | (.219) |
Distributions from Realized Capital Gains | — | — | — | — | — | — |
Total Distributions | (.007) | (.402) | (.333) | (.304) | (.234) | (.219) |
Net Asset Value, End of Period | $35.66 | $32.65 | $28.54 | $26.84 | $22.61 | $15.66 |
| | | | | | |
Total Return | 9.24% | 15.82% | 7.56% | 20.06% | 45.88% | –19.89% |
| | | | | | |
Ratios/Supplemental Data | | | | | | |
Net Assets, End of Period (Millions) | $3,661 | $3,107 | $2,089 | $1,648 | $1,111 | $686 |
Ratio of Total Expenses to | | | | | | |
Average Net Assets | 0.07%* | 0.08% | 0.08% | 0.08% | 0.10% | 0.10% |
Ratio of Net Investment Income to | | | | | | |
Average Net Assets | 1.31%* | 1.33% | 1.23% | 1.30% | 1.33% | 1.32% |
Portfolio Turnover Rate1 | 16%* | 13% | 18% | 19% | 39%2 | 32% |
1 Excludes the value of portfolio securities received or delivered as a result of in-kind purchases or redemptions of the fund’s capital shares, including ETF Creation Units.
2 Includes activity related to a change in the fund’s target index.
19
Vanguard Small-Cap Index Fund
ETF Shares | | | | |
| Six Months | | | Jan. 26, |
| Ended | Year Ended | 20041 to |
| June 30, | December 31, | Dec. 31, |
For a Share Outstanding Throughout Each Period | 2007 | 2006 | 2005 | 2004 |
Net Asset Value, Beginning of Period | $68.16 | $59.59 | $56.05 | $50.65 |
Investment Operations | | | | |
Net Investment Income | .454 | .836 | .668 | .585 |
Net Realized and Unrealized Gain (Loss) on Investments | 5.840 | 8.569 | 3.555 | 5.436 |
Total from Investment Operations | 6.294 | 9.405 | 4.223 | 6.021 |
Distributions | | | | |
Dividends from Net Investment Income | (.014) | (.835) | (.683) | (.621) |
Distributions from Realized Capital Gains | — | — | — | — |
Total Distributions | (.014) | (.835) | (.683) | (.621) |
Net Asset Value, End of Period | $74.44 | $68.16 | $59.59 | $56.05 |
| | | | |
Total Return | 9.24% | 15.79% | 7.53% | 11.90% |
| | | | |
Ratios/Supplemental Data | | | | |
Net Assets, End of Period (Millions) | $944 | $670 | $265 | $186 |
Ratio of Total Expenses to Average Net Assets | 0.10%* | 0.10% | 0.10% | 0.18%* |
Ratio of Net Investment Income to Average Net Assets | 1.28%* | 1.31% | 1.20% | 1.19%* |
Portfolio Turnover Rate2 | 16%* | 13% | 18% | 19% |
1 Inception.
2 Excludes the value of portfolio securities received or delivered as a result of in-kind purchases or redemptions of the fund’s capital shares, including ETF Creation Units.
See accompanying Notes, which are an integral part of the Financial Statements.
20
Vanguard Small-Cap Index Fund
Notes to Financial Statements
Vanguard Small-Cap Index Fund is registered under the Investment Company Act of 1940 as an open-end investment company, or mutual fund. The fund offers five classes of shares: Investor Shares, Admiral Shares, Signal Shares, Institutional Shares, and ETF Shares. Investor Shares are available to any investor who meets the fund’s minimum purchase requirements. Admiral Shares are designed for investors who meet certain administrative, service, tenure, and account-size criteria. Signal Shares are designed for institutional investors who meet certain administrative, service, and account-size criteria. Institutional Shares are designed for investors who meet certain administrative and service criteria and invest a minimum of $5 million. ETF Shares are listed for trading on the American Stock Exchange; they can be purchased and sold through a broker.
A. The following significant accounting policies conform to generally accepted accounting principles for U.S. mutual funds. The fund consistently follows such policies in preparing its financial statements.
1. Security Valuation: Securities are valued as of the close of trading on the New York Stock Exchange (generally 4 p.m., Eastern time) on the valuation date. Equity securities are valued at the latest quoted sales prices or official closing prices taken from the primary market in which each security trades; such securities not traded on the valuation date are valued at the mean of the latest quoted bid and asked prices. Securities for which market quotations are not readily available, or whose values have been materially affected by events occurring before the fund’s pricing time but after the close of the securities’ primary markets, are valued by methods deemed by the board of trustees to represent fair value. Investments in Vanguard Market Liquidity Fund are valued at that fund’s net asset value. Temporary cash investments acquired over 60 days to maturity are valued using the latest bid prices or using valuations based on a matrix system (which considers such factors as security prices, yields, maturities, and ratings), both as furnished by independent pricing services. Other temporary cash investments are valued at amortized cost, which approximates market value.
2. Futures Contracts: The fund uses index futures contracts to a limited extent, with the objectives of maintaining full exposure to the stock market, enhancing returns, maintaining liquidity, and minimizing transaction costs. The fund may purchase futures contracts to immediately invest incoming cash in the market, or sell futures in response to cash outflows, thereby simulating a fully invested position in the underlying index while maintaining a cash balance for liquidity. The fund may seek to enhance returns by using futures contracts instead of the underlying securities when futures are believed to be priced more attractively than the underlying securities. The primary risks associated with the use of futures contracts are imperfect correlation between changes in market values of stocks held by the fund and the prices of futures contracts, and the possibility of an illiquid market.
Futures contracts are valued at their quoted daily settlement prices. The aggregate principal amounts of the contracts are not recorded in the Statement of Net Assets. Fluctuations in the value of the contracts are recorded in the Statement of Net Assets as an asset (liability) and in the Statement of Operations as unrealized appreciation (depreciation) until the contracts are closed, when they are recorded as realized futures gains (losses).
3. Federal Income Taxes: The fund intends to continue to qualify as a regulated investment company and distribute all of its taxable income. Accordingly, no provision for federal income taxes is required in the financial statements.
4. Distributions: Distributions to shareholders are recorded on the ex-dividend date.
5. Security Lending: The fund may lend its securities to qualified institutional borrowers to earn additional income. Security loans are required to be secured at all times by collateral at least equal to the market value of securities loaned. The fund invests cash collateral received in Vanguard Market
21
Vanguard Small-Cap Index Fund
Liquidity Fund, and records a liability for the return of the collateral, during the period the securities are on loan. Security lending income represents the income earned on investing cash collateral, less expenses associated with the loan.
6. Other: Dividend income is recorded on the ex-dividend date. Interest income includes income distributions received from Vanguard Market Liquidity Fund and is accrued daily. Security transactions are accounted for on the date securities are bought or sold. Costs used to determine realized gains (losses) on the sale of investment securities are those of the specific securities sold.
Each class of shares has equal rights as to assets and earnings, except that each class separately bears certain class-specific expenses related to maintenance of shareholder accounts (included in Management and Administrative expenses) and shareholder reporting. Marketing and distribution expenses are allocated to each class of shares based on a method approved by the board of trustees. Income, other non-class-specific expenses, and gains and losses on investments are allocated to each class of shares based on its relative net assets.
B. The Vanguard Group furnishes at cost investment advisory, corporate management, administrative, marketing, and distribution services. The costs of such services are allocated to the fund under methods approved by the board of trustees. The fund has committed to provide up to 0.40% of its net assets in capital contributions to Vanguard. At June 30, 2007, the fund had contributed capital of $1,385,000 to Vanguard (included in Other Assets), representing 0.01% of the fund’s net assets and 1.38% of Vanguard’s capitalization. The fund’s trustees and officers are also directors and officers of Vanguard.
C. Distributions are determined on a tax basis and may differ from net investment income and realized capital gains for financial reporting purposes. Differences may be permanent or temporary. Permanent differences are reclassified among capital accounts in the financial statements to reflect their tax character. Temporary differences arise when certain items of income, expense, gain, or loss are recognized in different periods for financial statement and tax purposes; these differences will reverse at some time in the future. Differences in classification may also result from the treatment of short-term gains as ordinary income for tax purposes.
During the six months ended June 30, 2007, the fund realized $621,091,000 of net capital gains resulting from in-kind redemptions—in which shareholders exchange fund shares for securities held by the fund rather than for cash. Because such gains are not taxable to the fund, and are not distributed to shareholders, they have been reclassified from accumulated net realized gains to paid-in capital.
The fund’s tax-basis capital gains and losses are determined only at the end of each fiscal year. For tax purposes, at December 31, 2006, the fund had available realized losses of $402,458,000 to offset future net capital gains of $326,341,000 through December 31, 2011, and $76,117,000 through December 31, 2015. The fund will use these capital losses to offset net taxable capital gains, if any, realized during the year ending December 31, 2007; should the fund realize net capital losses for the year, the losses will be added to the loss carryforward balances above.
At June 30, 2007, the cost of investment securities for tax purposes was $12,411,237,000. Net unrealized appreciation of investment securities for tax purposes was $4,325,408,000, consisting of unrealized gains of $4,780,510,000 on securities that had risen in value since their purchase and $455,102,000 in unrealized losses on securities that had fallen in value since their purchase.
22
Vanguard Small-Cap Index Fund
At June 30, 2007, the aggregate settlement value of open futures contracts expiring in September 2007 and the related unrealized appreciation (depreciation) were:
| | | ($000) |
| | Aggregate | Unrealized |
| Number of | Settlement | Appreciation |
Futures Contracts | Long Contracts | Value | (Depreciation) |
Russell 2000 Index | 172 | 72,421 | 1,253 |
E-mini Russell 2000 Index | 200 | 16,842 | (73) |
Unrealized appreciation (depreciation) on open futures contracts is required to be treated as realized gain (loss) for tax purposes.
D. During the six months ended June 30, 2007, the fund purchased $3,064,054,000 of investment securities and sold $2,415,981,000 of investment securities other than temporary cash investments.
E. The market value of securities on loan to broker-dealers at June 30, 2007, was $923,361,000, for which the fund received cash collateral of $972,773,000.
F. Capital share transactions for each class of shares were:
| Six Months Ended | Year Ended |
| June 30, 2007 | December 31, 2006 |
| Amount | Shares | Amount | Shares |
| ($000) | (000) | ($000) | (000) |
Investor Shares | | | | |
Issued | 740,471 | 21,755 | 1,566,416 | 50,715 |
Issued in Lieu of Cash Distributions | 1,202 | 35 | 70,372 | 2,168 |
Redeemed | (954,556) | (27,795) | (1,582,229) | (51,136) |
Net Increase (Decrease)—Investor Shares | (212,883) | (6,005) | 54,559 | 1,747 |
Admiral Shares | | | | |
Issued | 563,017 | 16,512 | 952,912 | 30,830 |
Issued in Lieu of Cash Distributions | 600 | 18 | 31,519 | 971 |
Redeemed | (334,510) | (9,759) | (652,204) | (20,992) |
Net Increase (Decrease)—Admiral Shares | 229,107 | 6,771 | 332,227 | 10,809 |
Signal Shares | | | | |
Issued | 161,979 | 6,045 | 159,697 | 5,325 |
Issued in Lieu of Cash Distributions | 27 | 1 | 1,656 | 57 |
Redeemed | (33,683) | (1,090) | (1,724) | (58) |
Net Increase (Decrease)—Signal Shares | 128,323 | 4,956 | 159,629 | 5,324 |
23
Vanguard Small-Cap Index Fund
| Six Months Ended | Year Ended |
| June 30, 2007 | December 31, 2006 |
| Amount | Shares | Amount | Shares |
| ($000) | (000) | ($000) | (000) |
Institutional Shares | | | | |
Issued | 618,567 | 17,978 | 1,143,786 | 36,968 |
Issued in Lieu of Cash Distributions | 632 | 19 | 34,286 | 1,055 |
Redeemed | (361,985) | (10,526) | (495,523) | (16,035) |
Net Increase (Decrease)—Institutional Shares | 257,214 | 7,471 | 682,549 | 21,988 |
ETF Shares | | | | |
Issued | 1,517,977 | 20,346 | 1,773,739 | 27,087 |
Issued in Lieu of Cash Distributions | — | — | — | — |
Redeemed | (1,291,665) | (17,500) | (1,423,740) | (21,700) |
Net Increase (Decrease)—ETF Shares | 226,312 | 2,846 | 349,999 | 5,387 |
G. In June 2006, the Financial Accounting Standards Board issued Interpretation No. 48 (“FIN 48”), “Accounting for Uncertainty in Income Taxes.” FIN 48 establishes the minimum threshold for recognizing, and a system for measuring, the benefits of tax-return positions in financial statements, effective for the fund’s current fiscal year. Management has analyzed the fund’s tax positions taken on federal income tax returns for all open tax years (tax years ended December 31, 2004–2006) for purposes of implementing FIN 48, and has concluded that no provision for income tax is required in the fund’s financial statements.
24
Vanguard Small-Cap Growth Index Fund
Fund Profile
As of June 30, 2007
Portfolio Characteristics | | |
| | Target | Broad |
| Fund | Index1 | Index2 |
Number of Stocks | 943 | 940 | 4,921 |
Median Market Cap | $1.9B | $1.9B | $32.6B |
Price/Earnings Ratio | 30.8x | 30.8x | 18.2x |
Price/Book Ratio | 3.7x | 3.7x | 2.9x |
Yield | | 0.2% | 1.7% |
Investor Shares | 0.3% | | |
Institutional Shares | 0.4% | | |
ETF Shares | 0.4% | | |
Return on Equity | 13.0% | 13.0% | 18.2% |
Earnings Growth Rate | 25.7% | 25.7% | 20.7% |
Foreign Holdings | 0.9% | 0.9% | 0.0% |
Turnover Rate | 33%3 | — | — |
Expense Ratio | | — | — |
Investor Shares | 0.22%3 | | |
Institutional Shares | 0.07%3 | | |
ETF Shares | 0.12%3 | | |
Short-Term Reserves | 0% | — | — |
Sector Diversification (% of portfolio) | |
| | Target | Broad |
| Fund | Index1 | Index2 |
Consumer Discretionary | 17% | 17% | 12% |
Consumer Staples | 3 | 3 | 8 |
Energy | 10 | 10 | 10 |
Financials | 6 | 6 | 21 |
Health Care | 17 | 17 | 11 |
Industrials | 17 | 17 | 12 |
Information Technology | 23 | 23 | 15 |
Materials | 5 | 5 | 4 |
Telecommunication Services | 2 | 2 | 3 |
Utilities | 0 | 0 | 4 |
Volatility Measures4 | |
| Fund Versus | Fund Versus |
| Target Index1 | Broad Index2 |
R-Squared | 1.00 | 0.83 |
Beta | 1.00 | 1.61 |
Ten Largest Holdings5 (% of total net assets) |
| | |
The Manitowoc Co., Inc. | construction and farm machinery and heavy trucks | 0.5% |
Cytyc Corp. | health care equipment | 0.5 |
ITT Educational Services, Inc. | education services | 0.5 |
Frontier Oil Corp. | oil and gas refining and marketing | 0.5 |
aQuantive, Inc. | Internet software and services | 0.5 |
Dade Behring Holdings Inc. | health care equipment | 0.5 |
Denbury Resources, Inc. | oil and gas exploration and production | 0.4 |
Jones Lang LaSalle Inc. | real estate management and development | 0.4 |
AK Steel Holding Corp. | steel | 0.4 |
Stericycle, Inc. | environmental and facilities services | 0.4 |
Top Ten | | 4.6% |
Investment Focus
1 MSCI US Small Cap Growth Index.
2 Dow Jones Wilshire 5000 Index.
3 Annualized.
4 For an explanation of R-squared, beta, and other terms used here, see the Glossary on page 56.
5 “Ten Largest Holdings” excludes any temporary cash investments and equity index products.
25
Vanguard Small-Cap Growth Index Fund
Performance Summary
All of the returns in this report represent past performance, which is not a guarantee of future results that may be achieved by the fund. (Current performance may be lower or higher than the performance data cited. For performance data current to the most recent month-end, visit our website at www.vanguard.com/performance.) Note, too, that both investment returns and principal value can fluctuate widely, so an investor’s shares, when sold, could be worth more or less than their original cost. The returns shown do not reflect taxes that a shareholder would pay on fund distributions or on the sale of fund shares.
Fiscal-Year Total Returns (%): May 21, 1998–June 30, 2007
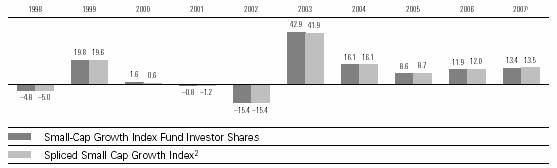
Average Annual Total Returns: Periods Ended June 30, 2007 |
| | | | |
| Inception Date | One Year | Five Years | Ten Years |
Investor Shares3 | 5/21/1998 | 20.16% | 15.46% | 9.18% |
Institutional Shares | 5/24/2000 | 20.35 | 15.64 | 10.524 |
ETF Shares | 1/26/2004 | | | |
Market Price | | 20.87 | 11.974 | — |
Net Asset Value | | 20.29 | 11.964 | — |
1 Six months ended June 30, 2007.
2 S&P SmallCap 600/Barra Growth Index through May 16, 2003; MSCI US Small Cap Growth Index thereafter.
3 Total returns do not include the account service fee that may be applicable to certain acconts with balances below $10,000.
4 Since inception.
Note: See Financial Highlights tables on pages 33 through 35 for dividend and capital gains information.
26
Vanguard Small-Cap Growth Index Fund
Financial Statements (unaudited)
Statement of Net Assets—Investments Summary
As of June 30, 2007
This Statement summarizes the fund’s holdings by asset type (common stocks, bonds, etc.) and by industry sector. Details are reported for each of the fund’s 50 largest individual holdings and for investments that, in total for any issuer, represent more than 1% of the fund’s net assets. The total value of smaller holdings is reported as a single amount within each category.
The fund provides a complete list of its holdings four times in each fiscal year, at the quarter-ends. For the second and fourth fiscal quarters, the complete listing of the fund’s holdings is available electronically on Vanguard.com and on the Securities and Exchange Commission’s website (www.sec.gov), or you can have it mailed to you without charge by calling 800-662-7447. For the first and third fiscal quarters, the fund files the lists with the SEC on Form N-Q. Shareholders can look up the fund’s Forms N-Q on the SEC’s website. Forms N-Q may also be reviewed and copied at the SEC’s Public Reference Room (see the back cover of this report for further information).
| | | Market | Percentage |
| | | Value• | of Net |
| | Shares | ($000) | Assets |
Common Stocks | | | |
Consumer Discretionary | | | |
* | ITT Educational Services, Inc. | 164,378 | 19,295 | 0.5% |
* | Big Lots Inc. | 432,601 | 12,727 | 0.3% |
† | Other—Consumer Discretionary | | 663,848 | 16.6% |
| | | 695,870 | 17.4% |
Consumer Staples | | | |
* | Rite Aid Corp. | 2,115,116 | 13,494 | 0.3% |
| Church & Dwight, Inc.. | 259,215 | 12,562 | 0.3% |
† | Other—Consumer Staples | | 104,232 | 2.6% |
| | | 130,288 | 3.2% |
Energy | | | |
| Frontier Oil Corp. | 438,470 | 19,192 | 0.5% |
* | Denbury Resources, Inc. | 476,925 | 17,885 | 0.4% |
| Helmerich & Payne, Inc. | 418,035 | 14,807 | 0.4% |
| Holly Corp. | 189,621 | 14,068 | 0.4% |
* | Helix Energy Solutions Group, Inc. | 352,469 | 14,067 | 0.4% |
* | Superior Energy Services, Inc. | 337,777 | 13,484 | 0.3% |
* | Dresser Rand Group, Inc. | 305,726 | 12,076 | 0.3% |
† | Other—Energy | | 298,578 | 7.4% |
| | | 404,157 | 10.1% |
Financials | | | |
| Jones Lang LaSalle Inc. | 145,074 | 16,466 | 0.4% |
* | Affiliated Managers Group, Inc. | 119,909 | 15,439 | 0.4% |
† | Other—Financials | | 184,095 | 4.6% |
| | | 216,000 | 5.4% |
27
Vanguard Small-Cap Growth Index Fund
| | | Market | Percentage |
| | | Value• | of Net |
| | Shares | ($000) | Assets |
Health Care | | | |
* | Cytyc Corp. | 447,616 | 19,297 | 0.5% |
| Dade Behring Holdings Inc. | 341,117 | 18,120 | 0.5% |
* | VCA Antech, Inc. | 331,763 | 12,504 | 0.3% |
* | Gen-Probe Inc. | 206,844 | 12,498 | 0.3% |
* | ResMed Inc. | 302,174 | 12,468 | 0.3% |
* | WellCare Health Plans Inc. | 137,550 | 12,450 | 0.3% |
* | Respironics, Inc. | 290,050 | 12,353 | 0.3% |
* | IDEXX Laboratories Corp. | 124,358 | 11,768 | 0.3% |
† | Other—Health Care | | 553,823 | 13.8% |
| | | 665,281 | 16.6% |
Industrials | | | |
| The Manitowoc Co., Inc. | 244,702 | 19,669 | 0.5% |
* | Stericycle, Inc. | 352,647 | 15,679 | 0.4% |
* | General Cable Corp. | 204,966 | 15,526 | 0.4% |
* | Corrections Corp. of America | 241,271 | 15,227 | 0.4% |
* | BE Aerospace, Inc. | 359,335 | 14,841 | 0.4% |
* | Thomas & Betts Corp. | 238,040 | 13,806 | 0.3% |
| Trinity Industries, Inc. | 316,995 | 13,802 | 0.3% |
* | Alliant Techsystems, Inc. | 130,953 | 12,984 | 0.3% |
* | Covanta Holding Corp. | 486,328 | 11,988 | 0.3% |
* | WESCO International, Inc. | 195,375 | 11,810 | 0.3% |
† | Other—Industrials | | 529,729 | 13.2% |
| | | 675,061 | 16.8% |
Information Technology | | | |
* | aQuantive, Inc. | 292,958 | 18,691 | 0.5% |
* | Trimble Navigation Ltd. | 465,282 | 14,982 | 0.4% |
* | Mettler-Toledo International Inc. | 156,085 | 14,908 | 0.4% |
* | CommScope, Inc. | 236,844 | 13,820 | 0.4% |
* | Cypress Semiconductor Corp. | 571,893 | 13,319 | 0.3% |
* | Varian Semiconductor Equipment Associates, Inc. | 328,207 | 13,148 | 0.3% |
* | F5 Networks, Inc. | 161,132 | 12,987 | 0.3% |
| Global Payments Inc. | 318,566 | 12,631 | 0.3% |
* | Unisys Corp. | 1,372,031 | 12,540 | 0.3% |
* | Brocade Communications Systems, Inc. | 1,569,792 | 12,276 | 0.3% |
* | Ciena Corp. | 335,541 | 12,123 | 0.3% |
| FactSet Research Systems Inc. | 175,146 | 11,971 | 0.3% |
* | Polycom, Inc. | 352,648 | 11,849 | 0.3% |
† | Other--Information Technology | | 759,438 | 18.9% |
| | | 934,683 | 23.3% |
Materials | | | |
* | AK Steel Holding Corp. | 438,209 | 16,376 | 0.4% |
| Nalco Holding Co. | 568,417 | 15,603 | 0.4% |
| Chaparral Steel Co. | 183,966 | 13,222 | 0.3% |
| Cleveland-Cliffs Inc. | 163,604 | 12,707 | 0.3% |
| CF Industries Holdings, Inc. | 197,280 | 11,815 | 0.3% |
† | Other—Materials | | 119,944 | 3.0% |
| | | 189,667 | 4.7% |
Telecommunication Services | | | |
* | SBA Communications Corp. | 374,289 | 12,572 | 0.3% |
† | Other—Telecommunication Services | | 53,281 | 1.3% |
| | | 65,853 | 1.6% |
| | | | |
† | Utilities | | 7,052 | 0.2% |
Total Common Stocks (Cost $3,192,596) | | 3,983,912 | 99.3%1 |
28
Vanguard Small-Cap Growth Index Fund
| | Market | Percentage |
| | Value• | of Net |
| Shares | ($000) | Assets |
Temporary Cash Investments | | | |
Money Market Fund | | | |
2 Vanguard Market Liquidity Fund, 5.281% | 17,832,945 | 17,833 | 0.5% |
2 Vanguard Market Liquidity Fund, 5.281%—Note F | 262,018,700 | 262,019 | 6.5% |
| | 279,852 | 7.0% |
| | | |
†3U.S. Agency Obligation | | 999 | 0.0% |
Total Temporary Cash Investments (Cost $280,851) | | 280,851 | 7.0%1 |
Total Investments (Cost $3,473,447) | | 4,264,763 | 106.3% |
Other Assets and Liabilities | | | |
Other Assets—Note B | | 15,869 | 0.4% |
Security Lending Collateral Payable to Brokers—Note F | | (262,019) | (6.5%) |
Other Liabilities | | (7,959) | (0.2%) |
| | (254,109) | (6.3%) |
Net Assets | | 4,010,654 | 100.0% |
29
Vanguard Small-Cap Growth Index Fund
At June 30, 2007, net assets consisted of:4 | |
| Amount |
| ($000) |
| |
Paid-in Capital | 3,288,546 |
Undistributed Net Investment Income | 7,896 |
Accumulated Net Realized Losses | (77,225) |
Unrealized Appreciation | |
Investment Securities | 791,316 |
Futures Contracts | 121 |
Net Assets | 4,010,654 |
| |
Investor Shares—Net Assets | |
Applicable to 127,691,147 outstanding $.001 par value shares of | |
beneficial interest (unlimited authorization) | 2,656,349 |
Net Asset Value Per Share—Investor Shares | $20.80 |
| |
Institutional Shares—Net Assets | |
Applicable to 31,045,261 outstanding $.001 par value shares of | |
beneficial interest (unlimited authorization) | 647,337 |
Net Asset Value Per Share—Institutional Shares | $20.85 |
| |
ETF Shares—Net Assets | |
Applicable to 9,548,625 outstanding $.001 par value shares of | |
beneficial interest (unlimited authorization) | 706,968 |
Net Asset Value Per Share—ETF Shares | $74.04 |
• | See Note A in Notes to Financial Statements. |
* | Non-income-producing security. |
† Represents the aggregate value, by category, of securities that are not among the 50 largest holdings and, in total for any issuer, represent 1% or less of net assets.
1 The fund invests a portion of its cash reserves in equity markets through the use of index futures contracts. After giving effect to futures investments, the fund’s effective common stock and temporary cash investment positions represent 99.9% and 6.4%, respectively, of net assets. See Note D in Notes to Financial Statements.
2 Affiliated money market fund available only to Vanguard funds and certain trusts and accounts managed by Vanguard. Rate shown is the 7-day yield.
3 Securities with a value of $999,000 have been segregated as initial margin for open futures contracts.
4 See Note D in Notes to Financial Statements for the tax-basis components of net assets.
30
Vanguard Small-Cap Growth Index Fund
Statement of Operations
| Six Months Ended |
| June 30, 2007 |
| ($000) |
Investment Income | |
Income | |
Dividends | 10,925 |
Interest1 | 644 |
Security Lending | 2,291 |
Total Income | 13,860 |
Expenses | |
The Vanguard Group—Note B | |
Investment Advisory Services | 98 |
Management and Administrative | |
Investor Shares | 2,122 |
Institutional Shares | 72 |
ETF Shares | 211 |
Marketing and Distribution | |
Investor Shares | 305 |
Institutional Shares | 46 |
ETF Shares | 73 |
Custodian Fees | 203 |
Shareholders’ Reports | |
Investor Shares | 34 |
Institutional Shares | 5 |
ETF Shares | 11 |
Trustees’ Fees and Expenses | 2 |
Total Expenses | 3,182 |
Expenses Paid Indirectly—Note C | (24) |
Net Expenses | 3,158 |
Net Investment Income | 10,702 |
Realized Net Gain (Loss) | |
Investment Securities Sold | 147,767 |
Futures Contracts | 146 |
Realized Net Gain (Loss) | 147,913 |
Change in Unrealized Appreciation (Depreciation) | |
Investment Securities | 275,472 |
Futures Contracts | 243 |
Change in Unrealized Appreciation (Depreciation) | 275,715 |
Net Increase (Decrease) in Net Assets Resulting from Operations | 434,330 |
1 Interest income from an affiliated company of the fund was $613,000.
31
Vanguard Small-Cap Growth Index Fund
Statement of Changes in Net Assets
| Six Months Ended | Year Ended |
| June 30, | December 31, |
| 2007 | 2006 |
| ($000) | ($000) |
Increase (Decrease) in Net Assets | | |
Operations | | |
Net Investment Income | 10,702 | 8,624 |
Realized Net Gain (Loss) | 147,913 | 118,477 |
Change in Unrealized Appreciation (Depreciation) | 275,715 | 133,952 |
Net Increase (Decrease) in Net Assets Resulting from Operations | 434,330 | 261,053 |
Distributions | | |
Net Investment Income | | |
Investor Shares | (246) | (6,221) |
Institutional Shares | (68) | (1,077) |
ETF Shares | (82) | (2,018) |
Realized Capital Gain | | |
Investor Shares | — | — |
Institutional Shares | — | — |
ETF Shares | — | — |
Total Distributions | (396) | (9,316) |
Capital Share Transactions—Note G | | |
Investor Shares | 143,854 | 285,058 |
Institutional Shares | 338,644 | 167,475 |
ETF Shares | 112,017 | 273,576 |
Net Increase (Decrease) from Capital Share Transactions | 594,515 | 726,109 |
Total Increase (Decrease) | 1,028,449 | 977,846 |
Net Assets | | |
Beginning of Period | 2,982,205 | 2,004,359 |
End of Period1 | 4,010,654 | 2,982,205 |
1 Net Assets—End of Period includes undistributed (overdistributed) net investment income of $7,896,000 and ($2,410,000).
32
Vanguard Small-Cap Growth Index Fund
Financial Highlights
Investor Shares | | | | | | |
| Six Months | | | | | |
| Ended | | | | | |
For a Share Outstanding | June 30, | Year Ended December 31, |
Throughout Each Period | 2007 | 2006 | 2005 | 2004 | 2003 | 2002 |
Net Asset Value, Beginning of Period | $18.34 | $16.43 | $15.16 | $13.08 | $9.17 | $10.87 |
Investment Operations | | | | | | |
Net Investment Income | .054 | .051 | .04 | .02 | .021 | .027 |
Net Realized and Unrealized Gain | | | | | | |
(Loss) on Investments | 2.408 | 1.911 | 1.27 | 2.08 | 3.911 | (1.702) |
Total from Investment Operations | 2.462 | 1.962 | 1.31 | 2.10 | 3.932 | (1.675) |
Distributions | | | | | | |
Dividends from Net Investment Income | (.002) | (.052) | (.04) | (.02) | (.022) | (.025) |
Distributions from Realized Capital Gains | — | — | — | — | — | — |
Total Distributions | (.002) | (.052) | (.04) | (.02) | (.022) | (.025) |
Net Asset Value, End of Period | $20.80 | $18.34 | $16.43 | $15.16 | $13.08 | $9.17 |
| | | | | | |
Total Return1 | 13.43% | 11.94% | 8.64% | 16.06% | 42.88% | –15.41% |
| | | | | | |
Ratios/Supplemental Data | | | | | | |
Net Assets, End of Period (Millions) | $2,656 | $2,208 | $1,726 | $1,435 | $907 | $388 |
Ratio of Total Expenses to | | | | | | |
Average Net Assets | 0.22%* | 0.23% | 0.23% | 0.23% | 0.27% | 0.27% |
Ratio of Net Investment | | | | | | |
Income to Average Net Assets | 0.59%* | 0.30% | 0.27% | 0.13% | 0.21% | 0.24% |
Portfolio Turnover Rate2 | 33%* | 40% | 39% | 41% | 91%3 | 61% |
| | | | | | | |
1 Total returns do not reflect the 0.5% transaction fee on purchases through March 31, 2002, or the account service fee that may be applicable to certain accounts with balances below $10,000.
2 Excludes the value of portfolio securities received or delivered as a result of in-kind purchases or redemptions of the fund’s capital shares, including ETF Creation Units.
3 Includes activity related to a change in the fund’s target index.
33
Vanguard Small-Cap Growth Index Fund
Institutional Shares | | | | | | |
| Six Months | | | | | |
| Ended | | | | | |
For a Share Outstanding | June 30, | Year Ended December 31, |
Throughout Each Period | 2007 | 2006 | 2005 | 2004 | 2003 | 2002 |
Net Asset Value, Beginning of Period | $18.37 | $16.46 | $15.18 | $13.09 | $9.17 | $10.87 |
Investment Operations | | | | | | |
Net Investment Income | .075 | .08 | .073 | .048 | .039 | .043 |
Net Realized and Unrealized Gain | | | | | | |
(Loss) on Investments | 2.408 | 1.91 | 1.270 | 2.080 | 3.911 | (1.702) |
Total from Investment Operations | 2.483 | 1.99 | 1.343 | 2.128 | 3.950 | (1.659) |
Distributions | | | | | | |
Dividends from Net Investment Income | (.003) | (.08) | (.063) | (.038) | (.030) | (.041) |
Distributions from Realized Capital Gains | — | — | — | — | — | — |
Total Distributions | (.003) | (.08) | (.063) | (.038) | (.030) | (.041) |
Net Asset Value, End of Period | $20.85 | $18.37 | $16.46 | $15.18 | $13.09 | $9.17 |
| | | | | | |
Total Return1 | 13.52% | 12.09% | 8.84% | 16.26% | 43.08% | –15.26% |
| | | | | | |
Ratios/Supplemental Data | | | | | | |
Net Assets, End of Period (Millions) | $647 | $257 | $73 | $38 | $30 | $104 |
Ratio of Total Expenses to | | | | | | |
Average Net Assets | 0.07%* | 0.08% | 0.08% | 0.08% | 0.10% | 0.10% |
Ratio of Net Investment Income to | | | | | | |
Average Net Assets | 0.74%* | 0.45% | 0.42% | 0.28% | 0.38% | 0.41% |
Portfolio Turnover Rate2 | 33%* | 40% | 39% | 41% | 91%3 | 61% |
1 Total returns do not reflect the 0.5% transaction fee on purchases through March 31, 2002.
2 Excludes the value of portfolio securities received or delivered as a result of in-kind purchases or redemptions of the fund’s capital shares, including ETF Creation Units.
3 Includes activity related to a change in the fund’s target index.
34
Vanguard Small-Cap Growth Index Fund
ETF Shares | | | | |
| Six Months | | | Jan. 26, |
| Ended | Year Ended | 20041 to |
| | December 31, | |
| June 30, | | | Dec. 31, |
For a Share Outstanding Throughout Each Period | 2007 | 2006 | 2005 | 2004 |
Net Asset Value, Beginning of Period | $65.24 | $58.47 | $53.95 | $50.77 |
Investment Operations | | | | |
Net Investment Income | .23 | .262 | .200 | .091 |
Net Realized and Unrealized Gain (Loss) on Investments | 8.58 | 6.773 | 4.534 | 3.177 |
Total from Investment Operations | 8.81 | 7.035 | 4.734 | 3.268 |
Distributions | | | | |
Dividends from Net Investment Income | (.01) | (.265) | (.214) | (.088) |
Distributions from Realized Capital Gains | — | — | — | — |
Total Distributions | (.01) | (.265) | (.214) | (.088) |
Net Asset Value, End of Period | $74.04 | $65.24 | $58.47 | $53.95 |
| | | | |
Total Return | 13.51% | 12.03% | 8.77% | 6.44% |
| | | | |
Ratios/Supplemental Data | | | | |
Net Assets, End of Period (Millions) | $707 | $518 | $206 | $92 |
Ratio of Total Expenses to Average Net Assets | 0.12%* | 0.12% | 0.12% | 0.22%* |
Ratio of Net Investment Income to Average Net Assets | 0.69%* | 0.41% | 0.37% | 0.15%* |
Portfolio Turnover Rate2 | 33%* | 40% | 39% | 41% |
1 Inception.
2 Excludes the value of portfolio securities received or delivered as a result of in-kind purchases or redemptions of the fund’s capital shares, including ETF Creation Units.
See accompanying Notes, which are an integral part of the Financial Statements.
35
Vanguard Small-Cap Growth Index Fund
Notes to Financial Statements
Vanguard Small-Cap Growth Index Fund is registered under the Investment Company Act of 1940 as an open-end investment company, or mutual fund. The fund offers three classes of shares: Investor Shares, Institutional Shares, and ETF Shares. Investor Shares are available to any investor who meets the fund’s minimum purchase requirements. Institutional Shares are designed for investors who meet certain administrative and service criteria and invest a minimum of $5 million. ETF Shares are listed for trading on the American Stock Exchange; they can be purchased and sold through a broker.
A. The following significant accounting policies conform to generally accepted accounting principles for U.S. mutual funds. The fund consistently follows such policies in preparing its financial statements.
1. Security Valuation: Securities are valued as of the close of trading on the New York Stock Exchange (generally 4 p.m., Eastern time) on the valuation date. Equity securities are valued at the latest quoted sales prices or official closing prices taken from the primary market in which each security trades; such securities not traded on the valuation date are valued at the mean of the latest quoted bid and asked prices. Securities for which market quotations are not readily available, or whose values have been materially affected by events occurring before the fund’s pricing time but after the close of the securities’ primary markets, are valued by methods deemed by the board of trustees to represent fair value. Investments in Vanguard Market Liquidity Fund are valued at that fund’s net asset value. Temporary cash investments acquired over 60 days to maturity are valued using the latest bid prices or using valuations based on a matrix system (which considers such factors as security prices, yields, maturities, and ratings), both as furnished by independent pricing services. Other temporary cash investments are valued at amortized cost, which approximates market value.
2. Futures Contracts: The fund uses index futures contracts to a limited extent, with the objectives of maintaining full exposure to the stock market, enhancing returns, maintaining liquidity, and minimizing transaction costs. The fund may purchase futures contracts to immediately invest incoming cash in the market, or sell futures in response to cash outflows, thereby simulating a fully invested position in the underlying index while maintaining a cash balance for liquidity. The fund may seek to enhance returns by using futures contracts instead of the underlying securities when futures are believed to be priced more attractively than the underlying securities. The primary risks associated with the use of futures contracts are imperfect correlation between changes in market values of stocks held by the fund and the prices of futures contracts, and the possibility of an illiquid market.
Futures contracts are valued at their quoted daily settlement prices. The aggregate principal amounts of the contracts are not recorded in the Statement of Net Assets. Fluctuations in the value of the contracts are recorded in the Statement of Net Assets as an asset (liability) and in the Statement of Operations as unrealized appreciation (depreciation) until the contracts are closed, when they are recorded as realized futures gains (losses).
3. Federal Income Taxes: The fund intends to continue to qualify as a regulated investment company and distribute all of its taxable income. Accordingly, no provision for federal income taxes is required in the financial statements.
4. Distributions: Distributions to shareholders are recorded on the ex-dividend date.
5. Security Lending: The fund may lend its securities to qualified institutional borrowers to earn additional income. Security loans are required to be secured at all times by collateral at least equal to the market value of securities loaned. The fund invests cash collateral received in Vanguard Market Liquidity Fund, and records a liability for the return of the collateral, during the period the securities are on loan. Security lending income represents the income earned on investing cash collateral, less expenses associated with the loan.
36
Vanguard Small-Cap Growth Index Fund
6. Other: Dividend income is recorded on the ex-dividend date. Interest income includes income distributions received from Vanguard Market Liquidity Fund and is accrued daily. Security transactions are accounted for on the date securities are bought or sold. Costs used to determine realized gains (losses) on the sale of investment securities are those of the specific securities sold.
Each class of shares has equal rights as to assets and earnings, except that each class separately bears certain class-specific expenses related to maintenance of shareholder accounts (included in Management and Administrative expenses) and shareholder reporting. Marketing and distribution expenses are allocated to each class of shares based on a method approved by the board of trustees. Income, other non-class-specific expenses, and gains and losses on investments are allocated to each class of shares based on its relative net assets.
B. The Vanguard Group furnishes at cost investment advisory, corporate management, administrative, marketing, and distribution services. The costs of such services are allocated to the fund under methods approved by the board of trustees. The fund has committed to provide up to 0.40% of its net assets in capital contributions to Vanguard. At June 30, 2007, the fund had contributed capital of $334,000 to Vanguard (included in Other Assets), representing 0.01% of the fund’s net assets and 0.33% of Vanguard’s capitalization. The fund’s trustees and officers are also directors and officers of Vanguard.
C. The fund’s custodian bank has agreed to reduce its fees when the fund maintains cash on deposit in the non-interest-bearing custody account. For the six months ended June 30, 2007, custodian fee offset arrangements reduced the fund’s expenses by $24,000.
D. Distributions are determined on a tax basis and may differ from net investment income and realized capital gains for financial reporting purposes. Differences may be permanent or temporary. Permanent differences are reclassified among capital accounts in the financial statements to reflect their tax character. Temporary differences arise when certain items of income, expense, gain, or loss are recognized in different periods for financial statement and tax purposes; these differences will reverse at some time in the future. Differences in classification may also result from the treatment of short-term gains as ordinary income for tax purposes.
During the six months ended June 30, 2007, the fund realized $163,427,000 of net capital gains resulting from in-kind redemptions—in which shareholders exchange fund shares for securities held by the fund rather than for cash. Because such gains are not taxable to the fund, and are not distributed to shareholders, they have been reclassified from accumulated net realized gains to paid-in capital.
The fund’s tax-basis capital gains and losses are determined only at the end of each fiscal year. For tax purposes, at December 31, 2006, the fund had available realized losses of $59,847,000 to offset future net capital gains of $13,814,000 through December 31, 2011, $15,893,000 through December 31, 2014, and $30,140,000 through December 31, 2015. The fund will use these capital losses to offset net taxable capital gains, if any, realized during the year ending December 31, 2007; should the fund realize net capital losses for the year, the losses will be added to the loss carryforward balances above.
At June 30, 2007, the cost of investment securities for tax purposes was $3,473,447,000. Net unrealized appreciation of investment securities for tax purposes was $791,316,000, consisting of unrealized gains of $889,547,000 on securities that had risen in value since their purchase and $98,231,000 in unrealized losses on securities that had fallen in value since their purchase.
37
Vanguard Small-Cap Growth Index Fund
At June 30, 2007, the aggregate settlement value of open futures contracts expiring in September 2007 and the related unrealized appreciation (depreciation) were:
| | | ($000) |
| | Aggregate | Unrealized |
| Number of | Settlement | Appreciation |
Futures Contracts | Long Contracts | Value | (Depreciation) |
Russell 2000 Index | 48 | 20,210 | 191 |
E-mini Russell 2000 Index | 60 | 5,053 | (70) |
Unrealized appreciation (depreciation) on open futures contracts is required to be treated as realized gain (loss) for tax purposes.
E. During the six months ended June 30, 2007, the fund purchased $1,621,648,000 of investment securities and sold $1,019,150,000 of investment securities other than temporary cash investments.
F. The market value of securities on loan to broker-dealers at June 30, 2007, was $249,731,000, for which the fund received cash collateral of $262,019,000.
G. Capital share transactions for each class of shares were:
| Six Months Ended | Year Ended |
| June 30, 2007 | December 31, 2006 |
| Amount | Shares | Amount | Shares |
| ($000) | (000) | ($000) | (000) |
Investor Shares | | | | |
Issued | 428,198 | 21,937 | 849,050 | 47,904 |
Issued in Lieu of Cash Distributions | 231 | 12 | 5,601 | 306 |
Redeemed | (284,575) | (14,636) | (569,593) | (32,829) |
Net Increase (Decrease)—Investor Shares | 143,854 | 7,313 | 285,058 | 15,381 |
Institutional Shares | | | | |
Issued | 377,647 | 19,023 | 196,373 | 11,158 |
Issued in Lieu of Cash Distributions | 64 | 3 | 1,047 | 57 |
Redeemed | (39,067) | (1,946) | (29,945) | (1,682) |
Net Increase (Decrease)—Institutional Shares | 338,644 | 17,080 | 167,475 | 9,533 |
ETF Shares | | | | |
Issued | 593,903 | 8,210 | 667,882 | 10,618 |
Issued in Lieu of Cash Distributions | — | — | — | — |
Redeemed | (481,886) | (6,600) | (394,306) | (6,200) |
Net Increase (Decrease)—ETF Shares | 112,017 | 1,610 | 273,576 | 4,418 |
H. In June 2006, the Financial Accounting Standards Board issued Interpretation No. 48 (“FIN 48”), “Accounting for Uncertainty in Income Taxes.”FIN 48 establishes the minimum threshold for recognizing, and a system for measuring, the benefits of tax-return positions in financial statements, effective for the fund’s current fiscal year. Management has analyzed the fund’s tax positions taken on federal income tax returns for all open tax years (tax years ended December 31, 2004–2006) for purposes of implementing FIN 48, and has concluded that no provision for income tax is required in the fund's financial statements.
38
Vanguard Small-Cap Value Index Fund
Fund Profile
As of June 30, 2007
Portfolio Characteristics | | |
| | Target | Broad |
| Fund | Index1 | Index2 |
Number of Stocks | 943 | 940 | 4,921 |
Median Market Cap | $1.8B | $1.8B | $32.6B |
Price/Earnings Ratio | 19.6x | 19.7x | 18.2x |
Price/Book Ratio | 1.9x | 1.9x | 2.9x |
Yield | | 2.1% | 1.7% |
Investor Shares | 2.0% | | |
Institutional Shares | 2.1% | | |
ETF Shares | 2.1% | | |
Return on Equity | 10.8% | 10.8% | 18.2% |
Earnings Growth Rate | 12.3% | 12.3% | 20.7% |
Foreign Holdings | 0.4% | 0.4% | 0.0% |
Turnover Rate | 28%3 | — | — |
Expense Ratio | | — | — |
Investor Shares | 0.22%3 | | |
Institutional Shares | 0.07%3 | | |
ETF Shares | 0.12%3 | | |
Short-Term Reserves | 0% | — | — |
Sector Diversification (% of portfolio) | |
| | Target | Broad |
| Fund | Index1 | Index2 |
Consumer Discretionary | 12% | 12% | 12% |
Consumer Staples | 3 | 3 | 8 |
Energy | 5 | 5 | 10 |
Financials | 33 | 33 | 21 |
Health Care | 4 | 4 | 11 |
Industrials | 17 | 17 | 12 |
Information Technology | 10 | 10 | 15 |
Materials | 7 | 7 | 4 |
Telecommunication | | | |
Services | 1 | 1 | 3 |
Utilities | 8 | 8 | 4 |
Volatility Measures4 | |
| Fund Versus | Fund Versus |
| Target Index1 | Broad Index2 |
R-Squared | 1.00 | 0.84 |
Beta | 1.00 | 1.23 |
Ten Largest Holdings5 (% of total net assets) |
| | |
Lubrizol Corp. | specialty chemicals | 0.5% |
Harsco Corp. | industrial machinery | 0.5 |
AGCO Corp. | construction and farm machinery and heavy trucks | 0.4 |
Sierra Pacific Resources | electric utilities | 0.4 |
Reliance Steel & Aluminum Co. | steel | 0.4 |
CMS Energy Corp. | multi-utilities | 0.4 |
Commercial Metals Co. | steel | 0.4 |
Energen Corp. | gas utilities | 0.4 |
Service Corp.International | specialized consumer services | 0.4 |
Shaw Group, Inc. | construction and engineering | 0.4 |
Top Ten | | 4.2% |
Investment Focus
1 MSCI US Small Cap Value Index.
2 Dow Jones Wilshire 5000 Index.
3 Annualized.
4 For an explanation of R-squared, beta, and other terms used here, see the Glossary on page 56.
5“Ten Largest Holdings” excludes any temporary cash investments and equity index products.
39
Vanguard Small-Cap Value Index Fund
Performance Summary
All of the returns in this report represent past performance, which is not a guarantee of future results that may be achieved by the fund. (Current performance may be lower or higher than the performance data cited. For performance data current to the most recent month-end, visit our website at www.vanguard.com/performance.) Note, too, that both investment returns and principal value can fluctuate widely, so an investor’s shares, when sold, could be worth more or less than their original cost. The returns shown do not reflect taxes that a shareholder would pay on fund distributions or on the sale of fund shares.
Fiscal-Year Total Returns (%): May 21, 1998–June 30, 2007

Average Annual Total Returns: Periods Ended June 30, 2007 |
| | | | |
| Inception Date | One Year | Five Years | Ten Years |
Investor Shares3 | 5/21/1998 | 15.91% | 12.79% | 10.19% |
Institutional Shares | 12/7/1999 | 16.02 | 12.97 | 14.50 |
ETF Shares | 1/26/2004 | | | |
Market Price | | 15.98 | 13.924 | — |
Net Asset Value | | 16.39 | 13.964 | — |
1 Six months ended June 30, 2007.
2 S&P SmallCap 600/Barra Value Index through May 16, 2003; MSCI US Small Cap Value Index thereafter.
3 Total returns do not include the account service fee that may be applicable to certain accounts with balances below $10,000.
Note: See Financial Highlights tables on pages 47 through 49 for dividend and capital gains information.
40
Vanguard Small-Cap Value Index Fund
Financial Statements (unaudited)
Statement of Net Assets—Investments Summary
As of June 30, 2007
This Statement summarizes the fund’s holdings by asset type (common stocks, bonds, etc.) and by industry sector. Details are reported for each of the fund’s 50 largest individual holdings and for investments that, in total for any issuer, represent more than 1% of the fund’s net assets. The total value of smaller holdings is reported as a single amount within each category.
The fund provides a complete list of its holdings four times in each fiscal year, at the quarter-ends. For the second and fourth fiscal quarters, the complete listing of the fund’s holdings is available electronically on Vanguard.com and on the Securities and Exchange Commission’s website (www.sec.gov), or you can have it mailed to you without charge by calling 800-662-7447. For the first and third fiscal quarters, the fund files the lists with the SEC on Form N-Q. Shareholders can look up the fund’s Forms N-Q on the SEC’s website. Forms N-Q may also be reviewed and copied at the SEC’s Public Reference Room (see the back cover of this report for further information).
| | | Market | Percentage |
| | | Value• | of Net |
| | Shares | ($000) | Assets |
Common Stocks | | | |
Consumer Discretionary | | | |
| Service Corp. International | 1,781,939 | 22,773 | 0.4% |
| Phillips-Van Heusen Corp. | 337,270 | 20,428 | 0.4% |
| Dow Jones & Co., Inc. | 346,998 | 19,935 | 0.3% |
| OfficeMax, Inc. | 453,441 | 17,820 | 0.3% |
† | Other—Consumer Discretionary | | 646,433 | 10.9% |
| | | 727,389 | 12.3% |
Consumer Staples | | | |
| J.M. Smucker Co. | 328,595 | 20,918 | 0.4% |
| Corn Products International, Inc. | 451,961 | 20,542 | 0.3% |
† | Other—Consumer Staples | | 159,282 | 2.7% |
| | | 200,742 | 3.4% |
Energy | | | |
*^ | Forest Oil Corp. | 475,707 | 20,103 | 0.3% |
* | Kinder Morgan Management, LLC | 378,354 | 19,637 | 0.3% |
† | Other—Energy | | 238,888 | 4.1% |
| | | 278,628 | 4.7% |
Financials | | | |
| Annaly Mortgage Management Inc. REIT | 1,555,543 | 22,431 | 0.4% |
| Rayonier Inc. REIT | 466,881 | 21,075 | 0.4% |
| Health Care Inc. REIT | 479,064 | 19,335 | 0.3% |
* | Conseco, Inc. | 925,074 | 19,325 | 0.3% |
| ^Thornburg Mortgage, Inc. REIT | 722,340 | 18,911 | 0.3% |
| BRE Properties Inc. Class A REIT | 306,983 | 18,201 | 0.3% |
| Mack-Cali Realty Corp. REIT | 409,466 | 17,808 | 0.3% |
| Sky Financial Group, Inc. | 637,395 | 17,758 | 0.3% |
| Essex Property Trust, Inc. REIT | 151,742 | 17,648 | 0.3% |
| Cullen/Frost Bankers, Inc. | 328,505 | 17,565 | 0.3% |
| Raymond James Financial, Inc. | 565,399 | 17,471 | 0.3% |
| Alexandria Real Estate Equities, Inc. REIT | 178,137 | 17,247 | 0.3% |
† | Other—Financials | | 1,722,884 | 29.2% |
| | | 1,947,659 | 33.0% |
41
Vanguard Small-Cap Value Index Fund
| | | Market | Percentage |
| | | Value• | of Net |
| | Shares | ($000) | Assets |
Health Care | | | |
| PerkinElmer, Inc. | 748,702 | 19,511 | 0.4% |
| Universal Health Services Class B | 305,544 | 18,791 | 0.3% |
† | Other—Health Care | | 171,573 | 2.9% |
| | | 209,875 | 3.6% |
Industrials | | | |
| Harsco Corp. | 511,651 | 26,606 | 0.5% |
* | AGCO Corp. | 555,044 | 24,094 | 0.4% |
* | Shaw Group, Inc. | 490,290 | 22,696 | 0.4% |
| Ryder System, Inc. | 369,903 | 19,901 | 0.3% |
| Kennametal, Inc. | 235,324 | 19,304 | 0.3% |
| IDEX Corp. | 489,727 | 18,874 | 0.3% |
| Teleflex Inc. | 225,637 | 18,453 | 0.3% |
| Lincoln Electric Holdings, Inc. | 246,576 | 18,306 | 0.3% |
| The Timken Co. | 487,106 | 17,589 | 0.3% |
| Carlisle Co., Inc. | 375,612 | 17,470 | 0.3% |
* | Avis Budget Group, Inc. | 614,149 | 17,460 | 0.3% |
| Hubbell Inc. Class B | 316,411 | 17,156 | 0.3% |
† | Other—Industrials | | 786,034 | 13.3% |
| | | 1,023,943 | 17.3% |
Information Technology | | | |
| Diebold, Inc. | 398,651 | 20,810 | 0.4% |
* | Integrated Device Technology Inc. | 1,209,571 | 18,470 | 0.3% |
† | Other—Information Technology | | 542,579 | 9.1% |
| | | 581,859 | 9.8% |
Materials | | | |
| Lubrizol Corp. | 418,677 | 27,026 | 0.5% |
| Reliance Steel & Aluminum Co. | 414,053 | 23,295 | 0.4% |
| Commercial Metals Co. | 683,644 | 23,087 | 0.4% |
| FMC Corp. | 221,858 | 19,832 | 0.3% |
| Cabot Corp. | 387,019 | 18,453 | 0.3% |
| Cytec Industries, Inc. | 276,555 | 17,636 | 0.3% |
† | Other—Materials | | 308,148 | 5.2% |
| | | 437,477 | 7.4% |
| | | | |
† Telecommunication Services | | 35,298 | 0.6% |
| | | | |
Utilities | | | |
* | Sierra Pacific Resources | 1,344,814 | 23,615 | 0.4% |
| CMS Energy Corp. | 1,353,968 | 23,288 | 0.4% |
| Energen Corp. | 418,508 | 22,993 | 0.4% |
| National Fuel Gas Co. | 482,419 | 20,894 | 0.4% |
| OGE Energy Corp. | 554,858 | 20,336 | 0.3% |
| Southern Union Co. | 619,136 | 20,178 | 0.3% |
| AGL Resources Inc. | 473,034 | 19,148 | 0.3% |
| UGI Corp. Holding Co. | 641,786 | 17,508 | 0.3% |
† | Other—Utilities | | 299,475 | 5.1% |
| | | 467,435 | 7.9% |
Total Common Stocks (Cost $4,962,592) | | 5,910,305 | 100.0% 1 |
42
Vanguard Small-Cap Value Index Fund
| | Market | Percentage |
| | Value• | of Net |
| Shares | ($000) | Assets |
Temporary Cash Investments | | | |
Money Market Fund | | | |
2 Vanguard Market Liquidity Fund, 5.281%—Note E | 171,896,600 | 171,897 | 2.9% |
| | | |
†3U.S. Agency Obligation | | 1,998 | 0.1% |
Total Temporary Cash Investments (Cost $173,895) | | 173,895 | 3.0%1 |
Total Investments (Cost $5,136,487) | | 6,084,200 | 103.0% |
Other Assets and Liabilities | | | |
Other Assets—Note B | | 29,329 | 0.5% |
Security Lending Collateral Payable to Brokers—Note E | | (171,897) | (2.9%) |
Other Liabilities | | (32,008) | (0.6%) |
| | (174,576) | (3.0%) |
Net Assets | | 5,909,624 | 100.0% |
43
Vanguard Small-Cap Value Index Fund
At June 30, 2007, net assets consisted of:4 | |
| Amount |
| ($000) |
Paid-in Capital | 5,063,315 |
Undistributed Net Investment Income | 46,788 |
Accumulated Net Realized Losses | (148,265) |
Unrealized Appreciation | |
Investment Securities | 947,713 |
Futures Contracts | 73 |
Net Assets | 5,909,624 |
| |
Investor Shares—Net Assets | |
Applicable to 254,805,477 outstanding $.001 par value shares of | |
beneficial interest (unlimited authorization) | 4,557,760 |
Net Asset Value Per Share—Investor Shares | $17.89 |
| |
Institutional Shares—Net Assets | |
Applicable to 32,336,702 outstanding $.001 par value shares of | |
beneficial interest (unlimited authorization) | 580,155 |
Net Asset Value Per Share—Institutional Shares | $17.94 |
| |
ETF Shares—Net Assets | |
Applicable to 10,333,661 outstanding $.001 par value shares of | |
beneficial interest (unlimited authorization) | 771,709 |
Net Asset Value Per Share—ETF Shares | $74.68 |
• | See Note A in Notes to Financial Statements. |
* | Non-income-producing security. |
^ | Part of security position is on loan to broker-dealers. See Note E in Notes to Financial Statements. |
† Represents the aggregate value, by category, of securities that are not among the 50 largest holdings and, in total for any issuer, represent 1% or less of net assets.
1 The fund invests a portion of its cash reserves in equity markets through the use of index futures contracts. After giving effect to futures investments, the fund’s effective common stock and temporary cash investment positions represent 100.1% and 2.9%, respectively, of net assets. See Note C in Notes to Financial Statements.
2 Affiliated money market fund available only to Vanguard funds and certain trusts and accounts managed by Vanguard. Rate shown is the 7-day yield.
3 Securities with a value of $1,998,000 have been segregated as initial margin for open futures contracts.
4 See Note C in Notes to Financial Statements for the tax-basis components of net assets.
REIT—Real Estate Investment Trust.
44
Vanguard Small-Cap Value Index Fund
Statement of Operations
| Six Months Ended |
| June 30, 2007 |
| ($000) |
Investment Income | |
Income | |
Dividends | 54,729 |
Interest1 | 705 |
Security Lending | 1,483 |
Total Income | 56,917 |
Expenses | |
The Vanguard Group—Note B | |
Investment Advisory Services | 131 |
Management and Administrative | |
Investor Shares | 4,135 |
Institutional Shares | 100 |
ETF Shares | 259 |
Marketing and Distribution | |
Investor Shares | 507 |
Institutional Shares | 58 |
ETF Shares | 78 |
Custodian Fees | 176 |
Shareholders’ Reports | |
Investor Shares | 54 |
Institutional Shares | 1 |
ETF Shares | 11 |
Trustees’ Fees and Expenses | 4 |
Total Expenses | 5,514 |
Net Investment Income | 51,403 |
Realized Net Gain (Loss) | |
Investment Securities Sold | 196,162 |
Futures Contracts | 1,636 |
Realized Net Gain (Loss) | 197,798 |
Change In Unrealized Appreciation (Depreciation) | |
Investment Securities | 26,845 |
Futures Contracts | 237 |
Change in Unrealized Appreciation (Depreciation) | 27,082 |
Net Increase (Decrease) in Net Assets Resulting from Operations | 276,283 |
1 Interest income from an affiliated company of the fund was $646,000.
45
Vanguard Small-Cap Value Index Fund
Statement of Changes in Net Assets
| Six Months Ended | Year Ended |
| June 30, | December 31, |
| 2007 | 2006 |
| ($000) | ($000) |
Increase (Decrease) in Net Assets | | |
Operations | | |
Net Investment Income | 51,403 | 92,392 |
Realized Net Gain (Loss) | 197,798 | 362,733 |
Change in Unrealized Appreciation (Depreciation) | 27,082 | 323,757 |
Net Increase (Decrease) in Net Assets Resulting from Operations | 276,283 | 778,882 |
Distributions | | |
Net Investment Income | | |
Investor Shares | (3,337) | (76,448) |
Institutional Shares | (417) | (6,047) |
ETF Shares | (505) | (9,561) |
Realized Capital Gain | | |
Investor Shares | — | — |
Institutional Shares | — | — |
ETF Shares | — | — |
Total Distributions | (4,259) | (92,056) |
Capital Share Transactions—Note F | | |
Investor Shares | 28,582 | 271,012 |
Institutional Shares | 247,110 | 18,330 |
ETF Shares | 227,584 | 277,048 |
Net Increase (Decrease) from Capital Share Transactions | 503,276 | 566,390 |
Total Increase (Decrease) | 775,300 | 1,253,216 |
Net Assets | | |
Beginning of Period | 5,134,324 | 3,881,108 |
End of Period1 | 5,909,624 | 5,134,324 |
1 Net Assets—End of Period includes undistributed (overdistributed) net investment income of $46,788,000 and ($356,000).
46
Vanguard Small-Cap Value Index Fund
Financial Highlights
Investor Shares | | | | | | |
| Six Months | | | | | |
| Ended | | | | | |
For a Share Outstanding | June 30, | Year Ended December 31, |
Throughout Each Period | 2007 | 2006 | 2005 | 2004 | 2003 | 2002 |
Net Asset Value, Beginning of Period | $17.05 | $14.56 | $13.97 | $11.49 | $ 8.52 | $10.29 |
Investment Operations | | | | | | |
Net Investment Income | .153 | .311 | .263 | .227 | .192 | .090 |
Net Realized and Unrealized Gain | | | | | | |
(Loss) on Investments | .700 | 2.488 | .589 | 2.478 | 2.976 | (1.494) |
Total from Investment Operations | .853 | 2.799 | .852 | 2.705 | 3.168 | (1.404) |
Distributions | | | | | | |
Dividends from Net Investment Income | (.013) | (.309) | (.262) | (.225) | (.198) | (.090) |
Distributions from Realized Capital Gains | — | — | — | — | — | (.276) |
Total Distributions | (.013) | (.309) | (.262) | (.225) | (.198) | (.366) |
Net Asset Value, End of Period | $17.89 | $17.05 | $14.56 | $13.97 | $11.49 | $ 8.52 |
| | | | | | |
Total Return1 | 5.00% | 19.24% | 6.07% | 23.55% | 37.19% | –14.20% |
| | | | | | |
Ratios/Supplemental Data | | | | | | |
Net Assets, End of Period (Millions) | $4,558 | $4,314 | $3,446 | $2,947 | $1,730 | $1,176 |
Ratio of Total Expenses to | | | | | | |
Average Net Assets | 0.22%* | 0.23% | 0.23% | 0.23% | 0.27% | 0.27% |
Ratio of Net Investment | | | | | | |
Income to Average Net Assets | 1.80%* | 2.06% | 1.96% | 2.15% | 2.07% | 0.93% |
Portfolio Turnover Rate2 | 28%* | 25% | 28% | 30% | 100%3 | 57% |
1 Total returns do not reflect the 0.5% transaction fee on purchases through March 31, 2002, or the account service fee that may be applicable to certain accounts with balances below $10,000.
2 Excludes the value of portfolio securities received or delivered as a result of in-kind purchases or redemptions of the fund’s capital shares, including ETF Creation Units.
3 Includes activity related to a change in the fund’s target index.
47
Vanguard Small-Cap Value Index Fund
Institutional Shares | | | | | | |
| Six Months | | | | | |
| Ended | | | | | |
For a Share Outstanding | June 30, | Year Ended December 31, |
Throughout Each Period | 2007 | 2006 | 2005 | 2004 | 2003 | 2002 |
Net Asset Value, Beginning of Period | $17.09 | $14.59 | $13.99 | $11.50 | $ 8.53 | $10.29 |
Investment Operations | | | | | | |
Net Investment Income | .164 | .345 | .294 | .255 | .198 | .114 |
Net Realized and Unrealized Gain | | | | | | |
(Loss) on Investments | .700 | 2.488 | .589 | 2.478 | 2.976 | (1.494) |
Total from Investment Operations | .864 | 2.833 | .883 | 2.733 | 3.174 | (1.380) |
Distributions | | | | | | |
Dividends from Net Investment Income | (.014) | (.333) | (.283) | (.243) | (.204) | (.104) |
Distributions from Realized Capital Gains | — | — | — | — | — | (.276) |
Total Distributions | (.014) | (.333) | (.283) | (.243) | (.204) | (.380) |
Net Asset Value, End of Period | $17.94 | $17.09 | $14.59 | $13.99 | $11.50 | $ 8.53 |
| | | | | | |
Total Return1 | 5.06% | 19.44% | 6.28% | 23.77% | 37.22% | –13.96% |
| | | | | | |
Ratios/Supplemental Data | | | | | | |
Net Assets, End of Period (Millions) | $580 | $310 | $247 | $153 | $106 | $338 |
Ratio of Total Expenses to | | | | | | |
Average Net Assets | 0.07%* | 0.08% | 0.08% | 0.08% | 0.10% | 0.10% |
Ratio of Net Investment Income to | | | | | | |
Average Net Assets | 1.95%* | 2.21% | 2.11% | 2.29% | 2.24% | 1.08% |
Portfolio Turnover Rate2 | 28%* | 25% | 28% | 30% | 100%3 | 57% |
1 Total returns do not reflect the 0.5% transaction fee on purchases through March 31, 2002.
2 Excludes the value of portfolio securities received or delivered as a result of in-kind purchases or redemptions of the fund’s capital shares, including ETF Creation Units.
3 Includes activity related to a change in the fund’s target index.
48
Vanguard Small-Cap Value Index Fund
ETF Shares | | | | |
| Six Months | | Jan. 26, |
| Ended | Year Ended | 20041 to |
| June 30, | December 31, | Dec. 31, |
For a Share Outstanding Throughout Each Period | 2007 | 2006 | 2005 | 2004 |
Net Asset Value, Beginning of Period | $71.16 | $60.76 | $58.31 | $50.53 |
Investment Operations | | | | |
Net Investment Income | .681 | 1.380 | 1.174 | .930 |
Net Realized and Unrealized Gain (Loss) on Investments | 2.897 | 10.391 | 2.443 | 7.818 |
Total from Investment Operations | 3.578 | 11.771 | 3.617 | 8.748 |
Distributions | | | | |
Dividends from Net Investment Income | (.058) | (1.371) | (1.167) | (.968) |
Distributions from Realized Capital Gains | — | — | — | — |
Total Distributions | (.058) | (1.371) | (1.167) | (.968) |
Net Asset Value, End of Period | $74.68 | $71.16 | $60.76 | $58.31 |
| | | | |
Total Return | 5.03% | 19.40% | 6.20% | 17.34% |
| | | | |
Ratios/Supplemental Data | | | | |
Net Assets, End of Period (Millions) | $772 | $510 | $188 | $47 |
Ratio of Total Expenses to Average Net Assets | 0.12%* | 0.12% | 0.12% | 0.22%* |
Ratio of Net Investment Income to Average Net Assets | 1.90%* | 2.17% | 2.07% | 2.16%* |
Portfolio Turnover Rate2 | 28%* | 25% | 28% | 30% |
1 Inception.
2 Excludes the value of portfolio securities received or delivered as a result of in-kind purchases or redemptions of the fund’s capital shares, including ETF Creation Units.
See accompanying Notes, which are an integral part of the Financial Statements.
49
Vanguard Small-Cap Value Index Fund
Notes to Financial Statements
Vanguard Small-Cap Value Index Fund is registered under the Investment Company Act of 1940 as an open-end investment company, or mutual fund. The fund offers three classes of shares: Investor Shares, Institutional Shares, and ETF Shares. Investor Shares are available to any investor who meets the fund’s minimum purchase requirements. Institutional Shares are designed for investors who meet certain administrative and service criteria and invest a minimum of $5 million. ETF Shares are listed for trading on the American Stock Exchange; they can be purchased and sold through a broker.
A. The following significant accounting policies conform to generally accepted accounting principles for U.S. mutual funds. The fund consistently follows such policies in preparing its financial statements.
1. Security Valuation: Securities are valued as of the close of trading on the New York Stock Exchange (generally 4 p.m., Eastern time) on the valuation date. Equity securities are valued at the latest quoted sales prices or official closing prices taken from the primary market in which each security trades; such securities not traded on the valuation date are valued at the mean of the latest quoted bid and asked prices. Securities for which market quotations are not readily available, or whose values have been materially affected by events occurring before the fund’s pricing time but after the close of the securities’ primary markets, are valued by methods deemed by the board of trustees to represent fair value. Investments in Vanguard Market Liquidity Fund are valued at that fund’s net asset value. Temporary cash investments acquired over 60 days to maturity are valued using the latest bid prices or using valuations based on a matrix system (which considers such factors as security prices, yields, maturities, and ratings), both as furnished by independent pricing services. Other temporary cash investments are valued at amortized cost, which approximates market value.
2. Futures Contracts: The fund uses index futures contracts to a limited extent, with the objectives of maintaining full exposure to the stock market, enhancing returns, maintaining liquidity, and minimizing transaction costs. The fund may purchase futures contracts to immediately invest incoming cash in the market, or sell futures in response to cash outflows, thereby simulating a fully invested position in the underlying index while maintaining a cash balance for liquidity. The fund may seek to enhance returns by using futures contracts instead of the underlying securities when futures are believed to be priced more attractively than the underlying securities. The primary risks associated with the use of futures contracts are imperfect correlation between changes in market values of stocks held by the fund and the prices of futures contracts, and the possibility of an illiquid market.
Futures contracts are valued at their quoted daily settlement prices. The aggregate principal amounts of the contracts are not recorded in the Statement of Net Assets. Fluctuations in the value of the contracts are recorded in the Statement of Net Assets as an asset (liability) and in the Statement of Operations as unrealized appreciation (depreciation) until the contracts are closed, when they are recorded as realized futures gains (losses).
3. Federal Income Taxes: The fund intends to continue to qualify as a regulated investment company and distribute all of its taxable income. Accordingly, no provision for federal income taxes is required in the financial statements.
4. Distributions: Distributions to shareholders are recorded on the ex-dividend date.
5. Security Lending: The fund may lend its securities to qualified institutional borrowers to earn additional income. Security loans are required to be secured at all times by collateral at least equal to the market value of securities loaned. The fund invests cash collateral received in Vanguard Market Liquidity Fund, and records a liability for the return of the collateral, during the period the securities are on loan. Security lending income represents the income earned on investing cash collateral, less expenses associated with the loan.
50
Vanguard Small-Cap Value Index Fund
6. Other: Dividend income is recorded on the ex-dividend date. Interest income includes income distributions received from Vanguard Market Liquidity Fund and is accrued daily. Security transactions are accounted for on the date securities are bought or sold. Costs used to determine realized gains (losses) on the sale of investment securities are those of the specific securities sold.
Each class of shares has equal rights as to assets and earnings, except that each class separately bears certain class-specific expenses related to maintenance of shareholder accounts (included in Management and Administrative expenses) and shareholder reporting. Marketing and distribution expenses are allocated to each class of shares based on a method approved by the board of trustees. Income, other non-class-specific expenses, and gains and losses on investments are allocated to each class of shares based on its relative net assets.
B. The Vanguard Group furnishes at cost investment advisory, corporate management, administrative, marketing, and distribution services. The costs of such services are allocated to the fund under methods approved by the board of trustees. The fund has committed to provide up to 0.40% of its net assets in capital contributions to Vanguard. At June 30, 2007, the fund had contributed capital of $525,000 to Vanguard (included in Other Assets), representing 0.01% of the fund’s net assets and 0.52% of Vanguard’s capitalization. The fund’s trustees and officers are also directors and officers of Vanguard.
C. Distributions are determined on a tax basis and may differ from net investment income and realized capital gains for financial reporting purposes. Differences may be permanent or temporary. Permanent differences are reclassified among capital accounts in the financial statements to reflect their tax character. Temporary differences arise when certain items of income, expense, gain, or loss are recognized in different periods for financial statement and tax purposes; these differences will reverse at some time in the future. Differences in classification may also result from the treatment of short-term gains as ordinary income for tax purposes.
During the six months ended June 30, 2007, the fund realized $262,856,000 of net capital gains resulting from in-kind redemptions—in which shareholders exchange fund shares for securities held by the fund rather than for cash. Because such gains are not taxable to the fund, and are not distributed to shareholders, they have been reclassified from accumulated net realized gains to paid-in capital.
The fund’s tax-basis capital gains and losses are determined only at the end of each fiscal year. For tax purposes, at December 31, 2006, the fund had available realized losses of $80,822,000 to offset future net capital gains of $67,032,000 through December 31, 2011, and $13,790,000 through December 31, 2015. The fund will use these capital losses to offset net taxable capital gains, if any, realized during the year ending December 31, 2007; should the fund realize net capital losses for the year, the losses will be added to the loss carryforward balances above.
At June 30, 2007, the cost of investment securities for tax purposes was $5,136,487,000. Net unrealized appreciation of investment securities for tax purposes was $947,713,000, consisting of unrealized gains of $1,096,877,000 on securities that had risen in value since their purchase and $149,164,000 in unrealized losses on securities that had fallen in value since their purchase.
51
Vanguard Small-Cap Value Index Fund
At June 30, 2007, the aggregate settlement value of open futures contracts expiring in September 2007 and the related unrealized appreciation (depreciation) were:
| | | ($000) |
| | Aggregate | Unrealized |
| Number of | Settlement | Appreciation |
Futures Contracts | Long Contracts | Value | (Depreciation) |
Russell 2000 Index | 10 | 4,211 | 73 |
Unrealized appreciation (depreciation) on open futures contracts is required to be treated as realized gain (loss) for tax purposes.
D. During the six months ended June 30, 2007, the fund purchased $2,075,092,000 of investment securities and sold $1,486,190,000 of investment securities other than temporary cash investments.
E. The market value of securities on loan to broker-dealers at June 30, 2007, was $162,302,000, for which the fund received cash collateral of $171,897,000.
F. Capital share transactions for each class of shares were:
| Six Months Ended | Year Ended |
| June 30, 2007 | December 31, 2006 |
| Amount | Shares | Amount | Shares |
| ($000) | (000) | ($000) | (000) |
Investor Shares | | | | |
Issued | 603,237 | 34,511 | 988,544 | 61,990 |
Issued in Lieu of Cash Distributions | 3,093 | 176 | 70,455 | 4,169 |
Redeemed | (577,748) | (32,888) | (787,987) | (49,861) |
Net Increase (Decrease)—Investor Shares | 28,582 | 1,799 | 271,012 | 16,298 |
Institutional Shares | | | | |
Issued | 314,521 | 18,000 | 98,157 | 6,180 |
Issued in Lieu of Cash Distributions | 341 | 19 | 4,228 | 250 |
Redeemed | (67,752) | (3,808) | (84,055) | (5,256) |
Net Increase (Decrease)—Institutional Shares | 247,110 | 14,211 | 18,330 | 1,174 |
ETF Shares | | | | |
Issued | 924,691 | 12,362 | 1,260,357 | 18,385 |
Issued in Lieu of Cash Distributions | — | — | — | — |
Redeemed | (697,107) | (9,200) | (983,309) | (14,300) |
Net Increase (Decrease)—ETF Shares | 227,584 | 3,162 | 277,048 | 4,085 |
G. In June 2006, the Financial Accounting Standards Board issued Interpretation No. 48 (“FIN 48”), “Accounting for Uncertainty in Income Taxes.” FIN 48 establishes the minimum threshold for recognizing, and a system for measuring, the benefits of tax-return positions in financial statements, effective for the fund’s current fiscal year. Management has analyzed the fund’s tax positions taken on federal income tax returns for all open tax years (tax years ended December 31, 2004–2006) for purposes of implementing FIN 48, and has concluded that no provision for income tax is required in the fund's financial statements.
52
About Your Fund’s Expenses
As a shareholder of the fund, you incur ongoing costs, which include costs for portfolio management, administrative services, and shareholder reports (like this one), among others. Operating expenses, which are deducted from a fund’s gross income, directly reduce the investment return of the fund.
A fund’s expenses are expressed as a percentage of its average net assets. This figure is known as the expense ratio. The following examples are intended to help you understand the ongoing costs (in dollars) of investing in your fund and to compare these costs with those of other mutual funds. The examples are based on an investment of $1,000 made at the beginning of the period shown and held for the entire period.
The table on page 54 illustrates your fund’s costs in two ways:
• Based on actual fund return. This section helps you to estimate the actual expenses that you paid over the period. The “Ending Account Value” shown is derived from the fund’s actual return, and the third column shows the dollar amount that would have been paid by an investor who started with $1,000 in the fund. You may use the information here, together with the amount you invested, to estimate the expenses that you paid over the period.
To do so, simply divide your account value by $1,000 (for example, an $8,600 account value divided by $1,000 = 8.6), then multiply the result by the number given for your fund under the heading “Expenses Paid During Period.”
• Based on hypothetical 5% yearly return. This section is intended to help you compare your fund’s costs with those of other mutual funds. It assumes that the fund had a yearly return of 5% before expenses, but that the expense ratio is unchanged. In this case—because the return used is not the fund’s actual return—the results do not apply to your investment. The example is useful in making comparisons because the Securities and Exchange Commission requires all mutual funds to calculate expenses based on a 5% return. You can assess your fund’s costs by comparing this hypothetical example with the hypothetical examples that appear in shareholder reports of other funds.
Note that the expenses shown in the table on page 54 are meant to highlight and help you compare ongoing costs only and do not reflect transaction costs incurred by the fund for buying and selling securities. Further, the expenses do not include any account service fee described in the prospectus. If such a fee were applied to your account, your costs would be higher. Your fund does not charge transaction fees, such as purchase or redemption fees, nor does it carry a “sales load.”
The calculations assume no shares were bought or sold during the period. Your actual costs may have been higher or lower, depending on the amount of your investment and the timing of any purchases or redemptions.
You can find more information about the funds’ expenses, including annual expense ratios, in the Financial Statements section of this report. For additional information on operating expenses and other shareholder costs, please refer to your fund’s current prospectus.
53
Six Months Ended June 30, 2007 | | | |
| | | | |
| | Beginning | Ending | Expenses |
| | Account Value | Account Value | Paid During |
| | 12/31/2006 | 6/30/2007 | Period1 |
Based on Actual Fund Return | | | |
| Small-Cap Index Fund | | | |
| Investor Shares | $1,000.00 | $1,091.85 | $1.14 |
| Admiral Shares | 1,000.00 | 1,092.14 | 0.62 |
| Signal Shares | 1,000.00 | 1,092.29 | 0.62 |
| Institutional Shares | 1,000.00 | 1,092.41 | 0.36 |
| ETF Shares | 1,000.00 | 1,092.35 | 0.52 |
Small-Cap Growth Index Fund | | | |
| Investor Shares | $1,000.00 | $1,134.25 | $1.16 |
| Institutional Shares | 1,000.00 | 1,135.18 | 0.37 |
| ETF Shares | 1,000.00 | 1,135.05 | 0.64 |
Small-Cap Value Index Fund | | | |
| Investor Shares | $1,000.00 | $1,050.04 | $1.12 |
| Institutional Shares | 1,000.00 | 1,050.57 | 0.36 |
| ETF Shares | 1,000.00 | 1,050.30 | 0.61 |
Based on Hypothetical 5% Yearly Return | | | |
Small-Cap Index Fund | | | |
| Investor Shares | $1,000.00 | $1,023.70 | $1.10 |
| Admiral Shares | 1,000.00 | 1,024.20 | 0.60 |
| Signal Shares | 1,000.00 | 1,024.20 | 0.60 |
| Institutional Shares | 1,000.00 | 1,024.45 | 0.35 |
| ETF Shares | 1,000.00 | 1,024.30 | 0.50 |
Small-Cap Growth Index Fund | | | |
| Investor Shares | $1,000.00 | $1,023.70 | $1.10 |
| Institutional Shares | 1,000.00 | 1,024.45 | 0.35 |
| ETF Shares | 1,000.00 | 1,024.20 | 0.60 |
Small-Cap Value Index Fund | | | |
| Investor Shares | $1,000.00 | $1,023.70 | $1.10 |
| Institutional Shares | 1,000.00 | 1,024.45 | 0.35 |
| ETF Shares | 1,000.00 | 1,024.20 | 0.60 |
1 The calculations are based on expenses incurred in the most recent six-month period. The funds’ annualized six-month expense ratios for that period are: 0.22% for the Small-Cap Index Fund Investor Shares, 0.12% for Admiral Shares, 0.12% for Signal Shares, 0.07% for Institutional Shares, and 0.10% for ETF Shares; 0.22% for the Small-Cap Growth Index Fund Investor Shares, 0.07% for Institutional Shares, and 0.12% for ETF Shares; 0.22% for the Small-Cap Value Index Fund Investor Shares, 0.07% for Institutional Shares, and 0.12% for ETF Shares. The dollar amounts shown as “Expenses Paid” are equal to the annualized expense ratio multiplied by the average account value over the period, multiplied by the number of days in the most recent six-month period, then divided by the number of days in the most recent 12-month period.
54
Trustees Approve Advisory Arrangement
The board of trustees of Vanguard Small-Cap Index Fund, Small-Cap Growth Index Fund, and Small-Cap Value Index Fund has renewed the funds’ investment advisory arrangement with The Vanguard Group, Inc. Vanguard—through its Quantitative Equity Group—serves as the investment advisor for the funds. The board determined that continuing the funds’ internalized management structure was in the best interests of the funds and their shareholders.
The board based its decision upon an evaluation of the advisor’s investment staff, portfolio management process, and performance. The trustees considered the factors discussed below, among others. However, no single factor determined whether the board approved the arrangement. Rather, it was the totality of the circumstances that drove the board’s decision.
Nature, extent, and quality of services
The board considered the quality of the funds’ investment management over both short- and long-term periods, and took into account the organizational depth and stability of the advisor. Vanguard has been managing investments for more than two decades. George U. Sauter, Vanguard managing director and chief investment officer, has been in the investment management business since 1985. Mr. Sauter has led the Quantitative Equity Group since 1987. The Quantitative Equity Group adheres to a sound, disciplined investment management process; the team has considerable experience, stability, and depth.
The board concluded that Vanguard’s experience, stability, depth, and performance, among other factors, warranted continuation of the advisory arrangement.
Investment performance
The board considered the short- and long-term performance of the funds, including any periods of outperformance or underperformance of their target benchmarks and peer groups. The board concluded that the funds have performed in line with expectations, and that their results have been consistent with their investment strategies. Information about the funds’ most recent performance can be found on the Performance Summary pages of this report.
Cost
The board concluded that the funds’ expense ratios were far below the average expense ratios charged by funds in their respective peer groups. The board noted that the funds’ advisory expense ratios were also well below their peer-group averages. Information about the funds’ expense ratios appears in the About Your Fund’s Expenses section of this report as well as in the Financial Statements sections.
The board does not conduct a profitability analysis of Vanguard because of Vanguard’s unique “at-cost” structure. Unlike most other mutual fund management companies, Vanguard is owned by the funds it oversees, and produces “profits” only in the form of reduced expenses for fund shareholders.
The benefit of economies of scale
The board concluded that the funds’ low-cost arrangement with Vanguard ensures that the funds will realize economies of scale as they grow, with the cost to shareholders declining as fund assets increase.
The board will consider whether to renew the advisory arrangement again after a one-year period.
55
Glossary
Beta. A measure of the magnitude of a fund’s past share-price fluctuations in relation to the ups and downs of a given market index. The index is assigned a beta of 1.00. Compared with a given index, a fund with a beta of 1.20 typically would have seen its share price rise or fall by 12% when the index rose or fell by 10%. A fund’s beta should be reviewed in conjunction with its R-squared (see definition below). The lower the R-squared, the less correlation there is between the fund and the index, and the less reliable beta is as an indicator of volatility.
Earnings Growth Rate. The average annual rate of growth in earnings over the past five years for the stocks now in a fund.
Expense Ratio. The percentage of a fund’s average net assets used to pay its annual administrative and advisory expenses. These expenses directly reduce returns to investors.
Foreign Holdings. The percentage of a fund represented by stocks or depositary receipts of companies based outside the United States.
Inception Date. The date on which the assets of a fund (or one of its share classes) are first invested in accordance with the fund’s investment objective. For funds with a subscription period, the inception date is the day after that period ends. Investment performance is measured from the inception date.
Median Market Cap. An indicator of the size of companies in which a fund invests; the midpoint of market capitalization (market price x shares outstanding) of a fund’s stocks, weighted by the proportion of the fund’s assets invested in each stock. Stocks representing half of the fund’s assets have market capitalizations above the median, and the rest are below it.
Price/Book Ratio. The share price of a stock divided by its net worth, or book value, per share. For a fund, the weighted average price/book ratio of the stocks it holds.
Price/Earnings Ratio. The ratio of a stock’s current price to its per-share earnings over the past year. For a fund, the weighted average P/E of the stocks it holds. P/E is an indicator of market expectations about corporate prospects; the higher the P/E, the greater the expectations for a company’s future growth.
R-Squared. A measure of how much of a fund’s past returns can be explained by the returns from the market in general, as measured by a given index. If a fund’s total returns were precisely synchronized with an index’s returns, its R-squared would be 1.00. If the fund’s returns bore no relationship to the index’s returns, its R-squared would be 0.
Return on Equity. The annual average rate of return generated by a company during the past five years for each dollar of shareholder’s equity (net income divided by shareholder’s equity). For a fund, the weighted average return on equity for the companies whose stocks it holds.
Short-Term Reserves. The percentage of a fund invested in highly liquid, short-term securities that can be readily converted to cash.
Turnover Rate. An indication of the fund’s trading activity. Funds with high turnover rates incur higher transaction costs and may be more likely to distribute capital gains (which may be taxable to investors). The turnover rate excludes in-kind transactions, which have minimal impact on costs.
Yield. A snapshot of a fund’s income from interest and dividends. The yield, expressed as a percentage of the fund’s net asset value, is based on income earned over the past 30 days and is annualized, or projected forward for the coming year. The index yield is based on the current annualized rate of income
provided by securities in the index.
56
This page intentionally left blank.
This page intentionally left blank.
This page intentionally left blank.
The People Who Govern Your Fund
The trustees of your mutual fund are there to see that the fund is operated and managed in your best interests since, as a shareholder, you are a part owner of the fund. Your fund’s trustees also serve on the board of directors of The Vanguard Group, Inc., which is owned by the Vanguard funds and provides services to them on an at-cost basis.
A majority of Vanguard’s board members are independent, meaning that they have no affiliation with Vanguard or the funds they oversee, apart from the sizable personal investments they have made as private individuals.
Our independent board members bring distinguished backgrounds in business, academia, and public service to their task of working with Vanguard officers to establish the policies and oversee the activities of the funds. Among board members’ responsibilities are selecting investment advisors for the funds; monitoring fund operations, performance, and costs; reviewing contracts; nominating and selecting new trustees/directors; and electing Vanguard officers.
Each trustee serves a fund until its termination; or until the trustee’s retirement, resignation, or death; or otherwise as specified in the fund’s organizational documents. Any trustee may be removed at a shareholders’ meeting by a vote representing two-thirds of the net asset value of all shares of the fund together with shares of other Vanguard funds organized within the same trust. The table on these two pages shows information for each trustee and executive officer of the fund. The mailing address of the trustees and officers is P.O. Box 876, Valley Forge, PA 19482.
Chairman of the Board, Chief Executive Officer, and Trustee |
| |
John J. Brennan1 | |
Born 1954 | Principal Occupation(s) During the Past Five Years: Chairman of the Board, Chief Executive |
Trustee since May 1987; | Officer, and Director/Trustee of The Vanguard Group, Inc., and of each of the investment |
Chairman of the Board and | companies served by The Vanguard Group. |
Chief Executive Officer | |
147 Vanguard Funds Overseen | |
| |
Independent Trustees | |
| |
Charles D. Ellis | |
Born 1937 | Principal Occupation(s) During the Past Five Years: Applecore Partners (pro bono ventures |
Trustee since January 2001 | in education); Senior Advisor to Greenwich Associates (international business strategy |
147 Vanguard Funds Overseen | consulting); Successor Trustee of Yale University; Overseer of the Stern School of Business |
| at New York University; Trustee of the Whitehead Institute for Biomedical Research. |
| |
Rajiv L. Gupta | |
Born 1945 | Principal Occupation(s) During the Past Five Years: Chairman and Chief Executive Officer |
Trustee since December 20012 | of Rohm and Haas Co. (chemicals); Board Member of the American Chemistry Council; |
147 Vanguard Funds Overseen | Director of Tyco International, Ltd. (diversified manufacturing and services) since 2005; |
| Trustee of Drexel University and of the Chemical Heritage Foundation. |
| |
Amy Gutmann | |
Born 1949 | Principal Occupation(s) During the Past Five Years: President of the University of |
Trustee since June 2006 | Pennsylvania since 2004; Professor in the School of Arts and Sciences, Annenberg School |
147 Vanguard Funds Overseen | for Communication, and Graduate School of Education of the University of Pennsylvania |
| since 2004; Provost (2001–2004) and Laurance S. Rockefeller Professor of Politics and |
| the University Center for Human Values (1990–2004), Princeton University; Director of |
| Carnegie Corporation of New York since 2005 and of Schuylkill River Development |
| Corporation and Greater Philadelphia Chamber of Commerce since 2004. |
JoAnn Heffernan Heisen | |
Born 1950 | Principal Occupation(s) During the Past Five Years: Corporate Vice President and |
Trustee since July 1998 | Chief Global Diversity Officer since 2006, Vice President and Chief Information |
147 Vanguard Funds Overseen | Officer (1997–2005), and Member of the Executive Committee of Johnson & |
| Johnson (pharmaceuticals/consumer products); Director of the University Medical |
| Center at Princeton and Women’s Research and Education Institute. |
| |
André F. Perold | |
Born 1952 | Principal Occupation(s) During the Past Five Years: George Gund Professor of Finance |
Trustee since December 2004 | and Banking, Harvard Business School; Senior Associate Dean, Director of Faculty |
147 Vanguard Funds Overseen | Recruiting, and Chair of Finance Faculty, Harvard Business School; Director and Chairman |
| of UNX, Inc. (equities trading firm) since 2003; Chair of the Investment Committee of |
| HighVista Strategies LLC (private investment firm) since 2005. |
| |
Alfred M. Rankin, Jr. | |
Born 1941 | Principal Occupation(s) During the Past Five Years: Chairman, President, Chief Executive |
Trustee since January 1993 | Officer, and Director of NACCO Industries, Inc. (forklift trucks/housewares/lignite); Director |
147 Vanguard Funds Overseen | of Goodrich Corporation (industrial products/aircraft systems and services). |
| |
| |
J. Lawrence Wilson | |
Born 1936 | Principal Occupation(s) During the Past Five Years: Retired Chairman and Chief Executive |
Trustee since April 1985 | Officer of Rohm and Haas Co. (chemicals); Director of Cummins Inc. (diesel engines) and |
147 Vanguard Funds Overseen | AmerisourceBergen Corp. (pharmaceutical distribution); Trustee of Vanderbilt University |
| and of Culver Educational Foundation. |
| |
Executive Officers1 | |
| |
Heidi Stam | |
Born 1956 | Principal Occupation(s) During the Past Five Years: Managing Director of The Vanguard |
Secretary since July 2005 | Group, Inc., since 2006; General Counsel of The Vanguard Group since 2005; Secretary of |
147 Vanguard Funds Overseen | The Vanguard Group, and of each of the investment companies served by The Vanguard |
| Group, since 2005; Principal of The Vanguard Group (1997–2006). |
| |
Thomas J. Higgins | |
Born 1957 | Principal Occupation(s) During the Past Five Years: Principal of The Vanguard Group, Inc.; |
Treasurer since July 1998 | Treasurer of each of the investment companies served by The Vanguard Group. |
147 Vanguard Funds Overseen | |
Vanguard Senior Management Team | | |
| | |
R. Gregory Barton | Kathleen C. Gubanich | Michael S. Miller |
Mortimer J. Buckley | Paul A. Heller | Ralph K. Packard |
James H. Gately | F. William McNabb, III | George U. Sauter |
|
Founder |
|
John C. Bogle |
Chairman and Chief Executive Officer, 1974–1996 |
1 Officers of the funds are “interested persons” as defined in the Investment Company Act of 1940.
2 December 2002 for Vanguard Equity Income Fund, Vanguard Growth Equity Fund, the Vanguard Municipal Bond Funds, and the Vanguard State Tax-Exempt Funds.
More information about the trustees is in the Statement of Additional Information, available from The Vanguard Group.
| 
|
| P.O. Box 2600 |
| Valley Forge, PA 19482-2600 |
Connect with Vanguard® > www.vanguard.com
Fund Information > 800-662-7447 | Vanguard, Vanguard.com, Admiral, Signal, Connect |
| with Vanguard, and the ship logo are trademarks of |
Direct Investor Account Services > 800-662-2739 | The Vanguard Group, Inc. |
| |
Institutional Investor Services > 800-523-1036 | |
| All other marks are the exclusive property of their |
Text Telephone for People | respective owners. |
With Hearing Impairment > 800-952-3335 | |
| |
| All comparative mutual fund data are from Lipper Inc. |
| or Morningstar, Inc., unless otherwise noted. |
| |
| |
This material may be used in conjunction | You can obtain a free copy of Vanguard’s proxy voting |
with the offering of shares of any Vanguard | guidelines by visiting our website, www.vanguard.com, |
fund only if preceded or accompanied by | and searching for “proxy voting guidelines,” or by calling |
the fund’s current prospectus. | Vanguard at 800-662-2739. They are also available from |
| the SEC’s website, www.sec.gov. In addition, you may |
| obtain a free report on how your fund voted the proxies for |
The funds or securities referred to herein are not | securities it owned during the 12 months ended June 30. |
sponsored, endorsed, or promoted by MSCI, and | To get the report, visit either www.vanguard.com |
MSCI bears no liability with respect to any such funds | or www.sec.gov. |
or securities. For any such funds or securities, the | |
prospectus or the Statement of Additional Information | You can review and copy information about your fund |
contains a more detailed description of the limited | at the SEC’s Public Reference Room in Washington, D.C. |
relationship MSCI has with The Vanguard Group and | To find out more about this public service, call the SEC |
any related funds. | at 202-551-8090. Information about your fund is also |
| available on the SEC’s website, and you can receive |
| copies of this information, for a fee, by sending a |
| request in either of two ways: via e-mail addressed to |
| publicinfo@sec.gov or via regular mail addressed to the |
| Public Reference Section, Securities and Exchange |
| Commission, Washington, DC 20549-0102. |
| |
| |
| |
| © 2007 The Vanguard Group, Inc. |
| All rights reserved. |
| Vanguard Marketing Corporation, Distributor. |
| |
| Q482 082007 |
| |
Vanguard® U.S. Stock Index Funds Mid-Capitalization Portfolios |
| |
| |
| |
| |
> Semiannual Report | |
| |
| |
| |
| |
June 30, 2007 | |
| |
| |
| |
| |
| 
|
| |
| |
| |
| |
Vanguard Extended Market Index Fund | |
| |
Vanguard Mid-Cap Index Fund | |
| |
Vanguard Mid-Cap Growth Index Fund | |
| |
Vanguard Mid-Cap Value Index Fund | |
| |
| |
> During the six months ended June 30, 2007, returns for Investor Shares of Vanguard’s mid-capitalization funds ranged from 7.8% for the Mid-Cap Value Index Fund to 14.1% for the Mid-Cap Growth Index Fund.
> All four funds achieved their objectives of closely tracking their respective target indexes; only the Mid-Cap Growth Index Fund’s return exceeded the average return among its peers.
> Mid-cap stocks outperformed large- and small-cap stocks during the period.
Contents | |
| |
Your Fund’s Total Returns | 1 |
Chairman’s Letter | 4 |
Extended Market Index Fund | 10 |
Mid-Cap Index Fund | 27 |
Mid-Cap Growth Index Fund | 47 |
Mid-Cap Value Index Fund | 59 |
About Your Fund’s Expenses | 72 |
Trustees Approve Advisory Arrangement | 74 |
Glossary | 75 |
| Mid-Cap Index Fund |

| Mid-Cap Growth Index Fund
Mid-Cap Value Index Fund |
|
|
Please note: The opinions expressed in this report are just that—informed opinions. They should not be considered promises or advice. Also, please keep in mind that the information and opinions cover the period through the date on the cover of this report. Of course, the risks of investing in your fund are spelled out in the prospectus.
Your Fund’s Total Returns
Six Months Ended June 30, 2007 | | |
| Ticker | Total |
| Symbol | Returns |
Vanguard Extended Market Index Fund | | |
Investor Shares | VEXMX | 9.6% |
Admiral™ Shares1 | VEXAX | 9.7 |
Signal™ Shares2 | VEMSX | 9.7 |
Institutional Shares3 | VIEIX | 9.7 |
ETF Shares4 | VXF | |
Market Price | | 9.8 |
Net Asset Value | | 9.7 |
S&P Completion Index | | 9.6 |
Average Mid-Cap Core Fund5 | | 11.4 |
| | |
| | |
Vanguard Mid-Cap Index Fund | | |
Investor Shares | VIMSX | 10.8% |
Admiral Shares | VIMAX | 10.9 |
Signal Shares | VMISX | 6.0 6 |
Institutional Shares | VMCIX | 11.0 |
ETF Shares | VO | |
Market Price | | 10.8 |
Net Asset Value | | 10.9 |
MSCI® US Mid-Cap 450 Index | | 11.0 |
Average Mid-Cap Core Fund5 | | 11.4 |
1 A lower-cost class of shares available to many longtime shareholders and to those with significant investments in the fund.
2 Signal Shares also carry lower costs and are available to certain institutional shareholders who meet specific administrative, service, and account-size criteria.
3 This class of shares carries low expenses and is available for a minimum initial investment of $5 million.
4 Vanguard ETF™ Shares are traded on the American Stock Exchange and are available only through brokers. The table shows ETF returns based on both the AMEX market price and the net asset value for a share. U.S. Pat. No. 6,879,964 B2.
5 Derived from data provided by Lipper Inc.
6 Return since the share-class inception on March 30, 2007.
1
Your Fund’s Total Returns
Six Months Ended June 30, 2007 | | |
| Ticker | Total |
| Symbol | Returns |
Vanguard Mid-Cap Growth Index Fund | | |
Investor Shares | VMGIX | 14.1% |
ETF Shares1 | VOT | |
Market Price | | 14.1 |
Net Asset Value | | 14.2 |
MSCI US Mid Cap Growth Index | | 14.2 |
Average Mid-Cap Growth Fund2 | | 12.8 |
| | |
| | |
Vanguard Mid-Cap Value Index Fund | | |
Investor Shares | VMVIX | 7.8% |
ETF Shares | VOE | |
Market Price | | 7.8 |
Net Asset Value | | 7.8 |
MSCI US Mid Cap Value Index | | 7.8 |
Average Mid-Cap Value Fund2 | | 10.9 |
1 Vanguard ETF Shares are traded on the American Stock Exchange and are available only through brokers. The table shows ETF returns based on both the AMEX market price and the net asset value for a share. U.S. Pat. No. 6,879,964 B2.
2 Derived from data provided by Lipper Inc.
2
Your Fund’s Performance at a Glance
December 31, 2006–June 30, 2007 | | | | |
| | | Distributions Per Share |
| Starting | Ending | Income | Capital |
| Share Price | Share Price | Dividends | Gains |
Vanguard Extended Market Index Fund | | | | |
Investor Shares | $38.68 | $42.39 | $0.007 | $0.000 |
Admiral Shares | 38.70 | 42.44 | 0.009 | 0.000 |
Signal Shares | 33.26 | 36.47 | 0.008 | 0.000 |
Institutional Shares | 38.71 | 42.46 | 0.009 | 0.000 |
ETF Shares | 102.06 | 111.94 | 0.022 | 0.000 |
Vanguard Mid-Cap Index Fund | | | | |
Investor Shares | $19.78 | $21.92 | $0.005 | $0.000 |
Admiral Shares | 89.73 | 99.52 | 0.024 | 0.000 |
Signal Shares | 29.631 | 31.42 | 0.000 | 0.000 |
Institutional Shares | 19.83 | 22.00 | 0.005 | 0.000 |
ETF Shares | 72.48 | 80.39 | 0.017 | 0.000 |
Vanguard Mid-Cap Growth Index Fund | | | | |
Investor Shares | $21.78 | $24.85 | $0.004 | $0.000 |
ETF Shares | 55.35 | 63.20 | 0.010 | 0.000 |
Vanguard Mid-Cap Value Index Fund | | | | |
Investor Shares | $22.34 | $24.07 | $0.004 | $0.000 |
ETF Shares | 56.67 | 61.08 | 0.010 | 0.000 |
1 Share price at inception on March 30, 2007.
3

Chairman’s Letter
Dear Shareholder,
During the past six months, economic growth in the United States and around the globe buoyed a wide range of stocks, driving the broad U.S. stock market to a gain of 7.6%. Mid-capitalization stocks did even better. The Investor Shares of the Vanguard Mid-Cap Index Fund gained 10.8% while those of the Vanguard Extended Market Index Fund returned 9.6%. The Extended Market Fund’s slightly lower return reflected its higher exposure to small-cap stocks, which didn’t quite keep pace with the mid-cap segment.
Performances for Vanguard’s newest funds, the growth and value slices of the mid-cap market, served as bookends for the broader market. Vanguard Mid-Cap Growth Index Fund gained 14.1%, compared with 7.8% for its value counterpart, the Mid-Cap Value Index Fund. The wide outperformance of growth stocks reversed the trend of recent years.
Stock market’s ascent was driven by global liquidity
The broad U.S. stock market notched impressive gains in the year’s first half, when an abundance of cash drove record numbers of mergers and acquisitions around the globe. The gains came amid increased volatility. In February, markets worldwide fell sharply following a sell-off in China, only to recover quickly and continue upward. The six-month period closed with two dips in June, owing to fears of accelerating inflation and slowing economic growth.
4
The best performers in the U.S. market were the so-called mega-caps—broadly diversified companies that are well-positioned to thrive during periods of economic transition. International stocks, particularly those in emerging markets, outperformed U.S. equities. The dollar slid against the euro and the British pound, further enhancing gains for Americans investing abroad.
Bond investors were hobbled by a shift in sentiment
The relationship between yield and maturity returned to normal during the past six months, as yields of intermediate-and longer-term bonds moved higher than short-term yields. The accompanying drop in prices was steepest for long-term and intermediate-term bonds.
Earlier in the year, bond yields seemed to reflect an assumption that the Federal Reserve Board might cut interest rates in response to weaker economic growth. As the year progressed, inflationary pressures and economic growth looked more substantial, producing a change in market sentiment, which resulted in higher yields and lower prices.
The broad taxable bond market returned 1.0% for the period, while municipal bonds posted a return of 0.1%. The Citigroup 3-Month Treasury Bill Index—a proxy for money market yields—returned 2.5% for the half-year.
Market Barometer | | | |
| | | Total Returns |
| | Periods Ended June 30, 2007 |
| Six Months | One Year | Five Years1 |
Stocks | | | |
Russell 1000 Index (Large-caps) | 7.2% | 20.4% | 11.3% |
Russell 2000 Index (Small-caps) | 6.4 | 16.4 | 13.9 |
Dow Jones Wilshire 5000 Index (Entire market) | 7.6 | 20.4 | 12.0 |
MSCI All Country World Index ex USA (International) | 12.6 | 30.1 | 19.9 |
| | | |
Bonds | | | |
Lehman U.S. Aggregate Bond Index (Broad taxable market) | 1.0% | 6.1% | 4.5% |
Lehman Municipal Bond Index | 0.1 | 4.7 | 4.6 |
Citigroup 3-Month Treasury Bill Index | 2.5 | 5.1 | 2.7 |
| | | |
CPI | | | |
Consumer Price Index | 3.2% | 2.7% | 3.0% |
1 Annualized.
5
Strong performance came despite setbacks for financials sector
A primary factor distinguishing performance among the four mid-cap funds was each fund’s exposure to the financials sector. Financial stocks struggled during the period as the prolonged upward trend in the performance of real estate investment trusts reversed course. In addition, troubles among lenders to homebuyers with weak credit rippled across thrifts, banks, and consumer loan companies.
The financials sector represented, on average, 22% of the two broad mid-cap indexes and more than 33% of the value fund. For the growth fund, financials made up less than 10%. This variation in exposure to a weak sector opened gaps in the funds’ returns.
Annualized Expense Ratios1 | |
Your fund compared with its peer group | |
| Expense |
| Ratio |
Extended Market Index Fund | |
Investor Shares | 0.24% |
Admiral Shares | 0.09 |
Signal Shares | 0.09 |
Institutional Shares | 0.06 |
ETF Shares | 0.08 |
Average Mid-Cap Core Fund | 1.83 |
| |
Mid-Cap Index Fund | |
Investor Shares | 0.21% |
Admiral Shares | 0.11 |
Signal Shares | 0.112 |
Institutional Shares | 0.07 |
ETF Shares | 0.13 |
Average Mid-Cap Core Fund | 1.83 |
| |
Mid-Cap Growth Index Fund | |
Investor Shares | 0.25% |
ETF Shares | 0.13 |
Average Mid-Cap Growth Fund | 1.56 |
| |
| |
Mid-Cap Value Index | |
Investor Shares | 0.25% |
ETF Shares | 0.13 |
Average Mid-Cap Value Fund | 1.45 |
1 Fund expense ratios reflect the six months ended June 30, 2007. Peer-group expense ratios are derived from data provided by Lipper Inc. and capture information through year-end 2006.
2 Inception date March 30, 2007.
6
The strong performance of other sectors more than compensated for weakness among financials stocks. Mirroring a global trend, the most robust gains came among energy producers and energy-equipment suppliers, industrial machinery and construction firms, and producers of chemicals and commodities. These areas have prospered in the wake of rapid industrialization, infrastructure development, and heavy capital spending in emerging countries.
Another prevalent theme was the boost many stocks received from merger-and-acquisition activity—whether the companies were targets or not. Two of the best performers among mid-cap stocks were CBOT Holdings, owner of the Chicago Board of Trade, and casino operator MGM Mirage, both subjects of bidding wars.
Vanguard manages its mid-cap index portfolios using proprietary index-tracking methodologies and trading strategies. Much of the credit for keeping all four funds in line with their respective benchmarks goes to the Vanguard Quantitative Equity Group and its battle-tested experience in using these techniques. The funds also gain from Vanguard’s low-cost structure, a powerful advantage that enables a greater portion of the funds’ returns to go to shareholders.
Style-based index funds: Use wisely
Vanguard uses a nine-box grid called a style box to show how our domestic stock fund holdings are distributed by investment style (growth, value, or blend) and market capitalization (large-, mid-, and small-cap companies)—style boxes are shown on the funds’ Profile pages in this report. With the addition of growth and value mid-cap funds, Vanguard’s stable of domestic stock index funds now includes offerings in each segment of the broad U.S. stock market.
The wise investor builds a portfolio with exposure to each segment of the stock and bond markets, based on his or her risk tolerance, goals, and time horizon. The grid-based display for each fund is intended to facilitate building such a portfolio. The danger is that the wide array of funds—at Vanguard and elsewhere—creates an opportunity for investors to pack their portfolios with too many funds that entail too much overlap.
If you need help building a portfolio appropriate to your needs, I invite you to explore the planning tools available on our website, Vanguard.com, or to take advantage of the broad range of advisory services Vanguard offers.
Thank you for investing with Vanguard.
Sincerely,

John J. Brennan
Chairman and Chief Executive Officer
July 18, 2007
7
Vanguard Extended Market ETF |
Premium/Discount: June 30, 2002–June 30, 2007 |
| | | | |
| Market Price Above or | Market Price Below |
| Equal to Net Asset Value | Net Asset Value |
| Number | Percentage | Number | Percentage |
Basis Point Differential1 | of Days | of Total Days | of Days | of Total Days |
0–24.9 | 588 | 46.66% | 612 | 48.57% |
25–49.9 | 32 | 2.54 | 20 | 1.59 |
50–74.9 | 3 | 0.24 | 3 | 0.24 |
75–100.0 | 1 | 0.08 | 1 | 0.08 |
>100.0 | 0 | 0.00 | 0 | 0.00 |
Total | 624 | 49.52% | 636 | 50.48% |
Vanguard Mid-Cap ETF |
Premium/Discount: January 26, 20042–June 30, 2007 |
| | | | |
| Market Price Above or | Market Price Below |
| Equal to Net Asset Value | | Net Asset Value |
| Number | Percentage | Number | Percentage |
Basis Point Differential1 | of Days | of Total Days | of Days | of Total Days |
0–24.9 | 488 | 56.41% | 374 | 43.23% |
25–49.9 | 0 | 0.00 | 1 | 0.12 |
50–74.9 | 0 | 0.00 | 0 | 0.00 |
75–100.0 | 0 | 0.00 | 1 | 0.12 |
>100.0 | 1 | 0.12 | 0 | 0.00 |
Total | 489 | 56.53% | 376 | 43.47% |
Vanguard Mid-Cap Growth ETF |
Premium/Discount: August 17, 20062–June 30, 2007 |
| | | | |
| Market Price Above or | Market Price Below |
| Equal to Net Asset Value | | Net Asset Value |
| Number | Percentage | Number | Percentage |
Basis Point Differential1 | of Days | of Total Days | of Days | of Total Days |
0–24.9 | 135 | 61.64% | 84 | 38.36% |
25–49.9 | 0 | 0.00 | 0 | 0.00 |
50–74.9 | 0 | 0.00 | 0 | 0.00 |
75–100.0 | 0 | 0.00 | 0 | 0.00 |
>100.0 | 0 | 0.00 | 0 | 0.00 |
Total | 135 | 61.64% | 84 | 38.36% |
1 One basis point equals 1/100 of a percentage point.
2 Inception.
8
Vanguard Mid-Cap Value ETF |
Premium/Discount: August 17, 20061–June 30, 2007 |
| | | | |
| Market Price Above or | Market Price Below |
| Equal to Net Asset Value | | Net Asset Value |
| Number | Percentage | Number | Percentage |
Basis Point Differential2 | of Days | of Total Days | of Days | of Total Days |
0–24.9 | 157 | 71.69% | 61 | 27.85% |
25–49.9 | 1 | 0.46 | 0 | 0.00 |
50–74.9 | 0 | 0.00 | 0 | 0.00 |
75–100.0 | 0 | 0.00 | 0 | 0.00 |
>100.0 | 0 | 0.00 | 0 | 0.00 |
Total | 158 | 72.15% | 61 | 27.85% |
1 Inception.
2 One basis point equals 1/100 of a percentage point.
9
Extended Market Index Fund
Fund Profile
As of June 30, 2007
Portfolio Characteristics | | |
| | Target | Broad |
| Fund | Index1 | Index2 |
Number of Stocks | 3,278 | 3,853 | 4,921 |
Median Market Cap | $2.8B | $2.8B | $32.6B |
Price/Earnings Ratio | 24.4x | 24.5x | 18.2x |
Price/Book Ratio | 2.7x | 2.7x | 2.9x |
Yield | | 1.0% | 1.7% |
Investor Shares | 1.0% | | |
Admiral Shares | 1.1% | | |
Signal Shares | 1.1% | | |
Institutional Shares | 1.2% | | |
ETF Shares | 1.1% | | |
Return on Equity | 12.6% | 12.7% | 18.2% |
Earnings Growth Rate | 19.5% | 19.2% | 20.7% |
Foreign Holdings | 0.5% | 0.5% | 0.0% |
Turnover Rate | 10%3 | — | — |
Expense Ratio | | — | — |
Investor Shares | 0.24%3 | | |
Admiral Shares | 0.09%3 | | |
Signal Shares | 0.09%3 | | |
Institutional Shares | 0.06%3 | | |
ETF Shares | 0.08%3 | | |
Short-Term Reserves | 0% | — | — |
Sector Diversification (% of portfolio) |
| | Target | Broad |
| Fund | Index1 | Index2 |
Consumer Discretionary | 15% | 15% | 12% |
Consumer Staples | 3 | 3 | 8 |
Energy | 8 | 8 | 10 |
Financials | 21 | 20 | 21 |
Health Care | 12 | 12 | 11 |
Industrials | 14 | 15 | 12 |
Information Technology | 15 | 15 | 15 |
Materials | 5 | 5 | 4 |
Telecommunication Services | 2 | 2 | 3 |
Utilities | 5 | 5 | 4 |
Volatility Measures4 | | |
| Fund Versus | Fund Versus |
| Spliced Index5 | Broad Index2 |
R-Squared | 1.00 | 0.88 |
Beta | 1.01 | 1.33 |
10
Ten Largest Holdings6 (% of total net assets) |
| | |
Genentech, Inc. | biotechnology | 1.1% |
NYSE Euronext | specialized finance | 0.6 |
American Tower Corp. | wireless | |
Class A | telecommunication | |
| services | 0.5 |
GlobalSantaFe Corp. | oil and gas drilling | 0.5 |
Liberty Global, Inc. | broadcasting | |
| and cable tv | 0.5 |
NII Holdings Inc. | wireless | |
| telecommunication | |
| services | 0.4 |
Nymex Holdings Inc. | specialized finance | 0.3 |
MasterCard, Inc. Class A | data processing | |
| and outsourced | |
| services | 0.3 |
CBOT Holdings, Inc. | | |
Class A | specialized finance | 0.3 |
Mirant Corp. | independent power | |
| producers and | |
| energy traders | 0.3 |
Top Ten | | 4.8% |
Investment Focus

1 S&P Completion Index.
2 Dow Jones Wilshire 5000 Index.
3 Annualized.
4 For an explanation of R-squared, beta, and other terms used here, see the Glossary on page 75.
5 Dow Jones Wilshire 4500 Index through June 17, 2005; S&P Transitional Completion Index through September 16, 2005; S&P Completion Index thereafter.
6 “Ten Largest Holdings” excludes any temporary cash investments and equity index products.
11
Extended Market Index Fund
Performance Summary
All of the returns in this report represent past performance, which is not a guarantee of future results that may be achieved by the fund. (Current performance may be lower or higher than the performance data cited. For performance data current to the most recent month-end, visit our website at www.vanguard.com/performance.) Note, too, that both investment returns and principal value can fluctuate widely, so an investor’s shares, when sold, could be worth more or less than their original cost. The returns shown do not reflect taxes that a shareholder would pay on fund distributions or on the sale of fund shares.
Fiscal-Year Total Returns (%): December 31, 1996–June 30, 2007
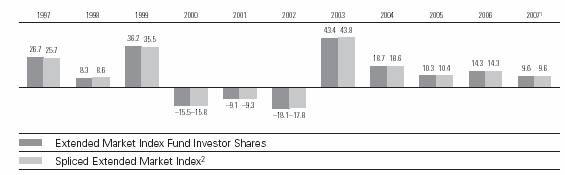
Average Annual Total Returns: Periods Ended June 30, 2007 |
| | | | |
| Inception Date | One Year | Five Years | Ten Years |
Investor Shares3 | 12/21/1987 | 18.75% | 16.03% | 9.49% |
Admiral Shares | 11/13/2000 | 18.90 | 16.15 | 8.214 |
Signal Shares | 9/1/2006 | 19.914 | — | — |
Institutional Shares | 7/7/1997 | 18.95 | 16.22 | 9.514 |
ETF Shares | 12/27/2001 | | | |
Market Price | | 19.06 | 16.14 | 12.784 |
Net Asset Value | | 18.95 | 16.15 | 12.794 |
1 Six months ended June 30, 2007.
2 Dow Jones Wilshire 4500 Index through June 17, 2005; S&P Transitional Completion Index through September 16, 2005; S&P Completion Index thereafter.
3 Total returns do not include the account service fee that may be applicable to certain accounts with balances below $10,000.
4 Return since inception.
Note: See Financial Highlights tables on pages 18 through 22 for dividend and capital gains information.
12
Extended Market Index Fund
Financial Statements (unaudited)
Statement of Net Assets—Investments Summary
As of June 30, 2007
This Statement summarizes the fund’s holdings by asset type (common stocks, bonds, etc.) and by industry sector. Details are reported for each of the fund’s 50 largest individual holdings and for investments that, in total for any issuer, represent more than 1% of the fund’s net assets. The total value of smaller holdings is reported as a single amount within each category.
The fund provides a complete list of its holdings four times in each fiscal year, at the quarter-ends. For the second and fourth fiscal quarters, the complete listing of the fund’s holdings is available electronically on Vanguard.com® and on the Securities and Exchange Commission’s website (www.sec.gov), or you can have it mailed to you without charge by calling 800-662-7447. For the first and third fiscal quarters, the fund files the lists with the SEC on Form N-Q. Shareholders can look up the fund’s Forms N-Q on the SEC’s website. Forms N-Q may also be reviewed and copied at the SEC’s Public Reference Room (see the back cover of this report for further information).
| | | Market | Percentage |
| | | Value• | of Net |
| | Shares | ($000) | Assets |
Common Stocks | | | |
Consumer Discretionary | | | |
* | Las Vegas Sands Corp. | 605,686 | 46,268 | 0.3% |
* | MGM Mirage, Inc. | 545,969 | 45,032 | 0.3% |
* | EchoStar Communications Corp. Class A | 899,080 | 38,993 | 0.3% |
* | Liberty Global, Inc. Series C | 925,757 | 36,382 | 0.3% |
* | Cablevision Systems NY Group Class A | 1,002,132 | 36,267 | 0.2% |
* | Liberty Global, Inc. Class A | 754,770 | 30,976 | 0.2% |
* | Discovery Holding Co. Class A | 1,225,445 | 28,173 | 0.2% |
† | Other—Consumer Discretionary | | 1,906,990 | 13.1% |
| | | 2,169,081 | 14.9% |
Consumer Staples | | | |
| Bunge Ltd. | 527,658 | 44,587 | 0.3% |
† | Other—Consumer Staples | | 356,581 | 2.5% |
| | | 401,168 | 2.8% |
Energy | | | |
| GlobalSantaFe Corp. | 997,725 | 72,086 | 0.5% |
| Noble Energy, Inc. | 747,024 | 46,607 | 0.3% |
* | Ultra Petroleum Corp. | 665,029 | 36,736 | 0.3% |
* | Cameron International Corp. | 482,379 | 34,476 | 0.2% |
| Tesoro Petroleum Corp. | 597,697 | 34,158 | 0.2% |
* | Southwestern Energy Co. | 736,353 | 32,768 | 0.2% |
* | Grant Prideco, Inc. | 557,762 | 30,024 | 0.2% |
| Diamond Offshore Drilling, Inc. | 278,539 | 28,288 | 0.2% |
* | Pride International, Inc. | 722,180 | 27,053 | 0.2% |
† | Other—Energy | | 802,843 | 5.6% |
| | | 1,145,039 | 7.9% |
Financials | | | |
| NYSE Euronext | 1,154,746 | 85,012 | 0.6% |
13
Extended Market Index Fund
| | | Market | Percentage |
| | | Value• | of Net |
| | Shares | ($000) | Assets |
| Nymex Holdings Inc. | 402,356 | 50,548 | 0.3% |
* | CBOT Holdings, Inc. Class A | 231,348 | 47,796 | 0.3% |
* | IntercontinentalExchange Inc. | 258,554 | 38,227 | 0.3% |
| SL Green Realty Corp. REIT | 259,932 | 32,203 | 0.2% |
| ^American Capital Strategies, Ltd. | 716,273 | 30,456 | 0.2% |
| Everest Re Group, Ltd. | 275,950 | 29,979 | 0.2% |
| A.G. Edwards, Inc. | 329,337 | 27,845 | 0.2% |
† | Other—Financials | | 2,664,936 | 18.4% |
| | | 3,007,002 | 20.7% |
Health Care | | | |
* | Genentech, Inc. | 2,026,537 | 153,328 | 1.1% |
† | Other—Health Care | | 1,534,305 | 10.5% |
| | | 1,687,633 | 11.6% |
Industrials | | | |
* | McDermott International, Inc. | 486,819 | 40,464 | 0.3% |
| Expeditors International of Washington, Inc. | 932,434 | 38,510 | 0.3% |
| Manpower Inc. | 369,973 | 34,126 | 0.2% |
* | Foster Wheeler Ltd. | 308,307 | 32,986 | 0.2% |
* | Jacobs Engineering Group Inc. | 517,494 | 29,761 | 0.2% |
* | AMR Corp. | 1,052,444 | 27,732 | 0.2% |
| Joy Global Inc. | 475,319 | 27,725 | 0.2% |
| The Dun & Bradstreet Corp. | 260,189 | 26,794 | 0.2% |
† | Other—Industrials | | 1,863,685 | 12.8% |
| | | 2,121,783 | 14.6% |
Information Technology | | | |
| MasterCard, Inc. Class A | 288,211 | 47,806 | 0.3% |
* | Akamai Technologies, Inc. | 721,372 | 35,088 | 0.2% |
| Microchip Technology, Inc. | 945,458 | 35,020 | 0.2% |
| Harris Corp. | 587,537 | 32,050 | 0.2% |
* | LAM Research Corp. | 590,056 | 30,329 | 0.2% |
| Amphenol Corp. | 782,644 | 27,901 | 0.2% |
* | Cadence Design Systems, Inc. | 1,217,791 | 26,743 | 0.2% |
† | Other—Information Technology | | 1,919,756 | 13.3% |
| | | 2,154,693 | 14.8% |
Materials | | | |
| Lyondell Chemical Co. | 940,369 | 34,906 | 0.2% |
| Martin Marietta Materials, Inc. | 186,792 | 30,264 | 0.2% |
† | Other—Materials | | 736,125 | 5.1% |
| | | 801,295 | 5.5% |
Telecommunication Services | | | |
* | American Tower Corp. Class A | 1,827,974 | 76,775 | 0.5% |
* | NII Holdings Inc. | 715,641 | 57,781 | 0.4% |
* | Level 3 Communications, Inc. | 6,688,921 | 39,130 | 0.3% |
* | Crown Castle International Corp. | 1,057,830 | 38,367 | 0.2% |
† | Other—Telecommunication Services | | 158,655 | 1.1% |
| | | 370,708 | 2.5% |
Utilities | | | |
* | Mirant Corp. | 1,119,300 | 47,738 | 0.3% |
* | Reliant Energy, Inc. | 1,492,911 | 40,234 | 0.3% |
14
Extended Market Index Fund
| | Market | Percentage |
| | Value• | of Net |
| Shares | ($000) | Assets |
* | NRG Energy, Inc. | 791,422 | 32,899 | 0.2% |
† | Other—Utilities | | 555,616 | 3.8% |
| | | 676,487 | 4.6% |
Total Common Stocks (Cost $10,853,832) | | 14,534,889 | 99.9%1 |
Temporary Cash Investments | | | |
Money Market Fund | | | |
2 Vanguard Market Liquidity Fund, 5.281% | 35,109,663 | 35,110 | 0.3% |
2 Vanguard Market Liquidity Fund, 5.281%—Note F | 656,766,430 | 656,766 | 4.5% |
| | 691,876 | 4.8% |
†3U.S. Agency Obligation | | 5,994 | 0.0% |
Total Temporary Cash Investments (Cost $697,869) | | 697,870 | 4.8%1 |
Total Investments (Cost $11,551,701) | | 15,232,759 | 104.7% |
Other Assets and Liabilities | | | |
Other Assets—Note B | | 220,744 | 1.5% |
Security Lending Collateral Payable to Brokers—Note F | | (656,766) | (4.5%) |
Other Liabilities | | (243,057) | (1.7%) |
| | (679,079) | (4.7%) |
Net Assets | | 14,553,680 | 100.0% |
15
Extended Market Index Fund
At June 30, 2007, net assets consisted of:4 | |
| Amount |
| ($000) |
Paid-in Capital | 11,049,581 |
Undistributed Net Investment Income | 76,523 |
Accumulated Net Realized Losses | (253,334) |
Unrealized Appreciation (Depreciation) | |
Investment Securities | 3,681,058 |
Futures Contracts | (148) |
Net Assets | 14,553,680 |
| |
Investor Shares—Net Assets | |
Applicable to 144,719,058 outstanding $.001 par value shares of | |
beneficial interest (unlimited authorization) | 6,134,757 |
Net Asset Value Per Share—Investor Shares | $42.39 |
| |
Admiral Shares—Net Assets | |
Applicable to 85,536,683 outstanding $.001 par value shares of | |
beneficial interest (unlimited authorization) | 3,630,335 |
Net Asset Value Per Share—Admiral Shares | $42.44 |
| |
Signal Shares—Net Assets | |
Applicable to 34,033,714 outstanding $.001 par value shares of | |
beneficial interest (unlimited authorization) | 1,241,261 |
Net Asset Value Per Share—Signal Shares | $36.47 |
| |
Institutional Shares—Net Assets | |
Applicable to 70,541,696 outstanding $.001 par value shares of | |
beneficial interest (unlimited authorization) | 2,995,262 |
Net Asset Value Per Share—Institutional Shares | $42.46 |
| |
ETF Shares—Net Assets | |
Applicable to 4,931,992 outstanding $.001 par value shares of | |
beneficial interest (unlimited authorization) | 552,065 |
Net Asset Value Per Share—ETF Shares | $111.94 |
• See Note A in Notes to Financial Statements.
* Non-income-producing security.
† Represents the aggregate value, by category, of securities that are not among the 50 largest holdings and, in total for any issuer, represent 1% or less of net assets.
^ Part of security position is on loan to broker-dealers. See Note F in Notes to Financial Statements.
1 The fund invests a portion of its cash reserves in equity markets through the use of index futures contracts. After giving effect to futures investments, the fund’s effective common stock and temporary cash investment positions represent 100.0% and 4.7%, respectively, of net assets. See Note D in Notes to Financial Statements.
2 Affiliated money market fund available only to Vanguard funds and certain trusts and accounts managed by Vanguard. Rate shown is the 7-day yield.
3 Securities with a value of $5,994,000 have been segregated as initial margin for open futures contracts.
4 See Note D in Notes to Financial Statements for the tax-basis components of net assets. REIT—Real Estate Investment Trust.
16
Extended Market Index Fund
Statement of Operations
| Six Months Ended |
| June 30, 2007 |
| ($000) |
Investment Income | |
Income | |
Dividends | 84,718 |
Interest1 | 1,985 |
Security Lending | 11,717 |
Total Income | 98,420 |
Expenses | |
The Vanguard Group—Note B | |
Investment Advisory Services | 261 |
Management and Administrative—Investor Shares | 6,429 |
Management and Administrative—Admiral Shares | 1,108 |
Management and Administrative—Signal Shares | 245 |
Management and Administrative—Institutional Shares | 372 |
Management and Administrative—ETF Shares | 103 |
Marketing and Distribution—Investor Shares | 758 |
Marketing and Distribution—Admiral Shares | 291 |
Marketing and Distribution—Signal Shares | 37 |
Marketing and Distribution—Institutional Shares | 363 |
Marketing and Distribution—ETF Shares | 67 |
Custodian Fees | 393 |
Shareholders’ Reports—Investor Shares | 129 |
Shareholders’ Reports—Admiral Shares | 6 |
Shareholders’ Reports—Signal Shares | 21 |
Shareholders’ Reports—Institutional Shares | 5 |
Shareholders’ Reports—ETF Shares | 10 |
Trustees’ Fees and Expenses | 9 |
Total Expenses | 10,607 |
Expense Paid Indirectly—Note C | (73) |
Net Expenses | 10,534 |
Net Investment Income | 87,886 |
Realized Net Gain (Loss) | |
Investment Securities Sold | 254,399 |
Futures Contracts | 2,317 |
Realized Net Gain (Loss) | 256,716 |
Change in Unrealized Appreciation (Depreciation) | |
Investment Securities | 921,928 |
Futures Contracts | 187 |
Change in Unrealized Appreciation (Depreciation) | 922,115 |
Net Increase (Decrease) in Net Assets Resulting from Operations | 1,266,717 |
1 Interest income from an affiliated company of the fund was $1,617,000.
17
Extended Market Index Fund
Statement of Changes in Net Assets
| Six Months Ended | | Year Ended |
| June 30, | | December 31, |
| 2007 | | 2006 |
| ($000) | | ($000) |
Increase (Decrease) in Net Assets | | | |
Operations | | | |
Net Investment Income | 87,886 | | 154,812 |
Realized Net Gain (Loss) | 256,716 | | 719,372 |
Change in Unrealized Appreciation (Depreciation) | 922,115 | | 691,989 |
Net Increase (Decrease) in Net Assets Resulting from Operations | 1,266,717 | | 1,566,173 |
Distributions | | | |
Net Investment Income | | | |
Investor Shares | (1,117) | | (73,789) |
Admiral Shares | (758) | | (41,672) |
Signal Shares | (125) | | (4,846) |
Institutional Shares | (628) | | (35,716) |
ETF Shares | (113) | | (5,621) |
Realized Capital Gain | | | |
Investor Shares | — | | — |
Admiral Shares | — | | — |
Signal Shares | — | | — |
Institutional Shares | — | | — |
ETF Shares | — | | — |
Total Distributions | (2,741) | | (161,644) |
Capital Share Transactions—Note G | | | |
Investor Shares | (624,411) | | 30,705 |
Admiral Shares | 182,306 | | 427,708 |
Signal Shares | 778,032 | | 391,212 |
Institutional Shares | 114,422 | | (43,076) |
ETF Shares | 91,927 | | (12,914) |
Net Increase (Decrease) from Capital Share Transactions | 542,276 | | 793,635 |
Total Increase (Decrease) | 1,806,252 | | 2,198,164 |
Net Assets | | | |
Beginning of Period | 12,747,428 | | 10,549,264 |
End of Period1 | 14,553,680 | | 12,747,428 |
1 Net Assets—End of Period includes undistributed (overdistributed) net investment income of $76,523,000 and ($8,622,000).
18
Extended Market Index Fund
Financial Highlights
Investor Shares | | | | | | |
| | | | | | |
| Six Months | | | | | |
| Ended | | | |
For a Share Outstanding | June 30, | Year Ended December 31, |
Throughout Each Period | 2007 | 2006 | 2005 | 2004 | 2003 | 2002 |
Net Asset Value, Beginning of Period | $38.68 | $34.26 | $31.36 | $26.66 | $18.74 | $23.09 |
Investment Operations | | | | | | |
Net Investment Income | .236 | .447 | .35 | .284 | .207 | .19 |
Net Realized and Unrealized Gain (Loss) | | | | | | |
on Investments | 3.481 | 4.440 | 2.88 | 4.701 | 7.926 | (4.36) |
Total from Investment Operations | 3.717 | 4.887 | 3.23 | 4.985 | 8.133 | (4.17) |
Distributions | | | | | | |
Dividends from Net Investment Income | (.007) | (.467) | (.33) | (.285) | (.213) | (.18) |
Distributions from Realized Capital Gains | — | — | — | — | — | — |
Total Distributions | (.007) | (.467) | (.33) | (.285) | (.213) | (.18) |
Net Asset Value, End of Period | $42.39 | $38.68 | $34.26 | $31.36 | $26.66 | $18.74 |
| | | | | | |
Total Return1 | 9.61% | 14.27% | 10.29% | 18.71% | 43.43% | –18.06% |
| | | | | | |
Ratios/Supplemental Data | | | | | | |
Net Assets, End of Period (Millions) | $6,135 | $6,172 | $5,441 | $5,484 | $4,259 | $2,629 |
Ratio of Total Expenses to | | | | | | |
Average Net Assets | 0.24%* | 0.25% | 0.25% | 0.25% | 0.26% | 0.26% |
Ratio of Net Investment Income to | | | | | | |
Average Net Assets | 1.18%* | 1.22% | 1.12% | 1.05% | 1.01% | 0.88% |
Portfolio Turnover Rate2 | 10%* | 16% | 27%3 | 17% | 8% | 17% |
1 Total returns do not include the account service fee that may be applicable to certain accounts with balances below $10,000.
2 Excludes the value of portfolio securities received or delivered as a result of in-kind purchases or redemptions of the fund’s capital shares, including ETF Creation Units.
3 Includes activity related to a change in the fund’s target index.
* Annualized.
19
Extended Market Index Fund
Admiral Shares | | | | | | |
| | | | | | |
| Six Months | | | | | |
| Ended | | | |
For a Share Outstanding | June 30, | Year Ended December 31, |
Throughout Each Period | 2007 | 2006 | 2005 | 2004 | 2003 | 2002 |
Net Asset Value, Beginning of Period | $38.70 | $34.28 | $31.36 | $26.66 | $18.74 | $23.09 |
Investment Operations | | | | | | |
Net Investment Income | .268 | .503 | .409 | .315 | .221 | .201 |
Net Realized and Unrealized Gain (Loss) | | | | | | |
on Investments | 3.481 | 4.440 | 2.880 | 4.701 | 7.926 | (4.360) |
Total from Investment Operations | 3.749 | 4.943 | 3.289 | 5.016 | 8.147 | (4.159) |
Distributions | | | | | | |
Dividends from Net Investment Income | (.009) | (.523) | (.369) | (.316) | (.227) | (.191) |
Distributions from Realized Capital Gains | — | — | — | — | — | — |
Total Distributions | (.009) | (.523) | (.369) | (.316) | (.227) | (.191) |
Net Asset Value, End of Period | $42.44 | $38.70 | $34.28 | $31.36 | $26.66 | $18.74 |
| | | | | | |
Total Return | 9.69% | 14.43% | 10.47% | 18.82% | 43.51% | –18.02% |
| | | | | | |
Ratios/Supplemental Data | | | | | | |
Net Assets, End of Period (Millions) | $3,630 | $3,137 | $2,379 | $1,353 | $1,075 | $611 |
Ratio of Total Expenses to | | | | | | |
Average Net Assets | 0.09%* | 0.10% | 0.10% | 0.15% | 0.20% | 0.20% |
Ratio of Net Investment Income to | | | | | | |
Average Net Assets | 1.33%* | 1.37% | 1.27% | 1.15% | 1.07% | 0.94% |
Portfolio Turnover Rate1 | 10%* | 16% | 27%2 | 17% | 8% | 17% |
1 Excludes the value of portfolio securities received or delivered as a result of in-kind purchases or redemptions of the fund’s capital shares, including ETF Creation Units.
2 Includes activity related to a change in the fund’s target index.
* Annualized.
20
Extended Market Index Fund
Signal Shares | | |
| Six Months | Sept. 1, |
| Ended | 20061 to |
| June 30, | Dec. 31, |
For a Share Outstanding Throughout Each Period | 2007 | 2006 |
Net Asset Value, Beginning of Period | $33.26 | $30.79 |
Investment Operations | | |
Net Investment Income | .235 | .173 |
Net Realized and Unrealized Gain (Loss) on Investments | 2.983 | 2.698 |
Total from Investment Operations | 3.218 | 2.871 |
Distributions | | |
Dividends from Net Investment Income | (.008) | (.401) |
Distributions from Realized Capital Gains | — | — |
Total Distributions | (.008) | (.401) |
Net Asset Value, End of Period | $36.47 | $33.26 |
| | |
Total Return | 9.68% | 9.33% |
| | |
Ratios/Supplemental Data | | |
Net Assets, End of Period (Millions) | $1,241 | $408 |
Ratio of Total Expenses to Average Net Assets | 0.09%* | 0.10%* |
Ratio of Net Investment Income to Average Net Assets | 1.33%* | 1.37%* |
Portfolio Turnover Rate2 | 10%* | 16% |
1 Inception.
2 Excludes the value of portfolio securities received or delivered as a result of in-kind purchases or redemptions of the fund’s capital shares, including ETF Creation Units.
* Annualized.
21
Extended Market Index Fund
Institutional Shares | | | | | | |
| | | | | | |
| Six Months | | | | | |
| Ended | | | |
For a Share Outstanding | June 30, | Year Ended December 31, |
Throughout Each Period | 2007 | 2006 | 2005 | 2004 | 2003 | 2002 |
Net Asset Value, Beginning of Period | $38.71 | $34.29 | $31.38 | $26.67 | $18.74 | $23.09 |
Investment Operations | | | | | | |
Net Investment Income | .276 | .513 | .419 | .343 | .247 | .22 |
Net Realized and Unrealized Gain (Loss) | | | | | | |
on Investments | 3.483 | 4.440 | 2.880 | 4.701 | 7.926 | (4.36) |
Total from Investment Operations | 3.759 | 4.953 | 3.299 | 5.044 | 8.173 | (4.14) |
Distributions | | | | | | |
Dividends from Net Investment Income | (.009) | (.533) | (.389) | (.334) | (.243) | (.21) |
Distributions from Realized Capital Gains | — | — | — | — | — | — |
Total Distributions | (.009) | (.533) | (.389) | (.334) | (.243) | (.21) |
Net Asset Value, End of Period | $42.46 | $38.71 | $34.29 | $31.38 | $26.67 | $18.74 |
| | | | | | |
Total Return | 9.71% | 14.46% | 10.50% | 18.92% | 43.66% | –17.93% |
| | | | | | |
Ratios/Supplemental Data | | | | | | |
Net Assets, End of Period (Millions) | $2,995 | $2,621 | $2,361 | $2,136 | $1,524 | $644 |
Ratio of Total Expenses to | | | | | | |
Average Net Assets | 0.06%* | 0.07% | 0.07% | 0.08% | 0.10% | 0.10% |
Ratio of Net Investment Income to | | | | | | |
Average Net Assets | 1.36%* | 1.40% | 1.30% | 1.22% | 1.17% | 1.05% |
Portfolio Turnover Rate1 | 10%* | 16% | 27%2 | 17% | 8% | 17% |
1 Excludes the value of portfolio securities received or delivered as a result of in-kind purchases or redemptions of the fund’s capital shares, including ETF Creation Units.
2 Includes activity related to a change in the fund’s target index.
* Annualized.
22
Extended Market Index Fund
ETF Shares | | | | | | |
| | | | | | |
| Six Months | | | | | |
| Ended | | | |
For a Share Outstanding | June 30, | Year Ended December 31, |
Throughout Each Period | 2007 | 2006 | 2005 | 2004 | 2003 | 2002 |
Net Asset Value, Beginning of Period | $102.06 | $90.40 | $82.74 | $70.37 | $49.46 | $60.99 |
Investment Operations | | | | | | |
Net Investment Income | .720 | 1.338 | 1.063 | .796 | .608 | .566 |
Net Realized and Unrealized Gain (Loss) | | | | | | |
on Investments | 9.182 | 11.716 | 7.613 | 12.387 | 20.914 | (11.561) |
Total from Investment Operations | 9.902 | 13.054 | 8.676 | 13.183 | 21.522 | (10.995) |
Distributions | | | | | | |
Dividends from Net Investment Income | (.022) | (1.394) | (1.016) | (.813) | (.612) | (.535) |
Distributions from Realized Capital Gains | — | — | — | — | — | — |
Total Distributions | (.022) | (1.394) | (1.016) | (.813) | (.612) | (.535) |
Net Asset Value, End of Period | $111.94 | $102.06 | $90.40 | $82.74 | $70.37 | $49.46 |
| | | | | | |
Total Return | 9.70% | 14.46% | 10.48% | 18.75% | 43.55% | –18.04% |
| | | | | | |
Ratios/Supplemental Data | | | | | | |
Net Assets, End of Period (Millions) | $552 | $409 | $368 | $231 | $107 | $30 |
Ratio of Total Expenses to | | | | | | |
Average Net Assets | 0.08%* | 0.08% | 0.08% | 0.20% | 0.20% | 0.20% |
Ratio of Net Investment Income to | | | | | | |
Average Net Assets | 1.34%* | 1.39% | 1.29% | 1.12% | 1.07% | 1.04% |
Portfolio Turnover Rate1 | 10%* | 16% | 27%2 | 17% | 8% | 17% |
1 Excludes the value of portfolio securities received or delivered as a result of in-kind purchases or redemptions of the fund’s capital shares, including ETF Creation Units.
2 Includes activity related to a change in the fund’s target index.
* Annualized.
See accompanying Notes, which are an integral part of the Financial Statements.
23
Extended Market Index Fund
Notes to Financial Statements
Vanguard Extended Market Index Fund is registered under the Investment Company Act of 1940 as an open-end investment company, or mutual fund. The fund offers five classes of shares: Investor Shares, Admiral Shares, Signal Shares, Institutional Shares, and ETF Shares. Investor Shares are available to any investor who meets the fund’s minimum purchase requirements. Admiral Shares are designed for investors who meet certain administrative, servicing, tenure, and account-size criteria. Signal Shares are designed for institutional investors who meet certain administrative, servicing, and account-size criteria. Institutional Shares are designed for investors who meet certain administrative and servicing criteria and invest a minimum of $5 million. ETF Shares are listed for trading on the American Stock Exchange; they can be purchased and sold through a broker.
A. The following significant accounting policies conform to generally accepted accounting principles for U.S. mutual funds. The fund consistently follows such policies in preparing its financial statements.
1. Security Valuation: Securities are valued as of the close of trading on the New York Stock Exchange (generally 4 p.m., Eastern time) on the valuation date. Equity securities are valued at the latest quoted sales prices or official closing prices taken from the primary market in which each security trades; such securities not traded on the valuation date are valued at the mean of the latest quoted bid and asked prices. Securities for which market quotations are not readily available, or whose values have been affected by events occurring before the fund’s pricing time but after the close of the securities’ primary markets, are valued by methods deemed by the board of trustees to represent fair value. Investments in Vanguard Market Liquidity Fund are valued at that fund’s net asset value. Temporary cash investments acquired over 60 days to maturity are valued using the latest bid prices or using valuations based on a matrix system (which considers such factors as security prices, yields, maturities, and ratings), both as furnished by independent pricing services. Other temporary cash investments are valued at amortized cost, which approximates market value.
2. Futures Contracts: The fund uses index futures contracts to a limited extent, with the objectives of maintaining full exposure to the stock market, enhancing returns, maintaining liquidity, and minimizing transaction costs. The fund may purchase futures contracts to immediately invest incoming cash in the market, or sell futures in response to cash outflows, thereby simulating a fully invested position in the underlying index while maintaining a cash balance for liquidity. The fund may seek to enhance returns by using futures contracts instead of the underlying securities when futures are believed to be priced more attractively than the underlying securities. The primary risks associated with the use of futures contracts are imperfect correlation between changes in market values of stocks held by the fund and the prices of futures contracts, and the possibility of an illiquid market.
Futures contracts are valued at their quoted daily settlement prices. The aggregate principal amounts of the contracts are not recorded in the Statement of Net Assets. Fluctuations in the value of the contracts are recorded in the Statement of Net Assets as an asset (liability) and in the Statement of Operations as unrealized appreciation (depreciation) until the contracts are closed, when they are recorded as realized futures gains (losses).
3. Federal Income Taxes: The fund intends to continue to qualify as a regulated investment company and distribute all of its taxable income. Accordingly, no provision for federal income taxes is required in the financial statements.
24
Extended Market Index Fund
4. Distributions: Distributions to shareholders are recorded on the ex-dividend date.
5. Security Lending: The fund may lend its securities to qualified institutional borrowers to earn additional income. Security loans are required to be secured at all times by collateral at least equal to the market value of securities loaned. The fund invests cash collateral received in Vanguard Market Liquidity Fund, and records a liability for the return of the collateral, during the period the securities are on loan. Security lending income represents the income earned on investing cash collateral, less expenses associated with the loan.
6. Other: Dividend income is recorded on the ex-dividend date. Interest income includes income distributions received from Vanguard Market Liquidity Fund and is accrued daily. Security transactions are accounted for on the date securities are bought or sold. Costs used to determine realized gains (losses) on the sale of investment securities are those of the specific securities sold.
Each class of shares has equal rights as to assets and earnings, except that each class separately bears certain class-specific expenses related to maintenance of shareholder accounts (included in Management and Administrative expenses) and shareholder reporting. Marketing and distribution expenses are allocated to each class of shares based on a method approved by the board of trustees. Income, other non-class-specific expenses, and gains and losses on investments are allocated to each class of shares based on its relative net assets.
B. The Vanguard Group furnishes at cost investment advisory, corporate management, administrative, marketing, and distribution services. The costs of such services are allocated to the fund under methods approved by the board of trustees. The fund has committed to provide up to 0.40% of its net assets in capital contributions to Vanguard. At June 30, 2007, the fund had contributed capital of $1,301,000 to Vanguard (included in Other Assets), representing 0.01% of the fund’s net assets and 1.30% of Vanguard’s capitalization. The fund’s trustees and officers are also directors and officers of Vanguard.
C. The fund’s custodian bank has agreed to reduce its fees when the fund maintains cash on deposit in the non-interest-bearing custody account. For the six months ended June 30, 2007, custodian fee offset arrangements reduced the fund’s expenses by $73,000.
D. Distributions are determined on a tax basis and may differ from net investment income and realized capital gains for financial-reporting purposes. Differences may be permanent or temporary. Permanent differences are reclassified among capital accounts in the financial statements to reflect their tax character. Temporary differences arise when certain items of income, expense, gain, or loss are recognized in different periods for financial statement and tax purposes; these differences will reverse at some time in the future. Differences in classification may also result from the treatment of short-term gains as ordinary income for tax purposes.
During the six months ended June 30, 2007, the fund realized $342,856,000 of net capital gains resulting from in-kind redemptions—in which shareholders exchanged fund shares for securities held by the fund rather than for cash. Because such gains are not taxable to the fund, and are not distributed to shareholders, they have been reclassified from accumulated net realized losses to paid-in capital.
The fund’s tax-basis capital gains and losses are determined only at the end of each fiscal year. For tax purposes, at December 31, 2006, the fund had available realized losses of $160,782,000 to offset future net capital gains of $100,407,000 through December 31, 2011, and $60,375,000 through December 31, 2014. The fund will use these capital losses to offset net taxable capital gains, if any, realized during the year ending December 31, 2007; should the fund realize net
25
Extended Market Index Fund
capital losses for the year, the losses will be added to the loss carryforward balances above.
At June 30, 2007, the cost of investment securities for tax purposes was $11,551,701,000. Net unrealized appreciation of investment securities for tax purposes was $3,681,058,000, consisting of unrealized gains of $4,618,817,000 on securities that had risen in value since their purchase and $937,759,000 in unrealized losses on securities that had fallen in value since their purchase.
At June 30, 2007, the aggregate settlement value of open futures contracts expiring in September 2007 and the related unrealized appreciation (depreciation) were:
| | | ($000) |
| | Aggregate | Unrealized |
| Number of | Settlement | Appreciation |
Futures Contracts | Long Contracts | Value | (Depreciation) |
S&P MidCap 400 Index | 42 | 18,988 | (147) |
Russell 2000 Index | 8 | 3,368 | (1) |
Unrealized appreciation (depreciation) on open futures contracts is required to be treated as realized gain (loss) for tax purposes.
E. During the six months ended June 30, 2007, the fund purchased $2,087,080,000 of investment securities and sold $1,412,234,000 of investment securities other than temporary cash investments.
F. The market value of securities on loan to broker-dealers at June 30, 2007, was $607,209,000, for which the fund received cash collateral of $656,766,000.
G. Capital share transactions for each class of shares were:
| Six Months Ended | | Year Ended |
| June 30, 2007 | | December 31, 2006 |
| Amount | Shares | | Amount | Shares |
| ($000) | (000) | | ($000) | (000) |
Investor Shares | | | | | |
Issued | 724,172 | 17,823 | | 1,608,224 | 44,045 |
Issued in Lieu of Cash Distributions | 1,086 | 27 | | 71,291 | 1,855 |
Redeemed | (1,349,669) | (32,697) | | (1,648,810) | (45,144) |
Net Increase (Decrease)—Investor Shares | (624,411) | (14,847) | | 30,705 | 756 |
Admiral Shares | | | | | |
Issued | 515,811 | 12,561 | | 847,742 | 23,202 |
Issued in Lieu of Cash Distributions | 668 | 16 | | 36,584 | 951 |
Redeemed | (334,173) | (8,107) | | (456,618) | (12,480) |
Net Increase (Decrease)—Admiral Shares | 182,306 | 4,470 | | 427,708 | 11,673 |
Signal Shares | | | | | |
Issued | 817,340 | 22,867 | | 398,586 | 12,510 |
Issued in Lieu of Cash Distributions | 125 | 4 | | 4,846 | 146 |
Redeemed | (39,433) | (1,116) | | (12,220) | (377) |
Net Increase (Decrease)—Signal Shares | 778,032 | 21,755 | | 391,212 | 12,279 |
26
Extended Market Index Fund
| Six Months Ended | | Year Ended |
| June 30, 2007 | | December 31, 2006 |
| Amount | Shares | | Amount | Shares |
| ($000) | (000) | | ($000) | (000) |
Institutional Shares | | | | | |
Issued | 385,590 | 9,430 | | 638,253 | 17,636 |
Issued in Lieu of Cash Distributions | 565 | 14 | | 31,622 | 822 |
Redeemed | (271,733) | (6,602) | | (712,951) | (19,622) |
Net Increase (Decrease)—Institutional Shares | 114,422 | 2,842 | | (43,076) | (1,164) |
ETF Shares | | | | | |
Issued | 917,443 | 8,525 | | 1,504,419 | 15,337 |
Issued in Lieu of Cash Distributions | — | — | | — | — |
Redeemed | (825,516) | (7,600) | | (1,517,333) | (15,400) |
Net Increase (Decrease)—ETF Shares | 91,927 | 925 | | (12,914) | (63) |
H. In June 2006, the Financial Accounting Standards Board issued Interpretation No. 48 (“FIN 48”), “Accounting for Uncertainty in Income Taxes.” FIN 48 establishes the minimum threshold for recognizing, and a system for measuring, the benefits of tax-return positions in financial statements, effective for the fund’s current fiscal year. Management has analyzed the fund’s tax positions taken on federal income tax returns for all open tax years (tax years ended December 31, 2004–2006) for purposes of implementing FIN 48, and has concluded that no provision for income tax is required in the fund’s financial statements.
27
Mid-Cap Index Fund
Fund Profile
As of June 30, 2007
Portfolio Characteristics | | |
| | Target | Broad |
| Fund | Index1 | Index2 |
Number of Stocks | 451 | 450 | 4,921 |
Median Market Cap | $7.0B | $6.9B | $32.6B |
Price/Earnings Ratio | 21.0x | 21.0x | 18.2x |
Price/Book Ratio | 2.9x | 2.9x | 2.9x |
Yield | | 1.2% | 1.7% |
Investor Shares | 1.1% | | |
Admiral Shares | 1.2% | | |
Signal Shares | 1.2%3 | | |
Institutional Shares | 1.2% | | |
ETF Shares | 1.2% | | |
Return on Equity | 16.3% | 16.3% | 18.2% |
Earnings Growth Rate | 20.1% | 19.7% | 20.7% |
Foreign Holdings | 1.1% | 1.1% | 0.0% |
Turnover Rate | 18%3 | — | — |
Expense Ratio | | — | — |
Investor Shares | 0.21%3 | | |
Admiral Shares | 011%3 | | |
Signal Shares | 0.11%3 | | |
Institutional Shares | 0.07%3 | | |
ETF Shares | 0.13%3 | | |
Short-Term Reserves | 0% | — | — |
Sector Diversification (% of portfolio) | |
| | Target | Broad |
| Fund | Index1 | Index2 |
Consumer Discretionary | 17% | 17% | 12% |
Consumer Staples | 4 | 4 | 8 |
Energy | 8 | 8 | 10 |
Financials | 20 | 20 | 21 |
Health Care | 10 | 10 | 11 |
Industrials | 13 | 13 | 12 |
Information Technology | 14 | 14 | 15 |
Materials | 6 | 6 | 4 |
Telecommunication | | | |
Services | 2 | 2 | 3 |
Utilities | 6 | 6 | 4 |
Volatility Measures4 |
| Fund Versus | Fund Versus |
| Target Index1 | Broad Index2 |
R-Squared | 1.00 | 0.89 |
Beta | 1.00 | 1.24 |
28
Ten Largest Holdings5 (% of total net assets) |
| | |
Precision Castparts Corp. | aerospace and | |
| defense | 0.6% |
NVIDIA Corp. | semiconductors | 0.5 |
Ameriprise Financial, Inc. | asset management | |
| and custody banks | 0.5 |
Noble Corp. | oil and gas drilling | 0.5 |
T. Rowe Price Group Inc. | asset management | |
| and custody banks | 0.5 |
Archstone-Smith Trust | | |
REIT | residential REITs | 0.5 |
United States Steel Corp. | steel | 0.5 |
Host Hotels & | | |
Resorts Inc. REIT | specialized REITs | 0.5 |
Hilton Hotels Corp. | hotels, resorts, | |
| and cruise lines | 0.5 |
L-3 Communications | aerospace and | |
Holdings, Inc. | defense | 0.5 |
Top Ten | | 5.1% |
Investment Focus
1 MSCI US Mid Cap 450 Index.
2 Dow Jones Wilshire 5000 Index.
3 Annualized.
4 For an explanation of R-squared, beta, and other terms used here, see the Glossary on page 75.
5 “Ten Largest Holdings” excludes any temporary cash investments and equity index products.
29
Mid-Cap Index Fund
Performance Summary
All of the returns in this report represent past performance, which is not a guarantee of future results that may be achieved by the fund. (Current performance may be lower or higher than the performance data cited. For performance data current to the most recent month-end, visit our website at www.vanguard.com/performance.) Note, too, that both investment returns and principal value can fluctuate widely, so an investor’s shares, when sold, could be worth more or less than their original cost. The returns shown do not reflect taxes that a shareholder would pay on fund distributions or on the sale of fund shares.
Fiscal-Year Total Returns (%): May 21, 1998–June 30, 2007
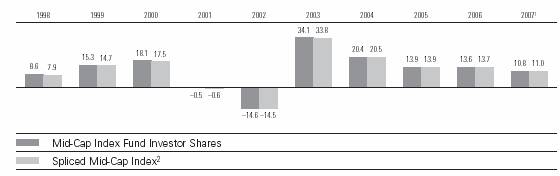
Average Annual Total Returns: Periods Ended June 30, 2007 |
| | | | |
| Inception Date | One Year | Five Years | Ten Years |
Investor Shares3 | 5/21/1998 | 20.58% | 15.38% | 12.44%4 |
Admiral Shares | 11/12/2001 | 20.70 | 15.48 | 14.544 |
Signal Shares | 3/30/2007 | 6.044 | — | — |
Institutional Shares | 5/21/1998 | 20.79 | 15.54 | 12.604 |
ETF Shares | 1/26/2004 | | | |
Market Price | | 20.56 | 15.844 | — |
Net Asset Value | | 20.69 | 15.874 | — |
1 Six months ended June 30, 2007.
2 S&P MidCap 400 Index through May 16, 2003; MSCI US Mid Cap 450 Index thereafter.
3 Total returns do not include the account service fee that may be applicable to certain accounts with balances below $10,000.
4 Return since inception.
Note: See Financial Highlights tables on pages 38 through 42 for dividend and capital gains information.
30
Mid-Cap Index Fund
Financial Statements (unaudited)
Statement of Net Assets
As of June 30, 2007
The fund provides a complete list of its holdings four times in each fiscal year, at the quarter-ends. For the second and fourth fiscal quarters, the lists appear in the fund’s semiannual and annual reports to shareholders. For the first and third fiscal quarters, the fund files the lists with the Securities and Exchange Commission on Form N-Q. Shareholders can look up the fund’s Forms N-Q on the SEC’s website at www.sec.gov. Forms N-Q may also be reviewed and copied at the SEC’s Public Reference Room (see the back cover of this report for further information).
| | | Market |
| | | Value• |
| | Shares | ($000) |
Common Stocks (100.0%)1 | | |
Consumer Discretionary (17.1%) | | |
| Hilton Hotels Corp. | 3,005,145 | 100,582 |
| Nordstrom, Inc. | 1,684,317 | 86,102 |
| Mattel, Inc. | 3,216,964 | 81,357 |
| ^Garmin Ltd. | 971,310 | 71,848 |
| Whirlpool Corp. | 638,229 | 70,971 |
* | Apollo Group, Inc. Class A | 1,201,080 | 70,179 |
| Genuine Parts Co. | 1,394,276 | 69,156 |
* | Office Depot, Inc. | 2,262,265 | 68,547 |
* | Cablevision Systems | | |
| NY Group Class A | 1,868,773 | 67,631 |
| VF Corp. | 731,607 | 67,001 |
| Newell Rubbermaid, Inc. | 2,268,098 | 66,750 |
| Eastman Kodak Co. | 2,350,649 | 65,419 |
| Sherwin-Williams Co. | 937,682 | 62,328 |
| H & R Block, Inc. | 2,637,145 | 61,630 |
| Harman International | | |
| Industries, Inc. | 509,199 | 59,474 |
* | Wyndham Worldwide Corp. | 1,621,216 | 58,785 |
| Tiffany & Co. | 1,107,404 | 58,759 |
* | IAC/InterActiveCorp | 1,645,125 | 56,938 |
| Dollar General Corp. | 2,553,113 | 55,964 |
* | AutoZone Inc. | 404,720 | 55,293 |
| Virgin Media Inc. | 2,268,716 | 55,289 |
* | Expedia, Inc. | 1,810,812 | 53,039 |
* | The Goodyear Tire & | | |
| Rubber Co. | 1,518,070 | 52,768 |
| Abercrombie & Fitch Co. | 722,573 | 52,733 |
* | Discovery Holding Co. | | |
| Class A | 2,193,877 | 50,437 |
| Darden Restaurants Inc. | 1,128,604 | 49,647 |
| Polo Ralph Lauren Corp. | 495,654 | 48,629 |
| Royal Caribbean | | |
| Cruises, Ltd. | 1,127,791 | 48,472 |
| Tim Hortons, Inc. | 1,562,387 | 48,043 |
| Black & Decker Corp. | 536,642 | 47,391 |
31
Mid-Cap Index Fund
| | | Market |
| | | Value• |
| | Shares | ($000) |
| D. R. Horton, Inc. | 2,310,913 | 46,056 |
* | Mohawk Industries, Inc. | 444,932 | 44,845 |
* | CarMax, Inc. | 1,758,272 | 44,836 |
* | GameStop Corp. Class A | 1,127,770 | 44,096 |
* | R.H. Donnelley Corp. | 575,631 | 43,621 |
| Idearc Inc. | 1,193,344 | 42,161 |
| American Eagle | | |
| Outfitters, Inc. | 1,641,808 | 42,129 |
| Lamar Advertising Co. | | |
| Class A | 666,765 | 41,846 |
* | Interpublic Group | | |
| of Cos., Inc. | 3,609,865 | 41,152 |
| Wynn Resorts Ltd. | 456,997 | 40,988 |
| BorgWarner, Inc. | 474,318 | 40,810 |
| Family Dollar Stores, Inc. | 1,178,549 | 40,448 |
| Pulte Homes, Inc. | 1,780,506 | 39,972 |
| Centex Corp. | 977,314 | 39,190 |
| Hasbro, Inc. | 1,234,598 | 38,779 |
| Autoliv, Inc. | 664,990 | 37,818 |
| The Stanley Works | 609,903 | 37,021 |
| ServiceMaster Co. | 2,386,991 | 36,903 |
* | Dollar Tree Stores, Inc. | 839,482 | 36,559 |
| PetSmart, Inc. | 1,110,412 | 36,033 |
| Lennar Corp. Class A | 978,113 | 35,760 |
* | Penn National Gaming, Inc. | 590,602 | 35,489 |
| Ross Stores, Inc. | 1,143,402 | 35,217 |
| RadioShack Corp. | 1,058,701 | 35,085 |
| Washington Post Co. | | |
| Class B | 45,172 | 35,058 |
* | Chico’s FAS, Inc. | 1,437,997 | 35,001 |
| Advance Auto Parts, Inc. | 861,922 | 34,934 |
| Station Casinos, Inc. | 398,229 | 34,566 |
*^ | Sirius Satellite Radio, Inc. | 11,334,500 | 34,230 |
| E.W. Scripps Co. Class A | 726,340 | 33,186 |
* | O’Reilly Automotive, Inc. | 883,332 | 32,286 |
| Leggett & Platt, Inc. | 1,451,495 | 32,005 |
| Liz Claiborne, Inc. | 838,586 | 31,279 |
| Brinker International, Inc. | 1,000,786 | 29,293 |
| Wendy’s International, Inc. | 782,141 | 28,744 |
* | AutoNation, Inc. | 1,268,974 | 28,476 |
| ^New York Times Co. | | |
| Class A | 1,111,122 | 28,222 |
| Foot Locker, Inc. | 1,273,401 | 27,760 |
* | Toll Brothers, Inc. | 1,074,716 | 26,846 |
* | Career Education Corp. | 775,392 | 26,185 |
* | XM Satellite Radio | | |
| Holdings, Inc. | 2,196,020 | 25,847 |
* | NVR, Inc. | 37,144 | 25,249 |
| Jones Apparel Group, Inc. | 887,255 | 25,065 |
| Williams-Sonoma, Inc. | 779,964 | 24,631 |
| KB Home | 621,556 | 24,471 |
| Brunswick Corp. | 742,012 | 24,212 |
32
Mid-Cap Index Fund
| | | Market |
| | | Value• |
| | Shares | ($000) |
* | Urban Outfitters, Inc. | 942,761 | 22,655 |
| Boyd Gaming Corp. | 459,667 | 22,611 |
| Gentex Corp. | 1,110,286 | 21,862 |
| Circuit City Stores, Inc. | 1,437,001 | 21,670 |
* | Getty Images, Inc. | 440,151 | 21,044 |
| Tribune Co. | 656,163 | 19,291 |
| Weight Watchers | | |
| International, Inc. | 291,559 | 14,823 |
| ^The McClatchy Co. Class A | 455,581 | 11,531 |
* | CTC Media, Inc. | 309,580 | 8,402 |
| Lennar Corp. Class B | 63,528 | 2,234 |
| | | 3,631,645 |
Consumer Staples (4.0%) | | |
| Bunge Ltd. | 980,021 | 82,812 |
| SuperValu Inc. | 1,700,305 | 78,758 |
| The Clorox Co. | 1,237,647 | 76,858 |
| UST, Inc. | 1,314,246 | 70,588 |
| Coca-Cola Enterprises, Inc. | 2,159,442 | 51,827 |
| Tyson Foods, Inc. | 2,133,143 | 49,148 |
| Molson Coors Brewing Co. | | |
| Class B | 525,134 | 48,554 |
| ^Whole Foods Market, Inc. | 1,150,236 | 44,054 |
| The Estee Lauder Cos. Inc. | | |
| Class A | 965,477 | 43,939 |
* | Energizer Holdings, Inc. | 436,331 | 43,459 |
* | Constellation Brands, Inc. | | |
| Class A | 1,722,801 | 41,830 |
| The Pepsi Bottling | | |
| Group, Inc. | 1,112,748 | 37,477 |
| McCormick & Co., Inc. | 955,888 | 36,496 |
| Dean Foods Co. | 1,094,455 | 34,880 |
| Brown-Forman Corp. | | |
| Class B | 433,406 | 31,673 |
* | Smithfield Foods, Inc. | 930,370 | 28,646 |
| Hormel Foods Corp. | 619,467 | 23,137 |
* | Bare Escentuals, Inc. | 441,937 | 15,092 |
| PepsiAmericas, Inc. | 527,317 | 12,951 |
| | | 852,179 |
Energy (7.6%) | | |
| Noble Corp. | 1,101,260 | 107,395 |
| El Paso Corp. | 5,771,593 | 99,445 |
| Smith International, Inc. | 1,636,196 | 95,947 |
33
Mid-Cap Index Fund
| | | Market |
| | | Value• |
| | Shares | ($000) |
| Noble Energy, Inc. | 1,394,305 | 86,991 |
| Murphy Oil Corp. | 1,453,985 | 86,425 |
* | Nabors Industries, Inc. | 2,447,830 | 81,709 |
| Sunoco, Inc. | 992,803 | 79,107 |
| ENSCO International, Inc. | 1,234,572 | 75,321 |
| CONSOL Energy, Inc. | 1,493,427 | 68,862 |
* | Ultra Petroleum Corp. | 1,242,078 | 68,612 |
| BJ Services Co. | 2,399,284 | 68,236 |
* | Cameron International Corp. | 909,649 | 65,013 |
| Tesoro Corp. | 1,116,327 | 63,798 |
* | Southwestern Energy Co. | 1,376,853 | 61,270 |
| Diamond Offshore | | |
| Drilling, Inc. | 566,063 | 57,489 |
* | Grant Prideco, Inc. | 1,047,692 | 56,397 |
* | Pride International, Inc. | 1,342,430 | 50,287 |
| Pioneer Natural | | |
| Resources Co. | 1,010,533 | 49,223 |
* | Newfield Exploration Co. | 1,055,297 | 48,069 |
| Range Resources Corp. | 1,201,782 | 44,959 |
* | FMC Technologies Inc. | 556,690 | 44,101 |
| Arch Coal, Inc. | 1,161,798 | 40,431 |
| Rowan Cos., Inc. | 903,603 | 37,030 |
| Patterson-UTI Energy, Inc. | 1,280,799 | 33,570 |
| Cimarex Energy Co. | 677,874 | 26,715 |
| Pogo Producing Co. | 477,708 | 24,263 |
* | CNX Gas Corp. | 246,587 | 7,546 |
| | | 1,628,211 |
Financials (20.6%) | | |
| Ameriprise Financial, Inc. | 1,761,444 | 111,975 |
| T. Rowe Price Group Inc. | 2,062,281 | 107,012 |
| Archstone-Smith Trust REIT | 1,786,807 | 105,618 |
| Host Hotels & Resorts Inc. | | |
| REIT | 4,416,667 | 102,113 |
| Boston Properties, Inc. REIT | 955,849 | 97,621 |
| CIT Group Inc. | 1,622,508 | 88,962 |
| ^Nymex Holdings Inc. | 640,649 | 80,485 |
* | E*TRADE Financial Corp. | 3,488,139 | 77,053 |
| Avalonbay | | |
| Communities, Inc. REIT | 643,008 | 76,441 |
| Ambac Financial Group, Inc. | 865,119 | 75,430 |
| Unum Group | 2,802,749 | 73,180 |
| Compass Bancshares Inc. | 1,057,757 | 72,964 |
| Kimco Realty Corp. REIT | 1,839,791 | 70,041 |
| MBIA, Inc. | 1,103,082 | 68,634 |
| Zions Bancorp | 873,157 | 67,155 |
| Sovereign Bancorp, Inc. | 3,095,541 | 65,440 |
| Synovus Financial Corp. | 2,131,021 | 65,422 |
*^ | CBOT Holdings, Inc. | | |
| Class A | 302,573 | 62,512 |
34
Mid-Cap Index Fund
| | | Market |
| | | Value• |
| | Shares | ($000) |
* | CB Richard Ellis Group, Inc. | 1,659,383 | 60,567 |
| Plum Creek Timber Co. Inc. | | |
| REIT | 1,450,740 | 60,438 |
^ | American Capital | | |
| Strategies, Ltd. | 1,410,157 | 59,960 |
| SL Green Realty Corp. REIT | 478,141 | 59,237 |
| Everest Re Group, Ltd. | 531,850 | 57,780 |
| Willis Group Holdings Ltd. | 1,286,222 | 56,671 |
| Cincinnati Financial Corp. | 1,275,825 | 55,371 |
| Commerce Bancorp, Inc. | 1,457,409 | 53,910 |
| Torchmark Corp. | 802,712 | 53,782 |
| Safeco Corp. | 863,702 | 53,774 |
| Hudson City Bancorp, Inc. | 4,335,682 | 52,982 |
| A.G. Edwards, Inc. | 615,895 | 52,074 |
| Assurant, Inc. | 858,141 | 50,562 |
* | IntercontinentalExchange Inc. | 338,020 | 49,976 |
| The Macerich Co. REIT | 587,553 | 48,426 |
| Health Care Properties | | |
| Investors REIT | 1,642,359 | 47,513 |
| Developers Diversified | | |
| Realty Corp. REIT | 890,969 | 46,963 |
| Leucadia National Corp. | 1,327,595 | 46,798 |
| iStar Financial Inc. REIT | 1,035,543 | 45,906 |
| Axis Capital Holdings Ltd. | 1,104,475 | 44,897 |
* | TD Ameritrade | | |
| Holding Corp. | 2,206,943 | 44,139 |
| W.R. Berkley Corp. | 1,340,688 | 43,626 |
| Eaton Vance Corp. | 980,377 | 43,313 |
| People’s United | | |
| Financial Inc. | 2,442,371 | 43,303 |
| Janus Capital Group Inc. | 1,552,379 | 43,218 |
| AMB Property Corp. REIT | 809,195 | 43,065 |
| White Mountains | | |
| Insurance Group Inc. | 70,600 | 42,785 |
| Huntington Bancshares Inc. | 1,830,486 | 41,625 |
| Fidelity National | | |
| Financial, Inc. Class A | 1,699,993 | 40,290 |
| Nuveen Investments, Inc. | | |
| Class A | 644,196 | 40,037 |
| First Horizon National Corp. | 1,021,624 | 39,843 |
| Apartment Investment & | | |
| Management Co. | | |
| Class A REIT | 789,523 | 39,808 |
| Regency Centers Corp. | | |
| REIT | 563,809 | 39,749 |
| Duke Realty Corp. REIT | 1,106,371 | 39,464 |
| New York Community | | |
| Bancorp, Inc. | 2,292,857 | 39,024 |
| MGIC Investment Corp. | 679,216 | 38,620 |
| ^Allied Capital Corp. | 1,243,214 | 38,490 |
| Ventas, Inc. REIT | 1,061,621 | 38,484 |
| Old Republic | | |
| International Corp. | 1,795,861 | 38,180 |
* | Markel Corp. | 77,692 | 37,646 |
| PartnerRe Ltd. | 467,033 | 36,195 |
| SEI Investments Co. | 1,215,572 | 35,300 |
| Radian Group, Inc. | 650,624 | 35,134 |
| Federal Realty | | |
| Investment Trust REIT | 452,439 | 34,955 |
| Popular, Inc. | 2,166,536 | 34,816 |
| RenaissanceRe | | |
| Holdings Ltd. | 560,806 | 34,764 |
| Investors Financial | | |
| Services Corp. | 539,914 | 33,296 |
| First American Corp. | 671,093 | 33,219 |
| Associated Banc-Corp. | 997,321 | 32,612 |
^ | Liberty Property Trust REIT | 739,826 | 32,501 |
| The PMI Group Inc. | 710,506 | 31,738 |
| Hospitality Properties Trust | | |
| REIT | 761,592 | 31,598 |
| Forest City Enterprise | | |
| Class A | 502,953 | 30,922 |
| Camden Property Trust | | |
| REIT | 461,521 | 30,908 |
| HCC Insurance | | |
| Holdings, Inc. | 909,796 | 30,396 |
| Colonial BancGroup, Inc. | 1,209,216 | 30,194 |
| Federated Investors, Inc. | 773,362 | 29,643 |
| UDR, Inc. REIT | 1,102,007 | 28,983 |
| Nationwide Financial | | |
| Services, Inc. | 444,049 | 28,073 |
^ | The St. Joe Co. | 577,258 | 26,750 |
| TCF Financial Corp. | 960,585 | 26,704 |
* | Arch Capital Group Ltd. | 364,475 | 26,439 |
| Protective Life Corp. | 543,575 | 25,988 |
| Weingarten Realty Investors | | |
| REIT | 630,251 | 25,903 |
* | AmeriCredit Corp. | 960,705 | 25,507 |
| City National Corp. | 330,183 | 25,124 |
35
Mid-Cap Index Fund
| | | Market |
| | | Value• |
| | Shares | ($000) |
| Brown & Brown, Inc. | 973,238 | 24,467 |
| ^CapitalSource Inc. REIT | 949,819 | 23,356 |
| Erie Indemnity Co. Class A | 425,372 | 22,987 |
| Commerce Bancshares, Inc. | 486,511 | 22,039 |
^ | The First Marblehead Corp. | 541,774 | 20,934 |
*^ | Nasdaq Stock Market Inc. | 683,596 | 20,310 |
| American | | |
| Financial Group, Inc. | 585,363 | 19,990 |
| Unitrin, Inc. | 383,789 | 18,875 |
| Astoria Financial Corp. | 722,595 | 18,094 |
| Transatlantic Holdings, Inc. | 215,861 | 15,354 |
| Mercury General Corp. | 223,440 | 12,314 |
| BOK Financial Corp. | 191,903 | 10,251 |
| Student Loan Corp. | 32,689 | 6,665 |
| | | 4,373,652 |
Health Care (9.7%) | | |
* | Express Scripts Inc. | 1,886,706 | 94,354 |
| Biomet, Inc. | 1,907,801 | 87,225 |
* | Humana Inc. | 1,364,168 | 83,091 |
* | Laboratory Corp. of | | |
| America Holdings | 1,025,992 | 80,294 |
| AmerisourceBergen Corp. | 1,549,878 | 76,672 |
* | Coventry Health Care Inc. | 1,303,876 | 75,168 |
| Quest Diagnostics, Inc. | 1,356,602 | 70,068 |
| C.R. Bard, Inc. | 842,602 | 69,624 |
| IMS Health, Inc. | 1,596,722 | 51,303 |
* | Health Net Inc. | 953,671 | 50,354 |
* | Hospira, Inc. | 1,274,897 | 49,772 |
* | Waters Corp. | 830,347 | 49,289 |
| Applera Corp.–Applied | | |
| Biosystems Group | 1,501,861 | 45,867 |
* | DaVita, Inc. | 850,876 | 45,845 |
| DENTSPLY | | |
| International Inc. | 1,182,555 | 45,245 |
* | Varian | | |
| Medical Systems, Inc. | 1,051,007 | 44,678 |
*^ | Amylin | | |
| Pharmaceuticals, Inc. | 1,072,530 | 44,145 |
* | Intuitive Surgical, Inc. | 303,857 | 42,166 |
* | Barr Pharmaceuticals Inc. | 826,980 | 41,539 |
* | King Pharmaceuticals, Inc. | 1,989,173 | 40,698 |
* | Cephalon, Inc. | 498,888 | 40,106 |
| Manor Care, Inc. | 596,350 | 38,936 |
* | Triad Hospitals, Inc. | 723,026 | 38,870 |
* | Henry Schein, Inc. | 724,155 | 38,692 |
* | Endo Pharmaceuticals | | |
| Holdings, Inc. | 1,092,346 | 37,391 |
36
Mid-Cap Index Fund
| | | Market |
| | | Value• |
| | Shares | ($000) |
* | Sepracor Inc. | 896,374 | 36,769 |
| Mylan Laboratories, Inc. | 2,002,725 | 36,430 |
* | Covance, Inc. | 523,522 | 35,893 |
| Omnicare, Inc. | 993,578 | 35,828 |
* | Patterson Cos. | 910,824 | 33,946 |
| Pharmaceutical Product | | |
| Development, Inc. | 863,207 | 33,035 |
* | Millipore Corp. | 436,788 | 32,798 |
| Beckman Coulter, Inc. | 504,606 | 32,638 |
* | Community Health | | |
| Systems, Inc. | 769,693 | 31,134 |
| Hillenbrand Industries, Inc. | 478,138 | 31,079 |
| Bausch & Lomb, Inc. | 444,159 | 30,842 |
* | Lincare Holdings, Inc. | 757,565 | 30,189 |
* | Cerner Corp. | 543,177 | 30,130 |
* | Vertex | | |
| Pharmaceuticals, Inc. | 1,031,910 | 29,471 |
* | Invitrogen Corp. | 393,436 | 29,016 |
* | Charles River | | |
| Laboratories, Inc. | 547,428 | 28,258 |
* | Millennium | | |
| Pharmaceuticals, Inc. | 2,503,265 | 26,460 |
* | Watson | | |
| Pharmaceuticals, Inc. | 796,420 | 25,908 |
* | Tenet Healthcare Corp. | 3,858,539 | 25,119 |
* | Kinetic Concepts, Inc. | 434,965 | 22,605 |
| Health Management | | |
| Associates Class A | 1,980,000 | 22,493 |
* | ImClone Systems, Inc. | 485,048 | 17,151 |
* | Warner Chilcott Ltd. | 819,634 | 14,827 |
| ^Brookdale Senior Living Inc. | 289,599 | 13,197 |
*^Abraxis Bioscience, Inc. | 270,891 | 6,022 |
| | | 2,072,630 |
Industrials (12.9%) | | |
| Precision Castparts Corp. | 1,121,933 | 136,158 |
| L-3 Communications | | |
| Holdings, Inc. | 1,022,250 | 99,557 |
| ITT Industries, Inc. | 1,435,674 | 98,028 |
| Rockwell Collins, Inc. | 1,376,500 | 97,236 |
| Parker Hannifin Corp. | 948,004 | 92,819 |
| Rockwell Automation, Inc. | 1,287,753 | 89,422 |
| American | | |
| Standard Cos., Inc. | 1,478,782 | 87,219 |
| Dover Corp. | 1,670,497 | 85,446 |
| Cooper Industries, Inc. | | |
| Class A | 1,493,157 | 85,244 |
| Cummins Inc. | 809,963 | 81,976 |
| Fluor Corp. | 720,409 | 80,232 |
| R.R. Donnelley & Sons Co. | 1,773,895 | 77,182 |
* | McDermott | | |
| International, Inc. | 904,127 | 75,151 |
| Expeditors International of | | |
| Washington, Inc. | 1,743,476 | 72,006 |
| C.H. Robinson | | |
| Worldwide Inc. | 1,353,809 | 71,102 |
* | Terex Corp. | 832,133 | 67,652 |
| Manpower Inc. | 695,053 | 64,112 |
* | Foster Wheeler Ltd. | 562,015 | 60,130 |
| Goodrich Corp. | 974,507 | 58,042 |
| Joy Global Inc. | 970,976 | 56,637 |
* | Jacobs Engineering | | |
| Group Inc. | 967,862 | 55,662 |
| W.W. Grainger, Inc. | 584,715 | 54,408 |
| Avery Dennison Corp. | 808,343 | 53,739 |
37
Mid-Cap Index Fund
| | | Market |
| | | Value• |
| | Shares | ($000) |
| Equifax, Inc. | 1,203,765 | 53,471 |
| The Dun & Bradstreet Corp. | 502,508 | 51,748 |
* | AMR Corp. | 1,962,862 | 51,721 |
| Republic Services, Inc. | | |
| Class A | 1,584,625 | 48,553 |
| Robert Half | | |
| International, Inc. | 1,305,643 | 47,656 |
| Cintas Corp. | 1,176,068 | 46,372 |
| Pall Corp. | 1,001,581 | 46,063 |
| Fastenal Co. | 1,051,646 | 44,022 |
| SPX Corp. | 469,515 | 41,228 |
| Roper Industries Inc. | 713,500 | 40,741 |
* | Monster Worldwide Inc. | 962,263 | 39,549 |
| Oshkosh Truck Corp. | 604,821 | 38,055 |
* | UAL Corp. | 905,986 | 36,774 |
* | Allied Waste Industries, Inc. | 2,724,596 | 36,673 |
* | KBR Inc. | 1,371,748 | 35,981 |
| Ametek, Inc. | 866,046 | 34,365 |
* | Hertz Global Holdings Inc. | 1,180,436 | 31,364 |
| Pentair, Inc. | 776,090 | 29,934 |
*^USG Corp. | 601,709 | 29,508 |
* | Spirit Aerosystems | | |
| Holdings Inc. | 815,155 | 29,386 |
* | ChoicePoint Inc. | 652,370 | 27,693 |
| J.B. Hunt Transport | | |
| Services, Inc. | 827,540 | 24,263 |
* | Owens Corning Inc. | 641,816 | 21,584 |
| The Corporate Executive | | |
| Board Co. | 319,415 | 20,733 |
* | US Airways Group Inc. | 673,157 | 20,376 |
* | First Solar, Inc. | 227,089 | 20,277 |
| | | 2,747,250 |
Information Technology (14.1%) | |
* | NVIDIA Corp. | 2,763,655 | 114,167 |
| Seagate Technology | 4,485,145 | 97,642 |
* | SanDisk Corp. | 1,841,257 | 90,111 |
| KLA-Tencor Corp. | 1,634,118 | 89,795 |
* | MEMC Electronic | | |
| Materials, Inc. | 1,455,201 | 88,942 |
* | Autodesk, Inc. | 1,881,923 | 88,601 |
* | Cognizant Technology | | |
| Solutions Corp. | 1,167,458 | 87,664 |
| Fidelity National | | |
| Information Services, Inc. | 1,552,086 | 84,247 |
* | Computer Sciences Corp. | 1,405,084 | 83,111 |
* | Micron Technology, Inc. | 6,175,839 | 77,383 |
* | NCR Corp. | 1,458,126 | 76,610 |
* | Fiserv, Inc. | 1,346,118 | 76,459 |
| National | | |
| Semiconductor Corp. | 2,607,450 | 73,713 |
38
Mid-Cap Index Fund
| | | Market |
| | | Value• |
| | Shares | ($000) |
| Xilinx, Inc. | 2,715,352 | 72,690 |
| Microchip Technology, Inc. | 1,768,085 | 65,490 |
| Altera Corp. | 2,917,207 | 64,558 |
* | VeriSign, Inc. | 1,987,397 | 63,060 |
* | Avaya Inc. | 3,708,635 | 62,453 |
* | Akamai Technologies, Inc. | 1,244,479 | 60,531 |
| Harris Corp. | 1,097,109 | 59,847 |
* | LAM Research Corp. | 1,159,976 | 59,623 |
* | Flextronics International Ltd. | 4,968,169 | 53,656 |
| Amphenol Corp. | 1,456,910 | 51,939 |
* | BMC Software, Inc. | 1,668,817 | 50,565 |
* | Cadence Design | | |
| Systems, Inc. | 2,289,510 | 50,278 |
* | Citrix Systems, Inc. | 1,477,569 | 49,750 |
* | Avnet, Inc. | 1,209,126 | 47,930 |
* | LSI Corp. | 6,321,375 | 47,474 |
* | McAfee Inc. | 1,305,281 | 45,946 |
* | BEA Systems, Inc. | 3,207,372 | 43,909 |
* | CDW Corp. | 513,047 | 43,594 |
* | Affiliated Computer | | |
| Services, Inc. Class A | 755,181 | 42,834 |
* | Activision, Inc. | 2,293,957 | 42,828 |
* | Alliance Data Systems Corp. | 553,424 | 42,769 |
* | Iron Mountain, Inc. | 1,543,762 | 40,338 |
* | Ceridian Corp. | 1,137,924 | 39,827 |
* | Lexmark International, Inc. | 801,192 | 39,507 |
* | Arrow Electronics, Inc. | 1,005,325 | 38,635 |
* | Tellabs, Inc. | 3,399,330 | 36,577 |
| Intersil Corp. | 1,129,674 | 35,540 |
* | Western Digital Corp. | 1,816,317 | 35,146 |
| Jabil Circuit, Inc. | 1,563,210 | 34,500 |
* | DST Systems, Inc. | 432,751 | 34,278 |
* | NAVTEQ Corp. | 800,872 | 33,909 |
* | Red Hat, Inc. | 1,493,755 | 33,281 |
* | salesforce.com, Inc. | 742,956 | 31,843 |
* | Compuware Corp. | 2,652,805 | 31,462 |
* | Novellus Systems, Inc. | 1,010,855 | 28,678 |
* | Hewitt Associates, Inc. | 862,079 | 27,587 |
* | Teradyne, Inc. | 1,552,702 | 27,296 |
* | Solectron Corp. | 7,396,616 | 27,220 |
* | Ingram Micro, Inc. Class A | 1,249,716 | 27,131 |
* | CheckFree Corp. | 607,623 | 24,426 |
| Molex, Inc. | 796,014 | 23,888 |
*^JDS Uniphase Corp. | 1,680,560 | 22,570 |
* | Zebra Technologies Corp. | | |
| Class A | 576,088 | 22,318 |
* | QLogic Corp. | 1,300,721 | 21,657 |
| Molex, Inc. Class A | 390,145 | 10,358 |
| Total System Services, Inc. | 321,874 | 9,498 |
| AVX Corp. | 421,429 | 7,055 |
39
Mid-Cap Index Fund
| | | Market |
| | | Value• |
| | Shares | ($000) |
| | | |
| | | 2,994,694 |
Materials (5.7%) | | |
| United States Steel Corp. | 969,452 | 105,428 |
| Vulcan Materials Co. | 777,430 | 89,047 |
| Allegheny Technologies Inc. | 741,575 | 77,776 |
| Lyondell Chemical Co. | 1,833,384 | 68,055 |
| Martin Marietta | | |
| Materials, Inc. | 369,424 | 59,854 |
| Temple-Inland Inc. | 860,328 | 52,936 |
| MeadWestvaco Corp. | 1,482,539 | 52,363 |
* | The Mosaic Co. | 1,258,860 | 49,121 |
* | Domtar Corp. | 4,247,116 | 47,398 |
| Sigma-Aldrich Corp. | 1,080,597 | 46,109 |
| Celanese Corp. Series A | 1,157,922 | 44,904 |
* | Owens-Illinois, Inc. | 1,257,541 | 44,014 |
| Eastman Chemical Co. | 684,034 | 44,004 |
| Sealed Air Corp. | 1,319,281 | 40,924 |
| Ball Corp. | 759,196 | 40,366 |
* | Pactiv Corp. | 1,088,818 | 34,722 |
| International Flavors & | | |
| Fragrances, Inc. | 661,078 | 34,469 |
* | Crown Holdings, Inc. | 1,334,011 | 33,310 |
| Sonoco Products Co. | 775,329 | 33,192 |
| Steel Dynamics, Inc. | 745,129 | 31,228 |
| Ashland, Inc. | 461,292 | 29,500 |
| Bemis Co., Inc. | 857,373 | 28,448 |
* | Smurfit-Stone | | |
| Container Corp. | 2,083,922 | 27,737 |
| Florida Rock Industries, Inc. | 403,651 | 27,246 |
| Albemarle Corp. | 660,164 | 25,436 |
* | Titanium Metals Corp. | 659,294 | 21,031 |
| Huntsman Corp. | 815,357 | 19,821 |
| | | 1,208,439 |
Telecommunication Services (2.6%) | |
* | NII Holdings Inc. | 1,193,937 | 96,398 |
* | Crown Castle | | |
| International Corp. | 2,138,474 | 77,562 |
| Embarq Corp. | 1,223,127 | 77,510 |
| Windstream Corp. | 3,901,007 | 57,579 |
* | Level 3 | | |
| Communications, Inc. | 9,055,188 | 52,973 |
| CenturyTel, Inc. | 892,179 | 43,761 |
| Citizens | | |
| Communications Co. | 2,771,523 | 42,321 |
* | Leap Wireless | | |
| International, Inc. | 443,537 | 37,479 |
| Telephone & | | |
| Data Systems, Inc. | 496,825 | 31,086 |
| Telephone & | | |
40
Mid-Cap Index Fund
| | | Market |
| | | Value• |
| | Shares | ($000) |
| Data Systems, Inc.– | | |
| Special Common Shares | 349,444 | 20,110 |
* | U.S. Cellular Corp. | 132,889 | 12,040 |
| | | 548,819 |
Utilities (5.7%) | | |
* | Mirant Corp. | 2,094,551 | 89,333 |
* | NRG Energy, Inc. | 1,901,657 | 79,052 |
| Questar Corp. | 1,405,215 | 74,266 |
| DTE Energy Co. | 1,456,123 | 70,214 |
* | Allegheny Energy, Inc. | 1,352,022 | 69,954 |
| Xcel Energy, Inc. | 3,336,275 | 68,294 |
* | Reliant Energy, Inc. | 2,524,091 | 68,024 |
| KeySpan Corp. | 1,436,703 | 60,313 |
| Equitable Resources, Inc. | 945,433 | 46,856 |
| NiSource, Inc. | 2,239,088 | 46,372 |
| Pepco Holdings, Inc. | 1,565,554 | 44,149 |
| ONEOK, Inc. | 856,681 | 43,185 |
| Wisconsin Energy Corp. | 957,120 | 42,333 |
| CenterPoint Energy Inc. | 2,431,696 | 42,312 |
* | Dynegy, Inc. | 4,026,377 | 38,009 |
| MDU Resources Group, Inc. | 1,333,911 | 37,403 |
| Alliant Energy Corp. | 950,154 | 36,913 |
| Northeast Utilities | 1,261,860 | 35,786 |
| SCANA Corp. | 905,521 | 34,672 |
| Energy East Corp. | 1,284,806 | 33,521 |
| Pinnacle West Capital Corp. | 817,830 | 32,591 |
| Integrys Energy Group, Inc. | 611,471 | 31,020 |
| TECO Energy, Inc. | 1,711,570 | 29,405 |
| NSTAR | 873,875 | 28,357 |
| DPL Inc. | 925,361 | 26,225 |
| | | 1,208,559 |
Total Common Stocks | | |
(Cost $16,654,690) | | 21,266,078 |
Temporary Cash Investments (1.7%)1 | |
Money Market Fund (1.7%) | | |
2 | Vanguard Market | | |
| Liquidity Fund, 5.281% | 18,861,097 | 18,861 |
2 | Vanguard Market | | |
| Liquidity Fund, | | |
| 5.281%—Note E | 335,827,400 | 335,827 |
| | | 354,688 |
| | | |
| | | |
| | Face | |
| | Amount | |
| | ($000) | |
U.S. Government & Agency Obligation (0.0%) |
3 | Federal Home Loan | | |
| Mortgage Corp. | | |
| | | | |
41
Mid-Cap Index Fund
| | | Market |
| | | Value• |
| | Shares | ($000) |
4 | 5.197%, 7/9/07 | 2,000 | 1,998 |
Total Temporary Cash Investments | |
(Cost $356,686) | | 356,686 |
Total Investments (101.7%) | | |
(Cost $17,011,376) | | 21,622,764 |
Other Assets and Liabilities (–1.7%) | |
Other Assets—Note B | | 103,959 |
Liabilities—Note E | | (463,560) |
| | | (359,601) |
Net Assets (100%) | | 21,263,163 |
| | | | |
At June 30, 2007, net assets consisted of:5 | |
| Amount |
| ($000) |
Paid-in Capital | 16,701,423 |
Undistributed Net Investment Income | 124,833 |
Accumulated Net Realized Losses | (174,371) |
Unrealized Appreciation (Depreciation) | |
Investment Securities | 4,611,388 |
Futures Contracts | (110) |
Net Assets | 21,263,163 |
| |
Investor Shares—Net Assets | |
Applicable to 407,569,086 outstanding | |
$.001 par value shares of beneficial | |
interest (unlimited authorization) | 8,934,870 |
Net Asset Value Per Share— | |
Investor Shares | $21.92 |
| |
Admiral Shares—Net Assets | |
Applicable to 50,483,308 outstanding | |
$.001 par value shares of beneficial | |
interest (unlimited authorization) | 5,024,075 |
Net Asset Value Per Share— | |
Admiral Shares | $99.52 |
42
Mid-Cap Index Fund
| Amount |
| ($000) |
Signal Shares—Net Assets | |
Applicable to 5,879,732 outstanding | |
$.001 par value shares of beneficial | |
interest (unlimited authorization) | 184,748 |
Net Asset Value Per Share— | |
Signal Shares | $31.42 |
| |
Institutional Shares—Net Assets | |
Applicable to 267,124,418 outstanding | |
$.001 par value shares of beneficial | |
interest (unlimited authorization) | 5,875,616 |
Net Asset Value Per Share— | |
Institutional Shares | $22.00 |
| |
ETF Shares—Net Assets | |
Applicable to 15,473,557 outstanding | |
$.001 par value shares of beneficial | |
interest (unlimited authorization) | 1,243,854 |
Net Asset Value Per Share— | |
ETF Shares | $80.39 |
• See Note A in Notes to Financial Statements.
* Non-income-producing security.
^ Part of security position is on loan to broker-dealers. See Note E in Notes to Financial Statements.
1 The fund invests a portion of its cash reserves in equity markets through the use of index futures contracts. After giving effect to futures investments, the fund’s effective common stock and temporary cash investment positions represent 100.1% and 1.6%, respectively, of net assets. See Note C in Notes to Financial Statements.
2 Affiliated money market fund available only to Vanguard funds and certain trusts and accounts managed by Vanguard. Rate shown is the 7-day yield.
3 The issuer operates under a congressional charter; its securities are neither issued nor guaranteed by the U.S. government. If needed, access to additional funding from the U.S. Treasury (beyond the issuer’s line of credit) would require congressional action.
4 Securities with a value of $1,998,000 have been segregated as initial margin for open futures contracts.
5 See Note C in Notes to Financial Statements for the tax-basis components of net assets.
REIT—Real Estate Investment Trust.
43
Mid-Cap Index Fund
Statement of Operations
| Six Months Ended |
| June 30, 2007 |
| ($000) |
Investment Income | |
Income | |
Dividends | 144,902 |
Interest1 | 1,602 |
Security Lending | 2,888 |
Total Income | 149,392 |
Expenses | |
The Vanguard Group—Note B | |
Investment Advisory Services | 347 |
Management and Administrative—Investor Shares | 7,414 |
Management and Administrative—Admiral Shares | 1,876 |
Management and Administrative—Signal Shares | 37 |
Management and Administrative—Institutional Shares | 1,056 |
Management and Administrative—ETF Shares | 661 |
Marketing and Distribution—Investor Shares | 1,065 |
Marketing and Distribution—Admiral Shares | 530 |
Marketing and Distribution—Signal Shares | 3 |
Marketing and Distribution—Institutional Shares | 659 |
Marketing and Distribution—ETF Shares | 211 |
Custodian Fees | 121 |
Shareholders’ Reports—Investor Shares | 170 |
Shareholders’ Reports—Admiral Shares | 16 |
Shareholders’ Reports—Signal Shares | 3 |
Shareholders’ Reports—Institutional Shares | 61 |
Shareholders’ Reports—ETF Shares | 29 |
Trustees’ Fees and Expenses | 12 |
Total Expenses | 14,271 |
Net Investment Income | 135,121 |
Realized Net Gain (Loss) | |
Investment Securities Sold | 1,101,652 |
Futures Contracts | 2,288 |
Realized Net Gain (Loss) | 1,103,940 |
Change in Unrealized Appreciation (Depreciation) | |
Investment Securities | 815,724 |
Futures Contracts | 158 |
Change in Unrealized Appreciation (Depreciation) | 815,882 |
Net Increase (Decrease) in Net Assets Resulting from Operations | 2,054,943 |
1 Interest income from an affiliated company of the fund was $1,553,000.
44
Mid-Cap Index Fund
Statement of Changes in Net Assets
| Six Months Ended | | Year Ended |
| June 30, | | December 31, |
| 2007 | | 2006 |
| ($000) | | ($000) |
Increase (Decrease) in Net Assets | | | |
Operations | | | |
Net Investment Income | 135,121 | | 236,457 |
Realized Net Gain (Loss) | 1,103,940 | | 812,333 |
Change in Unrealized Appreciation (Depreciation) | 815,882 | | 965,218 |
Net Increase (Decrease) in Net Assets Resulting from Operations | 2,054,943 | | 2,014,008 |
Distributions | | | |
Net Investment Income | | | |
Investor Shares | (2,004) | | (94,810) |
Admiral Shares | (1,159) | | (53,803) |
Signal Shares | — | | — |
Institutional Shares | (1,262) | | (63,378) |
ETF Shares | (346) | | (21,247) |
Realized Capital Gain | | | |
Investor Shares | — | | — |
Admiral Shares | — | | — |
Signal Shares | — | | — |
Institutional Shares | — | | — |
ETF Shares | — | | — |
Total Distributions | (4,771) | | (233,238) |
Capital Share Transactions—Note F | | | |
Investor Shares | 400,525 | | 477,702 |
Admiral Shares | 483,917 | | 823,840 |
Signal Shares | 176,737 | | — |
Institutional Shares | 699,003 | | 1,301,163 |
ETF Shares | (514,570) | | 383,910 |
Net Increase (Decrease) from Capital Share Transactions | 1,245,612 | | 2,986,615 |
Total Increase (Decrease) | 3,295,784 | | 4,767,385 |
Net Assets | | | |
Beginning of Period | 17,967,379 | | 13,199,994 |
End of Period1 | 21,263,163 | | 17,967,379 |
1 Net Assets—End of Period includes undistributed (overdistributed) net investment income of $124,833,000 and ($5,517,000).
45
Mid-Cap Index Fund
Financial Highlights
Investor Shares | | | | | | |
| | | | | | |
| Six Months | | | | | |
| Ended | | | |
For a Share Outstanding | June 30, | Year Ended December 31, |
Throughout Each Period | 2007 | 2006 | 2005 | 2004 | 2003 | 2002 |
Net Asset Value, Beginning of Period | $19.78 | $17.63 | $15.64 | $13.13 | $ 9.88 | $11.81 |
Investment Operations | | | | | | |
Net Investment Income | .133 | .253 | .198 | .159 | .122 | .088 |
Net Realized and Unrealized Gain (Loss) | | | | | | |
on Investments | 2.012 | 2.144 | 1.983 | 2.512 | 3.250 | (1.798) |
Total from Investment Operations | 2.145 | 2.397 | 2.181 | 2.671 | 3.372 | (1.710) |
Distributions | | | | | | |
Dividends from Net Investment Income | (.005) | (.247) | (.191) | (.161) | (.122) | (.093) |
Distributions from Realized Capital Gains | — | — | — | — | — | (.127) |
Total Distributions | (.005) | (.247) | (.191) | (.161) | (.122) | (.220) |
Net Asset Value, End of Period | $21.92 | $19.78 | $17.63 | $15.64 | $13.13 | $9.88 |
| | | | | | |
Total Return1 | 10.85% | 13.60% | 13.93% | 20.35% | 34.14% | –14.61% |
| | | | | | |
Ratios/Supplemental Data | | | | | | |
Net Assets, End of Period (Millions) | $8,935 | $7,677 | $6,399 | $5,234 | $3,610 | $2,267 |
Ratio of Total Expenses to | | | | | | |
Average Net Assets | 0.21%* | 0.22% | 0.22% | 0.22% | 0.26% | 0.26% |
Ratio of Net Investment Income to | | | | | | |
Average Net Assets | 1.29%* | 1.43% | 1.36% | 1.26% | 1.20% | 0.85% |
Portfolio Turnover Rate2 | 18%* | 18% | 18% | 16% | 73%3 | 18% |
1 Total returns do not include the account service fee that may be applicable to certain accounts with balances below $10,000.
2 Excludes the value of portfolio securities received or delivered as a result of in-kind purchases or redemptions of the fund’s capital shares, including ETF Creation Units.
3 Includes activity related to a change in the fund’s target index.
* Annualized.
46
Mid-Cap Index Fund
Admiral Shares | | | | | | |
| | | | | | |
| Six Months | | | | | |
| Ended | | | |
For a Share Outstanding | June 30, | Year Ended December 31, |
Throughout Each Period | 2007 | 2006 | 2005 | 2004 | 2003 | 2002 |
Net Asset Value, Beginning of Period | $89.73 | $79.98 | $70.92 | $59.55 | $44.81 | $53.56 |
Investment Operations | | | | | | |
Net Investment Income | .652 | 1.226 | .946 | .771 | .593 | .431 |
Net Realized and Unrealized | | | | | | |
Gain (Loss) on Investments | 9.162 | 9.725 | 9.022 | 11.383 | 14.742 | (8.154) |
Total from Investment Operations | 9.814 | 10.951 | 9.968 | 12.154 | 15.335 | (7.723) |
Distributions | | | | | | |
Dividends from Net Investment Income | (.024) | (1.201) | (.908) | (.784) | (.595) | (.451) |
Distributions from Realized Capital Gains | — | — | — | — | — | (.576) |
Total Distributions | (.024) | (1.201) | (.908) | (.784) | (.595) | (1.027) |
Net Asset Value, End of Period | $99.52 | $89.73 | $79.98 | $70.92 | $59.55 | $44.81 |
| | | | | | |
Total Return | 10.94% | 13.69% | 14.04% | 20.42% | 34.24% | –14.55% |
| | | | | | |
Ratios/Supplemental Data | | | | | | |
Net Assets, End of Period (Millions) | $5,024 | $4,075 | $2,852 | $1,196 | $842 | $411 |
Ratio of Total Expenses to | | | | | | |
Average Net Assets | 0.11%* | 0.13% | 0.13% | 0.13% | 0.18% | 0.18% |
Ratio of Net Investment Income to | | | | | | |
Average Net Assets | 1.39%* | 1.52% | 1.45% | 1.35% | 1.31% | 0.94% |
Portfolio Turnover Rate1 | 18%* | 18% | 18% | 16% | 73%2 | 18% |
1 Excludes the value of portfolio securities received or delivered as a result of in-kind purchases or redemptions of the fund’s capital shares, including ETF Creation Units.
2 Includes activity related to a change in the fund’s target index.
* Annualized.
47
Mid-Cap Index Fund
Signal Shares | |
| |
| March 30, |
| 20071 to |
| June 30, |
For a Share Outstanding Throughout the Period | 2007 |
Net Asset Value, Beginning of Period | $29.63 |
Investment Operations | |
Net Investment Income | .093 |
Net Realized and Unrealized Gain (Loss) on Investments | 1.697 |
Total from Investment Operations | 1.790 |
Distributions | |
Dividends from Net Investment Income | — |
Distributions from Realized Capital Gains | — |
Total Distributions | — |
Net Asset Value, End of Period | $31.42 |
| |
Total Return | 6.04% |
| |
Ratios/Supplemental Data | |
Net Assets, End of Period (Millions) | $185 |
Ratio of Total Expenses to Average Net Assets | 0.11%* |
Ratio of Net Investment Income to Average Net Assets | 1.39%* |
Portfolio Turnover Rate2 | 18%* |
1 Inception.
2 Excludes the value of portfolio securities received or delivered as a result of in-kind purchases or redemptions of the fund’s capital shares, including ETF Creation Units.
* Annualized.
48
Mid-Cap Index Fund
Institutional Shares | | | | | | |
| | | | | | |
| Six Months | | | | | |
| Ended | | | |
For a Share Outstanding | June 30, | Year Ended December 31, |
Throughout Each Period | 2007 | 2006 | 2005 | 2004 | 2003 | 2002 |
Net Asset Value, Beginning of Period | $19.83 | $17.67 | $15.67 | $13.16 | $ 9.90 | $11.83 |
Investment Operations | | | | | | |
Net Investment Income | .147 | .286 | .228 | .18 | .147 | .103 |
Net Realized and Unrealized | | | | | | |
Gain (Loss) on Investments | 2.028 | 2.149 | 1.983 | 2.51 | 3.250 | (1.798) |
Total from Investment Operations | 2.175 | 2.435 | 2.211 | 2.69 | 3.397 | (1.695) |
Distributions | | | | | | |
Dividends from Net Investment Income | (.005) | (.275) | (.211) | (.18) | (.137) | (.108) |
Distributions from Realized Capital Gains | — | — | — | — | — | (.127) |
Total Distributions | (.005) | (.275) | (.211) | (.18) | (.137) | (.235) |
Net Asset Value, End of Period | $22.00 | $19.83 | $17.67 | $15.67 | $13.16 | $9.90 |
| | | | | | |
Total Return | 10.97% | 13.78% | 14.09% | 20.45% | 34.33% | –14.45% |
| | | | | | |
Ratios/Supplemental Data | | | | | | |
Net Assets, End of Period (Millions) | $5,876 | $4,633 | $2,905 | $2,056 | $1,071 | $653 |
Ratio of Total Expenses to | | | | | | |
Average Net Assets | 0.07%* | 0.08% | 0.08% | 0.08% | 0.10% | 0.10% |
Ratio of Net Investment Income to | | | | | | |
Average Net Assets | 1.43%* | 1.57% | 1.50% | 1.40% | 1.36% | 1.01% |
Portfolio Turnover Rate1 | 18%* | 18% | 18% | 16% | 73%2 | 18% |
1 Excludes the value of portfolio securities received or delivered as a result of in-kind purchases or redemptions of the fund’s capital shares, including ETF Creation Units.
2 Includes activity related to a change in the fund’s target index.
* Annualized.
49
Mid-Cap Index Fund
ETF Shares | | | | |
| | | | |
| Six Months | | Jan. 26, |
| Ended | Year Ended | 20041 to |
| June 30, | December 31, | Dec. 31, |
For a Share Outstanding Throughout Each Period | 2007 | 2006 | 2005 | 2004 |
Net Asset Value, Beginning of Period | $72.48 | $64.61 | $57.32 | $50.34 |
Investment Operations | | | | |
Net Investment Income | .507 | .992 | .785 | .617 |
Net Realized and Unrealized Gain (Loss) on Investments | 7.420 | 7.851 | 7.258 | 7.004 |
Total from Investment Operations | 7.927 | 8.843 | 8.043 | 7.621 |
Distributions | | | | |
Dividends from Net Investment Income | (.017) | (.973) | (.753) | (.641) |
Distributions from Realized Capital Gains | — | — | — | — |
Total Distributions | (.017) | (.973) | (.753) | (.641) |
Net Asset Value, End of Period | $80.39 | $72.48 | $64.61 | $57.32 |
| | | | |
Total Return | 10.94% | 13.69% | 14.03% | 15.16% |
| | | | |
Ratios/Supplemental Data | | | | |
Net Assets, End of Period (Millions) | $1,244 | $1,582 | $1,044 | $58 |
Ratio of Total Expenses to Average Net Assets | 0.13%* | 0.13% | 0.13% | 0.18%* |
Ratio of Net Investment Income to Average Net Assets | 1.37%* | 1.52% | 1.45% | 1.30%* |
Portfolio Turnover Rate2 | 18%* | 18% | 18% | 16% |
1 Inception.
2 Excludes the value of portfolio securities received or delivered as a result of in-kind purchases or redemptions of the fund’s capital shares, including ETF Creation Units.
* Annualized.
See accompanying Notes, which are an integral part of the Financial Statements.
50
Mid-Cap Index Fund
Notes to Financial Statements
Vanguard Mid-Cap Index Fund is registered under the Investment Company Act of 1940 as an open-end investment company, or mutual fund. The fund offers five classes of shares: Investor Shares, Admiral Shares, Signal Shares, Institutional Shares, and ETF Shares. Investor Shares are available to any investor who meets the fund’s minimum purchase requirements. Admiral Shares are designed for investors who meet certain administrative, servicing, tenure, and account-size criteria. Signal Shares are designed for institutional investors who meet certain administrative, servicing, and account-size criteria. Signal Shares were first issued on March 30, 2007. Institutional Shares are designed for investors who meet certain administrative and servicing criteria and invest a minimum of $5 million. ETF Shares are listed for trading on the American Stock Exchange; they can be purchased and sold through a broker.
A. The following significant accounting policies conform to generally accepted accounting principles for U.S. mutual funds. The fund consistently follows such policies in preparing its financial statements.
1. Security Valuation: Securities are valued as of the close of trading on the New York Stock Exchange (generally 4 p.m., Eastern time) on the valuation date. Equity securities are valued at the latest quoted sales prices or official closing prices taken from the primary market in which each security trades; such securities not traded on the valuation date are valued at the mean of the latest quoted bid and asked prices. Securities for which market quotations are not readily available, or whose values have been affected by events occurring before the fund’s pricing time but after the close of the securities’ primary markets, are valued by methods deemed by the board of trustees to represent fair value. Investments in Vanguard Market Liquidity Fund are valued at that fund’s net asset value. Temporary cash investments acquired over 60 days to maturity are valued using the latest bid prices or using valuations based on a matrix system (which considers such factors as security prices, yields, maturities, and ratings), both as furnished by independent pricing services. Other temporary cash investments are valued at amortized cost, which approximates market value.
2. Futures Contracts: The fund uses index futures contracts to a limited extent, with the objectives of maintaining full exposure to the stock market, enhancing returns, maintaining liquidity, and minimizing transaction costs. The fund may purchase futures contracts to immediately invest incoming cash in the market, or sell futures in response to cash outflows, thereby simulating a fully invested position in the underlying index while maintaining a cash balance for liquidity. The fund may seek to enhance returns by using futures contracts instead of the underlying securities when futures are believed to be priced more attractively than the underlying securities. The primary risks associated with the use of futures contracts are imperfect correlation between changes in market values of stocks held by the fund and the prices of futures contracts, and the possibility of an illiquid market.
Futures contracts are valued at their quoted daily settlement prices. The aggregate principal amounts of the contracts are not recorded in the Statement of Net Assets. Fluctuations in the value of the contracts are recorded in the Statement of Net Assets as an asset (liability) and in the Statement of Operations as unrealized appreciation (depreciation) until the contracts are closed, when they are recorded as realized futures gains (losses).
3. Federal Income Taxes: The fund intends to continue to qualify as a regulated investment company and distribute all of its taxable income. Accordingly, no provision for federal income taxes is required in the financial statements.
51
Mid-Cap Index Fund
4. Distributions: Distributions to shareholders are recorded on the ex-dividend date.
5. Security Lending: The fund may lend its securities to qualified institutional borrowers to earn additional income. Security loans are required to be secured at all times by collateral at least equal to the market value of securities loaned. The fund invests cash collateral received in Vanguard Market Liquidity Fund, and records a liability for the return of the collateral, during the period the securities are on loan. Security lending income represents the income earned on investing cash collateral, less expenses associated with the loan.
6. Other: Dividend income is recorded on the ex-dividend date. Interest income includes income distributions received from Vanguard Market Liquidity Fund and is accrued daily. Security transactions are accounted for on the date securities are bought or sold. Costs used to determine realized gains (losses) on the sale of investment securities are those of the specific securities sold.
Each class of shares has equal rights as to assets and earnings, except that each class separately bears certain class-specific expenses related to maintenance of shareholder accounts (included in Management and Administrative expenses) and shareholder reporting. Marketing and distribution expenses are allocated to each class of shares based on a method approved by the board of trustees. Income, other non-class-specific expenses, and gains and losses on investments are allocated to each class of shares based on its relative net assets.
B. The Vanguard Group furnishes at cost investment advisory, corporate management, administrative, marketing, and distribution services. The costs of such services are allocated to the fund under methods approved by the board of trustees. The fund has committed to provide up to 0.40% of its net assets in capital contributions to Vanguard. At June 30, 2007, the fund had contributed capital of $1,862,000 to Vanguard (included in Other Assets), representing 0.01% of the fund’s net assets and 1.86% of Vanguard’s capitalization. The fund’s trustees and officers are also directors and officers of Vanguard.
C. Distributions are determined on a tax basis and may differ from net investment income and realized capital gains for financial-reporting purposes. Differences may be permanent or temporary. Permanent differences are reclassified among capital accounts in the financial statements to reflect their tax character. Temporary differences arise when certain items of income, expense, gain, or loss are recognized in different periods for financial statement and tax purposes; these differences will reverse at some time in the future. Differences in classification may also result from the treatment of short-term gains as ordinary income for tax purposes.
During the six months ended June 30, 2007, the fund realized $1,101,915,000 of net capital gains resulting from in-kind redemptions—in which shareholders exchanged fund shares for securities held by the fund rather than for cash. Because such gains are not taxable to the fund, and are not distributed to shareholders, they have been reclassified from accumulated net realized losses to paid-in capital.
The fund’s tax-basis capital gains and losses are determined only at the end of each fiscal year. For tax purposes, at December 31, 2006, the fund had available realized losses of $169,094,000 to offset future net capital gains of $20,314,000 through December 31, 2011, $63,490,000 through December 31, 2014, and $85,290,000 through December 31, 2015. The fund will use these capital losses to offset net taxable capital gains, if any, realized during the year ending December 31, 2007; should the fund realize net capital losses for the year, the losses will be added to the loss carryforward balances above.
52
Mid-Cap Index Fund
At June 30, 2007, the cost of investment securities for tax purposes was $17,011,376,000. Net unrealized appreciation of investment securities for tax purposes was $4,611,388,000, consisting of unrealized gains of $4,986,562,000 on securities that had risen in value since their purchase and $375,174,000 in unrealized losses on securities that had fallen in value since their purchase.
At June 30, 2007, the aggregate settlement value of open futures contracts expiring in September 2007 and the related unrealized appreciation (depreciation) were:
| | | ($000) |
| | Aggregate | Unrealized |
| Number of | Settlement | Appreciation |
Futures Contracts | Long Contracts | Value | (Depreciation) |
S&P MidCap 400 Index | 31 | 14,015 | (110) |
Unrealized appreciation (depreciation) on open futures contracts is required to be treated as realized gain (loss) for tax purposes.
D. During the six months ended June 30, 2007, the fund purchased $5,999,051,000 of investment securities and sold $4,570,392,000 of investment securities other than temporary cash investments.
E. The market value of securities on loan to broker-dealers at June 30, 2007, was $317,195,000, for which the fund received cash collateral of $335,827,000.
F. Capital share transactions for each class of shares were:
| Six Months Ended | | Year Ended |
| June 30, 2007 | | December 31, 2006 |
| Amount | Shares | | Amount | Shares |
| ($000) | (000) | | ($000) | (000) |
Investor Shares | | | | | |
Issued | 1,533,868 | 72,975 | | 2,234,918 | 119,929 |
Issued in Lieu of Cash Distributions | 1,856 | 89 | | 87,971 | 4,452 |
Redeemed | (1,135,199) | (53,706) | | (1,845,187) | (99,197) |
Net Increase (Decrease)—Investor Shares | 400,525 | 19,358 | | 477,702 | 25,184 |
Admiral Shares | | | | | |
Issued | 952,211 | 9,939 | | 1,485,862 | 17,560 |
Issued in Lieu of Cash Distributions | 999 | 11 | | 46,434 | 518 |
Redeemed | (469,293) | (4,881) | | (708,456) | (8,322) |
Net Increase (Decrease)—Admiral Shares | 483,917 | 5,069 | | 823,840 | 9,756 |
Signal Shares | | | | | |
Issued | 188,371 | 6,251 | | — | — |
Issued in Lieu of Cash Distributions | — | — | | — | — |
Redeemed | (11,634) | (371) | | — | — |
Net Increase (Decrease)—Signal Shares | 176,737 | 5,880 | | — | — |
53
Mid-Cap Index Fund
| Six Months Ended | | Year Ended |
| June 30, 2007 | | December 31, 2006 |
| Amount | Shares | | Amount | Shares |
| ($000) | (000) | | ($000) | (000) |
Institutional Shares | | | | | |
Issued | 1,176,706 | 56,038 | | 1,642,656 | 87,622 |
Issued in Lieu of Cash Distributions | 832 | 39 | | 57,275 | 2,891 |
Redeemed | (478,535) | (22,601) | | (398,768) | (21,224) |
Net Increase (Decrease)—Institutional Shares | 699,003 | 33,476 | | 1,301,163 | 69,289 |
ETF Shares | | | | | |
Issued | 2,228,682 | 27,944 | | 2,782,508 | 39,966 |
Issued in Lieu of Cash Distributions | — | — | | — | — |
Redeemed | (2,743,252) | (34,300) | | (2,398,598) | (34,300) |
Net Increase (Decrease)—ETF Shares | (514,570) | (6,356) | | 383,910 | 5,666 |
G. In June 2006, the Financial Accounting Standards Board issued Interpretation No. 48 (“FIN 48”), “Accounting for Uncertainty in Income Taxes.” FIN 48 establishes the minimum threshold for recognizing, and a system for measuring, the benefits of tax-return positions in financial statements, effective for the fund’s current fiscal year. Management has analyzed the fund’s tax positions taken on federal income tax returns for all open tax years (tax years ended December 31, 2004–2006) for purposes of implementing FIN 48, and has concluded that no provision for income tax is required in the fund’s financial statements.
54
Mid-Cap Growth Index Fund
Fund Profile
As of June 30, 2007
Portfolio Characteristics | | |
| | Target | Broad |
| Fund | Index1 | Index2 |
Number of Stocks | 236 | 236 | 4,921 |
Median Market Cap | $7.9B | $7.9B | $32.6B |
Price/Earnings Ratio | 24.9x | 24.9x | 18.2x |
Price/Book Ratio | 4.5x | 4.5x | 2.9x |
Yield | | 0.4% | 1.7% |
Investor Shares | 0.4% | | |
ETF Shares | 0.5% | | |
Return on Equity | 19.2% | 19.2% | 18.2% |
Earnings Growth Rate | 27.3% | 26.4% | 20.7% |
Foreign Holdings | 0.5% | 0.5% | 0.0% |
Turnover Rate | 93%3 | — | — |
Expense Ratio | | — | — |
Investor Shares | 0.25%3 | | |
ETF Shares | 0.13%3 | | |
Short-Term Reserves | 0% | — | — |
Sector Diversification (% of portfolio) | |
| | Target | Broad |
| Fund | Index1 | Index2 |
Consumer Discretionary | 18% | 18% | 12% |
Consumer Staples | 2 | 2 | 8 |
Energy | 10 | 10 | 10 |
Financials | 7 | 7 | 21 |
Health Care | 14 | 14 | 11 |
Industrials | 16 | 17 | 12 |
Information Technology | 21 | 21 | 15 |
Materials | 5 | 5 | 4 |
Telecommunication | | | |
Services | 3 | 2 | 3 |
Utilities | 4 | 4 | 4 |
55
Ten Largest Holdings4 (% of total net assets) |
| | |
Precision Castparts Corp. | aerospace and | |
| defense | 1.3% |
NVIDIA Corp. | semiconductors | 1.1 |
Noble Corp. | oil and gas drilling | 1.0 |
T. Rowe Price Group Inc. | asset management | |
| and custody banks | 1.0 |
Hilton Hotels Corp. | hotels, resorts, | |
| and cruise lines | 0.9 |
L-3 Communications | aerospace and | |
Holdings, Inc. | defense | 0.9 |
ITT Industries, Inc. | industrial machinery | 0.9 |
Rockwell Collins, Inc. | aerospace and | |
| defense | 0.9 |
NII Holdings Inc. | wireless | |
| telecommunication | |
| services | 0.9 |
Smith International, Inc. | oil and gas | |
| equipment and | |
| services | 0.9 |
Top Ten | | 9.8% |
Investment Focus
1 MSCI US Mid Cap Growth Index.
2 Dow Jones Wilshire 5000 Index.
3 Annualized.
4 “Ten Largest Holdings” excludes any temporary cash investments and equity index products.
See page 75 for a glossary of investment terms.
56
Mid-Cap Growth Index Fund
Performance Summary
All of the returns in this report represent past performance, which is not a guarantee of future results that may be achieved by the fund. (Current performance may be lower or higher than the performance data cited. For performance data current to the most recent month-end, visit our website at www.vanguard.com/performance.) Note, too, that both investment returns and principal value can fluctuate widely, so an investor’s shares, when sold, could be worth more or less than their original cost. The returns shown do not reflect taxes that a shareholder would pay on fund distributions or on the sale of fund shares.
Fiscal-Year Total Returns (%): August 24, 2006–June 30, 2007
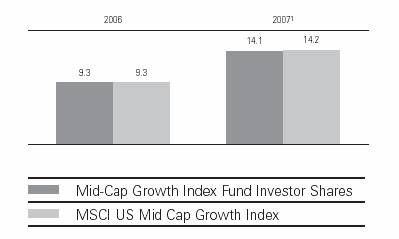
Average Annual Total Returns: Periods Ended June 30, 2007 |
| | |
| | Since |
| Inception Date | Inception |
Investor Shares2 | 8/24/2006 | 24.73% |
ETF Shares | 8/17/2006 | |
Market Price | | 23.04 |
Net Asset Value | | 23.09 |
1 Six months ended June 30, 2007.
2 Total returns do not include the account service fee that may be applicable to certain accounts with balances below $10,000. Note: See Financial Highlights tables on pages 55 and 56 for dividend and capital gains information.
57
Mid-Cap Growth Index Fund
Financial Statements (unaudited)
Statement of Net Assets
As of June 30, 2007
The fund provides a complete list of its holdings four times in each fiscal year, at the quarter-ends. For the second and fourth fiscal quarters, the lists appear in the fund’s semiannual and annual reports to shareholders. For the first and third fiscal quarters, the fund files the lists with the Securities and Exchange Commission on Form N-Q. Shareholders can look up the fund’s Forms N-Q on the SEC’s website at www.sec.gov. Forms N-Q may also be reviewed and copied at the SEC’s Public Reference Room (see the back cover of this report for further information).
| | | Market |
| | | Value• |
| | Shares | ($000) |
Common Stocks (100.1%) | | |
Consumer Discretionary (17.6%) | | |
| Hilton Hotels Corp. | 86,364 | 2,891 |
| Nordstrom, Inc. | 48,405 | 2,474 |
| ^Garmin Ltd. | 27,915 | 2,065 |
* | Apollo Group, Inc. Class A | 34,384 | 2,009 |
* | Office Depot, Inc. | 65,017 | 1,970 |
* | Cablevision Systems | | |
| NY Group Class A | 53,542 | 1,938 |
| Harman International | | |
| Industries, Inc. | 14,617 | 1,707 |
| Tiffany & Co. | 31,829 | 1,689 |
* | AutoZone Inc. | 11,621 | 1,588 |
* | The Goodyear Tire & | | |
| Rubber Co. | 43,632 | 1,517 |
| Abercrombie & Fitch Co. | 20,766 | 1,516 |
* | Discovery Holding Co. | | |
| Class A | 62,797 | 1,444 |
| Polo Ralph Lauren Corp. | 14,231 | 1,396 |
| Tim Hortons, Inc. | 44,694 | 1,374 |
| Black & Decker Corp. | 15,410 | 1,361 |
* | CarMax, Inc. | 50,367 | 1,284 |
* | GameStop Corp. Class A | 32,414 | 1,267 |
* | R.H. Donnelley Corp. | 16,526 | 1,252 |
| American Eagle | | |
| Outfitters, Inc. | 47,192 | 1,211 |
| Lamar Advertising Co. | | |
| Class A | 19,128 | 1,200 |
* | Interpublic Group of Cos., Inc. | 103,757 | 1,183 |
| Wynn Resorts Ltd. | 13,120 | 1,177 |
* | Dollar Tree Stores, Inc. | 24,060 | 1,048 |
| Dollar General Corp. | 47,701 | 1,046 |
| PetSmart, Inc. | 31,791 | 1,032 |
* | Penn National Gaming, Inc. | 16,956 | 1,019 |
| Ross Stores, Inc. | 32,734 | 1,008 |
| Advance Auto Parts, Inc. | 24,701 | 1,001 |
* | Chico’s FAS, Inc. | 41,129 | 1,001 |
58
Mid-Cap Growth Index Fund
| | | Market |
| | | Value• |
| | Shares | ($000) |
| Station Casinos, Inc. | 11,435 | 993 |
*^Sirius Satellite Radio, Inc. | 324,391 | 980 |
* | O’Reilly Automotive, Inc. | 25,310 | 925 |
* | Career Education Corp. | 22,229 | 751 |
* | XM Satellite Radio | | |
| Holdings, Inc. | 62,802 | 739 |
| Centex Corp. | 18,262 | 732 |
* | NVR, Inc. | 1,068 | 726 |
| Williams-Sonoma, Inc. | 22,331 | 705 |
| RadioShack Corp. | 19,784 | 656 |
* | Urban Outfitters, Inc. | 26,986 | 648 |
| Gentex Corp. | 31,763 | 625 |
* | Getty Images, Inc. | 12,559 | 600 |
| Family Dollar Stores, Inc. | 16,944 | 581 |
| Virgin Media Inc. | 22,657 | 552 |
| E.W. Scripps Co. Class A | 10,411 | 476 |
| Weight Watchers | | |
| International, Inc. | 8,326 | 423 |
| Boyd Gaming Corp. | 8,570 | 422 |
* | CTC Media, Inc. | 8,801 | 239 |
| | | 54,441 |
Consumer Staples (2.1%) | | |
| Whole Foods Market, Inc. | 32,930 | 1,261 |
| The Estee Lauder Cos. Inc. | | |
| Class A | 27,657 | 1,259 |
* | Energizer Holdings, Inc. | 12,526 | 1,248 |
| The Clorox Co. | 17,787 | 1,105 |
| Dean Foods Co. | 20,377 | 649 |
| Brown-Forman Corp. Class B | 8,037 | 587 |
* | Bare Escentuals, Inc. | 12,672 | 433 |
| | | 6,542 |
Energy (10.1%) | | |
| Noble Corp. | 31,648 | 3,086 |
| Smith International, Inc. | 47,024 | 2,757 |
| Sunoco, Inc. | 28,533 | 2,273 |
| ENSCO International, Inc. | 35,481 | 2,165 |
| CONSOL Energy, Inc. | 42,921 | 1,979 |
* | Ultra Petroleum Corp. | 35,553 | 1,964 |
| BJ Services Co. | 68,956 | 1,961 |
* | Cameron International Corp. | 26,066 | 1,863 |
* | Southwestern Energy Co. | 39,570 | 1,761 |
| Diamond Offshore Drilling, Inc. | 16,267 | 1,652 |
* | Grant Prideco, Inc. | 30,111 | 1,621 |
* | Pride International, Inc. | 38,583 | 1,445 |
| Range Resources Corp. | 34,400 | 1,287 |
* | FMC Technologies Inc. | 15,981 | 1,266 |
* | Nabors Industries, Inc. | 35,180 | 1,174 |
| Arch Coal, Inc. | 33,397 | 1,162 |
| Murphy Oil Corp. | 14,612 | 869 |
59
Mid-Cap Growth Index Fund
| | | Market |
| | | Value• |
| | Shares | ($000) |
| Rowan Cos., Inc. | 16,885 | 692 |
* | CNX Gas Corp. | 7,007 | 214 |
| | | 31,191 |
Financials (7.1%) | | | |
| T. Rowe Price Group Inc. | 59,069 | 3,065 |
| Nymex Holdings Inc. | 18,410 | 2,313 |
* | CBOT Holdings, Inc. Class A | 8,689 | 1,795 |
* | CB Richard Ellis Group, Inc. | 47,466 | 1,732 |
* | IntercontinentalExchange Inc. | 9,715 | 1,436 |
* | E*TRADE Financial Corp. | 64,892 | 1,433 |
* | TD Ameritrade Holding Corp. | 63,168 | 1,263 |
| Eaton Vance Corp. | 28,082 | 1,241 |
| Nuveen Investments, Inc. | | |
| Class A | 18,517 | 1,151 |
| SEI Investments Co. | 34,795 | 1,010 |
| Boston Properties, Inc. REIT | 9,606 | 981 |
| Investors Financial | | |
| Services Corp. | 15,502 | 956 |
| ^The St. Joe Co. | 16,575 | 768 |
| Brown & Brown, Inc. | 27,789 | 699 |
| The First Marblehead Corp. | 15,462 | 597 |
* | Nasdaq Stock Market Inc. | 19,657 | 584 |
| Forest City Enterprise Class A | 9,332 | 574 |
| Federated Investors, Inc. | 11,032 | 423 |
| | | 22,021 |
Health Care (14.5%) | | |
* | Express Scripts Inc. | 54,056 | 2,703 |
| Biomet, Inc. | 54,659 | 2,499 |
* | Humana Inc. | 39,040 | 2,378 |
* | Laboratory Corp. of | | |
| America Holdings | 29,388 | 2,300 |
* | Coventry Health Care Inc. | 37,319 | 2,151 |
| C.R. Bard, Inc. | 24,152 | 1,996 |
| IMS Health, Inc. | 45,675 | 1,468 |
* | Health Net Inc. | 27,322 | 1,443 |
* | Waters Corp. | 23,801 | 1,413 |
* | DaVita, Inc. | 24,388 | 1,314 |
| Quest Diagnostics, Inc. | 25,268 | 1,305 |
| DENTSPLY International Inc. | 33,851 | 1,295 |
* | Varian Medical Systems, Inc. | 30,097 | 1,279 |
* | Amylin Pharmaceuticals, Inc. | 30,711 | 1,264 |
* | Intuitive Surgical, Inc. | 8,724 | 1,211 |
* | Cephalon, Inc. | 14,338 | 1,153 |
| Manor Care, Inc. | 17,118 | 1,118 |
* | Henry Schein, Inc. | 20,767 | 1,110 |
| AmerisourceBergen Corp. | 22,222 | 1,099 |
* | Endo Pharmaceuticals | | |
| Holdings, Inc. | 31,277 | 1,071 |
* | Sepracor Inc. | 25,766 | 1,057 |
60
Mid-Cap Growth Index Fund
| | | Market |
| | | Value• |
| | Shares | ($000) |
* | Covance, Inc. | 15,032 | 1,031 |
* | Patterson Cos. | 26,096 | 973 |
| Pharmaceutical Product | | |
| Development, Inc. | 24,736 | 947 |
* | Millipore Corp. | 12,547 | 942 |
* | Hospira, Inc. | 23,749 | 927 |
* | Cerner Corp. | 15,604 | 866 |
* | Lincare Holdings, Inc. | 21,720 | 866 |
* | Vertex Pharmaceuticals, Inc. | 29,665 | 847 |
* | Millennium | | |
| Pharmaceuticals, Inc. | 71,541 | 756 |
* | Tenet Healthcare Corp. | 110,931 | 722 |
| Applera Corp.–Applied | | |
| Biosystems Group | 21,504 | 657 |
* | Kinetic Concepts, Inc. | 12,416 | 645 |
* | ImClone Systems, Inc. | 13,907 | 492 |
* | Warner Chilcott Ltd. | 23,510 | 425 |
| Brookdale Senior Living Inc. | 8,269 | 377 |
| Beckman Coulter, Inc. | 5,037 | 326 |
* | Abraxis Bioscience, Inc. | 7,642 | 170 |
| | | 44,596 |
Industrials (16.5%) | | |
| Precision Castparts Corp. | 32,128 | 3,899 |
| L-3 Communications | | |
| Holdings, Inc. | 29,281 | 2,852 |
| ITT Industries, Inc. | 41,082 | 2,805 |
| Rockwell Collins, Inc. | 39,393 | 2,783 |
| American Standard Cos., Inc. | 42,312 | 2,496 |
| Cummins Inc. | 23,278 | 2,356 |
| Fluor Corp. | 20,663 | 2,301 |
* | McDermott International, Inc. | 25,907 | 2,153 |
| Expeditors International of | | |
| Washington, Inc. | 49,967 | 2,064 |
| C.H. Robinson Worldwide Inc. | 38,743 | 2,035 |
* | Terex Corp. | 23,852 | 1,939 |
* | Foster Wheeler Ltd. | 16,135 | 1,726 |
| Joy Global Inc. | 27,816 | 1,622 |
* | Jacobs Engineering | | |
| Group Inc. | 27,727 | 1,595 |
| Equifax, Inc. | 34,459 | 1,531 |
* | AMR Corp. | 56,416 | 1,487 |
| The Dun & Bradstreet Corp. | 14,426 | 1,486 |
| Robert Half International, Inc. | 37,367 | 1,364 |
| Fastenal Co. | 30,115 | 1,261 |
| Roper Industries Inc. | 20,462 | 1,168 |
* | Monster Worldwide Inc. | 27,566 | 1,133 |
* | KBR Inc. | 39,235 | 1,029 |
| Ametek, Inc. | 24,819 | 985 |
* | Hertz Global Holdings Inc. | 33,779 | 898 |
61
Mid-Cap Growth Index Fund
| | | Market | |
| | | Value• | |
| | Shares | ($000) | |
* | USG Corp. | 17,279 | 847 | |
* | Spirit Aerosystems | | | |
| Holdings Inc. | 23,375 | 843 | |
* | ChoicePoint Inc. | 18,725 | 795 | |
| Republic Services, Inc. | | | |
| Class A | 22,683 | 695 | |
| J.B. Hunt Transport | | | |
| Services, Inc. | 23,626 | 693 | |
| Pall Corp. | 14,290 | 657 | |
| The Corporate Executive | | | |
| Board Co. | 9,114 | 592 | |
* | First Solar, Inc. | 6,479 | 578 | |
* | Owens Corning Inc. | 6,378 | 214 | |
| | | 50,882 | |
Information Technology (21.1%) | | |
* | NVIDIA Corp. | 79,193 | 3,271 | |
* | SanDisk Corp. | 52,761 | 2,582 | |
| KLA-Tencor Corp. | 46,849 | 2,574 | |
* | MEMC Electronic | | | |
| Materials, Inc. | 41,821 | 2,556 | |
* | Autodesk, Inc. | 53,920 | 2,539 | |
* | Cognizant Technology | | | |
| Solutions Corp. | 33,426 | 2,510 | |
* | Micron Technology, Inc. | 177,490 | 2,224 | |
* | NCR Corp. | 41,720 | 2,192 | |
* | Fiserv, Inc. | 38,524 | 2,188 | |
| National Semiconductor Corp. | 74,937 | 2,118 | |
| Xilinx, Inc. | 77,783 | 2,082 | |
| Altera Corp. | 83,642 | 1,851 | |
* | VeriSign, Inc. | 56,908 | 1,806 | |
* | Avaya Inc. | 106,606 | 1,795 | |
* | Akamai Technologies, Inc. | 35,767 | 1,740 | |
| Harris Corp. | 31,416 | 1,714 | |
* | LAM Research Corp. | 33,340 | 1,714 | |
| Amphenol Corp. | 41,684 | 1,486 | |
* | BMC Software, Inc. | 47,735 | 1,446 | |
* | Citrix Systems, Inc. | 42,374 | 1,427 | |
* | McAfee Inc. | 37,516 | 1,321 | |
* | BEA Systems, Inc. | 91,814 | 1,257 | |
* | CDW Corp. | 14,731 | 1,252 | |
* | Affiliated Computer | | | |
| Services, Inc. Class A | 21,658 | 1,228 | |
* | Alliance Data Systems Corp. | 15,890 | 1,228 | |
* | Activision, Inc. | 65,654 | 1,226 | |
* | Iron Mountain, Inc. | 44,146 | 1,153 | |
* | Ceridian Corp. | 32,589 | 1,141 | |
* | DST Systems, Inc. | 12,428 | 984 | |
* | NAVTEQ Corp. | 22,957 | 972 | |
* | Red Hat, Inc. | 42,938 | 957 | |
62
Mid-Cap Growth Index Fund
| | | Market |
| | | Value• |
| | Shares | ($000) |
* | salesforce.com, inc. | 21,356 | 915 |
* | Avnet, Inc. | 22,591 | 895 |
| Fidelity National Information | | |
| Services, Inc. | 15,599 | 847 |
* | Novellus Systems, Inc. | 29,072 | 825 |
* | Hewitt Associates, Inc. | 24,704 | 790 |
* | Teradyne, Inc. | 44,638 | 785 |
* | Lexmark International, Inc. | 14,956 | 737 |
* | CheckFree Corp. | 17,348 | 697 |
* | JDS Uniphase Corp. | 48,081 | 646 |
* | Zebra Technologies Corp. | | |
| Class A | 16,446 | 637 |
* | QLogic Corp. | 37,195 | 619 |
* | Cadence Design | | |
| Systems, Inc. | 22,971 | 504 |
| Jabil Circuit, Inc. | 22,406 | 494 |
| Molex, Inc. | 15,177 | 455 |
* | Compuware Corp. | 26,437 | 314 |
| Total System Services, Inc. | 9,242 | 273 |
| | | 64,967 |
Materials (4.9%) | | |
| Allegheny Technologies Inc. | 21,317 | 2,236 |
| Martin Marietta Materials, Inc. | 10,605 | 1,718 |
* | The Mosaic Co. | 36,182 | 1,412 |
* | Owens-Illinois, Inc. | 35,991 | 1,260 |
| Sealed Air Corp. | 37,754 | 1,171 |
| Ball Corp. | 21,766 | 1,157 |
* | Pactiv Corp. | 31,174 | 994 |
* | Crown Holdings, Inc. | 38,160 | 953 |
| Vulcan Materials Co. | 7,813 | 895 |
| Florida Rock Industries, Inc. | 11,597 | 783 |
| Albemarle Corp. | 18,848 | 726 |
* | Titanium Metals Corp. | 18,956 | 605 |
| Steel Dynamics, Inc. | 13,818 | 579 |
| Sigma-Aldrich Corp. | 10,843 | 463 |
| Huntsman Corp. | 11,684 | 284 |
| | | 15,236 |
Telecommunication Services (2.6%) | |
* | NII Holdings Inc. | 34,182 | 2,760 |
* | Crown Castle | | |
| International Corp. | 61,244 | 2,221 |
* | Level 3 Communications, Inc. | 259,477 | 1,518 |
* | Leap Wireless | | |
| International, Inc. | 12,736 | 1,076 |
* | U.S. Cellular Corp. | 3,794 | 344 |
| | | 7,919 |
Utilities (3.6%) | | |
* | Mirant Corp. | 60,194 | 2,567 |
* | NRG Energy, Inc. | 54,653 | 2,272 |
| | | | |
63
Mid-Cap Growth Index Fund
| | | Market | |
| | | Value• | |
| | Shares | ($000) | |
| Questar Corp. | 40,209 | 2,125 | |
* | Allegheny Energy, Inc. | 38,698 | 2,002 | |
* | Reliant Energy, Inc. | 36,278 | 978 | |
| Equitable Resources, Inc. | 13,489 | 668 | |
* | Dynegy, Inc. | 40,407 | 381 | |
| | | 10,993 | |
Total Common Stocks | | | |
(Cost $291,499) | | 308,788 | |
Temporary Cash Investment (0.6%) | | |
1 Vanguard Market Liquidity | | |
Fund, 5.281%—Note E | | | |
(Cost $1,966) | 1,965,800 | 1,966 | |
Total Investments (100.7%) | | | |
(Cost $293,465) | | 310,754 | |
Other Assets and Liabilities (–0.7%) | |
Other Assets—Note B | | 3,257 | |
Liabilities—Note E | | (5,386) | |
| | (2,129) | |
Net Assets (100%) | | 308,625 | |
64
Mid-Cap Growth Index Fund
At June 30, 2007, net assets consisted of:2 | |
| Amount |
| ($000) |
Paid-in Capital | 292,464 |
Undistributed Net Investment Income | 398 |
Accumulated Net Realized Losses | (1,526) |
Unrealized Appreciation | 17,289 |
Net Assets | 308,625 |
| |
Investor Shares—Net Assets | |
Applicable to 7,330,035 outstanding | |
$.001 par value shares of beneficial | |
interest (unlimited authorization) | 182,180 |
Net Asset Value Per Share— | |
Investor Shares | $24.85 |
| |
| |
ETF Shares—Net Assets | |
Applicable to 2,000,624 outstanding | |
$.001 par value shares of beneficial | |
interest (unlimited authorization) | 126,445 |
Net Asset Value Per Share— | |
ETF Shares | $63.20 |
• See Note A in Notes to Financial Statements.
* Non-income-producing security.
^ Part of security position is on loan to broker-dealers. See Note E in Notes to Financial Statements.
1 Affiliated money market fund available only to Vanguard funds and certain trusts and accounts managed by Vanguard. Rate shown is the 7-day yield.
2 See Note C in Notes to Financial Statements for the tax-basis components of net assets. REIT—Real Estate Investment Trust.
65
Mid-Cap Growth Index Fund
Statement of Operations
| Six Months Ended |
| June 30, 2007 |
| ($000) |
Investment Income | |
Income | |
Dividends | 486 |
Interest1 | 65 |
Security Lending | 7 |
Total Income | 558 |
Expenses | |
The Vanguard Group—Note B | |
Investment Advisory Services | 11 |
Management and Administrative | |
Investor Shares | 58 |
ETF Shares | 4 |
Marketing and Distribution | |
Investor Shares | 4 |
ETF Shares | 3 |
Custodian Fees | 70 |
Shareholders’ Reports | |
Investor Shares | 2 |
ETF Shares | 1 |
Total Expenses | 153 |
Net Investment Income | 405 |
Realized Net Gain (Loss) | |
Investment Securities Sold | 2,713 |
Futures Contracts | (158) |
Realized Net Gain (Loss) | 2,555 |
Change in Unrealized Appreciation (Depreciation) | |
Investment Securities Sold | 15,999 |
Futures Contracts | — |
Change in Unrealized Appreciation (Depreciation) | 15,999 |
Net Increase (Decrease) in Net Assets Resulting from Operations | 18,959 |
1 Interest income from an affiliated company of the fund was $65,000.
66
Mid-Cap Growth Index Fund
Statement of Changes in Net Assets
| | | August 17, |
| Six Months Ended | | 20061 to |
| June 30, | | December 31, |
| 2007 | | 2006 |
| ($000) | | ($000) |
Increase (Decrease) in Net Assets | | | |
Operations | | | |
Net Investment Income | 405 | | 182 |
Realized Net Gain (Loss) | 2,555 | | 1,839 |
Change in Unrealized Appreciation (Depreciation) | 15,999 | | 1,290 |
Net Increase (Decrease) in Net Assets Resulting from Operations | 18,959 | | 3,311 |
Distributions | | | |
Net Investment Income | | | |
Investor Shares | (11) | | (84) |
ETF Shares | (10) | | (84) |
Realized Capital Gain | | | |
Investor Shares | — | | — |
ETF Shares | — | | — |
Total Distributions | (21) | | (168) |
Capital Share Transactions—Note F | | | |
Investor Shares | 147,283 | | 23,964 |
ETF Shares | 96,010 | | 19,287 |
Net Increase (Decrease) from Capital Share Transactions | 243,293 | | 43,251 |
Total Increase (Decrease) | 262,231 | | 46,394 |
Net Assets | | | |
Beginning of Period | 46,394 | | — |
End of Period2 | 308,625 | | 46,394 |
1 Inception.
2 Net Assets—End of Period includes undistributed (overdistributed) net investment income of $398,000 and $14,000.
67
Mid-Cap Growth Index Fund
Financial Highlights
Investor Shares | | |
| Six Months | Aug. 24, |
| Ended | 20061 to |
| June 30, | Dec. 31, |
For a Share Outstanding Throughout Each Period | 2007 | 2006 |
Net Asset Value, Beginning of Period | $21.78 | $20.00 |
Investment Operations | | |
Net Investment Income | .027 | .09 |
Net Realized and Unrealized Gain (Loss) on Investments | 3.047 | 1.77 |
Total from Investment Operations | 3.074 | 1.86 |
Distributions | | |
Dividends from Net Investment Income | (.004) | (.08) |
Distributions from Realized Capital Gains | — | — |
Total Distributions | (.004) | (.08) |
Net Asset Value, End of Period | $24.85 | $21.78 |
| | |
Total Return2 | 14.12% | 9.30% |
| | |
Ratios/Supplemental Data | | |
Net Assets, End of Period (Millions) | $182 | $24 |
Ratio of Total Expenses to Average Net Assets | 0.25%* | 0.26%* |
Ratio of Net Investment Income to Average Net Assets | 0.47%* | 1.00%* |
Portfolio Turnover Rate3 | 93%* | 20% |
1 Inception.
2 Total returns do not include the account service fee that may be applicable to certain accounts with balances below $10,000.
3 Excludes the value of portfolio securities received or delivered as a result of in-kind purchases or redemptions of the fund’s capital shares, including ETF Creation Units.
* Annualized.
68
Mid-Cap Growth Index Fund
ETF Shares | | |
| Six Months | Aug. 17, |
| Ended | 20061 to |
| June 30, | Dec. 31, |
For a Share Outstanding Throughout Each Period | 2007 | 2006 |
Net Asset Value, Beginning of Period | $55.35 | $51.55 |
Investment Operations | | |
Net Investment Income | .09 | .228 |
Net Realized and Unrealized Gain (Loss) on Investments | 7.77 | 3.783 |
Total from Investment Operations | 7.86 | 4.011 |
Distributions | | |
Dividends from Net Investment Income | (.01) | (.211) |
Distributions from Realized Capital Gains | — | — |
Total Distributions | (.01) | (.211) |
Net Asset Value, End of Period | $63.20 | $55.35 |
| | |
Total Return | 14.20% | 7.78% |
| | |
Ratios/Supplemental Data | | |
Net Assets, End of Period (Millions) | $126 | $22 |
Ratio of Total Expenses to Average Net Assets | 0.13%* | 0.13%* |
Ratio of Net Investment Income to Average Net Assets | 0.59%* | 1.13%* |
Portfolio Turnover Rate2 | 93%* | 20% |
1 Inception.
2 Excludes the value of portfolio securities received or delivered as a result of in-kind purchases or redemptions of the fund’s capital shares, including ETF Creation Units.
* Annualized.
69
Mid-Cap Growth Index Fund
Notes to Financial Statements
Vanguard Mid-Cap Growth Index Fund is registered under the Investment Company Act of 1940 as an open-end investment company, or mutual fund. The fund offers two classes of shares: Investor Shares and ETF Shares. Investor Shares are available to any investor who meets the fund’s minimum purchase requirements. ETF Shares are listed for trading on the American Stock Exchange; they can be purchased and sold through a broker.
A. The following significant accounting policies conform to generally accepted accounting principles for U.S. mutual funds. The fund consistently follows such policies in preparing its financial statements.
1. Security Valuation: Securities are valued as of the close of trading on the New York Stock Exchange (generally 4 p.m., Eastern time) on the valuation date. Equity securities are valued at the latest quoted sales prices or official closing prices taken from the primary market in which each security trades; such securities not traded on the valuation date are valued at the mean of the latest quoted bid and asked prices. Securities for which market quotations are not readily available, or whose values have been affected by events occurring before the fund’s pricing time but after the close of the securities’ primary markets, are valued by methods deemed by the board of trustees to represent fair value. Investments in Vanguard Market Liquidity Fund are valued at that fund’s net asset value.
2. Futures Contracts: The fund uses index futures contracts to a limited extent, with the objective of maintaining full exposure to the stock market while maintaining liquidity. The fund may purchase or sell futures contracts to achieve a desired level of investment, whether to accommodate portfolio turnover or cash flows from capital share transactions. The primary risks associated with the use of futures contracts are imperfect correlation between changes in market values of stocks held by the fund and the prices of futures contracts, and the possibility of an illiquid market.
Futures contracts are valued at their quoted daily settlement prices. The aggregate principal amounts of the contracts are not recorded in the Statement of Net Assets. Fluctuations in the value of the contracts are recorded in the Statement of Net Assets as an asset (liability) and in the Statement of Operations as unrealized appreciation (depreciation) until the contracts are closed, when they are recorded as realized futures gains (losses).
3. Federal Income Taxes: The fund intends to continue to qualify as a regulated investment company and distribute all of its taxable income. Accordingly, no provision for federal income taxes is required in the financial statements.
4. Distributions: Distributions to shareholders are recorded on the ex-dividend date.
5. Security Lending: The fund may lend its securities to qualified institutional borrowers to earn additional income. Security loans are required to be secured at all times by collateral at least equal to the market value of securities loaned. The fund invests cash collateral received in Vanguard Market Liquidity Fund, and records a liability for the return of the collateral, during the period the securities are on loan. Security lending income represents the income earned on investing cash collateral, less expenses associated with the loan.
70
Mid-Cap Growth Index Fund
6. Other: Dividend income is recorded on the ex-dividend date. Interest income includes income distributions received from Vanguard Market Liquidity Fund and is accrued daily. Security transactions are accounted for on the date securities are bought or sold. Costs used to determine realized gains (losses) on the sale of investment securities are those of the specific securities sold.
Each class of shares has equal rights as to assets and earnings, except that each class separately bears certain class-specific expenses related to maintenance of shareholder accounts (included in Management and Administrative expenses) and shareholder reporting. Marketing and distribution expenses are allocated to each class of shares based on a method approved by the board of trustees. Income, other non-class-specific expenses, and gains and losses on investments are allocated to each class of shares based on its relative net assets.
B. The Vanguard Group furnishes at cost investment advisory, corporate management, administrative, marketing, and distribution services. The costs of such services are allocated to the fund under methods approved by the board of trustees. The fund has committed to provide up to 0.40% of its net assets in capital contributions to Vanguard. At June 30, 2007, the fund had contributed capital of $24,000 to Vanguard (included in Other Assets), representing 0.01% of the fund’s net assets and 0.02% of Vanguard’s capitalization. The fund’s trustees and officers are also directors and officers of Vanguard.
C. Distributions are determined on a tax basis and may differ from net investment income and realized capital gains for financial-reporting purposes. Differences may be permanent or temporary. Permanent differences are reclassified among capital accounts in the financial statements to reflect their tax character. Temporary differences arise when certain items of income, expense, gain, or loss are recognized in different periods for financial statement and tax purposes; these differences will reverse at some time in the future. Differences in classification may also result from the treatment of short-term gains as ordinary income for tax purposes.
During the six months ended June 30, 2007, the fund realized $3,700,000 of net capital gains resulting from in-kind redemptions—in which shareholders exchanged fund shares for securities held by the fund rather than for cash. Because such gains are not taxable to the fund, and are not distributed to shareholders, they have been reclassified from accumulated net realized gains to paid-in capital.
The fund’s tax-basis capital gains and losses are determined only at the end of each fiscal year. For tax purposes, at December 31, 2006, the fund had available realized losses of $374,000 to offset future net capital gains of $35,000 through December 31, 2014, and $339,000 through December 31, 2015. The fund will use these capital losses to offset net taxable capital gains, if any, realized during the year ending December 31, 2007; should the fund realize net capital losses for the year, the losses will be added to the loss carryforward balances above.
At June 30, 2007, the cost of investment securities for tax purposes was $293,465,000. Net unrealized appreciation of investment securities for tax purposes was $17,289,000, consisting of unrealized gains of $21,430,000 on securities that had risen in value since their purchase and $4,141,000 in unrealized losses on securities that had fallen in value since their purchase.
D. During the six months ended June 30, 2007, the fund purchased $346,734,000 of investment securities and sold $103,134,000 of investment securities other than temporary cash investments.
E. The market value of securities on loan to broker-dealers at June 30, 2007, was $1,756,000, for which the fund received cash collateral of $1,966,000.
71
Mid-Cap Growth Index Fund
F. Capital share transactions for each class of shares were:
| Six Months Ended | | | Inception1 to |
| June 30, 2007 | | | December 31, 2006 |
| Amount | Shares | | Amount | Shares |
| ($000) | (000) | | ($000) | (000) |
Investor Shares | | | | | |
Issued | 160,627 | 6,779 | | 25,082 | 1,165 |
Issued in Lieu of Cash Distributions | 10 | — | | 75 | 3 |
Redeemed | (13,354) | (562) | | (1,193) | (55) |
Net Increase (Decrease)—Investor Shares | 147,283 | 6,217 | | 23,964 | 1,113 |
ETF Shares | | | | | |
Issued | 121,494 | 2,000 | | 41,642 | 800 |
Issued in Lieu of Cash Distributions | — | — | | — | — |
Redeemed | (25,484) | (400) | | (22,355) | (400) |
Net Increase (Decrease)—ETF Shares | 96,010 | 1,600 | | 19,287 | 400 |
G. In June 2006, the Financial Accounting Standards Board issued Interpretation No. 48 (“FIN 48”), “Accounting for Uncertainty in Income Taxes.” FIN 48 establishes the minimum threshold for recognizing, and a system for measuring, the benefits of tax-return positions in financial statements, effective for the fund’s current fiscal year. Management has analyzed the fund’s tax positions taken on its federal income tax return for open tax year ended December 31, 2006, for purposes of implementing FIN 48, and has concluded that no provision for income tax is required in the fund’s financial statements.
1 Inception was August 24, 2006, for Investor Shares and August 17, 2006, for ETF Shares.
72
Mid-Cap Value Index Fund
Fund Profile
As of June 30, 2007
Portfolio Characteristics | | |
| | Target | Broad |
| Fund | Index1 | Index2 |
Number of Stocks | 252 | 252 | 4,921 |
Median Market Cap | $6.6B | $6.6B | $32.6B |
Price/Earnings Ratio | 18.1x | 18.1x | 18.2x |
Price/Book Ratio | 2.1x | 2.1x | 2.9x |
Yield | | 2.1% | 1.7% |
Investor Shares | 2.0% | | |
ETF Shares | 2.1% | | |
Return on Equity | 13.7% | 13.7% | 18.2% |
Earnings Growth Rate | 13.9% | 13.9% | 20.7% |
Foreign Holdings | 1.8% | 1.8% | 0.0% |
Turnover Rate | 45%3 | — | — |
Expense Ratio | | — | — |
Investor Shares | 0.25%3 | | |
ETF Shares | 0.13%3 | | |
Short-Term Reserves | 0% | — | — |
Sector Diversification (% of portfolio) | |
| | Target | Broad |
| Fund | Index1 | Index2 |
Consumer Discretionary | 17% | 17% | 12% |
Consumer Staples | 6 | 6 | 8 |
Energy | 5 | 5 | 10 |
Financials | 34 | 34 | 21 |
Health Care | 5 | 5 | 11 |
Industrials | 9 | 9 | 12 |
Information Technology | 7 | 7 | 15 |
Materials | 6 | 6 | 4 |
Telecommunication | | | |
Services | 3 | 3 | 3 |
Utilities | 8 | 8 | 4 |
73
Ten Largest Holdings4 (% of total net assets) |
| | |
Ameriprise Financial, Inc. | asset management | |
| and custody banks | 1.1% |
Archstone-Smith Trust | | |
REIT | residential REITs | 1.0 |
United States Steel Corp. | steel | 1.0 |
Host Hotels & Resorts Inc. | | |
REIT | specialized REITs | 1.0 |
El Paso Corp. | oil and gas storage | |
| and transportation | 0.9 |
Seagate Technology | computer storage | |
| and peripherals | 0.9 |
Parker Hannifin Corp. | industrial machinery | 0.9 |
Rockwell Automation, Inc. | electrical | |
| components and | |
| equipment | 0.8 |
CIT Group, Inc. | specialized finance | 0.8 |
Noble Energy, Inc. | oil and gas | |
| exploration and | |
| production | 0.8 |
Top Ten | | 9.2% |
Investment Focus
1 MSCI US Mid Cap Value Index.
2 Dow Jones Wilshire 5000 Index.
3 Annualized.
4 “Ten Largest Holdings” excludes any temporary cash investments and equity index products.
See page 75 for a glossary of investment terms.
74
Mid-Cap Value Index Fund
Performance Summary
All of the returns in this report represent past performance, which is not a guarantee of future results that may be achieved by the fund. (Current performance may be lower or higher than the performance data cited. For performance data current to the most recent month-end, visit our website at www.vanguard.com/performance.) Note, too, that both investment returns and principal value can fluctuate widely, so an investor’s shares, when sold, could be worth more or less than their original cost. The returns shown do not reflect taxes that a shareholder would pay on fund distributions or on the sale of fund shares.
Fiscal-Year Total Returns (%): August 24, 2006–June 30, 2007
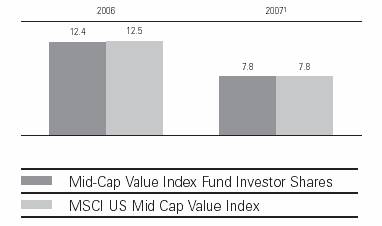
Average Annual Total Returns: Periods Ended June 30, 2007 |
| | |
| | Since |
| Inception Date | Inception |
Investor Shares2 | 8/24/2006 | 21.13% |
ETF Shares | 8/17/2006 | |
Market Price | | 20.59 |
Net Asset Value | | 20.56 |
1 Six months ended June 30, 2007.
2 Total returns do not include the account service fee that may be applicable to certain accounts with balances below $10,000. Note: See Financial Highlights tables on pages 67 and 68 for dividend and capital gains information.
75
Mid-Cap Value Index Fund
Financial Statements (unaudited)
Statement of Net Assets
As of June 30, 2007
The fund provides a complete list of its holdings four times in each fiscal year, at the quarter-ends. For the second and fourth fiscal quarters, the lists appear in the fund’s semiannual and annual reports to shareholders. For the first and third fiscal quarters, the fund files the lists with the Securities and Exchange Commission on Form N-Q. Shareholders can look up the fund’s Forms N-Q on the SEC’s website at www.sec.gov. Forms N-Q may also be reviewed and copied at the SEC’s Public Reference Room (see the back cover of this report for further information).
| | | Market |
| | | Value• |
| | Shares | ($000) |
Common Stocks (99.7%)1 | | |
Consumer Discretionary (16.5%) | | |
| Mattel, Inc. | 123,878 | 3,133 |
| Whirlpool Corp. | 24,441 | 2,718 |
| Genuine Parts Co. | 53,397 | 2,649 |
| VF Corp. | 28,018 | 2,566 |
| Newell Rubbermaid, Inc. | 86,863 | 2,556 |
| Eastman Kodak Co. | 90,519 | 2,519 |
| Sherwin-Williams Co. | 35,911 | 2,387 |
| H & R Block, Inc. | 101,550 | 2,373 |
* | Wyndham Worldwide Corp. | 62,089 | 2,251 |
* | IAC/InterActiveCorp | 63,006 | 2,181 |
* | Expedia, Inc. | 69,730 | 2,042 |
| Darden Restaurants Inc. | 43,164 | 1,899 |
| Royal Caribbean Cruises, Ltd. | 43,194 | 1,856 |
| D. R. Horton, Inc. | 89,046 | 1,775 |
* | Mohawk Industries, Inc. | 17,041 | 1,718 |
| Idearc Inc. | 45,706 | 1,615 |
| BorgWarner, Inc. | 18,167 | 1,563 |
| Pulte Homes, Inc. | 68,602 | 1,540 |
| Hasbro, Inc. | 47,283 | 1,485 |
| Lennar Corp. Class A | 40,125 | 1,467 |
| Autoliv, Inc. | 25,468 | 1,448 |
| ServiceMaster Co. | 91,719 | 1,418 |
| The Stanley Works | 23,356 | 1,418 |
| Virgin Media Inc. | 56,788 | 1,384 |
| Washington Post Co. Class B | 1,731 | 1,343 |
| Leggett & Platt, Inc. | 55,663 | 1,227 |
| Liz Claiborne, Inc. | 32,293 | 1,205 |
| Brinker International, Inc. | 38,329 | 1,122 |
| Wendy’s International, Inc. | 29,957 | 1,101 |
* | AutoNation, Inc. | 48,603 | 1,091 |
| ^New York Times Co. Class A | 42,558 | 1,081 |
| Foot Locker, Inc. | 49,041 | 1,069 |
* | Toll Brothers, Inc. | 41,460 | 1,036 |
| Jones Apparel Group, Inc. | 33,997 | 960 |
| KB Home | 23,937 | 942 |
76
Mid-Cap Value Index Fund
| | | Market |
| | | Value• |
| | Shares | ($000) |
| Brunswick Corp. | 28,432 | 928 |
| Circuit City Stores, Inc. | 55,469 | 836 |
| Family Dollar Stores, Inc. | 22,715 | 780 |
| Dollar General Corp. | 34,324 | 752 |
| Tribune Co. | 25,133 | 739 |
| E.W. Scripps Co. Class A | 13,953 | 638 |
| Centex Corp. | 13,101 | 525 |
| RadioShack Corp. | 14,270 | 473 |
| The McClatchy Co. Class A | 17,471 | 442 |
| Boyd Gaming Corp. | 6,189 | 304 |
| | | 66,555 |
Consumer Staples (5.9%) | | |
| Bunge Ltd. | 37,535 | 3,172 |
| SuperValu Inc. | 65,115 | 3,016 |
| UST, Inc. | 50,335 | 2,703 |
| Coca-Cola Enterprises, Inc. | 83,155 | 1,996 |
| Tyson Foods, Inc. | 81,694 | 1,882 |
| Molson Coors Brewing Co. | | |
| Class B | 20,110 | 1,859 |
* | Constellation Brands, Inc. | | |
| Class A | 66,342 | 1,611 |
| The Clorox Co. | 23,699 | 1,472 |
| The Pepsi Bottling Group, Inc. | 42,675 | 1,437 |
| McCormick & Co., Inc. | 36,610 | 1,398 |
* | Smithfield Foods, Inc. | 35,633 | 1,097 |
| Hormel Foods Corp. | 23,735 | 887 |
| PepsiAmericas, Inc. | 20,221 | 497 |
| Dean Foods Co. | 14,595 | 465 |
| Brown-Forman Corp. Class B | 5,784 | 423 |
| | | 23,915 |
Energy (5.2%) | | |
| El Paso Corp. | 222,248 | 3,829 |
| Noble Energy, Inc. | 53,387 | 3,331 |
| Tesoro Corp. | 42,986 | 2,457 |
| Murphy Oil Corp. | 36,194 | 2,151 |
| Pioneer Natural Resources Co. | 38,697 | 1,885 |
* | Newfield Exploration Co. | 40,362 | 1,838 |
* | Nabors Industries, Inc. | 47,185 | 1,575 |
| Patterson-UTI Energy, Inc. | 49,324 | 1,293 |
| Cimarex Energy Co. | 25,963 | 1,023 |
Pogo Producing Co. | 18,298 | 929 |
Rowan Cos., Inc. | 12,171 | 499 |
| | 20,810 |
Financials (34.2%) | | |
Ameriprise Financial, Inc. | 67,465 | 4,289 |
Archstone-Smith Trust REIT | 68,806 | 4,067 |
Host Hotels & Resorts Inc. | | |
REIT | 170,073 | 3,932 |
CIT Group Inc. | 62,139 | 3,407 |
77
Mid-Cap Value Index Fund
| | | Market |
| | | Value• |
| | Shares | ($000) |
Avalonbay Communities, Inc. | | |
REIT | 24,621 | 2,927 |
Ambac Financial Group, Inc. | 33,313 | 2,905 |
Unum Group | 107,339 | 2,803 |
Compass Bancshares Inc. | 40,512 | 2,795 |
Kimco Realty Corp. REIT | 70,460 | 2,682 |
MBIA, Inc. | 42,476 | 2,643 |
Zions Bancorp | 33,442 | 2,572 |
Sovereign Bancorp, Inc. | 118,554 | 2,506 |
Synovus Financial Corp. | 81,612 | 2,505 |
Boston Properties, Inc. REIT | 23,796 | 2,430 |
Plum Creek Timber Co. Inc. | | |
REIT | 55,560 | 2,315 |
American Capital | | |
Strategies, Ltd. | 54,002 | 2,296 |
SL Green Realty Corp. REIT | 18,312 | 2,269 |
Everest Re Group, Ltd. | 20,368 | 2,213 |
Willis Group Holdings Ltd. | 49,258 | 2,170 |
Cincinnati Financial Corp. | 48,861 | 2,121 |
Commerce Bancorp, Inc. | 56,134 | 2,076 |
Safeco Corp. | 33,082 | 2,060 |
Torchmark Corp. | 30,741 | 2,060 |
Hudson City Bancorp, Inc. | 166,957 | 2,040 |
A.G. Edwards, Inc. | 23,560 | 1,992 |
Assurant, Inc. | 32,868 | 1,937 |
The Macerich Co. REIT | 22,533 | 1,857 |
Health Care Properties | | |
Investors REIT | 62,899 | 1,820 |
Developers Diversified | | |
Realty Corp. REIT | 34,125 | 1,799 |
Leucadia National Corp. | 50,841 | 1,792 |
iStar Financial Inc. REIT | 39,659 | 1,758 |
Axis Capital Holdings Ltd. | 42,299 | 1,719 |
W.R. Berkley Corp. | 51,346 | 1,671 |
People’s United Financial Inc. | 94,114 | 1,669 |
Janus Capital Group Inc. | 59,780 | 1,664 |
AMB Property Corp. REIT | 30,993 | 1,649 |
White Mountains Insurance | | |
Group Inc. | 2,704 | 1,639 |
Huntington Bancshares Inc. | 70,493 | 1,603 |
Fidelity National Financial, Inc. | |
Class A | 65,106 | 1,543 |
First Horizon National Corp. | 39,129 | 1,526 |
| Apartment Investment & | | |
| Management Co. | | |
| Class A REIT | 30,237 | 1,525 |
| Regency Centers Corp. REIT | 21,594 | 1,522 |
| Duke Realty Corp. REIT | 42,375 | 1,512 |
| New York Community | | |
78
Mid-Cap Value Index Fund
| | | Market |
| | | Value• |
| | Shares | ($000) |
| Bancorp, Inc. | 87,812 | 1,495 |
| MGIC Investment Corp. | 26,013 | 1,479 |
| ^Allied Capital Corp. | 47,691 | 1,477 |
| Ventas, Inc. REIT | 40,659 | 1,474 |
| Old Republic | | |
| International Corp. | 68,782 | 1,462 |
* | Markel Corp. | 2,976 | 1,442 |
| PartnerRe Ltd. | 17,886 | 1,386 |
| Radian Group, Inc. | 24,915 | 1,345 |
| Federal Realty Investment | | |
| Trust REIT | 17,326 | 1,339 |
| Popular, Inc. | 82,980 | 1,333 |
| RenaissanceRe Holdings Ltd. | 21,476 | 1,331 |
| First American Corp. | 25,700 | 1,272 |
| Associated Banc-Corp. | 38,197 | 1,249 |
| Liberty Property Trust REIT | 28,335 | 1,245 |
| The PMI Group Inc. | 27,223 | 1,216 |
| Hospitality Properties Trust | | |
| REIT | 29,170 | 1,210 |
| Colonial BancGroup, Inc. | 47,488 | 1,186 |
| Camden Property Trust REIT | 17,706 | 1,186 |
| HCC Insurance Holdings, Inc. | 34,846 | 1,164 |
| UDR, Inc. REIT | 42,208 | 1,110 |
| Nationwide Financial | | |
| Services, Inc. | 17,039 | 1,077 |
* | E*TRADE Financial Corp. | 47,081 | 1,040 |
| TCF Financial Corp. | 36,789 | 1,023 |
* | Arch Capital Group Ltd. | 13,965 | 1,013 |
| Protective Life Corp. | 20,829 | 996 |
| Weingarten Realty Investors | | |
| REIT | 24,141 | 992 |
* | AmeriCredit Corp. | 36,797 | 977 |
| City National Corp. | 12,650 | 963 |
| CapitalSource Inc. REIT | 36,397 | 895 |
| Erie Indemnity Co. Class A | 16,300 | 881 |
| Commerce Bancshares, Inc. | 18,642 | 844 |
| American Financial | | |
| Group, Inc. | 22,431 | 766 |
| Unitrin, Inc. | 14,721 | 724 |
| Astoria Financial Corp. | 27,737 | 695 |
| Transatlantic Holdings, Inc. | 8,270 | 588 |
| Federated Investors, Inc. | 14,811 | 568 |
| Mercury General Corp. | 8,603 | 474 |
| Forest City Enterprise | | |
| Class A | 6,710 | 413 |
| BOK Financial Corp. | 7,362 | 393 |
| Student Loan Corp. | 1,265 | 258 |
| | | 138,261 |
Health Care (4.9%) | | |
79
Mid-Cap Value Index Fund
| | | Market |
| | | Value• |
| | Shares | ($000) |
* | Barr Pharmaceuticals Inc. | 31,714 | 1,593 |
* | King Pharmaceuticals, Inc. | 76,600 | 1,567 |
* | Triad Hospitals, Inc. | 27,688 | 1,489 |
| AmerisourceBergen Corp. | 29,686 | 1,469 |
| Mylan Laboratories, Inc. | 76,802 | 1,397 |
| Omnicare, Inc. | 38,103 | 1,374 |
* | Community Health | | |
| Systems, Inc. | 29,478 | 1,192 |
| Hillenbrand Industries, Inc. | 18,318 | 1,191 |
| Bausch & Lomb, Inc. | 17,042 | 1,183 |
* | Invitrogen Corp. | 15,075 | 1,112 |
* | Charles River | | |
| Laboratories, Inc. | 21,003 | 1,084 |
* | Watson Pharmaceuticals, Inc. | 30,505 | 992 |
| Quest Diagnostics, Inc. | 18,185 | 939 |
| Applera Corp.–Applied | | |
| Biosystems Group | 28,963 | 885 |
| Health Management | | |
| Associates Class A | 76,172 | 865 |
| Beckman Coulter, Inc. | 12,562 | 813 |
* | Hospira, Inc. | 17,090 | 667 |
| | | 19,812 |
Industrials (9.2%) | | |
| Parker Hannifin Corp. | 36,303 | 3,554 |
| Rockwell Automation, Inc. | 49,319 | 3,425 |
| Dover Corp. | 63,976 | 3,272 |
| Cooper Industries, Inc. | | |
| Class A | 57,184 | 3,265 |
| R.R. Donnelley & Sons Co. | 67,939 | 2,956 |
| Manpower Inc. | 26,599 | 2,453 |
| Goodrich Corp. | 37,323 | 2,223 |
| W.W. Grainger, Inc. | 22,392 | 2,084 |
| Avery Dennison Corp. | 30,923 | 2,056 |
| Cintas Corp. | 45,041 | 1,776 |
| SPX Corp. | 17,983 | 1,579 |
| Oshkosh Truck Corp. | 23,198 | 1,460 |
* | UAL Corp. | 34,889 | 1,416 |
* | Allied Waste Industries, Inc. | 104,916 | 1,412 |
| Pentair, Inc. | 29,738 | 1,147 |
| Republic Services, Inc. | | |
| Class A | 30,345 | 930 |
| Pall Corp. | 19,180 | 882 |
* | US Airways Group Inc. | 25,884 | 784 |
* | Owens Corning Inc. | 16,009 | 538 |
| | | 37,212 |
Information Technology (6.9%) | | |
| Seagate Technology | 172,581 | 3,757 |
* | Computer Sciences Corp. | 53,810 | 3,183 |
| Microchip Technology, Inc. | 68,085 | 2,522 |
80
Mid-Cap Value Index Fund
| | | Market |
| | | Value• |
| | Shares | ($000) |
| Fidelity National Information | | |
| Services, Inc. | 38,638 | 2,097 |
* | Flextronics International Ltd. | 191,315 | 2,066 |
* | LSI Corp. | 243,418 | 1,828 |
* | Arrow Electronics, Inc. | 38,513 | 1,480 |
* | Tellabs, Inc. | 130,900 | 1,408 |
| Intersil Corp. | 43,266 | 1,361 |
* | Western Digital Corp. | 69,947 | 1,353 |
* | Cadence Design Systems, Inc. | 57,309 | 1,259 |
* | Solectron Corp. | 284,194 | 1,046 |
* | Ingram Micro, Inc. Class A | 47,866 | 1,039 |
* | Compuware Corp. | 66,288 | 786 |
| Molex, Inc. Class A | 25,192 | 669 |
| Jabil Circuit, Inc. | 29,958 | 661 |
* | Avnet, Inc. | 16,332 | 647 |
* | Lexmark International, Inc. | 10,769 | 531 |
| AVX Corp. | 16,255 | 272 |
| | | 27,965 |
Materials (6.4%) | | |
| United States Steel Corp. | 37,333 | 4,060 |
| Lyondell Chemical Co. | 70,600 | 2,621 |
| Vulcan Materials Co. | 19,353 | 2,217 |
| Temple-Inland Inc. | 32,949 | 2,027 |
| MeadWestvaco Corp. | 56,708 | 2,003 |
* | Domtar Corp. | 163,613 | 1,826 |
| Celanese Corp. Series A | 44,405 | 1,722 |
| Eastman Chemical Co. | 26,197 | 1,685 |
| International Flavors & | | |
| Fragrances, Inc. | 25,319 | 1,320 |
| Sonoco Products Co. | 29,694 | 1,271 |
| Sigma-Aldrich Corp. | 26,901 | 1,148 |
| Ashland, Inc. | 17,690 | 1,131 |
| Bemis Co., Inc. | 32,852 | 1,090 |
* | Smurfit-Stone Container Corp. | 79,815 | 1,062 |
| Steel Dynamics, Inc. | 9,942 | 417 |
| Huntsman Corp. | 15,683 | 381 |
| | | 25,981 |
Telecommunication Services (2.6%) | |
| Embarq Corp. | 46,843 | 2,968 |
| Windstream Corp. | 150,220 | 2,217 |
| CenturyTel, Inc. | 34,171 | 1,676 |
| Citizens Communications Co. | 106,150 | 1,621 |
| Telephone & | | |
| Data Systems, Inc. | 16,118 | 1,009 |
| Telephone & | | |
| Data Systems, Inc.– | | |
| Special Common Shares | 16,297 | 938 |
| | | 10,429 |
81
Mid-Cap Value Index Fund
| | | Market |
| | | Value• |
| | Shares | ($000) |
Utilities (7.9%) | | |
| DTE Energy Co. | 55,737 | 2,688 |
| Xcel Energy, Inc. | 128,472 | 2,630 |
| KeySpan Corp. | 55,022 | 2,310 |
| NiSource, Inc. | 86,222 | 1,786 |
| Pepco Holdings, Inc. | 60,040 | 1,693 |
| ONEOK, Inc. | 32,855 | 1,656 |
| CenterPoint Energy Inc. | 93,640 | 1,629 |
| Wisconsin Energy Corp. | 36,657 | 1,621 |
| MDU Resources Group, Inc. | 51,089 | 1,433 |
| Alliant Energy Corp. | 36,390 | 1,414 |
| Northeast Utilities | 48,396 | 1,373 |
| SCANA Corp. | 34,680 | 1,328 |
* | Reliant Energy, Inc. | 48,600 | 1,310 |
| Energy East Corp. | 49,495 | 1,291 |
| Pinnacle West Capital Corp. | 31,324 | 1,248 |
| Integrys Energy Group, Inc. | 23,429 | 1,189 |
| TECO Energy, Inc. | 65,556 | 1,126 |
| NSTAR | 33,470 | 1,086 |
| DPL Inc. | 35,442 | 1,004 |
* | Dynegy, Inc. | 100,539 | 949 |
| Equitable Resources, Inc. | 18,104 | 897 |
| | | 31,661 |
Total Common Stocks | | |
(Cost $393,004) | | 402,601 |
Temporary Cash Investments (0.5%)1 | |
Money Market Fund (0.5%) | | |
2 | Vanguard Market Liquidity | | |
| Fund, 5.281%—Note F 1,913,000 | 1,913 |
| | | |
| | | |
| | Face | |
| | Amount | |
| | ($000) | |
U.S. Agency Obligation (0.0%) | | |
3 | Federal National | | |
| Mortgage Assn. | | |
4 | 5.211%, 7/3/07 | 100 | 100 |
Total Temporary Cash Investments | |
(Cost $2,013) | | 2,013 |
Total Investments (100.2%) | | |
(Cost $395,017) | | 404,614 |
Other Assets and Liabilities (–0.2%) | |
Other Assets—Note B | | 2,033 |
Liabilities—Note F | | (2,796) |
| | | (763) |
Net Assets (100%) | | 403,851 |
| | | | |
82
At June 30, 2007, net assets consisted of:5 | |
| Amount |
| ($000) |
Paid-in Capital | 392,452 |
Undistributed Net Investment Income | 3,163 |
Accumulated Net Realized Losses | (1,354) |
Unrealized Appreciation (Depreciation) | |
Investment Securities | 9,597 |
Futures Contracts | (7) |
Net Assets | 403,851 |
| |
Investor Shares—Net Assets | |
Applicable to 8,337,930 outstanding | |
$.001 par value shares of beneficial | |
interest (unlimited authorization) | 200,666 |
Net Asset Value Per Share— | |
Investor Shares | $24.07 |
| |
ETF Shares—Net Assets | |
Applicable to 3,326,347 outstanding | |
$.001 par value shares of beneficial | |
interest (unlimited authorization) | 203,185 |
Net Asset Value Per Share— | |
ETF Shares | $61.08 |
• See Note A in Notes to Financial Statements.
* Non-income-producing security.
^ Part of security position is on loan to broker-dealers. See Note F in Notes to Financial Statements.
1 The fund invests a portion of its cash reserves in equity markets through the use of index futures contracts. After giving effect to futures investments, the fund’s effective common stock and temporary cash investment positions represent 99.9% and 0.3%, respectively, of net assets. See Note D in Notes to Financial Statements.
2 Affiliated money market fund available only to Vanguard funds and certain trusts and accounts managed by Vanguard. Rate shown is the 7-day yield.
3 The issuer operates under a congressional charter; its securities are neither issued nor guaranteed by the U.S. government. If needed, access to additional funding from the U.S. Treasury (beyond the issuer’s line of credit) would require congressional action.
4 Securities with a value of $100,000 have been segregated as initial margin for open futures contracts.
5 See Note D in Notes to Financial Statements for the tax-basis components of net assets. REIT—Real Estate Investment Trust.
83
Mid-Cap Value Index Fund
Statement of Operations
| Six Months Ended |
| June 30, 2007 |
| ($000) |
Investment Income | |
Income | |
Dividends | 3,361 |
Interest1 | 50 |
Security Lending | 25 |
Total Income | 3,436 |
Expenses | |
The Vanguard Group—Note B | |
Investment Advisory Services | 22 |
Management and Administrative | |
Investor Shares | 94 |
ETF Shares | 26 |
Marketing and Distribution | |
Investor Shares | 12 |
ETF Shares | 11 |
Custodian Fees | 79 |
Shareholders’ Reports | |
Investor Shares | 4 |
ETF Shares | 1 |
Total Expenses | 249 |
Expenses Paid Indirectly—Note C | (1) |
Net Expenses | 248 |
Net Investment Income | 3,188 |
Realized Net Gain (Loss) | |
Investment Securities | 5,879 |
Futures Contracts | (102) |
Realized Net Gain (Loss) | 5,777 |
Change in Unrealized Appreciation (Depreciation) | |
Investment Securities Sold | 5,191 |
Futures Contracts | (7) |
Change in Unrealized Appreciation (Depreciation) | 5,184 |
Net Increase (Decrease) in Net Assets Resulting from Operations | 14,149 |
1 Interest income from an affiliated company of the fund was $49,000.
84
Mid-Cap Value Index Fund
Statement of Changes in Net Assets
| | | August 17, |
| Six Months Ended | | 20061 to |
| June 30, | | December 31, |
| 2007 | | 2006 |
| ($000) | | ($000) |
Increase (Decrease) in Net Assets | | | |
Operations | | | |
Net Investment Income | 3,188 | | 622 |
Realized Net Gain (Loss) | 5,777 | | 1,844 |
Change in Unrealized Appreciation (Depreciation) | 5,184 | | 4,406 |
Net Increase (Decrease) in Net Assets Resulting from Operations | 14,149 | | 6,872 |
Distributions | | | |
Net Investment Income | | | |
Investor Shares | (21) | | (347) |
ETF Shares | (20) | | (259) |
Realized Capital Gain | | | |
Investor Shares | — | | — |
ETF Shares | — | | — |
Total Distributions | (41) | | (606) |
Capital Share Transactions—Note G | | | |
Investor Shares | 127,614 | | 63,244 |
ETF Shares | 150,662 | | 41,957 |
Net Increase (Decrease) from Capital Share Transactions | 278,276 | | 105,201 |
Total Increase (Decrease) | 292,384 | | 111,467 |
Net Assets | | | |
Beginning of Period | 111,467 | | — |
End of Period2 | 403,851 | | 111,467 |
1 Inception.
2 Net Assets—End of Period includes undistributed (overdistributed) net investment income of $3,163,000 and $16,000.
85
Mid-Cap Value Index Fund
Financial Highlights
Investor Shares | | |
| Six Months | Aug. 24, |
| Ended | 20061 to |
| June 30, | Dec. 31, |
For a Share Outstanding Throughout Each Period | 2007 | 2006 |
Net Asset Value, Beginning of Period | $22.34 | $20.00 |
Investment Operations | | |
Net Investment Income | .184 | .14 |
Net Realized and Unrealized Gain (Loss) on Investments | 1.550 | 2.34 |
Total from Investment Operations | 1.734 | 2.48 |
Distributions | | |
Dividends from Net Investment Income | (.004) | (.14) |
Distributions from Realized Capital Gains | — | — |
Total Distributions | (.004) | (.14) |
Net Asset Value, End of Period | $24.07 | $22.34 |
| | |
Total Return2 | 7.76% | 12.40% |
| | |
Ratios/Supplemental Data | | |
Net Assets, End of Period (Millions) | $201 | $65 |
Ratio of Total Expenses to Average Net Assets | 0.25%* | 0.26%* |
Ratio of Net Investment Income to Average Net Assets | 2.40%* | 2.50%* |
Portfolio Turnover Rate3 | 45%* | 16% |
1 Inception.
2 Total returns do not include the account service fee that may be applicable to certain accounts with balances below $10,000.
3 Excludes the value of portfolio securities received or delivered as a result of in-kind purchases or redemptions of the fund’s capital shares, including ETF Creation Units.
* Annualized.
86
Mid-Cap Value Index Fund
ETF Shares | | |
| Six Months | Aug. 17, |
| Ended | 20061 to |
| June 30, | Dec. 31, |
For a Share Outstanding Throughout Each Period | 2007 | 2006 |
Net Asset Value, Beginning of Period | $56.67 | $51.00 |
Investment Operations | | |
Net Investment Income | .49 | .373 |
Net Realized and Unrealized Gain (Loss) on Investments | 3.93 | 5.661 |
Total from Investment Operations | 4.42 | 6.034 |
Distributions | | |
Dividends from Net Investment Income | (.01) | (.364) |
Distributions from Realized Capital Gains | — | — |
Total Distributions | (.01) | (.364) |
Net Asset Value, End of Period | $61.08 | $56.67 |
| | |
Total Return | 7.80% | 11.84% |
| | |
Ratios/Supplemental Data | | |
Net Assets, End of Period (Millions) | $203 | $46 |
Ratio of Total Expenses to Average Net Assets | 0.13%* | 0.13%* |
Ratio of Net Investment Income to Average Net Assets | 2.52%* | 2.63%* |
Portfolio Turnover Rate2 | 45%* | 16% |
1 Inception.
2 Excludes the value of portfolio securities received or delivered as a result of in-kind purchases or redemptions of the fund’s capital shares, including ETF Creation Units.
* Annualized.
See accompanying Notes, which are an integral part of the Financial Statements.
87
Mid-Cap Value Index Fund
Notes to Financial Statements
Vanguard Mid-Cap Value Index Fund is registered under the Investment Company Act of 1940 as an open-end investment company, or mutual fund. The fund offers two classes of shares: Investor Shares and ETF Shares. Investor Shares are available to any investor who meets the fund’s minimum purchase requirements. ETF Shares are listed for trading on the American Stock Exchange; they can be purchased and sold through a broker.
A. The following significant accounting policies conform to generally accepted accounting principles for U.S. mutual funds. The fund consistently follows such policies in preparing its financial statements.
1. Security Valuation: Securities are valued as of the close of trading on the New York Stock Exchange (generally 4 p.m., Eastern time) on the valuation date. Equity securities are valued at the latest quoted sales prices or official closing prices taken from the primary market in which each security trades; such securities not traded on the valuation date are valued at the mean of the latest quoted bid and asked prices. Securities for which market quotations are not readily available, or whose values have been affected by events occurring before the fund’s pricing time but after the close of the securities’ primary markets, are valued by methods deemed by the board of trustees to represent fair value. Investments in Vanguard Market Liquidity Fund are valued at that fund’s net asset value. Temporary cash investments acquired over 60 days to maturity are valued using the latest bid prices or using valuations based on a matrix system (which considers such factors as security prices, yields, maturities, and ratings), both as furnished by independent pricing services. Other temporary cash investments are valued at amortized cost, which approximates market value.
2. Futures Contracts: The fund uses index futures contracts to a limited extent, with the objective of maintaining full exposure to the stock market while maintaining liquidity. The fund may purchase or sell futures contracts to achieve a desired level of investment, whether to accommodate portfolio turnover or cash flows from capital share transactions. The primary risks associated with the use of futures contracts are imperfect correlation between changes in market values of stocks held by the fund and the prices of futures contracts, and the possibility of an illiquid market.
Futures contracts are valued at their quoted daily settlement prices. The aggregate principal amounts of the contracts are not recorded in the Statement of Net Assets. Fluctuations in the value of the contracts are recorded in the Statement of Net Assets as an asset (liability) and in the Statement of Operations as unrealized appreciation (depreciation) until the contracts are closed, when they are recorded as realized futures gains (losses).
3. Federal Income Taxes: The fund intends to continue to qualify as a regulated investment company and distribute all of its taxable income. Accordingly, no provision for federal income taxes is required in the financial statements.
4. Distributions: Distributions to shareholders are recorded on the ex-dividend date.
5. Security Lending: The fund may lend its securities to qualified institutional borrowers to earn additional income. Security loans are required to be secured at all times by collateral at least equal to the market value of securities loaned. The fund invests cash collateral received in Vanguard Market Liquidity Fund, and records a liability for the return of the collateral, during the period the securities are on loan. Security lending income represents the income earned on investing cash collateral, less expenses associated with the loan.
6. Other: Dividend income is recorded on the ex-dividend date. Interest income includes income distributions received from Vanguard Market Liquidity Fund and is accrued daily. Security transactions are accounted for on the date securities are bought or sold. Costs used to determine realized gains (losses) on the sale of investment securities are those of the specific securities sold.
88
Mid-Cap Value Index Fund
Each class of shares has equal rights as to assets and earnings, except that each class separately bears certain class-specific expenses related to maintenance of shareholder accounts (included in Management and Administrative expenses) and shareholder reporting. Marketing and distribution expenses are allocated to each class of shares based on a method approved by the board of trustees. Income, other non-class-specific expenses, and gains and losses on investments are allocated to each class of shares based on its relative net assets.
B. The Vanguard Group furnishes at cost investment advisory, corporate management, administrative, marketing, and distribution services. The costs of such services are allocated to the fund under methods approved by the board of trustees. The fund has committed to provide up to 0.40% of its net assets in capital contributions to Vanguard. At June 30, 2007, the fund had contributed capital of $34,000 to Vanguard (included in Other Assets), representing 0.01% of the fund’s net assets and 0.03% of Vanguard’s capitalization. The fund’s trustees and officers are also directors and officers of Vanguard.
C. The fund’s custodian bank has agreed to reduce its fees when the fund maintains cash on deposit in the non-interest-bearing custody account. For the six months ended June 30, 2007, custodian fee offset arrangements reduced the fund’s expenses by $1,000.
D. Distributions are determined on a tax basis and may differ from net investment income and realized capital gains for financial-reporting purposes. Differences may be permanent or temporary. Permanent differences are reclassified among capital accounts in the financial statements to reflect their tax character. Temporary differences arise when certain items of income, expense, gain, or loss are recognized in different periods for financial statement and tax purposes; these differences will reverse at some time in the future. Differences in classification may also result from the treatment of short-term gains as ordinary income for tax purposes.
During the six months ended June 30, 2007, the fund realized $7,079,000 of net capital gains resulting from in-kind redemptions—in which shareholders exchanged fund shares for securities held by the fund rather than for cash. Because such gains are not taxable to the fund, and are not distributed to shareholders, they have been reclassified from accumulated net realized losses to paid-in capital.
The fund’s tax-basis capital gains and losses are determined only at the end of each fiscal year. For tax purposes, at December 31, 2006, the fund had available realized losses of $52,000 to offset future net capital gains of $11,000 through December 31, 2014, and $41,000 through December 31, 2015. The fund will use these capital losses to offset net taxable capital gains, if any, realized during the year ending December 31, 2007; should the fund realize net capital losses for the year, the losses will be added to the loss carryforward balances above.
At June 30, 2007, the cost of investment securities for tax purposes was $395,017,000. Net unrealized appreciation of investment securities for tax purposes was $9,597,000, consisting of unrealized gains of $22,436,000 on securities that had risen in value since their purchase and $12,839,000 in unrealized losses on securities that had fallen in value since their purchase.
Mid-Cap Value Index Fund
At June 30, 2007, the aggregate settlement value of open futures contracts expiring in September 2007 and the related unrealized appreciation (depreciation) were:
89
| | | ($000) |
| | Aggregate | Unrealized |
| Number of | Settlement | Appreciation |
Futures Contracts | Long Contracts | Value | (Depreciation) |
E-Mini S&P MidCap 400 Index | 10 | 904 | (7) |
Unrealized appreciation (depreciation) on open futures contracts is required to be treated as realized gain (loss) for tax purposes.
E. During the six months ended June 30, 2007, the fund purchased $381,070,000 of investment securities and sold $100,868,000 of investment securities other than temporary cash investments.
F. The market value of securities on loan to broker-dealers at June 30, 2007, was $1,856,000, for which the fund received cash collateral of $1,913,000.
G. Capital share transactions for each class of shares were:
| Six Months Ended | | Inception1 to |
| June 30, 2007 | | December 31, 2006 |
| Amount | Shares | | Amount | Shares |
| ($000) | (000) | | ($000) | (000) |
Investor Shares | | | | | |
Issued | 151,119 | 6,405 | | 65,602 | 3,032 |
Issued in Lieu of Cash Distributions | 23 | 1 | | 315 | 14 |
Redeemed | (23,528) | (992) | | (2,673) | (122) |
Net Increase (Decrease)—Investor Shares | 127,614 | 5,414 | | 63,244 | 2,924 |
ETF Shares | | | | | |
Issued | 194,344 | 3,212 | | 64,453 | 1,214 |
Issued in Lieu of Cash Distributions | — | — | | — | — |
Redeemed | (43,682) | (700) | | (22,496) | (400) |
Net Increase (Decrease)—ETF Shares | 150,662 | 2,512 | | 41,957 | 814 |
H. In June 2006, the Financial Accounting Standards Board issued Interpretation No. 48 (“FIN 48”), “Accounting for Uncertainty in Income Taxes.” FIN 48 establishes the minimum threshold for recognizing, and a system for measuring, the benefits of tax-return positions in financial statements, effective for the fund’s current fiscal year. Management has analyzed the fund’s tax positions taken on its federal income tax return for open tax year ended December 31, 2006, for purposes of implementing FIN 48, and has concluded that no provision for income tax is required in the fund’s financial statements.
1 Inception was August 24, 2006, for Investor Shares and August 17, 2006, for ETF Shares.
90
About Your Fund’s Expenses
As a shareholder of the fund, you incur ongoing costs, which include costs for portfolio management, administrative services, and shareholder reports (like this one), among others. Operating expenses, which are deducted from a fund’s gross income, directly reduce the investment return of the fund.
A fund’s expenses are expressed as a percentage of its average net assets. This figure is known as the expense ratio. The following examples, for the funds and share classes of funds that have at least six months of operating history, are intended to help you understand the ongoing costs (in dollars) of investing in your fund and to compare these costs with those of other mutual funds.
The examples are based on an investment of $1,000 made at the beginning of the period shown and held for the entire period.
The table on page 73 illustrate your fund’s costs in two ways:
• Based on actual fund return. This section helps you to estimate the actual expenses that you paid over the period. The “Ending Account Value” shown is derived from the fund’s actual return, and the third column shows the dollar amount that would have been paid by an investor who started with $1,000 in the fund. You may use the information here, together with the amount you invested, to estimate the expenses that you paid over the period.
To do so, simply divide your account value by $1,000 (for example, an $8,600 account value divided by $1,000 = 8.6), then multiply the result by the number given for your fund under the heading “Expenses Paid During Period.”
• Based on hypothetical 5% yearly return. This section is intended to help you compare your fund’s costs with those of other mutual funds. It assumes that the fund had a yearly return of 5% before expenses, but that the expense ratio is unchanged. In this case—because the return used is not the fund’s actual return—the results do not apply to your investment. The example is useful in making comparisons because the Securities and Exchange Commission requires all mutual funds to calculate expenses based on a 5% return. You can assess your fund’s costs by comparing this hypothetical example with the hypothetical examples that appear in shareholder reports of other funds.
Note that the expenses shown in the table on the next page are meant to highlight and help you compare ongoing costs only and do not reflect transaction costs incurred by the fund for buying and selling securities. Further, the expenses do not include any account service fee described in the prospectus. If such a fee were applied to your account, your costs would be higher. Your fund does not charge transaction fees, such as purchase or redemption fees, nor does it carry a “sales load.”
The calculations assume no shares were bought or sold during the period. Your actual costs may have been higher or lower, depending on the amount of your investment and the timing of any purchases or redemptions.
You can find more information about the fund’s expenses, including annual expense ratios, in the Financial Statements section of this report. For additional information on operating expenses and other shareholder costs, please refer to your fund’s current prospectus.
91
Six Months Ended June 30, 20071 | | | |
| Beginning | Ending | Expenses |
| Account Value | Account Value | Paid During |
U.S. Stock Index Fund | 12/31/2006 | 6/30/2007 | Period2 |
Based on Actual Fund Return | | | |
Extended Market | | | |
Investor Shares | $1,000.00 | $1,096.10 | $1.25 |
Admiral Shares | 1,000.00 | 1,096.88 | 0.47 |
Signal Shares | 1,000.00 | 1,096.76 | 0.47 |
Institutional Shares | 1,000.00 | 1,097.12 | 0.31 |
ETF Shares | 1,000.00 | 1,097.03 | 0.42 |
Mid-Cap Index | | | |
Investor Shares | $1,000.00 | $1,108.46 | $1.10 |
Admiral Shares | 1,000.00 | 1,109.39 | 0.58 |
Institutional Shares | 1,000.00 | 1,109.70 | 0.37 |
ETF Shares | 1,000.00 | 1,109.38 | 0.68 |
Mid-Cap Growth Index | | | |
Investor Shares | $1,000.00 | $1,141.15 | $1.33 |
ETF Shares | 1,000.00 | 1,142.02 | 0.69 |
Mid-Cap Value Index | | | |
Investor Shares | $1,000.00 | $1,077.62 | $1.29 |
ETF Shares | 1,000.00 | 1,078.00 | 0.67 |
Based on Hypothetical 5% Yearly Return | | | |
Extended Market | | | |
Investor Shares | $1,000.00 | $1,023.60 | $1.20 |
Admiral Shares | 1,000.00 | 1,024.35 | 0.45 |
Signal Shares | 1,000.00 | 1,024.35 | 0.45 |
Institutional Shares | 1,000.00 | 1,024.50 | 0.30 |
ETF Shares | 1,000.00 | 1,024.40 | 0.40 |
Mid-Cap Index | | | |
Investor Shares | $1,000.00 | $1,023.75 | $1.05 |
Admiral Shares | 1,000.00 | 1,024.25 | 0.55 |
Institutional Shares | 1,000.00 | 1,024.45 | 0.35 |
ETF Shares | 1,000.00 | 1,024.15 | 0.65 |
Mid-Cap Growth Index | | | |
Investor Shares | $1,000.00 | $1,023.55 | $1.25 |
ETF Shares | 1,000.00 | 1,024.15 | 0.65 |
Mid-Cap Value Index | | | |
Investor Shares | $1,000.00 | $1,023.55 | $1.25 |
ETF Shares | 1,000.00 | 1,024.15 | 0.65 |
1 This table does not include data for the share class of funds with fewer than six months of history.
2 The calculations are based on expenses incurred in the most recent six-month period. The funds’ annualized six-month expense ratios for that period are: 0.24% for the Extended Market Index Fund Investor Shares, 0.09% for Admiral Shares, 0.09% for Signal Shares, 0.06% for Institutional Shares, and 0.08% for ETF Shares; 0.21% for the Mid-Cap Index Fund Investor Shares, 0.11% for Admiral Shares, 0.07% for Institutional Shares, and 0.13% for ETF Shares; 0.25% for the Mid-Cap Growth Index Fund Investor Shares, and 0.13% for ETF Shares; 0.25% for the Mid-Cap Value Index Fund Investor Shares, and 0.13% for ETF Shares. The dollar amounts shown as “Expenses Paid” are equal to the annualized expense ratio multiplied by the average account value over the period, multiplied by the number of days in the most recent six-month period, then divided by the number of days in the most recent 12-month period.
92
Trustees Approve Advisory Arrangement
The board of trustees of Vanguard Extended Market Index Fund, Mid-Cap Index Fund, Mid-Cap Growth Index Fund, and Mid-Cap Value Index Fund has renewed the funds’ investment advisory arrangement with The Vanguard Group, Inc. Vanguard—through its Quantitative Equity Group—serves as the investment advisor for the funds. The board determined that continuing the funds’ internalized management structure was in the best interests of the funds and their shareholders.
The board based its decision upon an evaluation of the advisor’s investment staff, portfolio management process, and performance. The trustees considered the factors discussed below, among others. However, no single factor determined whether the board approved the arrangement. Rather, it was the totality of the circumstances that drove the board’s decision.
Nature, extent, and quality of services
The board considered the quality of the funds’ investment management over both short- and long-term periods, and took into account the organizational depth and stability of the advisor. Vanguard has been managing investments for more than two decades. George U. Sauter, Vanguard managing director and chief investment officer, has been in the investment management business since 1985. Mr. Sauter has led the Quantitative Equity Group since 1987. The Quantitative Equity Group adheres to a sound, disciplined investment management process; the team has considerable experience, stability, and depth.
The board concluded that Vanguard’s experience, stability, depth, and performance, among other factors, warranted continuation of the advisory arrangement.
Investment performance
The board considered the short- and long-term performance of the funds, including any periods of outperformance or underperformance of their target benchmarks and peer groups. The board concluded that the funds have performed in line with expectations, and that their results have been consistent with their investment strategies. Information about the funds’ most recent performance can be found on the Performance Summary pages of this report.
Cost
The board concluded that the funds’ expense ratios were far below the average expense ratios charged by funds in their respective peer groups. The board noted that the funds’ advisory expense ratios were also well below their peer-group averages. Information about the funds’ expense ratios appears in the About Your Fund’s Expenses section of this report as well as in the Financial Statements sections.
The board does not conduct a profitability analysis of Vanguard because of Vanguard’s unique “at-cost” structure. Unlike most other mutual fund management companies, Vanguard is owned by the funds it oversees, and produces “profits” only in the form of reduced expenses for fund shareholders.
The benefit of economies of scale
The board concluded that the funds’ low-cost arrangement with Vanguard ensures that the funds will realize economies of scale as they grow, with the cost to shareholders declining as fund assets increase.
The board will consider whether to renew the advisory arrangement again after a one-year period.
93
Glossary
Beta. A measure of the magnitude of a fund’s past share-price fluctuations in relation to the ups and downs of a given market index. The index is assigned a beta of 1.00. Compared with a given index, a fund with a beta of 1.20 typically would have seen its share price rise or fall by 12% when the index rose or fell by 10%. A fund’s beta should be reviewed in conjunction with its R-squared (see definition below). The lower the R-squared, the less correlation there is between the fund and the index, and the less reliable beta is as an indicator of volatility.
Earnings Growth Rate. The average annual rate of growth in earnings over the past five years for the stocks now in a fund.
Expense Ratio. The percentage of a fund’s average net assets used to pay its annual administrative and advisory expenses. These expenses directly reduce returns to investors.
Foreign Holdings. The percentage of a fund represented by stocks or depositary receipts of companies based outside the United States.
Inception Date. The date on which the assets of a fund (or one of its share classes) are first invested in accordance with the fund’s investment objective. For funds with a subscription period, the inception date is the day after that period ends. Investment performance is measured from the inception date.
Median Market Cap. An indicator of the size of companies in which a fund invests; the midpoint of market capitalization (market price x shares outstanding) of a fund’s stocks, weighted by the proportion of the fund’s assets invested in each stock. Stocks representing half of the fund’s assets have market capitalizations above the median, and the rest are below it.
Price/Book Ratio. The share price of a stock divided by its net worth, or book value, per share. For a fund, the weighted average price/book ratio of the stocks it holds.
Price/Earnings Ratio. The ratio of a stock’s current price to its per-share earnings over the past year. For a fund, the weighted average P/E of the stocks it holds. P/E is an indicator of market expectations about corporate prospects; the higher the P/E, the greater the expectations for a company’s future growth.
R-Squared. A measure of how much of a fund’s past returns can be explained by the returns from the market in general, as measured by a given index. If a fund’s total returns were precisely synchronized with an index’s returns, its R-squared would be 1.00. If the fund’s returns bore no relationship to the index’s returns, its R-squared would be 0.
Return on Equity. The annual average rate of return generated by a company during the past five years for each dollar of shareholder’s equity (net income divided by shareholder’s equity). For a fund, the weighted average return on equity for the companies whose stocks it holds.
Short-Term Reserves. The percentage of a fund invested in highly liquid, short-term securities that can be readily converted to cash.
Turnover Rate. An indication of the fund’s trading activity. Funds with high turnover rates incur higher transaction costs and may be more likely to distribute capital gains (which may be taxable to investors). The turnover rate excludes in-kind transactions, which have minimal impact on costs.
Yield. A snapshot of a fund’s income from interest and dividends. The yield, expressed as a percentage of the fund’s net asset value, is based on income earned over the past 30 days and is annualized, or projected forward for the coming year. The index yield is based on the current annualized rate of income provided by securities in the index.
94
The People Who Govern Your Fund
The trustees of your mutual fund are there to see that the fund is operated and managed in your best interests since, as a shareholder, you are a part owner of the fund. Your fund’s trustees also serve on the board of directors of The Vanguard Group, Inc., which is owned by the Vanguard funds and provides services to them on an at-cost basis.
A majority of Vanguard’s board members are independent, meaning that they have no affiliation with Vanguard or the funds they oversee, apart from the sizable personal investments they have made as private individuals.
Our independent board members bring distinguished backgrounds in business, academia, and public service to their task of working with Vanguard officers to establish the policies and oversee the activities of the funds. Among board members’ responsibilities are selecting investment advisors for the funds; monitoring fund operations, performance, and costs; reviewing contracts; nominating and selecting new trustees/directors; and electing Vanguard officers.
Each trustee serves a fund until its termination; or until the trustee’s retirement, resignation, or death; or otherwise as specified in the fund’s organizational documents. Any trustee may be removed at a shareholders’ meeting by a vote representing two-thirds of the net asset value of all shares of the fund together with shares of other Vanguard funds organized within the same trust. The table on these two pages shows information for each trustee and executive officer of the fund. The mailing address of the trustees and officers is P.O. Box 876, Valley Forge, PA 19482.
Chairman of the Board, Chief Executive Officer, and Trustee |
| |
John J. Brennan1 | |
Born 1954 | Principal Occupation(s) During the Past Five Years: Chairman of the Board, Chief Executive |
Trustee since May 1987; | Officer, and Director/Trustee of The Vanguard Group, Inc., and of each of the investment |
Chairman of the Board and | companies served by The Vanguard Group. |
Chief Executive Officer | |
147 Vanguard Funds Overseen | |
| |
Independent Trustees | |
| |
Charles D. Ellis | |
Born 1937 | Principal Occupation(s) During the Past Five Years: Applecore Partners (pro bono ventures |
Trustee since January 2001 | in education); Senior Advisor to Greenwich Associates (international business strategy |
147 Vanguard Funds Overseen | consulting); Successor Trustee of Yale University; Overseer of the Stern School of Business |
| at New York University; Trustee of the Whitehead Institute for Biomedical Research. |
| |
Rajiv L. Gupta | |
Born 1945 | Principal Occupation(s) During the Past Five Years: Chairman and Chief Executive Officer |
Trustee since December 20012 | of Rohm and Haas Co. (chemicals); Board Member of the American Chemistry Council; |
147 Vanguard Funds Overseen | Director of Tyco International, Ltd. (diversified manufacturing and services) since 2005; |
| Trustee of Drexel University and of the Chemical Heritage Foundation. |
| |
Amy Gutmann | |
Born 1949 | Principal Occupation(s) During the Past Five Years: President of the University of |
Trustee since June 2006 | Pennsylvania since 2004; Professor in the School of Arts and Sciences, Annenberg School |
147 Vanguard Funds Overseen | for Communication, and Graduate School of Education of the University of Pennsylvania |
| since 2004; Provost (2001–2004) and Laurance S. Rockefeller Professor of Politics and |
| the University Center for Human Values (1990–2004), Princeton University; Director of |
| Carnegie Corporation of New York since 2005 and of Schuylkill River Development |
| Corporation and Greater Philadelphia Chamber of Commerce since 2004. |
| |
JoAnn Heffernan Heisen | |
Born 1950 | Principal Occupation(s) During the Past Five Years: Corporate Vice President and |
Trustee since July 1998 | Chief Global Diversity Officer since 2006, Vice President and Chief Information |
147 Vanguard Funds Overseen | Officer (1997–2005), and Member of the Executive Committee of Johnson & |
| Johnson (pharmaceuticals/consumer products); Director of the University Medical |
| Center at Princeton and Women’s Research and Education Institute. |
| |
André F. Perold | |
Born 1952 | Principal Occupation(s) During the Past Five Years: George Gund Professor of Finance |
Trustee since December 2004 | and Banking, Harvard Business School; Senior Associate Dean, Director of Faculty |
147 Vanguard Funds Overseen | Recruiting, and Chair of Finance Faculty, Harvard Business School; Director and Chairman |
| of UNX, Inc. (equities trading firm) since 2003; Chair of the Investment Committee of |
| HighVista Strategies LLC (private investment firm) since 2005. |
| |
Alfred M. Rankin, Jr. | |
Born 1941 | Principal Occupation(s) During the Past Five Years: Chairman, President, Chief Executive |
Trustee since January 1993 | Officer, and Director of NACCO Industries, Inc. (forklift trucks/housewares/lignite); Director |
147 Vanguard Funds Overseen | of Goodrich Corporation (industrial products/aircraft systems and services). |
| |
| |
J. Lawrence Wilson | |
Born 1936 | Principal Occupation(s) During the Past Five Years: Retired Chairman and Chief Executive |
Trustee since April 1985 | Officer of Rohm and Haas Co. (chemicals); Director of Cummins Inc. (diesel engines) and |
147 Vanguard Funds Overseen | AmerisourceBergen Corp. (pharmaceutical distribution); Trustee of Vanderbilt University |
| and of Culver Educational Foundation. |
| |
Executive Officers1 | |
| |
Heidi Stam | |
Born 1956 | Principal Occupation(s) During the Past Five Years: Managing Director of The Vanguard |
Secretary since July 2005 | Group, Inc., since 2006; General Counsel of The Vanguard Group since 2005; Secretary of |
147 Vanguard Funds Overseen | The Vanguard Group, and of each of the investment companies served by The Vanguard |
| Group, since 2005; Principal of The Vanguard Group (1997–2006). |
| |
Thomas J. Higgins | |
Born 1957 | Principal Occupation(s) During the Past Five Years: Principal of The Vanguard Group, Inc.; |
Treasurer since July 1998 | Treasurer of each of the investment companies served by The Vanguard Group. |
147 Vanguard Funds Overseen | |
Vanguard Senior Management Team | | |
| | |
R. Gregory Barton | Kathleen C. Gubanich | Michael S. Miller |
Mortimer J. Buckley | Paul A. Heller | Ralph K. Packard |
James H. Gately | F. William McNabb, III | George U. Sauter |
| | |
Founder | | |
| | |
John C. Bogle | | |
Chairman and Chief Executive Officer, 1974–1996 | |
1 Officers of the funds are “interested persons” as defined in the Investment Company Act of 1940.
2 December 2002 for Vanguard Equity Income Fund, Vanguard Growth Equity Fund, the Vanguard Municipal Bond Funds, and the Vanguard State Tax-Exempt Funds.
More information about the trustees is in the Statement of Additional Information, available from The Vanguard Group.
P.O. Box 2600
Valley Forge, PA 19482-2600
Connect with Vanguard® > www.vanguard.com
Fund Information > 800-662-7447 | Vanguard, Admiral, Signal, Connect with Vanguard, |
| Vanguard.com, and the ship logo are trademarks of |
Direct Investor Account Services > 800-662-2739 | |
| The Vanguard Group, Inc. |
Institutional Investor Services > 800-523-1036 | |
| All other marks are the exclusive property of their |
Text Telephone for People | respective owners. |
With Hearing Impairment > 800-952-3335 | |
| All comparative mutual fund data are from Lipper Inc. |
| or Morningstar, Inc., unless otherwise noted. |
| |
| You can obtain a free copy of Vanguard’s proxy voting |
This material may be used in conjunction | guidelines by visiting our website, www.vanguard.com, |
with the offering of shares of any Vanguard | and searching for “proxy voting guidelines,” or by calling |
fund only if preceded or accompanied by | Vanguard at 800-662-2739. They are also available from |
the fund’s current prospectus. | the SEC’s website, www.sec.gov. In addition, you may |
| obtain a free report on how your fund voted the proxies for |
| securities it owned during the 12 months ended June 30. |
| To get the report, visit either www.vanguard.com |
| or www.sec.gov. |
| |
The funds or securities referred to herein are not | |
sponsored, endorsed, or promoted by MSCI, and | |
MSCI bears no liability with respect to any such funds | |
or securities. For any such funds or securities, the | |
prospectus or the Statement of Additional Information | |
contains a more detailed description of the limited | You can review and copy information about your fund |
relationship MSCI has with The Vanguard Group and | at the SEC’s Public Reference Room in Washington, D.C. |
any related funds. | To find out more about this public service, call the SEC |
| at 202-551-8090. Information about your fund is also |
| available on the SEC’s website, and you can receive |
| copies of this information, for a fee, by sending a |
| request in either of two ways: via e-mail addressed to |
| publicinfo@sec.gov or via regular mail addressed to the |
| Public Reference Section, Securities and Exchange |
| Commission, Washington, DC 20549-0102. |
| |
| |
| |
| © 2007 The Vanguard Group, Inc. |
| All rights reserved. |
| Vanguard Marketing Corporation, Distributor. |
| |
| Q982 082007 |
|
|
Vanguard® U.S. Stock Index Funds |
Large-Capitalization Portfolios |
|
> Semiannual Report |
|
|
|
|
|
June 30, 2007 |
|
|

|
|
Vanguard Growth Index Fund |
|
Vanguard Value Index Fund |
|
Vanguard Large-Cap Index Fund |
|
Vanguard Total Stock Market Index Fund |
|
|
|
|
|
|
|
|
|
|
|
|
|
|
|
> | For the first half of 2007, the four Vanguard large-capitalization index |
| funds closely tracked the returns of their target indexes. |
> | Despite a brief but sharp pullback in February, stock prices rose smartly |
| during the half-year. |
> | Energy and industrial stocks were strong contributors in all four funds, |
| while financial and consumer-oriented issues fared less well. |
Contents | |
| |
Your Fund’s Total Returns | 1 |
Chairman’s Letter | 4 |
Growth Index Fund | 11 |
Value Index Fund | 29 |
Large-Cap Index Fund | 47 |
Total Stock Market Index Fund | 59 |
About Your Fund’s Expenses | 72 |
Trustees Approve Advisory Arrangement | 75 |
Glossary | 76 |

Please note: The opinions expressed in this report are just that—informed opinions. They should not be considered promises or advice. Also, please keep in mind that the information and opinions cover the period through the date on the cover of this report. Of course, the risks of investing in your fund are spelled out in the prospectus.
Your Fund’s Total Returns
Six Months Ended June 30, 2007 | | |
| Ticker | Total |
| Symbol | Returns |
Vanguard Growth Index Fund | | |
Investor Shares | VIGRX | 7.9% |
Admiral™ Shares1 | VIGAX | 8.0 |
Signal™ Shares2 | VIGSX | –1.83 |
Institutional Shares4 | VIGIX | 8.0 |
ETF Shares5 | VUG | |
Market Price | | 7.9 |
Net Asset Value | | 8.0 |
MSCI® US Prime Market Growth Index | | 8.0 |
Average Large-Cap Growth Fund6 | | 7.6 |
| | |
| | |
Vanguard Value Index Fund | | |
Investor Shares | VIVAX | 6.7% |
Admiral Shares | VVIAX | 6.7 |
Signal Shares | VVISX | –2.73 |
Institutional Shares | VIVIX | 6.7 |
ETF Shares | VTV | |
Market Price | | 6.6 |
Net Asset Value | | 6.7 |
MSCI US Prime Market Value Index | | 6.8 |
Average Large-Cap Value Fund6 | | 7.2 |
1 A lower-cost class of shares available to many longtime shareholders and to those with significant investments in the fund.
2 Signal Shares also carry lower costs and are available to certain institutional shareholders who meet specific administrative, service, and account-size criteria.
3 Return is since the share-class inception on June 4, 2007.
4 This class of shares carries low expenses and is available for a minimum initial investment of $5 million.
5 Vanguard ETF™ Shares are traded on the American Stock Exchange and are available only through brokers. The table shows ETF returns based on both the AMEX market price and the net asset value for a share. U.S. Pat. No. 6,879,964 B2.
6 Derived from data provided by Lipper Inc.
1
Your Fund’s Total Returns
Six Months Ended June 30, 2007 | | |
| Ticker | Total |
| Symbol | Returns |
Vanguard Large-Cap Index Fund | | |
Investor Shares | VLACX | 7.3% |
Admiral Shares | VLCAX | 7.3 |
Institutional Shares | VLISX | 7.3 |
ETF Shares | VV | |
Market Price | | 7.3 |
Net Asset Value | | 7.3 |
MSCI US Prime Market 750 Index | | 7.4 |
Average Large-Cap Core Fund1 | | 6.9 |
| | |
| | |
Vanguard Total Stock Market Index Fund | | |
Investor Shares | VTSMX | 7.5% |
Admiral Shares | VTSAX | 7.5 |
Signal Shares | VTSSX | 7.5 |
Institutional Shares | VITSX | 7.5 |
ETF Shares | VTI | |
Market Price | | 7.4 |
Net Asset Value | | 7.5 |
MSCI US Broad Market Index | | 7.6 |
Average Multi-Cap Core Fund1 | | 7.8 |
1 Derived from data provided by Lipper Inc.
2
Your Fund’s Performance at a Glance
December 31, 2006–June 30, 2007 | | | | |
| | | Distributions Per Share |
| Starting | Ending | Income | Capital |
| Share Price | Share Price | Dividends | Gains |
Growth Index Fund | | | | |
Investor Shares | $29.77 | $32.00 | $0.130 | $0.000 |
Admiral Shares | 29.77 | 32.00 | 0.148 | 0.000 |
Signal Shares | 30.261 | 29.63 | 0.075 | 0.000 |
Institutional Shares | 29.77 | 32.00 | 0.153 | 0.000 |
ETF Shares | 57.85 | 62.17 | 0.287 | 0.000 |
Value Index Fund | | | | |
Investor Shares | $26.58 | $28.04 | $0.300 | $0.000 |
Admiral Shares | 26.58 | 28.04 | 0.314 | 0.000 |
Signal Shares | 30.141 | 29.18 | 0.156 | 0.000 |
Institutional Shares | 26.58 | 28.04 | 0.318 | 0.000 |
ETF Shares | 68.14 | 71.89 | 0.805 | 0.000 |
Large-Cap Index Fund | | | | |
Investor Shares | $25.42 | $27.07 | $0.190 | $0.000 |
Admiral Shares | 31.78 | 33.84 | 0.253 | 0.000 |
Institutional Shares | 130.78 | 139.29 | 1.054 | 0.000 |
ETF Shares | 62.92 | 67.01 | 0.510 | 0.000 |
Total Stock Market Index Fund | | | | |
Investor Shares | $34.09 | $36.36 | $0.270 | $0.000 |
Admiral Shares | 34.09 | 36.36 | 0.284 | 0.000 |
Signal Shares | 32.91 | 35.10 | 0.276 | 0.000 |
Institutional Shares | 34.10 | 36.37 | 0.290 | 0.000 |
ETF Shares | 140.08 | 149.40 | 1.182 | 0.000 |
1 Share price at inception on June 4, 2007.
3

Chairman’s Letter
Dear Shareholder,
Despite some choppiness, the broad U.S. stock market posted solid returns for the first half of 2007, spurred by a strong March, April, and May. The four Vanguard large-cap index funds reflected these market dynamics and produced returns ranging from 6.7% for the Value Index Fund to 7.9% for the Growth Index Fund Investor Shares. As expected, the Large-Cap Index and Total Stock Market Index Funds (which contain both value and growth stocks), produced returns that fell between these bookends.
The Large-Cap Index and Growth Index Funds outperformed the average returns of their peers, while the Value Index and Total Stock Market Index Funds trailed their competitors. Each fund met its primary objective of closely tracking its target benchmark.
Stock market’s ascent was driven by global liquidity
The broad U.S. stock market notched impressive gains in the year’s first half, when an abundance of cash drove record numbers of mergers and acquisitions around the globe. The gains came amid increased volatility. In February, markets worldwide fell sharply following a sell-off in China, only to recover quickly and continue upward. The six-month period closed with two dips in June, owing to fears of accelerating inflation and slowing economic growth.
4
The best performers in the U.S. market were the so-called mega-caps—broadly diversified companies that are well-positioned to thrive during periods of economic transition. International stocks, particularly those in emerging markets, outperformed U.S. equities. The dollar slid against the euro and the British pound, further enhancing gains for Americans investing abroad.
Bond investors were hobbled by a shift in sentiment
The relationship between yield and maturity returned to normal during the past six months, as yields of intermediate-and longer-term bonds moved higher than short-term yields. The accompanying drop in prices was steepest for long-term and intermediate-term bonds.
Earlier in the year, bond yields seemed to reflect an assumption that the Federal Reserve Board might cut interest rates in response to weaker economic growth. As the year progressed, inflationary pressures and economic growth looked more substantial, producing a change in market sentiment, which resulted in higher yields and lower prices.
The broad taxable bond market returned 1.0% for the period, while municipal bonds posted a return of 0.1%. The Citigroup 3-Month Treasury Bill Index—a proxy for money market yields—returned 2.5% for the half-year.
Market Barometer | | | |
| | | Total Returns |
| Periods Ended June 30, 2007 |
| Six Months | One Year | Five Years1 |
Stocks | | | |
Russell 1000 Index (Large-caps) | 7.2% | 20.4% | 11.3% |
Russell 2000 Index (Small-caps) | 6.4 | 16.4 | 13.9 |
Dow Jones Wilshire 5000 Index (Entire market) | 7.6 | 20.4 | 12.0 |
MSCI All Country World Index ex USA (International) | 12.6 | 30.1 | 19.9 |
| | | |
| | | |
Bonds | | | |
Lehman U.S. Aggregate Bond Index (Broad taxable market) | 1.0% | 6.1% | 4.5% |
Lehman Municipal Bond Index | 0.1 | 4.7 | 4.6 |
Citigroup 3-Month Treasury Bill Index | 2.5 | 5.1 | 2.7 |
| | | |
| | | |
CPI | | | |
Consumer Price Index | 3.2% | 2.7% | 3.0% |
| | | | |
1 Annualized.
5
Growth stocks took the lead during the year’s first half
In our past several annual and semiannual letters, we’ve reported that large-cap value stocks performed better than their growth-oriented counterparts. During the first six months of 2007, growth stocks stepped to the fore. The Growth Index Fund, with its 7.9% return for Investor Shares, posted the strongest performance of the four large-cap index funds. Impressive returns in the energy and industrials sectors contributed to the Growth Index Fund’s solid return. The sizable information technology sector was also a top contributor. Consumer staples and consumer discretionary stocks, meanwhile, were restrained by high fuel prices and continued weakness in the housing market.
The Value Index Fund Investor Shares returned 6.7%, and, like the Growth Index Fund, benefited from strength in energy and industrials stocks. The relatively tiny materials sector produced outsized returns as metal and mining stocks soared over 40%. The fund’s performance was dampened by its heavy exposure to financial stocks (representing more than one-third of the fund’s assets, on average, during the period). Rising interest rates, trouble with subprime mortgage loans, and poor returns among real estate investment trusts (REITs) contributed to a negative return for the sector.
The 7.3% return of the Large-Cap Index Fund, which is essentially a combination of the Growth and Value Index Funds, marked the approximate midpoint between the results of the two style-oriented funds and reflected the blended dynamics of their underlying sectors. Energy, technology, and industrial stocks were top contributors; financial and consumer issues were laggards.
The story was much the same for the Total Stock Market Index Fund, which returned 7.5%. Although the fund is heavily weighted with large-cap holdings, its total-market mandate ensures exposure to virtually every portion of the market. During the period, small-cap stocks trailed the broad market, but mid-sized companies offset much of this relative weakness.
Familiar patterns among stocks, but unpredictable timing
As mentioned earlier, large growth stocks edged out large value stocks during the past six months, reversing a longer-term trend. Like the pendulum on a grandfather clock, stock market leadership “swings” back and forth, from growth to value and
6
all the gradations in between. Unlike a clock, however, the timing of these movements is unpredictable. That is why it is smart to have a portfolio that is diversified among growth and value stocks as well as among different segments of the market, including small- and mid-cap stocks as well as large-cap.
Each of the four Vanguard large-cap index funds offers varying degrees of exposure to the U.S. market. The Total Stock Market Index Fund provides the broadest exposure to the overall market, covering all segments and styles. The other three funds focus on the market’s larger companies, with the Value Index and Growth Index Funds providing even more targeted exposure to specific investment styles. Each fund can serve as a foundation for building a balanced and diversified portfolio. It’s important to know the role each fund plays in your investment strategy.
Thank you for investing with Vanguard.
Sincerely,

John J. Brennan
Chairman and Chief Executive Officer
July 12, 2007
7
Annualized Expense Ratios1 | |
Your fund compared with its peer group | |
| Expense |
| Ratio |
Growth Index Fund | |
Investor Shares | 0.22% |
Admiral Shares | 0.10 |
Signal Shares | 0.10 |
Institutional Shares | 0.07 |
ETF Shares | 0.11 |
Average Large-Cap Growth Fund | 1.43 |
Value Index Fund | |
Investor Shares | 0.20% |
Admiral Shares | 0.10 |
Signal Shares | 0.10 |
Institutional Shares | 0.07 |
ETF Shares | 0.11 |
Average Large-Cap Value Fund | 1.35 |
Large-Cap Index Fund | |
Investor Shares | 0.20% |
Admiral Shares | 0.10 |
Institutional Shares | 0.08 |
ETF Shares | 0.07 |
Average Large-Cap Core Fund | 1.35 |
Total Stock Market Index Fund | |
Investor Shares | 0.16% |
Admiral Shares | 0.08 |
Signal Shares | 0.08 |
Institutional Shares | 0.05 |
ETF Shares | 0.07 |
Average Multi-Cap Core Fund | 1.30 |
1 Fund expense ratios reflect the six months ended June 30, 2007. Peer-group expense ratios are derived from data provided by Lipper Inc. and capture information through year-end 2006.
8
Vanguard Growth ETF | | | | |
Premium/Discount: January 26, 20041–June 30, 2007 | | | |
| Market Price Above or | Market Price Below |
| Equal to Net Asset Value | | Net Asset Value |
| Number | Percentage | Number | Percentage |
Basis Point Differential2 | of Days | of Total Days | of Days | of Total Days |
0–24.9 | 508 | 58.72% | 347 | 40.11% |
25–49.9 | 3 | 0.35 | 1 | 0.12 |
50–74.9 | 3 | 0.35 | 0 | 0.00 |
75–100.0 | 1 | 0.12 | 0 | 0.00 |
>100.0 | 2 | 0.23 | 0 | 0.00 |
Total | 517 | 59.77% | 348 | 40.23% |
| | | | | |
Vanguard Value ETF | | | | |
Premium/Discount: January 26, 20041–June 30, 2007 | | | |
| Market Price Above or | Market Price Below |
| Equal to Net Asset Value | | Net Asset Value |
| Number | Percentage | Number | Percentage |
Basis Point Differential2 | of Days | of Total Days | of Days | of Total Days |
0–24.9 | 507 | 58.61% | 353 | 40.81% |
25–49.9 | 3 | 0.35 | 0 | 0.00 |
50–74.9 | 0 | 0.00 | 0 | 0.00 |
75–100.0 | 0 | 0.00 | 0 | 0.00 |
>100.0 | 2 | 0.23 | 0 | 0.00 |
Total | 512 | 59.19% | 353 | 40.81% |
| | | | | |
Vanguard Large-Cap ETF | | | | |
Premium/Discount: January 27, 20041–June 30, 2007 | | | |
| Market Price Above or | Market Price Below |
| Equal to Net Asset Value | | Net Asset Value |
| Number | Percentage | Number | Percentage |
Basis Point Differential2 | of Days | of Total Days | of Days | of Total Days |
0–24.9 | 489 | 56.59% | 371 | 42.94% |
25–49.9 | 2 | 0.23 | 0 | 0.00 |
50–74.9 | 1 | 0.12 | 0 | 0.00 |
75–100.0 | 0 | 0.00 | 0 | 0.00 |
>100.0 | 1 | 0.12 | 0 | 0.00 |
Total | 493 | 57.06% | 371 | 42.94% |
| | | | | |
1 Inception.
2 One basis point equals 1/100 of a percentage point.
9
Vanguard Total Stock Market ETF | | | | |
Premium/Discount: June 30, 2002–June 30, 2007 | | |
| Market Price Above or | Market Price Below |
| Equal to Net Asset Value | | Net Asset Value |
| Number | Percentage | Number | Percentage |
Basis Point Differential1 | of Days | of Total Days | of Days | of Total Days |
0–24.9 | 747 | 59.28% | 508 | 40.32% |
25–49.9 | 2 | 0.16 | 1 | 0.08 |
50–74.9 | 0 | 0.00 | 2 | 0.16 |
75–100.0 | 0 | 0.00 | 0 | 0.00 |
>100.0 | 0 | 0.00 | 0 | 0.00 |
Total | 749 | 59.44% | 511 | 40.56% |
| | | | | | | |
1 One basis point equals 1/100 of a percentage point.
10
Growth Index Fund
Fund Profile
As of June 30, 2007
Portfolio Characteristics | | |
| | Target | Broad |
| Fund | Index1 | Index2 |
Number of Stocks | 429 | 428 | 4,921 |
Median Market Cap | $37.2B | $37.2B | $32.6B |
Price/Earnings Ratio | 22.0x | 22.0x | 18.2x |
Price/Book Ratio | 4.1x | 4.1x | 2.9x |
Yield | | 0.9% | 1.7% |
Investor Shares | 0.7% | | |
Admiral Shares | 0.9% | | |
Signal Shares | 0.8% | | |
Institutional Shares | 0.9% | | |
ETF Shares | 0.8% | | |
Return on Equity | 19.6% | 19.6% | 18.2% |
Earnings Growth Rate | 25.0% | 24.9% | 20.7% |
Foreign Holdings | 0.4% | 0.4% | 0.0% |
Turnover Rate | 15%3 | — | — |
Expense Ratio | | — | — |
Investor Shares | 0.22%3 | | |
Admiral Shares | 0.10%3 | | |
Signal Shares | 0.10%3 | | |
Institutional Shares | 0.07%3 | | |
ETF Shares | 0.11%3 | | |
Short-Term Reserves | 0% | — | — |
Sector Diversification (% of portfolio) | |
| | Target | Broad |
| Fund | Index1 | Index2 |
Consumer Discretionary | 16% | 16% | 12% |
Consumer Staples | 11 | 11 | 8 |
Energy | 6 | 6 | 10 |
Financials | 7 | 8 | 21 |
Health Care | 15 | 15 | 11 |
Industrials | 11 | 11 | 12 |
Information Technology | 28 | 28 | 15 |
Materials | 3 | 2 | 4 |
Telecommunication Services | 1 | 1 | 3 |
Utilities | 2 | 2 | 4 |
Volatility Measures4 | |
| Fund Versus | Fund Versus |
| Target Index1 | Broad Index2 |
R-Squared | 1.00 | 0.94 |
Beta | 1.00 | 1.08 |
Ten Largest Holdings5 (% of total net assets) |
| | |
Microsoft Corp. | systems software | 3.6% |
The Procter & Gamble Co. | household products | 2.7 |
Johnson & Johnson | pharmaceuticals | 2.4 |
Cisco Systems, Inc. | communications | |
| equipment | 2.3 |
Intel Corp. | semiconductors | 1.9 |
Wal-Mart Stores, Inc. | hypermarkets | |
| and super centers | 1.7 |
Google Inc. | internet software | |
| and services | 1.6 |
PepsiCo, Inc. | soft drinks | 1.5 |
Apple Computer, Inc. | computer hardware | 1.4 |
International Business Machines Corp. | computer hardware | 1.4 |
Top Ten | | 20.5% |
Investment Focus
1 MSCI US Prime Market Growth Index.
2 Dow Jones Wilshire 5000 Index.
3 Annualized.
4 For an explanation of R-squared, beta, and other terms used here, see the Glossary on page 76.
5 “Ten Largest Holdings” excludes any temporary cash investments and equity index products.
11
Growth Index Fund
Performance Summary
All of the returns in this report represent past performance, which is not a guarantee of future results that may be achieved by the fund. (Current performance may be lower or higher than the performance data cited. For performance data current to the most recent month-end, visit our website at www.vanguard.com/performance.) Note, too, that both investment returns and principal value can fluctuate widely, so an investor’s shares, when sold, could be worth more or less than their original cost. The returns shown do not reflect taxes that a shareholder would pay on fund distributions or on the sale of fund shares.
Fiscal-Year Total Returns (%): December 31, 1996–June 30, 2007
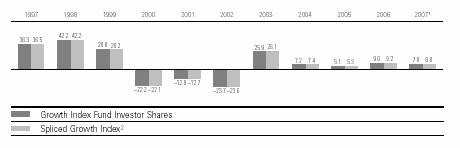
Average Annual Total Returns: Periods Ended June 30, 2007 | |
| | | | |
| Inception Date | One Year | Five Years | Ten Years |
Growth Index Fund | | | | |
Investor Shares3 | 11/2/1992 | 18.58% | 8.95% | 5.64% |
Admiral Shares | 11/13/2000 | 18.71 | 9.06 | 0.464 |
Signal Shares | 6/4/2007 | –1.834 | — | — |
Institutional Shares | 5/14/1998 | 18.75 | 9.10 | 3.404 |
ETF Shares | 1/26/2004 | | | |
Market Price | | 18.39 | 7.264 | — |
Net Asset Value | | 18.68 | 7.284 | — |
1 Six months ended June 30, 2007.
2 S&P 500/Barra Growth Index through May 16, 2003; MSCI US Prime Market Growth Index thereafter.
3 Total returns do not include the account service fee that may be applicable to certain accounts with balances below $10,000.
4 Return since Inception.
Note: See Financial Highlights tables on pages 21–25 for dividend and capital gains information.
12
Growth Index Fund
Financial Statements (unaudited)
Statement of Net Assets
As of June 30, 2007
The fund provides a complete list of its holdings four times in each fiscal year, at the quarter-ends. For the second and fourth fiscal quarters, the lists appear in the fund’s semiannual and annual reports to shareholders. For the first and third fiscal quarters, the fund files the lists with the Securities and Exchange Commission on Form N-Q. Shareholders can look up the fund’s Forms N-Q on the SEC’s website at www.sec.gov. Forms N-Q may also be reviewed and copied at the SEC’s Public Reference Room (see the back cover of this report for further information).
| | | Market |
| | | Value• |
| | Shares | ($000) |
Common Stocks (100.0%) | | |
| Consumer Discretionary (15.9%) | |
| Home Depot, Inc. | 4,178,766 | 164,434 |
| The Walt Disney Co. | 3,984,528 | 136,032 |
| Time Warner, Inc. | 5,078,139 | 106,844 |
| Target Corp. | 1,670,690 | 106,256 |
* | Comcast Corp. | | |
| Special Class A | 3,526,004 | 98,587 |
| Lowe’s Cos., Inc. | 2,962,124 | 90,908 |
| News Corp., Class A | 3,801,118 | 80,622 |
* | Comcast Corp. Class A | 2,626,676 | 73,862 |
* | Viacom Inc. Class B | 1,243,094 | 51,750 |
| The McGraw-Hill Cos., Inc. | 725,289 | 49,378 |
| Johnson Controls, Inc. | 402,386 | 46,584 |
| McDonald’s Corp. | 862,522 | 43,782 |
* | Amazon.com, Inc. | 636,838 | 43,566 |
* | Kohl’s Corp. | 602,703 | 42,810 |
| Macy’s Inc. | 1,075,318 | 42,776 |
| NIKE, Inc. Class B | 693,274 | 40,411 |
* | Starbucks Corp. | 1,537,673 | 40,349 |
| Best Buy Co., Inc. | 838,791 | 39,146 |
| Omnicom Group Inc. | 684,344 | 36,215 |
* | Coach, Inc. | 757,951 | 35,919 |
| Yum! Brands, Inc. | 1,085,540 | 35,519 |
| Staples, Inc. | 1,479,669 | 35,113 |
* | DIRECTV Group, Inc. | 1,377,981 | 31,845 |
| J.C. Penney Co., Inc. | | |
| (Holding Co.) | 437,674 | 31,679 |
| Harley-Davidson, Inc. | 528,449 | 31,501 |
| Marriott International, Inc. | | |
| Class A | 714,917 | 30,913 |
| Starwood Hotels & Resorts | |
| Worldwide, Inc. | 439,967 | 29,509 |
* | Sears Holdings Corp. | 173,410 | 29,393 |
* | Liberty Media Corp.– | | |
| Interactive Series A | 1,274,402 | 28,457 |
| International Game | | |
| Technology | 692,626 | 27,497 |
| TJX Cos., Inc. | 931,865 | 25,626 |
| Hilton Hotels Corp. | 752,027 | 25,170 |
| | | | |
13
| | | Market |
| | | Value• |
| | Shares | ($000) |
| News Corp., Class B | 1,010,035 | 23,170 |
| Ford Motor Co. | 2,419,670 | 22,793 |
* | MGM Mirage, Inc. | 261,641 | 21,580 |
| Nordstrom, Inc. | 421,484 | 21,546 |
* | Bed Bath & Beyond, Inc. | 580,255 | 20,883 |
* | Liberty Global, Inc. Series C | 514,280 | 20,211 |
* | Liberty Media Corp.– | | |
| Capital Series A | 163,701 | 19,264 |
* | EchoStar Communications Corp. | | |
| Class A | 422,967 | 18,344 |
| ^Garmin Ltd. | 243,124 | 17,984 |
* | Apollo Group, Inc. Class A | 300,615 | 17,565 |
* | Office Depot, Inc. | 566,156 | 17,155 |
* | Cablevision Systems NY | | |
| Group Class A | 467,647 | 16,924 |
* | Las Vegas Sands Corp. | 217,608 | 16,623 |
| Harman International | | |
| Industries, Inc. | 127,502 | 14,892 |
| Tiffany & Co. | 277,144 | 14,705 |
* | AutoZone Inc. | 101,205 | 13,827 |
* | The Goodyear Tire & | | |
| Rubber Co. | 379,895 | 13,205 |
| Abercrombie & Fitch Co. | 180,829 | 13,197 |
* | Discovery Holding Co. | | |
| Class A | 549,049 | 12,623 |
| Polo Ralph Lauren Corp. | 124,116 | 12,177 |
| Tim Hortons, Inc. | 390,669 | 12,013 |
| Black & Decker Corp. | 134,119 | 11,844 |
| Harrah’s Entertainment, Inc. | 133,390 | 11,373 |
* | CarMax, Inc. | 439,997 | 11,220 |
* | GameStop Corp. Class A | 282,019 | 11,027 |
* | R.H. Donnelley Corp. | 144,050 | 10,916 |
| American Eagle | | |
| Outfitters, Inc. | 410,468 | 10,533 |
| Lamar Advertising Co. | | |
| Class A | 166,854 | 10,472 |
* | Liberty Global, Inc. Class A | 251,056 | 10,303 |
* | Interpublic Group | | |
| of Cos., Inc. | 903,411 | 10,299 |
| Wynn Resorts Ltd. | 114,367 | 10,258 |
14
Growth Index Fund
| | | Market |
| | | Value• |
| | Shares | ($000) |
* | Dollar Tree Stores, Inc. | 210,155 | 9,152 |
| Dollar General Corp. | 415,360 | 9,105 |
| PetSmart, Inc. | 277,926 | 9,019 |
* | Penn National Gaming, Inc. | 147,838 | 8,884 |
| Ross Stores, Inc. | 286,157 | 8,814 |
* | Chico’s FAS, Inc. | 359,576 | 8,752 |
| Advance Auto Parts, Inc. | 215,713 | 8,743 |
| Station Casinos, Inc. | 99,555 | 8,641 |
* | ^Sirius Satellite Radio, Inc. | 2,836,593 | 8,567 |
* | O’Reilly Automotive, Inc. | 221,114 | 8,082 |
| Limited Brands, Inc. | 256,537 | 7,042 |
* | Career Education Corp. | 193,766 | 6,543 |
* | XM Satellite Radio | | |
| Holdings, Inc. | 549,925 | 6,473 |
| Centex Corp. | 158,699 | 6,364 |
* | NVR, Inc. | 9,285 | 6,311 |
| Williams-Sonoma, Inc. | 194,851 | 6,153 |
| RadioShack Corp. | 171,899 | 5,697 |
* | Urban Outfitters, Inc. | 235,647 | 5,663 |
| Gentex Corp. | 277,540 | 5,465 |
* | Getty Images, Inc. | 110,007 | 5,259 |
| Family Dollar Stores, Inc. | 147,366 | 5,058 |
| Virgin Media Inc. | 198,722 | 4,843 |
| E.W. Scripps Co. Class A | 90,686 | 4,143 |
| Weight Watchers | | |
| International, Inc. | 72,847 | 3,704 |
| Boyd Gaming Corp. | 74,595 | 3,669 |
* | CTC Media, Inc. | 77,457 | 2,102 |
| | | 2,373,627 |
Consumer Staples (11.1%) | | |
| The Procter & Gamble Co. | 6,460,812 | 395,337 |
| Wal-Mart Stores, Inc. | 5,120,496 | 246,347 |
| PepsiCo, Inc. | 3,353,453 | 217,471 |
| CVS/Caremark Corp. | 3,151,679 | 114,879 |
| Walgreen Co. | 2,049,229 | 89,223 |
| Anheuser-Busch Cos., Inc. | 1,573,328 | 82,065 |
| The Coca-Cola Co. | 1,493,335 | 78,116 |
| Colgate-Palmolive Co. | 1,051,236 | 68,173 |
| Costco Wholesale Corp. | 926,217 | 54,202 |
| Sysco Corp. | 1,263,371 | 41,679 |
| Archer-Daniels-Midland Co. | 1,202,222 | 39,782 |
| Avon Products, Inc. | 910,315 | 33,454 |
| Kellogg Co. | 529,670 | 27,432 |
| Safeway, Inc. | 586,319 | 19,952 |
| The Kroger Co. | 688,560 | 19,369 |
| Wm. Wrigley Jr. Co. | 339,002 | 18,750 |
| Campbell Soup Co. | 477,887 | 18,547 |
| Carolina Group | 221,875 | 17,144 |
| The Hershey Co. | 330,653 | 16,738 |
| ^Whole Foods Market, Inc. | 287,633 | 11,016 |
| The Estee Lauder Cos. Inc. | | |
| Class A | 241,682 | 10,999 |
15
| | | Market |
| | | Value• |
| | Shares | ($000) |
* | Energizer Holdings, Inc. | 109,072 | 10,864 |
| The Clorox Co. | 154,864 | 9,617 |
| Dean Foods Co. | 177,773 | 5,666 |
| Brown-Forman Corp. Class B | 70,525 | 5,154 |
* | Bare Escentuals, Inc. | 110,499 | 3,774 |
| Wm. Wrigley Jr. Co. Class B | 62,668 | 3,447 |
| | | 1,659,197 |
Energy (6.3%) | | |
| Schlumberger Ltd. | 2,413,144 | 204,972 |
| Halliburton Co. | 1,884,209 | 65,005 |
* | Transocean Inc. | 598,896 | 63,471 |
| Baker Hughes, Inc. | 655,722 | 55,166 |
| XTO Energy, Inc. | 708,137 | 42,559 |
| Williams Cos., Inc. | 1,221,067 | 38,610 |
* | Weatherford | | |
| International Ltd. | 692,394 | 38,248 |
* | National Oilwell Varco Inc. | 359,995 | 37,526 |
| EOG Resources, Inc. | 498,590 | 36,427 |
| GlobalSantaFe Corp. | 478,186 | 34,549 |
| Noble Corp. | 275,613 | 26,878 |
| Peabody Energy Corp. | 540,218 | 26,136 |
| Smith International, Inc. | 409,506 | 24,013 |
| Chesapeake Energy Corp. | 581,739 | 20,128 |
| Sunoco, Inc. | 248,542 | 19,804 |
| ENSCO International, Inc. | 309,010 | 18,853 |
| CONSOL Energy, Inc. | 373,733 | 17,233 |
* | Ultra Petroleum Corp. | 310,808 | 17,169 |
| BJ Services Co. | 600,479 | 17,078 |
* | Cameron International Corp. | 227,646 | 16,270 |
* | Southwestern Energy Co. | 344,579 | 15,334 |
| Diamond Offshore | | |
| Drilling, Inc. | 141,654 | 14,386 |
* | Grant Prideco, Inc. | 262,237 | 14,116 |
* | Pride International, Inc. | 336,006 | 12,587 |
| Range Resources Corp. | 300,768 | 11,252 |
* | FMC Technologies Inc. | 139,381 | 11,042 |
* | Nabors Industries, Inc. | 306,347 | 10,226 |
| Arch Coal, Inc. | 290,791 | 10,120 |
| Murphy Oil Corp. | 127,166 | 7,559 |
| Rowan Cos., Inc. | 146,749 | 6,014 |
* | CNX Gas Corp. | 61,503 | 1,882 |
| | | 934,613 |
Financials (7.3%) | | |
| American Express Co. | 2,205,295 | 134,920 |
| The Goldman Sachs | | |
| Group, Inc. | 494,636 | 107,212 |
* | Berkshire Hathaway Inc. | | |
| Class B | 25,649 | 92,465 |
| AFLAC Inc. | 1,012,545 | 52,045 |
| Franklin Resources Corp. | 363,625 | 48,169 |
| Prudential Financial, Inc. | 488,343 | 47,482 |
| State Street Corp. | 683,607 | 46,759 |
| Charles Schwab Corp. | 2,206,898 | 45,286 |
| The Chicago | | |
| Mercantile Exchange | 71,288 | 38,093 |
| Progressive Corp. of Ohio | 1,448,163 | 34,655 |
| | | | | |
16
Growth Index Fund
| | | Market | |
| | | Value• | |
| | Shares | ($000) | |
| The Principal | | |
| Financial Group, Inc. | 549,588 | 32,035 |
| Moody’s Corp. | 486,998 | 30,291 |
| ProLogis REIT | 506,700 | 28,831 |
| T. Rowe Price Group Inc. | 516,094 | 26,780 | |
| Legg Mason Inc. | 269,304 | 26,494 | |
| SLM Corp. | 418,546 | 24,100 | |
| General Growth | | | |
| Properties Inc. REIT | 445,143 | 23,570 | |
| ^Nymex Holdings Inc. | 160,373 | 20,148 | |
| NYSE Euronext | 272,911 | 20,092 | |
| Northern Trust Corp. | 261,976 | 16,829 | |
* | CBOT Holdings, Inc. Class A | 75,742 | 15,648 | |
* | CB Richard Ellis Group, Inc. | 415,347 | 15,160 | |
| Simon Property | | | |
| Group, Inc. REIT | 158,661 | 14,762 | |
| Public Storage, Inc. REIT | 169,751 | 13,040 | |
* | E*TRADE Financial Corp. | 567,383 | 12,533 | |
* | IntercontinentalExchange Inc. | 84,538 | 12,499 | |
* | TD Ameritrade Holding Corp. | 552,293 | 11,046 | |
| Eaton Vance Corp. | 245,162 | 10,831 | |
| Vornado Realty Trust REIT | 97,826 | 10,745 | |
| Nuveen Investments, Inc. | | | |
| Class A | 161,042 | 10,009 | |
| SEI Investments Co. | 304,284 | 8,836 | |
| Boston Properties, Inc. REIT | 83,651 | 8,543 | |
| Investors Financial | | | |
| Services Corp. | 135,051 | 8,329 | |
| ^The St. Joe Co. | 144,300 | 6,687 | |
| Brown & Brown, Inc. | 243,449 | 6,120 | |
| ^The First Marblehead Corp. | 135,438 | 5,233 | |
* | Nasdaq Stock Market Inc. | 170,821 | 5,075 | |
| Forest City Enterprise | | | |
| Class A | 81,779 | 5,028 | |
| Federated Investors, Inc. | 96,636 | 3,704 | |
| | | 1,080,084 | |
Health Care (15.2%) | | | |
| Johnson & Johnson | 5,925,787 | 365,147 | |
| UnitedHealth Group Inc. | 2,758,061 | 141,047 | |
* | Amgen, Inc. | 2,388,533 | 132,062 | |
| Medtronic, Inc. | 2,362,052 | 122,496 | |
* | WellPoint Inc. | 1,254,021 | 100,108 | |
| Schering-Plough Corp. | 3,035,643 | 92,405 | |
| Abbott Laboratories | 1,579,748 | 84,595 | |
| Baxter International, Inc. | 1,340,017 | 75,497 | |
* | Genentech, Inc. | 970,464 | 73,425 | |
* | Gilead Sciences, Inc. | 1,883,082 | 73,007 | |
| Cardinal Health, Inc. | 819,638 | 57,899 | |
| Wyeth | 964,773 | 55,320 | |
| Aetna Inc. | 1,057,375 | 52,234 | |
* | Medco Health | | | |
| Solutions, Inc. | 589,863 | 46,003 | |
* | Celgene Corp. | 762,604 | 43,720 | |
17
| | | Market | |
| | | Value• | |
| | Shares | ($000) | |
* | Thermo Fisher | | |
| Scientific, Inc. | 835,582 | 43,216 |
* | Zimmer Holdings, Inc. | 488,679 | 41,484 |
| Becton, Dickinson & Co. | 500,834 | 37,312 |
| Stryker Corp. | 583,667 | 36,824 |
| Allergan, Inc. | 629,712 | 36,297 |
| McKesson Corp. | 604,839 | 36,073 |
* | Genzyme Corp. | 538,271 | 34,665 | |
* | St. Jude Medical, Inc. | 723,779 | 30,030 | |
* | Forest Laboratories, Inc. | 650,825 | 29,710 | |
* | Express Scripts Inc. | 472,134 | 23,611 | |
| Biomet, Inc. | 477,505 | 21,832 | |
| CIGNA Corp. | 409,522 | 21,385 | |
* | Humana Inc. | 341,416 | 20,796 | |
* | Laboratory Corp. of | | | |
| America Holdings | 256,847 | 20,101 | |
* | Biogen Idec Inc. | 353,282 | 18,901 | |
* | Coventry Health Care Inc. | 326,351 | 18,814 | |
| C.R. Bard, Inc. | 210,716 | 17,411 | |
| IMS Health, Inc. | 399,245 | 12,828 | |
* | Health Net Inc. | 238,678 | 12,602 | |
* | Waters Corp. | 207,640 | 12,325 | |
* | DaVita, Inc. | 213,007 | 11,477 | |
| Quest Diagnostics, Inc. | 220,476 | 11,388 | |
| DENTSPLY International Inc. | 295,702 | 11,314 | |
* | Varian Medical Systems, Inc. | 263,079 | 11,183 | |
* | Amylin Pharmaceuticals, Inc. | 268,450 | 11,049 | |
* | Intuitive Surgical, Inc. | 76,052 | 10,554 | |
* | Cephalon, Inc. | 124,708 | 10,025 | |
| Manor Care, Inc. | 149,249 | 9,744 | |
* | Henry Schein, Inc. | 181,221 | 9,683 | |
| AmerisourceBergen Corp. | 194,048 | 9,600 | |
* | Endo Pharmaceuticals | | | |
| Holdings, Inc. | 273,413 | 9,359 | |
* | Sepracor Inc. | 224,349 | 9,203 | |
* | Covance, Inc. | 130,863 | 8,972 | |
* | Patterson Cos. | 228,019 | 8,498 | |
| Pharmaceutical Product | | | |
| Development, Inc. | 216,102 | 8,270 | |
* | Millipore Corp. | 109,284 | 8,206 | |
* | Hospira, Inc. | 207,448 | 8,099 | |
* | Lincare Holdings, Inc. | 189,579 | 7,555 | |
* | Cerner Corp. | 136,046 | 7,546 | |
* | Vertex Pharmaceuticals, Inc. | 258,330 | 7,378 | |
* | Millennium | | | |
| Pharmaceuticals, Inc. | 626,515 | 6,622 | |
* | Tenet Healthcare Corp. | 964,686 | 6,280 | |
| Applera Corp.–Applied | | | |
| Biosystems Group | 187,585 | 5,729 | |
* | Kinetic Concepts, Inc. | 108,924 | 5,661 | |
* | ImClone Systems, Inc. | 121,349 | 4,291 | |
* | Warner Chilcott Ltd. | 205,077 | 3,710 | |
| Brookdale Senior Living Inc. | 72,320 | 3,296 | |
| Beckman Coulter, Inc. | 44,083 | 2,851 | |
* | ^Abraxis Bioscience, Inc. | 67,850 | 1,508 | |
18
Growth Index Fund
| | | Market |
| | | Value• |
| | Shares | ($000) |
| | | 2,270,233 |
Industrials (11.2%) | | |
| The Boeing Co. | 1,535,242 | 147,629 |
| United Technologies Corp. | 1,934,786 | 137,234 |
| 3M Co. | 1,427,538 | 123,896 |
| Caterpillar, Inc. | 1,321,606 | 103,482 |
| United Parcel Service, Inc. | 1,363,324 | 99,523 |
| Lockheed Martin Corp. | 735,343 | 69,218 |
| FedEx Corp. | 597,429 | 66,297 |
| Burlington Northern | | |
| Santa Fe Corp. | 734,588 | 62,543 |
| General Dynamics Corp. | 706,220 | 55,241 |
| Illinois Tool Works, Inc. | 972,663 | 52,709 |
| PACCAR, Inc. | 482,914 | 42,033 |
| CSX Corp. | 894,376 | 40,318 |
| Emerson Electric Co. | 816,943 | 38,233 |
| Danaher Corp. | 504,642 | 38,100 |
| Deere & Co. | 301,434 | 36,395 |
| Precision Castparts Corp. | 280,786 | 34,076 |
| Textron, Inc. | 230,960 | 25,431 |
| L-3 Communications | | |
| Holdings, Inc. | 255,815 | 24,914 |
| ITT Industries, Inc. | 359,269 | 24,531 |
| Rockwell Collins, Inc. | 344,523 | 24,337 |
| Southwest Airlines Co. | 1,614,386 | 24,070 |
| American | | |
| Standard Cos., Inc. | 370,130 | 21,830 |
| Norfolk Southern Corp. | 406,499 | 21,370 |
| Waste Management, Inc. | 545,765 | 21,312 |
| Cummins Inc. | 202,740 | 20,519 |
| Fluor Corp. | 180,170 | 20,066 |
* | McDermott | | |
| International, Inc. | 226,331 | 18,813 |
| Expeditors International | | |
| of Washington, Inc. | 436,346 | 18,021 |
| C.H. Robinson | | |
| Worldwide Inc. | 338,811 | 17,794 |
| Raytheon Co. | 319,841 | 17,236 |
* | Terex Corp. | 208,321 | 16,936 |
* | Foster Wheeler Ltd. | 140,654 | 15,049 |
| Joy Global Inc. | 242,994 | 14,174 |
* | Jacobs Engineering | | |
| Group Inc. | 242,214 | 13,930 |
| Equifax, Inc. | 301,285 | 13,383 |
| The Dun & Bradstreet Corp. | 125,782 | 12,953 |
* | AMR Corp. | 491,285 | 12,945 |
| Robert Half International, Inc. | 326,805 | 11,928 |
| Fastenal Co. | 262,975 | 11,008 |
| Pitney Bowes, Inc. | 227,184 | 10,637 |
| Roper Industries Inc. | 178,613 | 10,199 |
* | Monster Worldwide Inc. | 240,893 | 9,901 |
* | KBR Inc. | 343,322 | 9,005 |
| Ametek, Inc. | 216,443 | 8,588 |
19
| | | Market |
| | | Value• |
| | Shares | ($000) |
* | Hertz Global Holdings Inc. | 295,488 | 7,851 |
* | ^USG Corp. | 150,549 | 7,383 |
* | Spirit Aerosystems | | |
| Holdings Inc. | 203,792 | 7,347 |
* | ChoicePoint Inc. | 163,078 | 6,923 |
| J.B. Hunt Transport | | |
| Services, Inc. | 206,894 | 6,066 |
| Republic Services, Inc. | | |
| Class A | 197,961 | 6,066 |
| Pall Corp. | 125,165 | 5,756 |
| The Corporate | | |
| Executive Board Co. | 79,924 | 5,188 |
* | First Solar, Inc. | 56,856 | 5,077 |
* | Owens Corning Inc. | 56,144 | 1,888 |
| | | 1,677,352 |
Information Technology (28.2%) | |
| Microsoft Corp. | 18,045,004 | 531,786 |
* | Cisco Systems, Inc. | 12,367,110 | 344,424 |
| Intel Corp. | 11,808,132 | 280,561 |
* | Google Inc. | 457,393 | 239,390 |
* | Apple Computer, Inc. | 1,764,801 | 215,376 |
| International Business | | |
| Machines Corp. | 2,003,762 | 210,896 |
* | Oracle Corp. | 8,488,568 | 167,310 |
| Hewlett-Packard Co. | 3,594,101 | 160,369 |
| QUALCOMM Inc. | 3,391,819 | 147,171 |
* | Dell Inc. | 4,186,093 | 119,513 |
| Texas Instruments, Inc. | 3,038,312 | 114,332 |
| Motorola, Inc. | 4,949,853 | 87,612 |
* | Corning, Inc. | 3,212,265 | 82,073 |
* | EMC Corp. | 4,509,537 | 81,623 |
* | eBay Inc. | 2,283,606 | 73,486 |
* | Yahoo! Inc. | 2,499,836 | 67,821 |
| Applied Materials, Inc. | 2,859,768 | 56,824 |
| Automatic Data | | |
| Processing, Inc. | 1,126,799 | 54,616 |
| Accenture Ltd. | 1,206,353 | 51,740 |
| First Data Corp. | 1,540,899 | 50,341 |
* | Adobe Systems, Inc. | 1,204,919 | 48,377 |
* | Sun Microsystems, Inc. | 7,372,651 | 38,780 |
* | Symantec Corp. | 1,893,147 | 38,242 |
| Western Union Co. | 1,580,614 | 32,924 |
* | Agilent Technologies, Inc. | 831,467 | 31,962 |
* | Electronic Arts Inc. | 634,892 | 30,043 |
* | NVIDIA Corp. | 691,645 | 28,572 |
* | Broadcom Corp. | 969,522 | 28,359 |
* | Juniper Networks, Inc. | 1,100,521 | 27,700 |
| Paychex, Inc. | 702,295 | 27,474 |
| Analog Devices, Inc. | 683,348 | 25,721 |
| MasterCard, Inc. Class A | 138,676 | 23,002 |
* | SanDisk Corp. | 460,847 | 22,554 |
| KLA-Tencor Corp. | 408,982 | 22,474 |
* | Network Appliance, Inc. | 765,492 | 22,352 |
| CA, Inc. | 863,284 | 22,299 |
20
Growth Index Fund
| | | Market |
| | | Value• |
| | Shares | ($000) |
* | MEMC Electronic | | |
| Materials, Inc. | 364,164 | 22,258 |
* | Autodesk, Inc. | 470,974 | 22,173 |
| ^Linear Technology Corp. | 612,851 | 22,173 |
* | Cognizant Technology | | |
| Solutions Corp. | 292,166 | 21,939 |
* | Intuit, Inc. | 672,771 | 20,237 |
* | Micron Technology, Inc. | 1,545,481 | 19,365 |
* | NCR Corp. | 364,965 | 19,175 |
* | Fiserv, Inc. | 336,929 | 19,138 |
* | Marvell Technology | | |
| Group Ltd. | 1,017,080 | 18,521 |
| National | | |
| Semiconductor Corp. | 652,581 | 18,448 |
| Xilinx, Inc. | 679,517 | 18,191 |
| Altera Corp. | 730,081 | 16,157 |
* | Advanced Micro | | |
| Devices, Inc. | 1,123,292 | 16,063 |
* | VeriSign, Inc. | 497,330 | 15,780 |
* | Avaya Inc. | 927,677 | 15,622 |
* | Akamai Technologies, Inc. | 311,458 | 15,149 |
| Harris Corp. | 274,595 | 14,979 |
* | LAM Research Corp. | 290,289 | 14,921 |
| Amphenol Corp. | 364,318 | 12,988 |
* | BMC Software, Inc. | 417,264 | 12,643 |
* | Xerox Corp. | 679,802 | 12,563 |
* | Citrix Systems, Inc. | 369,805 | 12,451 |
* | McAfee Inc. | 326,392 | 11,489 |
* | BEA Systems, Inc. | 802,716 | 10,989 |
| Maxim Integrated | | |
| Products, Inc. | 328,374 | 10,971 |
* | CDW Corp. | 128,481 | 10,917 |
* | Affiliated Computer | | |
| Services, Inc. Class A | 189,059 | 10,723 |
* | Activision, Inc. | 574,067 | 10,718 |
* | Alliance Data Systems Corp. | 138,525 | 10,705 |
* | Iron Mountain, Inc. | 386,342 | 10,095 |
* | Ceridian Corp. | 284,872 | 9,971 |
* | DST Systems, Inc. | 108,194 | 8,570 |
* | NAVTEQ Corp. | 200,507 | 8,489 |
* | Red Hat, Inc. | 373,812 | 8,329 |
* | salesforce.com, Inc. | 185,948 | 7,970 |
* | Avnet, Inc. | 196,758 | 7,799 |
| Fidelity National Information | | |
| Services, Inc. | 135,806 | 7,372 |
* | Novellus Systems, Inc. | 253,159 | 7,182 |
* | Hewitt Associates, Inc. | 215,487 | 6,896 |
* | Teradyne, Inc. | 388,586 | 6,831 |
* | Lexmark International, Inc. | 130,416 | 6,431 |
* | CheckFree Corp. | 152,153 | 6,117 |
* | ^JDS Uniphase Corp. | 420,064 | 5,641 |
* | Zebra Technologies | | |
| Corp. Class A | 144,056 | 5,581 |
21
| | | Market |
| | | Value• |
| | Shares | ($000) |
* | QLogic Corp. | 325,135 | 5,413 |
* | Cadence Design | | |
| Systems, Inc. | 200,291 | 4,398 |
| Jabil Circuit, Inc. | 195,450 | 4,314 |
* | Compuware Corp. | 231,628 | 2,747 |
| Molex, Inc. Class A | 102,501 | 2,721 |
| Total System Services, Inc. | 80,477 | 2,375 |
| Molex, Inc. | 29,857 | 896 |
| | | 4,201,683 |
Materials (2.4%) | | |
| Monsanto Co. | 1,112,921 | 75,167 |
| Praxair, Inc. | 661,186 | 47,599 |
| Nucor Corp. | 618,607 | 36,281 |
| Newmont Mining Corp. | | |
| (Holding Co.) | 922,785 | 36,044 |
| Allegheny Technologies Inc. | 185,472 | 19,452 |
| Ecolab, Inc. | 385,742 | 16,471 |
| Martin Marietta | | |
| Materials, Inc. | 92,506 | 14,988 |
| Air Products & | | |
| Chemicals, Inc. | 155,126 | 12,467 |
* | The Mosaic Co. | 314,742 | 12,281 |
* | Owens-Illinois, Inc. | 314,409 | 11,004 |
| Sealed Air Corp. | 330,215 | 10,243 |
| Ball Corp. | 190,015 | 10,103 |
* | Pactiv Corp. | 272,477 | 8,689 |
* | Crown Holdings, Inc. | 333,862 | 8,337 |
| Vulcan Materials Co. | 68,058 | 7,795 |
| Florida Rock Industries, Inc. | 100,929 | 6,813 |
| Albemarle Corp. | 165,064 | 6,360 |
* | Titanium Metals Corp. | 164,699 | 5,254 |
| Steel Dynamics, Inc. | 121,082 | 5,075 |
| Sigma-Aldrich Corp. | 94,499 | 4,032 |
| Huntsman Corp. | 101,937 | 2,478 |
| | | 356,933 |
Telecommunication Services (0.9%) | |
* | American Tower Corp. | | |
| Class A | 871,206 | 36,591 |
* | Qwest Communications | | |
| International Inc. | 3,249,936 | 31,524 |
* | NII Holdings Inc. | 298,782 | 24,124 |
* | Crown Castle | | |
| International Corp. | 534,453 | 19,385 |
* | Level 3 | | |
| Communications, Inc. | 2,266,049 | 13,256 |
* | Leap Wireless | | |
| International, Inc. | 110,875 | 9,369 |
* | U.S. Cellular Corp. | 33,214 | 3,009 |
| | | 137,258 |
Utilities (1.5%) | | |
| TXU Corp. | 893,410 | 60,126 |
| Constellation Energy | | |
| Group, Inc. | 369,965 | 32,250 |
* | AES Corp. | 1,359,961 | 29,756 |
22
Growth Index Fund
| | Market |
| | Value• |
| Shares | ($000) |
* | Mirant Corp. | 524,219 | 22,358 |
* | NRG Energy, Inc. | 475,906 | 19,783 |
| Questar Corp. | 351,652 | 18,585 |
* | Allegheny Energy, Inc. | 338,428 | 17,510 |
* | Reliant Energy, Inc. | 315,820 | 8,511 |
| Equitable Resources, Inc. | 118,372 | 5,867 |
* | Dynegy, Inc. | 352,726 | 3,330 |
| | | 218,076 |
Total Common Stocks | | |
(Cost $10,297,033) | | 14,909,056 |
Temporary Cash Investments (0.5%) | |
Money Market Fund (0.5%) | | |
1 Vanguard Market | | |
Liquidity Fund, | | |
5.281%—Note E | 48,596,200 | 48,596 |
1 Vanguard Market | | |
Liquidity Fund, 5.281% | 24,173,961 | 24,174 |
Total Temporary Cash Investments | |
(Cost $72,770) | | 72,770 |
Total Investments (100.5%) | | |
(Cost $10,369,803) | | 14,981,826 |
Other Assets and Liabilities (–0.5%) | |
Other Assets—Note B | | 75,322 |
Liabilities—Note E | | (143,073) |
| | (67,751) |
Net Assets (100%) | | 14,914,075 |
| | | | |
23
At June 30, 2007, net assets consisted of:2 | |
| Amount |
| ($000) |
Paid-in Capital | 13,678,200 |
Overdistributed Net Investment Income | (18,359) |
Accumulated Net Realized Losses | (3,357,789) |
Unrealized Appreciation | 4,612,023 |
Net Assets | 14,914,075 |
| |
| |
Investor Shares—Net Assets | |
Applicable to 217,355,816 outstanding $.001 |
par value shares of beneficial interest | |
(unlimited authorization) | 6,954,359 |
Net Asset Value Per Share— | |
Investor Shares | $32.00 |
| |
| |
Admiral Shares—Net Assets | |
Applicable to 91,448,387 outstanding $.001 | |
par value shares of beneficial interest | |
(unlimited authorization) | 2,926,012 |
Net Asset Value Per Share— | |
Admiral Shares | $32.00 |
| |
| |
Signal Shares—Net Assets | |
Applicable to 28,796 outstanding $.001 | |
par value shares of beneficial interest | |
(unlimited authorization) | 853 |
Net Asset Value Per Share— | |
Signal Shares | $29.63 |
| |
| |
Institutional Shares—Net Assets | |
Applicable to 86,879,027 outstanding $.001 | |
par value shares of beneficial interest | |
(unlimited authorization) | 2,779,866 |
Net Asset Value Per Share— | |
Institutional Shares | $32.00 |
| |
| |
ETF Shares—Net Assets | |
Applicable to 36,241,622 outstanding $.001 | |
par value shares of beneficial interest | |
(unlimited authorization) | 2,252,985 |
Net Asset Value Per Share— | |
ETF Shares | $62.17 |
• See Note A in Notes to Financial Statements.
* Non-income-producing security.
^ Part of security position is on loan to broker-dealers. See Note E in Notes to Financial Statements.
1 Affiliated money market fund available only to Vanguard funds and certain trusts and accounts managed by Vanguard. Rate shown is the 7-day yield.
2 See Note C in Notes to Financial Statements for the tax-basis components of net assets.
REIT—Real Estate Investment Trust.
24
Growth Index Fund
Statement of Operations
| Six Months Ended |
| June 30, 2007 |
| ($000) |
Investment Income | |
Income | |
Dividends | 71,628 |
Interest1 | 813 |
Security Lending | 984 |
Total Income | 73,425 |
Expenses | |
The Vanguard Group—Note B | |
Investment Advisory Services | 258 |
Management and Administrative—Investor Shares | 6,277 |
Management and Administrative—Admiral Shares | 958 |
Management and Administrative—Signal Shares | — |
Management and Administrative—Institutional Shares | 487 |
Management and Administrative—ETF Shares | 724 |
Marketing and Distribution—Investor Shares | 703 |
Marketing and Distribution—Admiral Shares | 307 |
Marketing and Distribution—Signal Shares | — |
Marketing and Distribution—Institutional Shares | 304 |
Marketing and Distribution—ETF Shares | 205 |
Custodian Fees | 183 |
Shareholders’ Reports—Investor Shares | 113 |
Shareholders’ Reports—Admiral Shares | 3 |
Shareholders’ Reports—Signal Shares | — |
Shareholders’ Reports—Institutional Shares | — |
Shareholders’ Reports—ETF Shares | 5 |
Trustees’ Fees and Expenses | 9 |
Total Expenses | 10,536 |
Net Investment Income | 62,889 |
Realized Net Gain (Loss) on Investment Securities Sold | 142,823 |
Change in Unrealized Appreciation (Depreciation) of Investment Securities | 860,073 |
Net Increase (Decrease) in Net Assets Resulting from Operations | 1,065,785 |
1 Interest income from an affiliated company of the fund was $493,000.
25
Growth Index Fund
Statement of Changes in Net Assets
| Six Months Ended | Year Ended |
| June 30, | December 31, |
| 2007 | 2006 |
| ($000) | ($000) |
Increase (Decrease) in Net Assets | | |
Operations | | |
Net Investment Income | 62,889 | 102,918 |
Realized Net Gain (Loss) | 142,823 | 105,823 |
Change in Unrealized Appreciation (Depreciation) | 860,073 | 795,633 |
Net Increase (Decrease) in Net Assets Resulting from Operations | 1,065,785 | 1,004,374 |
Distributions | | |
Net Investment Income | | |
Investor Shares | (28,522) | (55,673) |
Admiral Shares | (13,273) | (21,664) |
Signal Shares | (2) | — |
Institutional Shares | (12,721) | (17,858) |
ETF Shares | (9,875) | (7,995) |
Realized Capital Gain | | |
Investor Shares | — | — |
Admiral Shares | — | — |
Signal Shares | — | — |
Institutional Shares | — | — |
ETF Shares | — | — |
Total Distributions | (64,393) | (103,190) |
Capital Share Transactions—Note F | | |
Investor Shares | (248,036) | (567,496) |
Admiral Shares | 228,939 | 250,783 |
Signal Shares | 863 | — |
Institutional Shares | 470,455 | 539,350 |
ETF Shares | 780,552 | 947,005 |
Net Increase (Decrease) from Capital Share Transactions | 1,232,773 | 1,169,642 |
Total Increase (Decrease) | 2,234,165 | 2,070,826 |
Net Assets | | |
Beginning of Period | 12,679,910 | 10,609,084 |
End of Period1 | 14,914,075 | 12,679,910 |
1 Net Assets—End of Period includes undistributed (overdistributed) net investment income of ($18,359,000) and ($16,855,000).
26
Growth Index Fund
Financial Highlights
Investor Shares | | | | | | |
| | | | | | |
| Six Months | | | | | |
| Ended | | | |
For a Share Outstanding | June 30, | | Year Ended December 31, |
Throughout Each Period | 2007 | 2006 | 2005 | 2004 | 2003 | 2002 |
Net Asset Value, Beginning of Period | $29.77 | $27.54 | $26.41 | $24.92 | $19.95 | $26.42 |
Investment Operations | | | | | | |
Net Investment Income | .13 | .241 | .196 | .2911 | .169 | .222 |
Net Realized and Unrealized | | | | | | |
Gain (Loss) on Investments | 2.23 | 2.228 | 1.139 | 1.494 | 4.977 | (6.465) |
Total from Investment Operations | 2.36 | 2.469 | 1.335 | 1.785 | 5.146 | (6.243) |
Distributions | | | | | | |
Dividends from Net Investment Income | (.13) | (.239) | (.205) | (.295) | (.176) | (.227) |
Distributions from Realized Capital Gains | — | — | — | — | — | — |
Total Distributions | (.13) | (.239) | (.205) | (.295) | (.176) | (.227) |
Net Asset Value, End of Period | $32.00 | $29.77 | $27.54 | $26.41 | $24.92 | $19.95 |
| | | | | | |
| | | | | | |
Total Return2 | 7.94% | 9.01% | 5.09% | 7.20% | 25.92% | –23.68% |
| | | | | | |
| | | | | | |
Ratios/Supplemental Data | | | | | | |
Net Assets, End of Period (Millions) | $6,954 | $6,707 | $6,761 | $7,711 | $7,586 | $6,094 |
Ratio of Total Expenses to | | | | | | |
Average Net Assets | 0.22%* | 0.22% | 0.22% | 0.22% | 0.23% | 0.23% |
Ratio of Net Investment Income to | | | | | | |
Average Net Assets | 0.84%* | 0.86% | 0.75% | 1.14%1 | 0.77% | 0.97% |
Portfolio Turnover Rate3 | 15%* | 28% | 23% | 24% | 42%4 | 23% |
| | | | | | | | |
1 Net investment income per share and the ratio of net investment income to average net assets include $.139 and 0.55%, respectively, resulting from a special dividend from Microsoft Corp. in November 2004.
2 Total returns do not include the account service fee that may be applicable to certain accounts with balances below $10,000.
3 Excludes the value of portfolio securities received or delivered as a result of in-kind purchases or redemptions of the fund’s capital shares, including ETF Creation Units.
4 Includes activity related to a change in the fund’s target index.
* Annualized.
27
Growth Index Fund
Admiral Shares | | | | | | |
| | | | | | |
| Six Months | | | | | |
| Ended | | | |
For a Share Outstanding | June 30, | | Year Ended December 31, |
Throughout Each Period | 2007 | 2006 | 2005 | 2004 | 2003 | 2002 |
Net Asset Value, Beginning of Period | $29.77 | $27.54 | $26.41 | $24.92 | $19.95 | $26.42 |
Investment Operations | | | | | | |
Net Investment Income | .148 | .272 | .226 | .321 | .188 | .237 |
Net Realized and Unrealized | | | | | | |
Gain (Loss) on Investments | 2.230 | 2.228 | 1.139 | 1.49 | 4.977 | (6.465) |
Total from Investment Operations | 2.378 | 2.500 | 1.365 | 1.81 | 5.165 | (6.228) |
Distributions | | | | | | |
Dividends from Net Investment Income | (.148) | (.270) | (.235) | (.32) | (.195) | (.242) |
Distributions from Realized Capital Gains | — | — | — | — | — | — |
Total Distributions | (.148) | (.270) | (.235) | (.32) | (.195) | (.242) |
Net Asset Value, End of Period | $32.00 | $29.77 | $27.54 | $26.41 | $24.92 | $19.95 |
| | | | | | |
| | | | | | |
Total Return | 8.00% | 9.13% | 5.21% | 7.31% | 26.03% | –23.62% |
| | | | | | |
| | | | | | |
Ratios/Supplemental Data | | | | | | |
Net Assets, End of Period (Millions) | $2,926 | $2,505 | $2,076 | $1,214 | $1,092 | $751 |
Ratio of Total Expenses to | | | | | | |
Average Net Assets | 0.10%* | 0.11% | 0.11% | 0.11% | 0.15% | 0.15% |
Ratio of Net Investment Income to | | | | | | |
Average Net Assets | 0.96%* | 0.97% | 0.86% | 1.27%1 | 0.84% | 1.05% |
Portfolio Turnover Rate2 | 15%* | 28% | 23% | 24% | 42%3 | 23% |
| | | | | | | | |
1 Net investment income per share and the ratio of net investment income to average net assets include $.14 and 0.55%, respectively, resulting from a special dividend from Microsoft Corp. in November 2004.
2 Excludes the value of portfolio securities received or delivered as a result of in-kind purchases or redemptions of the fund’s capital shares, including ETF Creation Units.
3 Includes activity related to a change in the fund’s target index.
* Annualized.
28
Growth Index Fund
Signal Shares | |
| June 4, 20071 to |
For a Share Outstanding Throughout the Period | June 30, 2007 |
Net Asset Value, Beginning of Period | $30.26 |
Investment Operations | |
Net Investment Income | .024 |
Net Realized and Unrealized Gain (Loss) on Investments | (.579) |
Total from Investment Operations | (.555) |
Distributions | |
Dividends from Net Investment Income | (.075) |
Distributions from Realized Capital Gains | — |
Total Distributions | (.075) |
Net Asset Value, End of Period | $29.63 |
| |
| |
Total Return | –1.83% |
| |
| |
Ratios/Supplemental Data | |
Net Assets, End of Period (Millions) | $0.9 |
Ratio of Total Expenses to Average Net Assets | 0.10%* |
Ratio of Net Investment Income to Average Net Assets | 0.96%* |
Portfolio Turnover Rate2 | 15%* |
1 Inception.
2 Excludes the value of portfolio securities received or delivered as a result of in-kind purchases or redemptions of the fund’s capital shares, including ETF Creation Units.
* Annualized.
29
Growth Index Fund
Institutional Shares | | | | | | |
| | | | | | |
| Six Months | | | | | |
| Ended | | | |
For a Share Outstanding | June 30, | | Year Ended December 31, |
Throughout Each Period | 2007 | 2006 | 2005 | 2004 | 2003 | 2002 |
Net Asset Value, Beginning of Period | $29.77 | $27.54 | $26.41 | $24.92 | $19.95 | $26.42 |
Investment Operations | | | | | | |
Net Investment Income | .153 | .280 | .234 | .3241 | .199 | .248 |
Net Realized and Unrealized Gain (Loss) | | | | | | |
on Investments | 2.230 | 2.228 | 1.139 | 1.494 | 4.977 | (6.465) |
Total from Investment Operations | 2.383 | 2.508 | 1.373 | 1.818 | 5.176 | (6.217) |
Distributions | | | | | | |
Dividends from Net Investment Income | (.153) | (.278) | (.243) | (.328) | (.206) | (.253) |
Distributions from Realized Capital Gains | — | — | — | — | — | — |
Total Distributions | (.153) | (.278) | (.243) | (.328) | (.206) | (.253) |
Net Asset Value, End of Period | $32.00 | $29.77 | $27.54 | $26.41 | $24.92 | $19.95 |
| | | | | | |
| | | | | | |
Total Return | 8.02% | 9.16% | 5.24% | 7.34% | 26.09% | –23.58% |
| | | | | | |
| | | | | | |
Ratios/Supplemental Data | | | | | | |
Net Assets, End of Period (Millions) | $2,780 | $2,132 | $1,448 | $1,185 | $782 | $675 |
Ratio of Total Expenses to | | | | | | |
Average Net Assets | 0.07%* | 0.08% | 0.08% | 0.08% | 0.10% | 0.10% |
Ratio of Net Investment Income to | | | | | | |
Average Net Assets | 0.99%* | 1.00% | 0.89% | 1.29%1 | 0.92% | 1.10% |
Portfolio Turnover Rate2 | 15%* | 28% | 23% | 24% | 42%3 | 23% |
| | | | | | | | |
1 Net investment income per share and the ratio of net investment income to average net assets include $.139 and 0.55%, respectively, resulting from a special dividend from Microsoft Corp. in November 2004.
2 Excludes the value of portfolio securities received or delivered as a result of in-kind purchases or redemptions of the fund’s capital shares, including ETF Creation Units.
3 Includes activity related to a change in the fund’s target index.
* Annualized.
30
Growth Index Fund
ETF Shares | | | | |
| | | | |
| Six Months | | Jan. 26, |
| Ended | Year Ended | 20041 to |
| June 30, | December 31, | Dec. 31, |
For a Share Outstanding Throughout Each Period | 2007 | 2006 | 2005 | 2004 |
Net Asset Value, Beginning of Period | $57.85 | $53.52 | $51.33 | $50.64 |
Investment Operations | | | | |
Net Investment Income | .287 | .535 | .444 | .6092 |
Net Realized and Unrealized Gain (Loss) on Investments | 4.320 | 4.323 | 2.206 | .694 |
Total from Investment Operations | 4.607 | 4.858 | 2.650 | 1.303 |
Distributions | | | | |
Dividends from Net Investment Income | (.287) | (.528) | (.460) | (.613) |
Distributions from Realized Capital Gains | — | — | — | — |
Total Distributions | (.287) | (.528) | (.460) | (.613) |
Net Asset Value, End of Period | $62.17 | $57.85 | $53.52 | $51.33 |
| | | | |
| | | | |
Total Return | 7.98% | 9.13% | 5.20% | 2.62% |
| | | | |
| | | | |
Ratios/Supplemental Data | | | | |
Net Assets, End of Period (Millions) | $2,253 | $1,336 | $324 | $104 |
Ratio of Total Expenses to Average Net Assets | 0.11%* | 0.11% | 0.11% | 0.15%* |
Ratio of Net Investment Income to Average Net Assets | 0.95%* | 0.97% | 0.86% | 1.22%2,* |
Portfolio Turnover Rate3 | 15%* | 28% | 23% | 24% |
1 Inception.
2 Net investment income per share and the ratio of net investment income to average net assets include $.269 and 0.55%, respectively, resulting from a special dividend from Microsoft Corp. in November 2004.
3 Excludes the value of portfolio securities received or delivered as a result of in-kind purchases or redemptions of the fund’s capital shares, including ETF Creation Units.
* Annualized.
See accompanying Notes, which are an integral part of the Financial Statements.
31
Growth Index Fund
Notes to Financial Statements
Vanguard Growth Index Fund is registered under the Investment Company Act of 1940 as an open-end investment company, or mutual fund. The fund offers five classes of shares: Investor Shares, Admiral Shares, Signal Shares, Institutional Shares, and ETF Shares. Investor Shares are available to any investor who meets the fund’s minimum purchase requirements. Admiral Shares are designed for investors who meet certain administrative, service, tenure, and account-size criteria. Signal Shares are designed for institutional investors who meet certain administrative, service, and account-size criteria. Signal Shares were first issued on June 4, 2007. Institutional Shares are designed for investors who meet certain administrative and service criteria and invest a minimum of $5 million. ETF Shares are listed for trading on the American Stock Exchange; they can be purchased and sold through a broker.
A. The following significant accounting policies conform to generally accepted accounting principles for U.S. mutual funds. The fund consistently follows such policies in preparing its financial statements.
1. Security Valuation: Securities are valued as of the close of trading on the New York Stock Exchange (generally 4 p.m., Eastern time) on the valuation date. Equity securities are valued at the latest quoted sales prices or official closing prices taken from the primary market in which each security trades; such securities not traded on the valuation date are valued at the mean of the latest quoted bid and asked prices. Securities for which market quotations are not readily available, or whose values have been materially affected by events occurring before the fund’s pricing time but after the close of the securities’ primary markets, are valued by methods deemed by the board of trustees to represent fair value. Investments in Vanguard Market Liquidity Fund are valued at that fund’s net asset value.
2. Federal Income Taxes: The fund intends to continue to qualify as a regulated investment company and distribute all of its taxable income. Accordingly, no provision for federal income taxes is required in the financial statements.
3. Distributions: Distributions to shareholders are recorded on the ex-dividend date.
4. Security Lending: The fund may lend its securities to qualified institutional borrowers to earn additional income. Security loans are required to be secured at all times by collateral at least equal to the market value of securities loaned. The fund invests cash collateral received in Vanguard Market Liquidity Fund, and records a liability for the return of the collateral, during the period the securities are on loan. Security lending income represents the income earned on investing cash collateral, less expenses associated with the loan.
5. Other: Dividend income is recorded on the ex-dividend date. Interest income includes income distributions received from Vanguard Market Liquidity Fund and is accrued daily. Security transactions are accounted for on the date securities are bought or sold. Costs used to determine realized gains (losses) on the sale of investment securities are those of the specific securities sold.
Each class of shares has equal rights as to assets and earnings, except that each class separately bears certain class-specific expenses related to maintenance of shareholder accounts (included in Management and Administrative expenses) and shareholder reporting. Marketing and distribution
32
Growth Index Fund
expenses are allocated to each class of shares based on a method approved by the board of trustees. Income, other non-class-specific expenses, and gains and losses on investments are allocated to each class of shares based on its relative net assets.
B. The Vanguard Group furnishes at cost investment advisory, corporate management, administrative, marketing, and distribution services. The costs of such services are allocated to the fund under methods approved by the board of trustees. The fund has committed to provide up to 0.40% of its net assets in capital contributions to Vanguard. At June 30, 2007, the fund had contributed capital of $1,301,000 to Vanguard (included in Other Assets), representing 0.01% of the fund’s net assets and 1.30% of Vanguard’s capitalization. The fund’s trustees and officers are also directors and officers of Vanguard.
C. Distributions are determined on a tax basis and may differ from net investment income and realized capital gains for financial reporting purposes. Differences may be permanent or temporary. Permanent differences are reclassified among capital accounts in the financial statements to reflect their tax character. Temporary differences arise when certain items of income, expense, gain, or loss are recognized in different periods for financial statement and tax purposes; these differences will reverse at some time in the future. Differences in classification may also result from the treatment of short-term gains as ordinary income for tax purposes.
During the six months ended June 30, 2007, the fund realized $32,318,000 of net capital gains resulting from in-kind redemptions—in which shareholders exchanged fund shares for securities held by the fund rather than for cash. Because such gains are not taxable to the fund, and are not distributed to shareholders, they have been reclassified from accumulated net realized losses to paid-in capital.
The fund’s tax-basis capital gains and losses are determined only at the end of each fiscal year. For tax purposes, at December 31, 2006, the fund had available realized losses of $3,464,458,000 to offset future net capital gains of $221,842,000 through December 31, 2008, $1,752,289,000 through December 31, 2009, $747,930,000 through December 31, 2010, and $742,397,000 through December 31, 2011. The fund will use these capital losses to offset net taxable capital gains, if any, realized during the year ending December 31, 2007; should the fund realize net capital losses for the year, the losses will be added to the loss carryforward balances above.
At June 30, 2007, the cost of investment securities for tax purposes was $10,369,803,000. Net unrealized appreciation of investment securities for tax purposes was $4,612,023,000, consisting of unrealized gains of $4,825,916,000 on securities that had risen in value since their purchase and $213,893,000 in unrealized losses on securities that had fallen in value since their purchase.
D. During the six months ended June 30, 2007, the fund purchased $2,307,165,000 of investment securities and sold $1,076,347,000 of investment securities, other than temporary cash investments.
E. The market value of securities on loan to broker-dealers at June 30, 2007, was $44,992,000, for which the fund received cash collateral of $48,596,000.
33
Growth Index Fund
F. Capital share transactions for each class of shares were:
| Six Months Ended | Year Ended |
| June 30, 2007 | December 31, 2006 |
| Amount | Shares | Amount | Shares |
| ($000) | (000) | ($000) | (000) |
Investor Shares | | | | |
Issued | 534,697 | 17,295 | 860,936 | 30,550 |
Issued in Lieu of Cash Distributions | 27,210 | 870 | 52,211 | 1,846 |
Redeemed | (809,943) | (26,090) | (1,480,643) | (52,623) |
Net Increase (Decrease)—Investor Shares | (248,036) | (7,925) | (567,496) | (20,227) |
Admiral Shares | | | | |
Issued | 483,417 | 15,557 | 745,920 | 26,306 |
Issued in Lieu of Cash Distributions | 11,291 | 361 | 18,889 | 668 |
Redeemed | (265,769) | (8,592) | (514,026) | (18,226) |
Net Increase (Decrease)—Admiral Shares | 228,939 | 7,326 | 250,783 | 8,748 |
Signal Shares | | | | |
Issued | 862 | 29 | — | — |
Issued in Lieu of Cash Distributions | 1 | — | — | — |
Redeemed | — | — | — | — |
Net Increase (Decrease)—Signal Shares | 863 | 29 | — | — |
Institutional Shares | | | | |
Issued | 630,828 | 20,548 | 757,439 | 26,759 |
Issued in Lieu of Cash Distributions | 11,354 | 363 | 15,977 | 564 |
Redeemed | (171,727) | (5,624) | (234,066) | (8,292) |
Net Increase (Decrease)—Institutional Shares | 470,455 | 15,287 | 539,350 | 19,031 |
ETF Shares | | | | |
Issued | 851,553 | 14,339 | 985,331 | 17,746 |
Issued in Lieu of Cash Distributions | — | — | — | — |
Redeemed | (71,001) | (1,200) | (38,326) | (700) |
Net Increase (Decrease)—ETF Shares | 780,552 | 13,139 | 947,005 | 17,046 |
G. In June 2006, the Financial Accounting Standards Board issued Interpretation No. 48 (“FIN 48”), “Accounting for Uncertainty in Income Taxes.” FIN 48 establishes the minimum threshold for recognizing, and a system for measuring, the benefits of tax-return positions in financial statements, effective for the fund’s current fiscal year. Management has analyzed the fund’s tax positions taken on federal income tax returns for all open tax years (tax years ended December 31, 2004–2006) for purposes of implementing FIN 48, and has concluded that no provision for income tax is required in the fund’s financial statements.
34
Value Index Fund
Fund Profile
As of June 30, 2007
Portfolio Characteristics | | |
| | Target | Broad |
| Fund | Index1 | Index2 |
Number of Stocks | 395 | 394 | 4,921 |
Median Market Cap | $62.1B | $62.1B | $32.6B |
Price/Earnings Ratio | 14.5x | 14.5x | 18.2x |
Price/Book Ratio | 2.3x | 2.3x | 2.9x |
Yield | | 2.6% | 1.7% |
Investor Shares | 2.4% | | |
Admiral Shares | 2.5% | | |
Signal Shares | 2.5% | | |
Institutional Shares | 2.5% | | |
ETF Shares | 2.5% | | |
Return on Equity | 18.7% | 18.7% | 18.2% |
Earnings Growth Rate | 17.9% | 17.9% | 20.7% |
Foreign Holdings | 0.3% | 0.3% | 0.0% |
Turnover Rate | 12%3 | — | — |
Expense Ratio | | — | — |
Investor Shares | 0.20%3 | | |
Admiral Shares | 0.10%3 | | |
Signal Shares | 0.10%3 | | |
Institutional Shares | 0.07%3 | | |
ETF Shares | 0.11%3 | | |
Short-Term Reserves | 0% | — | — |
Sector Diversification (% of portfolio) | |
| | Target | Broad |
| Fund | Index1 | Index2 |
Consumer Discretionary | 6% | 6% | 12% |
Consumer Staples | 6 | 6 | 8 |
Energy | 15 | 15 | 10 |
Financials | 34 | 34 | 21 |
Health Care | 8 | 8 | 11 |
Industrials | 11 | 11 | 12 |
Information Technology | 3 | 3 | 15 |
Materials | 4 | 4 | 4 |
Telecommunication Services | 7 | 7 | 3 |
Utilities | 6 | 6 | 4 |
1 MSCI US Prime Market Value Index.
2 Dow Jones Wilshire 5000 Index.
3 Annualized.
4 For an explanation of R-squared, beta, and other terms used here, see the Glossary on page 76.
5 “Ten Largest Holdings” excludes any temporary cash investments and equity index products.
35
Volatility Measures4 | |
| Fund Versus | Fund Versus |
| Target Index1 | Broad Index2 |
R-Squared | 1.00 | 0.82 |
Beta | 1.00 | 0.79 |
Ten Largest Holdings5(% of total net assets) | |
| | |
ExxonMobil Corp. | integrated oil | |
| and gas | 6.5% |
General Electric Co. | industrial | |
| conglomerates | 5.3 |
AT&T Inc. | integrated | |
| telecommunication services | 3.5 |
Citigroup, Inc. | diversified | |
| financial services | 3.4 |
Bank of America Corp. | diversified | |
| financial services | 3.0 |
Pfizer Inc. | pharmaceuticals | 2.5 |
Chevron Corp. | integrated oil | |
| and gas | 2.5 |
JPMorgan Chase & Co. | diversified | |
| financial services | 2.3 |
American International | | |
Group, Inc. | multi-line insurance | 2.1 |
Altria Group, Inc. | tobacco | 2.0 |
Top Ten | | 33.1% |
Investment Focus
1 MSCI US Prime Market Value Index.
2 Dow Jones Wilshire 5000 Index.
3 Annualized.
4 For an explanation of R-squared, beta, and other terms used here, see the Glossary on page 76.
5 “Ten Largest Holdings” excludes any temporary cash investments and equity index products.
36
Value Index Fund
Performance Summary
All of the returns in this report represent past performance, which is not a guarantee of future results that may be achieved by the fund. (Current performance may be lower or higher than the performance data cited. For performance data current to the most recent month-end, visit our website at www.vanguard.com/performance.) Note, too, that both investment returns and principal value can fluctuate widely, so an investor’s shares, when sold, could be worth more or less than their original cost. The returns shown do not reflect taxes that a shareholder would pay on fund distributions or on the sale of fund shares.
Fiscal Year Total Returns (%): December 31, 1996–June 30, 2007
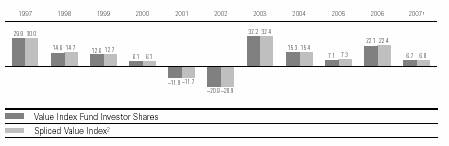
Average Annual Total Returns: Periods Ended June 30, 2007 | | | |
| | | | |
| Inception Date | One Year | Five Years | Ten Years |
Value Index Fund | | | | |
Investor Shares3 | 11/2/1992 | 22.61% | 13.20% | 8.51% |
Admiral Shares | 11/13/2000 | 22.74 | 13.31 | 6.714 |
Signal Shares | 6/4/2007 | –2.674 | — | — |
Institutional Shares | 7/2/1998 | 22.77 | 13.35 | 6.764 |
ETF Shares | 1/26/2004 | | | |
Market Price | | 22.41 | 13.784 | — |
Net Asset Value | | 22.71 | 13.824 | — |
1 Six months ended June 30, 2007.
2 S&P 500/Barra Value Index through May 16, 2003; MSCI US Prime Market Value Index thereafter.
3 Total returns do not include the account service fee that may be applicable to certain accounts with balances below $10,000.
4 Return since inception.
Note: See Financial Highlights tables on pages 39–43 for dividend and capital gains information.
37
Value Index Fund
Financial Statements (unaudited)
Statement of Net Assets
As of June 30, 2007
The fund provides a complete list of its holdings four times in each fiscal year, at the quarter-ends. For the second and fourth fiscal quarters, the lists appear in the fund’s semiannual and annual reports to shareholders. For the first and third fiscal quarters, the fund files the lists with the Securities and Exchange Commission on Form N-Q. Shareholders can look up the fund’s Forms N-Q on the SEC’s website at www.sec.gov. Forms N-Q may also be reviewed and copied at the SEC’s Public Reference Room (see the back cover of this report for further information).
| | | Market |
| | | Value• |
| | Shares | ($000) |
Common Stocks (100.0%) | | |
Consumer Discretionary (5.7%) | | |
| McDonald’s Corp. | 1,380,987 | 70,099 |
| Time Warner, Inc. | 2,357,615 | 49,604 |
| CBS Corp. | 1,206,329 | 40,195 |
| Carnival Corp. | 770,007 | 37,553 |
| Clear Channel | | |
| Communications, Inc. | 829,409 | 31,368 |
| General Motors Corp. | 798,762 | 30,193 |
| Gannett Co., Inc. | 413,582 | 22,726 |
| Fortune Brands, Inc. | 267,181 | 22,008 |
| The Gap, Inc. | 1,001,759 | 19,134 |
| Harrah’s Entertainment, Inc. | 213,449 | 18,199 |
| Mattel, Inc. | 694,028 | 17,552 |
| Whirlpool Corp. | 137,808 | 15,324 |
| Genuine Parts Co. | 300,657 | 14,913 |
| VF Corp. | 158,020 | 14,471 |
| Newell Rubbermaid, Inc. | 489,117 | 14,395 |
| Eastman Kodak Co. | 507,018 | 14,110 |
| Sherwin-Williams Co. | 202,285 | 13,446 |
| H & R Block, Inc. | 568,966 | 13,297 |
* | Wyndham Worldwide Corp. | 350,745 | 12,718 |
* | IAC/InterActiveCorp | 355,060 | 12,289 |
* | Expedia, Inc. | 390,474 | 11,437 |
| Limited Brands, Inc. | 410,686 | 11,273 |
| Darden Restaurants Inc. | 243,451 | 10,709 |
| Ford Motor Co. | 1,123,362 | 10,582 |
| Royal Caribbean Cruises, Ltd. | 244,262 | 10,498 |
| D. R. Horton, Inc. | 498,593 | 9,937 |
* | Mohawk Industries, Inc. | 96,116 | 9,688 |
| Idearc Inc. | 257,478 | 9,097 |
* | Liberty Media Corp.– | | |
| Capital Series A | 75,970 | 8,940 |
| BorgWarner, Inc. | 102,323 | 8,804 |
| Pulte Homes, Inc. | 384,454 | 8,631 |
| Hasbro, Inc. | 266,234 | 8,362 |
| Lennar Corp. Class A | 224,719 | 8,216 |
| Autoliv, Inc. | 143,402 | 8,155 |
| The Stanley Works | 131,820 | 8,001 |
| ServiceMaster Co. | 515,384 | 7,968 |
| | | | |
38
| | | Market |
| | | Value• |
| | Shares | ($000) |
| Virgin Media Inc. | 318,861 | 7,771 |
| Washington Post Co. Class B | 9,775 | 7,586 |
| Leggett & Platt, Inc. | 313,917 | 6,922 |
| Liz Claiborne, Inc. | 181,431 | 6,767 |
| Brinker International, Inc. | 215,860 | 6,318 |
| Wendy’s International, Inc. | 168,565 | 6,195 |
* | AutoNation, Inc. | 273,630 | 6,140 |
^ | New York Times Co. | | |
| Class A | 239,432 | 6,082 |
| Foot Locker, Inc. | 274,699 | 5,988 |
* | Toll Brothers, Inc. | 231,782 | 5,790 |
| Jones Apparel Group, Inc. | 191,469 | 5,409 |
| KB Home | 133,844 | 5,269 |
| Brunswick Corp. | 160,052 | 5,222 |
| Circuit City Stores, Inc. | 310,450 | 4,682 |
| Family Dollar Stores, Inc. | 127,189 | 4,365 |
| Dollar General Corp. | 192,799 | 4,226 |
| Tribune Co. | 141,695 | 4,166 |
| E.W. Scripps Co. Class A | 78,413 | 3,583 |
| Centex Corp. | 73,822 | 2,960 |
| RadioShack Corp. | 80,324 | 2,662 |
^ | The McClatchy Co. Class A | 98,958 | 2,505 |
| Boyd Gaming Corp. | 34,486 | 1,696 |
| | | 746,196 |
| Consumer Staples (6.4%) | | |
| Altria Group, Inc. | 3,702,220 | 259,674 |
| The Coca-Cola Co. | 2,391,092 | 125,078 |
| Kraft Foods Inc. | 2,888,149 | 101,807 |
| Kimberly-Clark Corp. | 805,792 | 53,899 |
| General Mills, Inc. | 609,270 | 35,594 |
| H.J. Heinz Co. | 581,663 | 27,612 |
| ConAgra Foods, Inc. | 893,144 | 23,990 |
| Sara Lee Corp. | 1,294,802 | 22,530 |
| Reynolds American Inc. | 313,107 | 20,415 |
| Bunge Ltd. | 211,366 | 17,860 |
| SuperValu Inc. | 366,738 | 16,987 |
| The Kroger Co. | 594,268 | 16,717 |
| UST, Inc. | 283,549 | 15,229 |
| Coca-Cola Enterprises, Inc. | 465,921 | 11,182 |
| Tyson Foods, Inc. | 461,176 | 10,625 |
39
Value Index Fund
| | | Market |
| | | Value• |
| | Shares | ($000) |
| Molson Coors Brewing Co. | | |
| Class B | 113,434 | 10,488 |
| Safeway, Inc. | 272,235 | 9,264 |
* | Constellation Brands, Inc. | | |
| Class A | 372,144 | 9,036 |
| The Clorox Co. | 133,713 | 8,304 |
| The Pepsi Bottling Group, Inc. | 240,243 | 8,091 |
| McCormick & Co., Inc. | 206,682 | 7,891 |
* | Smithfield Foods, Inc. | 200,523 | 6,174 |
| Hormel Foods Corp. | 134,001 | 5,005 |
| PepsiAmericas, Inc. | 114,298 | 2,807 |
| Dean Foods Co. | 82,835 | 2,640 |
| Brown-Forman Corp. Class B | 32,633 | 2,385 |
| | | 831,284 |
Energy (15.0%) | | |
| ExxonMobil Corp. | 10,114,038 | 848,366 |
| Chevron Corp. | 3,848,533 | 324,200 |
| ConocoPhillips Co. | 2,757,332 | 216,451 |
| Occidental Petroleum Corp. | 1,479,563 | 85,637 |
| Valero Energy Corp. | 1,066,478 | 78,770 |
| Marathon Oil Corp. | 1,241,062 | 74,414 |
| Devon Energy Corp. | 744,628 | 58,297 |
| Apache Corp. | 583,808 | 47,633 |
| Anadarko Petroleum Corp. | 771,013 | 40,085 |
| Spectra Energy Corp. | 1,112,127 | 28,871 |
| Hess Corp. | 446,656 | 26,335 |
| El Paso Corp. | 1,245,266 | 21,456 |
| Noble Energy, Inc. | 301,807 | 18,830 |
| Tesoro Corp. | 240,817 | 13,763 |
| Murphy Oil Corp. | 203,866 | 12,118 |
| Pioneer Natural | | |
| Resources Co. | 217,838 | 10,611 |
* | Newfield Exploration Co. | 228,152 | 10,392 |
| Chesapeake Energy Corp. | 269,952 | 9,340 |
* | Nabors Industries, Inc. | 264,296 | 8,822 |
| Patterson-UTI Energy, Inc. | 276,213 | 7,240 |
| Cimarex Energy Co. | 146,138 | 5,759 |
| Pogo Producing Co. | 103,021 | 5,232 |
| Rowan Cos., Inc. | 68,467 | 2,806 |
| | | 1,955,428 |
Financials (34.3%) | | |
| Citigroup, Inc. | 8,654,929 | 443,911 |
| Bank of America Corp. | 7,870,414 | 384,785 |
| JPMorgan Chase & Co. | 6,111,300 | 296,092 |
| American International | | |
| Group, Inc. | 3,901,116 | 273,195 |
| Wells Fargo & Co. | 5,624,227 | 197,804 |
| Wachovia Corp. | 3,361,314 | 172,267 |
| Morgan Stanley | 1,691,460 | 141,880 |
| Merrill Lynch & Co., Inc. | 1,478,690 | 123,589 |
| Fannie Mae | 1,721,362 | 112,457 |
| U.S. Bancorp | 3,115,934 | 102,670 |
| MetLife, Inc. | 1,342,043 | 86,535 |
| Freddie Mac | 1,224,842 | 74,348 |
40
| | Market |
| | Value• |
| Shares | ($000) |
Washington Mutual, Inc. | 1,656,751 | 70,644 |
The Allstate Corp. | 1,037,636 | 63,825 |
The Travelers Cos., Inc. | 1,192,683 | 63,809 |
Lehman Brothers | | |
Holdings, Inc. | 789,392 | 58,825 |
Capital One Financial Corp. | 723,627 | 56,761 |
The Hartford Financial | | |
Services Group Inc. | 565,283 | 55,686 |
The Bank of | | |
New York Co., Inc. | 1,336,169 | 55,371 |
SunTrust Banks, Inc. | 595,143 | 51,028 |
The Goldman | | |
Sachs Group, Inc. | 229,644 | 49,775 |
PNC Financial | | |
Services Group | 610,330 | 43,687 |
Regions Financial Corp. | 1,291,233 | 42,740 |
Prudential Financial, Inc. | 420,975 | 40,931 |
BB&T Corp. | 969,575 | 39,442 |
The Chubb Corp. | 726,727 | 39,345 |
Countrywide Financial Corp. | 1,041,225 | 37,849 |
ACE Ltd. | 575,692 | 35,992 |
Fifth Third Bancorp | 883,816 | 35,149 |
Lincoln National Corp. | 489,616 | 34,738 |
Loews Corp. | 671,564 | 34,236 |
National City Corp. | 1,015,737 | 33,844 |
Mellon Financial Corp. | 734,354 | 32,312 |
Marsh & McLennan Cos., Inc. | 972,869 | 30,042 |
Bear Stearns Co., Inc. | 200,812 | 28,114 |
Genworth Financial Inc. | 798,238 | 27,459 |
XL Capital Ltd. Class A | 318,690 | 26,862 |
KeyCorp | 704,583 | 24,188 |
Ameriprise Financial, Inc. | 380,055 | 24,160 |
Simon Property | | |
Group, Inc. REIT | 253,842 | 23,617 |
Equity Residential REIT | 516,440 | 23,565 |
Archstone-Smith Trust REIT | 385,463 | 22,785 |
Host Hotels & | | |
Resorts Inc. REIT | 952,859 | 22,030 |
Aon Corp. | 491,997 | 20,964 |
SLM Corp. | 360,611 | 20,764 |
Marshall & Ilsley Corp. | 405,842 | 19,330 |
CIT Group Inc. | 350,009 | 19,191 |
Vornado Realty Trust REIT | 156,404 | 17,179 |
Comerica, Inc. | 278,146 | 16,541 |
Avalonbay | | |
Communities, Inc. REIT | 138,608 | 16,478 |
Ambac Financial Group, Inc. | 186,562 | 16,266 |
Unum Group | 604,541 | 15,785 |
Compass Bancshares Inc. | 228,160 | 15,738 |
Kimco Realty Corp. REIT | 396,830 | 15,107 |
MBIA, Inc. | 237,882 | 14,801 |
Zions Bancorp | 188,397 | 14,490 |
Synovus Financial Corp. | 460,290 | 14,131 |
Sovereign Bancorp, Inc. | 667,706 | 14,115 |
Boston Properties, Inc. REIT | 134,125 | 13,698 |
41
Value Index Fund
| | Market |
| | Value• |
| Shares | ($000) |
Plum Creek | | |
Timber Co. Inc. REIT | 312,761 | 13,030 |
American Capital | | |
Strategies, Ltd. | 304,226 | 12,936 |
SL Green Realty Corp. REIT | 103,071 | 12,769 |
Everest Re Group, Ltd. | 114,979 | 12,491 |
M & T Bank Corp. | 116,344 | 12,437 |
Willis Group Holdings Ltd. | 277,421 | 12,223 |
Cincinnati Financial Corp. | 275,560 | 11,959 |
Commerce Bancorp, Inc. | 314,478 | 11,633 |
Torchmark Corp. | 173,361 | 11,615 |
Safeco Corp. | 186,527 | 11,613 |
Hudson City Bancorp, Inc. | 936,744 | 11,447 |
A.G. Edwards, Inc. | 132,814 | 11,229 |
Assurant, Inc. | 185,112 | 10,907 |
The Macerich Co. REIT | 126,752 | 10,447 |
Health Care Properties | | |
Investors REIT | 354,215 | 10,247 |
Developers Diversified | | |
Realty Corp. REIT | 192,173 | 10,129 |
Leucadia National Corp. | 286,376 | 10,095 |
iStar Financial Inc. REIT | 223,761 | 9,919 |
Axis Capital Holdings Ltd. | 238,685 | 9,703 |
W.R. Berkley Corp. | 289,809 | 9,430 |
People’s United Financial Inc. | 528,653 | 9,373 |
Janus Capital Group Inc. | 334,869 | 9,323 |
AMB Property Corp. REIT | 174,460 | 9,285 |
White Mountains | | |
Insurance Group Inc. | 15,251 | 9,242 |
Huntington Bancshares Inc. | 395,457 | 8,993 |
Fidelity National | | |
Financial, Inc. Class A | 367,381 | 8,707 |
First Horizon National Corp. | 220,757 | 8,610 |
Apartment Investment & | | |
Management Co. | | |
Class A REIT | 170,439 | 8,593 |
Regency Centers Corp. REIT | 121,566 | 8,570 |
Duke Realty Corp. REIT | 239,130 | 8,530 |
New York Community | | |
Bancorp, Inc. | 495,476 | 8,433 |
MGIC Investment Corp. | 146,704 | 8,342 |
Ventas, Inc. REIT | 229,522 | 8,320 |
^Allied Capital Corp. | 268,730 | 8,320 |
Old Republic | | |
International Corp. | 387,122 | 8,230 |
* Markel Corp. | 16,750 | 8,116 |
Northern Trust Corp. | 121,841 | 7,827 |
PartnerRe Ltd. | 100,654 | 7,801 |
Radian Group, Inc. | 140,774 | 7,602 |
Federal Realty | | |
Investment Trust REIT | 97,740 | 7,551 |
Popular, Inc. | 467,115 | 7,507 |
RenaissanceRe Holdings Ltd. | 120,964 | 7,499 |
First American Corp. | 144,675 | 7,161 |
Associated Banc-Corp. | 215,493 | 7,047 |
42
| | | Market |
| | | Value• |
| | Shares | ($000) |
| Liberty Property Trust REIT | 159,558 | 7,009 |
| The PMI Group Inc. | 153,341 | 6,850 |
| Hospitality Properties | | |
| Trust REIT | 164,682 | 6,833 |
| Camden Property Trust REIT | 99,467 | 6,661 |
| Colonial BancGroup, Inc. | 265,658 | 6,633 |
| HCC Insurance Holdings, Inc. | 196,220 | 6,556 |
| UDR, Inc. REIT | 238,573 | 6,274 |
| Public Storage, Inc. REIT | 78,895 | 6,061 |
| Nationwide Financial | | |
| Services, Inc. | 95,630 | 6,046 |
| UnionBanCal Corp. | 98,703 | 5,893 |
* | E*TRADE Financial Corp. | 263,422 | 5,819 |
| TCF Financial Corp. | 207,070 | 5,757 |
* | Arch Capital Group Ltd. | 78,698 | 5,709 |
| Protective Life Corp. | 117,342 | 5,610 |
| Weingarten Realty | | |
| Investors REIT | 135,887 | 5,585 |
* | AmeriCredit Corp. | 207,296 | 5,504 |
| City National Corp. | 71,267 | 5,423 |
| CapitalSource Inc. REIT | 205,294 | 5,048 |
| Erie Indemnity Co. Class A | 91,942 | 4,969 |
| Commerce Bancshares, Inc. | 105,080 | 4,760 |
| American Financial | | |
| Group, Inc. | 126,557 | 4,322 |
| Unitrin, Inc. | 82,944 | 4,079 |
| Astoria Financial Corp. | 156,264 | 3,913 |
| Transatlantic Holdings, Inc. | 46,608 | 3,315 |
| Federated Investors, Inc. | 83,301 | 3,193 |
| Mercury General Corp. | 48,433 | 2,669 |
| Forest City Enterprise Class A | 38,016 | 2,337 |
| BOK Financial Corp. | 41,663 | 2,226 |
| Student Loan Corp. | 7,023 | 1,432 |
| | | 4,474,649 |
Health Care (8.2%) | | |
| Pfizer Inc. | 12,729,448 | 325,492 |
| Merck & Co., Inc. | 3,832,693 | 190,868 |
| Bristol-Myers Squibb Co. | 3,565,210 | 112,518 |
| Eli Lilly & Co. | 1,797,936 | 100,469 |
| Wyeth | 1,545,866 | 88,640 |
| Abbott Laboratories | 1,361,998 | 72,935 |
* | Boston Scientific Corp. | 2,212,021 | 33,932 |
* | Biogen Idec Inc. | 305,062 | 16,321 |
| CIGNA Corp. | 190,301 | 9,937 |
* | Barr Pharmaceuticals Inc. | 178,678 | 8,975 |
* | King Pharmaceuticals, Inc. | 429,586 | 8,789 |
* | Triad Hospitals, Inc. | 155,800 | 8,376 |
| AmerisourceBergen Corp. | 167,333 | 8,278 |
| Mylan Laboratories, Inc. | 432,962 | 7,876 |
| Omnicare, Inc. | 214,299 | 7,728 |
* | Community Health | | |
| Systems, Inc. | 166,796 | 6,747 |
| Hillenbrand Industries, Inc. | 103,086 | 6,701 |
| Bausch & Lomb, Inc. | 95,804 | 6,653 |
* | Invitrogen Corp. | 85,199 | 6,283 |
43
Value Index Fund
| | | Market |
| | | Value• |
| | Shares | ($000) |
* | Charles River | | |
| Laboratories, Inc. | 118,069 | 6,095 |
* | Watson Pharmaceuticals, Inc. | 171,933 | 5,593 |
| Quest Diagnostics, Inc. | 102,617 | 5,300 |
| Applera Corp.–Applied | | |
| Biosystems Group | 162,072 | 4,950 |
| Health Management | | |
| Associates Class A | 427,916 | 4,861 |
| Beckman Coulter, Inc. | 70,948 | 4,589 |
* | Hospira, Inc. | 96,476 | 3,766 |
| | | 1,062,672 |
Industrials (10.7%) | | |
| General Electric Co. | 18,153,958 | 694,934 |
| Tyco International Ltd. | 3,488,960 | 117,892 |
| Honeywell International Inc. | 1,341,588 | 75,505 |
| Union Pacific Corp. | 454,032 | 52,282 |
| Northrop Grumman Corp. | 588,419 | 45,820 |
| Emerson Electric Co. | 704,298 | 32,961 |
| Ingersoll-Rand Co. | 541,600 | 29,691 |
| Raytheon Co. | 511,977 | 27,590 |
| Eaton Corp. | 262,951 | 24,454 |
| Parker Hannifin Corp. | 204,494 | 20,022 |
| Masco Corp. | 695,830 | 19,810 |
| Rockwell Automation, Inc. | 277,838 | 19,293 |
| Dover Corp. | 360,407 | 18,435 |
| Norfolk Southern Corp. | 350,356 | 18,418 |
| Waste Management, Inc. | 470,938 | 18,390 |
| Cooper Industries, Inc. | | |
| Class A | 322,085 | 18,388 |
| Deere & Co. | 140,153 | 16,922 |
| R.R. Donnelley & Sons Co. | 382,639 | 16,649 |
| Manpower Inc. | 149,941 | 13,831 |
| Goodrich Corp. | 210,477 | 12,536 |
| W.W. Grainger, Inc. | 126,267 | 11,749 |
| Avery Dennison Corp. | 174,590 | 11,607 |
| Cintas Corp. | 254,070 | 10,018 |
| Pitney Bowes, Inc. | 196,004 | 9,177 |
| SPX Corp. | 101,201 | 8,886 |
| Oshkosh Truck Corp. | 130,784 | 8,229 |
* | UAL Corp. | 195,394 | 7,931 |
* | Allied Waste Industries, Inc. | 589,058 | 7,929 |
| Pentair, Inc. | 167,476 | 6,460 |
| Republic Services, Inc. | | |
| Class A | 171,019 | 5,240 |
| Pall Corp. | 107,934 | 4,964 |
* | US Airways Group Inc. | 145,473 | 4,403 |
* | Owens Corning Inc. | 90,501 | 3,044 |
* | Raytheon Co. Warrants | | |
| Exp. 6/16/11 | 9,836 | 181 |
| | | 1,393,641 |
Information Technology (3.0%) | | |
| International Business | | |
| Machines Corp. | 930,238 | 97,908 |
| Hewlett-Packard Co. | 1,668,588 | 74,452 |
44
| | | Market |
| | | Value• |
| | Shares | ($000) |
| Electronic Data | | |
| Systems Corp. | 913,021 | 25,318 |
| Seagate Technology | 967,681 | 21,066 |
* | Xerox Corp. | 1,088,271 | 20,111 |
* | Computer Sciences Corp. | 303,023 | 17,924 |
| Microchip Technology, Inc. | 381,786 | 14,141 |
| Fidelity National | | |
| Information Services, Inc. | 217,912 | 11,828 |
* | Flextronics International Ltd. | 1,071,920 | 11,577 |
* | LSI Corp. | 1,363,824 | 10,242 |
| Maxim Integrated | | |
| Products, Inc. | 283,261 | 9,464 |
* | Arrow Electronics, Inc. | 217,361 | 8,353 |
* | Tellabs, Inc. | 734,844 | 7,907 |
| Intersil Corp. | 244,543 | 7,693 |
* | Western Digital Corp. | 393,042 | 7,605 |
* | Cadence Design | | |
| Systems, Inc. | 321,513 | 7,060 |
* | Solectron Corp. | 1,594,881 | 5,869 |
* | Ingram Micro, Inc. Class A | 269,347 | 5,848 |
* | Compuware Corp. | 372,470 | 4,417 |
| Molex, Inc. Class A | 142,046 | 3,771 |
| Jabil Circuit, Inc. | 168,965 | 3,729 |
* | Avnet, Inc. | 91,541 | 3,629 |
* | Lexmark International, Inc. | 60,694 | 2,993 |
| AVX Corp. | 91,108 | 1,525 |
| | | 384,430 |
Materials (4.1%) | | |
| E.I. du Pont de | | |
| Nemours & Co. | 1,631,456 | 82,943 |
| Dow Chemical Co. | 1,693,320 | 74,879 |
| Alcoa Inc. | 1,535,082 | 62,217 |
| Freeport-McMoRan | | |
| Copper & Gold, Inc. | | |
| Class B | 662,696 | 54,884 |
| International Paper Co. | 762,954 | 29,793 |
| Weyerhaeuser Co. | 372,570 | 29,407 |
| United States Steel Corp. | 209,161 | 22,746 |
| PPG Industries, Inc. | 289,392 | 22,026 |
| Air Products & | | |
| Chemicals, Inc. | 248,231 | 19,950 |
| Lyondell Chemical Co. | 395,565 | 14,683 |
| Rohm & Haas Co. | 250,562 | 13,701 |
| Vulcan Materials Co. | 109,096 | 12,496 |
| Temple-Inland Inc. | 185,858 | 11,436 |
| MeadWestvaco Corp. | 320,294 | 11,313 |
* | Domtar Corp. | 916,285 | 10,226 |
| Celanese Corp. Series A | 249,627 | 9,681 |
| Eastman Chemical Co. | 147,496 | 9,488 |
| International Flavors & | | |
| Fragrances, Inc. | 143,019 | 7,457 |
| Sonoco Products Co. | 167,258 | 7,160 |
| Sigma-Aldrich Corp. | 151,434 | 6,462 |
| Ashland, Inc. | 99,776 | 6,381 |
| Bemis Co., Inc. | 184,871 | 6,134 |
45
Value Index Fund
| | | Market | |
| | | Value• | |
| | Shares | ($000) | |
* | Smurfit-Stone Container Corp. | 449,503 | 5,983 | |
| Steel Dynamics, Inc. | 56,638 | 2,374 | |
| Huntsman Corp. | 87,681 | 2,132 | |
| | | 535,952 | |
Telecommunication Services (6.7%) | | |
| AT&T Inc. | 11,023,466 | 457,474 | |
| Verizon Communications Inc. | 5,140,895 | 211,651 |
| Sprint Nextel Corp. | 4,903,390 | 101,549 | |
| Alltel Corp. | 635,909 | 42,956 | |
| Embarq Corp. | 263,906 | 16,724 | |
| Windstream Corp. | 841,620 | 12,422 | |
| CenturyTel, Inc. | 192,610 | 9,448 | |
| Citizens Communications Co. | 598,597 | 9,141 | |
| Telephone & | | | |
| Data Systems, Inc. | 90,851 | 5,685 | |
| Telephone & | | | |
| Data Systems, Inc.– | | | |
| Special Common Shares | 92,003 | 5,295 | |
| | | 872,345 | |
Utilities (5.9%) | | | |
| Exelon Corp. | 1,183,089 | 85,892 | |
| Dominion Resources, Inc. | 624,443 | 53,896 | |
| Southern Co. | 1,321,578 | 45,317 | |
| Duke Energy Corp. | 2,215,986 | 40,553 | |
| Public Service | | | |
| Enterprise Group, Inc. | 446,308 | 39,177 | |
| FPL Group, Inc. | 680,223 | 38,596 | |
| Entergy Corp. | 357,831 | 38,413 | |
| FirstEnergy Corp. | 538,023 | 34,826 | |
| PPL Corp. | 673,526 | 31,514 | |
| American Electric | | | |
| Power Co., Inc. | 698,318 | 31,452 | |
| Edison International | 546,420 | 30,665 | |
| PG&E Corp. | 629,727 | 28,527 | |
| Sempra Energy | 441,153 | 26,129 | |
| Consolidated Edison Inc. | 477,575 | 21,548 | |
| Progress Energy, Inc. | 429,305 | 19,572 | |
| Ameren Corp. | 364,636 | 17,871 | |
| DTE Energy Co. | 313,990 | 15,141 | |
| Xcel Energy, Inc. | 719,543 | 14,729 | |
| KeySpan Corp. | 309,832 | 13,007 | |
| NiSource, Inc. | 483,773 | 10,019 | |
| Pepco Holdings, Inc. | 337,771 | 9,525 | |
| ONEOK, Inc. | 184,633 | 9,307 | |
| Wisconsin Energy Corp. | 206,477 | 9,132 | |
| CenterPoint Energy Inc. | 524,584 | 9,128 | |
| MDU Resources Group, Inc. | 288,398 | 8,087 | |
| Alliant Energy Corp. | 204,834 | 7,958 | |
| Northeast Utilities | 272,666 | 7,733 | |
| SCANA Corp. | 195,742 | 7,495 | |
* | Reliant Energy, Inc. | 272,624 | 7,347 | |
| Energy East Corp. | 277,640 | 7,244 | |
| | | | | |
46
| | | Market |
| | | Value• |
| | Shares | ($000) |
| Pinnacle West Capital Corp. | 176,667 | 7,040 | |
| Integrys Energy Group, Inc. | 132,220 | 6,708 | |
| TECO Energy, Inc. | 368,918 | 6,338 | |
| NSTAR | 188,344 | 6,112 |
| DPL Inc. | 199,577 | 5,656 |
* | Dynegy, Inc. | 564,951 | 5,333 |
| Equitable Resources, Inc. | 101,868 | 5,049 |
| | | 762,036 |
Total Common Stocks | | |
(Cost $10,285,104) | | 13,018,633 |
Temporary Cash Investments (0.1%) | |
Money Market Fund (0.1%) | | |
1 | Vanguard Market | | |
| Liquidity Fund, | | |
| 5.281%—Note E | 13,502,300 | 13,502 |
1 | Vanguard Market | | |
| Liquidity Fund, 5.281% | 4,872,166 | 4,872 |
Total Temporary Cash Investments | |
(Cost $18,374) | | 18,374 |
Total Investments (100.1%) | | |
(Cost $10,303,478) | | 13,037,007 |
Other Assets and Liabilities (–0.1%) | |
Other Assets—Note B | | 99,295 |
Liabilities—Note E | | (112,685) |
| | | (13,390) |
Net Assets (100%) | | 13,023,617 |
| | | | | | | |
47
Value Index Fund
At June 30, 2007, net assets consisted of:2 |
| Amount |
| ($000) |
Paid-in Capital | 11,056,744 |
Undistributed Net Investment Income | 2,572 |
Accumulated Net Realized Losses | (769,228) |
Unrealized Appreciation | 2,733,529 |
Net Assets | 13,023,617 |
| |
| |
Investor Shares—Net Assets | |
Applicable to 173,113,962 outstanding | |
$.001 par value shares of beneficial | |
interest (unlimited authorization) | 4,854,145 |
Net Asset Value Per Share— | |
Investor Shares | $28.04 |
| |
| |
Admiral Shares—Net Assets | |
Applicable to 107,606,966 outstanding | |
$.001 par value shares of beneficial | |
interest (unlimited authorization) | 3,017,409 |
Net Asset Value Per Share— | |
Admiral Shares | $28.04 |
| |
| |
Signal Shares—Net Assets | |
Applicable to 209,730 outstanding | |
$.001 par value shares of beneficial | |
interest (unlimited authorization) | 6,120 |
Net Asset Value Per Share— | |
Signal Shares | $29.18 |
| |
| |
Institutional Shares—Net Assets | |
Applicable to 104,346,223 outstanding | |
$.001 par value shares of beneficial | |
interest (unlimited authorization) | 2,926,057 |
Net Asset Value Per Share— | |
Institutional Shares | $28.04 |
| |
| |
ETF Shares—Net Assets | |
Applicable to 30,877,758 outstanding | |
$.001 par value shares of beneficial | |
interest (unlimited authorization) | 2,219,886 |
Net Asset Value Per Share— | |
ETF Shares | $71.89 |
• See Note A in Notes to Financial Statements.
* Non-income-producing security.
^ Part of security position is on loan to broker-dealers. See Note E in Notes to Financial Statements.
1 Affiliated money market fund available only to Vanguard funds and certain trusts and accounts managed by Vanguard. Rate shown is the 7-day yield.
2 See Note C in Notes to Financial Statements for the tax-basis components of net assets.
REIT—Real Estate Investment Trust.
48
Value Index Fund
Statement of Operations
| Six Months Ended |
| June 30, 2007 |
| ($000) |
Investment Income | |
Income | |
Dividends | 157,294 |
Interest1 | 454 |
Security Lending | 380 |
Total Income | 158,128 |
Expenses | |
The Vanguard Group—Note B | |
Investment Advisory Services | 226 |
Management and Administrative—Investor Shares | 3,902 |
Management and Administrative—Admiral Shares | 1,065 |
Management and Administrative—Signal Shares | — |
Management and Administrative—Institutional Shares | 519 |
Management and Administrative—ETF Shares | 713 |
Marketing and Distribution—Investor Shares | 536 |
Marketing and Distribution—Admiral Shares | 255 |
Marketing and Distribution—Signal Shares | — |
Marketing and Distribution—Institutional Shares | 314 |
Marketing and Distribution—ETF Shares | 234 |
Custodian Fees | 163 |
Shareholders’ Reports—Investor Shares | 63 |
Shareholders’ Reports—Admiral Shares | 4 |
Shareholders’ Reports—Signal Shares | — |
Shareholders’ Reports—Institutional Shares | 1 |
Shareholders’ Reports—ETF Shares | 5 |
Trustees’ Fees and Expenses | 7 |
Total Expenses | 8,007 |
Net Investment Income | 150,121 |
Realized Net Gain (Loss) on Investment Securities Sold | 193,668 |
Change in Unrealized Appreciation (Depreciation) of Investment Securities | 443,614 |
Net Increase (Decrease) in Net Assets Resulting from Operations | 787,403 |
1 Interest income from an affiliated company of the fund was $454,000.
49
Value Index Fund
Statement of Changes in Net Assets
| Six Months Ended | Year Ended |
| June 30, | December 31, |
| 2007 | 2006 |
| ($000) | ($000) |
Increase (Decrease) in Net Assets | | |
Operations | | |
Net Investment Income | 150,121 | 215,630 |
Realized Net Gain (Loss) | 193,668 | 331,789 |
Change in Unrealized Appreciation (Depreciation) | 443,614 | 1,209,630 |
Net Increase (Decrease) in Net Assets Resulting from Operations | 787,403 | 1,757,049 |
Distributions | | |
Net Investment Income | | |
Investor Shares | (51,494) | (92,045) |
Admiral Shares | (33,157) | (56,265) |
Signal Shares | (33) | — |
Institutional Shares | (31,059) | (42,009) |
ETF Shares | (23,243) | (29,028) |
Realized Capital Gain | | |
Investor Shares | — | — |
Admiral Shares | — | — |
Signal Shares | — | — |
Institutional Shares | — | — |
ETF Shares | — | — |
Total Distributions | (138,986) | (219,347) |
Capital Share Transactions—Note F | | |
Investor Shares | 184,621 | 368,080 |
Admiral Shares | 241,804 | 356,285 |
Signal Shares | 6,280 | — |
Institutional Shares | 575,298 | 701,714 |
ETF Shares | 470,919 | 853,064 |
Net Increase (Decrease) from Capital Share Transactions | 1,478,922 | 2,279,143 |
Total Increase (Decrease) | 2,127,339 | 3,816,845 |
Net Assets | | |
Beginning of Period | 10,896,278 | 7,079,433 |
End of Period1 | 13,023,617 | 10,896,278 |
1 Net Assets—End of Period includes undistributed (overdistributed) net investment income of $2,572,000 and ($8,677,000).
50
Value Index Fund
Financial Highlights
Investor Shares | | | | | | |
| | | | | | |
| Six Months | | | | | |
| Ended | | | |
For a Share Outstanding | June 30, | | Year Ended December 31, |
Throughout Each Period | 2007 | 2006 | 2005 | 2004 | 2003 | 2002 |
Net Asset Value, Beginning of Period | $26.58 | $22.29 | $21.35 | $18.95 | $14.65 | $18.90 |
Investment Operations | | | | | | |
Net Investment Income | .33 | .586 | .559 | .460 | .378 | .303 |
Net Realized and Unrealized | | | | | | |
Gain (Loss) on Investments | 1.43 | 4.295 | .936 | 2.399 | 4.294 | (4.238) |
Total from Investment Operations | 1.76 | 4.881 | 1.495 | 2.859 | 4.672 | (3.935) |
Distributions | | | | | | |
Dividends from Net Investment Income | (.30) | (.591) | (.555) | (.459) | (.372) | (.315) |
Distributions from Realized Capital Gains | — | — | — | — | — | — |
Total Distributions | (.30) | (.591) | (.555) | (.459) | (.372) | (.315) |
Net Asset Value, End of Period | $28.04 | $26.58 | $22.29 | $21.35 | $18.95 | $14.65 |
| | | | | | |
| | | | | | |
Total Return1 | 6.65% | 22.15% | 7.09% | 15.29% | 32.25% | –20.91% |
| | | | | | |
| | | | | | |
Ratios/Supplemental Data | | | | | | |
Net Assets, End of Period (Millions) | $4,854 | $4,417 | $3,376 | $3,592 | $2,921 | $2,197 |
Ratio of Total Expenses to | | | | | | |
Average Net Assets | 0.20%* | 0.21% | 0.21% | 0.21% | 0.23% | 0.23% |
Ratio of Net Investment Income to | | | | | | |
Average Net Assets | 2.41%* | 2.48% | 2.63% | 2.40% | 2.38% | 1.80% |
Portfolio Turnover Rate2 | 12%* | 20% | 21% | 18% | 44%3 | 26% |
| | | | | | | | |
1 Total returns do not include the account service fee that may be applicable to certain accounts with balances below $10,000.
2 Excludes the value of portfolio securities received or delivered as a result of in-kind purchases or redemptions of the fund’s capital shares, including ETF Creation Units.
3 Includes activity related to a change in the fund’s target index.
* Annualized.
51
Value Index Fund
Admiral Shares | | | | | | |
| | | | | | |
| Six Months | | | | | |
| Ended | | | |
For a Share Outstanding | June 30, | | Year Ended December 31, |
Throughout Each Period | 2007 | 2006 | 2005 | 2004 | 2003 | 2002 |
Net Asset Value, Beginning of Period | $26.58 | $22.29 | $21.35 | $18.95 | $14.65 | $18.90 |
Investment Operations | | | | | | |
Net Investment Income | .340 | .611 | .581 | .479 | .392 | .315 |
Net Realized and Unrealized | | | | | | |
Gain (Loss) on Investments | 1.434 | 4.295 | .936 | 2.399 | 4.294 | (4.238) |
Total from Investment Operations | 1.774 | 4.906 | 1.517 | 2.878 | 4.686 | (3.923) |
Distributions | | | | | | |
Dividends from Net Investment Income | (.314) | (.616) | (.577) | (.478) | (.386) | (.327) |
Distributions from Realized Capital Gains | — | — | — | — | — | — |
Total Distributions | (.314) | (.616) | (.577) | (.478) | (.386) | (.327) |
Net Asset Value, End of Period | $28.04 | $26.58 | $22.29 | $21.35 | $18.95 | $14.65 |
| | | | | | |
| | | | | | |
Total Return | 6.71% | 22.27% | 7.20% | 15.40% | 32.36% | –20.85% |
| | | | | | |
| | | | | | |
Ratios/Supplemental Data | | | | | | |
Net Assets, End of Period (Millions) | $3,017 | $2,625 | $1,880 | $1,075 | $773 | $480 |
Ratio of Total Expenses to | | | | | | |
Average Net Assets | 0.10%* | 0.11% | 0.11% | 0.11% | 0.15% | 0.15% |
Ratio of Net Investment Income to | | | | | | |
Average Net Assets | 2.51%* | 2.58% | 2.72% | 2.50% | 2.48% | 1.88% |
Portfolio Turnover Rate1 | 12%* | 20% | 21% | 18% | 44%2 | 26% |
| | | | | | | | |
1 Excludes the value of portfolio securities received or delivered as a result of in-kind purchases or redemptions of the fund’s capital shares, including ETF Creation Units.
2 Includes activity related to a change in the fund’s target index.
* Annualized.
52
Value Index Fund
Signal Shares | |
| June 4, 20071 to |
For a Share Outstanding Throughout the Period | June 30, 2007 |
Net Asset Value, Beginning of Period | $30.14 |
Investment Operations | |
Net Investment Income | .057 |
Net Realized and Unrealized Gain (Loss) on Investments | (.861) |
Total from Investment Operations | (.804) |
Distributions | |
Dividends from Net Investment Income | (.156) |
Distributions from Realized Capital Gains | — |
Total Distributions | (.156) |
Net Asset Value, End of Period | $29.18 |
| |
| |
Total Return | –2.67% |
| |
| |
Ratios/Supplemental Data | |
Net Assets, End of Period (Millions) | $6 |
Ratio of Total Expenses to Average Net Assets | 0.10%* |
Ratio of Net Investment Income to Average Net Assets | 2.51%* |
Portfolio Turnover Rate2 | 12%* |
1 Inception.
2 Excludes the value of portfolio securities received or delivered as a result of in-kind purchases or redemptions of the fund’s capital shares, including ETF Creation Units.
* Annualized.
53
Value Index Fund
Institutional Shares | | | | | | |
| | | | | | |
| Six Months | | | | | |
| Ended | | | |
For a Share Outstanding | June 30, | | Year Ended December 31, |
Throughout Each Period | 2007 | 2006 | 2005 | 2004 | 2003 | 2002 |
Net Asset Value, Beginning of Period | $26.58 | $22.29 | $21.35 | $18.95 | $14.65 | $18.90 |
Investment Operations | | | | | | |
Net Investment Income | .344 | .618 | .588 | .485 | .400 | .322 |
Net Realized and Unrealized Gain (Loss) | | | | | | |
on Investments | 1.434 | 4.295 | .936 | 2.399 | 4.294 | (4.238) |
Total from Investment Operations | 1.778 | 4.913 | 1.524 | 2.884 | 4.694 | (3.916) |
Distributions | | | | | | |
Dividends from Net Investment Income | (.318) | (.623) | (.584) | (.484) | (.394) | (.334) |
Distributions from Realized Capital Gains | — | — | — | — | — | — |
Total Distributions | (.318) | (.623) | (.584) | (.484) | (.394) | (.334) |
Net Asset Value, End of Period | $28.04 | $26.58 | $22.29 | $21.35 | $18.95 | $14.65 |
| | | | | | |
| | | | | | |
Total Return | 6.72% | 22.31% | 7.23% | 15.43% | 32.42% | –20.81% |
| | | | | | |
| | | | | | |
Ratios/Supplemental Data | | | | | | |
Net Assets, End of Period (Millions) | $2,926 | $2,209 | $1,224 | $807 | $534 | $494 |
Ratio of Total Expenses to | | | | | | |
Average Net Assets | 0.07%* | 0.08% | 0.08% | 0.08% | 0.10% | 0.10% |
Ratio of Net Investment Income to | | | | | | |
Average Net Assets | 2.54%* | 2.61% | 2.76% | 2.53% | 2.46% | 1.91% |
Portfolio Turnover Rate1 | 12%* | 20% | 21% | 18% | 44%2 | 26% |
| | | | | | | | | |
1 Excludes the value of portfolio securities received or delivered as a result of in-kind purchases or redemptions of the fund’s capital shares, including ETF Creation Units.
2 Includes activity related to a change in the fund’s target index.
* Annualized.
54
Value Index Fund
ETF Shares | | | | |
| | | | |
| Six Months | | Jan. 26, |
| Ended | Year Ended | 20041 to |
| June 30, | December 31, | Dec. 31, |
For a Share Outstanding Throughout Each Period | 2007 | 2006 | 2005 | 2004 |
Net Asset Value, Beginning of Period | $68.14 | $57.14 | $54.74 | $50.34 |
Investment Operations | | | | |
Net Investment Income | .872 | 1.565 | 1.489 | 1.184 |
Net Realized and Unrealized Gain (Loss) on Investments | 3.683 | 11.016 | 2.392 | 4.437 |
Total from Investment Operations | 4.555 | 12.581 | 3.881 | 5.621 |
Distributions | | | | |
Dividends from Net Investment Income | (.805) | (1.581) | (1.481) | (1.221) |
Distributions from Realized Capital Gains | — | — | — | — |
Total Distributions | (.805) | (1.581) | (1.481) | (1.221) |
Net Asset Value, End of Period | $71.89 | $68.14 | $57.14 | $54.74 |
| | | | |
| | | | |
Total Return | 6.72% | 22.28% | 7.19% | 11.37% |
| | | | |
| | | | |
Ratios/Supplemental Data | | | | |
Net Assets, End of Period (Millions) | $2,220 | $1,646 | $600 | $406 |
Ratio of Total Expenses to Average Net Assets | 0.11%* | 0.11% | 0.11% | 0.15%* |
Ratio of Net Investment Income to Average Net Assets | 2.50%* | 2.58% | 2.72% | 2.46%* |
Portfolio Turnover Rate2 | 12%* | 20% | 21% | 18% |
1 Inception.
2 Excludes the value of portfolio securities received or delivered as a result of in-kind purchases or redemptions of the fund’s capital shares, including ETF Creation Units.
* Annualized.
See accompanying Notes, which are an integral part of the Financial Statements.
55
Value Index Fund
Notes to Financial Statements
Vanguard Value Index Fund is registered under the Investment Company Act of 1940 as an open-end investment company, or mutual fund. The fund offers five classes of shares: Investor Shares, Admiral Shares, Signal Shares, Institutional Shares, and ETF Shares. Investor Shares are available to any investor who meets the fund’s minimum purchase requirements. Admiral Shares are designed for investors who meet certain administrative, service, tenure, and account-size criteria. Signal Shares are designed for institutional investors who meet certain administrative, service, and account-size criteria. Signal Shares were first issued on June 4, 2007. Institutional Shares are designed for investors who meet certain administrative and service criteria and invest a minimum of $5 million. ETF Shares are listed for trading on the American Stock Exchange; they can be purchased and sold through a broker.
A. The following significant accounting policies conform to generally accepted accounting principles for U.S. mutual funds. The fund consistently follows such policies in preparing its financial statements.
1. Security Valuation: Securities are valued as of the close of trading on the New York Stock Exchange (generally 4 p.m., Eastern time) on the valuation date. Equity securities are valued at the latest quoted sales prices or official closing prices taken from the primary market in which each security trades; such securities not traded on the valuation date are valued at the mean of the latest quoted bid and asked prices. Securities for which market quotations are not readily available, or whose values have been materially affected by events occurring before the fund’s pricing time but after the close of the securities’ primary markets, are valued by methods deemed by the board of trustees to represent fair value. Investments in Vanguard Market Liquidity Fund are valued at that fund’s net asset value.
2. Federal Income Taxes: The fund intends to continue to qualify as a regulated investment company and distribute all of its taxable income. Accordingly, no provision for federal income taxes is required in the financial statements.
3. Distributions: Distributions to shareholders are recorded on the ex-dividend date.
4. Security Lending: The fund may lend its securities to qualified institutional borrowers to earn additional income. Security loans are required to be secured at all times by collateral at least equal to the market value of securities loaned. The fund invests cash collateral received in Vanguard Market Liquidity Fund, and records a liability for the return of the collateral, during the period the securities are on loan. Security lending income represents the income earned on investing cash collateral, less expenses associated with the loan.
5. Other: Dividend income is recorded on the ex-dividend date. Interest income includes income distributions received from Vanguard Market Liquidity Fund and is accrued daily. Security transactions are accounted for on the date securities are bought or sold. Costs used to determine realized gains (losses) on the sale of investment securities are those of the specific securities sold.
Each class of shares has equal rights as to assets and earnings, except that each class separately bears certain class-specific expenses related to maintenance of shareholder accounts (included in Management and Administrative expenses) and shareholder reporting. Marketing and distribution expenses are allocated to each class of shares based on a method approved by the board of trustees. Income, other non-class-specific expenses, and gains and losses on investments are allocated to each class of shares based on its relative net assets.
56
Value Index Fund
B. The Vanguard Group furnishes at cost investment advisory, corporate management, administrative, marketing, and distribution services. The costs of such services are allocated to the fund under methods approved by the board of trustees. The fund has committed to provide up to 0.40% of its net assets in capital contributions to Vanguard. At June 30, 2007, the fund had contributed capital of $1,148,000 to Vanguard (included in Other Assets), representing 0.01% of the fund’s net assets and 1.15% of Vanguard’s capitalization. The fund’s trustees and officers are also directors and officers of Vanguard.
C. Distributions are determined on a tax basis and may differ from net investment income and realized capital gains for financial reporting purposes. Differences may be permanent or temporary. Permanent differences are reclassified among capital accounts in the financial statements to reflect their tax character. Temporary differences arise when certain items of income, expense, gain, or loss are recognized in different periods for financial statement and tax purposes; these differences will reverse at some time in the future. Differences in classification may also result from the treatment of short-term gains as ordinary income for tax purposes.
During the six months ended June 30, 2007, the fund realized $204,629,000 of net capital gains resulting from in-kind redemptions—in which shareholders exchanged fund shares for securities held by the fund rather than for cash. Because such gains are not taxable to the fund, and are not distributed to shareholders, they have been reclassified from accumulated net realized losses to paid-in capital.
The fund’s tax-basis capital gains and losses are determined only at the end of each fiscal year. For tax purposes, at December 31, 2006, the fund had available realized losses of $757,542,000 to offset future net capital gains of $125,066,000 through December 31, 2010, $503,996,000 through December 31, 2011, $40,920,000 through December 31, 2014, and $87,560,000 through December 31, 2015. The fund will use these capital losses to offset net taxable capital gains, if any, realized during the year ending December 31, 2007; should the fund realize net capital losses for the year, the losses will be added to the loss carryforward balances above.
At June 30, 2007, the cost of investment securities for tax purposes was $10,303,478,000. Net unrealized appreciation of investment securities for tax purposes was $2,733,529,000, consisting of unrealized gains of $2,812,905,000 on securities that had risen in value since their purchase and $79,376,000 in unrealized losses on securities that had fallen in value since their purchase.
D. During the six months ended June 30, 2007, the fund purchased $2,737,280,000 of investment securities and sold $1,244,823,000 of investment securities, other than temporary cash investments.
E. The market value of securities on loan to broker-dealers at June 30, 2007, was $13,028,000, for which the fund received cash collateral of $13,502,000.
57
Value Index Fund
F. Capital share transactions for each class of shares were:
| Six Months Ended | Year Ended |
| June 30, 2007 | December 31, 2006 |
| Amount | Shares | Amount | Shares |
| ($000) | (000) | ($000) | (000) |
Investor Shares | | | | |
Issued | 737,293 | 27,063 | 1,129,396 | 46,421 |
Issued in Lieu of Cash Distributions | 48,491 | 1,771 | 86,280 | 3,512 |
Redeemed | (601,163) | (21,907) | (847,596) | (35,218) |
Net Increase (Decrease)—Investor Shares | 184,621 | 6,927 | 368,080 | 14,715 |
Admiral Shares | | | | |
Issued | 534,483 | 19,537 | 835,495 | 34,242 |
Issued in Lieu of Cash Distributions | 28,857 | 1,053 | 48,464 | 1,973 |
Redeemed | (321,536) | (11,741) | (527,674) | (21,810) |
Net Increase (Decrease)—Admiral Shares | 241,804 | 8,849 | 356,285 | 14,405 |
Signal Shares | | | | |
Issued | 6,249 | 209 | — | — |
Issued in Lieu of Cash Distributions | 31 | 1 | — | — |
Redeemed | — | — | — | — |
Net Increase (Decrease)—Signal Shares | 6,280 | 210 | — | — |
Institutional Shares | | | | |
Issued | 724,614 | 26,744 | 834,468 | 33,733 |
Issued in Lieu of Cash Distributions | 25,482 | 929 | 31,444 | 1,273 |
Redeemed | (174,798) | (6,429) | (164,198) | (6,802) |
Net Increase (Decrease)—Institutional Shares | 575,298 | 21,244 | 701,714 | 28,204 |
ETF Shares | | | | |
Issued | 1,015,110 | 14,224 | 2,040,089 | 32,352 |
Issued in Lieu of Cash Distributions | — | — | — | — |
Redeemed | (544,191) | (7,500) | (1,187,025) | (18,700) |
Net Increase (Decrease)—ETF Shares | 470,919 | 6,724 | 853,064 | 13,652 |
G. In June 2006, the Financial Accounting Standards Board issued Interpretation No. 48 (“FIN 48”), “Accounting for Uncertainty in Income Taxes.” FIN 48 establishes the minimum threshold for recognizing, and a system for measuring, the benefits of tax-return positions in financial statements, effective for the fund’s current fiscal year. Management has analyzed the fund’s tax positions taken on federal income tax returns for all open tax years (tax years ended December 31, 2004–2006) for purposes of implementing FIN 48, and has concluded that no provision for income tax is required in the fund’s financial statements.
58
Large-Cap Index Fund
Fund Profile
As of June 30, 2007
Portfolio Characteristics | | |
| | Target | Broad |
| Fund | Index1 | Index2 |
Number of Stocks | 752 | 751 | 4,921 |
Median Market Cap | $47.0B | $47.0B | $32.6B |
Price/Earnings Ratio | 17.5x | 17.5x | 18.2x |
Price/Book Ratio | 2.9x | 2.9x | 2.9x |
Yield | | 1.8% | 1.7% |
Investor Shares | 1.6% | | |
Admiral Shares | 1.7% | | |
Institutional Shares | 1.7% | | |
ETF Shares | 1.7% | | |
Return on Equity | 19.1% | 19.1% | 18.2% |
Earnings Growth Rate | 21.1% | 21.1% | 20.7% |
Foreign Holdings | 0.4% | 0.4% | 0.0% |
Turnover Rate | 6%3 | — | — |
Expense Ratio | | — | — |
Investor Shares | 0.20%3 | | |
Admiral Shares | 0.10%3 | | |
Institutional Shares | 0.08%3 | | |
ETF Shares | 0.07%3 | | |
Short-Term Reserves | 0% | — | — |
Sector Diversification (% of portfolio) | |
| | Target | Broad |
| Fund | Index1 | Index2 |
Consumer Discretionary | 11% | 11% | 12% |
Consumer Staples | 9 | 9 | 8 |
Energy | 11 | 11 | 10 |
Financials | 21 | 21 | 21 |
Health Care | 11 | 11 | 11 |
Industrials | 11 | 11 | 12 |
Information Technology | 15 | 15 | 15 |
Materials | 3 | 3 | 4 |
Telecommunication Services | 4 | 4 | 3 |
Utilities | 4 | 4 | 4 |
Volatility Measures4 | |
| Fund Versus | Fund Versus |
| Target Index1 | Broad Index2 |
R-Squared | 1.00 | 0.98 |
Beta | 1.00 | 0.93 |
Ten Largest Holdings5 (% of total net assets) |
| | |
ExxonMobil Corp. | integrated oil | |
| and gas | 3.3% |
General Electric Co. | industrial | |
| conglomerates | 2.7 |
Microsoft Corp. | systems software | 1.8 |
AT&T Inc. | integrated | |
| telecommunication | |
| services | 1.8 |
Citigroup, Inc. | diversified financial | |
| services | 1.7 |
Bank of America Corp. | diversified financial | |
| services | 1.5 |
The Procter & Gamble Co. | household products | 1.3 |
Pfizer Inc. | pharmaceuticals | 1.3 |
Chevron Corp. | integrated oil | |
| and gas | 1.2 |
Johnson & Johnson | pharmaceuticals | 1.2 |
Top Ten | | 17.8% |
Investment Focus
1 MSCI US Prime Market 750 Index.
2 Dow Jones Wilshire 5000 Index.
3 Annualized.
4 For an explanation of R-squared, beta, and other terms used here, see the Glossary on page 76.
5 “Ten Largest Holdings” excludes any temporary cash investments and equity index products.
59
Large-Cap Index Fund
Performance Summary
All of the returns in this report represent past performance, which is not a guarantee of future results that may be achieved by the fund. (Current performance may be lower or higher than the performance data cited. For performance data current to the most recent month-end, visit our website at www.vanguard.com/performance.) Note, too, that both investment returns and principal value can fluctuate widely, so an investor’s shares, when sold, could be worth more or less than their original cost. The returns shown do not reflect taxes that a shareholder would pay on fund distributions or on the sale of fund shares.
Fiscal-Year Total Returns (%): January 30, 2004–June 30, 2007
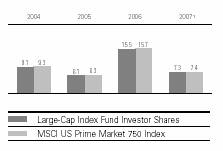
Average Annual Total Returns: Periods Ended June 30, 2007 | | |
| | | |
| Inception Date | One Year | Since Inception |
Large-Cap Index Fund | | | |
Investor Shares2 | 1/30/2004 | 20.58% | 11.15% |
Admiral Shares | 2/2/2004 | 20.67 | 11.16 |
Institutional Shares | 6/30/2005 | 20.73 | 14.84 |
ETF Shares | 1/27/2004 | | |
Market Price | | 20.50 | 10.86 |
Net Asset Value | | 20.72 | 10.88 |
1 Six months ended June 30, 2007.
2 Total returns do not include the account service fee that may be applicable to certain accounts with balances below $10,000.
Note: See Financial Highlights tables on pages 51–54 for dividend and capital gains information.
60
Large-Cap Index Fund
The Statement of Net Assets—an integral part of the Financial Statements for Vanguard Large-Cap Index Fund—is included as an insert to this report.
Statement of Operations | |
| Six Months Ended |
| June 30, 2007 |
| ($000) |
Investment Income | |
Income | |
Dividends | 11,727 |
Interest1 | 149 |
Security Lending | 43 |
Total Income | 11,919 |
Expenses | |
The Vanguard Group—Note B | |
Investment Advisory Services | 66 |
Management and Administrative—Investor Shares | 160 |
Management and Administrative—Admiral Shares | 43 |
Management and Administrative—Institutional Shares | 3 |
Management and Administrative—ETF Shares | 5 |
Marketing and Distribution—Investor Shares | 30 |
Marketing and Distribution—Admiral Shares | 17 |
Marketing and Distribution—Institutional Shares | 11 |
Marketing and Distribution—ETF Shares | 87 |
Custodian Fees | 177 |
Shareholders’ Reports—Investor Shares | 6 |
Shareholders’ Reports—Admiral Shares | — |
Shareholders’ Reports—Institutional Shares | 1 |
Shareholders’ Reports—ETF Shares | 9 |
Trustees’ Fees and Expenses | 1 |
Total Expenses | 616 |
Net Investment Income | 11,303 |
Realized Net Gain (Loss) | |
Investment Securities Sold | 5,628 |
Futures Contracts | 183 |
Realized Net Gain (Loss) | 5,811 |
Change in Unrealized Appreciation (Depreciation) | |
Investment Securities | 72,560 |
Futures Contracts | (41) |
Change in Unrealized Appreciation (Depreciation) | 72,519 |
Net Increase (Decrease) in Net Assets Resulting from Operations | 89,633 |
1 Interest income from an affiliated company of the fund was $142,000.
61
Large-Cap Index Fund
Statement of Changes in Net Assets
| Six Months Ended | Year Ended |
| June 30, | December 31, |
| 2007 | 2006 |
| ($000) | ($000) |
Increase (Decrease) in Net Assets | | |
Operations | | |
Net Investment Income | 11,303 | 13,500 |
Realized Net Gain (Loss) | 5,811 | 69,623 |
Change in Unrealized Appreciation (Depreciation) | 72,519 | 36,281 |
Net Increase (Decrease) in Net Assets Resulting from Operations | 89,633 | 119,404 |
Distributions | | |
Net Investment Income | | |
Investor Shares | (1,920) | (2,666) |
Admiral Shares | (1,699) | (2,250) |
Institutional Shares | (690) | (1,317) |
ETF Shares | (6,264) | (7,454) |
Realized Capital Gain | | |
Investor Shares | — | — |
Admiral Shares | — | — |
Institutional Shares | — | — |
ETF Shares | — | — |
Total Distributions | (10,573) | (13,687) |
Capital Share Transactions—Note F | | |
Investor Shares | 68,769 | 96,479 |
Admiral Shares | 56,322 | 76,475 |
Institutional Shares | 13,169 | (13,460) |
ETF Shares | 261,947 | 348,745 |
Net Increase (Decrease) from Capital Share Transactions | 400,207 | 508,239 |
Total Increase (Decrease) | 479,267 | 613,956 |
Net Assets | | |
Beginning of Period | 1,040,162 | 426,206 |
End of Period1 | 1,519,429 | 1,040,162 |
1 Net Assets—End of Period includes undistributed (overdistributed) net investment income of $520,000 and ($210,000).
62
Large-Cap Index Fund
Financial Highlights
Investor Shares | | | | |
| | | | |
| Six Months | | Jan. 30, |
| Ended | Year Ended | 20041 to |
| June 30, | December 31, | Dec. 31, |
For a Share Outstanding Throughout Each Period | 2007 | 2006 | 2005 | 2004 |
Net Asset Value, Beginning of Period | $25.42 | $22.38 | $21.41 | $20.00 |
Investment Operations | | | | |
Net Investment Income | .20 | .393 | .328 | .392 |
Net Realized and Unrealized Gain (Loss) on Investments | 1.64 | 3.044 | .970 | 1.41 |
Total from Investment Operations | 1.84 | 3.437 | 1.298 | 1.80 |
Distributions | | | | |
Dividends from Net Investment Income | (.19) | (.397) | (.328) | (.39) |
Distributions from Realized Capital Gains | — | — | — | — |
Total Distributions | (.19) | (.397) | (.328) | (.39) |
Net Asset Value, End of Period | $27.07 | $25.42 | $22.38 | $21.41 |
| | | | |
| | | | |
Total Return3 | 7.26% | 15.49% | 6.12% | 9.13% |
| | | | |
| | | | |
Ratios/Supplemental Data | | | | |
Net Assets, End of Period (Millions) | $295 | $211 | $94 | $44 |
Ratio of Total Expenses to Average Net Assets | 0.20%* | 0.20% | 0.20% | 0.20%* |
Ratio of Net Investment Income to Average Net Assets | 1.65%* | 1.74% | 1.72% | 1.92%2,* |
Portfolio Turnover Rate4 | 6%* | 9% | 9% | 5% |
1 Inception.
2 Net investment income per share and the ratio of net investment income to average net assets include $.05 and 0.30%, respectively, resulting from a special dividend from Microsoft Corp. in November 2004.
3 Total returns do not include the account service fee that may be applicable to certain accounts with balances below $10,000.
4 Excludes the value of portfolio securities received or delivered as a result of in-kind purchases or redemptions of the fund’s capital shares, including ETF Creation Units.
* Annualized.
63
Large-Cap Index Fund
Admiral Shares | | | | |
| | | | |
| Six Months | | Feb. 2, |
| Ended | Year Ended | 20041 to |
| June 30, | December 31, | Dec. 31, |
For a Share Outstanding Throughout Each Period | 2007 | 2006 | 2005 | 2004 |
Net Asset Value, Beginning of Period | $31.78 | $27.98 | $26.77 | $25.08 |
Investment Operations | | | | |
Net Investment Income | .271 | .514 | .431 | .5012 |
Net Realized and Unrealized Gain (Loss) on Investments | 2.042 | 3.806 | 1.209 | 1.692 |
Total from Investment Operations | 2.313 | 4.320 | 1.640 | 2.193 |
Distributions | | | | |
Dividends from Net Investment Income | (.253) | (.520) | (.430) | (.503) |
Distributions from Realized Capital Gains | — | — | — | — |
Total Distributions | (.253) | (.520) | (.430) | (.503) |
Net Asset Value, End of Period | $33.84 | $31.78 | $27.98 | $26.77 |
| | | | |
| | | | |
Total Return | 7.30% | 15.58% | 6.19% | 8.87% |
| | | | |
| | | | |
Ratios/Supplemental Data | | | | |
Net Assets, End of Period (Millions) | $233 | $164 | $71 | $27 |
Ratio of Total Expenses to Average Net Assets | 0.10%* | 0.12% | 0.12% | 0.12%* |
Ratio of Net Investment Income to Average Net Assets | 1.75%* | 1.82% | 1.80% | 2.00%2,* |
Portfolio Turnover Rate3 | 6%* | 9% | 9% | 5% |
1 Inception.
2 Net investment income per share and the ratio of net investment income to average net assets include $.063 and 0.30%, respectively, resulting from a special dividend from Microsoft Corp. in November 2004.
3 Excludes the value of portfolio securities received or delivered as a result of in-kind purchases or redemptions of the fund’s capital shares, including ETF Creation Units.
* Annualized.
64
Large-Cap Index Fund
Institutional Shares | | | |
| Six Months | Year | June 30, |
| Ended | Ended | 20051 to |
| June 30, | Dec. 31, | Dec. 31, |
For a Share Outstanding Throughout Each Period | 2007 | 2006 | 2005 |
Net Asset Value, Beginning of Period | $130.78 | $115.14 | $109.32 |
Investment Operations | | | |
Net Investment Income | 1.126 | 2.151 | .989 |
Net Realized and Unrealized Gain (Loss) on Investments | 8.438 | 15.660 | 5.863 |
Total from Investment Operations | 9.564 | 17.811 | 6.852 |
Distributions | | | |
Dividends from Net Investment Income | (1.054) | (2.171) | (1.032) |
Distributions from Realized Capital Gains | — | — | — |
Total Distributions | (1.054) | (2.171) | (1.032) |
Net Asset Value, End of Period | $139.29 | $130.78 | $115.14 |
| | | |
| | | |
Total Return | 7.33% | 15.61% | 6.28% |
| | | |
| | | |
Ratios/Supplemental Data | | | |
Net Assets, End of Period (Millions) | $98 | $79 | $83 |
Ratio of Total Expenses to Average Net Assets | 0.08%* | 0.08% | 0.08%* |
Ratio of Net Investment Income to Average Net Assets | 1.77%* | 1.86% | 1.83%* |
Portfolio Turnover Rate2 | 6%* | 9% | 9% |
1 Inception.
2 Excludes the value of portfolio securities received or delivered as a result of in-kind purchases or redemptions of the fund’s capital shares, including ETF Creation Units.
* Annualized.
65
Large-Cap Index Fund
ETF Shares | | | | |
| | | | |
| Six Months | | Jan. 27, |
| Ended | Year Ended | 20041 to |
| June 30, | December 31, | Dec. 31, |
For a Share Outstanding Throughout Each Period | 2007 | 2006 | 2005 | 2004 |
Net Asset Value, Beginning of Period | $62.92 | $55.40 | $52.99 | $50.01 |
Investment Operations | | | | |
Net Investment Income | .55 | 1.044 | .873 | .9582 |
Net Realized and Unrealized Gain (Loss) on Investments | 4.05 | 7.529 | 2.410 | 2.983 |
Total from Investment Operations | 4.60 | 8.573 | 3.283 | 3.941 |
Distributions | | | | |
Dividends from Net Investment Income | (.51) | (1.053) | (.873) | (.961) |
Distributions from Realized Capital Gains | — | — | — | — |
Total Distributions | (.51) | (1.053) | (.873) | (.961) |
Net Asset Value, End of Period | $67.01 | $62.92 | $55.40 | $52.99 |
| | | | |
| | | | |
Total Return | 7.33% | 15.61% | 6.26% | 8.00% |
| | | | |
| | | | |
Ratios/Supplemental Data | | | | |
Net Assets, End of Period (Millions) | $894 | $587 | $178 | $48 |
Ratio of Total Expenses to Average Net Assets | 0.07%* | 0.07% | 0.07% | 0.12%* |
Ratio of Net Investment Income to Average Net Assets | 1.78%* | 1.87% | 1.84% | 2.00%2,* |
Portfolio Turnover Rate3 | 6%* | 9% | 9% | 5% |
| | | | | |
1 Inception.
2 Net investment income per share and the ratio of net investment income to average net assets include $.125 and 0.30%, respectively, resulting from a special dividend from Microsoft Corp. in November 2004.
3 Excludes the value of portfolio securities received or delivered as a result of in-kind purchases or redemptions of the fund’s capital shares, including ETF Creation Units.
* Annualized.
See accompanying Notes, which are an integral part of the Financial Statements.
66
Large-Cap Index Fund
Notes to Financial Statements
Vanguard Large-Cap Index Fund is registered under the Investment Company Act of 1940 as an open-end investment company, or mutual fund. The fund offers five classes of shares: Investor Shares, Admiral Shares, Signal Shares, Institutional Shares, and ETF Shares. Investor Shares are available to any investor who meets the fund’s minimum purchase requirements. Admiral Shares are designed for investors who meet certain administrative, service, tenure, and account-size criteria. Signal Shares are designed for institutional investors who meet certain administrative, service, and account-size criteria. At June 30, 2007, no Signal Shares have been issued. Institutional Shares are designed for investors who meet certain administrative and service criteria and invest a minimum of $5 million. ETF Shares are listed for trading on the American Stock Exchange; they can be purchased and sold through a broker.
A. The following significant accounting policies conform to generally accepted accounting principles for U.S. mutual funds. The fund consistently follows such policies in preparing its financial statements.
1. Security Valuation: Securities are valued as of the close of trading on the New York Stock Exchange (generally 4 p.m., Eastern time) on the valuation date. Equity securities are valued at the latest quoted sales prices or official closing prices taken from the primary market in which each security trades; such securities not traded on the valuation date are valued at the mean of the latest quoted bid and asked prices. Securities for which market quotations are not readily available, or whose values have been materially affected by events occurring before the fund’s pricing time but after the close of the securities’ primary markets, are valued by methods deemed by the board of trustees to represent fair value. Investments in Vanguard Market Liquidity Fund are valued at that fund’s net asset value. Temporary cash investments acquired over 60 days to maturity are valued using the latest bid prices or using valuations based on a matrix system (which considers such factors as security prices, yields, maturities, and ratings), both as furnished by independent pricing services. Other temporary cash investments are valued at amortized cost, which approximates market value.
2. Futures Contracts: The fund uses index futures contracts to a limited extent, with the objectives of maintaining full exposure to the stock market, enhancing returns, maintaining liquidity, and minimizing transaction costs. The fund may purchase futures contracts to immediately invest incoming cash in the market, or sell futures in response to cash outflows, thereby simulating a fully invested position in the underlying index while maintaining a cash balance for liquidity. The fund may seek to enhance returns by using futures contracts instead of the underlying securities when futures are believed to be priced more attractively than the underlying securities. The primary risks associated with the use of futures contracts are imperfect correlation between changes in market values of stocks held by the fund and the prices of futures contracts, and the possibility of an illiquid market.
Futures contracts are valued at their quoted daily settlement prices. The aggregate principal amounts of the contracts are not recorded in the Statement of Net Assets. Fluctuations in the value of the contracts are recorded in the Statement of Net Assets as an asset (liability) and in the Statement of Operations as unrealized appreciation (depreciation) until the contracts are closed, when they are recorded as realized futures gains (losses).
67
Large-Cap Index Fund
3. Federal Income Taxes: The fund intends to continue to qualify as a regulated investment company and distribute all of its taxable income. Accordingly, no provision for federal income taxes is required in the financial statements.
4. Distributions: Distributions to shareholders are recorded on the ex-dividend date.
5. Security Lending: The fund may lend its securities to qualified institutional borrowers to earn additional income. Security loans are required to be secured at all times by collateral at least equal to the market value of securities loaned. The fund invests cash collateral received in Vanguard Market Liquidity Fund, and records a liability for the return of the collateral, during the period the securities are on loan. Security lending income represents the income earned on investing cash collateral, less expenses associated with the loan.
6. Other: Dividend income is recorded on the ex-dividend date. Interest income includes income distributions received from Vanguard Market Liquidity Fund and is accrued daily. Security transactions are accounted for on the date securities are bought or sold. Costs used to determine realized gains (losses) on the sale of investment securities are those of the specific securities sold.
Each class of shares has equal rights as to assets and earnings, except that each class separately bears certain class-specific expenses related to maintenance of shareholder accounts (included in Management and Administrative expenses) and shareholder reporting. Marketing and distribution expenses are allocated to each class of shares based on a method approved by the board of trustees. Income, other non-class-specific expenses, and gains and losses on investments are allocated to each class of shares based on its relative net assets.
B. The Vanguard Group furnishes at cost investment advisory, corporate management, administrative, marketing, and distribution services. The costs of such services are allocated to the fund under methods approved by the board of trustees. The fund has committed to provide up to 0.40% of its net assets in capital contributions to Vanguard. At June 30, 2007, the fund had contributed capital of $128,000 to Vanguard (included in Other Assets), representing 0.01% of the fund’s net assets and 0.13% of Vanguard’s capitalization. The fund’s trustees and officers are also directors and officers of Vanguard.
C. Distributions are determined on a tax basis and may differ from net investment income and realized capital gains for financial reporting purposes. Differences may be permanent or temporary. Permanent differences are reclassified among capital accounts in the financial statements to reflect their tax character. Temporary differences arise when certain items of income, expense, gain, or loss are recognized in different periods for financial statement and tax purposes; these differences will reverse at some time in the future. Differences in classification may also result from the treatment of short-term gains as ordinary income for tax purposes.
68
Large-Cap Index Fund
During the six months ended June 30, 2007, the fund realized $4,077,000 of net capital gains resulting from in-kind redemptions—in which shareholders exchanged fund shares for securities held by the fund rather than for cash. Because such gains are not taxable to the fund, and are not distributed to shareholders, they have been reclassified from accumulated net realized gains to paid-in capital.
The fund’s tax-basis capital gains and losses are determined only at the end of each fiscal year. For tax purposes, at December 31, 2006, the fund had available realized losses of $1,328,000 to offset future net capital gains of $11,000 through December 31, 2013, $463,000 through December 31, 2014, and $854,000 through December 31, 2015. The fund will use these capital losses to offset net taxable capital gains, if any, realized during the year ending December 31, 2007; should the fund realize net capital losses for the year, the losses will be added to the loss carryforward balances above.
At June 30, 2007, the cost of investment securities for tax purposes was $1,400,421,000. Net unrealized appreciation of investment securities for tax purposes was $125,585,000, consisting of unrealized gains of $149,906,000 on securities that had risen in value since their purchase and $24,321,000 in unrealized losses on securities that had fallen in value since their purchase.
At June 30, 2007, the aggregate settlement value of open futures contracts expiring in September 2007 and the related unrealized appreciation (depreciation) were:
| | | ($000) |
| | Aggregate | Unrealized |
| Number of | Settlement | Appreciation |
Futures Contracts | Long Contracts | Value | (Depreciation) |
S&P 500 Index | 12 | 4,546 | (8) |
Unrealized appreciation (depreciation) on open futures contracts is required to be treated as realized gain (loss) for tax purposes.
D. During the six months ended June 30, 2007, the fund purchased $464,087,000 of investment securities and sold $62,374,000 of investment securities, other than temporary cash investments.
E. The market value of securities on loan to broker-dealers at June 30, 2007, was $1,742,000, for which the fund received cash collateral of $1,855,000.
69
Large-Cap Index Fund
F. Capital share transactions for each class of shares were:
| Six Months Ended | Year Ended |
| June 30, 2007 | December 31, 2006 |
| Amount | Shares | Amount | Shares |
| ($000) | (000) | ($000) | (000) |
Investor Shares | | | | |
Issued | 115,498 | 4,383 | 155,826 | 6,600 |
Issued in Lieu of Cash Distributions | 1,711 | 65 | 2,381 | 99 |
Redeemed | (48,440) | (1,841) | (61,728) | (2,616) |
Net Increase (Decrease)—Investor Shares | 68,769 | 2,607 | 96,479 | 4,083 |
Admiral Shares | | | | |
Issued | 93,021 | 2,846 | 93,916 | 3,200 |
Issued in Lieu of Cash Distributions | 1,457 | 44 | 1,952 | 65 |
Redeemed | (38,156) | (1,145) | (19,393) | (658) |
Net Increase (Decrease)—Admiral Shares | 56,322 | 1,745 | 76,475 | 2,607 |
Institutional Shares | | | | |
Issued | 15,979 | 115 | 255,490 | 2,024 |
Issued in Lieu of Cash Distributions | 690 | 5 | 1,317 | 11 |
Redeemed | (3,500) | (25) | (270,267) | (2,154) |
Net Increase (Decrease)—Institutional Shares | 13,169 | 95 | (13,460) | (119) |
ETF Shares | | | | |
Issued | 287,532 | 4,411 | 679,485 | 11,420 |
Issued in Lieu of Cash Distributions | — | — | — | — |
Redeemed | (25,585) | (400) | (330,740) | (5,300) |
Net Increase (Decrease)—ETF Shares | 261,947 | 4,011 | 348,745 | 6,120 |
G. In June 2006, the Financial Accounting Standards Board issued Interpretation No. 48 (“FIN 48”), “Accounting for Uncertainty in Income Taxes.” FIN 48 establishes the minimum threshold for recognizing, and a system for measuring, the benefits of tax-return positions in financial statements, effective for the fund’s current fiscal year. Management has analyzed the fund’s tax positions taken on federal income tax returns for all open tax years (tax years ended December 31, 2004–2006) for purposes of implementing FIN 48, and has concluded that no provision for income tax is required in the fund’s financial statements.
70
Total Stock Market Index Fund
Fund Profile
As of June 30, 2007
Portfolio Characteristics | | |
| | Target |
| Fund | Index1 |
Number of Stocks | 3,686 | 3,929 |
Median Market Cap | $33.4B | $33.4B |
Price/Earnings Ratio | 18.2x | 18.2x |
Price/Book Ratio | 2.9x | 2.9x |
Yield | | 1.7% |
Investor Shares | 1.6% | |
Admiral Shares | 1.7% | |
Signal Shares | 1.7% | |
Institutional Shares | 1.7% | |
ETF Shares | 1.7% | |
Return on Equity | 18.2% | 18.2% |
Earnings Growth Rate | 20.8% | 20.7% |
Foreign Holdings | 0.4% | 0.4% |
Turnover Rate | 3%2 | — |
Expense Ratio | | — |
Investor Shares | 0.16%2 | |
Admiral Shares | 0.08%2 | |
Signal Shares | 0.08%2 | |
Institutional Shares | 0.05%2 | |
ETF Shares | 0.07%2 | |
Short-Term Reserves | 0% | — |
Sector Diversification (% of portfolio) | |
| | Target |
| Fund | Index1 |
Consumer Discretionary | 11% | 11% |
Consumer Staples | 8 | 8 |
Energy | 10 | 10 |
Financials | 21 | 21 |
Health Care | 12 | 12 |
Industrials | 12 | 12 |
Information Technology | 16 | 16 |
Materials | 3 | 3 |
Telecommunication Services | 3 | 3 |
Utilities | 4 | 4 |
Volatility Measures3 | |
| Fund Versus |
| Spliced Index4 |
R-Squared | 1.00 |
Beta | 1.00 |
Ten Largest Holdings5 (% of total net assets) |
| | |
ExxonMobil Corp. | integrated oil | |
| and gas | 2.8% |
General Electric Co. | industrial | |
| conglomerates | 2.3 |
Microsoft Corp. | systems software | 1.5 |
AT&T Inc. | integrated | |
| telecommunication | |
| services | 1.5 |
Citigroup, Inc. | diversified | |
| financial services | 1.5 |
Bank of America Corp. | diversified | |
| financial services | 1.3 |
The Procter & Gamble Co. | household products | 1.1 |
Pfizer Inc. | pharmaceuticals | 1.1 |
Chevron Corp. | integrated oil and gas | 1.1 |
Johnson & Johnson | pharmaceuticals | 1.1 |
Top Ten | | 15.3% |
| | | |
Investment Focus
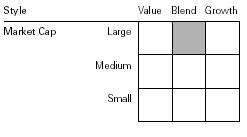
1 MSCI US Broad Market Index.
2 Annualized.
3 For an explanation of R-squared, beta, and other terms used here, see the Glossary on page 76.
4 Dow Jones Wilshire 5000 Index through April 22, 2005; MSCI US Broad Market Index thereafter.
5 “Ten Largest Holdings” excludes any temporary cash investments and equity index products.
71
Total Stock Market Index Fund
Performance Summary
All of the returns in this report represent past performance, which is not a guarantee of future results that may be achieved by the fund. (Current performance may be lower or higher than the performance data cited. For performance data current to the most recent month-end, visit our website at www.vanguard.com/performance.) Note, too, that both investment returns and principal value can fluctuate widely, so an investor’s shares, when sold, could be worth more or less than their original cost. The returns shown do not reflect taxes that a shareholder would pay on fund distributions or on the sale of fund shares.
Fiscal-Year Total Returns (%): December 31, 1996–June 30, 2007
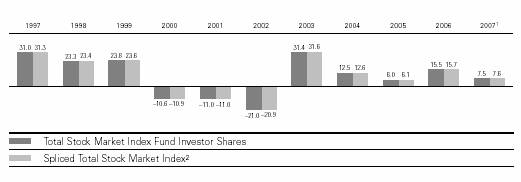
Average Annual Total Returns: Periods Ended June 30, 2007
| Inception Date | One Year | Five Years | Ten Years |
Total Stock Market Index Fund | | | | |
Investor Shares3 | 4/27/1992 | 20.21% | 11.76% | 7.60% |
Admiral Shares | 11/13/2000 | 20.32 | 11.85 | 4.514 |
Signal Shares | 9/1/2006 | 17.144 | — | — |
Institutional Shares | 7/7/1997 | 20.39 | 11.90 | 7.464 |
ETF Shares | 5/24/2001 | | | |
Market Price | | 20.25 | 11.73 | 5.554 |
Net Asset Value | | 20.35 | 11.85 | 5.574 |
1 Six months ended June 30, 2007.
2 Dow Jones Wilshire 5000 Index through April 22, 2005; MSCI US Broad Market Index thereafter.
3 Total returns do not include the account service fee that may be applicable to certain accounts with balances below $10,000.
4 Return since inception.
Note: See Financial Highlights tables on pages 63–67 for dividend and capital gains information.
72
Total Stock Market Index Fund
The Statement of Net Assets–Investments Summary—an integral part of the Financial Statements for Vanguard Total Stock Market Index Fund—is included as an insert to this report.
Statement of Operations |
| Six Months Ended |
| June 30, 2007 |
| ($000) |
Investment Income | |
Income | |
Dividends | 802,572 |
Interest1 | 18,653 |
Security Lending | 13,286 |
Total Income | 834,511 |
Expenses | |
The Vanguard Group—Note B | |
Investment Advisory Services | 1,420 |
Management and Administrative—Investor Shares | 27,852 |
Management and Administrative—Admiral Shares | 8,618 |
Management and Administrative—Signal Shares | 124 |
Management and Administrative—Institutional Shares | 1,240 |
Management and Administrative—ETF Shares | 1,326 |
Marketing and Distribution—Investor Shares | 5,405 |
Marketing and Distribution—Admiral Shares | 2,264 |
Marketing and Distribution—Signal Shares | 29 |
Marketing and Distribution—Institutional Shares | 1,632 |
Marketing and Distribution—ETF Shares | 968 |
Custodian Fees | 555 |
Shareholders’ Reports—Investor Shares | 324 |
Shareholders’ Reports—Admiral Shares | 37 |
Shareholders’ Reports—Signal Shares | 9 |
Shareholders’ Reports—Institutional Shares | 20 |
Shareholders’ Reports—ETF Shares | 91 |
Trustees’ Fees and Expenses | 49 |
Total Expenses | 51,963 |
Net Investment Income | 782,548 |
Realized Net Gain (Loss) | |
Investment Securities Sold | 1,158,107 |
Futures Contracts | 31,257 |
Realized Net Gain (Loss) | 1,189,364 |
Change in Unrealized Appreciation (Depreciation) | |
Investment Securities | 4,723,095 |
Futures Contracts | (8,144) |
Change in Unrealized Appreciation (Depreciation) | 4,714,951 |
Net Increase (Decrease) in Net Assets Resulting from Operations | 6,686,863 |
1 Interest income from an affiliated company of the fund was $18,009,000.
73
Total Stock Market Index Fund
Statement of Changes in Net Assets
| Six Months Ended | Year Ended |
| June 30, | December 31, |
| 2007 | 2006 |
| ($000) | ($000) |
Increase (Decrease) in Net Assets | | |
Operations | | |
Net Investment Income | 782,548 | 1,283,120 |
Realized Net Gain (Loss) | 1,189,364 | 921,981 |
Change in Unrealized Appreciation (Depreciation) | 4,714,951 | 8,818,237 |
Net Increase (Decrease) in Net Assets Resulting from Operations | 6,686,863 | 11,023,338 |
Distributions | | |
Net Investment Income | | |
Investor Shares | (335,023) | (572,472) |
Admiral Shares | (235,737) | (415,805) |
Signal Shares | (3,537) | (2,468) |
Institutional Shares | (100,887) | (193,310) |
ETF Shares | (65,205) | (108,438) |
Realized Capital Gain | | |
Investor Shares | — | — |
Admiral Shares | — | — |
Signal Shares | — | — |
Institutional Shares | — | — |
ETF Shares | — | — |
Total Distributions | (740,389) | (1,292,493) |
Capital Share Transactions—Note F | | |
Investor Shares | 4,373,770 | 4,821,192 |
Admiral Shares | 1,940,533 | 3,467,146 |
Signal Shares | 337,172 | 369,757 |
Institutional Shares | 679,945 | 1,171,149 |
ETF Shares | 1,186,582 | 497,536 |
Net Increase (Decrease) from Capital Share Transactions | 8,518,002 | 10,326,780 |
Total Increase (Decrease) | 14,464,476 | 20,057,625 |
Net Assets | | |
Beginning of Period | 85,477,198 | 65,419,573 |
End of Period1 | 99,941,674 | 85,477,198 |
1 Net Assets—End of Period includes undistributed (overdistributed) net investment income of ($20,913,000) and ($63,072,000).
74
Total Stock Market Index Fund
Financial Highlights
Investor Shares | | | | | | |
| | | | | | |
| Six Months | | | | | |
| Ended | | | |
For a Share Outstanding | June 30, | | Year Ended December 31, |
Throughout Each Period | 2007 | 2006 | 2005 | 2004 | 2003 | 2002 |
Net Asset Value, Beginning of Period | $34.09 | $30.00 | $28.77 | $25.99 | $20.07 | $25.74 |
Investment Operations | | | | | | |
Net Investment Income | .29 | .523 | .466 | .4451 | .325 | .295 |
Net Realized and Unrealized | | | | | | |
Gain (Loss) on Investments | 2.25 | 4.091 | 1.237 | 2.780 | 5.922 | (5.672) |
Total from Investment Operations | 2.54 | 4.614 | 1.703 | 3.225 | 6.247 | (5.377) |
Distributions | | | | | | |
Dividends from Net Investment Income | (.27) | (.524) | (.473) | (.445) | (.327) | (.293) |
Distributions from Realized Capital Gains | — | — | — | — | — | — |
Total Distributions | (.27) | (.524) | (.473) | (.445) | (.327) | (.293) |
Net Asset Value, End of Period | $36.36 | $34.09 | $30.00 | $28.77 | $25.99 | $20.07 |
| | | | | | |
| | | | | | |
Total Return2 | 7.47% | 15.51% | 5.98% | 12.52% | 31.35% | –20.96% |
| | | | | | |
| | | | | | |
Ratios/Supplemental Data | | | | | | |
Net Assets, End of Period (Millions) | $46,261 | $39,095 | $29,785 | $31,718 | $24,059 | $14,254 |
Ratio of Total Expenses to | | | | | | |
Average Net Assets | 0.16%* | 0.19% | 0.19% | 0.19% | 0.20% | 0.20% |
Ratio of Net Investment Income to | | | | | | |
Average Net Assets | 1.65%* | 1.66% | 1.62% | 1.70%1 | 1.49% | 1.32% |
Portfolio Turnover Rate3 | 3%* | 4% | 12%4 | 4% | 2% | 2% |
| | | | | | | | |
1 Net investment income per share and the ratio of net investment income to average net assets include $.063 and 0.25%, respectively, resulting from a special dividend from Microsoft Corp. in November 2004.
2 Total returns do not include the account service fee that may be applicable to certain accounts with balances below $10,000.
3 Excludes the value of portfolio securities received or delivered as a result of in-kind purchases or redemptions of the fund’s capital shares, including ETF Creation Units.
4 Includes activity related to a change in the fund’s target index.
* Annualized.
75
Total Stock Market Index Fund
Admiral Shares | | | | | | |
| | | | | | |
| Six Months | | | | | |
| Ended | | | |
For a Share Outstanding | June 30, | | Year Ended December 31, |
Throughout Each Period | 2007 | 2006 | 2005 | 2004 | 2003 | 2002 |
Net Asset Value, Beginning of Period | $34.09 | $30.00 | $28.77 | $25.99 | $20.07 | $25.75 |
Investment Operations | | | | | | |
Net Investment Income | .301 | .555 | .495 | .4681 | .336 | .296 |
Net Realized and Unrealized Gain (Loss) | | | | | | |
on Investments | 2.253 | 4.091 | 1.237 | 2.780 | 5.922 | (5.672) |
Total from Investment Operations | 2.554 | 4.646 | 1.732 | 3.248 | 6.258 | (5.376) |
Distributions | | | | | | |
Dividends from Net Investment Income | (.284) | (.556) | (.502) | (.468) | (.338) | (.304) |
Distributions from Realized Capital Gains | — | — | — | — | — | — |
Total Distributions | (.284) | (.556) | (.502) | (.468) | (.338) | (.304) |
Net Asset Value, End of Period | $36.36 | $34.09 | $30.00 | $28.77 | $25.99 | $20.07 |
| | | | | | |
| | | | | | |
Total Return | 7.51% | 15.63% | 6.09% | 12.61% | 31.42% | –20.95% |
| | | | | | |
| | | | | | |
Ratios/Supplemental Data | | | | | | |
Net Assets, End of Period (Millions) | $30,634 | $26,853 | $20,347 | $10,856 | $7,969 | $4,069 |
Ratio of Total Expenses to | | | | | | |
Average Net Assets | 0.08%* | 0.09% | 0.09% | 0.10% | 0.15% | 0.15% |
Ratio of Net Investment Income to | | | | | | |
Average Net Assets | 1.73%* | 1.76% | 1.72% | 1.79%1 | 1.54% | 1.39% |
Portfolio Turnover Rate2 | 3%* | 4% | 12%3 | 4% | 2% | 2% |
| | | | | | | | |
1 Net investment income per share and the ratio of net investment income to average net assets include $.063 and 0.25%, respectively, resulting from a special dividend from Microsoft Corp. in November 2004.
2 Excludes the value of portfolio securities received or delivered as a result of in-kind purchases or redemptions of the fund’s capital shares, including ETF Creation Units.
3 Includes activity related to a change in the fund’s target index.
* Annualized.
76
Total Stock Market Index Fund
Signal Shares | | |
| Six Months | Sept. 1, |
| Ended | 20061 to |
| June 30, | Dec. 31, |
For a Share Outstanding Throughout Each Period | 2007 | 2006 |
Net Asset Value, Beginning of Period | $32.91 | $30.47 |
Investment Operations | | |
Net Investment Income | .292 | .181 |
Net Realized and Unrealized Gain (Loss) on Investments | 2.174 | 2.536 |
Total from Investment Operations | 2.466 | 2.717 |
Distributions | | |
Dividends from Net Investment Income | (.276) | (.277) |
Distributions from Realized Capital Gains | — | — |
Total Distributions | (.276) | (.277) |
Net Asset Value, End of Period | $35.10 | $32.91 |
| | |
| | |
Total Return | 7.52% | 8.95% |
| | |
| | |
Ratios/Supplemental Data | | |
Net Assets, End of Period (Millions) | $744 | $381 |
Ratio of Total Expenses to Average Net Assets | 0.08%* | 0.09%* |
Ratio of Net Investment Income to Average Net Assets | 1.73%* | 1.76%* |
Portfolio Turnover Rate2 | 3%* | 4% |
1 Inception.
2 Excludes the value of portfolio securities received or delivered as a result of in-kind purchases or redemptions of the fund’s capital shares, including ETF Creation Units.
* Annualized.
77
Total Stock Market Index Fund
Institutional Shares | | | | | | |
| | | | | | |
| Six Months | | | | | |
| Ended | | | |
For a Share Outstanding | June 30, | | Year Ended December 31, |
Throughout Each Period | 2007 | 2006 | 2005 | 2004 | 2003 | 2002 |
Net Asset Value, Beginning of Period | $34.10 | $30.00 | $28.77 | $26.00 | $20.07 | $25.75 |
Investment Operations | | | | | | |
Net Investment Income | .31 | .573 | .504 | .4651 | .360 | .311 |
Net Realized and Unrealized Gain (Loss) | | | | | | |
on Investments | 2.25 | 4.091 | 1.237 | 2.780 | 5.922 | (5.672) |
Total from Investment Operations | 2.56 | 4.664 | 1.741 | 3.245 | 6.282 | (5.361) |
Distributions | | | | | | |
Dividends from Net Investment Income | (.29) | (.564) | (.511) | (.475) | (.352) | (.319) |
Distributions from Realized Capital Gains | — | — | — | — | — | — |
Total Distributions | (.29) | (.564) | (.511) | (.475) | (.352) | (.319) |
Net Asset Value, End of Period | $36.37 | $34.10 | $30.00 | $28.77 | $26.00 | $20.07 |
| | | | | | |
| | | | | | |
Total Return | 7.53% | 15.69% | 6.12% | 12.60% | 31.55% | –20.90% |
| | | | | | |
| | | | | | |
Ratios/Supplemental Data | | | | | | |
Net Assets, End of Period (Millions) | $13,739 | $12,262 | $9,676 | $10,181 | $8,000 | $4,466 |
Ratio of Total Expenses to | | | | | | |
Average Net Assets | 0.05%* | 0.06% | 0.06% | 0.08% | 0.08% | 0.08% |
Ratio of Net Investment Income to | | | | | | |
Average Net Assets | 1.76%* | 1.79% | 1.75% | 1.82%1 | 1.62% | 1.45% |
Portfolio Turnover Rate2 | 3%* | 4% | 12%3 | 4% | 2% | 2% |
| | | | | | | | |
1 Net investment income per share and the ratio of net investment income to average net assets include $.063 and 0.25%, respectively, resulting from a special dividend from Microsoft Corp. in November 2004.
2 Excludes the value of portfolio securities received or delivered as a result of in-kind purchases or redemptions of the fund’s capital shares, including ETF Creation Units.
3 Includes activity related to a change in the fund’s target index.
* Annualized.
78
Total Stock Market Index Fund
ETF Shares | | | | | | |
| Six | | | | | |
| Months | | | | | |
| Ended | | | |
For a Share Outstanding | June 30, | | Year Ended December 31, |
Throughout Each Period | 2007 | 2006 | 2005 | 2004 | 2003 | 2002 |
Net Asset Value, Beginning of Period | $140.08 | $123.25 | $118.21 | $106.81 | $82.47 | $105.80 |
Investment Operations | | | | | | |
Net Investment Income | 1.249 | 2.303 | 2.053 | 1.8931 | 1.381 | 1.259 |
Net Realized and Unrealized Gain (Loss) | | | | | | |
on Investments | 9.253 | 16.829 | 5.070 | 11.409 | 24.341 | (23.337) |
Total from Investment Operations | 10.502 | 19.132 | 7.123 | 13.302 | 25.722 | (22.078) |
Distributions | | | | | | |
Dividends from Net Investment Income | (1.182) | (2.302) | (2.083) | (1.902) | (1.382) | (1.252) |
Distributions from Realized Capital Gains | — | — | — | — | — | — |
Total Distributions | (1.182) | (2.302) | (2.083) | (1.902) | (1.382) | (1.252) |
Net Asset Value, End of Period | $149.40 | $140.08 | $123.25 | $118.21 | $106.81 | $82.47 |
| | | | | | |
| | | | | | |
Total Return | 7.52% | 15.66% | 6.10% | 12.57% | 31.43% | –20.94% |
| | | | | | |
| | | | | | |
Ratios/Supplemental Data | | | | | | |
Net Assets, End of Period (Millions) | $8,563 | $6,885 | $5,612 | $4,259 | $2,517 | $1,290 |
Ratio of Total Expenses to | | | | | | |
Average Net Assets | 0.07%* | 0.07% | 0.07% | 0.13% | 0.15% | 0.15% |
Ratio of Net Investment Income to | | | | | | |
Average Net Assets | 1.74%* | 1.78% | 1.74% | 1.79%1 | 1.54% | 1.38% |
Portfolio Turnover Rate2 | 3%* | 4% | 12%3 | 4% | 2% | 2% |
| | | | | | | | | |
1 Net investment income per share and the ratio of net investment income to average net assets include $.259 and 0.25%, respectively, resulting from a special dividend from Microsoft Corp. in November 2004.
2 Excludes the value of portfolio securities received or delivered as a result of in-kind purchases or redemptions of the fund’s capital shares, including ETF Creation Units.
3 Includes activity related to a change in the fund’s target index.
* Annualized.
See accompanying Notes, which are an integral part of the Financial Statements.
79
Total Stock Market Index Fund
Notes to Financial Statements
Vanguard Total Stock Market Index Fund is registered under the Investment Company Act of 1940 as an open-end investment company, or mutual fund. The fund offers five classes of shares: Investor Shares, Admiral Shares, Signal Shares, Institutional Shares, and ETF Shares. Investor Shares are available to any investor who meets the fund’s minimum purchase requirements. Admiral Shares are designed for investors who meet certain administrative, service, tenure, and account-size criteria. Signal Shares are designed for institutional investors who meet certain administrative, service, and account-size criteria. Institutional Shares are designed for investors who meet certain administrative and service criteria and invest a minimum of $5 million. ETF Shares are listed for trading on the American Stock Exchange; they can be purchased and sold through a broker.
A. The following significant accounting policies conform to generally accepted accounting principles for U.S. mutual funds. The fund consistently follows such policies in preparing its financial statements.
1. Security Valuation: Securities are valued as of the close of trading on the New York Stock Exchange (generally 4 p.m., Eastern time) on the valuation date. Equity securities are valued at the latest quoted sales prices or official closing prices taken from the primary market in which each security trades; such securities not traded on the valuation date are valued at the mean of the latest quoted bid and asked prices. Securities for which market quotations are not readily available, or whose values have been materially affected by events occurring before the fund’s pricing time but after the close of the securities’ primary markets, are valued by methods deemed by the board of trustees to represent fair value. Investments in Vanguard Market Liquidity Fund are valued at that fund’s net asset value. Temporary cash investments acquired over 60 days to maturity are valued using the latest bid prices or using valuations based on a matrix system (which considers such factors as security prices, yields, maturities, and ratings), both as furnished by independent pricing services. Other temporary cash investments are valued at amortized cost, which approximates market value.
2. Futures Contracts: The fund uses index futures contracts to a limited extent, with the objectives of maintaining full exposure to the stock market, enhancing returns, maintaining liquidity, and minimizing transaction costs. The fund may purchase futures contracts to immediately invest incoming cash in the market, or sell futures in response to cash outflows, thereby simulating a fully invested position in the underlying index while maintaining a cash balance for liquidity. The fund may seek to enhance returns by using futures contracts instead of the underlying securities when futures are believed to be priced more attractively than the underlying securities. The primary risks associated with the use of futures contracts are imperfect correlation between changes in market values of stocks held by the fund and the prices of futures contracts, and the possibility of an illiquid market.
Futures contracts are valued at their quoted daily settlement prices. The aggregate principal amounts of the contracts are not recorded in the Statement of Net Assets. Fluctuations in the value of the contracts are recorded in the Statement of Net Assets as an asset (liability) and in the Statement of Operations as unrealized appreciation (depreciation) until the contracts are closed, when they are recorded as realized futures gains (losses).
3. Federal Income Taxes: The fund intends to continue to qualify as a regulated investment company and distribute all of its taxable income. Accordingly, no provision for federal income taxes is required in the financial statements.
4. Distributions: Distributions to shareholders are recorded on the ex-dividend date.
80
Total Stock Market Index Fund
5. Security Lending: The fund may lend its securities to qualified institutional borrowers to earn additional income. Security loans are required to be secured at all times by collateral at least equal to the market value of securities loaned. The fund invests cash collateral received in Vanguard Market Liquidity Fund, and records a liability for the return of the collateral, during the period the securities are on loan. Security lending income represents the income earned on investing cash collateral, less expenses associated with the loan.
6. Other: Dividend income is recorded on the ex-dividend date. Interest income includes income distributions received from Vanguard Market Liquidity Fund and is accrued daily. Security transactions are accounted for on the date securities are bought or sold. Costs used to determine realized gains (losses) on the sale of investment securities are those of the specific securities sold.
Each class of shares has equal rights as to assets and earnings, except that each class separately bears certain class-specific expenses related to maintenance of shareholder accounts (included in Management and Administrative expenses) and shareholder reporting. Marketing and distribution expenses are allocated to each class of shares based on a method approved by the board of trustees. Income, other non-class-specific expenses, and gains and losses on investments are allocated to each class of shares based on its relative net assets.
B. The Vanguard Group furnishes at cost investment advisory, corporate management, administrative, marketing, and distribution services. The costs of such services are allocated to the fund under methods approved by the board of trustees. The fund has committed to provide up to 0.40% of its net assets in capital contributions to Vanguard. At June 30, 2007, the fund had contributed capital of $8,680,000 to Vanguard (included in Other Assets), representing 0.01% of the fund’s net assets and 8.68% of Vanguard’s capitalization. The fund’s trustees and officers are also directors and officers of Vanguard.
C. Distributions are determined on a tax basis and may differ from net investment income and realized capital gains for financial reporting purposes. Differences may be permanent or temporary. Permanent differences are reclassified among capital accounts in the financial statements to reflect their tax character. Temporary differences arise when certain items of income, expense, gain, or loss are recognized in different periods for financial statement and tax purposes; these differences will reverse at some time in the future. Differences in classification may also result from the treatment of short-term gains as ordinary income for tax purposes.
During the six months ended June 30, 2007, the fund realized $1,256,515,000 of net capital gains resulting from in-kind redemptions—in which shareholders exchanged fund shares for securities held by the fund rather than for cash. Because such gains are not taxable to the fund, and are not distributed to shareholders, they have been reclassified from accumulated net realized losses to paid-in capital.
The fund’s tax-basis capital gains and losses are determined only at the end of each fiscal year. For tax purposes, at December 31, 2006, the fund had available realized losses of $1,908,675,000 to offset future net capital gains of $60,790,000 through December 31, 2009, $439,204,000 through December 31, 2010, $411,583,000 through December 31, 2011, $762,181,000 through December 31, 2013, and $234,917,000 through December 31, 2015. The fund will use these capital losses to offset net taxable capital gains, if any, realized during the year ending December 31, 2007; should the fund realize net capital losses for the year, the losses will be added to the loss carryforward balances above.
81
Total Stock Market Index Fund
At June 30, 2007, the cost of investment securities for tax purposes was $77,142,167,000. Net unrealized appreciation of investment securities for tax purposes was $24,150,095,000, consisting of unrealized gains of $26,295,007,000 on securities that had risen in value since their purchase and $2,144,912,000 in unrealized losses on securities that had fallen in value since their purchase.
At June 30, 2007, the aggregate settlement value of open futures contracts expiring in September 2007 and the unrealized appreciation (depreciation) were:
| | | ($000) |
| | Aggregate | Unrealized |
| Number of | Settlement | Appreciation |
Futures Contracts | Long Contracts | Value | (Depreciation) |
S&P 500 Index | 1,544 | 584,944 | (6,635) |
S&P MidCap 400 Index | 79 | 35,716 | (280) |
Russell 2000 Index | 24 | 10,105 | 2 |
Unrealized appreciation (depreciation) on open futures contracts is required to be treated as realized gain (loss) for tax purposes.
D. During the six months ended June 30, 2007, the fund purchased $12,114,701,000 of investment securities and sold $3,659,994,000 of investment securities, other than temporary cash investments.
E. The market value of securities on loan to broker-dealers at June 30, 2007, was $1,153,319,000, for which the fund received cash collateral of $1,230,484,000.
F. Capital share transactions for each class of shares were:
| Six Months Ended | Year Ended |
| June 30, 2007 | December 31, 2006 |
| Amount | Shares | Amount | Shares |
| ($000) | (000) | ($000) | (000) |
Investor Shares | | | | |
Issued | $7,153,110 | 203,621 | $9,913,509 | 314,269 |
Issued in Lieu of Cash Distributions | 328,961 | 9,261 | 558,647 | 17,492 |
Redeemed | (3,108,301) | (87,381) | (5,650,964) | (177,927) |
Net Increase (Decrease)—Investor Shares | 4,373,770 | 125,501 | 4,821,192 | 153,834 |
Admiral Shares | | | | |
Issued | 3,854,999 | 108,836 | 6,057,169 | 191,210 |
Issued in Lieu of Cash Distributions | 208,059 | 5,856 | 367,282 | 11,502 |
Redeemed | (2,122,525) | (59,865) | (2,957,305) | (93,352) |
Net Increase (Decrease)—Admiral Shares | 1,940,533 | 54,827 | 3,467,146 | 109,360 |
Signal Shares | | | | |
Issued | 364,137 | 10,415 | 376,857 | 11,812 |
Issued in Lieu of Cash Distributions | 3,367 | 98 | 2,468 | 77 |
Redeemed | (30,332) | (888) | (9,568) | (302) |
Net Increase (Decrease)—Signal Shares | 337,172 | 9,625 | 369,757 | 11,587 |
82
Total Stock Market Index Fund
| Six Months Ended | Year Ended |
| June 30, 2007 | December 31, 2006 |
| Amount | Shares | Amount | Shares |
| ($000) | (000) | ($000) | (000) |
Institutional Shares | | | | |
Issued | 2,834,103 | 79,578 | 2,842,672 | 89,979 |
Issued in Lieu of Cash Distributions | 82,634 | 2,326 | 158,666 | 4,968 |
Redeemed | (2,236,792) | (63,745) | (1,830,189) | (57,854) |
Net Increase (Decrease)—Institutional Shares | 679,945 | 18,159 | 1,171,149 | 37,093 |
ETF Shares | | | | |
Issued | 2,394,289 | 16,413 | 2,058,789 | 15,769 |
Issued in Lieu of Cash Distributions | — | — | — | — |
Redeemed | (1,207,707) | (8,250) | (1,561,253) | (12,150) |
Net Increase (Decrease)—ETF Shares | 1,186,582 | 8,163 | 497,536 | 3,619 |
G. In June 2006, the Financial Accounting Standards Board issued Interpretation No. 48 (“FIN 48”), “Accounting for Uncertainty in Income Taxes.” FIN 48 establishes the minimum threshold for recognizing, and a system for measuring, the benefits of tax-return positions in financial statements, effective for the fund’s current fiscal year. Management has analyzed the fund’s tax positions taken on federal income tax returns for all open tax years (tax years ended December 31, 2004–2006) for purposes of implementing FIN 48, and has concluded that no provision for income tax is required in the fund’s financial statements.
83
About Your Fund’s Expenses
As a shareholder of the fund, you incur ongoing costs, which include costs for portfolio management, administrative services, and shareholder reports (like this one), among others. Operating expenses, which are deducted from a fund’s gross income, directly reduce the investment return of the fund.
A fund’s expenses are expressed as a percentage of its average net assets. This figure is known as the expense ratio. The following examples are intended to help you understand the ongoing costs (in dollars) of investing in your fund and to compare these costs with those of other mutual funds. The examples are based on an investment of $1,000 made at the beginning of the period shown and held for the entire period.
The tables illustrate your fund’s costs in two ways:
• Based on actual fund return. This section helps you to estimate the actual expenses that you paid over the period. The “Ending Account Value” shown is derived from the fund’s actual return, and the third column shows the dollar amount that would have been paid by an investor who started with $1,000 in the fund. You may use the information here, together with the amount you invested, to estimate the expenses that you paid over the period.
To do so, simply divide your account value by $1,000 (for example, an $8,600 account value divided by $1,000 = 8.6), then multiply the result by the number given for your fund under the heading “Expenses Paid During Period.”
• Based on hypothetical 5% yearly return. This section is intended to help you compare your fund’s costs with those of other mutual funds. It assumes that the fund had a yearly return of 5% before expenses, but that the expense ratio is unchanged. In this case—because the return used is not the fund’s actual return—the results do not apply to your investment. The example is useful in making comparisons because the Securities and Exchange Commission requires all mutual funds to calculate expenses based on a 5% return. You can assess your fund’s costs by comparing this hypothetical example with the hypothetical examples that appear in shareholder reports of other funds.
Note that the expenses shown in the tables are meant to highlight and help you compare ongoing costs only and do not reflect transaction costs incurred by the fund for buying and selling securities. Further, the expenses do not include any account service fee described in the prospectus. If such a fee were applied to your account, your costs would be higher. Your fund does not charge transaction fees, such as purchase or redemption fees, nor does it carry a “sales load.”
The calculations assume no shares were bought or sold during the period. Your actual costs may have been higher or lower, depending on the amount of your investment and the timing of any purchases or redemptions.
You can find more information about the fund’s expenses, including annual expense ratios, in the Financial Statements section of this report. For additional information on operating expenses and other shareholder costs, please refer to your fund’s current prospectus.
84
Six Months Ended June 30, 20071 | | | |
| Beginning | Ending | Expenses |
| Account Value | Account Value | Paid During |
Index Fund | 12/31/2006 | 6/30/2007 | Period2 |
Based on Actual Fund Return | | | |
Growth | | | |
Investor Shares | $1,000.00 | $1,079.38 | $1.13 |
Admiral Shares | 1,000.00 | 1,080.00 | 0.52 |
Institutional Shares | 1,000.00 | 1,080.17 | 0.36 |
ETF Shares | 1,000.00 | 1,079.77 | 0.57 |
Value | | | |
Investor Shares | $1,000.00 | $1,066.52 | $1.02 |
Admiral Shares | 1,000.00 | 1,067.06 | 0.51 |
Institutional Shares | 1,000.00 | 1,067.21 | 0.36 |
ETF Shares | 1,000.00 | 1,067.18 | 0.56 |
Large-Cap | | | |
Investor Shares | $1,000.00 | $1,072.57 | $1.03 |
Admiral Shares | 1,000.00 | 1,072.98 | 0.51 |
Institutional Shares | 1,000.00 | 1,073.33 | 0.41 |
ETF Shares | 1,000.00 | 1,073.32 | 0.36 |
Total Stock Market | | | |
Investor Shares | $1,000.00 | $1,074.72 | $0.82 |
Admiral Shares | 1,000.00 | 1,075.13 | 0.41 |
Signal Shares | 1,000.00 | 1,075.15 | 0.41 |
Institutional Shares | 1,000.00 | 1,075.30 | 0.26 |
ETF Shares | 1,000.00 | 1,075.21 | 0.36 |
1 This table does not include data for funds or share classes of funds with fewer than six months of history.
2 The calculations are based on expenses incurred in the most recent six-month period.The funds’ annualized six-month expense ratios for that period are: 0.22% for the Growth Index Fund Investor Shares, 0.10% for Admiral Shares, 0.07% for Institutional Shares, and 0.11% for ETF Shares; 0.20% for the Value Index Fund Investor Shares, 0.10% for Admiral Shares, 0.07% for Institutional Shares, and 0.11% for ETF Shares; 0.20% for the Large-Cap Index Fund Investor Shares, 0.10% for Admiral Shares, 0.08% for Institutional Shares, and 0.07% for ETF Shares; 0.16% for the Total Stock Market Index Fund Investor Shares, 0.08% for Admiral Shares, 0.08% for Signal Shares, 0.05% for Institutional Shares, and 0.07% for ETF Shares. The dollar amounts shown as “Expenses Paid” are equal to the annualized expense ratio multiplied by the average account value over the period, multiplied by the number of days in the most recent six-month period, then divided by the number of days in the most recent 12-month period.
85
Six Months Ended June 30, 20071 | | | |
| Beginning | Ending | Expenses |
| Account Value | Account Value | Paid During |
Index Fund | 12/31/2006 | 6/30/2007 | Period2 |
Based on Hypothetical 5% Yearly Return | | | |
Growth | | | |
Investor Shares | $1,000.00 | $1,023.70 | $1.10 |
Admiral Shares | 1,000.00 | 1,024.30 | 0.50 |
Institutional Shares | 1,000.00 | 1,024.45 | 0.35 |
ETF Shares | 1,000.00 | 1,024.25 | 0.55 |
Value | | | |
Investor Shares | $1,000.00 | $1,023.80 | $1.00 |
Admiral Shares | 1,000.00 | 1,024.30 | 0.50 |
Institutional Shares | 1,000.00 | 1,024.45 | 0.35 |
ETF Shares | 1,000.00 | 1,024.25 | 0.55 |
Large-Cap | | | |
Investor Shares | $1,000.00 | $1,023.80 | $1.00 |
Admiral Shares | 1,000.00 | 1,024.30 | 0.50 |
Institutional Shares | 1,000.00 | 1,024.40 | 0.40 |
ETF Shares | 1,000.00 | 1,024.45 | 0.35 |
Total Stock Market | | | |
Investor Shares | $1,000.00 | $1,024.00 | $0.80 |
Admiral Shares | 1,000.00 | 1,024.40 | 0.40 |
Signal Shares | 1,000.00 | 1,024.40 | 0.40 |
Institutional Shares | 1,000.00 | 1,024.55 | 0.25 |
ETF Shares | 1,000.00 | 1,024.45 | 0.35 |
1 This table does not include data for funds or share classes of funds with fewer than six months of history.
2 The calculations are based on expenses incurred in the most recent six-month period.The funds’ annualized six-month expense ratios for that period are: 0.22% for the Growth Index Fund Investor Shares, 0.10% for Admiral Shares, 0.07% for Institutional Shares, and 0.11% for ETF Shares; 0.20% for the Value Index Fund Investor Shares, 0.10% for Admiral Shares, 0.07% for Institutional Shares, and 0.11% for ETF Shares; 0.20% for the Large-Cap Index Fund Investor Shares, 0.10% for Admiral Shares, 0.08% for Institutional Shares, and 0.07% for ETF Shares; 0.16% for the Total Stock Market Index Fund Investor Shares, 0.08% for Admiral Shares, 0.08% for Signal Shares, 0.05% for Institutional Shares, and 0.07% for ETF Shares. The dollar amounts shown as “Expenses Paid” are equal to the annualized expense ratio multiplied by the average account value over the period, multiplied by the number of days in the most recent six-month period, then divided by the number of days in the most recent 12-month period.
86
Trustees Approve Advisory Arrangement
The board of trustees of Vanguard Growth Index Fund, Value Index Fund, Large-Cap Index Fund, and Total Stock Market Index Fund has renewed the funds’ investment advisory arrangement with The Vanguard Group, Inc. Vanguard—through its Quantitative Equity Group—serves as the investment advisor for the funds. The board determined that continuing the funds’ internalized management structure was in the best interests of the funds and their shareholders.
The board based its decision upon an evaluation of the advisor’s investment staff, portfolio management process, and performance. The trustees considered the factors discussed below, among others. However, no single factor determined whether the board approved the arrangement. Rather, it was the totality of the circumstances that drove the board’s decision.
Nature, extent, and quality of services
The board considered the quality of the funds’ investment management over both short- and long-term periods, and took into account the organizational depth and stability of the advisor. Vanguard has been managing investments for more than two decades. George U. Sauter, Vanguard managing director and chief investment officer, has been in the investment management business since 1985. Mr. Sauter has led the Quantitative Equity Group since 1987. The Quantitative Equity Group adheres to a sound, disciplined investment management process; the team has considerable experience, stability, and depth.
The board concluded that Vanguard’s experience, stability, depth, and performance, among other factors, warranted continuation of the advisory arrangement.
Investment performance
The board considered the short- and long-term performance of the funds, including any periods of outperformance or underperformance of their target benchmarks and peer groups. The board concluded that the funds have performed in line with expectations, and that their results have been consistent with their investment strategies. Information about the funds’ most recent performance can be found on the Performance Summary pages of this report.
Cost
The board concluded that the funds’ expense ratios were far below the average expense ratios charged by funds in their respective peer groups. The board noted that the funds’ advisory expense ratios were also well below their peer-group averages. Information about the funds’ expense ratios appears in the About Your Fund’s Expenses section of this report as well as in the Financial Statements sections.
The board does not conduct a profitability analysis of Vanguard because of Vanguard’s unique “at-cost” structure. Unlike most other mutual fund management companies, Vanguard is owned by the funds it oversees, and produces “profits” only in the form of reduced expenses for fund shareholders.
The benefit of economies of scale
The board concluded that the funds’ low-cost arrangement with Vanguard ensures that the funds will realize economies of scale as they grow, with the cost to shareholders declining as fund assets increase.
The board will consider whether to renew the advisory arrangement again after a one-year period.
87
Glossary
Beta. A measure of the magnitude of a fund’s past share-price fluctuations in relation to the ups and downs of a given market index. The index is assigned a beta of 1.00. Compared with a given index, a fund with a beta of 1.20 typically would have seen its share price rise or fall by 12% when the index rose or fell by 10%. A fund’s beta should be reviewed in conjunction with its R-squared (see definition below). The lower the R-squared, the less correlation there is between the fund and the index, and the less reliable beta is as an indicator of volatility.
Earnings Growth Rate. The average annual rate of growth in earnings over the past five years for the stocks now in a fund.
Expense Ratio. The percentage of a fund’s average net assets used to pay its annual administrative and advisory expenses. These expenses directly reduce returns to investors.
Foreign Holdings. The percentage of a fund represented by stocks or depositary receipts of companies based outside the United States.
Inception Date. The date on which the assets of a fund (or one of its share classes) are first invested in accordance with the fund’s investment objective. For funds with a subscription period, the inception date is the day after that period ends. Investment performance is measured from the inception date.
Median Market Cap. An indicator of the size of companies in which a fund invests; the midpoint of market capitalization (market price x shares outstanding) of a fund’s stocks, weighted by the proportion of the fund’s assets invested in each stock. Stocks representing half of the fund’s assets have market capitalizations above the median, and the rest are below it.
Price/Book Ratio. The share price of a stock divided by its net worth, or book value, per share. For a fund, the weighted average price/book ratio of the stocks it holds.
Price/Earnings Ratio. The ratio of a stock’s current price to its per-share earnings over the past year. For a fund, the weighted average P/E of the stocks it holds. P/E is an indicator of market expectations about corporate prospects; the higher the P/E, the greater the expectations for a company’s future growth.
R-Squared. A measure of how much of a fund’s past returns can be explained by the returns from the market in general, as measured by a given index. If a fund’s total returns were precisely synchronized with an index’s returns, its R-squared would be 1.00. If the fund’s returns bore no relationship to the index’s returns, its R-squared would be 0.
Return on Equity. The annual average rate of return generated by a company during the past five years for each dollar of shareholder’s equity (net income divided by shareholder’s equity). For a fund, the weighted average return on equity for the companies whose stocks it holds.
Short-Term Reserves. The percentage of a fund invested in highly liquid, short-term securities that can be readily converted to cash.
Turnover Rate. An indication of the fund’s trading activity. Funds with high turnover rates incur higher transaction costs and may be more likely to distribute capital gains (which may be taxable to investors). The turnover rate excludes in-kind transactions, which have minimal impact on costs.
Yield. A snapshot of a fund’s income from interest and dividends. The yield, expressed as a percentage of the fund’s net asset value, is based on income earned over the past 30 days and is annualized, or projected forward for the coming year. The index yield is based on the current annualized rate of income provided by securities in the index.
88
This page intentionally left blank.
This page intentionally left blank.
This page intentionally left blank.
The People Who Govern Your Fund
The trustees of your mutual fund are there to see that the fund is operated and managed in your best interests since, as a shareholder, you are a part owner of the fund. Your fund’s trustees also serve on the board of directors of The Vanguard Group, Inc., which is owned by the Vanguard funds and provides services to them on an at-cost basis.
A majority of Vanguard’s board members are independent, meaning that they have no affiliation with Vanguard or the funds they oversee, apart from the sizable personal investments they have made as private individuals.
Our independent board members bring distinguished backgrounds in business, academia, and public service to their task of working with Vanguard officers to establish the policies and oversee the activities of the funds. Among board members’ responsibilities are selecting investment advisors for the funds; monitoring fund operations, performance, and costs; reviewing contracts; nominating and selecting new trustees/directors; and electing Vanguard officers.
Each trustee serves a fund until its termination; or until the trustee’s retirement, resignation, or death; or otherwise as specified in the fund’s organizational documents. Any trustee may be removed at a shareholders’ meeting by a vote representing two-thirds of the net asset value of all shares of the fund together with shares of other Vanguard funds organized within the same trust. The table on these two pages shows information for each trustee and executive officer of the fund. The mailing address of the trustees and officers is P.O. Box 876, Valley Forge, PA 19482.
Chairman of the Board, Chief Executive Officer, and Trustee |
| |
John J. Brennan1 | |
Born 1954 | Principal Occupation(s) During the Past Five Years: Chairman of the Board, Chief |
Trustee since May 1987; | Executive Officer, and Director/Trustee of The Vanguard Group, Inc., and of each |
Chairman of the Board and | of the investment companies served by The Vanguard Group. |
Chief Executive Officer | |
147 Vanguard Funds Overseen | |
| |
Independent Trustees | |
| |
Charles D. Ellis | |
Born 1937 | Principal Occupation(s) During the Past Five Years: Applecore Partners (pro bono |
Trustee since January 2001 | ventures in education); Senior Advisor to Greenwich Associates (international |
147 Vanguard Funds Overseen | business strategy consulting); Successor Trustee of Yale University; Overseer of |
| the Stern School of Business at New York University; Trustee of the Whitehead |
| Institute for Biomedical Research. |
Rajiv L. Gupta | |
Born 1945 | Principal Occupation(s) During the Past Five Years: Chairman and Chief |
Trustee since December 20012 | Executive Officer of Rohm and Haas Co. (chemicals); Board Member of the |
147 Vanguard Funds Overseen | American Chemistry Council;Director of Tyco International, Ltd. (diversified |
| manufacturing and services) since 2005;Trustee of Drexel University and of the |
| Chemical Heritage Foundation. |
Amy Gutmann | |
Born 1949 | Principal Occupation(s) During the Past Five Years: President of the University of |
Trustee since June 2006 | Pennsylvania since 2004; Professor in the School of Arts and Sciences, |
147 Vanguard Funds Overseen | Annenberg School for Communication, and Graduate School of Education of the |
| University of Pennsylvania since 2004; Provost (2001–2004) and Laurance S. |
| Rockefeller Professor of Politics and the University Center for Human Values |
| (1990–2004), Princeton University; Director of Carnegie Corporation of New York |
| since 2005 and of Schuylkill River Development Corporation and Greater |
| Philadelphia Chamber of Commerce since 2004. |
JoAnn Heffernan Heisen | |
Born 1950 | Principal Occupation(s) During the Past Five Years: Corporate Vice President and |
Trustee since July 1998 | Chief Global Diversity Officer since 2006, Vice President and Chief Information |
147 Vanguard Funds Overseen | Officer (1997–2005), and Member of the Executive Committee of Johnson & |
| Johnson (pharmaceuticals/consumer products); Director of the University Medical |
| Center at Princeton and Women’s Research and Education Institute. |
| |
André F. Perold | |
Born 1952 | Principal Occupation(s) During the Past Five Years: George Gund Professor of |
Trustee since December 2004 | Finance and Banking, Harvard Business School; Senior Associate Dean, Director |
147 Vanguard Funds Overseen | of Faculty Recruiting, and Chair of Finance Faculty, Harvard Business School; |
| Director and Chairman of UNX, Inc. (equities trading firm) since 2003; Chair of the |
| Investment Committee of HighVista Strategies LLC (private investment firm) since |
| 2005. |
| |
Alfred M. Rankin, Jr. | |
Born 1941 | Principal Occupation(s) During the Past Five Years: Chairman, President, Chief |
Trustee since January 1993 | Executive Officer, and Director of NACCO Industries, Inc. (forklift |
147 Vanguard Funds Overseen | trucks/housewares/lignite); Director of Goodrich Corporation (industrial |
| products/aircraft systems and services). |
| |
J. Lawrence Wilson | |
Born 1936 | Principal Occupation(s) During the Past Five Years: Retired Chairman and Chief |
Trustee since April 1985 | Executive Officer of Rohm and Haas Co. (chemicals); Director of Cummins Inc. |
147 Vanguard Funds Overseen | (diesel engines) and AmerisourceBergen Corp. (pharmaceutical distribution); |
| Trustee of Vanderbilt University and of Culver Educational Foundation. |
Executive Officers1 | | |
| | |
Heidi Stam | | |
Born 1956 | Principal Occupation(s) During the Past Five Years: Managing Director of The |
Secretary since July 2005 | Vanguard Group, Inc., since 2006; General Counsel of The Vanguard Group since |
147 Vanguard Funds Overseen | 2005; Secretary of The Vanguard Group, and of each of the investment companies |
| served by The Vanguard Group, since 2005; Principal of The Vanguard Group |
| (1997–2006). | |
| | |
Thomas J. Higgins | | |
Born 1957 | Principal Occupation(s) During the Past Five Years: Principal of The Vanguard |
Treasurer since July 1998 | Group, Inc.;Treasurer of each of the investment companies served by The |
147 Vanguard Funds Overseen | Vanguard Group. | |
| | |
Vanguard Senior Management Team | |
| | |
R. Gregory Barton | Kathleen C. Gubanich | Michael S. Miller |
Mortimer J. Buckley | Paul A. Heller | Ralph K. Packard |
James H. Gately | F. William McNabb, III | George U. Sauter |
| | |
Founder | | |
| | |
John C. Bogle | | |
Chairman and Chief Executive Officer, 1974–1996 | |
1 Officers of the funds are “interested persons” as defined in the Investment Company Act of 1940.
2 December 2002 for Vanguard Equity Income Fund, Vanguard Growth Equity Fund, the Vanguard Municipal Bond Funds, and the Vanguard State Tax-Exempt Funds.
More information about the trustees is in the Statement of Additional Information, available from The Vanguard Group.

P.O. Box 2600
Valley Forge, PA 19482-2600
Connect with Vanguard® > www.vanguard.com
Fund Information > 800-662-7447 | Vanguard, Admiral, Signal, Connect with Vanguard, and |
| the ship logo are trademarks of The Vanguard Group, |
| Inc. |
Direct Investor Account Services > 800-662-2739 | |
| S&P 500® , Standard & Poor’s 500, and 500 are |
Institutional Investor Services > 800-523-1036 | |
| trademarks of The McGraw-Hill Companies, Inc., and |
Text Telephone for People | have been licensed for use by The Vanguard Group, Inc. |
With Hearing Impairment > 800-952-3335 | Vanguard mutual funds are not sponsored, endorsed, |
| sold, or promoted by Standard & Poor’s, and Standard & |
| Poor’s makes no representation regarding the |
| advisability of investing in the funds. |
This material may be used in conjunction | |
with the offering of shares of any Vanguard | All other marks are the exclusive property of their |
fund only if preceded or accompanied by | |
the fund’s current prospectus. | respective owners. All comparative mutual fund data are |
| from Lipper Inc. or Morningstar, Inc., unless otherwise |
| noted. |
| |
| You can obtain a free copy of Vanguard’s proxy voting |
You can review and copy information about your fund | guidelines by visiting our website, www.vanguard.com, |
at the SEC’s Public Reference Room in Washington, | and searching for “proxy voting guidelines,” or by calling |
D.C.To find out more about this public service, call the | Vanguard at 800-662-2739. They are also available from |
SEC at 202-551-8090. Information about your fund is | the SEC’s website, www.sec.gov. In addition, you may |
also available on the SEC’s website, and you can receive | obtain a free report on how your fund voted the proxies |
copies of this information, for a fee, by sending a | for securities it owned during the 12 months ended June |
request in either of two ways: via e-mail addressed to | 30. To get the report, visit either www.vanguard.com |
publicinfo@sec.gov or via regular mail addressed to the | or www.sec.gov. |
Public Reference Section, Securities and Exchange | |
Commission, Washington, DC 20549-0102. | |
| |
| |
| |
| |
| |
| |
| |
| |
| © 2007 The Vanguard Group, Inc. |
| All rights reserved. |
| Vanguard Marketing Corporation, Distributor. |
| |
| Q852 082007 |
Vanguard® U.S. Stock Index Funds
Large-Cap Index Fund
Statement of Net Assets (unaudited)
As of June 30, 2007
The Statement of Net Assets should be read in conjunction with the Statement of Operations, Statement of Changes in Net Assets, Financial Highlights, and Notes to Financial Statements, all of which appear in the accompanying report.
The fund provides a complete list of its holdings four times in each fiscal year, at the quarter-ends. For the second and fourth fiscal quarters, the lists appear in the fund’s semiannual and annual reports to shareholders. For the first and third fiscal quarters, the fund files the lists with the Securities and Exchange Commission on Form N-Q. Shareholders can look up the fund’s Forms N-Q on the SEC’s website at www.sec.gov. Forms N-Q may also be reviewed and copied at the SEC’s Public Reference Room (see the back cover of the accompanying report for further information).
| | | Market |
| | | Value• |
| | Shares | ($000) |
Common Stocks (99.7%)1 | | |
Consumer Discretionary (10.8%) | | |
| Home Depot, Inc. | 210,978 | 8,302 |
| Time Warner, Inc. | 394,432 | 8,299 |
| The Walt Disney Co. | 201,216 | 6,870 |
| McDonald’s Corp. | 124,479 | 6,319 |
* | Comcast Corp. Class A | 201,526 | 5,667 |
| Target Corp. | 84,353 | 5,365 |
| Lowe’s Cos., Inc. | 149,441 | 4,586 |
| News Corp., Class A | 191,741 | 4,067 |
* | Comcast Corp. | | |
| Special Class A | 108,977 | 3,047 |
* | Viacom Inc. Class B | 62,808 | 2,615 |
| The McGraw-Hill Cos., Inc. | 36,603 | 2,492 |
| Johnson Controls, Inc. | 20,356 | 2,357 |
| CBS Corp. | 70,605 | 2,353 |
* | Amazon.com, Inc. | 32,176 | 2,201 |
| Carnival Corp. | 45,050 | 2,197 |
* | Kohl’s Corp. | 30,422 | 2,161 |
| Macy’s Inc. | 54,274 | 2,159 |
| NIKE, Inc. Class B | 34,970 | 2,038 |
* | Starbucks Corp. | 77,558 | 2,035 |
| Best Buy Co., Inc. | 42,338 | 1,976 |
| Clear Channel | | |
| Communications, Inc. | 48,508 | 1,835 |
| Omnicom Group Inc. | 34,542 | 1,828 |
* | Coach, Inc. | 38,263 | 1,813 |
| Yum! Brands, Inc. | 54,864 | 1,795 |
| Staples, Inc. | 74,675 | 1,772 |
| Ford Motor Co. | 187,919 | 1,770 |
| General Motors Corp. | 46,691 | 1,765 |
| Harrah’s Entertainment, Inc. | 19,258 | 1,642 |
* | DIRECTV Group, Inc. | 69,566 | 1,608 |
1
| | | Market |
| | | Value• |
| | Shares | ($000) |
| J.C. Penney Co., Inc. | | |
| (Holding Co.) | 22,133 | 1,602 |
| Harley-Davidson, Inc. | 26,708 | 1,592 |
| Marriott International, Inc. | | |
| Class A | 36,104 | 1,561 |
* | Liberty Media Corp.– | | |
| Capital Series A | 12,732 | 1,498 |
| Starwood Hotels & | | |
| Resorts Worldwide, Inc. | 22,188 | 1,488 |
* | Sears Holdings Corp. | 8,738 | 1,481 |
* | Liberty Media Corp.– | | |
| Interactive Series A | 64,367 | 1,437 |
| International Game | | |
| Technology | 34,970 | 1,388 |
| Gannett Co., Inc. | 24,217 | 1,331 |
| TJX Cos., Inc. | 46,950 | 1,291 |
| Fortune Brands, Inc. | 15,611 | 1,286 |
| Hilton Hotels Corp. | 37,952 | 1,270 |
| News Corp., Class B | 51,037 | 1,171 |
| The Gap, Inc. | 58,589 | 1,119 |
* | MGM Mirage, Inc. | 13,248 | 1,093 |
| Nordstrom, Inc. | 21,206 | 1,084 |
* | Bed Bath & Beyond, Inc. | 29,314 | 1,055 |
| Mattel, Inc. | 40,748 | 1,031 |
| Limited Brands, Inc. | 37,094 | 1,018 |
* | EchoStar Communications | | |
| Corp. Class A | 21,338 | 925 |
| ^Garmin Ltd. | 12,290 | 909 |
| Whirlpool Corp. | 8,041 | 894 |
* | Apollo Group, Inc. Class A | 15,112 | 883 |
| Genuine Parts Co. | 17,556 | 871 |
* | Office Depot, Inc. | 28,620 | 867 |
* | Cablevision Systems | | |
| NY Group Class A | 23,665 | 856 |
| VF Corp. | 9,239 | 846 |
| Newell Rubbermaid, Inc. | 28,721 | 845 |
* | Las Vegas Sands Corp. | 10,990 | 840 |
| Eastman Kodak Co. | 29,822 | 830 |
* | Liberty Global, Inc. Class A | 19,767 | 811 |
| Sherwin-Williams Co. | 11,797 | 784 |
| H & R Block, Inc. | 33,410 | 781 |
| Harman International | | |
| Industries, Inc. | 6,474 | 756 |
* | Wyndham Worldwide Corp. | 20,553 | 745 |
| Tiffany & Co. | 13,976 | 742 |
* | Liberty Global, Inc. Series C | 18,790 | 738 |
* | IAC/InterActiveCorp | 20,868 | 722 |
* | AutoZone Inc. | 5,169 | 706 |
| Dollar General Corp. | 32,092 | 703 |
| Virgin Media Inc. | 28,756 | 701 |
* | Expedia, Inc. | 22,832 | 669 |
| Abercrombie & Fitch Co. | 9,141 | 667 |
2
| | | Market |
| | | Value• |
| | Shares | ($000) |
* | The Goodyear Tire & | | |
| Rubber Co. | 19,095 | 664 |
* | Discovery Holding Co. | | |
| Class A | 27,594 | 634 |
| Darden Restaurants Inc. | 14,194 | 624 |
| Polo Ralph Lauren Corp. | 6,291 | 617 |
| Royal Caribbean Cruises, Ltd. | 14,204 | 610 |
| Tim Hortons, Inc. | 19,778 | 608 |
| Black & Decker Corp. | 6,819 | 602 |
| D. R. Horton, Inc. | 29,130 | 581 |
* | Mohawk Industries, Inc. | 5,656 | 570 |
* | CarMax, Inc. | 22,160 | 565 |
* | GameStop Corp. Class A | 14,241 | 557 |
* | R.H. Donnelley Corp. | 7,249 | 549 |
| Idearc Inc. | 15,070 | 532 |
| American Eagle | | |
| Outfitters, Inc. | 20,631 | 529 |
| Lamar Advertising Co. | | |
| Class A | 8,424 | 529 |
| Wynn Resorts Ltd. | 5,814 | 521 |
* | Interpublic Group of Cos., Inc. | 45,381 | 517 |
| BorgWarner, Inc. | 6,010 | 517 |
| Family Dollar Stores, Inc. | 14,922 | 512 |
| Pulte Homes, Inc. | 22,439 | 504 |
| Centex Corp. | 12,295 | 493 |
| Hasbro, Inc. | 15,545 | 488 |
| Lennar Corp. Class A | 13,111 | 479 |
| Autoliv, Inc. | 8,389 | 477 |
| The Stanley Works | 7,712 | 468 |
| ServiceMaster Co. | 30,058 | 465 |
* | Dollar Tree Stores, Inc. | 10,612 | 462 |
| PetSmart, Inc. | 14,145 | 459 |
* | Penn National Gaming, Inc. | 7,431 | 447 |
| RadioShack Corp. | 13,461 | 446 |
| Ross Stores, Inc. | 14,483 | 446 |
* | Chico’s FAS, Inc. | 18,272 | 445 |
| Washington Post Co. Class B | 572 | 444 |
| Station Casinos, Inc. | 5,061 | 439 |
| Advance Auto Parts, Inc. | 10,816 | 438 |
* | ^Sirius Satellite Radio, Inc. | 142,413 | 430 |
| E.W. Scripps Co. Class A | 9,206 | 421 |
* | O’Reilly Automotive, Inc. | 11,249 | 411 |
| Leggett & Platt, Inc. | 18,360 | 405 |
| Liz Claiborne, Inc. | 10,573 | 394 |
| Brinker International, Inc. | 12,592 | 369 |
| Wendy’s International, Inc. | 9,844 | 362 |
* | AutoNation, Inc. | 16,023 | 360 |
| ^New York Times Co. Class A | 14,003 | 356 |
| Foot Locker, Inc. | 15,999 | 349 |
* | Toll Brothers, Inc. | 13,455 | 336 |
* | Career Education Corp. | 9,859 | 333 |
* | XM Satellite Radio | | |
| Holdings, Inc. | 27,667 | 326 |
* | NVR, Inc. | 468 | 318 |
| Jones Apparel Group, Inc. | 11,197 | 316 |
| Williams-Sonoma, Inc. | 9,856 | 311 |
3
| | | Market |
| | | Value• |
| | Shares | ($000) |
| KB Home | 7,872 | 310 |
| Brunswick Corp. | 9,348 | 305 |
* | Urban Outfitters, Inc. | 11,960 | 287 |
| Boyd Gaming Corp. | 5,794 | 285 |
| Gentex Corp. | 13,992 | 276 |
| Circuit City Stores, Inc. | 18,120 | 273 |
* | Getty Images, Inc. | 5,576 | 267 |
| Tribune Co. | 8,287 | 244 |
| Weight Watchers | | |
| International, Inc. | 3,663 | 186 |
| The McClatchy Co. Class A | 5,758 | 146 |
* | CTC Media, Inc. | 3,888 | 106 |
| | | 163,541 |
Consumer Staples (8.7%) | | |
| The Procter & Gamble Co. | 326,151 | 19,957 |
| Altria Group, Inc. | 216,773 | 15,204 |
| Wal-Mart Stores, Inc. | 258,455 | 12,434 |
| The Coca-Cola Co. | 215,438 | 11,270 |
| PepsiCo, Inc. | 169,245 | 10,976 |
| Kraft Foods Inc. | 169,005 | 5,957 |
| CVS/Caremark Corp. | 158,998 | 5,795 |
| Walgreen Co. | 103,486 | 4,506 |
| Anheuser-Busch Cos., Inc. | 79,400 | 4,141 |
| Colgate-Palmolive Co. | 53,012 | 3,438 |
| Kimberly-Clark Corp. | 47,138 | 3,153 |
| Costco Wholesale Corp. | 46,749 | 2,736 |
| Sysco Corp. | 63,731 | 2,102 |
| General Mills, Inc. | 35,660 | 2,083 |
| Archer-Daniels-Midland Co. | 60,714 | 2,009 |
| The Kroger Co. | 69,519 | 1,956 |
| Avon Products, Inc. | 45,884 | 1,686 |
| H.J. Heinz Co. | 34,077 | 1,618 |
| Safeway, Inc. | 45,479 | 1,548 |
| ConAgra Foods, Inc. | 52,258 | 1,404 |
| Kellogg Co. | 26,684 | 1,382 |
| Sara Lee Corp. | 75,657 | 1,316 |
| Reynolds American Inc. | 18,301 | 1,193 |
| Bunge Ltd. | 12,386 | 1,047 |
| Wm. Wrigley Jr. Co. | 18,548 | 1,026 |
| SuperValu Inc. | 21,491 | 995 |
| The Clorox Co. | 15,615 | 970 |
| Campbell Soup Co. | 24,034 | 933 |
| UST, Inc. | 16,550 | 889 |
| Carolina Group | 11,222 | 867 |
| The Hershey Co. | 16,688 | 845 |
| Coca-Cola Enterprises, Inc. | 27,320 | 656 |
| Tyson Foods, Inc. | 26,876 | 619 |
| Molson Coors Brewing Co. | | |
| Class B | 6,615 | 612 |
| Whole Foods Market, Inc. | 14,466 | 554 |
| The Estee Lauder Cos. Inc. | | |
| Class A | 12,122 | 552 |
4
| | | Market |
| | | Value• |
| | Shares | ($000) |
* | Energizer Holdings, Inc. | 5,518 | 550 |
* | Constellation Brands, Inc. | | |
| Class A | 21,660 | 526 |
| The Pepsi Bottling Group, Inc. | 14,111 | 475 |
| McCormick & Co., Inc. | 11,996 | 458 |
| Dean Foods Co. | 13,738 | 438 |
| Brown-Forman Corp. Class B | 5,467 | 400 |
* | Smithfield Foods, Inc. | 11,741 | 362 |
| Hormel Foods Corp. | 7,813 | 292 |
* | Bare Escentuals, Inc. | 5,595 | 191 |
| PepsiAmericas, Inc. | 6,700 | 165 |
| Wm. Wrigley Jr. Co. Class B | 1,719 | 95 |
| | | 132,381 |
Energy (10.7%) | | |
| ExxonMobil Corp. | 592,137 | 49,668 |
| Chevron Corp. | 225,275 | 18,977 |
| ConocoPhillips Co. | 161,455 | 12,674 |
| Schlumberger Ltd. | 121,791 | 10,345 |
| Occidental Petroleum Corp. | 86,673 | 5,017 |
| Valero Energy Corp. | 62,456 | 4,613 |
| Marathon Oil Corp. | 72,621 | 4,354 |
| Devon Energy Corp. | 43,575 | 3,411 |
| Halliburton Co. | 95,017 | 3,278 |
* | Transocean Inc. | 30,198 | 3,200 |
| Apache Corp. | 34,233 | 2,793 |
| Baker Hughes, Inc. | 33,099 | 2,785 |
| Anadarko Petroleum Corp. | 45,081 | 2,344 |
| XTO Energy, Inc. | 35,946 | 2,160 |
| Williams Cos., Inc. | 61,636 | 1,949 |
* | Weatherford International Ltd. | 35,003 | 1,934 |
* | National Oilwell Varco Inc. | 18,172 | 1,894 |
| EOG Resources, Inc. | 25,146 | 1,837 |
| GlobalSantaFe Corp. | 24,150 | 1,745 |
| Spectra Energy Corp. | 65,122 | 1,691 |
| Chesapeake Energy Corp. | 45,152 | 1,562 |
| Hess Corp. | 26,144 | 1,541 |
| Noble Corp. | 13,935 | 1,359 |
| Peabody Energy Corp. | 27,294 | 1,320 |
| El Paso Corp. | 72,773 | 1,254 |
| Smith International, Inc. | 20,667 | 1,212 |
| Noble Energy, Inc. | 17,567 | 1,096 |
| Murphy Oil Corp. | 18,382 | 1,093 |
* | Nabors Industries, Inc. | 30,960 | 1,033 |
| Sunoco, Inc. | 12,552 | 1,000 |
| ENSCO International, Inc. | 15,581 | 951 |
* | Ultra Petroleum Corp. | 15,702 | 867 |
| CONSOL Energy, Inc. | 18,798 | 867 |
| BJ Services Co. | 30,234 | 860 |
* | Cameron International Corp. | 11,533 | 824 |
| Tesoro Corp. | 14,042 | 803 |
* | Southwestern Energy Co. | 17,340 | 772 |
| Diamond Offshore Drilling, Inc. | 7,133 | 724 |
5
| | | Market |
| | | Value• |
| | Shares | ($000) |
* | Grant Prideco, Inc. | 13,241 | 713 |
* | Pride International, Inc. | 16,867 | 632 |
| Pioneer Natural Resources Co. | 12,777 | 622 |
* | Newfield Exploration Co. | 13,296 | 606 |
| Range Resources Corp. | 15,169 | 567 |
* | FMC Technologies Inc. | 6,994 | 554 |
| Arch Coal, Inc. | 14,593 | 508 |
| Rowan Cos., Inc. | 11,399 | 467 |
| Patterson-UTI Energy, Inc. | 16,252 | 426 |
| Cimarex Energy Co. | 8,521 | 336 |
| Pogo Producing Co. | 6,085 | 309 |
* | CNX Gas Corp. | 3,091 | 95 |
| | | 161,642 |
Financials (20.8%) | | |
| Citigroup, Inc. | 506,767 | 25,992 |
| Bank of America Corp. | 460,811 | 22,529 |
| JPMorgan Chase & Co. | 357,855 | 17,338 |
| American International | | |
| Group, Inc. | 228,431 | 15,997 |
| Wells Fargo & Co. | 329,354 | 11,583 |
| Wachovia Corp. | 196,849 | 10,089 |
| The Goldman | | |
| Sachs Group, Inc. | 38,416 | 8,327 |
| Morgan Stanley | 98,995 | 8,304 |
| Merrill Lynch & Co., Inc. | 86,578 | 7,236 |
| American Express Co. | 111,337 | 6,812 |
| Fannie Mae | 100,819 | 6,587 |
| U.S. Bancorp | 182,496 | 6,013 |
| MetLife, Inc. | 78,578 | 5,067 |
| Prudential Financial, Inc. | 49,343 | 4,798 |
* | Berkshire Hathaway Inc. | | |
| Class B | 1,296 | 4,672 |
| Freddie Mac | 71,607 | 4,347 |
| Washington Mutual, Inc. | 96,997 | 4,136 |
| The Travelers Cos., Inc. | 69,837 | 3,736 |
| The Allstate Corp. | 60,718 | 3,735 |
| Lehman Brothers | | |
| Holdings, Inc. | 46,205 | 3,443 |
| Capital One Financial Corp. | 42,376 | 3,324 |
6
| | | Market |
| | | Value• |
| | Shares | ($000) |
| The Hartford Financial | | |
| Services Group Inc. | 33,130 | 3,264 |
| The Bank of | | |
| New York Co., Inc. | 78,234 | 3,242 |
| SunTrust Banks, Inc. | 34,817 | 2,985 |
| AFLAC Inc. | 51,130 | 2,628 |
| PNC Financial Services Group | 35,755 | 2,559 |
| Regions Financial Corp. | 75,397 | 2,496 |
| Franklin Resources Corp. | 18,404 | 2,438 |
| SLM Corp. | 42,191 | 2,429 |
| State Street Corp. | 34,525 | 2,362 |
| BB&T Corp. | 56,719 | 2,307 |
| The Chubb Corp. | 42,558 | 2,304 |
| Charles Schwab Corp. | 111,380 | 2,286 |
| Countrywide Financial Corp. | 61,033 | 2,219 |
| Simon Property | | |
| Group, Inc. REIT | 22,847 | 2,126 |
| ACE Ltd. | 33,735 | 2,109 |
| Fifth Third Bancorp | 51,767 | 2,059 |
| Lincoln National Corp. | 28,670 | 2,034 |
| Loews Corp. | 39,401 | 2,009 |
| National City Corp. | 59,500 | 1,983 |
| The Chicago | | |
| Mercantile Exchange | 3,598 | 1,923 |
| Mellon Financial Corp. | 43,025 | 1,893 |
| Marsh & McLennan Cos., Inc. | 57,007 | 1,760 |
| Progressive Corp. of Ohio | 73,017 | 1,747 |
| Bear Stearns Co., Inc. | 11,809 | 1,653 |
| The Principal | | |
| Financial Group, Inc. | 27,791 | 1,620 |
| Genworth Financial Inc. | 46,728 | 1,607 |
| XL Capital Ltd. Class A | 18,640 | 1,571 |
| Vornado Realty Trust REIT | 14,092 | 1,548 |
| Moody’s Corp. | 24,626 | 1,532 |
| ProLogis REIT | 25,572 | 1,455 |
| KeyCorp | 41,249 | 1,416 |
| Ameriprise Financial, Inc. | 22,260 | 1,415 |
| Equity Residential REIT | 30,169 | 1,377 |
| T. Rowe Price Group Inc. | 26,042 | 1,351 |
| Legg Mason Inc. | 13,657 | 1,344 |
| Archstone-Smith Trust REIT | 22,609 | 1,336 |
| Northern Trust Corp. | 20,384 | 1,309 |
| Host Hotels & | | |
| Resorts Inc. REIT | 55,638 | 1,286 |
| Boston Properties, Inc. REIT | 12,058 | 1,231 |
| Aon Corp. | 28,834 | 1,229 |
| General Growth | | |
| Properties Inc. REIT | 22,458 | 1,189 |
| Marshall & Ilsley Corp. | 23,693 | 1,128 |
7
| | | Market |
| | | Value• |
| | Shares | ($000) |
| CIT Group Inc. | 20,526 | 1,125 |
| Nymex Holdings Inc. | 8,153 | 1,024 |
| NYSE Euronext | 13,812 | 1,017 |
| Public Storage, Inc. REIT | 13,179 | 1,012 |
* | E*TRADE Financial Corp. | 43,984 | 972 |
| Comerica, Inc. | 16,327 | 971 |
| Avalonbay | | |
| Communities, Inc. REIT | 8,094 | 962 |
| Ambac Financial Group, Inc. | 10,922 | 952 |
| Unum Group | 35,272 | 921 |
| Compass Bancshares Inc. | 13,346 | 921 |
| Kimco Realty Corp. REIT | 23,161 | 882 |
| MBIA, Inc. | 13,955 | 868 |
| Zions Bancorp | 11,011 | 847 |
| Sovereign Bancorp, Inc. | 39,195 | 829 |
| Synovus Financial Corp. | 26,978 | 828 |
* | CBOT Holdings, Inc. Class A | 3,812 | 788 |
* | CB Richard Ellis Group, Inc. | 21,045 | 768 |
| Plum Creek | | |
| Timber Co. Inc. REIT | 18,249 | 760 |
| American Capital | | |
| Strategies, Ltd. | 17,828 | 758 |
| SL Green Realty Corp. REIT | 6,105 | 756 |
| Everest Re Group, Ltd. | 6,737 | 732 |
| M & T Bank Corp. | 6,835 | 731 |
| Willis Group Holdings Ltd. | 16,206 | 714 |
| Cincinnati Financial Corp. | 16,204 | 703 |
| Torchmark Corp. | 10,178 | 682 |
| Commerce Bancorp, Inc. | 18,317 | 678 |
| Safeco Corp. | 10,871 | 677 |
| Hudson City Bancorp, Inc. | 54,651 | 668 |
| A.G. Edwards, Inc. | 7,823 | 661 |
* | IntercontinentalExchange Inc. | 4,330 | 640 |
| Assurant, Inc. | 10,857 | 640 |
| The Macerich Co. REIT | 7,380 | 608 |
| Health Care Properties | | |
| Investors REIT | 20,725 | 600 |
| Developers Diversified | | |
| Realty Corp. REIT | 11,211 | 591 |
| Leucadia National Corp. | 16,705 | 589 |
| iStar Financial Inc. REIT | 13,038 | 578 |
| Axis Capital Holdings Ltd. | 14,037 | 571 |
* | TD Ameritrade Holding Corp. | 27,739 | 555 |
| Janus Capital Group Inc. | 19,727 | 549 |
| W.R. Berkley Corp. | 16,851 | 548 |
| Eaton Vance Corp. | 12,319 | 544 |
| People’s United Financial Inc. | 30,659 | 544 |
| AMB Property Corp. REIT | 10,193 | 542 |
| White Mountains | | |
8
| | | Market |
| | | Value• |
| | Shares | ($000) |
| Insurance Group Inc. | 891 | 540 |
| Huntington Bancshares Inc. | 23,019 | 523 |
| Fidelity National | | |
| Financial, Inc. Class A | 21,593 | 512 |
| Nuveen Investments, Inc. | | |
| Class A | 8,182 | 509 |
| Apartment Investment & | | |
| Management Co. | | |
| Class A REIT | 9,990 | 504 |
| Regency Centers Corp. REIT | 7,138 | 503 |
| First Horizon National Corp. | 12,894 | 503 |
| Duke Realty Corp. REIT | 14,016 | 500 |
| New York Community | | |
| Bancorp, Inc. | 28,833 | 491 |
| MGIC Investment Corp. | 8,562 | 487 |
| Ventas, Inc. REIT | 13,398 | 486 |
| ^Allied Capital Corp. | 15,667 | 485 |
| Old Republic | | |
| International Corp. | 22,689 | 482 |
* | Markel Corp. | 984 | 477 |
| PartnerRe Ltd. | 5,892 | 457 |
| SEI Investments Co. | 15,346 | 446 |
| Radian Group, Inc. | 8,244 | 445 |
| Federal Realty | | |
| Investment Trust REIT | 5,762 | 445 |
| Popular, Inc. | 27,241 | 438 |
| RenaissanceRe Holdings Ltd. | 7,046 | 437 |
| Investors Financial | | |
| Services Corp. | 6,851 | 423 |
| First American Corp. | 8,454 | 418 |
| Liberty Property Trust REIT | 9,332 | 410 |
| Associated Banc-Corp. | 12,495 | 409 |
| The PMI Group Inc. | 9,034 | 404 |
| Hospitality Properties | | |
| Trust REIT | 9,566 | 397 |
| Forest City Enterprise Class A | 6,379 | 392 |
| Camden Property Trust REIT | 5,802 | 389 |
| HCC Insurance Holdings, Inc. | 11,557 | 386 |
| Colonial BancGroup, Inc. | 15,348 | 383 |
| Federated Investors, Inc. | 9,683 | 371 |
| UDR, Inc. REIT | 13,925 | 366 |
| Nationwide Financial | | |
| Services, Inc. | 5,564 | 352 |
| UnionBanCal Corp. | 5,708 | 341 |
* | Arch Capital Group Ltd. | 4,647 | 337 |
| TCF Financial Corp. | 12,106 | 337 |
| The St. Joe Co. | 7,262 | 337 |
| Protective Life Corp. | 6,886 | 329 |
| Weingarten Realty | | |
9
| | | Market |
| | | Value• |
| | Shares | ($000) |
| Investors REIT | 7,953 | 327 |
* | AmeriCredit Corp. | 12,013 | 319 |
| City National Corp. | 4,133 | 314 |
| Brown & Brown, Inc. | 12,297 | 309 |
| CapitalSource Inc. REIT | 11,984 | 295 |
| Erie Indemnity Co. Class A | 5,386 | 291 |
| Commerce Bancshares, Inc. | 6,129 | 278 |
| The First Marblehead Corp. | 6,766 | 261 |
* | Nasdaq Stock Market Inc. | 8,675 | 258 |
| American Financial Group, Inc. | 7,331 | 250 |
| Unitrin, Inc. | 4,836 | 238 |
| Astoria Financial Corp. | 9,104 | 228 |
| Transatlantic Holdings, Inc. | 2,679 | 191 |
| Mercury General Corp. | 2,767 | 152 |
| BOK Financial Corp. | 2,364 | 126 |
| Student Loan Corp. | 407 | 83 |
| | | 316,501 |
Health Care (11.6%) | | |
| Pfizer Inc. | 745,333 | 19,058 |
| Johnson & Johnson | 299,083 | 18,429 |
| Merck & Co., Inc. | 224,433 | 11,177 |
| Abbott Laboratories | 159,516 | 8,542 |
| Wyeth | 139,096 | 7,976 |
| UnitedHealth Group Inc. | 139,306 | 7,124 |
* | Amgen, Inc. | 120,610 | 6,668 |
| Bristol-Myers Squibb Co. | 208,776 | 6,589 |
| Medtronic, Inc. | 119,330 | 6,188 |
| Eli Lilly & Co. | 105,302 | 5,884 |
* | WellPoint Inc. | 63,305 | 5,054 |
| Schering-Plough Corp. | 153,157 | 4,662 |
| Baxter International, Inc. | 67,664 | 3,812 |
* | Genentech, Inc. | 49,027 | 3,709 |
* | Gilead Sciences, Inc. | 95,054 | 3,685 |
| Cardinal Health, Inc. | 41,330 | 2,920 |
| Aetna Inc. | 53,336 | 2,635 |
* | Medco Health Solutions, Inc. | 29,822 | 2,326 |
* | Celgene Corp. | 38,437 | 2,204 |
* | Thermo Fisher Scientific, Inc. | 42,127 | 2,179 |
* | Zimmer Holdings, Inc. | 24,648 | 2,092 |
* | Boston Scientific Corp. | 129,406 | 1,985 |
* | Biogen Idec Inc. | 35,709 | 1,910 |
| Becton, Dickinson & Co. | 25,275 | 1,883 |
| Stryker Corp. | 29,494 | 1,861 |
| Allergan, Inc. | 31,824 | 1,834 |
| McKesson Corp. | 30,547 | 1,822 |
* | Genzyme Corp. | 27,205 | 1,752 |
| CIGNA Corp. | 31,820 | 1,662 |
* | St. Jude Medical, Inc. | 36,552 | 1,517 |
* | Forest Laboratories, Inc. | 32,939 | 1,504 |
10
| | | Market |
| | | Value• |
| | Shares | ($000) |
* | Express Scripts Inc. | 23,908 | 1,196 |
| Biomet, Inc. | 24,163 | 1,105 |
* | Humana Inc. | 17,256 | 1,051 |
* | Laboratory Corp. of | | |
| America Holdings | 12,945 | 1,013 |
| AmerisourceBergen Corp. | 19,522 | 966 |
* | Coventry Health Care Inc. | 16,421 | 947 |
| Quest Diagnostics, Inc. | 17,114 | 884 |
| C.R. Bard, Inc. | 10,621 | 878 |
| IMS Health, Inc. | 20,064 | 645 |
* | Health Net Inc. | 12,054 | 636 |
* | Hospira, Inc. | 16,025 | 626 |
* | Waters Corp. | 10,496 | 623 |
| Applera Corp.–Applied | | |
| Biosystems Group | 19,040 | 581 |
* | DaVita, Inc. | 10,744 | 579 |
| DENTSPLY International Inc. | 14,919 | 571 |
* | Varian Medical Systems, Inc. | 13,205 | 561 |
* | Amylin Pharmaceuticals, Inc. | 13,502 | 556 |
* | Intuitive Surgical, Inc. | 3,876 | 538 |
* | Barr Pharmaceuticals Inc. | 10,392 | 522 |
* | King Pharmaceuticals, Inc. | 24,996 | 511 |
* | Cephalon, Inc. | 6,332 | 509 |
| Manor Care, Inc. | 7,540 | 492 |
* | Triad Hospitals, Inc. | 9,156 | 492 |
* | Henry Schein, Inc. | 9,163 | 490 |
* | Endo Pharmaceuticals | | |
| Holdings, Inc. | 13,761 | 471 |
* | Sepracor Inc. | 11,246 | 461 |
| Mylan Laboratories, Inc. | 25,178 | 458 |
* | Covance, Inc. | 6,663 | 457 |
| Omnicare, Inc. | 12,598 | 454 |
* | Patterson Cos. | 11,506 | 429 |
* | Millipore Corp. | 5,578 | 419 |
| Pharmaceutical Product | | |
| Development, Inc. | 10,851 | 415 |
| Beckman Coulter, Inc. | 6,375 | 412 |
| Hillenbrand Industries, Inc. | 6,077 | 395 |
* | Community Health | | |
| Systems, Inc. | 9,746 | 394 |
| Bausch & Lomb, Inc. | 5,654 | 393 |
* | Lincare Holdings, Inc. | 9,596 | 382 |
* | Cerner Corp. | 6,810 | 378 |
* | Vertex Pharmaceuticals, Inc. | 12,991 | 371 |
* | Invitrogen Corp. | 4,968 | 366 |
* | Charles River | | |
| Laboratories, Inc. | 6,921 | 357 |
* | Millennium | | |
| Pharmaceuticals, Inc. | 31,998 | 338 |
11
| | | Market |
| | | Value• |
| | Shares | ($000) |
* | Watson Pharmaceuticals, Inc. | 10,128 | 329 |
* | Tenet Healthcare Corp. | 48,448 | 315 |
* | Kinetic Concepts, Inc. | 5,521 | 287 |
| Health Management | | |
| Associates Class A | 24,733 | 281 |
* | ImClone Systems, Inc. | 6,056 | 214 |
* | Warner Chilcott Ltd. | 10,284 | 186 |
| Brookdale Senior Living Inc. | 3,647 | 166 |
* | Abraxis Bioscience, Inc. | 3,430 | 76 |
| | | 176,819 |
Industrials (10.9%) | | |
| General Electric Co. | 1,062,833 | 40,685 |
| The Boeing Co. | 77,462 | 7,449 |
| United Technologies Corp. | 97,692 | 6,929 |
| Tyco International Ltd. | 204,314 | 6,904 |
| 3M Co. | 72,042 | 6,253 |
| Caterpillar, Inc. | 66,706 | 5,223 |
| United Parcel Service, Inc. | 68,766 | 5,020 |
| Honeywell International Inc. | 78,523 | 4,419 |
| Emerson Electric Co. | 82,453 | 3,859 |
| Lockheed Martin Corp. | 37,138 | 3,496 |
| FedEx Corp. | 30,140 | 3,345 |
| Burlington Northern | | |
| Santa Fe Corp. | 37,151 | 3,163 |
| Union Pacific Corp. | 26,629 | 3,066 |
| Deere & Co. | 23,425 | 2,828 |
| General Dynamics Corp. | 35,630 | 2,787 |
| Northrop Grumman Corp. | 34,434 | 2,681 |
| Illinois Tool Works, Inc. | 49,102 | 2,661 |
| Raytheon Co. | 46,085 | 2,484 |
| Norfolk Southern Corp. | 41,058 | 2,158 |
| Waste Management, Inc. | 55,088 | 2,151 |
| PACCAR, Inc. | 24,339 | 2,118 |
| CSX Corp. | 45,100 | 2,033 |
| Danaher Corp. | 25,447 | 1,921 |
| Ingersoll-Rand Co. | 31,703 | 1,738 |
| Precision Castparts Corp. | 14,165 | 1,719 |
| Eaton Corp. | 15,432 | 1,435 |
| Textron, Inc. | 11,636 | 1,281 |
| L-3 Communications | | |
| Holdings, Inc. | 12,942 | 1,260 |
| ITT Industries, Inc. | 18,134 | 1,238 |
| Rockwell Collins, Inc. | 17,399 | 1,229 |
| Southwest Airlines Co. | 81,632 | 1,217 |
| Parker Hannifin Corp. | 11,945 | 1,170 |
| Masco Corp. | 40,841 | 1,163 |
| Rockwell Automation, Inc. | 16,292 | 1,131 |
| American Standard Cos., Inc. | 18,689 | 1,102 |
| Dover Corp. | 21,057 | 1,077 |
12
| | | Market |
| | | Value• |
| | Shares | ($000) |
| Cooper Industries, Inc. | | |
| Class A | 18,831 | 1,075 |
| Pitney Bowes, Inc. | 22,930 | 1,074 |
| Cummins Inc. | 10,293 | 1,042 |
| Fluor Corp. | 9,144 | 1,018 |
| R.R. Donnelley & Sons Co. | 22,364 | 973 |
* | McDermott International, Inc. | 11,436 | 951 |
| Expeditors International of | | |
| Washington, Inc. | 22,081 | 912 |
| C.H. Robinson Worldwide Inc. | 17,099 | 898 |
* | Terex Corp. | 10,470 | 851 |
| Manpower Inc. | 8,814 | 813 |
* | Foster Wheeler Ltd. | 7,121 | 762 |
| Goodrich Corp. | 12,346 | 735 |
| Joy Global Inc. | 12,223 | 713 |
* | Jacobs Engineering Group Inc. | 12,242 | 704 |
| W.W. Grainger, Inc. | 7,419 | 690 |
| Avery Dennison Corp. | 10,236 | 680 |
| Equifax, Inc. | 15,215 | 676 |
* | AMR Corp. | 24,679 | 650 |
| The Dun & Bradstreet Corp. | 6,314 | 650 |
| Republic Services, Inc. | | |
| Class A | 19,996 | 613 |
| Robert Half International, Inc. | 16,433 | 600 |
| Pall Corp. | 12,752 | 586 |
| Cintas Corp. | 14,814 | 584 |
| Fastenal Co. | 13,292 | 556 |
| SPX Corp. | 5,913 | 519 |
| Roper Industries Inc. | 9,021 | 515 |
* | Monster Worldwide Inc. | 12,123 | 498 |
| Oshkosh Truck Corp. | 7,614 | 479 |
* | UAL Corp. | 11,523 | 468 |
* | Allied Waste Industries, Inc. | 34,237 | 461 |
* | KBR Inc. | 17,277 | 453 |
| Ametek, Inc. | 10,942 | 434 |
* | Hertz Global Holdings Inc. | 14,900 | 396 |
| Pentair, Inc. | 9,736 | 376 |
* | USG Corp. | 7,652 | 375 |
* | Spirit Aerosystems | | |
| Holdings Inc. | 10,393 | 375 |
* | ChoicePoint Inc. | 8,250 | 350 |
| J.B. Hunt Transport | | |
| Services, Inc. | 10,482 | 307 |
* | Owens Corning Inc. | 8,198 | 276 |
| The Corporate Executive | | |
| Board Co. | 4,027 | 261 |
* | US Airways Group Inc. | 8,571 | 259 |
* | First Solar, Inc. | 2,858 | 255 |
| | | 166,256 |
13
| | | Market |
| | | Value• |
| | Shares | ($000) |
Information Technology (15.4%) | | |
| Microsoft Corp. | 910,892 | 26,844 |
* | Cisco Systems, Inc. | 624,291 | 17,387 |
| International Business | | |
| Machines Corp. | 155,622 | 16,379 |
| Intel Corp. | 596,086 | 14,163 |
| Hewlett-Packard Co. | 279,071 | 12,452 |
* | Google Inc. | 23,089 | 12,084 |
* | Apple Computer, Inc. | 89,111 | 10,875 |
* | Oracle Corp. | 428,547 | 8,447 |
| QUALCOMM Inc. | 171,142 | 7,426 |
* | Dell Inc. | 211,289 | 6,032 |
| Texas Instruments, Inc. | 153,317 | 5,769 |
| Motorola, Inc. | 249,952 | 4,424 |
* | Corning, Inc. | 162,192 | 4,144 |
* | EMC Corp. | 227,450 | 4,117 |
* | eBay Inc. | 115,252 | 3,709 |
* | Yahoo! Inc. | 126,093 | 3,421 |
| Applied Materials, Inc. | 144,317 | 2,868 |
| Automatic Data | | |
| Processing, Inc. | 56,862 | 2,756 |
| Accenture Ltd. | 60,901 | 2,612 |
| First Data Corp. | 77,721 | 2,539 |
* | Adobe Systems, Inc. | 60,767 | 2,440 |
* | Sun Microsystems, Inc. | 372,111 | 1,957 |
* | Symantec Corp. | 95,519 | 1,929 |
* | Xerox Corp. | 98,058 | 1,812 |
| Western Union Co. | 79,799 | 1,662 |
* | Agilent Technologies, Inc. | 41,935 | 1,612 |
* | Electronic Arts Inc. | 32,110 | 1,519 |
| Electronic Data | | |
| Systems Corp. | 53,378 | 1,480 |
* | NVIDIA Corp. | 34,960 | 1,444 |
* | Broadcom Corp. | 48,843 | 1,429 |
* | Juniper Networks, Inc. | 55,429 | 1,395 |
| Paychex, Inc. | 35,489 | 1,388 |
| Analog Devices, Inc. | 34,533 | 1,300 |
| Seagate Technology | 56,759 | 1,236 |
| MasterCard, Inc. Class A | 6,998 | 1,161 |
* | SanDisk Corp. | 23,227 | 1,137 |
| KLA-Tencor Corp. | 20,649 | 1,135 |
| CA, Inc. | 43,703 | 1,129 |
* | Network Appliance, Inc. | 38,625 | 1,128 |
* | MEMC Electronic | | |
| Materials, Inc. | 18,415 | 1,126 |
* | Autodesk, Inc. | 23,834 | 1,122 |
| Linear Technology Corp. | 30,952 | 1,120 |
* | Cognizant Technology | | |
| Solutions Corp. | 14,792 | 1,111 |
14
| | | Market |
| | | Value• |
| | Shares | ($000) |
| Maxim Integrated | | |
| Products, Inc. | 33,228 | 1,110 |
| Fidelity National | | |
| Information Services, Inc. | 19,616 | 1,065 |
* | Computer Sciences Corp. | 17,698 | 1,047 |
* | Intuit, Inc. | 33,995 | 1,023 |
* | Micron Technology, Inc. | 78,126 | 979 |
* | NCR Corp. | 18,377 | 966 |
* | Fiserv, Inc. | 16,965 | 964 |
* | Marvell Technology Group Ltd. | 51,417 | 936 |
| National Semiconductor Corp. | 33,035 | 934 |
| Xilinx, Inc. | 34,416 | 921 |
| Microchip Technology, Inc. | 22,237 | 824 |
| Altera Corp. | 36,906 | 817 |
* | Advanced Micro Devices, Inc. | 56,805 | 812 |
* | VeriSign, Inc. | 25,187 | 799 |
* | Avaya Inc. | 46,988 | 791 |
* | Akamai Technologies, Inc. | 15,719 | 765 |
| Harris Corp. | 13,860 | 756 |
* | LAM Research Corp. | 14,582 | 750 |
* | Flextronics International Ltd. | 62,497 | 675 |
| Amphenol Corp. | 18,331 | 653 |
* | BMC Software, Inc. | 21,140 | 641 |
* | Cadence Design | | |
| Systems, Inc. | 28,865 | 634 |
* | Citrix Systems, Inc. | 18,619 | 627 |
* | Avnet, Inc. | 15,276 | 606 |
* | LSI Corp. | 79,436 | 597 |
* | McAfee Inc. | 16,456 | 579 |
* | BEA Systems, Inc. | 40,359 | 553 |
* | CDW Corp. | 6,441 | 547 |
* | Alliance Data Systems Corp. | 7,037 | 544 |
* | Affiliated Computer | | |
| Services, Inc. Class A | 9,518 | 540 |
* | Activision, Inc. | 28,886 | 539 |
* | Iron Mountain, Inc. | 19,438 | 508 |
* | Ceridian Corp. | 14,438 | 505 |
* | Lexmark International, Inc. | 10,140 | 500 |
* | Arrow Electronics, Inc. | 12,721 | 489 |
* | Tellabs, Inc. | 42,718 | 460 |
| Intersil Corp. | 14,231 | 448 |
* | Western Digital Corp. | 22,835 | 442 |
* | DST Systems, Inc. | 5,518 | 437 |
| Jabil Circuit, Inc. | 19,666 | 434 |
* | NAVTEQ Corp. | 10,094 | 427 |
* | Red Hat, Inc. | 18,811 | 419 |
* | salesforce.com, Inc. | 9,388 | 402 |
* | Compuware Corp. | 33,341 | 395 |
* | Novellus Systems, Inc. | 12,759 | 362 |
15
| | | Market |
| | | Value• |
| | Shares | ($000) |
* | Hewitt Associates, Inc. | 10,850 | 347 |
* | Teradyne, Inc. | 19,700 | 346 |
* | Ingram Micro, Inc. Class A | 15,765 | 342 |
* | Solectron Corp. | 92,912 | 342 |
* | CheckFree Corp. | 7,629 | 307 |
* | JDS Uniphase Corp. | 21,111 | 284 |
* | Zebra Technologies Corp. | | |
| Class A | 7,281 | 282 |
* | QLogic Corp. | 16,300 | 271 |
| Molex, Inc. Class A | 8,170 | 217 |
| Molex, Inc. | 6,574 | 197 |
| Total System Services, Inc. | 4,128 | 122 |
| AVX Corp. | 5,293 | 89 |
| | | 234,588 |
Materials (3.3%) | | |
| E.I. du Pont de | | |
| Nemours & Co. | 95,525 | 4,856 |
| Dow Chemical Co. | 99,173 | 4,385 |
| Monsanto Co. | 56,170 | 3,794 |
| Alcoa Inc. | 89,810 | 3,640 |
| Freeport-McMoRan | | |
| Copper & Gold, Inc. Class B | 38,818 | 3,215 |
| Praxair, Inc. | 33,345 | 2,401 |
| Nucor Corp. | 31,203 | 1,830 |
| Newmont Mining Corp. | | |
| (Holding Co.) | 46,616 | 1,821 |
| Air Products & Chemicals, Inc. | 22,427 | 1,802 |
| International Paper Co. | 44,688 | 1,745 |
| Weyerhaeuser Co. | 21,787 | 1,720 |
| United States Steel Corp. | 12,284 | 1,336 |
| PPG Industries, Inc. | 16,997 | 1,294 |
| Vulcan Materials Co. | 9,880 | 1,132 |
| Allegheny Technologies Inc. | 9,397 | 986 |
| Lyondell Chemical Co. | 23,215 | 862 |
| Ecolab, Inc. | 19,399 | 828 |
| Rohm & Haas Co. | 14,641 | 801 |
| Martin Marietta Materials, Inc. | 4,651 | 754 |
| Temple-Inland Inc. | 10,846 | 667 |
| MeadWestvaco Corp. | 18,660 | 659 |
* | The Mosaic Co. | 15,824 | 617 |
* | Domtar Corp. | 53,317 | 595 |
| Sigma-Aldrich Corp. | 13,617 | 581 |
| Celanese Corp. Series A | 14,655 | 568 |
* | Owens-Illinois, Inc. | 15,848 | 555 |
| Eastman Chemical Co. | 8,605 | 554 |
| Sealed Air Corp. | 16,740 | 519 |
| Ball Corp. | 9,543 | 507 |
| International Flavors & | | |
| Fragrances, Inc. | 8,408 | 438 |
16
| | | Market |
| | | Value• |
| | Shares | ($000) |
* | Pactiv Corp. | 13,717 | 437 |
| Sonoco Products Co. | 9,816 | 420 |
* | Crown Holdings, Inc. | 16,825 | 420 |
| Steel Dynamics, Inc. | 9,394 | 394 |
| Ashland, Inc. | 5,787 | 370 |
| Bemis Co., Inc. | 10,789 | 358 |
* | Smurfit-Stone Container Corp. | 26,199 | 349 |
| Florida Rock Industries, Inc. | 5,161 | 348 |
| Albemarle Corp. | 8,259 | 318 |
* | Titanium Metals Corp. | 8,332 | 266 |
| Huntsman Corp. | 10,252 | 249 |
| | | 49,391 |
Telecommunication Services (3.8%) | |
| AT&T Inc. | 645,442 | 26,786 |
| Verizon Communications Inc. | 300,999 | 12,392 |
| Sprint Nextel Corp. | 287,149 | 5,947 |
| Alltel Corp. | 37,227 | 2,515 |
* | American Tower Corp. | | |
| Class A | 43,981 | 1,847 |
* | Qwest Communications | | |
| International Inc. | 164,090 | 1,592 |
* | NII Holdings Inc. | 15,076 | 1,217 |
* | Crown Castle | | |
| International Corp. | 27,030 | 980 |
| Embarq Corp. | 15,423 | 977 |
| Windstream Corp. | 49,362 | 729 |
* | Level 3 Communications, Inc. | 114,396 | 669 |
| CenturyTel, Inc. | 11,265 | 553 |
| Citizens Communications Co. | 35,072 | 536 |
* | Leap Wireless | | |
| International, Inc. | 5,575 | 471 |
| Telephone & Data | | |
| Systems, Inc. | 5,333 | 334 |
| Telephone & Data Systems, | | |
| Inc.–Special Common Shares | 5,408 | 311 |
* | U.S. Cellular Corp. | 1,672 | 151 |
| | | 58,007 |
Utilities (3.7%) | | |
| Exelon Corp. | 69,266 | 5,029 |
| Dominion Resources, Inc. | 36,600 | 3,159 |
| TXU Corp. | 45,107 | 3,036 |
| Southern Co. | 77,312 | 2,651 |
| Duke Energy Corp. | 129,651 | 2,373 |
| Public Service Enterprise | | |
| Group, Inc. | 26,139 | 2,294 |
| FPL Group, Inc. | 39,762 | 2,256 |
| Entergy Corp. | 21,013 | 2,256 |
| FirstEnergy Corp. | 31,484 | 2,038 |
| PPL Corp. | 39,459 | 1,846 |
17
| | | Market |
| | | Value• |
| | Shares | ($000) |
| American Electric | | |
| Power Co., Inc. | 40,947 | 1,844 |
| Edison International | 31,930 | 1,792 |
| PG&E Corp. | 36,923 | 1,673 |
| Constellation Energy | | |
| Group, Inc. | 18,729 | 1,633 |
| Sempra Energy | 25,857 | 1,532 |
* | AES Corp. | 68,528 | 1,499 |
| Consolidated Edison Inc. | 28,040 | 1,265 |
| Progress Energy, Inc. | 25,209 | 1,149 |
* | Mirant Corp. | 26,384 | 1,125 |
| Ameren Corp. | 21,295 | 1,044 |
* | NRG Energy, Inc. | 23,950 | 996 |
| Questar Corp. | 17,735 | 937 |
| DTE Energy Co. | 18,348 | 885 |
* | Allegheny Energy, Inc. | 17,040 | 882 |
| Xcel Energy, Inc. | 42,289 | 866 |
* | Reliant Energy, Inc. | 31,775 | 856 |
| KeySpan Corp. | 18,248 | 766 |
| Equitable Resources, Inc. | 11,888 | 589 |
| NiSource, Inc. | 28,354 | 587 |
| Pepco Holdings, Inc. | 19,821 | 559 |
| ONEOK, Inc. | 10,808 | 545 |
| Wisconsin Energy Corp. | 12,092 | 535 |
| CenterPoint Energy Inc. | 30,543 | 531 |
* | Dynegy, Inc. | 50,881 | 480 |
| MDU Resources Group, Inc. | 16,765 | 470 |
| Alliant Energy Corp. | 12,092 | 470 |
| Northeast Utilities | 16,010 | 454 |
| SCANA Corp. | 11,361 | 435 |
| Energy East Corp. | 16,189 | 422 |
| Pinnacle West Capital Corp. | 10,315 | 411 |
| Integrys Energy Group, Inc. | 7,710 | 391 |
| TECO Energy, Inc. | 21,562 | 370 |
| NSTAR | 11,056 | 359 |
| DPL Inc. | 11,741 | 333 |
| | | 55,623 |
Total Common Stocks | | |
(Cost $1,389,164) | | 1,514,749 |
Temporary Cash Investments (0.7%)1 | |
Money Market Fund (0.7%) | | |
2 | Vanguard Market Liquidity | | |
| Fund, 5.281% | 9,103,296 | 9,103 |
2 | Vanguard Market Liquidity | | |
| Fund, 5.281%—Note E | 1,855,200 | 1,855 |
| | | |
| | | |
| | | | |
18
| | Face | |
| | Amount | |
| | ($000) | |
U.S. Agency Obligation (0.0%) | |
3 | Federal National Mortgage Assn. | |
4 | 5.192%, 7/25/07 | 300 | 299 |
Total Temporary Cash Investments | |
(Cost $11,257) | | 11,257 |
Total Investments (100.4%) | | |
(Cost $1,400,421) | | 1,526,006 |
Other Assets and Liabilities (–0.4%) | |
Other Assets—Note B | | 2,952 |
Liabilities—Note E | | (9,529) |
| | | (6,577) |
Net Assets (100%) | | 1,519,429 |
19
At June 30, 2007, net assets consisted of:5 | |
| Amount |
| ($000) |
Paid-in Capital | 1,393,051 |
Undistributed Net Investment Income | 520 |
Accumulated Net Realized Gains | 281 |
Unrealized Appreciation | |
Investment Securities | 125,585 |
Futures Contracts | (8) |
Net Assets | 1,519,429 |
| |
Investor Shares—Net Assets | |
Applicable to 10,888,944 outstanding | |
$.001 par value shares of beneficial | |
interest (unlimited authorization) | 294,761 |
Net Asset Value Per Share— | |
Investor Shares | $27.07 |
| |
Admiral Shares—Net Assets | |
Applicable to 6,895,652 outstanding | |
$.001 par value shares of beneficial | |
interest (unlimited authorization) | 233,381 |
Net Asset Value Per Share— | |
Admiral Shares | $33.84 |
| |
Institutional Shares—Net Assets | |
Applicable to 700,070 outstanding | |
$.001 par value shares of beneficial | |
interest (unlimited authorization) | 97,509 |
Net Asset Value Per Share— | |
Institutional Shares | $139.29 |
| |
ETF Shares—Net Assets | |
Applicable to 13,337,215 outstanding | |
$.001 par value shares of beneficial | |
interest (unlimited authorization) | 893,778 |
Net Asset Value Per Share— | |
ETF Shares | $67.01 |
• See Note A in Notes to Financial Statements.
* Non-income-producing security.
^ Part of security position is on loan to broker-dealers. See Note E in Notes to Financial Statements.
1 The fund invests a portion of its cash reserves in equity markets through the use of index futures contracts. After giving effect to futures investments, the fund’s effective common stock and temporary cash investment positions represent 100.0% and 0.4%, respectively, of net assets. See Note C in Notes to Financial Statements.
2 Affiliated money market fund available only to Vanguard funds and certain trusts and accounts managed by Vanguard. Rate shown is the 7-day yield.
3 The issuer operates under a congressional charter; its securities are neither issued nor guaranteed by the U.S. government. If needed, access to additional funding from the U.S. Treasury (beyond the issuer’s line of credit) would require congressional action.
4 Securities with a value of $299,000 have been segregated as initial margin for open futures contracts.
5 See Note C in Notes to Financial Statements for the tax-basis components of net assets.
REIT—Real Estate Investment Trust.
20
This page intentionally left blank.
This page intentionally left blank.
© 2007 The Vanguard Group, Inc.
All rights reserved.
Vanguard Marketing Corporation, Distributor.
F03072 082007
Vanguard® U.S. Stock Index Funds
Total Stock Market Index Fund
Statement of Net Assets—Investments Summary (unaudited)
As of June 30, 2007
This Statement should be read in conjunction with the Statement of Operations, Statement of Changes in Net Assets, Financial Highlights, and Notes to Financial Statements, all of which appear in the accompanying report.
This Statement summarizes the fund’s holdings by asset type (common stocks, bonds, etc.) and by industry sector. Details are reported for each of the fund’s 50 largest individual holdings and for investments that, in total for any issuer, represent more than 1% of the fund’s net assets. The total value of smaller holdings is reported as a single amount within each category.
The fund provides a complete list of its holdings four times in each fiscal year, at the quarter-ends. For the second and fourth fiscal quarters, the complete listing of the fund’s holdings is available electronically on Vanguard.com® and on the Securities and Exchange Commission’s website (www.sec.gov), or you can have it mailed to you without charge by calling 800-662-7447. For the first and third fiscal quarters, the fund files the lists with the SEC on Form N-Q. Shareholders can look up the fund’s Forms N-Q on the SEC’s website. Forms N-Q may also be reviewed and copied at the SEC’s Public Reference Room (see the back cover of the accompanying report for further information).
| | Market | Percentage |
| | Value• | of Net |
| Shares | ($000) | Assets |
Common Stocks | | | |
Consumer Discretionary | | | |
Home Depot, Inc. | 12,020,151 | 472,993 | 0.5% |
Time Warner, Inc. | 22,472,721 | 472,826 | 0.5% |
* Comcast Corp. Class A | 16,477,525 | 463,348 | 0.4% |
The Walt Disney Co. | 11,461,484 | 391,295 | 0.4% |
McDonald’s Corp. | 7,088,312 | 359,803 | 0.4% |
† Other—Consumer Discretionary | | 9,052,823 | 9.0% |
| | 11,213,088 | 11.2% |
Consumer Staples | | | |
The Procter & Gamble Co. | 18,584,349 | 1,137,176 | 1.1% |
Altria Group, Inc. | 12,351,254 | 866,317 | 0.9% |
Wal-Mart Stores, Inc. | 14,729,103 | 708,617 | 0.7% |
The Coca-Cola Co. | 12,272,788 | 641,990 | 0.7% |
PepsiCo, Inc. | 9,645,980 | 625,542 | 0.6% |
† Other—Consumer Staples | | 3,987,216 | 4.0% |
| | 7,966,858 | 8.0% |
Energy | | | |
ExxonMobil Corp. | 33,742,207 | 2,830,296 | 2.8% |
Chevron Corp. | 12,839,604 | 1,081,608 | 1.1% |
ConocoPhillips Co. | 9,199,201 | 722,137 | 0.7% |
Schlumberger Ltd. | 6,941,320 | 589,596 | 0.6% |
† Other—Energy | | 4,922,516 | 4.9% |
| | 10,146,153 | 10.1% |
Financials | | | |
Citigroup, Inc. | 28,874,442 | 1,480,970 | 1.5% |
1
| | Market | Percentage |
| | Value• | of Net |
| Shares | ($000) | Assets |
Bank of America Corp. | 26,257,271 | 1,283,718 | 1.3% |
JPMorgan Chase & Co. | 20,388,505 | 987,823 | 1.0% |
American International Group, Inc. | 13,014,897 | 911,433 | 0.9% |
Wells Fargo & Co. | 18,763,556 | 659,914 | 0.6% |
Wachovia Corp. | 11,214,123 | 574,724 | 0.6% |
The Goldman Sachs Group, Inc. | 2,188,967 | 474,459 | 0.5% |
Morgan Stanley | 5,643,053 | 473,339 | 0.5% |
Merrill Lynch & Co., Inc. | 4,933,345 | 412,329 | 0.4% |
American Express Co. | 6,343,369 | 388,087 | 0.4% |
Fannie Mae | 5,742,788 | 375,176 | 0.4% |
Student Loan Corp. | 23,047 | 4,699 | 0.0% |
† Other—Financials | | 12,512,665 | 12.5% |
| | 20,539,336 | 20.6% |
Health Care | | | |
Pfizer Inc. | 42,467,520 | 1,085,894 | 1.1% |
Johnson & Johnson | 17,045,332 | 1,050,333 | 1.0% |
Merck & Co., Inc. | 12,786,619 | 636,774 | 0.6% |
Abbott Laboratories | 9,088,335 | 486,680 | 0.5% |
Wyeth | 7,928,543 | 454,623 | 0.5% |
UnitedHealth Group Inc. | 7,933,404 | 405,714 | 0.4% |
* Amgen, Inc. | 6,870,529 | 379,872 | 0.4% |
Bristol-Myers Squibb Co. | 11,894,241 | 375,382 | 0.4% |
Medtronic, Inc. | 6,794,402 | 352,358 | 0.3% |
† Other—Health Care | | 6,305,478 | 6.3% |
| | 11,533,108 | 11.5% |
Industrials | | | |
General Electric Co. | 60,564,725 | 2,318,418 | 2.3% |
The Boeing Co. | 4,416,142 | 424,656 | 0.4% |
United Technologies Corp. | 5,565,242 | 394,743 | 0.4% |
Tyco International Ltd. | 11,639,951 | 393,314 | 0.4% |
3M Co. | 4,106,352 | 356,390 | 0.4% |
† Other—Industrials | | 7,750,679 | 7.7% |
| | 11,638,200 | 11.6% |
Information Technology | | | |
Microsoft Corp. | 51,906,513 | 1,529,685 | 1.5% |
* Cisco Systems, Inc. | 35,574,108 | 990,739 | 1.0% |
International Business Machines Corp. | 8,867,120 | 933,264 | 1.0% |
Intel Corp. | 33,966,060 | 807,034 | 0.8% |
Hewlett-Packard Co. | 15,905,309 | 709,695 | 0.7% |
* Google Inc. | 1,315,669 | 688,595 | 0.7% |
* Apple Computer, Inc. | 5,076,308 | 619,513 | 0.6% |
* Oracle Corp. | 24,417,286 | 481,265 | 0.5% |
QUALCOMM Inc. | 9,756,471 | 423,333 | 0.4% |
† Other—Information Technology | | 8,402,255 | 8.4% |
| | 15,585,378 | 15.6% |
| | | |
† Materials | | 3,563,454 | 3.6% |
| | | |
Telecommunication Services | | | |
AT&T Inc. | 36,776,217 | 1,526,213 | 1.5% |
Verizon Communications Inc. | 17,150,954 | 706,105 | 0.7% |
2
| | Market | Percentage |
| | Value• | of Net |
| Shares | ($000) | Assets |
† Other—Telecommunication Services | | 1,224,408 | 1.3% |
| | 3,456,726 | 3.5% |
| | | |
† Utilities | | 3,655,574 | 3.7% |
| | | |
| | | |
Total Common Stocks (Cost $75,147,784) | | 99,297,875 | 99.4%1 |
Temporary Cash Investments | | | |
Money Market Fund | | | |
2 Vanguard Market Liquidity Fund, | | | |
5.281%—Note E | 1,230,484,261 | 1,230,484 | 1.2% |
2 Vanguard Market Liquidity Fund, 5.281% | 738,927,702 | 738,928 | 0.8% |
| | 1,969,412 | 2.0%1 |
†3U.S. Agency Obligation | | 24,975 | 0.0% |
Total Temporary Cash Investments (Cost $1,994,383) | | 1,994,387 | 2.0% |
Total Investments (Cost $77,142,167) | | 101,292,262 | 101.4% |
Other Assets and Liabilities | | | |
Other Assets—Note B | | 314,923 | 0.3% |
Liabilities—Note E | | (1,665,511) | (1.7%) |
| | (1,350,588) | (1.4%) |
Net Assets (100%) | | 99,941,674 | 100.0% |
3
At June 30, 2007, net assets consisted of:4 | |
| Amount |
| ($000) |
Paid-in Capital | 77,800,786 |
Overdistributed Net Investment Income | (20,913) |
Accumulated Net Realized Losses | (1,981,381) |
Unrealized Appreciation (Depreciation) | |
Investment Securities | 24,150,095 |
Futures Contracts | (6,913) |
Net Assets | 99,941,674 |
| |
Investor Shares—Net Assets | |
Applicable to 1,272,241,453 outstanding $.001 par value shares | |
of beneficial interest (unlimited authorization) | 46,261,073 |
Net Asset Value Per Share—Investor Shares | $36.36 |
| |
Admiral Shares—Net Assets | |
Applicable to 842,441,867 outstanding $.001 par value shares | |
of beneficial interest (unlimited authorization) | 30,634,261 |
Net Asset Value Per Share—Admiral Shares | $36.36 |
| |
Signal Shares—Net Assets | |
Applicable to 21,211,518 outstanding $.001 par value shares | |
of beneficial interest (unlimited authorization) | 744,443 |
Net Asset Value Per Share—Signal Shares | $35.10 |
| ($000) |
Institutional Shares—Net Assets | |
Applicable to 377,759,538 outstanding $.001 par value shares | |
of beneficial interest (unlimited authorization) | 13,738,835 |
Net Asset Value Per Share—Institutional Shares | $36.37 |
| |
ETF Shares—Net Assets | |
Applicable to 57,314,701 outstanding $.001 par value shares | |
of beneficial interest (unlimited authorization) | 8,563,062 |
Net Asset Value Per Share—ETF Shares | $149.40 |
4
Item 2: Not Applicable
Item 3: Not Applicable
Item 4: Not Applicable
Item 5: Not applicable.
Item 6: Not applicable.
Item 7: Not applicable.
Item 8: Not applicable.
Item 9: Not applicable.
Item 10: Not applicable.
Item 11: Controls and Procedures
(a) Disclosure Controls and Procedures. The Principal Executive and Financial Officers concluded that the Registrant's Disclosure Controls and Procedures are effective based on their evaluation of the Disclosure Controls and Procedures as of a date within 90 days of the filing date of this report.
(b) Internal Control Over Financial Reporting. There were no significant changes in Registrant‘s Internal Control Over Financial Reporting or in other factors that could significantly affect this control subsequent to the date of the evaluation, including any corrective actions with regard to significant deficiencies and material weaknesses.
Item 12: Exhibits.
Certifications.
Pursuant to the requirements of the Securities Exchange Act of 1934 and the Investment Company Act of 1940, the registrant has duly caused this report to be signed on its behalf by the undersigned, thereunto duly authorized.
| VANGUARD INDEX FUNDS
|
| BY: | (signature)
|
| (HEIDI STAM)
JOHN J. BRENNAN*
CHIEF EXECUTIVE OFFICER |
Pursuant to the requirements of the Securities Exchange Act of 1934 and the Investment Company Act of 1940, this report has been signed below by the following persons on behalf of the registrant and in the capacities and on the dates indicated.
| VANGUARD INDEX FUNDS
|
| BY: | (signature)
|
| (HEIDI STAM)
JOHN J. BRENNAN*
CHIEF EXECUTIVE OFFICER |
| VANGUARD INDEX FUNDS
|
| BY: | (signature)
|
| (HEIDI STAM)
THOMAS J. HIGGINS*
TREASURER |
*By Power of Attorney, Filed on August 22, 2007, see File Number 333-145624. Incorporated by Reference.