UNITED STATES
SECURITIES AND EXCHANGE COMMISSION
Washington, D.C. 20549
FORM N-CSR
CERTIFIED SHAREHOLDER REPORT
OF
REGISTERED MANAGEMENT INVESTMENT COMPANIES
Investment Company Act file number: 811-2652
Name of registrant: Vanguard Index Funds
Address of Registrant:
P.O. Box 2600
Valley Forge, PA 19482
Name and address of agent for service:
Heidi Stam, Esquire
P.O. Box 876
Valley Forge, PA 19482
Registrant’s telephone number, including area code: (610) 669-1000
Date of fiscal year end: December 31
Date of reporting period: January 1, 2010 – December 31, 2010
Item 1: Reports to Shareholders
 |
| Vanguard 500 Index Fund |
| Annual Report |
|
| December 31, 2010 |
|
 |
|
|
> Despite a volatile year for the financial markets, U.S. stocks ended 2010 with double-digit gains.
> For the fiscal year ended December 31, 2010, Investor, Admiral, and Signal Shares of Vanguard 500 Index Fund returned about 15%, closely tracking its benchmark index. The fund’s ETF Shares returned just under 16% for the period since their inception in September.
> All ten sectors posted positive results for the period, with consumer discretionary and industrials leading the way.
| |
| Contents | |
| Your Fund’s Total Returns. | 1 |
| Chairman’s Letter. | 2 |
| Fund Profile. | 7 |
| Performance Summary. | 9 |
| Financial Statements. | 12 |
| Your Fund’s After-Tax Returns. | 30 |
| About Your Fund’s Expenses. | 31 |
| Glossary. | 33 |
Please note: The opinions expressed in this report are just that—informed opinions. They should not be considered promises or advice. Also, please keep in mind that the information and opinions cover the period through the date on the front of this report. Of course, the risks of investing in your fund are spelled out in the prospectus.
See the Glossary for definitions of investment terms used in this report.
Cover photograph: Jean Maher.
Your Fund’s Total Returns
| |
| Fiscal Year Ended December 31, 2010 | |
| | Total |
| | Returns |
| Vanguard 500 Index Fund | |
| Investor Shares | 14.91% |
| Admiral™ Shares | 15.05 |
| Signal® Shares | 15.05 |
| ETF Shares (Inception: 9/7/2010) | |
| Market Price | 15.96 |
| Net Asset Value | 15.89 |
| S&P 500 Index | 15.06 |
| Large-Cap Core Funds Average | 12.86 |
| Large-Cap Core Funds Average: Derived from data provided by Lipper Inc. | |
Admiral Shares carry lower expenses and are available to investors who meet certain account-balance requirements. Signal Shares are available to certain institutional shareholders who meet specific administrative, service, and account-size criteria. The Vanguard ETF® Shares shown are traded on the NYSE Arca exchange and are available only through brokers. The table provides ETF returns based on both the NYSE Arca market price and the net asset value for a share. U.S. Pat. No. 6,879,964 B2; 7,337,138.
For the ETF Shares, the market price is determined by the midpoint of the bid-offer spread as of the closing time of the New York Stock Exchange (generally 4 p.m., Eastern time). The net asset value is also determined as of the NYSE closing time. For more information about how the ETF Shares' market prices have compared with their net asset value, visit vanguard.com, select your ETF, and then select the Price and Performance tab. The ETF premium/discount analysis there shows the percentages of days on which the ETF Shares' market price was above or below the NAV.
| | | | |
| Your Fund’s Performance at a Glance | | | | |
| December 31, 2009 , Through December 31, 2010 | | | | |
| | | | Distributions Per Share |
| | Starting | Ending | Income | Capital |
| | Share Price | Share Price | Dividends | Gains |
| Vanguard 500 Index Fund | | | | |
| Investor Shares | $102.67 | $115.82 | $1.966 | $0.000 |
| Admiral Shares | 102.67 | 115.83 | 2.084 | 0.000 |
| Signal Shares | 84.81 | 95.68 | 1.723 | 0.000 |
| ETF Shares (Inception: 9/7/2010) | 50.08 | 57.47 | 0.542 | 0.000 |
1

Chairman’s Letter
Dear Shareholder,
Global financial markets took a roller-coaster ride during 2010. Still, despite many ups and downs, Vanguard 500 Index Fund returned about 15% for the period, closely tracking its benchmark, the Standard & Poor’s 500 Index. The fund outperformed the average return of its large-capitalization core fund peers, which stood at about 13% for the year.
In September, Vanguard launched a suite of index mutual funds and exchange-traded funds based on the S&P domestic stock benchmarks. Vanguard S&P 500 ETF, which offers exchange-traded shares of Vanguard’s 500 Index Fund, is among the new offerings. The ETF Shares returned just under 16% for the brief period since their inception.
Please note that on October 6, Vanguard broadened the availability of our lower-cost Admiral Shares. We reduced the Admiral minimums on most of our broad-market index funds to $10,000 from $100,000, as part of our ongoing efforts to lower the cost of investing for our clients.
Although Vanguard 500 Index Fund posted impressive results for the year, it made no capital gains distributions—a benefit to shareholders in taxable accounts. You may wish to review the fund’s after-tax returns that appear later in this report.

Stocks rallied as the forecast seemed to brighten
After a series of false starts, hesitations, and retreats, global stock markets finished 2010 with powerful gains. As the prospect of a double-dip recession faded, the broad U.S. stock market clambered higher, shrugging off high unemployment and distress in Europe’s debt markets to return 17.70%. Small- and mid-capitalization stocks did even better.
Outside the United States, gains were more muted, in part because Europe’s sovereign debt challenges continued to reverberate through local stock markets. Emerging markets were the best performers. Asia’s developed markets performed weakly, though the strength of the yen, the Australian dollar, and other regional currencies bolstered returns for U.S.-based investors.
The fixed income market reprised a familiar theme
Although U.S. Treasury securities rallied through the summer, total return tables were dominated by riskier bonds for the full 12 months, a pattern we also saw in 2009. Low interest rates and a sense that the economic recovery was gathering momentum prompted investors to seek higher yields in both high-quality and below-investment-grade corporate bonds. The broad U.S. bond market returned 6.54%. Late in the year, yields bounced
| | | |
| Market Barometer | | | |
| |
| | | Average Annual Total Returns |
| | | Periods Ended December 31, 2010 |
| | One | Three | Five |
| | Year | Years | Years |
| Stocks | | | |
| Russell 1000 Index (Large-caps) | 16.10% | -2.37% | 2.59% |
| Russell 2000 Index (Small-caps) | 26.86 | 2.22 | 4.47 |
| Dow Jones U.S. Total Stock Market Index | 17.70 | -1.56 | 3.17 |
| MSCI All Country World Index ex USA (International) | 11.60 | -4.58 | 5.29 |
| |
| Bonds | | | |
| Barclays Capital U.S. Aggregate Bond Index (Broad | | | |
| taxable market) | 6.54% | 5.90% | 5.80% |
| Barclays Capital Municipal Bond Index (Broad | | | |
| tax-exempt market) | 2.38 | 4.08 | 4.09 |
| Citigroup Three-Month U.S. Treasury Bill Index | 0.13 | 0.69 | 2.29 |
| |
| CPI | | | |
| Consumer Price Index | 1.50% | 1.43% | 2.18% |
3
off summer lows, putting pressure on bond prices. The dynamic was especially pronounced among municipal bonds.
As it has since December 2008, the Federal Reserve Board held its target for short-term interest rates near 0%, keeping the returns available from money market instruments such as the 3-month Treasury bill in the same neighborhood.
Gains in all sectors boosted fund returns
During 2010, the S&P 500 Index, a barometer of the market’s larger stocks, hit some rough spots, but it managed to post an impressive return of about 15% for the year. Your fund’s advisor, Vanguard Quantitative Equity Group, closely tracked the index’s performance, consistent with its long tradition of superior index fund management. The market’s recovery was broad-based, and all ten market sectors posted gains for the year.
The consumer discretionary sector was the index’s top performer for the period, gaining almost 28%. Improved consumer sentiment helped boost consumer stocks across the board, including holdings in media conglomerates, hotels, and restaurants. Retailers benefited from a better-than-expected back-to-school season and signs that shoppers were opening their wallets as the holidays approached.
| | | | | |
| Expense Ratios | | | | | |
| Your Fund Compared With Its Peer Group | | | | | |
| |
| | Investor | Admiral | Signal | ETF | Peer Group |
| | Shares | Shares | Shares | Shares | Average |
| 500 Index Fund | 0.18% | 0.07% | 0.07% | 0.06% | 1.27% |
The fund expense ratios shown are from the prospectus dated September 7, 2010, for the ETF share class and April 29, 2010, for the Investor, Admiral, and Signal share classes and represent estimated costs for the current fiscal year. For the fiscal year ended December 31, 2010, the fund’s expense ratios were 0.17% for Investor Shares, 0.06% for Admiral Shares, 0.06% for Signal Shares, and 0.06% (annualized) for ETF Shares. The peer-group expense ratio is derived from data provided by Lipper Inc. and captures information through year-end 2009.
Peer group: Large-Cap Core Funds.
4
Stocks in the industrials sector also helped, returning almost 27% for the year. Equipment and machinery companies rose on high demand from emerging markets, most notably China, India, and Latin American countries.
Your fund benefited from double-digit gains in the energy and financial sectors. In energy, an increase in oil prices boosted gas companies while insurance companies, commercial banks, and real estate investment trusts led the way in financials. Returns from stocks in the information technology and consumer staples sectors also helped returns.
Long-term performance has been competitive
For the decade ended December 31, Investor Shares of 500 Index Fund generated an average annual return of 1.31%. These results were in line with those of the fund’s unmanaged benchmark, the S&P 500 Index, which has no transaction costs or operating expenses. The fund outperformed the –0.09% average annual result posted by its large-cap core fund peers for the same period. The peer group is mostly made up of actively managed funds, whose higher expenses are a drag on performance.
| |
| Total Returns | |
| Ten Years Ended December 31, 2010 | |
| | Average |
| | Annual Return |
| 500 Index Fund Investor Shares | 1.31% |
| S&P 500 Index | 1.41 |
| Large-Cap Core Funds Average | -0.09 |
| Large-Cap Core Funds Average: Derived from data provided by Lipper Inc. | |
The figures shown represent past performance, which is not a guarantee of future results. (Current performance may be lower or higher than the performance data cited. For performance data current to the most recent month-end, visit our website at vanguard.com/performance.) Note, too, that both investment returns and principal value can fluctuate widely, so an investor’s shares, when sold, could be worth more or less than their original cost.
5
Though the fund’s ten-year return is clearly unimpressive, keep in mind the time period that it represents. The 500 Index Fund’s performance reflects a decade that included double-digit negative stock market returns in 2001 and 2002 as the late-1990s tech stock bubble deflated and the trauma of the 2008–2009 financial crisis.
The fund’s advisor, Vanguard Quantitative Equity Group, succeeded in tracking its benchmark index—cold comfort, perhaps, but an important measure of the kind of indexing skill that puts you in position to maximize your share of the market’s returns in better times. The advisor is helped in this task by the fund’s low expenses, which are far below the average for its peer group.
Focus on your goals rather than the market’s swings
Over the past few years, investors have been forced to endure an unusually bumpy ride in the U.S. stock market. While these times have, without a doubt, been nerve-racking, they have also been a good reminder that in can be unwise to let market swings influence your long-term investment strategy. Changes have been swift and unpredictable, potentially imposing penalties on investors who use past performance as a guide to the future.
Vanguard encourages you to create a long-term investment plan that includes a mix of stocks, bonds, and short-term investments appropriate for your goals and risk tolerance. Once your plan is in place, it’s important to stick with that plan, regardless of market conditions.
Such a well-balanced portfolio can help cushion some of the market’s volatility while allowing you to participate in its long-term potential for growth. Vanguard 500 Index Fund can play an important role in your long-term investment plan by providing broad, low-cost exposure to the large-cap segment of the stock market.
Thank you for entrusting your assets to Vanguard.
Sincerely,

F. William McNabb III
Chairman and Chief Executive Officer
January 11, 2011
6
500 Index Fund
Fund Profile
As of December 31, 2010
| | | | |
| Share-Class Characteristics | | | | |
| | Investor | Admiral | Signal | ETF |
| | Shares | Shares | Shares | Shares |
| Ticker Symbol | VFINX | VFIAX | VIFSX | VOO |
| Expense Ratio1 | 0.18% | 0.07% | 0.07% | 0.06% |
| 30-Day SEC Yield | 1.46% | 1.58% | 1.59% | 1.57% |
| | | |
| Portfolio Characteristics | | |
| | | | DJ |
| | | | U.S. Total |
| | | S&P 500 | Market |
| | Fund | Index | Index |
| Number of Stocks | 504 | 500 | 3,893 |
| Median Market Cap $47.3B | $47.3B | $29.6B |
| Price/Earnings Ratio | 17.1x | 17.1x | 18.3x |
| Price/Book Ratio | 2.2x | 2.2x | 2.2x |
| Return on Equity | 20.2% | 20.2% | 18.8% |
| Earnings Growth Rate | 6.3% | 6.3% | 6.2% |
| Dividend Yield | 1.9% | 1.9% | 1.7% |
| Foreign Holdings | 0.0% | 0.0% | 0.0% |
| Turnover Rate | 5% | — | — |
| Short-Term Reserves | 0.0% | — | — |
| | |
| Volatility Measures | | |
| | | DJ |
| | | U.S. Total |
| | S&P 500 | Market |
| | Index | Index |
| R-Squared | 1.00 | 1.00 |
| Beta | 1.00 | 0.97 |
These measures show the degree and timing of the fund’s fluctuations compared with the indexes over 36 months.
| | |
| Ten Largest Holdings (% of total net assets) |
| Exxon Mobil Corp. | Integrated Oil & | |
| | Gas | 3.2% |
| Apple Inc. | Computer | |
| | Hardware | 2.6 |
| Microsoft Corp. | Systems Software | 1.8 |
| General Electric Co. | Industrial | |
| | Conglomerates | 1.7 |
| Chevron Corp. | Integrated Oil & | |
| | Gas | 1.6 |
| International Business | IT Consulting & | |
| Machines Corp. | Other Services | 1.6 |
| Procter & Gamble Co. | Household | |
| | Products | 1.6 |
| AT&T Inc. | Integrated | |
| | Telecommunication | |
| | Services | 1.5 |
| Johnson & Johnson | Pharmaceuticals | 1.5 |
| JPMorgan Chase & Co. | Diversified Financial | |
| | Services | 1.4 |
| Top Ten | | 18.5% |
The holdings listed exclude any temporary cash investments and equity index products.
1 The fund expense ratios shown are from the prospectus dated September 7, 2010, for the ETF share class and April 29, 2010, for the Investor, Admiral, and Signal share classes and represent estimated costs for the current fiscal year. For the fiscal year ended December 31, 2010, the fund’s expense ratios were 0.17% for Investor Shares, 0.06% for Admiral Shares, 0.06% for Signal Shares, and 0.06% (annualized) for ETF Shares. The peer-group expense ratio is derived from data provided by Lipper Inc. and captures information through year-end 2009.
7
500 Index Fund
| | | |
| Sector Diversification (% of equity exposure) |
| | | | DJ |
| | | | U.S. Total |
| | | S&P 500 | Market |
| | Fund | Index | Index |
| Consumer | | | |
| Discretionary | 10.6% | 10.6% | 11.9% |
| Consumer Staples | 10.6 | 10.6 | 9.5 |
| Energy | 12.0 | 12.0 | 10.6 |
| Financials | 16.1 | 16.1 | 16.6 |
| Health Care | 10.9 | 10.9 | 10.7 |
| Industrials | 11.0 | 11.0 | 11.4 |
| Information | | | |
| Technology | 18.7 | 18.7 | 18.9 |
| Materials | 3.7 | 3.7 | 4.5 |
| Telecommunication | | | |
| Services | 3.1 | 3.1 | 2.7 |
| Utilities | 3.3 | 3.3 | 3.2 |
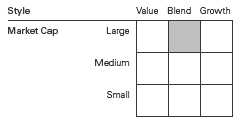
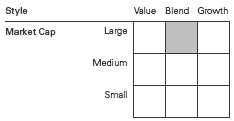
Investment Focus
8
500 Index Fund
Performance Summary
All of the returns in this report represent past performance, which is not a guarantee of future results that may be achieved by the fund. (Current performance may be lower or higher than the performance data cited. For performance data current to the most recent month-end, visit our website at vanguard.com/performance.) Note, too, that both investment returns and principal value can fluctuate widely, so an investor’s shares, when sold, could be worth more or less than their original cost. The returns shown do not reflect taxes that a shareholder would pay on fund distributions or on the sale of fund shares.
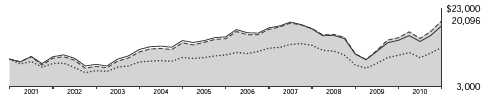
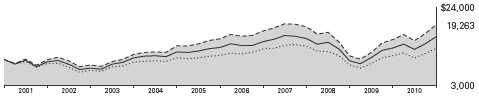
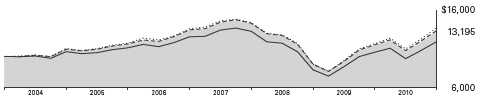
Cumulative Performance: December 31, 2000, Through December 31, 2010
Initial Investment of $10,000

| | | | | |
| | | Average Annual Total Returns | |
| | | Periods Ended December 31, 2010 | |
| | | | | | Final Value |
| | | One | Five | Ten | of a $10,000 |
| | | Year | Years | Years | Investment |
| | 500 Index Fund Investor Shares | 14.91% | 2.21% | 1.31% | $11,393 |
| •••••••• | Dow Jones U.S. Total Stock Market | | | | |
| | Index | 17.70 | 3.17 | 2.64 | 12,981 |
| – – – – | S&P 500 Index | 15.06 | 2.29 | 1.41 | 11,507 |
| | Large-Cap Core Funds Average | 12.86 | 1.37 | -0.09 | 9,911 |
| Large-Cap Core Funds Average: Derived from data provided by Lipper Inc. | | | |
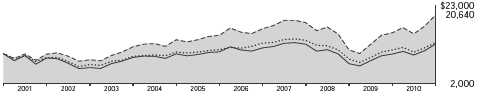
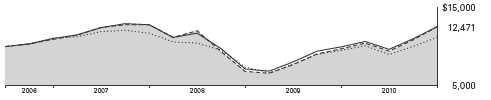
| | | | |
| | | | | Final Value |
| | One | Five | Ten | of a $10,000 |
| | Year | Years | Years | Investment |
| 500 Index Fund Admiral Shares | 15.05% | 2.31% | 1.40% | $11,488 |
| Dow Jones U.S. Total Stock Market | | | | |
| Index | 17.70 | 3.17 | 2.64 | 12,981 |
| S&P 500 Index | 15.06 | 2.29 | 1.41 | 11,507 |
See Financial Highlights for dividend and capital gains information.
9
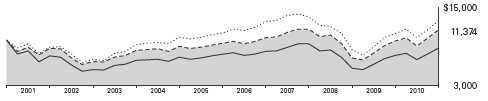
500 Index Fund
| | | |
| | Average Annual Total Returns | |
| | Periods Ended December 31, 2010 | |
| | | Since | Final Value |
| | One | Inception | of a $10,000 |
| | Year | (9/29/2006) | Investment |
| 500 Index Fund Signal Shares | 15.05% | 0.77% | $10,331 |
| Dow Jones U.S. Total Stock Market | | | |
| Index | 17.70 | 1.88 | 10,825 |
| S&P 500 Index | 15.06 | 0.74 | 10,319 |
| "Since Inception" performance is calculated from the Signal Shares’ inception date for both the fund and its comparative standards. |
| | |
| | Since | Final Value |
| | Inception | of a $10,000 |
| | (9/7/2010) | Investment |
| 500 Index Fund | | |
| ETF Shares Net Asset Value | 15.89% | $11,589 |
| Dow Jones U.S. Total Stock Market Index | 17.45 | 11,745 |
| S&P 500 Index | 15.91 | 11,591 |
| "Since Inception" performance is calculated from the ETF Shares’ inception date for both the fund and its comparative standards. |
Cumulative Returns of ETF Shares: September 7, 2010, Through December 31, 2010
| |
| | Since |
| | Inception |
| | (9/7/2010) |
| 500 Index Fund | |
| ETF Shares Market Price | 15.96% |
| 500 Index Fund | |
| ETF Shares Net Asset Value | 15.89 |
| S&P 500 Index | 15.91 |
| "Since Inception" performance is calculated from the ETF Shares’ inception date for both the fund and its comparative standard. | |
10
500 Index Fund
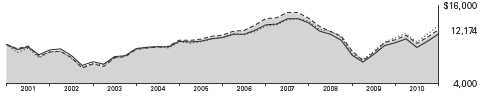
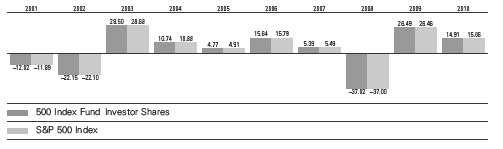
Fiscal-Year Total Returns (%): December 31, 2000, Through December 31, 2010
11
500 Index Fund
Financial Statements
Statement of Net Assets
As of December 31, 2010
The fund reports a complete list of its holdings in regulatory filings four times in each fiscal year, at the quarter-ends. For the second and fourth fiscal quarters, the lists appear in the fund’s semiannual and annual reports to shareholders. For the first and third fiscal quarters, the fund files the lists with the Securities and Exchange Commission on Form N-Q. Shareholders can look up the fund’s Forms N-Q on the SEC’s website at sec.gov. Forms N-Q may also be reviewed and copied at the SEC’s Public Reference Room (see the back cover of this report for further information).
| | | |
| | | | Market |
| | | | Value |
| | | Shares | ($000) |
| Common Stocks (99.8%)1 | | |
| Consumer Discretionary (10.6%) | |
| | McDonald’s Corp. | 9,459,937 | 726,145 |
| | Walt Disney Co. | 16,954,999 | 635,982 |
| * | Amazon.com Inc. | 3,174,814 | 571,467 |
| * | Ford Motor Co. | 33,547,329 | 563,260 |
| | Comcast Corp. Class A | 23,677,792 | 520,201 |
| | Home Depot Inc. | 14,673,834 | 514,465 |
| | Target Corp. | 6,340,038 | 381,226 |
| | Time Warner Inc. | 9,932,446 | 319,527 |
| | Lowe’s Cos. Inc. | 12,356,287 | 309,896 |
| * | DIRECTV Class A | 7,464,925 | 298,074 |
| | News Corp. Class A | 20,447,473 | 297,715 |
| | NIKE Inc. Class B | 3,422,993 | 292,392 |
| | Johnson Controls Inc. | 6,038,103 | 230,656 |
| | Viacom Inc. Class B | 5,412,813 | 214,402 |
| | Starbucks Corp. | 6,635,528 | 213,199 |
| | Time Warner Cable Inc. | 3,185,057 | 210,309 |
| | Yum! Brands Inc. | 4,195,475 | 205,788 |
| | Carnival Corp. | 3,855,936 | 177,797 |
| * | priceline.com Inc. | 439,577 | 175,633 |
| | TJX Cos. Inc. | 3,543,747 | 157,307 |
| | Staples Inc. | 6,475,094 | 147,438 |
| | Coach Inc. | 2,653,593 | 146,770 |
| * | Kohl’s Corp. | 2,617,802 | 142,251 |
| | Omnicom Group Inc. | 2,697,075 | 123,526 |
| | CBS Corp. Class B | 6,096,200 | 116,133 |
| * | Bed Bath & Beyond Inc. | 2,319,838 | 114,020 |
| | Marriott International Inc. | | |
| | Class A | 2,576,314 | 107,020 |
| * | Discovery | | |
| | Communications Inc. | | |
| | Class A | 2,545,491 | 106,147 |
| | Starwood Hotels & | | |
| | Resorts Worldwide Inc. | 1,706,919 | 103,747 |
| | Best Buy Co. Inc. | 2,956,388 | 101,375 |
| | McGraw-Hill Cos. Inc. | 2,748,597 | 100,076 |
| | Stanley Black & | | |
| | Decker Inc. | 1,485,518 | 99,337 |
| | | |
| | | | Market |
| | | | Value |
| | | Shares | ($000) |
| | Macy’s Inc. | 3,791,396 | 95,922 |
| | Gap Inc. | 3,933,958 | 87,098 |
| | Fortune Brands Inc. | 1,365,969 | 82,300 |
| | Mattel Inc. | 3,212,564 | 81,695 |
| * | O’Reilly Automotive Inc. | 1,255,799 | 75,875 |
| | Harley-Davidson Inc. | 2,110,934 | 73,186 |
| | Limited Brands Inc. | 2,367,881 | 72,765 |
| | Cablevision | | |
| | Systems Corp. | | |
| | Class A | 2,148,936 | 72,720 |
| | Genuine Parts Co. | 1,410,330 | 72,406 |
| | Tiffany & Co. | 1,131,556 | 70,462 |
| | Wynn Resorts Ltd. | 676,835 | 70,283 |
| | JC Penney Co. Inc. | 2,116,769 | 68,393 |
| | Ross Stores Inc. | 1,079,735 | 68,293 |
| * | NetFlix Inc. | 388,300 | 68,224 |
| | VF Corp. | 777,858 | 67,036 |
| * | AutoZone Inc. | 243,711 | 66,433 |
| | Polo Ralph Lauren Corp. | | |
| | Class A | 578,677 | 64,187 |
| * | CarMax Inc. | 2,013,047 | 64,176 |
| | Nordstrom Inc. | 1,506,921 | 63,863 |
| | Whirlpool Corp. | 680,535 | 60,452 |
| | Darden Restaurants Inc. | 1,239,136 | 57,545 |
| | Hasbro Inc. | 1,219,277 | 57,525 |
| | Family Dollar Stores Inc. | 1,128,499 | 56,098 |
| | Newell Rubbermaid Inc. | 2,601,488 | 47,295 |
| | International Game | | |
| | Technology | 2,672,232 | 47,272 |
| | Wyndham | | |
| | Worldwide Corp. | 1,566,300 | 46,926 |
| * | Interpublic Group | | |
| | of Cos. Inc. | 4,383,034 | 46,548 |
| | Expedia Inc. | 1,810,482 | 45,425 |
| | Abercrombie & Fitch Co. | 786,363 | 45,318 |
| * | Apollo Group Inc. Class A | 1,137,913 | 44,936 |
| | Scripps Networks | | |
| | Interactive Inc. Class A | 806,295 | 41,726 |
| * | Urban Outfitters Inc. | 1,154,249 | 41,334 |
12
500 Index Fund
| | | |
| | | | Market |
| | | | Value |
| | | Shares | ($000) |
| | H&R Block Inc. | 2,761,524 | 32,890 |
| | Gannett Co. Inc. | 2,139,141 | 32,280 |
| * | GameStop Corp. Class A | 1,358,175 | 31,075 |
| | DR Horton Inc. | 2,517,882 | 30,038 |
| | Leggett & Platt Inc. | 1,312,106 | 29,864 |
| *,^ | Sears Holdings Corp. | 394,754 | 29,113 |
| * | Harman International | | |
| | Industries Inc. | 623,087 | 28,849 |
| | Comcast Corp. Class A | | |
| | Special Shares | 1,304,720 | 27,151 |
| | DeVry Inc. | 559,191 | 26,830 |
| | Lennar Corp. Class A | 1,428,407 | 26,783 |
| * | Goodyear Tire & | | |
| | Rubber Co. | 2,174,197 | 25,764 |
| * | Pulte Group Inc. | 3,017,356 | 22,691 |
| ^ | Washington Post Co. | | |
| | Class B | 49,258 | 21,649 |
| * | Big Lots Inc. | 678,862 | 20,678 |
| | RadioShack Corp. | 1,022,969 | 18,915 |
| *,^ | AutoNation Inc. | 571,082 | 16,104 |
| | Meredith Corp. | 326,797 | 11,323 |
| | | | 10,878,995 |
| Consumer Staples (10.6%) | | |
| | Procter & Gamble Co. | 25,064,074 | 1,612,372 |
| | Coca-Cola Co. | 20,791,536 | 1,367,459 |
| | Philip Morris | | |
| | International Inc. | 16,246,024 | 950,880 |
| | Wal-Mart Stores Inc. | 17,541,723 | 946,025 |
| | PepsiCo Inc. | 14,190,648 | 927,075 |
| | Kraft Foods Inc. | 15,640,416 | 492,829 |
| | Altria Group Inc. | 18,694,179 | 460,251 |
| | CVS Caremark Corp. | 12,166,475 | 423,028 |
| | Colgate-Palmolive Co. | 4,321,860 | 347,348 |
| | Walgreen Co. | 8,289,121 | 322,944 |
| | Costco Wholesale Corp. | 3,870,960 | 279,522 |
| | Kimberly-Clark Corp. | 3,651,184 | 230,171 |
| | General Mills Inc. | 5,732,930 | 204,035 |
| | Archer-Daniels- | | |
| | Midland Co. | 5,720,373 | 172,069 |
| | Sysco Corp. | 5,238,555 | 154,013 |
| | HJ Heinz Co. | 2,871,752 | 142,037 |
| | Kroger Co. | 5,709,871 | 127,673 |
| | Kellogg Co. | 2,274,734 | 116,193 |
| | Mead Johnson | | |
| | Nutrition Co. | 1,831,553 | 114,014 |
| | Avon Products Inc. | 3,842,483 | 111,663 |
| | Lorillard Inc. | 1,339,406 | 109,912 |
| | Sara Lee Corp. | 5,723,430 | 100,217 |
| | Reynolds American Inc. | 3,027,616 | 98,761 |
| | ConAgra Foods Inc. | 3,936,807 | 88,893 |
| | Estee Lauder Cos. Inc. | | |
| | Class A | 1,016,606 | 82,040 |
| | Clorox Co. | 1,248,354 | 78,996 |
| | Coca-Cola | | |
| | Enterprises Inc. | 3,033,032 | 75,917 |
| | | |
| | | | Market |
| | | | Value |
| | | Shares | ($000) |
| | Safeway Inc. | 3,337,614 | 75,063 |
| | Dr Pepper Snapple | | |
| | Group Inc. | 2,033,106 | 71,484 |
| | Molson Coors | | |
| | Brewing Co. Class B | 1,416,289 | 71,083 |
| | JM Smucker Co. | 1,069,815 | 70,233 |
| * | Whole Foods Market Inc. | 1,317,885 | 66,672 |
| | Hershey Co. | 1,384,758 | 65,291 |
| | Brown-Forman Corp. | | |
| | Class B | 930,366 | 64,772 |
| | Campbell Soup Co. | 1,714,481 | 59,578 |
| | McCormick & Co. Inc. | 1,190,129 | 55,377 |
| | Tyson Foods Inc. Class A | 2,667,834 | 45,940 |
| * | Constellation Brands Inc. | | |
| | Class A | 1,599,722 | 35,434 |
| | Hormel Foods Corp. | 620,827 | 31,824 |
| | SUPERVALU Inc. | 1,906,853 | 18,363 |
| * | Dean Foods Co. | 1,635,278 | 14,456 |
| | | | 10,881,907 |
| Energy (12.0%) | | |
| | Exxon Mobil Corp. | 45,151,393 | 3,301,470 |
| | Chevron Corp. | 18,019,339 | 1,644,265 |
| | Schlumberger Ltd. | 12,216,661 | 1,020,091 |
| | ConocoPhillips | 13,155,376 | 895,881 |
| | Occidental | | |
| | Petroleum Corp. | 7,275,848 | 713,761 |
| | Apache Corp. | 3,421,893 | 407,992 |
| | Anadarko | | |
| | Petroleum Corp. | 4,437,396 | 337,952 |
| | Halliburton Co. | 8,143,800 | 332,511 |
| | Devon Energy Corp. | 3,867,095 | 303,606 |
| | National Oilwell | | |
| | Varco Inc. | 3,757,278 | 252,677 |
| | Marathon Oil Corp. | 6,356,301 | 235,374 |
| | Baker Hughes Inc. | 3,861,440 | 220,759 |
| | EOG Resources Inc. | 2,274,347 | 207,898 |
| | Hess Corp. | 2,686,215 | 205,603 |
| | Peabody Energy Corp. | 2,414,172 | 154,459 |
| | Chesapeake Energy Corp. | 5,854,808 | 151,698 |
| | Spectra Energy Corp. | 5,803,821 | 145,038 |
| | Noble Energy Inc. | 1,567,686 | 134,946 |
| | Williams Cos. Inc. | 5,235,656 | 129,425 |
| | Murphy Oil Corp. | 1,722,310 | 128,398 |
| | Valero Energy Corp. | 5,069,469 | 117,206 |
| * | Southwestern Energy Co. | 3,104,758 | 116,211 |
| * | Cameron | | |
| | International Corp. | 2,171,709 | 110,171 |
| | Consol Energy Inc. | 2,022,032 | 98,554 |
| * | FMC Technologies Inc. | 1,071,751 | 95,289 |
| | Pioneer Natural | | |
| | Resources Co. | 1,039,399 | 90,241 |
| | El Paso Corp. | 6,304,161 | 86,745 |
| * | Newfield Exploration Co. | 1,198,582 | 86,430 |
| * | Denbury Resources Inc. | 3,578,220 | 68,308 |
| | Range Resources Corp. | 1,434,498 | 64,524 |
13
500 Index Fund
| | | |
| | | | Market |
| | | | Value |
| | | Shares | ($000) |
| * | Nabors Industries Ltd. | 2,557,823 | 60,007 |
| | EQT Corp. | 1,336,914 | 59,947 |
| | QEP Resources Inc. | 1,572,169 | 57,085 |
| | Massey Energy Co. | 915,457 | 49,114 |
| | Helmerich & Payne Inc. | 948,793 | 45,998 |
| | Sunoco Inc. | 1,080,804 | 43,567 |
| | Diamond Offshore | | |
| | Drilling Inc. | 623,126 | 41,668 |
| * | Rowan Cos. Inc. | 1,131,006 | 39,483 |
| | Cabot Oil & Gas Corp. | 930,689 | 35,227 |
| * | Tesoro Corp. | 1,284,595 | 23,816 |
| | | | 12,313,395 |
| Financials (16.0%) | | |
| | JPMorgan Chase & Co. | 35,002,987 | 1,484,827 |
| | Wells Fargo & Co. | 46,997,545 | 1,456,454 |
| * | Citigroup Inc. | 260,116,299 | 1,230,350 |
| | Bank of America Corp. | 90,302,687 | 1,204,638 |
| * | Berkshire Hathaway Inc. | | |
| | Class B | 13,965,597 | 1,118,784 |
| | Goldman Sachs | | |
| | Group Inc. | 4,577,596 | 769,769 |
| | US Bancorp | 17,176,275 | 463,244 |
| | American Express Co. | 9,377,134 | 402,467 |
| | Morgan Stanley | 13,546,004 | 368,587 |
| | MetLife Inc. | 8,114,708 | 360,618 |
| | Bank of New York | | |
| | Mellon Corp. | 11,106,776 | 335,425 |
| | PNC Financial Services | | |
| | Group Inc. | 4,707,789 | 285,857 |
| | Simon Property | | |
| | Group Inc. | 2,622,476 | 260,910 |
| | Prudential Financial Inc. | 4,345,686 | 255,135 |
| | Aflac Inc. | 4,219,501 | 238,106 |
| | Travelers Cos. Inc. | 4,110,103 | 228,974 |
| | State Street Corp. | 4,494,953 | 208,296 |
| | CME Group Inc. | 600,028 | 193,059 |
| | ACE Ltd. | 3,038,763 | 189,163 |
| | Capital One | | |
| | Financial Corp. | 4,091,029 | 174,114 |
| | BB&T Corp. | 6,211,338 | 163,296 |
| | Chubb Corp. | 2,730,199 | 162,829 |
| | Allstate Corp. | 4,818,582 | 153,616 |
| | Charles Schwab Corp. | 8,879,179 | 151,923 |
| | T Rowe Price Group Inc. | 2,295,914 | 148,178 |
| | Franklin Resources Inc. | 1,303,582 | 144,971 |
| | AON Corp. | 2,953,791 | 135,904 |
| | Marsh & | | |
| | McLennan Cos. Inc. | 4,865,649 | 133,027 |
| | Equity Residential | 2,546,758 | 132,304 |
| | SunTrust Banks Inc. | 4,476,317 | 132,096 |
| | Ameriprise Financial Inc. | 2,220,025 | 127,762 |
| | Public Storage | 1,250,483 | 126,824 |
| * | Berkshire Hathaway Inc. | | |
| | Class A | 1,019 | 122,739 |
| | Vornado Realty Trust | 1,455,532 | 121,290 |
| | | |
| | | | Market |
| | | | Value |
| | | Shares | ($000) |
| | Northern Trust Corp. | 2,168,374 | 120,150 |
| | HCP Inc. | 3,261,943 | 120,007 |
| | Progressive Corp. | 5,940,519 | 118,038 |
| | Loews Corp. | 2,832,109 | 110,197 |
| | Boston Properties Inc. | 1,254,393 | 108,003 |
| | Host Hotels & | | |
| | Resorts Inc. | 5,962,179 | 106,544 |
| | Hartford Financial | | |
| | Services Group Inc. | 3,980,067 | 105,432 |
| | Fifth Third Bancorp | 7,129,254 | 104,657 |
| | Invesco Ltd. | 4,136,819 | 99,532 |
| | Principal Financial | | |
| | Group Inc. | 2,868,100 | 93,385 |
| | M&T Bank Corp. | 1,068,799 | 93,039 |
| | Weyerhaeuser Co. | 4,798,333 | 90,832 |
| | Discover Financial | | |
| | Services | 4,875,722 | 90,347 |
| | AvalonBay | | |
| | Communities Inc. | 763,535 | 85,936 |
| | Lincoln National Corp. | 2,839,106 | 78,956 |
| | Regions Financial Corp. | 11,258,045 | 78,806 |
| * | Intercontinental- | | |
| | Exchange Inc. | 654,847 | 78,025 |
| | Ventas Inc. | 1,407,955 | 73,890 |
| | ProLogis | 5,094,388 | 73,563 |
| *,^ | American International | | |
| | Group Inc. | 1,253,591 | 72,232 |
| | NYSE Euronext | 2,336,672 | 70,053 |
| | KeyCorp | 7,882,659 | 69,762 |
| | Unum Group | 2,839,272 | 68,767 |
| | Comerica Inc. | 1,580,014 | 66,740 |
| | Kimco Realty Corp. | 3,638,645 | 65,641 |
| | XL Group plc Class A | 2,897,214 | 63,217 |
| | Health Care REIT Inc. | 1,299,224 | 61,895 |
| | Hudson City Bancorp Inc. | 4,720,955 | 60,145 |
| * | Genworth Financial Inc. | | |
| | Class A | 4,387,527 | 57,652 |
| * | SLM Corp. | 4,354,187 | 54,819 |
| | Plum Creek | | |
| | Timber Co. Inc. | 1,448,676 | 54,253 |
| * | CB Richard Ellis | | |
| | Group Inc. Class A | 2,601,559 | 53,280 |
| | Huntington | | |
| | Bancshares Inc. | 7,727,278 | 53,086 |
| | Leucadia National Corp. | 1,766,721 | 51,553 |
| | Legg Mason Inc. | 1,369,604 | 49,676 |
| | Moody’s Corp. | 1,827,392 | 48,499 |
| | People’s United | | |
| | Financial Inc. | 3,302,882 | 46,273 |
| | Cincinnati Financial Corp. | 1,458,060 | 46,206 |
| | Torchmark Corp. | 716,567 | 42,808 |
| | Zions Bancorporation | 1,592,992 | 38,598 |
| | Assurant Inc. | 954,965 | 36,785 |
| | Marshall & Ilsley Corp. | 4,727,572 | 32,715 |
| * | NASDAQ OMX Group Inc. | 1,335,302 | 31,660 |
14
500 Index Fund
| | | |
| | | | Market |
| | | | Value |
| | | Shares | ($000) |
| * | E*Trade Financial Corp. | 1,779,987 | 28,480 |
| * | First Horizon | | |
| | National Corp. | 2,340,508 | 27,571 |
| | Apartment Investment & | | |
| | Management Co. | 1,049,257 | 27,113 |
| ^ | Federated Investors Inc. | | |
| | Class B | 821,945 | 21,510 |
| | Janus Capital Group Inc. | 1,648,043 | 21,375 |
| | | | 16,437,239 |
| Health Care (10.9%) | | |
| | Johnson & Johnson | 24,590,028 | 1,520,893 |
| | Pfizer Inc. | 71,721,344 | 1,255,841 |
| | Merck & Co. Inc. | 27,586,186 | 994,206 |
| | Abbott Laboratories | 13,841,151 | 663,130 |
| * | Amgen Inc. | 8,459,790 | 464,442 |
| | Bristol-Myers Squibb Co. | 15,326,207 | 405,838 |
| | Medtronic Inc. | 9,669,069 | 358,626 |
| | UnitedHealth Group Inc. | 9,848,653 | 355,635 |
| | Eli Lilly & Co. | 9,085,953 | 318,372 |
| | Baxter International Inc. | 5,217,583 | 264,114 |
| * | Gilead Sciences Inc. | 7,269,182 | 263,435 |
| * | Express Scripts Inc. | 4,719,046 | 255,064 |
| * | Celgene Corp. | 4,213,978 | 249,215 |
| * | Medco Health | | |
| | Solutions Inc. | 3,799,905 | 232,820 |
| * | WellPoint Inc. | 3,524,164 | 200,384 |
| * | Thermo Fisher | | |
| | Scientific Inc. | 3,558,800 | 197,015 |
| | Allergan Inc. | 2,753,317 | 189,070 |
| | Becton Dickinson and Co. | 2,058,929 | 174,021 |
| * | Genzyme Corp. | 2,318,858 | 165,103 |
| | Stryker Corp. | 3,057,836 | 164,206 |
| | McKesson Corp. | 2,265,727 | 159,462 |
| * | Biogen Idec Inc. | 2,133,608 | 143,058 |
| * | St. Jude Medical Inc. | 3,069,497 | 131,221 |
| * | Agilent Technologies Inc. | 3,101,147 | 128,481 |
| | Cardinal Health Inc. | 3,124,360 | 119,694 |
| | Aetna Inc. | 3,582,194 | 109,293 |
| * | Boston Scientific Corp. | 13,609,604 | 103,025 |
| * | Zimmer Holdings Inc. | 1,767,644 | 94,887 |
| * | Life Technologies Corp. | 1,671,713 | 92,780 |
| * | Intuitive Surgical Inc. | 351,792 | 90,674 |
| | CIGNA Corp. | 2,425,550 | 88,921 |
| | AmerisourceBergen Corp. | | |
| | Class A | 2,474,072 | 84,415 |
| * | Hospira Inc. | 1,495,825 | 83,302 |
| * | Humana Inc. | 1,506,861 | 82,486 |
| * | Mylan Inc. | 3,896,471 | 82,332 |
| * | Forest Laboratories Inc. | 2,557,085 | 81,776 |
| * | Laboratory Corp. of | | |
| | America Holdings | 910,512 | 80,052 |
| | CR Bard Inc. | 831,709 | 76,326 |
| * | Varian Medical | | |
| | Systems Inc. | 1,065,233 | 73,799 |
| | Quest Diagnostics Inc. | 1,266,241 | 68,339 |
| | | |
| | | | Market |
| | | | Value |
| | | Shares | ($000) |
| * | Waters Corp. | 817,570 | 63,533 |
| * | DaVita Inc. | 871,162 | 60,537 |
| * | Cerner Corp. | 638,747 | 60,515 |
| * | Watson | | |
| | Pharmaceuticals Inc. | 1,121,821 | 57,942 |
| * | CareFusion Corp. | 1,995,861 | 51,294 |
| | DENTSPLY | | |
| | International Inc. | 1,272,001 | 43,464 |
| * | Cephalon Inc. | 674,075 | 41,604 |
| * | Coventry Health Care Inc. | 1,329,962 | 35,111 |
| * | Tenet Healthcare Corp. | 4,345,961 | 29,074 |
| | PerkinElmer Inc. | 1,056,775 | 27,286 |
| | Patterson Cos. Inc. | 866,854 | 26,552 |
| | | | 11,162,665 |
| Industrials (11.0%) | | |
| | General Electric Co. | 95,402,952 | 1,744,920 |
| | United | | |
| | Technologies Corp. | 8,268,115 | 650,866 |
| | United Parcel Service Inc. | | |
| | Class B | 8,854,817 | 642,683 |
| | 3M Co. | 6,400,742 | 552,384 |
| | Caterpillar Inc. | 5,683,085 | 532,278 |
| | Boeing Co. | 6,568,328 | 428,649 |
| | Union Pacific Corp. | 4,415,518 | 409,142 |
| | Emerson Electric Co. | 6,739,116 | 385,275 |
| | Honeywell | | |
| | International Inc. | 6,985,465 | 371,347 |
| | Deere & Co. | 3,795,162 | 315,188 |
| | FedEx Corp. | 2,817,175 | 262,025 |
| | General Dynamics Corp. | 3,382,202 | 240,001 |
| | Illinois Tool Works Inc. | 4,440,393 | 237,117 |
| | Danaher Corp. | 4,801,323 | 226,478 |
| | CSX Corp. | 3,350,298 | 216,463 |
| | Norfolk Southern Corp. | 3,253,447 | 204,382 |
| | Cummins Inc. | 1,771,031 | 194,831 |
| | PACCAR Inc. | 3,265,366 | 187,497 |
| | Lockheed Martin Corp. | 2,643,972 | 184,840 |
| | Tyco International Ltd. | 4,382,240 | 181,600 |
| | Precision Castparts Corp. | 1,276,858 | 177,751 |
| | Northrop Grumman Corp. | 2,614,273 | 169,353 |
| | Waste Management Inc. | 4,260,041 | 157,068 |
| | Eaton Corp. | 1,506,775 | 152,953 |
| | Raytheon Co. | 3,203,319 | 148,442 |
| | Ingersoll-Rand plc | 2,900,941 | 136,605 |
| | Parker Hannifin Corp. | 1,444,427 | 124,654 |
| | CH Robinson | | |
| | Worldwide Inc. | 1,486,353 | 119,191 |
| | Fluor Corp. | 1,600,726 | 106,064 |
| | Expeditors International | | |
| | of Washington Inc. | 1,901,209 | 103,806 |
| | Goodrich Corp. | 1,122,504 | 98,859 |
| | Dover Corp. | 1,672,295 | 97,746 |
| | Rockwell Automation Inc. | 1,269,364 | 91,026 |
| | Southwest Airlines Co. | 6,688,695 | 86,819 |
| | ITT Corp. | 1,643,705 | 85,654 |
15
500 Index Fund
| | | |
| | | | Market |
| | | | Value |
| | | Shares | ($000) |
| | Republic Services Inc. | | |
| | Class A | 2,752,091 | 82,177 |
| | Rockwell Collins Inc. | 1,404,252 | 81,812 |
| | Fastenal Co. | 1,319,885 | 79,074 |
| | WW Grainger Inc. | 519,320 | 71,723 |
| | L-3 Communications | | |
| | Holdings Inc. | 1,013,333 | 71,430 |
| | Roper Industries Inc. | 847,542 | 64,778 |
| * | Stericycle Inc. | 765,643 | 61,956 |
| | Flowserve Corp. | 499,811 | 59,587 |
| | Textron Inc. | 2,460,981 | 58,178 |
| * | Jacobs Engineering | | |
| | Group Inc. | 1,128,835 | 51,757 |
| | Pall Corp. | 1,031,099 | 51,122 |
| | Iron Mountain Inc. | 1,791,494 | 44,805 |
| | Pitney Bowes Inc. | 1,820,343 | 44,016 |
| | Avery Dennison Corp. | 966,460 | 40,920 |
| | Masco Corp. | 3,213,601 | 40,684 |
| | Robert Half | | |
| | International Inc. | 1,319,794 | 40,386 |
| | Equifax Inc. | 1,104,609 | 39,324 |
| * | Quanta Services Inc. | 1,929,131 | 38,428 |
| | Dun & Bradstreet Corp. | 446,906 | 36,687 |
| | RR Donnelley & Sons Co. | 1,848,616 | 32,295 |
| | Cintas Corp. | 1,134,150 | 31,711 |
| | Snap-On Inc. | 521,063 | 29,482 |
| | Ryder System Inc. | 464,174 | 24,434 |
| * | Raytheon Co. | | |
| | Warrants Exp. | | |
| | 6/16/2011 | 60,569 | 528 |
| | | | 11,201,251 |
| Information Technology (18.6%) | |
| * | Apple Inc. | 8,213,640 | 2,649,392 |
| | Microsoft Corp. | 67,413,857 | 1,882,195 |
| | International Business | | |
| | Machines Corp. | 11,124,091 | 1,632,572 |
| * | Google Inc. Class A | 2,233,355 | 1,326,546 |
| | Oracle Corp. | 34,659,880 | 1,084,854 |
| | Intel Corp. | 49,945,508 | 1,050,354 |
| * | Cisco Systems Inc. | 49,629,978 | 1,004,014 |
| | Hewlett-Packard Co. | 20,305,284 | 854,852 |
| | QUALCOMM Inc. | 14,484,961 | 716,861 |
| * | EMC Corp. | 18,448,503 | 422,471 |
| | Texas Instruments Inc. | 10,513,157 | 341,678 |
| | Visa Inc. Class A | 4,363,103 | 307,075 |
| * | eBay Inc. | 10,272,542 | 285,885 |
| | Corning Inc. | 13,993,584 | 270,356 |
| | Automatic Data | | |
| | Processing Inc. | 4,416,022 | 204,374 |
| * | Dell Inc. | 15,036,298 | 203,742 |
| * | Cognizant Technology | | |
| | Solutions Corp. Class A | 2,717,216 | 199,145 |
| | Mastercard Inc. Class A | 867,170 | 194,341 |
| * | Yahoo! Inc. | 11,670,998 | 194,089 |
| | | |
| | | | Market |
| | | | Value |
| | | Shares | ($000) |
| * | Motorola Inc. | 21,035,391 | 190,791 |
| * | NetApp Inc. | 3,235,944 | 177,847 |
| | Broadcom Corp. Class A | 4,077,531 | 177,576 |
| * | Juniper Networks Inc. | 4,684,487 | 172,951 |
| | Applied Materials Inc. | 11,962,515 | 168,073 |
| | Xerox Corp. | 12,420,158 | 143,080 |
| * | Adobe Systems Inc. | 4,554,676 | 140,193 |
| * | Salesforce.com Inc. | 1,058,834 | 139,766 |
| * | Intuit Inc. | 2,502,880 | 123,392 |
| * | Symantec Corp. | 6,949,998 | 116,343 |
| * | Citrix Systems Inc. | 1,681,186 | 115,010 |
| | Western Union Co. | 5,872,081 | 109,045 |
| * | SanDisk Corp. | 2,099,527 | 104,682 |
| | Analog Devices Inc. | 2,673,891 | 100,725 |
| | Altera Corp. | 2,798,351 | 99,565 |
| * | F5 Networks Inc. | 723,761 | 94,205 |
| | Paychex Inc. | 2,881,824 | 89,077 |
| | CA Inc. | 3,435,319 | 83,959 |
| | Amphenol Corp. Class A | 1,563,235 | 82,508 |
| * | NVIDIA Corp. | 5,201,603 | 80,105 |
| * | Fiserv Inc. | 1,331,393 | 77,966 |
| * | Red Hat Inc. | 1,706,229 | 77,889 |
| * | Autodesk Inc. | 2,035,790 | 77,767 |
| * | Akamai Technologies Inc. | 1,632,444 | 76,807 |
| * | BMC Software Inc. | 1,590,617 | 74,982 |
| | Linear Technology Corp. | 2,017,919 | 69,800 |
| * | Western Digital Corp. | 2,057,302 | 69,743 |
| | Computer Sciences Corp. | 1,382,978 | 68,596 |
| | Xilinx Inc. | 2,319,737 | 67,226 |
| | Fidelity | | |
| | National Information | | |
| | Services Inc. | 2,371,003 | 64,942 |
| * | McAfee Inc. | 1,379,992 | 63,907 |
| *,^ | First Solar Inc. | 484,083 | 62,999 |
| * | Teradata Corp. | 1,499,521 | 61,720 |
| * | Micron Technology Inc. | 7,670,273 | 61,516 |
| | KLA-Tencor Corp. | 1,495,595 | 57,790 |
| ^ | Microchip | | |
| | Technology Inc. | 1,672,471 | 57,215 |
| | Harris Corp. | 1,148,302 | 52,018 |
| | VeriSign Inc. | 1,539,664 | 50,301 |
| * | Electronic Arts Inc. | 2,970,606 | 48,659 |
| * | FLIR Systems Inc. | 1,419,685 | 42,236 |
| * | Advanced Micro | | |
| | Devices Inc. | 5,126,555 | 41,935 |
| * | SAIC Inc. | 2,631,977 | 41,743 |
| | Jabil Circuit Inc. | 1,758,941 | 35,337 |
| * | LSI Corp. | 5,531,836 | 33,136 |
| | National | | |
| | Semiconductor Corp. | 2,147,111 | 29,544 |
| * | JDS Uniphase Corp. | 1,997,860 | 28,929 |
| | Molex Inc. | 1,235,629 | 28,074 |
| * | Monster Worldwide Inc. | 1,166,779 | 27,571 |
| * | Novellus Systems Inc. | 809,142 | 26,151 |
16
500 Index Fund
| | | |
| | | | Market |
| | | | Value |
| | | Shares | ($000) |
| * | Lexmark International Inc. | | |
| | Class A | 703,990 | 24,513 |
| * | MEMC Electronic | | |
| | Materials Inc. | 2,037,588 | 22,943 |
| * | Compuware Corp. | 1,965,190 | 22,934 |
| * | Teradyne Inc. | 1,624,522 | 22,808 |
| | Total System | | |
| | Services Inc. | 1,464,590 | 22,525 |
| | Tellabs Inc. | 3,310,200 | 22,443 |
| * | Novell Inc. | 3,147,497 | 18,633 |
| * | QLogic Corp. | 947,624 | 16,129 |
| | Molex Inc. Class A | 4,051 | 76 |
| | | | 19,083,192 |
| Materials (3.7%) | | |
| | Freeport-McMoRan | | |
| | Copper & Gold Inc. | 4,216,153 | 506,318 |
| | EI du Pont de | | |
| | Nemours & Co. | 8,173,850 | 407,712 |
| | Dow Chemical Co. | 10,392,874 | 354,813 |
| | Monsanto Co. | 4,802,679 | 334,459 |
| | Newmont Mining Corp. | 4,414,756 | 271,198 |
| | Praxair Inc. | 2,743,219 | 261,895 |
| | Air Products & | | |
| | Chemicals Inc. | 1,918,453 | 174,483 |
| | Alcoa Inc. | 9,145,404 | 140,748 |
| | Nucor Corp. | 2,826,742 | 123,868 |
| | PPG Industries Inc. | 1,459,486 | 122,699 |
| | International Paper Co. | 3,916,589 | 106,688 |
| | Ecolab Inc. | 2,078,295 | 104,788 |
| | Cliffs Natural | | |
| | Resources Inc. | 1,212,719 | 94,604 |
| | CF Industries | | |
| | Holdings Inc. | 636,821 | 86,066 |
| ^ | United States Steel Corp. | 1,287,215 | 75,199 |
| | Sigma-Aldrich Corp. | 1,085,924 | 72,279 |
| | Sherwin-Williams Co. | 803,078 | 67,258 |
| | Eastman Chemical Co. | 646,674 | 54,372 |
| | Ball Corp. | 790,660 | 53,804 |
| | FMC Corp. | 649,794 | 51,912 |
| | Vulcan Materials Co. | 1,149,392 | 50,987 |
| | Allegheny | | |
| | Technologies Inc. | 883,702 | 48,763 |
| * | Owens-Illinois Inc. | 1,466,095 | 45,009 |
| | Airgas Inc. | 669,809 | 41,836 |
| | International Flavors & | | |
| | Fragrances Inc. | 715,779 | 39,790 |
| | MeadWestvaco Corp. | 1,506,128 | 39,400 |
| | Sealed Air Corp. | 1,430,131 | 36,397 |
| | Bemis Co. Inc. | 970,743 | 31,705 |
| | AK Steel Holding Corp. | 987,750 | 16,170 |
| * | Titanium Metals Corp. | 809,096 | 13,900 |
| | | | 3,829,120 |
| | | |
| | | | Market |
| | | | Value |
| | | Shares | ($000) |
| Telecommunication Services (3.1%) | |
| | AT&T Inc. | 52,918,393 | 1,554,742 |
| | Verizon | | |
| | Communications Inc. | 25,310,951 | 905,626 |
| * | American Tower Corp. | | |
| | Class A | 3,573,175 | 184,519 |
| | CenturyLink Inc. | 2,714,999 | 125,352 |
| | Qwest Communications | | |
| | International Inc. | 15,603,046 | 118,739 |
| * | Sprint Nextel Corp. | 26,743,813 | 113,126 |
| | Frontier | | |
| | Communications Corp. | 8,898,169 | 86,579 |
| | Windstream Corp. | 4,333,896 | 60,415 |
| * | MetroPCS | | |
| | Communications Inc. | 2,347,974 | 29,655 |
| | | | 3,178,753 |
| Utilities (3.3%) | | |
| | Southern Co. | 7,509,218 | 287,077 |
| | Exelon Corp. | 5,922,076 | 246,595 |
| | Dominion Resources Inc. | 5,197,681 | 222,045 |
| | Duke Energy Corp. | 11,859,557 | 211,219 |
| | NextEra Energy Inc. | 3,723,265 | 193,573 |
| | PG&E Corp. | 3,510,371 | 167,936 |
| | American Electric | | |
| | Power Co. Inc. | 4,300,116 | 154,718 |
| | Public Service Enterprise | | |
| | Group Inc. | 4,529,797 | 144,093 |
| | Consolidated Edison Inc. | 2,601,282 | 128,946 |
| | Entergy Corp. | 1,619,694 | 114,723 |
| | Progress Energy Inc. | 2,622,727 | 114,036 |
| | PPL Corp. | 4,327,008 | 113,887 |
| | Sempra Energy | 2,149,205 | 112,790 |
| | Edison International | 2,917,072 | 112,599 |
| | FirstEnergy Corp. | 2,729,233 | 101,036 |
| | Xcel Energy Inc. | 4,119,394 | 97,012 |
| * | AES Corp. | 5,926,782 | 72,188 |
| | DTE Energy Co. | 1,514,057 | 68,617 |
| | Wisconsin Energy Corp. | 1,047,839 | 61,676 |
| | Ameren Corp. | 2,146,989 | 60,524 |
| | CenterPoint Energy Inc. | 3,788,574 | 59,556 |
| | Constellation Energy | | |
| | Group Inc. | 1,788,702 | 54,788 |
| | Oneok Inc. | 954,281 | 52,934 |
| | Northeast Utilities | 1,579,727 | 50,362 |
| | NiSource Inc. | 2,491,331 | 43,897 |
| * | NRG Energy Inc. | 2,212,871 | 43,239 |
| | SCANA Corp. | 1,013,525 | 41,149 |
| | CMS Energy Corp. | 2,191,738 | 40,766 |
| | Pinnacle West | | |
| | Capital Corp. | 973,702 | 40,360 |
| | Allegheny Energy Inc. | 1,521,335 | 36,877 |
| | Pepco Holdings Inc. | 2,014,400 | 36,763 |
| | TECO Energy Inc. | 1,923,406 | 34,237 |
17
500 Index Fund
| | | |
| | | | Market |
| | | | Value |
| | | Shares | ($000) |
| | Integrys Energy | | |
| | Group Inc. | 696,164 | 33,771 |
| | Nicor Inc. | 408,014 | 20,368 |
| | | | 3,374,357 |
| Total Common Stocks | | |
| (Cost $74,435,238) | | 102,340,874 |
| Temporary Cash Investments (0.4%)1 | |
| Money Market Fund (0.4%) | | |
| 2,3 | Vanguard Market | | |
| | Liquidity Fund, | | |
| | 0.211% | 373,300,225 | 373,300 |
| |
| | | Face | |
| | | Amount | |
| | | ($000) |
| U.S. Government and Agency Obligations (0.0%) |
| 4 | Fannie Mae | | |
| | Discount Notes, | | |
| | 0.240%, 6/22/11 | 5,000 | 4,994 |
| 4,5 | Freddie Mac | | |
| | Discount Notes, | | |
| | 0.240%, 3/14/11 | 15,000 | 14,994 |
| 4,5 | Freddie Mac | | |
| | Discount Notes, | | |
| | 0.185%, 3/28/11 | 5,000 | 4,997 |
| | | | 24,985 |
| Total Temporary Cash Investments | |
| (Cost $398,285) | | 398,285 |
| Total Investments (100.2%) | | |
| (Cost $74,833,523) | | 102,739,159 |
| Other Assets and Liabilities (-0.2%) | |
| Other Assets | | 1,551,047 |
| Liabilities3 | | (1,709,790) |
| | | | (158,743) |
| Net Assets (100%) | | 102,580,416 |
| |
| At December 31, 2010, net assets consisted of: |
| | Amount |
| | ($000) |
| Paid-in Capital | 77,333,798 |
| Overdistributed Net Investment Income | (138,844) |
| Accumulated Net Realized Losses | (2,523,164) |
| Unrealized Appreciation (Depreciation) | |
| Investment Securities | 27,905,636 |
| Futures Contracts | 2,990 |
| Net Assets | 102,580,416 |
| |
| Investor Shares—Net Assets | |
| Applicable to 275,459,252 outstanding | |
| $.001 par value shares of beneficial | |
| interest (unlimited authorization) | 31,904,010 |
| Net Asset Value Per Share— | |
| Investor Shares | $115.82 |
| |
| Admiral Shares—Net Assets | |
| Applicable to 444,094,927 outstanding | |
| $.001 par value shares of beneficial | |
| interest (unlimited authorization) | 51,437,695 |
| Net Asset Value Per Share— | |
| Admiral Shares | $115.83 |
| |
| Signal Shares—Net Assets | |
| Applicable to 198,351,097 outstanding | |
| $.001 par value shares of beneficial | |
| interest (unlimited authorization) | 18,977,465 |
| Net Asset Value Per Share— | |
| Signal Shares | $95.68 |
| |
| ETF Shares—Net Assets | |
| Applicable to 4,545,526 outstanding | |
| $.001 par value shares of beneficial | |
| interest (unlimited authorization) | 261,246 |
| Net Asset Value Per Share— | |
| ETF Shares | $57.47 |
See Note A in Notes to Financial Statements.
* Non-income-producing security.
^ Part of security position is on loan to broker-dealers. The total value of securities on loan is $146,631,000.
1 The fund invests a portion of its cash reserves in equity markets through the use of index futures contracts. After giving effect to futures investments, the fund’s effective common stock and temporary cash investment positions represent 100.0% and 0.2%, respectively, of net assets.
2 Affiliated money market fund available only to Vanguard funds and certain trusts and accounts managed by Vanguard. Rate shown is the 7-day yield.
3 Includes $151,347,000 of collateral received for securities on loan.
4 The issuer operates under a congressional charter; its securities are not backed by the full faith and credit of the U.S. government.
5 Securities with a value of $17,992,000 have been segregated as initial margin for open futures contracts.
REIT—Real Estate Investment Trust.
See accompanying Notes, which are an integral part of the Financial Statements.
18
500 Index Fund
| |
| Statement of Operations | |
| |
| | Year Ended |
| | December 31, 2010 |
| | ($000) |
| Investment Income | |
| Income | |
| Dividends | 1,986,510 |
| Interest1 | 380 |
| Security Lending | 6,573 |
| Total Income | 1,993,463 |
| Expenses | |
| The Vanguard Group—Note B | |
| Investment Advisory Services | 4,950 |
| Management and Administrative—Investor Shares | 62,893 |
| Management and Administrative—Admiral Shares | 10,828 |
| Management and Administrative—Signal Shares | 4,123 |
| Management and Administrative—ETF Shares | 21 |
| Marketing and Distribution—Investor Shares | 11,771 |
| Marketing and Distribution—Admiral Shares | 5,380 |
| Marketing and Distribution—Signal Shares | 4,641 |
| Marketing and Distribution—ETF Shares | 1 |
| Custodian Fees | 1,059 |
| Auditing Fees | 33 |
| Shareholders’ Reports—Investor Shares | 1,173 |
| Shareholders’ Reports—Admiral Shares | 92 |
| Shareholders’ Reports—Signal Shares | 115 |
| Shareholders’ Reports—ETF Shares | — |
| Trustees’ Fees and Expenses | 156 |
| Total Expenses | 107,236 |
| Net Investment Income | 1,886,227 |
| Realized Net Gain (Loss) | |
| Investment Securities Sold | 1,286,947 |
| Futures Contracts | 9,311 |
| Realized Net Gain (Loss) | 1,296,258 |
| Change in Unrealized Appreciation (Depreciation) | |
| Investment Securities | 10,283,344 |
| Futures Contracts | 2,794 |
| Change in Unrealized Appreciation (Depreciation) | 10,286,138 |
| Net Increase (Decrease) in Net Assets Resulting from Operations | 13,468,623 |
| 1 Interest income from an affiliated company of the fund was $287,000. | |
See accompanying Notes, which are an integral part of the Financial Statements.
19
500 Index Fund
| | |
| Statement of Changes in Net Assets | | |
| |
| | Year Ended December 31, |
| | 2010 | 2009 |
| | ($000) | ($000) |
| Increase (Decrease) in Net Assets | | |
| Operations | | |
| Net Investment Income | 1,886,227 | 1,976,600 |
| Realized Net Gain (Loss) | 1,296,258 | 5,105,226 |
| Change in Unrealized Appreciation (Depreciation) | 10,286,138 | 12,793,273 |
| Net Increase (Decrease) in Net Assets Resulting from Operations | 13,468,623 | 19,875,099 |
| Distributions | | |
| Net Investment Income | | |
| Investor Shares | (821,569) | (992,312) |
| Admiral Shares | (666,060) | (603,880) |
| Signal Shares | (332,468) | (359,090) |
| ETF Shares | (1,184) | — |
| Realized Capital Gain | | |
| Investor Shares | — | — |
| Admiral Shares | — | — |
| Signal Shares | — | — |
| ETF Shares | — | — |
| Total Distributions | (1,821,281) | (1,955,282) |
| Capital Share Transactions | | |
| Investor Shares | (21,636,466) | 204,042 |
| Admiral Shares | 18,712,213 | 59,911 |
| Signal Shares | 325,876 | 213,059 |
| ETF Shares | 248,592 | — |
| Net Increase (Decrease) from Capital Share Transactions | (2,349,785) | 477,012 |
| Total Increase (Decrease) | 9,297,557 | 18,396,829 |
| Net Assets | | |
| Beginning of Period | 93,282,859 | 74,886,030 |
| End of Period1 | 102,580,416 | 93,282,859 |
| 1 Net Assets—End of Period includes undistributed (overdistributed) net investment income of ($138,844,000) and ($203,790,000). |
See accompanying Notes, which are an integral part of the Financial Statements.
20
500 Index Fund
Financial Highlights
| | | | | |
| Investor Shares | | | | | |
| |
| For a Share Outstanding | | | Year Ended December 31, |
| Throughout Each Period | 2010 | 2009 | 2008 | 2007 | 2006 |
| Net Asset Value, Beginning of Period | $102.67 | $83.09 | $135.15 | $130.59 | $114.92 |
| Investment Operations | | | | | |
| Net Investment Income | 2.020 | 2.131 | 2.443 | 2.470 | 2.110 |
| Net Realized and Unrealized Gain (Loss) | | | | | |
| on Investments | 13.096 | 19.553 | (51.998) | 4.580 | 15.700 |
| Total from Investment Operations | 15.116 | 21.684 | (49.555) | 7.050 | 17.810 |
| Distributions | | | | | |
| Dividends from Net Investment Income | (1.966) | (2.104) | (2.505) | (2.490) | (2.140) |
| Distributions from Realized Capital Gains | — | — | — | — | — |
| Total Distributions | (1.966) | (2.104) | (2.505) | (2.490) | (2.140) |
| Net Asset Value, End of Period | $115.82 | $102.67 | $83.09 | $135.15 | $130.59 |
| |
| Total Return1 | 14.91% | 26.49% | -37.02% | 5.39% | 15.64% |
| |
| Ratios/Supplemental Data | | | | | |
| Net Assets, End of Period (Millions) | $31,904 | $48,313 | $38,778 | $63,327 | $72,013 |
| Ratio of Total Expenses to | | | | | |
| Average Net Assets | 0.17% | 0.18% | 0.16% | 0.15% | 0.18% |
| Ratio of Net Investment Income to | | | | | |
| Average Net Assets | 1.94% | 2.42% | 2.16% | 1.81% | 1.74% |
| Portfolio Turnover Rate2 | 5% | 12% | 6% | 5% | 5% |
1 Total returns do not include account service fees that may have applied in the periods shown. Fund prospectuses provide information about any applicable account service fees.
2 Excludes the value of portfolio securities received or delivered as a result of in-kind purchases or redemptions of the fund’s capital shares, including ETF Creation Units.
See accompanying Notes, which are an integral part of the Financial Statements.
21
500 Index Fund
Financial Highlights
| | | | | |
| Admiral Shares | | | | | |
| |
| For a Share Outstanding | | | Year Ended December 31, |
| Throughout Each Period | 2010 | 2009 | 2008 | 2007 | 2006 |
| Net Asset Value, Beginning of Period | $102.67 | $83.09 | $135.15 | $130.59 | $114.92 |
| Investment Operations | | | | | |
| Net Investment Income | 2.152 | 2.227 | 2.534 | 2.583 | 2.222 |
| Net Realized and Unrealized Gain (Loss) | | | | | |
| on Investments | 13.092 | 19.556 | (52.000) | 4.576 | 15.700 |
| Total from Investment Operations | 15.244 | 21.783 | (49.466) | 7.159 | 17.922 |
| Distributions | | | | | |
| Dividends from Net Investment Income | (2.084) | (2.203) | (2.594) | (2.599) | (2.252) |
| Distributions from Realized Capital Gains | — | — | — | — | — |
| Total Distributions | (2.084) | (2.203) | (2.594) | (2.599) | (2.252) |
| Net Asset Value, End of Period | $115.83 | $102.67 | $83.09 | $135.15 | $130.59 |
| |
| Total Return | 15.05% | 26.62% | -36.97% | 5.47% | 15.75% |
| |
| Ratios/Supplemental Data | | | | | |
| Net Assets, End of Period (Millions) | $51,438 | $28,380 | $23,009 | $37,113 | $46,467 |
| Ratio of Total Expenses to | | | | | |
| Average Net Assets | 0.06% | 0.07% | 0.08% | 0.07% | 0.09% |
| Ratio of Net Investment Income to | | | | | |
| Average Net Assets | 2.05% | 2.53% | 2.24% | 1.89% | 1.83% |
| Portfolio Turnover Rate1 | 5% | 12% | 6% | 5% | 5% |
1 Excludes the value of portfolio securities received or delivered as a result of in-kind purchases or redemptions of the fund’s capital shares, including ETF Creation Units.
See accompanying Notes, which are an integral part of the Financial Statements.
22
500 Index Fund
Financial Highlights
| | | | | |
| Signal Shares | | | | | |
| | | | | | Sept. 29, |
| | | | | | 20061 to |
| For a Share Outstanding | Year Ended December 31, | Dec. 31, |
| Throughout Each Period | 2010 | 2009 | 2008 | 2007 | 2006 |
| Net Asset Value, Beginning of Period | $84.81 | $68.64 | $111.64 | $107.86 | $101.61 |
| Investment Operations | | | | | |
| Net Investment Income | 1.780 | 1.839 | 2.092 | 2.119 | .502 |
| Net Realized and Unrealized Gain (Loss) | | | | | |
| on Investments | 10.813 | 16.151 | (42.952) | 3.794 | 6.287 |
| Total from Investment Operations | 12.593 | 17.990 | (40.860) | 5.913 | 6.789 |
| Distributions | | | | | |
| Dividends from Net Investment Income | (1.723) | (1.820) | (2.140) | (2.133) | (.539) |
| Distributions from Realized Capital Gains | — | — | — | — | — |
| Total Distributions | (1.723) | (1.820) | (2.140) | (2.133) | (.539) |
| Net Asset Value, End of Period | $95.68 | $84.81 | $68.64 | $111.64 | $107.86 |
| |
| Total Return | 15.05% | 26.61% | -36.97% | 5.47% | 6.68% |
| |
| Ratios/Supplemental Data | | | | | |
| Net Assets, End of Period (Millions) | $18,977 | $16,590 | $13,099 | $21,433 | $713 |
| Ratio of Total Expenses to | | | | | |
| Average Net Assets | 0.06% | 0.07% | 0.08% | 0.07% | 0.09%2 |
| Ratio of Net Investment Income to | | | | | |
| Average Net Assets | 2.05% | 2.53% | 2.24% | 1.89% | 1.83%2 |
| Portfolio Turnover Rate3 | 5% | 12% | 6% | 5% | 5% |
1 Inception.
2 Annualized.
3 Excludes the value of portfolio securities received or delivered as a result of in-kind purchases or redemptions of the fund’s capital shares,
including ETF Creation Units.
See accompanying Notes, which are an integral part of the Financial Statements.
23
500 Index Fund
Financial Highlights
| |
| ETF Shares | |
| | September 7, 20101 to |
| For a Share Outstanding Throughout the Period | December 31, 2010 |
| Net Asset Value, Beginning of Period | $50.08 |
| Investment Operations | |
| Net Investment Income | .363 |
| Net Realized and Unrealized Gain (Loss) on Investments | 7.569 |
| Total from Investment Operations | 7.932 |
| Distributions | |
| Dividends from Net Investment Income | (.542) |
| Distributions from Realized Capital Gains | — |
| Total Distributions | (.542) |
| Net Asset Value, End of Period | $57.47 |
| |
| Total Return | 15.89% |
| |
| Ratios/Supplemental Data | |
| Net Assets, End of Period (Millions) | $261 |
| Ratio of Total Expenses to Average Net Assets | 0.06%2 |
| Ratio of Net Investment Income to Average Net Assets | 2.05%2 |
| Portfolio Turnover Rate3 | 5% |
1 Inception.
2 Annualized.
3 Excludes the value of portfolio securities received or delivered as a result of in-kind purchases or redemptions of the fund’s capital shares,
including ETF Creation Units.
See accompanying Notes, which are an integral part of the Financial Statements.
24
500 Index Fund
Notes to Financial Statements
Vanguard 500 Index Fund is registered under the Investment Company Act of 1940 as an open-end investment company, or mutual fund. The fund offers four classes of shares: Investor Shares, Admiral Shares, Signal Shares, and ETF Shares. Investor Shares are available to any investor who meets the fund’s minimum purchase requirements. Admiral Shares and Signal Shares are designed for investors who meet certain administrative, service, and account-size criteria. ETF Shares were first issued on September 7, 2010, and first offered to the public on September 9, 2010. ETF Shares are listed for trading on the NYSE Arca, Inc.; they can be purchased and sold through a broker.
A. The following significant accounting policies conform to generally accepted accounting principles for U.S. mutual funds. The fund consistently follows such policies in preparing its financial statements.
1. Security Valuation: Securities are valued as of the close of trading on the New York Stock Exchange (generally 4 p.m., Eastern time) on the valuation date. Equity securities are valued at the latest quoted sales prices or official closing prices taken from the primary market in which each security trades; such securities not traded on the valuation date are valued at the mean of the latest quoted bid and asked prices. Securities for which market quotations are not readily available, or whose values have been materially affected by events occurring before the fund’s pricing time but after the close of the securities’ primary markets, are valued by methods deemed by the board of trustees to represent fair value. Investments in Vanguard Market Liquidity Fund are valued at that fund’s net asset value. Temporary cash investments acquired over 60 days to maturity are valued using the latest bid prices or using valuations based on a matrix system (which considers such factors as security prices, yields, maturities, and ratings), both as furnished by independent pricing services. Other temporary cash investments are valued at amortized cost, which approximates market value.
2. Futures Contracts: The fund uses index futures contracts to a limited extent, with the objectives of maintaining full exposure to the stock market, enhancing returns, maintaining liquidity, and minimizing transaction costs. The fund may purchase futures contracts to immediately invest incoming cash in the market, or sell futures in response to cash outflows, thereby simulating a fully invested position in the underlying index while maintaining a cash balance for liquidity. The fund may seek to enhance returns by using futures contracts instead of the underlying securities when futures are believed to be priced more attractively than the underlying securities. The primary risks associated with the use of futures contracts are imperfect correlation between changes in market values of stocks held by the fund and the prices of futures contracts, and the possibility of an illiquid market.
Futures contracts are valued at their quoted daily settlement prices. The aggregate principal amounts of the contracts are not recorded in the Statement of Net Assets. Fluctuations in the value of the contracts are recorded in the Statement of Net Assets as an asset (liability) and in the Statement of Operations as unrealized appreciation (depreciation) until the contracts are closed, when they are recorded as realized futures gains (losses).
3. Federal Income Taxes: The fund intends to continue to qualify as a regulated investment company and distribute all of its taxable income. Management has analyzed the fund’s tax positions taken for all open federal income tax years (December 31, 2007–2010), and has concluded that no provision for federal income tax is required in the fund’s financial statements.
4. Distributions: Distributions to shareholders are recorded on the ex-dividend date.
25
500 Index Fund
5. Security Lending: The fund may lend its securities to qualified institutional borrowers to earn additional income. Security loans are required to be secured at all times by collateral at least equal to the market value of securities loaned. The fund invests cash collateral received in Vanguard Market Liquidity Fund, and records a liability for the return of the collateral, during the period the securities are on loan. Security lending income represents fees charged to borrowers plus income earned on investing cash collateral, less expenses associated with the loan.
6. Other: Dividend income is recorded on the ex-dividend date. Interest income includes income distributions received from Vanguard Market Liquidity Fund and is accrued daily. Security transactions are accounted for on the date securities are bought or sold. Costs used to determine realized gains (losses) on the sale of investment securities are those of the specific securities sold.
Each class of shares has equal rights as to assets and earnings, except that each class separately bears certain class-specific expenses related to maintenance of shareholder accounts (included in Management and Administrative expenses) and shareholder reporting. Marketing and distribution expenses are allocated to each class of shares based on a method approved by the board of trustees. Income, other non-class-specific expenses, and gains and losses on investments are allocated to each class of shares based on its relative net assets.
B. The Vanguard Group furnishes at cost investment advisory, corporate management, administrative, marketing, and distribution services. The costs of such services are allocated to the fund under methods approved by the board of trustees. The fund has committed to provide up to 0.40% of its net assets in capital contributions to Vanguard. At December 31, 2010, the fund had contributed capital of $16,883,000 to Vanguard (included in Other Assets), representing 0.02% of the fund’s net assets and 6.75% of Vanguard’s capitalization. The fund’s trustees and officers are also directors and officers of Vanguard.
C. Various inputs may be used to determine the value of the fund’s investments. These inputs are summarized in three broad levels for financial statement purposes. The inputs or methodologies used to value securities are not necessarily an indication of the risk associated with investing in those securities.
Level 1—Quoted prices in active markets for identical securities.
Level 2—Other significant observable inputs (including quoted prices for similar securities, interest rates, prepayment speeds, credit risk, etc.).
Level 3—Significant unobservable inputs (including the fund’s own assumptions used to determine the fair value of investments).
The following table summarizes the fund’s investments as of December 31, 2010, based on the inputs used to value them:
| | | |
| | Level 1 | Level 2 | Level 3 |
| Investments | ($000) | ($000) | ($000) |
| Common Stocks | 102,340,874 | — | — |
| Temporary Cash Investments | 373,300 | 24,985 | — |
| Futures Contracts—Liabilities1 | (283) | — | — |
| Total | 102,713,891 | 24,985 | — |
| 1 Represents variation margin on the last day of the reporting period. | | | |
26
500 Index Fund
D. At December 31, 2010, the aggregate settlement value of open futures contracts and the related unrealized appreciation (depreciation) were:
| | | | |
| | | | | ($000) |
| | | Number of | Aggregate | Unrealized |
| | | Long (Short) | Settlement | Appreciation |
| Futures Contracts | Expiration | Contracts | Value | (Depreciation) |
| E-mini S&P 500 Index | March 2011 | 2,000 | 125,300 | 770 |
| S&P 500 Index | March 2011 | 354 | 110,891 | 2,220 |
Unrealized appreciation (depreciation) on open futures contracts is required to be treated as realized gain (loss) for tax purposes.
E. Distributions are determined on a tax basis and may differ from net investment income and realized capital gains for financial reporting purposes. Differences may be permanent or temporary. Permanent differences are reclassified among capital accounts in the financial statements to reflect their tax character. Temporary differences arise when certain items of income, expense, gain, or loss are recognized in different periods for financial statement and tax purposes; these differences will reverse at some time in the future. Differences in classification may also result from the treatment of short-term gains as ordinary income for tax purposes.
During the year ended December 31, 2010, the fund realized $967,491,000 of net capital gains resulting from in-kind redemptions—in which shareholders exchanged fund shares for securities held by the fund rather than for cash. Because such gains are not taxable to the fund, and are not distributed to shareholders, they have been reclassified from accumulated net realized losses to paid-in capital.
For tax purposes, at December 31, 2010, the fund had $8,777,000 of ordinary income available for distribution. The fund had available capital loss carryforwards totaling $2,057,911,000 to offset future net capital gains of $293,941,000 through December 31, 2014, and $1,763,970,000 through December 31, 2016. In addition, the fund realized losses of $317,773,000 during the period from November 1, 2010, through December 31, 2010, which are deferred and will be treated as realized for tax purposes in fiscal 2011.
At December 31, 2010, the cost of investment securities for tax purposes was $74,974,401,000.
Net unrealized appreciation of investment securities for tax purposes was $27,764,758,000, consisting of unrealized gains of $37,123,583,000 on securities that had risen in value since their purchase and $9,358,825,000 in unrealized losses on securities that had fallen in value since their purchase.
F. During the year ended December 31, 2010, the fund purchased $4,653,528,000 of investment securities and sold $7,170,928,000 of investment securities, other than temporary cash investments.
27
500 Index Fund
G. Capital share transactions for each class of shares were:
| | | | |
| | | | Year Ended December 31, |
| | | 2010 | | 2009 |
| | Amount | Shares | Amount | Shares |
| | ($000) | (000) | ($000) | (000) |
| Investor Shares | | | | |
| Issued | 6,152,449 | 58,515 | 6,999,037 | 82,421 |
| Issued in Lieu of Cash Distributions | 796,796 | 7,579 | 961,778 | 10,704 |
| Redeemed | (28,585,711) | (261,206) | (7,756,773) | (89,256) |
| Net Increase (Decrease)—Investor Shares | (21,636,466) | (195,112) | 204,042 | 3,869 |
| Admiral Shares | | | | |
| Issued | 21,802,511 | 197,021 | 3,155,584 | 36,520 |
| Issued in Lieu of Cash Distributions | 591,430 | 5,509 | 527,723 | 5,866 |
| Redeemed | (3,681,728) | (34,849) | (3,623,396) | (42,890) |
| Net Increase (Decrease)—Admiral Shares | 18,712,213 | 167,681 | 59,911 | (504) |
| Signal Shares | | | | |
| Issued | 4,491,022 | 50,934 | 3,948,201 | 56,496 |
| Issued in Lieu of Cash Distributions | 301,194 | 3,437 | 323,718 | 4,362 |
| Redeemed | (4,466,340) | (51,633) | (4,058,860) | (56,083) |
| Net Increase (Decrease)—Signal Shares | 325,876 | 2,738 | 213,059 | 4,775 |
| ETF Shares1 | | | | |
| Issued | 251,293 | 4,596 | — | — |
| Issued in Lieu of Cash Distributions | — | — | — | — |
| Redeemed | (2,701) | (50) | — | — |
| Net Increase (Decrease)—ETF Shares | 248,592 | 4,546 | — | — |
| 1 Inception was September 7, 2010, for ETF Shares. | | | | |
H. In preparing the financial statements as of December 31, 2010, management considered the impact of subsequent events for potential recognition or disclosure in these financial statements.
28
Report of Independent Registered Public Accounting Firm
To the Trustees of Vanguard Index Funds and the Shareholders of Vanguard 500 Index Fund:
In our opinion, the accompanying statement of net assets and the related statements of operations and of changes in net assets and the financial highlights present fairly, in all material respects, the financial position of Vanguard 500 Index Fund (constituting a separate portfolio of Vanguard Index Funds, hereafter referred to as the “Fund”) at December 31, 2010, the results of its operations for the year then ended, the changes in its net assets for each of the two years in the period then ended and the financial highlights for each of the periods indicated, in conformity with accounting principles generally accepted in the United States of America. These financial statements and financial highlights (hereafter referred to as “financial statements”) are the responsibility of the Fund’s management; our responsibility is to express an opinion on these financial statements based on our audits. We co nducted our audits of these financial statements in accordance with the standards of the Public Company Accounting Oversight Board (United States). Those standards require that we plan and perform the audit to obtain reasonable assurance about whether the financial statements are free of material misstatement. An audit includes examining, on a test basis, evidence supporting the amounts and disclosures in the financial statements, assessing the accounting principles used and significant estimates made by management, and evaluating the overall financial statement presentation. We believe that our audits, which included confirmation of securities at December 31, 2010 by correspondence with the custodian and broker and by agreement to the underlying ownership records of Vanguard Market Liquidity Fund, provide a reasonable basis for our opinion.
PricewaterhouseCoopers LLP
Philadelphia, Pennsylvania
February 8, 2011
|
| Special 2010 tax information (unaudited) for Vanguard 500 Index Fund |
This information for the fiscal year ended December 31, 2010, is included pursuant to provisions of the Internal Revenue Code.
The fund distributed $1,821,281,000 of qualified dividend income to shareholders during the fiscal year.
For corporate shareholders, 100% of investment income (dividend income plus short-term gains, if any) qualifies for the dividends-received deduction.
29
Your Fund’s After-Tax Returns
This table presents returns for your fund both before and after taxes. The after-tax returns are shown in two ways: (1) assuming that an investor owned the fund during the entire period and paid taxes on the fund’s distributions, and (2) assuming that an investor paid taxes on the fund’s distributions and sold all shares at the end of each period.
Calculations are based on the highest individual federal income tax and capital gains tax rates in effect at the times of the distributions and the hypothetical sales. State and local taxes were not considered. After-tax returns reflect any qualified dividend income . (In the example, returns after the sale of fund shares may be higher than those assuming no sale. This occurs when the sale would have produced a capital loss. The calculation assumes that the investor received a tax deduction for the loss.) The table shows returns for Investor Shares only; returns for other share classes will differ. Please note that your actual after-tax returns will depend on your tax situation and may differ from those shown. Also note that if you own the fund in a tax-deferred account, such as an individual retirement account or a 401(k) plan, this information does not apply to you. Such accounts are not subject to current taxes.
Finally, keep in mind that a fund’s performance—whether before or after taxes—does not guarantee future results.
| | | |
| Average Annual Total Returns: 500 Index Fund Investor Shares | | |
| Periods Ended December 31, 2010 | | | |
| | One | Five | Ten |
| | Year | Years | Years |
| Returns Before Taxes | 14.91% | 2.21% | 1.31% |
| Returns After Taxes on Distributions | 14.60 | 1.90 | 0.97 |
| Returns After Taxes on Distributions and Sale of Fund Shares | 10.06 | 1.86 | 1.02 |
30
About Your Fund’s Expenses
As a shareholder of the fund, you incur ongoing costs, which include costs for portfolio management, administrative services, and shareholder reports (like this one), among others. Operating expenses, which are deducted from a fund’s gross income, directly reduce the investment return of the fund.
A fund’s expenses are expressed as a percentage of its average net assets. This figure is known as the expense ratio. The following examples are intended to help you understand the ongoing costs (in dollars) of investing in your fund and to compare these costs with those of other mutual funds. The examples are based on an investment of $1,000 made at the beginning of the period shown and held for the entire period.
The accompanying table illustrates your fund’s costs in two ways:
• Based on actual fund return. This section helps you to estimate the actual expenses that you paid over the period. The ”Ending Account Value“ shown is derived from the fund‘s actual return, and the third column shows the dollar amount that would have been paid by an investor who started with $1,000 in the fund. You may use the information here, together with the amount you invested, to estimate the expenses that you paid over the period.
To do so, simply divide your account value by $1,000 (for example, an $8,600 account value divided by $1,000 = 8.6), then multiply the result by the number given for your fund under the heading ”Expenses Paid During Period.“
• Based on hypothetical 5% yearly return. This section is intended to help you compare your fund‘s costs with those of other mutual funds. It assumes that the fund had a yearly return of 5% before expenses, but that the expense ratio is unchanged. In this case—because the return used is not the fund’s actual return—the results do not apply to your investment. The example is useful in making comparisons because the Securities and Exchange Commission requires all mutual funds to calculate expenses based on a 5% return. You can assess your fund’s costs by comparing this hypothetical example with the hypothetical examples that appear in shareholder reports of other funds.
Note that the expenses shown in the table are meant to highlight and help you compare ongoing costs only and do not reflect transaction costs incurred by the fund for buying and selling securities. Further, the expenses do not include the account service fee described in the prospectus. If such a fee were applied to your account, your costs would be higher. Your fund does not charge transaction fees, such as purchase or redemption fees, nor does it carry a “sales load.” The calculations assume no shares were bought or sold during the period. Your actual costs may have been higher or lower, depending on the amount of your investment and the timing of any purchases or redemptions.
You can find more information about the fund’s expenses, including annual expense ratios, in the Financial Statements section of this report. For additional information on operating expenses and other shareholder costs, please refer to your fund’s current prospectus.
31
| | | |
| Six Months Ended December 31, 2010 | | | |
| | Beginning | Ending | Expenses |
| | Account Value | Account Value | Paid During |
| 500 Index Fund | 6/30/2010 | 12/31/2010 | Period |
| Based on Actual Fund Return | | | |
| Investor Shares | $1,000.00 | $1,231.79 | $0.96 |
| Admiral Shares | 1,000.00 | 1,232.61 | 0.28 |
| Signal Shares | 1,000.00 | 1,232.64 | 0.28 |
| Based on Hypothetical 5% Yearly Return | | | |
| Investor Shares | $1,000.00 | $1,024.35 | $0.87 |
| Admiral Shares | 1,000.00 | 1,024.95 | 0.26 |
| Signal Shares | 1,000.00 | 1,024.95 | 0.26 |
The calculations are based on expenses incurred in the most recent six-month period. The fund’s annualized six-month expense ratios for that period are 0.17% for Investor Shares, 0.05% for Admiral Shares, and 0.05% for Signal Shares. The dollar amounts shown as “Expenses Paid” are equal to the annualized expense ratio multiplied by the average account value over the period, multiplied by the number of days in the most recent six-month period, then divided by the number of days in the most recent 12-month period. The table does not include data for share classes of funds with fewer than six months of history.
32
Glossary
30-Day SEC Yield. A fund’s 30-day SEC yield is derived using a formula specified by the U.S. Securities and Exchange Commission. Under the formula, data related to the fund’s security holdings in the previous 30 days are used to calculate the fund’s hypothetical net income for that period, which is then annualized and divided by the fund’s estimated average net assets over the calculation period. For the purposes of this calculation, a security’s income is based on its current market yield to maturity (in the case of bonds) or its projected dividend yield (for stocks). Because the SEC yield represents hypothetical annualized income, it will differ—at times significantly—from the fund’s actual experience. As a result, the fund’s income distributions may be higher or lower than implied by the SEC yield.
Beta. A measure of the magnitude of a fund’s past share-price fluctuations in relation to the ups and downs of a given market index. The index is assigned a beta of 1.00. Compared with a given index, a fund with a beta of 1.20 typically would have seen its share price rise or fall by 12% when the index rose or fell by 10%. For this report, beta is based on returns over the past 36 months for both the fund and the index. Note that a fund’s beta should be reviewed in conjunction with its R-squared (see definition). The lower the R-squared, the less correlation there is between the fund and the index, and the less reliable beta is as an indicator of volatility.
Dividend Yield. Dividend income earned by stocks, expressed as a percentage of the aggregate market value (or of net asset value, for a fund). The yield is determined by dividing the amount of the annual dividends by the aggregate value (or net asset value) at the end of the period. For a fund, the dividend yield is based solely on stock holdings and does not include any income produced by other investments.
Earnings Growth Rate. The average annual rate of growth in earnings over the past five years for the stocks now in a fund.
Equity Exposure. A measure that reflects a fund’s investments in stocks and stock futures. Any holdings in short-term reserves are excluded.
Expense Ratio. The percentage of a fund’s average net assets used to pay its annual administrative and advisory expenses. These expenses directly reduce returns to investors.
Foreign Holdings. The percentage of a fund represented by stocks or depositary receipts of companies based outside the United States.
Inception Date. The date on which the assets of a fund (or one of its share classes) are first invested in accordance with the fund’s investment objective. For funds with a subscription period, the inception date is the day after that period ends. Investment performance is measured from the inception date.
Median Market Cap. An indicator of the size of companies in which a fund invests; the midpoint of market capitalization (market price x shares outstanding) of a fund’s stocks, weighted by the proportion of the fund’s assets invested in each stock. Stocks representing half of the fund’s assets have market capitalizations above the median, and the rest are below it.
Price/Book Ratio. The share price of a stock divided by its net worth, or book value, per share. For a fund, the weighted average price/book ratio of the stocks it holds.
33
Price/Earnings Ratio. The ratio of a stock’s current price to its per-share earnings over the past year. For a fund, the weighted average P/E of the stocks it holds. P/E is an indicator of market expectations about corporate prospects; the higher the P/E, the greater the expectations for a company’s future growth.
R-Squared. A measure of how much of a fund’s past returns can be explained by the returns from the market in general, as measured by a given index. If a fund’s total returns were precisely synchronized with an index’s returns, its R-squared would be 1.00. If the fund’s returns bore no relationship to the index’s returns, its R-squared would be 0. For this report, R-squared is based on returns over the past 36 months for both the fund and the index.
Return on Equity. The annual average rate of return generated by a company during the past five years for each dollar of shareholder’s equity (net income divided by shareholder’s equity). For a fund, the weighted average return on equity for the companies whose stocks it holds.
Short-Term Reserves. The percentage of a fund invested in highly liquid, short-term securities that can be readily converted to cash.
Turnover Rate. An indication of the fund’s trading activity. Funds with high turnover rates incur higher transaction costs and may be more likely to distribute capital gains (which may be taxable to investors). The turnover rate excludes in-kind transactions, which have minimal impact on costs.
34
This page intentionally left blank.
The People Who Govern Your Fund
The trustees of your mutual fund are there to see that the fund is operated and managed in your best interests since, as a shareholder, you are a part owner of the fund. Your fund’s trustees also serve on the board of directors of The Vanguard Group, Inc., which is owned by the Vanguard funds and provides services to them on an at-cost basis.
A majority of Vanguard’s board members are independent, meaning that they have no affiliation with Vanguard or the funds they oversee, apart from the sizable personal investments they have made as private individuals. The independent board members have distinguished backgrounds in business, academia, and public service. Each of the trustees and executive officers oversees 179 Vanguard funds.
The following table provides information for each trustee and executive officer of the fund. More information about the trustees is in the Statement of Additional Information, which can be obtained, without charge, by contacting Vanguard at 800-662-7447, or online at vanguard.com.
| |
| Interested Trustee1 | Amy Gutmann |
| | Born 1949. Trustee Since June 2006. Principal |
| F. William McNabb III | Occupation(s) During the Past Five Years: President |
| Born 1957. Trustee Since July 2009. Chairman of the | of the University of Pennsylvania; Christopher H. |
| Board. Principal Occupation(s) During the Past Five | Browne Distinguished Professor of Political Science |
| Years: Chairman of the Board of The Vanguard Group, | in the School of Arts and Sciences with secondary |
| Inc., and of each of the investment companies served | appointments at the Annenberg School for Commu- |
| by The Vanguard Group, since January 2010; Director | nication and the Graduate School of Education |
| of The Vanguard Group since 2008; Chief Executive | of the University of Pennsylvania; Director of |
| Officer and President of The Vanguard Group and of | Carnegie Corporation of New York, Schuylkill River |
| each of the investment companies served by The | Development Corporation, and Greater Philadelphia |
| Vanguard Group since 2008; Director of Vanguard | Chamber of Commerce; Trustee of the National |
| Marketing Corporation; Managing Director of The | Constitution Center; Chair of the Presidential |
| Vanguard Group (1995–2008) . | Commission for the Study of Bioethical Issues. |
| |
| | JoAnn Heffernan Heisen |
| Independent Trustees | Born 1950. Trustee Since July 1998. Principal |
| | Occupation(s) During the Past Five Years: Corporate |
| Emerson U. Fullwood | Vice President and Chief Global Diversity Officer |
| Born 1948. Trustee Since January 2008. Principal | since 2006 (retired 2008) and Member of the |
| Occupation(s) During the Past Five Years: Executive | Executive Committee (retired 2008) of Johnson & |
| Chief Staff and Marketing Officer for North America | Johnson (pharmaceuticals/consumer products); Vice |
| and Corporate Vice President (retired 2008) of Xerox | President and Chief Information Officer of Johnson & |
| Corporation (document management products and | Johnson (1997–2005); Director of the University |
| services); Director of SPX Corporation (multi-industry | Medical Center at Princeton and Women’s Research |
| manufacturing), the United Way of Rochester, | and Education Institute; Member of the Advisory |
| Amerigroup Corporation (managed health care), | Board of the Maxwell School of Citizenship and Public |
| the University of Rochester Medical Center, and | Affairs at Syracuse University. |
| Monroe Community College Foundation. | |
| | F. Joseph Loughrey |
| Rajiv L. Gupta | Born 1949. Trustee Since October 2009. Principal |
| Born 1945. Trustee Since December 2001.2 | Occupation(s) During the Past Five Years: President |
| Principal Occupation(s) During the Past Five Years: | and Chief Operating Officer since 2005 (retired 2009) |
| Chairman and Chief Executive Officer (retired 2009) | and Vice Chairman of the Board (2008–2009) of |
| and President (2006–2008) of Rohm and Haas Co. | Cummins Inc. (industrial machinery); Director of |
| (chemicals); Director of Tyco International, Ltd. | SKF AB (industrial machinery), Hillenbrand, Inc. |
| (diversified manufacturing and services) and Hewlett- | (specialized consumer services), Sauer-Danfoss Inc. |
| Packard Co. (electronic computer manufacturing); | (machinery), the Lumina Foundation for Education, |
| Trustee of The Conference Board; Member of the | and Oxfam America; Chairman of the Advisory |
| Board of Managers of Delphi Automotive LLP | Council for the College of Arts and Letters at the |
| (automotive components) . | University of Notre Dame. |
| | |
| André F. Perold | Kathryn J. Hyatt | |
| Born 1952. Trustee Since December 2004. Principal | Born 1955. Treasurer Since November 2008. Principal |
| Occupation(s) During the Past Five Years: George | Occupation(s) During the Past Five Years: Principal |
| Gund Professor of Finance and Banking at the Harvard | of The Vanguard Group, Inc.; Treasurer of each of |
| Business School; Chair of the Investment Committee | the investment companies served by The Vanguard |
| of HighVista Strategies LLC (private investment firm) . | Group since 2008; Assistant Treasurer of each of the |
| | investment companies served by The Vanguard Group |
| Alfred M. Rankin, Jr. | (1988–2008) . | |
| Born 1941. Trustee Since January 1993. Principal | | |
| Occupation(s) During the Past Five Years: Chairman, | Heidi Stam | |
| President, and Chief Executive Officer of NACCO | Born 1956. Secretary Since July 2005. Principal |
| Industries, Inc. (forklift trucks/housewares/lignite); | Occupation(s) During the Past Five Years: Managing |
| Director of Goodrich Corporation (industrial products/ | Director of The Vanguard Group, Inc., since 2006; |
| aircraft systems and services); Chairman of the | General Counsel of The Vanguard Group since 2005; |
| Federal Reserve Bank of Cleveland; Trustee of The | Secretary of The Vanguard Group and of each of the |
| Cleveland Museum of Art. | investment companies served by The Vanguard Group |
| | since 2005; Director and Senior Vice President of |
| Peter F. Volanakis | Vanguard Marketing Corporation since 2005; |
| Born 1955. Trustee Since July 2009. Principal | Principal of The Vanguard Group (1997–2006). |
| Occupation(s) During the Past Five Years: President | | |
| since 2007 and Chief Operating Officer since 2005 | | |
| of Corning Incorporated (communications equipment); | Vanguard Senior Management Team |
| President of Corning Technologies (2001–2005); | | |
| Director of Corning Incorporated and Dow Corning; | R. Gregory Barton | Michael S. Miller |
| Trustee of the Corning Incorporated Foundation and | Mortimer J. Buckley | James M. Norris |
| the Corning Museum of Glass; Overseer of the | Kathleen C. Gubanich | Glenn W. Reed |
| Amos Tuck School of Business Administration at | Paul A. Heller | George U. Sauter |
| Dartmouth College. | | |
| |
| | Chairman Emeritus and Senior Advisor |
| Executive Officers | | |
| | John J. Brennan | |
| Glenn Booraem | Chairman, 1996–2009 | |
| Born 1967. Controller Since July 2010. Principal | Chief Executive Officer and President, 1996–2008 |
| Occupation(s) During the Past Five Years: Principal | | |
| of The Vanguard Group, Inc.; Controller of each of | | |
| the investment companies served by The Vanguard | Founder | |
| Group since 2010; Assistant Controller of each of | | |
| the investment companies served by The Vanguard | John C. Bogle | |
| Group (2001–2010) . | Chairman and Chief Executive Officer, 1974–1996 |
| |
| Thomas J. Higgins | | |
| Born 1957. Chief Financial Officer Since September | | |
| 2008. Principal Occupation(s) During the Past Five | | |
| Years: Principal of The Vanguard Group, Inc.; Chief | | |
| Financial Officer of each of the investment companies | | |
| served by The Vanguard Group since 2008; Treasurer | | |
| of each of the investment companies served by The | | |
| Vanguard Group (1998–2008) . | | |
1 Mr. McNabb is considered an “interested person,” as defined in the Investment Company Act of 1940, because he is an officer of the Vanguard funds.
2 December 2002 for Vanguard Equity Income Fund, Vanguard Growth Equity Fund, the Vanguard Municipal Bond Funds, and the Vanguard State Tax-Exempt Funds.
| |
|
|  |
| P.O. Box 2600 |
| Valley Forge, PA 19482-2600 |
Connect with Vanguard® > vanguard.com
| Standard & Poor’s®, S&P®, S&P 500®, Standard & |
| Fund Information > 800-662-7447 | Poor’s 500, and 500® are registered trademarks of |
| Direct Investor Account Services > 800-662-2739 | Standard & Poor’s Financial Services LLC (”S&P”) and |
| Institutional Investor Services > 800-523-1036 | have been licensed for use by The Vanguard Group, Inc. |
| Text Telephone for People | The Vanguard ETFs are not sponsored, endorsed, sold |
| With Hearing Impairment > 800-749-7273 | or promoted by S&P or its Affiliates, and S&P and its |
| | Affiliates make no representation, warranty, or |
| This material may be used in conjunction | condition regarding the advisability of buying, selling, |
| with the offering of shares of any Vanguard | or holding units/shares in the ETFs. |
| fund only if preceded or accompanied by | |
| the fund’s current prospectus. | |
| |
| All comparative mutual fund data are from Lipper Inc. or | |
| Morningstar, Inc., unless otherwise noted. | |
| |
| You can obtain a free copy of Vanguard’s proxy voting | |
| guidelines by visiting vanguard.com/proxyreporting or by | |
| calling Vanguard at 800-662-2739. The guidelines are | |
| also available from the SEC’s website, sec.gov. In | |
| addition, you may obtain a free report on how your fund | |
| voted the proxies for securities it owned during the 12 | |
| months ended June 30. To get the report, visit either | |
| vanguard.com/proxyreporting or sec.gov. | |
| |
| You can review and copy information about your fund at | |
| the SEC’s Public Reference Room in Washington, D.C. To | |
| find out more about this public service, call the SEC at | |
| 202-551-8090. Information about your fund is also | |
| available on the SEC’s website, and you can receive | |
| copies of this information, for a fee, by sending a | |
| request in either of two ways: via e-mail addressed to | |
| publicinfo@sec.gov or via regular mail addressed to the | |
| Public Reference Section, Securities and Exchange | |
| Commission, Washington, DC 20549-1520. | |
| |
| |
| | © 2011 The Vanguard Group, Inc. |
| | All rights reserved. |
| | Vanguard Marketing Corporation, Distributor. |
| |
| | Q400 022011 |
 |
| Vanguard U.S. Stock Index Funds |
| Small-Capitalization Portfolios |
| Annual Report |
|
| December 31, 2010 |
| |
 |
| |
| |
| Vanguard Small-Cap Index Fund |
| Vanguard Small-Cap Growth Index Fund |
| Vanguard Small-Cap Value Index Fund |
|
|
> For the year ended December 31, 2010, Vanguard’s three small-capitalization index funds posted strong gains of about 25% to 31%.
> Small-company growth stocks outperformed small-company value stocks.
> Information technology stocks led the advance across the small-cap segment, while financial firms were the standouts in the narrower small-cap value arena.
| |
| Contents | |
| Your Fund’s Total Returns. | 1 |
| Chairman’s Letter. | 4 |
| Small-Cap Index Fund. | 10 |
| Small-Cap Growth Index Fund. | 31 |
| Small-Cap Value Index Fund. | 47 |
| Your Fund’s After-Tax Returns. | 65 |
| About Your Fund’s Expenses. | 66 |
| Glossary. | 69 |

Small-Cap Index Fund
Small-Cap Growth Index Fund
Small-Cap Value Index Fund
Please note: The opinions expressed in this report are just that—informed opinions. They should not be considered promises or advice. Also, please keep in mind that the information and opinions cover the period through the date on the front of this report. Of course, the risks of investing in your fund are spelled out in the prospectus.
See the Glossary for definitions of investment terms used in this report.
Cover photograph: Jean Maher.
Your Fund’s Total Returns
| |
| Fiscal Year Ended December 31, 2010 | |
| | Total |
| | Returns |
| Vanguard Small-Cap Index Fund | |
| Investor Shares | 27.72% |
| Admiral™ Shares | 27.89 |
| Signal® Shares | 27.85 |
| Institutional Shares | 27.95 |
| Institutional Plus Shares (Inception: 12/17/2010) | 0.82 |
| ETF Shares | |
| Market Price | 28.10 |
| Net Asset Value | 27.89 |
| MSCI US Small Cap 1750 Index | 27.82 |
| Small-Cap Core Funds Average | 25.21 |
| Small-Cap Core Funds Average: Derived from data provided by Lipper Inc. | |
| Vanguard Small-Cap Growth Index Fund | |
| Investor Shares | 30.69% |
| Institutional Shares | 30.96 |
| ETF Shares | |
| Market Price | 31.11 |
| Net Asset Value | 30.87 |
| MSCI US Small Cap Growth Index | 30.71 |
| Small-Cap Growth Funds Average | 27.32 |
| Small-Cap Growth Funds Average: Derived from data provided by Lipper Inc. | |
Admiral Shares carry lower expenses and are available to investors who meet certain account-balance requirements. Signal, Institutional, and Institutional Plus Shares are available to certain institutional investors who meet specific administrative, service, and account-size criteria. The Vanguard ETF® Shares shown are traded on the NYSE Arca exchange and are available only through brokers. The table provides ETF returns based on both the NYSE Arca market price and the net asset value for a share. U.S. Pat. No. 6,879,964 B2; 7,337,138.
1
Your Fund’s Total Returns
| |
| Fiscal Year Ended December 31, 2010 | |
| | Total |
| | Returns |
| Vanguard Small-Cap Value Index Fund | |
| Investor Shares | 24.82% |
| Institutional Shares | 24.97 |
| ETF Shares | |
| Market Price | 25.13 |
| Net Asset Value | 24.97 |
| MSCI US Small Cap Value Index | 25.01 |
| Small-Cap Value Funds Average | 25.96 |
| Small-Cap Value Funds Average: Derived from data provided by Lipper Inc. | |
Admiral Shares carry lower expenses and are available to investors who meet certain account-balance requirements. Signal, Institutional, and Institutional Plus Shares are available to certain institutional investors who meet specific administrative, service, and account-size criteria. The Vanguard ETF® Shares shown are traded on the NYSE Arca exchange and are available only through brokers. The table provides ETF returns based on both the NYSE Arca market price and the net asset value for a share. U.S. Pat. No. 6,879,964 B2; 7,337,138.
For the ETF Shares, the market price is determined by the midpoint of the bid-offer spread as of the closing time of the New York Stock Exchange (generally 4 p.m., Eastern time). The net asset value is also determined as of the NYSE closing time. For more information about how the ETF Shares' market prices have compared with their net asset value, visit vanguard.com, select your ETF, and then select the Price and Performance tab. The ETF premium/discount analysis there shows the percentages of days on which the ETF Shares' market price was above or below the NAV.
2
Your Fund’s Performance at a Glance
| | | | |
| December 31, 2009 , Through December 31, 2010 | | | | |
| | | | Distributions Per Share |
| | Starting | Ending | Income | Capital |
| | Share Price | Share Price | Dividends | Gains |
| Vanguard Small-Cap Index Fund | | | | |
| Investor Shares | $27.49 | $34.75 | $0.361 | $0.000 |
| Admiral Shares | 27.50 | 34.78 | 0.390 | 0.000 |
| Signal Shares | 24.79 | 31.33 | 0.364 | 0.000 |
| Institutional Shares | 27.50 | 34.77 | 0.416 | 0.000 |
| Institutional Plus Shares (Inception: | 100.73 | 100.38 | 1.181 | 0.000 |
| 12/17/2010) | | | | |
| ETF Shares | 57.41 | 72.58 | 0.846 | 0.000 |
| Vanguard Small-Cap Growth Index Fund | | | | |
| Investor Shares | $16.83 | $21.92 | $0.076 | $0.000 |
| Institutional Shares | 16.85 | 21.96 | 0.108 | 0.000 |
| ETF Shares | 59.86 | 77.98 | 0.361 | 0.000 |
| Vanguard Small-Cap Value Index Fund | | | | |
| Investor Shares | $13.06 | $16.01 | $0.291 | $0.000 |
| Institutional Shares | 13.09 | 16.04 | 0.318 | 0.000 |
| ETF Shares | 54.49 | 66.80 | 1.299 | 0.000 |
3

Chairman’s Letter
Dear Shareholder,
Small-capitalization stocks turned in a strong showing for the second consecutive year. The three Vanguard small-cap index funds again closely tracked their respective target indexes; each logged total returns of about 25% or higher for 2010.
Of the three funds, Vanguard Small-Cap Growth Index Fund was the best performer, returning about 31%; Vanguard Small-Cap Value Index Fund, the worst performer, returned “only” about 25% for the year. The broader-based Vanguard Small-Cap Index Fund, which covers both the growth and value segments of the small-cap market, fell in between, with a return of about 28%.
Although outperforming funds that invest in similar stocks is not the objective of these three funds, the Small-Cap and Small-Cap Growth Index Funds did outperform their peer-group averages in 2010. The Small-Cap Value Index Fund trailed its comparable industry average by about one percentage point.
Please note that on October 6, Vanguard broadened the availability of our lower-cost Admiral Shares. We reduced the Admiral minimums on most of our broad-market index funds, including Small-Cap Index Fund, to $10,000 from $100,000, as part of our ongoing efforts to lower the cost of investing for our clients. (Admiral minimums were also lowered for many of our actively managed funds.)
4
Also, in December we launched Institutional Plus Shares for the Small-Cap Index Fund. These shares require a minimum initial investment of $100 million.
Stocks rallied as the forecast
seemed to brighten
After a series of false starts, hesitations,
and retreats, global stock markets finished 2010 with powerful gains. As the prospect of a double-dip recession faded, the broad U.S. stock market clambered higher, shrugging off high unemployment and distress in Europe’s debt markets to return 17.70%. Small- and mid-capitalization stocks did even better.
Outside the United States, gains were more muted, in part because Europe’s sovereign debt challenges continued to reverberate through local stock markets. Emerging markets were the best performers. Asia’s developed markets performed poorly, though the strength of the yen, the Australian dollar, and other regional currencies bolstered returns for U.S.-based investors.
The fixed income market
reprised a familiar theme
Although U.S. Treasury securities rallied
through the summer, total return tables were dominated by riskier bonds for the full 12 months, a pattern we also saw in 2009. Low interest rates and a sense that the economic recovery was gathering
| | | |
| Market Barometer | | | |
| |
| | | Average Annual Total Returns |
| | | Periods Ended December 31, 2010 |
| | One | Three | Five |
| | Year | Years | Years |
| Stocks | | | |
| Russell 1000 Index (Large-caps) | 16.10% | -2.37% | 2.59% |
| Russell 2000 Index (Small-caps) | 26.86 | 2.22 | 4.47 |
| Dow Jones U.S. Total Stock Market Index | 17.70 | -1.56 | 3.17 |
| MSCI All Country World Index ex USA (International) | 11.60 | -4.58 | 5.29 |
| |
| Bonds | | | |
| Barclays Capital U.S. Aggregate Bond Index (Broad | | | |
| taxable market) | 6.54% | 5.90% | 5.80% |
| Barclays Capital Municipal Bond Index (Broad | | | |
| tax-exempt market) | 2.38 | 4.08 | 4.09 |
| Citigroup Three-Month U.S. Treasury Bill Index | 0.13 | 0.69 | 2.29 |
| |
| CPI | | | |
| Consumer Price Index | 1.50% | 1.43% | 2.18% |
5
momentum prompted investors to seek higher yields in both high-quality and below-investment-grade corporate bonds. The broad U.S. bond market returned 6.54%. Late in the year, yields bounced off summer lows, putting pressure on bond prices. The dynamic was especially pronounced among municipal bonds.
As it has since December 2008, the Federal Reserve held its target for short-term interest rates near 0%, keeping the returns available from money market instruments such as the 3-month Treasury bill in the same neighborhood.
IT stocks again led small-caps to strong gains
As the economic recovery gained some modest momentum, smaller-company stocks continued to outperform larger companies in 2010, just as they did in 2009. And once again, every sector across the small-cap arena registered gains.
Small-cap information technology companies represented the largest contributor to Small-Cap Index Fund’s advance as consumers and businesses stepped up computer-related purchases and investors remained optimistic about continued growth in the sector. IT stocks also did the best of any sector in Small-Cap Growth Index Fund. Software firms, which comprise one of the largest IT subsectors, were the best performers.
| | | | | | | |
| Expense Ratios | | | | | | | |
| Your Fund Compared With Its Peer Group | | | | | | |
| | | | | | | | Peer |
| | Investor | Admiral | Signal | Institutional | Institutional | ETF | Group |
| | Shares | Shares | Shares | Shares | Plus Shares | Shares | Average |
| Small-Cap Index Fund | 0.28% | 0.14% | 0.14% | 0.08% | 0.06% | 0.14% | 1.50% |
| Small-Cap Growth Index Fund | 0.28 | — | — | 0.08 | — | 0.14 | 1.64 |
| Small-Cap Value Index Fund | 0.28 | — | — | 0.08 | — | 0.14 | 1.53 |
The fund expense ratios shown are from the prospectus dated December 13, 2010, for the Institutional and Institutional Plus share classes and April 29, 2010, for the Investor, Admiral, Signal, and ETF share classes, and represent estimated costs for the current fiscal year. For the fiscal year ended December 31, 2010, the funds’ expense ratios were: for the Small-Cap Index Fund, 0.26% for Investor Shares, 0.12% for Admiral Shares, 0.12% for Signal Shares, 0.08% for Institutional Shares, and 0.12% for ETF Shares; for the Small-Cap Growth Index Fund, 0.26% for Investor Shares, 0.08% for Institutional Shares, and 0.12% for ETF Shares; and for the Small-Cap Value Index Fund, 0.26% for Investor Shares, 0.08% for Institutional Shares, and 0.12% for ETF Shares. For the fiscal period ended December 31, 2010, the annualized expense ratio for the Small-Cap Index Fund Institutional Plus Shares was 0.06%. The peer-group ex pense ratios are derived from data provided by Lipper Inc. and capture information through year-end 2009.
Peer groups: For the Small-Cap Index Fund, Small-Cap Core Funds; for the Small-Cap Growth Index Fund, Small-Cap Growth Funds; for the Small-Cap Value Index Fund, Small-Cap Value Funds.
6
Unsurprisingly, given that the economy is recovering from a recession, traditionally cyclical sectors such as industrials did well, with manufacturing, transportation, and shipping companies advancing. Another cyclical bellwether, the consumer discretionary sector, also advanced sharply as consumers felt more confident in opening their wallets.
Financial firms, the largest small-cap sector, posted healthy gains, although they were not as robust as those made in the aforementioned industries. Real estate investment trusts, insurance companies, banks, and the like continued to make progress in repairing their balance sheets.
| |
| Total Returns | |
| Ten Years Ended December 31, 2010 | |
| | Average |
| | Annual Return |
| Small-Cap Index Fund Investor Shares | 7.23% |
| Spliced Small-Cap Index | 7.12 |
| Small-Cap Core Funds Average | 6.44 |
| Spliced Small-Cap Index: Russell 2000 Index through May 16, 2003; MSCI US Small Cap 1750 Index thereafter. | |
| Small-Cap Core Funds Average: Derived from data provided by Lipper Inc. | |
| |
| Small-Cap Growth Index Fund Investor Shares | 7.52% |
| Spliced Small-Cap Growth Index | 7.42 |
| Small-Cap Growth Funds Average | 2.34 |
| Spliced Small-Cap Growth Index: S&P SmallCap 600/Barra Growth Index through May 16, 2003; MSCI US Small Cap Growth Index thereafter. |
| Small-Cap Growth Funds Average: Derived from data provided by Lipper Inc. | |
| |
| Small-Cap Value Index Fund Investor Shares | 7.95% |
| Spliced Small-Cap Value Index | 7.80 |
| Small-Cap Value Funds Average | 8.48 |
| Spliced Small-Cap Value Index: S&P SmallCap 600/Barra Value Index through May 16, 2003; MSCI US Small Cap Value Index thereafter. |
| Small-Cap Value Funds Average: Derived from data provided by Lipper Inc. | |
The figures shown represent past performance, which is not a guarantee of future results. (Current performance may be lower or higher than the performance data cited. For performance data current to the most recent month-end, visit our website at vanguard.com/performance.) Note, too, that both investment returns and principal value can fluctuate widely, so an investor’s shares, when sold, could be worth more or less than their original cost.
7
Energy, a relatively small sector in the small-cap arena, showed the sharpest rise. Increasing demand and prices powered energy-related stocks to gains that, in all three funds, exceeded 35%.
A look at a decade of returns provides an important perspective
While the investment community tends to focus on short-term performance, we’ve always believed the long-term view is far more important. Looking at returns over longer periods can filter out short-term market trends, giving a truer picture of a fund’s performance.
For the decade ended December 31, 2010, each of the funds captured the performance of its respective benchmark, producing a solid single-digit return.
The funds’ longer-term track records are a credit to the funds’ advisor, Vanguard Quantitative Equity Group, and its team of experienced professionals. The group relies on its time-tested portfolio management strategies to help keep the funds closely aligned with their benchmarks in both up and down markets. As a result, the three funds have successfully tracked the returns from the small-cap market, whether those returns are for the entire small-cap segment or for a subset of it.
When measured against industry averages for small-cap funds, two of the three funds have outperformed for the ten years.
Small-Cap Value Index Fund’s 10-year figure trails that of the industry by about half a percentage point.
It’s worth noting that for the ten-year period all three funds far outperformed the broad U.S. stock market (as measured by the Dow Jones U.S. Total Stock Market Index), which posted average annual returns of less than 3%. Compared with mid- and large-cap stocks, small-cap stocks have been relatively stellar performers over the past 10 years. Given the fact that larger-company stocks have often outperformed small-caps during different periods, small-cap investors would be wise not to count on a repeat performance over the next decade. No one knows whether it will be large-cap stocks’ turn to take the lead in the years ahead, but we encourage our clients to maintain reasonable expectations, especially after a particular investment category has outperformed.
Our small-cap funds can serve as a useful building block
Although the past year did not experience the severe swings of 2008 or 2009, periods of instability still buffeted investors as the global marketplace continued to reverberate with aftershocks from the financial crisis. During times of volatility, it helps to remember that adopting a long-term perspective and maintaining a diversified portfolio can help make month-to-month price swings seem less threatening.
8
In practice, this means building a cost-efficient portfolio that includes a steady mix of stocks, bonds, and short-term reserves, one that can provide some protection against market losses while allowing you to participate in the long-term potential for accumulating returns in each asset class. So while our small-cap index funds offer a convenient way to seek to capture the returns across this sometimes-volatile market segment, we consider the funds best suited to be part of a broad-based, diversified investment program.
Thank you for investing with Vanguard.
Sincerely,

F. William McNabb III
Chairman and Chief Executive Officer
January 12, 2011
9
Small-Cap Index Fund
Fund Profile
As of December 31, 2010
| | | | | | |
| Share-Class Characteristics | | | | | | |
| | Investor | Admiral | Signal | Institutional | Institutional | ETF |
| | Shares | Shares | Shares | Shares | Plus Shares | Shares |
| Ticker Symbol | NAESX | VSMAX | VSISX | VSCIX | VSCPX | VB |
| Expense Ratio1 | 0.28% | 0.14% | 0.14% | 0.08% | 0.06% | 0.14% |
| 30-Day SEC Yield | 0.98% | 1.12% | 1.12% | 1.16% | — | 1.12% |
| | | |
| Portfolio Characteristics | | |
| | | | DJ |
| | | MSCI US | U.S. Total |
| | | Small Cap | Market |
| | Fund | 1750 Index | Index |
| Number of Stocks | 1,737 | 1,733 | 3,893 |
| Median Market Cap | $1.6B | $1.6B | $29.6B |
| Price/Earnings Ratio | 26.6x | 26.8x | 18.3x |
| Price/Book Ratio | 2.0x | 2.0x | 2.2x |
| Return on Equity | 10.3% | 10.3% | 18.8% |
| Earnings Growth Rate | 3.8% | 4.0% | 6.2% |
| Dividend Yield | 1.1% | 1.1% | 1.7% |
| Foreign Holdings | 0.0% | 0.0% | 0.0% |
| Turnover Rate | 12% | — | — |
| Short-Term Reserves | 0.2% | — | — |
| | |
| Volatility Measures | | |
| | | DJ |
| | MSCI US | U.S. Total |
| | Small Cap | Market |
| | 1750 Index | Index |
| R-Squared | 1.00 | 0.95 |
| Beta | 1.00 | 1.23 |
These measures show the degree and timing of the fund’s fluctuations compared with the indexes over 36 months.
| | |
| Ten Largest Holdings (% of total net assets) |
| Riverbed Technology | Communications | |
| Inc. | Equipment | 0.3% |
| Gentex Corp. | Auto Parts & | |
| | Equipment | 0.3 |
| Informatica Corp. | Application | |
| | Software | 0.3 |
| WABCO Holdings Inc. | Construction & | |
| | Farm Machinery & | |
| | Heavy Trucks | 0.2 |
| Signet Jewelers Ltd. | Specialty Stores | 0.2 |
| SM Energy Co. | Oil & Gas | |
| | Exploration & | |
| | Production | 0.2 |
| Del Monte Foods Co. | Packaged Foods & | |
| | Meats | 0.2 |
| Camden Property Trust | Residential REITs | 0.2 |
| Gardner Denver Inc. | Industrial | |
| | Machinery | 0.2 |
| BE Aerospace Inc. | Aerospace & | |
| | Defense | 0.2 |
| Top Ten | | 2.3% |
The holdings listed exclude any temporary cash investments and equity index products.
1 The expense ratios shown are from the prospectus dated December 13, 2010, for the Institutional and Institutional Plus Shares and April 29, 2010, for the Investor, Admiral, Signal, and ETF Shares, and represent estimated costs for the current fiscal year. For the fiscal year ended December 31, 2010, the expense ratios were 0.26% for Investor Shares, 0.12% for Admiral Shares, 0.12% for Signal Shares, 0.08% for Institutional Shares, and 0.12% for ETF Shares. For the fiscal period ended December 31, 2010, the annualized expense ratio for the Small-Cap Index Fund Institutional Plus Shares was 0.06%.
10
Small-Cap Index Fund
| | | |
| Sector Diversification (% of equity exposure) |
| | | | DJ |
| | | MSCI US | U.S. Total |
| | | Small Cap | Market |
| | Fund 1750 Index | Index |
| Consumer | | | |
| Discretionary | 14.2% | 14.2% | 11.9% |
| Consumer Staples | 2.7 | 2.7 | 9.5 |
| Energy | 6.2 | 6.2 | 10.6 |
| Financials | 20.2 | 20.1 | 16.6 |
| Health Care | 10.9 | 11.0 | 10.7 |
| Industrials | 16.3 | 16.3 | 11.4 |
| Information | | | |
| Technology | 18.6 | 18.6 | 18.9 |
| Materials | 6.3 | 6.3 | 4.5 |
| Telecommunication | | | |
| Services | 1.0 | 1.0 | 2.7 |
| Utilities | 3.6 | 3.6 | 3.2 |
Investment Focus
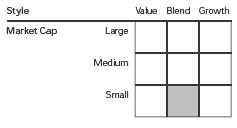
11
Small-Cap Index Fund
Performance Summary
All of the returns in this report represent past performance, which is not a guarantee of future results that may be achieved by the fund. (Current performance may be lower or higher than the performance data cited. For performance data current to the most recent month-end, visit our website at vanguard.com/performance.) Note, too, that both investment returns and principal value can fluctuate widely, so an investor’s shares, when sold, could be worth more or less than their original cost. The returns shown do not reflect taxes that a shareholder would pay on fund distributions or on the sale of fund shares.
Cumulative Performance: December 31, 2000, Through December 31, 2010
Initial Investment of $10,000
| | | | | |
| | | Average Annual Total Returns | |
| | | Periods Ended December 31, 2010 | |
| | | | | | Final Value |
| | | One | Five | Ten | of a $10,000 |
| | | Year | Years | Years | Investment |
| | Small-Cap Index Fund Investor Shares | 27.72% | 5.39% | 7.23% | $20,096 |
| •••••••• | Dow Jones U.S. Total Stock Market | | | | |
| | Index | 17.70 | 3.17 | 2.64 | 12,981 |
| – – – – | Spliced Small-Cap Index | 27.82 | 5.40 | 7.12 | 19,893 |
| | Small-Cap Core Funds Average | 25.21 | 3.42 | 6.44 | 18,661 |
| Spliced Small-Cap Index: Russell 2000 Index through May 16, 2003; MSCI US Small Cap 1750 Index thereafter. | |
| Small-Cap Core Funds Average: Derived from data provided by Lipper Inc. | | | |
| | | | |
| | | | | Final Value |
| | One | Five | Ten | of a $10,000 |
| | Year | Years | Years | Investment |
| Small-Cap Index Fund Admiral | | | | |
| Shares | 27.89% | 5.51% | 7.34% | $20,310 |
| Dow Jones U.S. Total Stock Market | | | | |
| Index | 17.70 | 3.17 | 2.64 | 12,981 |
| Spliced Small-Cap Index | 27.82 | 5.40 | 7.12 | 19,893 |
See Financial Highlights for dividend and capital gains information.
12
Small-Cap Index Fund
| | | |
| | Average Annual Total Returns | |
| | Periods Ended December 31, 2010 | |
| | | Since | Final Value |
| | One | Inception | of a $10,000 |
| | Year | (12/15/2006) | Investment |
| Small-Cap Index Fund Signal Shares | 27.85% | 2.85% | $11,203 |
| Dow Jones U.S. Total Stock Market | | | |
| Index | 17.70 | 0.06 | 10,024 |
| MSCI US Small Cap 1750 Index | 27.82 | 2.72 | 11,146 |
| "Since Inception" performance is calculated from the Signal Shares’ inception date for both the fund and its comparative standards. |
| | | | |
| | | | | Final Value |
| | One | Five | Ten | of a $5,000,000 |
| | Year | Years | Years | Investment |
| Small-Cap Index Fund Institutional Shares | 27.95% | 5.56% | 7.41% | $10,215,022 |
| Dow Jones U.S. Total Stock Market | | | | |
| Index | 17.70 | 3.17 | 2.64 | 6,490,386 |
| Spliced Small-Cap Index | 27.82 | 5.40 | 7.12 | 9,946,586 |
| | |
| | Since | Final Value |
| | Inception | of a $100,000,000 |
| | (12/17/2010) | Investment |
| Small-Cap Index Fund Institutional | | |
| Plus Shares | 0.82% | $100,820,324 |
| Dow Jones U.S. Total Stock Market | | |
| Index | 1.18 | 101,176,262 |
| MSCI US Small Cap 1750 Index | 0.82 | 100,819,415 |
| "Since Inception" performance is calculated from the Institutional Plus Shares’ inception date for both the fund and its comparative standards. |
| | | | |
| | | | Since | Final Value |
| | One | Five | Inception | of a $10,000 |
| | Year | Years | (1/26/2004) | Investment |
| Small-Cap Index Fund | | | | |
| ETF Shares Net Asset Value | 27.89% | 5.52% | 6.77% | $15,745 |
| Dow Jones U.S. Total Stock Market Index | 17.70 | 3.17 | 4.30 | 13,390 |
| MSCI US Small Cap 1750 Index | 27.82 | 5.40 | 6.68 | 15,653 |
| "Since Inception" performance is calculated from the ETF Shares’ inception date for both the fund and its comparative standards. |
13
Small-Cap Index Fund
| | | |
| Cumulative Returns of ETF Shares: January 26, 2004, Through December 31, 2010 | |
| | | | Since |
| | One | Five | Inception |
| | Year | Years | (1/26/2004) |
| Small-Cap Index Fund | | | |
| ETF Shares Market Price | 28.10% | 31.23% | 57.57% |
| Small-Cap Index Fund | | | |
| ETF Shares Net Asset Value | 27.89 | 30.85 | 57.45 |
| MSCI US Small Cap 1750 Index | 27.82 | 30.08 | 56.53 |
| "Since Inception" performance is calculated from the ETF Shares’ inception date for both the fund and its comparative standard. | |
Fiscal-Year Total Returns (%): December 31, 2000, Through December 31, 2010
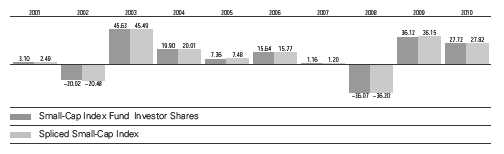
14
Small-Cap Index Fund
Financial Statements
Statement of Net Assets—Investments Summary
As of December 31, 2010
This Statement summarizes the fund’s holdings by asset type. Details are reported for each of the fund’s 50 largest individual holdings and for investments that, in total for any issuer, represent more than 1% of the fund’s net assets. The total value of smaller holdings is reported as a single amount within each category.
The fund reports a complete list of its holdings in regulatory filings four times in each fiscal year, at the quarter-ends. For the second and fourth fiscal quarters, the complete listing of the fund’s holdings is available electronically on vanguard.com and on the Securities and Exchange Commission’s website (sec.gov), or you can have it mailed to you without charge by calling 800-662-7447. For the first and third fiscal quarters, the fund files the lists with the SEC on Form N-Q. Shareholders can look up the fund’s Forms N-Q on the SEC’s website. Forms N-Q may also be reviewed and copied at the SEC’s Public Reference Room (see the back cover of this report for further information).
| | | |
| | | Market | Percentage |
| | | Value | of Net |
| | Shares | ($000) | Assets |
| Common Stocks | | | |
| Consumer Discretionary | | | |
| Gentex Corp. | 2,084,852 | 61,628 | 0.3% |
| * Signet Jewelers Ltd. | 1,276,324 | 55,392 | 0.2% |
| Tractor Supply Co. | 1,082,354 | 52,483 | 0.2% |
| Williams-Sonoma Inc. | 1,450,339 | 51,763 | 0.2% |
| * Lululemon Athletica Inc. | 686,272 | 46,955 | 0.2% |
| * Deckers Outdoor Corp. | 575,925 | 45,924 | 0.2% |
| Sotheby’s | 997,873 | 44,904 | 0.2% |
| * Panera Bread Co. Class A | 442,779 | 44,814 | 0.2% |
| Consumer Discretionary—Other † | | 3,008,500 | 12.5% |
| | | 3,412,363 | 14.2% |
| Consumer Staples | | | |
| Del Monte Foods Co. | 2,898,982 | 54,501 | 0.2% |
| Corn Products International Inc. | 1,121,113 | 51,571 | 0.2% |
| Consumer Staples—Other † | | 549,681 | 2.3% |
| | | 655,753 | 2.7% |
| Energy | | | |
| SM Energy Co. | 939,777 | 55,381 | 0.2% |
| * Atlas Energy Inc. | 1,167,396 | 51,330 | 0.2% |
| * Oil States International Inc. | 748,886 | 47,996 | 0.2% |
| * Brigham Exploration Co. | 1,736,477 | 47,302 | 0.2% |
| Energy—Other † | | 1,272,433 | 5.3% |
| | | 1,474,442 | 6.1% |
| Financials | | | |
| Camden Property Trust | 997,373 | 53,838 | 0.2% |
| * E*Trade Financial Corp. | 3,288,077 | 52,609 | 0.2% |
| Essex Property Trust Inc. | 451,670 | 51,590 | 0.2% |
| Ares Capital Corp. | 3,016,241 | 49,708 | 0.2% |
| * Popular Inc. | 15,230,904 | 47,825 | 0.2% |
| Senior Housing Properties Trust | 2,085,056 | 45,746 | 0.2% |
15
Small-Cap Index Fund
| | | |
| | | Market | Percentage |
| | | Value | of Net |
| | Shares | ($000) | Assets |
| Arthur J Gallagher & Co. | 1,567,490 | 45,583 | 0.2% |
| Apartment Investment & Management Co. | 1,743,864 | 45,061 | 0.2% |
| Waddell & Reed Financial Inc. Class A | 1,272,215 | 44,896 | 0.2% |
| Financials—Other † | | 4,389,751 | 18.3% |
| | | 4,826,607 | 20.1% |
| Health Care | | | |
| * Allscripts Healthcare Solutions Inc. | 2,648,261 | 51,032 | 0.2% |
| * United Therapeutics Corp. | 798,665 | 50,492 | 0.2% |
| * Tenet Healthcare Corp. | 7,229,199 | 48,363 | 0.2% |
| * Mednax Inc. | 709,422 | 47,737 | 0.2% |
| PerkinElmer Inc. | 1,756,870 | 45,362 | 0.2% |
| Health Care—Other † | | 2,383,912 | 9.9% |
| | | 2,626,898 | 10.9% |
| Industrials | | | |
| * WABCO Holdings Inc. | 959,295 | 58,450 | 0.3% |
| Gardner Denver Inc. | 779,311 | 53,632 | 0.2% |
| * BE Aerospace Inc. | 1,447,865 | 53,614 | 0.2% |
| * TransDigm Group Inc. | 698,054 | 50,267 | 0.2% |
| Snap-On Inc. | 865,556 | 48,973 | 0.2% |
| Kennametal Inc. | 1,220,061 | 48,144 | 0.2% |
| * Oshkosh Corp. | 1,347,957 | 47,502 | 0.2% |
| IDEX Corp. | 1,213,657 | 47,478 | 0.2% |
| Hubbell Inc. Class B | 785,925 | 47,258 | 0.2% |
| Waste Connections Inc. | 1,641,132 | 45,180 | 0.2% |
| Industrials—Other † | | 3,408,602 | 14.2% |
| | | 3,909,100 | 16.3% |
| Information Technology | | | |
| * Riverbed Technology Inc. | 1,836,127 | 64,577 | 0.3% |
| * Informatica Corp. | 1,378,085 | 60,677 | 0.3% |
| Solera Holdings Inc. | 1,043,148 | 53,534 | 0.2% |
| * MICROS Systems Inc. | 1,193,509 | 52,347 | 0.2% |
| * Polycom Inc. | 1,269,583 | 49,488 | 0.2% |
| * VeriFone Systems Inc. | 1,272,954 | 49,085 | 0.2% |
| * TIBCO Software Inc. | 2,442,201 | 48,136 | 0.2% |
| * JDS Uniphase Corp. | 3,300,928 | 47,797 | 0.2% |
| Information Technology—Other † | | 4,040,533 | 16.8% |
| | | 4,466,174 | 18.6% |
| Materials | | | |
| Domtar Corp. | 638,104 | 48,445 | 0.2% |
| Aptargroup Inc. | 1,004,430 | 47,781 | 0.2% |
| Materials—Other † | | 1,412,481 | 5.9% |
| | | 1,508,707 | 6.3% |
| |
| Telecommunication Services † | | 231,641 | 1.0% |
| |
| Utilities | | | |
| ITC Holdings Corp. | 749,338 | 46,444 | 0.2% |
| Questar Corp. | 2,613,933 | 45,508 | 0.2% |
| Utilities—Other † | | 764,497 | 3.2% |
| | | 856,449 | 3.6% |
| Total Common Stocks (Cost $19,647,521) | | 23,968,134 | 99.8%1 |
16
Small-Cap Index Fund
| | | | |
| | | | Market | Percentage |
| | | | Value | of Net |
| | Coupon | Shares | ($000) | Assets |
| Temporary Cash Investments | | | | |
| Money Market Fund | | | | |
| 2,3 Vanguard Market Liquidity Fund | 0.211% | 477,032,000 | 477,032 | 2.0% |
| |
| 4U.S. Government and Agency Obligations † | | | 9,597 | 0.0% |
| Total Temporary Cash Investments (Cost $486,629) | | | 486,629 | 2.0%1 |
| 5Total Investments (Cost $20,134,150) | | | 24,454,763 | 101.8% |
| Other Assets and Liabilities | | | | |
| Other Assets | | | 188,837 | 0.8% |
| Liabilities3 | | | (624,897) | (2.6%) |
| | | | (436,060) | (1.8%) |
| Net Assets | | | 24,018,703 | 100.0% |
| |
| At December 31, 2010, net assets consisted of: | |
| | Amount |
| | ($000) |
| Paid-in Capital | 22,384,623 |
| Overdistributed Net Investment Income | (29,196) |
| Accumulated Net Realized Losses | (2,656,893) |
| Unrealized Appreciation (Depreciation) | |
| Investment Securities | 4,320,613 |
| Futures Contracts | (444) |
| Net Assets | 24,018,703 |
| |
| Investor Shares—Net Assets | |
| Applicable to 151,652,371 outstanding $.001 par value shares of | |
| beneficial interest (unlimited authorization) | 5,269,621 |
| Net Asset Value Per Share—Investor Shares | $34.75 |
| |
| Admiral Shares—Net Assets | |
| Applicable to 159,690,134 outstanding $.001 par value shares of | |
| beneficial interest (unlimited authorization) | 5,553,519 |
| Net Asset Value Per Share—Admiral Shares | $34.78 |
| |
| Signal Shares—Net Assets | |
| Applicable to 73,389,395 outstanding $.001 par value shares of | |
| beneficial interest (unlimited authorization) | 2,299,623 |
| Net Asset Value Per Share—Signal Shares | $31.33 |
17
Small-Cap Index Fund
| |
| | Amount |
| | ($000) |
| Institutional Shares—Net Assets | |
| Applicable to 164,253,154 outstanding $.001 par value shares of | |
| beneficial interest (unlimited authorization) | 5,711,443 |
| Net Asset Value Per Share—Institutional Shares | $34.77 |
| |
| Institutional Plus Shares—Net Assets | |
| Applicable to 3,400,816 outstanding $.001 par value shares of | |
| beneficial interest (unlimited authorization) | 341,360 |
| Net Asset Value Per Share—Institutional Plus Shares | $100.38 |
| |
| ETF Shares—Net Assets | |
| Applicable to 66,731,974 outstanding $.001 par value shares of | |
| beneficial interest (unlimited authorization) | 4,843,137 |
| Net Asset Value Per Share—ETF Shares | $72.58 |
See Note A in Notes to Financial Statements.
* Non-income-producing security.
† Represents the aggregate value, by category, of securities that are not among the 50 largest holdings and, in total for any issuer, represent 1% or less of net assets.
1 The fund invests a portion of its cash reserves in equity markets through the use of index futures contracts. After giving effect to futures investments, the fund’s effective common stock and temporary cash investment positions represent 100.0% and 1.8%, respectively, of net assets.
2 Affiliated money market fund available only to Vanguard funds and certain trusts and accounts managed by Vanguard. Rate shown is the 7-day yield.
3 Includes $385,068,000 of collateral received for securities on loan.
4 Securities with a value of $9,098,000 have been segregated as initial margin for open futures contracts.
5 The total value of securities on loan is $359,723,000.
See accompanying Notes, which are an integral part of the Financial Statements.
18
Small-Cap Index Fund
| |
| Statement of Operations | |
| |
| |
| | Year Ended |
| | December 31, 2010 |
| | ($000) |
| Investment Income | |
| Income | |
| Dividends | 269,046 |
| Interest1 | 229 |
| Security Lending | 23,913 |
| Total Income | 293,188 |
| Expenses | |
| The Vanguard Group—Note B | |
| Investment Advisory Services | 1,002 |
| Management and Administrative—Investor Shares | 13,917 |
| Management and Administrative—Admiral Shares | 2,479 |
| Management and Administrative—Signal Shares | 1,587 |
| Management and Administrative—Institutional Shares | 1,948 |
| Management and Administrative—Institutional Plus Shares | 7 |
| Management and Administrative—ETF Shares | 2,904 |
| Marketing and Distribution—Investor Shares | 1,723 |
| Marketing and Distribution—Admiral Shares | 405 |
| Marketing and Distribution—Signal Shares | 546 |
| Marketing and Distribution—Institutional Shares | 1,310 |
| Marketing and Distribution—Institutional Plus Shares | — |
| Marketing and Distribution—ETF Shares | 1,023 |
| Custodian Fees | 821 |
| Auditing Fees | 33 |
| Shareholders’ Reports—Investor Shares | 206 |
| Shareholders’ Reports—Admiral Shares | 17 |
| Shareholders’ Reports—Signal Shares | 25 |
| Shareholders’ Reports—Institutional Shares | 119 |
| Shareholders’ Reports—Institutional Plus Shares | — |
| Shareholders’ Reports—ETF Shares | 225 |
| Trustees’ Fees and Expenses | 30 |
| Total Expenses | 30,327 |
| Net Investment Income | 262,861 |
| Realized Net Gain (Loss) | |
| Investment Securities Sold | 933,213 |
| Futures Contracts | 9,286 |
| Realized Net Gain (Loss) | 942,499 |
| Change in Unrealized Appreciation (Depreciation) | |
| Investment Securities | 3,700,124 |
| Futures Contracts | (558) |
| Change in Unrealized Appreciation (Depreciation) | 3,699,566 |
| Net Increase (Decrease) in Net Assets Resulting from Operations | 4,904,926 |
| 1 Interest income from an affiliated company of the fund was $209,000. | |
| See accompanying Notes, which are an integral part of the Financial Statements. | |
19
Small-Cap Index Fund
| | |
| Statement of Changes in Net Assets | | |
| |
| | Year Ended December 31, |
| | 2010 | 2009 |
| | ($000) | ($000) |
| Increase (Decrease) in Net Assets | | |
| Operations | | |
| Net Investment Income | 262,861 | 178,324 |
| Realized Net Gain (Loss) | 942,499 | (433,963) |
| Change in Unrealized Appreciation (Depreciation) | 3,699,566 | 4,479,579 |
| Net Increase (Decrease) in Net Assets Resulting from Operations | 4,904,926 | 4,223,940 |
| Distributions | | |
| Net Investment Income | | |
| Investor Shares | (54,888) | (58,993) |
| Admiral Shares | (60,927) | (22,117) |
| Signal Shares | (26,640) | (19,496) |
| Institutional Shares | (66,672) | (48,371) |
| Institutional Plus Shares | (3,937) | — |
| ETF Shares | (56,141) | (36,024) |
| Realized Capital Gain | | |
| Investor Shares | — | — |
| Admiral Shares | — | — |
| Signal Shares | — | — |
| Institutional Shares | — | — |
| Institutional Plus Shares | — | — |
| ETF Shares | — | — |
| Total Distributions | (269,205) | (185,001) |
| Capital Share Transactions | | |
| Investor Shares | (2,074,399) | 372,313 |
| Admiral Shares | 2,843,790 | 40,938 |
| Signal Shares | 72,423 | 128,306 |
| Institutional Shares | 387,352 | 603,547 |
| Institutional Plus Shares | 342,580 | — |
| ETF Shares | 520,315 | 1,671,490 |
| Net Increase (Decrease) from Capital Share Transactions | 2,092,061 | 2,816,594 |
| Total Increase (Decrease) | 6,727,782 | 6,855,533 |
| Net Assets | | |
| Beginning of Period | 17,290,921 | 10,435,388 |
| End of Period1 | 24,018,703 | 17,290,921 |
| 1 Net Assets—End of Period includes undistributed (overdistributed) net investment income of ($29,196,000) and ($22,852,000). |
See accompanying Notes, which are an integral part of the Financial Statements.
20
Small-Cap Index Fund
| | | | | |
| Financial Highlights | | | | | |
| |
| Investor Shares | | | | | |
| |
| For a Share Outstanding | | | Year Ended December 31, |
| Throughout Each Period | 2010 | 2009 | 2008 | 2007 | 2006 |
| Net Asset Value, Beginning of Period | $27.49 | $20.40 | $32.58 | $32.62 | $28.52 |
| Investment Operations | | | | | |
| Net Investment Income | .355 | .272 | .398 | .413 | .357 |
| Net Realized and Unrealized Gain (Loss) | | | | | |
| on Investments | 7.266 | 7.094 | (12.174) | (.041) | 4.101 |
| Total from Investment Operations | 7.621 | 7.366 | (11.776) | .372 | 4.458 |
| Distributions | | | | | |
| Dividends from Net Investment Income | (.361) | (.276) | (.404) | (.412) | (.358) |
| Distributions from Realized Capital Gains | — | — | — | — | — |
| Total Distributions | (.361) | (.276) | (.404) | (.412) | (.358) |
| Net Asset Value, End of Period | $34.75 | $27.49 | $20.40 | $32.58 | $32.62 |
| |
| Total Return1 | 27.72% | 36.12% | -36.07% | 1.16% | 15.64% |
| |
| Ratios/Supplemental Data | | | | | |
| Net Assets, End of Period (Millions) | $5,270 | $5,913 | $4,050 | $6,214 | $6,808 |
| Ratio of Total Expenses to | | | | | |
| Average Net Assets | 0.26% | 0.28% | 0.23% | 0.22% | 0.23% |
| Ratio of Net Investment Income to | | | | | |
| Average Net Assets | 1.24% | 1.30% | 1.49% | 1.23% | 1.18% |
| Portfolio Turnover Rate2 | 12% | 14% | 14% | 16% | 13% |
1 Total returns do not include account service fees that may have applied in the periods shown. Fund prospectuses provide information about any applicable account service fees.
2 Excludes the value of portfolio securities received or delivered as a result of in-kind purchases or redemptions of the fund’s capital shares, including ETF Creation Units.
See accompanying Notes, which are an integral part of the Financial Statements.
21
Small-Cap Index Fund
| | | | | |
| Financial Highlights | | | | | |
| |
| Admiral Shares | | | | | |
| |
| For a Share Outstanding | | | Year Ended December 31, |
| Throughout Each Period | 2010 | 2009 | 2008 | 2007 | 2006 |
| Net Asset Value, Beginning of Period | $27.50 | $20.40 | $32.59 | $32.64 | $28.53 |
| Investment Operations | | | | | |
| Net Investment Income | .384 | .303 | .426 | .440 | .395 |
| Net Realized and Unrealized Gain (Loss) | | | | | |
| on Investments | 7.286 | 7.105 | (12.185) | (.040) | 4.101 |
| Total from Investment Operations | 7.670 | 7.408 | (11.759) | .400 | 4.496 |
| Distributions | | | | | |
| Dividends from Net Investment Income | (.390) | (.308) | (.431) | (.450) | (.386) |
| Distributions from Realized Capital Gains | — | — | — | — | — |
| Total Distributions | (.390) | (.308) | (.431) | (.450) | (.386) |
| Net Asset Value, End of Period | $34.78 | $27.50 | $20.40 | $32.59 | $32.64 |
| |
| Total Return | 27.89% | 36.33% | -36.00% | 1.24% | 15.77% |
| |
| Ratios/Supplemental Data | | | | | |
| Net Assets, End of Period (Millions) | $5,554 | $1,992 | $1,444 | $2,325 | $3,078 |
| Ratio of Total Expenses to | | | | | |
| Average Net Assets | 0.12% | 0.14% | 0.12% | 0.11% | 0.13% |
| Ratio of Net Investment Income to | | | | | |
| Average Net Assets | 1.38% | 1.44% | 1.60% | 1.34% | 1.28% |
| Portfolio Turnover Rate1 | 12% | 14% | 14% | 16% | 13% |
1 Excludes the value of portfolio securities received or delivered as a result of in-kind purchases or redemptions of the fund’s capital shares, including ETF Creation Units.
See accompanying Notes, which are an integral part of the Financial Statements.
22
Small-Cap Index Fund
| | | | | |
| Financial Highlights | | | | | |
| |
| Signal Shares | | | | | |
| | | | | | Dec. 15, |
| | | | | | 20061 to |
| For a Share Outstanding | | Year Ended December 31, | Dec. 31, |
| Throughout Each Period | 2010 | 2009 | 2008 | 2007 | 2006 |
| Net Asset Value, Beginning of Period | $24.79 | $18.39 | $29.38 | $29.42 | $29.98 |
| Investment Operations | | | | | |
| Net Investment Income | .359 | .274 | .385 | .406 | .004 |
| Net Realized and Unrealized Gain (Loss) | | | | | |
| on Investments | 6.545 | 6.405 | (10.985) | (.042) | (.251) |
| Total from Investment Operations | 6.904 | 6.679 | (10.600) | .364 | (.247) |
| Distributions | | | | | |
| Dividends from Net Investment Income | (.364) | (.279) | (.390) | (.404) | (.313) |
| Distributions from Realized Capital Gains | — | — | — | — | — |
| Total Distributions | (.364) | (.279) | (.390) | (.404) | (.313) |
| Net Asset Value, End of Period | $31.33 | $24.79 | $18.39 | $29.38 | $29.42 |
| |
| Total Return | 27.85% | 36.34% | -36.00% | 1.25% | -0.82% |
| |
| Ratios/Supplemental Data | | | | | |
| Net Assets, End of Period (Millions) | $2,300 | $1,763 | $1,172 | $1,625 | $157 |
| Ratio of Total Expenses to | | | | | |
| Average Net Assets | 0.12% | 0.14% | 0.12% | 0.11% | 0.13%2 |
| Ratio of Net Investment Income to | | | | | |
| Average Net Assets | 1.38% | 1.44% | 1.60% | 1.34% | 1.28%2 |
| Portfolio Turnover Rate3 | 12% | 14% | 14% | 16% | 13% |
1 Inception.
2 Annualized.
3 Excludes the value of portfolio securities received or delivered as a result of in-kind purchases or redemptions of the fund’s capital shares,
including ETF Creation Units.
See accompanying Notes, which are an integral part of the Financial Statements.
23
Small-Cap Index Fund
| | | | | |
| Financial Highlights | | | | | |
| |
| Institutional Shares | | | | | |
| |
| For a Share Outstanding | | | Year Ended December 31, |
| Throughout The Period | 2010 | 2009 | 2008 | 2007 | 2006 |
| Net Asset Value, Beginning of Period | $27.50 | $20.40 | $32.60 | $32.65 | $28.54 |
| Investment Operations | | | | | |
| Net Investment Income | .410 | .316 | .441 | .457 | .411 |
| Net Realized and Unrealized Gain (Loss) | | | | | |
| on Investments | 7.276 | 7.106 | (12.196) | (.041) | 4.101 |
| Total from Investment Operations | 7.686 | 7.422 | (11.755) | .416 | 4.512 |
| Distributions | | | | | |
| Dividends from Net Investment Income | (.416) | (.322) | (.445) | (.466) | (.402) |
| Distributions from Realized Capital Gains | — | — | — | — | — |
| Total Distributions | (.416) | (.322) | (.445) | (.466) | (.402) |
| Net Asset Value, End of Period | $34.77 | $27.50 | $20.40 | $32.60 | $32.65 |
| |
| Total Return | 27.95% | 36.40% | -35.98% | 1.29% | 15.82% |
| |
| Ratios/Supplemental Data | | | | | |
| Net Assets, End of Period (Millions) | $5,711 | $4,162 | $2,545 | $3,585 | $3,107 |
| Ratio of Total Expenses to | | | | | |
| Average Net Assets | 0.08% | 0.08% | 0.07% | 0.07% | 0.08% |
| Ratio of Net Investment Income to | | | | | |
| Average Net Assets | 1.42% | 1.50% | 1.65% | 1.38% | 1.33% |
| Portfolio Turnover Rate1 | 12% | 14% | 14% | 16% | 13% |
1 Excludes the value of portfolio securities received or delivered as a result of in-kind purchases or redemptions of the fund’s capital shares, including ETF Creation Units.
See accompanying Notes, which are an integral part of the Financial Statements.
24
Small-Cap Index Fund
| |
| Financial Highlights | |
| |
| Institutional Plus Shares | |
| | Dec. 17, |
| | 20101 to |
| For a Share Outstanding | Dec. 31, |
| Throughout The Period | 2010 |
| Net Asset Value, Beginning of Period | $100.73 |
| Investment Operations | |
| Net Investment Income | .0642 |
| Net Realized and Unrealized Gain (Loss) on Investments | .767 |
| Total from Investment Operations | .831 |
| Distributions | |
| Dividends from Net Investment Income | (1.181) |
| Distributions from Realized Capital Gains | — |
| Total Distributions | (1.181) |
| Net Asset Value, End of Period | $100.38 |
| |
| Total Return | 0.82% |
| |
| Ratios/Supplemental Data | |
| Net Assets, End of Period (Millions) | $341 |
| Ratio of Total Expenses to Average Net Assets | 0.06%3 |
| Ratio of Net Investment Income to Average Net Assets | 1.44%3 |
| Portfolio Turnover Rate4 | 12% |
1 Inception.
2 Calculated based on average shares outstanding.
3 Annualized.
4 Excludes the value of portfolio securities received or delivered as a result of in-kind purchases or redemptions of the fund’s capital shares, including ETF Creation Units.
See accompanying Notes, which are an integral part of the Financial Statements.
25
Small-Cap Index Fund
| | | | | |
| Financial Highlights | | | | | |
| |
| ETF Shares | | | | | |
| |
| For a Share Outstanding | | | Year Ended December 31, |
| Throughout Each Period | 2010 | 2009 | 2008 | 2007 | 2006 |
| Net Asset Value, Beginning of Period | $57.41 | $42.60 | $68.07 | $68.16 | $59.59 |
| Investment Operations | | | | | |
| Net Investment Income | .833 | .646 | .910 | .959 | .836 |
| Net Realized and Unrealized Gain (Loss) | | | | | |
| on Investments | 15.183 | 14.822 | (25.462) | (.093) | 8.569 |
| Total from Investment Operations | 16.016 | 15.468 | (24.552) | .866 | 9.405 |
| Distributions | | | | | |
| Dividends from Net Investment Income | (.846) | (.658) | (.918) | (.956) | (.835) |
| Distributions from Realized Capital Gains | — | — | — | — | — |
| Total Distributions | (.846) | (.658) | (.918) | (.956) | (.835) |
| Net Asset Value, End of Period | $72.58 | $57.41 | $42.60 | $68.07 | $68.16 |
| |
| Total Return | 27.89% | 36.31% | -35.99% | 1.27% | 15.79% |
| |
| Ratios/Supplemental Data | | | | | |
| Net Assets, End of Period (Millions) | $4,843 | $3,460 | $1,224 | $1,121 | $670 |
| Ratio of Total Expenses to | | | | | |
| Average Net Assets | 0.12% | 0.14% | 0.10% | 0.10% | 0.10% |
| Ratio of Net Investment Income to | | | | | |
| Average Net Assets | 1.38% | 1.44% | 1.62% | 1.35% | 1.31% |
| Portfolio Turnover Rate1 | 12% | 14% | 14% | 16% | 13% |
1 Excludes the value of portfolio securities received or delivered as a result of in-kind purchases or redemptions of the fund’s capital shares, including ETF Creation Units.
26
Small-Cap Index Fund
Notes to Financial Statements
Vanguard Small-Cap Index Fund is registered under the Investment Company Act of 1940 as an open-end investment company, or mutual fund. The fund offers six classes of shares: Investor Shares, Admiral Shares, Signal Shares, Institutional Shares, Institutional Plus Shares, and ETF Shares. Investor Shares are available to any investor who meets the fund’s minimum purchase requirements. Admiral Shares, Signal Shares, Institutional Shares, and Institutional Plus Shares are designed for investors who meet certain administrative, service, and account-size criteria. Institutional Plus Shares were first issued on December 17, 2010. ETF Shares are listed for trading on the NYSE Arca, Inc.; they can be purchased and sold through a broker.
A. The following significant accounting policies conform to generally accepted accounting principles for U.S. mutual funds. The fund consistently follows such policies in preparing its financial statements.
1. Security Valuation: Securities are valued as of the close of trading on the New York Stock Exchange (generally 4 p.m., Eastern time) on the valuation date. Equity securities are valued at the latest quoted sales prices or official closing prices taken from the primary market in which each security trades; such securities not traded on the valuation date are valued at the mean of the latest quoted bid and asked prices. Securities for which market quotations are not readily available, or whose values have been materially affected by events occurring before the fund’s pricing time but after the close of the securities’ primary markets, are valued by methods deemed by the board of trustees to represent fair value. Investments in Vanguard Market Liquidity Fund are valued at that fund’s net asset value. Temporary cash investments acquired over 60 days to maturity are valued using the latest bid prices or using valuations based on a matrix system (which considers such factors as security prices, yields, maturities, and ratings), both as furnished by independent pricing services. Other temporary cash investments are valued at amortized cost, which approximates market value.
2. Futures Contracts: The fund uses index futures contracts to a limited extent, with the objectives of maintaining full exposure to the stock market, enhancing returns, maintaining liquidity, and minimizing transaction costs. The fund may purchase futures contracts to immediately invest incoming cash in the market, or sell futures in response to cash outflows, thereby simulating a fully invested position in the underlying index while maintaining a cash balance for liquidity. The fund may seek to enhance returns by using futures contracts instead of the underlying securities when futures are believed to be priced more attractively than the underlying securities. The primary risks associated with the use of futures contracts are imperfect correlation between changes in market values of stocks held by the fund and the prices of futures contracts, and the possibility of an illiquid market.
Futures contracts are valued at their quoted daily settlement prices. The aggregate principal amounts of the contracts are not recorded in the Statement of Net Assets. Fluctuations in the value of the contracts are recorded in the Statement of Net Assets as an asset (liability) and in the Statement of Operations as unrealized appreciation (depreciation) until the contracts are closed, when they are recorded as realized futures gains (losses).
3. Federal Income Taxes: The fund intends to continue to qualify as a regulated investment company and distribute all of its taxable income. Management has analyzed the fund’s tax positions taken for all open federal income tax years (December 31, 2007–2010), and has concluded that no provision for federal income tax is required in the fund’s financial statements.
4. Distributions: Distributions to shareholders are recorded on the ex-dividend date.
27
Small-Cap Index Fund
5. Security Lending: The fund may lend its securities to qualified institutional borrowers to earn additional income. Security loans are required to be secured at all times by collateral at least equal to the market value of securities loaned. The fund invests cash collateral received in Vanguard Market Liquidity Fund, and records a liability for the return of the collateral, during the period the securities are on loan. Security lending income represents fees charged to borrowers plus income earned on investing cash collateral, less expenses associated with the loan.
6. Other: Dividend income is recorded on the ex-dividend date. Interest income includes income distributions received from Vanguard Market Liquidity Fund and is accrued daily. Security transactions are accounted for on the date securities are bought or sold. Costs used to determine realized gains (losses) on the sale of investment securities are those of the specific securities sold.
Each class of shares has equal rights as to assets and earnings, except that each class separately bears certain class-specific expenses related to maintenance of shareholder accounts (included in Management and Administrative expenses) and shareholder reporting. Marketing and distribution expenses are allocated to each class of shares based on a method approved by the board of trustees. Income, other non-class-specific expenses, and gains and losses on investments are allocated to each class of shares based on its relative net assets.
B. The Vanguard Group furnishes at cost investment advisory, corporate management, administrative, marketing, and distribution services. The costs of such services are allocated to the fund under methods approved by the board of trustees. The fund has committed to provide up to 0.40% of its net assets in capital contributions to Vanguard. At December 31, 2010, the fund had contributed capital of $3,862,000 to Vanguard (included in Other Assets), representing 0.02% of the fund’s net assets and 1.54% of Vanguard’s capitalization. The fund’s trustees and officers are also directors and officers of Vanguard.
C. Various inputs may be used to determine the value of the fund’s investments. These inputs are summarized in three broad levels for financial statement purposes. The inputs or methodologies used to value securities are not necessarily an indication of the risk associated with investing in those securities.
Level 1—Quoted prices in active markets for identical securities.
Level 2—Other significant observable inputs (including quoted prices for similar securities, interest rates, prepayment speeds, credit risk, etc.).
Level 3—Significant unobservable inputs (including the fund’s own assumptions used to determine the fair value of investments).
The following table summarizes the fund’s investments as of December 31, 2010, based on the inputs
used to value them:
| | | |
| | Level 1 | Level 2 | Level 3 |
| Investments | ($000) | ($000) | ($000) |
| Common Stocks | 23,968,134 | — | — |
| Temporary Cash Investments | 477,032 | 9,597 | — |
| Futures Contracts----Assets1 | 138 | — | — |
| Futures Contracts—Liabilities1 | (570) | — | — |
| Total | 24,444,734 | 9,597 | — |
| 1 Represents variation margin on the last day of the reporting period. | | | |
28
Small-Cap Index Fund
D. At December 31, 2010, the aggregate settlement value of open futures contracts and the related unrealized appreciation (depreciation) were:
| | | | |
| | | | | ($000) |
| | | | Aggregate | |
| | | Number of | Settlement | Unrealized |
| | | Long (Short) | Value | Appreciation |
| Futures Contracts | Expiration | Contracts | Long (Short) | (Depreciation) |
| E-mini Russell 2000 Index | March 2011 | 696 | 54,448 | (444) |
Unrealized appreciation (depreciation) on open futures contracts is required to be treated as realized gain (loss) for tax purposes.
E. Distributions are determined on a tax basis and may differ from net investment income and realized capital gains for financial reporting purposes. Differences may be permanent or temporary. Permanent differences are reclassified among capital accounts in the financial statements to reflect their tax character. Temporary differences arise when certain items of income, expense, gain, or loss are recognized in different periods for financial statement and tax purposes; these differences are primarily attributed to tax deferral of losses on wash sales and will reverse at some time in the future. Differences in classification may also result from the treatment of short-term gains as ordinary income for tax purposes.
During the year ended December 31, 2010, the fund realized $1,388,743 ,000 of net capital gains resulting from in-kind redemptions—in which shareholders exchanged fund shares for securities held by the fund rather than for cash. Because such gains are not taxable to the fund, and are not distributed to shareholders, they have been reclassified from accumulated net realized losses to paid-in capital.
For tax purposes, at December 31, 2010, the fund had $332,000 of ordinary income available for distribution. The fund had available capital loss carryforwards totaling $2,405,922,000 to offset future net capital gains of $326,341,000 through December 31, 2011, $23,049,000 through December 31, 2015, $481,807,000 through December 31, 2016, $970,576,000 through December 31, 2017, and $604,149,000 through December 31, 2018. In addition, the fund realized losses of $104,033,000 during the period from November 1, 2010, through December 31, 2010, which are deferred and will be treated as realized for tax purposes in fiscal 2011.
At December 31, 2010, the cost of investment securities for tax purposes was $20,281,503,000. Net unrealized appreciation of investment securities for tax purposes was $4,173,260,000, consisting of unrealized gains of $5,615,865,000 on securities that had risen in value since their purchase and $1,442,605,000 in unrealized losses on securities that had fallen in value since their purchase.
F. During the year ended December 31, 2010, the fund purchased $7,298,774,000 of investment securities and sold $5,183,605,000 of investment securities, other than temporary cash investments.
29
Small-Cap Index Fund
G. Capital share transactions for each class of shares were:
| | | | |
| | | | Year Ended December 31, |
| | | 2010 | | 2009 |
| | Amount | Shares | Amount | Shares |
| | ($000) | (000) | ($000) | (000) |
| Investor Shares | | | | |
| Issued | 1,807,733 | 59,832 | 1,292,322 | 58,916 |
| Issued in Lieu of Cash Distributions | 53,356 | 1,533 | 56,593 | 2,071 |
| Redeemed | (3,935,488) | (124,812) | (976,602) | (44,417) |
| Net Increase (Decrease)—Investor Shares | (2,074,399) | (63,447) | 372,313 | 16,570 |
| Admiral Shares | | | | |
| Issued | 3,132,693 | 97,007 | 290,764 | 13,073 |
| Issued in Lieu of Cash Distributions | 55,406 | 1,588 | 19,054 | 699 |
| Redeemed | (344,309) | (11,363) | (268,880) | (12,110) |
| Net Increase (Decrease)—Admiral Shares | 2,843,790 | 87,232 | 40,938 | 1,662 |
| Signal Shares | | | | |
| Issued | 800,486 | 28,955 | 550,957 | 27,652 |
| Issued in Lieu of Cash Distributions | 23,162 | 738 | 16,939 | 691 |
| Redeemed | (751,225) | (27,451) | (439,590) | (20,897) |
| Net Increase (Decrease)—Signal Shares | 72,423 | 2,242 | 128,306 | 7,446 |
| Institutional Shares | | | | |
| Issued | 1,689,975 | 55,195 | 1,294,155 | 57,320 |
| Issued in Lieu of Cash Distributions | 63,621 | 1,826 | 45,986 | 1,686 |
| Redeemed | (1,366,244) | (44,082) | (736,594) | (32,428) |
| Net Increase (Decrease)—Institutional Shares | 387,352 | 12,939 | 603,547 | 26,578 |
| Institutional Plus Shares1 | | | | |
| Issued | 349,865 | 3,473 | — | — |
| Issued in Lieu of Cash Distributions | 3,937 | 39 | — | — |
| Redeemed | (11,222) | (111) | — | — |
| Net Increase (Decrease)—Institutional Plus Shares | 342,580 | 3,401 | — | — |
| ETF Shares | | | | |
| Issued | 3,323,756 | 52,160 | 2,815,775 | 56,037 |
| Issued in Lieu of Cash Distributions | — | — | — | — |
| Redeemed | (2,803,441) | (45,700) | (1,144,285) | (24,500) |
| Net Increase (Decrease)—ETF Shares | 520,315 | 6,460 | 1,671,490 | 31,537 |
| 1 Inception was December 17, 2010, for Institutional Plus Shares. | | | | |
H. In preparing the financial statements as of December 31, 2010, management considered the impact of subsequent events for potential recognition or disclosure in these financial statements.
30
Small-Cap Growth Index Fund
Fund Profile
As of December 31, 2010
| | | |
| Share-Class Characteristics | |
| |
| | Investor | Institutional | ETF |
| | Shares | Shares | Shares |
| Ticker Symbol | VISGX | VSGIX | VBK |
| Expense Ratio1 | 0.28% | 0.08% | 0.14% |
| 30-Day SEC Yield | 0.22% | 0.40% | 0.36% |
| | | |
| Portfolio Characteristics | | |
| | | | DJ |
| | | MSCI US | U.S. Total |
| | | Small Cap | Market |
| | Fund | Growth | Index |
| Number of Stocks | 1,000 | 995 | 3,893 |
| Median Market Cap | $1.7B | $1.7B | $29.6B |
| Price/Earnings Ratio | 32.9x | 32.9x | 18.3x |
| Price/Book Ratio | 3.1x | 3.1x | 2.2x |
| Return on Equity | 12.2% | 12.2% | 18.8% |
| Earnings Growth Rate | 8.5% | 8.5% | 6.2% |
| Dividend Yield | 0.3% | 0.3% | 1.7% |
| Foreign Holdings | 0.0% | 0.0% | 0.0% |
| Turnover Rate | 34% | — | — |
| Short-Term Reserves | 0.3% | — | — |
| | | |
| Sector Diversification (% of equity exposure) |
| | | | DJ |
| | | MSCI US | U.S. Total |
| | | Small Cap | Market |
| | Fund | Growth | Index |
| Consumer | | | |
| Discretionary | 17.2% | 17.2% | 11.9% |
| Consumer Staples | 1.7 | 1.7 | 9.5 |
| Energy | 7.4 | 7.4 | 10.6 |
| Financials | 5.7 | 5.6 | 16.6 |
| Health Care | 16.0 | 16.1 | 10.7 |
| Industrials | 17.8 | 17.8 | 11.4 |
| Information | | | |
| Technology | 27.2 | 27.2 | 18.9 |
| Materials | 5.1 | 5.1 | 4.5 |
| Telecommunication | | | |
| Services | 1.3 | 1.3 | 2.7 |
| Utilities | 0.6 | 0.6 | 3.2 |
| | |
| Volatility Measures | | |
| | | DJ |
| | MSCI US | U.S. Total |
| | Small Cap | Market |
| | Growth | Index |
| R-Squared | 1.00 | 0.93 |
| Beta | 1.00 | 1.23 |
These measures show the degree and timing of the fund’s fluctuations compared with the indexes over 36 months.
| | |
| Ten Largest Holdings (% of total net assets) |
| Riverbed Technology | Communications | |
| Inc. | Equipment | 0.5% |
| Gentex Corp. | Auto Parts & | |
| | Equipment | 0.5 |
| Informatica Corp. | Application | |
| | Software | 0.5 |
| Signet Jewelers Ltd. | Specialty Stores | 0.5 |
| Gardner Denver Inc. | Industrial | |
| | Machinery | 0.4 |
| Solera Holdings Inc. | Application | |
| | Software | 0.4 |
| E*Trade Financial Corp. | Investment Banking | |
| | & Brokerage | 0.4 |
| Tractor Supply Co. | Specialty Stores | 0.4 |
| MICROS Systems Inc. | Systems Software | 0.4 |
| Atlas Energy Inc. | Oil & Gas | |
| | Exploration & | |
| | Production | 0.4 |
| Top Ten | | 4.4% |
The holdings listed exclude any temporary cash investments and equity index products.
Investment Focus
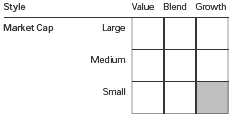
1 The expense ratios shown are from the prospectus dated December 13, 2010, for the Institutional Shares and April 29, 2010, for the Investor and ETF Shares, and represent estimated costs for the current fiscal year. For the fiscal year ended December 31, 2010, the expense ratios were 0.26% for Investor Shares, 0.08% for Institutional Shares, and 0.12% for ETF Shares.
31
Small-Cap Growth Index Fund
Performance Summary
All of the returns in this report represent past performance, which is not a guarantee of future results that may be achieved by the fund. (Current performance may be lower or higher than the performance data cited. For performance data current to the most recent month-end, visit our website at vanguard.com/performance.) Note, too, that both investment returns and principal value can fluctuate widely, so an investor’s shares, when sold, could be worth more or less than their original cost. The returns shown do not reflect taxes that a shareholder would pay on fund distributions or on the sale of fund shares.
Cumulative Performance: December 31, 2000, Through December 31, 2010
Initial Investment of $10,000
| | | | | |
| | | Average Annual Total Returns | |
| | | Periods Ended December 31, 2010 | |
| | | | | | Final Value |
| | | One | Five | Ten | of a $10,000 |
| | | Year | Years | Years | Investment |
| | Small-Cap Growth Index Fund Investor | | | | |
| | Shares | 30.69% | 6.42% | 7.52% | $20,640 |
| •••••••• | Dow Jones U.S. Total Stock Market | | | | |
| | Index | 17.70 | 3.17 | 2.64 | 12,981 |
| – – – – | Spliced Small-Cap Growth Index | 30.71 | 6.44 | 7.42 | 20,466 |
| | Small-Cap Growth Funds Average | 27.32 | 3.70 | 2.34 | 12,606 |
| Spliced Small-Cap Growth Index: S&P SmallCap 600/Barra Growth Index through May 16, 2003; MSCI US Small Cap Growth Index thereafter. |
| Small-Cap Growth Funds Average: Derived from data provided by Lipper Inc. | | | |
| | | | |
| | | | | Final Value |
| | One | Five | Ten | of a $5,000,000 |
| | Year | Years | Years | Investment |
| Small-Cap Growth Index Fund | | | | |
| Institutional Shares | 30.96% | 6.60% | 7.69% | $10,489,496 |
| Dow Jones U.S. Total Stock Market | | | | |
| Index | 17.70 | 3.17 | 2.64 | 6,490,386 |
| Spliced Small-Cap Growth Index | 30.71 | 6.44 | 7.42 | 10,233,210 |
See Financial Highlights for dividend and capital gains information.
32
Small-Cap Growth Index Fund
| | | | |
| | Average Annual Total Returns | |
| | Periods Ended December 31, 2010 | |
| | | | Since | Final Value |
| | One | Five | Inception | of a $10,000 |
| | Year | Years | (1/26/2004) | Investment |
| Small-Cap Growth Index Fund | | | | |
| ETF Shares Net Asset Value | 30.87% | 6.55% | 6.92% | $15,896 |
| Dow Jones U.S. Total Stock Market Index | 17.70 | 3.17 | 4.30 | 13,390 |
| MSCI US Small Cap Growth Index | 30.71 | 6.44 | 6.83 | 15,806 |
| "Since Inception" performance is calculated from the ETF Shares’ inception date for both the fund and its comparative standards. |
| | | |
| Cumulative Returns of ETF Shares: January 26, 2004, Through December 31, 2010 | |
| | | | Since |
| | One | Five | Inception |
| | Year | Years | (1/26/2004) |
| Small-Cap Growth Index Fund | | | |
| ETF Shares Market Price | 31.11% | 37.59% | 59.10% |
| Small-Cap Growth Index Fund | | | |
| ETF Shares Net Asset Value | 30.87 | 37.30 | 58.96 |
| MSCI US Small Cap Growth Index | 30.71 | 36.59 | 58.06 |
| "Since Inception" performance is calculated from the ETF Shares’ inception date for both the fund and its comparative standard. | |
Fiscal-Year Total Returns (%): December 31, 2000, Through December 31, 2010
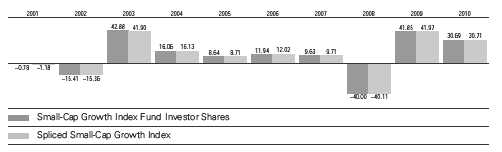
33
Small-Cap Growth Index Fund
Financial Statements
Statement of Net Assets—Investments Summary
As of December 31, 2010
This Statement summarizes the fund’s holdings by asset type. Details are reported for each of the fund’s 50 largest individual holdings and for investments that, in total for any issuer, represent more than 1% of the fund’s net assets. The total value of smaller holdings is reported as a single amount within each category.
The fund reports a complete list of its holdings in regulatory filings four times in each fiscal year, at the quarter-ends. For the second and fourth fiscal quarters, the complete listing of the fund’s holdings is available electronically on vanguard.com and on the Securities and Exchange Commission’s website (sec.gov), or you can have it mailed to you without charge by calling 800-662-7447. For the first and third fiscal quarters, the fund files the lists with the SEC on Form N-Q. Shareholders can look up the fund’s Forms N-Q on the SEC’s website. Forms N-Q may also be reviewed and copied at the SEC’s Public Reference Room (see the back cover of this report for further information).
| | | | |
| | | | Market | Percentage |
| | | | Value | of Net |
| | | Shares | ($000) | Assets |
| Common Stocks | | | |
| Consumer Discretionary | | | |
| | Gentex Corp. | 1,297,526 | 38,355 | 0.5% |
| * | Signet Jewelers Ltd. | 794,357 | 34,475 | 0.4% |
| | Tractor Supply Co. | 673,859 | 32,675 | 0.4% |
| *,^ | Lululemon Athletica Inc. | 427,210 | 29,230 | 0.4% |
| * | Deckers Outdoor Corp. | 358,547 | 28,591 | 0.4% |
| | Sotheby’s | 621,357 | 27,961 | 0.4% |
| * | Panera Bread Co. Class A | 275,568 | 27,890 | 0.4% |
| * | Tempur-Pedic International Inc. | 614,600 | 24,621 | 0.3% |
| * | WMS Industries Inc. | 538,621 | 24,367 | 0.3% |
| * | J Crew Group Inc. | 562,190 | 24,253 | 0.3% |
| | Consumer Discretionary—Other † | | 1,009,840 | 13.3% |
| | | | 1,302,258 | 17.1% |
| |
| Consumer Staples † | | 128,707 | 1.7% |
| |
| Energy | | | |
| * | Atlas Energy Inc. | 726,879 | 31,961 | 0.4% |
| * | Brigham Exploration Co. | 1,081,130 | 29,450 | 0.4% |
| * | Superior Energy Services Inc. | 730,540 | 25,562 | 0.4% |
| | Energy—Other † | | 472,887 | 6.2% |
| | | | 559,860 | 7.4% |
| Financials | | | |
| * | E*Trade Financial Corp. | 2,046,254 | 32,740 | 0.4% |
| | Taubman Centers Inc. | 506,946 | 25,591 | 0.4% |
| | East West Bancorp Inc. | 1,303,345 | 25,480 | 0.3% |
| | Financials—Other † | | 338,537 | 4.5% |
| | | | 422,348 | 5.6% |
34
Small-Cap Growth Index Fund
| | | | |
| | | | Market | Percentage |
| | | | Value | of Net |
| | | Shares | ($000) | Assets |
| Health Care | | | |
| * | Allscripts Healthcare Solutions Inc. | 1,647,905 | 31,755 | 0.4% |
| * | United Therapeutics Corp. | 497,230 | 31,435 | 0.4% |
| * | Tenet Healthcare Corp. | 4,498,387 | 30,094 | 0.4% |
| * | BioMarin Pharmaceutical Inc. | 946,255 | 25,483 | 0.4% |
| * | Salix Pharmaceuticals Ltd. | 536,034 | 25,172 | 0.3% |
| | Health Care—Other † | | 1,070,177 | 14.1% |
| | | | 1,214,116 | 16.0% |
| Industrials | | | |
| | Gardner Denver Inc. | 484,954 | 33,375 | 0.4% |
| * | TransDigm Group Inc. | 434,586 | 31,295 | 0.4% |
| * | Oshkosh Corp. | 839,354 | 29,579 | 0.4% |
| | IDEX Corp. | 755,272 | 29,546 | 0.4% |
| | Waste Connections Inc. | 1,021,183 | 28,113 | 0.4% |
| | Nordson Corp. | 283,328 | 26,032 | 0.4% |
| * | Corrections Corp. of America | 1,024,320 | 25,669 | 0.3% |
| | Wabtec Corp. | 444,338 | 23,501 | 0.3% |
| * | Thomas & Betts Corp. | 484,636 | 23,408 | 0.3% |
| | Industrials—Other † | | 1,093,319 | 14.4% |
| | | | 1,343,837 | 17.7% |
| Information Technology | | | |
| * | Riverbed Technology Inc. | 1,142,768 | 40,191 | 0.5% |
| * | Informatica Corp. | 858,000 | 37,778 | 0.5% |
| | Solera Holdings Inc. | 649,144 | 33,314 | 0.4% |
| * | MICROS Systems Inc. | 742,671 | 32,574 | 0.4% |
| * | Polycom Inc. | 790,575 | 30,817 | 0.4% |
| * | VeriFone Systems Inc. | 792,213 | 30,548 | 0.4% |
| * | TIBCO Software Inc. | 1,519,762 | 29,954 | 0.4% |
| * | JDS Uniphase Corp. | 2,054,355 | 29,747 | 0.4% |
| * | CommScope Inc. | 878,117 | 27,415 | 0.4% |
| *,^ | Rackspace Hosting Inc. | 869,040 | 27,297 | 0.4% |
| * | Monster Worldwide Inc. | 1,143,343 | 27,017 | 0.4% |
| * | WebMD Health Corp. | 511,523 | 26,118 | 0.3% |
| * | Varian Semiconductor Equipment Associates Inc. | 693,601 | 25,642 | 0.3% |
| * | Parametric Technology Corp. | 1,069,470 | 24,095 | 0.3% |
| * | Atheros Communications Inc. | 656,730 | 23,590 | 0.3% |
| * | Gartner Inc. | 706,933 | 23,470 | 0.3% |
| | Information Technology—Other † | | 1,584,796 | 20.9% |
| | | | 2,054,363 | 27.0% |
| Materials | | | |
| * | Hecla Mining Co. | 2,374,092 | 26,732 | 0.4% |
| * | Solutia Inc. | 1,130,879 | 26,101 | 0.3% |
| * | WR Grace & Co. | 674,793 | 23,705 | 0.3% |
| | Materials—Other † | | 312,187 | 4.1% |
| | | | 388,725 | 5.1% |
| |
| Telecommunication Services † | | 99,071 | 1.3% |
| |
| Utilities | | | |
| | ITC Holdings Corp. | 466,274 | 28,900 | 0.4% |
| | Utilities—Other † | | 16,948 | 0.2% |
| | | | 45,848 | 0.6% |
| Total Common Stocks (Cost $5,747,415) | | 7,559,133 | 99.5%1 |
35
Small-Cap Growth Index Fund
| | | | |
| | | | Market | Percentage |
| | | | Value | of Net |
| | Coupon | Shares | ($000) | Assets |
| Temporary Cash Investments | | | | |
| Money Market Fund | | | | |
| 2,3 Vanguard Market Liquidity Fund | 0.211% | 215,745,043 | 215,745 | 2.8% |
| |
| 4U.S. Government and Agency Obligations † | | | 3,199 | 0.1% |
| Total Temporary Cash Investments (Cost $218,944) | | | 218,944 | 2.9%1 |
| Total Investments (Cost $5,966,359) | | | 7,778,077 | 102.4% |
| Other Assets and Liabilities | | | | |
| Other Assets | | | 11,730 | 0.1% |
| Liabilities3 | | | (191,456) | (2.5%) |
| | | | (179,726) | (2.4%) |
| Net Assets | | | 7,598,351 | 100.0% |
36
Small-Cap Growth Index Fund
| |
| At December 31, 2010, net assets consisted of: | |
| | Amount |
| | ($000) |
| Paid-in Capital | 7,335,560 |
| Overdistributed Net Investment Income | (7,865) |
| Accumulated Net Realized Losses | (1,541,254) |
| Unrealized Appreciation (Depreciation) | |
| Investment Securities | 1,811,718 |
| Futures Contracts | 192 |
| Net Assets | 7,598,351 |
| |
| Investor Shares—Net Assets | |
| Applicable to 192,937,559 outstanding $.001 par value shares of | |
| beneficial interest (unlimited authorization) | 4,229,093 |
| Net Asset Value Per Share—Investor Shares | $21.92 |
| |
| Institutional Shares—Net Assets | |
| Applicable to 69,561,695 outstanding $.001 par value shares of | |
| beneficial interest (unlimited authorization) | 1,527,327 |
| Net Asset Value Per Share—Institutional Shares | $21.96 |
| |
| ETF Shares—Net Assets | |
| Applicable to 23,621,850 outstanding $.001 par value shares of | |
| beneficial interest (unlimited authorization) | 1,841,931 |
| Net Asset Value Per Share—ETF Shares | $77.98 |
See Note A in Notes to Financial Statements.
* Non-income-producing security.
^ Part of security position is on loan to broker-dealers. The total value of securities on loan is $141,716,000.
† Represents the aggregate value, by category, of securities that are not among the 50 largest holdings and, in total for any issuer, represent 1% or less of net assets.
1 The fund invests a portion of its cash reserves in equity markets through the use of index futures contracts. After giving effect to futures investments, the fund’s effective common stock and temporary cash investment positions represent 100.0% and 2.4%, respectively, of net assets.
2 Affiliated money market fund available only to Vanguard funds and certain trusts and accounts managed by Vanguard. Rate shown is the 7-day yield.
3 Includes $152,792,000 of collateral received for securities on loan.
4 Securities with a value of $2,399,000 have been segregated as initial margin for open futures contracts.
See accompanying Notes, which are an integral part of the Financial Statements.
37
Small-Cap Growth Index Fund
| |
| Statement of Operations | |
| |
| | Year Ended |
| | December 31, 2010 |
| | ($000) |
| Investment Income | |
| Income | |
| Dividends | 29,632 |
| Interest1 | 36 |
| Security Lending | 11,081 |
| Total Income | 40,749 |
| Expenses | |
| The Vanguard Group—Note B | |
| Investment Advisory Services | 367 |
| Management and Administrative—Investor Shares | 7,383 |
| Management and Administrative—Institutional Shares | 407 |
| Management and Administrative—ETF Shares | 978 |
| Marketing and Distribution—Investor Shares | 911 |
| Marketing and Distribution—Institutional Shares | 305 |
| Marketing and Distribution—ETF Shares | 379 |
| Custodian Fees | 318 |
| Auditing Fees | 32 |
| Shareholders’ Reports—Investor Shares | 83 |
| Shareholders’ Reports—Institutional Shares | 64 |
| Shareholders’ Reports—ETF Shares | 129 |
| Trustees’ Fees and Expenses | 9 |
| Total Expenses | 11,365 |
| Net Investment Income | 29,384 |
| Realized Net Gain (Loss) | |
| Investment Securities Sold | 261,061 |
| Futures Contracts | 1,916 |
| Realized Net Gain (Loss) | 262,977 |
| Change in Unrealized Appreciation (Depreciation) | |
| Investment Securities | 1,350,628 |
| Futures Contracts | 237 |
| Change in Unrealized Appreciation (Depreciation) | 1,350,865 |
| Net Increase (Decrease) in Net Assets Resulting from Operations | 1,643,226 |
| 1 Interest income from an affiliated company of the fund was $32,000. | |
See accompanying Notes, which are an integral part of the Financial Statements.
38
Small-Cap Growth Index Fund
| | |
| Statement of Changes in Net Assets | | |
| |
| | Year Ended December 31, |
| | 2010 | 2009 |
| | ($000) | ($000) |
| Increase (Decrease) in Net Assets | | |
| Operations | | |
| Net Investment Income | 29,384 | 15,557 |
| Realized Net Gain (Loss) | 262,977 | (141,233) |
| Change in Unrealized Appreciation (Depreciation) | 1,350,865 | 1,569,663 |
| Net Increase (Decrease) in Net Assets Resulting from Operations | 1,643,226 | 1,443,987 |
| Distributions | | |
| Net Investment Income | | |
| Investor Shares | (14,448) | (8,702) |
| Institutional Shares | (7,444) | (4,179) |
| ETF Shares | (8,490) | (4,659) |
| Realized Capital Gain | | |
| Investor Shares | — | — |
| Institutional Shares | — | — |
| ETF Shares | — | — |
| Total Distributions | (30,382) | (17,540) |
| Capital Share Transactions | | |
| Investor Shares | 300,801 | 322,971 |
| Institutional Shares | 252,182 | 177,511 |
| ETF Shares | 292,799 | 151,301 |
| Net Increase (Decrease) from Capital Share Transactions | 845,782 | 651,783 |
| Total Increase (Decrease) | 2,458,626 | 2,078,230 |
| Net Assets | | |
| Beginning of Period | 5,139,725 | 3,061,495 |
| End of Period1 | 7,598,351 | 5,139,725 |
| 1 Net Assets—End of Period includes undistributed (overdistributed) net investment income of ($7,865,000) and ($6,764,000). | |
See accompanying Notes, which are an integral part of the Financial Statements.
39
Small-Cap Growth Index Fund
| | | | | |
| Financial Highlights | | | | | |
| |
| Investor Shares | | | | | |
| |
| For a Share Outstanding | | | Year Ended December 31, |
| Throughout Each Period | 2010 | 2009 | 2008 | 2007 | 2006 |
| Net Asset Value, Beginning of Period | $16.83 | $11.90 | $20.01 | $18.34 | $16.43 |
| Investment Operations | | | | | |
| Net Investment Income | .075 | .046 | .096 | .095 | .051 |
| Net Realized and Unrealized Gain (Loss) | | | | | |
| on Investments | 5.091 | 4.933 | (8.105) | 1.669 | 1.911 |
| Total from Investment Operations | 5.166 | 4.979 | (8.009) | 1.764 | 1.962 |
| Distributions | | | | | |
| Dividends from Net Investment Income | (.076) | (.049) | (.101) | (.094) | (.052) |
| Distributions from Realized Capital Gains | — | — | — | — | — |
| Total Distributions | (.076) | (.049) | (.101) | (.094) | (.052) |
| Net Asset Value, End of Period | $21.92 | $16.83 | $11.90 | $20.01 | $18.34 |
| |
| Total Return1 | 30.69% | 41.85% | -40.00% | 9.63% | 11.94% |
| |
| Ratios/Supplemental Data | | | | | |
| Net Assets, End of Period (Millions) | $4,229 | $3,018 | $1,871 | $2,825 | $2,208 |
| Ratio of Total Expenses to | | | | | |
| Average Net Assets | 0.26% | 0.28% | 0.23% | 0.22% | 0.23% |
| Ratio of Net Investment Income to | | | | | |
| Average Net Assets | 0.43% | 0.33% | 0.60% | 0.52% | 0.30% |
| Portfolio Turnover Rate2 | 34% | 38% | 38% | 32% | 40% |
1 Total returns do not include account service fees that may have applied in the periods shown. Fund prospectuses provide information about any applicable account service fees.
2 Excludes the value of portfolio securities received or delivered as a result of in-kind purchases or redemptions of the fund’s capital shares, including ETF Creation Units.
See accompanying Notes, which are an integral part of the Financial Statements.
40
Small-Cap Growth Index Fund
| | | | | |
| Financial Highlights | | | | | |
| |
| Institutional Shares | | | | | |
| |
| For a Share Outstanding | | | Year Ended December 31, |
| Throughout Each Period | 2010 | 2009 | 2008 | 2007 | 2006 |
| Net Asset Value, Beginning of Period | $16.85 | $11.91 | $20.04 | $18.37 | $16.46 |
| Investment Operations | | | | | |
| Net Investment Income | .107 | .072 | .121 | .125 | .080 |
| Net Realized and Unrealized Gain (Loss) | | | | | |
| on Investments | 5.111 | 4.944 | (8.126) | 1.669 | 1.910 |
| Total from Investment Operations | 5.218 | 5.016 | (8.005) | 1.794 | 1.990 |
| Distributions | | | | | |
| Dividends from Net Investment Income | (.108) | (.076) | (.125) | (.124) | (.080) |
| Distributions from Realized Capital Gains | — | — | — | — | — |
| Total Distributions | (.108) | (.076) | (.125) | (.124) | (.080) |
| Net Asset Value, End of Period | $21.96 | $16.85 | $11.91 | $20.04 | $18.37 |
| |
| Total Return | 30.96% | 42.13% | -39.91% | 9.78% | 12.09% |
| |
| Ratios/Supplemental Data | | | | | |
| Net Assets, End of Period (Millions) | $1,527 | $945 | $511 | $703 | $257 |
| Ratio of Total Expenses to | | | | | |
| Average Net Assets | 0.08% | 0.08% | 0.07% | 0.07% | 0.08% |
| Ratio of Net Investment Income to | | | | | |
| Average Net Assets | 0.61% | 0.53% | 0.76% | 0.67% | 0.45% |
| Portfolio Turnover Rate1 | 34% | 38% | 38% | 32% | 40% |
1 Excludes the value of portfolio securities received or delivered as a result of in-kind purchases or redemptions of the fund’s capital shares, including ETF Creation Units.
See accompanying Notes, which are an integral part of the Financial Statements.
41
Small-Cap Growth Index Fund
| | | | | |
| Financial Highlights | | | | | |
| |
| ETF Shares | | | | | |
| |
| For a Share Outstanding | | | Year Ended December 31, |
| Throughout Each Period | 2010 | 2009 | 2008 | 2007 | 2006 |
| Net Asset Value, Beginning of Period | $59.86 | $42.32 | $71.18 | $65.24 | $58.47 |
| Investment Operations | | | | | |
| Net Investment Income | .360 | .225 | .411 | .415 | .262 |
| Net Realized and Unrealized Gain (Loss) | | | | | |
| on Investments | 18.121 | 17.555 | (28.846) | 5.940 | 6.773 |
| Total from Investment Operations | 18.481 | 17.780 | (28.435) | 6.355 | 7.035 |
| Distributions | | | | | |
| Dividends from Net Investment Income | (.361) | (.240) | (.425) | (.415) | (.265) |
| Distributions from Realized Capital Gains | — | — | — | — | — |
| Total Distributions | (.361) | (.240) | (.425) | (.415) | (.265) |
| Net Asset Value, End of Period | $77.98 | $59.86 | $42.32 | $71.18 | $65.24 |
| |
| Total Return | 30.87% | 42.02% | -39.92% | 9.74% | 12.03% |
| |
| Ratios/Supplemental Data | | | | | |
| Net Assets, End of Period (Millions) | $1,842 | $1,177 | $680 | $858 | $518 |
| Ratio of Total Expenses to | | | | �� | |
| Average Net Assets | 0.12% | 0.14% | 0.11% | 0.11% | 0.12% |
| Ratio of Net Investment Income to | | | | | |
| Average Net Assets | 0.57% | 0.47% | 0.72% | 0.63% | 0.41% |
| Portfolio Turnover Rate1 | 34% | 38% | 38% | 32% | 40% |
1 Excludes the value of portfolio securities received or delivered as a result of in-kind purchases or redemptions of the fund’s capital shares, including ETF Creation Units.
See accompanying Notes, which are an integral part of the Financial Statements.
42
Small-Cap Growth Index Fund
Notes to Financial Statements
Vanguard Small-Cap Growth Index Fund is registered under the Investment Company Act of 1940 as an open-end investment company, or mutual fund. The fund offers three classes of shares: Investor Shares, Institutional Shares, and ETF Shares. Investor Shares are available to any investor who meets the fund’s minimum purchase requirements. Institutional Shares are designed for investors who meet certain administrative, service, and account-size criteria. ETF Shares are listed for trading on the NYSE Arca, Inc.; they can be purchased and sold through a broker.
A. The following significant accounting policies conform to generally accepted accounting principles for U.S. mutual funds. The fund consistently follows such policies in preparing its financial statements.
1. Security Valuation: Securities are valued as of the close of trading on the New York Stock Exchange (generally 4 p.m., Eastern time) on the valuation date. Equity securities are valued at the latest quoted sales prices or official closing prices taken from the primary market in which each security trades; such securities not traded on the valuation date are valued at the mean of the latest quoted bid and asked prices. Securities for which market quotations are not readily available, or whose values have been materially affected by events occurring before the fund’s pricing time but after the close of the securities’ primary markets, are valued by methods deemed by the board of trustees to represent fair value. Investments in Vanguard Market Liquidity Fund are valued at that fund’s net asset value. Temporary cash investments acquired over 60 days to maturity are valued using the latest bid prices or using valuations based on a matrix system (which considers such factors as security prices, yields, maturities, and ratings), both as furnished by independent pricing services. Other temporary cash investments are valued at amortized cost, which approximates market value.
2. Futures Contracts: The fund uses index futures contracts to a limited extent, with the objectives of maintaining full exposure to the stock market, enhancing returns, maintaining liquidity, and minimizing transaction costs. The fund may purchase futures contracts to immediately invest incoming cash in the market, or sell futures in response to cash outflows, thereby simulating a fully invested position in the underlying index while maintaining a cash balance for liquidity. The fund may seek to enhance returns by using futures contracts instead of the underlying securities when futures are believed to be priced more attractively than the underlying securities. The primary risks associated with the use of futures contracts are imperfect correlation between changes in market values of stocks held by the fund and the prices of futures contracts, and the possibility of an illiquid market.
Futures contracts are valued at their quoted daily settlement prices. The aggregate principal amounts of the contracts are not recorded in the Statement of Net Assets. Fluctuations in the value of the contracts are recorded in the Statement of Net Assets as an asset (liability) and in the Statement of Operations as unrealized appreciation (depreciation) until the contracts are closed, when they are recorded as realized futures gains (losses).
3. Federal Income Taxes: The fund intends to continue to qualify as a regulated investment company and distribute all of its taxable income. Management has analyzed the fund’s tax positions taken for all open federal income tax years (December 31, 2007–2010), and has concluded that no provision for federal income tax is required in the fund’s financial statements.
4. Distributions: Distributions to shareholders are recorded on the ex-dividend date.
43
Small-Cap Growth Index Fund
5. Security Lending: The fund may lend its securities to qualified institutional borrowers to earn additional income. Security loans are required to be secured at all times by collateral at least equal to the market value of securities loaned. The fund invests cash collateral received in Vanguard Market Liquidity Fund, and records a liability for the return of the collateral, during the period the securities are on loan. Security lending income represents fees charged to borrowers plus income earned on investing cash collateral, less expenses associated with the loan.
6. Other: Dividend income is recorded on the ex-dividend date. Interest income includes income distributions received from Vanguard Market Liquidity Fund and is accrued daily. Security transactions are accounted for on the date securities are bought or sold. Costs used to determine realized gains (losses) on the sale of investment securities are those of the specific securities sold.
Each class of shares has equal rights as to assets and earnings, except that each class separately bears certain class-specific expenses related to maintenance of shareholder accounts (included in Management and Administrative expenses) and shareholder reporting. Marketing and distribution expenses are allocated to each class of shares based on a method approved by the board of trustees. Income, other non-class-specific expenses, and gains and losses on investments are allocated to each class of shares based on its relative net assets.
B. The Vanguard Group furnishes at cost investment advisory, corporate management, administrative, marketing, and distribution services. The costs of such services are allocated to the fund under methods approved by the board of trustees. The fund has committed to provide up to 0.40% of its net assets in capital contributions to Vanguard. At December 31, 2010, the fund had contributed capital of $1,185,000 to Vanguard (included in Other Assets), representing 0.02% of the fund’s net assets and 0.47% of Vanguard’s capitalization. The fund’s trustees and officers are also directors and officers of Vanguard.
C. Various inputs may be used to determine the value of the fund’s investments. These inputs are summarized in three broad levels for financial statement purposes. The inputs or methodologies used to value securities are not necessarily an indication of the risk associated with investing in those securities.
Level 1—Quoted prices in active markets for identical securities.
Level 2—Other significant observable inputs (including quoted prices for similar securities, interest rates, prepayment speeds, credit risk, etc.).
Level 3—Significant unobservable inputs (including the fund’s own assumptions used to determine the fair value of investments).
The following table summarizes the fund’s investments as of December 31, 2010, based on the inputs
used to value them:
| | | |
| | Level 1 | Level 2 | Level 3 |
| Investments | ($000) | ($000) | ($000) |
| Common Stocks | 7,559,133 | ---- | ---- |
| Temporary Cash Investments | 215,745 | 3,199 | ---- |
| Futures Contracts—Liabilities1 | (258) | ---- | ---- |
| Total | 7,774,620 | 3,199 | ---- |
| 1 Represents variation margin on the last day of the reporting period. | | | |
44
Small-Cap Growth Index Fund
D. At December 31, 2010, the aggregate settlement value of open futures contracts and the related unrealized appreciation (depreciation) were:
| | | | |
| | | | | ($000) |
| | | | Aggregate | |
| | | Number of | Settlement | Unrealized |
| | | Long (Short) | Value | Appreciation |
| Futures Contracts | Expiration | Contracts | Long (Short) | (Depreciation) |
| E-mini Russell 2000 Index | March 2011 | 505 | 39,506 | 192 |
Unrealized appreciation (depreciation) on open futures contracts is required to be treated as realized gain (loss) for tax purposes.
E. Distributions are determined on a tax basis and may differ from net investment income and realized capital gains for financial reporting purposes. Differences may be permanent or temporary. Permanent differences are reclassified among capital accounts in the financial statements to reflect their tax character. Temporary differences arise when certain items of income, expense, gain, or loss are recognized in different periods for financial statement and tax purposes; these differences are primarily attributed to tax deferral of losses on wash sales and will reverse at some time in the future. Differences in classification may also result from the treatment of short-term gains as ordinary income for tax purposes.
During the year ended December 31, 2010, the fund realized $424,274,000 of net capital gains resulting from in-kind redemptions—in which shareholders exchanged fund shares for securities held by the fund rather than for cash. Because such gains are not taxable to the fund, and are not distributed to shareholders, they have been reclassified from accumulated net realized losses to paid-in capital.
For tax purposes, at December 31, 2010, the fund had $62,000 of ordinary income available for distribution. The fund had available capital loss carryforwards totaling $1,428,308,000 to offset future net capital gains of $13,814,000 through December 31, 2011, $15,893,000 through December 31, 2014, $12,561,000 through December 31, 2015, $302,440,000 through December 31, 2016, $822,482,000 through December 31, 2017, and $261,118,000 through December 31, 2018. In addition, the fund realized losses of $59,809,000 during the period from November 1, 2010, through December 31, 2010, which are deferred and will be treated as realized for tax purposes in fiscal 2011.
At December 31, 2010, the cost of investment securities for tax purposes was $6,019,301,000. Net unrealized appreciation of investment securities for tax purposes was $1,758,776,000, consisting of unrealized gains of $1,966,364,000 on securities that had risen in value since their purchase and $207,588,000 in unrealized losses on securities that had fallen in value since their purchase.
F. During the year ended December 31, 2010, the fund purchased $3,867,886,000 of investment securities and sold $3,046,573,000 of investment securities, other than temporary cash investments.
45
Small-Cap Growth Index Fund
G. Capital share transactions for each class of shares were:
| | | | |
| | | | Year Ended December 31, |
| | | 2010 | | 2009 |
| | Amount | Shares | Amount | Shares |
| | ($000) | (000) | ($000) | (000) |
| Investor Shares | | | | |
| Issued | 1,126,064 | 59,493 | 817,190 | 59,537 |
| Issued in Lieu of Cash Distributions | 13,472 | 611 | 8,181 | 494 |
| Redeemed | (838,735) | (46,469) | (502,400) | (37,919) |
| Net Increase (Decrease)—Investor Shares | 300,801 | 13,635 | 322,971 | 22,112 |
| Institutional Shares | | | | |
| Issued | 454,233 | 24,423 | 357,212 | 27,809 |
| Issued in Lieu of Cash Distributions | 7,155 | 324 | 3,909 | 235 |
| Redeemed | (209,206) | (11,241) | (183,610) | (14,896) |
| Net Increase (Decrease)—Institutional Shares | 252,182 | 13,506 | 177,511 | 13,148 |
| ETF Shares | | | | |
| Issued | 1,352,428 | 20,055 | 839,418 | 17,004 |
| Issued in Lieu of Cash Distributions | — | — | — | — |
| Redeemed | (1,059,629) | (16,100) | (688,117) | (13,400) |
| Net Increase (Decrease)—ETF Shares | 292,799 | 3,955 | 151,301 | 3,604 |
H. In preparing the financial statements as of December 31, 2010, management considered the impact of subsequent events for potential recognition or disclosure in these financial statements.
46
Small-Cap Value Index Fund
Fund Profile
As of December 31, 2010
| | | |
| Share-Class Characteristics | |
| |
| | Investor | Institutional | ETF |
| | Shares | Shares | Shares |
| Ticker Symbol | VISVX | VSIIX | VBR |
| Expense Ratio1 | 0.28% | 0.08% | 0.14% |
| 30-Day SEC Yield | 1.76% | 1.94% | 1.90% |
| | | |
| Portfolio Characteristics | | |
| | | MSCI US | DJ |
| | | Small Cap | U.S. Total |
| | | Value | Market |
| | Fund | Index | Index |
| Number of Stocks | 988 | 985 | 3,893 |
| Median Market Cap | $1.6B | $1.6B | $29.6B |
| Price/Earnings Ratio | 22.2x | 22.5x | 18.3x |
| Price/Book Ratio | 1.5x | 1.5x | 2.2x |
| Return on Equity | 8.8% | 8.8% | 18.8% |
| Earnings Growth Rate | -0.1% | 0.4% | 6.2% |
| Dividend Yield | 2.0% | 2.0% | 1.7% |
| Foreign Holdings | 0.0% | 0.0% | 0.0% |
| Turnover Rate | 25% | — | — |
| Short-Term Reserves | 0.1% | — | — |
| | | |
| Sector Diversification (% of equity exposure) |
| | | MSCI US | DJ |
| | | Small Cap | U.S. Total |
| | | Value | Market |
| | Fund | Index | Index |
| Consumer | | | |
| Discretionary | 11.2% | 11.2% | 11.9% |
| Consumer Staples | 3.8 | 3.8 | 9.5 |
| Energy | 4.9 | 4.9 | 10.6 |
| Financials | 35.0 | 35.0 | 16.6 |
| Health Care | 5.7 | 5.7 | 10.7 |
| Industrials | 14.8 | 14.8 | 11.4 |
| Information | | | |
| Technology | 9.9 | 9.9 | 18.9 |
| Materials | 7.5 | 7.5 | 4.5 |
| Telecommunication | | | |
| Services | 0.6 | 0.6 | 2.7 |
| Utilities | 6.6 | 6.6 | 3.2 |
| | |
| Volatility Measures | | |
| | MSCI US | DJ |
| | Small Cap | U.S. Total |
| | Value | Market |
| | Index | Index |
| R-Squared | 1.00 | 0.91 |
| Beta | 1.00 | 1.23 |
These measures show the degree and timing of the fund’s fluctuations compared with the indexes over 36 months.
| | |
| Ten Largest Holdings (% of total net assets) |
| Del Monte Foods Co. | Packaged Foods & | |
| | Meats | 0.5% |
| Camden Property Trust | Residential REITs | 0.5 |
| BE Aerospace Inc. | Aerospace & | |
| | Defense | 0.5 |
| Williams-Sonoma Inc. | Home Furnishing | |
| | Retail | 0.4 |
| Essex Property Trust Inc. | Residential REITs | 0.4 |
| Corn Products | Agricultural | |
| International Inc. | Products | 0.4 |
| Ares Capital Corp. | Asset Management | |
| | & Custody Banks | 0.4 |
| Snap-On Inc. | Industrial | |
| | Machinery | 0.4 |
| Domtar Corp. | Paper Products | 0.4 |
| Kennametal Inc. | Industrial | |
| | Machinery | 0.4 |
| Top Ten | | 4.3% |
The holdings listed exclude any temporary cash investments and equity index products.
Investment Focus
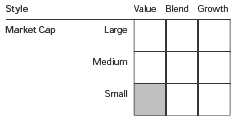
1 The expense ratios shown are from the prospectus dated December 13, 2010, for the Institutional Shares and April 29, 2010, for the Investor and ETF Shares, and represent estimated costs for the current fiscal year. For the fiscal year ended December 31, 2010, the expense ratios were 0.26% for Investor Shares, 0.08% for Institutional Shares, and 0.12% for ETF Shares.
47
Small-Cap Value Index Fund
Performance Summary
All of the returns in this report represent past performance, which is not a guarantee of future results that may be achieved by the fund. (Current performance may be lower or higher than the performance data cited. For performance data current to the most recent month-end, visit our website at vanguard.com/performance.) Note, too, that both investment returns and principal value can fluctuate widely, so an investor’s shares, when sold, could be worth more or less than their original cost. The returns shown do not reflect taxes that a shareholder would pay on fund distributions or on the sale of fund shares.
Cumulative Performance: December 31, 2000, Through December 31, 2010
Initial Investment of $10,000
| | | | | |
| | | Average Annual Total Returns | |
| | | Periods Ended December 31, 2010 | |
| | | | | | Final Value |
| | | One | Five | Ten | of a $10,000 |
| | | Year | Years | Years | Investment |
| | Small-Cap Value Index Fund Investor | | | | |
| | Shares | 24.82% | 4.14% | 7.95% | $21,484 |
| •••••••• | Dow Jones U.S. Total Stock Market | | | | |
| | Index | 17.70 | 3.17 | 2.64 | 12,981 |
| – – – – | Spliced Small-Cap Value Index | 25.01 | 4.21 | 7.80 | 21,190 |
| | Small-Cap Value Funds Average | 25.96 | 3.79 | 8.48 | 22,572 |
| Spliced Small-Cap Value Index: S&P SmallCap 600/Barra Value Index through May 16, 2003; MSCI US Small Cap Value Index thereafter. |
| Small-Cap Value Funds Average: Derived from data provided by Lipper Inc. | | | |
| | | | |
| | | | | Final Value |
| | One | Five | Ten | of a $5,000,000 |
| | Year | Years | Years | Investment |
| Small-Cap Value Index Fund Institutional | | | | |
| Shares | 24.97% | 4.31% | 8.12% | $10,919,500 |
| Dow Jones U.S. Total Stock Market | | | | |
| Index | 17.70 | 3.17 | 2.64 | 6,490,386 |
| Spliced Small-Cap Value Index | 25.01 | 4.21 | 7.80 | 10,595,155 |
See Financial Highlights for dividend and capital gains information.
48
Small-Cap Value Index Fund
| | | | |
| | Average Annual Total Returns | |
| | Periods Ended December 31, 2010 | |
| | | | Since | Final Value |
| | One | Five | Inception | of a $10,000 |
| | Year | Years | (1/26/2004) | Investment |
| Small-Cap Value Index Fund | | | | |
| ETF Shares Net Asset Value | 24.97% | 4.27% | 6.39% | $15,356 |
| Dow Jones U.S. Total Stock Market Index | 17.70 | 3.17 | 4.30 | 13,390 |
| MSCI US Small Cap Value Index | 25.01 | 4.21 | 6.37 | 15,342 |
| "Since Inception" performance is calculated from the ETF Shares’ inception date for both the fund and its comparative standards. |
| | | |
| Cumulative Returns of ETF Shares: January 26, 2004, Through December 31, 2010 | |
| | | | Since |
| | One | Five | Inception |
| | Year | Years | (1/26/2004) |
| Small-Cap Value Index Fund | | | |
| ETF Shares Market Price | 25.13% | 23.46% | 53.70% |
| Small-Cap Value Index Fund | | | |
| ETF Shares Net Asset Value | 24.97 | 23.23 | 53.56 |
| MSCI US Small Cap Value Index | 25.01 | 22.91 | 53.42 |
| "Since Inception" performance is calculated from the ETF Shares’ inception date for both the fund and its comparative standard. | |
Fiscal-Year Total Returns (%): December 31, 2000, Through December 31, 2010
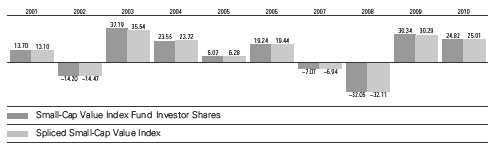
49
Small-Cap Value Index Fund
Financial Statements
Statement of Net Assets—Investments Summary
As of December 31, 2010
This Statement summarizes the fund’s holdings by asset type. Details are reported for each of the fund’s 50 largest individual holdings and for investments that, in total for any issuer, represent more than 1% of the fund’s net assets. The total value of smaller holdings is reported as a single amount within each category.
The fund reports a complete list of its holdings in regulatory filings four times in each fiscal year, at the quarter-ends. For the second and fourth fiscal quarters, the complete listing of the fund’s holdings is available electronically on vanguard.com and on the Securities and Exchange Commission’s website (sec.gov), or you can have it mailed to you without charge by calling 800-662-7447. For the first and third fiscal quarters, the fund files the lists with the SEC on Form N-Q. Shareholders can look up the fund’s Forms N-Q on the SEC’s website. Forms N-Q may also be reviewed and copied at the SEC’s Public Reference Room (see the back cover of this report for further information).
| | | |
| | | Market | Percentage |
| | | Value | of Net |
| | Shares | ($000) | Assets |
| Common Stocks | | | |
| Consumer Discretionary | | | |
| Williams-Sonoma Inc. | 862,459 | 30,781 | 0.4% |
| Tupperware Brands Corp. | 559,079 | 26,651 | 0.4% |
| Jarden Corp. | 811,672 | 25,056 | 0.3% |
| RadioShack Corp. | 1,111,200 | 20,546 | 0.3% |
| Consumer Discretionary—Other † | | 682,290 | 9.7% |
| | | 785,324 | 11.1% |
| Consumer Staples | | | |
| Del Monte Foods Co. | 1,723,847 | 32,408 | 0.5% |
| Corn Products International Inc. | 666,784 | 30,672 | 0.4% |
| Consumer Staples—Other † | | 203,849 | 2.9% |
| | | 266,929 | 3.8% |
| |
| Energy † | | 342,079 | 4.9% |
| |
| Financials | | | |
| Camden Property Trust | 593,366 | 32,030 | 0.5% |
| Essex Property Trust Inc. | 268,714 | 30,693 | 0.4% |
| Ares Capital Corp. | 1,794,740 | 29,577 | 0.4% |
| * Popular Inc. | 9,061,279 | 28,452 | 0.4% |
| Senior Housing Properties Trust | 1,240,274 | 27,212 | 0.4% |
| Arthur J Gallagher & Co. | 932,068 | 27,105 | 0.4% |
| Waddell & Reed Financial Inc. Class A | 757,123 | 26,719 | 0.4% |
| Developers Diversified Realty Corp. | 1,883,780 | 26,542 | 0.4% |
| First Niagara Financial Group Inc. | 1,852,343 | 25,896 | 0.4% |
| BRE Properties Inc. | 567,341 | 24,679 | 0.3% |
| Mack-Cali Realty Corp. | 703,612 | 23,261 | 0.3% |
| * American Capital Ltd. | 3,043,932 | 23,012 | 0.3% |
| Allied World Assurance Co. Holdings Ltd. | 368,207 | 21,886 | 0.3% |
| BioMed Realty Trust Inc. | 1,139,433 | 21,250 | 0.3% |
50
Small-Cap Value Index Fund
| | | |
| | | Market | Percentage |
| | | Value | of Net |
| | Shares | ($000) | Assets |
| Corporate Office Properties Trust | 584,166 | 20,417 | 0.3% |
| CBL & Associates Properties Inc. | 1,162,556 | 20,345 | 0.3% |
| MFA Financial Inc. | 2,489,514 | 20,314 | 0.3% |
| Financials—Other † | | 2,038,335 | 29.0% |
| | | 2,467,725 | 35.1% |
| Health Care | | | |
| * Mednax Inc. | 422,106 | 28,404 | 0.4% |
| PerkinElmer Inc. | 1,044,753 | 26,976 | 0.4% |
| * Health Net Inc. | 863,382 | 23,562 | 0.3% |
| Cooper Cos. Inc. | 412,690 | 23,251 | 0.3% |
| * Health Management Associates Inc. Class A | 2,221,002 | 21,188 | 0.3% |
| Health Care—Other † | | 278,924 | 4.0% |
| | | 402,305 | 5.7% |
| Industrials | | | |
| * BE Aerospace Inc. | 860,953 | 31,881 | 0.5% |
| Snap-On Inc. | 514,727 | 29,123 | 0.4% |
| Kennametal Inc. | 726,069 | 28,651 | 0.4% |
| Hubbell Inc. Class B | 467,741 | 28,125 | 0.4% |
| Lincoln Electric Holdings Inc. | 376,055 | 24,545 | 0.4% |
| Regal-Beloit Corp. | 341,702 | 22,812 | 0.3% |
| Carlisle Cos. Inc. | 540,342 | 21,473 | 0.3% |
| Industrials—Other † | | 854,494 | 12.1% |
| | | 1,041,104 | 14.8% |
| Information Technology | | | |
| * Vishay Intertechnology Inc. | 1,526,834 | 22,414 | 0.3% |
| * NCR Corp. | 1,422,417 | 21,862 | 0.3% |
| Information Technology—Other † | | 649,005 | 9.2% |
| | | 693,281 | 9.8% |
| Materials | | | |
| Domtar Corp. | 379,685 | 28,826 | 0.4% |
| Aptargroup Inc. | 597,694 | 28,432 | 0.4% |
| Huntsman Corp. | 1,695,255 | 26,463 | 0.4% |
| Compass Minerals International Inc. | 290,226 | 25,908 | 0.4% |
| RPM International Inc. | 1,151,978 | 25,459 | 0.4% |
| Packaging Corp. of America | 918,256 | 23,728 | 0.3% |
| Cytec Industries Inc. | 434,615 | 23,061 | 0.3% |
| * Coeur d’Alene Mines Corp. | 791,358 | 21,620 | 0.3% |
| Cabot Corp. | 550,088 | 20,711 | 0.3% |
| Materials—Other † | | 301,699 | 4.3% |
| | | 525,907 | 7.5% |
| |
| Telecommunication Services † | | 43,133 | 0.6% |
| |
| Utilities | | | |
| Questar Corp. | 1,555,576 | 27,083 | 0.4% |
| Westar Energy Inc. | 1,048,446 | 26,379 | 0.4% |
| Atmos Energy Corp. | 798,912 | 24,926 | 0.3% |
| Great Plains Energy Inc. | 1,201,348 | 23,294 | 0.3% |
| Utilities—Other † | | 363,938 | 5.2% |
| | | 465,620 | 6.6% |
| Total Common Stocks (Cost $5,847,589) | | 7,033,407 | 99.9%1 |
51
Small-Cap Value Index Fund
| | | | |
| | | | Market | Percentage |
| | | | Value | of Net |
| | Coupon | Shares | ($000) | Assets |
| Temporary Cash Investments | | | | |
| Money Market Fund | | | | |
| 2,3 Vanguard Market Liquidity Fund | 0.211% | 49,468,392 | 49,468 | 0.7% |
| |
| 4U.S. Government and Agency Obligations † | | | 2,799 | 0.1% |
| Total Temporary Cash Investments (Cost $52,267) | | | 52,267 | 0.8%1 |
| 5Total Investments (Cost $5,899,856) | | | 7,085,674 | 100.7% |
| Other Assets and Liabilities | | | | |
| Other Assets | | | 24,760 | 0.3% |
| Liabilities3 | | | (71,879) | (1.0%) |
| | | | (47,119) | (0.7%) |
| Net Assets | | | 7,038,555 | 100.0% |
52
Small-Cap Value Index Fund
| |
| At December 31, 2010, net assets consisted of: | |
| | Amount |
| | ($000) |
| Paid-in Capital | 7,623,267 |
| Overdistributed Net Investment Income | (10,132) |
| Accumulated Net Realized Losses | (1,760,361) |
| Unrealized Appreciation (Depreciation) | |
| Investment Securities | 1,185,818 |
| Futures Contracts | (37) |
| Net Assets | 7,038,555 |
| |
| Investor Shares—Net Assets | |
| Applicable to 269,610,405 outstanding $.001 par value shares of | |
| beneficial interest (unlimited authorization) | 4,315,881 |
| Net Asset Value Per Share—Investor Shares | $16.01 |
| |
| Institutional Shares—Net Assets | |
| Applicable to 54,322,573 outstanding $.001 par value shares of | |
| beneficial interest (unlimited authorization) | 871,440 |
| Net Asset Value Per Share—Institutional Shares | $16.04 |
| |
| ETF Shares—Net Assets | |
| Applicable to 27,713,816 outstanding $.001 par value shares of | |
| beneficial interest (unlimited authorization) | 1,851,234 |
| Net Asset Value Per Share—ETF Shares | $66.80 |
See Note A in Notes to Financial Statements.
* Non-income-producing security.
† Represents the aggregate value, by category, of securities that are not among the 50 largest holdings and, in total for any issuer, represent 1% or less of net assets.
1 The fund invests a portion of its cash reserves in equity markets through the use of index futures contracts. After giving effect to futures investments, the fund’s effective common stock and temporary cash investment positions represent 100.1% and 0.6%, respectively, of net assets.
2 Affiliated money market fund available only to Vanguard funds and certain trusts and accounts managed by Vanguard. Rate shown is the 7-day yield.
3 Includes $35,474,000 of collateral received for securities on loan.
4 Securities with a value of $1,299,000 have been segregated as initial margin for open futures contracts.
5 The total value of securities on loan is $32,526,000.
See accompanying Notes, which are an integral part of the Financial Statements.
53
Small-Cap Value Index Fund
| |
| Statement of Operations | |
| |
| | Year Ended |
| | December 31, 2010 |
| | ($000) |
| Investment Income | |
| Income | |
| Dividends | 135,632 |
| Interest1 | 34 |
| Security Lending | 2,680 |
| Total Income | 138,346 |
| Expenses | |
| The Vanguard Group—Note B | |
| Investment Advisory Services | 373 |
| Management and Administrative—Investor Shares | 8,250 |
| Management and Administrative—Institutional Shares | 261 |
| Management and Administrative—ETF Shares | 1,153 |
| Marketing and Distribution—Investor Shares | 957 |
| Marketing and Distribution—Institutional Shares | 189 |
| Marketing and Distribution—ETF Shares | 446 |
| Custodian Fees | 268 |
| Auditing Fees | 33 |
| Shareholders’ Reports—Investor Shares | 92 |
| Shareholders’ Reports—Institutional Shares | 31 |
| Shareholders’ Reports—ETF Shares | 134 |
| Trustees’ Fees and Expenses | 10 |
| Total Expenses | 12,197 |
| Net Investment Income | 126,149 |
| Realized Net Gain (Loss) | |
| Investment Securities Sold | 113,225 |
| Futures Contracts | (175) |
| Realized Net Gain (Loss) | 113,050 |
| Change in Unrealized Appreciation (Depreciation) | |
| Investment Securities | 1,097,182 |
| Futures Contracts | 85 |
| Change in Unrealized Appreciation (Depreciation) | 1,097,267 |
| Net Increase (Decrease) in Net Assets Resulting from Operations | 1,336,466 |
| 1 Interest income from an affiliated company of the fund was $29,000. | |
See accompanying Notes, which are an integral part of the Financial Statements.
54
Small-Cap Value Index Fund
| | |
| Statement of Changes in Net Assets | | |
| |
| | Year Ended December 31, |
| | 2010 | 2009 |
| | ($000) | ($000) |
| Increase (Decrease) in Net Assets | | |
| Operations | | |
| Net Investment Income | 126,149 | 95,323 |
| Realized Net Gain (Loss) | 113,050 | (377,566) |
| Change in Unrealized Appreciation (Depreciation) | 1,097,267 | 1,468,397 |
| Net Increase (Decrease) in Net Assets Resulting from Operations | 1,336,466 | 1,186,154 |
| Distributions | | |
| Net Investment Income | | |
| Investor Shares | (77,203) | (60,460) |
| Institutional Shares | (16,898) | (10,732) |
| ETF Shares | (35,797) | (25,772) |
| Realized Capital Gain | | |
| Investor Shares | — | — |
| Institutional Shares | — | — |
| ETF Shares | — | — |
| Total Distributions | (129,898) | (96,964) |
| Capital Share Transactions | | |
| Investor Shares | 286,817 | 154,755 |
| Institutional Shares | 178,789 | 49,011 |
| ETF Shares | 233,708 | 127,785 |
| Net Increase (Decrease) from Capital Share Transactions | 699,314 | 331,551 |
| Total Increase (Decrease) | 1,905,882 | 1,420,741 |
| Net Assets | | |
| Beginning of Period | 5,132,673 | 3,711,932 |
| End of Period1 | 7,038,555 | 5,132,673 |
| 1 Net Assets—End of Period includes undistributed (overdistributed) net investment income of ($10,132,000) and ($6,383,000). | |
See accompanying Notes, which are an integral part of the Financial Statements.
55
Small-Cap Value Index Fund
| | | | | |
| Financial Highlights | | | | | |
| |
| Investor Shares | | | | | |
| |
| For a Share Outstanding | | | Year Ended December 31, |
| Throughout Each Period | 2010 | 2009 | 2008 | 2007 | 2006 |
| Net Asset Value, Beginning of Period | $13.06 | $10.21 | $15.49 | $17.05 | $14.56 |
| Investment Operations | | | | | |
| Net Investment Income | .285 | .241 | .293 | .344 | .311 |
| Net Realized and Unrealized Gain (Loss) | | | | | |
| on Investments | 2.956 | 2.854 | (5.277) | (1.551) | 2.488 |
| Total from Investment Operations | 3.241 | 3.095 | (4.984) | (1.207) | 2.799 |
| Distributions | | | | | |
| Dividends from Net Investment Income | (.291) | (.245) | (.296) | (.353) | (.309) |
| Distributions from Realized Capital Gains | — | — | — | — | — |
| Total Distributions | (.291) | (.245) | (.296) | (.353) | (.309) |
| Net Asset Value, End of Period | $16.01 | $13.06 | $10.21 | $15.49 | $17.05 |
| |
| Total Return1 | 24.82% | 30.34% | -32.05% | -7.07% | 19.24% |
| |
| Ratios/Supplemental Data | | | | | |
| Net Assets, End of Period (Millions) | $4,316 | $3,279 | $2,435 | $3,678 | $4,314 |
| Ratio of Total Expenses to | | | | | |
| Average Net Assets | 0.26% | 0.28% | 0.23% | 0.22% | 0.23% |
| Ratio of Net Investment Income to | | | | | |
| Average Net Assets | 2.03% | 2.26% | 2.33% | 1.95% | 2.06% |
| Portfolio Turnover Rate2 | 25% | 33% | 30% | 34% | 25% |
1 Total returns do not include account service fees that may have applied in the periods shown. Fund prospectuses provide information about any applicable account service fees.
2 Excludes the value of portfolio securities received or delivered as a result of in-kind purchases or redemptions of the fund’s capital shares, including ETF Creation Units.
See accompanying Notes, which are an integral part of the Financial Statements.
56
Small-Cap Value Index Fund
| | | | | |
| Financial Highlights | | | | | |
| |
| Institutional Shares | | | | | |
| |
| For a Share Outstanding | | | Year Ended December 31, |
| Throughout Each Period | 2010 | 2009 | 2008 | 2007 | 2006 |
| Net Asset Value, Beginning of Period | $13.09 | $10.22 | $15.53 | $17.09 | $14.59 |
| Investment Operations | | | | | |
| Net Investment Income | .311 | .262 | .315 | .372 | .345 |
| Net Realized and Unrealized Gain (Loss) | | | | | |
| on Investments | 2.957 | 2.874 | (5.307) | (1.551) | 2.488 |
| Total from Investment Operations | 3.268 | 3.136 | (4.992) | (1.179) | 2.833 |
| Distributions | | | | | |
| Dividends from Net Investment Income | (.318) | (.266) | (.318) | (.381) | (.333) |
| Distributions from Realized Capital Gains | — | — | — | — | — |
| Total Distributions | (.318) | (.266) | (.318) | (.381) | (.333) |
| Net Asset Value, End of Period | $16.04 | $13.09 | $10.22 | $15.53 | $17.09 |
| |
| Total Return | 24.97% | 30.71% | -32.02% | -6.89% | 19.44% |
| |
| Ratios/Supplemental Data | | | | | |
| Net Assets, End of Period (Millions) | $871 | $543 | $383 | $430 | $310 |
| Ratio of Total Expenses to | | | | | |
| Average Net Assets | 0.08% | 0.08% | 0.07% | 0.07% | 0.08% |
| Ratio of Net Investment Income to | | | | | |
| Average Net Assets | 2.21% | 2.46% | 2.49% | 2.10% | 2.21% |
| Portfolio Turnover Rate1 | 25% | 33% | 30% | 34% | 25% |
1 Excludes the value of portfolio securities received or delivered as a result of in-kind purchases or redemptions of the fund’s capital shares, including ETF Creation Units.
See accompanying Notes, which are an integral part of the Financial Statements.
57
Small-Cap Value Index Fund
| | | | | |
| Financial Highlights | | | | | |
| |
| ETF Shares | | | | | |
| |
| For a Share Outstanding | | | Year Ended December 31, |
| Throughout Each Period | 2010 | 2009 | 2008 | 2007 | 2006 |
| Net Asset Value, Beginning of Period | $54.49 | $42.58 | $64.65 | $71.16 | $60.76 |
| Investment Operations | | | | | |
| Net Investment Income | 1.269 | 1.071 | 1.296 | 1.531 | 1.380 |
| Net Realized and Unrealized Gain (Loss) | | | | | |
| on Investments | 12.340 | 11.923 | (22.053) | (6.474) | 10.391 |
| Total from Investment Operations | 13.609 | 12.994 | (20.757) | (4.943) | 11.771 |
| Distributions | | | | | |
| Dividends from Net Investment Income | (1.299) | (1.084) | (1.313) | (1.567) | (1.371) |
| Distributions from Realized Capital Gains | — | — | — | — | — |
| Total Distributions | (1.299) | (1.084) | (1.313) | (1.567) | (1.371) |
| Net Asset Value, End of Period | $66.80 | $54.49 | $42.58 | $64.65 | $71.16 |
| |
| Total Return | 24.97% | 30.52% | -31.99% | -6.96% | 19.40% |
| |
| Ratios/Supplemental Data | | | | | |
| Net Assets, End of Period (Millions) | $1,851 | $1,310 | $894 | $819 | $510 |
| Ratio of Total Expenses to | | | | | |
| Average Net Assets | 0.12% | 0.14% | 0.11% | 0.11% | 0.12% |
| Ratio of Net Investment Income to | | | | | |
| Average Net Assets | 2.17% | 2.40% | 2.45% | 2.06% | 2.17% |
| Portfolio Turnover Rate1 | 25% | 33% | 30% | 34% | 25% |
1 Excludes the value of portfolio securities received or delivered as a result of in-kind purchases or redemptions of the fund’s capital shares, including ETF Creation Units.
See accompanying Notes, which are an integral part of the Financial Statements.
58
Small-Cap Value Index Fund
Notes to Financial Statements
Vanguard Small-Cap Value Index Fund is registered under the Investment Company Act of 1940 as an open-end investment company, or mutual fund. The fund offers three classes of shares: Investor Shares, Institutional Shares, and ETF Shares. Investor Shares are available to any investor who meets the fund’s minimum purchase requirements. Institutional Shares are designed for investors who meet certain administrative, service, and account-size criteria. ETF Shares are listed for trading on the NYSE Arca, Inc.; they can be purchased and sold through a broker.
A. The following significant accounting policies conform to generally accepted accounting principles for U.S. mutual funds. The fund consistently follows such policies in preparing its financial statements.
1. Security Valuation: Securities are valued as of the close of trading on the New York Stock Exchange (generally 4 p.m., Eastern time) on the valuation date. Equity securities are valued at the latest quoted sales prices or official closing prices taken from the primary market in which each security trades; such securities not traded on the valuation date are valued at the mean of the latest quoted bid and asked prices. Securities for which market quotations are not readily available, or whose values have been materially affected by events occurring before the fund’s pricing time but after the close of the securities’ primary markets, are valued by methods deemed by the board of trustees to represent fair value. Investments in Vanguard Market Liquidity Fund are valued at that fund’s net asset value. Temporary cash investments acquired over 60 days to maturity are valued using the latest bid prices or using valuations based on a matrix system (which considers such factors as security prices, yields, maturities, and ratings), both as furnished by independent pricing services. Other temporary cash investments are valued at amortized cost, which approximates market value.
2. Futures Contracts: The fund uses index futures contracts to a limited extent, with the objectives of maintaining full exposure to the stock market, enhancing returns, maintaining liquidity, and minimizing transaction costs. The fund may purchase futures contracts to immediately invest incoming cash in the market, or sell futures in response to cash outflows, thereby simulating a fully invested position in the underlying index while maintaining a cash balance for liquidity. The fund may seek to enhance returns by using futures contracts instead of the underlying securities when futures are believed to be priced more attractively than the underlying securities. The primary risks associated with the use of futures contracts are imperfect correlation between changes in market values of stocks held by the fund and the prices of futures contracts, and the possibility of an illiquid market.
Futures contracts are valued at their quoted daily settlement prices. The aggregate principal amounts of the contracts are not recorded in the Statement of Net Assets. Fluctuations in the value of the contracts are recorded in the Statement of Net Assets as an asset (liability) and in the Statement of Operations as unrealized appreciation (depreciation) until the contracts are closed, when they are recorded as realized futures gains (losses).
3. Federal Income Taxes: The fund intends to continue to qualify as a regulated investment company and distribute all of its taxable income. Management has analyzed the fund’s tax positions taken for all open federal income tax years (December 31, 2007–2010), and has concluded that no provision for federal income tax is required in the fund’s financial statements.
4. Distributions: Distributions to shareholders are recorded on the ex-dividend date.
59
Small-Cap Value Index Fund
5. Security Lending: The fund may lend its securities to qualified institutional borrowers to earn additional income. Security loans are required to be secured at all times by collateral at least equal to the market value of securities loaned. The fund invests cash collateral received in Vanguard Market Liquidity Fund, and records a liability for the return of the collateral, during the period the securities are on loan. Security lending income represents fees charged to borrowers plus income earned on investing cash collateral, less expenses associated with the loan.
6. Other: Dividend income is recorded on the ex-dividend date. Interest income includes income distributions received from Vanguard Market Liquidity Fund and is accrued daily. Security transactions are accounted for on the date securities are bought or sold. Costs used to determine realized gains (losses) on the sale of investment securities are those of the specific securities sold.
Each class of shares has equal rights as to assets and earnings, except that each class separately bears certain class-specific expenses related to maintenance of shareholder accounts (included in Management and Administrative expenses) and shareholder reporting. Marketing and distribution expenses are allocated to each class of shares based on a method approved by the board of trustees. Income, other non-class-specific expenses, and gains and losses on investments are allocated to each class of shares based on its relative net assets.
B. The Vanguard Group furnishes at cost investment advisory, corporate management, administrative, marketing, and distribution services. The costs of such services are allocated to the fund under methods approved by the board of trustees. The fund has committed to provide up to 0.40% of its net assets in capital contributions to Vanguard. At December 31, 2010, the fund had contributed capital of $1,155,000 to Vanguard (included in Other Assets), representing 0.02% of the fund’s net assets and 0.46% of Vanguard’s capitalization. The fund’s trustees and officers are also directors and officers of Vanguard.
C. Various inputs may be used to determine the value of the fund’s investments. These inputs are summarized in three broad levels for financial statement purposes. The inputs or methodologies used to value securities are not necessarily an indication of the risk associated with investing in those securities.
Level 1—Quoted prices in active markets for identical securities.
Level 2—Other significant observable inputs (including quoted prices for similar securities, interest rates, prepayment speeds, credit risk, etc.).
Level 3—Significant unobservable inputs (including the fund’s own assumptions used to determine the fair value of investments).
The following table summarizes the fund’s investments as of December 31, 2010, based on the inputs used to value them:
| | | |
| | Level 1 | Level 2 | Level 3 |
| Investments | ($000) | ($000) | ($000) |
| Common Stocks | 7,033,407 | — | — |
| Temporary Cash Investments | 49,468 | 2,799 | — |
| Futures Contracts—Assets1 | 43 | — | — |
| Futures Contracts—Liabilities1 | (128) | — | — |
| Total | 7,082,790 | 2,799 | — |
| 1 Represents variation margin on the last day of the reporting period. | | | |
60
Small-Cap Value Index Fund
D. At December 31, 2010, the aggregate settlement value of open futures contracts and the related unrealized appreciation (depreciation) were:
| | | | |
| | | | | ($000) |
| | | | Aggregate | |
| | | Number of | Settlement | Unrealized |
| | | Long (Short) | Value | Appreciation |
| Futures Contracts | Expiration | Contracts | Long (Short) | (Depreciation) |
| E-mini Russell 2000 Index | March 2011 | 132 | 10,326 | (37) |
Unrealized appreciation (depreciation) on open futures contracts is required to be treated as realized gain (loss) for tax purposes.
E. Distributions are determined on a tax basis and may differ from net investment income and realized capital gains for financial reporting purposes. Differences may be permanent or temporary. Permanent differences are reclassified among capital accounts in the financial statements to reflect their tax character. Temporary differences arise when certain items of income, expense, gain, or loss are recognized in different periods for financial statement and tax purposes; these differences will reverse at some time in the future. Differences in classification may also result from the treatment of short-term gains as ordinary income for tax purposes.
During the year ended December 31, 2010, the fund realized $349,443,000 of net capital gains resulting from in-kind redemptions—in which shareholders exchanged fund shares for securities held by the fund rather than for cash. Because such gains are not taxable to the fund, and are not distributed to shareholders, they have been reclassified from accumulated net realized losses to paid-in capital.
For tax purposes, at December 31, 2010, the fund had $317,000 of ordinary income available for distribution. The fund had available capital loss carryforwards totaling $1,638,969,000 to offset future net capital gains of $67,032,000 through December 31, 2011, $86,085,000 through December 31, 2015, $318,931,000 through December 31, 2016, $778,148,000 through December 31, 2017, and $388,773,000 through December 31, 2018. In addition, the fund realized losses of $105,048,000 during the period from November 1, 2010, through December 31, 2010, which are deferred and will be treated as realized for tax purposes in fiscal 2011.
At December 31, 2010, the cost of investment securities for tax purposes was $5,915,195,000. Net unrealized appreciation of investment securities for tax purposes was $1,170,479,000, consisting of unrealized gains of $1,415,456,000 on securities that had risen in value since their purchase and $244,977,000 in unrealized losses on securities that had fallen in value since their purchase.
F. During the year ended December 31, 2010, the fund purchased $3,219,592,000 of investment securities and sold $2,509,345,000 of investment securities, other than temporary cash investments.
61
Small-Cap Value Index Fund
| G. | Capital share transactions for each class of shares were: |
| | | | |
| | | | Year Ended December 31, |
| | | 2010 | | 2009 |
| | Amount | Shares | Amount | Shares |
| | ($000) | (000) | ($000) | (000) |
| Investor Shares | | | | |
| Issued | 1,084,315 | 75,426 | 676,646 | 63,651 |
| Issued in Lieu of Cash Distributions | 71,353 | 4,458 | 55,690 | 4,297 |
| Redeemed | (868,851) | (61,333) | (577,581) | (55,367) |
| Net Increase (Decrease)—Investor Shares | 286,817 | 18,551 | 154,755 | 12,581 |
| Institutional Shares | | | | |
| Issued | 361,078 | 25,363 | 190,927 | 17,053 |
| Issued in Lieu of Cash Distributions | 15,127 | 943 | 9,248 | 713 |
| Redeemed | (197,416) | (13,503) | (151,164) | (13,695) |
| Net Increase (Decrease)—Institutional Shares | 178,789 | 12,803 | 49,011 | 4,071 |
| ETF Shares | | | | |
| Issued | 1,281,986 | 21,271 | 874,144 | 18,135 |
| Issued in Lieu of Cash Distributions | — | — | — | — |
| Redeemed | (1,048,278) | (17,600) | (746,359) | (15,100) |
| Net Increase (Decrease)—ETF Shares | 233,708 | 3,671 | 127,785 | 3,035 |
H. In preparing the financial statements as of December 31, 2010, management considered the impact of subsequent events for potential recognition or disclosure in these financial statements.
62
Report of Independent Registered Public Accounting Firm
To the Trustees of Vanguard Index Funds and the Shareholders of Vanguard Small-Cap Index Fund, Vanguard Small-Cap Growth Index Fund and Vanguard Small-Cap Value Index Fund: In our opinion, the accompanying statements of net assets-investments summary and the related statements of operations and of changes in net assets and the financial highlights present fairly, in all material respects, the financial position of Vanguard Small-Cap Index Fund, Vanguard Small-Cap Growth Index Fund and Vanguard Small-Cap Value Index Fund (constituting separate portfolios of Vanguard Index Funds, hereafter referred to as the “Funds”) at December 31, 2010, the results of each of their operations for the year then ended, the changes in each of their net assets for each of the two years in the period then ended and the financial highlights for each of the periods indicated, in conformity with accounting principles generally accepted i n the United States of America. These financial statements and financial highlights (hereafter referred to as “financial statements”) are the responsibility of the Funds’ management; our responsibility is to express an opinion on these financial statements based on our audits. We conducted our audits of these financial statements in accordance with the standards of the Public Company Accounting Oversight Board (United States). Those standards require that we plan and perform the audit to obtain reasonable assurance about whether the financial statements are free of material misstatement. An audit includes examining, on a test basis, evidence supporting the amounts and disclosures in the financial statements, assessing the accounting principles used and significant estimates made by management, and evaluating the overall financial statement presentation. We believe that our audits, which included confirmation of securities at December 31, 2010 by correspondence with the custodian and broker and by agreement to the underlying ownership records of Vanguard Market Liquidity Fund, provide a reasonable basis for our opinion.
PricewaterhouseCoopers LLP
Philadelphia, Pennsylvania
February 8, 2011
63
|
| Special 2010 tax information (unaudited) for Vanguard U.S. Stock Index Funds (Small-Capitalization Portfolios) |
This information for the fiscal year ended December 31, 2010, is included pursuant to provisions of the Internal Revenue Code.
The funds distributed qualified dividend income to shareholders during the fiscal year as follows:
| |
| | Qualified Dividend Income |
| Index Fund | ($000) |
| Small-Cap | 197,354 |
| Small-Cap Growth | 26,582 |
| Small-Cap Value | 95,280 |
For corporate shareholders, the percentage of investment income (dividend income plus short-term gains, if any) that qualifies for the dividends-received deduction is as follows:
| |
| Index Fund | Percentage |
| Small-Cap | 70.2% |
| Small-Cap Growth | 86.7 |
| Small-Cap Value | 69.6 |
64
Your Fund’s After-Tax Returns
This table presents returns for your fund both before and after taxes. The after-tax returns are shown in two ways: (1) assuming that an investor owned the fund during the entire period and paid taxes on the fund’s distributions, and (2) assuming that an investor paid taxes on the fund’s distributions and sold all shares at the end of each period.
Calculations are based on the highest individual federal income tax and capital gains tax rates in effect at the times of the distributions and the hypothetical sales. State and local taxes were not considered. After-tax returns reflect any qualified dividend income . (In the example, returns after the sale of fund shares may be higher than those assuming no sale. This occurs when the sale would have produced a capital loss. The calculation assumes that the investor received a tax deduction for the loss.) The table shows returns for Investor Shares only; returns for other share classes will differ. Please note that your actual after-tax returns will depend on your tax situation and may differ from those shown. Also note that if you own the fund in a tax-deferred account, such as an individual retirement account or a 401(k) plan, this information does not apply to you. Such accounts are not subject to current taxes.
Finally, keep in mind that a fund’s performance—whether before or after taxes—does not guarantee future results.
| | | |
| Average Annual Total Returns: U.S. Stock Index Funds Small-Capitalization Portfolios | |
| Periods Ended December 31, 2010 | | | |
| | One | Five | Ten |
| | Year | Years | Years |
| Small-Cap Index Fund Investor Shares | | | |
| Returns Before Taxes | 27.72% | 5.39% | 7.23% |
| Returns After Taxes on Distributions | 27.45 | 5.11 | 6.92 |
| Returns After Taxes on Distributions and Sale of Fund Shares | 18.21 | 4.53 | 6.22 |
| |
| | One | Five | Ten |
| | Year | Years | Years |
| Small-Cap Growth Index Fund Investor Shares | | | |
| Returns Before Taxes | 30.69% | 6.42% | 7.52% |
| Returns After Taxes on Distributions | 30.61 | 6.33 | 7.44 |
| Returns After Taxes on Distributions and Sale of Fund Shares | 20.03 | 5.52 | 6.62 |
| |
| | One | Five | Ten |
| | Year | Years | Years |
| Small-Cap Value Index Fund Investor Shares | | | |
| Returns Before Taxes | 24.82% | 4.14% | 7.95% |
| Returns After Taxes on Distributions | 24.36 | 3.68 | 7.22 |
| Returns After Taxes on Distributions and Sale of Fund Shares | 16.46 | 3.39 | 6.61 |
65
About Your Fund’s Expenses
As a shareholder of the fund, you incur ongoing costs, which include costs for portfolio management, administrative services, and shareholder reports (like this one), among others. Operating expenses, which are deducted from a fund’s gross income, directly reduce the investment return of the fund.
A fund’s expenses are expressed as a percentage of its average net assets. This figure is known as the expense ratio. The following examples are intended to help you understand the ongoing costs (in dollars) of investing in your fund and to compare these costs with those of other mutual funds. The examples are based on an investment of $1,000 made at the beginning of the period shown and held for the entire period.
The accompanying table illustrates your fund’s costs in two ways:
• Based on actual fund return. This section helps you to estimate the actual expenses that you paid over the period. The ”Ending Account Value“ shown is derived from the fund‘s actual return, and the third column shows the dollar amount that would have been paid by an investor who started with $1,000 in the fund. You may use the information here, together with the amount you invested, to estimate the expenses that you paid over the period.
To do so, simply divide your account value by $1,000 (for example, an $8,600 account value divided by $1,000 = 8.6), then multiply the result by the number given for your fund under the heading ”Expenses Paid During Period.“
• Based on hypothetical 5% yearly return. This section is intended to help you compare your fund‘s costs with those of other mutual funds. It assumes that the fund had a yearly return of 5% before expenses, but that the expense ratio is unchanged. In this case—because the return used is not the fund’s actual return—the results do not apply to your investment. The example is useful in making comparisons because the Securities and Exchange Commission requires all mutual funds to calculate expenses based on a 5% return. You can assess your fund’s costs by comparing this hypothetical example with the hypothetical examples that appear in shareholder reports of other funds.
Note that the expenses shown in the table are meant to highlight and help you compare ongoing costs only and do not reflect transaction costs incurred by the fund for buying and selling securities. Further, the expenses do not include the account service fee described in the prospectus. If such a fee were applied to your account, your costs would be higher. Your fund does not charge transaction fees, such as purchase or redemption fees, nor does it carry a “sales load.” The calculations assume no shares were bought or sold during the period. Your actual costs may have been higher or lower, depending on the amount of your investment and the timing of any purchases or redemptions.
You can find more information about the fund’s expenses, including annual expense ratios, in the Financial Statements section of this report. For additional information on operating expenses and other shareholder costs, please refer to your fund’s current prospectus.
66
| | | |
| Six Months Ended December 31, 2010 | | | |
| | Beginning | Ending | Expenses |
| | Account Value | Account Value | Paid During |
| | 6/30/2010 | 12/31/2010 | Period |
| Based on Actual Fund Return | | | |
| Small-Cap Index Fund | | | |
| Investor Shares | $1,000.00 | $1,294.93 | $1.50 |
| Admiral Shares | 1,000.00 | 1,296.11 | 0.69 |
| Signal Shares | 1,000.00 | 1,296.01 | 0.69 |
| Institutional Shares | 1,000.00 | 1,296.22 | 0.46 |
| ETF Shares | 1,000.00 | 1,296.10 | 0.69 |
| Small-Cap Growth Index Fund | | | |
| Investor Shares | $1,000.00 | $1,329.84 | $1.53 |
| Institutional Shares | 1,000.00 | 1,330.96 | 0.47 |
| ETF Shares | 1,000.00 | 1,330.70 | 0.70 |
| Small-Cap Value Index Fund | | | |
| Investor Shares | $1,000.00 | $1,261.18 | $1.48 |
| Institutional Shares | 1,000.00 | 1,262.58 | 0.46 |
| ETF Shares | 1,000.00 | 1,262.28 | 0.68 |
67
| | | |
| Six Months Ended December 31, 2010 | | | |
| | Beginning | Ending | Expenses |
| | Account Value | Account Value | Paid During |
| | 6/30/2010 | 12/31/2010 | Period |
| Based on Hypothetical 5% Yearly Return | | | |
| Small-Cap Index Fund | | | |
| Investor Shares | $1,000.00 | $1,023.89 | $1.33 |
| Admiral Shares | 1,000.00 | 1,024.60 | 0.61 |
| Signal Shares | 1,000.00 | 1,024.60 | 0.61 |
| Institutional Shares | 1,000.00 | 1,024.80 | 0.41 |
| ETF Shares | 1,000.00 | 1,024.60 | 0.61 |
| Small-Cap Growth Index Fund | | | |
| Investor Shares | $1,000.00 | $1,023.89 | $1.33 |
| Institutional Shares | 1,000.00 | 1,024.80 | 0.41 |
| ETF Shares | 1,000.00 | 1,024.60 | 0.61 |
| Small-Cap Value Index Fund | | | |
| Investor Shares | $1,000.00 | $1,023.89 | $1.33 |
| Institutional Shares | 1,000.00 | 1,024.80 | 0.41 |
| ETF Shares | 1,000.00 | 1,024.60 | 0.61 |
The calculations are based on expenses incurred in the most recent six-month period. The funds’ annualized six-month expense ratios for that period are: for the Small-Cap Index Fund, 0.26% for Investor Shares, 0.12% for Admiral Shares, 0.12% for Signal Shares, 0.08% for Institutional Shares, and 0.12% for ETF Shares; for the Small-Cap Growth Index Fund, 0.26% for Investor Shares, 0.08% for Institutional Shares, and 0.12% for ETF Shares; and for the Small-Cap Value Index Fund, 0.26% for Investor Shares, 0.08% for Institutional Shares, and 0.12% for ETF Shares. The dollar amounts shown as “Expenses Paid” are equal to the annualized expense ratio multiplied by the average account value over the period, multiplied by the number of days in the most recent six-month period, then divided by the number of days in the most recent 12-month period. This table does not include data for funds or share classes of f unds with fewer than six months of history.
68
Glossary
30-Day SEC Yield. A fund’s 30-day SEC yield is derived using a formula specified by the U.S. Securities and Exchange Commission. Under the formula, data related to the fund’s security holdings in the previous 30 days are used to calculate the fund’s hypothetical net income for that period, which is then annualized and divided by the fund’s estimated average net assets over the calculation period. For the purposes of this calculation, a security’s income is based on its current market yield to maturity (in the case of bonds) or its projected dividend yield (for stocks). Because the SEC yield represents hypothetical annualized income, it will differ—at times significantly—from the fund’s actual experience. As a result, the fund’s income distributions may be higher or lower than implied by the SEC yield.
Beta. A measure of the magnitude of a fund’s past share-price fluctuations in relation to the ups and downs of a given market index. The index is assigned a beta of 1.00. Compared with a given index, a fund with a beta of 1.20 typically would have seen its share price rise or fall by 12% when the index rose or fell by 10%. For this report, beta is based on returns over the past 36 months for both the fund and the index. Note that a fund’s beta should be reviewed in conjunction with its R-squared (see definition). The lower the R-squared, the less correlation there is between the fund and the index, and the less reliable beta is as an indicator of volatility.
Dividend Yield. Dividend income earned by stocks, expressed as a percentage of the aggregate market value (or of net asset value, for a fund). The yield is determined by dividing the amount of the annual dividends by the aggregate value (or net asset value) at the end of the period. For a fund, the dividend yield is based solely on stock holdings and does not include any income produced by other investments.
Earnings Growth Rate. The average annual rate of growth in earnings over the past five years for the stocks now in a fund.
Equity Exposure. A measure that reflects a fund’s investments in stocks and stock futures. Any holdings in short-term reserves are excluded.
Expense Ratio. The percentage of a fund’s average net assets used to pay its annual administrative and advisory expenses. These expenses directly reduce returns to investors.
Foreign Holdings. The percentage of a fund represented by stocks or depositary receipts of companies based outside the United States.
Inception Date. The date on which the assets of a fund (or one of its share classes) are first invested in accordance with the fund’s investment objective. For funds with a subscription period, the inception date is the day after that period ends. Investment performance is measured from the inception date.
Median Market Cap. An indicator of the size of companies in which a fund invests; the midpoint of market capitalization (market price x shares outstanding) of a fund’s stocks, weighted by the proportion of the fund’s assets invested in each stock. Stocks representing half of the fund’s assets have market capitalizations above the median, and the rest are below it.
Price/Book Ratio. The share price of a stock divided by its net worth, or book value, per share. For a fund, the weighted average price/book ratio of the stocks it holds.
69
Price/Earnings Ratio. The ratio of a stock’s current price to its per-share earnings over the past year. For a fund, the weighted average P/E of the stocks it holds. P/E is an indicator of market expectations about corporate prospects; the higher the P/E, the greater the expectations for a company’s future growth.
R-Squared. A measure of how much of a fund’s past returns can be explained by the returns from the market in general, as measured by a given index. If a fund’s total returns were precisely synchronized with an index’s returns, its R-squared would be 1.00. If the fund’s returns bore no relationship to the index’s returns, its R-squared would be 0. For this report, R-squared is based on returns over the past 36 months for both the fund and the index.
Return on Equity. The annual average rate of return generated by a company during the past five years for each dollar of shareholder’s equity (net income divided by shareholder’s equity). For a fund, the weighted average return on equity for the companies whose stocks it holds.
Short-Term Reserves. The percentage of a fund invested in highly liquid, short-term securities that can be readily converted to cash.
Turnover Rate. An indication of the fund’s trading activity. Funds with high turnover rates incur higher transaction costs and may be more likely to distribute capital gains (which may be taxable to investors). The turnover rate excludes in-kind transactions, which have minimal impact on costs.
70
This page intentionally left blank.
The People Who Govern Your Fund
The trustees of your mutual fund are there to see that the fund is operated and managed in your best interests since, as a shareholder, you are a part owner of the fund. Your fund’s trustees also serve on the board of directors of The Vanguard Group, Inc., which is owned by the Vanguard funds and provides services to them on an at-cost basis.
A majority of Vanguard’s board members are independent, meaning that they have no affiliation with Vanguard or the funds they oversee, apart from the sizable personal investments they have made as private individuals. The independent board members have distinguished backgrounds in business, academia, and public service. Each of the trustees and executive officers oversees 179 Vanguard funds.
The following table provides information for each trustee and executive officer of the fund. More information about the trustees is in the Statement of Additional Information, which can be obtained, without charge, by contacting Vanguard at 800-662-7447, or online at vanguard.com.
| |
| Interested Trustee1 | Amy Gutmann |
| | Born 1949. Trustee Since June 2006. Principal |
| F. William McNabb III | Occupation(s) During the Past Five Years: President |
| Born 1957. Trustee Since July 2009. Chairman of the | of the University of Pennsylvania; Christopher H. |
| Board. Principal Occupation(s) During the Past Five | Browne Distinguished Professor of Political Science |
| Years: Chairman of the Board of The Vanguard Group, | in the School of Arts and Sciences with secondary |
| Inc., and of each of the investment companies served | appointments at the Annenberg School for Commu- |
| by The Vanguard Group, since January 2010; Director | nication and the Graduate School of Education |
| of The Vanguard Group since 2008; Chief Executive | of the University of Pennsylvania; Director of |
| Officer and President of The Vanguard Group and of | Carnegie Corporation of New York, Schuylkill River |
| each of the investment companies served by The | Development Corporation, and Greater Philadelphia |
| Vanguard Group since 2008; Director of Vanguard | Chamber of Commerce; Trustee of the National |
| Marketing Corporation; Managing Director of The | Constitution Center; Chair of the Presidential |
| Vanguard Group (1995–2008) . | Commission for the Study of Bioethical Issues. |
| |
| | JoAnn Heffernan Heisen |
| Independent Trustees | Born 1950. Trustee Since July 1998. Principal |
| | Occupation(s) During the Past Five Years: Corporate |
| Emerson U. Fullwood | Vice President and Chief Global Diversity Officer |
| Born 1948. Trustee Since January 2008. Principal | since 2006 (retired 2008) and Member of the |
| Occupation(s) During the Past Five Years: Executive | Executive Committee (retired 2008) of Johnson & |
| Chief Staff and Marketing Officer for North America | Johnson (pharmaceuticals/consumer products); Vice |
| and Corporate Vice President (retired 2008) of Xerox | President and Chief Information Officer of Johnson & |
| Corporation (document management products and | Johnson (1997–2005); Director of the University |
| services); Director of SPX Corporation (multi-industry | Medical Center at Princeton and Women’s Research |
| manufacturing), the United Way of Rochester, | and Education Institute; Member of the Advisory |
| Amerigroup Corporation (managed health care), | Board of the Maxwell School of Citizenship and Public |
| the University of Rochester Medical Center, and | Affairs at Syracuse University. |
| Monroe Community College Foundation. | |
| | F. Joseph Loughrey |
| Rajiv L. Gupta | Born 1949. Trustee Since October 2009. Principal |
| Born 1945. Trustee Since December 2001. 2 | Occupation(s) During the Past Five Years: President |
| Principal Occupation(s) During the Past Five Years: | and Chief Operating Officer since 2005 (retired 2009) |
| Chairman and Chief Executive Officer (retired 2009) | and Vice Chairman of the Board (2008–2009) of |
| and President (2006–2008) of Rohm and Haas Co. | Cummins Inc. (industrial machinery); Director of |
| (chemicals); Director of Tyco International, Ltd. | SKF AB (industrial machinery), Hillenbrand, Inc. |
| (diversified manufacturing and services) and Hewlett- | (specialized consumer services), Sauer-Danfoss Inc. |
| Packard Co. (electronic computer manufacturing); | (machinery), the Lumina Foundation for Education, |
| Trustee of The Conference Board; Member of the | and Oxfam America; Chairman of the Advisory |
| Board of Managers of Delphi Automotive LLP | Council for the College of Arts and Letters at the |
| (automotive components) . | University of Notre Dame. |
| | |
| André F. Perold | Kathryn J. Hyatt | |
| Born 1952. Trustee Since December 2004. Principal | Born 1955. Treasurer Since November 2008. Principal |
| Occupation(s) During the Past Five Years: George | Occupation(s) During the Past Five Years: Principal |
| Gund Professor of Finance and Banking at the Harvard | of The Vanguard Group, Inc.; Treasurer of each of |
| Business School; Chair of the Investment Committee | the investment companies served by The Vanguard |
| of HighVista Strategies LLC (private investment firm) . | Group since 2008; Assistant Treasurer of each of the |
| | investment companies served by The Vanguard Group |
| Alfred M. Rankin, Jr. | (1988–2008). | |
| Born 1941. Trustee Since January 1993. Principal | | |
| Occupation(s) During the Past Five Years: Chairman, | Heidi Stam | |
| President, and Chief Executive Officer of NACCO | Born 1956. Secretary Since July 2005. Principal |
| Industries, Inc. (forklift trucks/housewares/lignite); | Occupation(s) During the Past Five Years: Managing |
| Director of Goodrich Corporation (industrial products/ | Director of The Vanguard Group, Inc., since 2006; |
| aircraft systems and services); Chairman of the | General Counsel of The Vanguard Group since 2005; |
| Federal Reserve Bank of Cleveland; Trustee of The | Secretary of The Vanguard Group and of each of the |
| Cleveland Museum of Art. | investment companies served by The Vanguard Group |
| | since 2005; Director and Senior Vice President of |
| Peter F. Volanakis | Vanguard Marketing Corporation since 2005; |
| Born 1955. Trustee Since July 2009. Principal | Principal of The Vanguard Group (1997–2006). |
| Occupation(s) During the Past Five Years: President | | |
| since 2007 and Chief Operating Officer since 2005 | | |
| of Corning Incorporated (communications equipment); | Vanguard Senior Management Team |
| President of Corning Technologies (2001–2005); | | |
| Director of Corning Incorporated and Dow Corning; | R. Gregory Barton | Michael S. Miller |
| Trustee of the Corning Incorporated Foundation and | Mortimer J. Buckley | James M. Norris |
| the Corning Museum of Glass; Overseer of the | Kathleen C. Gubanich | Glenn W. Reed |
| Amos Tuck School of Business Administration at | Paul A. Heller | George U. Sauter |
| Dartmouth College. | | |
| |
| | Chairman Emeritus and Senior Advisor |
| Executive Officers | | |
| | John J. Brennan | |
| Glenn Booraem | Chairman, 1996–2009 | |
| Born 1967. Controller Since July 2010. Principal | Chief Executive Officer and President, 1996–2008 |
| Occupation(s) During the Past Five Years: Principal | | |
| of The Vanguard Group, Inc.; Controller of each of | | |
| the investment companies served by The Vanguard | Founder | |
| Group since 2010; Assistant Controller of each of | | |
| the investment companies served by The Vanguard | John C. Bogle | |
| Group (2001–2010) . | Chairman and Chief Executive Officer, 1974–1996 |
| |
| Thomas J. Higgins | | |
| Born 1957. Chief Financial Officer Since September | | |
| 2008. Principal Occupation(s) During the Past Five | | |
| Years: Principal of The Vanguard Group, Inc.; Chief | | |
| Financial Officer of each of the investment companies | | |
| served by The Vanguard Group since 2008; Treasurer | | |
| of each of the investment companies served by The | | |
| Vanguard Group (1998–2008) . | | |
1 Mr. McNabb is considered an “interested person,” as defined in the Investment Company Act of 1940, because he is an officer of the Vanguard funds.
2 December 2002 for Vanguard Equity Income Fund, Vanguard Growth Equity Fund, the Vanguard Municipal Bond Funds, and the Vanguard State Tax-Exempt Funds.
|  |
| P.O. Box 2600 |
| Valley Forge, PA 19482-2600 |
Connect with Vanguard® > vanguard.com
| The funds or securities referred to herein are not |
| Fund Information > 800-662-7447 | sponsored, endorsed, or promoted by MSCI, and MSCI |
| Direct Investor Account Services > 800-662-2739 | bears no liability with respect to any such funds or |
| Institutional Investor Services > 800-523-1036 | securities. For any such funds or securities, the |
| Text Telephone for People | prospectus or the Statement of Additional Information |
| With Hearing Impairment > 800-749-7273 | contains a more detailed description of the limited |
| | relationship MSCI has with The Vanguard Group and |
| This material may be used in conjunction | any related funds. |
| with the offering of shares of any Vanguard | |
| fund only if preceded or accompanied by | |
| the fund’s current prospectus. | |
| |
| All comparative mutual fund data are from Lipper Inc. or | |
| Morningstar, Inc., unless otherwise noted. | |
| |
| You can obtain a free copy of Vanguard’s proxy voting | |
| guidelines by visiting vanguard.com/proxyreporting or by | |
| calling Vanguard at 800-662-2739. The guidelines are | |
| also available from the SEC’s website, sec.gov. In | |
| addition, you may obtain a free report on how your fund | |
| voted the proxies for securities it owned during the 12 | |
| months ended June 30. To get the report, visit either | |
| vanguard.com/proxyreporting or sec.gov. | |
| |
| You can review and copy information about your fund at | |
| the SEC’s Public Reference Room in Washington, D.C. To | |
| find out more about this public service, call the SEC at | |
| 202-551-8090. Information about your fund is also | |
| available on the SEC’s website, and you can receive | |
| copies of this information, for a fee, by sending a | |
| request in either of two ways: via e-mail addressed to | |
| publicinfo@sec.gov or via regular mail addressed to the | |
| Public Reference Section, Securities and Exchange | |
| Commission, Washington, DC 20549-1520. | |
| | © 2011 The Vanguard Group, Inc. |
| | All rights reserved. |
| | Vanguard Marketing Corporation, Distributor. |
| |
| | Q480 022011 |
| | | |
| Vanguard® Small-Cap Index Fund | | |
| Schedule of Investments | | |
| December 31, 2010 | | |
| |
| | | | Market |
| | | | Value |
| | | Shares | ($000) |
| Common Stocks (99.8%)1 | | |
| Consumer Discretionary (14.2%) | | |
| | Gentex Corp. | 2,084,852 | 61,628 |
| * | Signet Jewelers Ltd. | 1,276,324 | 55,392 |
| | Tractor Supply Co. | 1,082,354 | 52,483 |
| | Williams-Sonoma Inc. | 1,450,339 | 51,763 |
| * | Lululemon Athletica Inc. | 686,272 | 46,955 |
| * | Deckers Outdoor Corp. | 575,925 | 45,924 |
| | Sotheby's | 997,873 | 44,904 |
| * | Panera Bread Co. Class A | 442,779 | 44,814 |
| | Tupperware Brands Corp. | 939,489 | 44,785 |
| | Jarden Corp. | 1,363,890 | 42,103 |
| * | Tempur-Pedic International Inc. | 987,098 | 39,543 |
| * | WMS Industries Inc. | 865,061 | 39,135 |
| * | J Crew Group Inc. | 903,472 | 38,976 |
| * | Big Lots Inc. | 1,208,627 | 36,815 |
| | Polaris Industries Inc. | 470,558 | 36,713 |
| * | Tenneco Inc. | 889,904 | 36,628 |
| * | Warnaco Group Inc. | 663,231 | 36,524 |
| * | Hanesbrands Inc. | 1,424,575 | 36,184 |
| * | Dana Holding Corp. | 2,091,327 | 35,992 |
| | RadioShack Corp. | 1,868,317 | 34,545 |
| * | Aeropostale Inc. | 1,392,853 | 34,320 |
| * | Bally Technologies Inc. | 803,179 | 33,886 |
| | Chico's FAS Inc. | 2,668,387 | 32,101 |
| | Rent-A-Center Inc. | 982,467 | 31,714 |
| * | DreamWorks Animation SKG Inc. Class A | 1,038,796 | 30,613 |
| | John Wiley & Sons Inc. Class A | 675,966 | 30,581 |
| | Service Corp. International | 3,674,866 | 30,318 |
| *,^ | Under Armour Inc. Class A | 543,306 | 29,795 |
| | Dillard's Inc. Class A | 701,506 | 26,615 |
| * | Coinstar Inc. | 462,891 | 26,126 |
| * | Carter's Inc. | 884,861 | 26,112 |
| * | Cheesecake Factory Inc. | 841,584 | 25,803 |
| * | Career Education Corp. | 1,209,967 | 25,083 |
| | Brunswick Corp. | 1,319,587 | 24,729 |
| * | Dress Barn Inc. | 935,534 | 24,717 |
| * | AnnTaylor Stores Corp. | 879,175 | 24,081 |
| * | Madison Square Garden Inc. Class A | 926,565 | 23,887 |
| * | Valassis Communications Inc. | 732,499 | 23,696 |
| * | Live Nation Entertainment Inc. | 2,065,715 | 23,590 |
| | Aaron's Inc. | 1,146,750 | 23,382 |
| * | Jo-Ann Stores Inc. | 386,384 | 23,268 |
| | Wolverine World Wide Inc. | 726,506 | 23,161 |
| * | Life Time Fitness Inc. | 561,062 | 22,998 |
| * | Vail Resorts Inc. | 432,345 | 22,499 |
| * | OfficeMax Inc. | 1,265,982 | 22,408 |
| * | Office Depot Inc. | 4,107,922 | 22,183 |
| * | CROCS Inc. | 1,289,779 | 22,081 |
| *,^ | Saks Inc. | 2,036,800 | 21,794 |
| * | Sally Beauty Holdings Inc. | 1,494,067 | 21,709 |
| * | Eastman Kodak Co. | 3,999,565 | 21,438 |
| * | Iconix Brand Group Inc. | 1,076,924 | 20,795 |
| * | Collective Brands Inc. | 966,040 | 20,383 |
| | Jones Group Inc. | 1,296,818 | 20,153 |
| * | Orient-Express Hotels Ltd. Class A | 1,501,967 | 19,511 |
| | Cooper Tire & Rubber Co. | 823,670 | 19,422 |
| | Hillenbrand Inc. | 927,032 | 19,292 |
| | Cracker Barrel Old Country Store Inc. | 350,735 | 19,210 |
| * | New York Times Co. Class A | 1,943,574 | 19,047 |
| | Weight Watchers International Inc. | 505,159 | 18,938 |
| | Six Flags Entertainment Corp. | 346,948 | 18,874 |
| | Meredith Corp. | 541,179 | 18,752 |
1
| | | |
| Vanguard® Small-Cap Index Fund | | |
| Schedule of Investments | | |
| December 31, 2010 | | |
| |
| | | | Market |
| | | | Value |
| | | Shares | ($000) |
| | Men's Wearhouse Inc. | 744,570 | 18,599 |
| * | Childrens Place Retail Stores Inc. | 371,479 | 18,440 |
| * | HSN Inc. | 599,909 | 18,381 |
| * | Pier 1 Imports Inc. | 1,744,652 | 18,319 |
| | Thor Industries Inc. | 536,365 | 18,215 |
| * | Gaylord Entertainment Co. | 491,354 | 17,659 |
| | Morningstar Inc. | 331,939 | 17,619 |
| | Cinemark Holdings Inc. | 1,013,590 | 17,474 |
| * | Jack in the Box Inc. | 820,516 | 17,337 |
| | Choice Hotels International Inc. | 444,042 | 16,993 |
| | PF Chang's China Bistro Inc. | 344,734 | 16,706 |
| | Pool Corp. | 738,276 | 16,641 |
| | Arbitron Inc. | 399,499 | 16,587 |
| * | JOS A Bank Clothiers Inc. | 409,732 | 16,520 |
| * | Ulta Salon Cosmetics & Fragrance Inc. | 479,656 | 16,308 |
| | MDC Holdings Inc. | 562,424 | 16,181 |
| | KB Home | 1,179,271 | 15,908 |
| * | Hibbett Sports Inc. | 429,759 | 15,858 |
| | Buckle Inc. | 418,025 | 15,789 |
| | National CineMedia Inc. | 788,888 | 15,707 |
| | Matthews International Corp. Class A | 443,393 | 15,510 |
| * | Steven Madden Ltd. | 370,989 | 15,478 |
| * | Timberland Co. Class A | 618,645 | 15,212 |
| | Bob Evans Farms Inc. | 454,722 | 14,988 |
| *,^ | Capella Education Co. | 224,347 | 14,937 |
| | Regal Entertainment Group Class A | 1,264,196 | 14,842 |
| | Group 1 Automotive Inc. | 354,803 | 14,817 |
| | Monro Muffler Brake Inc. | 425,979 | 14,735 |
| | Regis Corp. | 856,918 | 14,225 |
| * | Texas Roadhouse Inc. Class A | 799,482 | 13,727 |
| * | Genesco Inc. | 360,131 | 13,501 |
| | Finish Line Inc. Class A | 777,862 | 13,371 |
| * | Cabela's Inc. | 606,004 | 13,181 |
| *,^ | Tesla Motors Inc. | 485,577 | 12,931 |
| * | Helen of Troy Ltd. | 433,858 | 12,903 |
| * | Shutterfly Inc. | 365,313 | 12,797 |
| * | Pinnacle Entertainment Inc. | 909,264 | 12,748 |
| * | CEC Entertainment Inc. | 320,707 | 12,453 |
| * | American Axle & Manufacturing Holdings Inc. | 956,454 | 12,300 |
| | American Greetings Corp. Class A | 552,007 | 12,232 |
| | Scholastic Corp. | 412,276 | 12,179 |
| *,^ | Blue Nile Inc. | 213,346 | 12,174 |
| * | Vitamin Shoppe Inc. | 356,102 | 11,979 |
| * | Penske Automotive Group Inc. | 685,732 | 11,945 |
| * | 99 Cents Only Stores | 726,318 | 11,578 |
| *,^ | Education Management Corp. | 637,904 | 11,546 |
| * | BJ's Restaurants Inc. | 322,745 | 11,435 |
| * | Ruby Tuesday Inc. | 868,315 | 11,340 |
| | Cato Corp. Class A | 413,699 | 11,339 |
| * | Buffalo Wild Wings Inc. | 257,194 | 11,278 |
| * | DineEquity Inc. | 226,887 | 11,204 |
| | Ryland Group Inc. | 656,972 | 11,188 |
| * | Skechers U.S.A. Inc. Class A | 538,769 | 10,775 |
| | International Speedway Corp. Class A | 411,585 | 10,771 |
| | Columbia Sportswear Co. | 176,234 | 10,627 |
| * | Exide Technologies | 1,128,743 | 10,621 |
| | PEP Boys-Manny Moe & Jack | 780,733 | 10,485 |
| * | American Public Education Inc. | 275,272 | 10,251 |
| * | Scientific Games Corp. Class A | 1,020,827 | 10,167 |
| * | Modine Manufacturing Co. | 655,742 | 10,164 |
| *,^ | Liz Claiborne Inc. | 1,406,081 | 10,068 |
| * | Quiksilver Inc. | 1,973,634 | 10,006 |
| | Stage Stores Inc. | 569,301 | 9,872 |
| * | Domino's Pizza Inc. | 616,794 | 9,838 |
2
| | | |
| Vanguard® Small-Cap Index Fund | | |
| Schedule of Investments | | |
| December 31, 2010 | | |
| |
| | | | Market |
| | | | Value |
| | | Shares | ($000) |
| * | Steiner Leisure Ltd. | 209,909 | 9,803 |
| * | K12 Inc. | 340,199 | 9,750 |
| * | Belo Corp. Class A | 1,367,521 | 9,682 |
| * | Interval Leisure Group Inc. | 593,361 | 9,577 |
| * | Meritage Homes Corp. | 429,775 | 9,541 |
| * | Shuffle Master Inc. | 797,982 | 9,137 |
| * | Federal-Mogul Corp. | 441,958 | 9,126 |
| | Brown Shoe Co. Inc. | 646,052 | 8,999 |
| * | Boyd Gaming Corp. | 834,244 | 8,843 |
| * | Sonic Corp. | 871,721 | 8,822 |
| | Express Inc. | 461,999 | 8,686 |
| * | Papa John's International Inc. | 313,339 | 8,679 |
| * | DSW Inc. Class A | 219,652 | 8,588 |
| * | Zumiez Inc. | 318,985 | 8,571 |
| * | G-III Apparel Group Ltd. | 241,581 | 8,492 |
| | Stewart Enterprises Inc. Class A | 1,268,259 | 8,485 |
| ^ | Barnes & Noble Inc. | 580,197 | 8,210 |
| * | Maidenform Brands Inc. | 343,440 | 8,164 |
| * | Lumber Liquidators Holdings Inc. | 326,664 | 8,137 |
| * | Asbury Automotive Group Inc. | 438,469 | 8,103 |
| * | True Religion Apparel Inc. | 360,336 | 8,021 |
| * | Peet's Coffee & Tea Inc. | 192,074 | 8,017 |
| * | iRobot Corp. | 321,306 | 7,994 |
| | Churchill Downs Inc. | 183,620 | 7,969 |
| * | Ascent Media Corp. Class A | 201,593 | 7,814 |
| | Callaway Golf Co. | 957,568 | 7,728 |
| | Ethan Allen Interiors Inc. | 385,274 | 7,709 |
| | Fred's Inc. Class A | 559,146 | 7,694 |
| ^ | Nutrisystem Inc. | 360,262 | 7,576 |
| * | Jakks Pacific Inc. | 412,438 | 7,515 |
| * | Select Comfort Corp. | 819,207 | 7,479 |
| * | Biglari Holdings Inc. | 18,192 | 7,463 |
| * | Standard Pacific Corp. | 1,597,778 | 7,350 |
| * | Knology Inc. | 469,681 | 7,341 |
| * | Fuel Systems Solutions Inc. | 248,446 | 7,299 |
| | Harte-Hanks Inc. | 570,096 | 7,280 |
| | Sonic Automotive Inc. Class A | 545,015 | 7,216 |
| * | Dorman Products Inc. | 198,634 | 7,198 |
| | Superior Industries International Inc. | 337,553 | 7,163 |
| * | RC2 Corp. | 321,620 | 7,002 |
| * | La-Z-Boy Inc. | 774,072 | 6,982 |
| *,^ | Corinthian Colleges Inc. | 1,315,009 | 6,851 |
| | Universal Technical Institute Inc. | 306,812 | 6,756 |
| | Drew Industries Inc. | 294,691 | 6,695 |
| * | Winnebago Industries Inc. | 433,484 | 6,589 |
| * | Lions Gate Entertainment Corp. | 973,765 | 6,339 |
| * | Krispy Kreme Doughnuts Inc. | 902,673 | 6,301 |
| *,^ | Pre-Paid Legal Services Inc. | 103,592 | 6,241 |
| *,^ | hhgregg Inc. | 292,909 | 6,136 |
| * | Charming Shoppes Inc. | 1,721,112 | 6,110 |
| ^ | PetMed Express Inc. | 341,649 | 6,085 |
| | Ameristar Casinos Inc. | 389,098 | 6,082 |
| * | Beazer Homes USA Inc. | 1,124,905 | 6,063 |
| * | California Pizza Kitchen Inc. | 348,883 | 6,029 |
| * | Grand Canyon Education Inc. | 306,620 | 6,007 |
| * | Retail Ventures Inc. | 364,608 | 5,943 |
| * | Rue21 Inc. | 198,366 | 5,814 |
| | Sinclair Broadcast Group Inc. Class A | 696,950 | 5,701 |
| * | Universal Electronics Inc. | 200,762 | 5,696 |
| * | Wet Seal Inc. Class A | 1,515,002 | 5,605 |
| * | Citi Trends Inc. | 221,816 | 5,446 |
| *,^ | Bridgepoint Education Inc. | 284,844 | 5,412 |
| | Oxford Industries Inc. | 209,166 | 5,357 |
| * | Pacific Sunwear of California Inc. | 981,591 | 5,320 |
3
| | | |
| Vanguard® Small-Cap Index Fund | | |
| Schedule of Investments | | |
| December 31, 2010 | | |
| |
| | | | Market |
| | | | Value |
| | | Shares | ($000) |
| * | Denny's Corp. | 1,482,830 | 5,309 |
| * | AFC Enterprises Inc. | 379,904 | 5,281 |
| * | Mediacom Communications Corp. Class A | 612,217 | 5,179 |
| ^ | World Wrestling Entertainment Inc. Class A | 362,980 | 5,169 |
| * | Core-Mark Holding Co. Inc. | 144,865 | 5,156 |
| * | K-Swiss Inc. Class A | 406,657 | 5,071 |
| * | Talbots Inc. | 574,527 | 4,895 |
| * | ChinaCast Education Corp. | 630,122 | 4,890 |
| * | EW Scripps Co. Class A | 477,188 | 4,843 |
| | Volcom Inc. | 255,657 | 4,824 |
| * | Red Robin Gourmet Burgers Inc. | 220,438 | 4,733 |
| | Big 5 Sporting Goods Corp. | 308,052 | 4,704 |
| * | Warner Music Group Corp. | 805,809 | 4,537 |
| | Lincoln Educational Services Corp. | 285,104 | 4,422 |
| | Sturm Ruger & Co. Inc. | 286,446 | 4,380 |
| * | Movado Group Inc. | 270,060 | 4,359 |
| * | M/I Homes Inc. | 275,602 | 4,239 |
| | HOT Topic Inc. | 662,836 | 4,156 |
| * | Dex One Corp. | 556,966 | 4,155 |
| | Marcus Corp. | 310,833 | 4,125 |
| *,^ | Overstock.com Inc. | 241,042 | 3,972 |
| * | America's Car-Mart Inc. | 145,294 | 3,935 |
| * | Unifi Inc. | 223,889 | 3,790 |
| * | Libbey Inc. | 240,831 | 3,726 |
| * | Shoe Carnival Inc. | 137,805 | 3,721 |
| | Stein Mart Inc. | 389,467 | 3,603 |
| *,^ | Deer Consumer Products Inc. | 300,070 | 3,373 |
| | Speedway Motorsports Inc. | 218,132 | 3,342 |
| * | Smith & Wesson Holding Corp. | 892,473 | 3,338 |
| * | Kirkland's Inc. | 237,098 | 3,326 |
| | Christopher & Banks Corp. | 533,557 | 3,281 |
| *,^ | Hovnanian Enterprises Inc. Class A | 800,176 | 3,273 |
| * | Journal Communications Inc. Class A | 637,329 | 3,219 |
| | Haverty Furniture Cos. Inc. | 247,485 | 3,212 |
| | Ambassadors Group Inc. | 267,791 | 3,080 |
| * | Coldwater Creek Inc. | 957,928 | 3,037 |
| | Blyth Inc. | 85,114 | 2,935 |
| * | Furniture Brands International Inc. | 569,417 | 2,927 |
| * | Leapfrog Enterprises Inc. | 525,073 | 2,914 |
| | Spartan Motors Inc. | 464,489 | 2,829 |
| * | CKX Inc. | 694,733 | 2,800 |
| | Weyco Group Inc. | 109,367 | 2,678 |
| | Bebe Stores Inc. | 448,200 | 2,671 |
| * | LIN TV Corp. Class A | 467,957 | 2,480 |
| * | Isle of Capri Casinos Inc. | 241,700 | 2,470 |
| | CSS Industries Inc. | 115,379 | 2,378 |
| *,^ | China MediaExpress Holdings Inc. | 148,956 | 2,359 |
| * | Systemax Inc. | 164,301 | 2,317 |
| * | Sealy Corp. | 727,389 | 2,124 |
| *,^ | Wonder Auto Technology Inc. | 277,892 | 2,095 |
| * | Monarch Casino & Resort Inc. | 145,940 | 1,824 |
| * | Kenneth Cole Productions Inc. Class A | 144,664 | 1,807 |
| *,^ | Martha Stewart Living Omnimedia Class A | 404,381 | 1,787 |
| * | New York & Co. Inc. | 404,067 | 1,786 |
| * | Orbitz Worldwide Inc. | 303,588 | 1,697 |
| *,^ | Brookfield Homes Corp. | 177,242 | 1,666 |
| * | ReachLocal Inc. | 82,659 | 1,646 |
| *,^ | Fuqi International Inc. | 250,294 | 1,597 |
| * | Vitacost.com Inc. | 252,101 | 1,437 |
| * | China Automotive Systems Inc. | 100,643 | 1,369 |
| | Outdoor Channel Holdings Inc. | 189,218 | 1,357 |
| * | Marine Products Corp. | 166,803 | 1,111 |
| * | China XD Plastics Co. Ltd. | 200,965 | 1,081 |
| * | Archipelago Learning Inc. | 96,942 | 951 |
4
| | | |
| Vanguard® Small-Cap Index Fund | | |
| Schedule of Investments | | |
| December 31, 2010 | | |
| |
| | | | Market |
| | | | Value |
| | | Shares | ($000) |
| * | Krispy Kreme Doughnuts Inc. Warrants Exp. 03/02/2012 | 7,748 | 2 |
| | | | 3,412,363 |
| Consumer Staples (2.7%) | | |
| | Del Monte Foods Co. | 2,898,982 | 54,501 |
| | Corn Products International Inc. | 1,121,113 | 51,571 |
| * | BJ's Wholesale Club Inc. | 801,703 | 38,402 |
| * | TreeHouse Foods Inc. | 527,495 | 26,950 |
| | Nu Skin Enterprises Inc. Class A | 831,362 | 25,157 |
| * | United Natural Foods Inc. | 670,712 | 24,602 |
| | Casey's General Stores Inc. | 561,923 | 23,887 |
| * | Central European Distribution Corp. | 999,294 | 22,884 |
| | Ruddick Corp. | 618,250 | 22,776 |
| ^ | Diamond Foods Inc. | 324,645 | 17,265 |
| * | Hain Celestial Group Inc. | 637,734 | 17,257 |
| | Lancaster Colony Corp. | 292,693 | 16,742 |
| * | Darling International Inc. | 1,227,331 | 16,299 |
| | Fresh Del Monte Produce Inc. | 639,817 | 15,963 |
| | Universal Corp. | 359,451 | 14,630 |
| * | Boston Beer Co. Inc. Class A | 144,457 | 13,736 |
| | Sanderson Farms Inc. | 321,706 | 12,595 |
| | J&J Snack Foods Corp. | 220,407 | 10,632 |
| ^ | Vector Group Ltd. | 613,833 | 10,632 |
| | Pricesmart Inc. | 266,740 | 10,144 |
| | B&G Foods Inc. Class A | 709,663 | 9,744 |
| | WD-40 Co. | 235,516 | 9,487 |
| | Andersons Inc. | 260,359 | 9,464 |
| * | Chiquita Brands International Inc. | 668,293 | 9,369 |
| | Snyders-Lance Inc. | 386,582 | 9,061 |
| * | Rite Aid Corp. | 9,897,671 | 8,742 |
| | Tootsie Roll Industries Inc. | 299,074 | 8,664 |
| * | Prestige Brands Holdings Inc. | 708,008 | 8,461 |
| *,^ | Zhongpin Inc. | 413,686 | 8,439 |
| * | Elizabeth Arden Inc. | 351,336 | 8,084 |
| *,^ | Dole Food Co. Inc. | 591,085 | 7,986 |
| | Nash Finch Co. | 183,149 | 7,786 |
| * | Heckmann Corp. | 1,540,625 | 7,749 |
| | Weis Markets Inc. | 180,013 | 7,260 |
| * | Pantry Inc. | 339,582 | 6,744 |
| | Cal-Maine Foods Inc. | 207,161 | 6,542 |
| * | Central Garden and Pet Co. Class A | 637,659 | 6,300 |
| * | Winn-Dixie Stores Inc. | 824,856 | 5,914 |
| | Spartan Stores Inc. | 337,476 | 5,720 |
| * | Pilgrim's Pride Corp. | 797,633 | 5,655 |
| * | Alliance One International Inc. | 1,261,558 | 5,349 |
| * | USANA Health Sciences Inc. | 117,304 | 5,097 |
| | Inter Parfums Inc. | 226,054 | 4,261 |
| * | Smart Balance Inc. | 912,570 | 3,951 |
| | Calavo Growers Inc. | 163,728 | 3,774 |
| | Ingles Markets Inc. Class A | 191,351 | 3,674 |
| | Coca-Cola Bottling Co. Consolidated | 63,832 | 3,548 |
| | Village Super Market Inc. Class A | 84,293 | 2,782 |
| *,^ | China-Biotics Inc. | 166,523 | 2,448 |
| * | Central Garden and Pet Co. | 238,137 | 2,343 |
| *,^ | American Oriental Bioengineering Inc. | 943,796 | 2,265 |
| | National Beverage Corp. | 172,364 | 2,265 |
| | Farmer Bros Co. | 108,813 | 1,937 |
| * | Susser Holdings Corp. | 130,535 | 1,808 |
| * | Revlon Inc. Class A | 183,231 | 1,803 |
| *,^ | Feihe International Inc. | 166,479 | 1,771 |
| *,^ | AgFeed Industries Inc. | 527,845 | 1,552 |
| | Alico Inc. | 55,750 | 1,329 |
| | | | 655,753 |
| Energy (6.1%) | | |
| | SM Energy Co. | 939,777 | 55,381 |
5
| | | |
| Vanguard® Small-Cap Index Fund | | |
| Schedule of Investments | | |
| December 31, 2010 | | |
| |
| | | | Market |
| | | | Value |
| | | Shares | ($000) |
| * | Atlas Energy Inc. | 1,167,396 | 51,330 |
| * | Oil States International Inc. | 748,886 | 47,996 |
| * | Brigham Exploration Co. | 1,736,477 | 47,302 |
| * | Superior Energy Services Inc. | 1,173,416 | 41,058 |
| * | SandRidge Energy Inc. | 5,428,365 | 39,736 |
| * | Dril-Quip Inc. | 474,542 | 36,881 |
| | World Fuel Services Corp. | 955,297 | 34,543 |
| | Holly Corp. | 792,144 | 32,296 |
| * | Atwood Oceanics Inc. | 863,425 | 32,266 |
| | Berry Petroleum Co. Class A | 724,352 | 31,654 |
| * | Gran Tierra Energy Inc. | 3,785,391 | 30,472 |
| | SEACOR Holdings Inc. | 300,301 | 30,357 |
| | CARBO Ceramics Inc. | 292,641 | 30,300 |
| * | Rosetta Resources Inc. | 785,307 | 29,559 |
| | Frontier Oil Corp. | 1,574,049 | 28,349 |
| * | Unit Corp. | 605,459 | 28,142 |
| | Lufkin Industries Inc. | 446,056 | 27,829 |
| * | Complete Production Services Inc. | 926,316 | 27,373 |
| * | Energy XXI Bermuda Ltd. | 901,313 | 24,939 |
| * | Key Energy Services Inc. | 1,871,145 | 24,287 |
| * | Swift Energy Co. | 620,044 | 24,275 |
| * | Bristow Group Inc. | 511,739 | 24,231 |
| * | Bill Barrett Corp. | 581,846 | 23,931 |
| * | Patriot Coal Corp. | 1,151,058 | 22,296 |
| * | Northern Oil and Gas Inc. | 811,502 | 22,081 |
| * | Exterran Holdings Inc. | 894,306 | 21,419 |
| * | McMoRan Exploration Co. | 1,195,604 | 20,493 |
| * | Oasis Petroleum Inc. | 755,450 | 20,488 |
| * | International Coal Group Inc. | 2,579,401 | 19,965 |
| * | Cloud Peak Energy Inc. | 849,580 | 19,736 |
| * | Carrizo Oil & Gas Inc. | 543,384 | 18,741 |
| * | Helix Energy Solutions Group Inc. | 1,493,550 | 18,132 |
| * | Comstock Resources Inc. | 704,722 | 17,308 |
| * | Kodiak Oil & Gas Corp. | 2,455,944 | 16,209 |
| | Overseas Shipholding Group Inc. | 430,835 | 15,260 |
| * | Stone Energy Corp. | 650,844 | 14,507 |
| * | ION Geophysical Corp. | 1,701,015 | 14,425 |
| * | Petroleum Development Corp. | 340,446 | 14,370 |
| * | Enbridge Energy Management LLC | 223,307 | 14,258 |
| * | Tetra Technologies Inc. | 1,135,424 | 13,477 |
| ^ | RPC Inc. | 661,174 | 11,980 |
| * | CVR Energy Inc. | 771,074 | 11,705 |
| | Penn Virginia Corp. | 677,899 | 11,402 |
| | Contango Oil & Gas Co. | 187,967 | 10,889 |
| *,^ | ATP Oil & Gas Corp. | 648,490 | 10,856 |
| * | Gulfport Energy Corp. | 498,660 | 10,796 |
| * | Global Industries Ltd. | 1,541,421 | 10,682 |
| * | Gulfmark Offshore Inc. | 351,074 | 10,673 |
| * | James River Coal Co. | 413,721 | 10,480 |
| * | USEC Inc. | 1,698,800 | 10,227 |
| * | Clayton Williams Energy Inc. | 117,555 | 9,871 |
| *,^ | Clean Energy Fuels Corp. | 707,925 | 9,798 |
| * | Resolute Energy Corp. | 612,950 | 9,047 |
| | W&T Offshore Inc. | 500,344 | 8,941 |
| * | Western Refining Inc. | 794,205 | 8,403 |
| * | Newpark Resources Inc. | 1,338,422 | 8,245 |
| * | Approach Resources Inc. | 346,384 | 8,001 |
| * | Cal Dive International Inc. | 1,405,927 | 7,972 |
| * | Parker Drilling Co. | 1,738,745 | 7,946 |
| * | T-3 Energy Services Inc. | 199,143 | 7,932 |
| * | Energy Partners Ltd. | 506,665 | 7,529 |
| * | Hornbeck Offshore Services Inc. | 354,561 | 7,403 |
| * | Tesco Corp. | 449,905 | 7,144 |
| * | OYO Geospace Corp. | 71,779 | 7,114 |
6
| | | |
| Vanguard® Small-Cap Index Fund | | |
| Schedule of Investments | | |
| December 31, 2010 | | |
| |
| | | | Market |
| | | | Value |
| | | Shares | ($000) |
| * | Pioneer Drilling Co. | 805,404 | 7,096 |
| * | Rex Energy Corp. | 492,563 | 6,723 |
| * | Goodrich Petroleum Corp. | 362,973 | 6,403 |
| * | Petroquest Energy Inc. | 847,543 | 6,382 |
| * | Vaalco Energy Inc. | 841,293 | 6,024 |
| * | Venoco Inc. | 326,345 | 6,021 |
| * | Willbros Group Inc. | 605,045 | 5,942 |
| * | Hercules Offshore Inc. | 1,710,735 | 5,919 |
| * | Magnum Hunter Resources Corp. | 808,392 | 5,820 |
| * | Harvest Natural Resources Inc. | 474,943 | 5,780 |
| *,^ | BPZ Resources Inc. | 1,203,495 | 5,729 |
| | Gulf Island Fabrication Inc. | 202,149 | 5,697 |
| * | Basic Energy Services Inc. | 338,383 | 5,577 |
| | Crosstex Energy Inc. | 628,927 | 5,572 |
| *,^ | Uranium Energy Corp. | 858,473 | 5,185 |
| * | Matrix Service Co. | 414,421 | 5,048 |
| * | Warren Resources Inc. | 1,005,165 | 4,543 |
| *,^ | Cheniere Energy Inc. | 814,817 | 4,498 |
| | General Maritime Corp. | 1,329,635 | 4,321 |
| * | Allis-Chalmers Energy Inc. | 593,231 | 4,206 |
| * | Endeavour International Corp. | 296,146 | 4,087 |
| * | Dawson Geophysical Co. | 117,594 | 3,751 |
| *,^ | L&L Energy Inc. | 333,498 | 3,602 |
| * | Gastar Exploration Ltd. | 836,009 | 3,595 |
| * | PHI Inc. | 185,303 | 3,491 |
| * | Global Geophysical Services Inc. | 265,833 | 2,759 |
| *,^ | Delta Petroleum Corp. | 2,722,270 | 2,069 |
| * | Oilsands Quest Inc. | 4,675,473 | 1,964 |
| | Delek US Holdings Inc. | 205,213 | 1,494 |
| *,^ | China Integrated Energy Inc. | 179,053 | 1,312 |
| ^ | Alon USA Energy Inc. | 160,127 | 958 |
| * | Contango ORE Inc. | | 186 |
| | | | 1,474,442 |
| Financials (20.1%) | | |
| | Camden Property Trust | 997,373 | 53,838 |
| * | E*Trade Financial Corp. | 3,288,077 | 52,609 |
| | Essex Property Trust Inc. | 451,670 | 51,590 |
| | Ares Capital Corp. | 3,016,241 | 49,708 |
| * | Popular Inc. | 15,230,904 | 47,825 |
| | Senior Housing Properties Trust | 2,085,056 | 45,746 |
| | Arthur J Gallagher & Co. | 1,567,490 | 45,583 |
| | Apartment Investment & Management Co. | 1,743,864 | 45,061 |
| | Waddell & Reed Financial Inc. Class A | 1,272,215 | 44,896 |
| | Developers Diversified Realty Corp. | 3,165,817 | 44,606 |
| | First Niagara Financial Group Inc. | 3,114,859 | 43,546 |
| | BRE Properties Inc. | 954,097 | 41,503 |
| | Taubman Centers Inc. | 814,780 | 41,130 |
| | East West Bancorp Inc. | 2,093,203 | 40,922 |
| | Mack-Cali Realty Corp. | 1,183,198 | 39,117 |
| * | American Capital Ltd. | 5,013,963 | 37,906 |
| | Allied World Assurance Co. Holdings Ltd. | 618,661 | 36,773 |
| | BioMed Realty Trust Inc. | 1,914,490 | 35,705 |
| | Corporate Office Properties Trust | 981,490 | 34,303 |
| | CBL & Associates Properties Inc. | 1,954,766 | 34,208 |
| | MFA Financial Inc. | 4,185,969 | 34,158 |
| | Protective Life Corp. | 1,275,659 | 33,984 |
| | Highwoods Properties Inc. | 1,066,398 | 33,965 |
| | Bank of Hawaii Corp. | 718,649 | 33,927 |
| * | SVB Financial Group | 624,514 | 33,130 |
| | National Retail Properties Inc. | 1,242,520 | 32,927 |
| | Aspen Insurance Holdings Ltd. | 1,142,196 | 32,690 |
| | Valley National Bancorp | 2,279,886 | 32,602 |
| | FirstMerit Corp. | 1,619,612 | 32,052 |
| | Endurance Specialty Holdings Ltd. | 695,402 | 32,037 |
7
| | |
| Vanguard® Small-Cap Index Fund | | |
| Schedule of Investments | | |
| December 31, 2010 | | |
| |
| | | Market |
| | | Value |
| | Shares | ($000) |
| Entertainment Properties Trust | 692,581 | 32,032 |
| Apollo Investment Corp. | 2,885,963 | 31,948 |
| Omega Healthcare Investors Inc. | 1,411,209 | 31,668 |
| StanCorp Financial Group Inc. | 696,244 | 31,428 |
| Hanover Insurance Group Inc. | 669,391 | 31,274 |
| Mid-America Apartment Communities Inc. | 488,323 | 31,004 |
| Home Properties Inc. | 558,339 | 30,982 |
| Tanger Factory Outlet Centers | 602,615 | 30,848 |
| American Campus Communities Inc. | 966,863 | 30,708 |
| Fulton Financial Corp. | 2,960,142 | 30,608 |
| Alterra Capital Holdings Ltd. | 1,413,214 | 30,582 |
| * Forest City Enterprises Inc. Class A | 1,817,391 | 30,332 |
| * Signature Bank | 604,365 | 30,218 |
| Erie Indemnity Co. Class A | 452,643 | 29,635 |
| Synovus Financial Corp. | 11,104,572 | 29,316 |
| * Stifel Financial Corp. | 469,571 | 29,132 |
| Washington Real Estate Investment Trust | 930,294 | 28,830 |
| * MBIA Inc. | 2,389,630 | 28,652 |
| Kilroy Realty Corp. | 779,467 | 28,427 |
| Washington Federal Inc. | 1,674,372 | 28,330 |
| TCF Financial Corp. | 1,908,088 | 28,259 |
| * Alleghany Corp. | 92,084 | 28,212 |
| DiamondRock Hospitality Co. | 2,301,466 | 27,618 |
| Platinum Underwriters Holdings Ltd. | 611,841 | 27,514 |
| LaSalle Hotel Properties | 1,039,116 | 27,433 |
| * MGIC Investment Corp. | 2,688,821 | 27,399 |
| ^ American Capital Agency Corp. | 953,033 | 27,390 |
| CommonWealth REIT | 1,073,458 | 27,384 |
| CapitalSource Inc. | 3,853,223 | 27,358 |
| Douglas Emmett Inc. | 1,644,265 | 27,295 |
| * ProAssurance Corp. | 449,855 | 27,261 |
| Post Properties Inc. | 724,901 | 26,314 |
| Prosperity Bancshares Inc. | 659,760 | 25,915 |
| Equity Lifestyle Properties Inc. | 434,582 | 24,306 |
| Westamerica Bancorporation | 434,450 | 24,099 |
| * CNO Financial Group Inc. | 3,550,710 | 24,074 |
| Iberiabank Corp. | 399,966 | 23,650 |
| Brandywine Realty Trust | 1,965,359 | 22,896 |
| Trustmark Corp. | 903,718 | 22,448 |
| Starwood Property Trust Inc. | 1,021,558 | 21,943 |
| Webster Financial Corp. | 1,104,292 | 21,755 |
| Extra Space Storage Inc. | 1,236,752 | 21,519 |
| NewAlliance Bancshares Inc. | 1,408,663 | 21,102 |
| First American Financial Corp. | 1,395,559 | 20,850 |
| Delphi Financial Group Inc. | 722,026 | 20,823 |
| Montpelier Re Holdings Ltd. | 1,042,346 | 20,784 |
| Umpqua Holdings Corp. | 1,705,378 | 20,771 |
| Whitney Holding Corp. | 1,439,262 | 20,366 |
| Hatteras Financial Corp. | 672,585 | 20,359 |
| Healthcare Realty Trust Inc. | 948,497 | 20,080 |
| UMB Financial Corp. | 481,980 | 19,964 |
| Northwest Bancshares Inc. | 1,648,822 | 19,390 |
| Potlatch Corp. | 595,157 | 19,372 |
| * PHH Corp. | 825,973 | 19,121 |
| * Portfolio Recovery Associates Inc. | 253,901 | 19,093 |
| DuPont Fabros Technology Inc. | 883,561 | 18,793 |
| Susquehanna Bancshares Inc. | 1,931,153 | 18,694 |
| Cathay General Bancorp | 1,110,477 | 18,545 |
| * Knight Capital Group Inc. Class A | 1,337,567 | 18,445 |
| Astoria Financial Corp. | 1,311,699 | 18,246 |
| Colonial Properties Trust | 1,007,583 | 18,187 |
| * Sunstone Hotel Investors Inc. | 1,759,748 | 18,178 |
| Unitrin Inc. | 737,399 | 18,096 |
| ^ United Bankshares Inc. | 616,589 | 18,004 |
8
| | | |
| Vanguard® Small-Cap Index Fund | | |
| Schedule of Investments | | |
| December 31, 2010 | | |
| |
| | | | Market |
| | | | Value |
| | | Shares | ($000) |
| | Medical Properties Trust Inc. | 1,659,136 | 17,968 |
| | BancorpSouth Inc. | 1,118,304 | 17,837 |
| * | Ezcorp Inc. Class A | 654,078 | 17,745 |
| * | MF Global Holdings Ltd. | 2,092,835 | 17,496 |
| | Argo Group International Holdings Ltd. | 462,542 | 17,322 |
| | EastGroup Properties Inc. | 401,401 | 16,987 |
| | Wintrust Financial Corp. | 511,497 | 16,895 |
| | Symetra Financial Corp. | 1,231,114 | 16,866 |
| | FNB Corp. | 1,705,103 | 16,744 |
| | DCT Industrial Trust Inc. | 3,144,881 | 16,699 |
| | National Health Investors Inc. | 370,812 | 16,694 |
| | Redwood Trust Inc. | 1,102,489 | 16,460 |
| | PS Business Parks Inc. | 292,938 | 16,322 |
| | International Bancshares Corp. | 809,823 | 16,221 |
| | Glacier Bancorp Inc. | 1,070,204 | 16,171 |
| | Cash America International Inc. | 437,505 | 16,157 |
| | First Financial Bancorp | 865,799 | 16,000 |
| | Radian Group Inc. | 1,978,510 | 15,967 |
| | Invesco Mortgage Capital Inc. | 722,910 | 15,788 |
| | Tower Group Inc. | 609,968 | 15,603 |
| | Old National Bancorp | 1,297,333 | 15,425 |
| ^ | Lexington Realty Trust | 1,938,044 | 15,407 |
| | Hancock Holding Co. | 439,103 | 15,307 |
| | Franklin Street Properties Corp. | 1,069,574 | 15,241 |
| | Sovran Self Storage Inc. | 410,794 | 15,121 |
| | National Penn Bancshares Inc. | 1,877,026 | 15,073 |
| | First Citizens BancShares Inc. Class A | 78,204 | 14,784 |
| | Hersha Hospitality Trust Class A | 2,200,303 | 14,522 |
| | Selective Insurance Group Inc. | 794,928 | 14,428 |
| | Alexander's Inc. | 34,212 | 14,105 |
| | KBW Inc. | 501,336 | 13,997 |
| | Equity One Inc. | 762,305 | 13,859 |
| | Community Bank System Inc. | 493,715 | 13,710 |
| | MB Financial Inc. | 762,811 | 13,212 |
| | Capstead Mortgage Corp. | 1,044,298 | 13,148 |
| | RLI Corp. | 249,307 | 13,106 |
| | PrivateBancorp Inc. Class A | 903,501 | 12,992 |
| | First Financial Bankshares Inc. | 248,374 | 12,712 |
| | First Midwest Bancorp Inc. | 1,102,778 | 12,704 |
| | NBT Bancorp Inc. | 513,545 | 12,402 |
| | Park National Corp. | 170,656 | 12,402 |
| | Columbia Banking System Inc. | 585,617 | 12,333 |
| * | World Acceptance Corp. | 233,332 | 12,320 |
| | Anworth Mortgage Asset Corp. | 1,756,406 | 12,295 |
| | Provident Financial Services Inc. | 810,370 | 12,261 |
| | Prospect Capital Corp. | 1,126,726 | 12,169 |
| | First Potomac Realty Trust | 721,314 | 12,132 |
| * | Greenlight Capital Re Ltd. Class A | 449,482 | 12,051 |
| | American National Insurance Co. | 139,742 | 11,965 |
| | U-Store-It Trust | 1,255,178 | 11,962 |
| * | Strategic Hotels & Resorts Inc. | 2,250,804 | 11,907 |
| * | First Cash Financial Services Inc. | 383,221 | 11,876 |
| | Government Properties Income Trust | 438,388 | 11,744 |
| | Infinity Property & Casualty Corp. | 188,413 | 11,644 |
| | Solar Capital Ltd. | 469,147 | 11,625 |
| | Cousins Properties Inc. | 1,377,663 | 11,490 |
| | Pebblebrook Hotel Trust | 564,327 | 11,467 |
| | Pennsylvania Real Estate Investment Trust | 782,379 | 11,368 |
| | BlackRock Kelso Capital Corp. | 1,008,708 | 11,156 |
| | Cypress Sharpridge Investments Inc. | 859,580 | 11,097 |
| * | Texas Capital Bancshares Inc. | 519,934 | 11,059 |
| | CVB Financial Corp. | 1,267,071 | 10,985 |
| | Acadia Realty Trust | 597,991 | 10,907 |
| *,^ | iStar Financial Inc. | 1,391,529 | 10,882 |
9
| | |
| Vanguard® Small-Cap Index Fund | | |
| Schedule of Investments | | |
| December 31, 2010 | | |
| |
| | | Market |
| | | Value |
| | Shares | ($000) |
| * Kindred Healthcare Inc. | 587,422 | 10,791 |
| First Commonwealth Financial Corp. | 1,522,957 | 10,783 |
| Nelnet Inc. Class A | 452,425 | 10,718 |
| Employers Holdings Inc. | 611,303 | 10,686 |
| * Ocwen Financial Corp. | 1,118,096 | 10,667 |
| Horace Mann Educators Corp. | 586,376 | 10,578 |
| ^ Primerica Inc. | 432,991 | 10,500 |
| Getty Realty Corp. | 334,221 | 10,454 |
| * Investment Technology Group Inc. | 636,119 | 10,413 |
| American Equity Investment Life Holding Co. | 827,479 | 10,385 |
| * Dollar Financial Corp. | 362,553 | 10,380 |
| Glimcher Realty Trust | 1,234,740 | 10,372 |
| Investors Real Estate Trust | 1,156,018 | 10,369 |
| Compass Diversified Holdings | 584,306 | 10,336 |
| * Piper Jaffray Cos. | 294,983 | 10,327 |
| Oritani Financial Corp. | 836,625 | 10,240 |
| * FelCor Lodging Trust Inc. | 1,444,015 | 10,166 |
| Sterling Bancshares Inc. | 1,441,757 | 10,121 |
| * Investors Bancorp Inc. | 769,418 | 10,095 |
| Inland Real Estate Corp. | 1,146,596 | 10,090 |
| Interactive Brokers Group Inc. | 565,755 | 10,082 |
| * Navigators Group Inc. | 200,121 | 10,076 |
| optionsXpress Holdings Inc. | 641,545 | 10,053 |
| * Forestar Group Inc. | 515,827 | 9,955 |
| Fifth Street Finance Corp. | 811,540 | 9,852 |
| LTC Properties Inc. | 345,759 | 9,709 |
| Saul Centers Inc. | 204,986 | 9,706 |
| * Pico Holdings Inc. | 303,401 | 9,648 |
| * Enstar Group Ltd. | 113,303 | 9,583 |
| PacWest Bancorp | 447,282 | 9,563 |
| Brookline Bancorp Inc. | 881,264 | 9,562 |
| Oriental Financial Group Inc. | 734,330 | 9,172 |
| Associated Estates Realty Corp. | 599,685 | 9,169 |
| Evercore Partners Inc. Class A | 268,450 | 9,127 |
| Chemical Financial Corp. | 408,740 | 9,054 |
| Safety Insurance Group Inc. | 190,055 | 9,041 |
| ^ S&T Bancorp Inc. | 393,488 | 8,889 |
| * Credit Acceptance Corp. | 141,388 | 8,875 |
| Flagstone Reinsurance Holdings SA | 696,892 | 8,781 |
| Bank of the Ozarks Inc. | 202,486 | 8,778 |
| Sun Communities Inc. | 259,125 | 8,631 |
| * National Financial Partners Corp. | 634,972 | 8,509 |
| MarketAxess Holdings Inc. | 408,317 | 8,497 |
| City Holding Co. | 232,179 | 8,412 |
| Independent Bank Corp. | 299,972 | 8,114 |
| * Financial Engines Inc. | 400,657 | 7,945 |
| Meadowbrook Insurance Group Inc. | 757,311 | 7,762 |
| * Internet Capital Group Inc. | 544,272 | 7,740 |
| * Altisource Portfolio Solutions SA | 262,924 | 7,549 |
| * PMI Group Inc. | 2,279,801 | 7,523 |
| * Western Alliance Bancorp | 1,021,169 | 7,516 |
| * First Industrial Realty Trust Inc. | 854,680 | 7,487 |
| Cohen & Steers Inc. | 286,535 | 7,479 |
| Home Bancshares Inc. | 338,686 | 7,461 |
| United Fire & Casualty Co. | 334,202 | 7,459 |
| Trustco Bank Corp. NY | 1,145,587 | 7,263 |
| BGC Partners Inc. Class A | 870,980 | 7,238 |
| Amtrust Financial Services Inc. | 398,676 | 6,977 |
| Artio Global Investors Inc. Class A | 470,035 | 6,933 |
| Walter Investment Management Corp. | 384,726 | 6,902 |
| WesBanco Inc. | 355,721 | 6,744 |
| * Ashford Hospitality Trust Inc. | 697,519 | 6,731 |
| Harleysville Group Inc. | 182,673 | 6,711 |
| Boston Private Financial Holdings Inc. | 1,022,206 | 6,695 |
10
| | |
| Vanguard® Small-Cap Index Fund | | |
| Schedule of Investments | | |
| December 31, 2010 | | |
| |
| | | Market |
| | | Value |
| | Shares | ($000) |
| Ramco-Gershenson Properties Trust | 537,337 | 6,690 |
| Education Realty Trust Inc. | 854,229 | 6,637 |
| Sandy Spring Bancorp Inc. | 356,958 | 6,579 |
| * Pinnacle Financial Partners Inc. | 472,977 | 6,423 |
| Hercules Technology Growth Capital Inc. | 619,870 | 6,422 |
| Dime Community Bancshares Inc. | 437,416 | 6,382 |
| FBL Financial Group Inc. Class A | 221,491 | 6,350 |
| Universal Health Realty Income Trust | 173,258 | 6,329 |
| * Hilltop Holdings Inc. | 633,297 | 6,282 |
| * CNA Surety Corp. | 263,683 | 6,244 |
| SCBT Financial Corp. | 190,038 | 6,224 |
| Simmons First National Corp. Class A | 217,680 | 6,204 |
| Maiden Holdings Ltd. | 785,762 | 6,176 |
| Flushing Financial Corp. | 441,138 | 6,176 |
| Retail Opportunity Investments Corp. | 621,943 | 6,163 |
| Renasant Corp. | 354,561 | 5,996 |
| National Western Life Insurance Co. Class A | 35,654 | 5,944 |
| Wilmington Trust Corp. | 1,364,944 | 5,924 |
| ViewPoint Financial Group | 493,235 | 5,766 |
| Parkway Properties Inc. | 325,959 | 5,711 |
| ^ TowneBank | 356,798 | 5,670 |
| * Tejon Ranch Co. | 205,289 | 5,656 |
| Two Harbors Investment Corp. | 575,200 | 5,631 |
| Community Trust Bancorp Inc. | 192,666 | 5,580 |
| Cedar Shopping Centers Inc. | 879,273 | 5,531 |
| First Financial Corp. | 155,945 | 5,480 |
| NorthStar Realty Finance Corp. | 1,147,785 | 5,452 |
| Provident New York Bancorp | 516,862 | 5,422 |
| Duff & Phelps Corp. Class A | 314,577 | 5,304 |
| Danvers Bancorp Inc. | 298,873 | 5,281 |
| * Nara Bancorp Inc. | 537,033 | 5,274 |
| Hudson Valley Holding Corp. | 210,825 | 5,220 |
| * FPIC Insurance Group Inc. | 141,005 | 5,212 |
| OneBeacon Insurance Group Ltd. Class A | 342,093 | 5,186 |
| GFI Group Inc. | 1,093,978 | 5,131 |
| Kite Realty Group Trust | 943,217 | 5,103 |
| Tompkins Financial Corp. | 129,549 | 5,073 |
| MVC Capital Inc. | 343,544 | 5,016 |
| CapLease Inc. | 855,346 | 4,978 |
| StellarOne Corp. | 340,213 | 4,947 |
| Urstadt Biddle Properties Inc. Class A | 251,631 | 4,894 |
| Lakeland Financial Corp. | 227,794 | 4,888 |
| * AMERISAFE Inc. | 277,242 | 4,852 |
| * Citizens Inc. | 650,943 | 4,850 |
| * NewStar Financial Inc. | 458,691 | 4,848 |
| Chesapeake Lodging Trust | 256,244 | 4,820 |
| SY Bancorp Inc. | 194,221 | 4,768 |
| * eHealth Inc. | 334,543 | 4,747 |
| Cardinal Financial Corp. | 406,732 | 4,730 |
| Bancfirst Corp. | 114,114 | 4,700 |
| WSFS Financial Corp. | 99,010 | 4,697 |
| * International Assets Holding Corp. | 196,465 | 4,637 |
| Berkshire Hills Bancorp Inc. | 208,630 | 4,611 |
| Capital Southwest Corp. | 44,253 | 4,593 |
| Pennymac Mortgage Investment Trust | 251,940 | 4,573 |
| Univest Corp. of Pennsylvania | 234,912 | 4,503 |
| Winthrop Realty Trust | 351,477 | 4,495 |
| Southside Bancshares Inc. | 213,323 | 4,495 |
| Washington Trust Bancorp Inc. | 204,946 | 4,484 |
| * Global Indemnity plc | 217,403 | 4,446 |
| Arrow Financial Corp. | 160,489 | 4,415 |
| 1st Source Corp. | 218,018 | 4,413 |
| * Phoenix Cos. Inc. | 1,727,153 | 4,387 |
| Colony Financial Inc. | 218,966 | 4,384 |
11
| | |
| Vanguard® Small-Cap Index Fund | | |
| Schedule of Investments | | |
| December 31, 2010 | | |
| |
| | | Market |
| | | Value |
| | Shares | ($000) |
| * Beneficial Mutual Bancorp Inc. | 485,121 | 4,284 |
| First Busey Corp. | 888,524 | 4,176 |
| Calamos Asset Management Inc. Class A | 297,133 | 4,160 |
| State Auto Financial Corp. | 238,352 | 4,152 |
| Union First Market Bankshares Corp. | 269,637 | 3,985 |
| Sterling Bancorp | 379,191 | 3,970 |
| Camden National Corp. | 108,478 | 3,930 |
| Oppenheimer Holdings Inc. Class A | 148,430 | 3,890 |
| Northfield Bancorp Inc. | 290,993 | 3,876 |
| * Flagstar Bancorp Inc. | 2,368,180 | 3,860 |
| First Mercury Financial Corp. | 225,396 | 3,696 |
| * TradeStation Group Inc. | 542,083 | 3,659 |
| * Citizens Republic Bancorp Inc. | 5,946,597 | 3,657 |
| Westfield Financial Inc. | 394,656 | 3,651 |
| Advance America Cash Advance Centers Inc. | 647,062 | 3,649 |
| Republic Bancorp Inc. Class A | 152,869 | 3,631 |
| Territorial Bancorp Inc. | 182,164 | 3,627 |
| First Community Bancshares Inc. | 239,287 | 3,575 |
| Suffolk Bancorp | 144,695 | 3,571 |
| Westwood Holdings Group Inc. | 88,864 | 3,551 |
| Lakeland Bancorp Inc. | 321,483 | 3,527 |
| Hudson Pacific Properties Inc. | 230,815 | 3,474 |
| First Bancorp | 225,112 | 3,446 |
| Southwest Bancorp Inc. | 274,201 | 3,400 |
| * Kennedy-Wilson Holdings Inc. | 338,116 | 3,378 |
| First Merchants Corp. | 380,118 | 3,368 |
| First Interstate Bancsystem Inc. | 220,414 | 3,359 |
| United Financial Bancorp Inc. | 218,400 | 3,335 |
| GAMCO Investors Inc. | 67,520 | 3,242 |
| Trico Bancshares | 200,505 | 3,238 |
| * FBR Capital Markets Corp. | 827,647 | 3,162 |
| Epoch Holding Corp. | 203,453 | 3,160 |
| Bank Mutual Corp. | 646,108 | 3,088 |
| THL Credit Inc. | 235,851 | 3,068 |
| Presidential Life Corp. | 308,383 | 3,062 |
| Abington Bancorp Inc. | 254,463 | 3,036 |
| SeaBright Holdings Inc. | 328,947 | 3,033 |
| CoBiz Financial Inc. | 495,560 | 3,013 |
| Stewart Information Services Corp. | 258,037 | 2,975 |
| Heartland Financial USA Inc. | 170,274 | 2,973 |
| NGP Capital Resources Co. | 322,929 | 2,971 |
| MainSource Financial Group Inc. | 284,215 | 2,959 |
| First Financial Holdings Inc. | 246,005 | 2,832 |
| Great Southern Bancorp Inc. | 119,971 | 2,830 |
| Baldwin & Lyons Inc. | 117,544 | 2,766 |
| Home Federal Bancorp Inc. | 222,887 | 2,735 |
| * Gleacher & Co. Inc. | 1,143,898 | 2,711 |
| Citizens & Northern Corp. | 181,008 | 2,690 |
| CreXus Investment Corp. | 201,921 | 2,645 |
| * United Community Banks Inc. | 1,331,912 | 2,597 |
| BankFinancial Corp. | 265,337 | 2,587 |
| * Avatar Holdings Inc. | 127,184 | 2,521 |
| Consolidated-Tomoka Land Co. | 81,272 | 2,349 |
| Golub Capital BDC Inc. | 132,933 | 2,276 |
| Kansas City Life Insurance Co. | 68,730 | 2,270 |
| * Doral Financial Corp. | 1,603,484 | 2,213 |
| SWS Group Inc. | 436,796 | 2,206 |
| Wilshire Bancorp Inc. | 286,557 | 2,184 |
| ESSA Bancorp Inc. | 165,124 | 2,183 |
| National Interstate Corp. | 101,428 | 2,171 |
| Donegal Group Inc. Class A | 149,561 | 2,166 |
| ^ Ames National Corp. | 98,544 | 2,135 |
| ^ Life Partners Holdings Inc. | 111,518 | 2,133 |
| * First Marblehead Corp. | 979,586 | 2,126 |
12
| | | |
| Vanguard® Small-Cap Index Fund | | |
| Schedule of Investments | | |
| December 31, 2010 | | |
| |
| | | | Market |
| | | | Value |
| | | Shares | ($000) |
| | Student Loan Corp. | 60,108 | 1,950 |
| | Capital City Bank Group Inc. | 154,265 | 1,944 |
| * | Meridian Interstate Bancorp Inc. | 152,226 | 1,795 |
| | EMC Insurance Group Inc. | 77,641 | 1,758 |
| | Rockville Financial Inc. | 133,081 | 1,626 |
| * | Penson Worldwide Inc. | 293,882 | 1,437 |
| * | Asset Acceptance Capital Corp. | 226,453 | 1,343 |
| | Universal Insurance Holdings Inc. | 266,234 | 1,297 |
| | Roma Financial Corp. | 116,287 | 1,233 |
| | CompuCredit Holdings Corp. | 162,546 | 1,135 |
| | Urstadt Biddle Properties Inc. | 57,942 | 962 |
| | Pzena Investment Management Inc. Class A | 130,783 | 961 |
| * | CSF Holdings Inc. Contingent Litigation Rights | 29,125 | — |
| | | | 4,826,607 |
| Health Care (10.9%) | | |
| * | Allscripts Healthcare Solutions Inc. | 2,648,261 | 51,032 |
| * | United Therapeutics Corp. | 798,665 | 50,492 |
| * | Tenet Healthcare Corp. | 7,229,199 | 48,363 |
| * | Mednax Inc. | 709,422 | 47,737 |
| | PerkinElmer Inc. | 1,756,870 | 45,362 |
| * | BioMarin Pharmaceutical Inc. | 1,520,751 | 40,954 |
| * | Salix Pharmaceuticals Ltd. | 860,889 | 40,427 |
| * | Health Net Inc. | 1,451,587 | 39,614 |
| | Cooper Cos. Inc. | 693,533 | 39,074 |
| | Hill-Rom Holdings Inc. | 945,358 | 37,219 |
| * | Health Management Associates Inc. Class A | 3,731,175 | 35,595 |
| * | Onyx Pharmaceuticals Inc. | 934,012 | 34,437 |
| * | Regeneron Pharmaceuticals Inc. | 1,018,943 | 33,452 |
| * | AMERIGROUP Corp. | 759,836 | 33,372 |
| * | Brookdale Senior Living Inc. Class A | 1,526,282 | 32,678 |
| | STERIS Corp. | 887,027 | 32,341 |
| | Teleflex Inc. | 594,963 | 32,015 |
| * | Dionex Corp. | 260,057 | 30,689 |
| * | Incyte Corp. Ltd. | 1,817,312 | 30,095 |
| * | LifePoint Hospitals Inc. | 807,374 | 29,671 |
| * | Emergency Medical Services Corp. Class A | 450,551 | 29,110 |
| * | Healthsouth Corp. | 1,391,811 | 28,824 |
| * | VCA Antech Inc. | 1,215,977 | 28,320 |
| | Owens & Minor Inc. | 943,153 | 27,757 |
| * | InterMune Inc. | 750,665 | 27,324 |
| * | Catalyst Health Solutions Inc. | 567,144 | 26,367 |
| * | HMS Holdings Corp. | 405,456 | 26,261 |
| * | Sirona Dental Systems Inc. | 617,151 | 25,785 |
| | Medicis Pharmaceutical Corp. Class A | 896,241 | 24,010 |
| * | Magellan Health Services Inc. | 497,104 | 23,503 |
| * | Thoratec Corp. | 827,065 | 23,422 |
| * | Haemonetics Corp. | 367,213 | 23,201 |
| | Masimo Corp. | 788,312 | 22,916 |
| * | Theravance Inc. | 908,945 | 22,787 |
| | Chemed Corp. | 339,421 | 21,557 |
| * | Talecris Biotherapeutics Holdings Corp. | 916,818 | 21,362 |
| * | American Medical Systems Holdings Inc. | 1,131,842 | 21,347 |
| | Quality Systems Inc. | 301,359 | 21,041 |
| * | Pharmasset Inc. | 480,555 | 20,861 |
| * | Immucor Inc. | 1,042,358 | 20,670 |
| | West Pharmaceutical Services Inc. | 495,024 | 20,395 |
| * | Cepheid Inc. | 889,528 | 20,237 |
| * | Par Pharmaceutical Cos. Inc. | 523,718 | 20,168 |
| * | Viropharma Inc. | 1,160,791 | 20,105 |
| *,^ | athenahealth Inc. | 482,816 | 19,786 |
| * | Centene Corp. | 770,403 | 19,522 |
| * | Healthspring Inc. | 723,816 | 19,203 |
| * | Seattle Genetics Inc. | 1,282,737 | 19,177 |
| * | WellCare Health Plans Inc. | 632,929 | 19,127 |
13
| | | |
| Vanguard® Small-Cap Index Fund | | |
| Schedule of Investments | | |
| December 31, 2010 | | |
| |
| | | | Market |
| | | | Value |
| | | Shares | ($000) |
| * | PSS World Medical Inc. | 841,759 | 19,024 |
| * | Cubist Pharmaceuticals Inc. | 879,537 | 18,822 |
| * | Volcano Corp. | 679,864 | 18,567 |
| * | Parexel International Corp. | 870,935 | 18,490 |
| * | Nektar Therapeutics | 1,402,689 | 18,025 |
| * | Alkermes Inc. | 1,415,929 | 17,388 |
| * | Align Technology Inc. | 845,019 | 16,512 |
| * | Bruker Corp. | 982,797 | 16,314 |
| * | Impax Laboratories Inc. | 802,519 | 16,139 |
| * | Acorda Therapeutics Inc. | 578,777 | 15,777 |
| * | Martek Biosciences Corp. | 498,023 | 15,588 |
| * | Integra LifeSciences Holdings Corp. | 324,550 | 15,351 |
| * | NuVasive Inc. | 586,293 | 15,038 |
| * | Auxilium Pharmaceuticals Inc. | 709,557 | 14,972 |
| *,^ | Amedisys Inc. | 429,215 | 14,379 |
| * | Isis Pharmaceuticals Inc. | 1,402,707 | 14,195 |
| | Meridian Bioscience Inc. | 604,666 | 14,004 |
| | Invacare Corp. | 442,421 | 13,343 |
| * | Exelixis Inc. | 1,617,940 | 13,283 |
| * | Neogen Corp. | 320,786 | 13,162 |
| * | MedAssets Inc. | 644,688 | 13,016 |
| * | Questcor Pharmaceuticals Inc. | 878,296 | 12,937 |
| * | Cyberonics Inc. | 415,823 | 12,899 |
| * | HeartWare International Inc. | 143,040 | 12,526 |
| * | DexCom Inc. | 916,858 | 12,515 |
| * | Arthrocare Corp. | 401,970 | 12,485 |
| * | Zoll Medical Corp. | 320,057 | 11,916 |
| * | CONMED Corp. | 428,559 | 11,327 |
| * | Vivus Inc. | 1,207,982 | 11,319 |
| * | Medicines Co. | 794,060 | 11,220 |
| * | Gentiva Health Services Inc. | 421,791 | 11,220 |
| * | Savient Pharmaceuticals Inc. | 1,006,628 | 11,214 |
| | PDL BioPharma Inc. | 1,782,458 | 11,105 |
| * | MWI Veterinary Supply Inc. | 174,548 | 11,023 |
| * | Sequenom Inc. | 1,344,604 | 10,784 |
| * | Luminex Corp. | 566,846 | 10,362 |
| | Universal American Corp. | 505,103 | 10,329 |
| * | NxStage Medical Inc. | 398,158 | 9,906 |
| * | Insulet Corp. | 634,342 | 9,832 |
| * | Amsurg Corp. Class A | 460,254 | 9,642 |
| * | Ariad Pharmaceuticals Inc. | 1,888,124 | 9,629 |
| *,^ | MannKind Corp. | 1,186,645 | 9,564 |
| | Analogic Corp. | 191,792 | 9,496 |
| * | Halozyme Therapeutics Inc. | 1,195,164 | 9,466 |
| * | IPC The Hospitalist Co. Inc. | 242,107 | 9,445 |
| * | Air Methods Corp. | 167,543 | 9,428 |
| *,^ | Momenta Pharmaceuticals Inc. | 626,800 | 9,383 |
| *,^ | Immunogen Inc. | 1,011,489 | 9,366 |
| *,^ | Geron Corp. | 1,785,934 | 9,233 |
| * | Hanger Orthopedic Group Inc. | 435,277 | 9,224 |
| * | Wright Medical Group Inc. | 583,955 | 9,069 |
| * | Targacept Inc. | 341,008 | 9,037 |
| * | Abaxis Inc. | 332,583 | 8,930 |
| * | Enzon Pharmaceuticals Inc. | 723,314 | 8,803 |
| * | Micromet Inc. | 1,082,919 | 8,793 |
| * | RehabCare Group Inc. | 370,917 | 8,791 |
| | Landauer Inc. | 140,045 | 8,398 |
| * | Greatbatch Inc. | 346,322 | 8,364 |
| *,^ | Emeritus Corp. | 421,319 | 8,304 |
| * | Bio-Reference Labs Inc. | 372,545 | 8,263 |
| * | Inspire Pharmaceuticals Inc. | 924,640 | 7,767 |
| * | NPS Pharmaceuticals Inc. | 981,030 | 7,750 |
| * | Celera Corp. | 1,220,330 | 7,688 |
| *,^ | SIGA Technologies Inc. | 546,581 | 7,652 |
14
| | | |
| Vanguard® Small-Cap Index Fund | | |
| Schedule of Investments | | |
| December 31, 2010 | | |
| |
| | | | Market |
| | | | Value |
| | | Shares | ($000) |
| * | Orthofix International NV | 262,719 | 7,619 |
| * | Ardea Biosciences Inc. | 289,545 | 7,528 |
| * | Medivation Inc. | 489,183 | 7,421 |
| * | Emergent Biosolutions Inc. | 309,744 | 7,267 |
| * | LHC Group Inc. | 236,317 | 7,090 |
| * | Omnicell Inc. | 487,086 | 7,038 |
| | Computer Programs & Systems Inc. | 147,450 | 6,907 |
| * | Accelrys Inc. | 823,288 | 6,833 |
| *,^ | Protalix BioTherapeutics Inc. | 663,135 | 6,618 |
| * | ICU Medical Inc. | 180,053 | 6,572 |
| * | SonoSite Inc. | 206,135 | 6,514 |
| | Sabra Healthcare REIT Inc. | 352,108 | 6,479 |
| * | Emdeon Inc. Class A | 473,502 | 6,411 |
| * | Medidata Solutions Inc. | 266,497 | 6,364 |
| * | Merit Medical Systems Inc. | 399,680 | 6,327 |
| * | Molina Healthcare Inc. | 221,836 | 6,178 |
| * | Natus Medical Inc. | 430,040 | 6,098 |
| * | Select Medical Holdings Corp. | 832,585 | 6,086 |
| * | Conceptus Inc. | 439,321 | 6,063 |
| * | Rigel Pharmaceuticals Inc. | 774,654 | 5,833 |
| *,^ | MAKO Surgical Corp. | 382,315 | 5,819 |
| * | Triple-S Management Corp. Class B | 299,656 | 5,717 |
| * | Healthways Inc. | 509,121 | 5,682 |
| * | AMAG Pharmaceuticals Inc. | 312,963 | 5,665 |
| * | Angiodynamics Inc. | 368,194 | 5,659 |
| *,^ | Opko Health Inc. | 1,522,877 | 5,589 |
| * | Accretive Health Inc. | 338,513 | 5,501 |
| * | Allos Therapeutics Inc. | 1,174,273 | 5,413 |
| * | eResearchTechnology Inc. | 727,274 | 5,345 |
| * | Affymetrix Inc. | 1,055,606 | 5,310 |
| * | Alnylam Pharmaceuticals Inc. | 533,795 | 5,263 |
| * | Quidel Corp. | 361,412 | 5,222 |
| * | PharMerica Corp. | 455,960 | 5,221 |
| | National Healthcare Corp. | 112,605 | 5,210 |
| * | Corvel Corp. | 105,948 | 5,123 |
| * | Akorn Inc. | 836,478 | 5,077 |
| * | Accuray Inc. | 744,765 | 5,027 |
| * | Genoptix Inc. | 262,897 | 5,000 |
| | Cantel Medical Corp. | 213,273 | 4,991 |
| * | Symmetry Medical Inc. | 537,033 | 4,968 |
| * | MAP Pharmaceuticals Inc. | 287,868 | 4,819 |
| * | Almost Family Inc. | 124,004 | 4,764 |
| *,^ | Metabolix Inc. | 381,682 | 4,645 |
| * | Assisted Living Concepts Inc. Class A | 142,106 | 4,623 |
| *,^ | Genomic Health Inc. | 215,635 | 4,612 |
| * | ABIOMED Inc. | 478,508 | 4,598 |
| *,^ | Clinical Data Inc. | 288,485 | 4,590 |
| * | Sun Healthcare Group Inc. | 350,604 | 4,439 |
| | Atrion Corp. | 24,165 | 4,337 |
| *,^ | Orexigen Therapeutics Inc. | 527,292 | 4,261 |
| | Ensign Group Inc. | 169,781 | 4,222 |
| *,^ | Cadence Pharmaceuticals Inc. | 553,187 | 4,177 |
| *,^ | Unilife Corp. | 785,479 | 4,163 |
| * | Sunrise Senior Living Inc. | 750,350 | 4,089 |
| * | Sangamo Biosciences Inc. | 606,956 | 4,030 |
| * | Durect Corp. | 1,161,565 | 4,007 |
| * | XenoPort Inc. | 463,296 | 3,947 |
| * | BioMimetic Therapeutics Inc. | 309,666 | 3,933 |
| *,^ | Cell Therapeutics Inc. | 10,723,002 | 3,914 |
| * | OraSure Technologies Inc. | 652,626 | 3,753 |
| * | Cypress Bioscience Inc. | 578,135 | 3,746 |
| * | Palomar Medical Technologies Inc. | 262,413 | 3,729 |
| * | Arqule Inc. | 634,206 | 3,723 |
| * | Team Health Holdings Inc. | 239,341 | 3,719 |
15
| | | |
| Vanguard® Small-Cap Index Fund | | |
| Schedule of Investments | | |
| December 31, 2010 | | |
| |
| | | | Market |
| | | | Value |
| | | Shares | ($000) |
| | Pain Therapeutics Inc. | 539,631 | 3,643 |
| * | Kensey Nash Corp. | 130,880 | 3,642 |
| * | Lexicon Pharmaceuticals Inc. | 2,510,527 | 3,615 |
| * | Cross Country Healthcare Inc. | 416,344 | 3,526 |
| * | Medcath Corp. | 244,055 | 3,405 |
| * | PROLOR Biotech Inc. | 519,977 | 3,364 |
| * | Obagi Medical Products Inc. | 275,326 | 3,180 |
| * | AMN Healthcare Services Inc. | 487,467 | 2,993 |
| * | Dyax Corp. | 1,393,363 | 2,982 |
| * | Codexis Inc. | 279,312 | 2,961 |
| * | Ironwood Pharmaceuticals Inc. | 284,999 | 2,950 |
| *,^ | Arena Pharmaceuticals Inc. | 1,680,293 | 2,890 |
| * | Vital Images Inc. | 202,803 | 2,835 |
| *,^ | Biotime Inc. | 335,268 | 2,793 |
| * | IRIS International Inc. | 272,761 | 2,790 |
| * | Skilled Healthcare Group Inc. | 309,780 | 2,782 |
| * | Nabi Biopharmaceuticals | 480,215 | 2,780 |
| * | SurModics Inc. | 232,952 | 2,765 |
| * | Idenix Pharmaceuticals Inc. | 548,303 | 2,763 |
| * | Enzo Biochem Inc. | 513,018 | 2,709 |
| * | Synovis Life Technologies Inc. | 167,878 | 2,705 |
| * | Progenics Pharmaceuticals Inc. | 488,496 | 2,667 |
| *,^ | Stereotaxis Inc. | 693,259 | 2,655 |
| * | Pozen Inc. | 358,260 | 2,382 |
| * | Exactech Inc. | 125,584 | 2,363 |
| * | Ligand Pharmaceuticals Inc. Class B | 264,637 | 2,361 |
| * | TomoTherapy Inc. | 649,763 | 2,346 |
| *,^ | China Biologic Products Inc. | 139,720 | 2,290 |
| * | RTI Biologics Inc. | 817,698 | 2,183 |
| * | CryoLife Inc. | 400,343 | 2,170 |
| * | Orthovita Inc. | 1,037,156 | 2,085 |
| *,^ | Osiris Therapeutics Inc. | 246,039 | 1,917 |
| * | Alliance HealthCare Services Inc. | 434,046 | 1,840 |
| * | Albany Molecular Research Inc. | 322,863 | 1,814 |
| *,^ | Biospecifics Technologies Corp. | 66,373 | 1,699 |
| * | Alimera Sciences Inc. | 117,588 | 1,221 |
| *,^ | MELA Sciences Inc. | 362,392 | 1,214 |
| * | St. Jude Medical Inc. | 25,009 | 1,069 |
| * | Caraco Pharmaceutical Laboratories Ltd. | 144,231 | 655 |
| * | Sucampo Pharmaceuticals Inc. Class A | 117,027 | 449 |
| | | | 2,626,898 |
| Industrials (16.3%) | | |
| * | WABCO Holdings Inc. | 959,295 | 58,450 |
| | Gardner Denver Inc. | 779,311 | 53,632 |
| * | BE Aerospace Inc. | 1,447,865 | 53,614 |
| * | TransDigm Group Inc. | 698,054 | 50,267 |
| | Snap-On Inc. | 865,556 | 48,973 |
| | Kennametal Inc. | 1,220,061 | 48,144 |
| * | Oshkosh Corp. | 1,347,957 | 47,502 |
| | IDEX Corp. | 1,213,657 | 47,478 |
| | Hubbell Inc. Class B | 785,925 | 47,258 |
| | Waste Connections Inc. | 1,641,132 | 45,180 |
| | Baldor Electric Co. | 664,952 | 41,919 |
| | Nordson Corp. | 455,146 | 41,819 |
| * | Corrections Corp. of America | 1,646,117 | 41,252 |
| | Lincoln Electric Holdings Inc. | 631,968 | 41,249 |
| * | AMR Corp. | 4,962,966 | 38,661 |
| | Regal-Beloit Corp. | 574,386 | 38,346 |
| | Wabtec Corp. | 713,590 | 37,742 |
| * | Thomas & Betts Corp. | 778,391 | 37,596 |
| | Acuity Brands Inc. | 648,495 | 37,399 |
| | Carlisle Cos. Inc. | 907,986 | 36,083 |
| * | GrafTech International Ltd. | 1,801,144 | 35,735 |
| | Graco Inc. | 897,111 | 35,391 |
16
| | | |
| Vanguard® Small-Cap Index Fund | | |
| Schedule of Investments | | |
| December 31, 2010 | | |
| |
| | | | Market |
| | | | Value |
| | | Shares | ($000) |
| * | Kirby Corp. | 763,303 | 33,623 |
| * | WESCO International Inc. | 632,087 | 33,374 |
| | Lennox International Inc. | 689,061 | 32,586 |
| | Woodward Governor Co. | 862,685 | 32,402 |
| | CLARCOR Inc. | 754,011 | 32,340 |
| | UTi Worldwide Inc. | 1,513,385 | 32,084 |
| | Trinity Industries Inc. | 1,188,562 | 31,628 |
| * | Genesee & Wyoming Inc. Class A | 579,312 | 30,675 |
| * | Esterline Technologies Corp. | 447,134 | 30,669 |
| | Crane Co. | 745,535 | 30,619 |
| | Landstar System Inc. | 742,041 | 30,379 |
| * | Alaska Air Group Inc. | 533,314 | 30,234 |
| | Toro Co. | 483,791 | 29,821 |
| | Con-way Inc. | 811,021 | 29,659 |
| * | Clean Harbors Inc. | 352,651 | 29,651 |
| * | EMCOR Group Inc. | 987,883 | 28,629 |
| | Valmont Industries Inc. | 313,715 | 27,836 |
| * | ArvinMeritor Inc. | 1,330,585 | 27,304 |
| * | General Cable Corp. | 775,931 | 27,227 |
| | Actuant Corp. Class A | 1,011,566 | 26,928 |
| * | Hexcel Corp. | 1,446,446 | 26,166 |
| | Triumph Group Inc. | 288,333 | 25,780 |
| | Belden Inc. | 696,829 | 25,657 |
| | Manitowoc Co. Inc. | 1,954,633 | 25,625 |
| * | Geo Group Inc. | 1,017,011 | 25,079 |
| * | JetBlue Airways Corp. | 3,715,098 | 24,557 |
| | Alexander & Baldwin Inc. | 613,035 | 24,540 |
| | GATX Corp. | 689,329 | 24,320 |
| * | US Airways Group Inc. | 2,402,688 | 24,051 |
| * | Avis Budget Group Inc. | 1,531,317 | 23,827 |
| | Brady Corp. Class A | 729,087 | 23,776 |
| * | Teledyne Technologies Inc. | 539,727 | 23,732 |
| | Watsco Inc. | 376,194 | 23,730 |
| * | Moog Inc. Class A | 583,437 | 23,221 |
| * | Tetra Tech Inc. | 919,404 | 23,040 |
| | Curtiss-Wright Corp. | 686,140 | 22,780 |
| * | EnerSys | 694,633 | 22,312 |
| * | United Stationers Inc. | 348,082 | 22,211 |
| * | Middleby Corp. | 261,989 | 22,117 |
| | AO Smith Corp. | 570,129 | 21,711 |
| * | Atlas Air Worldwide Holdings Inc. | 385,069 | 21,498 |
| | HNI Corp. | 670,804 | 20,929 |
| * | United Rentals Inc. | 901,033 | 20,498 |
| *,^ | American Superconductor Corp. | 716,225 | 20,477 |
| | Herman Miller Inc. | 807,409 | 20,427 |
| | Kaydon Corp. | 497,859 | 20,273 |
| * | Old Dominion Freight Line Inc. | 624,639 | 19,982 |
| | Rollins Inc. | 990,828 | 19,569 |
| * | HUB Group Inc. Class A | 551,937 | 19,395 |
| | Corporate Executive Board Co. | 510,121 | 19,155 |
| | Brink's Co. | 698,447 | 18,774 |
| | Applied Industrial Technologies Inc. | 568,184 | 18,455 |
| | Mueller Industries Inc. | 562,297 | 18,387 |
| | Simpson Manufacturing Co. Inc. | 588,994 | 18,206 |
| * | Dollar Thrifty Automotive Group Inc. | 384,689 | 18,180 |
| * | II-VI Inc. | 391,409 | 18,146 |
| | Knight Transportation Inc. | 933,232 | 17,731 |
| | Deluxe Corp. | 764,188 | 17,592 |
| * | Polypore International Inc. | 431,234 | 17,564 |
| * | USG Corp. | 1,036,786 | 17,449 |
| | ABM Industries Inc. | 658,616 | 17,322 |
| * | CoStar Group Inc. | 292,931 | 16,861 |
| | Watts Water Technologies Inc. Class A | 444,631 | 16,269 |
| * | DigitalGlobe Inc. | 511,862 | 16,231 |
17
| | | |
| Vanguard® Small-Cap Index Fund | | |
| Schedule of Investments | | |
| December 31, 2010 | | |
| |
| | | | Market |
| | | | Value |
| | | Shares | ($000) |
| * | AAR Corp. | 587,924 | 16,150 |
| | Mine Safety Appliances Co. | 513,342 | 15,980 |
| * | Korn/Ferry International | 691,059 | 15,970 |
| | Werner Enterprises Inc. | 702,846 | 15,884 |
| * | Insituform Technologies Inc. Class A | 584,433 | 15,493 |
| | Healthcare Services Group Inc. | 929,392 | 15,121 |
| | ESCO Technologies Inc. | 395,038 | 14,948 |
| | Robbins & Myers Inc. | 416,763 | 14,912 |
| | Briggs & Stratton Corp. | 749,177 | 14,751 |
| * | Orbital Sciences Corp. | 860,555 | 14,741 |
| * | Chart Industries Inc. | 426,909 | 14,421 |
| | Barnes Group Inc. | 695,022 | 14,366 |
| | Granite Construction Inc. | 519,472 | 14,249 |
| * | AirTran Holdings Inc. | 1,918,809 | 14,180 |
| * | GeoEye Inc. | 329,067 | 13,949 |
| * | Macquarie Infrastructure Co. LLC | 646,171 | 13,679 |
| | Skywest Inc. | 837,389 | 13,080 |
| | Heartland Express Inc. | 809,803 | 12,973 |
| | Armstrong World Industries Inc. | 300,608 | 12,926 |
| | Resources Connection Inc. | 691,530 | 12,856 |
| | Steelcase Inc. Class A | 1,206,940 | 12,757 |
| * | EnPro Industries Inc. | 306,057 | 12,720 |
| * | RBC Bearings Inc. | 323,702 | 12,650 |
| * | Acacia Research - Acacia Technologies | 486,873 | 12,629 |
| | Forward Air Corp. | 431,748 | 12,253 |
| | Unifirst Corp. | 222,053 | 12,224 |
| * | SYKES Enterprises Inc. | 599,770 | 12,151 |
| * | Beacon Roofing Supply Inc. | 679,462 | 12,142 |
| * | Wabash National Corp. | 1,017,188 | 12,054 |
| | HEICO Corp. | 233,004 | 11,890 |
| * | TrueBlue Inc. | 655,838 | 11,799 |
| | Knoll Inc. | 700,340 | 11,717 |
| | Raven Industries Inc. | 241,693 | 11,526 |
| | American Science & Engineering Inc. | 134,496 | 11,463 |
| | Franklin Electric Co. Inc. | 294,091 | 11,446 |
| * | Ceradyne Inc. | 359,125 | 11,323 |
| | Cubic Corp. | 239,387 | 11,287 |
| | Interface Inc. Class A | 718,891 | 11,251 |
| | Kaman Corp. | 386,252 | 11,228 |
| * | Interline Brands Inc. | 491,644 | 11,195 |
| * | Griffon Corp. | 872,692 | 11,118 |
| * | Advisory Board Co. | 232,276 | 11,063 |
| | Lindsay Corp. | 185,892 | 11,048 |
| | Seaboard Corp. | 5,456 | 10,863 |
| * | Ladish Co. Inc. | 222,126 | 10,798 |
| | CIRCOR International Inc. | 254,420 | 10,757 |
| * | Mobile Mini Inc. | 541,726 | 10,667 |
| | Quanex Building Products Corp. | 560,227 | 10,628 |
| | Administaff Inc. | 350,629 | 10,273 |
| | Allegiant Travel Co. Class A | 205,263 | 10,107 |
| | Universal Forest Products Inc. | 259,120 | 10,080 |
| * | Layne Christensen Co. | 290,378 | 9,995 |
| | Ameron International Corp. | 130,816 | 9,990 |
| * | MasTec Inc. | 679,670 | 9,916 |
| | Albany International Corp. | 414,895 | 9,829 |
| | Arkansas Best Corp. | 358,132 | 9,820 |
| * | Amerco Inc. | 102,088 | 9,805 |
| | Tennant Co. | 254,509 | 9,776 |
| ^ | Titan International Inc. | 499,817 | 9,766 |
| | Tutor Perini Corp. | 455,572 | 9,754 |
| *,^ | A123 Systems Inc. | 1,013,782 | 9,671 |
| | Mueller Water Products Inc. Class A | 2,299,733 | 9,590 |
| * | Blount International Inc. | 605,317 | 9,540 |
| | Badger Meter Inc. | 212,433 | 9,394 |
18
| | | |
| Vanguard® Small-Cap Index Fund | | |
| Schedule of Investments | | |
| December 31, 2010 | | |
| |
| | | | Market |
| | | | Value |
| | | Shares | ($000) |
| | National Presto Industries Inc. | 71,499 | 9,296 |
| * | Astec Industries Inc. | 285,955 | 9,268 |
| | McGrath Rentcorp | 339,401 | 8,899 |
| * | 3D Systems Corp. | 276,260 | 8,699 |
| | Aircastle Ltd. | 828,321 | 8,656 |
| | G&K Services Inc. Class A | 276,585 | 8,549 |
| * | Dycom Industries Inc. | 575,787 | 8,493 |
| | John Bean Technologies Corp. | 419,306 | 8,441 |
| *,^ | Higher One Holdings Inc. | 414,537 | 8,386 |
| * | Huron Consulting Group Inc. | 311,816 | 8,248 |
| | NACCO Industries Inc. Class A | 75,365 | 8,167 |
| * | Kforce Inc. | 499,730 | 8,086 |
| * | Kelly Services Inc. Class A | 420,625 | 7,908 |
| * | Consolidated Graphics Inc. | 163,093 | 7,899 |
| | Viad Corp. | 305,950 | 7,793 |
| * | Exponent Inc. | 206,573 | 7,753 |
| * | Rush Enterprises Inc. Class A | 378,433 | 7,735 |
| * | SFN Group Inc. | 784,139 | 7,653 |
| * | RSC Holdings Inc. | 769,103 | 7,491 |
| | Heidrick & Struggles International Inc. | 260,914 | 7,475 |
| | Comfort Systems USA Inc. | 564,125 | 7,430 |
| | AZZ Inc. | 185,011 | 7,402 |
| * | Greenbrier Cos. Inc. | 351,467 | 7,377 |
| | Gorman-Rupp Co. | 223,267 | 7,216 |
| | Applied Signal Technology Inc. | 189,524 | 7,181 |
| | Sun Hydraulics Corp. | 189,187 | 7,151 |
| | TAL International Group Inc. | 228,348 | 7,049 |
| * | ACCO Brands Corp. | 817,149 | 6,962 |
| | Encore Wire Corp. | 275,707 | 6,915 |
| | Tredegar Corp. | 354,974 | 6,879 |
| * | Navigant Consulting Inc. | 745,736 | 6,861 |
| *,^ | Genco Shipping & Trading Ltd. | 475,354 | 6,845 |
| * | ICF International Inc. | 259,701 | 6,680 |
| | Ennis Inc. | 386,011 | 6,601 |
| * | Colfax Corp. | 355,531 | 6,545 |
| | Cascade Corp. | 138,362 | 6,542 |
| * | Generac Holdings Inc. | 402,644 | 6,511 |
| * | Team Inc. | 268,691 | 6,502 |
| | Federal Signal Corp. | 927,873 | 6,365 |
| * | LB Foster Co. Class A | 153,080 | 6,267 |
| | EnergySolutions Inc. | 1,121,294 | 6,246 |
| * | MYR Group Inc. | 296,775 | 6,232 |
| *,^ | EnerNOC Inc. | 259,757 | 6,211 |
| | Great Lakes Dredge & Dock Corp. | 828,715 | 6,108 |
| * | Aerovironment Inc. | 226,723 | 6,083 |
| * | Dolan Co. | 431,749 | 6,010 |
| * | Hawaiian Holdings Inc. | 764,570 | 5,994 |
| | HEICO Corp. Class A | 159,363 | 5,947 |
| * | Force Protection Inc. | 1,044,797 | 5,757 |
| | Apogee Enterprises Inc. | 419,456 | 5,650 |
| | Standex International Corp. | 186,475 | 5,577 |
| * | KAR Auction Services Inc. | 401,984 | 5,547 |
| * | Columbus McKinnon Corp. | 270,743 | 5,501 |
| * | Gibraltar Industries Inc. | 405,188 | 5,498 |
| | Marten Transport Ltd. | 244,679 | 5,231 |
| *,^ | Harbin Electric Inc. | 300,346 | 5,211 |
| | AAON Inc. | 184,703 | 5,210 |
| * | Trimas Corp. | 253,231 | 5,181 |
| | FreightCar America Inc. | 178,572 | 5,168 |
| | Vicor Corp. | 311,698 | 5,112 |
| * | Sauer-Danfoss Inc. | 180,296 | 5,093 |
| * | Republic Airways Holdings Inc. | 658,972 | 4,824 |
| * | H&E Equipment Services Inc. | 416,865 | 4,823 |
| * | RailAmerica Inc. | 367,467 | 4,759 |
19
| | | |
| Vanguard® Small-Cap Index Fund | | |
| Schedule of Investments | | |
| December 31, 2010 | | |
| |
| | | | Market |
| | | | Value |
| | | Shares | ($000) |
| * | Trex Co. Inc. | 196,528 | 4,709 |
| | Schawk Inc. Class A | 227,685 | 4,686 |
| * | Celadon Group Inc. | 316,078 | 4,675 |
| * | Orion Marine Group Inc. | 400,396 | 4,645 |
| * | Eagle Bulk Shipping Inc. | 926,366 | 4,613 |
| | US Ecology Inc. | 258,326 | 4,490 |
| * | Cenveo Inc. | 835,206 | 4,460 |
| | Dynamic Materials Corp. | 196,429 | 4,433 |
| * | Kadant Inc. | 186,086 | 4,386 |
| * | CBIZ Inc. | 692,473 | 4,321 |
| * | Taser International Inc. | 883,301 | 4,152 |
| * | American Reprographics Co. | 544,492 | 4,133 |
| *,^ | Ener1 Inc. | 1,078,307 | 4,087 |
| * | Powell Industries Inc. | 121,626 | 3,999 |
| * | Furmanite Corp. | 576,315 | 3,982 |
| * | M&F Worldwide Corp. | 172,364 | 3,982 |
| * | Standard Parking Corp. | 209,602 | 3,959 |
| * | Saia Inc. | 237,166 | 3,935 |
| * | School Specialty Inc. | 281,683 | 3,924 |
| * | CRA International Inc. | 163,748 | 3,850 |
| * | Michael Baker Corp. | 123,250 | 3,833 |
| * | GenCorp Inc. | 740,823 | 3,830 |
| * | Titan Machinery Inc. | 198,192 | 3,825 |
| | CDI Corp. | 198,427 | 3,689 |
| | Ampco-Pittsburgh Corp. | 129,569 | 3,634 |
| * | Pacer International Inc. | 521,653 | 3,568 |
| *,^ | Advanced Battery Technologies Inc. | 917,589 | 3,533 |
| * | Capstone Turbine Corp. | 3,653,477 | 3,507 |
| * | Fushi Copperweld Inc. | 394,459 | 3,503 |
| * | Metalico Inc. | 591,174 | 3,476 |
| *,^ | China Valves Technology Inc. | 326,858 | 3,425 |
| | Aceto Corp. | 377,433 | 3,397 |
| | American Woodmark Corp. | 138,249 | 3,393 |
| | Houston Wire & Cable Co. | 250,725 | 3,370 |
| * | Northwest Pipe Co. | 138,465 | 3,327 |
| | Ducommun Inc. | 149,117 | 3,248 |
| * | American Railcar Industries Inc. | 143,442 | 3,174 |
| * | Sterling Construction Co. Inc. | 228,337 | 2,978 |
| *,^ | Lihua International Inc. | 238,366 | 2,679 |
| * | Innerworkings Inc. | 407,565 | 2,670 |
| | Douglas Dynamics Inc. | 176,041 | 2,667 |
| | Kimball International Inc. Class B | 382,620 | 2,640 |
| *,^ | YRC Worldwide Inc. | 701,677 | 2,610 |
| * | Roadrunner Transportation Systems Inc. | 180,046 | 2,603 |
| | Baltic Trading Ltd. | 250,234 | 2,555 |
| * | Patriot Transportation Holding Inc. | 27,416 | 2,549 |
| * | Fuel Tech Inc. | 253,278 | 2,459 |
| * | Hill International Inc. | 379,324 | 2,454 |
| * | Mistras Group Inc. | 179,090 | 2,414 |
| * | APAC Customer Services Inc. | 392,411 | 2,382 |
| * | Pike Electric Corp. | 276,893 | 2,376 |
| | Courier Corp. | 152,674 | 2,369 |
| * | Rush Enterprises Inc. Class B | 121,851 | 2,191 |
| * | Tecumseh Products Co. Class A | 162,696 | 2,123 |
| | Preformed Line Products Co. | 35,301 | 2,066 |
| *,^ | SmartHeat Inc. | 371,362 | 1,961 |
| * | Volt Information Sciences Inc. | 217,853 | 1,884 |
| * | Broadwind Energy Inc. | 806,965 | 1,864 |
| *,^ | Energy Recovery Inc. | 470,309 | 1,721 |
| *,^ | Valence Technology Inc. | 984,878 | 1,655 |
| * | Universal Truckload Services Inc. | 94,825 | 1,510 |
| *,^ | China Fire & Security Group Inc. | 124,720 | 819 |
| * | TBS International plc Class A | 198,583 | 572 |
20
| | | |
| Vanguard® Small-Cap Index Fund | | |
| Schedule of Investments | | |
| December 31, 2010 | | |
| |
| | | | Market |
| | | | Value |
| | | Shares | ($000) |
| * | Tecumseh Products Co. Class B | 37,155 | 485 |
| | | | 3,909,100 |
| Information Technology (18.6%) | | |
| * | Riverbed Technology Inc. | 1,836,127 | 64,577 |
| * | Informatica Corp. | 1,378,085 | 60,677 |
| | Solera Holdings Inc. | 1,043,148 | 53,534 |
| * | MICROS Systems Inc. | 1,193,509 | 52,347 |
| * | Polycom Inc. | 1,269,583 | 49,488 |
| * | VeriFone Systems Inc. | 1,272,954 | 49,085 |
| * | TIBCO Software Inc. | 2,442,201 | 48,136 |
| * | JDS Uniphase Corp. | 3,300,928 | 47,797 |
| * | CommScope Inc. | 1,410,926 | 44,049 |
| *,^ | Rackspace Hosting Inc. | 1,395,619 | 43,836 |
| * | Monster Worldwide Inc. | 1,837,615 | 43,423 |
| * | Cypress Semiconductor Corp. | 2,266,774 | 42,117 |
| * | WebMD Health Corp. | 821,429 | 41,942 |
| * | Varian Semiconductor Equipment Associates Inc. | 1,114,065 | 41,187 |
| * | Compuware Corp. | 3,324,214 | 38,794 |
| * | Parametric Technology Corp. | 1,717,540 | 38,696 |
| * | Teradyne Inc. | 2,702,297 | 37,940 |
| * | Atheros Communications Inc. | 1,054,824 | 37,889 |
| * | Gartner Inc. | 1,135,219 | 37,689 |
| * | Vishay Intertechnology Inc. | 2,566,959 | 37,683 |
| * | NCR Corp. | 2,389,820 | 36,732 |
| | Jack Henry & Associates Inc. | 1,215,112 | 35,421 |
| * | Rambus Inc. | 1,668,035 | 34,161 |
| * | Concur Technologies Inc. | 657,115 | 34,124 |
| * | Itron Inc. | 601,287 | 33,341 |
| * | Tech Data Corp. | 755,831 | 33,272 |
| | National Instruments Corp. | 875,426 | 32,951 |
| * | Cadence Design Systems Inc. | 3,965,322 | 32,754 |
| * | Zebra Technologies Corp. | 844,097 | 32,067 |
| * | Ariba Inc. | 1,346,501 | 31,629 |
| | Diebold Inc. | 978,344 | 31,356 |
| * | International Rectifier Corp. | 1,046,978 | 31,085 |
| * | Novell Inc. | 5,213,402 | 30,863 |
| * | Finisar Corp. | 1,024,820 | 30,427 |
| | ADTRAN Inc. | 839,338 | 30,392 |
| * | VistaPrint NV | 654,237 | 30,095 |
| * | PMC - Sierra Inc. | 3,426,876 | 29,437 |
| * | Ciena Corp. | 1,386,021 | 29,176 |
| * | NeuStar Inc. Class A | 1,116,954 | 29,097 |
| * | Silicon Laboratories Inc. | 631,235 | 29,049 |
| * | Fairchild Semiconductor International Inc. Class A | 1,857,443 | 28,995 |
| * | Sohu.com Inc. | 450,716 | 28,616 |
| * | RF Micro Devices Inc. | 3,860,363 | 28,374 |
| * | Microsemi Corp. | 1,236,708 | 28,321 |
| | Intersil Corp. Class A | 1,843,490 | 28,150 |
| * | QLogic Corp. | 1,626,351 | 27,680 |
| * | Progress Software Corp. | 645,370 | 27,312 |
| * | InterDigital Inc. | 655,876 | 27,311 |
| * | TriQuint Semiconductor Inc. | 2,316,925 | 27,085 |
| * | Netlogic Microsystems Inc. | 851,018 | 26,730 |
| | Plantronics Inc. | 709,864 | 26,421 |
| * | MercadoLibre Inc. | 394,309 | 26,281 |
| *,^ | Veeco Instruments Inc. | 608,712 | 26,150 |
| * | Quest Software Inc. | 941,205 | 26,109 |
| | Anixter International Inc. | 427,718 | 25,548 |
| * | Wright Express Corp. | 541,219 | 24,896 |
| * | Acme Packet Inc. | 464,025 | 24,668 |
| * | Convergys Corp. | 1,847,228 | 24,328 |
| | CoreLogic Inc. | 1,306,828 | 24,202 |
| * | Viasat Inc. | 543,929 | 24,156 |
| * | CACI International Inc. Class A | 451,310 | 24,100 |
21
| | | |
| Vanguard® Small-Cap Index Fund | | |
| Schedule of Investments | | |
| December 31, 2010 | | |
| |
| | | | Market |
| | | | Value |
| | | Shares | ($000) |
| * | Omnivision Technologies Inc. | 801,800 | 23,741 |
| * | Aruba Networks Inc. | 1,115,398 | 23,289 |
| * | Hittite Microwave Corp. | 363,396 | 22,182 |
| * | Semtech Corp. | 924,881 | 20,939 |
| * | Arris Group Inc. | 1,863,414 | 20,907 |
| * | SuccessFactors Inc. | 713,924 | 20,675 |
| * | GSI Commerce Inc. | 889,071 | 20,626 |
| * | Digital River Inc. | 590,363 | 20,320 |
| * | Cavium Networks Inc. | 532,590 | 20,068 |
| *,^ | Blackboard Inc. | 485,019 | 20,031 |
| * | j2 Global Communications Inc. | 678,440 | 19,641 |
| * | ValueClick Inc. | 1,218,130 | 19,527 |
| | Sapient Corp. | 1,607,488 | 19,451 |
| * | Acxiom Corp. | 1,131,603 | 19,407 |
| * | Spansion Inc. Class A | 934,905 | 19,353 |
| * | Mentor Graphics Corp. | 1,590,825 | 19,090 |
| * | Lawson Software Inc. | 2,062,402 | 19,077 |
| * | Blue Coat Systems Inc. | 637,030 | 19,028 |
| * | Fortinet Inc. | 584,554 | 18,910 |
| * | Cymer Inc. | 417,728 | 18,827 |
| * | Plexus Corp. | 602,352 | 18,637 |
| * | Netgear Inc. | 527,213 | 17,757 |
| * | CommVault Systems Inc. | 610,580 | 17,475 |
| * | MKS Instruments Inc. | 709,645 | 17,379 |
| * | Ultimate Software Group Inc. | 355,017 | 17,264 |
| | MAXIMUS Inc. | 257,895 | 16,913 |
| | Blackbaud Inc. | 652,344 | 16,896 |
| * | Benchmark Electronics Inc. | 926,897 | 16,832 |
| * | Coherent Inc. | 370,690 | 16,733 |
| * | Aspen Technology Inc. | 1,313,650 | 16,683 |
| | Power Integrations Inc. | 415,320 | 16,671 |
| * | JDA Software Group Inc. | 592,193 | 16,581 |
| * | Tessera Technologies Inc. | 747,744 | 16,563 |
| | Cognex Corp. | 561,412 | 16,517 |
| * | Unisys Corp. | 634,374 | 16,424 |
| * | Integrated Device Technology Inc. | 2,360,496 | 15,721 |
| | Littelfuse Inc. | 329,381 | 15,501 |
| * | Take-Two Interactive Software Inc. | 1,261,419 | 15,440 |
| * | Cirrus Logic Inc. | 957,803 | 15,306 |
| *,^ | Synaptics Inc. | 513,162 | 15,077 |
| * | FEI Co. | 568,068 | 15,003 |
| * | Rofin-Sinar Technologies Inc. | 420,686 | 14,909 |
| * | TiVo Inc. | 1,725,282 | 14,889 |
| * | L-1 Identity Solutions Inc. | 1,247,390 | 14,856 |
| * | Taleo Corp. Class A | 536,155 | 14,825 |
| * | Universal Display Corp. | 483,531 | 14,820 |
| * | Entegris Inc. | 1,962,944 | 14,663 |
| *,^ | Power-One Inc. | 1,423,989 | 14,525 |
| | Fair Isaac Corp. | 620,753 | 14,507 |
| * | OpenTable Inc. | 204,211 | 14,393 |
| * | Cabot Microelectronics Corp. | 347,082 | 14,387 |
| * | Advent Software Inc. | 247,491 | 14,335 |
| * | Diodes Inc. | 529,086 | 14,280 |
| * | Mantech International Corp. Class A | 343,342 | 14,190 |
| * | Emulex Corp. | 1,213,731 | 14,152 |
| * | Art Technology Group Inc. | 2,353,855 | 14,076 |
| | Earthlink Inc. | 1,609,665 | 13,843 |
| * | Infinera Corp. | 1,335,701 | 13,798 |
| * | SAVVIS Inc. | 534,491 | 13,640 |
| * | Sanmina-SCI Corp. | 1,184,379 | 13,597 |
| * | Entropic Communications Inc. | 1,116,503 | 13,487 |
| * | SRA International Inc. Class A | 653,724 | 13,369 |
| * | ACI Worldwide Inc. | 496,701 | 13,346 |
| * | Loral Space & Communications Inc. | 169,510 | 12,968 |
22
| | | |
| Vanguard® Small-Cap Index Fund | | |
| Schedule of Investments | | |
| December 31, 2010 | | |
| |
| | | | Market |
| | | | Value |
| | | Shares | ($000) |
| *,^ | AsiaInfo-Linkage Inc. | 773,079 | 12,810 |
| * | Websense Inc. | 632,174 | 12,802 |
| *,^ | Constant Contact Inc. | 409,744 | 12,698 |
| * | Scansource Inc. | 397,557 | 12,682 |
| * | EchoStar Corp. Class A | 501,695 | 12,527 |
| * | DTS Inc. | 255,208 | 12,518 |
| * | Harmonic Inc. | 1,452,348 | 12,447 |
| * | TTM Technologies Inc. | 834,014 | 12,435 |
| *,^ | Ebix Inc. | 522,258 | 12,362 |
| * | GT Solar International Inc. | 1,339,154 | 12,213 |
| * | Amkor Technology Inc. | 1,637,421 | 12,101 |
| * | Checkpoint Systems Inc. | 588,105 | 12,086 |
| | Syntel Inc. | 251,693 | 12,028 |
| * | IPG Photonics Corp. | 379,270 | 11,993 |
| * | Euronet Worldwide Inc. | 682,873 | 11,909 |
| | AVX Corp. | 759,725 | 11,723 |
| | Comtech Telecommunications Corp. | 421,668 | 11,693 |
| * | Verigy Ltd. | 892,167 | 11,616 |
| * | Quantum Corp. | 3,079,633 | 11,456 |
| * | DealerTrack Holdings Inc. | 570,567 | 11,451 |
| * | MicroStrategy Inc. Class A | 129,840 | 11,097 |
| * | DG FastChannel Inc. | 382,024 | 11,033 |
| * | Tekelec | 916,742 | 10,918 |
| * | SYNNEX Corp. | 344,782 | 10,757 |
| * | Radiant Systems Inc. | 544,177 | 10,650 |
| *,^ | SunPower Corp. Class A | 829,154 | 10,638 |
| * | Ancestry.com Inc. | 374,721 | 10,612 |
| * | Applied Micro Circuits Corp. | 991,603 | 10,590 |
| * | Lattice Semiconductor Corp. | 1,739,262 | 10,540 |
| * | Sourcefire Inc. | 392,365 | 10,174 |
| *,^ | Sonic Solutions Inc. | 676,704 | 10,151 |
| | Black Box Corp. | 262,776 | 10,062 |
| * | Netscout Systems Inc. | 436,775 | 10,050 |
| * | Manhattan Associates Inc. | 328,798 | 10,041 |
| * | Synchronoss Technologies Inc. | 372,842 | 9,959 |
| * | Avid Technology Inc. | 567,449 | 9,908 |
| * | Oclaro Inc. | 737,377 | 9,696 |
| * | Standard Microsystems Corp. | 336,258 | 9,694 |
| * | Bottomline Technologies Inc. | 445,643 | 9,675 |
| * | Electronics for Imaging Inc. | 673,910 | 9,644 |
| * | CSG Systems International Inc. | 507,419 | 9,611 |
| * | Newport Corp. | 546,685 | 9,496 |
| * | Stratasys Inc. | 290,859 | 9,494 |
| * | Intermec Inc. | 738,717 | 9,352 |
| * | ATMI Inc. | 468,979 | 9,351 |
| * | Volterra Semiconductor Corp. | 399,969 | 9,263 |
| * | LogMeIn Inc. | 208,178 | 9,231 |
| * | TeleTech Holdings Inc. | 447,858 | 9,221 |
| * | Compellent Technologies Inc. | 332,392 | 9,171 |
| | Pegasystems Inc. | 248,837 | 9,115 |
| * | Tyler Technologies Inc. | 438,370 | 9,101 |
| * | Insight Enterprises Inc. | 688,846 | 9,065 |
| | MTS Systems Corp. | 241,649 | 9,052 |
| * | Rogers Corp. | 235,482 | 9,007 |
| | iGate Corp. | 455,075 | 8,970 |
| * | Ixia | 534,412 | 8,967 |
| * | OSI Systems Inc. | 246,443 | 8,961 |
| * | Cardtronics Inc. | 500,594 | 8,860 |
| * | SolarWinds Inc. | 460,086 | 8,857 |
| * | Brooks Automation Inc. | 973,440 | 8,829 |
| | Park Electrochemical Corp. | 291,849 | 8,755 |
| | Heartland Payment Systems Inc. | 567,196 | 8,746 |
| *,^ | STEC Inc. | 491,651 | 8,678 |
| | United Online Inc. | 1,300,749 | 8,585 |
23
| | | |
| Vanguard® Small-Cap Index Fund | | |
| Schedule of Investments | | |
| December 31, 2010 | | |
| |
| | | | Market |
| | | | Value |
| | | Shares | ($000) |
| * | Epicor Software Corp. | 847,712 | 8,562 |
| * | Monolithic Power Systems Inc. | 517,476 | 8,549 |
| * | RightNow Technologies Inc. | 357,518 | 8,462 |
| | Micrel Inc. | 649,856 | 8,442 |
| * | Silicon Image Inc. | 1,142,728 | 8,399 |
| | Daktronics Inc. | 521,928 | 8,309 |
| | Forrester Research Inc. | 235,155 | 8,299 |
| * | Terremark Worldwide Inc. | 637,340 | 8,254 |
| * | Sonus Networks Inc. | 3,082,241 | 8,230 |
| * | Brightpoint Inc. | 936,370 | 8,174 |
| * | TNS Inc. | 390,394 | 8,120 |
| ^ | VirnetX Holding Corp. | 529,509 | 7,863 |
| | NIC Inc. | 804,739 | 7,814 |
| * | SunPower Corp. Class B | 627,623 | 7,789 |
| * | BroadSoft Inc. | 320,712 | 7,659 |
| * | Vocus Inc. | 275,640 | 7,624 |
| * | FARO Technologies Inc. | 228,529 | 7,505 |
| * | Advanced Energy Industries Inc. | 548,924 | 7,487 |
| * | Verint Systems Inc. | 229,002 | 7,259 |
| * | comScore Inc. | 324,058 | 7,230 |
| * | Smith Micro Software Inc. | 458,948 | 7,224 |
| * | Kulicke & Soffa Industries Inc. | 996,376 | 7,174 |
| * | NetSuite Inc. | 284,507 | 7,113 |
| | Methode Electronics Inc. | 548,108 | 7,109 |
| *,^ | QuinStreet Inc. | 368,489 | 7,079 |
| * | Net 1 UEPS Technologies Inc. | 573,412 | 7,030 |
| * | Dice Holdings Inc. | 482,401 | 6,922 |
| * | Ultratech Inc. | 343,148 | 6,822 |
| * | Anadigics Inc. | 972,958 | 6,743 |
| * | Maxwell Technologies Inc. | 353,950 | 6,686 |
| * | Electro Scientific Industries Inc. | 415,831 | 6,666 |
| * | Mercury Computer Systems Inc. | 362,395 | 6,661 |
| | EPIQ Systems Inc. | 484,557 | 6,653 |
| * | Kemet Corp. | 452,455 | 6,597 |
| * | Zoran Corp. | 740,412 | 6,516 |
| * | Ceva Inc. | 315,786 | 6,474 |
| * | FormFactor Inc. | 709,794 | 6,303 |
| * | Kenexa Corp. | 285,933 | 6,230 |
| * | THQ Inc. | 1,010,054 | 6,121 |
| * | Sycamore Networks Inc. | 295,808 | 6,091 |
| * | Move Inc. | 2,327,779 | 5,982 |
| * | Oplink Communications Inc. | 312,979 | 5,781 |
| *,^ | Rubicon Technology Inc. | 273,514 | 5,766 |
| | CTS Corp. | 509,628 | 5,636 |
| * | Sigma Designs Inc. | 394,075 | 5,584 |
| | Cohu Inc. | 336,589 | 5,581 |
| | Opnet Technologies Inc. | 207,703 | 5,560 |
| * | RealNetworks Inc. | 1,317,734 | 5,534 |
| *,^ | China Security & Surveillance Technology Inc. | 1,031,825 | 5,500 |
| * | S1 Corp. | 790,725 | 5,456 |
| * | Perficient Inc. | 425,165 | 5,315 |
| * | ShoreTel Inc. | 671,084 | 5,241 |
| * | Interactive Intelligence Inc. | 195,908 | 5,125 |
| *,^ | Powerwave Technologies Inc. | 1,979,503 | 5,028 |
| * | DemandTec Inc. | 447,639 | 4,852 |
| * | Imation Corp. | 460,383 | 4,747 |
| * | Echelon Corp. | 462,153 | 4,709 |
| * | ExlService Holdings Inc. | 218,063 | 4,684 |
| * | Intevac Inc. | 333,896 | 4,678 |
| * | Symmetricom Inc. | 654,383 | 4,640 |
| * | Ciber Inc. | 980,367 | 4,588 |
| * | LoopNet Inc. | 406,125 | 4,512 |
| * | EMS Technologies Inc. | 227,856 | 4,507 |
| * | Aviat Networks Inc. | 887,303 | 4,499 |
24
| | | |
| Vanguard® Small-Cap Index Fund | | |
| Schedule of Investments | | |
| December 31, 2010 | | |
| |
| | | | Market |
| | | | Value |
| | | Shares | ($000) |
| * | Novatel Wireless Inc. | 469,695 | 4,486 |
| * | Infospace Inc. | 535,320 | 4,443 |
| * | Super Micro Computer Inc. | 383,501 | 4,426 |
| * | ModusLink Global Solutions Inc. | 655,137 | 4,389 |
| * | SS&C Technologies Holdings Inc. | 213,453 | 4,378 |
| * | Anaren Inc. | 208,503 | 4,347 |
| | Cass Information Systems Inc. | 112,242 | 4,258 |
| * | Limelight Networks Inc. | 731,831 | 4,252 |
| *,^ | Calix Inc. | 251,533 | 4,251 |
| * | Knot Inc. | 429,780 | 4,246 |
| * | Internap Network Services Corp. | 694,835 | 4,225 |
| * | Kopin Corp. | 995,057 | 4,139 |
| * | Pericom Semiconductor Corp. | 370,514 | 4,068 |
| * | IXYS Corp. | 348,756 | 4,053 |
| | Electro Rent Corp. | 249,424 | 4,031 |
| * | SMART Modular Technologies WWH Inc. | 697,480 | 4,017 |
| * | Supertex Inc. | 164,111 | 3,968 |
| * | Extreme Networks | 1,280,422 | 3,956 |
| * | Multi-Fineline Electronix Inc. | 148,189 | 3,926 |
| * | Silicon Graphics International Corp. | 433,822 | 3,917 |
| * | Digi International Inc. | 352,780 | 3,916 |
| * | Exar Corp. | 558,162 | 3,896 |
| * | Monotype Imaging Holdings Inc. | 338,426 | 3,757 |
| * | VASCO Data Security International Inc. | 449,844 | 3,657 |
| * | Rudolph Technologies Inc. | 442,896 | 3,645 |
| * | Seachange International Inc. | 419,795 | 3,589 |
| * | Actuate Corp. | 627,606 | 3,577 |
| *,^ | Rosetta Stone Inc. | 168,367 | 3,573 |
| * | Virtusa Corp. | 215,565 | 3,527 |
| * | Cray Inc. | 481,359 | 3,442 |
| * | UTStarcom Inc. | 1,664,780 | 3,429 |
| * | Ness Technologies Inc. | 564,875 | 3,355 |
| * | PROS Holdings Inc. | 291,337 | 3,318 |
| *,^ | Energy Conversion Devices Inc. | 720,846 | 3,316 |
| * | TeleCommunication Systems Inc. Class A | 699,704 | 3,268 |
| * | Cogo Group Inc. | 368,506 | 3,261 |
| | Bel Fuse Inc. Class B | 135,699 | 3,243 |
| * | Fabrinet | 150,569 | 3,237 |
| * | Pulse Electronics Corp. | 586,494 | 3,120 |
| * | Liquidity Services Inc. | 219,625 | 3,086 |
| * | DSP Group Inc. | 348,613 | 2,838 |
| | Marchex Inc. Class B | 275,039 | 2,624 |
| * | NCI Inc. Class A | 113,585 | 2,611 |
| * | Integral Systems Inc. | 261,740 | 2,594 |
| * | Global Cash Access Holdings Inc. | 794,040 | 2,533 |
| * | Comverge Inc. | 358,866 | 2,480 |
| *,^ | China Information Technology Inc. | 463,994 | 2,417 |
| * | Advanced Analogic Technologies Inc. | 596,340 | 2,391 |
| * | CPI International Inc. | 112,984 | 2,186 |
| | Stamps.com Inc. | 159,752 | 2,117 |
| * | Conexant Systems Inc. | 1,217,447 | 1,984 |
| *,^ | Echo Global Logistics Inc. | 163,524 | 1,969 |
| * | Agilysys Inc. | 345,555 | 1,945 |
| * | Trident Microsystems Inc. | 1,053,701 | 1,876 |
| * | BigBand Networks Inc. | 667,960 | 1,870 |
| * | Deltek Inc. | 254,446 | 1,847 |
| *,^ | Meru Networks Inc. | 119,128 | 1,837 |
| | Renaissance Learning Inc. | 154,347 | 1,827 |
| *,^ | Evergreen Solar Inc. | 2,962,909 | 1,727 |
| * | MaxLinear Inc. | 111,928 | 1,204 |
| * | TechTarget Inc. | 136,279 | 1,081 |
| * | Mitel Networks Corp. | 194,446 | 1,071 |
| * | China TransInfo Technology Corp. | 149,894 | 709 |
25
| | |
| Vanguard® Small-Cap Index Fund | | |
| Schedule of Investments | | |
| December 31, 2010 | | |
| |
| | | Market |
| | | Value |
| | Shares | ($000) |
| Bel Fuse Inc. Class A | 17,928 | 457 |
| | | 4,466,174 |
| Materials (6.3%) | | |
| Domtar Corp. | 638,104 | 48,445 |
| Aptargroup Inc. | 1,004,430 | 47,781 |
| Huntsman Corp. | 2,850,883 | 44,502 |
| Compass Minerals International Inc. | 487,707 | 43,538 |
| * Hecla Mining Co. | 3,812,764 | 42,932 |
| RPM International Inc. | 1,937,000 | 42,808 |
| * Solutia Inc. | 1,817,579 | 41,950 |
| Royal Gold Inc. | 759,687 | 41,502 |
| Packaging Corp. of America | 1,542,995 | 39,871 |
| Cytec Industries Inc. | 730,864 | 38,780 |
| * WR Grace & Co. | 1,083,797 | 38,074 |
| * Rockwood Holdings Inc. | 959,034 | 37,517 |
| * Coeur d'Alene Mines Corp. | 1,329,573 | 36,324 |
| Cabot Corp. | 924,511 | 34,808 |
| Temple-Inland Inc. | 1,524,168 | 32,373 |
| * Allied Nevada Gold Corp. | 1,187,273 | 31,237 |
| Rock-Tenn Co. Class A | 551,059 | 29,730 |
| * Stillwater Mining Co. | 1,363,283 | 29,106 |
| Commercial Metals Co. | 1,701,767 | 28,232 |
| Sensient Technologies Corp. | 739,507 | 27,162 |
| AK Steel Holding Corp. | 1,637,570 | 26,807 |
| Silgan Holdings Inc. | 747,716 | 26,776 |
| Carpenter Technology Corp. | 654,691 | 26,345 |
| * Intrepid Potash Inc. | 671,078 | 25,024 |
| Olin Corp. | 1,179,681 | 24,207 |
| Schnitzer Steel Industries Inc. | 342,626 | 22,747 |
| NewMarket Corp. | 182,182 | 22,476 |
| * Ferro Corp. | 1,281,950 | 18,768 |
| * Louisiana-Pacific Corp. | 1,923,127 | 18,193 |
| Minerals Technologies Inc. | 276,863 | 18,110 |
| * OM Group Inc. | 459,521 | 17,696 |
| Eagle Materials Inc. | 624,444 | 17,641 |
| * PolyOne Corp. | 1,385,520 | 17,305 |
| Schweitzer-Mauduit International Inc. | 273,252 | 17,193 |
| Worthington Industries Inc. | 910,569 | 16,754 |
| ^ Texas Industries Inc. | 351,794 | 16,105 |
| Globe Specialty Metals Inc. | 940,321 | 16,070 |
| HB Fuller Co. | 729,356 | 14,966 |
| Balchem Corp. | 421,605 | 14,254 |
| Arch Chemicals Inc. | 373,821 | 14,179 |
| * Century Aluminum Co. | 897,009 | 13,931 |
| * Clearwater Paper Corp. | 170,846 | 13,377 |
| Westlake Chemical Corp. | 295,445 | 12,843 |
| * Calgon Carbon Corp. | 836,167 | 12,643 |
| Buckeye Technologies Inc. | 584,274 | 12,276 |
| * Georgia Gulf Corp. | 505,614 | 12,165 |
| * RTI International Metals Inc. | 447,807 | 12,082 |
| * Brush Engineered Materials Inc. | 303,105 | 11,712 |
| Innophos Holdings Inc. | 318,918 | 11,507 |
| * US Gold Corp. | 1,387,159 | 11,194 |
| Koppers Holdings Inc. | 305,993 | 10,948 |
| Kaiser Aluminum Corp. | 214,601 | 10,749 |
| A Schulman Inc. | 468,721 | 10,729 |
| * Kraton Performance Polymers Inc. | 325,133 | 10,063 |
| AMCOL International Corp. | 323,555 | 10,030 |
| Deltic Timber Corp. | 167,449 | 9,434 |
| Stepan Co. | 119,583 | 9,121 |
| * Horsehead Holding Corp. | 647,297 | 8,441 |
| PH Glatfelter Co. | 682,237 | 8,371 |
| * KapStone Paper and Packaging Corp. | 514,882 | 7,878 |
| Haynes International Inc. | 180,602 | 7,555 |
26
| | | |
| Vanguard® Small-Cap Index Fund | | |
| Schedule of Investments | | |
| December 31, 2010 | | |
| |
| | | | Market |
| | | | Value |
| | | Shares | ($000) |
| *,^ | STR Holdings Inc. | 368,903 | 7,378 |
| * | Innospec Inc. | 354,545 | 7,233 |
| | Boise Inc. | 886,394 | 7,029 |
| | Zep Inc. | 323,326 | 6,428 |
| * | LSB Industries Inc. | 251,283 | 6,096 |
| | Wausau Paper Corp. | 695,989 | 5,992 |
| * | General Moly Inc. | 917,982 | 5,948 |
| ^ | Hawkins Inc. | 131,003 | 5,816 |
| * | Zoltek Cos. Inc. | 434,480 | 5,018 |
| * | Graphic Packaging Holding Co. | 1,278,993 | 4,975 |
| * | Noranda Aluminum Holding Corp. | 340,069 | 4,965 |
| *,^ | Yongye International Inc. | 576,551 | 4,843 |
| * | TPC Group Inc. | 156,138 | 4,734 |
| * | AM Castle & Co. | 256,987 | 4,731 |
| * | Capital Gold Corp. | 909,232 | 4,610 |
| | Myers Industries Inc. | 449,212 | 4,375 |
| | Neenah Paper Inc. | 220,271 | 4,335 |
| * | Spartech Corp. | 462,453 | 4,329 |
| * | Golden Minerals Co. | 159,255 | 4,252 |
| * | Headwaters Inc. | 898,482 | 4,115 |
| | Olympic Steel Inc. | 138,294 | 3,966 |
| * | Graham Packaging Co. Inc. | 278,792 | 3,635 |
| *,^ | Gulf Resources Inc. | 308,449 | 3,297 |
| * | Metals USA Holdings Corp. | 192,892 | 2,940 |
| | American Vanguard Corp. | 325,954 | 2,784 |
| * | Landec Corp. | 378,550 | 2,264 |
| *,^ | ShengdaTech Inc. | 445,218 | 2,182 |
| *,^ | China Green Agriculture Inc. | 219,702 | 1,977 |
| *,^ | China Agritech Inc. | 139,642 | 1,713 |
| * | United States Lime & Minerals Inc. | 33,472 | 1,410 |
| | | | 1,508,707 |
| Telecommunication Services (1.0%) | | |
| * | tw telecom inc Class A | 2,143,966 | 36,555 |
| * | Syniverse Holdings Inc. | 1,042,848 | 32,172 |
| * | Level 3 Communications Inc. | 24,790,620 | 24,295 |
| | AboveNet Inc. | 224,788 | 13,141 |
| * | Leap Wireless International Inc. | 932,800 | 11,436 |
| * | Cogent Communications Group Inc. | 682,339 | 9,648 |
| | NTELOS Holdings Corp. | 465,679 | 8,871 |
| * | Cincinnati Bell Inc. | 2,999,890 | 8,400 |
| | Alaska Communications Systems Group Inc. | 663,722 | 7,367 |
| * | PAETEC Holding Corp. | 1,944,789 | 7,274 |
| | Consolidated Communications Holdings Inc. | 355,521 | 6,862 |
| * | Neutral Tandem Inc. | 466,911 | 6,742 |
| * | Global Crossing Ltd. | 495,914 | 6,407 |
| | Shenandoah Telecommunications Co. | 335,999 | 6,293 |
| * | Hughes Communications Inc. | 146,130 | 5,909 |
| * | General Communication Inc. Class A | 465,184 | 5,889 |
| | USA Mobility Inc. | 329,980 | 5,864 |
| �� | Atlantic Tele-Network Inc. | 148,225 | 5,683 |
| * | Cbeyond Inc. | 367,101 | 5,609 |
| * | Premiere Global Services Inc. | 741,752 | 5,044 |
| * | Iridium Communications Inc. | 574,483 | 4,739 |
| * | Vonage Holdings Corp. | 1,732,469 | 3,881 |
| * | ICO Global Communications Holdings Ltd. | 2,373,301 | 3,560 |
| | | | 231,641 |
| Utilities (3.6%) | | |
| | ITC Holdings Corp. | 749,338 | 46,444 |
| | Questar Corp. | 2,613,933 | 45,508 |
| | Westar Energy Inc. | 1,761,830 | 44,328 |
| * | GenOn Energy Inc. | 11,414,495 | 43,489 |
| | Atmos Energy Corp. | 1,342,365 | 41,882 |
| | Great Plains Energy Inc. | 2,019,849 | 39,165 |
| | Nicor Inc. | 677,626 | 33,827 |
27
| | | | | |
| Vanguard® Small-Cap Index Fund | | | | |
| Schedule of Investments | | | | |
| December 31, 2010 | | | | |
| |
| | | | | | Market |
| | | | | | Value |
| | | | | Shares | ($000) |
| | Hawaiian Electric Industries Inc. | | | 1,394,780 | 31,787 |
| | Piedmont Natural Gas Co. Inc. | | | 1,071,240 | 29,952 |
| | Vectren Corp. | | | 1,150,862 | 29,209 |
| | Cleco Corp. | | | 904,169 | 27,812 |
| | WGL Holdings Inc. | | | 757,089 | 27,081 |
| | IDACORP Inc. | | | 717,273 | 26,525 |
| | New Jersey Resources Corp. | | | 613,494 | 26,448 |
| | Southwest Gas Corp. | | | 676,649 | 24,813 |
| | Portland General Electric Co. | | | 1,121,067 | 24,327 |
| | South Jersey Industries Inc. | | | 444,673 | 23,488 |
| | UIL Holdings Corp. | | | 711,341 | 21,312 |
| | Unisource Energy Corp. | | | 541,230 | 19,398 |
| | Avista Corp. | | | 823,906 | 18,554 |
| | Northwest Natural Gas Co. | | | 395,589 | 18,383 |
| * | El Paso Electric Co. | | | 648,952 | 17,866 |
| | Allete Inc. | | | 478,376 | 17,824 |
| | PNM Resources Inc. | | | 1,292,483 | 16,828 |
| | Black Hills Corp. | | | 554,244 | 16,627 |
| | NorthWestern Corp. | | | 538,467 | 15,524 |
| | MGE Energy Inc. | | | 344,016 | 14,710 |
| | Empire District Electric Co. | | | 616,041 | 13,676 |
| | Otter Tail Corp. | | | 534,784 | 12,054 |
| | Laclede Group Inc. | | | 315,436 | 11,526 |
| | CH Energy Group Inc. | | | 235,480 | 11,513 |
| | California Water Service Group | | | 294,101 | 10,961 |
| | American States Water Co. | | | 276,905 | 9,545 |
| ^ | Ormat Technologies Inc. | | | 304,370 | 9,003 |
| * | Dynegy Inc. Class A | | | 1,526,954 | 8,581 |
| | Chesapeake Utilities Corp. | | | 134,854 | 5,599 |
| | SJW Corp. | | | 207,798 | 5,500 |
| | Middlesex Water Co. | | | 230,679 | 4,233 |
| | Central Vermont Public Service Corp. | | | 177,847 | 3,888 |
| | Unitil Corp. | | | 161,963 | 3,683 |
| | Connecticut Water Service Inc. | | | 128,256 | 3,576 |
| |
| | | | | | 856,449 |
| |
| Total Common Stocks (Cost $19,647,521) | | | | 23,968,134 |
| |
| |
| | | Coupon | | | |
| |
| Temporary Cash Investments (2.0%)1 | | | | |
| Money Market Fund (2.0%) | | | | |
| 2,3 | Vanguard Market Liquidity Fund | 0.211% | | 477,032,000 | 477,032 |
| |
| |
| | | | | Face | |
| | | | Maturity | Amount | |
| | | | Date | ($000) | |
| U.S. Government and Agency Obligations (0.0%) | | | | |
| 4,5 | Fannie Mae Discount Notes | 0.200% | 2/14/11 | 8,000 | 7,998 |
| 4,5 | Federal Home Loan Bank Discount Notes | 0.260% | 3/23/11 | 600 | 600 |
| 4,5 | Freddie Mac Discount Notes | 0.250% | 3/21/11 | 1,000 | 999 |
| |
| | | | | | 9,597 |
| |
| Total Temporary Cash Investments (Cost $486,629) | | | | 486,629 |
| |
| Total Investments (101.8%) (Cost $20,134,150) | | | | 24,454,763 |
| Other Assets and Liabilities—Net (-1.8%)3 | | | | (436,060) |
| Net Assets (100%) | | | | 24,018,703 |
| * | Non-income-producing security. |
| ^ | Part of security position is on loan to broker-dealers. The total value of securities on loan is $359,723,000. |
28
Vanguard® Small-Cap Index Fund
Schedule of Investments
December 31, 2010
1 The fund invests a portion of its cash reserves in equity markets through the use of index futures contracts. After giving effect to futures investments, the fund's effective common stock and temporary cash investment positions represent 100.0% and 1.8%, respectively, of net assets.
2 Affiliated money market fund available only to Vanguard funds and certain trusts and accounts managed by Vanguard. Rate shown is the 7-day yield.
3 Includes $385,068,000 of collateral received for securities on loan.
4 The issuer operates under a congressional charter; its securities are not backed by the full faith and credit of the U.S. government.
5 Securities with a value of $9,098,000 have been segregated as initial margin for open futures contracts.
REIT—Real Estate Investment Trust.
29
| | | |
| Vanguard® Small-Cap Growth Index Fund | | |
| Schedule of Investments | | |
| December 31, 2010 | | |
| |
| | | | Market |
| | | | Value |
| | | Shares | ($000) |
| Common Stocks (99.5%)1 | | |
| Consumer Discretionary (17.1%) | | |
| | Gentex Corp. | 1,297,526 | 38,355 |
| * | Signet Jewelers Ltd. | 794,357 | 34,475 |
| | Tractor Supply Co. | 673,859 | 32,675 |
| *,^ | Lululemon Athletica Inc. | 427,210 | 29,230 |
| * | Deckers Outdoor Corp. | 358,547 | 28,591 |
| | Sotheby's | 621,357 | 27,961 |
| * | Panera Bread Co. Class A | 275,568 | 27,890 |
| * | Tempur-Pedic International Inc. | 614,600 | 24,621 |
| * | WMS Industries Inc. | 538,621 | 24,367 |
| * | J Crew Group Inc. | 562,190 | 24,253 |
| * | Big Lots Inc. | 752,481 | 22,921 |
| | Polaris Industries Inc. | 292,949 | 22,856 |
| * | Tenneco Inc. | 554,139 | 22,808 |
| * | Warnaco Group Inc. | 413,045 | 22,746 |
| * | Dana Holding Corp. | 1,302,140 | 22,410 |
| * | Aeropostale Inc. | 867,100 | 21,365 |
| * | Bally Technologies Inc. | 500,164 | 21,102 |
| | Chico's FAS Inc. | 1,661,083 | 19,983 |
| * | DreamWorks Animation SKG Inc. Class A | 646,622 | 19,056 |
| | John Wiley & Sons Inc. Class A | 421,029 | 19,047 |
| *,^ | Under Armour Inc. Class A | 338,280 | 18,551 |
| * | Coinstar Inc. | 288,219 | 16,267 |
| * | Cheesecake Factory Inc. | 524,049 | 16,067 |
| * | Madison Square Garden Inc. Class A | 577,151 | 14,879 |
| * | Live Nation Entertainment Inc. | 1,286,653 | 14,694 |
| * | Hanesbrands Inc. | 576,581 | 14,645 |
| | Aaron's Inc. | 716,205 | 14,603 |
| * | Life Time Fitness Inc. | 349,408 | 14,322 |
| * | CROCS Inc. | 803,207 | 13,751 |
| * | Sally Beauty Holdings Inc. | 930,113 | 13,515 |
| * | Eastman Kodak Co. | 2,490,687 | 13,350 |
| * | Iconix Brand Group Inc. | 670,316 | 12,944 |
| * | Orient-Express Hotels Ltd. Class A | 935,266 | 12,149 |
| | Weight Watchers International Inc. | 314,512 | 11,791 |
| * | Childrens Place Retail Stores Inc. | 231,423 | 11,488 |
| * | HSN Inc. | 373,464 | 11,443 |
| * | Pier 1 Imports Inc. | 1,086,225 | 11,405 |
| | Thor Industries Inc. | 333,998 | 11,343 |
| * | Gaylord Entertainment Co. | 306,168 | 11,004 |
| | Morningstar Inc. | 206,782 | 10,976 |
| | PF Chang's China Bistro Inc. | 214,331 | 10,386 |
| | Pool Corp. | 459,637 | 10,360 |
| | Arbitron Inc. | 248,840 | 10,332 |
| * | JOS A Bank Clothiers Inc. | 255,061 | 10,284 |
| * | Ulta Salon Cosmetics & Fragrance Inc. | 298,842 | 10,161 |
| * | Hibbett Sports Inc. | 267,426 | 9,868 |
| | National CineMedia Inc. | 491,430 | 9,784 |
| | Matthews International Corp. Class A | 276,169 | 9,660 |
| * | Steven Madden Ltd. | 231,011 | 9,638 |
| *,^ | Capella Education Co. | 139,694 | 9,301 |
| | Monro Muffler Brake Inc. | 265,198 | 9,173 |
| * | Texas Roadhouse Inc. Class A | 498,069 | 8,552 |
| * | Carter's Inc. | 275,370 | 8,126 |
| *,^ | Tesla Motors Inc. | 302,232 | 8,048 |
| * | Shutterfly Inc. | 227,402 | 7,966 |
| * | CEC Entertainment Inc. | 199,506 | 7,747 |
| | Brunswick Corp. | 410,878 | 7,700 |
| *,^ | Blue Nile Inc. | 132,829 | 7,579 |
| * | AnnTaylor Stores Corp. | 273,754 | 7,498 |
| * | Vitamin Shoppe Inc. | 221,822 | 7,462 |
| * | Valassis Communications Inc. | 228,080 | 7,378 |
30
| | | |
| Vanguard® Small-Cap Growth Index Fund | | |
| Schedule of Investments | | |
| December 31, 2010 | | |
| |
| | | | Market |
| | | | Value |
| | | Shares | ($000) |
| * | BJ's Restaurants Inc. | 200,820 | 7,115 |
| * | Buffalo Wild Wings Inc. | 160,294 | 7,029 |
| * | Vail Resorts Inc. | 134,699 | 7,010 |
| * | DineEquity Inc. | 141,312 | 6,978 |
| * | OfficeMax Inc. | 393,802 | 6,970 |
| * | Office Depot Inc. | 1,278,145 | 6,902 |
| | Choice Hotels International Inc. | 179,449 | 6,868 |
| * | Saks Inc. | 633,542 | 6,779 |
| * | Exide Technologies | 702,672 | 6,612 |
| | PEP Boys-Manny Moe & Jack | 486,062 | 6,528 |
| * | American Public Education Inc. | 171,325 | 6,380 |
| * | Scientific Games Corp. Class A | 635,775 | 6,332 |
| * | Steiner Leisure Ltd. | 130,766 | 6,107 |
| * | K12 Inc. | 211,790 | 6,070 |
| * | Interval Leisure Group Inc. | 369,574 | 5,965 |
| * | Shuffle Master Inc. | 496,920 | 5,690 |
| * | Sonic Corp. | 542,963 | 5,495 |
| | Express Inc. | 287,611 | 5,407 |
| * | Papa John's International Inc. | 195,039 | 5,403 |
| * | Dress Barn Inc. | 203,991 | 5,389 |
| * | Zumiez Inc. | 198,663 | 5,338 |
| * | G-III Apparel Group Ltd. | 150,612 | 5,294 |
| * | Maidenform Brands Inc. | 214,038 | 5,088 |
| * | Lumber Liquidators Holdings Inc. | 203,455 | 5,068 |
| * | True Religion Apparel Inc. | 224,484 | 4,997 |
| * | American Axle & Manufacturing Holdings Inc. | 387,035 | 4,977 |
| * | Peet's Coffee & Tea Inc. | 119,241 | 4,977 |
| * | iRobot Corp. | 200,032 | 4,977 |
| | Ethan Allen Interiors Inc. | 239,901 | 4,800 |
| * | Select Comfort Corp. | 510,268 | 4,659 |
| * | Knology Inc. | 291,819 | 4,561 |
| * | Fuel Systems Solutions Inc. | 154,710 | 4,545 |
| | Universal Technical Institute Inc. | 190,621 | 4,197 |
| * | New York Times Co. Class A | 423,365 | 4,149 |
| * | Modine Manufacturing Co. | 265,588 | 4,117 |
| * | Domino's Pizza Inc. | 249,825 | 3,985 |
| * | Krispy Kreme Doughnuts Inc. | 561,897 | 3,922 |
| * | Pre-Paid Legal Services Inc. | 64,421 | 3,881 |
| *,^ | hhgregg Inc. | 182,526 | 3,824 |
| * | Grand Canyon Education Inc. | 191,015 | 3,742 |
| * | California Pizza Kitchen Inc. | 216,324 | 3,738 |
| * | Lions Gate Entertainment Corp. | 568,548 | 3,701 |
| * | Rue21 Inc. | 123,625 | 3,623 |
| * | Universal Electronics Inc. | 124,625 | 3,536 |
| * | Wet Seal Inc. Class A | 942,620 | 3,488 |
| | Buckle Inc. | 90,944 | 3,435 |
| * | Citi Trends Inc. | 137,666 | 3,380 |
| *,^ | Bridgepoint Education Inc. | 177,516 | 3,373 |
| | International Speedway Corp. Class A | 127,895 | 3,347 |
| * | Denny's Corp. | 923,889 | 3,308 |
| * | AFC Enterprises Inc. | 237,131 | 3,296 |
| * | Asbury Automotive Group Inc. | 177,648 | 3,283 |
| * | Mediacom Communications Corp. Class A | 381,656 | 3,229 |
| * | Liz Claiborne Inc. | 438,238 | 3,138 |
| | Volcom Inc. | 158,306 | 2,987 |
| * | Warner Music Group Corp. | 501,773 | 2,825 |
| * | Penske Automotive Group Inc. | 149,191 | 2,599 |
| * | Dex One Corp. | 347,061 | 2,589 |
| * | 99 Cents Only Stores | 158,176 | 2,521 |
| *,^ | Education Management Corp. | 139,099 | 2,518 |
| *,^ | Overstock.com Inc. | 149,372 | 2,462 |
| * | Retail Ventures Inc. | 147,480 | 2,404 |
| | Nutrisystem Inc. | 112,043 | 2,356 |
| * | Libbey Inc. | 149,857 | 2,318 |
31
| | | |
| Vanguard® Small-Cap Growth Index Fund | | |
| Schedule of Investments | | |
| December 31, 2010 | | |
| |
| | | | Market |
| | | | Value |
| | | Shares | ($000) |
| | Sinclair Broadcast Group Inc. Class A | 282,014 | 2,307 |
| *,^ | Deer Consumer Products Inc. | 186,553 | 2,097 |
| * | Kirkland's Inc. | 147,206 | 2,065 |
| * | K-Swiss Inc. Class A | 163,890 | 2,044 |
| *,^ | Hovnanian Enterprises Inc. Class A | 497,188 | 2,034 |
| * | Federal-Mogul Corp. | 95,991 | 1,982 |
| * | Coldwater Creek Inc. | 597,696 | 1,895 |
| ^ | PetMed Express Inc. | 106,244 | 1,892 |
| * | DSW Inc. Class A | 47,745 | 1,867 |
| | Blyth Inc. | 53,078 | 1,830 |
| | Sturm Ruger & Co. Inc. | 115,866 | 1,772 |
| * | CKX Inc. | 430,973 | 1,737 |
| | Callaway Golf Co. | 208,729 | 1,684 |
| | Bebe Stores Inc. | 279,235 | 1,664 |
| * | Pacific Sunwear of California Inc. | 305,793 | 1,657 |
| * | Biglari Holdings Inc. | 3,949 | 1,620 |
| * | Isle of Capri Casinos Inc. | 150,506 | 1,538 |
| *,^ | China MediaExpress Holdings Inc. | 92,641 | 1,467 |
| * | Smith & Wesson Holding Corp. | 360,862 | 1,350 |
| * | America's Car-Mart Inc. | 45,228 | 1,225 |
| * | Martha Stewart Living Omnimedia Class A | 249,384 | 1,102 |
| * | Orbitz Worldwide Inc. | 188,997 | 1,056 |
| * | ReachLocal Inc. | 51,511 | 1,026 |
| | Ambassadors Group Inc. | 83,456 | 960 |
| * | Leapfrog Enterprises Inc. | 163,682 | 908 |
| * | Vitacost.com Inc. | 150,615 | 859 |
| * | Sealy Corp. | 293,914 | 858 |
| *,^ | China Automotive Systems Inc. | 62,777 | 854 |
| | Outdoor Channel Holdings Inc. | 117,905 | 845 |
| *,^ | Wonder Auto Technology Inc. | 112,034 | 845 |
| * | New York & Co. Inc. | 161,996 | 716 |
| * | Marine Products Corp. | 102,752 | 684 |
| * | Archipelago Learning Inc. | 61,036 | 599 |
| * | Kenneth Cole Productions Inc. Class A | 31,376 | 392 |
| * | Fuqi International Inc. | 53,690 | 343 |
| * | Krispy Kreme Doughnuts Inc. Warrants Exp. 03/02/2012 | 2,546 | 1 |
| | | | 1,302,258 |
| Consumer Staples (1.7%) | | |
| * | BJ's Wholesale Club Inc. | 324,477 | 15,542 |
| * | United Natural Foods Inc. | 417,557 | 15,316 |
| | Casey's General Stores Inc. | 349,953 | 14,877 |
| ^ | Diamond Foods Inc. | 202,271 | 10,757 |
| * | Darling International Inc. | 764,564 | 10,153 |
| * | Boston Beer Co. Inc. Class A | 89,990 | 8,557 |
| | J&J Snack Foods Corp. | 137,105 | 6,614 |
| | Pricesmart Inc. | 166,120 | 6,318 |
| * | TreeHouse Foods Inc. | 114,848 | 5,868 |
| * | Rite Aid Corp. | 6,166,839 | 5,447 |
| *,^ | Zhongpin Inc. | 257,577 | 5,255 |
| * | Heckmann Corp. | 959,281 | 4,825 |
| * | USANA Health Sciences Inc. | 73,051 | 3,174 |
| * | Smart Balance Inc. | 568,939 | 2,464 |
| * | Alliance One International Inc. | 511,224 | 2,168 |
| | Tootsie Roll Industries Inc. | 65,076 | 1,885 |
| | Coca-Cola Bottling Co. Consolidated | 25,912 | 1,440 |
| | National Beverage Corp. | 107,115 | 1,407 |
| * | Pilgrim's Pride Corp. | 173,089 | 1,227 |
| *,^ | Feihe International Inc. | 102,918 | 1,095 |
| *,^ | AgFeed Industries Inc. | 323,039 | 950 |
| | Calavo Growers Inc. | 35,462 | 817 |
| | Alico Inc. | 34,245 | 816 |
| *,^ | China-Biotics Inc. | 51,608 | 759 |
| * | Susser Holdings Corp. | 40,168 | 556 |
32
| | | |
| Vanguard® Small-Cap Growth Index Fund | | |
| Schedule of Investments | | |
| December 31, 2010 | | |
| |
| | | | Market |
| | | | Value |
| | | Shares | ($000) |
| | Farmer Bros Co. | 23,605 | 420 |
| | | | 128,707 |
| Energy (7.4%) | | |
| * | Atlas Energy Inc. | 726,879 | 31,961 |
| * | Brigham Exploration Co. | 1,081,130 | 29,450 |
| * | Superior Energy Services Inc. | 730,540 | 25,562 |
| * | Dril-Quip Inc. | 295,447 | 22,962 |
| | SM Energy Co. | 380,316 | 22,412 |
| | Holly Corp. | 493,340 | 20,113 |
| * | Gran Tierra Energy Inc. | 2,356,950 | 18,973 |
| | CARBO Ceramics Inc. | 182,149 | 18,860 |
| * | Rosetta Resources Inc. | 489,025 | 18,407 |
| * | Complete Production Services Inc. | 576,818 | 17,045 |
| * | SandRidge Energy Inc. | 2,197,148 | 16,083 |
| * | Energy XXI Bermuda Ltd. | 561,232 | 15,529 |
| * | Key Energy Services Inc. | 1,165,120 | 15,123 |
| * | Patriot Coal Corp. | 717,021 | 13,889 |
| * | Northern Oil and Gas Inc. | 505,226 | 13,747 |
| * | Exterran Holdings Inc. | 556,686 | 13,333 |
| * | Atwood Oceanics Inc. | 349,488 | 13,060 |
| * | McMoRan Exploration Co. | 744,263 | 12,757 |
| * | Oasis Petroleum Inc. | 470,293 | 12,754 |
| * | Carrizo Oil & Gas Inc. | 338,468 | 11,674 |
| * | Comstock Resources Inc. | 438,698 | 10,774 |
| | World Fuel Services Corp. | 297,429 | 10,755 |
| * | Oil States International Inc. | 163,193 | 10,459 |
| * | Kodiak Oil & Gas Corp. | 1,530,193 | 10,099 |
| * | Tetra Technologies Inc. | 705,849 | 8,378 |
| | RPC Inc. | 411,604 | 7,458 |
| | Contango Oil & Gas Co. | 117,000 | 6,778 |
| *,^ | ATP Oil & Gas Corp. | 404,057 | 6,764 |
| * | Gulfport Energy Corp. | 310,141 | 6,715 |
| * | Clayton Williams Energy Inc. | 73,272 | 6,153 |
| *,^ | Clean Energy Fuels Corp. | 441,001 | 6,103 |
| | Lufkin Industries Inc. | 97,285 | 6,070 |
| * | Resolute Energy Corp. | 381,644 | 5,633 |
| * | ION Geophysical Corp. | 529,701 | 4,492 |
| * | Petroleum Development Corp. | 105,945 | 4,472 |
| * | Tesco Corp. | 280,597 | 4,456 |
| * | OYO Geospace Corp. | 44,731 | 4,433 |
| * | International Coal Group Inc. | 562,241 | 4,352 |
| * | Global Industries Ltd. | 624,362 | 4,327 |
| * | Rex Energy Corp. | 306,455 | 4,183 |
| * | Goodrich Petroleum Corp. | 226,458 | 3,995 |
| * | Venoco Inc. | 203,369 | 3,752 |
| * | Magnum Hunter Resources Corp. | 503,317 | 3,624 |
| *,^ | BPZ Resources Inc. | 746,477 | 3,553 |
| * | Western Refining Inc. | 321,861 | 3,405 |
| *,^ | Uranium Energy Corp. | 535,122 | 3,232 |
| * | Matrix Service Co. | 258,455 | 3,148 |
| * | Enbridge Energy Management LLC | 48,638 | 3,106 |
| * | Pioneer Drilling Co. | 325,822 | 2,871 |
| * | Warren Resources Inc. | 625,549 | 2,828 |
| *,^ | Cheniere Energy Inc. | 507,298 | 2,800 |
| * | Allis-Chalmers Energy Inc. | 368,633 | 2,614 |
| * | CVR Energy Inc. | 167,789 | 2,547 |
| * | Endeavour International Corp. | 184,177 | 2,542 |
| * | Dawson Geophysical Co. | 73,237 | 2,336 |
| *,^ | L&L Energy Inc. | 207,715 | 2,243 |
| * | Gastar Exploration Ltd. | 519,437 | 2,234 |
| * | Hercules Offshore Inc. | 531,028 | 1,837 |
| * | Harvest Natural Resources Inc. | 147,711 | 1,798 |
| * | Approach Resources Inc. | 75,311 | 1,740 |
| * | Basic Energy Services Inc. | 105,042 | 1,731 |
33
| | | |
| Vanguard® Small-Cap Growth Index Fund | | |
| Schedule of Investments | | |
| December 31, 2010 | | |
| |
| | | | Market |
| | | | Value |
| | | Shares | ($000) |
| * | Global Geophysical Services Inc. | 166,218 | 1,725 |
| * | T-3 Energy Services Inc. | 43,316 | 1,725 |
| * | Willbros Group Inc. | 131,555 | 1,292 |
| *,^ | China Integrated Energy Inc. | 71,114 | 521 |
| * | Contango ORE Inc. | | 113 |
| | | | 559,860 |
| Financials (5.6%) | | |
| * | E*Trade Financial Corp. | 2,046,254 | 32,740 |
| | Taubman Centers Inc. | 506,946 | 25,591 |
| | East West Bancorp Inc. | 1,303,345 | 25,480 |
| * | SVB Financial Group | 388,940 | 20,633 |
| * | Signature Bank | 376,334 | 18,817 |
| * | Stifel Financial Corp. | 292,364 | 18,138 |
| | Equity Lifestyle Properties Inc. | 270,733 | 15,142 |
| | Extra Space Storage Inc. | 770,227 | 13,402 |
| * | Forest City Enterprises Inc. Class A | 735,587 | 12,277 |
| * | Portfolio Recovery Associates Inc. | 158,054 | 11,886 |
| | DuPont Fabros Technology Inc. | 549,403 | 11,686 |
| * | Ezcorp Inc. Class A | 407,372 | 11,052 |
| | PS Business Parks Inc. | 182,382 | 10,162 |
| | Apartment Investment & Management Co. | 379,789 | 9,814 |
| | Alexander's Inc. | 21,294 | 8,779 |
| * | Greenlight Capital Re Ltd. Class A | 279,757 | 7,500 |
| | U-Store-It Trust | 781,461 | 7,447 |
| * | First Cash Financial Services Inc. | 238,479 | 7,391 |
| | Pebblebrook Hotel Trust | 351,123 | 7,135 |
| * | Texas Capital Bancshares Inc. | 323,673 | 6,885 |
| * | Dollar Financial Corp. | 225,935 | 6,469 |
| * | Investors Bancorp Inc. | 479,381 | 6,290 |
| | Interactive Brokers Group Inc. | 352,085 | 6,274 |
| | optionsXpress Holdings Inc. | 399,440 | 6,259 |
| * | MBIA Inc. | 520,348 | 6,239 |
| * | MGIC Investment Corp. | 585,523 | 5,967 |
| | KBW Inc. | 202,954 | 5,667 |
| * | Sunstone Hotel Investors Inc. | 547,088 | 5,651 |
| * | Credit Acceptance Corp. | 87,945 | 5,520 |
| | DCT Industrial Trust Inc. | 979,722 | 5,202 |
| * | Financial Engines Inc. | 249,384 | 4,945 |
| * | Internet Capital Group Inc. | 337,972 | 4,806 |
| * | Altisource Portfolio Solutions SA | 163,778 | 4,702 |
| | Evercore Partners Inc. Class A | 108,700 | 3,696 |
| * | Tejon Ranch Co. | 127,854 | 3,522 |
| | Sun Communities Inc. | 105,087 | 3,500 |
| | Duff & Phelps Corp. Class A | 196,042 | 3,305 |
| | Danvers Bancorp Inc. | 186,004 | 3,287 |
| * | Forestar Group Inc. | 160,186 | 3,092 |
| * | Pico Holdings Inc. | 94,374 | 3,001 |
| * | International Assets Holding Corp. | 122,496 | 2,891 |
| * | World Acceptance Corp. | 50,811 | 2,683 |
| * | Beneficial Mutual Bancorp Inc. | 301,314 | 2,661 |
| * | Strategic Hotels & Resorts Inc. | 489,888 | 2,592 |
| | Retail Opportunity Investments Corp. | 251,570 | 2,493 |
| | Westwood Holdings Group Inc. | 55,353 | 2,212 |
| | Saul Centers Inc. | 44,668 | 2,115 |
| * | Kennedy-Wilson Holdings Inc. | 210,555 | 2,103 |
| * | Pinnacle Financial Partners Inc. | 147,053 | 1,997 |
| * | NewStar Financial Inc. | 185,853 | 1,965 |
| | Epoch Holding Corp. | 126,476 | 1,964 |
| * | Citizens Inc. | 263,549 | 1,963 |
| | THL Credit Inc. | 146,683 | 1,908 |
| | Cohen & Steers Inc. | 62,261 | 1,625 |
| | Cardinal Financial Corp. | 126,772 | 1,474 |
| * | Doral Financial Corp. | 997,961 | 1,377 |
| * | Hilltop Holdings Inc. | 137,274 | 1,362 |
34
| | |
| Vanguard® Small-Cap Growth Index Fund | | |
| Schedule of Investments | | |
| December 31, 2010 | | |
| |
| | | Market |
| | | Value |
| | Shares | ($000) |
| * Nara Bancorp Inc. | 116,767 | 1,147 |
| * eHealth Inc. | 72,435 | 1,028 |
| GAMCO Investors Inc. | 21,014 | 1,009 |
| Consolidated-Tomoka Land Co. | 32,660 | 944 |
| * TradeStation Group Inc. | 117,665 | 794 |
| Pzena Investment Management Inc. Class A | 81,830 | 601 |
| * Gleacher & Co. Inc. | 248,863 | 590 |
| * Asset Acceptance Capital Corp. | 91,787 | 544 |
| SWS Group Inc. | 94,740 | 478 |
| * First Marblehead Corp. | 210,330 | 456 |
| Cousins Properties Inc. | 2,488 | 21 |
| | | 422,348 |
| Health Care (16.0%) | | |
| * Allscripts Healthcare Solutions Inc. | 1,647,905 | 31,755 |
| * United Therapeutics Corp. | 497,230 | 31,435 |
| * Tenet Healthcare Corp. | 4,498,387 | 30,094 |
| * BioMarin Pharmaceutical Inc. | 946,255 | 25,483 |
| * Salix Pharmaceuticals Ltd. | 536,034 | 25,172 |
| * Onyx Pharmaceuticals Inc. | 581,397 | 21,436 |
| * Regeneron Pharmaceuticals Inc. | 634,243 | 20,822 |
| * Brookdale Senior Living Inc. Class A | 949,934 | 20,338 |
| * Dionex Corp. | 161,849 | 19,100 |
| * Incyte Corp. Ltd. | 1,131,306 | 18,734 |
| * Healthsouth Corp. | 866,450 | 17,944 |
| * VCA Antech Inc. | 757,288 | 17,637 |
| * InterMune Inc. | 467,521 | 17,018 |
| * Catalyst Health Solutions Inc. | 353,157 | 16,418 |
| * HMS Holdings Corp. | 252,499 | 16,354 |
| * Sirona Dental Systems Inc. | 384,219 | 16,053 |
| Medicis Pharmaceutical Corp. Class A | 557,859 | 14,945 |
| * Thoratec Corp. | 514,893 | 14,582 |
| * Haemonetics Corp. | 228,726 | 14,451 |
| Masimo Corp. | 490,873 | 14,270 |
| * Theravance Inc. | 565,970 | 14,189 |
| Chemed Corp. | 211,167 | 13,411 |
| * Talecris Biotherapeutics Holdings Corp. | 570,849 | 13,301 |
| * American Medical Systems Holdings Inc. | 704,581 | 13,288 |
| Quality Systems Inc. | 187,703 | 13,105 |
| * Immucor Inc. | 648,780 | 12,865 |
| West Pharmaceutical Services Inc. | 308,356 | 12,704 |
| * Cepheid Inc. | 553,849 | 12,600 |
| * Par Pharmaceutical Cos. Inc. | 326,178 | 12,561 |
| * Viropharma Inc. | 721,926 | 12,504 |
| * athenahealth Inc. | 300,736 | 12,324 |
| * Seattle Genetics Inc. | 797,725 | 11,926 |
| * PSS World Medical Inc. | 523,449 | 11,830 |
| * Cubist Pharmaceuticals Inc. | 546,901 | 11,704 |
| * Volcano Corp. | 422,763 | 11,546 |
| * Parexel International Corp. | 542,249 | 11,512 |
| * AMERIGROUP Corp. | 236,396 | 10,383 |
| * Align Technology Inc. | 526,250 | 10,283 |
| * Bruker Corp. | 611,064 | 10,144 |
| * Impax Laboratories Inc. | 499,935 | 10,054 |
| * Acorda Therapeutics Inc. | 360,444 | 9,826 |
| * Martek Biosciences Corp. | 310,304 | 9,713 |
| * Integra LifeSciences Holdings Corp. | 202,101 | 9,559 |
| * NuVasive Inc. | 365,237 | 9,368 |
| * Auxilium Pharmaceuticals Inc. | 441,700 | 9,320 |
| * Emergency Medical Services Corp. Class A | 140,378 | 9,070 |
| * Isis Pharmaceuticals Inc. | 873,531 | 8,840 |
| * Pharmasset Inc. | 194,428 | 8,440 |
| * Exelixis Inc. | 1,007,454 | 8,271 |
| * Neogen Corp. | 199,625 | 8,191 |
| Hill-Rom Holdings Inc. | 206,064 | 8,113 |
35
| | | |
| Vanguard® Small-Cap Growth Index Fund | | |
| Schedule of Investments | | |
| December 31, 2010 | | |
| |
| | | | Market |
| | | | Value |
| | | Shares | ($000) |
| * | MedAssets Inc. | 401,042 | 8,097 |
| * | Questcor Pharmaceuticals Inc. | 546,637 | 8,052 |
| * | Cyberonics Inc. | 258,709 | 8,025 |
| * | HeartWare International Inc. | 89,140 | 7,806 |
| * | DexCom Inc. | 571,016 | 7,794 |
| * | Healthspring Inc. | 293,088 | 7,776 |
| * | Arthrocare Corp. | 250,246 | 7,773 |
| * | WellCare Health Plans Inc. | 255,932 | 7,734 |
| * | Zoll Medical Corp. | 199,287 | 7,419 |
| * | Nektar Therapeutics | 567,174 | 7,288 |
| *,^ | Vivus Inc. | 751,904 | 7,045 |
| * | Alkermes Inc. | 573,173 | 7,039 |
| * | Medicines Co. | 494,606 | 6,989 |
| * | MWI Veterinary Supply Inc. | 108,763 | 6,868 |
| * | Sequenom Inc. | 836,718 | 6,710 |
| * | Luminex Corp. | 353,010 | 6,453 |
| * | NxStage Medical Inc. | 247,958 | 6,169 |
| * | Insulet Corp. | 395,001 | 6,123 |
| * | Ariad Pharmaceuticals Inc. | 1,175,563 | 5,995 |
| *,^ | MannKind Corp. | 739,400 | 5,960 |
| * | Halozyme Therapeutics Inc. | 744,225 | 5,894 |
| * | IPC The Hospitalist Co. Inc. | 150,770 | 5,882 |
| * | Air Methods Corp. | 104,018 | 5,853 |
| * | Momenta Pharmaceuticals Inc. | 389,295 | 5,828 |
| * | Hanger Orthopedic Group Inc. | 271,072 | 5,744 |
| * | Wright Medical Group Inc. | 363,690 | 5,648 |
| * | Targacept Inc. | 212,292 | 5,626 |
| * | Abaxis Inc. | 207,062 | 5,560 |
| * | Micromet Inc. | 674,266 | 5,475 |
| * | Enzon Pharmaceuticals Inc. | 449,305 | 5,468 |
| * | Bio-Reference Labs Inc. | 232,015 | 5,146 |
| * | Inspire Pharmaceuticals Inc. | 575,570 | 4,835 |
| * | NPS Pharmaceuticals Inc. | 610,327 | 4,822 |
| * | Celera Corp. | 760,195 | 4,789 |
| *,^ | SIGA Technologies Inc. | 339,134 | 4,748 |
| * | Orthofix International NV | 163,604 | 4,745 |
| * | Ardea Biosciences Inc. | 180,371 | 4,690 |
| * | Medivation Inc. | 304,327 | 4,617 |
| * | LHC Group Inc. | 147,143 | 4,414 |
| * | Omnicell Inc. | 302,646 | 4,373 |
| * | Accelrys Inc. | 513,375 | 4,261 |
| * | Centene Corp. | 167,481 | 4,244 |
| *,^ | Protalix BioTherapeutics Inc. | 412,591 | 4,118 |
| * | ICU Medical Inc. | 112,302 | 4,099 |
| * | SonoSite Inc. | 128,557 | 4,062 |
| * | Emdeon Inc. Class A | 294,416 | 3,986 |
| * | Medidata Solutions Inc. | 165,298 | 3,947 |
| * | Merit Medical Systems Inc. | 248,191 | 3,929 |
| * | Molina Healthcare Inc. | 138,337 | 3,853 |
| *,^ | Immunogen Inc. | 409,634 | 3,793 |
| * | Natus Medical Inc. | 267,323 | 3,791 |
| * | Conceptus Inc. | 273,532 | 3,775 |
| *,^ | Geron Corp. | 722,496 | 3,735 |
| *,^ | MAKO Surgical Corp. | 238,392 | 3,628 |
| * | AMAG Pharmaceuticals Inc. | 195,250 | 3,534 |
| * | Savient Pharmaceuticals Inc. | 313,002 | 3,487 |
| * | Opko Health Inc. | 947,013 | 3,476 |
| | PDL BioPharma Inc. | 555,105 | 3,458 |
| * | Accretive Health Inc. | 210,791 | 3,425 |
| * | Allos Therapeutics Inc. | 731,930 | 3,374 |
| * | Emeritus Corp. | 170,657 | 3,364 |
| * | eResearchTechnology Inc. | 453,089 | 3,330 |
| * | Alnylam Pharmaceuticals Inc. | 331,834 | 3,272 |
| * | Quidel Corp. | 224,166 | 3,239 |
36
| | | |
| Vanguard® Small-Cap Growth Index Fund | | |
| Schedule of Investments | | |
| December 31, 2010 | | |
| |
| | | | Market |
| | | | Value |
| | | Shares | ($000) |
| * | Corvel Corp. | 65,982 | 3,190 |
| * | Akorn Inc. | 521,653 | 3,166 |
| * | Amedisys Inc. | 93,435 | 3,130 |
| * | Accuray Inc. | 461,990 | 3,118 |
| | Cantel Medical Corp. | 132,621 | 3,103 |
| * | Genoptix Inc. | 162,753 | 3,096 |
| * | Symmetry Medical Inc. | 333,371 | 3,084 |
| | Meridian Bioscience Inc. | 132,007 | 3,057 |
| * | MAP Pharmaceuticals Inc. | 178,551 | 2,989 |
| * | Almost Family Inc. | 77,129 | 2,963 |
| * | ABIOMED Inc. | 298,051 | 2,864 |
| * | Genomic Health Inc. | 133,602 | 2,858 |
| | Atrion Corp. | 15,006 | 2,693 |
| *,^ | Cadence Pharmaceuticals Inc. | 345,106 | 2,606 |
| *,^ | Unilife Corp. | 486,280 | 2,577 |
| * | Sangamo Biosciences Inc. | 376,716 | 2,501 |
| * | Durect Corp. | 723,510 | 2,496 |
| * | XenoPort Inc. | 287,901 | 2,453 |
| * | BioMimetic Therapeutics Inc. | 192,820 | 2,449 |
| *,^ | Cell Therapeutics Inc. | 6,678,257 | 2,438 |
| * | Rigel Pharmaceuticals Inc. | 314,258 | 2,366 |
| * | Arqule Inc. | 395,487 | 2,322 |
| * | Team Health Holdings Inc. | 149,165 | 2,318 |
| * | Cypress Bioscience Inc. | 357,299 | 2,315 |
| | Pain Therapeutics Inc. | 336,228 | 2,270 |
| * | Emergent Biosolutions Inc. | 96,290 | 2,259 |
| *,^ | PROLOR Biotech Inc. | 321,168 | 2,078 |
| * | Obagi Medical Products Inc. | 170,999 | 1,975 |
| * | RehabCare Group Inc. | 80,876 | 1,917 |
| *,^ | Metabolix Inc. | 153,794 | 1,872 |
| *,^ | Clinical Data Inc. | 117,043 | 1,862 |
| * | Dyax Corp. | 865,508 | 1,852 |
| * | Ironwood Pharmaceuticals Inc. | 177,998 | 1,842 |
| * | Codexis Inc. | 173,715 | 1,841 |
| | Landauer Inc. | 30,554 | 1,832 |
| * | Greatbatch Inc. | 75,464 | 1,822 |
| * | Vital Images Inc. | 126,078 | 1,763 |
| * | IRIS International Inc. | 169,079 | 1,730 |
| * | Nabi Biopharmaceuticals | 297,994 | 1,725 |
| *,^ | Orexigen Therapeutics Inc. | 213,491 | 1,725 |
| * | SurModics Inc. | 144,987 | 1,721 |
| * | Idenix Pharmaceuticals Inc. | 337,402 | 1,701 |
| * | Synovis Life Technologies Inc. | 104,911 | 1,690 |
| * | Enzo Biochem Inc. | 317,895 | 1,678 |
| * | Progenics Pharmaceuticals Inc. | 303,333 | 1,656 |
| * | Stereotaxis Inc. | 428,497 | 1,641 |
| * | OraSure Technologies Inc. | 264,502 | 1,521 |
| * | Pozen Inc. | 221,671 | 1,474 |
| * | Exactech Inc. | 77,966 | 1,467 |
| * | Ligand Pharmaceuticals Inc. Class B | 163,862 | 1,462 |
| * | Lexicon Pharmaceuticals Inc. | 1,014,706 | 1,461 |
| * | TomoTherapy Inc. | 400,019 | 1,444 |
| *,^ | China Biologic Products Inc. | 87,271 | 1,430 |
| * | CryoLife Inc. | 248,277 | 1,346 |
| * | Orthovita Inc. | 641,642 | 1,290 |
| *,^ | Osiris Therapeutics Inc. | 151,292 | 1,179 |
| *,^ | Arena Pharmaceuticals Inc. | 675,116 | 1,161 |
| * | Palomar Medical Technologies Inc. | 81,566 | 1,159 |
| * | Alliance HealthCare Services Inc. | 268,350 | 1,138 |
| *,^ | Biotime Inc. | 135,162 | 1,126 |
| * | Biospecifics Technologies Corp. | 40,611 | 1,040 |
| * | Sunrise Senior Living Inc. | 162,525 | 886 |
| * | Kensey Nash Corp. | 28,273 | 787 |
| * | Alimera Sciences Inc. | 71,790 | 745 |
37
| | | |
| Vanguard® Small-Cap Growth Index Fund | | |
| Schedule of Investments | | |
| December 31, 2010 | | |
| |
| | | | Market |
| | | | Value |
| | | Shares | ($000) |
| *,^ | MELA Sciences Inc. | 221,240 | 741 |
| * | Albany Molecular Research Inc. | 130,635 | 734 |
| * | St. Jude Medical Inc. | 15,463 | 661 |
| * | AMN Healthcare Services Inc. | 105,989 | 651 |
| * | RTI Biologics Inc. | 177,178 | 473 |
| * | Caraco Pharmaceutical Laboratories Ltd. | 90,321 | 410 |
| * | Sucampo Pharmaceuticals Inc. Class A | 74,874 | 288 |
| | | | 1,214,116 |
| Industrials (17.7%) | | |
| | Gardner Denver Inc. | 484,954 | 33,375 |
| * | TransDigm Group Inc. | 434,586 | 31,295 |
| * | Oshkosh Corp. | 839,354 | 29,579 |
| | IDEX Corp. | 755,272 | 29,546 |
| | Waste Connections Inc. | 1,021,183 | 28,113 |
| | Nordson Corp. | 283,328 | 26,032 |
| * | Corrections Corp. of America | 1,024,320 | 25,669 |
| | Wabtec Corp. | 444,338 | 23,501 |
| * | Thomas & Betts Corp. | 484,636 | 23,408 |
| | Acuity Brands Inc. | 403,772 | 23,286 |
| * | Kirby Corp. | 475,159 | 20,931 |
| | Woodward Governor Co. | 537,197 | 20,177 |
| | UTi Worldwide Inc. | 942,351 | 19,978 |
| * | Genesee & Wyoming Inc. Class A | 360,815 | 19,105 |
| | Landstar System Inc. | 462,027 | 18,915 |
| | Toro Co. | 301,210 | 18,567 |
| * | Clean Harbors Inc. | 219,612 | 18,465 |
| * | WABCO Holdings Inc. | 298,735 | 18,202 |
| * | EMCOR Group Inc. | 615,121 | 17,826 |
| | Valmont Industries Inc. | 195,356 | 17,334 |
| * | ArvinMeritor Inc. | 828,593 | 17,003 |
| | Actuant Corp. Class A | 629,896 | 16,768 |
| * | Hexcel Corp. | 900,931 | 16,298 |
| * | Geo Group Inc. | 633,345 | 15,618 |
| * | US Airways Group Inc. | 1,496,118 | 14,976 |
| * | Avis Budget Group Inc. | 953,651 | 14,839 |
| * | Moog Inc. Class A | 363,406 | 14,464 |
| * | Tetra Tech Inc. | 572,440 | 14,345 |
| * | United Stationers Inc. | 216,730 | 13,830 |
| * | Middleby Corp. | 163,108 | 13,770 |
| | CLARCOR Inc. | 305,159 | 13,088 |
| * | United Rentals Inc. | 561,281 | 12,769 |
| *,^ | American Superconductor Corp. | 446,175 | 12,756 |
| | Herman Miller Inc. | 502,563 | 12,715 |
| * | Old Dominion Freight Line Inc. | 388,898 | 12,441 |
| | Rollins Inc. | 616,840 | 12,183 |
| * | HUB Group Inc. Class A | 343,208 | 12,060 |
| * | AMR Corp. | 1,543,868 | 12,027 |
| | Corporate Executive Board Co. | 317,780 | 11,933 |
| | Applied Industrial Technologies Inc. | 353,679 | 11,487 |
| * | II-VI Inc. | 243,677 | 11,297 |
| | Knight Transportation Inc. | 581,167 | 11,042 |
| | Graco Inc. | 279,332 | 11,020 |
| * | Polypore International Inc. | 268,481 | 10,935 |
| * | CoStar Group Inc. | 182,404 | 10,499 |
| * | DigitalGlobe Inc. | 318,770 | 10,108 |
| * | Insituform Technologies Inc. Class A | 363,826 | 9,645 |
| | Healthcare Services Group Inc. | 579,041 | 9,421 |
| | Robbins & Myers Inc. | 259,739 | 9,293 |
| | ESCO Technologies Inc. | 245,562 | 9,292 |
| * | Orbital Sciences Corp. | 535,715 | 9,177 |
| | Baldor Electric Co. | 144,918 | 9,136 |
| * | GeoEye Inc. | 204,761 | 8,680 |
| | Heartland Express Inc. | 504,542 | 8,083 |
| | Resources Connection Inc. | 430,544 | 8,004 |
38
| | | |
| Vanguard® Small-Cap Growth Index Fund | | |
| Schedule of Investments | | |
| December 31, 2010 | | |
| |
| | | | Market |
| | | | Value |
| | | Shares | ($000) |
| | Manitowoc Co. Inc. | 608,767 | 7,981 |
| | Steelcase Inc. Class A | 750,770 | 7,936 |
| * | RBC Bearings Inc. | 201,568 | 7,877 |
| * | Acacia Research - Acacia Technologies | 303,232 | 7,866 |
| * | GrafTech International Ltd. | 392,567 | 7,789 |
| | Forward Air Corp. | 268,795 | 7,628 |
| * | SYKES Enterprises Inc. | 373,552 | 7,568 |
| * | Beacon Roofing Supply Inc. | 423,352 | 7,565 |
| | HEICO Corp. | 147,443 | 7,524 |
| * | Teledyne Technologies Inc. | 168,121 | 7,392 |
| * | Dollar Thrifty Automotive Group Inc. | 155,552 | 7,351 |
| | Knoll Inc. | 436,093 | 7,296 |
| | Raven Industries Inc. | 150,350 | 7,170 |
| | American Science & Engineering Inc. | 83,671 | 7,131 |
| | Franklin Electric Co. Inc. | 183,072 | 7,125 |
| | Cubic Corp. | 148,740 | 7,013 |
| | Interface Inc. Class A | 447,606 | 7,005 |
| * | Advisory Board Co. | 144,679 | 6,891 |
| | Lindsay Corp. | 115,795 | 6,882 |
| | Seaboard Corp. | 3,398 | 6,765 |
| * | Esterline Technologies Corp. | 97,480 | 6,686 |
| * | Mobile Mini Inc. | 337,117 | 6,638 |
| * | AAR Corp. | 237,783 | 6,532 |
| | Administaff Inc. | 218,450 | 6,401 |
| | Allegiant Travel Co. Class A | 127,900 | 6,298 |
| | Tennant Co. | 158,525 | 6,089 |
| | Titan International Inc. | 311,125 | 6,079 |
| *,^ | A123 Systems Inc. | 630,659 | 6,016 |
| * | Blount International Inc. | 376,848 | 5,939 |
| | Badger Meter Inc. | 132,369 | 5,853 |
| | Barnes Group Inc. | 281,392 | 5,816 |
| | National Presto Industries Inc. | 44,522 | 5,788 |
| * | Astec Industries Inc. | 178,304 | 5,779 |
| | Mueller Industries Inc. | 175,143 | 5,727 |
| * | USG Corp. | 322,993 | 5,436 |
| * | 3D Systems Corp. | 171,576 | 5,403 |
| | John Bean Technologies Corp. | 261,130 | 5,257 |
| * | Higher One Holdings Inc. | 258,033 | 5,220 |
| * | Huron Consulting Group Inc. | 194,321 | 5,140 |
| * | Kforce Inc. | 311,549 | 5,041 |
| * | Korn/Ferry International | 215,334 | 4,976 |
| * | Exponent Inc. | 128,640 | 4,828 |
| * | TrueBlue Inc. | 265,374 | 4,774 |
| * | SFN Group Inc. | 488,043 | 4,763 |
| * | RSC Holdings Inc. | 479,737 | 4,673 |
| | Gorman-Rupp Co. | 139,218 | 4,500 |
| | Sun Hydraulics Corp. | 117,959 | 4,459 |
| * | Navigant Consulting Inc. | 464,575 | 4,274 |
| * | ICF International Inc. | 161,833 | 4,162 |
| * | Colfax Corp. | 220,990 | 4,068 |
| | Simpson Manufacturing Co. Inc. | 128,329 | 3,967 |
| * | LB Foster Co. Class A | 95,023 | 3,890 |
| *,^ | EnerNOC Inc. | 161,172 | 3,854 |
| | Great Lakes Dredge & Dock Corp. | 516,191 | 3,804 |
| * | Aerovironment Inc. | 141,483 | 3,796 |
| | HEICO Corp. Class A | 96,965 | 3,619 |
| * | Force Protection Inc. | 651,600 | 3,590 |
| | Standex International Corp. | 115,455 | 3,453 |
| * | KAR Auction Services Inc. | 249,522 | 3,443 |
| * | Ladish Co. Inc. | 69,227 | 3,365 |
| | NACCO Industries Inc. Class A | 30,406 | 3,295 |
| | Marten Transport Ltd. | 152,637 | 3,263 |
| *,^ | Harbin Electric Inc. | 187,333 | 3,250 |
| | AAON Inc. | 115,169 | 3,249 |
39
| | | |
| Vanguard® Small-Cap Growth Index Fund | | |
| Schedule of Investments | | |
| December 31, 2010 | | |
| |
| | | | Market |
| | | | Value |
| | | Shares | ($000) |
| * | Trimas Corp. | 157,526 | 3,223 |
| | Vicor Corp. | 193,827 | 3,179 |
| * | H&E Equipment Services Inc. | 260,036 | 3,009 |
| * | Trex Co. Inc. | 121,596 | 2,913 |
| * | Celadon Group Inc. | 196,941 | 2,913 |
| * | Orion Marine Group Inc. | 248,883 | 2,887 |
| * | Cenveo Inc. | 520,163 | 2,778 |
| | Dynamic Materials Corp. | 122,512 | 2,765 |
| * | Kadant Inc. | 115,245 | 2,716 |
| * | Wabash National Corp. | 221,589 | 2,626 |
| * | Taser International Inc. | 550,136 | 2,586 |
| *,^ | Ener1 Inc. | 670,681 | 2,542 |
| * | Powell Industries Inc. | 75,630 | 2,487 |
| * | Furmanite Corp. | 358,606 | 2,478 |
| * | Standard Parking Corp. | 130,187 | 2,459 |
| | Kaman Corp. | 84,122 | 2,445 |
| * | Saia Inc. | 147,040 | 2,439 |
| * | Hawaiian Holdings Inc. | 309,785 | 2,429 |
| | Viad Corp. | 95,276 | 2,427 |
| * | Michael Baker Corp. | 76,800 | 2,388 |
| * | GenCorp Inc. | 460,937 | 2,383 |
| | AZZ Inc. | 57,605 | 2,305 |
| * | Greenbrier Cos. Inc. | 109,488 | 2,298 |
| * | Pacer International Inc. | 323,961 | 2,216 |
| * | Advanced Battery Technologies Inc. | 571,225 | 2,199 |
| * | Capstone Turbine Corp. | 2,272,534 | 2,181 |
| * | Team Inc. | 83,669 | 2,025 |
| * | RailAmerica Inc. | 148,673 | 1,925 |
| * | Innerworkings Inc. | 253,735 | 1,662 |
| *,^ | YRC Worldwide Inc. | 439,139 | 1,634 |
| * | Sauer-Danfoss Inc. | 56,179 | 1,587 |
| * | Titan Machinery Inc. | 80,402 | 1,552 |
| * | Fuel Tech Inc. | 157,247 | 1,527 |
| | Tredegar Corp. | 77,493 | 1,502 |
| * | Mistras Group Inc. | 111,359 | 1,501 |
| * | APAC Customer Services Inc. | 243,601 | 1,479 |
| * | Pike Electric Corp. | 171,191 | 1,469 |
| | Houston Wire & Cable Co. | 101,814 | 1,368 |
| * | American Railcar Industries Inc. | 57,524 | 1,273 |
| * | Columbus McKinnon Corp. | 58,768 | 1,194 |
| * | Broadwind Energy Inc. | 494,478 | 1,142 |
| *,^ | Energy Recovery Inc. | 290,709 | 1,064 |
| *,^ | Valence Technology Inc. | 617,839 | 1,038 |
| * | Hill International Inc. | 152,013 | 984 |
| * | CBIZ Inc. | 149,865 | 935 |
| * | M&F Worldwide Corp. | 37,748 | 872 |
| * | Fushi Copperweld Inc. | 85,202 | 757 |
| *,^ | China Valves Technology Inc. | 70,808 | 742 |
| *,^ | SmartHeat Inc. | 113,478 | 599 |
| *,^ | Lihua International Inc. | 51,811 | 582 |
| * | Patriot Transportation Holding Inc. | 6,046 | 562 |
| *,^ | China Fire & Security Group Inc. | 76,515 | 503 |
| * | Universal Truckload Services Inc. | 21,554 | 343 |
| * | TBS International plc Class A | 79,871 | 230 |
| * | RINO International Corp. | 164 | 1 |
| | | | 1,343,837 |
| Information Technology (27.0%) | | |
| * | Riverbed Technology Inc. | 1,142,768 | 40,191 |
| * | Informatica Corp. | 858,000 | 37,778 |
| | Solera Holdings Inc. | 649,144 | 33,314 |
| * | MICROS Systems Inc. | 742,671 | 32,574 |
| * | Polycom Inc. | 790,575 | 30,817 |
| * | VeriFone Systems Inc. | 792,213 | 30,548 |
| * | TIBCO Software Inc. | 1,519,762 | 29,954 |
40
| | | |
| Vanguard® Small-Cap Growth Index Fund | | |
| Schedule of Investments | | |
| December 31, 2010 | | |
| |
| | | | Market |
| | | | Value |
| | | Shares | ($000) |
| * | JDS Uniphase Corp. | 2,054,355 | 29,747 |
| * | CommScope Inc. | 878,117 | 27,415 |
| *,^ | Rackspace Hosting Inc. | 869,040 | 27,297 |
| * | Monster Worldwide Inc. | 1,143,343 | 27,017 |
| * | WebMD Health Corp. | 511,523 | 26,118 |
| * | Varian Semiconductor Equipment Associates Inc. | 693,601 | 25,642 |
| * | Parametric Technology Corp. | 1,069,470 | 24,095 |
| * | Atheros Communications Inc. | 656,730 | 23,590 |
| * | Gartner Inc. | 706,933 | 23,470 |
| | Jack Henry & Associates Inc. | 756,674 | 22,057 |
| * | Concur Technologies Inc. | 409,145 | 21,247 |
| * | Itron Inc. | 374,373 | 20,759 |
| | National Instruments Corp. | 544,989 | 20,513 |
| * | Cadence Design Systems Inc. | 2,468,374 | 20,389 |
| * | Zebra Technologies Corp. | 525,516 | 19,964 |
| * | Ariba Inc. | 838,115 | 19,687 |
| * | Finisar Corp. | 638,160 | 18,947 |
| | ADTRAN Inc. | 522,610 | 18,924 |
| * | VistaPrint NV | 407,449 | 18,743 |
| *,^ | Ciena Corp. | 863,154 | 18,169 |
| * | NeuStar Inc. Class A | 695,636 | 18,121 |
| * | Silicon Laboratories Inc. | 393,146 | 18,093 |
| * | Sohu.com Inc. | 280,657 | 17,819 |
| * | Microsemi Corp. | 770,202 | 17,638 |
| * | QLogic Corp. | 1,012,920 | 17,240 |
| * | InterDigital Inc. | 408,497 | 17,010 |
| * | TriQuint Semiconductor Inc. | 1,442,742 | 16,866 |
| | Plantronics Inc. | 442,012 | 16,452 |
| * | MercadoLibre Inc. | 245,545 | 16,366 |
| *,^ | Veeco Instruments Inc. | 379,016 | 16,283 |
| * | Quest Software Inc. | 586,062 | 16,257 |
| | Anixter International Inc. | 266,290 | 15,905 |
| * | Wright Express Corp. | 337,008 | 15,502 |
| * | Acme Packet Inc. | 288,860 | 15,356 |
| * | Teradyne Inc. | 1,092,838 | 15,343 |
| * | Aruba Networks Inc. | 694,278 | 14,497 |
| * | Hittite Microwave Corp. | 226,300 | 13,813 |
| * | Cypress Semiconductor Corp. | 705,229 | 13,103 |
| * | SuccessFactors Inc. | 444,403 | 12,870 |
| * | GSI Commerce Inc. | 553,564 | 12,843 |
| * | Digital River Inc. | 367,543 | 12,651 |
| * | Cavium Networks Inc. | 331,768 | 12,501 |
| * | Blackboard Inc. | 302,019 | 12,473 |
| * | j2 Global Communications Inc. | 422,591 | 12,234 |
| * | ValueClick Inc. | 758,478 | 12,158 |
| | Sapient Corp. | 1,001,316 | 12,116 |
| * | Acxiom Corp. | 704,791 | 12,087 |
| * | Blue Coat Systems Inc. | 396,115 | 11,832 |
| * | Fortinet Inc. | 363,863 | 11,771 |
| * | Cymer Inc. | 260,169 | 11,726 |
| * | Plexus Corp. | 374,578 | 11,589 |
| * | CommVault Systems Inc. | 380,429 | 10,888 |
| * | Netlogic Microsystems Inc. | 344,486 | 10,820 |
| * | Ultimate Software Group Inc. | 221,044 | 10,749 |
| * | Rambus Inc. | 519,360 | 10,636 |
| | MAXIMUS Inc. | 160,693 | 10,538 |
| | Blackbaud Inc. | 406,145 | 10,519 |
| | Power Integrations Inc. | 258,204 | 10,364 |
| * | Tessera Technologies Inc. | 465,837 | 10,318 |
| * | Unisys Corp. | 395,237 | 10,233 |
| * | Viasat Inc. | 220,158 | 9,777 |
| * | Cirrus Logic Inc. | 596,721 | 9,536 |
| *,^ | Synaptics Inc. | 319,581 | 9,389 |
| * | FEI Co. | 353,698 | 9,341 |
41
| | | |
| Vanguard® Small-Cap Growth Index Fund | | |
| Schedule of Investments | | |
| December 31, 2010 | | |
| |
| | | | Market |
| | | | Value |
| | | Shares | ($000) |
| * | Rofin-Sinar Technologies Inc. | 261,927 | 9,283 |
| * | TiVo Inc. | 1,074,377 | 9,272 |
| * | L-1 Identity Solutions Inc. | 777,048 | 9,255 |
| * | Taleo Corp. Class A | 333,917 | 9,233 |
| *,^ | Universal Display Corp. | 300,750 | 9,218 |
| *,^ | Power-One Inc. | 887,030 | 9,048 |
| * | OpenTable Inc. | 127,126 | 8,960 |
| * | Cabot Microelectronics Corp. | 216,160 | 8,960 |
| * | Advent Software Inc. | 154,090 | 8,925 |
| * | Diodes Inc. | 328,651 | 8,870 |
| * | Mantech International Corp. Class A | 213,645 | 8,830 |
| * | Art Technology Group Inc. | 1,465,906 | 8,766 |
| * | Infinera Corp. | 831,642 | 8,591 |
| * | Progress Software Corp. | 200,740 | 8,495 |
| * | SAVVIS Inc. | 332,656 | 8,489 |
| * | Semtech Corp. | 373,970 | 8,467 |
| * | Compuware Corp. | 724,474 | 8,455 |
| * | Entropic Communications Inc. | 694,674 | 8,392 |
| * | SRA International Inc. Class A | 407,236 | 8,328 |
| * | ACI Worldwide Inc. | 309,290 | 8,311 |
| * | AsiaInfo-Linkage Inc. | 481,012 | 7,970 |
| * | Constant Contact Inc. | 255,053 | 7,904 |
| * | Scansource Inc. | 247,519 | 7,896 |
| * | DTS Inc. | 158,816 | 7,790 |
| * | Harmonic Inc. | 904,522 | 7,752 |
| *,^ | Ebix Inc. | 324,961 | 7,692 |
| * | GT Solar International Inc. | 833,455 | 7,601 |
| * | Amkor Technology Inc. | 1,020,234 | 7,540 |
| * | Checkpoint Systems Inc. | 365,964 | 7,521 |
| * | IPG Photonics Corp. | 236,152 | 7,467 |
| * | Euronet Worldwide Inc. | 425,172 | 7,415 |
| | Syntel Inc. | 154,644 | 7,390 |
| | Comtech Telecommunications Corp. | 262,320 | 7,274 |
| * | Verigy Ltd. | 554,869 | 7,224 |
| * | Netgear Inc. | 213,301 | 7,184 |
| * | Quantum Corp. | 1,917,473 | 7,133 |
| * | DealerTrack Holdings Inc. | 355,157 | 7,128 |
| * | MicroStrategy Inc. Class A | 80,934 | 6,917 |
| * | DG FastChannel Inc. | 237,214 | 6,851 |
| * | Aspen Technology Inc. | 531,381 | 6,749 |
| * | Novell Inc. | 1,134,329 | 6,715 |
| * | Radiant Systems Inc. | 338,857 | 6,631 |
| * | Ancestry.com Inc. | 233,521 | 6,613 |
| * | Applied Micro Circuits Corp. | 616,767 | 6,587 |
| * | Sourcefire Inc. | 244,339 | 6,336 |
| *,^ | Sonic Solutions Inc. | 421,152 | 6,317 |
| * | Netscout Systems Inc. | 271,821 | 6,255 |
| * | Manhattan Associates Inc. | 204,707 | 6,252 |
| * | Synchronoss Technologies Inc. | 232,340 | 6,206 |
| * | Standard Microsystems Corp. | 209,489 | 6,040 |
| * | Oclaro Inc. | 458,935 | 6,035 |
| * | CSG Systems International Inc. | 315,837 | 5,982 |
| * | Stratasys Inc. | 181,082 | 5,911 |
| * | Intermec Inc. | 458,844 | 5,809 |
| * | Volterra Semiconductor Corp. | 249,169 | 5,771 |
| * | LogMeIn Inc. | 129,728 | 5,752 |
| * | TeleTech Holdings Inc. | 278,993 | 5,744 |
| * | Compellent Technologies Inc. | 206,529 | 5,698 |
| | Pegasystems Inc. | 154,935 | 5,675 |
| * | Tyler Technologies Inc. | 273,222 | 5,672 |
| * | OSI Systems Inc. | 153,695 | 5,588 |
| * | Ixia | 333,030 | 5,588 |
| | iGate Corp. | 283,370 | 5,585 |
| * | Cardtronics Inc. | 311,782 | 5,519 |
42
| | | |
| Vanguard® Small-Cap Growth Index Fund | | |
| Schedule of Investments | | |
| December 31, 2010 | | |
| |
| | | | Market |
| | | | Value |
| | | Shares | ($000) |
| * | SolarWinds Inc. | 286,367 | 5,513 |
| | Heartland Payment Systems Inc. | 353,155 | 5,446 |
| *,^ | STEC Inc. | 306,168 | 5,404 |
| * | Monolithic Power Systems Inc. | 322,174 | 5,322 |
| * | RightNow Technologies Inc. | 222,845 | 5,275 |
| | Micrel Inc. | 404,619 | 5,256 |
| | Daktronics Inc. | 325,123 | 5,176 |
| * | Omnivision Technologies Inc. | 174,763 | 5,175 |
| | Forrester Research Inc. | 146,420 | 5,167 |
| | Cognex Corp. | 174,702 | 5,140 |
| * | Terremark Worldwide Inc. | 396,094 | 5,129 |
| * | Sonus Networks Inc. | 1,912,419 | 5,106 |
| ^ | VirnetX Holding Corp. | 330,044 | 4,901 |
| * | Integrated Device Technology Inc. | 734,674 | 4,893 |
| | NIC Inc. | 501,150 | 4,866 |
| * | BroadSoft Inc. | 199,532 | 4,765 |
| * | Vocus Inc. | 171,107 | 4,733 |
| * | FARO Technologies Inc. | 142,186 | 4,669 |
| * | Verint Systems Inc. | 142,618 | 4,521 |
| * | comScore Inc. | 202,158 | 4,510 |
| * | Smith Micro Software Inc. | 286,031 | 4,502 |
| * | NetSuite Inc. | 177,236 | 4,431 |
| *,^ | QuinStreet Inc. | 229,837 | 4,415 |
| *,^ | SunPower Corp. Class A | 335,501 | 4,304 |
| * | Dice Holdings Inc. | 299,600 | 4,299 |
| * | Ultratech Inc. | 212,632 | 4,227 |
| * | Anadigics Inc. | 605,712 | 4,198 |
| * | Maxwell Technologies Inc. | 220,810 | 4,171 |
| | EPIQ Systems Inc. | 300,805 | 4,130 |
| * | Mercury Computer Systems Inc. | 224,590 | 4,128 |
| * | Ceva Inc. | 197,011 | 4,039 |
| * | Websense Inc. | 196,649 | 3,982 |
| * | Kenexa Corp. | 178,426 | 3,888 |
| * | Sycamore Networks Inc. | 184,587 | 3,801 |
| * | ATMI Inc. | 189,751 | 3,784 |
| * | Oplink Communications Inc. | 194,671 | 3,596 |
| *,^ | Rubicon Technology Inc. | 169,966 | 3,583 |
| | Opnet Technologies Inc. | 129,220 | 3,459 |
| * | Silicon Image Inc. | 462,786 | 3,401 |
| * | S1 Corp. | 492,405 | 3,398 |
| * | TNS Inc. | 157,686 | 3,280 |
| * | Interactive Intelligence Inc. | 121,548 | 3,180 |
| * | SunPower Corp. Class B | 252,842 | 3,138 |
| *,^ | Powerwave Technologies Inc. | 1,229,992 | 3,124 |
| * | DemandTec Inc. | 278,088 | 3,014 |
| * | Echelon Corp. | 287,732 | 2,932 |
| * | ExlService Holdings Inc. | 135,227 | 2,905 |
| * | LoopNet Inc. | 253,076 | 2,812 |
| * | Novatel Wireless Inc. | 292,924 | 2,797 |
| * | Super Micro Computer Inc. | 237,594 | 2,742 |
| * | SS&C Technologies Holdings Inc. | 133,260 | 2,733 |
| * | Knot Inc. | 267,767 | 2,646 |
| * | Limelight Networks Inc. | 455,046 | 2,644 |
| | Cass Information Systems Inc. | 69,672 | 2,643 |
| *,^ | Calix Inc. | 155,634 | 2,630 |
| * | Internap Network Services Corp. | 432,343 | 2,629 |
| * | Kopin Corp. | 617,688 | 2,570 |
| * | Pericom Semiconductor Corp. | 230,802 | 2,534 |
| * | IXYS Corp. | 217,865 | 2,532 |
| * | Multi-Fineline Electronix Inc. | 92,239 | 2,443 |
| * | Digi International Inc. | 219,732 | 2,439 |
| * | Monotype Imaging Holdings Inc. | 211,063 | 2,343 |
| * | Lattice Semiconductor Corp. | 378,587 | 2,294 |
| * | VASCO Data Security International Inc. | 279,393 | 2,271 |
43
| | | |
| Vanguard® Small-Cap Growth Index Fund | | |
| Schedule of Investments | | |
| December 31, 2010 | | |
| |
| | | | Market |
| | | | Value |
| | | Shares | ($000) |
| * | Seachange International Inc. | 261,492 | 2,236 |
| * | RealNetworks Inc. | 531,358 | 2,232 |
| * | Actuate Corp. | 390,611 | 2,226 |
| *,^ | Rosetta Stone Inc. | 104,824 | 2,224 |
| * | Virtusa Corp. | 134,470 | 2,200 |
| * | Net 1 UEPS Technologies Inc. | 178,607 | 2,190 |
| * | Avid Technology Inc. | 123,532 | 2,157 |
| * | Cray Inc. | 299,557 | 2,142 |
| * | Bottomline Technologies Inc. | 96,901 | 2,104 |
| * | PROS Holdings Inc. | 181,493 | 2,067 |
| * | TeleCommunication Systems Inc. Class A | 435,388 | 2,033 |
| * | Fabrinet | 93,832 | 2,017 |
| * | Rogers Corp. | 51,310 | 1,963 |
| * | Pulse Electronics Corp. | 364,877 | 1,941 |
| * | Liquidity Services Inc. | 136,935 | 1,924 |
| * | Move Inc. | 724,531 | 1,862 |
| * | Perficient Inc. | 132,157 | 1,652 |
| * | ShoreTel Inc. | 208,656 | 1,630 |
| * | NCI Inc. Class A | 70,471 | 1,620 |
| * | Integral Systems Inc. | 162,934 | 1,615 |
| * | Global Cash Access Holdings Inc. | 494,508 | 1,577 |
| * | Comverge Inc. | 222,540 | 1,538 |
| *,^ | China Information Technology Inc. | 288,284 | 1,502 |
| * | Advanced Analogic Technologies Inc. | 370,311 | 1,485 |
| * | Electro Scientific Industries Inc. | 90,895 | 1,457 |
| * | Zoran Corp. | 161,262 | 1,419 |
| * | EMS Technologies Inc. | 70,996 | 1,404 |
| * | FormFactor Inc. | 154,666 | 1,373 |
| * | Anaren Inc. | 64,571 | 1,346 |
| | Stamps.com Inc. | 99,228 | 1,315 |
| * | Conexant Systems Inc. | 749,919 | 1,222 |
| *,^ | Echo Global Logistics Inc. | 100,819 | 1,214 |
| * | Sigma Designs Inc. | 85,634 | 1,213 |
| * | China Security & Surveillance Technology Inc. | 224,155 | 1,195 |
| * | BigBand Networks Inc. | 412,389 | 1,155 |
| * | Meru Networks Inc. | 73,564 | 1,134 |
| * | Deltek Inc. | 155,977 | 1,132 |
| *,^ | Energy Conversion Devices Inc. | 224,460 | 1,032 |
| * | Extreme Networks | 278,183 | 860 |
| * | Exar Corp. | 121,423 | 848 |
| * | MaxLinear Inc. | 68,384 | 736 |
| | Renaissance Learning Inc. | 47,425 | 561 |
| * | China TransInfo Technology Corp. | 45,718 | 216 |
| * | Equinix Inc. | 1 | — |
| | | | 2,054,363 |
| Materials (5.1%) | | |
| * | Hecla Mining Co. | 2,374,092 | 26,732 |
| * | Solutia Inc. | 1,130,879 | 26,101 |
| * | WR Grace & Co. | 674,793 | 23,705 |
| * | Allied Nevada Gold Corp. | 739,091 | 19,446 |
| * | Stillwater Mining Co. | 848,977 | 18,126 |
| * | Intrepid Potash Inc. | 417,814 | 15,580 |
| * | Rockwood Holdings Inc. | 388,159 | 15,185 |
| | Schnitzer Steel Industries Inc. | 213,468 | 14,172 |
| | NewMarket Corp. | 113,433 | 13,994 |
| | Royal Gold Inc. | 236,395 | 12,914 |
| * | Ferro Corp. | 798,602 | 11,692 |
| | Schweitzer-Mauduit International Inc. | 170,301 | 10,715 |
| | Globe Specialty Metals Inc. | 585,736 | 10,010 |
| | Rock-Tenn Co. Class A | 171,457 | 9,250 |
| | Balchem Corp. | 262,664 | 8,881 |
| | Silgan Holdings Inc. | 232,918 | 8,341 |
| * | Clearwater Paper Corp. | 106,401 | 8,331 |
| * | Calgon Carbon Corp. | 520,754 | 7,874 |
44
| | | |
| Vanguard® Small-Cap Growth Index Fund | | |
| Schedule of Investments | | |
| December 31, 2010 | | |
| |
| | | | Market |
| | | | Value |
| | | Shares | ($000) |
| * | RTI International Metals Inc. | 278,942 | 7,526 |
| * | Brush Engineered Materials Inc. | 188,540 | 7,285 |
| | Temple-Inland Inc. | 331,985 | 7,051 |
| * | PolyOne Corp. | 560,466 | 7,000 |
| * | US Gold Corp. | 863,426 | 6,968 |
| * | Kraton Performance Polymers Inc. | 202,350 | 6,263 |
| | AK Steel Holding Corp. | 356,647 | 5,838 |
| * | Horsehead Holding Corp. | 401,997 | 5,242 |
| * | KapStone Paper and Packaging Corp. | 319,518 | 4,889 |
| *,^ | STR Holdings Inc. | 230,074 | 4,601 |
| * | Innospec Inc. | 220,714 | 4,503 |
| | Zep Inc. | 201,162 | 3,999 |
| | Buckeye Technologies Inc. | 181,650 | 3,816 |
| * | LSB Industries Inc. | 156,253 | 3,791 |
| * | General Moly Inc. | 571,973 | 3,706 |
| | Worthington Industries Inc. | 198,497 | 3,652 |
| * | Zoltek Cos. Inc. | 270,965 | 3,130 |
| | Deltic Timber Corp. | 52,057 | 2,933 |
| * | Capital Gold Corp. | 567,302 | 2,876 |
| | Stepan Co. | 37,247 | 2,841 |
| | Boise Inc. | 357,400 | 2,834 |
| * | Georgia Gulf Corp. | 110,136 | 2,650 |
| * | Golden Minerals Co. | 98,656 | 2,634 |
| | Haynes International Inc. | 56,193 | 2,351 |
| * | Graham Packaging Co. Inc. | 173,814 | 2,267 |
| *,^ | Gulf Resources Inc. | 192,621 | 2,059 |
| *,^ | Yongye International Inc. | 232,157 | 1,950 |
| * | Metals USA Holdings Corp. | 120,054 | 1,830 |
| | PH Glatfelter Co. | 148,864 | 1,827 |
| * | Spartech Corp. | 186,239 | 1,743 |
| * | Graphic Packaging Holding Co. | 398,093 | 1,549 |
| * | TPC Group Inc. | 48,588 | 1,473 |
| * | Landec Corp. | 233,675 | 1,397 |
| | Hawkins Inc. | 28,496 | 1,265 |
| *,^ | China Agritech Inc. | 86,255 | 1,058 |
| * | United States Lime & Minerals Inc. | 20,863 | 879 |
| | | | 388,725 |
| Telecommunication Services (1.3%) | | |
| * | tw telecom inc Class A | 1,335,040 | 22,762 |
| * | Level 3 Communications Inc. | 10,032,376 | 9,832 |
| | AboveNet Inc. | 139,947 | 8,181 |
| * | Leap Wireless International Inc. | 580,557 | 7,118 |
| * | Cogent Communications Group Inc. | 425,001 | 6,010 |
| | Alaska Communications Systems Group Inc. | 413,729 | 4,592 |
| * | PAETEC Holding Corp. | 1,210,454 | 4,527 |
| * | Neutral Tandem Inc. | 290,689 | 4,198 |
| * | Global Crossing Ltd. | 307,917 | 3,978 |
| | Shenandoah Telecommunications Co. | 209,196 | 3,918 |
| * | Hughes Communications Inc. | 91,186 | 3,688 |
| * | General Communication Inc. Class A | 288,845 | 3,657 |
| | USA Mobility Inc. | 205,085 | 3,644 |
| * | Cbeyond Inc. | 228,314 | 3,489 |
| * | Vonage Holdings Corp. | 1,079,740 | 2,419 |
| * | ICO Global Communications Holdings Ltd. | 1,482,079 | 2,223 |
| * | Premiere Global Services Inc. | 298,895 | 2,032 |
| | Atlantic Tele-Network Inc. | 46,190 | 1,771 |
| * | Iridium Communications Inc. | 125,134 | 1,032 |
| | | | 99,071 |
| Utilities (0.6%) | | |
| | ITC Holdings Corp. | 466,274 | 28,900 |
| * | GenOn Energy Inc. | 2,485,850 | 9,471 |
| | Ormat Technologies Inc. | 189,605 | 5,608 |
45
| | | | | |
| Vanguard® Small-Cap Growth Index Fund | | | | |
| Schedule of Investments | | | | |
| December 31, 2010 | | | | |
| |
| | | | | | Market |
| | | | | | Value |
| | | | | Shares | ($000) |
| * | Dynegy Inc. Class A | | | 332,527 | 1,869 |
| | | | | | 45,848 |
| Total Common Stocks (Cost $5,747,415) | | | | 7,559,133 |
| |
| | | Coupon | | | |
| Temporary Cash Investments (2.9%)1 | | | | |
| Money Market Fund (2.8%) | | | | |
| 2,3 | Vanguard Market Liquidity Fund | 0.211% | | 215,745,043 | 215,745 |
| |
| | | | | Face | |
| | | | Maturity | Amount | |
| | | | Date | ($000) | |
| U.S. Government and Agency Obligations (0.1%) | | | | |
| 4,5 | Fannie Mae Discount Notes | 0.200% | 2/14/11 | 3,000 | 2,999 |
| 4,5 | Fannie Mae Discount Notes | 0.340% | 3/1/11 | 200 | 200 |
| | | | | | 3,199 |
| Total Temporary Cash Investments (Cost $218,944) | | | | 218,944 |
| Total Investments (102.4%) (Cost $5,966,359) | | | | 7,778,077 |
| Other Assets and Liabilities—Net (-2.4%)3 | | | | (179,726) |
| Net Assets (100%) | | | | 7,598,351 |
* Non-income-producing security.
^ Part of security position is on loan to broker-dealers. The total value of securities on loan is $141,716,000.
1 The fund invests a portion of its cash reserves in equity markets through the use of index futures contracts. After giving effect to futures investments, the fund's effective common stock and temporary cash investment positions represent 100.0% and 2.4%, respectively, of net assets.
2 Affiliated money market fund available only to Vanguard funds and certain trusts and accounts managed by Vanguard. Rate shown is the 7-day yield.
3 Includes $152,792,000 of collateral received for securities on loan.
4 Securities with a value of $2,399,000 have been segregated as initial margin for open futures contracts.
5 The issuer operates under a congressional charter; its securities are not backed by the full faith and credit of the U.S. government.
46
| | |
| Vanguard® Small-Cap Value Index Fund | | |
| Schedule of Investments | | |
| December 31, 2010 | | |
| |
| | | Market |
| | | Value |
| | Shares | ($000) |
| Common Stocks (99.9%)1 | | |
| Consumer Discretionary (11.1%) | | |
| Williams-Sonoma Inc. | 862,459 | 30,781 |
| Tupperware Brands Corp. | 559,079 | 26,651 |
| Jarden Corp. | 811,672 | 25,056 |
| RadioShack Corp. | 1,111,200 | 20,546 |
| Rent-A-Center Inc. | 584,858 | 18,879 |
| Service Corp. International | 2,187,711 | 18,049 |
| Dillard's Inc. Class A | 417,529 | 15,841 |
| * Career Education Corp. | 719,494 | 14,915 |
| * Jo-Ann Stores Inc. | 229,698 | 13,832 |
| Wolverine World Wide Inc. | 431,918 | 13,770 |
| * Collective Brands Inc. | 574,437 | 12,121 |
| Jones Group Inc. | 771,164 | 11,984 |
| Cooper Tire & Rubber Co. | 489,609 | 11,545 |
| Hillenbrand Inc. | 551,343 | 11,473 |
| Cracker Barrel Old Country Store Inc. | 208,591 | 11,425 |
| Six Flags Entertainment Corp. | 206,335 | 11,225 |
| Meredith Corp. | 321,700 | 11,147 |
| Men's Wearhouse Inc. | 442,723 | 11,059 |
| Cinemark Holdings Inc. | 602,583 | 10,389 |
| * Jack in the Box Inc. | 487,801 | 10,307 |
| MDC Holdings Inc. | 333,792 | 9,603 |
| * Dress Barn Inc. | 361,513 | 9,551 |
| KB Home | 701,534 | 9,464 |
| * Timberland Co. Class A | 367,814 | 9,045 |
| Bob Evans Farms Inc. | 270,419 | 8,913 |
| Regal Entertainment Group Class A | 751,374 | 8,821 |
| Group 1 Automotive Inc. | 211,031 | 8,813 |
| Regis Corp. | 509,540 | 8,458 |
| * Genesco Inc. | 214,148 | 8,028 |
| Finish Line Inc. Class A | 462,673 | 7,953 |
| * Cabela's Inc. | 360,388 | 7,838 |
| * Carter's Inc. | 263,149 | 7,766 |
| * Helen of Troy Ltd. | 257,988 | 7,673 |
| * Pinnacle Entertainment Inc. | 540,600 | 7,579 |
| * Hanesbrands Inc. | 296,351 | 7,527 |
| * New York Times Co. Class A | 751,317 | 7,363 |
| Brunswick Corp. | 392,323 | 7,352 |
| American Greetings Corp. Class A | 328,408 | 7,278 |
| ^ Scholastic Corp. | 245,125 | 7,241 |
| * AnnTaylor Stores Corp. | 261,285 | 7,157 |
| * Valassis Communications Inc. | 217,749 | 7,044 |
| * Ruby Tuesday Inc. | 516,234 | 6,742 |
| Cato Corp. Class A | 245,471 | 6,728 |
| * Vail Resorts Inc. | 128,525 | 6,688 |
| * OfficeMax Inc. | 376,305 | 6,661 |
| Ryland Group Inc. | 390,512 | 6,650 |
| * Office Depot Inc. | 1,221,580 | 6,597 |
| * Saks Inc. | 605,450 | 6,478 |
| * Skechers U.S.A. Inc. Class A | 320,217 | 6,404 |
| Columbia Sportswear Co. | 104,764 | 6,317 |
| Buckle Inc. | 161,477 | 6,099 |
| * Quiksilver Inc. | 1,174,002 | 5,952 |
| Stage Stores Inc. | 338,418 | 5,868 |
| * Belo Corp. Class A | 813,473 | 5,759 |
| * Meritage Homes Corp. | 255,599 | 5,674 |
| Brown Shoe Co. Inc. | 384,262 | 5,353 |
| * Boyd Gaming Corp. | 496,170 | 5,259 |
| Stewart Enterprises Inc. Class A | 753,667 | 5,042 |
| ^ Barnes & Noble Inc. | 344,995 | 4,882 |
| Churchill Downs Inc. | 109,143 | 4,737 |
| * Ascent Media Corp. Class A | 119,997 | 4,651 |
47
| | | |
| Vanguard® Small-Cap Value Index Fund | | |
| Schedule of Investments | | |
| December 31, 2010 | | |
| |
| | | | Market |
| | | | Value |
| | | Shares | ($000) |
| * | Penske Automotive Group Inc. | 264,864 | 4,614 |
| | Fred's Inc. Class A | 331,505 | 4,562 |
| *,^ | Education Management Corp. | 247,517 | 4,480 |
| * | 99 Cents Only Stores | 280,772 | 4,476 |
| * | Jakks Pacific Inc. | 244,540 | 4,456 |
| * | Standard Pacific Corp. | 946,901 | 4,356 |
| | Harte-Hanks Inc. | 337,603 | 4,311 |
| | Sonic Automotive Inc. Class A | 323,753 | 4,287 |
| * | Dorman Products Inc. | 118,245 | 4,285 |
| | Superior Industries International Inc. | 200,964 | 4,264 |
| * | RC2 Corp. | 191,444 | 4,168 |
| * | La-Z-Boy Inc. | 458,891 | 4,139 |
| *,^ | Corinthian Colleges Inc. | 779,806 | 4,063 |
| | Drew Industries Inc. | 175,254 | 3,982 |
| * | Winnebago Industries Inc. | 257,762 | 3,918 |
| * | Charming Shoppes Inc. | 1,022,196 | 3,629 |
| *,^ | Beazer Homes USA Inc. | 670,011 | 3,611 |
| | Ameristar Casinos Inc. | 231,050 | 3,611 |
| | Choice Hotels International Inc. | 92,293 | 3,532 |
| * | Federal-Mogul Corp. | 170,618 | 3,523 |
| * | DSW Inc. Class A | 85,153 | 3,330 |
| | International Speedway Corp. Class A | 122,288 | 3,200 |
| | Oxford Industries Inc. | 124,326 | 3,184 |
| | World Wrestling Entertainment Inc. Class A | 215,987 | 3,076 |
| * | Core-Mark Holding Co. Inc. | 85,934 | 3,058 |
| * | Liz Claiborne Inc. | 417,672 | 2,991 |
| | Callaway Golf Co. | 370,549 | 2,990 |
| * | Talbots Inc. | 341,721 | 2,911 |
| * | ChinaCast Education Corp. | 374,589 | 2,907 |
| * | Biglari Holdings Inc. | 7,043 | 2,889 |
| * | EW Scripps Co. Class A | 282,318 | 2,866 |
| * | Red Robin Gourmet Burgers Inc. | 131,898 | 2,832 |
| | Big 5 Sporting Goods Corp. | 184,169 | 2,812 |
| | Lincoln Educational Services Corp. | 166,869 | 2,588 |
| * | Movado Group Inc. | 160,272 | 2,587 |
| * | American Axle & Manufacturing Holdings Inc. | 199,753 | 2,569 |
| * | M/I Homes Inc. | 164,313 | 2,527 |
| | HOT Topic Inc. | 394,654 | 2,474 |
| | Marcus Corp. | 184,474 | 2,448 |
| | Nutrisystem Inc. | 107,370 | 2,258 |
| * | Unifi Inc. | 133,135 | 2,254 |
| * | Shoe Carnival Inc. | 81,634 | 2,204 |
| | Stein Mart Inc. | 231,250 | 2,139 |
| * | Modine Manufacturing Co. | 137,187 | 2,126 |
| * | Domino's Pizza Inc. | 128,370 | 2,048 |
| | Speedway Motorsports Inc. | 130,537 | 2,000 |
| | Christopher & Banks Corp. | 317,190 | 1,951 |
| | Haverty Furniture Cos. Inc. | 147,942 | 1,920 |
| * | Journal Communications Inc. Class A | 379,699 | 1,917 |
| ^ | PetMed Express Inc. | 101,312 | 1,804 |
| * | Furniture Brands International Inc. | 337,378 | 1,734 |
| * | Asbury Automotive Group Inc. | 91,443 | 1,690 |
| | Spartan Motors Inc. | 276,447 | 1,684 |
| | Weyco Group Inc. | 65,040 | 1,593 |
| * | Pacific Sunwear of California Inc. | 291,978 | 1,583 |
| * | LIN TV Corp. Class A | 277,746 | 1,472 |
| | CSS Industries Inc. | 68,365 | 1,409 |
| * | Systemax Inc. | 98,345 | 1,387 |
| * | Retail Ventures Inc. | 76,699 | 1,250 |
| | Sinclair Broadcast Group Inc. Class A | 146,667 | 1,200 |
| * | America's Car-Mart Inc. | 43,067 | 1,166 |
| * | Monarch Casino & Resort Inc. | 86,665 | 1,083 |
| * | K-Swiss Inc. Class A | 85,092 | 1,061 |
| *,^ | Brookfield Homes Corp. | 105,818 | 995 |
48
| | | |
| Vanguard® Small-Cap Value Index Fund | | |
| Schedule of Investments | | |
| December 31, 2010 | | |
| |
| | | | Market |
| | | | Value |
| | | Shares | ($000) |
| | Ambassadors Group Inc. | 80,626 | 927 |
| | Sturm Ruger & Co. Inc. | 60,174 | 920 |
| * | Leapfrog Enterprises Inc. | 158,377 | 879 |
| * | Kenneth Cole Productions Inc. Class A | 56,422 | 705 |
| * | Smith & Wesson Holding Corp. | 187,888 | 703 |
| * | China XD Plastics Co. Ltd. | 118,511 | 638 |
| *,^ | Fuqi International Inc. | 96,414 | 615 |
| * | Sealy Corp. | 152,761 | 446 |
| * | Wonder Auto Technology Inc. | 58,260 | 439 |
| * | New York & Co. Inc. | 84,094 | 372 |
| * | Lions Gate Entertainment Corp. | 37,339 | 243 |
| | | | 785,324 |
| Consumer Staples (3.8%) | | |
| | Del Monte Foods Co. | 1,723,847 | 32,408 |
| | Corn Products International Inc. | 666,784 | 30,672 |
| | Nu Skin Enterprises Inc. Class A | 494,961 | 14,977 |
| * | Central European Distribution Corp. | 594,334 | 13,610 |
| | Ruddick Corp. | 367,654 | 13,544 |
| * | TreeHouse Foods Inc. | 203,632 | 10,404 |
| * | Hain Celestial Group Inc. | 379,017 | 10,256 |
| | Lancaster Colony Corp. | 174,023 | 9,954 |
| | Fresh Del Monte Produce Inc. | 379,871 | 9,478 |
| | Universal Corp. | 213,774 | 8,701 |
| * | BJ's Wholesale Club Inc. | 166,749 | 7,987 |
| | Sanderson Farms Inc. | 191,240 | 7,487 |
| | Vector Group Ltd. | 364,933 | 6,321 |
| | B&G Foods Inc. Class A | 421,676 | 5,790 |
| | WD-40 Co. | 140,010 | 5,640 |
| | Andersons Inc. | 154,703 | 5,623 |
| * | Chiquita Brands International Inc. | 397,507 | 5,573 |
| | Snyders-Lance Inc. | 229,779 | 5,386 |
| * | Prestige Brands Holdings Inc. | 420,814 | 5,029 |
| * | Elizabeth Arden Inc. | 208,787 | 4,804 |
| *,^ | Dole Food Co. Inc. | 351,483 | 4,749 |
| | Nash Finch Co. | 109,001 | 4,634 |
| | Weis Markets Inc. | 107,102 | 4,319 |
| * | Pantry Inc. | 201,195 | 3,996 |
| ^ | Cal-Maine Foods Inc. | 123,376 | 3,896 |
| * | Central Garden and Pet Co. Class A | 378,786 | 3,742 |
| * | Winn-Dixie Stores Inc. | 489,892 | 3,513 |
| | Spartan Stores Inc. | 200,304 | 3,395 |
| | Tootsie Roll Industries Inc. | 115,545 | 3,347 |
| | Inter Parfums Inc. | 135,181 | 2,548 |
| | Ingles Markets Inc. Class A | 113,889 | 2,187 |
| * | Pilgrim's Pride Corp. | 308,235 | 2,185 |
| | Village Super Market Inc. Class A | 49,661 | 1,639 |
| | Calavo Growers Inc. | 62,983 | 1,452 |
| * | Central Garden and Pet Co. | 140,981 | 1,387 |
| *,^ | American Oriental Bioengineering Inc. | 553,988 | 1,330 |
| * | Alliance One International Inc. | 265,524 | 1,126 |
| * | Revlon Inc. Class A | 108,982 | 1,072 |
| | Farmer Bros Co. | 42,296 | 753 |
| | Coca-Cola Bottling Co. Consolidated | 13,362 | 743 |
| *,^ | China-Biotics Inc. | 50,094 | 736 |
| * | Susser Holdings Corp. | 38,694 | 536 |
| | | | 266,929 |
| Energy (4.9%) | | |
| | Berry Petroleum Co. Class A | 431,146 | 18,841 |
| * | Oil States International Inc. | 289,641 | 18,563 |
| | SEACOR Holdings Inc. | 178,643 | 18,059 |
| | Frontier Oil Corp. | 935,627 | 16,851 |
| * | Unit Corp. | 360,431 | 16,753 |
| * | Swift Energy Co. | 368,624 | 14,432 |
| * | Bristow Group Inc. | 304,209 | 14,404 |
49
| | | |
| Vanguard® Small-Cap Value Index Fund | | |
| Schedule of Investments | | |
| December 31, 2010 | | |
| |
| | | | Market |
| | | | Value |
| | | Shares | ($000) |
| * | Bill Barrett Corp. | 345,974 | 14,230 |
| * | Cloud Peak Energy Inc. | 505,386 | 11,740 |
| | SM Energy Co. | 195,921 | 11,546 |
| | Lufkin Industries Inc. | 172,762 | 10,779 |
| * | Helix Energy Solutions Group Inc. | 886,881 | 10,767 |
| | World Fuel Services Corp. | 283,936 | 10,267 |
| | Overseas Shipholding Group Inc. | 255,857 | 9,062 |
| * | Stone Energy Corp. | 386,865 | 8,623 |
| * | SandRidge Energy Inc. | 1,129,784 | 8,270 |
| * | International Coal Group Inc. | 996,890 | 7,716 |
| | Penn Virginia Corp. | 403,013 | 6,779 |
| * | Atwood Oceanics Inc. | 179,667 | 6,714 |
| * | Gulfmark Offshore Inc. | 208,834 | 6,349 |
| * | James River Coal Co. | 245,973 | 6,230 |
| * | USEC Inc. | 1,011,029 | 6,086 |
| * | Enbridge Energy Management LLC | 86,249 | 5,507 |
| | W&T Offshore Inc. | 297,366 | 5,314 |
| * | Newpark Resources Inc. | 795,784 | 4,902 |
| * | Cal Dive International Inc. | 834,045 | 4,729 |
| * | Parker Drilling Co. | 1,034,355 | 4,727 |
| * | CVR Energy Inc. | 297,902 | 4,522 |
| * | Energy Partners Ltd. | 301,624 | 4,482 |
| * | Hornbeck Offshore Services Inc. | 210,500 | 4,395 |
| * | ION Geophysical Corp. | 505,783 | 4,289 |
| * | Petroleum Development Corp. | 101,231 | 4,273 |
| * | Petroquest Energy Inc. | 503,549 | 3,792 |
| * | Vaalco Energy Inc. | 499,547 | 3,577 |
| | Gulf Island Fabrication Inc. | 120,376 | 3,392 |
| | Crosstex Energy Inc. | 373,443 | 3,309 |
| * | Approach Resources Inc. | 133,909 | 3,093 |
| * | T-3 Energy Services Inc. | 76,603 | 3,051 |
| | General Maritime Corp. | 787,037 | 2,558 |
| * | Willbros Group Inc. | 234,091 | 2,299 |
| * | Global Industries Ltd. | 320,947 | 2,224 |
| * | PHI Inc. | 110,641 | 2,084 |
| * | Hercules Offshore Inc. | 507,023 | 1,754 |
| * | Western Refining Inc. | 165,009 | 1,746 |
| * | Harvest Natural Resources Inc. | 141,878 | 1,727 |
| * | Basic Energy Services Inc. | 100,399 | 1,655 |
| * | Pioneer Drilling Co. | 167,344 | 1,474 |
| * | Delta Petroleum Corp. | 1,612,611 | 1,226 |
| * | Oilsands Quest Inc. | 2,810,767 | 1,181 |
| | Delek US Holdings Inc. | 121,689 | 886 |
| | Alon USA Energy Inc. | 96,855 | 579 |
| *,^ | China Integrated Energy Inc. | 37,039 | 271 |
| | | | 342,079 |
| Financials (35.1%) | | |
| | Camden Property Trust | 593,366 | 32,030 |
| | Essex Property Trust Inc. | 268,714 | 30,693 |
| | Ares Capital Corp. | 1,794,740 | 29,577 |
| * | Popular Inc. | 9,061,279 | 28,452 |
| | Senior Housing Properties Trust | 1,240,274 | 27,212 |
| | Arthur J Gallagher & Co. | 932,068 | 27,105 |
| | Waddell & Reed Financial Inc. Class A | 757,123 | 26,719 |
| | Developers Diversified Realty Corp. | 1,883,780 | 26,542 |
| | First Niagara Financial Group Inc. | 1,852,343 | 25,896 |
| | BRE Properties Inc. | 567,341 | 24,679 |
| | Mack-Cali Realty Corp. | 703,612 | 23,261 |
| * | American Capital Ltd. | 3,043,932 | 23,012 |
| | Allied World Assurance Co. Holdings Ltd. | 368,207 | 21,886 |
| | BioMed Realty Trust Inc. | 1,139,433 | 21,250 |
| | Corporate Office Properties Trust | 584,166 | 20,417 |
| | CBL & Associates Properties Inc. | 1,162,556 | 20,345 |
| | MFA Financial Inc. | 2,489,514 | 20,314 |
50
| | |
| Vanguard® Small-Cap Value Index Fund | | |
| Schedule of Investments | | |
| December 31, 2010 | | |
| |
| | | Market |
| | | Value |
| | Shares | ($000) |
| Protective Life Corp. | 759,143 | 20,224 |
| Highwoods Properties Inc. | 634,759 | 20,217 |
| Bank of Hawaii Corp. | 427,792 | 20,196 |
| National Retail Properties Inc. | 739,001 | 19,584 |
| Aspen Insurance Holdings Ltd. | 679,723 | 19,454 |
| Valley National Bancorp | 1,356,600 | 19,399 |
| FirstMerit Corp. | 964,114 | 19,080 |
| Endurance Specialty Holdings Ltd. | 413,937 | 19,070 |
| Entertainment Properties Trust | 412,141 | 19,062 |
| Apollo Investment Corp. | 1,718,091 | 19,019 |
| Omega Healthcare Investors Inc. | 840,013 | 18,850 |
| StanCorp Financial Group Inc. | 414,216 | 18,698 |
| Hanover Insurance Group Inc. | 398,119 | 18,600 |
| Mid-America Apartment Communities Inc. | 290,705 | 18,457 |
| Home Properties Inc. | 332,356 | 18,442 |
| Tanger Factory Outlet Centers | 358,690 | 18,361 |
| American Campus Communities Inc. | 575,597 | 18,281 |
| Fulton Financial Corp. | 1,762,063 | 18,220 |
| Alterra Capital Holdings Ltd. | 841,304 | 18,206 |
| Erie Indemnity Co. Class A | 269,461 | 17,642 |
| Synovus Financial Corp. | 6,603,174 | 17,432 |
| Apartment Investment & Management Co. | 674,314 | 17,424 |
| Washington Real Estate Investment Trust | 553,818 | 17,163 |
| Kilroy Realty Corp. | 464,026 | 16,923 |
| Washington Federal Inc. | 996,976 | 16,869 |
| TCF Financial Corp. | 1,135,822 | 16,822 |
| * Alleghany Corp. | 54,813 | 16,793 |
| DiamondRock Hospitality Co. | 1,370,187 | 16,442 |
| Platinum Underwriters Holdings Ltd. | 364,314 | 16,383 |
| LaSalle Hotel Properties | 618,660 | 16,333 |
| American Capital Agency Corp. | 567,456 | 16,309 |
| CommonWealth REIT | 638,316 | 16,283 |
| CapitalSource Inc. | 2,289,761 | 16,257 |
| Douglas Emmett Inc. | 977,878 | 16,233 |
| * ProAssurance Corp. | 267,518 | 16,212 |
| Post Properties Inc. | 431,619 | 15,668 |
| Prosperity Bancshares Inc. | 392,179 | 15,405 |
| Westamerica Bancorporation | 258,376 | 14,332 |
| * CNO Financial Group Inc. | 2,111,490 | 14,316 |
| Iberiabank Corp. | 238,191 | 14,084 |
| Brandywine Realty Trust | 1,168,669 | 13,615 |
| Trustmark Corp. | 537,349 | 13,348 |
| Starwood Property Trust Inc. | 607,551 | 13,050 |
| Webster Financial Corp. | 656,449 | 12,932 |
| NewAlliance Bancshares Inc. | 837,246 | 12,542 |
| Delphi Financial Group Inc. | 430,120 | 12,405 |
| First American Financial Corp. | 829,770 | 12,397 |
| Montpelier Re Holdings Ltd. | 619,959 | 12,362 |
| Umpqua Holdings Corp. | 1,013,910 | 12,349 |
| Whitney Holding Corp. | 855,531 | 12,106 |
| Hatteras Financial Corp. | 399,355 | 12,088 |
| Healthcare Realty Trust Inc. | 563,413 | 11,927 |
| UMB Financial Corp. | 286,657 | 11,873 |
| Northwest Bancshares Inc. | 980,769 | 11,534 |
| Potlatch Corp. | 353,991 | 11,522 |
| * PHH Corp. | 491,270 | 11,373 |
| Susquehanna Bancshares Inc. | 1,148,363 | 11,116 |
| * MBIA Inc. | 922,695 | 11,063 |
| Cathay General Bancorp | 660,415 | 11,029 |
| * Knight Capital Group Inc. Class A | 795,566 | 10,971 |
| Astoria Financial Corp. | 779,913 | 10,849 |
| Colonial Properties Trust | 599,145 | 10,815 |
| Unitrin Inc. | 438,609 | 10,763 |
| ^ United Bankshares Inc. | 366,502 | 10,702 |
51
| | |
| Vanguard® Small-Cap Value Index Fund | | |
| Schedule of Investments | | |
| December 31, 2010 | | |
| |
| | | Market |
| | | Value |
| | Shares | ($000) |
| Medical Properties Trust Inc. | 985,152 | 10,669 |
| BancorpSouth Inc. | 665,185 | 10,610 |
| * MGIC Investment Corp. | 1,038,170 | 10,579 |
| * MF Global Holdings Ltd. | 1,244,666 | 10,405 |
| Argo Group International Holdings Ltd. | 275,092 | 10,302 |
| EastGroup Properties Inc. | 238,746 | 10,104 |
| Wintrust Financial Corp. | 304,247 | 10,049 |
| Symetra Financial Corp. | 732,335 | 10,033 |
| FNB Corp. | 1,014,043 | 9,958 |
| National Health Investors Inc. | 220,445 | 9,924 |
| Redwood Trust Inc. | 655,861 | 9,792 |
| International Bancshares Corp. | 480,705 | 9,629 |
| Glacier Bancorp Inc. | 636,634 | 9,620 |
| Cash America International Inc. | 260,175 | 9,608 |
| Radian Group Inc. | 1,177,056 | 9,499 |
| First Financial Bancorp | 513,975 | 9,498 |
| Invesco Mortgage Capital Inc. | 429,802 | 9,387 |
| Tower Group Inc. | 362,692 | 9,278 |
| Old National Bancorp | 771,728 | 9,176 |
| Lexington Realty Trust | 1,152,671 | 9,164 |
| Hancock Holding Co. | 261,163 | 9,104 |
| Franklin Street Properties Corp. | 634,854 | 9,047 |
| Sovran Self Storage Inc. | 244,229 | 8,990 |
| National Penn Bancshares Inc. | 1,116,400 | 8,965 |
| First Citizens BancShares Inc. Class A | 46,640 | 8,817 |
| Hersha Hospitality Trust Class A | 1,308,646 | 8,637 |
| Selective Insurance Group Inc. | 472,888 | 8,583 |
| Equity One Inc. | 453,520 | 8,245 |
| Community Bank System Inc. | 293,582 | 8,153 |
| MB Financial Inc. | 453,807 | 7,860 |
| Capstead Mortgage Corp. | 620,873 | 7,817 |
| RLI Corp. | 148,170 | 7,789 |
| PrivateBancorp Inc. Class A | 537,274 | 7,726 |
| First Financial Bankshares Inc. | 147,584 | 7,553 |
| First Midwest Bancorp Inc. | 655,595 | 7,552 |
| Park National Corp. | 101,639 | 7,386 |
| NBT Bancorp Inc. | 305,300 | 7,373 |
| Columbia Banking System Inc. | 348,122 | 7,331 |
| Anworth Mortgage Asset Corp. | 1,044,254 | 7,310 |
| Provident Financial Services Inc. | 480,917 | 7,276 |
| Prospect Capital Corp. | 670,476 | 7,241 |
| First Potomac Realty Trust | 428,802 | 7,212 |
| American National Insurance Co. | 83,352 | 7,137 |
| Government Properties Income Trust | 260,647 | 6,983 |
| Infinity Property & Casualty Corp. | 111,935 | 6,918 |
| Solar Capital Ltd. | 278,897 | 6,911 |
| Cousins Properties Inc. | 817,907 | 6,821 |
| Pennsylvania Real Estate Investment Trust | 465,201 | 6,759 |
| BlackRock Kelso Capital Corp. | 600,254 | 6,639 |
| Cypress Sharpridge Investments Inc. | 511,026 | 6,597 |
| CVB Financial Corp. | 753,892 | 6,536 |
| Acadia Realty Trust | 355,359 | 6,482 |
| * iStar Financial Inc. | 827,036 | 6,467 |
| * Kindred Healthcare Inc. | 349,499 | 6,420 |
| First Commonwealth Financial Corp. | 906,341 | 6,417 |
| Nelnet Inc. Class A | 269,161 | 6,376 |
| Employers Holdings Inc. | 363,450 | 6,353 |
| * Ocwen Financial Corp. | 665,314 | 6,347 |
| * Forest City Enterprises Inc. Class A | 378,197 | 6,312 |
| Horace Mann Educators Corp. | 348,794 | 6,292 |
| Primerica Inc. | 257,519 | 6,245 |
| Getty Realty Corp. | 198,765 | 6,217 |
| * Investment Technology Group Inc. | 378,251 | 6,192 |
| American Equity Investment Life Holding Co. | 492,372 | 6,179 |
52
| | |
| Vanguard® Small-Cap Value Index Fund | | |
| Schedule of Investments | | |
| December 31, 2010 | | |
| |
| | | Market |
| | | Value |
| | Shares | ($000) |
| Investors Real Estate Trust | 687,690 | 6,169 |
| Glimcher Realty Trust | 734,280 | 6,168 |
| Compass Diversified Holdings | 347,478 | 6,147 |
| * Piper Jaffray Cos. | 175,365 | 6,140 |
| Oritani Financial Corp. | 497,567 | 6,090 |
| * FelCor Lodging Trust Inc. | 859,246 | 6,049 |
| Sterling Bancshares Inc. | 857,264 | 6,018 |
| Inland Real Estate Corp. | 681,920 | 6,001 |
| * Navigators Group Inc. | 119,053 | 5,994 |
| Fifth Street Finance Corp. | 482,721 | 5,860 |
| LTC Properties Inc. | 205,500 | 5,770 |
| * Enstar Group Ltd. | 67,593 | 5,717 |
| PacWest Bancorp | 265,841 | 5,684 |
| Brookline Bancorp Inc. | 522,616 | 5,670 |
| Oriental Financial Group Inc. | 436,341 | 5,450 |
| Associated Estates Realty Corp. | 355,642 | 5,438 |
| * Sunstone Hotel Investors Inc. | 522,392 | 5,396 |
| Chemical Financial Corp. | 242,806 | 5,378 |
| Safety Insurance Group Inc. | 112,957 | 5,373 |
| S&T Bancorp Inc. | 233,989 | 5,286 |
| Flagstone Reinsurance Holdings SA | 414,312 | 5,220 |
| Bank of the Ozarks Inc. | 120,005 | 5,202 |
| * National Financial Partners Corp. | 377,495 | 5,058 |
| MarketAxess Holdings Inc. | 242,078 | 5,038 |
| City Holding Co. | 137,979 | 4,999 |
| DCT Industrial Trust Inc. | 935,446 | 4,967 |
| Independent Bank Corp. | 178,315 | 4,823 |
| * World Acceptance Corp. | 90,075 | 4,756 |
| Meadowbrook Insurance Group Inc. | 450,265 | 4,615 |
| * Strategic Hotels & Resorts Inc. | 870,570 | 4,605 |
| * PMI Group Inc. | 1,355,516 | 4,473 |
| * Western Alliance Bancorp | 605,214 | 4,454 |
| * First Industrial Realty Trust Inc. | 508,095 | 4,451 |
| Home Bancshares Inc. | 201,308 | 4,435 |
| United Fire & Casualty Co. | 197,976 | 4,419 |
| Trustco Bank Corp. NY | 681,133 | 4,318 |
| BGC Partners Inc. Class A | 517,534 | 4,301 |
| Amtrust Financial Services Inc. | 236,910 | 4,146 |
| Artio Global Investors Inc. Class A | 279,772 | 4,127 |
| Walter Investment Management Corp. | 227,942 | 4,089 |
| WesBanco Inc. | 211,840 | 4,017 |
| * Ashford Hospitality Trust Inc. | 415,428 | 4,009 |
| Harleysville Group Inc. | 108,172 | 3,974 |
| Ramco-Gershenson Properties Trust | 319,107 | 3,973 |
| Boston Private Financial Holdings Inc. | 605,797 | 3,968 |
| Education Realty Trust Inc. | 508,758 | 3,953 |
| Sandy Spring Bancorp Inc. | 212,482 | 3,916 |
| Hercules Technology Growth Capital Inc. | 374,290 | 3,878 |
| Dime Community Bancshares Inc. | 259,908 | 3,792 |
| Saul Centers Inc. | 79,513 | 3,765 |
| Universal Health Realty Income Trust | 103,059 | 3,765 |
| FBL Financial Group Inc. Class A | 131,104 | 3,759 |
| * CNA Surety Corp. | 156,855 | 3,714 |
| SCBT Financial Corp. | 113,078 | 3,703 |
| Simmons First National Corp. Class A | 129,645 | 3,695 |
| Flushing Financial Corp. | 262,709 | 3,678 |
| Maiden Holdings Ltd. | 466,767 | 3,669 |
| Renasant Corp. | 210,593 | 3,561 |
| National Western Life Insurance Co. Class A | 21,218 | 3,537 |
| Wilmington Trust Corp. | 810,449 | 3,517 |
| ViewPoint Financial Group | 293,209 | 3,428 |
| Parkway Properties Inc. | 193,816 | 3,396 |
| ^ TowneBank | 212,485 | 3,376 |
| Two Harbors Investment Corp. | 341,510 | 3,343 |
53
| | |
| Vanguard® Small-Cap Value Index Fund | | |
| Schedule of Investments | | |
| December 31, 2010 | | |
| |
| | | Market |
| | | Value |
| | Shares | ($000) |
| Community Trust Bancorp Inc. | 114,625 | 3,320 |
| Cedar Shopping Centers Inc. | 523,689 | 3,294 |
| First Financial Corp. | 92,758 | 3,260 |
| NorthStar Realty Finance Corp. | 685,188 | 3,255 |
| Provident New York Bancorp | 307,684 | 3,228 |
| * FPIC Insurance Group Inc. | 83,855 | 3,099 |
| Hudson Valley Holding Corp. | 124,884 | 3,092 |
| OneBeacon Insurance Group Ltd. Class A | 202,566 | 3,071 |
| GFI Group Inc. | 649,174 | 3,045 |
| Kite Realty Group Trust | 562,259 | 3,042 |
| Tompkins Financial Corp. | 76,667 | 3,002 |
| MVC Capital Inc. | 204,290 | 2,983 |
| * Forestar Group Inc. | 152,994 | 2,953 |
| CapLease Inc. | 506,279 | 2,947 |
| StellarOne Corp. | 202,637 | 2,946 |
| KBW Inc. | 104,678 | 2,923 |
| Lakeland Financial Corp. | 135,615 | 2,910 |
| * AMERISAFE Inc. | 165,777 | 2,901 |
| Chesapeake Lodging Trust | 153,167 | 2,881 |
| Cohen & Steers Inc. | 110,324 | 2,879 |
| * Pico Holdings Inc. | 90,188 | 2,868 |
| SY Bancorp Inc. | 115,230 | 2,829 |
| Bancfirst Corp. | 68,303 | 2,813 |
| WSFS Financial Corp. | 59,062 | 2,802 |
| Capital Southwest Corp. | 26,793 | 2,781 |
| Urstadt Biddle Properties Inc. Class A | 142,781 | 2,777 |
| Berkshire Hills Bancorp Inc. | 124,108 | 2,743 |
| Pennymac Mortgage Investment Trust | 148,847 | 2,702 |
| Winthrop Realty Trust | 209,734 | 2,683 |
| Univest Corp. of Pennsylvania | 139,673 | 2,678 |
| Southside Bancshares Inc. | 126,155 | 2,658 |
| Washington Trust Bancorp Inc. | 121,184 | 2,652 |
| * Global Indemnity plc | 129,335 | 2,645 |
| * Phoenix Cos. Inc. | 1,032,204 | 2,622 |
| 1st Source Corp. | 128,896 | 2,609 |
| Arrow Financial Corp. | 94,775 | 2,607 |
| Colony Financial Inc. | 130,021 | 2,603 |
| First Busey Corp. | 531,197 | 2,497 |
| Calamos Asset Management Inc. Class A | 176,123 | 2,466 |
| State Auto Financial Corp. | 141,395 | 2,463 |
| * Hilltop Holdings Inc. | 245,086 | 2,431 |
| Union First Market Bankshares Corp. | 160,388 | 2,371 |
| Sterling Bancorp | 225,530 | 2,361 |
| Camden National Corp. | 64,793 | 2,347 |
| Oppenheimer Holdings Inc. Class A | 88,300 | 2,314 |
| Northfield Bancorp Inc. | 172,988 | 2,304 |
| * Flagstar Bancorp Inc. | 1,408,753 | 2,296 |
| First Mercury Financial Corp. | 133,836 | 2,195 |
| Advance America Cash Advance Centers Inc. | 385,455 | 2,174 |
| * Citizens Republic Bancorp Inc. | 3,522,193 | 2,166 |
| Territorial Bancorp Inc. | 108,793 | 2,166 |
| Westfield Financial Inc. | 234,122 | 2,166 |
| Republic Bancorp Inc. Class A | 91,084 | 2,163 |
| First Community Bancshares Inc. | 142,535 | 2,129 |
| Suffolk Bancorp | 85,507 | 2,110 |
| Lakeland Bancorp Inc. | 190,950 | 2,095 |
| Hudson Pacific Properties Inc. | 137,570 | 2,070 |
| First Bancorp | 133,666 | 2,046 |
| * Nara Bancorp Inc. | 207,440 | 2,037 |
| Southwest Bancorp Inc. | 163,081 | 2,022 |
| First Merchants Corp. | 226,204 | 2,004 |
| First Interstate Bancsystem Inc. | 130,954 | 1,996 |
| United Financial Bancorp Inc. | 129,930 | 1,984 |
| Trico Bancshares | 119,287 | 1,927 |
54
| | |
| Vanguard® Small-Cap Value Index Fund | | |
| Schedule of Investments | | |
| December 31, 2010 | | |
| |
| | | Market |
| | | Value |
| | Shares | ($000) |
| * Pinnacle Financial Partners Inc. | 140,560 | 1,909 |
| Evercore Partners Inc. Class A | 55,815 | 1,898 |
| * FBR Capital Markets Corp. | 493,618 | 1,886 |
| Bank Mutual Corp. | 386,395 | 1,847 |
| * eHealth Inc. | 128,461 | 1,823 |
| Presidential Life Corp. | 183,267 | 1,820 |
| Abington Bancorp Inc. | 151,860 | 1,812 |
| SeaBright Holdings Inc. | 194,910 | 1,797 |
| Sun Communities Inc. | 53,930 | 1,796 |
| CoBiz Financial Inc. | 292,956 | 1,781 |
| Heartland Financial USA Inc. | 101,395 | 1,770 |
| Stewart Information Services Corp. | 153,264 | 1,767 |
| MainSource Financial Group Inc. | 169,313 | 1,763 |
| NGP Capital Resources Co. | 191,412 | 1,761 |
| First Financial Holdings Inc. | 146,186 | 1,683 |
| Great Southern Bancorp Inc. | 71,191 | 1,679 |
| Baldwin & Lyons Inc. | 69,909 | 1,645 |
| Home Federal Bancorp Inc. | 132,805 | 1,630 |
| Citizens & Northern Corp. | 107,255 | 1,594 |
| CreXus Investment Corp. | 120,043 | 1,573 |
| * United Community Banks Inc. | 793,335 | 1,547 |
| BankFinancial Corp. | 158,138 | 1,542 |
| * Avatar Holdings Inc. | 75,164 | 1,490 |
| Cardinal Financial Corp. | 122,086 | 1,420 |
| * TradeStation Group Inc. | 208,980 | 1,411 |
| Golub Capital BDC Inc. | 79,163 | 1,355 |
| Kansas City Life Insurance Co. | 40,468 | 1,337 |
| Wilshire Bancorp Inc. | 168,931 | 1,287 |
| ESSA Bancorp Inc. | 96,947 | 1,282 |
| National Interstate Corp. | 59,872 | 1,281 |
| Retail Opportunity Investments Corp. | 129,010 | 1,279 |
| Donegal Group Inc. Class A | 88,049 | 1,275 |
| Ames National Corp. | 58,120 | 1,259 |
| ^ Life Partners Holdings Inc. | 65,703 | 1,257 |
| Student Loan Corp. | 35,817 | 1,162 |
| Capital City Bank Group Inc. | 91,699 | 1,155 |
| * Meridian Interstate Bancorp Inc. | 90,596 | 1,068 |
| * Gleacher & Co. Inc. | 448,278 | 1,062 |
| EMC Insurance Group Inc. | 46,539 | 1,054 |
| * Citizens Inc. | 137,514 | 1,024 |
| * NewStar Financial Inc. | 96,533 | 1,020 |
| GAMCO Investors Inc. | 20,347 | 977 |
| Rockville Financial Inc. | 78,757 | 962 |
| * Penson Worldwide Inc. | 177,512 | 868 |
| SWS Group Inc. | 170,568 | 861 |
| * First Marblehead Corp. | 378,671 | 822 |
| Universal Insurance Holdings Inc. | 157,674 | 768 |
| Roma Financial Corp. | 68,830 | 730 |
| Urstadt Biddle Properties Inc. | 41,528 | 690 |
| CompuCredit Holdings Corp. | 96,091 | 671 |
| Consolidated-Tomoka Land Co. | 16,898 | 488 |
| * Asset Acceptance Capital Corp. | 48,405 | 287 |
| | | 2,467,725 |
| Health Care (5.7%) | | |
| * Mednax Inc. | 422,106 | 28,404 |
| PerkinElmer Inc. | 1,044,753 | 26,976 |
| * Health Net Inc. | 863,382 | 23,562 |
| Cooper Cos. Inc. | 412,690 | 23,251 |
| * Health Management Associates Inc. Class A | 2,221,002 | 21,188 |
| STERIS Corp. | 528,029 | 19,252 |
| Teleflex Inc. | 353,854 | 19,041 |
| * LifePoint Hospitals Inc. | 480,690 | 17,665 |
| Owens & Minor Inc. | 561,379 | 16,521 |
| Hill-Rom Holdings Inc. | 365,919 | 14,406 |
55
| | | |
| Vanguard® Small-Cap Value Index Fund | | |
| Schedule of Investments | | |
| December 31, 2010 | | |
| |
| | | | Market |
| | | | Value |
| | | Shares | ($000) |
| * | Magellan Health Services Inc. | 295,983 | 13,994 |
| * | AMERIGROUP Corp. | 225,847 | 9,919 |
| * | Emergency Medical Services Corp. Class A | 133,947 | 8,654 |
| | Invacare Corp. | 263,113 | 7,935 |
| * | Centene Corp. | 297,333 | 7,534 |
| * | CONMED Corp. | 254,887 | 6,737 |
| * | Gentiva Health Services Inc. | 250,663 | 6,668 |
| | Universal American Corp. | 300,740 | 6,150 |
| * | Amsurg Corp. Class A | 273,759 | 5,735 |
| | Analogic Corp. | 114,050 | 5,647 |
| * | Amedisys Inc. | 165,846 | 5,556 |
| | Meridian Bioscience Inc. | 233,830 | 5,415 |
| * | Pharmasset Inc. | 100,002 | 4,341 |
| | Computer Programs & Systems Inc. | 87,335 | 4,091 |
| * | Healthspring Inc. | 151,174 | 4,011 |
| * | WellCare Health Plans Inc. | 131,684 | 3,979 |
| | Sabra Healthcare REIT Inc. | 208,684 | 3,840 |
| * | Nektar Therapeutics | 291,454 | 3,745 |
| * | Select Medical Holdings Corp. | 495,803 | 3,624 |
| * | Alkermes Inc. | 294,223 | 3,613 |
| * | RehabCare Group Inc. | 143,432 | 3,399 |
| * | Triple-S Management Corp. Class B | 178,156 | 3,399 |
| * | Healthways Inc. | 304,034 | 3,393 |
| * | Angiodynamics Inc. | 219,128 | 3,368 |
| * | Savient Pharmaceuticals Inc. | 299,193 | 3,333 |
| | PDL BioPharma Inc. | 529,873 | 3,301 |
| * | Greatbatch Inc. | 134,352 | 3,245 |
| | Landauer Inc. | 54,030 | 3,240 |
| * | Affymetrix Inc. | 629,203 | 3,165 |
| | National Healthcare Corp. | 67,378 | 3,118 |
| * | PharMerica Corp. | 272,027 | 3,115 |
| * | Assisted Living Concepts Inc. Class A | 84,256 | 2,741 |
| * | Sun Healthcare Group Inc. | 209,525 | 2,653 |
| | Ensign Group Inc. | 101,014 | 2,512 |
| * | Emergent Biosolutions Inc. | 92,003 | 2,158 |
| * | Cross Country Healthcare Inc. | 248,095 | 2,101 |
| * | Medcath Corp. | 145,374 | 2,028 |
| * | Immunogen Inc. | 210,556 | 1,950 |
| *,^ | Geron Corp. | 371,146 | 1,919 |
| * | Emeritus Corp. | 87,560 | 1,726 |
| * | Skilled Healthcare Group Inc. | 183,822 | 1,651 |
| * | Sunrise Senior Living Inc. | 288,944 | 1,575 |
| * | Kensey Nash Corp. | 50,877 | 1,416 |
| * | Rigel Pharmaceuticals Inc. | 163,286 | 1,230 |
| * | AMN Healthcare Services Inc. | 190,768 | 1,171 |
| * | Palomar Medical Technologies Inc. | 78,762 | 1,119 |
| *,^ | Metabolix Inc. | 80,003 | 974 |
| * | Clinical Data Inc. | 60,759 | 967 |
| *,^ | Orexigen Therapeutics Inc. | 111,213 | 899 |
| * | RTI Biologics Inc. | 319,281 | 852 |
| * | OraSure Technologies Inc. | 137,621 | 791 |
| * | Lexicon Pharmaceuticals Inc. | 529,055 | 762 |
| * | Arena Pharmaceuticals Inc. | 351,456 | 605 |
| *,^ | Biotime Inc. | 70,405 | 586 |
| * | Albany Molecular Research Inc. | 69,265 | 389 |
| | | | 402,305 |
| Industrials (14.8%) | | |
| * | BE Aerospace Inc. | 860,953 | 31,881 |
| | Snap-On Inc. | 514,727 | 29,123 |
| | Kennametal Inc. | 726,069 | 28,651 |
| | Hubbell Inc. Class B | 467,741 | 28,125 |
| | Lincoln Electric Holdings Inc. | 376,055 | 24,545 |
| | Regal-Beloit Corp. | 341,702 | 22,812 |
| | Carlisle Cos. Inc. | 540,342 | 21,473 |
56
| | |
| Vanguard® Small-Cap Value Index Fund | | |
| Schedule of Investments | | |
| December 31, 2010 | | |
| |
| | | Market |
| | | Value |
| | Shares | ($000) |
| * WESCO International Inc. | 376,235 | 19,865 |
| Lennox International Inc. | 410,191 | 19,398 |
| Trinity Industries Inc. | 706,795 | 18,808 |
| Crane Co. | 443,402 | 18,210 |
| * Alaska Air Group Inc. | 317,448 | 17,996 |
| Con-way Inc. | 482,597 | 17,649 |
| * WABCO Holdings Inc. | 285,559 | 17,399 |
| Baldor Electric Co. | 257,206 | 16,214 |
| * General Cable Corp. | 461,396 | 16,190 |
| Triumph Group Inc. | 171,566 | 15,340 |
| Belden Inc. | 414,439 | 15,260 |
| Alexander & Baldwin Inc. | 364,987 | 14,610 |
| * JetBlue Airways Corp. | 2,209,502 | 14,605 |
| GATX Corp. | 410,491 | 14,482 |
| Brady Corp. Class A | 433,497 | 14,136 |
| Watsco Inc. | 224,073 | 14,135 |
| * GrafTech International Ltd. | 696,131 | 13,811 |
| Curtiss-Wright Corp. | 407,880 | 13,542 |
| * EnerSys | 412,955 | 13,264 |
| AO Smith Corp. | 338,857 | 12,904 |
| * Atlas Air Worldwide Holdings Inc. | 228,648 | 12,765 |
| HNI Corp. | 398,712 | 12,440 |
| Kaydon Corp. | 296,577 | 12,077 |
| * Esterline Technologies Corp. | 173,001 | 11,866 |
| * AMR Corp. | 1,474,369 | 11,485 |
| Brink's Co. | 415,399 | 11,166 |
| Graco Inc. | 266,632 | 10,519 |
| Deluxe Corp. | 454,534 | 10,463 |
| ABM Industries Inc. | 391,624 | 10,300 |
| Watts Water Technologies Inc. Class A | 263,931 | 9,657 |
| Mine Safety Appliances Co. | 305,032 | 9,496 |
| Werner Enterprises Inc. | 417,936 | 9,445 |
| Briggs & Stratton Corp. | 445,612 | 8,774 |
| * Chart Industries Inc. | 253,955 | 8,579 |
| Granite Construction Inc. | 308,928 | 8,474 |
| * AirTran Holdings Inc. | 1,138,987 | 8,417 |
| * Macquarie Infrastructure Co. LLC | 384,453 | 8,139 |
| Skywest Inc. | 497,002 | 7,763 |
| Armstrong World Industries Inc. | 178,655 | 7,682 |
| Manitowoc Co. Inc. | 581,257 | 7,620 |
| * EnPro Industries Inc. | 182,010 | 7,564 |
| Unifirst Corp. | 131,972 | 7,265 |
| * Teledyne Technologies Inc. | 160,427 | 7,054 |
| Simpson Manufacturing Co. Inc. | 227,543 | 7,033 |
| CLARCOR Inc. | 156,911 | 6,730 |
| * Ceradyne Inc. | 213,369 | 6,728 |
| * Interline Brands Inc. | 292,142 | 6,652 |
| * Griffon Corp. | 518,679 | 6,608 |
| CIRCOR International Inc. | 151,291 | 6,397 |
| Quanex Building Products Corp. | 332,961 | 6,316 |
| Universal Forest Products Inc. | 154,028 | 5,992 |
| * Layne Christensen Co. | 172,661 | 5,943 |
| Ameron International Corp. | 77,700 | 5,934 |
| * MasTec Inc. | 404,213 | 5,897 |
| Albany International Corp. | 246,668 | 5,844 |
| Arkansas Best Corp. | 212,910 | 5,838 |
| * Amerco Inc. | 60,757 | 5,835 |
| Tutor Perini Corp. | 270,986 | 5,802 |
| Mueller Water Products Inc. Class A | 1,368,424 | 5,706 |
| Mueller Industries Inc. | 167,196 | 5,467 |
| McGrath Rentcorp | 201,185 | 5,275 |
| * USG Corp. | 308,356 | 5,190 |
| Aircastle Ltd. | 492,529 | 5,147 |
| G&K Services Inc. Class A | 164,479 | 5,084 |
57
| | | |
| Vanguard® Small-Cap Value Index Fund | | |
| Schedule of Investments | | |
| December 31, 2010 | | |
| |
| | | | Market |
| | | | Value |
| | | Shares | ($000) |
| * | Dycom Industries Inc. | 342,166 | 5,047 |
| * | Korn/Ferry International | 205,532 | 4,750 |
| * | Consolidated Graphics Inc. | 97,076 | 4,701 |
| * | Kelly Services Inc. Class A | 250,073 | 4,701 |
| * | Wabash National Corp. | 393,052 | 4,658 |
| | Heidrick & Struggles International Inc. | 155,122 | 4,444 |
| | Comfort Systems USA Inc. | 335,559 | 4,419 |
| | Kaman Corp. | 149,175 | 4,336 |
| * | Rush Enterprises Inc. Class A | 211,582 | 4,325 |
| | Applied Signal Technology Inc. | 112,270 | 4,254 |
| | TAL International Group Inc. | 136,399 | 4,211 |
| * | ACCO Brands Corp. | 485,803 | 4,139 |
| | Encore Wire Corp. | 164,156 | 4,117 |
| *,^ | Genco Shipping & Trading Ltd. | 283,005 | 4,075 |
| | Ennis Inc. | 229,272 | 3,921 |
| | Cascade Corp. | 82,150 | 3,884 |
| * | Generac Holdings Inc. | 238,833 | 3,862 |
| * | Dollar Thrifty Automotive Group Inc. | 80,025 | 3,782 |
| | Federal Signal Corp. | 550,935 | 3,779 |
| | EnergySolutions Inc. | 666,204 | 3,711 |
| * | MYR Group Inc. | 176,601 | 3,709 |
| * | Dolan Co. | 256,383 | 3,569 |
| * | AAR Corp. | 122,107 | 3,354 |
| | Apogee Enterprises Inc. | 248,380 | 3,346 |
| * | Gibraltar Industries Inc. | 241,081 | 3,271 |
| * | Ladish Co. Inc. | 65,967 | 3,207 |
| | FreightCar America Inc. | 106,077 | 3,070 |
| | Barnes Group Inc. | 145,247 | 3,002 |
| * | Republic Airways Holdings Inc. | 389,992 | 2,855 |
| | Schawk Inc. Class A | 136,256 | 2,804 |
| * | Eagle Bulk Shipping Inc. | 553,068 | 2,754 |
| | US Ecology Inc. | 154,782 | 2,690 |
| | Tredegar Corp. | 137,181 | 2,659 |
| * | American Reprographics Co. | 324,653 | 2,464 |
| * | TrueBlue Inc. | 136,491 | 2,455 |
| * | School Specialty Inc. | 167,313 | 2,331 |
| | Viad Corp. | 91,139 | 2,321 |
| * | CRA International Inc. | 97,981 | 2,304 |
| | CDI Corp. | 118,388 | 2,201 |
| | AZZ Inc. | 54,932 | 2,198 |
| * | Greenbrier Cos. Inc. | 104,586 | 2,195 |
| | Ampco-Pittsburgh Corp. | 77,107 | 2,163 |
| * | Columbus McKinnon Corp. | 104,493 | 2,123 |
| * | Metalico Inc. | 349,294 | 2,054 |
| | Aceto Corp. | 224,905 | 2,024 |
| | American Woodmark Corp. | 82,300 | 2,020 |
| * | Northwest Pipe Co. | 81,716 | 1,964 |
| * | Team Inc. | 79,721 | 1,929 |
| | Ducommun Inc. | 88,236 | 1,922 |
| * | Sterling Construction Co. Inc. | 136,184 | 1,776 |
| | NACCO Industries Inc. Class A | 15,618 | 1,693 |
| * | CBIZ Inc. | 265,828 | 1,659 |
| | Douglas Dynamics Inc. | 103,967 | 1,575 |
| | Kimball International Inc. Class B | 227,553 | 1,570 |
| * | Rush Enterprises Inc. Class B | 85,887 | 1,544 |
| * | M&F Worldwide Corp. | 66,660 | 1,540 |
| * | Roadrunner Transportation Systems Inc. | 106,149 | 1,535 |
| | Baltic Trading Ltd. | 148,084 | 1,512 |
| * | Sauer-Danfoss Inc. | 53,518 | 1,512 |
| | Courier Corp. | 89,996 | 1,397 |
| * | Fushi Copperweld Inc. | 151,382 | 1,344 |
| *,^ | China Valves Technology Inc. | 127,734 | 1,339 |
| * | Hawaiian Holdings Inc. | 158,592 | 1,243 |
| | Preformed Line Products Co. | 21,069 | 1,233 |
58
| | | |
| Vanguard® Small-Cap Value Index Fund | | |
| Schedule of Investments | | |
| December 31, 2010 | | |
| |
| | | | Market |
| | | | Value |
| | | Shares | ($000) |
| * | Tecumseh Products Co. Class A | 92,580 | 1,208 |
| * | Volt Information Sciences Inc. | 130,565 | 1,129 |
| *,^ | Lihua International Inc. | 93,322 | 1,049 |
| * | RailAmerica Inc. | 77,235 | 1,000 |
| * | Patriot Transportation Holding Inc. | 10,667 | 992 |
| * | Titan Machinery Inc. | 41,696 | 805 |
| | Houston Wire & Cable Co. | 52,782 | 709 |
| * | American Railcar Industries Inc. | 30,145 | 667 |
| * | Universal Truckload Services Inc. | 37,163 | 592 |
| *,^ | SmartHeat Inc. | 110,223 | 582 |
| * | Hill International Inc. | 79,093 | 512 |
| * | Tecumseh Products Co. Class B | 25,897 | 338 |
| * | TBS International plc Class A | 41,298 | 119 |
| | | | 1,041,104 |
| Information Technology (9.8%) | | |
| * | Vishay Intertechnology Inc. | 1,526,834 | 22,414 |
| * | NCR Corp. | 1,422,417 | 21,862 |
| * | Tech Data Corp. | 449,542 | 19,789 |
| | Diebold Inc. | 582,310 | 18,663 |
| * | International Rectifier Corp. | 623,293 | 18,505 |
| * | PMC - Sierra Inc. | 2,039,783 | 17,522 |
| * | Fairchild Semiconductor International Inc. Class A | 1,104,291 | 17,238 |
| * | RF Micro Devices Inc. | 2,298,525 | 16,894 |
| | Intersil Corp. Class A | 1,097,543 | 16,759 |
| * | Compuware Corp. | 1,284,755 | 14,993 |
| * | Convergys Corp. | 1,098,475 | 14,467 |
| | CoreLogic Inc. | 776,879 | 14,388 |
| * | CACI International Inc. Class A | 268,307 | 14,328 |
| * | Cypress Semiconductor Corp. | 673,448 | 12,513 |
| * | Arris Group Inc. | 1,108,112 | 12,433 |
| * | Novell Inc. | 2,013,489 | 11,920 |
| * | Spansion Inc. Class A | 555,311 | 11,495 |
| * | Mentor Graphics Corp. | 945,833 | 11,350 |
| * | Lawson Software Inc. | 1,226,428 | 11,344 |
| * | MKS Instruments Inc. | 422,010 | 10,335 |
| * | Rambus Inc. | 495,845 | 10,155 |
| * | Benchmark Electronics Inc. | 550,915 | 10,005 |
| * | Coherent Inc. | 220,010 | 9,931 |
| * | JDA Software Group Inc. | 351,537 | 9,843 |
| | Littelfuse Inc. | 195,470 | 9,199 |
| * | Take-Two Interactive Software Inc. | 750,372 | 9,184 |
| * | Omnivision Technologies Inc. | 309,869 | 9,175 |
| * | Entegris Inc. | 1,167,768 | 8,723 |
| | Fair Isaac Corp. | 369,218 | 8,629 |
| * | Emulex Corp. | 721,909 | 8,417 |
| | Earthlink Inc. | 957,416 | 8,234 |
| * | Progress Software Corp. | 191,623 | 8,109 |
| * | Sanmina-SCI Corp. | 704,736 | 8,090 |
| * | Teradyne Inc. | 561,869 | 7,889 |
| * | Loral Space & Communications Inc. | 100,781 | 7,710 |
| * | EchoStar Corp. Class A | 298,393 | 7,451 |
| * | TTM Technologies Inc. | 496,161 | 7,398 |
| | AVX Corp. | 451,687 | 6,969 |
| * | Tekelec | 545,475 | 6,497 |
| * | SYNNEX Corp. | 204,868 | 6,392 |
| | Black Box Corp. | 155,752 | 5,964 |
| * | Electronics for Imaging Inc. | 400,868 | 5,736 |
| * | Newport Corp. | 325,072 | 5,646 |
| * | Netlogic Microsystems Inc. | 177,079 | 5,562 |
| * | Insight Enterprises Inc. | 409,602 | 5,390 |
| | MTS Systems Corp. | 143,564 | 5,378 |
| * | Brooks Automation Inc. | 579,236 | 5,254 |
| | Park Electrochemical Corp. | 173,473 | 5,204 |
| | United Online Inc. | 773,300 | 5,104 |
59
| | | |
| Vanguard® Small-Cap Value Index Fund | | |
| Schedule of Investments | | |
| December 31, 2010 | | |
| |
| | | | Market |
| | | | Value |
| | | Shares | ($000) |
| * | Epicor Software Corp. | 504,423 | 5,095 |
| * | Viasat Inc. | 113,175 | 5,026 |
| | Cognex Corp. | 166,892 | 4,910 |
| * | Brightpoint Inc. | 557,041 | 4,863 |
| * | Integrated Device Technology Inc. | 701,928 | 4,675 |
| * | Advanced Energy Industries Inc. | 325,420 | 4,439 |
| * | Semtech Corp. | 192,283 | 4,353 |
| * | Kulicke & Soffa Industries Inc. | 592,303 | 4,265 |
| | Methode Electronics Inc. | 325,833 | 4,226 |
| * | Lattice Semiconductor Corp. | 672,632 | 4,076 |
| * | Kemet Corp. | 269,401 | 3,928 |
| * | Avid Technology Inc. | 218,936 | 3,823 |
| * | Websense Inc. | 187,783 | 3,803 |
| * | Bottomline Technologies Inc. | 172,172 | 3,738 |
| * | Netgear Inc. | 109,667 | 3,694 |
| * | THQ Inc. | 599,896 | 3,635 |
| * | Rogers Corp. | 91,406 | 3,496 |
| * | Aspen Technology Inc. | 272,970 | 3,467 |
| | CTS Corp. | 302,591 | 3,347 |
| | Cohu Inc. | 199,029 | 3,300 |
| * | Imation Corp. | 274,938 | 2,835 |
| * | Intevac Inc. | 198,581 | 2,782 |
| * | Symmetricom Inc. | 389,871 | 2,764 |
| * | Ciber Inc. | 585,700 | 2,741 |
| * | Aviat Networks Inc. | 530,490 | 2,690 |
| * | Infospace Inc. | 319,989 | 2,656 |
| * | ModusLink Global Solutions Inc. | 391,578 | 2,624 |
| * | Electro Scientific Industries Inc. | 161,417 | 2,587 |
| * | Zoran Corp. | 286,526 | 2,521 |
| * | FormFactor Inc. | 275,737 | 2,448 |
| * | SMART Modular Technologies WWH Inc. | 417,314 | 2,404 |
| | Electro Rent Corp. | 148,120 | 2,394 |
| * | Supertex Inc. | 97,715 | 2,363 |
| * | Silicon Graphics International Corp. | 258,482 | 2,334 |
| *,^ | SunPower Corp. Class A | 172,096 | 2,208 |
| * | Rudolph Technologies Inc. | 263,528 | 2,169 |
| * | Sigma Designs Inc. | 152,118 | 2,155 |
| *,^ | China Security & Surveillance Technology Inc. | 398,885 | 2,126 |
| * | Net 1 UEPS Technologies Inc. | 170,680 | 2,092 |
| * | UTStarcom Inc. | 992,608 | 2,045 |
| * | Ness Technologies Inc. | 336,405 | 1,998 |
| * | ATMI Inc. | 97,581 | 1,946 |
| * | Cogo Group Inc. | 219,074 | 1,939 |
| | Bel Fuse Inc. Class B | 78,751 | 1,882 |
| * | Move Inc. | 691,660 | 1,777 |
| * | Silicon Image Inc. | 239,434 | 1,760 |
| * | TNS Inc. | 80,932 | 1,683 |
| * | DSP Group Inc. | 206,557 | 1,681 |
| * | SunPower Corp. Class B | 130,121 | 1,615 |
| * | Perficient Inc. | 126,219 | 1,578 |
| | Marchex Inc. Class B | 163,336 | 1,558 |
| * | ShoreTel Inc. | 198,877 | 1,553 |
| * | Extreme Networks | 495,381 | 1,531 |
| * | Exar Corp. | 215,782 | 1,506 |
| * | EMS Technologies Inc. | 67,398 | 1,333 |
| * | CPI International Inc. | 67,656 | 1,309 |
| * | Anaren Inc. | 62,296 | 1,299 |
| * | Agilysys Inc. | 206,046 | 1,160 |
| * | RealNetworks Inc. | 275,713 | 1,158 |
| * | Trident Microsystems Inc. | 632,359 | 1,126 |
| *,^ | Evergreen Solar Inc. | 1,787,471 | 1,042 |
| *,^ | Energy Conversion Devices Inc. | 216,929 | 998 |
| * | Mitel Networks Corp. | 118,144 | 651 |
| * | TechTarget Inc. | 71,624 | 568 |
60
| | | |
| Vanguard® Small-Cap Value Index Fund | | |
| Schedule of Investments | | |
| December 31, 2010 | | |
| |
| | | | Market |
| | | | Value |
| | | Shares | ($000) |
| | Renaissance Learning Inc. | 46,021 | 545 |
| | Bel Fuse Inc. Class A | 12,716 | 324 |
| * | China TransInfo Technology Corp. | 45,165 | 214 |
| | | | 693,281 |
| Materials (7.5%) | | |
| | Domtar Corp. | 379,685 | 28,826 |
| | Aptargroup Inc. | 597,694 | 28,432 |
| | Huntsman Corp. | 1,695,255 | 26,463 |
| | Compass Minerals International Inc. | 290,226 | 25,908 |
| | RPM International Inc. | 1,151,978 | 25,459 |
| | Packaging Corp. of America | 918,256 | 23,728 |
| | Cytec Industries Inc. | 434,615 | 23,061 |
| * | Coeur d'Alene Mines Corp. | 791,358 | 21,620 |
| | Cabot Corp. | 550,088 | 20,711 |
| | Commercial Metals Co. | 1,013,165 | 16,808 |
| | Sensient Technologies Corp. | 439,691 | 16,150 |
| | Carpenter Technology Corp. | 389,736 | 15,683 |
| | Olin Corp. | 701,182 | 14,388 |
| | Temple-Inland Inc. | 589,186 | 12,514 |
| | Royal Gold Inc. | 225,677 | 12,329 |
| * | Louisiana-Pacific Corp. | 1,143,953 | 10,822 |
| | Minerals Technologies Inc. | 164,319 | 10,748 |
| * | OM Group Inc. | 273,265 | 10,523 |
| | Eagle Materials Inc. | 371,414 | 10,492 |
| | AK Steel Holding Corp. | 632,895 | 10,361 |
| | Texas Industries Inc. | 209,201 | 9,577 |
| | HB Fuller Co. | 433,437 | 8,894 |
| | Rock-Tenn Co. Class A | 164,150 | 8,856 |
| | Arch Chemicals Inc. | 222,377 | 8,435 |
| * | Century Aluminum Co. | 533,697 | 8,288 |
| | Silgan Holdings Inc. | 222,301 | 7,961 |
| * | Rockwood Holdings Inc. | 199,577 | 7,807 |
| | Westlake Chemical Corp. | 175,646 | 7,635 |
| | Innophos Holdings Inc. | 189,571 | 6,840 |
| | Koppers Holdings Inc. | 182,061 | 6,514 |
| | Worthington Industries Inc. | 351,741 | 6,472 |
| | Kaiser Aluminum Corp. | 127,545 | 6,389 |
| | A Schulman Inc. | 278,713 | 6,380 |
| | AMCOL International Corp. | 192,361 | 5,963 |
| * | Georgia Gulf Corp. | 195,408 | 4,702 |
| | Buckeye Technologies Inc. | 173,494 | 3,645 |
| * | PolyOne Corp. | 288,353 | 3,602 |
| | Wausau Paper Corp. | 412,310 | 3,550 |
| | PH Glatfelter Co. | 263,689 | 3,235 |
| * | Noranda Aluminum Holding Corp. | 202,264 | 2,953 |
| * | AM Castle & Co. | 152,927 | 2,815 |
| | Deltic Timber Corp. | 49,753 | 2,803 |
| | Stepan Co. | 35,530 | 2,710 |
| | Myers Industries Inc. | 267,114 | 2,602 |
| | Neenah Paper Inc. | 131,144 | 2,581 |
| * | Headwaters Inc. | 536,209 | 2,456 |
| | Olympic Steel Inc. | 81,985 | 2,351 |
| | Hawkins Inc. | 50,689 | 2,251 |
| | Haynes International Inc. | 53,605 | 2,242 |
| | American Vanguard Corp. | 193,386 | 1,652 |
| * | Graphic Packaging Holding Co. | 379,485 | 1,476 |
| | Boise Inc. | 183,260 | 1,453 |
| * | TPC Group Inc. | 46,089 | 1,397 |
| *,^ | ShengdaTech Inc. | 262,762 | 1,288 |
| *,^ | China Green Agriculture Inc. | 131,774 | 1,186 |
| *,^ | Yongye International Inc. | 120,813 | 1,015 |
| * | Spartech Corp. | 96,712 | 905 |
| | | | 525,907 |
61
| | |
| Vanguard® Small-Cap Value Index Fund | | |
| Schedule of Investments | | |
| December 31, 2010 | | |
| |
| | | Market |
| | | Value |
| | Shares | ($000) |
| Telecommunication Services (0.6%) | | |
| * Syniverse Holdings Inc. | 620,814 | 19,152 |
| NTELOS Holdings Corp. | 276,857 | 5,274 |
| * Level 3 Communications Inc. | 5,158,859 | 5,056 |
| * Cincinnati Bell Inc. | 1,784,548 | 4,997 |
| Consolidated Communications Holdings Inc. | 211,206 | 4,076 |
| * Iridium Communications Inc. | 222,826 | 1,838 |
| Atlantic Tele-Network Inc. | 43,937 | 1,685 |
| * Premiere Global Services Inc. | 155,221 | 1,055 |
| | | 43,133 |
| Utilities (6.6%) | | |
| Questar Corp. | 1,555,576 | 27,083 |
| Westar Energy Inc. | 1,048,446 | 26,379 |
| Atmos Energy Corp. | 798,912 | 24,926 |
| Great Plains Energy Inc. | 1,201,348 | 23,294 |
| Nicor Inc. | 403,281 | 20,132 |
| Hawaiian Electric Industries Inc. | 830,242 | 18,921 |
| Piedmont Natural Gas Co. Inc. | 637,693 | 17,830 |
| Vectren Corp. | 685,041 | 17,386 |
| * GenOn Energy Inc. | 4,408,606 | 16,797 |
| Cleco Corp. | 538,311 | 16,558 |
| WGL Holdings Inc. | 450,209 | 16,104 |
| IDACORP Inc. | 427,138 | 15,796 |
| New Jersey Resources Corp. | 365,272 | 15,747 |
| Southwest Gas Corp. | 402,924 | 14,775 |
| Portland General Electric Co. | 666,638 | 14,466 |
| South Jersey Industries Inc. | 264,473 | 13,969 |
| UIL Holdings Corp. | 422,919 | 12,671 |
| Unisource Energy Corp. | 321,675 | 11,529 |
| Avista Corp. | 490,133 | 11,038 |
| Northwest Natural Gas Co. | 235,299 | 10,934 |
| * El Paso Electric Co. | 385,285 | 10,607 |
| Allete Inc. | 284,273 | 10,592 |
| PNM Resources Inc. | 767,358 | 9,991 |
| Black Hills Corp. | 329,672 | 9,890 |
| NorthWestern Corp. | 320,312 | 9,235 |
| MGE Energy Inc. | 204,638 | 8,750 |
| Empire District Electric Co. | 366,458 | 8,135 |
| Otter Tail Corp. | 318,127 | 7,171 |
| Laclede Group Inc. | 187,400 | 6,848 |
| CH Energy Group Inc. | 140,034 | 6,846 |
| California Water Service Group | 174,920 | 6,519 |
| American States Water Co. | 164,563 | 5,673 |
| * Dynegy Inc. Class A | 590,140 | 3,317 |
| Chesapeake Utilities Corp. | 79,814 | 3,314 |
| SJW Corp. | 122,986 | 3,255 |
| Middlesex Water Co. | 137,072 | 2,515 |
| Central Vermont Public Service Corp. | 105,188 | 2,299 |
| Unitil Corp. | 96,611 | 2,197 |
| Connecticut Water Service Inc. | 76,429 | 2,131 |
| | | 465,620 |
| Total Common Stocks (Cost $5,847,589) | | 7,033,407 |
62
| | | | | |
| Vanguard® Small-Cap Value Index Fund | | | | |
| Schedule of Investments | | | | |
| December 31, 2010 | | | | |
| |
| | | | | | Market |
| | | | | | Value |
| | | Coupon | | Shares | ($000) |
| Temporary Cash Investments (0.8%)1 | | | | |
| Money Market Fund (0.7%) | | | | |
| 2,3 | Vanguard Market Liquidity Fund | 0.211% | | 49,468,392 | 49,468 |
| |
| |
| | | | | Face | |
| | | | Maturity | Amount | |
| | | | Date | ($000) | |
| U.S. Government and Agency Obligations (0.1%) | | | | |
| 4,5 | Federal Home Loan Bank Discount Notes | 0.250% | 3/18/11 | 400 | 400 |
| 4,5 | Freddie Mac Discount Notes | 0.240% | 3/14/11 | 400 | 400 |
| 4,5 | Freddie Mac Discount Notes | 0.185% | 3/28/11 | 2,000 | 1,999 |
| |
| | | | | | 2,799 |
| Total Temporary Cash Investments (Cost $52,267) | | | | 52,267 |
| Total Investments (100.7%) (Cost $5,899,856) | | | | 7,085,674 |
| Other Assets and Liabilities—Net (-0.7%)3 | | | | (47,119) |
| Net Assets (100%) | | | | 7,038,555 |
* Non-income-producing security.
^ Part of security position is on loan to broker-dealers. The total value of securities on loan is $32,526,000.
1 The fund invests a portion of its cash reserves in equity markets through the use of index futures contracts. After giving effect to futures investments, the fund's effective common stock and temporary cash investment positions represent 100.1% and 0.6%, respectively, of net assets.
2 Affiliated money market fund available only to Vanguard funds and certain trusts and accounts managed by Vanguard. Rate shown is the 7-day yield.
3 Includes $35,474,000 of collateral received for securities on loan.
4 The issuer operates under a congressional charter; its securities are not backed by the full faith and credit of the U.S. government.
5 Securities with a value of $1,299,000 have been segregated as initial margin for open futures contracts.
REIT—Real Estate Investment Trust.
63
Report of Independent Registered Public Accounting Firm
To the Trustees of Vanguard Index Funds and the Shareholders of Vanguard Small-Cap Index Fund, Vanguard Small-Cap Growth Index Fund and Vanguard Small-Cap Value Index Fund:
We have audited, in accordance with the standards of the Public Company Accounting Oversight Board (United States), the financial statements (not presented herein) of Vanguard Small-Cap Index Fund, Vanguard Small-Cap Growth Index Fund and Vanguard Small-Cap Value Index Fund (constituting separate portfolios of Vanguard Index Funds, hereafter referred to as the "Funds") as of December 31, 2010 and for the year then ended and have issued our unqualified report thereon dated February 8, 2011. Our audits included audits of the Funds' schedules of investments as of December 31, 2010. These schedules of investments are the responsibility of the Funds' management. Our responsibility is to express an opinion on these schedules of investments based on our audits.
In our opinion, the accompanying schedules of investments referred to above, when read in conjunction with the financial statements of the Funds referred to above, present fairly, in all material respects, the information set forth therein.
PricewaterhouseCoopers LLP
Philadelphia, PA
February 8, 2011
64
| © 2011 The Vanguard Group. Inc. |
| All rights reserved. |
| Vanguard Marketing Corporation, Distributor. |
| |
| SNA 480 022011 |
 |
| Vanguard U.S. Stock Index Funds |
| Mid-Capitalization Portfolios |
| Annual Report |
|
| December 31, 2010 |
| |
 |
| |
| |
| Vanguard Extended Market Index Fund |
| Vanguard Mid-Cap Index Fund |
| Vanguard Mid-Cap Growth Index Fund |
| Vanguard Mid-Cap Value Index Fund |
|
|
> Mid-capitalization stocks produced excellent 12-month returns, with growth stocks leading the way.
> All four Vanguard Mid-Cap Index Funds succeeded in closely tracking their benchmark indexes.
> Consumer discretionary stocks were notably strong performers, as recession-battered shoppers felt confident enough to return to the malls.
| |
| Contents | |
| Your Fund’s Total Returns. | 1 |
| Chairman’s Letter. | 4 |
| Extended Market Index Fund. | 10 |
| Mid-Cap Index Fund. | 30 |
| Mid-Cap Growth Index Fund. | 54 |
| Mid-Cap Value Index Fund. | 68 |
| Your Fund’s After-Tax Returns. | 84 |
| About Your Fund’s Expenses. | 86 |
| Glossary. | 89 |

Mid-Cap Index Fund
Mid-Cap Growth Index Fund
Mid-Cap Value Index Fund
Please note: The opinions expressed in this report are just that—informed opinions. They should not be considered promises or advice. Also, please keep in mind that the information and opinions cover the period through the date on the front of this report. Of course, the risks of investing in your fund are spelled out in the prospectus.
See the Glossary for definitions of investment terms used in this report.
Cover photograph: Jean Maher.
Your Fund’s Total Returns
| |
| Fiscal Year Ended December 31, 2010 | |
| | Total |
| | Returns |
| Vanguard Extended Market Index Fund | |
| Investor Shares | 27.37% |
| Admiral™ Shares | 27.57 |
| Signal® Shares | 27.53 |
| Institutional Shares | 27.59 |
| ETF Shares | |
| Market Price | 27.63 |
| Net Asset Value | 27.55 |
| S&P Completion Index | 27.46 |
| Mid-Cap Core Funds Average | 23.29 |
| Mid-Cap Core Funds Average: Derived from data provided by Lipper Inc. | |
| Vanguard Mid-Cap Index Fund | |
| Investor Shares | 25.46% |
| Admiral™ Shares | 25.59 |
| Signal® Shares | 25.62 |
| Institutional Shares | 25.67 |
| Institutional Plus Shares (Inception: 12/15/2010) | 2.17 |
| ETF Shares | |
| Market Price | 25.55 |
| Net Asset Value | 25.57 |
| MSCI US Mid Cap 450 Index | 25.69 |
| Mid-Cap Core Funds Average | 23.29 |
| Mid-Cap Core Funds Average: Derived from data provided by Lipper Inc. | |
Admiral Shares carry lower expenses and are available to investors who meet certain account-balance requirements. Signal, Institutional, and Institutional Plus Shares are available to certain institutional investors who meet specific administrative, service, and account-size criteria. The Vanguard ETF® Shares shown are traded on the NYSE Arca exchange and are available only through brokers. The table provides ETF returns based on both the NYSE Arca market price and the net asset value for a share. U.S. Pat. No. 6,879,964 B2; 7,337,138.
1
Your Fund’s Total Returns
| |
| Fiscal Year Ended December 31, 2010 | |
| | Total |
| | Returns |
| Vanguard Mid-Cap Growth Index Fund | |
| Investor Shares | 28.93% |
| ETF Shares | |
| Market Price | 29.14 |
| Net Asset Value | 29.11 |
| MSCI US Mid Cap Growth Index | 29.24 |
| Mid-Cap Growth Funds Average | 26.22 |
| Mid-Cap Growth Funds Average: Derived from data provided by Lipper Inc. | |
| Vanguard Mid-Cap Value Index Fund | |
| Investor Shares | 21.63% |
| ETF Shares | |
| Market Price | 21.80 |
| Net Asset Value | 21.83 |
| MSCI US Mid Cap Value Index | 21.96 |
| Mid-Cap Value Funds Average | 22.39 |
| Mid-Cap Value Funds Average: Derived from data provided by Lipper Inc. | |
Admiral Shares carry lower expenses and are available to investors who meet certain account-balance requirements. Signal, Institutional, and Institutional Plus Shares are available to certain institutional investors who meet specific administrative, service, and account-size criteria. The Vanguard ETF® Shares shown are traded on the NYSE Arca exchange and are available only through brokers. The table provides ETF returns based on both the NYSE Arca market price and the net asset value for a share. U.S. Pat. No. 6,879,964 B2; 7,337,138.
For the ETF Shares, the market price is determined by the midpoint of the bid-offer spread as of the closing time of the New York Stock Exchange (generally 4 p.m., Eastern time). The net asset value is also determined as of the NYSE closing time. For more information about how the ETF Shares' market prices have compared with their net asset value, visit vanguard.com, select your ETF, and then select the Price and Performance tab. The ETF premium/discount analysis there shows the percentages of days on which the ETF Shares' market price was above or below the NAV.
2
Your Fund’s Performance at a Glance
| | | | |
| December 31, 2009 , Through December 31, 2010 | | | | |
| | | | Distributions Per Share |
| | Starting | Ending | Income | Capital |
| | Share Price | Share Price | Dividends | Gains |
| Vanguard Extended Market Index Fund | | | | |
| Investor Shares | $32.67 | $41.26 | $0.351 | $0.000 |
| Admiral Shares | 32.67 | 41.28 | 0.395 | 0.000 |
| Signal Shares | 28.08 | 35.46 | 0.351 | 0.000 |
| Institutional Shares | 32.68 | 41.27 | 0.425 | 0.000 |
| ETF Shares | 43.09 | 54.42 | 0.541 | 0.000 |
| Vanguard Mid-Cap Index Fund | | | | |
| Investor Shares | $16.36 | $20.31 | $0.215 | $0.000 |
| Admiral Shares | 74.23 | 92.17 | 1.055 | 0.000 |
| Signal Shares | 23.43 | 29.09 | 0.343 | 0.000 |
| Institutional Shares | 16.40 | 20.36 | 0.249 | 0.000 |
| Institutional Plus Shares (inception: | 99.45 | 100.40 | 1.207 | 0.000 |
| 12/15/2010) | | | | |
| ETF Shares | 59.97 | 74.42 | 0.886 | 0.000 |
| Vanguard Mid-Cap Growth Index Fund | | | | |
| Investor Shares | $19.05 | $24.46 | $0.102 | $0.000 |
| ETF Shares | 48.45 | 62.23 | 0.322 | 0.000 |
| Vanguard Mid-Cap Value Index Fund | | | | |
| Investor Shares | $17.45 | $20.85 | $0.374 | $0.000 |
| ETF Shares | 44.31 | 52.97 | 1.013 | 0.000 |
3

Chairman’s Letter
Dear Shareholder,
The first half of 2010 was marked by uncertainty about the strength of the global economic recovery and about the sovereign debt crisis in Europe. As evidence of a solid economic rebound mounted, and as plans to aid struggling countries in Europe materialized, the market posted robust gains in the second half of the year. The returns of small- and mid-sized stocks were especially strong.
For the full year, the returns of the four Vanguard Mid-Capitalization Index Funds in this report ranged from almost 22% for Vanguard Mid-Cap Value Index Fund to about 29% for Vanguard Mid-Cap Growth Index Fund. That performance reflected the strength of mid-cap stocks during the year. Vanguard Extended Market Index Fund, which invests in both small- and mid-cap stocks, turned in the second-best performance. The fund’s exposure to high-flying small-caps kept it a few steps ahead of Vanguard Mid-Cap Index Fund. All four funds closely tracked their benchmark indexes.
Index strategies can be a tax-efficient approach to investing in mid-cap stocks. If you own shares of the fund in a taxable account, you may wish to review the fund’s after-tax returns, which appear later in this report.
4
Please note that on October 6, Vanguard broadened the availability of our lower-cost Admiral Shares. We reduced the minimum investment requirement for these shares to $10,000 in most of our broad-market index funds, down from $100,000. In addition, in December we announced the addition of Institutional Plus Shares for several funds, including the Extended Market Index Fund and the Mid-Cap Index Fund. (The Extended Market Index Fund’s new shares were launched in January, shortly after the close of the reporting period.) The changes are part of our ongoing efforts to lower the cost of investing for our clients.
Stocks rallied as the forecast seemed to brighten
After a series of false starts, hesitations, and retreats, global stock markets finished 2010 with powerful gains. As the prospect of a double-dip recession faded, the broad U.S. stock market clambered higher, shrugging off high unemployment and distress in Europe’s debt markets to return more than 17%.
Outside the United States, gains were more muted, in part because Europe’s sovereign debt challenges continued to reverberate through local stock markets. Emerging markets were the best
| | | |
| Market Barometer | | | |
| |
| | | Average Annual Total Returns |
| | | Periods Ended December 31, 2010 |
| | One | Three | Five |
| | Year | Years | Years |
| Stocks | | | |
| Russell 1000 Index (Large-caps) | 16.10% | -2.37% | 2.59% |
| Russell 2000 Index (Small-caps) | 26.86 | 2.22 | 4.47 |
| Dow Jones U.S. Total Stock Market Index | 17.70 | -1.56 | 3.17 |
| MSCI All Country World Index ex USA (International) | 11.60 | -4.58 | 5.29 |
| |
| Bonds | | | |
| Barclays Capital U.S. Aggregate Bond Index (Broad | | | |
| taxable market) | 6.54% | 5.90% | 5.80% |
| Barclays Capital Municipal Bond Index (Broad | | | |
| tax-exempt market) | 2.38 | 4.08 | 4.09 |
| Citigroup Three-Month U.S. Treasury Bill Index | 0.13 | 0.69 | 2.29 |
| |
| CPI | | | |
| Consumer Price Index | 1.50% | 1.43% | 2.18% |
5
performers. Asia’s developed markets performed weakly, though the strength of the yen, the Australian dollar, and other regional currencies bolstered returns for U.S.-based investors.
The fixed income market reprised a familiar theme
Although U.S. Treasury securities rallied through the summer, total return tables were dominated by riskier bonds for the full 12 months, a pattern we also saw in 2009. Low interest rates and a sense that the economic recovery was gathering momentum prompted investors to seek higher yields in both high-quality and below-investment-grade corporate bonds. The broad U.S. bond market returned 6.54%. Late in the year, yields bounced off summer lows, putting pressure on bond prices. The dynamic was especially pronounced among municipal bonds.
As it has since December 2008, the Fed held its target for short-term interest rates near 0%, keeping the returns available from money market instruments such as the 3-month Treasury bill in the same neighborhood.
| | | | | | | |
| Expense Ratios | | | | | | | |
| Your Fund Compared With Its Peer Group | | | | | | |
| | | | | | | | Peer |
| | Investor | Admiral | Signal | Institutional | Institutional | ETF | Group |
| | Shares | Shares | Shares | Shares | Plus Shares | Shares | Average |
| Extended Market Index Fund | 0.30% | 0.13% | 0.13% | 0.08% | — | 0.13% | 1.32% |
| Mid-Cap Index Fund | 0.27 | 0.14 | 0.14 | 0.08 | 0.06% | 0.14 | 1.32 |
| Mid-Cap Growth Index Fund | 0.30 | — | — | — | — | 0.14 | 1.47 |
| Mid-Cap Value Index Fund | 0.30 | — | — | — | — | 0.14 | 1.42 |
The fund expense ratios shown are from the prospectus dated December 13, 2010, for the Institutional and Institutional Plus share classes and April 29, 2010, for the Investor, Admiral, Signal, and ETF share classes and represent estimated costs for the current fiscal year. For the fiscal year ended December 31, 2010, the funds’ expense ratios were: for the Extended Market Index Fund, 0.26% for Investor Shares, 0.12% for Admiral Shares, 0.12% for Signal Shares, 0.08% for Institutional Shares, and 0.12% for ETF Shares; for the Mid-Cap Index Fund, 0.26% for Investor Shares, 0.12% for Admiral Shares, 0.12% for Signal Shares, 0.08% for Institutional Shares, and 0.12% for ETF Shares; for the Mid-Cap Growth Index Fund, 0.26% for Investor Shares and 0.12% for ETF Shares; and for the Mid-Cap Value Index Fund, 0.26% for Investor Shares and 0.12% for ETF Shares. For the fiscal period ended December 31, 2010, the annualize d expense ratio for the Mid-Cap Index Fund Institutional Plus Shares was 0.06%. The peer-group expense ratios are derived from data provided by Lipper Inc. and capture information through year-end 2009.
Peer groups: For the Extended Market and Mid-Cap Index Funds, Mid-Cap Core Funds; for the Mid-Cap Growth Index Fund, Mid-Cap Growth Funds; for the Mid-Cap Value Index Fund, Mid-Cap Value Funds.
6
Most market sectors displayed signs of strength during the year
Throughout the first half of the year, stocks across all market capitalizations were on a roller-coaster ride as worries about economic growth and the debt issues plaguing nations in Europe grabbed headlines. But as concerns on both fronts receded, markets rebounded in the second half, with mid-cap and small-cap stocks outperforming their large-cap brethren, a familiar pattern in the early stages of an economic recovery. The rally was broad-based, with all ten stock market sectors in the four funds posting gains for the year.
Consumer discretionary stocks were a big driver of performance, gaining about 30% or more for the year in all four funds. With consumer spending showing signs of improvement, hotels, restaurants, and leisure stocks, as well as specialty retailers, posted major gains. At the
| |
| Total Returns | |
| Ten Years Ended December 31, 2010 | |
| | Average |
| | Annual Return |
| Extended Market Index Fund Investor Shares | 5.98% |
| Spliced Extended Market Index | 6.02 |
| Mid-Cap Core Funds Average | 4.92 |
| Spliced Extended Market Index: Dow Jones Wilshire 4500 Index through June 17, 2005; S&P Transitional Completion Index through |
| September 16, 2005; S&P Completion Index thereafter. | |
| Mid-Cap Core Funds Average: Derived from data provided by Lipper Inc. | |
| Mid-Cap Index Fund Investor Shares | 6.78% |
| Spliced Mid-Cap Index | 6.84 |
| Mid-Cap Core Funds Average | 4.92 |
| Spliced Mid-Cap Index: S&P MidCap 400 Index through May 16, 2003; MSCI US Mid Cap 450 Index thereafter. | |
| Mid-Cap Core Funds Average: Derived from data provided by Lipper Inc. | |
| |
| Mid-Cap Growth Index Fund Investor Shares (Returns since inception: 8/24/2006) | 5.20% |
| MSCI US Mid Cap Growth Index | 5.37 |
| Mid-Cap Growth Funds Average | 5.40 |
| Mid-Cap Growth Funds Average: Derived from data provided by Lipper Inc. | |
| Mid-Cap Value Index Fund Investor Shares (Returns since inception: 8/24/2006) | 3.05% |
| MSCI US Mid Cap Value Index | 3.22 |
| Mid-Cap Value Funds Average | 3.50 |
| Mid-Cap Value Funds Average: Derived from data provided by Lipper Inc. | |
The figures shown represent past performance, which is not a guarantee of future results. (Current performance may be lower or higher than the performance data cited. For performance data current to the most recent month-end, visit our website at vanguard.com/performance.) Note, too, that both investment returns and principal value can fluctuate widely, so an investor’s shares, when sold, could be worth more or less than their original cost.
7
same time, the economic recovery and a rebound in advertising helped power strong performance by media stocks. The consumer discretionary sector was the biggest contributor to performance in all but the Mid-Cap Value Index Fund, which has less exposure to the sector than the three other funds. Even so, these stocks were the second-biggest contributor to that fund’s performance for the year.
Financial stocks also posted strong gains in all four funds. Real estate investment trusts were strong performers. Over the past few years, the real estate meltdown forced many REITs to shore up their balance sheets, which put them in a strong position as the economy started to pick up and the outlook for rents and vacancy rates improved. Commercial banks posted healthy returns as credit quality began to improve. The strength of financial stocks was a key driver of the performance of the Mid-Cap Value Index Fund in particular. The sector was the fund’s single biggest concentration, accounting for about 30% of portfolio assets, on average.
Although technology stocks produced ordinary returns in the Mid-Cap Value Fund, the sector was a strength in the Mid-Cap Growth and Extended Market Index Funds. Software stocks posted gains as corporate IT spending, which was slashed during the recession, made a comeback. The Mid-Cap Value Index Fund has less exposure to software, as its index places greater emphasis on semiconductor and hardware stocks, which were some of the sector’s weaker performers.
Industrial stocks performed well in all four funds, particularly in the Mid-Cap Growth and the Extended Market Index Funds. Shares of companies that make and sell construction and farm machinery and heavy trucks saw outsized returns, a consequence, perhaps, of the global boom in prices for farm products.
A decade of small but important triumphs
The funds’ long-term returns have been solid, if somewhat below historical stock market averages, a reflection of the decade’s tough investment environment. The four funds have nevertheless done an excellent job of tracking the performance of their target indexes, the primary goal for any index fund.
The two funds that have been in existence for more than ten years—the Extended Market Index Fund and the Mid-Cap Index Fund—have captured most of the returns of their target indexes, trailing by small amounts consistent with the costs of managing real-world portfolios. The Mid-Cap Growth and Value Index Funds, which made their debuts in August 2006, have also succeeded in tracking the returns of their benchmarks.
The records are a testament to the funds’ advisor, Vanguard Quantitative Equity Group, which has been managing index portfolios for more than 30 years. This group of experienced professionals uses well-honed portfolio construction and trading methodologies that allow Vanguard to provide effective index tracking and fund
8
management regardless of the market’s volatility or direction. That approach also benefits, of course, from the funds’ low operating expenses.
The two older funds have outperformed their peer groups over the past decade, while the two newer funds have returned a bit less than theirs since their 2006 inceptions. Over time, we would expect Vanguard’s low-cost indexing strategies to provide competitive returns relative to their peer groups, which consist largely of higher-cost, actively managed funds.
Diversifying: An effective response to uncertainty in investing
The ups and downs of the past year, not to mention the steep and painful declines of the recent past, have tested investors in fundamental ways. Although many economic signs point toward a positive investing environment over the next year, it is impossible to predict when the next crisis may erupt or whether the gains of late 2010 will continue.
In the face of such uncertainty, it is more important than ever to follow a disciplined, time-tested approach to investing. That’s why Vanguard has always advocated that investors hold a diversified portfolio that includes stock, bond, and money market funds in a weighting that matches their risk tolerance and time horizon. Vanguard’s mid-cap index funds can be a valuable component of such a balanced investment portfolio.
As always, thank you for entrusting your assets to Vanguard.
Sincerely,

F. William McNabb III
Chairman and Chief Executive Officer
January 18, 2011
9
Extended Market Index Fund
Fund Profile
As of December 31, 2010
| | | | | |
| Share-Class Characteristics | | | | | |
| | Investor | Admiral | Signal | Institutional | ETF |
| | Shares | Shares | Shares | Shares | Shares |
| Ticker Symbol | VEXMX | VEXAX | VEMSX | VIEIX | VXF |
| Expense Ratio1 | 0.30% | 0.13% | 0.13% | 0.08% | 0.13% |
| 30-Day SEC Yield | 0.82% | 0.96% | 0.96% | 1.00% | 0.96% |
| | | |
| Portfolio Characteristics | | |
| | | | DJ |
| | | S&P | U.S. Total |
| | | Completion | Market |
| | Fund | Index | Index |
| Number of Stocks | 3,022 | 3,394 | 3,893 |
| Median Market Cap | $2.5B | $2.4B | $29.6B |
| Price/Earnings Ratio | 26.7x | 26.7x | 18.3x |
| Price/Book Ratio | 2.1x | 2.1x | 2.2x |
| Return on Equity | 11.2% | 11.2% | 18.8% |
| Earnings Growth Rate | 4.7% | 4.7% | 6.2% |
| Dividend Yield | 1.0% | 1.0% | 1.7% |
| Foreign Holdings | 0.0% | 0.0% | 0.0% |
| Turnover Rate | 10% | — | — |
| Short-Term Reserves | 0.1% | — | — |
| | |
| Volatility Measures | | |
| | | DJ |
| | S&P | U.S. Total |
| | Completion | Market |
| | Index | Index |
| R-Squared | 1.00 | 0.96 |
| Beta | 1.00 | 1.17 |
These measures show the degree and timing of the fund’s fluctuations compared with the indexes over 36 months.
| | |
| Ten Largest Holdings (% of total net assets) |
| BlackRock Inc. | Asset Management | |
| | & Custody Banks | 0.7% |
| Las Vegas Sands Corp. | Casinos & Gaming | 0.5 |
| Mosaic Co. | Fertilizers & | |
| | Agricultural | |
| | Chemicals | 0.5 |
| Delta Air Lines Inc. | Airlines | 0.4 |
| Bunge Ltd. | Agricultural | |
| | Products | 0.4 |
| Edwards Lifesciences | Health Care | |
| Corp. | Equipment | 0.3 |
| Joy Global Inc. | Construction & | |
| | Farm Machinery & | |
| | Heavy Trucks | 0.3 |
| Concho Resources Inc. | Oil & Gas | |
| | Exploration & | |
| | Production | 0.3 |
| Crown Castle | Wireless | |
| International Corp. | Telecommunication | |
| | Services | 0.3 |
| Liberty Global Inc. | Cable & Satellite | 0.3 |
| Top Ten | | 4.0% |
The holdings listed exclude any temporary cash investments and equity index products.
1 The expense ratios shown are from the prospectus dated December 13, 2010, for the Institutional share class and April 29, 2010, for the Investor, Admiral, Signal, and ETF share classes and represent estimated costs for the current fiscal year. For the fiscal year ended December 31, 2010, the expense ratios were 0.26% for Investor Shares, 0.12% for Admiral Shares, 0.12% for Signal Shares, 0.08% for Institutional Shares, and 0.12% for ETF Shares.
10
Extended Market Index Fund
| | | |
| Sector Diversification (% of equity exposure) |
| | | | DJ |
| | | S&P | U.S. Total |
| | | Completion | Market |
| | Fund | Index | Index |
| Consumer | | | |
| Discretionary | 13.9% | 13.9% | 11.9% |
| Consumer Staples | 3.4 | 3.4 | 9.5 |
| Energy | 7.4 | 7.4 | 10.6 |
| Financials | 19.7 | 19.7 | 16.6 |
| Health Care | 11.7 | 11.7 | 10.7 |
| Industrials | 15.7 | 15.7 | 11.4 |
| Information | | | |
| Technology | 15.8 | 15.7 | 18.9 |
| Materials | 6.7 | 6.8 | 4.5 |
| Telecommunication | | | |
| Services | 1.7 | 1.7 | 2.7 |
| Utilities | 4.0 | 4.0 | 3.2 |
Investment Focus
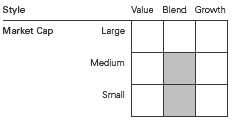
11
Extended Market Index Fund
Performance Summary
All of the returns in this report represent past performance, which is not a guarantee of future results that may be achieved by the fund. (Current performance may be lower or higher than the performance data cited. For performance data current to the most recent month-end, visit our website at vanguard.com/performance.) Note, too, that both investment returns and principal value can fluctuate widely, so an investor’s shares, when sold, could be worth more or less than their original cost. The returns shown do not reflect taxes that a shareholder would pay on fund distributions or on the sale of fund shares.
Cumulative Performance: December 31, 2000, Through December 31, 2010
Initial Investment of $10,000
| | | | | |
| | | Average Annual Total Returns | |
| | | Periods Ended December 31, 2010 | |
| | | | | | Final Value |
| | | One | Five | Ten | of a $10,000 |
| | | Year | Years | Years | Investment |
| | Extended Market Index Fund Investor | | | | |
| | Shares | 27.37% | 5.04% | 5.98% | $17,875 |
| •••••••• | Dow Jones U.S. Total Stock Market | | | | |
| | Index | 17.70 | 3.17 | 2.64 | 12,981 |
| – – – – | Spliced Extended Market Index | 27.46 | 5.05 | 6.02 | 17,949 |
| | Mid-Cap Core Funds Average | 23.29 | 4.06 | 4.92 | 16,172 |
Spliced Extended Market Index: Dow Jones Wilshire 4500 Index through June 17, 2005; S&P Transitional Completion Index through
September 16, 2005; S&P Completion Index thereafter.
Mid-Cap Core Funds Average: Derived from data provided by Lipper Inc.
See Financial Highlights for dividend and capital gains information.
12
Extended Market Index Fund
| | | | |
| | | Average Annual Total Returns | |
| | Periods Ended December 31, 2010 | |
| | | | | Final Value |
| | One | Five | Ten | of a $10,000 |
| | Year | Years | Years | Investment |
| Extended Market Index Fund | | | | |
| Admiral Shares | 27.57% | 5.20% | 6.11% | $18,087 |
| Dow Jones U.S. Total Stock Market | | | | |
| Index | 17.70 | 3.17 | 2.64 | 12,981 |
| Spliced Extended Market Index | 27.46 | 5.05 | 6.02 | 17,949 |
| | | |
| | | Since | Final Value |
| | One | Inception | of a $10,000 |
| | Year | (9/1/2006) | Investment |
| Extended Market Index Fund Signal | | | |
| Shares | 27.53% | 4.91% | $12,305 |
| Dow Jones U.S. Total Stock Market | | | |
| Index | 17.70 | 2.26 | 11,017 |
| S&P Completion Index | 27.46 | 4.77 | 12,238 |
| "Since Inception" performance is calculated from the Signal Shares’ inception date for both the fund and its comparative standards. |
| | | | |
| | | | | Final Value |
| | One | Five | Ten | of a $5,000,000 |
| | Year | Years | Years | Investment |
| Extended Market Index Fund | | | | |
| Institutional Shares | 27.59% | 5.23% | 6.16% | $9,093,679 |
| Dow Jones U.S. Total Stock Market | | | | |
| Index | 17.70 | 3.17 | 2.64 | 6,490,386 |
| Spliced Extended Market Index | 27.46 | 5.05 | 6.02 | 8,974,305 |
| | | | |
| | | | Since | Final Value |
| | One | Five | Inception | of a $10,000 |
| | Year | Years | (12/27/2001) | Investment |
| Extended Market Index Fund | | | | |
| ETF Shares Net Asset Value | 27.55% | 5.21% | 7.94% | $19,914 |
| Dow Jones U.S. Total Stock Market Index | 17.70 | 3.17 | 4.20 | 14,491 |
| Spliced Extended Market Index | 27.46 | 5.05 | 7.89 | 19,822 |
| "Since Inception" performance is calculated from the ETF Shares’ inception date for both the fund and its comparative standards. |
13
Extended Market Index Fund
| | | |
| Cumulative Returns of ETF Shares: December 27, 2001, Through December 31, 2010 | |
| | | | Since |
| | One | Five | Inception |
| | Year | Years | (12/27/2001) |
| Extended Market Index Fund | | | |
| ETF Shares Market Price | 27.63% | 29.05% | 99.20% |
| Extended Market Index Fund | | | |
| ETF Shares Net Asset Value | 27.55 | 28.90 | 99.14 |
| Spliced Extended Market Index | 27.46 | 27.94 | 98.22 |
| "Since Inception" performance is calculated from the ETF Shares’ inception date for both the fund and its comparative standard. |
Fiscal-Year Total Returns (%): December 31, 2000, Through December 31, 2010
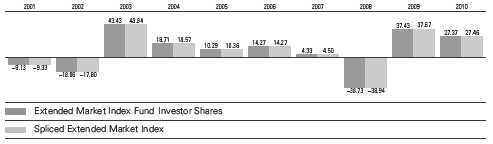
14
Extended Market Index Fund
Financial Statements
Statement of Net Assets—Investments Summary
As of December 31, 2010
This Statement summarizes the fund’s holdings by asset type. Details are reported for each of the fund’s 50 largest individual holdings and for investments that, in total for any issuer, represent more than 1% of the fund’s net assets. The total value of smaller holdings is reported as a single amount within each category.
The fund reports a complete list of its holdings in regulatory filings four times in each fiscal year, at the quarter-ends. For the second and fourth fiscal quarters, the complete listing of the fund’s holdings is available electronically on vanguard.com and on the Securities and Exchange Commission’s website (sec.gov), or you can have it mailed to you without charge by calling 800-662-7447. For the first and third fiscal quarters, the fund files the lists with the SEC on Form N-Q. Shareholders can look up the fund’s Forms N-Q on the SEC’s website. Forms N-Q may also be reviewed and copied at the SEC’s Public Reference Room (see the back cover of this report for further information).
| | | |
| | | Market | Percentage |
| | | Value | of Net |
| | Shares | ($000) | Assets |
| Common Stocks | | | |
| Consumer Discretionary | | | |
| * Las Vegas Sands Corp. | 2,059,740 | 94,645 | 0.6% |
| * BorgWarner Inc. | 739,028 | 53,476 | 0.3% |
| * Dollar Tree Inc. | 813,539 | 45,623 | 0.3% |
| * Chipotle Mexican Grill Inc. Class A | 201,026 | 42,750 | 0.3% |
| * Liberty Global Inc. | 1,249,820 | 42,356 | 0.2% |
| * Sirius XM Radio Inc. | 25,492,439 | 41,808 | 0.2% |
| * Royal Caribbean Cruises Ltd. | 880,887 | 41,402 | 0.2% |
| Advance Auto Parts Inc. | 546,082 | 36,123 | 0.2% |
| Consumer Discretionary—Other † | | 2,016,828 | 11.6% |
| | | 2,415,011 | 13.9% |
| Consumer Staples | | | |
| Bunge Ltd. | 941,322 | 61,675 | 0.4% |
| Consumer Staples—Other † | | 526,262 | 3.0% |
| | | 587,937 | 3.4% |
| Energy | | | |
| * Concho Resources Inc. | 648,961 | 56,894 | 0.3% |
| Cimarex Energy Co. | 550,272 | 48,716 | 0.3% |
| * Ultra Petroleum Corp. | 990,584 | 47,320 | 0.3% |
| * Alpha Natural Resources Inc. | 782,240 | 46,958 | 0.3% |
| * Whiting Petroleum Corp. | 380,392 | 44,578 | 0.2% |
| * Pride International Inc. | 1,141,605 | 37,673 | 0.2% |
| Arch Coal Inc. | 1,055,543 | 37,007 | 0.2% |
| * Petrohawk Energy Corp. | 1,963,904 | 35,841 | 0.2% |
| Energy—Other † | | 934,511 | 5.4% |
| | | 1,289,498 | 7.4% |
| Financials | | | |
| BlackRock Inc. | 621,878 | 118,518 | 0.7% |
| New York Community Bancorp Inc. | 2,829,861 | 53,343 | 0.3% |
| Macerich Co. | 845,288 | 40,041 | 0.2% |
15
Extended Market Index Fund
| | | |
| | | Market | Percentage |
| | | Value | of Net |
| | Shares | ($000) | Assets |
| AMB Property Corp. | 1,093,945 | 34,689 | 0.2% |
| SL Green Realty Corp. | 508,317 | 34,316 | 0.2% |
| Financials—Other † | | 3,141,236 | 18.0% |
| | | 3,422,143 | 19.6% |
| Health Care | | | |
| * Edwards Lifesciences Corp. | 741,522 | 59,945 | 0.3% |
| * Illumina Inc. | 807,401 | 51,141 | 0.3% |
| * Alexion Pharmaceuticals Inc. | 585,364 | 47,151 | 0.3% |
| * Vertex Pharmaceuticals Inc. | 1,320,067 | 46,242 | 0.3% |
| * Henry Schein Inc. | 599,482 | 36,802 | 0.2% |
| Perrigo Co. | 539,305 | 34,154 | 0.2% |
| * ResMed Inc. | 982,198 | 34,023 | 0.2% |
| Health Care—Other † | | 1,712,328 | 9.8% |
| | | 2,021,786 | 11.6% |
| Industrials | | | |
| * Delta Air Lines Inc. | 5,123,801 | 64,560 | 0.4% |
| Joy Global Inc. | 670,975 | 58,207 | 0.3% |
| * United Continental Holdings Inc. | 2,059,763 | 49,064 | 0.3% |
| Bucyrus International Inc. Class A | 526,082 | 47,032 | 0.3% |
| AMETEK Inc. | 1,039,767 | 40,811 | 0.2% |
| Industrials—Other † | | 2,468,434 | 14.1% |
| | | 2,728,108 | 15.6% |
| Information Technology | | | |
| * Cree Inc. | 704,492 | 46,419 | 0.3% |
| Maxim Integrated Products Inc. | 1,929,329 | 45,571 | 0.3% |
| * VMware Inc. Class A | 511,526 | 45,480 | 0.3% |
| * Rovi Corp. | 683,266 | 42,369 | 0.2% |
| Activision Blizzard Inc. | 3,368,899 | 41,909 | 0.2% |
| * Lam Research Corp. | 798,695 | 41,356 | 0.2% |
| * Atmel Corp. | 2,976,183 | 36,667 | 0.2% |
| * Skyworks Solutions Inc. | 1,190,750 | 34,091 | 0.2% |
| Information Technology—Other † | | 2,397,807 | 13.8% |
| | | 2,731,669 | 15.7% |
| Materials | | | |
| Mosaic Co. | 1,042,265 | 79,587 | 0.5% |
| Lubrizol Corp. | 426,358 | 45,569 | 0.3% |
| Walter Energy Inc. | 343,634 | 43,930 | 0.2% |
| Celanese Corp. Class A | 1,011,239 | 41,633 | 0.2% |
| * Crown Holdings Inc. | 1,033,488 | 34,498 | 0.2% |
| Materials—Other † | | 926,126 | 5.3% |
| | | 1,171,343 | 6.7% |
| Telecommunication Services | | | |
| * Crown Castle International Corp. | 1,283,986 | 56,277 | 0.3% |
| * NII Holdings Inc. | 1,099,637 | 49,110 | 0.3% |
| Telecommunication Services—Other † | | 184,661 | 1.1% |
| | | 290,048 | 1.7% |
| Utilities | | | |
| National Fuel Gas Co. | 533,945 | 35,037 | 0.2% |
| Utilities—Other † | | 657,398 | 3.8% |
| | | 692,435 | 4.0% |
| Total Common Stocks (Cost $14,156,752) | | 17,349,978 | 99.6%1 |
16
Extended Market Index Fund
| | | | |
| | | | Market | Percentage |
| | | | Value | of Net |
| | Coupon | Shares | ($000) | Assets |
| Temporary Cash Investments | | | | |
| Money Market Fund | | | | |
| 2,3 Vanguard Market Liquidity Fund | 0.211% | 264,435,000 | 264,435 | 1.5% |
| 4U.S. Government and Agency Obligations † | | | 6,998 | 0.0% |
| Total Temporary Cash Investments (Cost $271,433) | | | 271,433 | 1.5%1 |
| 5Total Investments (Cost $14,428,185) | | | 17,621,411 | 101.1% |
| Other Assets and Liabilities | | | | |
| Other Assets | | | 291,696 | 1.7% |
| Liabilities3 | | | (491,666) | (2.8%) |
| | | | (199,970) | (1.1%) |
| Net Assets | | | 17,421,441 | 100.0% |
| |
| At December 31, 2010, net assets consisted of: | |
| | Amount |
| | ($000) |
| Paid-in Capital | 15,941,243 |
| Overdistributed Net Investment Income | (20,411) |
| Accumulated Net Realized Losses | (1,692,350) |
| Unrealized Appreciation (Depreciation) | |
| Investment Securities | 3,193,226 |
| Futures Contracts | (267) |
| Net Assets | 17,421,441 |
17
Extended Market Index Fund
| |
| | Amount |
| | ($000) |
| Investor Shares—Net Assets | |
| Applicable to 82,515,646 outstanding $.001 par value shares of | |
| beneficial interest (unlimited authorization) | 3,404,736 |
| Net Asset Value Per Share—Investor Shares | $41.26 |
| |
| Admiral Shares—Net Assets | |
| Applicable to 125,038,050 outstanding $.001 par value shares of | |
| beneficial interest (unlimited authorization) | 5,161,470 |
| Net Asset Value Per Share—Admiral Shares | $41.28 |
| |
| Signal Shares—Net Assets | |
| Applicable to 59,054,204 outstanding $.001 par value shares of | |
| beneficial interest (unlimited authorization) | 2,094,277 |
| Net Asset Value Per Share—Signal Shares | $35.46 |
| |
| Institutional Shares—Net Assets | |
| Applicable to 136,844,349 outstanding $.001 par value shares of | |
| beneficial interest (unlimited authorization) | 5,648,039 |
| Net Asset Value Per Share—Institutional Shares | $41.27 |
| |
| ETF Shares—Net Assets | |
| Applicable to 20,452,386 outstanding $.001 par value shares of | |
| beneficial interest (unlimited authorization) | 1,112,919 |
| Net Asset Value Per Share—ETF Shares | $54.42 |
See Note A in Notes to Financial Statements.
* Non-income-producing security.
† Represents the aggregate value, by category, of securities that are not among the 50 largest holdings and, in total for any issuer, represent 1% or less of net assets.
1 The fund invests a portion of its cash reserves in equity markets through the use of index futures contracts. After giving effect to futures investments, the fund’s effective common stock and temporary cash investment positions represent 100.0% and 1.1%, respectively, of net assets.
2 Affiliated money market fund available only to Vanguard funds and certain trusts and accounts managed by Vanguard. Rate shown is the 7-day yield.
3 Includes $187,565,000 of collateral received for securities on loan.
4 Securities with a value of $6,998,000 have been segregated as initial margin for open futures contracts.
5 The total value of securities on loan is $164,884,000.
See accompanying Notes, which are an integral part of the Financial Statements.
18
Extended Market Index Fund
| |
| Statement of Operations | |
| |
| |
| | Year Ended |
| | December 31, 2010 |
| | ($000) |
| Investment Income | |
| Income | |
| Dividends | 172,606 |
| Interest1 | 175 |
| Security Lending | 17,487 |
| Total Income | 190,268 |
| Expenses | |
| The Vanguard Group—Note B | |
| Investment Advisory Services | 770 |
| Management and Administrative—Investor Shares | 9,847 |
| Management and Administrative—Admiral Shares | 2,685 |
| Management and Administrative—Signal Shares | 1,298 |
| Management and Administrative—Institutional Shares | 1,989 |
| Management and Administrative—ETF Shares | 711 |
| Marketing and Distribution—Investor Shares | 1,114 |
| Marketing and Distribution—Admiral Shares | 445 |
| Marketing and Distribution—Signal Shares | 452 |
| Marketing and Distribution—Institutional Shares | 1,187 |
| Marketing and Distribution—ETF Shares | 255 |
| Custodian Fees | 383 |
| Auditing Fees | 33 |
| Shareholders’ Reports—Investor Shares | 82 |
| Shareholders’ Reports—Admiral Shares | 11 |
| Shareholders’ Reports—Signal Shares | 23 |
| Shareholders’ Reports—Institutional Shares | 75 |
| Shareholders’ Reports—ETF Shares | 47 |
| Trustees’ Fees and Expenses | 22 |
| Total Expenses | 21,429 |
| Net Investment Income | 168,839 |
| Realized Net Gain (Loss) | |
| Investment Securities Sold | 606,546 |
| Futures Contracts | 7,449 |
| Realized Net Gain (Loss) | 613,995 |
| Change in Unrealized Appreciation (Depreciation) | |
| Investment Securities | 2,902,869 |
| Futures Contracts | (1,953) |
| Change in Unrealized Appreciation (Depreciation) | 2,900,916 |
| Net Increase (Decrease) in Net Assets Resulting from Operations | 3,683,750 |
1 Interest income from an affiliated company of the fund was $157,000.
See accompanying Notes, which are an integral part of the Financial Statements.
19
Extended Market Index Fund
| | |
| Statement of Changes in Net Assets | | |
| |
| | Year Ended December 31, |
| | 2010 | 2009 |
| | ($000) | ($000) |
| Increase (Decrease) in Net Assets | | |
| Operations | | |
| Net Investment Income | 168,839 | 131,857 |
| Realized Net Gain (Loss) | 613,995 | 97,363 |
| Change in Unrealized Appreciation (Depreciation) | 2,900,916 | 3,233,526 |
| Net Increase (Decrease) in Net Assets Resulting from Operations | 3,683,750 | 3,462,746 |
| Distributions | | |
| Net Investment Income | | |
| Investor Shares | (28,999) | (42,559) |
| Admiral Shares | (48,417) | (26,111) |
| Signal Shares | (18,088) | (18,811) |
| Institutional Shares | (62,049) | (40,612) |
| ETF Shares | (10,835) | (8,825) |
| Realized Capital Gain | | |
| Investor Shares | — | — |
| Admiral Shares | — | — |
| Signal Shares | — | — |
| Institutional Shares | — | — |
| ETF Shares | — | — |
| Total Distributions | (168,388) | (136,918) |
| Capital Share Transactions | | |
| Investor Shares | (1,889,941) | 109,190 |
| Admiral Shares | 2,110,302 | 9,913 |
| Signal Shares | 40,804 | (12,766) |
| Institutional Shares | 993,622 | 101,830 |
| ETF Shares | 105,383 | 70,227 |
| Net Increase (Decrease) from Capital Share Transactions | 1,360,170 | 278,394 |
| Total Increase (Decrease) | 4,875,532 | 3,604,222 |
| Net Assets | | |
| Beginning of Period | 12,545,909 | 8,941,687 |
| End of Period1 | 17,421,441 | 12,545,909 |
| 1 Net Assets—End of Period includes undistributed (overdistributed) net investment income of ($20,411,000) and ($20,862,000). |
See accompanying Notes, which are an integral part of the Financial Statements.
20
Extended Market Index Fund
| | | | | |
| Financial Highlights | | | | | |
| |
| Investor Shares | | | | | |
| |
| For a Share Outstanding | | | Year Ended December 31, |
| Throughout Each Period | 2010 | 2009 | 2008 | 2007 | 2006 |
| Net Asset Value, Beginning of Period | $32.67 | $24.01 | $39.89 | $38.68 | $34.26 |
| Investment Operations | | | | | |
| Net Investment Income | .360 | .316 | .392 | .453 | .447 |
| Net Realized and Unrealized Gain (Loss) | | | | | |
| on Investments | 8.581 | 8.670 | (15.862) | 1.214 | 4.440 |
| Total from Investment Operations | 8.941 | 8.986 | (15.470) | 1.667 | 4.887 |
| Distributions | | | | | |
| Dividends from Net Investment Income | (.351) | (.326) | (.410) | (.457) | (.467) |
| Distributions from Realized Capital Gains | — | — | — | — | — |
| Total Distributions | (.351) | (.326) | (.410) | (.457) | (.467) |
| Net Asset Value, End of Period | $41.26 | $32.67 | $24.01 | $39.89 | $38.68 |
| |
| Total Return1 | 27.37% | 37.43% | -38.73% | 4.33% | 14.27% |
| |
| Ratios/Supplemental Data | | | | | |
| Net Assets, End of Period (Millions) | $3,405 | $4,309 | $3,080 | $5,254 | $6,172 |
| Ratio of Total Expenses to | | | | | |
| Average Net Assets | 0.26% | 0.30% | 0.25% | 0.24% | 0.25% |
| Ratio of Net Investment Income to | | | | | |
| Average Net Assets | 1.07% | 1.16% | 1.22% | 1.13% | 1.22% |
| Portfolio Turnover Rate2 | 10% | 17% | 13% | 14% | 16% |
1 Total returns do not include account service fees that may have applied in the periods shown. Fund prospectuses provide information about any applicable account service fees.
2 Excludes the value of portfolio securities received or delivered as a result of in-kind purchases or redemptions of the fund’s capital shares, including ETF Creation Units.
See accompanying Notes, which are an integral part of the Financial Statements.
21
Extended Market Index Fund
| | | | | |
| Financial Highlights | | | | | |
| |
| Admiral Shares | | | | | |
| |
| For a Share Outstanding | | | Year Ended December 31, |
| Throughout Each Period | 2010 | 2009 | 2008 | 2007 | 2006 |
| Net Asset Value, Beginning of Period | $32.67 | $24.01 | $39.90 | $38.70 | $34.28 |
| Investment Operations | | | | | |
| Net Investment Income | .399 | .362 | .443 | .510 | .503 |
| Net Realized and Unrealized Gain (Loss) | | | | | |
| on Investments | 8.606 | 8.673 | (15.881) | 1.214 | 4.440 |
| Total from Investment Operations | 9.005 | 9.035 | (15.438) | 1.724 | 4.943 |
| Distributions | | | | | |
| Dividends from Net Investment Income | (.395) | (.375) | (.452) | (.524) | (.523) |
| Distributions from Realized Capital Gains | — | — | — | — | — |
| Total Distributions | (.395) | (.375) | (.452) | (.524) | (.523) |
| Net Asset Value, End of Period | $41.28 | $32.67 | $24.01 | $39.90 | $38.70 |
| |
| Total Return | 27.57% | 37.65% | -38.63% | 4.48% | 14.43% |
| |
| Ratios/Supplemental Data | | | | | |
| Net Assets, End of Period (Millions) | $5,161 | $2,300 | $1,705 | $2,811 | $3,137 |
| Ratio of Total Expenses to | | | | | |
| Average Net Assets | 0.12% | 0.13% | 0.10% | 0.09% | 0.10% |
| Ratio of Net Investment Income to | | | | | |
| Average Net Assets | 1.21% | 1.33% | 1.37% | 1.28% | 1.37% |
| Portfolio Turnover Rate1 | 10% | 17% | 13% | 14% | 16% |
1 Excludes the value of portfolio securities received or delivered as a result of in-kind purchases or redemptions of the fund’s capital shares, including ETF Creation Units.
See accompanying Notes, which are an integral part of the Financial Statements.
22
Extended Market Index Fund
| | | | | |
| Financial Highlights | | | | | |
| |
| Signal Shares | | | | | |
| | | | | | Sept. 1, |
| | | | | | 20061 to |
| For a Share Outstanding | Year Ended December 31, | Dec. 31, |
| Throughout Each Period | 2010 | 2009 | 2008 | 2007 | 2006 |
| Net Asset Value, Beginning of Period | $28.08 | $20.64 | $34.29 | $33.26 | $30.79 |
| Investment Operations | | | | | |
| Net Investment Income | .355 | .310 | .381 | .443 | .173 |
| Net Realized and Unrealized Gain (Loss) | | | | | |
| on Investments | 7.376 | 7.451 | (13.642) | 1.035 | 2.698 |
| Total from Investment Operations | 7.731 | 7.761 | (13.261) | 1.478 | 2.871 |
| Distributions | | | | | |
| Dividends from Net Investment Income | (.351) | (.321) | (.389) | (.448) | (.401) |
| Distributions from Realized Capital Gains | — | — | — | — | — |
| Total Distributions | (.351) | (.321) | (.389) | (.448) | (.401) |
| Net Asset Value, End of Period | $35.46 | $28.08 | $20.64 | $34.29 | $33.26 |
| |
| Total Return | 27.53% | 37.62% | -38.61% | 4.46% | 9.33% |
| |
| Ratios/Supplemental Data | | | | | |
| Net Assets, End of Period (Millions) | $2,094 | $1,661 | $1,230 | $2,079 | $408 |
| Ratio of Total Expenses to | | | | | |
| Average Net Assets | 0.12% | 0.13% | 0.10% | 0.09% | 0.10%2 |
| Ratio of Net Investment Income to | | | | | |
| Average Net Assets | 1.21% | 1.33% | 1.37% | 1.28% | 1.37%2 |
| Portfolio Turnover Rate3 | 10% | 17% | 13% | 14% | 16% |
1 Inception.
2 Annualized.
3 Excludes the value of portfolio securities received or delivered as a result of in-kind purchases or redemptions of the fund’s capital shares, including ETF Creation Units.
See accompanying Notes, which are an integral part of the Financial Statements.
23
Extended Market Index Fund
| | | | | |
| Financial Highlights | | | | | |
| |
| Institutional Shares | | | | | |
| |
| For a Share Outstanding | | | Year Ended December 31, |
| Throughout Each Period | 2010 | 2009 | 2008 | 2007 | 2006 |
| Net Asset Value, Beginning of Period | $32.68 | $24.02 | $39.91 | $38.71 | $34.29 |
| Investment Operations | | | | | |
| Net Investment Income | .429 | .374 | .458 | .523 | .513 |
| Net Realized and Unrealized Gain (Loss) | | | | | |
| on Investments | 8.586 | 8.674 | (15.882) | 1.214 | 4.440 |
| Total from Investment Operations | 9.015 | 9.048 | (15.424) | 1.737 | 4.953 |
| Distributions | | | | | |
| Dividends from Net Investment Income | (.425) | (.388) | (.466) | (.537) | (.533) |
| Distributions from Realized Capital Gains | — | — | — | — | — |
| Total Distributions | (.425) | (.388) | (.466) | (.537) | (.533) |
| Net Asset Value, End of Period | $41.27 | $32.68 | $24.02 | $39.91 | $38.71 |
| |
| Total Return | 27.59% | 37.69% | -38.58% | 4.51% | 14.46% |
| |
| Ratios/Supplemental Data | | | | | |
| Net Assets, End of Period (Millions) | $5,648 | $3,494 | $2,442 | $3,175 | $2,621 |
| Ratio of Total Expenses to | | | | | |
| Average Net Assets | 0.08% | 0.08% | 0.06% | 0.06% | 0.07% |
| Ratio of Net Investment Income to | | | | | |
| Average Net Assets | 1.25% | 1.38% | 1.41% | 1.31% | 1.40% |
| Portfolio Turnover Rate1 | 10% | 17% | 13% | 14% | 16% |
1 Excludes the value of portfolio securities received or delivered as a result of in-kind purchases or redemptions of the fund’s capital shares, including ETF Creation Units.
See accompanying Notes, which are an integral part of the Financial Statements.
24
Extended Market Index Fund
| | | | | |
| Financial Highlights | | | | | |
| |
| ETF Shares | | | | | |
| |
| For a Share Outstanding | | | Year Ended December 31, |
| Throughout Each Period | 2010 | 2009 | 20081 | 20071 | 20061 |
| Net Asset Value, Beginning of Period | $43.09 | $31.67 | $52.62 | $51.03 | $45.20 |
| Investment Operations | | | | | |
| Net Investment Income | .547 | .476 | .595 | .695 | .669 |
| Net Realized and Unrealized Gain (Loss) | | | | | |
| on Investments | 11.324 | 11.438 | (20.935) | 1.592 | 5.858 |
| Total from Investment Operations | 11.871 | 11.914 | (20.340) | 2.287 | 6.527 |
| Distributions | | | | | |
| Dividends from Net Investment Income | (.541) | (.494) | (.610) | (.697) | (.697) |
| Distributions from Realized Capital Gains | — | — | — | — | — |
| Total Distributions | (.541) | (.494) | (.610) | (.697) | (.697) |
| Net Asset Value, End of Period | $54.42 | $43.09 | $31.67 | $52.62 | $51.03 |
| |
| Total Return | 27.55% | 37.63% | -38.60% | 4.49% | 14.46% |
| |
| Ratios/Supplemental Data | | | | | |
| Net Assets, End of Period (Millions) | $1,113 | $781 | $484 | $559 | $409 |
| Ratio of Total Expenses to | | | | | |
| Average Net Assets | 0.12% | 0.13% | 0.08% | 0.08% | 0.08% |
| Ratio of Net Investment Income to | | | | | |
| Average Net Assets | 1.21% | 1.33% | 1.39% | 1.29% | 1.39% |
| Portfolio Turnover Rate2 | 10% | 17% | 13% | 14% | 16% |
1 Adjusted to reflect a 2-for-1 share split as of the close of business on June 13, 2008.
2 Excludes the value of portfolio securities received or delivered as a result of in-kind purchases or redemptions of the fund’s capital shares, including ETF Creation Units.
See accompanying Notes, which are an integral part of the Financial Statements.
25
Extended Market Index Fund
Notes to Financial Statements
Vanguard Extended Market Index Fund is registered under the Investment Company Act of 1940 as an open-end investment company, or mutual fund. The fund offers six classes of shares: Investor Shares, Admiral Shares, Signal Shares, Institutional Shares, Institutional Plus Shares, and ETF Shares. Investor Shares are available to any investor who meets the fund’s minimum purchase requirements. Admiral Shares, Signal Shares, Institutional Shares, and Institutional Plus Shares are designed for investors who meet certain administrative, service, and account-size criteria. The fund has not issued any Institutional Plus Shares through December 31, 2010. ETF Shares are listed for trading on the NYSE Arca, Inc.; they can be purchased and sold through a broker.
A. The following significant accounting policies conform to generally accepted accounting principles for U.S. mutual funds. The fund consistently follows such policies in preparing its financial statements.
1. Security Valuation: Securities are valued as of the close of trading on the New York Stock Exchange (generally 4 p.m., Eastern time) on the valuation date. Equity securities are valued at the latest quoted sales prices or official closing prices taken from the primary market in which each security trades; such securities not traded on the valuation date are valued at the mean of the latest quoted bid and asked prices. Securities for which market quotations are not readily available, or whose values have been materially affected by events occurring before the fund’s pricing time but after the close of the securities’ primary markets, are valued by methods deemed by the board of trustees to represent fair value. Investments in Vanguard Market Liquidity Fund are valued at that fund’s net asset value. Temporary cash investments acquired over 60 days to maturity are valued using the latest bid prices or using valuations based on a matrix system (which considers such factors as security prices, yields, maturities, and ratings), both as furnished by independent pricing services. Other temporary cash investments are valued at amortized cost, which approximates market value.
2. Futures Contracts: The fund uses index futures contracts to a limited extent, with the objectives of maintaining full exposure to the stock market, enhancing returns, maintaining liquidity, and minimizing transaction costs. The fund may purchase futures contracts to immediately invest incoming cash in the market, or sell futures in response to cash outflows, thereby simulating a fully invested position in the underlying index while maintaining a cash balance for liquidity. The fund may seek to enhance returns by using futures contracts instead of the underlying securities when futures are believed to be priced more attractively than the underlying securities. The primary risks associated with the use of futures contracts are imperfect correlation between changes in market values of stocks held by the fund and the prices of futures contracts, and the possibility of an illiquid market.
Futures contracts are valued at their quoted daily settlement prices. The aggregate principal amounts of the contracts are not recorded in the Statement of Net Assets. Fluctuations in the value of the contracts are recorded in the Statement of Net Assets as an asset (liability) and in the Statement of Operations as unrealized appreciation (depreciation) until the contracts are closed, when they are recorded as realized futures gains (losses).
3. Federal Income Taxes: The fund intends to continue to qualify as a regulated investment company and distribute all of its taxable income. Management has analyzed the fund’s tax positions taken for all open federal income tax years (December 31, 2007–2010), and has concluded that no provision for federal income tax is required in the fund’s financial statements.
4. Distributions: Distributions to shareholders are recorded on the ex-dividend date.
26
Extended Market Index Fund
5. Security Lending: The fund may lend its securities to qualified institutional borrowers to earn additional income. Security loans are required to be secured at all times by collateral at least equal to the market value of securities loaned. The fund invests cash collateral received in Vanguard Market Liquidity Fund, and records a liability for the return of the collateral, during the period the securities are on loan. Security lending income represents fees charged to borrowers plus income earned on investing cash collateral, less expenses associated with the loan.
6. Other: Dividend income is recorded on the ex-dividend date. Interest income includes income distributions received from Vanguard Market Liquidity Fund and is accrued daily. Security transactions are accounted for on the date securities are bought or sold. Costs used to determine realized gains (losses) on the sale of investment securities are those of the specific securities sold.
Each class of shares has equal rights as to assets and earnings, except that each class separately bears certain class-specific expenses related to maintenance of shareholder accounts (included in Management and Administrative expenses) and shareholder reporting. Marketing and distribution expenses are allocated to each class of shares based on a method approved by the board of trustees. Income, other non-class-specific expenses, and gains and losses on investments are allocated to each class of shares based on its relative net assets.
B. The Vanguard Group furnishes at cost investment advisory, corporate management, administrative, marketing, and distribution services. The costs of such services are allocated to the fund under methods approved by the board of trustees. The fund has committed to provide up to 0.40% of its net assets in capital contributions to Vanguard. At December 31, 2010, the fund had contributed capital of $2,866,000 to Vanguard (included in Other Assets), representing 0.02% of the fund’s net assets and 1.15% of Vanguard’s capitalization. The fund’s trustees and officers are also directors and officers of Vanguard.
C. Various inputs may be used to determine the value of the fund’s investments. These inputs are summarized in three broad levels for financial statement purposes. The inputs or methodologies used to value securities are not necessarily an indication of the risk associated with investing in those securities.
Level 1—Quoted prices in active markets for identical securities.
Level 2—Other significant observable inputs (including quoted prices for similar securities, interest rates, prepayment speeds, credit risk, etc.).
Level 3—Significant unobservable inputs (including the fund’s own assumptions used to determine the fair value of investments).
The following table summarizes the fund’s investments as of December 31, 2010, based on the inputs used to value them:
| | | |
| | Level 1 | Level 2 | Level 3 |
| Investments | ($000) | ($000) | ($000) |
| Common Stocks | 17,349,978 | — | — |
| Temporary Cash Investments | 264,435 | 6,998 | — |
| Futures Contracts—Liabilities1 | (494) | — | — |
| Total | 17,613,919 | 6,998 | — |
| 1 Represents variation margin on the last day of the reporting period. | | | |
27
Extended Market Index Fund
The following table summarizes changes in investments valued based on Level 3 inputs during the year ended December 31, 2010:
| |
| | Investments in |
| | Common Stocks |
| Amount Valued Based on Level 3 Inputs | ($000) |
| Balance as of December 31, 2009 | 11 |
| Total Sales | (7) |
| Net Realized Gain (Loss) | (1,458) |
| Change in Unrealized Appreciation (Depreciation) | 1,454 |
| Balance as of December 31, 2010 | — |
D. At December 31, 2010, the aggregate settlement value of open futures contracts and the related unrealized appreciation (depreciation) were:
| | | | |
| | | | | ($000) |
| | | | Aggregate | |
| | | Number of | Settlement | Unrealized |
| | | Long (Short) | Value | Appreciation |
| Futures Contracts | Expiration | Contracts | Long (Short) | (Depreciation) |
| E-mini Russell 2000 Index | March 2011 | 746 | 58,360 | (508) |
| S&P MidCap 400 Index | March 2011 | 36 | 16,295 | 241 |
Unrealized appreciation (depreciation) on open futures contracts is required to be treated as realized gain (loss) for tax purposes.
E. Distributions are determined on a tax basis and may differ from net investment income and realized capital gains for financial reporting purposes. Differences may be permanent or temporary. Permanent differences are reclassified among capital accounts in the financial statements to reflect their tax character. Temporary differences arise when certain items of income, expense, gain, or loss are recognized in different periods for financial statement and tax purposes; these differences will reverse at some time in the future. Differences in classification may also result from the treatment of short-term gains as ordinary income for tax purposes.
During the year ended December 31, 2010, the fund realized $628,567,000 of net capital gains resulting from in-kind redemptions—in which shareholders exchanged fund shares for securities held by the fund rather than for cash. Because such gains are not taxable to the fund, and are not distributed to shareholders, they have been reclassified from accumulated net realized losses to paid-in capital.
For tax purposes, at December 31, 2010, the fund had $4,094,000 of ordinary income available for distribution. The fund had available capital loss carryforwards totaling $1,684,629,000 to offset future net capital gains of $100,407,000 through December 31, 2011, $60,375,000 through December 31, 2014, $168,517,000 through December 31, 2015, $708,199,000 through December 31, 2016, $622,547,000 through December 31, 2017, and $24,584,000 through December 31, 2018. In addition, the fund realized losses of $1,466,000 during the period from November 1, 2010, through December 31, 2010, which are deferred and will be treated as realized for tax purposes in fiscal 2011.
28
Extended Market Index Fund
At December 31, 2010, the cost of investment securities for tax purposes was $14,433,519,000. Net unrealized appreciation of investment securities for tax purposes was $3,187,892,000, consisting of unrealized gains of $4,585,007,000 on securities that had risen in value since their purchase and $1,397,115,000 in unrealized losses on securities that had fallen in value since their purchase.
F. During the year ended December 31, 2010, the fund purchased $3,838,085,000 of investment securities and sold $2,384,996,000 of investment securities, other than temporary cash investments.
G. Capital share transactions for each class of shares were:
| | | | |
| | | | Year Ended December 31, |
| | | 2010 | | 2009 |
| | Amount | Shares | Amount | Shares |
| | ($000) | (000) | ($000) | (000) |
| Investor Shares | | | | |
| Issued | 1,048,317 | 29,288 | 761,674 | 28,907 |
| Issued in Lieu of Cash Distributions | 28,559 | 691 | 41,348 | 1,267 |
| Redeemed | (2,966,817) | (79,368) | (693,832) | (26,523) |
| Net Increase (Decrease)—Investor Shares | (1,889,941) | (49,389) | 109,190 | 3,651 |
| Admiral Shares | | | | |
| Issued | 2,403,983 | 62,989 | 273,049 | 10,067 |
| Issued in Lieu of Cash Distributions | 43,659 | 1,057 | 22,579 | 699 |
| Redeemed | (337,340) | (9,418) | (285,715) | (11,344) |
| Net Increase (Decrease)—Admiral Shares | 2,110,302 | 54,628 | 9,913 | (578) |
| Signal Shares | | | | |
| Issued | 746,516 | 23,222 | 402,911 | 17,572 |
| Issued in Lieu of Cash Distributions | 17,061 | 482 | 17,903 | 645 |
| Redeemed | (722,773) | (23,810) | (433,580) | (18,677) |
| Net Increase (Decrease)—Signal Shares | 40,804 | (106) | (12,766) | (460) |
| Institutional Shares | | | | |
| Issued | 2,504,141 | 70,390 | 1,058,868 | 41,224 |
| Issued in Lieu of Cash Distributions | 60,682 | 1,471 | 38,283 | 1,185 |
| Redeemed | (1,571,201) | (41,938) | (995,321) | (37,183) |
| Net Increase (Decrease)—Institutional Shares | 993,622 | 29,923 | 101,830 | 5,226 |
| ETF Shares | | | | |
| Issued | 860,375 | 17,927 | 936,493 | 31,036 |
| Issued in Lieu of Cash Distributions | — | — | — | — |
| Redeemed | (754,992) | (15,600) | (866,266) | (28,200) |
| Net Increase (Decrease)—ETF Shares | 105,383 | 2,327 | 70,227 | 2,836 |
H. In preparing the financial statements as of December 31, 2010, management considered the impact of subsequent events for potential recognition or disclosure in these financial statements.
29
Mid-Cap Index Fund
Fund Profile
As of December 31, 2010
| | | | | | |
| Share-Class Characteristics | | | | | | |
| | Investor | Admiral | Signal | Institutional | Institutional | ETF |
| | Shares | Shares | Shares | Shares | Plus Shares | Shares |
| Ticker Symbol | VIMSX | VIMAX | VMISX | VMCIX | VMCPX | VO |
| Expense Ratio1 | 0.27% | 0.14% | 0.14% | 0.08% | 0.06% | 0.14% |
| 30-Day SEC Yield | 0.84% | 0.98% | 0.98% | 1.02% | — | 0.98% |
| | | |
| Portfolio Characteristics | | |
| | | MSCI US | DJ |
| | | Mid Cap | U.S. Total |
| | | 450 | Market |
| | Fund | Index | Index |
| Number of Stocks | 455 | 453 | 3,893 |
| Median Market Cap | $6.2B | $6.2B | $29.6B |
| Price/Earnings Ratio | 21.3x | 21.3x | 18.3x |
| Price/Book Ratio | 2.2x | 2.2x | 2.2x |
| Return on Equity | 14.1% | 14.1% | 18.8% |
| Earnings Growth Rate | 4.7% | 4.7% | 6.2% |
| Dividend Yield | 1.3% | 1.3% | 1.7% |
| Foreign Holdings | 0.0% | 0.0% | 0.0% |
| Turnover Rate | 16% | — | — |
| Short-Term Reserves | 0.3% | — | — |
| | |
| Volatility Measures | | |
| | | DJ |
| | MSCI US | U.S. Total |
| | Mid Cap 450 | Market |
| | Index | Index |
| R-Squared | 1.00 | 0.96 |
| Beta | 1.00 | 1.14 |
These measures show the degree and timing of the fund’s fluctuations compared with the indexes over 36 months.
| | |
| Ten Largest Holdings (% of total net assets) |
| Cameron International | Oil & Gas | |
| Corp. | Equipment & | |
| | Services | 0.5% |
| Host Hotels & Resorts | Specialized REITs | |
| Inc. | | 0.5 |
| SanDisk Corp. | Computer Storage | |
| | & Peripherals | 0.5 |
| Starwood Hotels & | Hotels, Resorts & | |
| Resorts Worldwide Inc. | Cruise Lines | 0.5 |
| Goodrich Corp. | Aerospace & | |
| | Defense | 0.5 |
| Consol Energy Inc. | Coal & Consumable | |
| | Fuels | 0.5 |
| Altera Corp. | Semiconductors | 0.5 |
| Dover Corp. | Industrial | |
| | Machinery | 0.5 |
| FMC Technologies Inc. | Oil & Gas | |
| | Equipment & | |
| | Services | 0.5 |
| Cliffs Natural Resources | Steel | |
| Inc. | | 0.5 |
| Top Ten | | 5.0% |
The holdings listed exclude any temporary cash investments and equity index products.
1 The expense ratios shown are from the prospectus dated December 13, 2010, for the Institutional and Institutional Plus share classes and April 29, 2010, for the Investor, Admiral, Signal, and ETF share classes and represent estimated costs for the current fiscal year. For the fiscal year ended December 31, 2010, the expense ratios were 0.26% for Investor Shares, 0.12% for Admiral Shares, 0.12% for Signal Shares, 0.08% for Institutional Shares, and 0.12% for ETF Shares. For the fiscal period ended December 31, 2010, the annualized expense ratio for the Mid-Cap Index Fund Institutional Plus Shares was 0.06%.
30
Mid-Cap Index Fund
| | | |
| Sector Diversification (% of equity exposure) |
| | | MSCI US | DJ |
| | | Mid Cap | U.S. Total |
| | | 450 | Market |
| | Fund | Index | Index |
| Consumer | | | |
| Discretionary | 16.7% | 16.7% | 11.9% |
| Consumer Staples | 4.3 | 4.3 | 9.5 |
| Energy | 9.6 | 9.6 | 10.6 |
| Financials | 17.9 | 18.0 | 16.6 |
| Health Care | 10.2 | 10.2 | 10.7 |
| Industrials | 12.0 | 12.0 | 11.4 |
| Information | | | |
| Technology | 14.9 | 14.9 | 18.9 |
| Materials | 6.9 | 6.8 | 4.5 |
| Telecommunication | | | |
| Services | 1.6 | 1.6 | 2.7 |
| Utilities | 5.9 | 5.9 | 3.2 |
Investment Focus
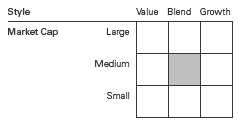
31
Mid-Cap Index Fund
Performance Summary
All of the returns in this report represent past performance, which is not a guarantee of future results that may be achieved by the fund. (Current performance may be lower or higher than the performance data cited. For performance data current to the most recent month-end, visit our website at vanguard.com/performance.) Note, too, that both investment returns and principal value can fluctuate widely, so an investor’s shares, when sold, could be worth more or less than their original cost. The returns shown do not reflect taxes that a shareholder would pay on fund distributions or on the sale of fund shares.
Cumulative Performance: December 31, 2000, Through December 31, 2010
Initial Investment of $10,000
| | | | | |
| | | Average Annual Total Returns | |
| | | Periods Ended December 31, 2010 | |
| | | | | | Final Value |
| | | One | Five | Ten | of a $10,000 |
| | | Year | Years | Years | Investment |
| | Mid-Cap Index Fund Investor Shares | 25.46% | 4.27% | 6.78% | $19,263 |
| •••••••• | Dow Jones U.S. Total Stock Market | | | | |
| | Index | 17.70 | 3.17 | 2.64 | 12,981 |
| – – – – | Spliced Mid-Cap Index | 25.69 | 4.42 | 6.84 | 19,386 |
| | Mid-Cap Core Funds Average | 23.29 | 4.06 | 4.92 | 16,172 |
Spliced Mid-Cap Index: S&P MidCap 400 Index through May 16, 2003; MSCI US Mid Cap 450 Index thereafter.
Mid-Cap Core Funds Average: Derived from data provided by Lipper Inc.
| | | | |
| | | | Since | Final Value |
| | One | Five | Inception | of a $10,000 |
| | Year | Years | (11/12/2001) | Investment |
| Mid-Cap Index Fund Admiral Shares | 25.59% | 4.39% | 8.52% | $21,106 |
| Dow Jones U.S. Total Stock Market | | | | |
| Index | 17.70 | 3.17 | 4.69 | 15,204 |
| Spliced Mid-Cap Index | 25.69 | 4.42 | 8.50 | 21,073 |
| "Since Inception" performance is calculated from the Admiral Shares’ inception date for both the fund and its comparative standards. |
See Financial Highlights for dividend and capital gains information.
32
Mid-Cap Index Fund
| | | |
| | Average Annual Total Returns | |
| | Periods Ended December 31, 2010 | |
| | | Since | Final Value |
| | One | Inception | of a $10,000 |
| | Year | (3/30/2007) | Investment |
| Mid-Cap Index Fund Signal Shares | 25.62% | 1.11% | $10,425 |
| Dow Jones U.S. Total Stock Market | | | |
| Index | 17.70 | -0.16 | 9,939 |
| MSCI US Mid Cap 450 Index | 25.69 | 1.13 | 10,432 |
| "Since Inception" performance is calculated from the Signal Shares’ inception date for both the fund and its comparative standards. |
| | | | |
| | | | | Final Value |
| | One | Five | Ten | of a $5,000,000 |
| | Year | Years | Years | Investment |
| Mid-Cap Index Fund Institutional | | | | |
| Shares | 25.67% | 4.44% | 6.94% | $9,777,705 |
| Dow Jones U.S. Total Stock Market | | | | |
| Index | 17.70 | 3.17 | 2.64 | 6,490,386 |
| Spliced Mid-Cap Index | 25.69 | 4.42 | 6.84 | 9,692,755 |
| | |
| | Since | Final Value |
| | Inception | of a $100,000,000 |
| | (12/15/2010) | Investment |
| Mid-Cap Index Fund Institutional | | |
| Plus Shares | 2.17% | $102,167,721 |
| Dow Jones U.S. Total Stock Market | | |
| Index | 2.04 | 102,035,222 |
| MSCI US Mid Cap 450 Index | 2.17 | 102,172,766 |
| "Since Inception" performance is calculated from the Institutional Plus Shares’ inception date for both the fund and its comparative standards. |
| | | | |
| | | | Since | Final Value |
| | One | Five | Inception | of a $10,000 |
| | Year | Years | (1/26/2004) | Investment |
| Mid-Cap Index Fund | | | | |
| ETF Shares Net Asset Value | 25.57% | 4.38% | 7.28% | $16,273 |
| Dow Jones U.S. Total Stock Market Index | 17.70 | 3.17 | 4.30 | 13,390 |
| MSCI US Mid Cap 450 Index | 25.69 | 4.42 | 7.31 | 16,306 |
| "Since Inception" performance is calculated from the ETF Shares’ inception date for both the fund and its comparative standards. |
33
Mid-Cap Index Fund
| | | |
| Cumulative Returns of ETF Shares: January 26, 2004, Through December 31, 2010 | |
| | | | Since |
| | One | Five | Inception |
| | Year | Years | (1/26/2004) |
| Mid-Cap Index Fund | | | |
| ETF Shares Market Price | 25.55% | 24.00% | 62.81% |
| Mid-Cap Index Fund | | | |
| ETF Shares Net Asset Value | 25.57 | 23.93 | 62.73 |
| MSCI US Mid Cap 450 Index | 25.69 | 24.13 | 63.06 |
| "Since Inception" performance is calculated from the ETF Shares’ inception date for both the fund and its comparative standard. | |
Fiscal-Year Total Returns (%): December 31, 2000, Through December 31, 2010
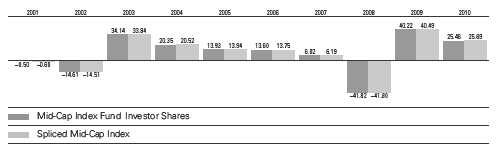
34
Mid-Cap Index Fund
Financial Statements
Statement of Net Assets
As of December 31, 2010
The fund reports a complete list of its holdings in regulatory filings four times in each fiscal year, at the quarter-ends. For the second and fourth fiscal quarters, the lists appear in the fund’s semiannual and annual reports to shareholders. For the first and third fiscal quarters, the fund files the lists with the Securities and Exchange Commission on Form N-Q. Shareholders can look up the fund’s Forms N-Q on the SEC’s website at sec.gov. Forms N-Q may also be reviewed and copied at the SEC’s Public Reference Room (see the back cover of this report for further information).
| | | |
| | | | Market |
| | | | Value |
| | | Shares | ($000) |
| Common Stocks (100.0%)1 | | |
| Consumer Discretionary (16.7%) | |
| | Starwood Hotels & | | |
| | Resorts Worldwide Inc. | 2,211,328 | 134,405 |
| | Fortune Brands Inc. | 1,772,031 | 106,765 |
| | Mattel Inc. | 4,183,932 | 106,397 |
| * | Liberty Media | | |
| | Corp. - Interactive | 6,616,203 | 104,338 |
| | Virgin Media Inc. | 3,667,482 | 99,902 |
| | Limited Brands Inc. | 3,215,005 | 98,797 |
| | Cablevision Systems | | |
| | Corp. Class A | 2,913,022 | 98,577 |
| * | O’Reilly Automotive Inc. | 1,613,932 | 97,514 |
| * | BorgWarner Inc. | 1,326,064 | 95,954 |
| | Harley-Davidson Inc. | 2,739,117 | 94,965 |
| | Genuine Parts Co. | 1,833,151 | 94,114 |
| | Tiffany & Co. | 1,478,861 | 92,089 |
| * | NetFlix Inc. | 517,538 | 90,931 |
| | Ross Stores Inc. | 1,420,015 | 89,816 |
| | Nordstrom Inc. | 2,038,582 | 86,395 |
| | Polo Ralph Lauren | | |
| | Corp. Class A | 756,391 | 83,899 |
| * | CarMax Inc. | 2,602,188 | 82,958 |
| * | Dollar Tree Inc. | 1,476,623 | 82,809 |
| | Autoliv Inc. | 1,029,150 | 81,241 |
| | Whirlpool Corp. | 883,876 | 78,515 |
| * | Chipotle Mexican Grill | | |
| | Inc. Class A | 361,818 | 76,944 |
| * | Royal Caribbean | | |
| | Cruises Ltd. | 1,626,356 | 76,439 |
| * | Sirius XM Radio Inc. | 45,229,424 | 74,176 |
| | Family Dollar Stores Inc. | 1,465,507 | 72,850 |
| | Darden Restaurants Inc. | 1,529,899 | 71,049 |
| | Hasbro Inc. | 1,463,659 | 69,055 |
| | Advance Auto Parts Inc. | 980,098 | 64,833 |
| * | TRW Automotive | | |
| | Holdings Corp. | 1,203,767 | 63,439 |
| | Wyndham | | |
| | Worldwide Corp. | 2,077,628 | 62,246 |
| | | |
| | | | Market |
| | | | Value |
| | | Shares | ($000) |
| | International Game | | |
| | Technology | 3,467,112 | 61,333 |
| * | Apollo Group Inc. Class A | 1,539,273 | 60,786 |
| | Expedia Inc. | 2,408,880 | 60,439 |
| * | Interpublic Group of | | |
| | Cos. Inc. | 5,685,442 | 60,379 |
| | Abercrombie & Fitch Co. | 1,026,313 | 59,146 |
| | Newell Rubbermaid Inc. | 3,236,869 | 58,846 |
| * | MGM Resorts | | |
| | International | 3,927,202 | 58,319 |
| * | Lear Corp. | 575,333 | 56,791 |
| * | Urban Outfitters Inc. | 1,564,130 | 56,012 |
| | PetSmart Inc. | 1,378,858 | 54,906 |
| | Scripps Networks | | |
| | Interactive Inc. Class A | 1,058,957 | 54,801 |
| * | Liberty Media | | |
| | Corp. - Capital | 838,374 | 52,449 |
| *,^ | Liberty Global Inc. Class A | 1,389,782 | 49,171 |
| | Phillips-Van Heusen Corp. | 771,196 | 48,593 |
| * | NVR Inc. | 64,642 | 44,669 |
| * | Fossil Inc. | 624,502 | 44,015 |
| * | Liberty Global Inc. | 1,268,771 | 42,999 |
| | H&R Block Inc. | 3,588,254 | 42,736 |
| | Gannett Co. Inc. | 2,774,698 | 41,870 |
| | DR Horton Inc. | 3,331,982 | 39,751 |
| * | Dick’s Sporting Goods Inc. | 1,056,591 | 39,622 |
| | Leggett & Platt Inc. | 1,703,168 | 38,764 |
| * | Mohawk Industries Inc. | 678,055 | 38,486 |
| * | GameStop Corp. Class A | 1,661,173 | 38,008 |
| * | Liberty Media Corp. - Starz | 568,897 | 37,820 |
| * | Harman International | | |
| | Industries Inc. | 808,791 | 37,447 |
| * | LKQ Corp. | 1,581,728 | 35,937 |
| | Foot Locker Inc. | 1,816,691 | 35,643 |
| | DeVry Inc. | 740,421 | 35,525 |
| | Guess? Inc. | 704,711 | 33,347 |
| | Lennar Corp. Class A | 1,723,424 | 32,314 |
| * | Goodyear Tire & | | |
| | Rubber Co. | 2,684,091 | 31,806 |
35
Mid-Cap Index Fund
| | | |
| | | | Market |
| | | | Value |
| | | Shares | ($000) |
| | American Eagle | | |
| | Outfitters Inc. | 2,160,542 | 31,609 |
| * | Toll Brothers Inc. | 1,635,523 | 31,075 |
| | Washington Post Co. | | |
| | Class B | 68,697 | 30,192 |
| * | Pulte Group Inc. | 4,005,972 | 30,125 |
| * | Penn National Gaming Inc. | 769,879 | 27,061 |
| * | Lamar Advertising Co. | | |
| | Class A | 672,994 | 26,812 |
| * | ITT Educational | | |
| | Services Inc. | 390,637 | 24,880 |
| | Brinker International Inc. | 1,181,273 | 24,665 |
| ^ | Strayer Education Inc. | 161,451 | 24,576 |
| * | Hyatt Hotels Corp. Class A | 512,275 | 23,442 |
| | Wendy’s/Arby’s | | |
| | Group Inc. Class A | 3,910,240 | 18,065 |
| | CTC Media Inc. | 638,521 | 14,961 |
| *,^ | AutoNation Inc. | 513,259 | 14,474 |
| * | Clear Channel Outdoor | | |
| | Holdings Inc. Class A | 478,779 | 6,722 |
| | Lennar Corp. Class B | 63,528 | 989 |
| * | Krispy Kreme | | |
| | Doughnuts Inc. | | |
| | Warrants Exp. 03/02/2012 | 8,389 | 3 |
| | | | 4,343,793 |
| Consumer Staples (4.3%) | | |
| | Bunge Ltd. | 1,549,983 | 101,555 |
| | Coca-Cola Enterprises Inc. | 3,985,212 | 99,750 |
| | Dr Pepper Snapple | | |
| | Group Inc. | 2,778,176 | 97,681 |
| | JM Smucker Co. | 1,389,550 | 91,224 |
| * | Whole Foods Market Inc. | 1,699,392 | 85,972 |
| | McCormick & Co. Inc. | 1,404,232 | 65,339 |
| | Tyson Foods Inc. Class A | 3,396,862 | 58,494 |
| | Church & Dwight Co. Inc. | 825,861 | 57,001 |
| * | Energizer Holdings Inc. | 775,499 | 56,534 |
| * | Constellation Brands Inc. | | |
| | Class A | 2,177,534 | 48,232 |
| | Herbalife Ltd. | 688,376 | 47,064 |
| * | Hansen Natural Corp. | 871,562 | 45,565 |
| | Hormel Foods Corp. | 852,266 | 43,687 |
| * | Green Mountain Coffee | | |
| | Roasters Inc. | 1,304,359 | 42,861 |
| * | Ralcorp Holdings Inc. | 638,548 | 41,512 |
| | Alberto-Culver Co. Class B | 1,032,609 | 38,248 |
| * | Smithfield Foods Inc. | 1,737,725 | 35,849 |
| | Flowers Foods Inc. | 962,013 | 25,888 |
| | SUPERVALU Inc. | 2,480,635 | 23,889 |
| * | Dean Foods Co. | 2,129,392 | 18,824 |
| | | | 1,125,169 |
| Energy (9.6%) | | |
| * | Cameron International | | |
| | Corp. | 2,817,142 | 142,914 |
| | Consol Energy Inc. | 2,626,254 | 128,004 |
| * | FMC Technologies Inc. | 1,395,756 | 124,097 |
| | | |
| | | | Market |
| | | | Value |
| | | Shares | ($000) |
| | Pioneer Natural | | |
| | Resources Co. | 1,349,142 | 117,133 |
| | El Paso Corp. | 8,188,467 | 112,673 |
| * | Newfield Exploration Co. | 1,553,904 | 112,052 |
| * | Concho Resources Inc. | 1,014,774 | 88,965 |
| | Cimarex Energy Co. | 978,033 | 86,585 |
| * | Denbury Resources Inc. | 4,411,807 | 84,221 |
| * | Alpha Natural | | |
| | Resources Inc. | 1,400,066 | 84,046 |
| | Range Resources Corp. | 1,861,256 | 83,719 |
| * | Nabors Industries Ltd. | 3,317,951 | 77,839 |
| | QEP Resources Inc. | 2,036,999 | 73,963 |
| | EQT Corp. | 1,647,778 | 73,886 |
| * | Whiting Petroleum Corp. | 593,117 | 69,507 |
| * | Pride International Inc. | 2,042,948 | 67,417 |
| | Arch Coal Inc. | 1,889,760 | 66,255 |
| * | Petrohawk Energy Corp. | 3,516,695 | 64,180 |
| * | Kinder Morgan | | |
| | Management LLC | 944,799 | 63,188 |
| | Massey Energy Co. | 1,128,154 | 60,526 |
| | Helmerich & Payne Inc. | 1,230,689 | 59,664 |
| | Sunoco Inc. | 1,402,351 | 56,529 |
| * | McDermott | | |
| | International Inc. | 2,701,313 | 55,890 |
| * | Plains Exploration & | | |
| | Production Co. | 1,629,451 | 52,371 |
| * | Forest Oil Corp. | 1,252,151 | 47,544 |
| * | Rowan Cos. Inc. | 1,333,213 | 46,543 |
| * | Oceaneering | | |
| | International Inc. | 629,663 | 46,362 |
| | Core Laboratories NV | 519,601 | 46,271 |
| | Cabot Oil & Gas Corp. | 1,211,082 | 45,839 |
| | EXCO Resources Inc. | 2,102,316 | 40,827 |
| * | Dresser-Rand Group Inc. | 941,327 | 40,091 |
| | Patterson-UTI Energy Inc. | 1,792,764 | 38,634 |
| | Southern Union Co. | 1,375,419 | 33,106 |
| | Tidewater Inc. | 597,753 | 32,183 |
| * | Tesoro Corp. | 1,659,787 | 30,772 |
| * | Continental Resources Inc. | 395,239 | 23,260 |
| * | Quicksilver Resources Inc. | 1,394,369 | 20,553 |
| * | Cobalt International | | |
| | Energy Inc. | 1,040,585 | 12,706 |
| | | | 2,510,315 |
| Financials (18.0%) | | |
| | Host Hotels & Resorts Inc. | 7,708,979 | 137,759 |
| | Discover Financial | | |
| | Services | 6,327,775 | 117,254 |
| | AvalonBay | | |
| | Communities Inc. | 990,516 | 111,483 |
| * | CIT Group Inc. | 2,212,740 | 104,220 |
| | Lincoln National Corp. | 3,683,966 | 102,451 |
| | Regions Financial Corp. | 14,608,068 | 102,256 |
| | Ventas Inc. | 1,826,945 | 95,878 |
| | ProLogis | 6,478,648 | 93,552 |
| | Unum Group | 3,800,822 | 92,056 |
36
Mid-Cap Index Fund
| | | |
| | | | Market |
| | | | Value |
| | | Shares | ($000) |
| | New York Community | | |
| | Bancorp Inc. | 4,812,548 | 90,717 |
| | KeyCorp | 10,238,698 | 90,612 |
| * | IntercontinentalExchange | | |
| | Inc. | 732,005 | 87,218 |
| | XL Group plc Class A | 3,977,912 | 86,798 |
| | Comerica Inc. | 2,050,730 | 86,623 |
| | Kimco Realty Corp. | 4,720,223 | 85,153 |
| * | American International | | |
| | Group Inc. | 1,414,455 | 81,501 |
| | Health Care REIT Inc. | 1,686,557 | 80,348 |
| * | Genworth Financial Inc. | | |
| | Class A | 5,691,483 | 74,786 |
| | Macerich Co. | 1,513,198 | 71,680 |
| * | SLM Corp. | 5,649,282 | 71,124 |
| | Plum Creek | | |
| | Timber Co. Inc. | 1,879,559 | 70,389 |
| * | CB Richard Ellis | | |
| | Group Inc. Class A | 3,368,253 | 68,982 |
| | Huntington | | |
| | Bancshares Inc. | 10,040,306 | 68,977 |
| | Willis Group Holdings plc | 1,980,426 | 68,582 |
| | PartnerRe Ltd. | 835,168 | 67,106 |
| | Leucadia National Corp. | 2,264,002 | 66,064 |
| | Legg Mason Inc. | 1,798,588 | 65,235 |
| | AMB Property Corp. | 1,957,240 | 62,064 |
| | SL Green Realty Corp. | 909,644 | 61,410 |
| | People’s United | | |
| | Financial Inc. | 4,313,748 | 60,436 |
| * | Affiliated Managers | | |
| | Group Inc. | 594,244 | 58,961 |
| | Cincinnati Financial Corp. | 1,797,364 | 56,958 |
| | Torchmark Corp. | 940,061 | 56,159 |
| | Federal Realty | | |
| | Investment Trust | 714,266 | 55,663 |
| | Everest Re Group Ltd. | 654,100 | 55,481 |
| | Nationwide Health | | |
| | Properties Inc. | 1,439,400 | 52,365 |
| | Digital Realty Trust Inc. | 1,015,397 | 52,334 |
| * | MSCI Inc. Class A | 1,312,378 | 51,130 |
| * | Arch Capital Group Ltd. | 577,728 | 50,869 |
| | UDR Inc. | 2,086,338 | 49,071 |
| | Rayonier Inc. | 933,345 | 49,019 |
| | Zions Bancorporation | 2,016,013 | 48,848 |
| | Chimera Investment Corp. | 11,725,877 | 48,193 |
| | Assurant Inc. | 1,239,158 | 47,732 |
| | Axis Capital Holdings Ltd. | 1,325,637 | 47,564 |
| | Realty Income Corp. | 1,361,890 | 46,577 |
| | Alexandria Real Estate | | |
| | Equities Inc. | 629,556 | 46,121 |
| | Reinsurance Group of | | |
| | America Inc. Class A | 850,811 | 45,697 |
| | WR Berkley Corp. | 1,553,729 | 42,541 |
| | Liberty Property Trust | 1,322,949 | 42,229 |
| | | |
| | | | Market |
| | | | Value |
| | | Shares | ($000) |
| | Jones Lang LaSalle Inc. | 495,812 | 41,609 |
| | Eaton Vance Corp. | 1,374,103 | 41,539 |
| * | Markel Corp. | 107,949 | 40,819 |
| | RenaissanceRe | | |
| | Holdings Ltd. | 638,017 | 40,635 |
| | Marshall & Ilsley Corp. | 5,829,735 | 40,342 |
| | Regency Centers Corp. | 952,069 | 40,215 |
| | Old Republic | | |
| | International Corp. | 2,859,697 | 38,978 |
| | Cullen/Frost Bankers Inc. | 635,081 | 38,816 |
| | HCC Insurance | | |
| | Holdings Inc. | 1,339,802 | 38,774 |
| | Transatlantic Holdings Inc. | 741,341 | 38,268 |
| | Raymond James | | |
| | Financial Inc. | 1,156,123 | 37,805 |
| | SEI Investments Co. | 1,534,532 | 36,507 |
| | Duke Realty Corp. | 2,925,828 | 36,456 |
| * | NASDAQ OMX Group Inc. | 1,532,445 | 36,334 |
| * | First Horizon | | |
| | National Corp. | 3,033,999 | 35,741 |
| | Jefferies Group Inc. | 1,297,915 | 34,563 |
| | Fidelity National | | |
| | Financial Inc. Class A | 2,521,106 | 34,489 |
| | Commerce | | |
| | Bancshares Inc. | 865,418 | 34,383 |
| | Brown & Brown Inc. | 1,405,574 | 33,649 |
| | City National Corp. | 545,294 | 33,459 |
| | Hospitality | | |
| | Properties Trust | 1,435,055 | 33,064 |
| | Assured Guaranty Ltd. | 1,816,397 | 32,150 |
| | Weingarten | | |
| | Realty Investors | 1,330,102 | 31,603 |
| | White Mountains | | |
| | Insurance Group Ltd. | 88,597 | 29,733 |
| | Associated Banc-Corp | 1,911,113 | 28,953 |
| | American Financial | | |
| | Group Inc. | 882,389 | 28,492 |
| ^ | Federated Investors | | |
| | Inc. Class B | 1,078,591 | 28,227 |
| | Janus Capital Group Inc. | 2,135,868 | 27,702 |
| | Greenhill & Co. Inc. | 291,296 | 23,793 |
| *,^ | St. Joe Co. | 1,078,079 | 23,556 |
| | Piedmont Office Realty | | |
| | Trust Inc. Class A | 1,090,452 | 21,962 |
| | Validus Holdings Ltd. | 710,013 | 21,733 |
| | Capitol Federal | | |
| | Financial Inc. | 1,665,464 | 19,836 |
| | BOK Financial Corp. | 318,757 | 17,022 |
| | Mercury General Corp. | 320,202 | 13,772 |
| | TFS Financial Corp. | 1,080,987 | 9,750 |
| * | LPL Investment | | |
| | Holdings Inc. | 188,059 | 6,840 |
| ^ | CBOE Holdings Inc. | 149,463 | 3,417 |
| | | | 4,681,212 |
37
Mid-Cap Index Fund
| | | |
| | | | Market |
| | | | Value |
| | | Shares | ($000) |
| Health Care (10.2%) | | |
| * | Life Technologies Corp. | 2,132,214 | 118,338 |
| | AmerisourceBergen | | |
| | Corp. Class A | 3,243,148 | 110,656 |
| * | Hospira Inc. | 1,945,934 | 108,369 |
| * | Humana Inc. | 1,968,333 | 107,747 |
| * | Edwards | | |
| | Lifesciences Corp. | 1,318,385 | 106,578 |
| * | Varian Medical | | |
| | Systems Inc. | 1,414,597 | 98,003 |
| * | Illumina Inc. | 1,445,564 | 91,562 |
| * | Alexion | | |
| | Pharmaceuticals Inc. | 1,048,254 | 84,437 |
| * | Waters Corp. | 1,070,499 | 83,189 |
| * | DaVita Inc. | 1,193,292 | 82,922 |
| * | Vertex | | |
| | Pharmaceuticals Inc. | 2,359,144 | 82,641 |
| * | Watson | | |
| | Pharmaceuticals Inc. | 1,541,041 | 79,595 |
| * | Cerner Corp. | 815,382 | 77,249 |
| * | Mylan Inc. | 3,598,186 | 76,030 |
| * | CareFusion Corp. | 2,586,192 | 66,465 |
| * | Henry Schein Inc. | 1,064,412 | 65,344 |
| * | ResMed Inc. | 1,760,477 | 60,983 |
| | Perrigo Co. | 959,754 | 60,781 |
| | Beckman Coulter Inc. | 805,324 | 60,585 |
| * | Mettler-Toledo | | |
| | International Inc. | 388,522 | 58,748 |
| * | Dendreon Corp. | 1,674,651 | 58,479 |
| * | Hologic Inc. | 3,014,101 | 56,725 |
| * | Cephalon Inc. | 874,559 | 53,978 |
| | DENTSPLY | | |
| | International Inc. | 1,578,093 | 53,924 |
| * | Human Genome | | |
| | Sciences Inc. | 2,188,356 | 52,280 |
| * | Endo Pharmaceuticals | | |
| | Holdings Inc. | 1,342,367 | 47,936 |
| * | IDEXX Laboratories Inc. | 671,163 | 46,458 |
| * | Coventry Health Care Inc. | 1,725,836 | 45,562 |
| | Universal Health Services | | |
| | Inc. Class B | 1,045,054 | 45,376 |
| * | Community Health | | |
| | Systems Inc. | 1,097,842 | 41,026 |
| * | King Pharmaceuticals Inc. | 2,903,758 | 40,798 |
| * | Covance Inc. | 753,155 | 38,720 |
| | Pharmaceutical Product | | |
| | Development Inc. | 1,312,763 | 35,628 |
| | Omnicare Inc. | 1,374,283 | 34,893 |
| * | Alere Inc. | 936,896 | 34,290 |
| | Patterson Cos. Inc. | 1,081,448 | 33,125 |
| * | Gen-Probe Inc. | 566,089 | 33,031 |
| * | Kinetic Concepts Inc. | 751,992 | 31,493 |
| | Lincare Holdings Inc. | 1,140,767 | 30,607 |
| | Warner Chilcott plc | | |
| | Class A | 1,320,036 | 29,780 |
| | | |
| | | | Market |
| | | | Value |
| | | Shares | ($000) |
| * | Charles River Laboratories | | |
| | International Inc. | 770,560 | 27,386 |
| | Techne Corp. | 409,295 | 26,878 |
| * | Myriad Genetics Inc. | 1,094,081 | 24,989 |
| * | Amylin | | |
| | Pharmaceuticals Inc. | 1,670,878 | 24,579 |
| * | Bio-Rad Laboratories Inc. | | |
| | Class A | 222,901 | 23,148 |
| | | | 2,651,311 |
| Industrials (12.0%) | | |
| | Goodrich Corp. | 1,457,111 | 128,328 |
| | Dover Corp. | 2,171,027 | 126,897 |
| | Rockwell Automation Inc. | 1,649,931 | 118,317 |
| | Cooper Industries plc | 1,939,393 | 113,047 |
| | Joy Global Inc. | 1,200,035 | 104,103 |
| | WW Grainger Inc. | 701,478 | 96,881 |
| | Fastenal Co. | 1,543,285 | 92,458 |
| * | United Continental | | |
| | Holdings Inc. | 3,675,864 | 87,559 |
| | Roper Industries Inc. | 1,095,326 | 83,716 |
| | Bucyrus International | | |
| | Inc. Class A | 895,057 | 80,018 |
| | Flowserve Corp. | 650,570 | 77,561 |
| * | Stericycle Inc. | 942,462 | 76,264 |
| | Textron Inc. | 3,189,334 | 75,396 |
| | AMETEK Inc. | 1,858,090 | 72,930 |
| | Pall Corp. | 1,356,921 | 67,276 |
| * | Jacobs Engineering | | |
| | Group Inc. | 1,462,343 | 67,048 |
| | Manpower Inc. | 956,469 | 60,028 |
| | Pitney Bowes Inc. | 2,404,042 | 58,130 |
| * | Kansas City Southern | 1,192,766 | 57,086 |
| | KBR Inc. | 1,817,561 | 55,381 |
| * | AGCO Corp. | 1,082,015 | 54,815 |
| | Masco Corp. | 4,185,929 | 52,994 |
| | Iron Mountain Inc. | 2,109,362 | 52,755 |
| | Equifax Inc. | 1,453,994 | 51,762 |
| * | Foster Wheeler AG | 1,483,107 | 51,197 |
| | Robert Half | | |
| | International Inc. | 1,630,719 | 49,900 |
| | Donaldson Co. Inc. | 844,138 | 49,196 |
| * | Quanta Services Inc. | 2,448,791 | 48,780 |
| | Avery Dennison Corp. | 1,150,500 | 48,712 |
| | Dun & Bradstreet Corp. | 582,078 | 47,783 |
| | Timken Co. | 956,384 | 45,648 |
| * | Verisk Analytics Inc. | | |
| | Class A | 1,314,941 | 44,813 |
| | Cintas Corp. | 1,600,160 | 44,740 |
| | JB Hunt Transport | | |
| | Services Inc. | 1,075,575 | 43,894 |
| * | Navistar International Corp. | 749,408 | 43,398 |
| | RR Donnelley & Sons Co. | 2,399,365 | 41,917 |
| | Pentair Inc. | 1,147,907 | 41,910 |
| * | Owens Corning | 1,343,163 | 41,840 |
| | SPX Corp. | 581,288 | 41,556 |
38
Mid-Cap Index Fund
| | | |
| | | | Market |
| | | | Value |
| | | Shares | ($000) |
| * | URS Corp. | 974,388 | 40,544 |
| * | Terex Corp. | 1,264,240 | 39,242 |
| * | IHS Inc. Class A | 484,408 | 38,942 |
| * | Hertz Global Holdings Inc. | 2,635,992 | 38,196 |
| * | Babcock & Wilcox Co. | 1,351,737 | 34,591 |
| * | Shaw Group Inc. | 982,094 | 33,617 |
| | MSC Industrial Direct Co. | | |
| | Class A | 518,783 | 33,560 |
| | Ryder System Inc. | 609,598 | 32,089 |
| | Towers Watson & Co. | | |
| | Class A | 598,584 | 31,162 |
| * | Copart Inc. | 833,712 | 31,139 |
| * | Aecom Technology Corp. | 1,080,532 | 30,223 |
| * | Alliant Techsystems Inc. | 386,017 | 28,731 |
| | Harsco Corp. | 935,898 | 26,505 |
| | Covanta Holding Corp. | 1,539,393 | 26,462 |
| * | Spirit Aerosystems | | |
| | Holdings Inc. Class A | 1,242,906 | 25,865 |
| * | Sensata Technologies | | |
| | Holding NV | 709,636 | 21,367 |
| * | FTI Consulting Inc. | 547,875 | 20,425 |
| | | | 3,128,694 |
| Information Technology (14.9%) | |
| * | SanDisk Corp. | 2,710,908 | 135,166 |
| | Altera Corp. | 3,573,323 | 127,139 |
| * | F5 Networks Inc. | 935,867 | 121,813 |
| | Amphenol Corp. Class A | 2,020,540 | 106,644 |
| * | Fiserv Inc. | 1,745,838 | 102,236 |
| * | Autodesk Inc. | 2,643,567 | 100,984 |
| * | Red Hat Inc. | 2,197,528 | 100,317 |
| * | Akamai Technologies Inc. | 2,112,239 | 99,381 |
| * | BMC Software Inc. | 2,077,619 | 97,939 |
| * | Western Digital Corp. | 2,667,253 | 90,420 |
| | Linear Technology Corp. | 2,610,507 | 90,297 |
| | Computer Sciences Corp. | 1,795,650 | 89,064 |
| | Xilinx Inc. | 3,010,410 | 87,242 |
| * | Micron Technology Inc. | 10,407,001 | 83,464 |
| * | Seagate Technology plc | 5,487,609 | 82,479 |
| | Maxim Integrated | | |
| | Products Inc. | 3,469,877 | 81,959 |
| * | McAfee Inc. | 1,768,755 | 81,911 |
| * | Teradata Corp. | 1,945,814 | 80,090 |
| * | Cree Inc. | 1,194,037 | 78,675 |
| | KLA-Tencor Corp. | 1,952,024 | 75,426 |
| * | Lam Research Corp. | 1,444,210 | 74,781 |
| * | Rovi Corp. | 1,199,701 | 74,394 |
| | Microchip Technology Inc. | 2,162,575 | 73,982 |
| * | Flextronics | | |
| | International Ltd. | 9,135,692 | 71,715 |
| * | SAIC Inc. | 4,419,734 | 70,097 |
| | Harris Corp. | 1,500,870 | 67,989 |
| | VeriSign Inc. | 2,025,266 | 66,165 |
| * | Atmel Corp. | 5,368,087 | 66,135 |
| * | Electronic Arts Inc. | 3,841,599 | 62,925 |
| * | Skyworks Solutions Inc. | 2,077,633 | 59,483 |
| | | |
| | | | Market |
| | | | Value |
| | | Shares | ($000) |
| * | Avnet Inc. | 1,766,127 | 58,335 |
| * | Trimble Navigation Ltd. | 1,385,934 | 55,340 |
| * | ANSYS Inc. | 1,052,685 | 54,813 |
| * | FLIR Systems Inc. | 1,838,909 | 54,708 |
| * | Advanced Micro | | |
| | Devices Inc. | 6,668,953 | 54,552 |
| * | Nuance | | |
| | Communications Inc. | 2,734,547 | 49,714 |
| * | ON Semiconductor Corp. | 5,014,294 | 49,541 |
| | Factset Research | | |
| | Systems Inc. | 511,874 | 47,993 |
| * | Arrow Electronics Inc. | 1,370,294 | 46,933 |
| * | Synopsys Inc. | 1,715,911 | 46,175 |
| | Jabil Circuit Inc. | 2,276,358 | 45,732 |
| * | LSI Corp. | 7,465,083 | 44,716 |
| | Avago Technologies Ltd. | 1,535,051 | 43,703 |
| * | Alliance Data | | |
| | Systems Corp. | 612,071 | 43,475 |
| * | Equinix Inc. | 530,188 | 43,083 |
| | Global Payments Inc. | 927,119 | 42,842 |
| * | Dolby Laboratories Inc. | | |
| | Class A | 617,974 | 41,219 |
| | National Semiconductor | | |
| | Corp. | 2,786,136 | 38,337 |
| * | Ingram Micro Inc. | 1,822,274 | 34,787 |
| * | Novellus Systems Inc. | 1,068,944 | 34,548 |
| | Broadridge Financial | | |
| | Solutions Inc. | 1,473,911 | 32,323 |
| | Lender Processing | | |
| | Services Inc. | 1,082,476 | 31,955 |
| * | Lexmark International Inc. | | |
| | Class A | 913,273 | 31,800 |
| * | IAC/InterActiveCorp | 1,067,560 | 30,639 |
| | Total System Services Inc. | 1,951,557 | 30,015 |
| * | MEMC Electronic | | |
| | Materials Inc. | 2,644,868 | 29,781 |
| * | AOL Inc. | 1,241,401 | 29,434 |
| | Tellabs Inc. | 4,214,037 | 28,571 |
| * | Brocade Communications | | |
| | Systems Inc. | 5,165,953 | 27,328 |
| | Molex Inc. | 858,143 | 19,497 |
| | DST Systems Inc. | 437,241 | 19,392 |
| * | Genpact Ltd. | 1,154,407 | 17,547 |
| | Molex Inc. Class A | 732,676 | 13,826 |
| | | | 3,872,966 |
| Materials (6.8%) | | |
| | Cliffs Natural | | |
| | Resources Inc. | 1,575,254 | 122,886 |
| | CF Industries Holdings Inc. | 826,701 | 111,729 |
| | United States Steel Corp. | 1,669,806 | 97,550 |
| | Sigma-Aldrich Corp. | 1,411,055 | 93,920 |
| | Lubrizol Corp. | 785,032 | 83,904 |
| | Walter Energy Inc. | 615,469 | 78,682 |
| | Celanese Corp. Class A | 1,815,368 | 74,739 |
| | Eastman Chemical Co. | 840,210 | 70,645 |
39
Mid-Cap Index Fund
| | | |
| | | | Market |
| | | | Value |
| | | Shares | ($000) |
| | Ball Corp. | 1,011,796 | 68,853 |
| | Vulcan Materials Co. | 1,491,871 | 66,179 |
| | FMC Corp. | 800,808 | 63,976 |
| * | Crown Holdings Inc. | 1,885,933 | 62,952 |
| * | Owens-Illinois Inc. | 1,902,196 | 58,397 |
| | Airgas Inc. | 924,442 | 57,741 |
| | Allegheny | | |
| | Technologies Inc. | 1,031,779 | 56,934 |
| | Albemarle Corp. | 955,570 | 53,302 |
| | MeadWestvaco Corp. | 1,986,524 | 51,967 |
| | International Flavors & | | |
| | Fragrances Inc. | 928,749 | 51,629 |
| | Nalco Holding Co. | 1,608,323 | 51,370 |
| ^ | Martin Marietta | | |
| | Materials Inc. | 529,407 | 48,832 |
| | Sealed Air Corp. | 1,856,289 | 47,242 |
| | Ashland Inc. | 869,822 | 44,239 |
| | Steel Dynamics Inc. | 2,395,795 | 43,843 |
| | Reliance Steel & | | |
| | Aluminum Co. | 820,518 | 41,928 |
| | Bemis Co. Inc. | 1,269,277 | 41,455 |
| | Sonoco Products Co. | 1,170,686 | 39,417 |
| | Valspar Corp. | 1,097,564 | 37,844 |
| | Scotts Miracle-Gro Co. | | |
| | Class A | 545,125 | 27,676 |
| * | Titanium Metals Corp. | 1,053,433 | 18,098 |
| | Greif Inc. Class A | 288,557 | 17,862 |
| | | | 1,785,791 |
| Telecommunication Services (1.6%) | |
| | Frontier | | |
| | Communications Corp. | 11,535,856 | 112,244 |
| * | NII Holdings Inc. | 1,958,891 | 87,484 |
| | Windstream Corp. | 5,619,709 | 78,339 |
| * | SBA Communications | | |
| | Corp. Class A | 1,266,577 | 51,854 |
| * | MetroPCS | | |
| | Communications Inc. | 2,881,142 | 36,389 |
| | Telephone & Data | | |
| | Systems Inc. | 526,402 | 19,240 |
| | Telephone & Data | | |
| | Systems Inc. - Special | | |
| | Common Shares | 572,274 | 18,038 |
| * | United States Cellular Corp. | 217,453 | 10,859 |
| *,^ | Clearwire Corp. Class A | 1,697,749 | 8,743 |
| | | | 423,190 |
| Utilities (5.9%) | | |
| | DTE Energy Co. | 1,963,234 | 88,974 |
| | Wisconsin Energy Corp. | 1,359,581 | 80,025 |
| | Ameren Corp. | 2,782,387 | 78,435 |
| | CenterPoint Energy Inc. | 4,659,704 | 73,251 |
| | Constellation Energy | | |
| | Group Inc. | 2,231,526 | 68,352 |
| | Northeast Utilities | 2,048,731 | 65,314 |
| | Oneok Inc. | 1,175,813 | 65,222 |
| | | |
| | | | Market |
| | | | Value |
| | | Shares | ($000) |
| * | NRG Energy Inc. | 2,944,742 | 57,540 |
| | NiSource Inc. | 3,233,110 | 56,967 |
| | SCANA Corp. | 1,399,034 | 56,801 |
| * | Calpine Corp. | 4,136,720 | 55,184 |
| | National Fuel Gas Co. | 810,336 | 53,174 |
| | Pinnacle West | | |
| | Capital Corp. | 1,263,535 | 52,373 |
| | OGE Energy Corp. | 1,132,476 | 51,573 |
| | American Water | | |
| | Works Co. Inc. | 2,032,758 | 51,408 |
| | NSTAR | 1,204,739 | 50,828 |
| | CMS Energy Corp. | 2,677,106 | 49,794 |
| | Allegheny Energy Inc. | 1,972,715 | 47,819 |
| | Pepco Holdings Inc. | 2,603,948 | 47,522 |
| | Alliant Energy Corp. | 1,288,581 | 47,381 |
| | Integrys Energy Group Inc. | 898,250 | 43,574 |
| | TECO Energy Inc. | 2,371,008 | 42,204 |
| | MDU Resources | | |
| | Group Inc. | 2,079,023 | 42,142 |
| | UGI Corp. | 1,278,681 | 40,381 |
| | NV Energy Inc. | 2,734,429 | 38,419 |
| | Energen Corp. | 794,128 | 38,325 |
| | Aqua America Inc. | 1,596,353 | 35,886 |
| | DPL Inc. | 1,383,373 | 35,566 |
| | AGL Resources Inc. | 906,379 | 32,494 |
| | | | 1,546,928 |
| Total Common Stocks | | |
| (Cost $20,955,280) | | 26,069,369 |
| Temporary Cash Investments (0.6%)1 | |
| Money Market Fund (0.6%) | | |
| 2,3 | Vanguard Market | | |
| | Liquidity Fund, 0.211% | 154,634,142 | 154,634 |
| |
| | | Face | |
| | | Amount | |
| | | ($000) | |
| U.S. Government and Agency Obligations (0.0%) |
| 4,5 | Federal Home Loan | | |
| | Bank Discount Notes, | | |
| | 0.240%, 3/4/11 | 400 | 400 |
| Total Temporary Cash Investments | |
| (Cost $155,034) | | 155,034 |
| Total Investments (100.6%) | | |
| (Cost $21,110,314) | | 26,224,403 |
| Other Assets and Liabilities (-0.6%) | |
| Other Assets | | 231,945 |
| Liabilities3 | | (396,716) |
| | | | (164,771) |
| Net Assets (100%) | | 26,059,632 |
40
Mid-Cap Index Fund
| |
| At December 31, 2010, net assets consisted of: |
| | Amount |
| | ($000) |
| Paid-in Capital | 24,917,840 |
| Overdistributed Net Investment Income | (27,251) |
| Accumulated Net Realized Losses | (3,945,095) |
| Unrealized Appreciation (Depreciation) | |
| Investment Securities | 5,114,089 |
| Futures Contracts | 49 |
| Net Assets | 26,059,632 |
| |
| Investor Shares—Net Assets | |
| Applicable to 275,864,817 outstanding | |
| $.001 par value shares of beneficial | |
| interest (unlimited authorization) | 5,601,976 |
| Net Asset Value Per Share— | |
| Investor Shares | $20.31 |
| |
| Admiral Shares—Net Assets | |
| Applicable to 65,484,548 outstanding | |
| $.001 par value shares of beneficial | |
| interest (unlimited authorization) | 6,035,578 |
| Net Asset Value Per Share— | |
| Admiral Shares | $92.17 |
| |
| |
| Signal Shares—Net Assets | |
| Applicable to 97,333,063 outstanding | |
| $.001 par value shares of beneficial | |
| interest (unlimited authorization) | 2,830,980 |
| Net Asset Value Per Share— | |
| Signal Shares | $29.09 |
| |
| Institutional Shares—Net Assets | |
| Applicable to 382,892,369 outstanding | |
| $.001 par value shares of beneficial | |
| interest (unlimited authorization) | 7,795,102 |
| Net Asset Value Per Share— | |
| Institutional Shares | $20.36 |
| |
| Institutional Plus Shares—Net Assets | |
| Applicable to 4,379,095 outstanding | |
| $.001 par value shares of beneficial | |
| interest (unlimited authorization) | 439,670 |
| Net Asset Value Per Share— | |
| Institutional Plus Shares | $100.40 |
| |
| ETF Shares—Net Assets | |
| Applicable to 45,097,980 outstanding | |
| $.001 par value shares of beneficial | |
| interest (unlimited authorization) | 3,356,326 |
| Net Asset Value Per Share— | |
| ETF Shares | $74.42 |
See Note A in Notes to Financial Statements.
* Non-income-producing security.
^ Part of security position is on loan to broker-dealers. The total value of securities on loan is $78,808,000.
1 The fund invests a portion of its cash reserves in equity markets through the use of index futures contracts. After giving effect to futures investments, the fund’s effective common stock and temporary cash investment positions represent 100.0% and 0.6%, respectively, of net assets.
2 Affiliated money market fund available only to Vanguard funds and certain trusts and accounts managed by Vanguard. Rate shown is the 7-day yield.
3 Includes $82,253,000 of collateral received for securities on loan.
4 The issuer operates under a congressional charter; its securities are not backed by the full faith and credit of the U.S. government.
5 Securities with a value of $400,000 have been segregated as initial margin for open futures contracts.
REIT—Real Estate Investment Trust.
See accompanying Notes, which are an integral part of the Financial Statements.
41
Mid-Cap Index Fund
| |
| Statement of Operations | |
| |
| |
| | Year Ended |
| | December 31, 2010 |
| | ($000) |
| Investment Income | |
| Income | |
| Dividends | 327,357 |
| Interest1 | 107 |
| Security Lending | 4,545 |
| Total Income | 332,009 |
| Expenses | |
| The Vanguard Group—Note B | |
| Investment Advisory Services | 1,134 |
| Management and Administrative—Investor Shares | 15,756 |
| Management and Administrative—Admiral Shares | 2,784 |
| Management and Administrative—Signal Shares | 2,144 |
| Management and Administrative—Institutional Shares | 3,061 |
| Management and Administrative—Institutional Plus Shares | 9 |
| Management and Administrative—ETF Shares | 2,149 |
| Marketing and Distribution—Investor Shares | 1,958 |
| Marketing and Distribution—Admiral Shares | 433 |
| Marketing and Distribution—Signal Shares | 713 |
| Marketing and Distribution—Institutional Shares | 1,803 |
| Marketing and Distribution—Institutional Plus Shares | — |
| Marketing and Distribution—ETF Shares | 712 |
| Custodian Fees | 243 |
| Auditing Fees | 30 |
| Shareholders’ Reports—Investor Shares | 167 |
| Shareholders’ Reports—Admiral Shares | 16 |
| Shareholders’ Reports—Signal Shares | 47 |
| Shareholders’ Reports—Institutional Shares | 145 |
| Shareholders’ Reports—Institutional Plus Shares | — |
| Shareholders’ Reports—ETF Shares | 132 |
| Trustees’ Fees and Expenses | 33 |
| Total Expenses | 33,469 |
| Net Investment Income | 298,540 |
| Realized Net Gain (Loss) | |
| Investment Securities Sold | 520,698 |
| Futures Contracts | 2,336 |
| Realized Net Gain (Loss) | 523,034 |
| Change in Unrealized Appreciation (Depreciation) | |
| Investment Securities | 4,337,125 |
| Futures Contracts | (333) |
| Change in Unrealized Appreciation (Depreciation) | 4,336,792 |
| Net Increase (Decrease) in Net Assets Resulting from Operations | 5,158,366 |
1 Interest income from an affiliated company of the fund was $102,000.
See accompanying Notes, which are an integral part of the Financial Statements.
42
Mid-Cap Index Fund
| | |
| Statement of Changes in Net Assets | | |
| |
| | Year Ended December 31, |
| | 2010 | 2009 |
| | ($000) | ($000) |
| Increase (Decrease) in Net Assets | | |
| Operations | | |
| Net Investment Income | 298,540 | 216,559 |
| Realized Net Gain (Loss) | 523,034 | (1,367,461) |
| Change in Unrealized Appreciation (Depreciation) | 4,336,792 | 6,627,254 |
| Net Increase (Decrease) in Net Assets Resulting from Operations | 5,158,366 | 5,476,352 |
| Distributions | | |
| Net Investment Income | | |
| Investor Shares | (59,374) | (74,555) |
| Admiral Shares | (67,510) | (26,125) |
| Signal Shares | (34,170) | (27,839) |
| Institutional Shares | (96,109) | (73,930) |
| Institutional Plus Shares | (5,114) | — |
| ETF Shares | (39,719) | (26,425) |
| Realized Capital Gain | | |
| Investor Shares | — | — |
| Admiral Shares | — | — |
| Signal Shares | — | — |
| Institutional Shares | — | — |
| Institutional Plus Shares | — | — |
| ETF Shares | — | — |
| Total Distributions | (301,996) | (228,874) |
| Capital Share Transactions | | |
| Investor Shares | (2,655,777) | 310,089 |
| Admiral Shares | 3,143,756 | (15,864) |
| Signal Shares | (69,360) | 100,492 |
| Institutional Shares | 302,287 | 512,438 |
| Institutional Plus Shares | 439,890 | — |
| ETF Shares | 556,238 | 536,791 |
| Net Increase (Decrease) from Capital Share Transactions | 1,717,034 | 1,443,946 |
| Total Increase (Decrease) | 6,573,404 | 6,691,424 |
| Net Assets | | |
| Beginning of Period | 19,486,228 | 12,794,804 |
| End of Period1 | 26,059,632 | 19,486,228 |
| 1 Net Assets—End of Period includes undistributed (overdistributed) net investment income of ($27,251,000) and ($23,795,000). |
See accompanying Notes, which are an integral part of the Financial Statements.
43
Mid-Cap Index Fund
| | | | | |
| Financial Highlights | | | | | |
| |
| Investor Shares | | | | | |
| |
| For a Share Outstanding | | | Year Ended December 31, |
| Throughout Each Period | 2010 | 2009 | 2008 | 2007 | 2006 |
| Net Asset Value, Beginning of Period | $16.36 | $11.80 | $20.70 | $19.78 | $17.63 |
| Investment Operations | | | | | |
| Net Investment Income | .214 | .171 | .224 | .269 | .253 |
| Net Realized and Unrealized Gain (Loss) | | | | | |
| on Investments | 3.951 | 4.571 | (8.894) | .918 | 2.144 |
| Total from Investment Operations | 4.165 | 4.742 | (8.670) | 1.187 | 2.397 |
| Distributions | | | | | |
| Dividends from Net Investment Income | (.215) | (.182) | (.230) | (.267) | (.247) |
| Distributions from Realized Capital Gains | — | — | — | — | — |
| Total Distributions | (.215) | (.182) | (.230) | (.267) | (.247) |
| Net Asset Value, End of Period | $20.31 | $16.36 | $11.80 | $20.70 | $19.78 |
| |
| Total Return1 | 25.46% | 40.22% | -41.82% | 6.02% | 13.60% |
| |
| Ratios/Supplemental Data | | | | | |
| Net Assets, End of Period (Millions) | $5,602 | $6,789 | $4,652 | $8,075 | $7,677 |
| Ratio of Total Expenses to | | | | | |
| Average Net Assets | 0.26% | 0.27% | 0.22% | 0.21% | 0.22% |
| Ratio of Net Investment Income to | | | | | |
| Average Net Assets | 1.25% | 1.32% | 1.36% | 1.30% | 1.43% |
| Portfolio Turnover Rate2 | 16% | 21% | 24% | 19% | 18% |
1 Total returns do not include account service fees that may have applied in the periods shown. Fund prospectuses provide information about any applicable account service fees.
2 Excludes the value of portfolio securities received or delivered as a result of in-kind purchases or redemptions of the fund’s capital shares, including ETF Creation Units.
See accompanying Notes, which are an integral part of the Financial Statements.
44
Mid-Cap Index Fund
| | | | | |
| Financial Highlights | | | | | |
| |
| Admiral Shares | | | | | |
| |
| For a Share Outstanding | | | Year Ended December 31, |
| Throughout Each Period | 2010 | 2009 | 2008 | 2007 | 2006 |
| Net Asset Value, Beginning of Period | $74.23 | $53.49 | $93.93 | $89.73 | $79.98 |
| Investment Operations | | | | | |
| Net Investment Income | 1.049 | .855 | 1.099 | 1.327 | 1.226 |
| Net Realized and Unrealized Gain (Loss) | | | | | |
| on Investments | 17.946 | 20.782 | (40.405) | 4.188 | 9.725 |
| Total from Investment Operations | 18.995 | 21.637 | (39.306) | 5.515 | 10.951 |
| Distributions | | | | | |
| Dividends from Net Investment Income | (1.055) | (.897) | (1.134) | (1.315) | (1.201) |
| Distributions from Realized Capital Gains | — | — | — | — | — |
| Total Distributions | (1.055) | (.897) | (1.134) | (1.315) | (1.201) |
| Net Asset Value, End of Period | $92.17 | $74.23 | $53.49 | $93.93 | $89.73 |
| |
| Total Return | 25.59% | 40.48% | -41.78% | 6.17% | 13.69% |
| |
| Ratios/Supplemental Data | | | | | |
| Net Assets, End of Period (Millions) | $6,036 | $2,184 | $1,601 | $2,975 | $4,075 |
| Ratio of Total Expenses to | | | | | |
| Average Net Assets | 0.12% | 0.14% | 0.11% | 0.10% | 0.13% |
| Ratio of Net Investment Income to | | | | | |
| Average Net Assets | 1.39% | 1.45% | 1.47% | 1.41% | 1.52% |
| Portfolio Turnover Rate1 | 16% | 21% | 24% | 19% | 18% |
1 Excludes the value of portfolio securities received or delivered as a result of in-kind purchases or redemptions of the fund’s capital shares, including ETF Creation Units.
See accompanying Notes, which are an integral part of the Financial Statements.
45
Mid-Cap Index Fund
| | | | |
| Financial Highlights | | | | |
| |
| Signal Shares | | | | |
| | | | | March 30, |
| | | | | 20071 to |
| | Year Ended December 31, | Dec. 31, |
| For a Share Outstanding Throughout Each Period | 2010 | 2009 | 2008 | 2007 |
| Net Asset Value, Beginning of Period | $23.43 | $16.89 | $29.66 | $29.63 |
| Investment Operations | | | | |
| Net Investment Income | .341 | .271 | .349 | .300 |
| Net Realized and Unrealized Gain (Loss) | | | | |
| on Investments | 5.662 | 6.552 | (12.759) | .138 |
| Total from Investment Operations | 6.003 | 6.823 | (12.410) | .438 |
| Distributions | | | | |
| Dividends from Net Investment Income | (.343) | (.283) | (.360) | (.408) |
| Distributions from Realized Capital Gains | — | — | — | — |
| Total Distributions | (.343) | (.283) | (.360) | (.408) |
| Net Asset Value, End of Period | $29.09 | $23.43 | $16.89 | $29.66 |
| |
| Total Return | 25.62% | 40.43% | -41.78% | 1.50% |
| |
| Ratios/Supplemental Data | | | | |
| Net Assets, End of Period (Millions) | $2,831 | $2,346 | $1,609 | $2,458 |
| Ratio of Total Expenses to Average Net Assets | 0.12% | 0.14% | 0.11% | 0.10%2 |
| Ratio of Net Investment Income to Average Net Assets | 1.39% | 1.45% | 1.47% | 1.41%2 |
| Portfolio Turnover Rate3 | 16% | 21% | 24% | 19% |
1 Inception.
2 Annualized.
3 Excludes the value of portfolio securities received or delivered as a result of in-kind purchases or redemptions of the fund’s capital shares, including ETF Creation Units.
See accompanying Notes, which are an integral part of the Financial Statements.
46
Mid-Cap Index Fund
| | | | | |
| Financial Highlights | | | | | |
| |
| Institutional Shares | | | | | |
| |
| For a Share Outstanding | | | Year Ended December 31, |
| Throughout Each Period | 2010 | 2009 | 2008 | 2007 | 2006 |
| Net Asset Value, Beginning of Period | $16.40 | $11.82 | $20.76 | $19.83 | $17.67 |
| Investment Operations | | | | | |
| Net Investment Income | .247 | .197 | .250 | .300 | .286 |
| Net Realized and Unrealized Gain (Loss) | | | | | |
| on Investments | 3.962 | 4.588 | (8.933) | .928 | 2.149 |
| Total from Investment Operations | 4.209 | 4.785 | (8.683) | 1.228 | 2.435 |
| Distributions | | | | | |
| Dividends from Net Investment Income | (.249) | (.205) | (.257) | (.298) | (.275) |
| Distributions from Realized Capital Gains | — | — | — | — | — |
| Total Distributions | (.249) | (.205) | (.257) | (.298) | (.275) |
| Net Asset Value, End of Period | $20.36 | $16.40 | $11.82 | $20.76 | $19.83 |
| |
| Total Return | 25.67% | 40.51% | -41.76% | 6.22% | 13.78% |
| |
| Ratios/Supplemental Data | | | | | |
| Net Assets, End of Period (Millions) | $7,795 | $5,960 | $3,820 | $6,162 | $4,633 |
| Ratio of Total Expenses to | | | | | |
| Average Net Assets | 0.08% | 0.08% | 0.07% | 0.07% | 0.08% |
| Ratio of Net Investment Income to | | | | | |
| Average Net Assets | 1.43% | 1.51% | 1.51% | 1.44% | 1.57% |
| Portfolio Turnover Rate1 | 16% | 21% | 24% | 19% | 18% |
1 Excludes the value of portfolio securities received or delivered as a result of in-kind purchases or redemptions of the fund’s capital shares, including ETF Creation Units.
See accompanying Notes, which are an integral part of the Financial Statements.
47
Mid-Cap Index Fund
| |
| Financial Highlights | |
| |
| Institutional Plus Shares | |
| | December 15, 20101 to |
| For a Share Outstanding Throughout the Period | December 31, 2010 |
| Net Asset Value, Beginning of Period | $99.45 |
| Investment Operations | |
| Net Investment Income | .0792 |
| Net Realized and Unrealized Gain (Loss) | |
| on Investments | 2.078 |
| Total from Investment Operations | 2.157 |
| Distributions | |
| Dividends from Net Investment Income | (1.207) |
| Distributions from Realized Capital Gains | — |
| Total Distributions | (1.207) |
| Net Asset Value, End of Period | $100.40 |
| |
| Total Return | 2.17% |
| |
| Ratios/Supplemental Data | |
| Net Assets, End of Period (Millions) | $440 |
| Ratio of Total Expenses to | |
| Average Net Assets | 0.06%3 |
| Ratio of Net Investment Income to | |
| Average Net Assets | 1.45%3 |
| Portfolio Turnover Rate4 | 16% |
1 Inception.
2 Calculated based on average shares outstanding.
3 Annualized.
4 Excludes the value of portfolio securities received or delivered as a result of in-kind purchases or redemptions of the fund’s capital shares, including ETF Creation Units.
See accompanying Notes, which are an integral part of the Financial Statements.
48
Mid-Cap Index Fund
| | | | | |
| Financial Highlights | | | | | |
| |
| ETF Shares | | | | | |
| |
| For a Share Outstanding | | | Year Ended December 31, |
| Throughout Each Period | 2010 | 2009 | 2008 | 2007 | 2006 |
| Net Asset Value, Beginning of Period | $59.97 | $43.21 | $75.90 | $72.48 | $64.61 |
| Investment Operations | | | | | |
| Net Investment Income | .882 | .696 | .895 | 1.042 | .992 |
| Net Realized and Unrealized Gain (Loss) | | | | | |
| on Investments | 14.454 | 16.794 | (32.656) | 3.403 | 7.851 |
| Total from Investment Operations | 15.336 | 17.490 | (31.761) | 4.445 | 8.843 |
| Distributions | | | | | |
| Dividends from Net Investment Income | (.886) | (.730) | (.929) | (1.025) | (.973) |
| Distributions from Realized Capital Gains | — | — | — | — | — |
| Total Distributions | (.886) | (.730) | (.929) | (1.025) | (.973) |
| Net Asset Value, End of Period | $74.42 | $59.97 | $43.21 | $75.90 | $72.48 |
| |
| Total Return | 25.57% | 40.49% | -41.79% | 6.14% | 13.69% |
| |
| Ratios/Supplemental Data | | | | | |
| Net Assets, End of Period (Millions) | $3,356 | $2,207 | $1,113 | $1,087 | $1,582 |
| Ratio of Total Expenses to | | | | | |
| Average Net Assets | 0.12% | 0.14% | 0.12% | 0.13% | 0.13% |
| Ratio of Net Investment Income to | | | | | |
| Average Net Assets | 1.39% | 1.45% | 1.46% | 1.38% | 1.52% |
| Portfolio Turnover Rate1 | 16% | 21% | 24% | 19% | 18% |
1 Excludes the value of portfolio securities received or delivered as a result of in-kind purchases or redemptions of the fund’s capital shares, including ETF Creation Units.
See accompanying Notes, which are an integral part of the Financial Statements.
49
Mid-Cap Index Fund
Notes to Financial Statements
Vanguard Mid-Cap Index Fund is registered under the Investment Company Act of 1940 as an open-end investment company, or mutual fund. The fund offers six classes of shares: Investor Shares, Admiral Shares, Signal Shares, Institutional Shares, Institutional Plus Shares, and ETF Shares. Investor Shares are available to any investor who meets the fund’s minimum purchase requirements. Admiral Shares, Signal Shares, Institutional Shares, and Institutional Plus Shares are designed for investors who meet certain administrative, service, and account-size criteria. Institutional Plus Shares were first issued on December 15, 2010. ETF Shares are listed for trading on the NYSE Arca, Inc.; they can be purchased and sold through a broker.
A. The following significant accounting policies conform to generally accepted accounting principles for U.S. mutual funds. The fund consistently follows such policies in preparing its financial statements.
1. Security Valuation: Securities are valued as of the close of trading on the New York Stock Exchange (generally 4 p.m., Eastern time) on the valuation date. Equity securities are valued at the latest quoted sales prices or official closing prices taken from the primary market in which each security trades; such securities not traded on the valuation date are valued at the mean of the latest quoted bid and asked prices. Securities for which market quotations are not readily available, or whose values have been materially affected by events occurring before the fund’s pricing time but after the close of the securities’ primary markets, are valued by methods deemed by the board of trustees to represent fair value. Investments in Vanguard Market Liquidity Fund are valued at that fund’s net asset value. Temporary cash investments acquired over 60 days to maturity are valued using the latest bid prices or using valuations based on a matrix system (which considers such factors as security prices, yields, maturities, and ratings), both as furnished by independent pricing services. Other temporary cash investments are valued at amortized cost, which approximates market value.
2. Futures Contracts: The fund uses index futures contracts to a limited extent, with the objectives of maintaining full exposure to the stock market, enhancing returns, maintaining liquidity, and minimizing transaction costs. The fund may purchase futures contracts to immediately invest incoming cash in the market, or sell futures in response to cash outflows, thereby simulating a fully invested position in the underlying index while maintaining a cash balance for liquidity. The fund may seek to enhance returns by using futures contracts instead of the underlying securities when futures are believed to be priced more attractively than the underlying securities. The primary risks associated with the use of futures contracts are imperfect correlation between changes in market values of stocks held by the fund and the prices of futures contracts, and the possibility of an illiquid market.
Futures contracts are valued at their quoted daily settlement prices. The aggregate principal amounts of the contracts are not recorded in the Statement of Net Assets. Fluctuations in the value of the contracts are recorded in the Statement of Net Assets as an asset (liability) and in the Statement of Operations as unrealized appreciation (depreciation) until the contracts are closed, when they are recorded as realized futures gains (losses).
3. Federal Income Taxes: The fund intends to continue to qualify as a regulated investment company and distribute all of its taxable income. Management has analyzed the fund’s tax positions taken for all open federal income tax years (December 31, 2007–2010), and has concluded that no provision for federal income tax is required in the fund’s financial statements.
4. Distributions: Distributions to shareholders are recorded on the ex-dividend date.
50
Mid-Cap Index Fund
5. Security Lending: The fund may lend its securities to qualified institutional borrowers to earn additional income. Security loans are required to be secured at all times by collateral at least equal to the market value of securities loaned. The fund invests cash collateral received in Vanguard Market Liquidity Fund, and records a liability for the return of the collateral, during the period the securities are on loan. Security lending income represents fees charged to borrowers plus income earned on investing cash collateral, less expenses associated with the loan.
6. Other: Dividend income is recorded on the ex-dividend date. Interest income includes income distributions received from Vanguard Market Liquidity Fund and is accrued daily. Security transactions are accounted for on the date securities are bought or sold. Costs used to determine realized gains (losses) on the sale of investment securities are those of the specific securities sold.
Each class of shares has equal rights as to assets and earnings, except that each class separately bears certain class-specific expenses related to maintenance of shareholder accounts (included in Management and Administrative expenses) and shareholder reporting. Marketing and distribution expenses are allocated to each class of shares based on a method approved by the board of trustees. Income, other non-class-specific expenses, and gains and losses on investments are allocated to each class of shares based on its relative net assets.
B. The Vanguard Group furnishes at cost investment advisory, corporate management, administrative, marketing, and distribution services. The costs of such services are allocated to the fund under methods approved by the board of trustees. The fund has committed to provide up to 0.40% of its net assets in capital contributions to Vanguard. At December 31, 2010, the fund had contributed capital of $4,278,000 to Vanguard (included in Other Assets), representing 0.02% of the fund’s net assets and 1.71% of Vanguard’s capitalization. The fund’s trustees and officers are also directors and officers of Vanguard.
C. Various inputs may be used to determine the value of the fund’s investments. These inputs are summarized in three broad levels for financial statement purposes. The inputs or methodologies used to value securities are not necessarily an indication of the risk associated with investing in those securities.
Level 1—Quoted prices in active markets for identical securities.
Level 2—Other significant observable inputs (including quoted prices for similar securities, interest rates, prepayment speeds, credit risk, etc.).
Level 3—Significant unobservable inputs (including the fund’s own assumptions used to determine the fair value of investments).
The following table summarizes the fund’s investments as of December 31, 2010, based on the inputs used to value them:
| | | |
| | Level 1 | Level 2 | Level 3 |
| Investments | ($000) | ($000) | ($000) |
| Common Stocks | 26,069,369 | — | — |
| Temporary Cash Investments | 154,634 | 400 | — |
| Futures Contracts—Liabilities1 | (22) | — | — |
| Total | 26,223,981 | 400 | — |
| 1 Represents variation margin on the last day of the reporting period. | | | |
51
Mid-Cap Index Fund
D. At December 31, 2010, the aggregate settlement value of open futures contracts and the related unrealized appreciation (depreciation) were:
| | | | |
| | | | | ($000) |
| | | | Aggregate | |
| | | Number of | Settlement | Unrealized |
| | | Long (Short) | Value | Appreciation |
| Futures Contracts | Expiration | Contracts | Long (Short) | (Depreciation) |
| S&P MidCap 400 Index | March 2011 | 7 | 3,169 | 49 |
Unrealized appreciation (depreciation) on open futures contracts is required to be treated as realized gain (loss) for tax purposes.
E. Distributions are determined on a tax basis and may differ from net investment income and realized capital gains for financial reporting purposes. Differences may be permanent or temporary. Permanent differences are reclassified among capital accounts in the financial statements to reflect their tax character. Temporary differences arise when certain items of income, expense, gain, or loss are recognized in different periods for financial statement and tax purposes; these differences are primarily attributed to tax deferral of losses on wash sales and will reverse at some time in the future. Differences in classification may also result from the treatment of short-term gains as ordinary income for tax purposes.
During the year ended December 31, 2010, the fund realized $1,085,523,000 of net capital gains resulting from in-kind redemptions—in which shareholders exchanged fund shares for securities held by the fund rather than for cash. Because such gains are not taxable to the fund, and are not distributed to shareholders, they have been reclassified from accumulated net realized losses to paid-in capital.
For tax purposes, at December 31, 2010, the fund had $2,352,000 of ordinary income available for distribution. The fund had available capital loss carryforwards totaling $3,627,445,000 to offset future net capital gains of $14,378,000 through December 31, 2011, $63,490,000 through December 31, 2014, $1,194,245,000 through December 31, 2016, $1,793,234,000 through December 31, 2017, and $562,098,000 through December 31, 2018. In addition, the fund realized losses of $158,499,000 during the period from November 1, 2010, through December 31, 2010, which are deferred and will be treated as realized for tax purposes in fiscal 2011.
At December 31, 2010, the cost of investment securities for tax purposes was $21,268,220,000. Net unrealized appreciation of investment securities for tax purposes was $4,956,183,000, consisting of unrealized gains of $6,201,277,000 on securities that had risen in value since their purchase and $1,245,094,000 in unrealized losses on securities that had fallen in value since their purchase.
F. During the year ended December 31, 2010, the fund purchased $7,670,344,000 of investment securities and sold $5,913,593,000 of investment securities, other than temporary cash investments.
52
Mid-Cap Index Fund
G. Capital share transactions for each class of shares were:
| | | | |
| | | | Year Ended December 31, |
| | | 2010 | | 2009 |
| | Amount | Shares | Amount | Shares |
| | ($000) | (000) | ($000) | (000) |
| Investor Shares | | | | |
| Issued | 1,743,914 | 98,135 | 1,423,348 | 107,883 |
| Issued in Lieu of Cash Distributions | 56,226 | 2,771 | 69,914 | 4,350 |
| Redeemed | (4,455,917) | (239,889) | (1,183,173) | (91,741) |
| Net Increase (Decrease)—Investor Shares | (2,655,777) | (138,983) | 310,089 | 20,492 |
| Admiral Shares | | | | |
| Issued | 3,454,685 | 39,996 | 291,548 | 4,815 |
| Issued in Lieu of Cash Distributions | 61,091 | 663 | 22,510 | 309 |
| Redeemed | (372,020) | (4,597) | (329,922) | (5,626) |
| Net Increase (Decrease)—Admiral Shares | 3,143,756 | 36,062 | (15,864) | (502) |
| Signal Shares | | | | |
| Issued | 891,891 | 34,656 | 573,460 | 30,467 |
| Issued in Lieu of Cash Distributions | 29,022 | 998 | 23,904 | 1,038 |
| Redeemed | (990,273) | (38,445) | (496,872) | (26,673) |
| Net Increase (Decrease)—Signal Shares | (69,360) | (2,791) | 100,492 | 4,832 |
| Institutional Shares | | | | |
| Issued | 2,012,186 | 112,232 | 1,384,125 | 105,648 |
| Issued in Lieu of Cash Distributions | 92,347 | 4,539 | 71,321 | 4,413 |
| Redeemed | (1,802,246) | (97,229) | (943,008) | (69,913) |
| Net Increase (Decrease)—Institutional Shares | 302,287 | 19,542 | 512,438 | 40,148 |
| Institutional Plus Shares1 | | | | |
| Issued | 445,711 | 4,436 | — | — |
| Issued in Lieu of Cash Distributions | 5,114 | 51 | — | — |
| Redeemed | (10,935) | (108) | — | — |
| Net Increase (Decrease)—Institutional Plus Shares | 439,890 | 4,379 | — | — |
| ETF Shares | | | | |
| Issued | 2,719,879 | 40,797 | 1,647,762 | 34,436 |
| Issued in Lieu of Cash Distributions | — | — | — | — |
| Redeemed | (2,163,641) | (32,500) | (1,110,971) | (23,400) |
| Net Increase (Decrease)—ETF Shares | 556,238 | 8,297 | 536,791 | 11,036 |
| 1 Inception was December 15, 2010, for Institutional Plus Shares | | | | |
H. In preparing the financial statements as of December 31, 2010, management considered the impact of subsequent events for potential recognition or disclosure in these financial statements.
53
Mid-Cap Growth Index Fund
Fund Profile
As of December 31, 2010
| | |
| Share-Class Characteristics | |
| |
| | Investor | ETF |
| | Shares | Shares |
| Ticker Symbol | VMGIX | VOT |
| Expense Ratio1 | 0.30% | 0.14% |
| 30-Day SEC Yield | 0.14% | 0.28% |
| | | |
| Portfolio Characteristics | | |
| | | MSCI US | DJ |
| | | Mid Cap | U.S. Total |
| | | Growth | Market |
| | Fund | Index | Index |
| Number of Stocks | 242 | 242 | 3,893 |
| Median Market Cap | $6.8B | $6.8B | $29.6B |
| Price/Earnings Ratio | 26.1x | 26.1x | 18.3x |
| Price/Book Ratio | 3.4x | 3.4x | 2.2x |
| Return on Equity | 17.1% | 17.1% | 18.8% |
| Earnings Growth Rate | 8.6% | 8.6% | 6.2% |
| Dividend Yield | 0.5% | 0.5% | 1.7% |
| Foreign Holdings | 0.0% | 0.0% | 0.0% |
| Turnover Rate | 38% | — | — |
| Short-Term Reserves | 0.6% | — | — |
| | | |
| Sector Diversification (% of equity exposure) |
| | | MSCI US | DJ |
| | | Mid Cap | U.S. Total |
| | | Growth | Market |
| | Fund | Index | Index |
| Consumer | | | |
| Discretionary | 21.2% | 21.2% | 11.9% |
| Consumer Staples | 3.0 | 3.0 | 9.5 |
| Energy | 14.1 | 14.1 | 10.6 |
| Financials | 7.4 | 7.4 | 16.6 |
| Health Care | 14.9 | 14.9 | 10.7 |
| Industrials | 13.9 | 13.9 | 11.4 |
| Information | | | |
| Technology | 18.1 | 18.1 | 18.9 |
| Materials | 5.6 | 5.6 | 4.5 |
| Telecommunication | | | |
| Services | 1.4 | 1.4 | 2.7 |
| Utilities | 0.4 | 0.4 | 3.2 |
| | |
| Volatility Measures | | |
| | | DJ |
| | MSCI US | U.S. Total |
| | Mid Cap | Market |
| | Growth Index | Index |
| R-Squared | 1.00 | 0.90 |
| Beta | 1.00 | 1.13 |
These measures show the degree and timing of the fund’s fluctuations compared with the indexes over 36 months.
| | |
| Ten Largest Holdings (% of total net assets) |
| Cameron International | Oil & Gas | |
| Corp. | Equipment & | |
| | Services | 1.1% |
| Host Hotels & Resorts | Specialized REITs | |
| Inc. | | 1.0 |
| SanDisk Corp. | Computer Storage | |
| | & Peripherals | 1.0 |
| Starwood Hotels & | Hotels, Resorts & | |
| Resorts Worldwide Inc. | Cruise Lines | 1.0 |
| Consol Energy Inc. | Coal & Consumable | |
| | Fuels | 1.0 |
| Altera Corp. | Semiconductors | 1.0 |
| FMC Technologies Inc. | Oil & Gas | |
| | Equipment & | |
| | Services | 0.9 |
| F5 Networks Inc. | Communications | |
| | Equipment | 0.9 |
| Life Technologies Corp. | Life Sciences Tools | |
| | & Services | 0.9 |
| Discover Financial | Consumer Finance | |
| Services | | 0.9 |
| Top Ten | | 9.7% |
The holdings listed exclude any temporary cash investments and equity index products.
Investment Focus
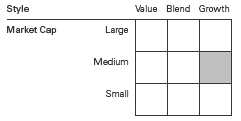
1 The expense ratios shown are from the prospectus dated April 29, 2010, and represent estimated costs for the current fiscal year. For the fiscal year ended December 31, 2010, the fund’s expense ratios were 0.26% for Investor Shares and 0.12% for ETF Shares.
54
Mid-Cap Growth Index Fund
Performance Summary
All of the returns in this report represent past performance, which is not a guarantee of future results that may be achieved by the fund. (Current performance may be lower or higher than the performance data cited. For performance data current to the most recent month-end, visit our website at vanguard.com/performance.) Note, too, that both investment returns and principal value can fluctuate widely, so an investor’s shares, when sold, could be worth more or less than their original cost. The returns shown do not reflect taxes that a shareholder would pay on fund distributions or on the sale of fund shares.
Cumulative Performance: August 24, 2006, Through December 31, 2010
Initial Investment of $10,000
| | | | |
| | | Average Annual Total Returns | |
| | | Periods Ended December 31, 2010 | |
| | | | Since | Final Value |
| | | One | Inception | of a $10,000 |
| | | Year | (8/24/2006) | Investment |
| | Mid-Cap Growth Index Fund Investor | | | |
| | Shares | 28.93% | 5.20% | $12,471 |
| •••••••• | Dow Jones U.S. Total Stock Market | | | |
| | Index | 17.70 | 2.63 | 11,194 |
| – – – – | MSCI US Mid Cap Growth Index | 29.24 | 5.37 | 12,558 |
| | Mid-Cap Growth Funds Average | 26.22 | 5.40 | 12,571 |
Mid-Cap Growth Funds Average: Derived from data provided by Lipper Inc.
"Since Inception" performance is calculated from the Investor Shares’ inception date for both the fund and its comparative standards.
| | | |
| | | Since | Final Value |
| | One | Inception | of a $10,000 |
| | Year | (8/17/2006) | Investment |
| Mid-Cap Growth Index Fund | | | |
| ETF Shares Net Asset Value | 29.11% | 4.98% | $12,368 |
| Dow Jones U.S. Total Stock Market Index | 17.70 | 2.52 | 11,151 |
| MSCI US Mid Cap Growth Index | 29.24 | 5.00 | 12,380 |
| "Since Inception" performance is calculated from the ETF Shares’ inception date for both the fund and its comparative standards. |
See Financial Highlights for dividend and capital gains information.
55
Mid-Cap Growth Index Fund
| | |
| Cumulative Returns of ETF Shares: August 17, 2006, Through December 31, 2010 | |
| | | Since |
| | One | Inception |
| | Year | (8/17/2006) |
| Mid-Cap Growth Index Fund | | |
| ETF Shares Market Price | 29.14% | 23.75% |
| Mid-Cap Growth Index Fund | | |
| ETF Shares Net Asset Value | 29.11 | 23.68 |
| MSCI US Mid Cap Growth Index | 29.24 | 23.80 |
| "Since Inception" performance is calculated from the ETF Shares’ inception date for both the fund and its comparative standard. | |
Fiscal-Year Total Returns (%): August 24, 2006, Through December 31, 2010
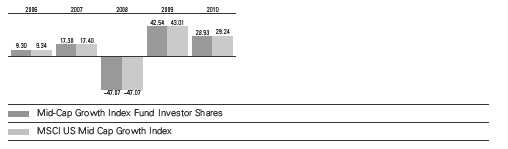
56
Mid-Cap Growth Index Fund
Financial Statements
Statement of Net Assets
As of December 31, 2010
The fund reports a complete list of its holdings in regulatory filings four times in each fiscal year, at the quarter-ends. For the second and fourth fiscal quarters, the lists appear in the fund’s semiannual and annual reports to shareholders. For the first and third fiscal quarters, the fund files the lists with the Securities and Exchange Commission on Form N-Q. Shareholders can look up the fund’s Forms N-Q on the SEC’s website at sec.gov. Forms N-Q may also be reviewed and copied at the SEC’s Public Reference Room (see the back cover of this report for further information).
| | | | |
| | | | | Market |
| | | | | Value |
| | | | Shares | ($000) |
| Common Stocks (99.9%) | | | |
| Consumer Discretionary (21.2%) | |
| | Starwood Hotels & | | | |
| | Resorts Worldwide Inc. | 329,144 | 20,005 |
| | Virgin Media Inc. | | 545,864 | 14,869 |
| | Cablevision Systems Corp. | | |
| | Class A | | 433,592 | 14,673 |
| * | O’Reilly Automotive Inc. | 240,257 | 14,516 |
| * | BorgWarner Inc. | | 197,417 | 14,285 |
| | Harley-Davidson Inc. | | 407,698 | 14,135 |
| | Tiffany & Co. | | 220,111 | 13,706 |
| * | NetFlix Inc. | | 77,091 | 13,545 |
| | Ross Stores Inc. | | 211,441 | 13,374 |
| | Nordstrom Inc. | | 303,479 | 12,861 |
| | Polo Ralph Lauren Corp. | | |
| | Class A | | 112,662 | 12,497 |
| * | CarMax Inc. | | 387,309 | 12,347 |
| * | Dollar Tree Inc. | | 219,827 | 12,328 |
| * | Chipotle Mexican Grill Inc. | | |
| | Class A | | 53,853 | 11,452 |
| * | Sirius XM Radio Inc. | 6,722,763 | 11,025 |
| | Family Dollar Stores Inc. | 218,188 | 10,846 |
| | Advance Auto Parts Inc. | 145,950 | 9,655 |
| | International Game | | | |
| | Technology | | 515,403 | 9,118 |
| * | Apollo Group Inc. Class A | 229,105 | 9,047 |
| | Expedia Inc. | | 358,591 | 8,997 |
| * | Interpublic Group | | | |
| | of Cos. Inc. | | 845,142 | 8,975 |
| | Abercrombie & Fitch Co. | 152,771 | 8,804 |
| * | MGM Resorts International | 584,546 | 8,681 |
| * | Urban Outfitters Inc. | | 232,828 | 8,338 |
| | PetSmart Inc. | | 205,279 | 8,174 |
| | Scripps Networks | | | |
| | Interactive Inc. Class A | 157,243 | 8,137 |
| | Autoliv Inc. | | 99,623 | 7,864 |
| * | Liberty Media Corp. - Capital | 124,626 | 7,797 |
| * | Liberty Global Inc. Class A | 206,524 | 7,307 |
| * | Fossil Inc. | | 92,979 | 6,553 |
| | | |
| | | | Market |
| | | | Value |
| | | Shares | ($000) |
| * | Liberty Global Inc. | 188,535 | 6,390 |
| * | TRW Automotive | | |
| | Holdings Corp. | 115,946 | 6,110 |
| * | Dick’s Sporting Goods Inc. | 157,034 | 5,889 |
| * | Liberty Media Corp. - Starz | 84,730 | 5,633 |
| * | Lear Corp. | 55,466 | 5,475 |
| * | LKQ Corp. | 235,421 | 5,349 |
| | DeVry Inc. | 110,028 | 5,279 |
| | Guess? Inc. | 104,694 | 4,954 |
| * | Goodyear Tire & Rubber Co. | 398,809 | 4,726 |
| | Phillips-Van Heusen Corp. | 74,527 | 4,696 |
| * | Royal Caribbean Cruises Ltd. | 84,782 | 3,985 |
| * | ITT Educational Services Inc. | 58,097 | 3,700 |
| ^ | Strayer Education Inc. | 23,990 | 3,652 |
| * | NVR Inc. | 4,796 | 3,314 |
| * | Harman International | | |
| | Industries Inc. | 60,007 | 2,778 |
| * | Lamar Advertising Co. | | |
| | Class A | 64,964 | 2,588 |
| | American Eagle | | |
| | Outfitters Inc. | 160,322 | 2,346 |
| * | Hyatt Hotels Corp. Class A | 49,303 | 2,256 |
| | CTC Media Inc. | 94,197 | 2,207 |
| * | Penn National Gaming Inc. | 57,244 | 2,012 |
| | Wendy’s/Arby’s Group Inc. | | |
| | Class A | 375,638 | 1,736 |
| * | Toll Brothers Inc. | 85,050 | 1,616 |
| * | Clear Channel Outdoor | | |
| | Holdings Inc. Class A | 45,504 | 639 |
| | | | 421,241 |
| Consumer Staples (3.0%) | | |
| * | Whole Foods Market Inc. | 252,992 | 12,799 |
| * | Energizer Holdings Inc. | 115,500 | 8,420 |
| | Dr Pepper Snapple | | |
| | Group Inc. | 206,779 | 7,270 |
| | Herbalife Ltd. | 102,480 | 7,007 |
| * | Hansen Natural Corp. | 129,789 | 6,785 |
| * | Green Mountain Coffee | | |
| | Roasters Inc. | 193,284 | 6,351 |
57
Mid-Cap Growth Index Fund
| | | |
| | | | Market |
| | | | Value |
| | | Shares | ($000) |
| | Alberto-Culver Co. Class B | 153,724 | 5,694 |
| | Flowers Foods Inc. | 142,971 | 3,847 |
| | Hormel Foods Corp. | 44,352 | 2,274 |
| | | | 60,447 |
| Energy (14.1%) | | |
| * | Cameron International Corp. | 419,345 | 21,273 |
| | Consol Energy Inc. | 390,851 | 19,050 |
| * | FMC Technologies Inc. | 207,820 | 18,477 |
| | Pioneer Natural | | |
| | Resources Co. | 200,789 | 17,433 |
| * | Concho Resources Inc. | 151,036 | 13,241 |
| * | Alpha Natural | | |
| | Resources Inc. | 208,381 | 12,509 |
| | Range Resources Corp. | 277,106 | 12,464 |
| | EQT Corp. | 245,283 | 10,999 |
| | QEP Resources Inc. | 302,812 | 10,995 |
| * | Whiting Petroleum Corp. | 88,279 | 10,345 |
| | Arch Coal Inc. | 281,330 | 9,863 |
| * | Petrohawk Energy Corp. | 523,407 | 9,552 |
| | Massey Energy Co. | 167,922 | 9,009 |
| | Helmerich & Payne Inc. | 183,253 | 8,884 |
| | Sunoco Inc. | 208,793 | 8,417 |
| | El Paso Corp. | 608,516 | 8,373 |
| * | Newfield Exploration Co. | 115,696 | 8,343 |
| * | McDermott | | |
| | International Inc. | 402,127 | 8,320 |
| * | Nabors Industries Ltd. | 321,054 | 7,532 |
| * | Oceaneering | | |
| | International Inc. | 93,816 | 6,908 |
| | Core Laboratories NV | 77,425 | 6,895 |
| | Cabot Oil & Gas Corp. | 179,938 | 6,811 |
| | EXCO Resources Inc. | 312,369 | 6,066 |
| * | Dresser-Rand Group Inc. | 140,144 | 5,969 |
| * | Kinder Morgan | | |
| | Management LLC | 70,268 | 4,700 |
| * | Forest Oil Corp. | 120,959 | 4,593 |
| * | Denbury Resources Inc. | 229,400 | 4,379 |
| * | Continental Resources Inc. | 58,750 | 3,457 |
| * | Quicksilver Resources Inc. | 206,130 | 3,038 |
| * | Cobalt International | | |
| | Energy Inc. | 153,476 | 1,874 |
| | | | 279,769 |
| Financials (7.3%) | | |
| | Host Hotels & Resorts Inc. | 1,147,288 | 20,502 |
| | Discover Financial Services | 941,718 | 17,450 |
| * | CIT Group Inc. | 329,388 | 15,514 |
| * | IntercontinentalExchange Inc. | 109,027 | 12,991 |
| * | CB Richard Ellis Group Inc. | | |
| | Class A | 501,386 | 10,268 |
| * | Affiliated Managers | | |
| | Group Inc. | 88,515 | 8,782 |
| | AvalonBay Communities Inc. | 73,759 | 8,302 |
| * | MSCI Inc. Class A | 195,374 | 7,612 |
| | Jones Lang LaSalle Inc. | 73,846 | 6,197 |
| | Eaton Vance Corp. | 204,155 | 6,172 |
| | | |
| | | | Market |
| | | | Value |
| | | Shares | ($000) |
| | SEI Investments Co. | 228,403 | 5,434 |
| | Brown & Brown Inc. | 209,275 | 5,010 |
| | Janus Capital Group Inc. | 316,403 | 4,104 |
| | Greenhill & Co. Inc. | 43,339 | 3,540 |
| *,^ | St. Joe Co. | 160,568 | 3,508 |
| | Digital Realty Trust Inc. | 52,835 | 2,723 |
| | Alexandria Real Estate | | |
| | Equities Inc. | 32,794 | 2,403 |
| | Duke Realty Corp. | 151,198 | 1,884 |
| * | First Horizon National Corp. | 157,828 | 1,859 |
| | TFS Financial Corp. | 159,895 | 1,442 |
| | CBOE Holdings Inc. | 21,835 | 499 |
| | | | 146,196 |
| Health Care (14.9%) | | |
| * | Life Technologies Corp. | 317,371 | 17,614 |
| | AmerisourceBergen Corp. | | |
| | Class A | 482,664 | 16,469 |
| * | Hospira Inc. | 289,661 | 16,131 |
| * | Edwards Lifesciences Corp. | 196,221 | 15,863 |
| * | Varian Medical Systems Inc. | 210,535 | 14,586 |
| * | Illumina Inc. | 215,197 | 13,631 |
| * | Alexion Pharmaceuticals Inc. | 156,079 | 12,572 |
| * | Waters Corp. | 159,323 | 12,381 |
| * | DaVita Inc. | 177,339 | 12,323 |
| * | Vertex Pharmaceuticals Inc. | 351,129 | 12,300 |
| * | Watson Pharmaceuticals Inc. | 229,376 | 11,847 |
| * | Cerner Corp. | 121,451 | 11,506 |
| * | Mylan Inc. | 535,541 | 11,316 |
| * | Henry Schein Inc. | 158,417 | 9,725 |
| * | ResMed Inc. | 262,067 | 9,078 |
| | Perrigo Co. | 142,870 | 9,048 |
| * | Mettler-Toledo | | |
| | International Inc. | 57,848 | 8,747 |
| * | Dendreon Corp. | 249,316 | 8,706 |
| | DENTSPLY International Inc. | 234,929 | 8,028 |
| * | Human Genome | | |
| | Sciences Inc. | 325,713 | 7,781 |
| * | IDEXX Laboratories Inc. | 99,914 | 6,916 |
| * | Covance Inc. | 112,150 | 5,766 |
| * | CareFusion Corp. | 192,520 | 4,948 |
| | Patterson Cos. Inc. | 160,977 | 4,931 |
| * | Gen-Probe Inc. | 84,189 | 4,912 |
| * | Cephalon Inc. | 65,142 | 4,021 |
| | Techne Corp. | 60,860 | 3,997 |
| * | Myriad Genetics Inc. | 162,609 | 3,714 |
| * | Amylin Pharmaceuticals Inc. | 248,297 | 3,652 |
| * | Bio-Rad Laboratories Inc. | | |
| | Class A | 33,161 | 3,444 |
| * | Community Health | | |
| | Systems Inc. | 81,721 | 3,054 |
| | Warner Chilcott plc Class A | 127,545 | 2,877 |
| * | Endo Pharmaceuticals | | |
| | Holdings Inc. | 69,722 | 2,490 |
| | Lincare Holdings Inc. | 59,387 | 1,593 |
| | | | 295,967 |
58
Mid-Cap Growth Index Fund
| | | |
| | | | Market |
| | | | Value |
| | | Shares | ($000) |
| Industrials (13.9%) | | |
| | Joy Global Inc. | 178,640 | 15,497 |
| | WW Grainger Inc. | 104,432 | 14,423 |
| | Fastenal Co. | 229,748 | 13,764 |
| | Roper Industries Inc. | 163,104 | 12,466 |
| | Bucyrus International Inc. | | |
| | Class A | 133,308 | 11,918 |
| | Flowserve Corp. | 96,863 | 11,548 |
| * | Stericycle Inc. | 140,366 | 11,358 |
| | Textron Inc. | 474,664 | 11,221 |
| | AMETEK Inc. | 276,614 | 10,857 |
| * | Jacobs Engineering | | |
| | Group Inc. | 217,725 | 9,983 |
| | Rockwell Automation Inc. | 122,792 | 8,805 |
| * | Kansas City Southern | 177,564 | 8,498 |
| * | AGCO Corp. | 161,060 | 8,159 |
| | Iron Mountain Inc. | 314,015 | 7,853 |
| * | Foster Wheeler AG | 220,789 | 7,622 |
| | Robert Half International Inc. | 242,778 | 7,429 |
| | Donaldson Co. Inc. | 125,486 | 7,313 |
| * | Quanta Services Inc. | 364,492 | 7,261 |
| | Dun & Bradstreet Corp. | 86,566 | 7,106 |
| * | Verisk Analytics Inc. Class A | 195,428 | 6,660 |
| | JB Hunt Transport | | |
| | Services Inc. | 160,135 | 6,535 |
| * | Navistar International Corp. | 111,355 | 6,449 |
| * | IHS Inc. Class A | 72,173 | 5,802 |
| * | Babcock & Wilcox Co. | 201,244 | 5,150 |
| | Pall Corp. | 101,071 | 5,011 |
| * | Shaw Group Inc. | 146,215 | 5,005 |
| | MSC Industrial Direct Co. | | |
| | Class A | 77,276 | 4,999 |
| * | Copart Inc. | 123,859 | 4,626 |
| | Manpower Inc. | 71,076 | 4,461 |
| * | Alliant Techsystems Inc. | 57,301 | 4,265 |
| | Covanta Holding Corp. | 228,726 | 3,932 |
| * | Spirit Aerosystems | | |
| | Holdings Inc. Class A | 184,713 | 3,844 |
| * | Sensata Technologies | | |
| | Holding NV | 105,118 | 3,165 |
| | SPX Corp. | 43,253 | 3,092 |
| * | FTI Consulting Inc. | 81,063 | 3,022 |
| * | Terex Corp. | 93,867 | 2,914 |
| * | Owens Corning | 69,776 | 2,174 |
| * | Hertz Global Holdings Inc. | 136,919 | 1,984 |
| | | | 276,171 |
| Information Technology (18.1%) | |
| * | SanDisk Corp. | 403,441 | 20,116 |
| | Altera Corp. | 531,869 | 18,924 |
| * | F5 Networks Inc. | 139,308 | 18,132 |
| | Amphenol Corp. Class A | 300,570 | 15,864 |
| * | Fiserv Inc. | 259,854 | 15,217 |
| * | Autodesk Inc. | 393,454 | 15,030 |
| * | Red Hat Inc. | 327,131 | 14,934 |
| * | Akamai Technologies Inc. | 314,384 | 14,792 |
| * | BMC Software Inc. | 309,270 | 14,579 |
| | | |
| | | | Market |
| | | | Value |
| | | Shares | ($000) |
| | Linear Technology Corp. | 388,592 | 13,441 |
| * | McAfee Inc. | 263,303 | 12,194 |
| * | Teradata Corp. | 289,642 | 11,922 |
| * | Cree Inc. | 177,753 | 11,712 |
| * | Rovi Corp. | 178,645 | 11,078 |
| | VeriSign Inc. | 301,511 | 9,850 |
| * | Atmel Corp. | 798,971 | 9,843 |
| * | Skyworks Solutions Inc. | 309,304 | 8,855 |
| * | Trimble Navigation Ltd. | 206,341 | 8,239 |
| * | ANSYS Inc. | 156,728 | 8,161 |
| * | FLIR Systems Inc. | 273,748 | 8,144 |
| * | Nuance | | |
| | Communications Inc. | 407,059 | 7,400 |
| * | ON Semiconductor Corp. | 746,322 | 7,374 |
| | Factset Research | | |
| | Systems Inc. | 76,110 | 7,136 |
| * | Western Digital Corp. | 198,190 | 6,719 |
| | Avago Technologies Ltd. | 228,485 | 6,505 |
| | Xilinx Inc. | 224,046 | 6,493 |
| * | Alliance Data Systems Corp. | 91,165 | 6,475 |
| * | Equinix Inc. | 78,933 | 6,414 |
| | Global Payments Inc. | 137,989 | 6,376 |
| * | Dolby Laboratories Inc. | | |
| | Class A | 91,822 | 6,125 |
| * | Electronic Arts Inc. | 371,002 | 6,077 |
| | Broadridge Financial | | |
| | Solutions Inc. | 219,467 | 4,813 |
| * | MEMC Electronic | | |
| | Materials Inc. | 391,791 | 4,412 |
| * | Brocade Communications | | |
| | Systems Inc. | 767,454 | 4,060 |
| * | Lam Research Corp. | 75,172 | 3,892 |
| * | Advanced Micro | | |
| | Devices Inc. | 347,494 | 2,842 |
| * | Genpact Ltd. | 170,382 | 2,590 |
| | Lender Processing | | |
| | Services Inc. | 80,314 | 2,371 |
| | DST Systems Inc. | 32,177 | 1,427 |
| | | | 360,528 |
| Materials (5.6%) | | |
| | CF Industries Holdings Inc. | 123,056 | 16,631 |
| | Sigma-Aldrich Corp. | 210,056 | 13,981 |
| | Lubrizol Corp. | 116,885 | 12,493 |
| | Celanese Corp. Class A | 270,248 | 11,126 |
| | Ball Corp. | 150,654 | 10,252 |
| | United States Steel Corp. | 161,558 | 9,438 |
| * | Crown Holdings Inc. | 280,748 | 9,371 |
| | Allegheny Technologies Inc. | 153,584 | 8,475 |
| | Nalco Holding Co. | 239,454 | 7,648 |
| | Scotts Miracle-Gro Co. | | |
| | Class A | 81,218 | 4,124 |
| | FMC Corp. | 41,669 | 3,329 |
| | Martin Marietta Materials Inc. | 27,530 | 2,539 |
| * | Titanium Metals Corp. | 101,254 | 1,740 |
| | | | 111,147 |
59
Mid-Cap Growth Index Fund
| | | |
| | | | Market |
| | | | Value |
| | | Shares | ($000) |
| Telecommunication Services (1.4%) | |
| * | NII Holdings Inc. | 291,546 | 13,020 |
| * | SBA Communications | | |
| | Corp. Class A | 188,070 | 7,700 |
| * | MetroPCS | | |
| | Communications Inc. | 428,826 | 5,416 |
| *,^ | Clearwire Corp. Class A | 163,215 | 841 |
| | | | 26,977 |
| Utilities (0.4%) | | |
| * | Calpine Corp. | 615,750 | 8,214 |
| Total Common Stocks | | |
| (Cost $1,575,064) | | 1,986,657 |
| Temporary Cash Investment (0.8%) | |
| Money Market Fund (0.8%) | | |
| 1,2 | Vanguard Market | | |
| | Liquidity Fund, 0.211% | | |
| | (Cost $15,157) | 15,157,406 | 15,157 |
| Total Investments (100.7%) | | |
| (Cost $1,590,221) | | 2,001,814 |
| Other Assets and Liabilities (-0.7%) | |
| Other Assets | | 6,508 |
| Liabilities2 | | (20,728) |
| | | | (14,220) |
| Net Assets (100%) | | 1,987,594 |
| |
| At December 31, 2010, net assets consisted of: |
| | Amount |
| | ($000) |
| Paid-in Capital | 1,993,302 |
| Overdistributed Net Investment Income | (1,217) |
| Accumulated Net Realized Losses | (416,084) |
| Unrealized Appreciation (Depreciation) | 411,593 |
| Net Assets | 1,987,594 |
| |
| Investor Shares—Net Assets | |
| Applicable to 39,164,384 outstanding | |
| $.001 par value shares of beneficial | |
| interest (unlimited authorization) | 958,081 |
| Net Asset Value Per Share— | |
| Investor Shares | $24.46 |
| |
| ETF Shares—Net Assets | |
| Applicable to 16,543,506 outstanding | |
| $.001 par value shares of beneficial | |
| interest (unlimited authorization) | 1,029,513 |
| Net Asset Value Per Share— | |
| ETF Shares | $62.23 |
See Note A in Notes to Financial Statements.
* Non-income-producing security.
^ Part of security position is on loan to broker-dealers. The total value of securities on loan is $3,247,000.
1 Affiliated money market fund available only to Vanguard funds and certain trusts and accounts managed by Vanguard. Rate shown is the 7-day yield.
2 Includes $3,463,000 of collateral received for securities on loan.
See accompanying Notes, which are an integral part of the Financial Statements.
60
Mid-Cap Growth Index Fund
| |
| Statement of Operations | |
| |
| | Year Ended |
| | December 31, 2010 |
| | ($000) |
| Investment Income | |
| Income | |
| Dividends | 11,498 |
| Interest1 | 6 |
| Security Lending | 178 |
| Total Income | 11,682 |
| Expenses | |
| The Vanguard Group—Note B | |
| Investment Advisory Services | 151 |
| Management and Administrative—Investor Shares | 1,431 |
| Management and Administrative—ETF Shares | 497 |
| Marketing and Distribution—Investor Shares | 174 |
| Marketing and Distribution—ETF Shares | 204 |
| Custodian Fees | 76 |
| Auditing Fees | 26 |
| Shareholders’ Reports—Investor Shares | 12 |
| Shareholders’ Reports—ETF Shares | 54 |
| Trustees’ Fees and Expenses | 2 |
| Total Expenses | 2,627 |
| Net Investment Income | 9,055 |
| Realized Net Gain (Loss) on Investment Securities Sold | 51,868 |
| Change in Unrealized Appreciation (Depreciation) of Investment Securities | 326,737 |
| Net Increase (Decrease) in Net Assets Resulting from Operations | 387,660 |
| 1 Interest income from an affiliated company of the fund was $6,000. | |
See accompanying Notes, which are an integral part of the Financial Statements.
61
Mid-Cap Growth Index Fund
| | |
| Statement of Changes in Net Assets | | |
| |
| | Year Ended December 31, |
| | 2010 | 2009 |
| | ($000) | ($000) |
| Increase (Decrease) in Net Assets | | |
| Operations | | |
| Net Investment Income | 9,055 | 5,814 |
| Realized Net Gain (Loss) | 51,868 | (86,447) |
| Change in Unrealized Appreciation (Depreciation) | 326,737 | 415,760 |
| Net Increase (Decrease) in Net Assets Resulting from Operations | 387,660 | 335,127 |
| Distributions | | |
| Net Investment Income | | |
| Investor Shares | (3,888) | (2,593) |
| ETF Shares | (5,293) | (3,860) |
| Realized Capital Gain | | |
| Investor Shares | — | — |
| ETF Shares | — | — |
| Total Distributions | (9,181) | (6,453) |
| Capital Share Transactions | | |
| Investor Shares | 233,465 | 132,234 |
| ETF Shares | 184,112 | 42,626 |
| Net Increase (Decrease) from Capital Share Transactions | 417,577 | 174,860 |
| Total Increase (Decrease) | 796,056 | 503,534 |
| Net Assets | | |
| Beginning of Period | 1,191,538 | 688,004 |
| End of Period1 | 1,987,594 | 1,191,538 |
| 1 Net Assets—End of Period includes undistributed (overdistributed) net investment income of ($1,217,000) and ($1,017,000). | |
See accompanying Notes, which are an integral part of the Financial Statements.
62
Mid-Cap Growth Index Fund
| | | | | |
| Financial Highlights | | | | | |
| |
| Investor Shares | | | | | |
| | | | | | Aug. 24, |
| | | | | | 20061 to |
| For a Share Outstanding | Year Ended December 31, | Dec. 31, |
| Throughout Each Period | 2010 | 2009 | 2008 | 2007 | 2006 |
| Net Asset Value, Beginning of Period | $19.05 | $13.43 | $25.50 | $21.78 | $20.00 |
| Investment Operations | | | | | |
| Net Investment Income | .1042 | .084 | .059 | .0813 | .090 |
| Net Realized and Unrealized Gain (Loss) | | | | | |
| on Investments | 5.408 | 5.629 | (12.065) | 3.686 | 1.770 |
| Total from Investment Operations | 5.512 | 5.713 | (12.006) | 3.767 | 1.860 |
| Distributions | | | | | |
| Dividends from Net Investment Income | (.102) | (.093) | (.064) | (.047) | (.080) |
| Distributions from Realized Capital Gains | — | — | — | — | — |
| Total Distributions | (.102) | (.093) | (.064) | (.047) | (.080) |
| Net Asset Value, End of Period | $24.46 | $19.05 | $13.43 | $25.50 | $21.78 |
| |
| Total Return4 | 28.93% | 42.54% | -47.07% | 17.30% | 9.30% |
| |
| Ratios/Supplemental Data | | | | | |
| Net Assets, End of Period (Millions) | $958 | $546 | $275 | $389 | $24 |
| Ratio of Total Expenses to | | | | | |
| Average Net Assets | 0.26% | 0.30% | 0.25% | 0.24% | 0.26%5 |
| Ratio of Net Investment Income to | | | | | |
| Average Net Assets | 0.57%2 | 0.55% | 0.37% | 0.33% | 1.00%5 |
| Portfolio Turnover Rate6 | 38% | 43% | 54% | 56% | 20% |
1 Inception.
2 Net investment income per share and the ratio of net investment income to average net assets include $0.011 and 0.06%, respectively, resulting from a special dividend from VeriSign Inc. in December 2010.
3 Calculated based on average shares outstanding.
4 Total returns do not include account service fees that may have applied in the periods shown. Fund prospectuses provide information about any applicable account service fees.
5 Annualized.
6 Excludes the value of portfolio securities received or delivered as a result of in-kind purchases or redemptions of the fund’s capital shares, including ETF Creation Units.
See accompanying Notes, which are an integral part of the Financial Statements.
63
Mid-Cap Growth Index Fund
| | | | | |
| Financial Highlights | | | | | |
| |
| ETF Shares | | | | | |
| | | | | | Aug. 17, |
| | | | | | 20061 to |
| For a Share Outstanding | Year Ended December 31, | Dec. 31, |
| Throughout Each Period | 2010 | 2009 | 2008 | 2007 | 2006 |
| Net Asset Value, Beginning of Period | $48.45 | $34.12 | $64.85 | $55.35 | $51.55 |
| Investment Operations | | | | | |
| Net Investment Income | .3262 | .267 | .214 | .2753 | .228 |
| Net Realized and Unrealized Gain (Loss) | | | | | |
| on Investments | 13.776 | 14.353 | (30.717) | 9.378 | 3.783 |
| Total from Investment Operations | 14.102 | 14.620 | (30.503) | 9.653 | 4.011 |
| Distributions | | | | | |
| Dividends from Net Investment Income | (.322) | (.290) | (.227) | (.153) | (.211) |
| Distributions from Realized Capital Gains | — | — | — | — | — |
| Total Distributions | (.322) | (.290) | (.227) | (.153) | (.211) |
| Net Asset Value, End of Period | $62.23 | $48.45 | $34.12 | $64.85 | $55.35 |
| |
| Total Return | 29.11% | 42.85% | -47.02% | 17.44% | 7.78% |
| |
| Ratios/Supplemental Data | | | | | |
| Net Assets, End of Period (Millions) | $1,030 | $646 | $413 | $377 | $22 |
| Ratio of Total Expenses to | | | | | |
| Average Net Assets | 0.12% | 0.14% | 0.12% | 0.13% | 0.13%4 |
| Ratio of Net Investment Income to | | | | | |
| Average Net Assets | 0.71%2 | 0.71% | 0.50% | 0.44% | 1.13%4 |
| Portfolio Turnover Rate5 | 38% | 43% | 54% | 56% | 20% |
1 Inception.
2 Net investment income per share and the ratio of net investment income to average net assets include $0.028 and 0.06%, respectively, resulting from a special dividend from VeriSign Inc. in December 2010.
3 Calculated based on average shares outstanding.
4 Annualized.
5 Excludes the value of portfolio securities received or delivered as a result of in-kind purchases or redemptions of the fund’s capital shares, including ETF Creation Units.
See accompanying Notes, which are an integral part of the Financial Statements.
64
Mid-Cap Growth Index Fund
Notes to Financial Statements
Vanguard Mid-Cap Growth Index Fund is registered under the Investment Company Act of 1940 as an open-end investment company, or mutual fund. The fund offers two classes of shares: Investor Shares and ETF Shares. Investor Shares are available to any investor who meets the fund’s minimum purchase requirements. ETF Shares are listed for trading on the NYSE Arca, Inc.; they can be purchased and sold through a broker.
A. The following significant accounting policies conform to generally accepted accounting principles for U.S. mutual funds. The fund consistently follows such policies in preparing its financial statements.
1. Security Valuation: Securities are valued as of the close of trading on the New York Stock Exchange (generally 4 p.m., Eastern time) on the valuation date. Equity securities are valued at the latest quoted sales prices or official closing prices taken from the primary market in which each security trades; such securities not traded on the valuation date are valued at the mean of the latest quoted bid and asked prices. Securities for which market quotations are not readily available, or whose values have been materially affected by events occurring before the fund’s pricing time but after the close of the securities’ primary markets, are valued by methods deemed by the board of trustees to represent fair value. Investments in Vanguard Market Liquidity Fund are valued at that fund’s net asset value.
2. Federal Income Taxes: The fund intends to continue to qualify as a regulated investment company and distribute all of its taxable income. Management has analyzed the fund’s tax positions taken for all open federal income tax years (December 31, 2007–2010), and has concluded that no provision for federal income tax is required in the fund’s financial statements.
3. Distributions: Distributions to shareholders are recorded on the ex-dividend date.
4. Security Lending: The fund may lend its securities to qualified institutional borrowers to earn additional income. Security loans are required to be secured at all times by collateral at least equal to the market value of securities loaned. The fund invests cash collateral received in Vanguard Market Liquidity Fund, and records a liability for the return of the collateral, during the period the securities are on loan. Security lending income represents fees charged to borrowers plus income earned on investing cash collateral, less expenses associated with the loan.
5. Other: Dividend income is recorded on the ex-dividend date. Interest income includes income distributions received from Vanguard Market Liquidity Fund and is accrued daily. Security transactions are accounted for on the date securities are bought or sold. Costs used to determine realized gains (losses) on the sale of investment securities are those of the specific securities sold.
Each class of shares has equal rights as to assets and earnings, except that each class separately bears certain class-specific expenses related to maintenance of shareholder accounts (included in Management and Administrative expenses) and shareholder reporting. Marketing and distribution expenses are allocated to each class of shares based on a method approved by the board of trustees. Income, other non-class-specific expenses, and gains and losses on investments are allocated to each class of shares based on its relative net assets.
65
Mid-Cap Growth Index Fund
B. The Vanguard Group furnishes at cost investment advisory, corporate management, administrative, marketing, and distribution services. The costs of such services are allocated to the fund under methods approved by the board of trustees. The fund has committed to provide up to 0.40% of its net assets in capital contributions to Vanguard. At December 31, 2010, the fund had contributed capital of $305,000 to Vanguard (included in Other Assets), representing 0.02% of the fund’s net assets and 0.12% of Vanguard’s capitalization. The fund’s trustees and officers are also directors and officers of Vanguard.
C. Various inputs may be used to determine the value of the fund’s investments. These inputs are summarized in three broad levels for financial statement purposes. The inputs or methodologies used to value securities are not necessarily an indication of the risk associated with investing in those securities.
Level 1—Quoted prices in active markets for identical securities.
Level 2—Other significant observable inputs (including quoted prices for similar securities, interest rates, prepayment speeds, credit risk, etc.).
Level 3—Significant unobservable inputs (including the fund’s own assumptions used to determine the fair value of investments).
At December 31, 2010, 100% of the fund’s investments were valued based on Level 1 inputs.
D. Distributions are determined on a tax basis and may differ from net investment income and realized capital gains for financial reporting purposes. Differences may be permanent or temporary. Permanent differences are reclassified among capital accounts in the financial statements to reflect their tax character. Temporary differences arise when certain items of income, expense, gain, or loss are recognized in different periods for financial statement and tax purposes; these differences are primarily attributed to tax deferral of losses on wash sales and will reverse at some time in the future. Differences in classification may also result from the treatment of short-term gains as ordinary income for tax purposes.
During the year ended December 31, 2010, the fund realized $113,188,000 of net capital gains resulting from in-kind redemptions—in which shareholders exchanged fund shares for securities held by the fund rather than for cash. Because such gains are not taxable to the fund, and are not distributed to shareholders, they have been reclassified from accumulated net realized losses to paid-in capital.
For tax purposes, at December 31, 2010, the fund had $179,000 of ordinary income available for distribution. The fund had available capital loss carryforwards totaling $398,186,000 to offset future net capital gains of $35,000 through December 31, 2014, $480,000 through December 31, 2015, $48,884,000 through December 31, 2016, $265,769,000 through December 31, 2017, and $83,018,000 December 31, 2018. In addition, the fund realized losses of $5,204,000 during the period from November 1, 2010, through December 31, 2010, which are deferred and will be treated as realized for tax purposes in fiscal 2011.
66
Mid-Cap Growth Index Fund
At December 31, 2010, the cost of investment securities for tax purposes was $1,602,914,000. Net unrealized appreciation of investment securities for tax purposes was $398,900,000, consisting of unrealized gains of $431,299,000 on securities that had risen in value since their purchase and $32,399,000 in unrealized losses on securities that had fallen in value since their purchase.
E. During the year ended December 31, 2010, the fund purchased $1,329,254,000 of investment securities and sold $914,802,000 of investment securities, other than temporary cash investments.
F. Capital share transactions for each class of shares were:
| | | | |
| | | | Year Ended December 31, |
| | | 2010 | | 2009 |
| | Amount | Shares | Amount | Shares |
| | ($000) | (000) | ($000) | (000) |
| Investor Shares | | | | |
| Issued | 414,672 | 19,377 | 239,949 | 15,221 |
| Issued in Lieu of Cash Distributions | 3,641 | 148 | 2,408 | 126 |
| Redeemed | (184,848) | (9,015) | (110,123) | (7,151) |
| Net Increase (Decrease)—Investor Shares | 233,465 | 10,510 | 132,234 | 8,196 |
| ETF Shares | | | | |
| Issued | 579,606 | 10,619 | 310,206 | 8,211 |
| Issued in Lieu of Cash Distributions | — | — | — | — |
| Redeemed | (395,494) | (7,400) | (267,580) | (7,000) |
| Net Increase (Decrease)—ETF Shares | 184,112 | 3,219 | 42,626 | 1,211 |
G. In preparing the financial statements as of December 31, 2010, management considered the impact of subsequent events for potential recognition or disclosure in these financial statements.
67
Mid-Cap Value Index Fund
Fund Profile
As of December 31, 2010
| | |
| Share-Class Characteristics | |
| |
| | Investor | ETF |
| | Shares | Shares |
| Ticker Symbol | VMVIX | VOE |
| Expense Ratio1 | 0.30% | 0.14% |
| 30-Day SEC Yield | 1.56% | 1.70% |
| | | |
| Portfolio Characteristics | | |
| | | | DJ |
| | | MSCI US | U.S. Total |
| | | Mid Cap | Market |
| | Fund | Value Index | Index |
| Number of Stocks | 263 | 263 | 3,893 |
| Median Market Cap | $5.3B | $5.3B | $29.6B |
| Price/Earnings Ratio | 17.8x | 17.8x | 18.3x |
| Price/Book Ratio | 1.6x | 1.6x | 2.2x |
| Return on Equity | 11.3% | 11.3% | 18.8% |
| Earnings Growth Rate | 0.3% | 0.3% | 6.2% |
| Dividend Yield | 2.1% | 2.1% | 1.7% |
| Foreign Holdings | 0.0% | 0.0% | 0.0% |
| Turnover Rate | 37% | — | — |
| Short-Term Reserves | 0.1% | — | — |
| | | |
| Sector Diversification (% of equity exposure) |
| | | MSCI US | DJ |
| | | Mid Cap | U.S. Total |
| | | Value | Market |
| | Fund | Index | Index |
| Consumer | | | |
| Discretionary | 11.9% | 11.9% | 11.9% |
| Consumer Staples | 5.6 | 5.6 | 9.5 |
| Energy | 5.0 | 5.0 | 10.6 |
| Financials | 29.1 | 29.1 | 16.6 |
| Health Care | 5.2 | 5.2 | 10.7 |
| Industrials | 10.0 | 10.0 | 11.4 |
| Information | | | |
| Technology | 11.4 | 11.4 | 18.9 |
| Materials | 8.2 | 8.2 | 4.5 |
| Telecommunication | | | |
| Services | 1.9 | 1.9 | 2.7 |
| Utilities | 11.7 | 11.7 | 3.2 |
| | |
| Volatility Measures | | |
| | | DJ |
| | MSCI US | U.S. Total |
| | Mid Cap | Market |
| | Value Index | Index |
| R-Squared | 1.00 | 0.96 |
| Beta | 1.00 | 1.15 |
These measures show the degree and timing of the fund’s fluctuations compared with the indexes over 36 months.
| | |
| Ten Largest Holdings (% of total net assets) |
| Goodrich Corp. | Aerospace & | |
| | Defense | 1.0% |
| Dover Corp. | Industrial | |
| | Machinery | 1.0 |
| Cliffs Natural Resources | Steel | |
| Inc. | | 1.0 |
| Cooper Industries plc | Electrical | |
| | Components & | |
| | Equipment | 0.9 |
| Frontier | Integrated | |
| Communications Corp. | Telecommunication | |
| | Services | 0.9 |
| Humana Inc. | Managed Health | |
| | Care | 0.8 |
| Fortune Brands Inc. | Housewares & | |
| | Specialties | 0.8 |
| Mattel Inc. | Leisure Products | 0.8 |
| Liberty Media Corp. - | Catalog Retail | |
| Interactive | | 0.8 |
| Lincoln National Corp. | Life & Health | |
| | Insurance | 0.8 |
| Top Ten | | 8.8% |
The holdings listed exclude any temporary cash investments and equity index products.
Investment Focus
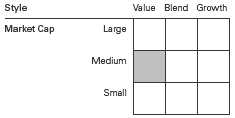
1 The expense ratios shown are from the prospectus dated April 29, 2010, and represent estimated costs for the current fiscal year. For the fiscal year ended December 31, 2010, the expense ratios were 0.26% for Investor Shares and 0.12% for ETF Shares.
68
Mid-Cap Value Index Fund
Performance Summary
All of the returns in this report represent past performance, which is not a guarantee of future results that may be achieved by the fund. (Current performance may be lower or higher than the performance data cited. For performance data current to the most recent month-end, visit our website at vanguard.com/performance.) Note, too, that both investment returns and principal value can fluctuate widely, so an investor’s shares, when sold, could be worth more or less than their original cost. The returns shown do not reflect taxes that a shareholder would pay on fund distributions or on the sale of fund shares.
Cumulative Performance: August 24, 2006, Through December 31, 2010
Initial Investment of $10,000
| | | | |
| | | Average Annual Total Returns | |
| | | Periods Ended December 31, 2010 | |
| | | | Since | Final Value |
| | | One | Inception | of a $10,000 |
| | | Year | (8/24/2006) | Investment |
| | Mid-Cap Value Index Fund Investor | | | |
| | Shares | 21.63% | 3.05% | $11,399 |
| •••••••• | Dow Jones U.S. Total Stock Market | | | |
| | Index | 17.70 | 2.63 | 11,194 |
| – – – – | MSCI US Mid Cap Value Index | 21.96 | 3.22 | 11,481 |
| | Mid-Cap Value Funds Average | 22.39 | 3.50 | 11,615 |
Mid-Cap Value Funds Average: Derived from data provided by Lipper Inc.
"Since Inception" performance is calculated from the Investor Shares’ inception date for both the fund and its comparative standards.
| | | |
| | | Since | Final Value |
| | One | Inception | of a $10,000 |
| | Year | (8/17/2006) | Investment |
| Mid-Cap Value Index Fund | | | |
| ETF Shares Net Asset Value | 21.83% | 3.05% | $11,404 |
| Dow Jones U.S. Total Stock Market Index | 17.70 | 2.52 | 11,151 |
| MSCI US Mid Cap Value Index | 21.96 | 3.08 | 11,418 |
| "Since Inception" performance is calculated from the ETF Shares’ inception date for both the fund and its comparative standards. |
See Financial Highlights for dividend and capital gains information.
69
Mid-Cap Value Index Fund
| | |
| Cumulative Returns of ETF Shares: August 17, 2006, Through December 31, 2010 | |
| | | Since |
| | One | Inception |
| | Year | (8/17/2006) |
| Mid-Cap Value Index Fund | | |
| ETF Shares Market Price | 21.80% | 14.10% |
| Mid-Cap Value Index Fund | | |
| ETF Shares Net Asset Value | 21.83 | 14.04 |
| MSCI US Mid Cap Value Index | 21.96 | 14.18 |
| "Since Inception" performance is calculated from the ETF Shares’ inception date for both the fund and its comparative standard. | |
Fiscal-Year Total Returns (%): August 24, 2006, Through December 31, 2010
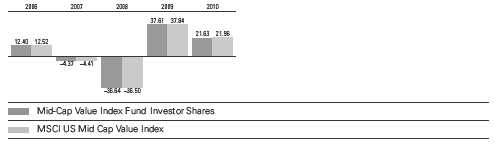
70
Mid-Cap Value Index Fund
Financial Statements
Statement of Net Assets
As of December 31, 2010
The fund reports a complete list of its holdings in regulatory filings four times in each fiscal year, at the quarter-ends. For the second and fourth fiscal quarters, the lists appear in the fund’s semiannual and annual reports to shareholders. For the first and third fiscal quarters, the fund files the lists with the Securities and Exchange Commission on Form N-Q. Shareholders can look up the fund’s Forms N-Q on the SEC’s website at sec.gov. Forms N-Q may also be reviewed and copied at the SEC’s Public Reference Room (see the back cover of this report for further information).
| | | |
| | | | Market |
| | | | Value |
| | | Shares | ($000) |
| Common Stocks (100.0%) | | |
| Consumer Discretionary (11.9%) | |
| | Fortune Brands Inc. | 199,126 | 11,997 |
| | Mattel Inc. | 470,278 | 11,959 |
| * | Liberty Media | | |
| | Corp. - Interactive | 743,726 | 11,729 |
| | Limited Brands Inc. | 361,404 | 11,106 |
| | Genuine Parts Co. | 206,015 | 10,577 |
| | Whirlpool Corp. | 99,321 | 8,823 |
| | Darden Restaurants Inc. | 171,928 | 7,984 |
| | Hasbro Inc. | 164,499 | 7,761 |
| | Wyndham Worldwide Corp. | 233,436 | 6,994 |
| | Newell Rubbermaid Inc. | 363,601 | 6,610 |
| * | Royal Caribbean Cruises Ltd. | 118,831 | 5,585 |
| | H&R Block Inc. | 403,372 | 4,804 |
| | Gannett Co. Inc. | 311,927 | 4,707 |
| | DR Horton Inc. | 374,640 | 4,469 |
| | Leggett & Platt Inc. | 191,484 | 4,358 |
| * | Mohawk Industries Inc. | 76,192 | 4,325 |
| * | GameStop Corp. Class A | 186,835 | 4,275 |
| | Foot Locker Inc. | 204,257 | 4,008 |
| | Lennar Corp. Class A | 200,654 | 3,762 |
| | Washington Post Co. | | |
| | Class B | 7,728 | 3,397 |
| * | Pulte Group Inc. | 449,881 | 3,383 |
| | Autoliv Inc. | 40,518 | 3,199 |
| | Brinker International Inc. | 132,889 | 2,775 |
| * | NVR Inc. | 3,640 | 2,515 |
| * | TRW Automotive | | |
| | Holdings Corp. | 47,400 | 2,498 |
| * | Toll Brothers Inc. | 119,514 | 2,271 |
| * | Lear Corp. | 22,652 | 2,236 |
| * | Harman International | | |
| | Industries Inc. | 45,494 | 2,106 |
| | Phillips-Van Heusen Corp. | 30,367 | 1,913 |
| | American Eagle | | |
| | Outfitters Inc. | 121,205 | 1,773 |
| *,^ | AutoNation Inc. | 57,418 | 1,619 |
| * | Penn National Gaming Inc. | 43,318 | 1,523 |
| | | |
| | | | Market |
| | | | Value |
| | | Shares | ($000) |
| * | Lamar Advertising Co. | | |
| | Class A | 26,422 | 1,053 |
| * | Hyatt Hotels Corp. Class A | 20,201 | 924 |
| | Wendy’s/Arby’s Group Inc. | | |
| | Class A | 152,696 | 705 |
| * | Clear Channel Outdoor | | |
| | Holdings Inc. Class A | 18,682 | 262 |
| | | | 169,985 |
| Consumer Staples (5.6%) | | |
| | Bunge Ltd. | 174,170 | 11,412 |
| | Coca-Cola Enterprises Inc. | 447,959 | 11,212 |
| | JM Smucker Co. | 156,141 | 10,251 |
| | McCormick & Co. Inc. | 157,831 | 7,344 |
| | Tyson Foods Inc. Class A | 381,656 | 6,572 |
| | Church & Dwight Co. Inc. | 92,802 | 6,405 |
| | Dr Pepper Snapple | | |
| | Group Inc. | 156,081 | 5,488 |
| * | Constellation Brands Inc. | | |
| | Class A | 244,704 | 5,420 |
| * | Ralcorp Holdings Inc. | 71,787 | 4,667 |
| * | Smithfield Foods Inc. | 195,148 | 4,026 |
| | Hormel Foods Corp. | 62,274 | 3,192 |
| | SUPERVALU Inc. | 277,007 | 2,667 |
| * | Dean Foods Co. | 237,635 | 2,101 |
| | | | 80,757 |
| Energy (5.0%) | | |
| | Cimarex Energy Co. | 109,949 | 9,734 |
| * | Pride International Inc. | 229,494 | 7,573 |
| | El Paso Corp. | 459,916 | 6,329 |
| * | Newfield Exploration Co. | 87,342 | 6,298 |
| * | Denbury Resources Inc. | 322,203 | 6,151 |
| * | Plains Exploration & | | |
| | Production Co. | 183,235 | 5,889 |
| * | Rowan Cos. Inc. | 149,817 | 5,230 |
| | Patterson-UTI Energy Inc. | 201,579 | 4,344 |
| | Southern Union Co. | 154,714 | 3,724 |
| | Tidewater Inc. | 67,274 | 3,622 |
| * | Kinder Morgan | | |
| | Management LLC | 53,086 | 3,550 |
71
Mid-Cap Value Index Fund
| | | |
| | | | Market |
| | | | Value |
| | | Shares | ($000) |
| * | Tesoro Corp. | 186,600 | 3,460 |
| * | Nabors Industries Ltd. | 130,366 | 3,058 |
| * | Forest Oil Corp. | 49,155 | 1,867 |
| | | | 70,829 |
| Financials (29.1%) | | |
| | Lincoln National Corp. | 414,066 | 11,515 |
| | Regions Financial Corp. | 1,641,940 | 11,494 |
| | Ventas Inc. | 205,275 | 10,773 |
| | ProLogis | 728,255 | 10,516 |
| | Unum Group | 427,282 | 10,349 |
| | New York Community | | |
| | Bancorp Inc. | 540,982 | 10,197 |
| | KeyCorp | 1,150,805 | 10,185 |
| | XL Group plc Class A | 447,204 | 9,758 |
| | Comerica Inc. | 230,572 | 9,739 |
| | Kimco Realty Corp. | 530,599 | 9,572 |
| * | American International | | |
| | Group Inc. | 159,004 | 9,162 |
| | Health Care REIT Inc. | 189,515 | 9,028 |
| * | Genworth Financial Inc. | | |
| | Class A | 639,391 | 8,402 |
| | Macerich Co. | 169,997 | 8,053 |
| * | SLM Corp. | 634,659 | 7,990 |
| | Plum Creek Timber Co. Inc. | 211,341 | 7,915 |
| | Huntington Bancshares Inc. | 1,128,674 | 7,754 |
| | Willis Group Holdings plc | 222,552 | 7,707 |
| | PartnerRe Ltd. | 93,911 | 7,546 |
| | Leucadia National Corp. | 254,377 | 7,423 |
| | Legg Mason Inc. | 202,071 | 7,329 |
| | AMB Property Corp. | 220,024 | 6,977 |
| | SL Green Realty Corp. | 102,214 | 6,900 |
| | People’s United | | |
| | Financial Inc. | 484,621 | 6,789 |
| | Cincinnati Financial Corp. | 202,068 | 6,403 |
| | Torchmark Corp. | 105,658 | 6,312 |
| | AvalonBay Communities Inc. | 55,686 | 6,267 |
| | Federal Realty | | |
| | Investment Trust | 80,273 | 6,256 |
| | Everest Re Group Ltd. | 73,561 | 6,239 |
| | Nationwide Health | | |
| | Properties Inc. | 161,814 | 5,887 |
| * | Arch Capital Group Ltd. | 64,986 | 5,722 |
| | UDR Inc. | 234,560 | 5,517 |
| | Rayonier Inc. | 104,923 | 5,511 |
| | Zions Bancorporation | 226,509 | 5,488 |
| | Chimera Investment Corp. | 1,317,253 | 5,414 |
| | Assurant Inc. | 139,325 | 5,367 |
| | Axis Capital Holdings Ltd. | 149,033 | 5,347 |
| | Realty Income Corp. | 153,125 | 5,237 |
| | Reinsurance Group of | | |
| | America Inc. Class A | 95,656 | 5,138 |
| | WR Berkley Corp. | 174,575 | 4,780 |
| | Liberty Property Trust | 148,675 | 4,746 |
| * | Markel Corp. | 12,141 | 4,591 |
| | RenaissanceRe Holdings Ltd. | 71,706 | 4,567 |
| | | |
| | | | Market |
| | | | Value |
| | | Shares | ($000) |
| | Marshall & Ilsley Corp. | 654,682 | 4,530 |
| | Regency Centers Corp. | 107,087 | 4,523 |
| | Old Republic | | |
| | International Corp. | 321,469 | 4,382 |
| | HCC Insurance Holdings Inc. | 150,697 | 4,361 |
| | Cullen/Frost Bankers Inc. | 71,325 | 4,359 |
| | Transatlantic Holdings Inc. | 83,378 | 4,304 |
| | Raymond James Financial Inc. | 129,965 | 4,250 |
| * | NASDAQ OMX Group Inc. | 172,310 | 4,085 |
| | Jefferies Group Inc. | 145,969 | 3,887 |
| | Fidelity National | | |
| | Financial Inc. Class A | 283,435 | 3,877 |
| | Commerce Bancshares Inc. | 97,174 | 3,861 |
| | Digital Realty Trust Inc. | 74,263 | 3,827 |
| | City National Corp. | 61,278 | 3,760 |
| | Hospitality Properties Trust | 161,398 | 3,719 |
| | Assured Guaranty Ltd. | 204,221 | 3,615 |
| | Weingarten Realty Investors | 149,369 | 3,549 |
| | Alexandria Real Estate | | |
| | Equities Inc. | 46,036 | 3,373 |
| | White Mountains | | |
| | Insurance Group Ltd. | 9,949 | 3,339 |
| | Associated Banc-Corp | 214,582 | 3,251 |
| | American Financial | | |
| | Group Inc. | 99,222 | 3,204 |
| | Federated Investors Inc. | | |
| | Class B | 121,271 | 3,174 |
| | Duke Realty Corp. | 213,479 | 2,660 |
| * | First Horizon National Corp. | 221,469 | 2,609 |
| | Piedmont Office Realty | | |
| | Trust Inc. Class A | 121,772 | 2,452 |
| | Validus Holdings Ltd. | 79,442 | 2,432 |
| | Capitol Federal Financial Inc. | 187,140 | 2,229 |
| | BOK Financial Corp. | 35,647 | 1,904 |
| | Mercury General Corp. | 35,893 | 1,544 |
| * | LPL Investment Holdings Inc. | 20,934 | 761 |
| | | | 415,683 |
| Health Care (5.2%) | | |
| * | Humana Inc. | 221,246 | 12,111 |
| | Beckman Coulter Inc. | 90,491 | 6,808 |
| * | Hologic Inc. | 338,578 | 6,372 |
| * | Coventry Health Care Inc. | 193,903 | 5,119 |
| | Universal Health Services | | |
| | Inc. Class B | 117,457 | 5,100 |
| * | King Pharmaceuticals Inc. | 326,473 | 4,587 |
| | Pharmaceutical Product | | |
| | Development Inc. | 147,656 | 4,007 |
| | Omnicare Inc. | 154,556 | 3,924 |
| * | Alere Inc. | 105,342 | 3,856 |
| * | CareFusion Corp. | 145,205 | 3,732 |
| * | Kinetic Concepts Inc. | 84,585 | 3,542 |
| * | Endo Pharmaceuticals | | |
| | Holdings Inc. | 97,975 | 3,499 |
| * | Charles River Laboratories | | |
| | International Inc. | 86,686 | 3,081 |
72
Mid-Cap Value Index Fund
| | | |
| | | | Market |
| | | | Value |
| | | Shares | ($000) |
| * | Cephalon Inc. | 49,091 | 3,030 |
| * | Community Health | | |
| | Systems Inc. | 61,747 | 2,307 |
| | Lincare Holdings Inc. | 83,312 | 2,235 |
| | Warner Chilcott plc Class A | 51,773 | 1,168 |
| | | | 74,478 |
| Industrials (10.0%) | | |
| | Goodrich Corp. | 163,827 | 14,428 |
| | Dover Corp. | 244,087 | 14,267 |
| | Cooper Industries plc | 218,053 | 12,710 |
| * | United Continental | | |
| | Holdings Inc. | 413,232 | 9,843 |
| | Rockwell Automation Inc. | 92,764 | 6,652 |
| | Pitney Bowes Inc. | 270,293 | 6,536 |
| | KBR Inc. | 204,177 | 6,221 |
| | Masco Corp. | 470,288 | 5,954 |
| | Equifax Inc. | 163,394 | 5,817 |
| | Avery Dennison Corp. | 129,369 | 5,478 |
| | Timken Co. | 107,580 | 5,135 |
| | Cintas Corp. | 179,941 | 5,031 |
| | Pentair Inc. | 129,073 | 4,713 |
| | RR Donnelley & Sons Co. | 269,723 | 4,712 |
| * | URS Corp. | 109,560 | 4,559 |
| | Pall Corp. | 76,370 | 3,786 |
| | Ryder System Inc. | 68,570 | 3,610 |
| | Towers Watson & Co. | | |
| | Class A | 67,343 | 3,506 |
| * | Aecom Technology Corp. | 121,322 | 3,393 |
| | Manpower Inc. | 53,811 | 3,377 |
| * | Owens Corning | 98,171 | 3,058 |
| | Harsco Corp. | 105,213 | 2,980 |
| * | Hertz Global Holdings Inc. | 192,362 | 2,787 |
| | SPX Corp. | 32,735 | 2,340 |
| * | Terex Corp. | 71,095 | 2,207 |
| | | | 143,100 |
| Information Technology (11.4%) | |
| | Computer Sciences Corp. | 201,923 | 10,015 |
| * | Micron Technology Inc. | 1,169,705 | 9,381 |
| * | Seagate Technology plc | 616,812 | 9,271 |
| | Maxim Integrated | | |
| | Products Inc. | 390,061 | 9,213 |
| | KLA-Tencor Corp. | 219,472 | 8,480 |
| | Microchip Technology Inc. | 242,963 | 8,312 |
| * | Flextronics | | |
| | International Ltd. | 1,026,952 | 8,062 |
| * | SAIC Inc. | 496,864 | 7,880 |
| | Harris Corp. | 168,666 | 7,641 |
| * | Avnet Inc. | 198,555 | 6,558 |
| * | Lam Research Corp. | 105,541 | 5,465 |
| * | Arrow Electronics Inc. | 154,057 | 5,276 |
| * | Synopsys Inc. | 192,935 | 5,192 |
| | Jabil Circuit Inc. | 255,708 | 5,137 |
| * | Western Digital Corp. | 149,913 | 5,082 |
| * | LSI Corp. | 838,625 | 5,023 |
| | | |
| | | | Market |
| | | | Value |
| | | Shares | ($000) |
| | Xilinx Inc. | 169,253 | 4,905 |
| | National | | |
| | Semiconductor Corp. | 312,879 | 4,305 |
| * | Advanced Micro | | |
| | Devices Inc. | 486,728 | 3,981 |
| * | Ingram Micro Inc. | 204,634 | 3,907 |
| * | Novellus Systems Inc. | 120,048 | 3,880 |
| * | Lexmark International Inc. | | |
| | Class A | 102,727 | 3,577 |
| * | IAC/InterActiveCorp | 120,019 | 3,445 |
| | Total System Services Inc. | 219,158 | 3,371 |
| * | AOL Inc. | 139,626 | 3,311 |
| | Tellabs Inc. | 473,197 | 3,208 |
| * | Electronic Arts Inc. | 150,893 | 2,472 |
| | Molex Inc. | 81,042 | 1,841 |
| | Molex Inc. Class A | 97,402 | 1,838 |
| | Lender Processing | �� | |
| | Services Inc. | 60,886 | 1,797 |
| | DST Systems Inc. | 24,512 | 1,087 |
| | | | 162,913 |
| Materials (8.2%) | | |
| | Cliffs Natural Resources Inc. | 177,094 | 13,815 |
| | Walter Energy Inc. | 69,233 | 8,851 |
| | Eastman Chemical Co. | 94,393 | 7,937 |
| | Vulcan Materials Co. | 167,619 | 7,436 |
| * | Owens-Illinois Inc. | 213,719 | 6,561 |
| | Airgas Inc. | 103,921 | 6,491 |
| | Albemarle Corp. | 107,429 | 5,992 |
| | MeadWestvaco Corp. | 223,179 | 5,838 |
| | International Flavors & | | |
| | Fragrances Inc. | 104,346 | 5,801 |
| | Sealed Air Corp. | 208,678 | 5,311 |
| | Ashland Inc. | 97,718 | 4,970 |
| | Steel Dynamics Inc. | 269,399 | 4,930 |
| | Reliance Steel & | | |
| | Aluminum Co. | 92,330 | 4,718 |
| | FMC Corp. | 58,544 | 4,677 |
| | Bemis Co. Inc. | 142,762 | 4,663 |
| | Sonoco Products Co. | 131,576 | 4,430 |
| | Valspar Corp. | 123,438 | 4,256 |
| | United States Steel Corp. | 65,671 | 3,836 |
| | Martin Marietta | | |
| | Materials Inc. | 38,713 | 3,571 |
| | Greif Inc. Class A | 32,171 | 1,991 |
| * | Titanium Metals Corp. | 41,052 | 705 |
| | | | 116,780 |
| Telecommunication Services (1.9%) | |
| | Frontier | | |
| | Communications Corp. | 1,296,668 | 12,617 |
| | Windstream Corp. | 631,692 | 8,806 |
| | Telephone & Data | | |
| | Systems Inc. | 65,047 | 2,377 |
| | Telephone & Data | | |
| | Systems Inc. | 58,409 | 1,841 |
73
Mid-Cap Value Index Fund
| | | |
| | | | Market |
| | | | Value |
| | | Shares | ($000) |
| * | United States Cellular Corp. | 24,332 | 1,215 |
| * | Clearwire Corp. Class A | 66,613 | 343 |
| | | | 27,199 |
| Utilities (11.7%) | | |
| | DTE Energy Co. | 220,587 | 9,997 |
| | Wisconsin Energy Corp. | 152,764 | 8,992 |
| | Ameren Corp. | 312,745 | 8,816 |
| | CenterPoint Energy Inc. | 523,843 | 8,235 |
| | Constellation Energy | | |
| | Group Inc. | 250,721 | 7,680 |
| | Northeast Utilities | 230,229 | 7,340 |
| | Oneok Inc. | 132,146 | 7,330 |
| * | NRG Energy Inc. | 330,860 | 6,465 |
| | NiSource Inc. | 363,232 | 6,400 |
| | SCANA Corp. | 157,181 | 6,382 |
| | National Fuel Gas Co. | 91,043 | 5,974 |
| | Pinnacle West Capital Corp. | 142,038 | 5,888 |
| | OGE Energy Corp. | 127,283 | 5,796 |
| | American Water | | |
| | Works Co. Inc. | 228,503 | 5,779 |
| | NSTAR | 135,462 | 5,715 |
| | CMS Energy Corp. | 300,975 | 5,598 |
| | Allegheny Energy Inc. | 221,806 | 5,377 |
| | Pepco Holdings Inc. | 292,534 | 5,339 |
| | Alliant Energy Corp. | 144,836 | 5,326 |
| | Integrys Energy Group Inc. | 101,034 | 4,901 |
| | TECO Energy Inc. | 266,535 | 4,744 |
| | MDU Resources Group Inc. | 233,761 | 4,738 |
| | UGI Corp. | 143,739 | 4,539 |
| | NV Energy Inc. | 307,423 | 4,319 |
| | Energen Corp. | 89,379 | 4,313 |
| | Aqua America Inc. | 179,480 | 4,035 |
| | DPL Inc. | 155,348 | 3,994 |
| | AGL Resources Inc. | 101,962 | 3,655 |
| | | | 167,667 |
| Total Common Stocks | | |
| (Cost $1,192,360) | | 1,429,391 |
| Temporary Cash Investments (0.3%) | |
| Money Market Fund (0.3%) | | |
| 1,2 | Vanguard Market | | |
| | Liquidity Fund, 0.211% 3,630,575 | 3,631 |
| | |
| | Face | Market |
| | Amount | Value |
| | ($000) | ($000) |
| U.S. Government and Agency Obligations (0.0%) |
| 3 Freddie Mac Discount | | |
| Notes, 0.281%, 6/21/11 | 100 | 100 |
| Total Temporary Cash Investments | |
| (Cost $3,731) | | 3,731 |
| Total Investments (100.3%) | | |
| (Cost $1,196,091) | | 1,433,122 |
| Other Assets and Liabilities (-0.3%) | |
| Other Assets | | 3,520 |
| Liabilities2 | | (7,725) |
| | | (4,205) |
| Net Assets (100%) | | 1,428,917 |
| |
| At December 31, 2010, net assets consisted of: |
| | Amount |
| | ($000) |
| Paid-in Capital | 1,446,703 |
| Overdistributed Net Investment Income | (1,025) |
| Accumulated Net Realized Losses | (253,792) |
| Unrealized Appreciation (Depreciation) | 237,031 |
| Net Assets | 1,428,917 |
| |
| Investor Shares—Net Assets | |
| Applicable to 32,761,452 outstanding | |
| $.001 par value shares of beneficial | |
| interest (unlimited authorization) | 683,227 |
| Net Asset Value Per Share— | |
| Investor Shares | $20.85 |
| |
| ETF Shares—Net Assets | |
| Applicable to 14,076,418 outstanding | |
| $.001 par value shares of beneficial | |
| interest (unlimited authorization) | 745,690 |
| Net Asset Value Per Share— | |
| ETF Shares | $52.97 |
See Note A in Notes to Financial Statements.
* Non-income-producing security.
^ Part of security position is on loan to broker-dealers. The total value of securities on loan is $1,548,000.
1 Affiliated money market fund available only to Vanguard funds and certain trusts and accounts managed by Vanguard. Rate shown is the 7-day yield.
2 Includes $1,647,000 of collateral received for securities on loan.
3 The issuer operates under a congressional charter; its securities are not backed by the full faith and credit of the U.S. government.
REIT—Real Estate Investment Trust.
See accompanying Notes, which are an integral part of the Financial Statements.
74
Mid-Cap Value Index Fund
| |
| Statement of Operations | |
| |
| | Year Ended |
| | December 31, 2010 |
| | ($000) |
| Investment Income | |
| Income | |
| Dividends | 27,934 |
| Interest1 | 4 |
| Security Lending | 239 |
| Total Income | 28,177 |
| Expenses | |
| The Vanguard Group—Note B | |
| Investment Advisory Services | 146 |
| Management and Administrative—Investor Shares | 1,196 |
| Management and Administrative—ETF Shares | 391 |
| Marketing and Distribution—Investor Shares | 160 |
| Marketing and Distribution—ETF Shares | 191 |
| Custodian Fees | 134 |
| Auditing Fees | 28 |
| Shareholders’ Reports—Investor Shares | 16 |
| Shareholders’ Reports—ETF Shares | 55 |
| Trustees’ Fees and Expenses | 2 |
| Total Expenses | 2,319 |
| Net Investment Income | 25,858 |
| Realized Net Gain (Loss) on Investment Securities Sold | 59,785 |
| Change in Unrealized Appreciation (Depreciation) of Investment Securities | 160,809 |
| Net Increase (Decrease) in Net Assets Resulting from Operations | 246,452 |
| 1 Interest income from an affiliated company of the fund was $4,000. | |
See accompanying Notes, which are an integral part of the Financial Statements.
75
Mid-Cap Value Index Fund
| | |
| Statement of Changes in Net Assets | | |
| |
| | Year Ended December 31, |
| | 2010 | 2009 |
| | ($000) | ($000) |
| Increase (Decrease) in Net Assets | | |
| Operations | | |
| Net Investment Income | 25,858 | 18,029 |
| Realized Net Gain (Loss) | 59,785 | 841 |
| Change in Unrealized Appreciation (Depreciation) | 160,809 | 285,591 |
| Net Increase (Decrease) in Net Assets Resulting from Operations | 246,452 | 304,461 |
| Distributions | | |
| Net Investment Income | | |
| Investor Shares | (12,041) | (8,157) |
| ETF Shares | (14,165) | (10,955) |
| Realized Capital Gain | | |
| Investor Shares | — | — |
| ETF Shares | — | — |
| Total Distributions | (26,206) | (19,112) |
| Capital Share Transactions | | |
| Investor Shares | 121,110 | 127,845 |
| ETF Shares | 45,225 | 53,303 |
| Net Increase (Decrease) from Capital Share Transactions | 166,335 | 181,148 |
| Total Increase (Decrease) | 386,581 | 466,497 |
| Net Assets | | |
| Beginning of Period | 1,042,336 | 575,839 |
| End of Period1 | 1,428,917 | 1,042,336 |
| 1 Net Assets—End of Period includes undistributed (overdistributed) net investment income of ($1,025,000) and ($677,000). | |
See accompanying Notes, which are an integral part of the Financial Statements.
76
Mid-Cap Value Index Fund
| | | | | |
| Financial Highlights | | | | | |
| |
| Investor Shares | | | | | |
| | | | | | Aug. 24, |
| | | | | | 20061 to |
| For a Share Outstanding | Year Ended December 31, | Dec. 31, |
| Throughout Each Period | 2010 | 2009 | 2008 | 2007 | 2006 |
| Net Asset Value, Beginning of Period | $17.45 | $12.92 | $20.95 | $22.34 | $20.00 |
| Investment Operations | | | | | |
| Net Investment Income | .371 | .300 | .4662 | .427 | .140 |
| Net Realized and Unrealized Gain (Loss) | | | | | |
| on Investments | 3.403 | 4.551 | (8.156) | (1.407) | 2.340 |
| Total from Investment Operations | 3.774 | 4.851 | (7.690) | (.980) | 2.480 |
| Distributions | | | | | |
| Dividends from Net Investment Income | (.374) | (.321) | (.340) | (.410) | (.140) |
| Distributions from Realized Capital Gains | — | — | — | — | — |
| Total Distributions | (.374) | (.321) | (.340) | (.410) | (.140) |
| Net Asset Value, End of Period | $20.85 | $17.45 | $12.92 | $20.95 | $22.34 |
| |
| Total Return3 | 21.63% | 37.61% | -36.64% | -4.37% | 12.40% |
| |
| Ratios/Supplemental Data | | | | | |
| Net Assets, End of Period (Millions) | $683 | $459 | $217 | $195 | $65 |
| Ratio of Total Expenses to | | | | | |
| Average Net Assets | 0.26% | 0.30% | 0.25% | 0.24% | 0.26%4 |
| Ratio of Net Investment Income to | | | | | |
| Average Net Assets | 1.99% | 2.14% | 2.73% | 2.48% | 2.50%4 |
| Portfolio Turnover Rate5 | 37% | 47% | 45% | 46% | 16% |
1 Inception.
2 Calculated based on average shares outstanding.
3 Total returns do not include account service fees that may have applied in the periods shown. Fund prospectuses provide information about any applicable account service fees.
4 Annualized.
5 Excludes the value of portfolio securities received or delivered as a result of in-kind purchases or redemptions of the fund’s capital shares, including ETF Creation Units.
See accompanying Notes, which are an integral part of the Financial Statements.
77
Mid-Cap Value Index Fund
| | | | | |
| Financial Highlights | | | | | |
| |
| ETF Shares | | | | | |
| | | | | | Aug. 17, |
| | | | | | 20061 to |
| For a Share Outstanding | Year Ended December 31, | Dec. 31, |
| Throughout Each Period | 2010 | 2009 | 2008 | 2007 | 2006 |
| Net Asset Value, Beginning of Period | $44.31 | $32.80 | $53.16 | $56.67 | $51.00 |
| Investment Operations | | | | | |
| Net Investment Income | 1.004 | .812 | 1.2612 | 1.133 | .373 |
| Net Realized and Unrealized Gain (Loss) | | | | | |
| on Investments | 8.669 | 11.562 | (20.716) | (3.553) | 5.661 |
| Total from Investment Operations | 9.673 | 12.374 | (19.455) | (2.420) | 6.034 |
| Distributions | | | | | |
| Dividends from Net Investment Income | (1.013) | (.864) | (.905) | (1.090) | (.364) |
| Distributions from Realized Capital Gains | — | — | — | — | — |
| Total Distributions | (1.013) | (.864) | (.905) | (1.090) | (.364) |
| Net Asset Value, End of Period | $52.97 | $44.31 | $32.80 | $53.16 | $56.67 |
| |
| Total Return | 21.83% | 37.75% | -36.53% | -4.27% | 11.84% |
| |
| Ratios/Supplemental Data | | | | | |
| Net Assets, End of Period (Millions) | $746 | $583 | $359 | $215 | $46 |
| Ratio of Total Expenses to | | | | | |
| Average Net Assets | 0.12% | 0.14% | 0.12% | 0.13% | 0.13%3 |
| Ratio of Net Investment Income to | | | | | |
| Average Net Assets | 2.13% | 2.30% | 2.86% | 2.59% | 2.63%3 |
| Portfolio Turnover Rate4 | 37% | 47% | 45% | 46% | 16% |
1 Inception.
2 Calculated based on average shares outstanding.
3 Annualized.
4 Excludes the value of portfolio securities received or delivered as a result of in-kind purchases or redemptions of the fund’s capital shares, including ETF Creation Units.
See accompanying Notes, which are an integral part of the Financial Statements.
78
Mid-Cap Value Index Fund
Notes to Financial Statements
Vanguard Mid-Cap Value Index Fund is registered under the Investment Company Act of 1940 as an open-end investment company, or mutual fund. The fund offers two classes of shares: Investor Shares and ETF Shares. Investor Shares are available to any investor who meets the fund’s minimum purchase requirements. ETF Shares are listed for trading on the NYSE Arca, Inc.; they can be purchased and sold through a broker.
A. The following significant accounting policies conform to generally accepted accounting principles for U.S. mutual funds. The fund consistently follows such policies in preparing its financial statements.
1. Security Valuation: Securities are valued as of the close of trading on the New York Stock Exchange (generally 4 p.m., Eastern time) on the valuation date. Equity securities are valued at the latest quoted sales prices or official closing prices taken from the primary market in which each security trades; such securities not traded on the valuation date are valued at the mean of the latest quoted bid and asked prices. Securities for which market quotations are not readily available, or whose values have been materially affected by events occurring before the fund’s pricing time but after the close of the securities’ primary markets, are valued by methods deemed by the board of trustees to represent fair value. Investments in Vanguard Market Liquidity Fund are valued at that fund’s net asset value. Temporary cash investments acquired over 60 days to maturity are valued using the latest bid prices or using valuations based on a matrix system (which considers such factors as security prices, yields, maturities, and ratings), both as furnished by independent pricing services. Other temporary cash investments are valued at amortized cost, which approximates market value.
2. Federal Income Taxes: The fund intends to continue to qualify as a regulated investment company and distribute all of its taxable income. Management has analyzed the fund’s tax positions taken for all open federal income tax years (December 31, 2007–2010), and has concluded that no provision for federal income tax is required in the fund’s financial statements.
3. Distributions: Distributions to shareholders are recorded on the ex-dividend date.
4. Security Lending: The fund may lend its securities to qualified institutional borrowers to earn additional income. Security loans are required to be secured at all times by collateral at least equal to the market value of securities loaned. The fund invests cash collateral received in Vanguard Market Liquidity Fund, and records a liability for the return of the collateral, during the period the securities are on loan. Security lending income represents fees charged to borrowers plus income earned on investing cash collateral, less expenses associated with the loan.
5. Other: Dividend income is recorded on the ex-dividend date. Interest income includes income distributions received from Vanguard Market Liquidity Fund and is accrued daily. Security transactions are accounted for on the date securities are bought or sold. Costs used to determine realized gains (losses) on the sale of investment securities are those of the specific securities sold.
Each class of shares has equal rights as to assets and earnings, except that each class separately bears certain class-specific expenses related to maintenance of shareholder accounts (included in Management and Administrative expenses) and shareholder reporting. Marketing and distribution expenses are allocated to each class of shares based on a method approved by the board of trustees. Income, other non-class-specific expenses, and gains and losses on investments are allocated to each class of shares based on its relative net assets.
79
Mid-Cap Value Index Fund
B. The Vanguard Group furnishes at cost investment advisory, corporate management, administrative, marketing, and distribution services. The costs of such services are allocated to the fund under methods approved by the board of trustees. The fund has committed to provide up to 0.40% of its net assets in capital contributions to Vanguard. At December 31, 2010, the fund had contributed capital of $232,000 to Vanguard (included in Other Assets), representing 0.02% of the fund’s net assets and 0.09% of Vanguard’s capitalization. The fund’s trustees and officers are also directors and officers of Vanguard.
C. Various inputs may be used to determine the value of the fund’s investments. These inputs are summarized in three broad levels for financial statement purposes. The inputs or methodologies used to value securities are not necessarily an indication of the risk associated with investing in those securities.
Level 1—Quoted prices in active markets for identical securities.
Level 2—Other significant observable inputs (including quoted prices for similar securities, interest rates, prepayment speeds, credit risk, etc.).
Level 3—Significant unobservable inputs (including the fund’s own assumptions used to determine the fair value of investments).
The following table summarizes the fund’s investments as of December 31, 2010, based on the inputs used to value them:
| | | |
| | Level 1 | Level 2 | Level 3 |
| Investments | ($000) | ($000) | ($000) |
| Common Stocks | 1,429,391 | — | — |
| Temporary Cash Investments | 3,631 | 100 | — |
| Total | 1,433,022 | 100 | — |
D. Distributions are determined on a tax basis and may differ from net investment income and realized capital gains for financial reporting purposes. Differences may be permanent or temporary. Permanent differences are reclassified among capital accounts in the financial statements to reflect their tax character. Temporary differences arise when certain items of income, expense, gain, or loss are recognized in different periods for financial statement and tax purposes; these differences are primarily attributed to tax deferral of losses on wash sales and will reverse at some time in the future. Differences in classification may also result from the treatment of short-term gains as ordinary income for tax purposes.
During the year ended December 31, 2010, the fund realized $97,850,000 of net capital gains resulting from in-kind redemptions—in which shareholders exchanged fund shares for securities held by the fund rather than for cash. Because such gains are not taxable to the fund, and are not distributed to shareholders, they have been reclassified from accumulated net realized losses to paid-in capital.
80
Mid-Cap Value Index Fund
For tax purposes, at December 31, 2010, the fund had $166,000 of ordinary income available for distribution. The fund had available capital loss carryforwards totaling $237,495,000 to offset future net capital gains of $11,000 through December 31, 2014, $390,000 through December 31, 2015, $47,840,000 through December 31, 2016, $125,799,000 through December 31, 2017, and $63,455,000 through December 31, 2018. In addition, the fund realized losses of $8,006,000 during the period from November 1, 2010, through December 31, 2010, which are deferred and will be treated as realized for tax purposes in fiscal 2011.
At December 31, 2010, the cost of investment securities for tax purposes was $1,204,383,000. Net unrealized appreciation of investment securities for tax purposes was $228,739,000, consisting of unrealized gains of $252,962,000 on securities that had risen in value since their purchase and $24,223,000 in unrealized losses on securities that had fallen in value since their purchase.
E. During the year ended December 31, 2010, the fund purchased $971,732,000 of investment securities and sold $803,302,000 of investment securities, other than temporary cash investments.
F. Capital share transactions for each class of shares were:
| | | | |
| | | | Year Ended December 31, |
| | | 2010 | | 2009 |
| | Amount | Shares | Amount | Shares |
| | ($000) | (000) | ($000) | (000) |
| Investor Shares | | | | |
| Issued | 344,847 | 18,314 | 232,424 | 16,895 |
| Issued in Lieu of Cash Distributions | 10,842 | 521 | 7,299 | 424 |
| Redeemed | (234,579) | (12,402) | (111,878) | (7,760) |
| Net Increase (Decrease)—Investor Shares | 121,110 | 6,433 | 127,845 | 9,559 |
| ETF Shares | | | | |
| Issued | 390,154 | 8,222 | 413,523 | 10,904 |
| Issued in Lieu of Cash Distributions | — | — | — | — |
| Redeemed | (344,929) | (7,300) | (360,220) | (8,700) |
| Net Increase (Decrease)—ETF Shares | 45,225 | 922 | 53,303 | 2,204 |
G. In preparing the financial statements as of December 31, 2010, management considered the impact of subsequent events for potential recognition or disclosure in these financial statements
81
Report of Independent Registered Public Accounting Firm
To the Trustees of Vanguard Index Funds and the Shareholders of Vanguard Extended Market Index Fund, Vanguard Mid-Cap Index Fund, Vanguard Mid-Cap Growth Index Fund and Vanguard Mid-Cap Value Index Fund:
In our opinion, the accompanying statement of net assets—investments summary and statements of net assets and the related statements of operations and of changes in net assets and the financial highlights present fairly, in all material respects, the financial position of Vanguard Extended Market Index Fund, Vanguard Mid-Cap Index Fund, Vanguard Mid-Cap Growth Index Fund and Vanguard Mid-Cap Value Index Fund (constituting separate portfolios of Vanguard Index Funds, hereafter referred to as the “Funds”) at December 31, 2010, the results of each of their operations for the year then ended, the changes in each of their net assets for each of the two years in the period then ended and the financial highlights for each of the periods indicated, in conformity with accounting principles generally accepted in the United States of America. These financial statements and financial highlights (hereafter referred to as “financial statements”) are the responsibility of the Funds’ management; our responsibility is to express an opinion on these financial statements based on our audits. We conducted our audits of these financial statements in accordance with the standards of the Public Company Accounting Oversight Board (United States). Those standards require that we plan and perform the audit to obtain reasonable assurance about whether the financial statements are free of material misstatement. An audit includes examining, on a test basis, evidence supporting the amounts and disclosures in the financial statements, assessing the accounting principles used and significant estimates made by management, and evaluating the overall financial statement presentation. We believe that our audits, which included confirmation of securities at December 31, 2010 by correspondence with the custodian and broker and by agreement to the underlying ownership records of Vanguard Market Liquidity Fund, provide a reasonable bas is for our opinion.
PricewaterhouseCoopers LLP
Philadelphia, Pennsylvania
February 8, 2011
82
|
| Special 2010 tax information (unaudited) for Vanguard U.S. Stock Index Funds (Mid-Capitalization Portfolios) |
This information for the fiscal year ended December 31, 2010, is included pursuant to provisions of the Internal Revenue Code.
The funds distributed qualified dividend income to shareholders during the fiscal year as follows:
| |
| | Qualified Dividend Income |
| Index Fund | ($000) |
| Extended Market | 135,468 |
| Mid-Cap | 284,692 |
| Mid-Cap Growth | 9,181 |
| Mid-Cap Value | 23,195 |
For corporate shareholders, the percentage of investment income (dividend income plus short-term gains, if any) that qualifies for the dividends-received deduction is as follows:
| |
| Index Fund | Percentage |
| Extended Market | 78.4% |
| Mid-Cap | 86.8 |
| Mid-Cap Growth | 100.0 |
| Mid-Cap Value | 82.8 |
83
Your Fund’s After-Tax Returns
This table presents returns for your fund both before and after taxes. The after-tax returns are shown in two ways: (1) assuming that an investor owned the fund during the entire period and paid taxes on the fund’s distributions, and (2) assuming that an investor paid taxes on the fund’s distributions and sold all shares at the end of each period.
Calculations are based on the highest individual federal income tax and capital gains tax rates in effect at the times of the distributions and the hypothetical sales. State and local taxes were not considered. After-tax returns reflect any qualified dividend income . (In the example, returns after the sale of fund shares may be higher than those assuming no sale. This occurs when the sale would have produced a capital loss. The calculation assumes that the investor received a tax deduction for the loss.) The table shows returns for Investor Shares only; returns for other share classes will differ. Please note that your actual after-tax returns will depend on your tax situation and may differ from those shown. Also note that if you own the fund in a tax-deferred account, such as an individual retirement account or a 401(k) plan, this information does not apply to you. Such accounts are not subject to current taxes.
Finally, keep in mind that a fund’s performance—whether before or after taxes—does not guarantee future results.
| | | |
| Average Annual Total Returns: U.S. Stock Index Funds Mid-Capitalization Portfolios | |
| Periods Ended December 31, 2010 | | | |
| | One | Five | Ten |
| | Year | Years | Years |
| Extended Market Index Fund Investor Shares | | | |
| Returns Before Taxes | 27.37% | 5.04% | 5.98% |
| Returns After Taxes on Distributions | 27.16 | 4.79 | 5.64 |
| Returns After Taxes on Distributions and Sale of Fund Shares | 17.96 | 4.25 | 5.07 |
| |
| | One | Five | Ten |
| | Year | Years | Years |
| Mid-Cap Index Fund Investor Shares | | | |
| Returns Before Taxes | 25.46% | 4.27% | 6.78% |
| Returns After Taxes on Distributions | 25.25 | 4.03 | 6.45 |
| Returns After Taxes on Distributions and Sale of Fund Shares | 16.80 | 3.61 | 5.82 |
| |
| | | | Since |
| | | One | Inception |
| | | Year | (8/24/2006) |
| Mid-Cap Growth Index Fund Investor Shares | | | |
| Returns Before Taxes | | 28.93% | 5.20% |
| Returns After Taxes on Distributions | | 28.85 | 5.13 |
| Returns After Taxes on Distributions and Sale of Fund Shares | | 18.91 | 4.47 |
84
| | |
| Average Annual Total Returns: U.S. Stock Index Funds Mid-Capitalization Portfolios | |
| Periods Ended December 31, 2010 | | |
| |
| | | Since |
| | One | Inception |
| | Year | (8/24/2006) |
| Mid-Cap Value Index Fund Investor Shares | | |
| Returns Before Taxes | 21.63% | 3.05% |
| Returns After Taxes on Distributions | 21.26 | 2.66 |
| Returns After Taxes on Distributions and Sale of Fund Shares | 14.44 | 2.49 |
85
About Your Fund’s Expenses
As a shareholder of the fund, you incur ongoing costs, which include costs for portfolio management, administrative services, and shareholder reports (like this one), among others. Operating expenses, which are deducted from a fund’s gross income, directly reduce the investment return of the fund.
A fund’s expenses are expressed as a percentage of its average net assets. This figure is known as the expense ratio. The following examples are intended to help you understand the ongoing costs (in dollars) of investing in your fund and to compare these costs with those of other mutual funds. The examples are based on an investment of $1,000 made at the beginning of the period shown and held for the entire period.
The accompanying table illustrates your fund’s costs in two ways:
• Based on actual fund return. This section helps you to estimate the actual expenses that you paid over the period. The ”Ending Account Value“ shown is derived from the fund‘s actual return, and the third column shows the dollar amount that would have been paid by an investor who started with $1,000 in the fund. You may use the information here, together with the amount you invested, to estimate the expenses that you paid over the period.
To do so, simply divide your account value by $1,000 (for example, an $8,600 account value divided by $1,000 = 8.6), then multiply the result by the number given for your fund under the heading ”Expenses Paid During Period.“
• Based on hypothetical 5% yearly return. This section is intended to help you compare your fund‘s costs with those of other mutual funds. It assumes that the fund had a yearly return of 5% before expenses, but that the expense ratio is unchanged. In this case—because the return used is not the fund’s actual return—the results do not apply to your investment. The example is useful in making comparisons because the Securities and Exchange Commission requires all mutual funds to calculate expenses based on a 5% return. You can assess your fund’s costs by comparing this hypothetical example with the hypothetical examples that appear in shareholder reports of other funds.
Note that the expenses shown in the table are meant to highlight and help you compare ongoing costs only and do not reflect transaction costs incurred by the fund for buying and selling securities. Further, the expenses do not include the account service fee described in the prospectus. If such a fee were applied to your account, your costs would be higher. Your fund does not charge transaction fees, such as purchase or redemption fees, nor does it carry a “sales load.” The calculations assume no shares were bought or sold during the period. Your actual costs may have been higher or lower, depending on the amount of your investment and the timing of any purchases or redemptions.
You can find more information about the fund’s expenses, including annual expense ratios, in the Financial Statements section of this report. For additional information on operating expenses and other shareholder costs, please refer to your fund’s current prospectus.
86
| | | |
| Six Months Ended December 31, 2010 | | | |
| | Beginning | Ending | Expenses |
| | Account Value | Account Value | Paid During |
| | 6/30/2010 | 12/31/2010 | Period |
| Based on Actual Fund Return | | | |
| Extended Market Index Fund | | | |
| Investor Shares | $1,000.00 | $1,296.64 | $1.51 |
| Admiral Shares | 1,000.00 | 1,297.61 | 0.69 |
| Signal Shares | 1,000.00 | 1,297.69 | 0.69 |
| Institutional Shares | 1,000.00 | 1,297.83 | 0.46 |
| ETF Shares | 1,000.00 | 1,297.77 | 0.69 |
| Mid-Cap Index Fund | | | |
| Investor Shares | $1,000.00 | $1,281.87 | $1.50 |
| Admiral Shares | 1,000.00 | 1,282.82 | 0.69 |
| Signal Shares | 1,000.00 | 1,282.85 | 0.69 |
| Institutional Shares | 1,000.00 | 1,283.05 | 0.46 |
| ETF Shares | 1,000.00 | 1,282.71 | 0.69 |
| Mid-Cap Growth Index Fund | | | |
| Investor Shares | $1,000.00 | $1,331.98 | $1.53 |
| ETF Shares | 1,000.00 | 1,333.15 | 0.71 |
| Mid-Cap Value Index Fund | | | |
| Investor Shares | $1,000.00 | $1,230.11 | $1.46 |
| ETF Shares | 1,000.00 | 1,231.36 | 0.67 |
87
| | | |
| Six Months Ended December 31, 2010 | | | |
| | Beginning | Ending | Expenses |
| | Account Value | Account Value | Paid During |
| | 6/30/2010 | 12/31/2010 | Period |
| Based on Hypothetical 5% Yearly Return | | | |
| Extended Market Index Fund | | | |
| Investor Shares | $1,000.00 | $1,023.89 | $1.33 |
| Admiral Shares | 1,000.00 | 1,024.60 | 0.61 |
| Signal Shares | 1,000.00 | 1,024.60 | 0.61 |
| Institutional Shares | 1,000.00 | 1,024.80 | 0.41 |
| ETF Shares | 1,000.00 | 1,024.60 | 0.61 |
| Mid-Cap Index Fund | | | |
| Investor Shares | $1,000.00 | $1,023.89 | $1.33 |
| Admiral Shares | 1,000.00 | 1,024.60 | 0.61 |
| Signal Shares | 1,000.00 | 1,024.60 | 0.61 |
| Institutional Shares | 1,000.00 | 1,024.80 | 0.41 |
| ETF Shares | 1,000.00 | 1,024.60 | 0.61 |
| Mid-Cap Growth Index Fund | | | |
| Investor Shares | $1,000.00 | $1,023.89 | $1.33 |
| ETF Shares | 1,000.00 | 1,024.60 | 0.61 |
| Mid-Cap Value Index Fund | | | |
| Investor Shares | $1,000.00 | $1,023.89 | $1.33 |
| ETF Shares | 1,000.00 | 1,024.60 | 0.61 |
The calculations are based on expenses incurred in the most recent six-month period. The funds’ annualized six-month expense ratios for that period are: for the Extended Market Index Fund, 0.26% for Investor Shares, 0.12% for Admiral Shares, 0.12% for Signal Shares, 0.08% for Institutional Shares, and 0.12% for ETF Shares; for the Mid-Cap Index Fund, 0.26% for Investor Shares, 0.12% for Admiral Shares, 0.12% for Signal Shares, 0.08% for Institutional Shares, and 0.12% for ETF Shares; for the Mid-Cap Growth Index Fund, 0.26% for Investor Shares and 0.12% for ETF Shares; and for the Mid-Cap Value Index Fund, 0.26% for Investor Shares and 0.12% for ETF Shares. The dollar amounts shown as “Expenses Paid” are equal to the annualized expense ratio multiplied by the average account value over the period, multiplied by the number of days in the most recent six-month period, then divided by the number of days in the most recent 12-month period. This table does not include data for funds or share classes of funds with fewer than six months of history.
88
Glossary
30-Day SEC Yield. A fund’s 30-day SEC yield is derived using a formula specified by the U.S. Securities and Exchange Commission. Under the formula, data related to the fund’s security holdings in the previous 30 days are used to calculate the fund’s hypothetical net income for that period, which is then annualized and divided by the fund’s estimated average net assets over the calculation period. For the purposes of this calculation, a security’s income is based on its current market yield to maturity (in the case of bonds) or its projected dividend yield (for stocks). Because the SEC yield represents hypothetical annualized income, it will differ—at times significantly—from the fund’s actual experience. As a result, the fund’s income distributions may be higher or lower than implied by the SEC yield.
Beta. A measure of the magnitude of a fund’s past share-price fluctuations in relation to the ups and downs of a given market index. The index is assigned a beta of 1.00. Compared with a given index, a fund with a beta of 1.20 typically would have seen its share price rise or fall by 12% when the index rose or fell by 10%. For this report, beta is based on returns over the past 36 months for both the fund and the index. Note that a fund’s beta should be reviewed in conjunction with its R-squared (see definition). The lower the R-squared, the less correlation there is between the fund and the index, and the less reliable beta is as an indicator of volatility.
Dividend Yield. Dividend income earned by stocks, expressed as a percentage of the aggregate market value (or of net asset value, for a fund). The yield is determined by dividing the amount of the annual dividends by the aggregate value (or net asset value) at the end of the period. For a fund, the dividend yield is based solely on stock holdings and does not include any income produced by other investments.
Earnings Growth Rate. The average annual rate of growth in earnings over the past five years for the stocks now in a fund.
Equity Exposure. A measure that reflects a fund’s investments in stocks and stock futures. Any holdings in short-term reserves are excluded.
Expense Ratio. The percentage of a fund’s average net assets used to pay its annual administrative and advisory expenses. These expenses directly reduce returns to investors.
Foreign Holdings. The percentage of a fund represented by stocks or depositary receipts of companies based outside the United States.
Inception Date. The date on which the assets of a fund (or one of its share classes) are first invested in accordance with the fund’s investment objective. For funds with a subscription period, the inception date is the day after that period ends. Investment performance is measured from the inception date.
Median Market Cap. An indicator of the size of companies in which a fund invests; the midpoint of market capitalization (market price x shares outstanding) of a fund’s stocks, weighted by the proportion of the fund’s assets invested in each stock. Stocks representing half of the fund’s assets have market capitalizations above the median, and the rest are below it.
Price/Book Ratio. The share price of a stock divided by its net worth, or book value, per share. For a fund, the weighted average price/book ratio of the stocks it holds.
89
Price/Earnings Ratio. The ratio of a stock’s current price to its per-share earnings over the past year. For a fund, the weighted average P/E of the stocks it holds. P/E is an indicator of market expectations about corporate prospects; the higher the P/E, the greater the expectations for a company’s future growth.
R-Squared. A measure of how much of a fund’s past returns can be explained by the returns from the market in general, as measured by a given index. If a fund’s total returns were precisely synchronized with an index’s returns, its R-squared would be 1.00. If the fund’s returns bore no relationship to the index’s returns, its R-squared would be 0. For this report, R-squared is based on returns over the past 36 months for both the fund and the index.
Return on Equity. The annual average rate of return generated by a company during the past five years for each dollar of shareholder’s equity (net income divided by shareholder’s equity). For a fund, the weighted average return on equity for the companies whose stocks it holds.
Short-Term Reserves. The percentage of a fund invested in highly liquid, short-term securities that can be readily converted to cash.
Turnover Rate. An indication of the fund’s trading activity. Funds with high turnover rates incur higher transaction costs and may be more likely to distribute capital gains (which may be taxable to investors). The turnover rate excludes in-kind transactions, which have minimal impact on costs.
90
This page intentionally left blank.
The People Who Govern Your Fund
The trustees of your mutual fund are there to see that the fund is operated and managed in your best interests since, as a shareholder, you are a part owner of the fund. Your fund’s trustees also serve on the board of directors of The Vanguard Group, Inc., which is owned by the Vanguard funds and provides services to them on an at-cost basis.
A majority of Vanguard’s board members are independent, meaning that they have no affiliation with Vanguard or the funds they oversee, apart from the sizable personal investments they have made as private individuals. The independent board members have distinguished backgrounds in business, academia, and public service. Each of the trustees and executive officers oversees 179 Vanguard funds.
The following table provides information for each trustee and executive officer of the fund. More information about the trustees is in the Statement of Additional Information, which can be obtained, without charge, by contacting Vanguard at 800-662-7447, or online at vanguard.com.
| |
| Interested Trustee1 | Amy Gutmann |
| | Born 1949. Trustee Since June 2006. Principal |
| F. William McNabb III | Occupation(s) During the Past Five Years: President |
| Born 1957. Trustee Since July 2009. Chairman of the | of the University of Pennsylvania; Christopher H. |
| Board. Principal Occupation(s) During the Past Five | Browne Distinguished Professor of Political Science |
| Years: Chairman of the Board of The Vanguard Group, | in the School of Arts and Sciences with secondary |
| Inc., and of each of the investment companies served | appointments at the Annenberg School for Commu- |
| by The Vanguard Group, since January 2010; Director | nication and the Graduate School of Education |
| of The Vanguard Group since 2008; Chief Executive | of the University of Pennsylvania; Director of |
| Officer and President of The Vanguard Group and of | Carnegie Corporation of New York, Schuylkill River |
| each of the investment companies served by The | Development Corporation, and Greater Philadelphia |
| Vanguard Group since 2008; Director of Vanguard | Chamber of Commerce; Trustee of the National |
| Marketing Corporation; Managing Director of The | Constitution Center; Chair of the Presidential |
| Vanguard Group (1995–2008) . | Commission for the Study of Bioethical Issues. |
| |
| | JoAnn Heffernan Heisen |
| Independent Trustees | Born 1950. Trustee Since July 1998. Principal |
| | Occupation(s) During the Past Five Years: Corporate |
| Emerson U. Fullwood | Vice President and Chief Global Diversity Officer |
| Born 1948. Trustee Since January 2008. Principal | since 2006 (retired 2008) and Member of the |
| Occupation(s) During the Past Five Years: Executive | Executive Committee (retired 2008) of Johnson & |
| Chief Staff and Marketing Officer for North America | Johnson (pharmaceuticals/consumer products); Vice |
| and Corporate Vice President (retired 2008) of Xerox | President and Chief Information Officer of Johnson & |
| Corporation (document management products and | Johnson (1997–2005); Director of the University |
| services); Director of SPX Corporation (multi-industry | Medical Center at Princeton and Women’s Research |
| manufacturing), the United Way of Rochester, | and Education Institute; Member of the Advisory |
| Amerigroup Corporation (managed health care), | Board of the Maxwell School of Citizenship and Public |
| the University of Rochester Medical Center, and | Affairs at Syracuse University. |
| Monroe Community College Foundation. | |
| | F. Joseph Loughrey |
| Rajiv L. Gupta | Born 1949. Trustee Since October 2009. Principal |
| Born 1945. Trustee Since December 2001.2 | Occupation(s) During the Past Five Years: President |
| Principal Occupation(s) During the Past Five Years: | and Chief Operating Officer since 2005 (retired 2009) |
| Chairman and Chief Executive Officer (retired 2009) | and Vice Chairman of the Board (2008–2009) of |
| and President (2006–2008) of Rohm and Haas Co. | Cummins Inc. (industrial machinery); Director of |
| (chemicals); Director of Tyco International, Ltd. | SKF AB (industrial machinery), Hillenbrand, Inc. |
| (diversified manufacturing and services) and Hewlett- | (specialized consumer services), Sauer-Danfoss Inc. |
| Packard Co. (electronic computer manufacturing); | (machinery), the Lumina Foundation for Education, |
| Trustee of The Conference Board; Member of the | and Oxfam America; Chairman of the Advisory |
| Board of Managers of Delphi Automotive LLP | Council for the College of Arts and Letters at the |
| (automotive components) . | University of Notre Dame. |
| | |
| André F. Perold | Kathryn J. Hyatt | |
| Born 1952. Trustee Since December 2004. Principal | Born 1955. Treasurer Since November 2008. Principal |
| Occupation(s) During the Past Five Years: George | Occupation(s) During the Past Five Years: Principal |
| Gund Professor of Finance and Banking at the Harvard | of The Vanguard Group, Inc.; Treasurer of each of |
| Business School; Chair of the Investment Committee | the investment companies served by The Vanguard |
| of HighVista Strategies LLC (private investment firm) . | Group since 2008; Assistant Treasurer of each of the |
| | investment companies served by The Vanguard Group |
| Alfred M. Rankin, Jr. | (1988–2008) . | |
| Born 1941. Trustee Since January 1993. Principal | | |
| Occupation(s) During the Past Five Years: Chairman, | Heidi Stam | |
| President, and Chief Executive Officer of NACCO | Born 1956. Secretary Since July 2005. Principal |
| Industries, Inc. (forklift trucks/housewares/lignite); | Occupation(s) During the Past Five Years: Managing |
| Director of Goodrich Corporation (industrial products/ | Director of The Vanguard Group, Inc., since 2006; |
| aircraft systems and services); Chairman of the | General Counsel of The Vanguard Group since 2005; |
| Federal Reserve Bank of Cleveland; Trustee of The | Secretary of The Vanguard Group and of each of the |
| Cleveland Museum of Art. | investment companies served by The Vanguard Group |
| | since 2005; Director and Senior Vice President of |
| Peter F. Volanakis | Vanguard Marketing Corporation since 2005; |
| Born 1955. Trustee Since July 2009. Principal | Principal of The Vanguard Group (1997–2006). |
| Occupation(s) During the Past Five Years: President | | |
| since 2007 and Chief Operating Officer since 2005 | | |
| of Corning Incorporated (communications equipment); | Vanguard Senior Management Team |
| President of Corning Technologies (2001–2005); | | |
| Director of Corning Incorporated and Dow Corning; | R. Gregory Barton | Michael S. Miller |
| Trustee of the Corning Incorporated Foundation and | Mortimer J. Buckley | James M. Norris |
| the Corning Museum of Glass; Overseer of the | Kathleen C. Gubanich | Glenn W. Reed |
| Amos Tuck School of Business Administration at | Paul A. Heller | George U. Sauter |
| Dartmouth College. | | |
| |
| | Chairman Emeritus and Senior Advisor |
| Executive Officers | | |
| | John J. Brennan | |
| Glenn Booraem | Chairman, 1996–2009 | |
| Born 1967. Controller Since July 2010. Principal | Chief Executive Officer and President, 1996–2008 |
| Occupation(s) During the Past Five Years: Principal | | |
| of The Vanguard Group, Inc.; Controller of each of | | |
| the investment companies served by The Vanguard | Founder | |
| Group since 2010; Assistant Controller of each of | | |
| the investment companies served by The Vanguard | John C. Bogle | |
| Group (2001–2010) . | Chairman and Chief Executive Officer, 1974–1996 |
| |
| Thomas J. Higgins | | |
| Born 1957. Chief Financial Officer Since September | | |
| 2008. Principal Occupation(s) During the Past Five | | |
| Years: Principal of The Vanguard Group, Inc.; Chief | | |
| Financial Officer of each of the investment companies | | |
| served by The Vanguard Group since 2008; Treasurer | | |
| of each of the investment companies served by The | | |
| Vanguard Group (1998–2008) . | | |
1 Mr. McNabb is considered an “interested person,” as defined in the Investment Company Act of 1940, because he is an officer of the Vanguard funds.
2 December 2002 for Vanguard Equity Income Fund, Vanguard Growth Equity Fund, the Vanguard Municipal Bond Funds, and the Vanguard State Tax-Exempt Funds.
|  |
| P.O. Box 2600 |
| Valley Forge, PA 19482-2600 |
Connect with Vanguard® > vanguard.com
| The funds or securities referred to herein are not |
| Fund Information > 800-662-7447 | sponsored, endorsed, or promoted by MSCI, and MSCI |
| Direct Investor Account Services > 800-662-2739 | bears no liability with respect to any such funds or |
| Institutional Investor Services > 800-523-1036 | securities. For any such funds or securities, the |
| Text Telephone for People | prospectus or the Statement of Additional Information |
| With Hearing Impairment > 800-749-7273 | contains a more detailed description of the limited |
| | relationship MSCI has with The Vanguard Group and |
| any related funds. |
| This material may be used in conjunction |
| with the offering of shares of any Vanguard | S&P® is a registered trademark of Standard & Poor’s |
| fund only if preceded or accompanied by | Financial Services LLC (“S&P”) and has been licensed |
| the fund’s current prospectus. | for use by The Vanguard Group, Inc. The Vanguard |
| | mutual funds are not sponsored, endorsed, sold, or |
| All comparative mutual fund data are from Lipper Inc. or | promoted by S&P or its Affiliates, and S&P and its |
| Morningstar, Inc., unless otherwise noted. | Affiliates make no representation, warranty, or |
| You can obtain a free copy of Vanguard’s proxy voting | condition regarding the advisability of buying, selling, |
| guidelines by visiting vanguard.com/proxyreporting or by | or holding units/shares in the funds. |
| calling Vanguard at 800-662-2739. The guidelines are | |
| also available from the SEC’s website, sec.gov. In | |
| addition, you may obtain a free report on how your fund | |
| voted the proxies for securities it owned during the 12 | |
| months ended June 30. To get the report, visit either | |
| vanguard.com/proxyreporting or sec.gov. | |
| |
| You can review and copy information about your fund at | |
| the SEC’s Public Reference Room in Washington, D.C. To | |
| find out more about this public service, call the SEC at | |
| 202-551-8090. Information about your fund is also | |
| available on the SEC’s website, and you can receive | |
| copies of this information, for a fee, by sending a | |
| request in either of two ways: via e-mail addressed to | |
| publicinfo@sec.gov or via regular mail addressed to the | |
| Public Reference Section, Securities and Exchange | |
| Commission, Washington, DC 20549-1520. | |
| | © 2011 The Vanguard Group, Inc. |
| | All rights reserved. |
| | Vanguard Marketing Corporation, Distributor. |
| |
| | Q980 022011 |
| | | |
| Vanguard® Extended Market Index Fund | | |
| Schedule of Investments | | |
| December 31, 2010 | | |
| |
| | | | Market |
| | | | Value |
| | | Shares | ($000) |
| Common Stocks (99.6%)1 | | |
| Consumer Discretionary (13.9%) | | |
| * | Las Vegas Sands Corp. | 2,059,740 | 94,645 |
| * | BorgWarner Inc. | 739,028 | 53,476 |
| * | Dollar Tree Inc. | 813,539 | 45,623 |
| * | Chipotle Mexican Grill Inc. Class A | 201,026 | 42,750 |
| * | Liberty Global Inc. | 1,249,820 | 42,356 |
| * | Sirius XM Radio Inc. | 25,492,439 | 41,808 |
| * | Royal Caribbean Cruises Ltd. | 880,887 | 41,402 |
| | Advance Auto Parts Inc. | 546,082 | 36,123 |
| * | Lear Corp. | 330,064 | 32,581 |
| | PetSmart Inc. | 764,020 | 30,423 |
| * | TRW Automotive Holdings Corp. | 545,183 | 28,731 |
| | Phillips-Van Heusen Corp. | 431,220 | 27,171 |
| | Gentex Corp. | 911,804 | 26,953 |
| * | MGM Resorts International | 1,786,166 | 26,525 |
| * | DISH Network Corp. Class A | 1,305,107 | 25,658 |
| * | NVR Inc. | 36,646 | 25,323 |
| | Williams-Sonoma Inc. | 689,423 | 24,605 |
| * | Signet Jewelers Ltd. | 556,640 | 24,158 |
| * | Fossil Inc. | 333,762 | 23,524 |
| | Tractor Supply Co. | 473,712 | 22,970 |
| * | Dick's Sporting Goods Inc. | 575,802 | 21,593 |
| * | LKQ Corp. | 937,897 | 21,309 |
| * | Mohawk Industries Inc. | 365,463 | 20,744 |
| * | Hyatt Hotels Corp. Class A | 440,729 | 20,168 |
| * | Deckers Outdoor Corp. | 250,581 | 19,981 |
| * | Panera Bread Co. Class A | 197,207 | 19,959 |
| | Foot Locker Inc. | 1,011,352 | 19,843 |
| | Sotheby's | 435,710 | 19,607 |
| | Tupperware Brands Corp. | 410,256 | 19,557 |
| | Guess? Inc. | 412,321 | 19,511 |
| | American Eagle Outfitters Inc. | 1,271,320 | 18,599 |
| | Jarden Corp. | 597,419 | 18,442 |
| * | J Crew Group Inc. | 415,355 | 17,918 |
| * | Toll Brothers Inc. | 937,466 | 17,812 |
| * | Tempur-Pedic International Inc. | 442,714 | 17,735 |
| | Polaris Industries Inc. | 220,187 | 17,179 |
| * | WMS Industries Inc. | 376,400 | 17,028 |
| * | Tenneco Inc. | 388,235 | 15,980 |
| * | Warnaco Group Inc. | 289,193 | 15,926 |
| * | Hanesbrands Inc. | 622,272 | 15,806 |
| * | Dana Holding Corp. | 917,247 | 15,786 |
| * | Penn National Gaming Inc. | 437,205 | 15,368 |
| * | Lamar Advertising Co. Class A | 372,281 | 14,832 |
| * | Aeropostale Inc. | 600,664 | 14,800 |
| * | Bally Technologies Inc. | 349,768 | 14,757 |
| | Chico's FAS Inc. | 1,161,395 | 13,972 |
| | Rent-A-Center Inc. | 427,323 | 13,794 |
| | Strayer Education Inc. | 90,184 | 13,728 |
| * | DreamWorks Animation SKG Inc. Class A | 465,275 | 13,712 |
| | John Wiley & Sons Inc. Class A | 301,456 | 13,638 |
| * | Dollar General Corp. | 443,124 | 13,591 |
| | Service Corp. International | 1,599,823 | 13,199 |
| *,^ | Under Armour Inc. Class A | 228,600 | 12,536 |
| | Brinker International Inc. | 599,709 | 12,522 |
| * | Vail Resorts Inc. | 235,349 | 12,248 |
| * | Dress Barn Inc. | 450,104 | 11,892 |
| * | Cheesecake Factory Inc. | 385,848 | 11,830 |
| * | Coinstar Inc. | 205,788 | 11,615 |
| *,^ | Liberty Global Inc. Class A | 324,973 | 11,498 |
| * | Saks Inc. | 1,045,277 | 11,184 |
| * | Life Time Fitness Inc. | 272,090 | 11,153 |
1
| | |
| Vanguard® Extended Market Index Fund | | |
| Schedule of Investments | | |
| December 31, 2010 | | |
| |
| |
| | | Market |
| | | Value |
| | Shares | ($000) |
| * Live Nation Entertainment Inc. | 969,735 | 11,074 |
| Dillard's Inc. Class A | 290,621 | 11,026 |
| * Carter's Inc. | 373,561 | 11,024 |
| * Gaylord Entertainment Co. | 306,423 | 11,013 |
| * ITT Educational Services Inc. | 170,055 | 10,831 |
| Brunswick Corp. | 575,991 | 10,794 |
| * Jo-Ann Stores Inc. | 175,800 | 10,587 |
| * AnnTaylor Stores Corp. | 382,611 | 10,480 |
| * Valassis Communications Inc. | 322,785 | 10,442 |
| * Madison Square Garden Inc. Class A | 394,219 | 10,163 |
| Wolverine World Wide Inc. | 317,573 | 10,124 |
| Six Flags Entertainment Corp. | 180,971 | 9,845 |
| * OfficeMax Inc. | 552,466 | 9,779 |
| * Office Depot Inc. | 1,799,920 | 9,720 |
| * CROCS Inc. | 566,813 | 9,704 |
| Wendy's/Arby's Group Inc. Class A | 2,092,187 | 9,666 |
| Aaron's Inc. | 474,030 | 9,665 |
| Cooper Tire & Rubber Co. | 399,869 | 9,429 |
| * Eastman Kodak Co. | 1,746,705 | 9,362 |
| Thor Industries Inc. | 275,606 | 9,360 |
| * Sally Beauty Holdings Inc. | 629,704 | 9,150 |
| * Iconix Brand Group Inc. | 471,221 | 9,099 |
| * Career Education Corp. | 428,251 | 8,878 |
| * Collective Brands Inc. | 418,662 | 8,834 |
| Jones Group Inc. | 566,214 | 8,799 |
| Men's Wearhouse Inc. | 342,520 | 8,556 |
| Hillenbrand Inc. | 404,771 | 8,423 |
| * Childrens Place Retail Stores Inc. | 168,850 | 8,382 |
| Cracker Barrel Old Country Store Inc. | 152,621 | 8,359 |
| Weight Watchers International Inc. | 220,418 | 8,263 |
| * Pier 1 Imports Inc. | 762,938 | 8,011 |
| * Orient-Express Hotels Ltd. Class A | 610,253 | 7,927 |
| Morningstar Inc. | 148,455 | 7,880 |
| * HSN Inc. | 251,436 | 7,704 |
| * Jack in the Box Inc. | 358,049 | 7,566 |
| * New York Times Co. Class A | 767,767 | 7,524 |
| * Ulta Salon Cosmetics & Fragrance Inc. | 218,479 | 7,428 |
| Pool Corp. | 322,959 | 7,279 |
| Arbitron Inc. | 175,182 | 7,274 |
| PF Chang's China Bistro Inc. | 149,819 | 7,260 |
| * JOS A Bank Clothiers Inc. | 179,502 | 7,237 |
| * Capella Education Co. | 108,585 | 7,230 |
| Choice Hotels International Inc. | 185,895 | 7,114 |
| MDC Holdings Inc. | 245,141 | 7,053 |
| National CineMedia Inc. | 352,127 | 7,011 |
| * Hibbett Sports Inc. | 185,945 | 6,861 |
| Monro Muffler Brake Inc. | 196,800 | 6,807 |
| Matthews International Corp. Class A | 193,588 | 6,772 |
| Bob Evans Farms Inc. | 197,995 | 6,526 |
| * Texas Roadhouse Inc. Class A | 377,643 | 6,484 |
| Group 1 Automotive Inc. | 154,818 | 6,465 |
| * Timberland Co. Class A | 261,308 | 6,426 |
| Buckle Inc. | 169,587 | 6,405 |
| KB Home | 469,057 | 6,328 |
| * Steven Madden Ltd. | 149,825 | 6,251 |
| * Shutterfly Inc. | 178,282 | 6,245 |
| Regis Corp. | 374,354 | 6,214 |
| Finish Line Inc. Class A | 353,383 | 6,075 |
| Regal Entertainment Group Class A | 511,491 | 6,005 |
| * Helen of Troy Ltd. | 199,389 | 5,930 |
| * Genesco Inc. | 156,529 | 5,868 |
| American Greetings Corp. Class A | 261,044 | 5,785 |
| * K12 Inc. | 201,354 | 5,771 |
| * Cabela's Inc. | 262,813 | 5,716 |
2
| | | |
| Vanguard® Extended Market Index Fund | | |
| Schedule of Investments | | |
| December 31, 2010 | | |
| |
| |
| | | | Market |
| | | | Value |
| | | Shares | ($000) |
| * | Pinnacle Entertainment Inc. | 399,080 | 5,595 |
| * | Ruby Tuesday Inc. | 422,025 | 5,512 |
| * | CEC Entertainment Inc. | 141,434 | 5,492 |
| *,^ | Blue Nile Inc. | 93,858 | 5,356 |
| * | Domino's Pizza Inc. | 335,428 | 5,350 |
| | Cato Corp. Class A | 191,958 | 5,262 |
| * | BJ's Restaurants Inc. | 146,788 | 5,201 |
| * | Buffalo Wild Wings Inc. | 118,320 | 5,188 |
| * | Penske Automotive Group Inc. | 293,516 | 5,113 |
| | International Speedway Corp. Class A | 192,695 | 5,043 |
| * | DineEquity Inc. | 100,909 | 4,983 |
| * | American Axle & Manufacturing Holdings Inc. | 386,672 | 4,973 |
| | Ryland Group Inc. | 287,448 | 4,895 |
| * | 99 Cents Only Stores | 304,753 | 4,858 |
| | Cinemark Holdings Inc. | 280,889 | 4,842 |
| * | Exide Technologies | 498,751 | 4,693 |
| * | Modine Manufacturing Co. | 301,958 | 4,680 |
| * | Meritage Homes Corp. | 209,396 | 4,649 |
| | PEP Boys-Manny Moe & Jack | 342,270 | 4,597 |
| ^ | Scholastic Corp. | 154,889 | 4,575 |
| | Columbia Sportswear Co. | 74,993 | 4,522 |
| * | Steiner Leisure Ltd. | 96,746 | 4,518 |
| * | American Public Education Inc. | 120,391 | 4,483 |
| * | Liz Claiborne Inc. | 615,065 | 4,404 |
| * | Skechers U.S.A. Inc. Class A | 220,189 | 4,404 |
| *,^ | Education Management Corp. | 240,708 | 4,357 |
| | Stage Stores Inc. | 249,683 | 4,329 |
| * | Quiksilver Inc. | 844,215 | 4,280 |
| * | Interval Leisure Group Inc. | 263,335 | 4,250 |
| * | Scientific Games Corp. Class A | 424,074 | 4,224 |
| * | Belo Corp. Class A | 590,899 | 4,184 |
| | Stewart Enterprises Inc. Class A | 607,676 | 4,065 |
| * | Sonic Corp. | 401,575 | 4,064 |
| * | Vitamin Shoppe Inc. | 119,698 | 4,027 |
| * | Shuffle Master Inc. | 349,806 | 4,005 |
| * | Asbury Automotive Group Inc. | 215,385 | 3,980 |
| | Brown Shoe Co. Inc. | 285,239 | 3,973 |
| * | Talbots Inc. | 458,254 | 3,904 |
| * | Pre-Paid Legal Services Inc. | 64,747 | 3,901 |
| * | Boyd Gaming Corp. | 365,337 | 3,873 |
| * | Biglari Holdings Inc. | 9,351 | 3,836 |
| * | DSW Inc. Class A | 97,366 | 3,807 |
| * | Papa John's International Inc. | 136,720 | 3,787 |
| * | Lumber Liquidators Holdings Inc. | 151,662 | 3,778 |
| * | Grand Canyon Education Inc. | 190,922 | 3,740 |
| | Ethan Allen Interiors Inc. | 186,805 | 3,738 |
| * | True Religion Apparel Inc. | 166,262 | 3,701 |
| | Churchill Downs Inc. | 84,594 | 3,671 |
| ^ | Nutrisystem Inc. | 174,509 | 3,670 |
| * | Zumiez Inc. | 135,452 | 3,640 |
| | Barnes & Noble Inc. | 256,821 | 3,634 |
| * | Maidenform Brands Inc. | 151,777 | 3,608 |
| * | Krispy Kreme Doughnuts Inc. | 515,070 | 3,595 |
| * | Ascent Media Corp. Class A | 92,582 | 3,588 |
| * | Clear Channel Outdoor Holdings Inc. Class A | 254,462 | 3,573 |
| * | Peet's Coffee & Tea Inc. | 85,416 | 3,565 |
| | Fred's Inc. Class A | 256,696 | 3,532 |
| | Sonic Automotive Inc. Class A | 256,430 | 3,395 |
| | Callaway Golf Co. | 418,796 | 3,380 |
| | Harte-Hanks Inc. | 260,276 | 3,324 |
| * | Jakks Pacific Inc. | 181,661 | 3,310 |
| * | G-III Apparel Group Ltd. | 94,132 | 3,309 |
| * | Federal-Mogul Corp. | 159,860 | 3,301 |
| | Superior Industries International Inc. | 154,505 | 3,279 |
3
| | | |
| Vanguard® Extended Market Index Fund | | |
| Schedule of Investments | | |
| December 31, 2010 | | |
| |
| |
| | | | Market |
| | | | Value |
| | | Shares | ($000) |
| * | Select Comfort Corp. | 352,684 | 3,220 |
| * | Dorman Products Inc. | 86,732 | 3,143 |
| * | iRobot Corp. | 123,275 | 3,067 |
| * | La-Z-Boy Inc. | 336,911 | 3,039 |
| * | RC2 Corp. | 138,573 | 3,017 |
| * | Denny's Corp. | 827,990 | 2,964 |
| *,^ | Corinthian Colleges Inc. | 566,869 | 2,953 |
| * | Standard Pacific Corp. | 639,635 | 2,942 |
| | Universal Technical Institute Inc. | 132,120 | 2,909 |
| | Drew Industries Inc. | 126,822 | 2,881 |
| * | Mediacom Communications Corp. Class A | 340,383 | 2,880 |
| * | Winnebago Industries Inc. | 187,025 | 2,843 |
| * | California Pizza Kitchen Inc. | 158,335 | 2,736 |
| * | Fuel Systems Solutions Inc. | 92,687 | 2,723 |
| * | Charming Shoppes Inc. | 753,140 | 2,674 |
| ^ | PetMed Express Inc. | 148,558 | 2,646 |
| * | Citi Trends Inc. | 107,702 | 2,644 |
| | Ameristar Casinos Inc. | 168,979 | 2,641 |
| * | Universal Electronics Inc. | 92,863 | 2,634 |
| * | Rentrak Corp. | 86,961 | 2,623 |
| * | Tesla Motors Inc. | 96,725 | 2,576 |
| | World Wrestling Entertainment Inc. Class A | 178,056 | 2,535 |
| *,^ | hhgregg Inc. | 120,801 | 2,531 |
| * | Knology Inc. | 158,993 | 2,485 |
| * | Retail Ventures Inc. | 150,966 | 2,461 |
| | Sinclair Broadcast Group Inc. Class A | 290,920 | 2,380 |
| | Sturm Ruger & Co. Inc. | 154,279 | 2,359 |
| | Oxford Industries Inc. | 91,863 | 2,353 |
| * | EW Scripps Co. Class A | 228,934 | 2,324 |
| * | Wet Seal Inc. Class A | 627,175 | 2,321 |
| * | Beazer Homes USA Inc. | 420,588 | 2,267 |
| * | Pacific Sunwear of California Inc. | 414,587 | 2,247 |
| * | K-Swiss Inc. Class A | 178,728 | 2,229 |
| * | Core-Mark Holding Co. Inc. | 62,582 | 2,227 |
| * | Warner Music Group Corp. | 391,848 | 2,206 |
| * | Dex One Corp. | 294,983 | 2,201 |
| * | Rue21 Inc. | 74,990 | 2,198 |
| | Big 5 Sporting Goods Corp. | 142,160 | 2,171 |
| * | AFC Enterprises Inc. | 154,059 | 2,141 |
| | Volcom Inc. | 112,831 | 2,129 |
| * | Red Robin Gourmet Burgers Inc. | 99,118 | 2,128 |
| * | Movado Group Inc. | 126,490 | 2,042 |
| * | Amerigon Inc. | 186,508 | 2,029 |
| * | Destination Maternity Corp. | 52,190 | 1,980 |
| | HOT Topic Inc. | 310,499 | 1,947 |
| * | Overstock.com Inc. | 115,867 | 1,909 |
| * | Unifi Inc. | 110,031 | 1,863 |
| | Ambassadors Group Inc. | 160,330 | 1,844 |
| *,^ | Bridgepoint Education Inc. | 96,963 | 1,842 |
| | Stein Mart Inc. | 199,098 | 1,842 |
| * | M/I Homes Inc. | 118,474 | 1,822 |
| * | Cavco Industries Inc. | 38,080 | 1,778 |
| * | Morgans Hotel Group Co. | 193,057 | 1,751 |
| | Speedway Motorsports Inc. | 114,093 | 1,748 |
| * | Vera Bradley Inc. | 52,839 | 1,744 |
| | Haverty Furniture Cos. Inc. | 131,631 | 1,709 |
| | Lithia Motors Inc. Class A | 118,411 | 1,692 |
| | Marcus Corp. | 126,202 | 1,675 |
| * | Furniture Brands International Inc. | 304,055 | 1,563 |
| | Blyth Inc. | 44,315 | 1,528 |
| | Christopher & Banks Corp. | 248,287 | 1,527 |
| * | Audiovox Corp. Class A | 175,226 | 1,512 |
| * | CKX Inc. | 358,497 | 1,445 |
| * | Smith & Wesson Holding Corp. | 386,214 | 1,444 |
4
| | | |
| Vanguard® Extended Market Index Fund | | |
| Schedule of Investments | | |
| December 31, 2010 | | |
| |
| |
| | | | Market |
| | | | Value |
| | | Shares | ($000) |
| * | Shoe Carnival Inc. | 52,697 | 1,423 |
| * | Steinway Musical Instruments Inc. | 70,770 | 1,405 |
| * | Coldwater Creek Inc. | 436,770 | 1,385 |
| | Lincoln Educational Services Corp. | 89,048 | 1,381 |
| *,^ | McClatchy Co. Class A | 294,199 | 1,374 |
| * | America's Car-Mart Inc. | 49,609 | 1,343 |
| * | Perry Ellis International Inc. | 48,851 | 1,342 |
| * | AH Belo Corp. Class A | 153,227 | 1,333 |
| * | Entercom Communications Corp. Class A | 114,572 | 1,327 |
| | Spartan Motors Inc. | 217,490 | 1,324 |
| * | LIN TV Corp. Class A | 249,498 | 1,322 |
| * | MarineMax Inc. | 139,070 | 1,300 |
| * | Entravision Communications Corp. Class A | 505,681 | 1,300 |
| | Express Inc. | 68,407 | 1,286 |
| | Bebe Stores Inc. | 212,540 | 1,267 |
| * | Journal Communications Inc. Class A | 249,316 | 1,259 |
| | Cherokee Inc. | 66,862 | 1,258 |
| * | Kirkland's Inc. | 89,395 | 1,254 |
| * | Insignia Systems Inc. | 188,040 | 1,228 |
| * | Libbey Inc. | 78,988 | 1,222 |
| | CPI Corp. | 54,013 | 1,218 |
| * | Tuesday Morning Corp. | 225,098 | 1,188 |
| *,^ | Hovnanian Enterprises Inc. Class A | 283,484 | 1,159 |
| * | Drugstore.Com Inc. | 523,292 | 1,156 |
| | Gaiam Inc. Class A | 148,482 | 1,143 |
| * | Isle of Capri Casinos Inc. | 111,028 | 1,135 |
| | Standard Motor Products Inc. | 82,701 | 1,133 |
| * | Valuevision Media Inc. Class A | 184,257 | 1,126 |
| * | Saga Communications Inc. Class A | 41,857 | 1,102 |
| | CSS Industries Inc. | 52,699 | 1,086 |
| * | Kid Brands Inc. | 125,218 | 1,071 |
| * | LodgeNet Interactive Corp. | 249,263 | 1,059 |
| * | Kenneth Cole Productions Inc. Class A | 84,520 | 1,056 |
| * | Systemax Inc. | 74,751 | 1,054 |
| * | Stoneridge Inc. | 66,601 | 1,052 |
| * | Orbitz Worldwide Inc. | 187,605 | 1,049 |
| * | Cumulus Media Inc. Class A | 238,973 | 1,030 |
| * | Marine Products Corp. | 153,752 | 1,024 |
| * | Midas Inc. | 126,019 | 1,022 |
| * | Casual Male Retail Group Inc. | 213,903 | 1,014 |
| | PRIMEDIA Inc. | 240,515 | 1,010 |
| * | Martha Stewart Living Omnimedia Class A | 219,972 | 972 |
| * | Red Lion Hotels Corp. | 120,508 | 962 |
| | Weyco Group Inc. | 39,043 | 956 |
| * | Geeknet Inc. | 37,871 | 946 |
| *,^ | Brookfield Homes Corp. | 100,588 | 945 |
| * | Famous Dave's Of America Inc. | 84,284 | 940 |
| * | Lifetime Brands Inc. | 65,566 | 921 |
| | Skyline Corp. | 35,069 | 915 |
| * | Arctic Cat Inc. | 61,197 | 896 |
| * | Rocky Brands Inc. | 88,584 | 889 |
| * | Luby's Inc. | 140,727 | 882 |
| * | SuperMedia Inc. | 100,436 | 875 |
| | Learning Tree International Inc. | 90,425 | 864 |
| * | Leapfrog Enterprises Inc. | 153,830 | 854 |
| * | Culp Inc. | 81,245 | 842 |
| * | Nexstar Broadcasting Group Inc. Class A | 136,245 | 816 |
| * | Zale Corp. | 191,550 | 816 |
| * | Princeton Review Inc. | 689,156 | 813 |
| * | Ruth's Hospitality Group Inc. | 173,111 | 801 |
| * | West Marine Inc. | 74,895 | 792 |
| * | Caribou Coffee Co. Inc. | 77,454 | 781 |
| * | Sealy Corp. | 266,941 | 779 |
| | Tandy Leather Factory Inc. | 166,905 | 778 |
5
| | | |
| Vanguard® Extended Market Index Fund | | |
| Schedule of Investments | | |
| December 31, 2010 | | |
| |
| |
| | | | Market |
| | | | Value |
| | | Shares | ($000) |
| *,^ | Crown Media Holdings Inc. Class A | 281,776 | 738 |
| * | Playboy Enterprises Inc. Class B | 135,980 | 710 |
| * | Multimedia Games Inc. | 126,282 | 705 |
| * | O'Charleys Inc. | 96,716 | 696 |
| * | Build-A-Bear Workshop Inc. | 90,099 | 688 |
| | RG Barry Corp. | 60,620 | 674 |
| | Flexsteel Industries | 37,426 | 662 |
| * | Fisher Communications Inc. | 30,115 | 656 |
| | Hooker Furniture Corp. | 45,997 | 650 |
| | Shiloh Industries Inc. | 54,386 | 650 |
| * | Bon-Ton Stores Inc. | 51,307 | 650 |
| * | Monarch Casino & Resort Inc. | 51,095 | 639 |
| * | Hollywood Media Corp. | 382,721 | 628 |
| | Escalade Inc. | 98,010 | 622 |
| * | Joe's Jeans Inc. | 389,951 | 608 |
| *,^ | Westwood One Inc. | 66,392 | 606 |
| * | New York & Co. Inc. | 136,091 | 601 |
| * | Jamba Inc. | 258,755 | 587 |
| | Collectors Universe | 41,451 | 577 |
| | Frisch's Restaurants Inc. | 25,701 | 574 |
| * | Summer Infant Inc. | 75,478 | 572 |
| * | 1-800-Flowers.com Inc. Class A | 212,399 | 571 |
| * | Media General Inc. Class A | 98,734 | 571 |
| * | Delta Apparel Inc. | 40,931 | 553 |
| * | Carrols Restaurant Group Inc. | 74,039 | 549 |
| * | Beasley Broadcasting Group Inc. Class A | 90,988 | 545 |
| * | Charles & Colvard Ltd. | 179,486 | 542 |
| | Mac-Gray Corp. | 36,218 | 541 |
| * | Forward Industries Inc. | 164,828 | 531 |
| | Strattec Security Corp. | 15,676 | 522 |
| | Outdoor Channel Holdings Inc. | 71,730 | 514 |
| * | Bravo Brio Restaurant Group Inc. | 26,732 | 512 |
| * | Cost Plus Inc. | 52,050 | 505 |
| | Books-A-Million Inc. | 86,393 | 501 |
| * | Benihana Inc. Class A | 61,047 | 496 |
| * | Nobel Learning Communities Inc. | 65,708 | 480 |
| * | Dixie Group Inc. | 131,574 | 472 |
| * | Global Traffic Network Inc. | 51,017 | 472 |
| * | AC Moore Arts & Crafts Inc. | 182,471 | 460 |
| * | Cache Inc. | 101,197 | 449 |
| | Ark Restaurants Corp. | 30,688 | 441 |
| * | Lee Enterprises Inc. | 175,451 | 432 |
| * | Bassett Furniture Industries Inc. | 102,110 | 429 |
| * | Nautilus Inc. | 239,023 | 425 |
| * | Bluegreen Corp. | 131,902 | 425 |
| * | Navarre Corp. | 194,921 | 413 |
| * | Dover Motorsports Inc. | 226,334 | 403 |
| | Dover Downs Gaming & Entertainment Inc. | 118,248 | 402 |
| * | Heelys Inc. | 126,864 | 386 |
| * | Carmike Cinemas Inc. | 49,046 | 379 |
| *,^ | Quantum Fuel Systems Technologies Worldwide Inc. | 837,024 | 377 |
| * | McCormick & Schmick's Seafood Restaurants Inc. | 41,235 | 375 |
| *,^ | Borders Group Inc. | 413,515 | 372 |
| * | MTR Gaming Group Inc. | 177,769 | 359 |
| * | Perfumania Holdings Inc. | 39,291 | 354 |
| * | Jackson Hewitt Tax Service Inc. | 157,830 | 344 |
| * | Vitacost.com Inc. | 60,219 | 343 |
| | Emerson Radio Corp. | 171,078 | 339 |
| * | Nathan's Famous Inc. | 19,811 | 334 |
| * | Trans World Entertainment Corp. | 194,782 | 331 |
| * | Nobility Homes Inc. | 40,811 | 331 |
| | Gaming Partners International Corp. | 50,097 | 310 |
| * | J Alexander's Corp. | 57,378 | 301 |
| * | VCG Holding Corp. | 135,391 | 295 |
6
| | | |
| Vanguard® Extended Market Index Fund | | |
| Schedule of Investments | | |
| December 31, 2010 | | |
| |
| |
| | | | Market |
| | | | Value |
| | | Shares | ($000) |
| * | Stanley Furniture Co. Inc. | 94,855 | 295 |
| * | Cambium Learning Group Inc. | 83,816 | 288 |
| * | American Apparel Inc. | 171,014 | 284 |
| * | Motorcar Parts of America Inc. | 21,681 | 283 |
| * | Carriage Services Inc. Class A | 57,955 | 281 |
| *,^ | Conn's Inc. | 57,102 | 267 |
| * | Morton's Restaurant Group Inc. | 41,110 | 266 |
| * | Lakes Entertainment Inc. | 92,413 | 263 |
| * | Century Casinos Inc. | 96,100 | 233 |
| * | Bidz.com Inc. | 189,541 | 224 |
| * | Town Sports International Holdings Inc. | 55,009 | 223 |
| * | Benihana Inc. Class A | 27,540 | 223 |
| * | Ballantyne Strong Inc. | 28,365 | 220 |
| * | Harris Interactive Inc. | 167,264 | 204 |
| * | Empire Resorts Inc. | 194,399 | 200 |
| * | Great Wolf Resorts Inc. | 72,443 | 190 |
| * | Rick's Cabaret International Inc. | 23,335 | 183 |
| * | Premier Exhibitions Inc. | 87,426 | 172 |
| * | Gray Television Inc. | 89,453 | 167 |
| * | Archipelago Learning Inc. | 16,659 | 163 |
| | Winmark Corp. | 4,489 | 151 |
| * | Emmis Communications Corp. Class A | 198,398 | 151 |
| * | Infosonics Corp. | 184,032 | 140 |
| * | Bluefly Inc. | 46,169 | 132 |
| * | Playboy Enterprises Inc. Class A | 22,850 | 122 |
| * | Silverleaf Resorts Inc. | 107,400 | 121 |
| * | Dreams Inc. | 44,337 | 117 |
| * | US Auto Parts Network Inc. | 13,039 | 109 |
| * | Radio One Inc. Class A | 93,623 | 108 |
| * | Cosi Inc. | 88,208 | 108 |
| * | Golfsmith International Holdings Inc. | 44,379 | 107 |
| * | Duckwall-ALCO Stores Inc. | 8,417 | 106 |
| * | NTN Buzztime Inc. | 274,389 | 104 |
| | Williams Controls Inc. | 9,744 | 103 |
| * | Full House Resorts Inc. | 28,898 | 98 |
| * | Johnson Outdoors Inc. Class A | 7,174 | 90 |
| | Lacrosse Footwear Inc. | 4,133 | 68 |
| * | Syms Corp. | 9,144 | 66 |
| * | Adams Golf Inc. | 10,608 | 50 |
| * | Hallwood Group Inc. | 1,737 | 46 |
| * | Atrinsic Inc. | 17,359 | 46 |
| * | Radio One Inc. | 24,633 | 28 |
| * | Kona Grill Inc. | 5,475 | 22 |
| * | Spanish Broadcasting System Inc. | 29,852 | 21 |
| * | Meade Instruments Corp. | 4,548 | 15 |
| * | Ambassadors International Inc. | 9,636 | 15 |
| * | Entertainment Gaming Asia Inc. | 35,584 | 13 |
| * | SPAR Group Inc. | 7,650 | 7 |
| * | Sport Chalet Inc. Class A | 1,485 | 4 |
| * | Ediets.Com Inc. | 8,155 | 4 |
| * | Clarus Corp. | 503 | 4 |
| * | Krispy Kreme Doughnuts Inc. Warrants Exp. 03/02/2012 | 5,255 | 2 |
| * | GameTech International Inc. | 2,000 | 1 |
| * | Here Media Inc. | 12,670 | — |
| | | | 2,415,011 |
| Consumer Staples (3.4%) | | |
| | Bunge Ltd. | 941,322 | 61,675 |
| * | Energizer Holdings Inc. | 458,412 | 33,418 |
| | Church & Dwight Co. Inc. | 461,998 | 31,887 |
| | Herbalife Ltd. | 384,891 | 26,315 |
| * | Green Mountain Coffee Roasters Inc. | 753,032 | 24,745 |
| | Del Monte Foods Co. | 1,259,532 | 23,679 |
| * | Hansen Natural Corp. | 448,760 | 23,461 |
7
| | | |
| Vanguard® Extended Market Index Fund | | |
| Schedule of Investments | | |
| December 31, 2010 | | |
| |
| |
| | | | Market |
| | | | Value |
| | | Shares | ($000) |
| * | Ralcorp Holdings Inc. | 356,859 | 23,199 |
| | Corn Products International Inc. | 491,305 | 22,600 |
| * | Smithfield Foods Inc. | 1,078,461 | 22,249 |
| | Alberto-Culver Co. Class B | 557,638 | 20,655 |
| * | BJ's Wholesale Club Inc. | 354,731 | 16,992 |
| | Flowers Foods Inc. | 494,642 | 13,311 |
| * | TreeHouse Foods Inc. | 229,985 | 11,750 |
| * | United Natural Foods Inc. | 312,973 | 11,480 |
| | Nu Skin Enterprises Inc. Class A | 351,380 | 10,633 |
| | Casey's General Stores Inc. | 245,878 | 10,452 |
| | Ruddick Corp. | 277,836 | 10,235 |
| * | Central European Distribution Corp. | 400,187 | 9,164 |
| | Diamond Foods Inc. | 142,753 | 7,592 |
| * | Hain Celestial Group Inc. | 278,420 | 7,534 |
| | Lancaster Colony Corp. | 126,026 | 7,209 |
| * | Darling International Inc. | 536,017 | 7,118 |
| | Snyders-Lance Inc. | 300,290 | 7,039 |
| | Fresh Del Monte Produce Inc. | 265,751 | 6,630 |
| | Universal Corp. | 156,661 | 6,376 |
| | Vector Group Ltd. | 355,747 | 6,162 |
| * | Boston Beer Co. Inc. Class A | 60,967 | 5,797 |
| * | Spectrum Brands Holdings Inc. | 166,270 | 5,183 |
| | Sanderson Farms Inc. | 126,094 | 4,937 |
| | Tootsie Roll Industries Inc. | 159,555 | 4,622 |
| | J&J Snack Foods Corp. | 92,710 | 4,472 |
| | WD-40 Co. | 108,810 | 4,383 |
| | Andersons Inc. | 119,676 | 4,350 |
| | B&G Foods Inc. Class A | 310,733 | 4,266 |
| | Pricesmart Inc. | 110,748 | 4,212 |
| * | Chiquita Brands International Inc. | 294,283 | 4,126 |
| * | Prestige Brands Holdings Inc. | 326,433 | 3,901 |
| * | Elizabeth Arden Inc. | 164,256 | 3,780 |
| * | Central Garden and Pet Co. Class A | 373,907 | 3,694 |
| * | Rite Aid Corp. | 4,122,679 | 3,641 |
| * | Pilgrim's Pride Corp. | 501,228 | 3,554 |
| | Nash Finch Co. | 81,798 | 3,477 |
| *,^ | Dole Food Co. Inc. | 225,191 | 3,042 |
| * | Pantry Inc. | 146,771 | 2,915 |
| | Weis Markets Inc. | 70,734 | 2,853 |
| | Spartan Stores Inc. | 162,405 | 2,753 |
| ^ | Cal-Maine Foods Inc. | 82,050 | 2,591 |
| * | Winn-Dixie Stores Inc. | 357,116 | 2,560 |
| * | Medifast Inc. | 85,677 | 2,474 |
| * | Alliance One International Inc. | 580,254 | 2,460 |
| * | Smart Balance Inc. | 438,771 | 1,900 |
| * | USANA Health Sciences Inc. | 41,576 | 1,806 |
| | Ingles Markets Inc. Class A | 93,251 | 1,790 |
| | Inter Parfums Inc. | 80,421 | 1,516 |
| | National Beverage Corp. | 111,489 | 1,465 |
| | Calavo Growers Inc. | 59,600 | 1,374 |
| | Village Super Market Inc. Class A | 39,663 | 1,309 |
| | Coca-Cola Bottling Co. Consolidated | 23,231 | 1,291 |
| | Imperial Sugar Co. | 93,916 | 1,256 |
| * | Seneca Foods Corp. Class A | 42,180 | 1,138 |
| *,^ | Synutra International Inc. | 83,892 | 1,128 |
| | Oil-Dri Corp. of America | 52,194 | 1,122 |
| | Farmer Bros Co. | 62,233 | 1,108 |
| *,^ | Star Scientific Inc. | 530,990 | 1,035 |
| * | Revlon Inc. Class A | 95,636 | 941 |
| * | Omega Protein Corp. | 113,930 | 923 |
| * | Susser Holdings Corp. | 65,033 | 901 |
| * | Nutraceutical International Corp. | 62,072 | 881 |
| * | John B. Sanfilippo & Son Inc. | 69,944 | 870 |
| * | Reddy Ice Holdings Inc. | 294,919 | 811 |
8
| | | |
| Vanguard® Extended Market Index Fund | | |
| Schedule of Investments | | |
| December 31, 2010 | | |
| |
| | | | Market |
| | | | Value |
| | | Shares | ($000) |
| | Rocky Mountain Chocolate Factory Inc. | 83,634 | 808 |
| | MGP Ingredients Inc. | 72,053 | 795 |
| *,^ | Lifeway Foods Inc. | 81,428 | 778 |
| | United-Guardian Inc. | 55,216 | 773 |
| * | HQ Sustainable Maritime Industries Inc. | 157,945 | 753 |
| ^ | Limoneira Co. | 24,504 | 703 |
| | Alico Inc. | 24,822 | 592 |
| | Schiff Nutrition International Inc. | 64,950 | 590 |
| * | Harbinger Group Inc. | 92,981 | 576 |
| | Arden Group Inc. | 6,134 | 506 |
| | Female Health Co. | 87,287 | 497 |
| * | Natural Alternatives International Inc. | 77,537 | 434 |
| * | Overhill Farms Inc. | 68,677 | 397 |
| *,^ | Nature's Sunshine Products Inc. | 35,717 | 321 |
| * | Orchids Paper Products Co. | 23,573 | 289 |
| * | Physicians Formula Holdings Inc. | 76,439 | 287 |
| * | Parlux Fragrances Inc. | 89,346 | 263 |
| * | IGI Laboratories Inc. | 72,600 | 120 |
| * | Mannatech Inc. | 63,530 | 114 |
| * | Craft Brewers Alliance Inc. | 12,423 | 92 |
| | Reliv International Inc. | 42,686 | 81 |
| * | Crystal Rock Holdings Inc. | 600 | — |
| | | | 587,937 |
| Energy (7.4%) | | |
| * | Concho Resources Inc. | 648,961 | 56,894 |
| | Cimarex Energy Co. | 550,272 | 48,716 |
| * | Ultra Petroleum Corp. | 990,584 | 47,320 |
| * | Alpha Natural Resources Inc. | 782,240 | 46,958 |
| * | Whiting Petroleum Corp. | 380,392 | 44,578 |
| * | Pride International Inc. | 1,141,605 | 37,673 |
| | Arch Coal Inc. | 1,055,543 | 37,007 |
| * | Petrohawk Energy Corp. | 1,963,904 | 35,841 |
| * | McDermott International Inc. | 1,508,791 | 31,217 |
| * | Plains Exploration & Production Co. | 910,215 | 29,254 |
| * | Forest Oil Corp. | 736,588 | 27,968 |
| | Core Laboratories NV | 291,931 | 25,996 |
| * | Oceaneering International Inc. | 351,547 | 25,884 |
| | SM Energy Co. | 409,678 | 24,142 |
| * | Atlas Energy Inc. | 509,288 | 22,393 |
| * | Dresser-Rand Group Inc. | 524,150 | 22,324 |
| | Patterson-UTI Energy Inc. | 1,001,327 | 21,579 |
| * | Oil States International Inc. | 328,427 | 21,049 |
| | EXCO Resources Inc. | 1,077,615 | 20,927 |
| * | Brigham Exploration Co. | 759,307 | 20,684 |
| | Southern Union Co. | 808,839 | 19,469 |
| | Tidewater Inc. | 333,967 | 17,981 |
| * | Superior Energy Services Inc. | 512,032 | 17,916 |
| * | Continental Resources Inc. | 298,170 | 17,547 |
| * | Dril-Quip Inc. | 222,740 | 17,311 |
| * | SandRidge Energy Inc. | 2,342,193 | 17,145 |
| | World Fuel Services Corp. | 449,011 | 16,236 |
| | SEACOR Holdings Inc. | 138,017 | 13,952 |
| * | Atwood Oceanics Inc. | 364,455 | 13,620 |
| * | Complete Production Services Inc. | 450,469 | 13,311 |
| | Berry Petroleum Co. Class A | 302,850 | 13,235 |
| * | Rosetta Resources Inc. | 342,707 | 12,900 |
| * | Energy XXI Bermuda Ltd. | 462,778 | 12,805 |
| | CARBO Ceramics Inc. | 123,189 | 12,755 |
| * | Bill Barrett Corp. | 301,445 | 12,398 |
| | Frontier Oil Corp. | 686,791 | 12,369 |
| | Lufkin Industries Inc. | 195,310 | 12,185 |
| * | Unit Corp. | 258,238 | 12,003 |
| * | McMoRan Exploration Co. | 689,780 | 11,823 |
| | Holly Corp. | 286,992 | 11,701 |
9
| | | |
| Vanguard® Extended Market Index Fund | | |
| Schedule of Investments | | |
| December 31, 2010 | | |
| |
| | | | Market |
| | | | Value |
| | | Shares | ($000) |
| * | Quicksilver Resources Inc. | 763,574 | 11,255 |
| * | Bristow Group Inc. | 235,371 | 11,145 |
| * | Key Energy Services Inc. | 817,739 | 10,614 |
| * | Swift Energy Co. | 270,505 | 10,590 |
| * | Patriot Coal Corp. | 520,267 | 10,078 |
| * | Exterran Holdings Inc. | 410,727 | 9,837 |
| * | Northern Oil and Gas Inc. | 338,280 | 9,205 |
| * | International Coal Group Inc. | 1,138,440 | 8,812 |
| * | ION Geophysical Corp. | 990,135 | 8,396 |
| * | Helix Energy Solutions Group Inc. | 685,207 | 8,318 |
| * | Cobalt International Energy Inc. | 648,517 | 7,918 |
| * | Carrizo Oil & Gas Inc. | 227,046 | 7,831 |
| * | Comstock Resources Inc. | 307,613 | 7,555 |
| * | Oasis Petroleum Inc. | 276,243 | 7,492 |
| * | SemGroup Corp. Class A | 269,657 | 7,327 |
| * | Stone Energy Corp. | 315,536 | 7,033 |
| * | Petroleum Development Corp. | 152,125 | 6,421 |
| | Overseas Shipholding Group Inc. | 173,925 | 6,160 |
| * | Tetra Technologies Inc. | 495,525 | 5,882 |
| | Penn Virginia Corp. | 296,382 | 4,985 |
| | RPC Inc. | 269,853 | 4,890 |
| | Contango Oil & Gas Co. | 84,222 | 4,879 |
| * | Cloud Peak Energy Inc. | 205,546 | 4,775 |
| * | James River Coal Co. | 181,123 | 4,588 |
| * | Gulfmark Offshore Inc. | 150,142 | 4,564 |
| * | Global Industries Ltd. | 654,839 | 4,538 |
| * | USEC Inc. | 745,655 | 4,489 |
| * | Gulfport Energy Corp. | 205,679 | 4,453 |
| *,^ | ATP Oil & Gas Corp. | 264,093 | 4,421 |
| *,^ | Clean Energy Fuels Corp. | 306,635 | 4,244 |
| | W&T Offshore Inc. | 228,084 | 4,076 |
| * | Approach Resources Inc. | 174,619 | 4,034 |
| *,^ | Hyperdynamics Corp. | 756,722 | 3,753 |
| * | Newpark Resources Inc. | 581,070 | 3,579 |
| * | Energy Partners Ltd. | 234,412 | 3,483 |
| * | Cal Dive International Inc. | 612,162 | 3,471 |
| * | Parker Drilling Co. | 753,843 | 3,445 |
| * | Clayton Williams Energy Inc. | 40,065 | 3,364 |
| * | Harvest Natural Resources Inc. | 266,509 | 3,243 |
| * | Hornbeck Offshore Services Inc. | 151,285 | 3,159 |
| * | T-3 Energy Services Inc. | 78,729 | 3,136 |
| * | Western Refining Inc. | 288,865 | 3,056 |
| * | Pioneer Drilling Co. | 345,909 | 3,047 |
| *,^ | BPZ Resources Inc. | 634,919 | 3,022 |
| * | Goodrich Petroleum Corp. | 169,855 | 2,996 |
| * | Hercules Offshore Inc. | 844,988 | 2,924 |
| * | Venoco Inc. | 157,516 | 2,906 |
| * | Vaalco Energy Inc. | 397,024 | 2,843 |
| | Crosstex Energy Inc. | 315,600 | 2,796 |
| | Gulf Island Fabrication Inc. | 97,387 | 2,744 |
| * | OYO Geospace Corp. | 26,894 | 2,665 |
| * | Willbros Group Inc. | 269,550 | 2,647 |
| * | Basic Energy Services Inc. | 155,444 | 2,562 |
| * | Rex Energy Corp. | 187,196 | 2,555 |
| * | Uranium Resources Inc. | 750,478 | 2,552 |
| * | Petroquest Energy Inc. | 331,015 | 2,493 |
| * | CVR Energy Inc. | 157,330 | 2,388 |
| * | Magnum Hunter Resources Corp. | 328,156 | 2,363 |
| * | Abraxas Petroleum Corp. | 509,846 | 2,330 |
| *,^ | Uranium Energy Corp. | 374,817 | 2,264 |
| * | Matrix Service Co. | 182,351 | 2,221 |
| * | Toreador Resources Corp. | 140,610 | 2,182 |
| * | Warren Resources Inc. | 471,579 | 2,132 |
| * | Allis-Chalmers Energy Inc. | 290,781 | 2,062 |
10
| | | |
| Vanguard® Extended Market Index Fund | | |
| Schedule of Investments | | |
| December 31, 2010 | | |
| |
| |
| | | | Market |
| | | | Value |
| | | Shares | ($000) |
| * | FX Energy Inc. | 324,321 | 1,995 |
| * | Vantage Drilling Co. | 925,467 | 1,879 |
| *,^ | Rentech Inc. | 1,534,158 | 1,872 |
| * | Endeavour International Corp. | 134,246 | 1,853 |
| | General Maritime Corp. | 568,546 | 1,848 |
| *,^ | Cheniere Energy Inc. | 323,836 | 1,788 |
| * | Georesources Inc. | 75,644 | 1,680 |
| ^ | Houston American Energy Corp. | 91,527 | 1,656 |
| * | PHI Inc. | 78,066 | 1,650 |
| * | Dawson Geophysical Co. | 50,346 | 1,606 |
| * | Callon Petroleum Co. | 266,951 | 1,580 |
| * | Natural Gas Services Group Inc. | 65,260 | 1,234 |
| * | Bronco Drilling Co. Inc. | 152,942 | 1,224 |
| * | Mitcham Industries Inc. | 104,431 | 1,206 |
| * | Syntroleum Corp. | 635,233 | 1,175 |
| *,^ | GMX Resources Inc. | 210,771 | 1,163 |
| | Panhandle Oil and Gas Inc. Class A | 39,882 | 1,094 |
| * | RAM Energy Resources Inc. | 590,339 | 1,086 |
| * | Westmoreland Coal Co. | 82,303 | 983 |
| * | Bolt Technology Corp. | 65,787 | 866 |
| * | Delta Petroleum Corp. | 1,020,320 | 775 |
| *,^ | Green Plains Renewable Energy Inc. | 65,408 | 737 |
| *,^ | Verenium Corp. | 229,794 | 735 |
| | Delek US Holdings Inc. | 88,709 | 646 |
| * | Seahawk Drilling Inc. | 69,672 | 624 |
| * | Union Drilling Inc. | 80,815 | 588 |
| ^ | Alon USA Energy Inc. | 94,249 | 564 |
| * | CREDO Petroleum Corp. | 69,275 | 561 |
| *,^ | Pacific Ethanol Inc. | 693,301 | 500 |
| * | ENGlobal Corp. | 127,031 | 473 |
| * | Double Eagle Petroleum Co. | 93,748 | 460 |
| *,^ | Isramco Inc. | 4,699 | 396 |
| * | Geokinetics Inc. | 41,480 | 385 |
| * | REX American Resources Corp. | 24,364 | 374 |
| *,^ | Zion Oil & Gas Inc. | 76,389 | 365 |
| *,^ | Royale Energy Inc. | 140,657 | 315 |
| * | Miller Petroleum Inc. | 47,375 | 246 |
| * | CAMAC Energy Inc. | 119,856 | 239 |
| * | Gasco Energy Inc. | 673,691 | 236 |
| * | PHI Inc. | 11,490 | 216 |
| * | HKN Inc. | 61,591 | 216 |
| *,^ | Tri-Valley Corp. | 337,014 | 192 |
| * | TGC Industries Inc. | 45,288 | 172 |
| * | Evolution Petroleum Corp. | 24,265 | 158 |
| * | GeoMet Inc. | 130,962 | 151 |
| * | Barnwell Industries Inc. | 40,609 | 149 |
| * | Triangle Petroleum Corp. | 22,600 | 147 |
| * | Tengasco Inc. | 193,380 | 124 |
| * | Amyris Inc. | 4,521 | 121 |
| * | Crimson Exploration Inc. | 28,173 | 120 |
| *,^ | NGAS Resources Inc. | 181,432 | 102 |
| * | Zion Oil & Gas Inc. Warrants Exp. 01/31/2012 | 12,066 | 101 |
| * | Magellan Petroleum Corp. | 34,769 | 100 |
| * | PostRock Energy Corp. | 24,811 | 90 |
| *,^ | Sulphco Inc. | 522,729 | 89 |
| * | Contango ORE Inc. | 8,271 | 87 |
| * | Cubic Energy Inc. | 80,815 | 81 |
| * | Evergreen Energy Inc. | 105,509 | 69 |
| * | BioFuel Energy Corp. | 30,740 | 54 |
| * | GreenHunter Energy Inc. | 33,852 | 27 |
| * | GeoPetro Resources Co. | 18,800 | 8 |
| * | FieldPoint Petroleum Corp. | 1,750 | 7 |
| * | Pyramid Oil Co. | 1,100 | 6 |
| | | | 1,289,498 |
11
| | |
| Vanguard® Extended Market Index Fund | | |
| Schedule of Investments | | |
| December 31, 2010 | | |
| |
| | | Market |
| | | Value |
| | Shares | ($000) |
| Financials (19.6%) | | |
| BlackRock Inc. | 621,878 | 118,518 |
| New York Community Bancorp Inc. | 2,829,861 | 53,343 |
| Macerich Co. | 845,288 | 40,041 |
| AMB Property Corp. | 1,093,945 | 34,689 |
| SL Green Realty Corp. | 508,317 | 34,316 |
| TD Ameritrade Holding Corp. | 1,758,258 | 33,389 |
| * Affiliated Managers Group Inc. | 335,054 | 33,244 |
| Lazard Ltd. Class A | 827,747 | 32,688 |
| Federal Realty Investment Trust | 399,720 | 31,150 |
| Digital Realty Trust Inc. | 587,755 | 30,293 |
| Everest Re Group Ltd. | 355,404 | 30,145 |
| * MSCI Inc. Class A | 771,668 | 30,064 |
| Nationwide Health Properties Inc. | 820,234 | 29,840 |
| UDR Inc. | 1,183,288 | 27,831 |
| Rayonier Inc. | 523,454 | 27,492 |
| Alexandria Real Estate Equities Inc. | 359,501 | 26,337 |
| Realty Income Corp. | 760,781 | 26,019 |
| Reinsurance Group of America Inc. Class A | 475,776 | 25,554 |
| Cullen/Frost Bankers Inc. | 395,932 | 24,199 |
| Camden Property Trust | 446,207 | 24,086 |
| * Markel Corp. | 63,471 | 24,000 |
| Liberty Property Trust | 741,970 | 23,684 |
| Jones Lang LaSalle Inc. | 277,146 | 23,258 |
| Essex Property Trust Inc. | 203,565 | 23,251 |
| Eaton Vance Corp. | 768,756 | 23,240 |
| RenaissanceRe Holdings Ltd. | 356,575 | 22,710 |
| SEI Investments Co. | 952,191 | 22,653 |
| Old Republic International Corp. | 1,653,044 | 22,531 |
| Regency Centers Corp. | 531,844 | 22,465 |
| HCC Insurance Holdings Inc. | 749,031 | 21,677 |
| Jefferies Group Inc. | 803,734 | 21,403 |
| Transatlantic Holdings Inc. | 412,508 | 21,294 |
| Raymond James Financial Inc. | 649,361 | 21,234 |
| WR Berkley Corp. | 772,332 | 21,146 |
| * Popular Inc. | 6,642,319 | 20,857 |
| Duke Realty Corp. | 1,637,883 | 20,408 |
| Fidelity National Financial Inc. Class A | 1,475,067 | 20,179 |
| Commerce Bancshares Inc. | 504,451 | 20,042 |
| Arthur J Gallagher & Co. | 688,376 | 20,018 |
| Validus Holdings Ltd. | 653,316 | 19,998 |
| Senior Housing Properties Trust | 909,420 | 19,953 |
| Waddell & Reed Financial Inc. Class A | 554,782 | 19,578 |
| First Niagara Financial Group Inc. | 1,358,405 | 18,991 |
| East West Bancorp Inc. | 961,538 | 18,798 |
| Weingarten Realty Investors | 782,300 | 18,587 |
| City National Corp. | 301,288 | 18,487 |
| Hospitality Properties Trust | 801,988 | 18,478 |
| Brown & Brown Inc. | 759,682 | 18,187 |
| BRE Properties Inc. | 416,288 | 18,109 |
| Developers Diversified Realty Corp. | 1,280,930 | 18,048 |
| Taubman Centers Inc. | 355,228 | 17,932 |
| Piedmont Office Realty Trust Inc. Class A | 863,752 | 17,396 |
| Mack-Cali Realty Corp. | 516,538 | 17,077 |
| Associated Banc-Corp | 1,124,298 | 17,033 |
| * American Capital Ltd. | 2,241,005 | 16,942 |
| American Financial Group Inc. | 512,742 | 16,556 |
| White Mountains Insurance Group Ltd. | 48,841 | 16,391 |
| Allied World Assurance Co. Holdings Ltd. | 274,790 | 16,334 |
| BioMed Realty Trust Inc. | 850,049 | 15,853 |
| CBL & Associates Properties Inc. | 897,049 | 15,698 |
| Ares Capital Corp. | 936,289 | 15,430 |
12
| | | |
| Vanguard® Extended Market Index Fund | | |
| Schedule of Investments | | |
| December 31, 2010 | | |
| |
| |
| | | | Market |
| | | | Value |
| | | Shares | ($000) |
| | Corporate Office Properties Trust | 434,569 | 15,188 |
| | Valley National Bancorp | 1,047,792 | 14,983 |
| | CapitalSource Inc. | 2,099,457 | 14,906 |
| | Highwoods Properties Inc. | 465,592 | 14,829 |
| | Protective Life Corp. | 556,522 | 14,826 |
| | Bank of Hawaii Corp. | 313,267 | 14,789 |
| * | SVB Financial Group | 272,800 | 14,472 |
| * | Stifel Financial Corp. | 231,975 | 14,392 |
| | National Retail Properties Inc. | 542,316 | 14,371 |
| | Omega Healthcare Investors Inc. | 639,834 | 14,358 |
| | Alterra Capital Holdings Ltd. | 659,644 | 14,275 |
| | Aspen Insurance Holdings Ltd. | 497,853 | 14,249 |
| * | Alleghany Corp. | 46,205 | 14,156 |
| | Mid-America Apartment Communities Inc. | 222,088 | 14,100 |
| | Apollo Investment Corp. | 1,267,058 | 14,026 |
| | FirstMerit Corp. | 706,801 | 13,988 |
| | Entertainment Properties Trust | 302,350 | 13,984 |
| | American Campus Communities Inc. | 433,799 | 13,777 |
| | Assured Guaranty Ltd. | 775,811 | 13,732 |
| | Hanover Insurance Group Inc. | 293,132 | 13,695 |
| | StanCorp Financial Group Inc. | 302,828 | 13,670 |
| * | Forest City Enterprises Inc. Class A | 816,398 | 13,626 |
| | Home Properties Inc. | 244,518 | 13,568 |
| | Tanger Factory Outlet Centers | 263,050 | 13,466 |
| | Synovus Financial Corp. | 5,099,618 | 13,463 |
| | Greenhill & Co. Inc. | 164,203 | 13,412 |
| | Fulton Financial Corp. | 1,292,488 | 13,364 |
| | Douglas Emmett Inc. | 802,340 | 13,319 |
| * | Signature Bank | 263,769 | 13,188 |
| *,^ | St. Joe Co. | 602,219 | 13,158 |
| | Washington Real Estate Investment Trust | 416,411 | 12,905 |
| | LaSalle Hotel Properties | 474,467 | 12,526 |
| | Kilroy Realty Corp. | 340,034 | 12,401 |
| | Washington Federal Inc. | 730,963 | 12,368 |
| | Endurance Specialty Holdings Ltd. | 266,206 | 12,264 |
| | TCF Financial Corp. | 824,741 | 12,214 |
| * | MBIA Inc. | 1,014,349 | 12,162 |
| * | ProAssurance Corp. | 199,586 | 12,095 |
| | DiamondRock Hospitality Co. | 1,004,079 | 12,049 |
| | CommonWealth REIT | 468,698 | 11,956 |
| | Prosperity Bancshares Inc. | 303,211 | 11,910 |
| | Post Properties Inc. | 316,936 | 11,505 |
| | Platinum Underwriters Holdings Ltd. | 255,112 | 11,472 |
| * | MGIC Investment Corp. | 1,106,877 | 11,279 |
| | Equity Lifestyle Properties Inc. | 200,206 | 11,198 |
| * | CNO Financial Group Inc. | 1,630,724 | 11,056 |
| | Erie Indemnity Co. Class A | 161,947 | 10,603 |
| | Westamerica Bancorporation | 189,187 | 10,494 |
| | Iberiabank Corp. | 174,582 | 10,323 |
| | NewAlliance Bancshares Inc. | 683,027 | 10,232 |
| | Delphi Financial Group Inc. | 352,958 | 10,179 |
| | Brandywine Realty Trust | 873,491 | 10,176 |
| | First American Financial Corp. | 677,107 | 10,116 |
| | Mercury General Corp. | 231,476 | 9,956 |
| | Colonial Properties Trust | 550,629 | 9,939 |
| | Extra Space Storage Inc. | 568,760 | 9,896 |
| | Webster Financial Corp. | 475,800 | 9,373 |
| | Trustmark Corp. | 369,434 | 9,177 |
| | Umpqua Holdings Corp. | 744,733 | 9,071 |
| | Whitney Holding Corp. | 628,506 | 8,893 |
| | Healthcare Realty Trust Inc. | 418,539 | 8,860 |
| * | MF Global Holdings Ltd. | 1,059,635 | 8,859 |
| * | Knight Capital Group Inc. Class A | 637,091 | 8,785 |
| * | Ezcorp Inc. Class A | 323,576 | 8,779 |
13
| | |
| Vanguard® Extended Market Index Fund | | |
| Schedule of Investments | | |
| December 31, 2010 | | |
| |
| |
| | | Market |
| | | Value |
| | Shares | ($000) |
| BOK Financial Corp. | 163,649 | 8,739 |
| Montpelier Re Holdings Ltd. | 433,225 | 8,639 |
| Cathay General Bancorp | 510,541 | 8,526 |
| ^ Primerica Inc. | 349,823 | 8,483 |
| Northwest Bancshares Inc. | 720,125 | 8,469 |
| Potlatch Corp. | 259,913 | 8,460 |
| * PHH Corp. | 360,647 | 8,349 |
| * Portfolio Recovery Associates Inc. | 110,976 | 8,345 |
| DuPont Fabros Technology Inc. | 387,302 | 8,238 |
| Susquehanna Bancshares Inc. | 843,224 | 8,162 |
| National Health Investors Inc. | 180,083 | 8,107 |
| UMB Financial Corp. | 194,694 | 8,064 |
| Unitrin Inc. | 324,924 | 7,974 |
| * Sunstone Hotel Investors Inc. | 766,640 | 7,919 |
| Medical Properties Trust Inc. | 722,853 | 7,829 |
| BancorpSouth Inc. | 478,055 | 7,625 |
| Argo Group International Holdings Ltd. | 201,854 | 7,559 |
| DCT Industrial Trust Inc. | 1,408,072 | 7,477 |
| Astoria Financial Corp. | 535,382 | 7,447 |
| EastGroup Properties Inc. | 175,359 | 7,421 |
| FNB Corp. | 751,825 | 7,383 |
| Wintrust Financial Corp. | 223,303 | 7,376 |
| Old National Bancorp | 615,564 | 7,319 |
| ^ United Bankshares Inc. | 249,858 | 7,296 |
| Tower Group Inc. | 280,835 | 7,184 |
| Cash America International Inc. | 192,208 | 7,098 |
| Glacier Bancorp Inc. | 468,273 | 7,076 |
| Radian Group Inc. | 865,313 | 6,983 |
| First Financial Bancorp | 377,358 | 6,974 |
| First Financial Bankshares Inc. | 135,606 | 6,940 |
| International Bancshares Corp. | 343,927 | 6,889 |
| Symetra Financial Corp. | 499,477 | 6,843 |
| * Howard Hughes Corp. | 125,209 | 6,814 |
| PS Business Parks Inc. | 121,602 | 6,776 |
| Hancock Holding Co. | 191,883 | 6,689 |
| Sovran Self Storage Inc. | 179,627 | 6,612 |
| National Penn Bancshares Inc. | 820,301 | 6,587 |
| First Citizens BancShares Inc. Class A | 34,563 | 6,534 |
| Hersha Hospitality Trust Class A | 977,879 | 6,454 |
| Franklin Street Properties Corp. | 451,304 | 6,431 |
| Lexington Realty Trust | 808,214 | 6,425 |
| Selective Insurance Group Inc. | 348,576 | 6,327 |
| * First Cash Financial Services Inc. | 197,071 | 6,107 |
| MB Financial Inc. | 350,600 | 6,072 |
| Community Bank System Inc. | 215,981 | 5,998 |
| Prospect Capital Corp. | 541,972 | 5,853 |
| Park National Corp. | 78,657 | 5,716 |
| RLI Corp. | 108,262 | 5,691 |
| Cousins Properties Inc. | 673,618 | 5,618 |
| First Potomac Realty Trust | 330,089 | 5,552 |
| First Midwest Bancorp Inc. | 481,323 | 5,545 |
| Alexander's Inc. | 13,312 | 5,488 |
| PrivateBancorp Inc. Class A | 380,481 | 5,471 |
| Equity One Inc. | 299,445 | 5,444 |
| NBT Bancorp Inc. | 224,710 | 5,427 |
| * Ocwen Financial Corp. | 567,881 | 5,418 |
| Columbia Banking System Inc. | 256,176 | 5,395 |
| * World Acceptance Corp. | 102,080 | 5,390 |
| Pebblebrook Hotel Trust | 259,831 | 5,280 |
| Pennsylvania Real Estate Investment Trust | 360,441 | 5,237 |
| KBW Inc. | 186,668 | 5,212 |
| * Strategic Hotels & Resorts Inc. | 983,448 | 5,202 |
| * Greenlight Capital Re Ltd. Class A | 193,651 | 5,192 |
| Provident Financial Services Inc. | 340,636 | 5,154 |
14
| | | |
| Vanguard® Extended Market Index Fund | | |
| Schedule of Investments | | |
| December 31, 2010 | | |
| |
| |
| | | | Market |
| | | | Value |
| | | Shares | ($000) |
| | CVB Financial Corp. | 589,396 | 5,110 |
| | U-Store-It Trust | 535,458 | 5,103 |
| * | Texas Capital Bancshares Inc. | 238,943 | 5,082 |
| | Infinity Property & Casualty Corp. | 82,125 | 5,075 |
| | Interactive Brokers Group Inc. | 275,423 | 4,908 |
| | Oritani Financial Corp. | 394,966 | 4,834 |
| | American National Insurance Co. | 56,002 | 4,795 |
| | LTC Properties Inc. | 170,607 | 4,791 |
| | American Equity Investment Life Holding Co. | 380,994 | 4,781 |
| | Acadia Realty Trust | 261,982 | 4,779 |
| *,^ | iStar Financial Inc. | 607,847 | 4,753 |
| * | CNA Financial Corp. | 175,402 | 4,745 |
| | Employers Holdings Inc. | 270,902 | 4,735 |
| * | Kindred Healthcare Inc. | 256,864 | 4,719 |
| | TFS Financial Corp. | 522,606 | 4,714 |
| * | Pico Holdings Inc. | 147,487 | 4,690 |
| | Safety Insurance Group Inc. | 97,895 | 4,657 |
| | Sterling Bancshares Inc. | 663,176 | 4,656 |
| | Horace Mann Educators Corp. | 257,703 | 4,649 |
| | Getty Realty Corp. | 148,092 | 4,632 |
| | Artio Global Investors Inc. Class A | 313,043 | 4,617 |
| * | Investment Technology Group Inc. | 280,735 | 4,596 |
| | Investors Real Estate Trust | 510,723 | 4,581 |
| * | Forestar Group Inc. | 236,525 | 4,565 |
| | Glimcher Realty Trust | 541,148 | 4,546 |
| * | Dollar Financial Corp. | 158,587 | 4,540 |
| | MarketAxess Holdings Inc. | 211,594 | 4,403 |
| | PacWest Bancorp | 205,319 | 4,390 |
| *,^ | Sterling Financial Corp. | 229,471 | 4,353 |
| | First Commonwealth Financial Corp. | 612,909 | 4,339 |
| | Inland Real Estate Corp. | 492,195 | 4,331 |
| | optionsXpress Holdings Inc. | 276,303 | 4,330 |
| | Fifth Street Finance Corp. | 355,157 | 4,312 |
| | Student Loan Corp. | 130,369 | 4,229 |
| | Brookline Bancorp Inc. | 385,279 | 4,180 |
| * | Navigators Group Inc. | 82,595 | 4,159 |
| | Associated Estates Realty Corp. | 268,769 | 4,109 |
| * | Investors Bancorp Inc. | 306,879 | 4,026 |
| | Chemical Financial Corp. | 178,836 | 3,961 |
| | Capitol Federal Financial Inc. | 330,114 | 3,932 |
| * | FelCor Lodging Trust Inc. | 556,390 | 3,917 |
| * | Credit Acceptance Corp. | 61,748 | 3,876 |
| * | Piper Jaffray Cos. | 110,181 | 3,857 |
| * | National Financial Partners Corp. | 283,946 | 3,805 |
| | Sun Communities Inc. | 113,389 | 3,777 |
| * | Pinnacle Financial Partners Inc. | 277,633 | 3,770 |
| | Oriental Financial Group Inc. | 301,437 | 3,765 |
| | Independent Bank Corp. | 137,896 | 3,730 |
| | Evercore Partners Inc. Class A | 109,341 | 3,718 |
| | City Holding Co. | 102,411 | 3,710 |
| | Bank of the Ozarks Inc. | 85,363 | 3,700 |
| | S&T Bancorp Inc. | 161,309 | 3,644 |
| | Meadowbrook Insurance Group Inc. | 352,316 | 3,611 |
| | Flagstone Reinsurance Holdings SA | 281,860 | 3,551 |
| | Saul Centers Inc. | 74,205 | 3,514 |
| | MCG Capital Corp. | 502,391 | 3,502 |
| * | PMI Group Inc. | 1,051,066 | 3,469 |
| * | Internet Capital Group Inc. | 241,336 | 3,432 |
| | Wesco Financial Corp. | 9,293 | 3,424 |
| | Nelnet Inc. Class A | 139,084 | 3,295 |
| | Wilmington Trust Corp. | 754,714 | 3,275 |
| | WesBanco Inc. | 172,058 | 3,262 |
| | Harleysville Group Inc. | 88,399 | 3,248 |
| | BlackRock Kelso Capital Corp. | 293,044 | 3,241 |
15
| | |
| Vanguard® Extended Market Index Fund | | |
| Schedule of Investments | | |
| December 31, 2010 | | |
| |
| |
| | | Market |
| | | Value |
| | Shares | ($000) |
| * Western Alliance Bancorp | 440,149 | 3,240 |
| United Fire & Casualty Co. | 144,630 | 3,228 |
| * First Industrial Realty Trust Inc. | 366,162 | 3,208 |
| FBL Financial Group Inc. Class A | 111,408 | 3,194 |
| Boston Private Financial Holdings Inc. | 486,056 | 3,184 |
| Trustco Bank Corp. NY | 499,299 | 3,166 |
| Simmons First National Corp. Class A | 110,393 | 3,146 |
| * Nara Bancorp Inc. | 319,237 | 3,135 |
| Home Bancshares Inc. | 139,874 | 3,081 |
| * Ashford Hospitality Trust Inc. | 315,481 | 3,044 |
| Universal Health Realty Income Trust | 83,015 | 3,033 |
| Cohen & Steers Inc. | 115,751 | 3,021 |
| Flushing Financial Corp. | 215,118 | 3,012 |
| * Safeguard Scientifics Inc. | 173,829 | 2,969 |
| Dime Community Bancshares Inc. | 202,841 | 2,959 |
| First Financial Corp. | 81,928 | 2,879 |
| * Financial Engines Inc. | 144,637 | 2,868 |
| Community Trust Bancorp Inc. | 98,417 | 2,850 |
| BGC Partners Inc. Class A | 337,079 | 2,801 |
| PennantPark Investment Corp. | 227,917 | 2,790 |
| * FPIC Insurance Group Inc. | 74,462 | 2,752 |
| SCBT Financial Corp. | 82,799 | 2,712 |
| Ramco-Gershenson Properties Trust | 217,336 | 2,706 |
| Hercules Technology Growth Capital Inc. | 255,372 | 2,646 |
| * CNA Surety Corp. | 109,477 | 2,592 |
| * Hilltop Holdings Inc. | 257,169 | 2,551 |
| * HFF Inc. Class A | 258,837 | 2,500 |
| Duff & Phelps Corp. Class A | 147,970 | 2,495 |
| * Virtus Investment Partners Inc. | 54,604 | 2,477 |
| MVC Capital Inc. | 167,060 | 2,439 |
| Cardinal Financial Corp. | 209,009 | 2,431 |
| * Tejon Ranch Co. | 88,151 | 2,429 |
| Parkway Properties Inc. | 136,838 | 2,397 |
| * Encore Capital Group Inc. | 101,928 | 2,390 |
| Urstadt Biddle Properties Inc. Class A | 122,851 | 2,389 |
| Provident New York Bancorp | 225,678 | 2,367 |
| Renasant Corp. | 139,842 | 2,365 |
| Danvers Bancorp Inc. | 132,664 | 2,344 |
| National Western Life Insurance Co. Class A | 14,009 | 2,336 |
| * eHealth Inc. | 162,600 | 2,307 |
| * Beneficial Mutual Bancorp Inc. | 261,101 | 2,306 |
| WSFS Financial Corp. | 48,442 | 2,298 |
| Education Realty Trust Inc. | 295,664 | 2,297 |
| Campus Crest Communities Inc. | 163,849 | 2,297 |
| * AMERISAFE Inc. | 131,011 | 2,293 |
| Maiden Holdings Ltd. | 291,548 | 2,292 |
| * Center Financial Corp. | 302,075 | 2,290 |
| ^ TowneBank | 144,078 | 2,289 |
| OneBeacon Insurance Group Ltd. Class A | 150,900 | 2,288 |
| * International Assets Holding Corp. | 96,069 | 2,267 |
| National Interstate Corp. | 105,288 | 2,253 |
| Winthrop Realty Trust | 175,394 | 2,243 |
| Advance America Cash Advance Centers Inc. | 387,699 | 2,187 |
| SY Bancorp Inc. | 88,614 | 2,175 |
| Sandy Spring Bancorp Inc. | 117,991 | 2,175 |
| Washington Trust Bancorp Inc. | 98,286 | 2,151 |
| StellarOne Corp. | 147,650 | 2,147 |
| * West Coast Bancorp | 750,892 | 2,118 |
| Bancfirst Corp. | 51,058 | 2,103 |
| Tompkins Financial Corp. | 52,503 | 2,056 |
| GAMCO Investors Inc. | 42,547 | 2,043 |
| Great Southern Bancorp Inc. | 86,184 | 2,033 |
| Amtrust Financial Services Inc. | 115,177 | 2,016 |
| Kite Realty Group Trust | 372,069 | 2,013 |
16
| | |
| Vanguard® Extended Market Index Fund | | |
| Schedule of Investments | | |
| December 31, 2010 | | |
| |
| |
| | | Market |
| | | Value |
| | Shares | ($000) |
| Westfield Financial Inc. | 216,249 | 2,000 |
| * Flagstar Bancorp Inc. | 1,225,650 | 1,998 |
| GFI Group Inc. | 425,080 | 1,994 |
| Arrow Financial Corp. | 72,111 | 1,984 |
| TICC Capital Corp. | 176,311 | 1,976 |
| Southwest Bancorp Inc. | 159,016 | 1,972 |
| Cedar Shopping Centers Inc. | 313,345 | 1,971 |
| * NewStar Financial Inc. | 184,613 | 1,951 |
| * Bancorp Inc. | 190,734 | 1,940 |
| Calamos Asset Management Inc. Class A | 138,149 | 1,934 |
| 1st Source Corp. | 95,080 | 1,924 |
| Berkshire Hills Bancorp Inc. | 84,737 | 1,873 |
| Southside Bancshares Inc. | 88,683 | 1,869 |
| * United Community Banks Inc. | 956,963 | 1,866 |
| ^ German American Bancorp Inc. | 101,226 | 1,864 |
| * Citizens Inc. | 249,339 | 1,858 |
| Republic Bancorp Inc. Class A | 77,800 | 1,848 |
| * Phoenix Cos. Inc. | 724,150 | 1,839 |
| * Global Indemnity plc | 88,235 | 1,804 |
| * Ameris Bancorp | 170,990 | 1,802 |
| Financial Institutions Inc. | 94,866 | 1,800 |
| * Hanmi Financial Corp. | 1,553,047 | 1,786 |
| National Bankshares Inc. | 56,447 | 1,778 |
| * Eagle Bancorp Inc. | 121,871 | 1,759 |
| Capital Southwest Corp. | 16,932 | 1,758 |
| MainSource Financial Group Inc. | 168,552 | 1,755 |
| Univest Corp. of Pennsylvania | 90,097 | 1,727 |
| Sterling Bancorp | 163,189 | 1,709 |
| SeaBright Holdings Inc. | 183,162 | 1,689 |
| Cogdell Spencer Inc. | 289,004 | 1,676 |
| Baldwin & Lyons Inc. | 70,871 | 1,668 |
| Lakeland Bancorp Inc. | 151,931 | 1,667 |
| Abington Bancorp Inc. | 136,912 | 1,633 |
| Agree Realty Corp. | 62,158 | 1,628 |
| * Citizens Republic Bancorp Inc. | 2,629,262 | 1,617 |
| Suffolk Bancorp | 65,497 | 1,616 |
| Camden National Corp. | 44,429 | 1,610 |
| First Bancorp | 103,846 | 1,590 |
| * TradeStation Group Inc. | 234,822 | 1,585 |
| State Auto Financial Corp. | 90,860 | 1,583 |
| Hudson Valley Holding Corp. | 63,800 | 1,580 |
| Bank Mutual Corp. | 328,469 | 1,570 |
| Chesapeake Lodging Trust | 82,278 | 1,548 |
| OceanFirst Financial Corp. | 119,797 | 1,542 |
| CapLease Inc. | 262,088 | 1,525 |
| Lakeland Financial Corp. | 70,988 | 1,523 |
| Hudson Pacific Properties Inc. | 100,606 | 1,514 |
| Westwood Holdings Group Inc. | 37,828 | 1,512 |
| Heartland Financial USA Inc. | 84,592 | 1,477 |
| Kearny Financial Corp. | 169,566 | 1,458 |
| * Seacoast Banking Corp. of Florida | 997,225 | 1,456 |
| Northfield Bancorp Inc. | 107,665 | 1,434 |
| Federal Agricultural Mortgage Corp. | 87,392 | 1,426 |
| Gladstone Capital Corp. | 123,253 | 1,420 |
| ESSA Bancorp Inc. | 106,379 | 1,406 |
| Oppenheimer Holdings Inc. Class A | 53,654 | 1,406 |
| One Liberty Properties Inc. | 83,882 | 1,401 |
| West Bancorporation Inc. | 177,585 | 1,383 |
| Monmouth Real Estate Investment Corp. Class A | 160,182 | 1,362 |
| Presidential Life Corp. | 137,063 | 1,361 |
| Stewart Information Services Corp. | 117,813 | 1,358 |
| * LaBranche & Co. Inc. | 376,395 | 1,355 |
| First Mercury Financial Corp. | 81,609 | 1,338 |
| First Merchants Corp. | 150,700 | 1,335 |
17
| | | |
| Vanguard® Extended Market Index Fund | | |
| Schedule of Investments | | |
| December 31, 2010 | | |
| |
| |
| | | | Market |
| | | | Value |
| | | Shares | ($000) |
| | United Financial Bancorp Inc. | 85,550 | 1,306 |
| | BankFinancial Corp. | 132,265 | 1,290 |
| | Wilshire Bancorp Inc. | 168,521 | 1,284 |
| | First Busey Corp. | 271,115 | 1,274 |
| | Peoples Bancorp Inc. | 81,388 | 1,274 |
| *,^ | Taylor Capital Group Inc. | 96,282 | 1,266 |
| | Union First Market Bankshares Corp. | 85,366 | 1,262 |
| | Northrim BanCorp Inc. | 64,897 | 1,254 |
| * | Green Dot Corp. Class A | 21,915 | 1,243 |
| | Kohlberg Capital Corp. | 177,940 | 1,240 |
| * | Thomas Properties Group Inc. | 293,023 | 1,237 |
| * | Virginia Commerce Bancorp Inc. | 199,979 | 1,236 |
| | Sanders Morris Harris Group Inc. | 169,553 | 1,229 |
| * | Metro Bancorp Inc. | 108,907 | 1,199 |
| | Home Federal Bancorp Inc. | 97,241 | 1,193 |
| * | NewBridge Bancorp | 255,103 | 1,189 |
| | Trico Bancshares | 73,383 | 1,185 |
| | First Interstate Bancsystem Inc. | 76,617 | 1,168 |
| ^ | CBOE Holdings Inc. | 51,042 | 1,167 |
| * | Tree.com Inc. | 121,479 | 1,147 |
| | ViewPoint Financial Group | 98,013 | 1,146 |
| | Triangle Capital Corp. | 60,204 | 1,144 |
| | Merchants Bancshares Inc. | 41,166 | 1,135 |
| * | Guaranty Bancorp | 799,882 | 1,128 |
| | NGP Capital Resources Co. | 121,285 | 1,116 |
| | Century Bancorp Inc. Class A | 41,168 | 1,103 |
| | First Community Bancshares Inc. | 73,610 | 1,100 |
| | Mission West Properties Inc. | 163,600 | 1,094 |
| | Gladstone Investment Corp. | 142,926 | 1,093 |
| | Asta Funding Inc. | 134,804 | 1,092 |
| | Donegal Group Inc. Class B | 63,194 | 1,087 |
| | Territorial Bancorp Inc. | 54,339 | 1,082 |
| | Capital City Bank Group Inc. | 85,362 | 1,076 |
| | Coresite Realty Corp. | 78,780 | 1,075 |
| | Main Street Capital Corp. | 59,012 | 1,073 |
| * | 1st United Bancorp Inc. | 153,963 | 1,064 |
| * | Terreno Realty Corp. | 57,999 | 1,040 |
| | Clifton Savings Bancorp Inc. | 94,772 | 1,024 |
| | Diamond Hill Investment Group Inc. | 14,110 | 1,021 |
| | First Financial Holdings Inc. | 87,948 | 1,012 |
| | American National Bankshares Inc. | 42,874 | 1,010 |
| * | Heritage Financial Corp. | 72,354 | 1,007 |
| | SWS Group Inc. | 198,836 | 1,004 |
| * | Gramercy Capital Corp. | 433,960 | 1,002 |
| | Gladstone Commercial Corp. | 53,143 | 1,001 |
| | Citizens & Northern Corp. | 67,077 | 997 |
| * | Meridian Interstate Bancorp Inc. | 84,388 | 995 |
| * | Cape Bancorp Inc. | 116,873 | 993 |
| *,^ | Macatawa Bank Corp. | 239,409 | 986 |
| * | Harris & Harris Group Inc. | 224,193 | 982 |
| *,^ | Central Pacific Financial Corp. | 628,314 | 961 |
| * | Avatar Holdings Inc. | 48,100 | 953 |
| | Consolidated-Tomoka Land Co. | 32,460 | 938 |
| | Banner Corp. | 400,194 | 928 |
| | First of Long Island Corp. | 32,039 | 926 |
| | CoBiz Financial Inc. | 150,066 | 912 |
| | EMC Insurance Group Inc. | 40,007 | 906 |
| ^ | CompuCredit Holdings Corp. | 129,406 | 903 |
| * | Netspend Holdings Inc. | 70,093 | 899 |
| ^ | Life Partners Holdings Inc. | 46,693 | 893 |
| | Orrstown Financial Services Inc. | 32,143 | 881 |
| * | Sun Bancorp Inc. | 186,940 | 867 |
| | Mercer Insurance Group Inc. | 30,924 | 866 |
| * | Gleacher & Co. Inc. | 348,240 | 825 |
18
| | | |
| Vanguard® Extended Market Index Fund | | |
| Schedule of Investments | | |
| December 31, 2010 | | |
| |
| |
| | | | Market |
| | | | Value |
| | | Shares | ($000) |
| | US Global Investors Inc. Class A | 100,715 | 819 |
| | ESB Financial Corp. | 50,035 | 813 |
| *,^ | Pacific Mercantile Bancorp | 213,660 | 793 |
| | Center Bancorp Inc. | 97,116 | 788 |
| | Penns Woods Bancorp Inc. | 19,678 | 783 |
| | Bryn Mawr Bank Corp. | 44,177 | 771 |
| * | Asset Acceptance Capital Corp. | 129,871 | 770 |
| | Washington Banking Co. | 56,019 | 768 |
| | Centerstate Banks Inc. | 96,568 | 765 |
| * | Bridge Capital Holdings | 87,803 | 761 |
| | MutualFirst Financial Inc. | 80,909 | 752 |
| * | American Safety Insurance Holdings Ltd. | 35,143 | 751 |
| | Enterprise Financial Services Corp. | 71,725 | 750 |
| | Epoch Holding Corp. | 47,202 | 733 |
| | Pulaski Financial Corp. | 96,503 | 732 |
| | Indiana Community Bancorp | 42,907 | 727 |
| | Excel Trust Inc. | 60,052 | 727 |
| * | FBR Capital Markets Corp. | 189,071 | 722 |
| | Kansas City Life Insurance Co. | 21,784 | 720 |
| | Pzena Investment Management Inc. Class A | 96,501 | 709 |
| | First Bancorp Inc. | 44,820 | 708 |
| * | OmniAmerican Bancorp Inc. | 50,911 | 690 |
| * | Home Bancorp Inc. | 49,238 | 680 |
| | Pacific Continental Corp. | 67,485 | 679 |
| | First Financial Northwest Inc. | 168,534 | 676 |
| *,^ | BankAtlantic Bancorp Inc. Class A | 587,347 | 675 |
| * | First California Financial Group Inc. | 240,911 | 675 |
| * | Crawford & Co. Class B | 197,436 | 671 |
| * | Marlin Business Services Corp. | 52,686 | 666 |
| | Arlington Asset Investment Corp. Class A | 27,554 | 661 |
| ^ | Bridge Bancorp Inc. | 26,760 | 660 |
| | Bank of Marin Bancorp | 18,800 | 658 |
| * | Ladenburg Thalmann Financial Services Inc. | 557,122 | 652 |
| * | Republic First Bancorp Inc. | 266,358 | 647 |
| * | First Marblehead Corp. | 296,255 | 643 |
| | Urstadt Biddle Properties Inc. | 38,700 | 643 |
| | JMP Group Inc. | 82,133 | 627 |
| | Eastern Insurance Holdings Inc. | 52,392 | 624 |
| | Universal Insurance Holdings Inc. | 127,670 | 622 |
| * | Unity Bancorp Inc. | 97,880 | 612 |
| | PMC Commercial Trust | 71,989 | 610 |
| | Shore Bancshares Inc. | 57,729 | 608 |
| * | MPG Office Trust Inc. | 220,042 | 605 |
| | MicroFinancial Inc. | 149,615 | 603 |
| * | Fidelity Southern Corp. | 86,226 | 602 |
| *,^ | First BanCorp | 1,291,688 | 594 |
| | TF Financial Corp. | 26,563 | 593 |
| | Bancorp Rhode Island Inc. | 20,379 | 593 |
| *,^ | United Security Bancshares | 157,517 | 592 |
| | State Bancorp Inc. | 62,596 | 579 |
| | Tower Bancorp Inc. | 24,976 | 550 |
| | Golub Capital BDC Inc. | 31,729 | 543 |
| | United Security Bancshares | 48,030 | 537 |
| * | Cowen Group Inc. Class A | 113,537 | 529 |
| | Legacy Bancorp Inc. | 39,524 | 519 |
| * | Fox Chase Bancorp Inc. | 43,749 | 518 |
| | Provident Financial Holdings Inc. | 71,199 | 515 |
| * | Firstcity Financial Corp. | 63,998 | 515 |
| * | AmeriServ Financial Inc. | 324,188 | 512 |
| * | Doral Financial Corp. | 370,290 | 511 |
| | CNB Financial Corp. | 34,478 | 511 |
| | Medallion Financial Corp. | 62,126 | 509 |
| | Donegal Group Inc. Class A | 34,667 | 502 |
| * | Penson Worldwide Inc. | 102,379 | 501 |
19
| | | |
| Vanguard® Extended Market Index Fund | | |
| Schedule of Investments | | |
| December 31, 2010 | | |
| |
| |
| | | | Market |
| | | | Value |
| �� | | Shares | ($000) |
| | Meta Financial Group Inc. | 36,475 | 500 |
| *,^ | Green Bankshares Inc. | 156,041 | 499 |
| | Ocean Shore Holding Co. | 43,211 | 495 |
| | UMH Properties Inc. | 48,093 | 491 |
| | People's United Financial Inc. | 34,234 | 480 |
| | Sierra Bancorp | 44,520 | 478 |
| * | Nicholas Financial Inc. | 47,705 | 478 |
| | Alliance Financial Corp. | 14,623 | 473 |
| * | Chicopee Bancorp Inc. | 37,339 | 472 |
| | Kaiser Federal Financial Group Inc. | 40,710 | 471 |
| | CFS Bancorp Inc. | 88,623 | 464 |
| | BCB Bancorp Inc. | 47,061 | 461 |
| * | Heritage Commerce Corp. | 102,066 | 458 |
| | Tortoise Capital Resources Corp. | 62,133 | 453 |
| | Rockville Financial Inc. | 36,989 | 452 |
| | Middleburg Financial Corp. | 31,177 | 446 |
| * | Intervest Bancshares Corp. Class A | 151,461 | 445 |
| * | Waterstone Financial Inc. | 136,825 | 445 |
| | Peapack Gladstone Financial Corp. | 34,015 | 444 |
| | Ames National Corp. | 20,194 | 438 |
| | Roma Financial Corp. | 41,273 | 438 |
| * | BofI Holding Inc. | 27,773 | 431 |
| *,^ | Pacific Capital Bancorp NA | 15,134 | 428 |
| | 21st Century Holding Co. | 129,012 | 413 |
| * | Maui Land & Pineapple Co. Inc. | 82,523 | 411 |
| * | Louisiana Bancorp Inc. | 28,068 | 410 |
| * | Community Capital Corp. | 154,216 | 401 |
| * | FXCM Inc. Class A | 30,200 | 400 |
| *,^ | Cascade Bancorp | 47,296 | 400 |
| * | MBT Financial Corp. | 217,680 | 387 |
| | Mercantile Bank Corp. | 46,930 | 381 |
| * | United Community Financial Corp. | 293,112 | 378 |
| *,^ | Premierwest Bancorp | 1,113,146 | 373 |
| | Citizens Holding Co. | 17,536 | 369 |
| * | Yadkin Valley Financial Corp. | 196,828 | 356 |
| | Citizens South Banking Corp. | 81,810 | 352 |
| ^ | First South Bancorp Inc. | 54,021 | 350 |
| | Ohio Valley Banc Corp. | 17,715 | 345 |
| | Peoples Bancorp of North Carolina Inc. | 64,718 | 343 |
| | Chatham Lodging Trust | 19,790 | 341 |
| * | Park Sterling Bank | 54,077 | 333 |
| | Parkvale Financial Corp. | 36,069 | 328 |
| * | MetroCorp Bancshares Inc. | 89,829 | 326 |
| | NASB Financial Inc. | 19,159 | 321 |
| | QC Holdings Inc. | 83,844 | 314 |
| | Hawthorn Bancshares Inc. | 35,505 | 305 |
| | Timberland Bancorp Inc. | 81,579 | 301 |
| * | First Defiance Financial Corp. | 25,073 | 298 |
| * | First Place Financial Corp. | 114,212 | 298 |
| *,^ | Dearborn Bancorp Inc. | 175,758 | 297 |
| * | Encore Bancshares Inc. | 28,950 | 297 |
| * | American River Bankshares | 49,581 | 297 |
| * | ZipRealty Inc. | 113,342 | 295 |
| * | WSB Holdings Inc. | 123,877 | 287 |
| * | BRT Realty Trust | 39,682 | 285 |
| ^ | Bar Harbor Bankshares | 9,730 | 284 |
| * | Southcoast Financial Corp. | 91,720 | 282 |
| *,^ | Hampton Roads Bankshares Inc. | 537,058 | 279 |
| *,^ | BancTrust Financial Group Inc. | 103,182 | 276 |
| | VIST Financial Corp. | 37,845 | 271 |
| | Firstbank Corp. | 46,094 | 270 |
| | First United Corp. | 77,714 | 267 |
| | Independence Holding Co. | 32,915 | 265 |
| * | First Acceptance Corp. | 146,908 | 262 |
20
| | | |
| Vanguard® Extended Market Index Fund | | |
| Schedule of Investments | | |
| December 31, 2010 | | |
| |
| |
| | | | Market |
| | | | Value |
| | | Shares | ($000) |
| * | Supertel Hospitality Inc. | 159,492 | 252 |
| | Prudential Bancorp Inc. of Pennsylvania | 40,084 | 241 |
| | Capital Bank Corp. | 96,428 | 240 |
| * | Tower Financial Corp. | 30,984 | 234 |
| * | Riverview Bancorp Inc. | 85,351 | 231 |
| * | Summit Financial Group Inc. | 61,208 | 228 |
| *,^ | Colony Bankcorp Inc. | 56,123 | 227 |
| * | Stratus Properties Inc. | 24,795 | 225 |
| * | North Valley Bancorp | 26,295 | 220 |
| * | Jefferson Bancshares Inc. | 67,379 | 218 |
| | Bank of Commerce Holdings | 50,389 | 214 |
| *,^ | Anchor Bancorp Wisconsin Inc. | 172,285 | 207 |
| * | Pacific Premier Bancorp Inc. | 31,901 | 201 |
| * | PVF Capital Corp. | 110,057 | 200 |
| | Heritage Financial Group Inc. | 15,556 | 193 |
| * | Hallmark Financial Services | 20,940 | 191 |
| * | Grubb & Ellis Co. | 146,840 | 187 |
| * | Preferred Bank | 103,492 | 182 |
| | New Hampshire Thrift Bancshares Inc. | 13,555 | 170 |
| | Federal Agricultural Mortgage Corp. Class A | 12,788 | 168 |
| | Farmers Capital Bank Corp. | 32,071 | 157 |
| | Norwood Financial Corp. | 5,635 | 156 |
| *,^ | Integra Bank Corp. | 214,786 | 155 |
| * | Tennessee Commerce Bancorp Inc. | 31,410 | 154 |
| | Hampden Bancorp Inc. | 13,609 | 154 |
| | Old Point Financial Corp. | 11,962 | 145 |
| * | Cadence Financial Corp. | 58,584 | 144 |
| *,^ | Princeton National Bancorp Inc. | 38,572 | 141 |
| | MidWestOne Financial Group Inc. | 9,269 | 140 |
| * | Atlantic Coast Federal Corp. | 80,976 | 138 |
| * | Bank of Granite Corp. | 259,864 | 137 |
| ^ | Old Second Bancorp Inc. | 84,701 | 136 |
| * | First Security Group Inc. | 148,338 | 135 |
| * | Guaranty Federal Bancshares Inc. | 27,970 | 133 |
| * | Camco Financial Corp. | 90,601 | 132 |
| * | HMN Financial Inc. | 45,747 | 129 |
| *,^ | Capitol Bancorp Ltd. | 241,514 | 125 |
| | Midsouth Bancorp Inc. | 7,606 | 117 |
| * | Investors Capital Holdings Ltd. | 26,700 | 115 |
| * | Southern Community Financial Corp. | 103,418 | 114 |
| * | Consumer Portfolio Services Inc. | 87,963 | 105 |
| *,^ | Superior Bancorp | 179,991 | 103 |
| * | Rodman & Renshaw Capital Group Inc. | 35,375 | 95 |
| * | Kennedy-Wilson Holdings Inc. | 9,287 | 93 |
| * | First Financial Service Corp. | 22,276 | 90 |
| | Community Bankers Trust Corp. | 86,810 | 90 |
| * | First Citizens Banc Corp. | 22,254 | 87 |
| | Porter Bancorp Inc. | 7,492 | 77 |
| * | Presidential Realty Corp. Class B | 46,000 | 75 |
| | Brooklyn Federal Bancorp Inc. | 54,847 | 71 |
| | Investors Title Co. | 2,267 | 71 |
| | Peoples Financial Corp. | 4,686 | 70 |
| * | OBA Financial Services Inc. | 4,550 | 63 |
| | Beacon Federal Bancorp Inc. | 5,037 | 59 |
| * | Northern States Financial Corp. | 36,253 | 59 |
| * | Royal Bancshares of Pennsylvania Inc. | 39,621 | 54 |
| | Enterprise Bancorp Inc. | 3,847 | 52 |
| | First Savings Financial Group Inc. | 3,547 | 51 |
| * | Parke Bancorp Inc. | 4,723 | 47 |
| * | United Western Bancorp Inc. | 152,519 | 44 |
| * | Centrue Financial Corp. | 44,199 | 43 |
| *,^ | Cascade Financial Corp. | 93,296 | 42 |
| * | BCSB Bancorp Inc. | 3,600 | 41 |
| | United Bancshares Inc. | 4,073 | 39 |
21
| | | |
| Vanguard® Extended Market Index Fund | | |
| Schedule of Investments | | |
| December 31, 2010 | | |
| |
| |
| | | | Market |
| | | | Value |
| | | Shares | ($000) |
| | Wilber Corp. | 3,631 | 37 |
| *,^ | TIB Financial Corp. | 1,750 | 36 |
| | Monarch Financial Holdings Inc. | 4,501 | 35 |
| * | Southern National Bancorp of Virginia Inc. | 4,536 | 34 |
| | Codorus Valley Bancorp Inc. | 3,197 | 30 |
| * | Independent Bank Corp. | 20,995 | 27 |
| * | FNB United Corp. | 68,477 | 25 |
| * | Xenith Bankshares Inc. | 4,400 | 24 |
| * | 1st Century Bancshares Inc. | 5,805 | 24 |
| * | TIB Financial Corp. Rights Exp. 01/10/2011 | 1,750,350 | 23 |
| * | Rurban Financial Corp. | 5,340 | 21 |
| * | First Capital Bancorp Inc. | 5,724 | 21 |
| *,^ | PAB Bankshares Inc. | 59,645 | 20 |
| | United Bancorp Inc. | 2,322 | 20 |
| | Premier Financial Bancorp Inc. | 3,042 | 19 |
| * | Affirmative Insurance Holdings Inc. | 7,091 | 19 |
| * | Commonwealth Bankshares Inc. | 13,840 | 19 |
| | Horizon Bancorp | 591 | 16 |
| * | Southern First Bancshares Inc. | 2,100 | 16 |
| | First Bancshares Inc. | 1,825 | 15 |
| | FedFirst Financial Corp. | 967 | 13 |
| * | Mercantile Bancorp Inc. | 15,601 | 13 |
| | Britton & Koontz Capital Corp. | 1,035 | 12 |
| * | Citizens Community Bancorp Inc. | 2,753 | 11 |
| * | Heritage Oaks Bancorp | 3,200 | 11 |
| * | Magyar Bancorp Inc. | 2,200 | 9 |
| * | Rand Capital Corp. | 2,600 | 8 |
| * | Gyrodyne Co. of America Inc. | 76 | 6 |
| * | MHI Hospitality Corp. | 2,300 | 5 |
| * | First Mariner Bancorp Inc. | 10,874 | 5 |
| * | Village Bank and Trust Financial Corp. | 2,400 | 4 |
| * | Berkshire Bancorp Inc. | 427 | 2 |
| * | New Century Bancorp Inc. | 455 | 2 |
| * | Siebert Financial Corp. | 1,236 | 2 |
| * | Mid Penn Bancorp Inc. | 284 | 2 |
| * | Community Financial Corp. | 300 | 1 |
| * | Laporte Bancorp Inc. | 100 | 1 |
| * | Ohio Legacy Corp. | 100 | — |
| * | Atlantic Southern Financial Group Inc. | 100 | — |
| | | | 3,422,143 |
| Health Care (11.6%) | | |
| * | Edwards Lifesciences Corp. | 741,522 | 59,945 |
| * | Illumina Inc. | 807,401 | 51,141 |
| * | Alexion Pharmaceuticals Inc. | 585,364 | 47,151 |
| * | Vertex Pharmaceuticals Inc. | 1,320,067 | 46,242 |
| * | Henry Schein Inc. | 599,482 | 36,802 |
| | Perrigo Co. | 539,305 | 34,154 |
| * | ResMed Inc. | 982,198 | 34,023 |
| | Beckman Coulter Inc. | 449,905 | 33,846 |
| * | Dendreon Corp. | 935,407 | 32,664 |
| * | Mettler-Toledo International Inc. | 213,309 | 32,254 |
| * | Hologic Inc. | 1,688,363 | 31,775 |
| * | Human Genome Sciences Inc. | 1,226,183 | 29,294 |
| | Universal Health Services Inc. Class B | 631,944 | 27,439 |
| * | Endo Pharmaceuticals Holdings Inc. | 750,986 | 26,818 |
| * | IDEXX Laboratories Inc. | 373,561 | 25,858 |
| * | Allscripts Healthcare Solutions Inc. | 1,215,289 | 23,419 |
| * | Community Health Systems Inc. | 601,210 | 22,467 |
| * | Covance Inc. | 421,338 | 21,661 |
| | Pharmaceutical Product Development Inc. | 772,215 | 20,958 |
| * | Mednax Inc. | 309,860 | 20,850 |
| * | United Therapeutics Corp. | 325,456 | 20,575 |
| * | Alere Inc. | 550,963 | 20,165 |
| | Omnicare Inc. | 753,114 | 19,122 |
22
| | | |
| Vanguard® Extended Market Index Fund | | |
| Schedule of Investments | | |
| December 31, 2010 | | |
| |
| |
| | | | Market |
| | | | Value |
| | | Shares | ($000) |
| * | Gen-Probe Inc. | 315,236 | 18,394 |
| * | BioMarin Pharmaceutical Inc. | 665,526 | 17,923 |
| * | Salix Pharmaceuticals Ltd. | 376,390 | 17,675 |
| * | Health Net Inc. | 630,817 | 17,215 |
| | Lincare Holdings Inc. | 635,549 | 17,052 |
| * | Kinetic Concepts Inc. | 406,724 | 17,034 |
| | Cooper Cos. Inc. | 296,716 | 16,717 |
| | Hill-Rom Holdings Inc. | 411,078 | 16,184 |
| | Techne Corp. | 240,906 | 15,820 |
| * | Health Management Associates Inc. Class A | 1,627,907 | 15,530 |
| * | Regeneron Pharmaceuticals Inc. | 472,151 | 15,501 |
| * | Onyx Pharmaceuticals Inc. | 407,622 | 15,029 |
| * | AMERIGROUP Corp. | 322,090 | 14,146 |
| | STERIS Corp. | 386,006 | 14,074 |
| | Teleflex Inc. | 259,822 | 13,981 |
| * | Myriad Genetics Inc. | 607,582 | 13,877 |
| * | Amylin Pharmaceuticals Inc. | 933,406 | 13,730 |
| * | Dionex Corp. | 113,252 | 13,365 |
| * | Charles River Laboratories International Inc. | 375,027 | 13,328 |
| * | Bio-Rad Laboratories Inc. Class A | 126,433 | 13,130 |
| * | Incyte Corp. Ltd. | 792,772 | 13,128 |
| * | VCA Antech Inc. | 559,805 | 13,038 |
| * | Emergency Medical Services Corp. Class A | 194,874 | 12,591 |
| * | LifePoint Hospitals Inc. | 342,386 | 12,583 |
| * | Healthsouth Corp. | 607,065 | 12,572 |
| | Owens & Minor Inc. | 411,451 | 12,109 |
| * | Brookdale Senior Living Inc. Class A | 562,569 | 12,045 |
| * | Catalyst Health Solutions Inc. | 253,910 | 11,804 |
| * | HMS Holdings Corp. | 179,074 | 11,599 |
| | Masimo Corp. | 382,678 | 11,124 |
| * | Sirona Dental Systems Inc. | 265,620 | 11,098 |
| * | InterMune Inc. | 295,705 | 10,764 |
| * | Thoratec Corp. | 379,833 | 10,757 |
| | Medicis Pharmaceutical Corp. Class A | 393,937 | 10,554 |
| * | Theravance Inc. | 414,442 | 10,390 |
| * | Magellan Health Services Inc. | 217,973 | 10,306 |
| * | Haemonetics Corp. | 160,860 | 10,163 |
| * | Healthspring Inc. | 371,850 | 9,865 |
| * | Talecris Biotherapeutics Holdings Corp. | 406,962 | 9,482 |
| | Chemed Corp. | 148,080 | 9,405 |
| * | American Medical Systems Holdings Inc. | 496,752 | 9,369 |
| *,^ | athenahealth Inc. | 222,684 | 9,126 |
| * | Volcano Corp. | 331,944 | 9,065 |
| * | Immucor Inc. | 455,279 | 9,028 |
| | West Pharmaceutical Services Inc. | 216,409 | 8,916 |
| * | Par Pharmaceutical Cos. Inc. | 231,260 | 8,906 |
| * | Cepheid Inc. | 388,014 | 8,827 |
| * | Viropharma Inc. | 506,550 | 8,773 |
| | Quality Systems Inc. | 124,245 | 8,675 |
| * | Align Technology Inc. | 441,231 | 8,622 |
| * | Impax Laboratories Inc. | 417,249 | 8,391 |
| * | WellCare Health Plans Inc. | 276,388 | 8,352 |
| * | Pharmasset Inc. | 192,131 | 8,340 |
| * | PSS World Medical Inc. | 367,036 | 8,295 |
| * | Cubist Pharmaceuticals Inc. | 385,298 | 8,245 |
| * | Centene Corp. | 320,080 | 8,111 |
| * | Parexel International Corp. | 378,977 | 8,046 |
| * | Seattle Genetics Inc. | 533,552 | 7,977 |
| * | Nektar Therapeutics | 612,816 | 7,875 |
| * | Bruker Corp. | 470,970 | 7,818 |
| * | Alkermes Inc. | 618,682 | 7,597 |
| * | Acorda Therapeutics Inc. | 253,839 | 6,920 |
| * | Martek Biosciences Corp. | 217,561 | 6,810 |
| | Universal American Corp. | 324,217 | 6,630 |
23
| | | |
| Vanguard® Extended Market Index Fund | | |
| Schedule of Investments | | |
| December 31, 2010 | | |
| |
| |
| | | | Market |
| | | | Value |
| | | Shares | ($000) |
| * | NuVasive Inc. | 255,927 | 6,565 |
| * | Auxilium Pharmaceuticals Inc. | 310,001 | 6,541 |
| * | Isis Pharmaceuticals Inc. | 644,669 | 6,524 |
| * | Integra LifeSciences Holdings Corp. | 136,147 | 6,440 |
| | Invacare Corp. | 210,772 | 6,357 |
| * | Amedisys Inc. | 188,656 | 6,320 |
| | Meridian Bioscience Inc. | 264,810 | 6,133 |
| * | NxStage Medical Inc. | 244,739 | 6,089 |
| * | Neogen Corp. | 147,908 | 6,069 |
| * | Questcor Pharmaceuticals Inc. | 404,348 | 5,956 |
| * | MedAssets Inc. | 290,479 | 5,865 |
| * | Exelixis Inc. | 707,998 | 5,813 |
| * | Arthrocare Corp. | 175,637 | 5,455 |
| * | DexCom Inc. | 391,236 | 5,340 |
| * | Zoll Medical Corp. | 139,917 | 5,209 |
| * | Gentiva Health Services Inc. | 194,402 | 5,171 |
| * | MWI Veterinary Supply Inc. | 81,095 | 5,121 |
| * | Savient Pharmaceuticals Inc. | 456,447 | 5,085 |
| * | CONMED Corp. | 187,714 | 4,961 |
| * | Vivus Inc. | 527,337 | 4,941 |
| * | Medicines Co. | 347,833 | 4,915 |
| * | Cyberonics Inc. | 156,654 | 4,859 |
| * | Micromet Inc. | 592,509 | 4,811 |
| * | Enzon Pharmaceuticals Inc. | 393,570 | 4,790 |
| * | Hanger Orthopedic Group Inc. | 211,619 | 4,484 |
| * | Luminex Corp. | 244,729 | 4,474 |
| * | Amsurg Corp. Class A | 200,995 | 4,211 |
| * | Ariad Pharmaceuticals Inc. | 824,343 | 4,204 |
| | Analogic Corp. | 83,920 | 4,155 |
| * | IPC The Hospitalist Co. Inc. | 105,777 | 4,126 |
| * | Ironwood Pharmaceuticals Inc. | 398,102 | 4,120 |
| * | HeartWare International Inc. | 46,785 | 4,097 |
| * | Air Methods Corp. | 72,682 | 4,090 |
| * | Insulet Corp. | 261,826 | 4,058 |
| * | Halozyme Therapeutics Inc. | 508,832 | 4,030 |
| * | Momenta Pharmaceuticals Inc. | 266,179 | 3,985 |
| * | Sequenom Inc. | 495,911 | 3,977 |
| * | Wright Medical Group Inc. | 255,046 | 3,961 |
| * | Abaxis Inc. | 145,228 | 3,899 |
| * | Inspire Pharmaceuticals Inc. | 463,553 | 3,894 |
| * | Targacept Inc. | 145,626 | 3,859 |
| * | RehabCare Group Inc. | 162,293 | 3,846 |
| | Landauer Inc. | 61,364 | 3,680 |
| *,^ | MannKind Corp. | 454,320 | 3,662 |
| * | Greatbatch Inc. | 151,512 | 3,659 |
| * | Accelrys Inc. | 436,420 | 3,622 |
| * | Bio-Reference Labs Inc. | 159,335 | 3,534 |
| * | Emeritus Corp. | 178,195 | 3,512 |
| *,^ | Immunogen Inc. | 378,479 | 3,505 |
| | Computer Programs & Systems Inc. | 72,822 | 3,411 |
| *,^ | SIGA Technologies Inc. | 239,869 | 3,358 |
| * | Celera Corp. | 530,768 | 3,344 |
| *,^ | Geron Corp. | 639,392 | 3,306 |
| * | Orthofix International NV | 113,272 | 3,285 |
| * | Medivation Inc. | 214,806 | 3,259 |
| * | Omnicell Inc. | 224,309 | 3,241 |
| * | ICU Medical Inc. | 83,700 | 3,055 |
| | National Healthcare Corp. | 65,194 | 3,017 |
| * | SonoSite Inc. | 95,219 | 3,009 |
| * | LHC Group Inc. | 99,075 | 2,972 |
| | Sabra Healthcare REIT Inc. | 160,874 | 2,960 |
| * | Merit Medical Systems Inc. | 183,096 | 2,898 |
| *,^ | Delcath Systems Inc. | 294,212 | 2,883 |
| * | Conceptus Inc. | 207,986 | 2,870 |
24
| | | |
| Vanguard® Extended Market Index Fund | | |
| Schedule of Investments | | |
| December 31, 2010 | | |
| |
| |
| | | | Market |
| | | | Value |
| | | Shares | ($000) |
| * | Rural/Metro Corp. | 193,081 | 2,815 |
| * | Emergent Biosolutions Inc. | 118,992 | 2,792 |
| * | NPS Pharmaceuticals Inc. | 352,354 | 2,784 |
| * | Affymetrix Inc. | 549,308 | 2,763 |
| *,^ | AVANIR Pharmaceuticals Inc. | 674,251 | 2,751 |
| * | Genoptix Inc. | 144,286 | 2,744 |
| * | Corvel Corp. | 56,411 | 2,727 |
| *,^ | MAKO Surgical Corp. | 177,994 | 2,709 |
| * | Neurocrine Biosciences Inc. | 353,475 | 2,701 |
| * | Molina Healthcare Inc. | 95,968 | 2,673 |
| * | Optimer Pharmaceuticals Inc. | 236,224 | 2,672 |
| * | Natus Medical Inc. | 185,628 | 2,632 |
| * | Depomed Inc. | 411,294 | 2,616 |
| * | Akorn Inc. | 424,406 | 2,576 |
| * | Medidata Solutions Inc. | 107,257 | 2,561 |
| * | Quidel Corp. | 177,238 | 2,561 |
| * | Opko Health Inc. | 689,911 | 2,532 |
| * | Rigel Pharmaceuticals Inc. | 332,738 | 2,506 |
| * | Angiodynamics Inc. | 161,896 | 2,488 |
| * | Healthways Inc. | 220,971 | 2,466 |
| * | AMAG Pharmaceuticals Inc. | 134,925 | 2,442 |
| * | Alnylam Pharmaceuticals Inc. | 236,294 | 2,330 |
| * | Allos Therapeutics Inc. | 500,472 | 2,307 |
| * | Five Star Quality Care Inc. | 326,282 | 2,307 |
| *,^ | Keryx Biopharmaceuticals Inc. | 502,308 | 2,301 |
| * | Assisted Living Concepts Inc. Class A | 70,669 | 2,299 |
| * | Jazz Pharmaceuticals Inc. | 116,586 | 2,294 |
| * | PharMerica Corp. | 198,886 | 2,277 |
| * | Genomic Health Inc. | 105,775 | 2,263 |
| * | Triple-S Management Corp. Class B | 117,518 | 2,242 |
| * | eResearchTechnology Inc. | 302,617 | 2,224 |
| * | Ardea Biosciences Inc. | 85,300 | 2,218 |
| * | Vanda Pharmaceuticals Inc. | 229,348 | 2,170 |
| * | Symmetry Medical Inc. | 234,419 | 2,168 |
| * | Kensey Nash Corp. | 77,591 | 2,159 |
| * | OraSure Technologies Inc. | 372,862 | 2,144 |
| * | Spectrum Pharmaceuticals Inc. | 311,430 | 2,140 |
| * | Sunrise Senior Living Inc. | 380,848 | 2,076 |
| * | Idenix Pharmaceuticals Inc. | 411,462 | 2,074 |
| * | Nabi Biopharmaceuticals | 356,963 | 2,067 |
| * | US Physical Therapy Inc. | 103,684 | 2,055 |
| * | Sun Healthcare Group Inc. | 159,138 | 2,015 |
| * | Accuray Inc. | 292,496 | 1,974 |
| * | Durect Corp. | 565,646 | 1,951 |
| * | Exact Sciences Corp. | 326,128 | 1,950 |
| * | ABIOMED Inc. | 202,341 | 1,944 |
| * | Emdeon Inc. Class A | 142,305 | 1,927 |
| * | Immunomedics Inc. | 528,009 | 1,890 |
| * | Lexicon Pharmaceuticals Inc. | 1,300,327 | 1,872 |
| * | Palomar Medical Technologies Inc. | 129,445 | 1,839 |
| * | Almost Family Inc. | 47,762 | 1,835 |
| * | Hi-Tech Pharmacal Co. Inc. | 73,365 | 1,830 |
| * | XenoPort Inc. | 213,357 | 1,818 |
| * | Chindex International Inc. | 109,390 | 1,804 |
| * | Sangamo Biosciences Inc. | 268,407 | 1,782 |
| * | Pharmacyclics Inc. | 290,247 | 1,765 |
| * | Cypress Bioscience Inc. | 270,747 | 1,754 |
| | Cantel Medical Corp. | 74,818 | 1,751 |
| * | Caliper Life Sciences Inc. | 274,018 | 1,737 |
| *,^ | AVI BioPharma Inc. | 808,646 | 1,714 |
| * | Columbia Laboratories Inc. | 738,659 | 1,677 |
| * | Dynavax Technologies Corp. | 513,700 | 1,644 |
| *,^ | Cel-Sci Corp. | 1,973,518 | 1,623 |
| * | Array Biopharma Inc. | 539,700 | 1,614 |
25
| | | |
| Vanguard® Extended Market Index Fund | | |
| Schedule of Investments | | |
| December 31, 2010 | | |
| |
| |
| | | | Market |
| | | | Value |
| | | Shares | ($000) |
| * | Providence Service Corp. | 99,136 | 1,593 |
| * | Endologix Inc. | 222,112 | 1,588 |
| * | Cross Country Healthcare Inc. | 187,375 | 1,587 |
| * | Sciclone Pharmaceuticals Inc. | 374,229 | 1,564 |
| *,^ | Metabolix Inc. | 128,033 | 1,558 |
| *,^ | Novavax Inc. | 639,667 | 1,554 |
| * | Staar Surgical Co. | 253,096 | 1,544 |
| * | Select Medical Holdings Corp. | 210,457 | 1,538 |
| * | Stereotaxis Inc. | 399,713 | 1,531 |
| * | BioScrip Inc. | 288,559 | 1,509 |
| * | Ligand Pharmaceuticals Inc. Class B | 163,291 | 1,457 |
| * | Vascular Solutions Inc. | 119,564 | 1,401 |
| * | AMN Healthcare Services Inc. | 225,647 | 1,385 |
| * | Arqule Inc. | 235,816 | 1,384 |
| *,^ | Cytori Therapeutics Inc. | 263,122 | 1,366 |
| | Ensign Group Inc. | 54,829 | 1,364 |
| *,^ | Cadence Pharmaceuticals Inc. | 180,214 | 1,361 |
| *,^ | Cell Therapeutics Inc. | 3,718,630 | 1,357 |
| * | MAP Pharmaceuticals Inc. | 80,460 | 1,347 |
| | Pain Therapeutics Inc. | 199,091 | 1,344 |
| * | SurModics Inc. | 112,183 | 1,332 |
| *,^ | Clinical Data Inc. | 83,250 | 1,325 |
| * | Repligen Corp. | 282,028 | 1,323 |
| * | BMP Sunstone Corp. | 133,127 | 1,319 |
| * | American Dental Partners Inc. | 94,152 | 1,272 |
| | America Service Group Inc. | 83,761 | 1,268 |
| * | Vital Images Inc. | 90,356 | 1,263 |
| * | Dyax Corp. | 577,359 | 1,236 |
| *,^ | BioCryst Pharmaceuticals Inc. | 238,653 | 1,234 |
| *,^ | Arena Pharmaceuticals Inc. | 716,361 | 1,232 |
| * | Medcath Corp. | 88,286 | 1,232 |
| * | RadNet Inc. | 435,269 | 1,227 |
| * | Spectranetics Corp. | 236,826 | 1,222 |
| * | IRIS International Inc. | 119,171 | 1,219 |
| | Atrion Corp. | 6,660 | 1,195 |
| * | Chelsea Therapeutics International Ltd. | 157,139 | 1,179 |
| * | Curis Inc. | 585,757 | 1,160 |
| * | Merge Healthcare Inc. | 310,894 | 1,160 |
| *,^ | Somaxon Pharmaceuticals Inc. | 363,947 | 1,146 |
| * | KV Pharmaceutical Co. Class A | 446,449 | 1,138 |
| * | CryoLife Inc. | 207,899 | 1,127 |
| * | Team Health Holdings Inc. | 72,019 | 1,119 |
| * | BioMimetic Therapeutics Inc. | 87,779 | 1,115 |
| * | Medical Action Industries Inc. | 115,771 | 1,109 |
| * | TomoTherapy Inc. | 304,200 | 1,098 |
| * | Pozen Inc. | 164,598 | 1,095 |
| *,^ | Orexigen Therapeutics Inc. | 131,719 | 1,064 |
| * | Harvard Bioscience Inc. | 258,016 | 1,055 |
| * | Corcept Therapeutics Inc. | 268,512 | 1,036 |
| * | CytRx Corp. | 1,020,642 | 1,031 |
| * | Skilled Healthcare Group Inc. | 114,319 | 1,027 |
| * | Enzo Biochem Inc. | 193,489 | 1,022 |
| * | StemCells Inc. | 941,394 | 1,017 |
| * | Alliance HealthCare Services Inc. | 238,356 | 1,011 |
| * | Synergetics USA Inc. | 209,556 | 983 |
| * | Peregrine Pharmaceuticals Inc. | 420,790 | 968 |
| * | PDI Inc. | 91,456 | 964 |
| * | Albany Molecular Research Inc. | 170,153 | 956 |
| * | Osiris Therapeutics Inc. | 122,393 | 953 |
| * | Capital Senior Living Corp. | 141,424 | 948 |
| * | Mediware Information Systems | 87,803 | 944 |
| * | Orthovita Inc. | 466,801 | 938 |
| * | Kendle International Inc. | 86,005 | 937 |
| * | AtriCure Inc. | 90,093 | 923 |
26
| | | |
| Vanguard® Extended Market Index Fund | | |
| Schedule of Investments | | |
| December 31, 2010 | | |
| |
| |
| | | | Market |
| | | | Value |
| | | Shares | ($000) |
| | Maxygen Inc. | 233,306 | 917 |
| * | Synovis Life Technologies Inc. | 56,851 | 916 |
| *,^ | Alexza Pharmaceuticals Inc. | 729,048 | 911 |
| * | Furiex Pharmaceuticals Inc. | 61,312 | 886 |
| | Medtox Scientific Inc. | 67,624 | 886 |
| * | LeMaitre Vascular Inc. | 130,255 | 882 |
| * | RTI Biologics Inc. | 326,455 | 872 |
| * | Cambrex Corp. | 168,052 | 869 |
| * | Santarus Inc. | 263,005 | 860 |
| * | Vical Inc. | 425,420 | 859 |
| * | Inhibitex Inc. | 329,827 | 858 |
| * | Myrexis Inc. | 205,574 | 855 |
| * | ISTA Pharmaceuticals Inc. | 164,635 | 845 |
| *,^ | Cerus Corp. | 340,622 | 838 |
| *,^ | Rexahn Pharmaceuticals Inc. | 737,492 | 833 |
| *,^ | PharmAthene Inc. | 194,938 | 825 |
| *,^ | Biotime Inc. | 98,981 | 825 |
| * | ZIOPHARM Oncology Inc. | 173,250 | 807 |
| * | Alphatec Holdings Inc. | 287,285 | 776 |
| * | Metropolitan Health Networks Inc. | 173,300 | 775 |
| * | Progenics Pharmaceuticals Inc. | 140,034 | 765 |
| * | Obagi Medical Products Inc. | 65,903 | 761 |
| *,^ | GenVec Inc. | 1,356,318 | 760 |
| * | Synta Pharmaceuticals Corp. | 121,735 | 745 |
| * | Codexis Inc. | 70,220 | 744 |
| * | Matrixx Initiatives Inc. | 86,896 | 735 |
| * | Antares Pharma Inc. | 431,832 | 734 |
| * | AVEO Pharmaceuticals Inc. | 50,212 | 734 |
| *,^ | Hemispherx Biopharma Inc. | 1,495,011 | 734 |
| *,^ | Celldex Therapeutics Inc. | 176,552 | 727 |
| * | Transcend Services Inc. | 37,104 | 727 |
| | Young Innovations Inc. | 21,900 | 701 |
| * | LCA-Vision Inc. | 121,916 | 701 |
| * | Adolor Corp. | 570,341 | 690 |
| *,^ | NovaMed Inc. | 59,491 | 686 |
| * | Icad Inc. | 504,072 | 686 |
| * | Dusa Pharmaceuticals Inc. | 274,523 | 673 |
| * | Cytokinetics Inc. | 319,655 | 668 |
| *,^ | Neuralstem Inc. | 313,558 | 665 |
| *,^ | Oculus Innovative Sciences Inc. | 392,111 | 663 |
| *,^ | Cyclacel Pharmaceuticals Inc. | 449,833 | 661 |
| * | Pacific Biosciences of California Inc. | 41,094 | 654 |
| | Psychemedics Corp. | 79,844 | 653 |
| *,^ | Biosante Pharmaceuticals Inc. | 395,347 | 648 |
| * | Cynosure Inc. Class A | 63,252 | 647 |
| * | Digirad Corp. | 307,664 | 646 |
| * | Insmed Inc. | 1,011,693 | 638 |
| * | Infinity Pharmaceuticals Inc. | 107,476 | 637 |
| * | Cleveland Biolabs Inc. | 87,878 | 634 |
| * | Allied Healthcare International Inc. | 252,523 | 634 |
| * | ExamWorks Group Inc. | 33,694 | 623 |
| * | Exactech Inc. | 32,695 | 615 |
| * | Biospecifics Technologies Corp. | 23,642 | 605 |
| * | SuperGen Inc. | 229,694 | 602 |
| * | Arrowhead Research Corp. | 664,290 | 595 |
| * | Simulations Plus Inc. | 219,233 | 590 |
| * | Continucare Corp. | 124,245 | 581 |
| * | Antigenics Inc. | 581,108 | 581 |
| * | Anika Therapeutics Inc. | 86,318 | 572 |
| * | Inovio Pharmaceuticals Inc. | 491,899 | 566 |
| *,^ | Apricus Biosciences Inc. | 156,874 | 544 |
| * | Anadys Pharmaceuticals Inc. | 380,789 | 541 |
| * | Affymax Inc. | 80,959 | 538 |
| *,^ | BSD Medical Corp. | 114,353 | 528 |
27
| | | |
| Vanguard® Extended Market Index Fund | | |
| Schedule of Investments | | |
| December 31, 2010 | | |
| |
| |
| | | | Market |
| | | | Value |
| | | Shares | ($000) |
| * | Rochester Medical Corp. | 47,355 | 517 |
| * | Zalicus Inc. | 316,317 | 500 |
| * | CardioNet Inc. | 104,661 | 490 |
| *,^ | MELA Sciences Inc. | 143,644 | 481 |
| * | Cutera Inc. | 56,326 | 467 |
| | National Research Corp. | 13,482 | 462 |
| * | ThermoGenesis Corp. | 132,266 | 462 |
| *,^ | XOMA Ltd. | 89,142 | 457 |
| * | SRI/Surgical Express Inc. | 95,914 | 456 |
| * | Theragenics Corp. | 293,457 | 443 |
| * | Accretive Health Inc. | 27,232 | 443 |
| * | Cardica Inc. | 98,917 | 431 |
| *,^ | Pure Bioscience | 192,641 | 428 |
| *,^ | Idera Pharmaceuticals Inc. | 145,210 | 417 |
| *,^ | Opexa Therapeutics Inc. | 283,073 | 416 |
| * | Bovie Medical Corp. | 126,896 | 414 |
| * | Iridex Corp. | 107,093 | 413 |
| * | Caraco Pharmaceutical Laboratories Ltd. | 87,666 | 398 |
| * | Acadia Pharmaceuticals Inc. | 330,965 | 394 |
| * | OncoGenex Pharmaceutical Inc. | 22,978 | 386 |
| * | Orchid Cellmark Inc. | 193,544 | 375 |
| * | Achillion Pharmaceuticals Inc. | 89,392 | 371 |
| * | Omeros Corp. | 44,697 | 368 |
| * | Cardiovascular Systems Inc. | 31,450 | 367 |
| * | Biolase Technology Inc. | 210,384 | 366 |
| * | Rockwell Medical Technologies Inc. | 45,069 | 356 |
| * | Entremed Inc. | 66,036 | 336 |
| * | Telik Inc. | 441,006 | 335 |
| *,^ | Sunesis Pharmaceuticals Inc. | 639,901 | 333 |
| * | GTx Inc. | 123,695 | 328 |
| * | Trimeris Inc. | 130,957 | 323 |
| * | Sucampo Pharmaceuticals Inc. Class A | 82,197 | 316 |
| * | Animal Health International Inc. | 108,944 | 313 |
| * | Nanosphere Inc. | 71,314 | 311 |
| * | EnteroMedics Inc. | 98,550 | 304 |
| * | Hansen Medical Inc. | 189,920 | 279 |
| *,^ | Discovery Laboratories Inc. | 83,163 | 277 |
| *,^ | Bionovo Inc. | 241,790 | 271 |
| *,^ | Aastrom Biosciences Inc. | 104,751 | 268 |
| * | Hooper Holmes Inc. | 375,715 | 265 |
| * | Arcadia Resources Inc. | 869,871 | 262 |
| *,^ | Oncothyreon Inc. | 77,641 | 252 |
| *,^ | Raptor Pharmaceutical Corp. | 66,840 | 244 |
| * | Capstone Therapeutics Corp. | 417,588 | 242 |
| | Utah Medical Products Inc. | 8,728 | 233 |
| * | Heska Corp. | 46,343 | 230 |
| * | Bioanalytical Systems Inc. | 86,496 | 214 |
| | MedQuist Inc. | 24,192 | 209 |
| * | MediciNova Inc. | 42,842 | 206 |
| *,^ | Repros Therapeutics Inc. | 64,149 | 195 |
| * | CombiMatrix Corp. | 89,252 | 192 |
| *,^ | Neostem Inc. | 134,764 | 190 |
| * | EpiCept Corp. | 216,806 | 183 |
| *,^ | RXi Pharmaceuticals Corp. | 68,030 | 176 |
| *,^ | IsoRay Inc. | 154,342 | 174 |
| * | ARCA Biopharma Inc. | 54,940 | 174 |
| * | American Caresource Holdings Inc. | 120,539 | 169 |
| *,^ | Poniard Pharmaceuticals Inc. | 302,091 | 157 |
| * | CPEX Pharmaceuticals Inc. | 6,397 | 154 |
| * | BioDelivery Sciences International Inc. | 42,836 | 152 |
| * | DynaVox Inc. Class A | 28,897 | 148 |
| * | Uroplasty Inc. | 36,220 | 146 |
| * | Urologix Inc. | 217,218 | 137 |
| * | Escalon Medical Corp. | 91,117 | 137 |
28
| | | |
| Vanguard® Extended Market Index Fund | | |
| Schedule of Investments | | |
| December 31, 2010 | | |
| |
| |
| | | | Market |
| | | | Value |
| | | Shares | ($000) |
| * | AspenBio Pharma Inc. | 219,112 | 132 |
| *,^ | Cardium Therapeutics Inc. | 306,488 | 120 |
| * | Lannett Co. Inc. | 21,303 | 119 |
| * | HealthStream Inc. | 14,678 | 118 |
| * | Anthera Pharmaceuticals Inc. | 23,912 | 117 |
| *,^ | Acura Pharmaceuticals Inc. | 32,877 | 109 |
| * | Solta Medical Inc. | 35,198 | 107 |
| * | pSivida Corp. | 20,796 | 106 |
| * | Retractable Technologies Inc. | 58,006 | 102 |
| * | PositiveID Corp. | 155,145 | 98 |
| * | PhotoMedex Inc. | 16,693 | 97 |
| * | TranS1 Inc. | 45,282 | 94 |
| * | SunLink Health Systems Inc. | 59,100 | 93 |
| *,^ | OXiGENE Inc. | 368,500 | 84 |
| * | Integramed America Inc. | 9,596 | 83 |
| * | Cornerstone Therapeutics Inc. | 13,447 | 78 |
| * | SCOLR Pharma Inc. | 197,266 | 73 |
| *,^ | Biodel Inc. | 37,133 | 68 |
| * | Cytomedix Inc. | 111,439 | 66 |
| * | ProPhase Labs Inc. | 51,986 | 62 |
| * | PHC Inc. Class A | 37,316 | 61 |
| * | Transcept Pharmaceuticals Inc. | 7,878 | 58 |
| * | Catalyst Pharmaceutical Partners Inc. | 57,225 | 57 |
| * | ADVENTRX Pharmaceuticals Inc. | 20,481 | 53 |
| | American Medical Alert Corp. | 8,497 | 52 |
| * | Icagen Inc. | 28,373 | 50 |
| * | Oxygen Biotherapeutics Inc. | 24,919 | 48 |
| * | Neurometrix Inc. | 63,058 | 41 |
| * | Vision-Sciences Inc. | 29,250 | 41 |
| * | NMT Medical Inc. | 112,290 | 40 |
| *,^ | Marina Biotech Inc. | 24,798 | 39 |
| * | HearUSA Inc. | 36,786 | 33 |
| | Emergent Group Inc. | 4,924 | 32 |
| * | AP Pharma Inc. | 69,384 | 31 |
| * | NuPathe Inc. | 3,300 | 30 |
| * | Threshold Pharmaceuticals Inc. | 19,966 | 27 |
| * | Strategic Diagnostics Inc. | 12,985 | 23 |
| * | Cumberland Pharmaceuticals Inc. | 3,878 | 23 |
| * | Adeona Pharmaceuticals Inc. | 17,961 | 22 |
| * | ReGeneRx Biopharmaceuticals Inc. | 92,387 | 20 |
| * | Amicus Therapeutics Inc. | 4,185 | 19 |
| * | CAS Medical Systems Inc. | 5,898 | 19 |
| * | DARA Biosciences Inc. | 5,069 | 17 |
| * | Palatin Technologies Inc. | 11,819 | 16 |
| *,^ | Celsion Corp. | 7,600 | 16 |
| * | IVAX Diagnostics Inc. | 27,208 | 15 |
| * | NeurogesX Inc. | 2,300 | 15 |
| *,^ | Molecular Insight Pharmaceuticals Inc. | 83,692 | 13 |
| * | ARYx Therapeutics Inc. | 39,301 | 11 |
| ^ | Ligand Pharmaceuticals Inc. Roche Contingent Value Rights | 395,811 | 9 |
| *,^ | Ligand Pharmaceuticals Inc. TR Beta Contingent Value Rights | 395,811 | 9 |
| *,^ | Ligand Pharmaceuticals Inc. General Contingent Value Rights | 395,811 | 8 |
| *,^ | Ligand Pharmaceuticals Inc. Glucagon Contingent Value Rights | 395,811 | 8 |
| * | Athersys Inc. | 2,200 | 5 |
| *,^ | ULURU Inc. | 28,716 | 3 |
| * | Nile Therapeutics Inc. | 3,600 | 2 |
| * | Angeion Corp. | 400 | 2 |
| * | Allied Healthcare Products | 334 | 1 |
| * | Senesco Technologies Inc. | 500 | — |
| | | | 2,021,786 |
29
| | |
| Vanguard® Extended Market Index Fund | | |
| Schedule of Investments | | |
| December 31, 2010 | | |
| |
| |
| |
| |
| | | Market |
| | | Value |
| | Shares | ($000) |
| Industrials (15.6%) | | |
| * Delta Air Lines Inc. | 5,123,801 | 64,560 |
| Joy Global Inc. | 670,975 | 58,207 |
| * United Continental Holdings Inc. | 2,059,763 | 49,064 |
| Bucyrus International Inc. Class A | 526,082 | 47,032 |
| AMETEK Inc. | 1,039,767 | 40,811 |
| * IHS Inc. Class A | 417,090 | 33,530 |
| Manpower Inc. | 529,970 | 33,261 |
| * Verisk Analytics Inc. Class A | 951,276 | 32,419 |
| * Kansas City Southern | 666,673 | 31,907 |
| * AGCO Corp. | 604,461 | 30,622 |
| KBR Inc. | 980,728 | 29,883 |
| Donaldson Co. Inc. | 497,007 | 28,966 |
| * Foster Wheeler AG | 828,472 | 28,599 |
| * WABCO Holdings Inc. | 419,792 | 25,578 |
| Timken Co. | 523,436 | 24,984 |
| * BE Aerospace Inc. | 664,302 | 24,599 |
| * Hertz Global Holdings Inc. | 1,688,336 | 24,464 |
| JB Hunt Transport Services Inc. | 576,671 | 23,534 |
| * Navistar International Corp. | 405,197 | 23,465 |
| Gardner Denver Inc. | 340,858 | 23,458 |
| Hubbell Inc. Class B | 389,482 | 23,420 |
| Pentair Inc. | 641,214 | 23,411 |
| SPX Corp. | 326,122 | 23,314 |
| * URS Corp. | 542,272 | 22,564 |
| * Terex Corp. | 707,507 | 21,961 |
| * Aecom Technology Corp. | 770,128 | 21,540 |
| * Chicago Bridge & Iron Co. NV | 643,539 | 21,172 |
| Kennametal Inc. | 533,314 | 21,045 |
| IDEX Corp. | 532,029 | 20,813 |
| * Oshkosh Corp. | 589,325 | 20,768 |
| Waste Connections Inc. | 750,185 | 20,653 |
| Nordson Corp. | 220,604 | 20,269 |
| * Owens Corning | 631,722 | 19,678 |
| * Babcock & Wilcox Co. | 755,121 | 19,324 |
| Baldor Electric Co. | 306,471 | 19,320 |
| * Shaw Group Inc. | 551,992 | 18,895 |
| MSC Industrial Direct Co. Class A | 289,512 | 18,729 |
| Lincoln Electric Holdings Inc. | 275,105 | 17,956 |
| * Corrections Corp. of America | 716,321 | 17,951 |
| * TransDigm Group Inc. | 246,879 | 17,778 |
| Covanta Holding Corp. | 1,008,988 | 17,344 |
| * Copart Inc. | 453,978 | 16,956 |
| * AMR Corp. | 2,165,179 | 16,867 |
| Regal-Beloit Corp. | 250,827 | 16,745 |
| * GrafTech International Ltd. | 830,598 | 16,479 |
| Wabtec Corp. | 311,532 | 16,477 |
| * Thomas & Betts Corp. | 338,777 | 16,363 |
| Acuity Brands Inc. | 281,971 | 16,261 |
| * Alliant Techsystems Inc. | 216,367 | 16,104 |
| * Spirit Aerosystems Holdings Inc. Class A | 768,499 | 15,992 |
| Carlisle Cos. Inc. | 396,186 | 15,744 |
| Graco Inc. | 390,606 | 15,409 |
| * Kirby Corp. | 349,644 | 15,402 |
| Towers Watson & Co. Class A | 294,285 | 15,320 |
| Harsco Corp. | 523,008 | 14,812 |
| * WESCO International Inc. | 275,950 | 14,570 |
| Woodward Governor Co. | 385,115 | 14,465 |
| * Genesee & Wyoming Inc. Class A | 269,403 | 14,265 |
| CLARCOR Inc. | 328,329 | 14,082 |
| UTi Worldwide Inc. | 661,306 | 14,020 |
| Lennox International Inc. | 296,396 | 14,017 |
30
| | | |
| Vanguard® Extended Market Index Fund | | |
| Schedule of Investments | | |
| December 31, 2010 | | |
| |
| |
| | | | Market |
| | | | Value |
| | | Shares | ($000) |
| | Trinity Industries Inc. | 518,129 | 13,787 |
| * | Alaska Air Group Inc. | 239,232 | 13,562 |
| * | Esterline Technologies Corp. | 195,408 | 13,403 |
| | Landstar System Inc. | 323,396 | 13,240 |
| | Con-way Inc. | 355,735 | 13,009 |
| * | ArvinMeritor Inc. | 611,585 | 12,550 |
| | Toro Co. | 203,455 | 12,541 |
| * | Clean Harbors Inc. | 149,004 | 12,528 |
| * | EMCOR Group Inc. | 431,784 | 12,513 |
| | Crane Co. | 301,898 | 12,399 |
| | Valmont Industries Inc. | 138,736 | 12,310 |
| * | General Cable Corp. | 338,594 | 11,881 |
| | Actuant Corp. Class A | 442,708 | 11,785 |
| * | Moog Inc. Class A | 295,356 | 11,755 |
| * | Hexcel Corp. | 631,762 | 11,429 |
| | Watsco Inc. | 181,004 | 11,418 |
| * | FTI Consulting Inc. | 303,552 | 11,316 |
| | Belden Inc. | 304,959 | 11,229 |
| | Manitowoc Co. Inc. | 852,902 | 11,182 |
| | Brady Corp. Class A | 341,692 | 11,143 |
| * | Quad/Graphics Inc. | 263,517 | 10,873 |
| | Alexander & Baldwin Inc. | 268,182 | 10,735 |
| | GATX Corp. | 300,820 | 10,613 |
| * | US Airways Group Inc. | 1,049,214 | 10,503 |
| * | Avis Budget Group Inc. | 668,225 | 10,398 |
| * | Teledyne Technologies Inc. | 235,908 | 10,373 |
| * | Geo Group Inc. | 418,747 | 10,326 |
| * | EnerSys | 319,069 | 10,248 |
| * | Middleby Corp. | 120,599 | 10,181 |
| * | Tetra Tech Inc. | 401,489 | 10,061 |
| | Curtiss-Wright Corp. | 299,524 | 9,944 |
| * | United Stationers Inc. | 151,462 | 9,665 |
| | Triumph Group Inc. | 107,018 | 9,568 |
| * | DigitalGlobe Inc. | 298,857 | 9,477 |
| | Herman Miller Inc. | 370,918 | 9,384 |
| * | Atlas Air Worldwide Holdings Inc. | 167,992 | 9,379 |
| | HNI Corp. | 291,898 | 9,107 |
| * | USG Corp. | 537,283 | 9,042 |
| * | United Rentals Inc. | 393,628 | 8,955 |
| | Kaydon Corp. | 217,411 | 8,853 |
| * | Dollar Thrifty Automotive Group Inc. | 186,710 | 8,824 |
| * | Old Dominion Freight Line Inc. | 272,576 | 8,720 |
| * | JetBlue Airways Corp. | 1,310,656 | 8,663 |
| * | HUB Group Inc. Class A | 244,583 | 8,595 |
| | Corporate Executive Board Co. | 222,873 | 8,369 |
| *,^ | American Superconductor Corp. | 289,598 | 8,280 |
| | HEICO Corp. | 162,223 | 8,278 |
| | AO Smith Corp. | 217,348 | 8,277 |
| | Rollins Inc. | 415,326 | 8,203 |
| | Brink's Co. | 304,882 | 8,195 |
| | ABM Industries Inc. | 305,780 | 8,042 |
| | Mueller Industries Inc. | 245,853 | 8,039 |
| | Applied Industrial Technologies Inc. | 245,364 | 7,969 |
| | Simpson Manufacturing Co. Inc. | 257,392 | 7,956 |
| * | CoStar Group Inc. | 134,828 | 7,761 |
| * | II-VI Inc. | 166,204 | 7,705 |
| | Robbins & Myers Inc. | 214,721 | 7,683 |
| | Deluxe Corp. | 333,443 | 7,676 |
| | Knight Transportation Inc. | 402,650 | 7,650 |
| * | Sensata Technologies Holding NV | 235,930 | 7,104 |
| * | AAR Corp. | 256,034 | 7,033 |
| | Healthcare Services Group Inc. | 428,136 | 6,966 |
| * | Korn/Ferry International | 301,091 | 6,958 |
| | Watts Water Technologies Inc. Class A | 190,072 | 6,955 |
31
| | | |
| Vanguard® Extended Market Index Fund | | |
| Schedule of Investments | | |
| December 31, 2010 | | |
| |
| |
| | | | Market |
| | | | Value |
| | | Shares | ($000) |
| * | Insituform Technologies Inc. Class A | 255,262 | 6,767 |
| | Interface Inc. Class A | 417,487 | 6,534 |
| | ESCO Technologies Inc. | 172,416 | 6,524 |
| | Werner Enterprises Inc. | 288,635 | 6,523 |
| * | AirTran Holdings Inc. | 880,967 | 6,510 |
| * | Orbital Sciences Corp. | 376,786 | 6,454 |
| | Briggs & Stratton Corp. | 327,289 | 6,444 |
| * | Chart Industries Inc. | 186,692 | 6,306 |
| * | Macquarie Infrastructure Co. LLC | 297,043 | 6,288 |
| | Mine Safety Appliances Co. | 200,799 | 6,251 |
| * | Polypore International Inc. | 150,630 | 6,135 |
| | Barnes Group Inc. | 296,020 | 6,119 |
| * | GeoEye Inc. | 143,868 | 6,099 |
| | Granite Construction Inc. | 222,271 | 6,097 |
| | Armstrong World Industries Inc. | 135,319 | 5,819 |
| | Steelcase Inc. Class A | 550,299 | 5,817 |
| | Skywest Inc. | 364,706 | 5,697 |
| | Resources Connection Inc. | 302,169 | 5,617 |
| | Raven Industries Inc. | 117,291 | 5,594 |
| * | EnPro Industries Inc. | 133,886 | 5,564 |
| * | RBC Bearings Inc. | 141,316 | 5,523 |
| * | SYKES Enterprises Inc. | 267,566 | 5,421 |
| | Forward Air Corp. | 188,700 | 5,355 |
| | Heartland Express Inc. | 332,980 | 5,334 |
| * | Beacon Roofing Supply Inc. | 297,570 | 5,318 |
| * | Wabash National Corp. | 444,399 | 5,266 |
| | Unifirst Corp. | 95,314 | 5,247 |
| * | Ceradyne Inc. | 165,508 | 5,218 |
| * | TrueBlue Inc. | 286,851 | 5,160 |
| * | MasTec Inc. | 351,517 | 5,129 |
| | Knoll Inc. | 306,449 | 5,127 |
| *,^ | A123 Systems Inc. | 530,703 | 5,063 |
| | American Science & Engineering Inc. | 58,804 | 5,012 |
| * | Acacia Research - Acacia Technologies | 192,584 | 4,996 |
| | Allegiant Travel Co. Class A | 101,073 | 4,977 |
| * | Ladish Co. Inc. | 102,216 | 4,969 |
| * | Blount International Inc. | 312,652 | 4,927 |
| | Kaman Corp. | 169,096 | 4,916 |
| * | Interline Brands Inc. | 215,208 | 4,900 |
| | Universal Forest Products Inc. | 125,484 | 4,881 |
| | Lindsay Corp. | 81,596 | 4,849 |
| | Cubic Corp. | 102,531 | 4,834 |
| * | Advisory Board Co. | 101,430 | 4,831 |
| | Franklin Electric Co. Inc. | 122,733 | 4,777 |
| | Tennant Co. | 123,405 | 4,740 |
| | CIRCOR International Inc. | 111,239 | 4,703 |
| * | Mobile Mini Inc. | 237,761 | 4,681 |
| | Quanex Building Products Corp. | 244,748 | 4,643 |
| | Ameron International Corp. | 60,382 | 4,611 |
| | Arkansas Best Corp. | 164,850 | 4,520 |
| | Titan International Inc. | 229,692 | 4,488 |
| | National Presto Industries Inc. | 33,911 | 4,409 |
| * | Layne Christensen Co. | 126,938 | 4,369 |
| | Badger Meter Inc. | 98,008 | 4,334 |
| | Seaboard Corp. | 2,171 | 4,322 |
| * | Rush Enterprises Inc. Class A | 211,011 | 4,313 |
| | Administaff Inc. | 146,693 | 4,298 |
| * | Amerco Inc. | 44,693 | 4,292 |
| | Albany International Corp. | 180,494 | 4,276 |
| * | Astec Industries Inc. | 129,438 | 4,195 |
| | Mueller Water Products Inc. Class A | 1,005,810 | 4,194 |
| | NACCO Industries Inc. Class A | 38,650 | 4,188 |
| | Sun Hydraulics Corp. | 110,615 | 4,181 |
| | McGrath Rentcorp | 155,505 | 4,077 |
32
| | | |
| Vanguard® Extended Market Index Fund | | |
| Schedule of Investments | | |
| December 31, 2010 | | |
| |
| |
| | | | Market |
| | | | Value |
| | | Shares | ($000) |
| * | Colfax Corp. | 217,399 | 4,002 |
| | John Bean Technologies Corp. | 193,299 | 3,891 |
| * | Griffon Corp. | 303,115 | 3,862 |
| * | Huron Consulting Group Inc. | 143,897 | 3,806 |
| * | RSC Holdings Inc. | 390,073 | 3,799 |
| | Applied Signal Technology Inc. | 100,099 | 3,793 |
| | G&K Services Inc. Class A | 121,801 | 3,765 |
| * | 3D Systems Corp. | 119,484 | 3,763 |
| * | Dycom Industries Inc. | 253,906 | 3,745 |
| * | Trimas Corp. | 181,281 | 3,709 |
| | Tutor Perini Corp. | 172,574 | 3,695 |
| | TAL International Group Inc. | 117,730 | 3,634 |
| | Comfort Systems USA Inc. | 275,902 | 3,634 |
| * | Kforce Inc. | 215,498 | 3,487 |
| * | Consolidated Graphics Inc. | 71,719 | 3,473 |
| * | Kelly Services Inc. Class A | 183,668 | 3,453 |
| | Viad Corp. | 133,364 | 3,397 |
| * | SFN Group Inc. | 347,043 | 3,387 |
| * | Exponent Inc. | 89,470 | 3,358 |
| | AZZ Inc. | 82,980 | 3,320 |
| * | Satcon Technology Corp. | 712,635 | 3,207 |
| | Heidrick & Struggles International Inc. | 111,745 | 3,201 |
| * | ICF International Inc. | 123,918 | 3,187 |
| | Aircastle Ltd. | 295,763 | 3,091 |
| | Encore Wire Corp. | 122,190 | 3,065 |
| | Gorman-Rupp Co. | 94,648 | 3,059 |
| * | Altra Holdings Inc. | 152,789 | 3,034 |
| | Cascade Corp. | 63,798 | 3,016 |
| * | Navigant Consulting Inc. | 326,385 | 3,003 |
| * | ACCO Brands Corp. | 352,313 | 3,002 |
| * | Aerovironment Inc. | 109,978 | 2,951 |
| | Federal Signal Corp. | 429,833 | 2,949 |
| * | Team Inc. | 119,308 | 2,887 |
| | Ennis Inc. | 167,639 | 2,867 |
| | FreightCar America Inc. | 97,137 | 2,811 |
| * | LB Foster Co. Class A | 67,359 | 2,758 |
| *,^ | EnerNOC Inc. | 114,453 | 2,737 |
| | AAON Inc. | 96,731 | 2,729 |
| * | Air Transport Services Group Inc. | 341,398 | 2,697 |
| | EnergySolutions Inc. | 483,033 | 2,690 |
| | Apogee Enterprises Inc. | 199,453 | 2,687 |
| | Vicor Corp. | 163,041 | 2,674 |
| | Great Lakes Dredge & Dock Corp. | 360,474 | 2,657 |
| * | MYR Group Inc. | 125,263 | 2,630 |
| * | Dolan Co. | 188,859 | 2,629 |
| * | Columbus McKinnon Corp. | 129,289 | 2,627 |
| * | Gibraltar Industries Inc. | 192,549 | 2,613 |
| * | Greenbrier Cos. Inc. | 121,145 | 2,543 |
| | Standex International Corp. | 81,998 | 2,453 |
| | Tredegar Corp. | 126,032 | 2,442 |
| * | Kadant Inc. | 102,934 | 2,426 |
| * | Force Protection Inc. | 438,386 | 2,415 |
| * | Sauer-Danfoss Inc. | 83,852 | 2,369 |
| * | Hawaiian Holdings Inc. | 301,920 | 2,367 |
| * | KAR Auction Services Inc. | 169,943 | 2,345 |
| | Dynamic Materials Corp. | 96,260 | 2,173 |
| | Marten Transport Ltd. | 99,929 | 2,136 |
| * | Commercial Vehicle Group Inc. | 130,651 | 2,123 |
| * | Trex Co. Inc. | 88,074 | 2,110 |
| | American Woodmark Corp. | 85,895 | 2,108 |
| * | NN Inc. | 165,873 | 2,050 |
| | Houston Wire & Cable Co. | 150,411 | 2,022 |
| * | CBIZ Inc. | 323,818 | 2,021 |
| * | Orion Marine Group Inc. | 174,040 | 2,019 |
33
| | | |
| Vanguard® Extended Market Index Fund | | |
| Schedule of Investments | | |
| December 31, 2010 | | |
| |
| |
| | | | Market |
| | | | Value |
| | | Shares | ($000) |
| * | FuelCell Energy Inc. | 867,248 | 2,003 |
| * | Taser International Inc. | 425,762 | 2,001 |
| * | Generac Holdings Inc. | 123,396 | 1,995 |
| * | On Assignment Inc. | 244,487 | 1,993 |
| | US Ecology Inc. | 113,622 | 1,975 |
| * | Cenveo Inc. | 368,159 | 1,966 |
| | Twin Disc Inc. | 65,239 | 1,948 |
| * | Genco Shipping & Trading Ltd. | 134,646 | 1,939 |
| * | Furmanite Corp. | 280,497 | 1,938 |
| | HEICO Corp. Class A | 51,800 | 1,933 |
| | CDI Corp. | 102,092 | 1,898 |
| * | M&F Worldwide Corp. | 80,995 | 1,871 |
| * | Active Power Inc. | 757,381 | 1,863 |
| * | Herley Industries Inc. | 106,564 | 1,846 |
| * | GenCorp Inc. | 355,415 | 1,837 |
| * | Powell Industries Inc. | 55,552 | 1,827 |
| | Schawk Inc. Class A | 88,645 | 1,824 |
| * | Odyssey Marine Exploration Inc. | 652,137 | 1,813 |
| | Ampco-Pittsburgh Corp. | 64,496 | 1,809 |
| * | American Reprographics Co. | 238,347 | 1,809 |
| * | Park-Ohio Holdings Corp. | 84,063 | 1,758 |
| * | APAC Customer Services Inc. | 288,883 | 1,753 |
| * | Celadon Group Inc. | 117,844 | 1,743 |
| | Aceto Corp. | 192,564 | 1,733 |
| * | H&E Equipment Services Inc. | 149,118 | 1,725 |
| * | Michael Baker Corp. | 54,109 | 1,683 |
| * | Northwest Pipe Co. | 69,046 | 1,659 |
| * | CRA International Inc. | 69,996 | 1,646 |
| * | Pacer International Inc. | 240,158 | 1,643 |
| *,^ | Ener1 Inc. | 423,516 | 1,605 |
| | Graham Corp. | 80,175 | 1,603 |
| * | Republic Airways Holdings Inc. | 218,634 | 1,600 |
| *,^ | Global Power Equipment Group Inc. | 66,992 | 1,554 |
| * | Eagle Bulk Shipping Inc. | 308,843 | 1,538 |
| * | Titan Machinery Inc. | 78,277 | 1,511 |
| *,^ | Advanced Battery Technologies Inc. | 390,160 | 1,502 |
| * | Innerworkings Inc. | 228,511 | 1,497 |
| *,^ | Valence Technology Inc. | 888,980 | 1,493 |
| * | School Specialty Inc. | 104,835 | 1,460 |
| * | Standard Parking Corp. | 75,689 | 1,430 |
| * | Dynamex Inc. | 55,639 | 1,378 |
| * | Pinnacle Airlines Corp. | 174,176 | 1,376 |
| * | Sterling Construction Co. Inc. | 105,420 | 1,375 |
| | Kimball International Inc. Class B | 197,534 | 1,363 |
| * | RailAmerica Inc. | 104,438 | 1,352 |
| | Baltic Trading Ltd. | 130,727 | 1,335 |
| * | Astronics Corp. | 62,610 | 1,315 |
| | Insteel Industries Inc. | 102,392 | 1,279 |
| * | Saia Inc. | 76,758 | 1,273 |
| | Ducommun Inc. | 58,381 | 1,272 |
| * | CAI International Inc. | 64,726 | 1,269 |
| * | USA Truck Inc. | 95,023 | 1,257 |
| * | Tecumseh Products Co. Class A | 95,123 | 1,241 |
| * | Broadwind Energy Inc. | 531,079 | 1,227 |
| * | American Railcar Industries Inc. | 55,006 | 1,217 |
| * | CPI Aerostructures Inc. | 85,735 | 1,206 |
| * | Flow International Corp. | 293,973 | 1,202 |
| * | Capstone Turbine Corp. | 1,251,828 | 1,201 |
| * | Energy Recovery Inc. | 323,370 | 1,184 |
| * | Lydall Inc. | 146,691 | 1,181 |
| * | DXP Enterprises Inc. | 48,485 | 1,164 |
| | Horizon Lines Inc. Class A | 262,607 | 1,148 |
| * | Casella Waste Systems Inc. Class A | 161,746 | 1,147 |
| * | AT Cross Co. Class A | 114,797 | 1,108 |
34
| | | |
| Vanguard® Extended Market Index Fund | | |
| Schedule of Investments | | |
| December 31, 2010 | | |
| |
| |
| | | | Market |
| | | | Value |
| | | Shares | ($000) |
| *,^ | YRC Worldwide Inc. | 297,211 | 1,106 |
| * | LMI Aerospace Inc. | 68,874 | 1,101 |
| | Multi-Color Corp. | 55,221 | 1,075 |
| * | Volt Information Sciences Inc. | 123,903 | 1,072 |
| * | PMFG Inc. | 63,760 | 1,046 |
| | Met-Pro Corp. | 86,640 | 1,023 |
| | LSI Industries Inc. | 120,930 | 1,023 |
| * | United Capital Corp. | 31,463 | 1,023 |
| | International Shipholding Corp. | 39,674 | 1,008 |
| * | NCI Building Systems Inc. | 71,662 | 1,003 |
| * | Pike Electric Corp. | 116,417 | 999 |
| * | WCA Waste Corp. | 204,513 | 990 |
| | Preformed Line Products Co. | 16,850 | 986 |
| | Miller Industries Inc. | 68,900 | 980 |
| * | Metalico Inc. | 163,012 | 958 |
| | Alamo Group Inc. | 33,648 | 936 |
| * | Kratos Defense & Security Solutions Inc. | 70,917 | 934 |
| | Intersections Inc. | 88,045 | 921 |
| * | Fuel Tech Inc. | 93,774 | 911 |
| * | Hill International Inc. | 140,036 | 906 |
| * | Franklin Covey Co. | 102,126 | 877 |
| * | Ceco Environmental Corp. | 142,337 | 848 |
| * | Universal Truckload Services Inc. | 53,196 | 847 |
| * | Willis Lease Finance Corp. | 64,920 | 846 |
| * | Xerium Technologies Inc. | 52,590 | 839 |
| * | Patriot Transportation Holding Inc. | 8,798 | 818 |
| * | LaBarge Inc. | 51,700 | 812 |
| | Todd Shipyards Corp. | 35,606 | 797 |
| * | Quality Distribution Inc. | 87,702 | 797 |
| | Barrett Business Services Inc. | 50,584 | 787 |
| * | Hudson Highland Group Inc. | 134,792 | 786 |
| * | GP Strategies Corp. | 76,656 | 785 |
| * | Hurco Cos. Inc. | 31,939 | 755 |
| | SIFCO Industries Inc. | 44,585 | 727 |
| * | PAM Transportation Services Inc. | 64,217 | 720 |
| | Courier Corp. | 45,031 | 699 |
| * | Coleman Cable Inc. | 110,772 | 696 |
| | VSE Corp. | 20,772 | 686 |
| | Lawson Products Inc. | 27,224 | 678 |
| * | Higher One Holdings Inc. | 32,953 | 667 |
| * | Key Technology Inc. | 38,493 | 655 |
| | Hardinge Inc. | 66,164 | 644 |
| * | Allied Motion Technologies Inc. | 92,797 | 638 |
| * | UQM Technologies Inc. | 277,445 | 635 |
| * | Mistras Group Inc. | 47,102 | 635 |
| | Primoris Services Corp. | 63,752 | 608 |
| * | PowerSecure International Inc. | 77,585 | 604 |
| * | Innovative Solutions & Support Inc. | 106,090 | 602 |
| | Ecology and Environment Inc. | 38,872 | 581 |
| *,^ | Ocean Power Technologies Inc. | 95,876 | 546 |
| * | Magnetek Inc. | 403,630 | 545 |
| * | Ultralife Corp. | 81,741 | 540 |
| | Eastern Co. | 28,955 | 517 |
| * | Frozen Food Express Industries | 114,834 | 510 |
| | Virco Manufacturing | 188,287 | 490 |
| * | Builders FirstSource Inc. | 243,575 | 480 |
| * | Mfri Inc. | 45,063 | 464 |
| * | US Home Systems Inc. | 94,353 | 461 |
| | Standard Register Co. | 134,841 | 460 |
| * | BlueLinx Holdings Inc. | 117,386 | 430 |
| * | Perma-Fix Environmental Services | 261,912 | 430 |
| | LS Starrett Co. Class A | 36,454 | 426 |
| * | Document Security Systems Inc. | 77,440 | 413 |
| * | Omega Flex Inc. | 24,637 | 407 |
35
| | | |
| Vanguard® Extended Market Index Fund | | |
| Schedule of Investments | | |
| December 31, 2010 | | |
| |
| |
| | | | Market |
| | | | Value |
| | | Shares | ($000) |
| * | Supreme Industries Inc. Class A | 120,885 | 375 |
| * | Hudson Technologies Inc. | 211,050 | 346 |
| * | Argan Inc. | 36,431 | 338 |
| * | Roadrunner Transportation Systems Inc. | 22,955 | 332 |
| | Providence and Worcester Railroad Co. | 19,800 | 332 |
| * | Integrated Electrical Services Inc. | 93,324 | 326 |
| * | Applied Energetics Inc. | 374,992 | 319 |
| | Douglas Dynamics Inc. | 20,300 | 308 |
| * | LGL Group Inc. | 16,937 | 306 |
| *,^ | Hoku Corp. | 105,454 | 278 |
| * | Orion Energy Systems Inc. | 83,581 | 278 |
| * | Baldwin Technology Co. Class A | 206,023 | 272 |
| * | Gencor Industries Inc. | 37,710 | 271 |
| | SeaCube Container Leasing Ltd. | 19,310 | 271 |
| * | Covenant Transportation Group Inc. Class A | 27,524 | 268 |
| * | Spherix Inc. | 348,444 | 249 |
| * | Arotech Corp. | 138,786 | 230 |
| * | Keyw Holding Corp. | 15,661 | 230 |
| * | TRC Cos. Inc. | 64,073 | 224 |
| * | Plug Power Inc. | 570,809 | 212 |
| | Superior Uniform Group Inc. | 17,494 | 192 |
| * | LECG Corp. | 131,605 | 182 |
| * | Tecumseh Products Co. Class B | 11,900 | 155 |
| *,^ | Beacon Power Corp. | 700,639 | 154 |
| * | Amrep Corp. | 12,689 | 153 |
| * | Energy Focus Inc. | 159,600 | 150 |
| *,^ | Akeena Solar Inc. | 287,918 | 136 |
| * | Ameresco Inc. Class A | 9,082 | 130 |
| * | Lime Energy Co. | 32,543 | 129 |
| * | Sypris Solutions Inc. | 28,772 | 123 |
| * | Innotrac Corp. | 74,579 | 108 |
| * | Rush Enterprises Inc. Class B | 5,550 | 100 |
| * | PGT Inc. | 40,387 | 99 |
| * | Multiband Corp. | 33,188 | 94 |
| * | American Electric Technologies Inc. | 36,928 | 82 |
| *,^ | Ascent Solar Technologies Inc. | 24,417 | 82 |
| * | Rand Logistics Inc. | 14,590 | 70 |
| * | Lightbridge Corp. | 11,198 | 60 |
| * | Adept Technology Inc. Class A | 13,375 | 60 |
| * | Innovaro Inc. | 33,134 | 46 |
| * | Heritage-Crystal Clean Inc. | 3,959 | 39 |
| * | Versar Inc. | 10,930 | 38 |
| * | Industrial Services of America Inc. | 3,032 | 37 |
| | Hubbell Inc. Class A | 500 | 28 |
| * | Real Goods Solar Inc. Class A | 8,597 | 21 |
| * | TBS International plc Class A | 7,410 | 21 |
| * | TeamStaff Inc. | 17,157 | 9 |
| * | Breeze-Eastern Corp. | 1,000 | 7 |
| * | Patrick Industries Inc. | 3,647 | 7 |
| | Servotronics Inc. | 503 | 4 |
| * | KSW Inc. | 1,017 | 4 |
| * | Kaiser Ventures LLC Class A | 36,800 | — |
| | | | 2,728,108 |
| Information Technology (15.7%) | | |
| * | Cree Inc. | 704,492 | 46,419 |
| | Maxim Integrated Products Inc. | 1,929,329 | 45,571 |
| * | VMware Inc. Class A | 511,526 | 45,480 |
| * | Rovi Corp. | 683,266 | 42,369 |
| | Activision Blizzard Inc. | 3,368,899 | 41,909 |
| * | Lam Research Corp. | 798,695 | 41,356 |
| * | Atmel Corp. | 2,976,183 | 36,667 |
| * | Skyworks Solutions Inc. | 1,190,750 | 34,091 |
| * | Riverbed Technology Inc. | 954,734 | 33,578 |
36
| | | |
| Vanguard® Extended Market Index Fund | | |
| Schedule of Investments | | |
| December 31, 2010 | | |
| |
| |
| | | | Market |
| | | | Value |
| | | Shares | ($000) |
| * | Avnet Inc. | 987,219 | 32,608 |
| * | Trimble Navigation Ltd. | 780,190 | 31,153 |
| * | ANSYS Inc. | 591,173 | 30,782 |
| | Factset Research Systems Inc. | 301,215 | 28,242 |
| * | Nuance Communications Inc. | 1,508,333 | 27,421 |
| * | Informatica Corp. | 609,475 | 26,835 |
| * | Synopsys Inc. | 965,094 | 25,971 |
| * | Arrow Electronics Inc. | 752,338 | 25,768 |
| * | Equinix Inc. | 298,861 | 24,285 |
| *,^ | Alliance Data Systems Corp. | 340,692 | 24,199 |
| | Global Payments Inc. | 517,638 | 23,920 |
| | Solera Holdings Inc. | 456,402 | 23,423 |
| * | ON Semiconductor Corp. | 2,360,154 | 23,318 |
| * | MICROS Systems Inc. | 523,494 | 22,960 |
| * | Dolby Laboratories Inc. Class A | 343,183 | 22,890 |
| * | Polycom Inc. | 554,652 | 21,620 |
| * | VeriFone Systems Inc. | 557,654 | 21,503 |
| * | TIBCO Software Inc. | 1,084,342 | 21,372 |
| * | Cypress Semiconductor Corp. | 1,077,500 | 20,020 |
| * | Rackspace Hosting Inc. | 630,905 | 19,817 |
| * | Ingram Micro Inc. | 1,018,651 | 19,446 |
| * | CommScope Inc. | 617,305 | 19,272 |
| | Broadridge Financial Solutions Inc. | 820,330 | 17,990 |
| * | Varian Semiconductor Equipment Associates Inc. | 484,573 | 17,915 |
| | Lender Processing Services Inc. | 602,499 | 17,786 |
| * | Parametric Technology Corp. | 765,434 | 17,245 |
| * | Atheros Communications Inc. | 464,938 | 16,701 |
| * | Acme Packet Inc. | 313,565 | 16,669 |
| * | AOL Inc. | 693,476 | 16,442 |
| * | IAC/InterActiveCorp | 570,461 | 16,372 |
| * | WebMD Health Corp. | 318,033 | 16,239 |
| | Jack Henry & Associates Inc. | 556,270 | 16,215 |
| * | NCR Corp. | 1,039,738 | 15,981 |
| * | Gartner Inc. | 474,603 | 15,757 |
| * | Vishay Intertechnology Inc. | 1,071,245 | 15,726 |
| * | Brocade Communications Systems Inc. | 2,945,449 | 15,581 |
| * | Concur Technologies Inc. | 296,202 | 15,382 |
| * | Finisar Corp. | 500,479 | 14,859 |
| | ADTRAN Inc. | 409,856 | 14,841 |
| * | Itron Inc. | 262,500 | 14,556 |
| | National Instruments Corp. | 381,578 | 14,363 |
| * | Cadence Design Systems Inc. | 1,735,591 | 14,336 |
| * | SuccessFactors Inc. | 493,419 | 14,289 |
| * | Zebra Technologies Corp. | 367,748 | 13,971 |
| | Diebold Inc. | 426,762 | 13,678 |
| * | International Rectifier Corp. | 455,824 | 13,533 |
| * | Tech Data Corp. | 302,931 | 13,335 |
| * | Silicon Laboratories Inc. | 289,397 | 13,318 |
| * | Rambus Inc. | 647,721 | 13,265 |
| * | RF Micro Devices Inc. | 1,784,670 | 13,117 |
| * | PMC - Sierra Inc. | 1,494,499 | 12,838 |
| * | Ciena Corp. | 607,897 | 12,796 |
| * | NeuStar Inc. Class A | 486,823 | 12,682 |
| * | Fairchild Semiconductor International Inc. Class A | 808,126 | 12,615 |
| | CoreLogic Inc. | 676,595 | 12,531 |
| * | Microsemi Corp. | 542,566 | 12,425 |
| | Intersil Corp. Class A | 807,837 | 12,336 |
| * | TriQuint Semiconductor Inc. | 1,033,362 | 12,080 |
| * | Ariba Inc. | 511,005 | 12,004 |
| * | InterDigital Inc. | 286,270 | 11,920 |
| * | Progress Software Corp. | 281,295 | 11,904 |
| * | Viasat Inc. | 266,816 | 11,849 |
| | Plantronics Inc. | 309,971 | 11,537 |
| * | Wright Express Corp. | 248,862 | 11,448 |
37
| | | |
| Vanguard® Extended Market Index Fund | | |
| Schedule of Investments | | |
| December 31, 2010 | | |
| |
| |
| | | | Market |
| | | | Value |
| | | Shares | ($000) |
| *,^ | Veeco Instruments Inc. | 265,110 | 11,389 |
| * | Quest Software Inc. | 398,488 | 11,054 |
| * | Cavium Networks Inc. | 290,541 | 10,948 |
| | Anixter International Inc. | 183,094 | 10,936 |
| * | Convergys Corp. | 804,578 | 10,596 |
| * | CACI International Inc. Class A | 197,018 | 10,521 |
| | DST Systems Inc. | 233,650 | 10,362 |
| * | Netlogic Microsystems Inc. | 325,919 | 10,237 |
| * | GSI Commerce Inc. | 431,880 | 10,020 |
| * | Aruba Networks Inc. | 469,198 | 9,797 |
| * | Hittite Microwave Corp. | 160,109 | 9,773 |
| | Sapient Corp. | 771,856 | 9,339 |
| * | Blackboard Inc. | 223,100 | 9,214 |
| * | Semtech Corp. | 405,071 | 9,171 |
| * | Arris Group Inc. | 815,029 | 9,145 |
| * | Acxiom Corp. | 521,028 | 8,936 |
| * | Digital River Inc. | 258,207 | 8,887 |
| * | Fortinet Inc. | 273,500 | 8,848 |
| * | Cymer Inc. | 193,310 | 8,712 |
| * | j2 Global Communications Inc. | 296,284 | 8,577 |
| * | Mentor Graphics Corp. | 712,492 | 8,550 |
| * | ValueClick Inc. | 530,466 | 8,503 |
| * | Blue Coat Systems Inc. | 280,601 | 8,382 |
| * | Plexus Corp. | 262,967 | 8,136 |
| * | Lawson Software Inc. | 868,633 | 8,035 |
| * | CommVault Systems Inc. | 280,073 | 8,016 |
| * | MKS Instruments Inc. | 327,062 | 8,010 |
| * | Ultimate Software Group Inc. | 163,516 | 7,952 |
| * | JDA Software Group Inc. | 280,833 | 7,863 |
| * | Netgear Inc. | 232,751 | 7,839 |
| * | Omnivision Technologies Inc. | 262,884 | 7,784 |
| * | Spansion Inc. Class A | 373,380 | 7,729 |
| | Cognex Corp. | 260,152 | 7,654 |
| | Blackbaud Inc. | 286,443 | 7,419 |
| | MAXIMUS Inc. | 112,338 | 7,367 |
| * | Benchmark Electronics Inc. | 405,567 | 7,365 |
| * | Coherent Inc. | 161,879 | 7,307 |
| | Power Integrations Inc. | 181,631 | 7,291 |
| * | Taleo Corp. Class A | 262,892 | 7,269 |
| * | Tessera Technologies Inc. | 327,861 | 7,262 |
| * | L-1 Identity Solutions Inc. | 607,628 | 7,237 |
| * | Cirrus Logic Inc. | 449,145 | 7,177 |
| *,^ | Power-One Inc. | 691,898 | 7,057 |
| *,^ | OpenTable Inc. | 99,588 | 7,019 |
| * | Integrated Device Technology Inc. | 1,030,800 | 6,865 |
| | Littelfuse Inc. | 144,444 | 6,798 |
| * | Take-Two Interactive Software Inc. | 553,043 | 6,769 |
| * | Emulex Corp. | 577,913 | 6,738 |
| * | SAVVIS Inc. | 258,621 | 6,600 |
| *,^ | Synaptics Inc. | 223,687 | 6,572 |
| * | FEI Co. | 248,756 | 6,570 |
| * | TiVo Inc. | 759,049 | 6,551 |
| * | Rofin-Sinar Technologies Inc. | 184,487 | 6,538 |
| * | Universal Display Corp. | 210,264 | 6,445 |
| * | Entegris Inc. | 856,935 | 6,401 |
| | Fair Isaac Corp. | 270,635 | 6,325 |
| * | Diodes Inc. | 233,813 | 6,311 |
| * | Cabot Microelectronics Corp. | 151,658 | 6,286 |
| * | Unisys Corp. | 238,301 | 6,170 |
| * | EchoStar Corp. Class A | 246,580 | 6,157 |
| * | Art Technology Group Inc. | 1,029,521 | 6,157 |
| * | Amkor Technology Inc. | 822,367 | 6,077 |
| * | Mantech International Corp. Class A | 146,514 | 6,055 |
| | Earthlink Inc. | 703,593 | 6,051 |
38
| | | |
| Vanguard® Extended Market Index Fund | | |
| Schedule of Investments | | |
| December 31, 2010 | | |
| |
| |
| | | | Market |
| | | | Value |
| | | Shares | ($000) |
| * | Advent Software Inc. | 103,828 | 6,014 |
| * | Sanmina-SCI Corp. | 517,459 | 5,940 |
| * | ACI Worldwide Inc. | 218,613 | 5,874 |
| *,^ | STEC Inc. | 330,614 | 5,835 |
| * | Euronet Worldwide Inc. | 330,310 | 5,761 |
| * | SRA International Inc. Class A | 279,132 | 5,708 |
| * | Websense Inc. | 277,381 | 5,617 |
| * | Scansource Inc. | 174,264 | 5,559 |
| * | Terremark Worldwide Inc. | 427,822 | 5,540 |
| *,^ | SunPower Corp. Class A | 427,786 | 5,489 |
| * | DTS Inc. | 111,724 | 5,480 |
| * | Entropic Communications Inc. | 453,120 | 5,474 |
| * | Harmonic Inc. | 633,693 | 5,431 |
| *,^ | Ebix Inc. | 226,018 | 5,350 |
| * | IPG Photonics Corp. | 168,955 | 5,342 |
| * | Tekelec | 446,925 | 5,323 |
| * | Checkpoint Systems Inc. | 258,065 | 5,303 |
| * | DealerTrack Holdings Inc. | 263,812 | 5,295 |
| * | Quantum Corp. | 1,413,758 | 5,259 |
| * | Netscout Systems Inc. | 227,158 | 5,227 |
| * | Aspen Technology Inc. | 404,430 | 5,136 |
| * | Loral Space & Communications Inc. | 66,994 | 5,125 |
| | Comtech Telecommunications Corp. | 183,965 | 5,101 |
| * | Constant Contact Inc. | 164,528 | 5,099 |
| * | Ixia | 300,387 | 5,040 |
| * | MIPS Technologies Inc. Class A | 325,616 | 4,936 |
| * | MicroStrategy Inc. Class A | 57,153 | 4,885 |
| | AVX Corp. | 312,989 | 4,829 |
| * | Sonus Networks Inc. | 1,795,670 | 4,794 |
| * | SYNNEX Corp. | 153,353 | 4,785 |
| * | Sonic Solutions Inc. | 317,103 | 4,757 |
| * | Sourcefire Inc. | 182,039 | 4,720 |
| * | LogMeIn Inc. | 106,292 | 4,713 |
| * | Lattice Semiconductor Corp. | 765,358 | 4,638 |
| * | DG FastChannel Inc. | 158,813 | 4,587 |
| * | Bottomline Technologies Inc. | 209,943 | 4,558 |
| * | Manhattan Associates Inc. | 145,192 | 4,434 |
| * | OSI Systems Inc. | 121,283 | 4,410 |
| | Black Box Corp. | 114,937 | 4,401 |
| * | Stratasys Inc. | 134,214 | 4,381 |
| * | Electronics for Imaging Inc. | 299,186 | 4,281 |
| | Micrel Inc. | 328,589 | 4,268 |
| * | Standard Microsystems Corp. | 147,581 | 4,255 |
| * | TeleTech Holdings Inc. | 205,896 | 4,239 |
| * | Oclaro Inc. | 321,744 | 4,231 |
| * | TTM Technologies Inc. | 283,329 | 4,224 |
| * | Radiant Systems Inc. | 215,353 | 4,214 |
| * | CSG Systems International Inc. | 222,022 | 4,205 |
| * | GT Solar International Inc. | 458,496 | 4,181 |
| * | Compellent Technologies Inc. | 151,472 | 4,179 |
| * | Synchronoss Technologies Inc. | 155,996 | 4,167 |
| * | Newport Corp. | 239,837 | 4,166 |
| * | ATMI Inc. | 204,933 | 4,086 |
| * | Intermec Inc. | 322,061 | 4,077 |
| * | Applied Micro Circuits Corp. | 380,232 | 4,061 |
| * | Volterra Semiconductor Corp. | 174,743 | 4,047 |
| * | SolarWinds Inc. | 210,111 | 4,045 |
| | Syntel Inc. | 84,301 | 4,029 |
| | Park Electrochemical Corp. | 134,238 | 4,027 |
| | MTS Systems Corp. | 106,754 | 3,999 |
| * | Brightpoint Inc. | 456,236 | 3,983 |
| * | Insight Enterprises Inc. | 301,507 | 3,968 |
| * | Rogers Corp. | 103,292 | 3,951 |
| * | Monolithic Power Systems Inc. | 237,796 | 3,928 |
39
| | | |
| Vanguard® Extended Market Index Fund | | |
| Schedule of Investments | | |
| December 31, 2010 | | |
| |
| |
| | | | Market |
| | | | Value |
| | | Shares | ($000) |
| | Pegasystems Inc. | 106,301 | 3,894 |
| | Daktronics Inc. | 244,437 | 3,891 |
| * | Brooks Automation Inc. | 426,678 | 3,870 |
| | Heartland Payment Systems Inc. | 249,066 | 3,841 |
| | United Online Inc. | 568,179 | 3,750 |
| * | Tyler Technologies Inc. | 179,718 | 3,731 |
| | iGate Corp. | 188,803 | 3,721 |
| * | comScore Inc. | 166,188 | 3,708 |
| * | Silicon Image Inc. | 503,965 | 3,704 |
| | Opnet Technologies Inc. | 136,182 | 3,646 |
| * | TNS Inc. | 174,260 | 3,625 |
| * | RightNow Technologies Inc. | 151,510 | 3,586 |
| * | FARO Technologies Inc. | 108,617 | 3,567 |
| * | Ultratech Inc. | 178,406 | 3,547 |
| *,^ | QuinStreet Inc. | 181,071 | 3,478 |
| * | Vocus Inc. | 125,412 | 3,469 |
| | Forrester Research Inc. | 96,942 | 3,421 |
| | EPIQ Systems Inc. | 248,414 | 3,411 |
| * | Advanced Energy Industries Inc. | 247,727 | 3,379 |
| * | Cardtronics Inc. | 190,810 | 3,377 |
| * | Avid Technology Inc. | 192,957 | 3,369 |
| * | Kenexa Corp. | 150,370 | 3,277 |
| * | Kulicke & Soffa Industries Inc. | 454,375 | 3,272 |
| | Methode Electronics Inc. | 247,491 | 3,210 |
| ^ | VirnetX Holding Corp. | 214,297 | 3,182 |
| * | Smith Micro Software Inc. | 201,874 | 3,178 |
| | NIC Inc. | 325,659 | 3,162 |
| * | Maxwell Technologies Inc. | 166,850 | 3,152 |
| * | Mercury Computer Systems Inc. | 168,740 | 3,101 |
| * | Electro Scientific Industries Inc. | 192,032 | 3,078 |
| * | Epicor Software Corp. | 302,833 | 3,059 |
| * | Verint Systems Inc. | 95,007 | 3,012 |
| * | LivePerson Inc. | 262,364 | 2,965 |
| * | AXT Inc. | 283,225 | 2,957 |
| * | Zoran Corp. | 335,769 | 2,955 |
| * | FormFactor Inc. | 327,000 | 2,904 |
| | CTS Corp. | 258,648 | 2,861 |
| * | THQ Inc. | 470,488 | 2,851 |
| * | Sycamore Networks Inc. | 131,106 | 2,699 |
| * | support.com Inc. | 403,775 | 2,616 |
| * | RealNetworks Inc. | 622,464 | 2,614 |
| * | Move Inc. | 1,013,011 | 2,603 |
| * | Infinera Corp. | 250,709 | 2,590 |
| * | Anadigics Inc. | 373,669 | 2,590 |
| * | SunPower Corp. Class B | 208,266 | 2,585 |
| * | Anaren Inc. | 122,272 | 2,549 |
| * | Sigma Designs Inc. | 178,357 | 2,527 |
| * | Echelon Corp. | 245,409 | 2,501 |
| * | Knot Inc. | 249,664 | 2,467 |
| | Cohu Inc. | 145,847 | 2,418 |
| * | ExlService Holdings Inc. | 111,412 | 2,393 |
| * | Perficient Inc. | 190,711 | 2,384 |
| * | Ancestry.com Inc. | 83,662 | 2,369 |
| * | Interactive Intelligence Inc. | 88,263 | 2,309 |
| * | Oplink Communications Inc. | 124,769 | 2,304 |
| * | LTX-Credence Corp. | 310,585 | 2,298 |
| * | Measurement Specialties Inc. | 77,969 | 2,288 |
| * | IXYS Corp. | 196,117 | 2,279 |
| * | DemandTec Inc. | 208,238 | 2,257 |
| *,^ | Rubicon Technology Inc. | 106,710 | 2,249 |
| * | S1 Corp. | 323,059 | 2,229 |
| * | Ceva Inc. | 108,327 | 2,221 |
| * | Hypercom Corp. | 264,368 | 2,213 |
| * | RealD Inc. | 84,982 | 2,203 |
40
| | | |
| Vanguard® Extended Market Index Fund | | |
| Schedule of Investments | | |
| December 31, 2010 | | |
| |
| |
| | | | Market |
| | | | Value |
| | | Shares | ($000) |
| * | Aviat Networks Inc. | 433,793 | 2,199 |
| *,^ | KIT Digital Inc. | 135,776 | 2,178 |
| * | ModusLink Global Solutions Inc. | 322,914 | 2,164 |
| * | Intevac Inc. | 154,157 | 2,160 |
| * | UTStarcom Inc. | 1,040,223 | 2,143 |
| | DDi Corp. | 180,202 | 2,119 |
| * | Zix Corp. | 494,449 | 2,111 |
| * | Multi-Fineline Electronix Inc. | 79,330 | 2,101 |
| * | SMART Modular Technologies WWH Inc. | 358,996 | 2,068 |
| * | Supertex Inc. | 85,353 | 2,064 |
| * | Kemet Corp. | 138,403 | 2,018 |
| *,^ | Powerwave Technologies Inc. | 788,054 | 2,002 |
| * | NetSuite Inc. | 80,050 | 2,001 |
| * | Photronics Inc. | 336,307 | 1,988 |
| * | Exar Corp. | 281,083 | 1,962 |
| * | EMS Technologies Inc. | 99,115 | 1,961 |
| * | Imation Corp. | 189,351 | 1,952 |
| * | Novatel Wireless Inc. | 202,753 | 1,936 |
| * | Amtech Systems Inc. | 76,650 | 1,928 |
| | Marchex Inc. Class B | 199,791 | 1,906 |
| * | Infospace Inc. | 228,311 | 1,895 |
| * | Internap Network Services Corp. | 311,345 | 1,893 |
| * | Ciber Inc. | 400,397 | 1,874 |
| * | NVE Corp. | 32,381 | 1,873 |
| * | LoopNet Inc. | 168,521 | 1,872 |
| * | Extreme Networks | 604,389 | 1,868 |
| * | RealPage Inc. | 60,081 | 1,858 |
| *,^ | Wave Systems Corp. Class A | 467,304 | 1,841 |
| * | Lionbridge Technologies Inc. | 494,906 | 1,826 |
| * | Pericom Semiconductor Corp. | 165,654 | 1,819 |
| | Keynote Systems Inc. | 124,330 | 1,818 |
| | Cass Information Systems Inc. | 47,775 | 1,813 |
| * | Silicon Graphics International Corp. | 199,235 | 1,799 |
| * | Super Micro Computer Inc. | 155,877 | 1,799 |
| * | Kopin Corp. | 430,394 | 1,790 |
| * | Actuate Corp. | 308,189 | 1,757 |
| * | Deltek Inc. | 233,324 | 1,694 |
| | Electro Rent Corp. | 104,141 | 1,683 |
| * | Trident Microsystems Inc. | 934,414 | 1,663 |
| * | iGO Inc. | 432,897 | 1,662 |
| * | Seachange International Inc. | 193,374 | 1,653 |
| * | Axcelis Technologies Inc. | 475,259 | 1,644 |
| * | Travelzoo Inc. | 39,664 | 1,635 |
| * | MoSys Inc. | 286,681 | 1,631 |
| * | QLIK Technologies Inc. | 63,103 | 1,629 |
| * | Rudolph Technologies Inc. | 196,263 | 1,615 |
| * | Limelight Networks Inc. | 276,772 | 1,608 |
| | Stamps.com Inc. | 120,526 | 1,597 |
| * | Symmetricom Inc. | 221,728 | 1,572 |
| * | DSP Group Inc. | 191,930 | 1,562 |
| * | Computer Task Group Inc. | 143,172 | 1,558 |
| * | Digi International Inc. | 140,134 | 1,555 |
| * | Vishay Precision Group Inc. | 81,824 | 1,542 |
| * | Magma Design Automation Inc. | 306,334 | 1,535 |
| * | NU Horizons Electronics Corp. | 213,002 | 1,485 |
| *,^ | Calix Inc. | 87,618 | 1,481 |
| * | Integral Systems Inc. | 148,877 | 1,475 |
| * | Saba Software Inc. | 239,769 | 1,467 |
| * | Integrated Silicon Solution Inc. | 179,453 | 1,441 |
| * | Monotype Imaging Holdings Inc. | 128,293 | 1,424 |
| * | VASCO Data Security International Inc. | 174,673 | 1,420 |
| * | QuickLogic Corp. | 221,320 | 1,410 |
| * | Global Cash Access Holdings Inc. | 441,299 | 1,408 |
| * | Cray Inc. | 194,884 | 1,393 |
41
| | | |
| Vanguard® Extended Market Index Fund | | |
| Schedule of Investments | | |
| December 31, 2010 | | |
| |
| |
| | | | Market |
| | | | Value |
| | | Shares | ($000) |
| * | Globecomm Systems Inc. | 136,480 | 1,365 |
| | Telular Corp. | 201,463 | 1,342 |
| *,^ | Energy Conversion Devices Inc. | 290,167 | 1,335 |
| * | PRGX Global Inc. | 209,581 | 1,327 |
| * | Pulse Electronics Corp. | 248,861 | 1,324 |
| * | Radisys Corp. | 146,310 | 1,302 |
| * | Mattson Technology Inc. | 431,243 | 1,294 |
| * | Zygo Corp. | 105,612 | 1,292 |
| * | Spectrum Control Inc. | 85,771 | 1,286 |
| * | Bsquare Corp. | 146,452 | 1,281 |
| * | Dynamics Research Corp. | 93,598 | 1,254 |
| * | TeleCommunication Systems Inc. Class A | 266,018 | 1,242 |
| * | Transact Technologies Inc. | 127,286 | 1,193 |
| * | Nanometrics Inc. | 91,992 | 1,180 |
| *,^ | Microvision Inc. | 615,836 | 1,145 |
| * | Ultra Clean Holdings | 122,860 | 1,144 |
| * | Occam Networks Inc. | 131,192 | 1,137 |
| * | MoneyGram International Inc. | 411,350 | 1,115 |
| * | PROS Holdings Inc. | 97,676 | 1,113 |
| | American Software Inc. Class A | 164,144 | 1,111 |
| * | Gerber Scientific Inc. | 141,066 | 1,110 |
| *,^ | Rosetta Stone Inc. | 52,243 | 1,109 |
| * | Callidus Software Inc. | 218,533 | 1,101 |
| *,^ | Research Frontiers Inc. | 205,046 | 1,091 |
| * | Dice Holdings Inc. | 75,636 | 1,085 |
| *,^ | Local.com Corp. | 167,148 | 1,085 |
| * | KVH Industries Inc. | 90,378 | 1,080 |
| * | Mindspeed Technologies Inc. | 175,202 | 1,069 |
| * | Hackett Group Inc. | 298,042 | 1,046 |
| | Bel Fuse Inc. Class B | 43,755 | 1,046 |
| * | SS&C Technologies Holdings Inc. | 50,129 | 1,028 |
| * | Immersion Corp. | 152,449 | 1,023 |
| * | Network Equipment Technologies Inc. | 220,338 | 1,020 |
| * | Tollgrade Communications Inc. | 109,137 | 1,013 |
| * | BTU International Inc. | 111,167 | 999 |
| * | Agilysys Inc. | 177,464 | 999 |
| * | Liquidity Services Inc. | 70,439 | 990 |
| * | FalconStor Software Inc. | 293,650 | 984 |
| | Renaissance Learning Inc. | 82,995 | 983 |
| * | X-Rite Inc. | 214,879 | 982 |
| * | Data I/O Corp. | 170,876 | 981 |
| * | PC Mall Inc. | 128,872 | 976 |
| * | Openwave Systems Inc. | 433,970 | 920 |
| * | Virtusa Corp. | 54,331 | 889 |
| * | Web.com Group Inc. | 105,072 | 888 |
| *,^ | Evergreen Solar Inc. | 1,516,247 | 884 |
| * | Pervasive Software Inc. | 170,783 | 881 |
| | Mocon Inc. | 68,091 | 880 |
| * | Westell Technologies Inc. Class A | 268,074 | 877 |
| | Communications Systems Inc. | 61,604 | 859 |
| * | ShoreTel Inc. | 108,995 | 851 |
| | Evolving Systems Inc. | 102,263 | 851 |
| * | Ramtron International Corp. | 252,459 | 851 |
| | Ipass Inc. | 676,702 | 846 |
| * | Fabrinet | 39,017 | 839 |
| * | LaserCard Corp. | 133,468 | 833 |
| * | Opnext Inc. | 472,796 | 832 |
| * | Bitstream Inc. Class A | 114,528 | 828 |
| * | Comverge Inc. | 117,645 | 813 |
| * | Digimarc Corp. | 26,516 | 796 |
| * | Advanced Analogic Technologies Inc. | 194,484 | 780 |
| * | NCI Inc. Class A | 33,700 | 775 |
| * | ORBCOMM Inc. | 292,962 | 759 |
| * | Datalink Corp. | 156,985 | 758 |
42
| | | |
| Vanguard® Extended Market Index Fund | | |
| Schedule of Investments | | |
| December 31, 2010 | | |
| |
| |
| | | | Market |
| | | | Value |
| | | Shares | ($000) |
| * | SRS Labs Inc. | 84,276 | 742 |
| * | LRAD Corp. | 271,744 | 731 |
| * | Guidance Software Inc. | 98,818 | 711 |
| * | Presstek Inc. | 320,018 | 710 |
| * | Tier Technologies Inc. Class B | 117,374 | 703 |
| * | Rimage Corp. | 46,868 | 699 |
| * | KEY Tronic Corp. | 131,723 | 688 |
| * | LeCroy Corp. | 69,031 | 679 |
| * | IntraLinks Holdings Inc. | 35,872 | 671 |
| * | GSE Systems Inc. | 179,828 | 651 |
| * | BigBand Networks Inc. | 230,937 | 647 |
| * | PDF Solutions Inc. | 133,969 | 646 |
| * | Aware Inc. | 229,403 | 642 |
| * | Conexant Systems Inc. | 390,556 | 637 |
| * | LoJack Corp. | 98,177 | 634 |
| * | Network Engines Inc. | 411,278 | 625 |
| * | CPI International Inc. | 31,588 | 611 |
| * | BroadSoft Inc. | 25,035 | 598 |
| * | Online Resources Corp. | 128,409 | 597 |
| * | StarTek Inc. | 115,340 | 585 |
| | Richardson Electronics Ltd. | 49,888 | 583 |
| * | PC Connection Inc. | 65,582 | 581 |
| * | Insweb Corp. | 70,359 | 580 |
| * | Hutchinson Technology Inc. | 153,807 | 571 |
| * | Innodata Isogen Inc. | 196,497 | 560 |
| | Mesa Laboratories Inc. | 18,022 | 541 |
| * | Identive Group Inc. | 213,733 | 539 |
| * | NAPCO Security Technologies Inc. | 297,429 | 532 |
| * | XETA Technologies Inc. | 177,517 | 527 |
| * | Versant Corp. | 43,949 | 523 |
| * | QAD Inc. Class A | 57,072 | 519 |
| * | Glu Mobile Inc. | 249,992 | 517 |
| *,^ | Echo Global Logistics Inc. | 42,436 | 511 |
| | Astro-Med Inc. | 64,998 | 501 |
| * | Autobytel Inc. | 572,741 | 493 |
| * | Aetrium Inc. | 209,921 | 489 |
| * | PC-Tel Inc. | 80,177 | 481 |
| * | MaxLinear Inc. | 44,422 | 478 |
| * | PLX Technology Inc. | 131,538 | 475 |
| * | FSI International Inc. | 106,309 | 470 |
| * | EndWave Corp. | 207,182 | 466 |
| * | Information Services Group Inc. | 219,952 | 460 |
| * | Onvia Inc. | 98,708 | 457 |
| * | RAE Systems Inc. | 283,305 | 456 |
| * | Frequency Electronics Inc. | 67,949 | 456 |
| * | Stream Global Services Inc. | 110,882 | 438 |
| * | GSI Technology Inc. | 53,108 | 430 |
| * | Emcore Corp. | 391,031 | 422 |
| | TheStreet.com Inc. | 148,904 | 398 |
| * | Reis Inc. | 56,574 | 396 |
| * | Zhone Technologies Inc. | 145,709 | 389 |
| * | Micronetics Inc. | 87,314 | 384 |
| *,^ | Meru Networks Inc. | 24,835 | 383 |
| * | Dot Hill Systems Corp. | 219,475 | 382 |
| * | Cyberoptics Corp. | 43,293 | 370 |
| * | EasyLink Services International Corp. Class A | 85,391 | 359 |
| * | Performance Technologies Inc. | 207,679 | 353 |
| | Optical Cable Corp. | 111,581 | 348 |
| * | Spire Corp. | 65,882 | 343 |
| * | Hauppauge Digital Inc. | 153,081 | 343 |
| * | Looksmart Ltd. | 161,326 | 340 |
| * | Market Leader Inc. | 181,907 | 320 |
| * | Motricity Inc. | 16,920 | 314 |
| * | CalAmp Corp. | 99,555 | 313 |
43
| | | |
| Vanguard® Extended Market Index Fund | | |
| Schedule of Investments | | |
| December 31, 2010 | | |
| |
| |
| | | | Market |
| | | | Value |
| | | Shares | ($000) |
| * | ID Systems Inc. | 91,248 | 302 |
| * | Tii Network Technologies Inc. | 107,178 | 298 |
| * | NetSol Technologies Inc. | 151,292 | 283 |
| * | Cinedigm Digital Cinema Corp. Class A | 166,650 | 275 |
| * | PAR Technology Corp. | 48,052 | 274 |
| * | Transwitch Corp. | 120,675 | 259 |
| * | Superconductor Technologies Inc. | 167,626 | 255 |
| | Imergent Inc. | 56,451 | 253 |
| * | Intellicheck Mobilisa Inc. | 184,780 | 253 |
| * | Video Display Corp. | 63,554 | 252 |
| * | Procera Networks Inc. | 402,632 | 250 |
| * | Ikanos Communications Inc. | 185,951 | 249 |
| * | Digital Ally Inc. | 137,859 | 241 |
| * | Ditech Networks Inc. | 165,261 | 236 |
| * | Sonic Foundry Inc. | 16,862 | 234 |
| *,^ | Netlist Inc. | 91,023 | 232 |
| * | NaviSite Inc. | 59,337 | 219 |
| * | ePlus Inc. | 8,963 | 212 |
| * | TechTarget Inc. | 25,396 | 201 |
| * | Lantronix Inc. | 54,334 | 201 |
| * | RF Monolithics Inc. | 160,383 | 197 |
| * | Acorn Energy Inc. | 49,263 | 191 |
| * | Pixelworks Inc. | 54,196 | 190 |
| * | Cascade Microtech Inc. | 43,648 | 189 |
| * | Management Network Group Inc. | 72,395 | 188 |
| * | AuthenTec Inc. | 74,840 | 187 |
| * | Inphi Corp. | 9,272 | 186 |
| * | Newtek Business Services Inc. | 96,214 | 165 |
| * | Vertro Inc. | 33,558 | 164 |
| | Bel Fuse Inc. Class A | 5,719 | 146 |
| * | Majesco Entertainment Co. | 199,658 | 146 |
| * | Soundbite Communications Inc. | 51,381 | 145 |
| * | QAD Inc. Class B | 14,091 | 140 |
| * | TigerLogic Corp. | 28,977 | 136 |
| * | IEC Electronics Corp. | 17,877 | 136 |
| * | Planar Systems Inc. | 65,314 | 133 |
| * | TSR Inc. | 27,043 | 132 |
| * | Selectica Inc. | 24,332 | 119 |
| * | Lightpath Technologies Inc. Class A | 59,757 | 109 |
| * | EDGAR Online Inc. | 82,112 | 99 |
| * | Parkervision Inc. | 221,647 | 98 |
| * | Authentidate Holding Corp. | 212,562 | 95 |
| * | WebMediaBrands Inc. | 55,964 | 90 |
| * | Dialogic Inc. | 20,792 | 82 |
| * | Convio Inc. | 9,294 | 77 |
| * | Scientific Learning Corp. | 22,131 | 67 |
| * | MEMSIC Inc. | 19,210 | 63 |
| * | Envestnet Inc. | 3,268 | 56 |
| * | Mastech Holdings Inc. | 12,664 | 53 |
| * | DRI Corp. | 39,661 | 45 |
| * | Unify Corp. | 13,137 | 38 |
| * | DayStar Technologies Inc. | 22,553 | 36 |
| * | Inuvo Inc. | 6,819 | 35 |
| * | Globalscape Inc. | 16,828 | 33 |
| * | Numerex Corp. Class A | 3,300 | 30 |
| * | MakeMusic Inc. | 5,456 | 29 |
| * | Relm Wireless Corp. | 13,962 | 25 |
| * | GTSI Corp. | 4,450 | 21 |
| * | ClearOne Communications Inc. | 5,294 | 20 |
| * | Rainmaker Systems Inc. | 7,607 | 11 |
| * | Overland Storage Inc. | 7,040 | 10 |
| * | Wireless Ronin Technologies Inc. | 5,509 | 8 |
| * | eLoyalty Corp. | 1,000 | 6 |
| * | Wireless Telecom Group Inc. | 4,907 | 4 |
44
| | | |
| Vanguard® Extended Market Index Fund | | |
| Schedule of Investments | | |
| December 31, 2010 | | |
| |
| |
| | | | Market |
| | | | Value |
| | | Shares | ($000) |
| * | Interphase Corp. | 449 | 1 |
| * | INX Inc. | 100 | 1 |
| * | Conolog Corp. | 25 | — |
| | | | 2,731,669 |
| Materials (6.7%) | | |
| | Mosaic Co. | 1,042,265 | 79,587 |
| | Lubrizol Corp. | 426,358 | 45,569 |
| | Walter Energy Inc. | 343,634 | 43,930 |
| | Celanese Corp. Class A | 1,011,239 | 41,633 |
| * | Crown Holdings Inc. | 1,033,488 | 34,498 |
| | Albemarle Corp. | 594,869 | 33,182 |
| | Nalco Holding Co. | 898,738 | 28,706 |
| | Martin Marietta Materials Inc. | 295,791 | 27,284 |
| | Ashland Inc. | 512,141 | 26,047 |
| | Steel Dynamics Inc. | 1,410,083 | 25,805 |
| | Reliance Steel & Aluminum Co. | 484,684 | 24,767 |
| | Sonoco Products Co. | 668,245 | 22,500 |
| | Valspar Corp. | 639,768 | 22,059 |
| | Aptargroup Inc. | 436,467 | 20,763 |
| | Domtar Corp. | 271,521 | 20,614 |
| | Royal Gold Inc. | 348,802 | 19,055 |
| | Compass Minerals International Inc. | 212,646 | 18,983 |
| * | Hecla Mining Co. | 1,665,409 | 18,753 |
| | RPM International Inc. | 842,288 | 18,615 |
| * | Solutia Inc. | 791,100 | 18,259 |
| | Huntsman Corp. | 1,118,654 | 17,462 |
| | Packaging Corp. of America | 671,493 | 17,351 |
| | Cytec Industries Inc. | 320,860 | 17,025 |
| * | WR Grace & Co. | 472,721 | 16,607 |
| | Cabot Corp. | 424,824 | 15,995 |
| * | Coeur d'Alene Mines Corp. | 580,132 | 15,849 |
| | Scotts Miracle-Gro Co. Class A | 299,095 | 15,185 |
| * | Smurfit-Stone Container Corp. | 591,170 | 15,134 |
| | Temple-Inland Inc. | 700,315 | 14,875 |
| | Rock-Tenn Co. Class A | 252,851 | 13,641 |
| * | Rockwood Holdings Inc. | 343,554 | 13,440 |
| * | Allied Nevada Gold Corp. | 502,686 | 13,226 |
| | Greif Inc. Class A | 202,253 | 12,519 |
| | Commercial Metals Co. | 742,820 | 12,323 |
| | Sensient Technologies Corp. | 322,978 | 11,863 |
| | Silgan Holdings Inc. | 326,310 | 11,685 |
| | Carpenter Technology Corp. | 285,712 | 11,497 |
| * | Intrepid Potash Inc. | 287,886 | 10,735 |
| | Olin Corp. | 516,822 | 10,605 |
| | Schnitzer Steel Industries Inc. | 150,262 | 9,976 |
| * | Chemtura Corp. | 619,684 | 9,903 |
| *,^ | Molycorp Inc. | 187,104 | 9,336 |
| | Texas Industries Inc. | 181,090 | 8,290 |
| * | Ferro Corp. | 559,927 | 8,197 |
| * | Louisiana-Pacific Corp. | 857,275 | 8,110 |
| | Eagle Materials Inc. | 287,052 | 8,109 |
| | NewMarket Corp. | 64,420 | 7,947 |
| * | Stillwater Mining Co. | 370,242 | 7,905 |
| | Minerals Technologies Inc. | 120,501 | 7,882 |
| * | OM Group Inc. | 200,678 | 7,728 |
| * | PolyOne Corp. | 607,705 | 7,590 |
| | Schweitzer-Mauduit International Inc. | 119,069 | 7,492 |
| | Worthington Industries Inc. | 371,615 | 6,838 |
| | Globe Specialty Metals Inc. | 393,938 | 6,732 |
| | HB Fuller Co. | 318,572 | 6,537 |
| * | Kraton Performance Polymers Inc. | 203,026 | 6,284 |
| | Balchem Corp. | 185,321 | 6,266 |
45
| | | |
| Vanguard® Extended Market Index Fund | | |
| Schedule of Investments | | |
| December 31, 2010 | | |
| |
| |
| | | | Market |
| | | | Value |
| | | Shares | ($000) |
| | Arch Chemicals Inc. | 163,683 | 6,209 |
| * | Clearwater Paper Corp. | 74,832 | 5,859 |
| * | Century Aluminum Co. | 368,817 | 5,728 |
| | Westlake Chemical Corp. | 129,079 | 5,611 |
| * | Calgon Carbon Corp. | 366,104 | 5,535 |
| | Buckeye Technologies Inc. | 257,085 | 5,401 |
| *,^ | STR Holdings Inc. | 268,898 | 5,378 |
| * | Georgia Gulf Corp. | 220,759 | 5,311 |
| * | RTI International Metals Inc. | 196,381 | 5,298 |
| * | Brush Engineered Materials Inc. | 132,372 | 5,115 |
| | AMCOL International Corp. | 164,154 | 5,089 |
| | Innophos Holdings Inc. | 139,488 | 5,033 |
| * | US Gold Corp. | 602,879 | 4,865 |
| | Kaiser Aluminum Corp. | 96,366 | 4,827 |
| | Koppers Holdings Inc. | 133,614 | 4,781 |
| | A Schulman Inc. | 204,917 | 4,691 |
| | Deltic Timber Corp. | 69,918 | 3,939 |
| | Boise Inc. | 492,479 | 3,905 |
| | Stepan Co. | 50,440 | 3,847 |
| * | KapStone Paper and Packaging Corp. | 248,305 | 3,799 |
| * | Horsehead Holding Corp. | 281,149 | 3,666 |
| | PH Glatfelter Co. | 297,674 | 3,652 |
| * | General Moly Inc. | 526,607 | 3,412 |
| | Haynes International Inc. | 70,928 | 2,967 |
| * | Omnova Solutions Inc. | 352,484 | 2,947 |
| | Wausau Paper Corp. | 338,858 | 2,918 |
| | Zep Inc. | 138,863 | 2,761 |
| | Quaker Chemical Corp. | 62,023 | 2,585 |
| * | LSB Industries Inc. | 102,251 | 2,481 |
| | Hawkins Inc. | 51,982 | 2,308 |
| | Myers Industries Inc. | 224,516 | 2,187 |
| * | Senomyx Inc. | 305,101 | 2,175 |
| * | Spartech Corp. | 218,045 | 2,041 |
| | Olympic Steel Inc. | 70,591 | 2,025 |
| * | Headwaters Inc. | 438,897 | 2,010 |
| * | AM Castle & Co. | 109,047 | 2,008 |
| | Neenah Paper Inc. | 100,672 | 1,981 |
| * | Zoltek Cos. Inc. | 164,777 | 1,903 |
| * | TPC Group Inc. | 59,272 | 1,797 |
| * | Graphic Packaging Holding Co. | 449,702 | 1,749 |
| | Kronos Worldwide Inc. | 40,055 | 1,702 |
| ^ | Great Northern Iron Ore Properties | 10,412 | 1,463 |
| * | ADA-ES Inc. | 121,635 | 1,357 |
| * | Graham Packaging Co. Inc. | 100,112 | 1,305 |
| * | Universal Stainless & Alloy | 39,450 | 1,234 |
| *,^ | Zagg Inc. | 159,717 | 1,217 |
| | NL Industries Inc. | 104,012 | 1,161 |
| | American Vanguard Corp. | 133,026 | 1,136 |
| * | AEP Industries Inc. | 43,286 | 1,123 |
| * | US Energy Corp. Wyoming | 172,326 | 1,048 |
| *,^ | Flotek Industries Inc. | 191,814 | 1,045 |
| * | Mercer International Inc. | 134,386 | 1,041 |
| * | Metals USA Holdings Corp. | 58,117 | 886 |
| * | Noranda Aluminum Holding Corp. | 60,438 | 882 |
| * | WHX Corp. | 65,482 | 850 |
| * | Landec Corp. | 125,821 | 752 |
| | Synalloy Corp. | 51,227 | 621 |
| * | United States Lime & Minerals Inc. | 14,638 | 617 |
| * | Rock of Ages Corp. | 91,696 | 480 |
| * | Penford Corp. | 77,586 | 474 |
| | Chase Corp. | 24,653 | 402 |
| * | TOR Minerals International Inc. | 32,018 | 318 |
| * | Nanophase Technologies Corp. | 247,325 | 292 |
| *,^ | Timberline Resources Corp. | 215,815 | 257 |
46
| | | |
| Vanguard® Extended Market Index Fund | | |
| Schedule of Investments | | |
| December 31, 2010 | | |
| |
| |
| | | | Market |
| | | | Value |
| | | Shares | ($000) |
| * | American Pacific Corp. | 44,024 | 253 |
| * | Mod-Pac Corp. | 49,498 | 243 |
| | KMG Chemicals Inc. | 12,966 | 215 |
| * | Solitario Exploration & Royalty Corp. | 51,032 | 186 |
| * | Verso Paper Corp. | 37,309 | 128 |
| * | Metalline Mining Co. | 84,866 | 106 |
| * | Clean Diesel Technologies Inc. | 671 | 6 |
| * | Cereplast Inc. | 300 | 1 |
| | | | 1,171,343 |
| Telecommunication Services (1.7%) | | |
| * | Crown Castle International Corp. | 1,283,986 | 56,277 |
| * | NII Holdings Inc. | 1,099,637 | 49,110 |
| * | SBA Communications Corp. Class A | 746,878 | 30,577 |
| * | tw telecom inc Class A | 982,957 | 16,759 |
| | Telephone & Data Systems Inc. | 451,721 | 16,510 |
| * | Syniverse Holdings Inc. | 455,937 | 14,066 |
| *,^ | Clearwire Corp. Class A | 2,435,899 | 12,545 |
| * | Level 3 Communications Inc. | 10,840,199 | 10,623 |
| | AboveNet Inc. | 166,215 | 9,717 |
| * | United States Cellular Corp. | 101,007 | 5,044 |
| | Telephone & Data Systems Inc. - Special Common Shares | 147,351 | 4,644 |
| * | Cogent Communications Group Inc. | 297,792 | 4,211 |
| * | Leap Wireless International Inc. | 336,566 | 4,126 |
| | NTELOS Holdings Corp. | 195,300 | 3,720 |
| * | Cincinnati Bell Inc. | 1,312,238 | 3,674 |
| * | General Communication Inc. Class A | 285,940 | 3,620 |
| * | Neutral Tandem Inc. | 225,625 | 3,258 |
| | Alaska Communications Systems Group Inc. | 283,798 | 3,150 |
| | USA Mobility Inc. | 174,314 | 3,098 |
| * | PAETEC Holding Corp. | 825,096 | 3,086 |
| | Shenandoah Telecommunications Co. | 164,315 | 3,078 |
| | IDT Corp. Class B | 118,371 | 3,036 |
| * | Global Crossing Ltd. | 231,704 | 2,994 |
| | Consolidated Communications Holdings Inc. | 153,605 | 2,965 |
| * | Premiere Global Services Inc. | 410,439 | 2,791 |
| * | Cbeyond Inc. | 167,032 | 2,552 |
| | Atlantic Tele-Network Inc. | 61,392 | 2,354 |
| * | Iridium Communications Inc. | 264,406 | 2,181 |
| * | Hughes Communications Inc. | 41,189 | 1,666 |
| * | 8x8 Inc. | 619,573 | 1,475 |
| * | Vonage Holdings Corp. | 537,469 | 1,204 |
| * | ICO Global Communications Holdings Ltd. | 732,974 | 1,099 |
| | HickoryTech Corp. | 96,649 | 928 |
| * | SureWest Communications | 82,344 | 881 |
| * | FiberTower Corp. | 184,960 | 825 |
| | Warwick Valley Telephone Co. | 48,561 | 673 |
| * | inContact Inc. | 155,906 | 514 |
| * | Towerstream Corp. | 102,845 | 418 |
| *,^ | Globalstar Inc. | 254,196 | 369 |
| * | Arbinet Corp. | 19,997 | 167 |
| | IDT Corp. | 2,456 | 63 |
| | | | 290,048 |
| Utilities (4.0%) | | |
| | National Fuel Gas Co. | 533,945 | 35,037 |
| * | Calpine Corp. | 2,281,330 | 30,433 |
| | OGE Energy Corp. | 633,238 | 28,838 |
| | American Water Works Co. Inc. | 1,136,042 | 28,731 |
| | NSTAR | 672,960 | 28,392 |
| | Alliant Energy Corp. | 720,139 | 26,480 |
| | MDU Resources Group Inc. | 1,222,946 | 24,789 |
| | UGI Corp. | 717,696 | 22,665 |
| | Energen Corp. | 467,061 | 22,540 |
| | NV Energy Inc. | 1,527,832 | 21,466 |
| | ITC Holdings Corp. | 329,176 | 20,402 |
47
| | | | |
| Vanguard® Extended Market Index Fund | | | |
| Schedule of Investments | | | |
| December 31, 2010 | | | |
| |
| |
| | | | | Market |
| | | | | Value |
| | | | Shares | ($000) |
| | Aqua America Inc. | | 893,577 | 20,088 |
| | DPL Inc. | | 772,688 | 19,866 |
| | Questar Corp. | | 1,135,983 | 19,777 |
| * | GenOn Energy Inc. | | 4,974,815 | 18,954 |
| | Atmos Energy Corp. | | 587,400 | 18,327 |
| | Westar Energy Inc. | | 723,687 | 18,208 |
| | AGL Resources Inc. | | 507,005 | 18,176 |
| | Great Plains Energy Inc. | | 881,219 | 17,087 |
| | Hawaiian Electric Industries Inc. | | 611,683 | 13,940 |
| | Vectren Corp. | | 530,491 | 13,464 |
| | Piedmont Natural Gas Co. Inc. | | 468,504 | 13,099 |
| | Cleco Corp. | | 394,769 | 12,143 |
| | WGL Holdings Inc. | | 331,824 | 11,869 |
| | IDACORP Inc. | | 319,139 | 11,802 |
| | New Jersey Resources Corp. | | 267,983 | 11,553 |
| | Southwest Gas Corp. | | 295,942 | 10,852 |
| | Portland General Electric Co. | | 489,210 | 10,616 |
| | South Jersey Industries Inc. | | 194,151 | 10,255 |
| | UIL Holdings Corp. | | 327,647 | 9,816 |
| | Unisource Energy Corp. | | 236,705 | 8,484 |
| | Avista Corp. | | 367,628 | 8,279 |
| | Northwest Natural Gas Co. | | 173,158 | 8,047 |
| * | El Paso Electric Co. | | 282,761 | 7,784 |
| | Black Hills Corp. | | 254,987 | 7,650 |
| | Allete Inc. | | 202,430 | 7,543 |
| | PNM Resources Inc. | | 564,084 | 7,344 |
| | NorthWestern Corp. | | 235,397 | 6,786 |
| | MGE Energy Inc. | | 150,245 | 6,424 |
| | Empire District Electric Co. | | 269,748 | 5,988 |
| | Laclede Group Inc. | | 145,054 | 5,300 |
| | Otter Tail Corp. | | 234,016 | 5,275 |
| | California Water Service Group | | 135,626 | 5,055 |
| | CH Energy Group Inc. | | 102,828 | 5,027 |
| | American States Water Co. | | 121,194 | 4,178 |
| | Ormat Technologies Inc. | | 130,030 | 3,846 |
| * | Dynegy Inc. Class A | | 670,723 | 3,769 |
| | Chesapeake Utilities Corp. | | 68,152 | 2,830 |
| | SJW Corp. | | 85,325 | 2,259 |
| | Middlesex Water Co. | | 98,053 | 1,799 |
| | Central Vermont Public Service Corp. | | 73,676 | 1,611 |
| | Connecticut Water Service Inc. | | 56,928 | 1,587 |
| | York Water Co. | | 72,574 | 1,255 |
| * | Cadiz Inc. | | 86,374 | 1,074 |
| | Unitil Corp. | | 45,457 | 1,034 |
| | Artesian Resources Corp. Class A | | 35,508 | 673 |
| | Pennichuck Corp. | | 21,585 | 591 |
| | Delta Natural Gas Co. Inc. | | 18,735 | 588 |
| * | Purecycle Corp. | | 83,956 | 298 |
| *,^ | US Geothermal Inc. | | 252,601 | 296 |
| * | Synthesis Energy Systems Inc. | | 82,354 | 96 |
| | | | | 692,435 |
| Total Common Stocks (Cost $14,156,752) | | 17,349,978 |
| |
| | | | | Market |
| | | | | Value |
| | | Coupon | Shares | ($000) |
| Temporary Cash Investments (1.5%)1 | | | |
| Money Market Fund (1.5%) | | | |
| 2,3 | Vanguard Market Liquidity Fund | 0.211% | 264,435,000 | 264,435 |
48
| | | | | |
| | | | | Face | Market |
| | | | Maturity | Amount | Value |
| | | Coupon | Date | ($000) | ($000) |
| U.S. Government and Agency Obligations (0.0%) | | | | |
| 4,5 | Fannie Mae Discount Notes | 0.200% | 2/14/11 | 4,000 | 3,999 |
| 4,5 | Fannie Mae Discount Notes | 0.341% | 3/1/11 | 3,000 | 2,999 |
| | | | | | 6,998 |
| Total Temporary Cash Investments (Cost $271,433) | | | | 271,433 |
| Total Investments (101.1%) (Cost $14,428,185) | | | | 17,621,411 |
| Other Assets and Liabilities—Net (-1.1%)3 | | | | (199,970) |
| Net Assets (100%) | | | | 17,421,441 |
* Non-income-producing security.
^ Part of security position is on loan to broker-dealers. The total value of securities on loan is $164,884,000.
1 The fund invests a portion of its cash reserves in equity markets through the use of index futures contracts. After giving effect to futures investments, the fund's effective common stock and temporary cash investment positions represent 100.0% and 1.1%, respectively, of net assets.
2 Affiliated money market fund available only to Vanguard funds and certain trusts and accounts managed by Vanguard. Rate shown is the 7-day yield.
3 Includes $187,565,000 of collateral received for securities on loan.
4 Securities with a value of $6,998,000 have been segregated as initial margin for open futures contracts.
5 The issuer operates under a congressional charter; its securities are not backed by the full faith and credit of the U.S. government.
REIT—Real Estate Investment Trust.
49
Report of Independent Registered Public Accounting Firm
To the Trustees of Vanguard Index Funds and the Shareholders of Vanguard Extended Market Index Fund:
We have audited, in accordance with the standards of the Public Company Accounting Oversight Board (United States), the financial statements (not presented herein) of Vanguard Extended Market Index Fund (constituting a separate portfolio of Vanguard Index Funds, hereafter referred to as the “Fund”) as of December 31, 2010 and for the year then ended and have issued our unqualified report thereon dated February 8, 2011. Our audit included an audit of the Fund’s schedule of investments as of December 31, 2010. This schedule of investments is the responsibility of the Fund’s management. Our responsibility is to express an opinion on this schedule of investments based on our audit.
In our opinion, the accompanying schedule of investments referred to above, when read in conjunction with the financial statements of the Fund referred to above, presents fairly, in all material respects, the information set forth therein.
PricewaterhouseCoopers LLP
Philadelphia, PA
February 8, 2011
50
|
| © 2011 The Vanguard Group. Inc. |
| All rights reserved. |
| Vanguard Marketing Corporation, Distributor. |
| |
| SNA 980_022011 |
 |
| Vanguard U.S. Stock Index Funds |
| Large-Capitalization Portfolios |
| Annual Report |
|
| December 31, 2010 |
| |
 |
| |
| |
| Vanguard Growth Index Fund |
| Vanguard Value Index Fund |
| Vanguard Large-Cap Index Fund |
|
> The Vanguard large-cap index funds produced double-digit returns as the stock market rallied in the second half of 2010.
> The funds closely tracked the returns of their target indexes, and all three outperformed the average returns of their peer groups.
> Although U.S. stocks have enjoyed a powerful rebound in the past two years, the long-term returns of the large-cap index funds still bear the scars of market traumas experienced earlier in the decade.
| |
| Contents | |
| Your Fund’s Total Returns. | 1 |
| Chairman’s Letter. | 4 |
| Growth Index Fund. | 10 |
| Value Index Fund. | 32 |
| Large-Cap Index Fund. | 53 |
| Your Fund’s After-Tax Returns. | 81 |
| About Your Fund’s Expenses. | 82 |
| Glossary. | 85 |

Growth Index Fund
Value Index Fund
Large-Cap Index Fund
Please note: The opinions expressed in this report are just that—informed opinions. They should not be considered promises or advice. Also, please keep in mind that the information and opinions cover the period through the date on the front of this report. Of course, the risks of investing in your fund are spelled out in the prospectus.
See the Glossary for definitions of investment terms used in this report.
Cover photograph: Jean Maher.
Your Fund’s Total Returns
| |
| Fiscal Year Ended December 31, 2010 | |
| | Total |
| | Returns |
| Vanguard Growth Index Fund | |
| Investor Shares | 16.96% |
| Admiral™ Shares | 17.12 |
| Signal® Shares | 17.11 |
| Institutional Shares | 17.17 |
| ETF Shares | |
| Market Price | 17.15 |
| Net Asset Value | 17.11 |
| MSCI US Prime Market Growth Index | 17.23 |
| Large-Cap Growth Funds Average | 14.64 |
| Large-Cap Growth Funds Average: Derived from data provided by Lipper Inc. | |
| Vanguard Value Index Fund | |
| Investor Shares | 14.28% |
| Admiral™ Shares | 14.45 |
| Signal® Shares | 14.46 |
| Institutional Shares | 14.49 |
| ETF Shares | |
| Market Price | 14.48 |
| Net Asset Value | 14.45 |
| MSCI US Prime Market Value Index | 14.54 |
| Large-Cap Value Funds Average | 13.15 |
| Large-Cap Value Funds Average: Derived from data provided by Lipper Inc. | |
Admiral Shares carry lower expenses and are available to investors who meet certain account-balance requirements. Signal Shares and Institutional Shares are available to certain institutional investors who meet specific administrative, service, and account-size criteria. The Vanguard ETF® Shares shown are traded on the NYSE Arca exchange and are available only through brokers. The table provides ETF returns based on both the NYSE Arca market price and the net asset value for a share. U.S. Pat. No. 6,879,964 B2; 7,337,138.
1
Your Fund’s Total Returns
| |
| Fiscal Year Ended December 31, 2010 | |
| | Total |
| | Returns |
| Vanguard Large-Cap Index Fund | |
| Investor Shares | 15.63% |
| Admiral™ Shares | 15.81 |
| Signal® Shares | 15.83 |
| Institutional Shares | 15.85 |
| ETF Shares | |
| Market Price | 15.84 |
| Net Asset Value | 15.81 |
| MSCI US Prime Market 750 Index | 15.92 |
| Large-Cap Core Funds Average | 12.86 |
| Large-Cap Core Funds Average: Derived from data provided by Lipper Inc. | |
Admiral Shares carry lower expenses and are available to investors who meet certain account-balance requirements. Signal Shares and Institutional Shares are available to certain institutional investors who meet specific administrative, service, and account-size criteria. The Vanguard ETF® Shares shown are traded on the NYSE Arca exchange and are available only through brokers. The table provides ETF returns based on both the NYSE Arca market price and the net asset value for a share. U.S. Pat. No. 6,879,964 B2; 7,337,138.
For the ETF Shares, the market price is determined by the midpoint of the bid-offer spread as of the closing time of the New York Stock Exchange (generally 4 p.m., Eastern time). The net asset value is also determined as of the NYSE closing time. For more information about how the ETF Shares' market prices have compared with their net asset value, visit vanguard.com, select your ETF, and then select the Price and Performance tab. The ETF premium/discount analysis there shows the percentages of days on which the ETF Shares' market price was above or below the NAV.
2
Your Fund’s Performance at a Glance
| | | | |
| December 31, 2009 , Through December 31, 2010 | | | | |
| | | | Distributions Per Share |
| | Starting | Ending | Income | Capital |
| | Share Price | Share Price | Dividends | Gains |
| Vanguard Growth Index Fund | | | | |
| Investor Shares | $27.32 | $31.60 | $0.319 | $0.000 |
| Admiral Shares | 27.32 | 31.60 | 0.359 | 0.000 |
| Signal Shares | 25.30 | 29.26 | 0.334 | 0.000 |
| Institutional Shares | 27.32 | 31.60 | 0.372 | 0.000 |
| ETF Shares | 53.08 | 61.39 | 0.700 | 0.000 |
| Vanguard Value Index Fund | | | | |
| Investor Shares | $18.63 | $20.79 | $0.462 | $0.000 |
| Admiral Shares | 18.63 | 20.79 | 0.490 | 0.000 |
| Signal Shares | 19.38 | 21.63 | 0.510 | 0.000 |
| Institutional Shares | 18.63 | 20.79 | 0.498 | 0.000 |
| ETF Shares | 47.75 | 53.29 | 1.257 | 0.000 |
| Vanguard Large-Cap Index Fund | | | | |
| Investor Shares | $20.47 | $23.25 | $0.383 | $0.000 |
| Admiral Shares | 25.59 | 29.07 | 0.518 | 0.000 |
| Signal Shares | 22.32 | 25.36 | 0.452 | 0.000 |
| Institutional Shares | 105.33 | 119.65 | 2.174 | 0.000 |
| ETF Shares | 50.67 | 57.56 | 1.026 | 0.000 |
3

Chairman’s Letter
Dear Shareholder,
The first half of 2010 was marked by uncertainty about the strength of the global economic recovery and the sovereign debt crisis in Europe. As evidence of a solid economic rebound mounted, and as plans to aid struggling countries in Europe materialized, the market posted sizable gains in the second half of the year.
With global economies reviving, growth stocks outperformed value stocks for the 12 months. Vanguard Growth Index Fund returned about 17%, the Value Index Fund returned about 14%, and the Large-Cap Index Fund, which blends the two styles, fell in between. All three funds closely tracked their target indexes for the 12-month period, and all outpaced the average returns of their peer groups. (Vanguard Total Stock Market Index Fund, which was previously included in this report, now has its own report.)
Large-cap indexing strategies have the potential to be relatively tax-efficient. Despite their strong total returns, none of the Vanguard Large-Cap Index Funds distributed a capital gain in 2010. If you hold any of these funds in a taxable account, you may wish to review the after-tax returns that appear later in this report.
4
Please note that on October 6, Vanguard broadened the availability of our lower-cost Admiral Shares. We reduced the minimum investment requirement for these shares to $10,000 in most of our broad-market index funds, down from $100,000. The change is part of our ongoing efforts to lower the cost of investing for our clients.
Stocks rallied as the forecast seemed to brighten
After a series of false starts, hesitations, and retreats, global stock markets finished 2010 with powerful gains. As the prospect of a double-dip recession faded, the broad U.S. stock market clambered higher, shrugging off high unemployment and distress in Europe’s debt markets to return 17.70%. Small- and mid-capitalization stocks did even better.
Outside the United States, gains were more muted, in part because Europe’s sovereign debt challenges continued to reverberate through local stock markets. Emerging markets were the best performers. Asia’s developed markets performed weakly, though the strength of the yen, the Australian dollar, and other regional currencies bolstered returns for U.S.-based investors.
The fixed income market reprised a familiar theme
Although U.S. Treasury securities rallied through the summer, total return tables were dominated by riskier bonds for the full 12 months, a pattern we also saw in 2009. Low interest rates and a sense that the economic recovery was gathering momentum prompted investors to seek
| | | |
| Market Barometer | | | |
| |
| | | Average Annual Total Returns |
| | | Periods Ended December 31, 2010 |
| | One | Three | Five |
| | Year | Years | Years |
| Stocks | | | |
| Russell 1000 Index (Large-caps) | 16.10% | -2.37% | 2.59% |
| Russell 2000 Index (Small-caps) | 26.86 | 2.22 | 4.47 |
| Dow Jones U.S. Total Stock Market Index | 17.70 | -1.56 | 3.17 |
| MSCI All Country World Index ex USA (International) | 11.60 | -4.58 | 5.29 |
| |
| Bonds | | | |
| Barclays Capital U.S. Aggregate Bond Index (Broad | | | |
| taxable market) | 6.54% | 5.90% | 5.80% |
| Barclays Capital Municipal Bond Index (Broad | | | |
| tax-exempt market) | 2.38 | 4.08 | 4.09 |
| Citigroup Three-Month U.S. Treasury Bill Index | 0.13 | 0.69 | 2.29 |
| |
| CPI | | | |
| Consumer Price Index | 1.50% | 1.43% | 2.18% |
5
higher yields in both high-quality and below-investment-grade corporate bonds. The broad U.S. bond market returned 6.54%. Late in the year, yields bounced off summer lows, putting pressure on bond prices. The dynamic was especially pronounced among municipal bonds.
As it has since December 2008, the Fed held its target for short-term interest rates near 0%, keeping the returns available from money market instruments, such as the 3-month Treasury bill, in the same neighborhood.
The large-cap funds rallied with the markets’ return to health
Despite ongoing challenges, such as high unemployment and a weak housing market, the three Vanguard large-cap index funds posted double-digit returns, thanks in large part to the broad market rally in the second half of 2010.
Although the funds didn’t reproduce the outsized gains earned in 2009, performance was solid across the board, with strength in just about every sector. The funds recorded their big gains in consumer discretionary and industrial stocks, both of which are sensitive to turns in the business cycle.
| | | | | | |
| Expense Ratios | | | | | | |
| Your Fund Compared With Its Peer Group | | | | | | |
| | | | | | | Peer |
| | Investor | Admiral | Signal | Institutional | ETF | Group |
| | Shares | Shares | Shares | Shares | Shares | Average |
| Growth Index Fund | 0.28% | 0.14% | 0.14% | 0.08% | 0.14% | 1.37% |
| Value Index Fund | 0.26 | 0.14 | 0.14 | 0.08 | 0.14 | 1.28 |
| Large-Cap Index Fund | 0.26 | 0.12 | 0.12 | 0.08 | 0.12 | 1.27 |
The fund expense ratios shown are from the prospectus dated April 29, 2010, and represent estimated costs for the current fiscal year. For the fiscal year ended December 31, 2010, the funds’ expense ratios were: for the Growth Index Fund, 0.26% for Investor Shares, 0.12% for Admiral Shares, 0.12% for Signal Shares, 0.08% for Institutional Shares, and 0.12% for ETF Shares; for the Value Index Fund, 0.26% for Investor Shares, 0.12% for Admiral Shares, 0.12% for Signal Shares, 0.08% for Institutional Shares, and 0.12% for ETF Shares; and for the Large-Cap Index Fund, 0.26% for Investor Shares, 0.12% for Admiral Shares, 0.12% for Signal Shares, 0.08% for Institutional Shares, and 0.12% for ETF Shares. The peer-group expense ratios are derived from data provided by Lipper Inc. and capture information through year-end 2009.
Peer groups: For the Growth Index Fund, Large-Cap Growth Funds; for the Value Index Fund, Large-Cap Value Funds; for the Large-Cap Index Fund, Large-Cap Core Funds.
6
Consumer discretionary stocks contributed almost a quarter of the overall return of the Growth Index Fund—more than any other sector. The sector also made sizable, if somewhat smaller, contributions to the Large-Cap and Value Index Funds. The economic recovery and a rebound in advertising helped power strong performance by media stocks. With consumer spending showing signs of improvement, restaurants and hotels, resorts, and cruise lines also posted major gains.
Industrial stocks were a significant contributor to returns, posting a gain of 20% or more in each fund. Machinery stocks, which were hit hard in the recession, continued to benefit from the ongoing U.S. recovery. Shares of
| |
| Total Returns | |
| Ten Years Ended December 31, 2010 | |
| | Average |
| | Annual Return |
| Growth Index Fund Investor Shares | 1.30% |
| Spliced Growth Index | 1.47 |
| Large-Cap Growth Funds Average | -1.32 |
| Spliced Growth Index: S&P 500/Barra Growth Index through May 16, 2003; MSCI US Prime Market Growth Index thereafter. | |
| Large-Cap Growth Funds Average: Derived from data provided by Lipper Inc. | |
| |
| Value Index Fund Investor Shares | 1.99% |
| Spliced Value Index | 2.10 |
| Large-Cap Value Funds Average | 1.52 |
| Spliced Value Index: S&P 500/Barra Value Index through May 16, 2003; MSCI US Prime Market Value Index thereafter. | |
| Large-Cap Value Funds Average: Derived from data provided by Lipper Inc. | |
| |
| Large-Cap Index Fund Investor Shares (Returns since inception: 1/30/2004) | 4.09% |
| MSCI US Prime Market 750 Index | 4.24 |
| Large-Cap Core Funds Average | 2.54 |
| Large-Cap Core Funds Average: Derived from data provided by Lipper Inc. | |
The figures shown represent past performance, which is not a guarantee of future results. (Current performance may be lower or higher than the performance data cited. For performance data current to the most recent month-end, visit our website at vanguard.com/performance.) Note, too, that both investment returns and principal value can fluctuate widely, so an investor’s shares, when sold, could be worth more or less than their original cost.
7
companies that make and sell construction and farm machinery and heavy trucks produced outsized returns amid a boom in prices for agricultural products.
Financial stocks registered solid gains as banks, brokerages, and insurance companies continued to put some distance between the financial crisis and their financial statements. Insurance stocks, in particular, saw healthy returns. And despite a high number of bank failures during the year, commercial banks overall produced good returns as credit quality for most of the group continued to show gradual improvement. These stocks account for about one-fourth of the Value Index Fund’s assets; they have more modest allocations in the two other funds.
Recent market traumas haunt the funds’ long-term returns
Although the past year’s gains have been encouraging, we advise investors to beware of focusing too closely on short-term returns. Instead, we counsel our shareholders to adopt a longer-term perspective, which can provide a better sense of how an investment performs over time and through a variety of market environments.
Even with that patient perspective, however, there is no escaping the impact of the stunning market decline two years ago, the worst since the 1930s. As a result of that collapse, the Large-Cap Index Fund has posted a modest 4.09% average annual return since its inception in early 2004. For the Growth and Value Index Funds, which have existed longer, the record is further affected by the market plunge that followed the bursting of the tech-stock bubble in 2000. Over the past ten years, each has produced average annual returns of less than 2%. Although these numbers seem paltry, the returns of all three large-cap index funds were superior to the average returns of their peer groups.
Certainly investors have had to weather some unsettling market gyrations over the last several years. But Vanguard’s large-cap index funds have delivered on their primary objective of matching the performance of their respective benchmarks. That performance is a testament to the funds’ advisor, Vanguard Quantitative Equity Group, which has been developing its indexing expertise for more than 30 years. This group of experienced professionals uses well-honed portfolio construction and
8
trading methodologies that allow Vanguard to provide effective index-tracking fund management regardless of the market’s volatility or direction. That approach also benefits, of course, from the funds’ low operating expenses.
Diversifying: An effective response to uncertainty in investing
The ups and downs of the past year, not to mention the steep and painful declines of the recent past, have tested investors in very fundamental ways. Although many economic signs point toward a positive investing environment over the next year, it is impossible to predict when the next crisis may erupt or whether the gains of late 2010 will continue.
In the face of such uncertainty, it is more important than ever to follow a disciplined, time-tested approach to investing. That’s why Vanguard has always advocated that investors hold a diversified portfolio that includes stock, bond, and money market funds in weightings that match their risk tolerance and time horizon. Vanguard’s large-cap index funds can be a valuable component of that balanced investment portfolio.
As always, thank you for entrusting your assets to Vanguard.
Sincerely,

F. William McNabb III
Chairman and Chief Executive Officer
January 18, 2011
9
Growth Index Fund
Fund Profile
As of December 31, 2010
| | | | | |
| Share-Class Characteristics | | | | | |
| | Investor | Admiral | Signal | Institutional | ETF |
| | Shares | Shares | Shares | Shares | Shares |
| Ticker Symbol | VIGRX | VIGAX | VIGSX | VIGIX | VUG |
| Expense Ratio1 | 0.28% | 0.14% | 0.14% | 0.08% | 0.14% |
| 30-Day SEC Yield | 0.71% | 0.85% | 0.85% | 0.89% | 0.85% |
| | | |
| Portfolio Characteristics | | |
| | | MSCI US | |
| | | Prime | DJ |
| | | Market | U.S. Total |
| | | Growth | Market |
| | Fund | Index | Index |
| Number of Stocks | 432 | 429 | 3,893 |
| Median Market Cap $33.3B | $33.3B | $29.6B |
| Price/Earnings Ratio | 20.1x | 20.1x | 18.3x |
| Price/Book Ratio | 3.5x | 3.5x | 2.2x |
| Return on Equity | 23.6% | 23.3% | 18.8% |
| Earnings Growth Rate 13.0% | 13.0% | 6.2% |
| Dividend Yield | 1.1% | 1.1% | 1.7% |
| Foreign Holdings | 0.0% | 0.0% | 0.0% |
| Turnover Rate | 26% | — | — |
| Short-Term Reserves | 0.1% | — | — |
| | |
| Volatility Measures | | |
| | MSCI US | DJ |
| | Prime Market | U.S. Total |
| | Growth | Market |
| | Index | Index |
| R-Squared | 1.00 | 0.97 |
| Beta | 1.00 | 0.97 |
These measures show the degree and timing of the fund’s fluctuations compared with the indexes over 36 months.
| | |
| Ten Largest Holdings (% of total net assets) |
| Apple Inc. | Computer | |
| | Hardware | 4.7% |
| Microsoft Corp. | Systems Software | 3.5 |
| International Business | IT Consulting & | |
| Machines Corp. | Other Services | 3.0 |
| Google Inc. Class A | Internet Software & | |
| | Services | 2.3 |
| Oracle Corp. | Systems Software | 2.0 |
| Cisco Systems Inc. | Communications | |
| | Equipment | 1.8 |
| Schlumberger Ltd. | Oil & Gas | |
| | Equipment & | |
| | Services | 1.8 |
| Wal-Mart Stores Inc. | Hypermarkets & | |
| | Super Centers | 1.8 |
| Philip Morris | Tobacco | |
| International Inc. | | 1.7 |
| PepsiCo Inc. | Soft Drinks | 1.7 |
| Top Ten | | 24.3% |
The holdings listed exclude any temporary cash investments and equity index products.
1 The expense ratios shown are from the prospectus dated April 29, 2010, and represent estimated costs for the current fiscal year. For the fiscal year ended December 31, 2010, the expense ratios were 0.26% for Investor Shares, 0.12% for Admiral Shares, 0.12% for Signal Shares, 0.08% for Institutional Shares, and 0.12% for ETF Shares.
10
Growth Index Fund
| | | |
| Sector Diversification (% of equity exposure) |
| | | MSCI US | |
| | | Prime | DJ |
| | | Market | U.S. Total |
| | | Growth | Market |
| | Fund | Index | Index |
| Consumer | | | |
| Discretionary | 15.9% | 15.9% | 11.9% |
| Consumer Staples | 11.5 | 11.5 | 9.5 |
| Energy | 8.3 | 8.3 | 10.6 |
| Financials | 6.6 | 6.6 | 16.6 |
| Health Care | 10.7 | 10.7 | 10.7 |
| Industrials | 10.7 | 10.7 | 11.4 |
| Information | | | |
| Technology | 30.7 | 30.7 | 18.9 |
| Materials | 4.6 | 4.6 | 4.5 |
| Telecommunication | | | |
| Services | 0.8 | 0.8 | 2.7 |
| Utilities | 0.2 | 0.2 | 3.2 |
Investment Focus
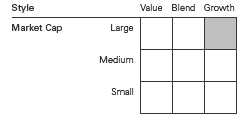
11
Growth Index Fund
Performance Summary
All of the returns in this report represent past performance, which is not a guarantee of future results that may be achieved by the fund. (Current performance may be lower or higher than the performance data cited. For performance data current to the most recent month-end, visit our website at vanguard.com/performance.) Note, too, that both investment returns and principal value can fluctuate widely, so an investor’s shares, when sold, could be worth more or less than their original cost. The returns shown do not reflect taxes that a shareholder would pay on fund distributions or on the sale of fund shares.
Cumulative Performance: December 31, 2000, Through December 31, 2010
Initial Investment of $10,000
| | | | | |
| | | Average Annual Total Returns | |
| | | Periods Ended December 31, 2010 | |
| | | | | | Final Value |
| | | One | Five | Ten | of a $10,000 |
| | | Year | Years | Years | Investment |
| | Growth Index Fund Investor Shares | 16.96% | 3.83% | 1.30% | $11,374 |
| •••••••• | Dow Jones U.S. Total Stock Market | | | | |
| | Index | 17.70 | 3.17 | 2.64 | 12,981 |
| – – – – | Spliced Growth Index | 17.23 | 4.01 | 1.47 | 11,566 |
| | Large-Cap Growth Funds Average | 14.64 | 2.28 | -1.32 | 8,755 |
Spliced Growth Index: S&P 500/Barra Growth Index through May 16, 2003; MSCI US Prime Market Growth Index thereafter.
Large-Cap Growth Funds Average: Derived from data provided by Lipper Inc.
| | | | |
| | | | | Final Value |
| | One | Five | Ten | of a $10,000 |
| | Year | Years | Years | Investment |
| Growth Index Fund Admiral Shares | 17.12% | 3.96% | 1.40% | $11,494 |
| Dow Jones U.S. Total Stock Market | | | | |
| Index | 17.70 | 3.17 | 2.64 | 12,981 |
| Spliced Growth Index | 17.23 | 4.01 | 1.47 | 11,566 |
See Financial Highlights for dividend and capital gains information.
12
Growth Index Fund
| | | |
| | Average Annual Total Returns | |
| | Periods Ended December 31, 2010 | |
| | | Since | Final Value |
| | One | Inception | of a $10,000 |
| | Year | (6/4/2007) | Investment |
| Growth Index Fund Signal Shares | 17.11% | 0.31% | $10,112 |
| Dow Jones U.S. Total Stock Market | | | |
| Index | 17.70 | -2.39 | 9,172 |
| MSCI US Prime Market Growth | | | |
| Index | 17.23 | 0.36 | 10,130 |
| "Since Inception" performance is calculated from the Signal Shares’ inception date for both the fund and its comparative standards. |
| | | | |
| | | | | Final Value |
| | One | Five | Ten | of a $5,000,000 |
| | Year | Years | Years | Investment |
| Growth Index Fund Institutional | | | | |
| Shares | 17.17% | 4.00% | 1.45% | $5,772,314 |
| Dow Jones U.S. Total Stock Market | | | | |
| Index | 17.70 | 3.17 | 2.64 | 6,490,386 |
| Spliced Growth Index | 17.23 | 4.01 | 1.47 | 5,782,923 |
| | | | |
| | | | Since | Final Value |
| | One | Five | Inception | of a $10,000 |
| | Year | Years | (1/26/2004) | Investment |
| Growth Index Fund | | | | |
| ETF Shares Net Asset Value | 17.11% | 3.95% | 3.98% | $13,106 |
| Dow Jones U.S. Total Stock Market Index | 17.70 | 3.17 | 4.30 | 13,390 |
| MSCI US Prime Market Growth Index | 17.23 | 4.01 | 4.04 | 13,155 |
| "Since Inception" performance is calculated from the ETF Shares’ inception date for both the fund and its comparative standards. |
| | | |
| Cumulative Returns of ETF Shares: January 26, 2004, Through December 31, 2010 | |
| | | | Since |
| | One | Five | Inception |
| | Year | Years | (1/26/2004) |
| Growth Index Fund | | | |
| ETF Shares Market Price | 17.15% | 21.47% | 31.11% |
| Growth Index Fund | | | |
| ETF Shares Net Asset Value | 17.11 | 21.40 | 31.06 |
| MSCI US Prime Market Growth Index | 17.23 | 21.70 | 31.55 |
| "Since Inception" performance is calculated from the ETF Shares’ inception date for both the fund and its comparative standard. | |
13
Growth Index Fund
Fiscal-Year Total Returns (%): December 31, 2000, Through December 31, 2010
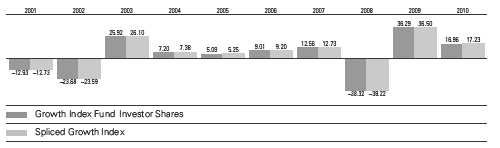
14
Growth Index Fund
Financial Statements
Statement of Net Assets
As of December 31, 2010
The fund reports a complete list of its holdings in regulatory filings four times in each fiscal year, at the quarter-ends. For the second and fourth fiscal quarters, the lists appear in the fund’s semiannual and annual reports to shareholders. For the first and third fiscal quarters, the fund files the lists with the Securities and Exchange Commission on Form N-Q. Shareholders can look up the fund’s Forms N-Q on the SEC’s website at sec.gov. Forms N-Q may also be reviewed and copied at the SEC’s Public Reference Room (see the back cover of this report for further information).
| | | |
| | | | Market |
| | | | Value |
| | | Shares | ($000) |
| Common Stocks (100.0%) | | |
| Consumer Discretionary (15.9%) | |
| | McDonald’s Corp. | 3,279,034 | 251,699 |
| * | Amazon.com Inc. | 1,103,818 | 198,687 |
| * | Ford Motor Co. | 9,339,954 | 156,818 |
| | Target Corp. | 2,111,626 | 126,972 |
| | Lowe’s Cos. Inc. | 4,323,331 | 108,429 |
| * | DIRECTV Class A | 2,670,482 | 106,632 |
| | NIKE Inc. Class B | 1,143,810 | 97,704 |
| | News Corp. Class A | 5,624,687 | 81,895 |
| | Johnson Controls Inc. | 2,074,422 | 79,243 |
| | Walt Disney Co. | 1,958,483 | 73,463 |
| | Starbucks Corp. | 2,280,250 | 73,264 |
| | Time Warner Cable Inc. | 1,095,028 | 72,305 |
| | Yum! Brands Inc. | 1,438,526 | 70,560 |
| | Carnival Corp. | 1,414,076 | 65,203 |
| * | priceline.com Inc. | 149,078 | 59,564 |
| | TJX Cos. Inc. | 1,256,978 | 55,797 |
| | Staples Inc. | 2,249,421 | 51,219 |
| | Coach Inc. | 916,293 | 50,680 |
| * | Kohl’s Corp. | 901,311 | 48,977 |
| * | Las Vegas Sands Corp. | 1,017,927 | 46,774 |
| | Omnicom Group Inc. | 928,386 | 42,520 |
| * | Bed Bath & Beyond Inc. | 812,685 | 39,944 |
| | Best Buy Co. Inc. | 1,091,927 | 37,442 |
| | Marriott International Inc. | | |
| | Class A | 894,323 | 37,150 |
| | CBS Corp. Class B | 1,939,695 | 36,951 |
| | Starwood Hotels & | | |
| | Resorts Worldwide Inc. | 585,844 | 35,608 |
| | McGraw-Hill Cos. Inc. | 951,911 | 34,659 |
| | Gap Inc. | 1,402,501 | 31,051 |
| | Virgin Media Inc. | 971,006 | 26,450 |
| | Cablevision Systems Corp. | | |
| | Class A | 771,225 | 26,098 |
| * | O’Reilly Automotive Inc. | 427,540 | 25,832 |
| | Wynn Resorts Ltd. | 247,369 | 25,687 |
| * | BorgWarner Inc. | 351,212 | 25,414 |
| | | |
| | | | Market |
| | | | Value |
| | | Shares | ($000) |
| | Harley-Davidson Inc. | 725,204 | 25,143 |
| | Tiffany & Co. | 391,714 | 24,392 |
| * | NetFlix Inc. | 137,052 | 24,080 |
| | Ross Stores Inc. | 376,100 | 23,788 |
| | Viacom Inc. Class B | 599,739 | 23,756 |
| * | AutoZone Inc. | 86,898 | 23,688 |
| | Comcast Corp. Class A | | |
| | Special Shares | 1,121,857 | 23,346 |
| | Nordstrom Inc. | 539,988 | 22,885 |
| | Polo Ralph Lauren Corp. | | |
| | Class A | 200,380 | 22,226 |
| | News Corp. Class B | 1,353,080 | 22,218 |
| * | CarMax Inc. | 689,268 | 21,974 |
| * | Dollar Tree Inc. | 391,091 | 21,932 |
| * | Chipotle Mexican Grill Inc. | | |
| | Class A | 95,840 | 20,381 |
| * | Sirius XM Radio Inc. | 11,980,365 | 19,648 |
| | Family Dollar Stores Inc. | 388,170 | 19,296 |
| * | Discovery | | |
| | Communications Inc. | | |
| | Class A | 419,849 | 17,508 |
| | Advance Auto Parts Inc. | 259,519 | 17,167 |
| | International Game | | |
| | Technology | 918,336 | 16,245 |
| * | Apollo Group Inc. Class A | 407,649 | 16,098 |
| * | Discovery | | |
| | Communications Inc. | 436,670 | 16,021 |
| | Expedia Inc. | 637,983 | 16,007 |
| * | Interpublic Group of | | |
| | Cos. Inc. | 1,505,906 | 15,993 |
| | Abercrombie & Fitch Co. | 271,690 | 15,658 |
| * | MGM Resorts | | |
| | International | 1,040,567 | 15,452 |
| * | Urban Outfitters Inc. | 414,266 | 14,835 |
| | PetSmart Inc. | 365,037 | 14,536 |
| | Scripps Networks | | |
| | Interactive Inc. Class A | 280,460 | 14,514 |
| | Autoliv Inc. | 177,248 | 13,992 |
15
Growth Index Fund
| | | |
| | | | Market |
| | | | Value |
| | | Shares | ($000) |
| * | Liberty Media Corp. - | | |
| | Capital | 222,160 | 13,898 |
| * | Liberty Global Inc. | 395,533 | 13,405 |
| * | Fossil Inc. | 165,441 | 11,660 |
| * | TRW Automotive | | |
| | Holdings Corp. | 207,238 | 10,921 |
| *,^ | Liberty Global Inc. Class A | 308,362 | 10,910 |
| * | Dick’s Sporting Goods Inc. | 279,866 | 10,495 |
| * | Liberty Media Corp. - Starz | 150,736 | 10,021 |
| * | Lear Corp. | 99,045 | 9,777 |
| * | Dollar General Corp. | 315,339 | 9,672 |
| * | LKQ Corp. | 419,032 | 9,520 |
| | DeVry Inc. | 196,066 | 9,407 |
| | Guess? Inc. | 186,630 | 8,831 |
| * | Goodyear Tire & Rubber Co. | 711,159 | 8,427 |
| | Phillips-Van Heusen Corp. | 132,819 | 8,369 |
| * | Royal Caribbean Cruises Ltd. | 150,786 | 7,087 |
| * | ITT Educational Services Inc. | 103,350 | 6,582 |
| ^ | Strayer Education Inc. | 42,759 | 6,509 |
| * | NVR Inc. | 8,576 | 5,926 |
| * | Harman International | | |
| | Industries Inc. | 107,335 | 4,970 |
| * | Lamar Advertising Co. | | |
| | Class A | 115,825 | 4,615 |
| * | DISH Network Corp. | | |
| | Class A | 226,203 | 4,447 |
| | American Eagle | | |
| | Outfitters Inc. | 286,758 | 4,195 |
| * | Hyatt Hotels Corp. Class A | 88,075 | 4,030 |
| | CTC Media Inc. | 168,490 | 3,948 |
| * | Penn National Gaming Inc. | 102,232 | 3,594 |
| *,^ | Sears Holdings Corp. | 47,838 | 3,528 |
| | Wendy’s/Arby’s Group Inc. | | |
| | Class A | 670,968 | 3,100 |
| * | Toll Brothers Inc. | 152,182 | 2,892 |
| * | Clear Channel Outdoor | | |
| | Holdings Inc. Class A | 82,287 | 1,155 |
| * | Krispy Kreme | | |
| | Doughnuts Inc. | | |
| | Warrants Exp. 03/02/2012 | 3,500 | 1 |
| | | | 3,055,362 |
| Consumer Staples (11.5%) | | |
| | Wal-Mart Stores Inc. | 6,285,847 | 338,996 |
| | Philip Morris | | |
| | International Inc. | 5,644,970 | 330,400 |
| | PepsiCo Inc. | 4,901,385 | 320,207 |
| | Coca-Cola Co. | 4,162,344 | 273,757 |
| | Colgate-Palmolive Co. | 1,497,289 | 120,337 |
| | Walgreen Co. | 2,998,247 | 116,812 |
| | Costco Wholesale Corp. | 1,352,941 | 97,696 |
| | Kimberly-Clark Corp. | 1,260,822 | 79,482 |
| | General Mills Inc. | 1,978,622 | 70,419 |
| | Sysco Corp. | 1,812,774 | 53,295 |
| | | |
| | | | Market |
| | | | Value |
| | | Shares | ($000) |
| | Kroger Co. | 1,879,295 | 42,021 |
| | Kellogg Co. | 814,716 | 41,616 |
| | Mead Johnson | | |
| | Nutrition Co. | 630,211 | 39,231 |
| | Avon Products Inc. | 1,321,570 | 38,405 |
| | Estee Lauder Cos. Inc. | | |
| | Class A | 350,574 | 28,291 |
| | Clorox Co. | 428,081 | 27,089 |
| | HJ Heinz Co. | 490,164 | 24,243 |
| | Hershey Co. | 487,012 | 22,963 |
| * | Whole Foods Market Inc. | 450,153 | 22,773 |
| * | Energizer Holdings Inc. | 205,440 | 14,977 |
| | Campbell Soup Co. | 407,876 | 14,174 |
| | Dr Pepper Snapple | | |
| | Group Inc. | 368,055 | 12,941 |
| | Herbalife Ltd. | 182,398 | 12,470 |
| * | Hansen Natural Corp. | 230,930 | 12,073 |
| | Sara Lee Corp. | 678,569 | 11,882 |
| * | Green Mountain Coffee | | |
| | Roasters Inc. | 345,630 | 11,357 |
| | Brown-Forman Corp. | | |
| | Class B | 162,996 | 11,348 |
| | Alberto-Culver Co. Class B | 273,609 | 10,134 |
| | Flowers Foods Inc. | 254,835 | 6,858 |
| | Hormel Foods Corp. | 78,904 | 4,045 |
| | | | 2,210,292 |
| Energy (8.3%) | | |
| | Schlumberger Ltd. | 4,209,659 | 351,507 |
| | Anadarko Petroleum Corp. | 1,524,853 | 116,133 |
| | Halliburton Co. | 2,810,880 | 114,768 |
| | Baker Hughes Inc. | 1,328,181 | 75,932 |
| | Hess Corp. | 934,551 | 71,531 |
| | EOG Resources Inc. | 780,999 | 71,391 |
| | Peabody Energy Corp. | 829,368 | 53,063 |
| * | Weatherford | | |
| | International Ltd. | 2,283,066 | 52,054 |
| | National Oilwell Varco Inc. | 645,582 | 43,415 |
| | Murphy Oil Corp. | 561,419 | 41,854 |
| * | Southwestern Energy Co. | 1,066,307 | 39,912 |
| * | Cameron | | |
| | International Corp. | 746,259 | 37,858 |
| | Consol Energy Inc. | 695,699 | 33,908 |
| * | FMC Technologies Inc. | 369,569 | 32,858 |
| | Pioneer Natural | | |
| | Resources Co. | 357,222 | 31,014 |
| * | Concho Resources Inc. | 268,771 | 23,563 |
| * | Ultra Petroleum Corp. | 469,571 | 22,431 |
| * | Alpha Natural | | |
| | Resources Inc. | 370,820 | 22,260 |
| | Range Resources Corp. | 492,970 | 22,174 |
| | QEP Resources Inc. | 539,559 | 19,591 |
| | EQT Corp. | 436,450 | 19,570 |
| * | Whiting Petroleum Corp. | 157,114 | 18,412 |
16
Growth Index Fund
| | | | |
| | | | | Market |
| | | | | Value |
| | | | Shares | ($000) |
| | Arch Coal Inc. | | 500,558 | 17,550 |
| * | Petrohawk Energy Corp. | 931,440 | 16,999 |
| | Noble Energy Inc. | | 188,450 | 16,222 |
| | Massey Energy Co. | | 298,841 | 16,033 |
| | Helmerich & Payne Inc. | 325,982 | 15,804 |
| | Sunoco Inc. | | 371,428 | 14,972 |
| | El Paso Corp. | | 1,084,371 | 14,921 |
| * | Newfield Exploration Co. | 205,837 | 14,843 |
| * | McDermott | | | |
| | International Inc. | | 715,501 | 14,804 |
| | Diamond Offshore | | | |
| | Drilling Inc. | | 214,185 | 14,323 |
| * | Nabors Industries Ltd. | 571,364 | 13,404 |
| * | Oceaneering | | | |
| | International Inc. | | 166,810 | 12,282 |
| | Core Laboratories NV | 137,676 | 12,260 |
| | Cabot Oil & Gas Corp. | 320,841 | 12,144 |
| | EXCO Resources Inc. | 556,960 | 10,816 |
| * | Dresser-Rand Group Inc. | 249,420 | 10,623 |
| | Noble Corp. | | 275,915 | 9,869 |
| * | Kinder Morgan | | | |
| | Management LLC | | 125,146 | 8,370 |
| * | Forest Oil Corp. | | 215,631 | 8,187 |
| * | Denbury Resources Inc. | 409,093 | 7,810 |
| * | Continental Resources Inc. | 104,692 | 6,161 |
| * | Quicksilver Resources Inc. | 367,406 | 5,416 |
| * | Cobalt International | | | |
| | Energy Inc. | | 275,089 | 3,359 |
| | | | | 1,592,371 |
| Financials (6.6%) | | | |
| * | Citigroup Inc. | 44,749,137 | 211,663 |
| | American Express Co. | 3,336,226 | 143,191 |
| * | Berkshire Hathaway Inc. | | |
| | Class B | | 922,669 | 73,915 |
| | State Street Corp. | | 1,546,242 | 71,653 |
| | CME Group Inc. | | 207,083 | 66,629 |
| | Simon Property Group Inc. | 586,468 | 58,348 |
| | Franklin Resources Inc. | 485,919 | 54,039 |
| | Charles Schwab Corp. | 3,126,514 | 53,495 |
| | T Rowe Price Group Inc. | 789,801 | 50,974 |
| | Public Storage | | 445,568 | 45,189 |
| | Aflac Inc. | | 725,280 | 40,927 |
| | Northern Trust Corp. | | 671,367 | 37,200 |
| | Host Hotels & | | | |
| | Resorts Inc. | | 2,041,097 | 36,474 |
| | Discover | | | |
| | Financial Services | | 1,675,403 | 31,045 |
| * | CIT Group Inc. | | 585,801 | 27,591 |
| * | Intercontinental- | | | |
| | Exchange Inc. | | 193,913 | 23,105 |
| | SunTrust Banks Inc. | | 770,069 | 22,725 |
| * | CB Richard Ellis Group Inc. | | |
| | Class A | | 892,183 | 18,272 |
| | | |
| | | | Market |
| | | | Value |
| | | Shares | ($000) |
| | Moody’s Corp. | 613,495 | 16,282 |
| | Equity Residential | 305,636 | 15,878 |
| * | Affiliated Managers | | |
| | Group Inc. | 157,333 | 15,611 |
| | Ameriprise Financial Inc. | 270,511 | 15,568 |
| | AvalonBay | | |
| | Communities Inc. | 131,207 | 14,767 |
| | Progressive Corp. | 683,848 | 13,588 |
| * | MSCI Inc. Class A | 347,679 | 13,546 |
| | TD Ameritrade | | |
| | Holding Corp. | 710,053 | 13,484 |
| | Boston Properties Inc. | 150,102 | 12,924 |
| | Jones Lang LaSalle Inc. | 131,376 | 11,025 |
| | Eaton Vance Corp. | 363,996 | 11,004 |
| | SEI Investments Co. | 406,411 | 9,668 |
| | Brown & Brown Inc. | 372,412 | 8,915 |
| | Janus Capital Group Inc. | 565,645 | 7,336 |
| | Greenhill & Co. Inc. | 77,146 | 6,301 |
| *,^ | St. Joe Co. | 285,612 | 6,241 |
| | Digital Realty Trust Inc. | 94,074 | 4,849 |
| | Alexandria Real Estate | | |
| | Equities Inc. | 58,321 | 4,273 |
| | Duke Realty Corp. | 271,925 | 3,388 |
| * | First Horizon National Corp. | 281,928 | 3,321 |
| | TFS Financial Corp. | 285,671 | 2,577 |
| ^ | CBOE Holdings Inc. | 39,665 | 907 |
| | AON Corp. | 1 | — |
| | | | 1,277,888 |
| Health Care (10.7%) | | |
| | Abbott Laboratories | 4,755,374 | 227,830 |
| | Medtronic Inc. | 3,336,487 | 123,750 |
| * | Amgen Inc. | 1,919,476 | 105,379 |
| * | Gilead Sciences Inc. | 2,583,724 | 93,634 |
| | Baxter International Inc. | 1,799,691 | 91,100 |
| * | Express Scripts Inc. | 1,587,628 | 85,811 |
| * | Celgene Corp. | 1,448,223 | 85,648 |
| * | Medco Health | | |
| | Solutions Inc. | 1,336,082 | 81,862 |
| * | Thermo Fisher | | |
| | Scientific Inc. | 1,255,307 | 69,494 |
| | Allergan Inc. | 947,425 | 65,060 |
| | Becton Dickinson and Co. | 715,267 | 60,454 |
| | McKesson Corp. | 805,561 | 56,695 |
| * | Genzyme Corp. | 785,206 | 55,907 |
| * | Biogen Idec Inc. | 745,356 | 49,976 |
| | Stryker Corp. | 917,243 | 49,256 |
| * | Agilent Technologies Inc. | 1,072,426 | 44,431 |
| * | St. Jude Medical Inc. | 1,038,918 | 44,414 |
| * | Zimmer Holdings Inc. | 618,893 | 33,222 |
| * | Life Technologies Corp. | 564,532 | 31,332 |
| * | Intuitive Surgical Inc. | 121,188 | 31,236 |
| | AmerisourceBergen Corp. | | |
| | Class A | 858,633 | 29,297 |
17
Growth Index Fund
| | | |
| | | | Market |
| | | | Value |
| | | Shares | ($000) |
| * | Hospira Inc. | 515,258 | 28,695 |
| * | Edwards Lifesciences Corp. | 349,077 | 28,219 |
| * | Laboratory Corp. of | | |
| | America Holdings | 316,824 | 27,855 |
| | CR Bard Inc. | 288,545 | 26,480 |
| * | Varian Medical | | |
| | Systems Inc. | 374,502 | 25,945 |
| | Quest Diagnostics Inc. | 463,860 | 25,035 |
| * | Illumina Inc. | 382,723 | 24,242 |
| * | Alexion | | |
| | Pharmaceuticals Inc. | 277,786 | 22,376 |
| * | Waters Corp. | 283,561 | 22,036 |
| * | DaVita Inc. | 316,011 | 21,960 |
| * | Vertex | | |
| | Pharmaceuticals Inc. | 624,573 | 21,879 |
| * | Watson | | |
| | Pharmaceuticals Inc. | 408,160 | 21,081 |
| * | Cerner Corp. | 215,960 | 20,460 |
| * | Mylan Inc. | 953,077 | 20,139 |
| * | Henry Schein Inc. | 281,881 | 17,305 |
| * | ResMed Inc. | 466,273 | 16,152 |
| | Perrigo Co. | 254,137 | 16,094 |
| * | Mettler-Toledo | | |
| | International Inc. | 102,908 | 15,561 |
| * | Dendreon Corp. | 443,526 | 15,488 |
| | DENTSPLY | | |
| | International Inc. | 418,148 | 14,288 |
| * | Human Genome | | |
| | Sciences Inc. | 579,577 | 13,846 |
| * | IDEXX Laboratories Inc. | 177,634 | 12,296 |
| * | Covance Inc. | 199,463 | 10,254 |
| * | CareFusion Corp. | 342,585 | 8,804 |
| | Patterson Cos. Inc. | 286,493 | 8,775 |
| * | Gen-Probe Inc. | 149,950 | 8,750 |
| * | Cephalon Inc. | 115,763 | 7,145 |
| | Techne Corp. | 108,276 | 7,110 |
| * | Myriad Genetics Inc. | 289,676 | 6,616 |
| * | Amylin | | |
| | Pharmaceuticals Inc. | 442,631 | 6,511 |
| * | Bio-Rad Laboratories Inc. | | |
| | Class A | 59,114 | 6,139 |
| * | Community Health | | |
| | Systems Inc. | 145,665 | 5,443 |
| | Warner Chilcott plc Class A | 227,225 | 5,126 |
| * | Endo Pharmaceuticals | | |
| | Holdings Inc. | 124,403 | 4,442 |
| | Lincare Holdings Inc. | 105,852 | 2,840 |
| | Valeant Pharmaceuticals | | |
| | International Inc. | 1 | — |
| | | | 2,061,175 |
| | | |
| | | | Market |
| | | | Value |
| | | Shares | ($000) |
| Industrials (10.7%) | | |
| | Caterpillar Inc. | 1,942,399 | 181,925 |
| | United Parcel Service Inc. | | |
| | Class B | 2,233,690 | 162,121 |
| | Union Pacific Corp. | 1,532,995 | 142,047 |
| | Emerson Electric Co. | 2,318,053 | 132,523 |
| | Deere & Co. | 1,305,866 | 108,452 |
| | Boeing Co. | 1,391,991 | 90,841 |
| | FedEx Corp. | 920,829 | 85,646 |
| | Danaher Corp. | 1,709,136 | 80,620 |
| | Norfolk Southern Corp. | 1,135,680 | 71,343 |
| | Cummins Inc. | 581,855 | 64,010 |
| | Precision Castparts Corp. | 438,038 | 60,979 |
| | PACCAR Inc. | 1,010,804 | 58,040 |
| | Honeywell | | |
| | International Inc. | 790,699 | 42,034 |
| | CH Robinson | | |
| | Worldwide Inc. | 510,786 | 40,960 |
| | Fluor Corp. | 550,794 | 36,496 |
| | Expeditors International of | | |
| | Washington Inc. | 653,763 | 35,695 |
| | Republic Services Inc. | | |
| | Class A | 1,179,493 | 35,220 |
| * | Delta Air Lines Inc. | 2,429,307 | 30,609 |
| | Rockwell Collins Inc. | 484,088 | 28,203 |
| | ITT Corp. | 536,534 | 27,959 |
| | Joy Global Inc. | 317,844 | 27,573 |
| | WW Grainger Inc. | 185,791 | 25,660 |
| | Fastenal Co. | 408,797 | 24,491 |
| | Ingersoll-Rand plc | 497,269 | 23,416 |
| | Roper Industries Inc. | 290,102 | 22,172 |
| | Parker Hannifin Corp. | 248,278 | 21,426 |
| | Bucyrus International Inc. | | |
| | Class A | 237,094 | 21,196 |
| | Flowserve Corp. | 172,384 | 20,552 |
| * | Stericycle Inc. | 249,638 | 20,201 |
| | Textron Inc. | 844,759 | 19,970 |
| | AMETEK Inc. | 492,337 | 19,324 |
| * | Jacobs Engineering | | |
| | Group Inc. | 387,434 | 17,764 |
| | Rockwell Automation Inc. | 218,375 | 15,660 |
| * | Kansas City Southern | 316,020 | 15,125 |
| | Southwest Airlines Co. | 1,148,985 | 14,914 |
| * | AGCO Corp. | 286,621 | 14,520 |
| | Iron Mountain Inc. | 558,668 | 13,972 |
| * | Foster Wheeler AG | 392,769 | 13,558 |
| | Robert Half | | |
| | International Inc. | 431,751 | 13,212 |
| | Donaldson Co. Inc. | 223,478 | 13,024 |
| * | Quanta Services Inc. | 648,338 | 12,915 |
| | Dun & Bradstreet Corp. | 154,045 | 12,645 |
18
Growth Index Fund
| | | |
| | | | Market |
| | | | Value |
| | | Shares | ($000) |
| * | Verisk Analytics Inc. | | |
| | Class A | 348,158 | 11,865 |
| | JB Hunt Transport | | |
| | Services Inc. | 284,923 | 11,628 |
| * | Navistar International Corp. | 198,372 | 11,488 |
| * | IHS Inc. Class A | 128,353 | 10,318 |
| * | Babcock & Wilcox Co. | 358,093 | 9,164 |
| | Pall Corp. | 179,752 | 8,912 |
| * | Shaw Group Inc. | 260,092 | 8,903 |
| | MSC Industrial Direct Co. | | |
| | Class A | 137,372 | 8,887 |
| * | Copart Inc. | 220,875 | 8,250 |
| | Manpower Inc. | 126,642 | 7,948 |
| * | Alliant Techsystems Inc. | 102,201 | 7,607 |
| | Covanta Holding Corp. | 407,783 | 7,010 |
| * | Spirit Aerosystems | | |
| | Holdings Inc. Class A | 329,111 | 6,849 |
| * | Sensata Technologies | | |
| | Holding NV | 186,934 | 5,629 |
| | SPX Corp. | 76,971 | 5,503 |
| * | FTI Consulting Inc. | 144,179 | 5,375 |
| * | Terex Corp. | 167,358 | 5,195 |
| * | Owens Corning | 124,835 | 3,889 |
| * | Hertz Global Holdings Inc. | 244,932 | 3,549 |
| | | | 2,066,982 |
| Information Technology (30.7%) | |
| * | Apple Inc. | 2,814,500 | 907,845 |
| | Microsoft Corp. | 23,993,953 | 669,911 |
| | International Business | | |
| | Machines Corp. | 3,885,815 | 570,282 |
| * | Google Inc. Class A | 759,312 | 451,009 |
| | Oracle Corp. | 12,387,962 | 387,743 |
| * | Cisco Systems Inc. | 17,594,949 | 355,946 |
| | QUALCOMM Inc. | 4,945,397 | 244,748 |
| | Hewlett-Packard Co. | 3,596,132 | 151,397 |
| * | EMC Corp. | 6,326,627 | 144,880 |
| | Texas Instruments Inc. | 3,682,273 | 119,674 |
| | Visa Inc. Class A | 1,529,866 | 107,672 |
| * | eBay Inc. | 3,638,354 | 101,255 |
| | Accenture plc Class A | 1,963,369 | 95,204 |
| | Mastercard Inc. Class A | 329,509 | 73,846 |
| * | Cognizant Technology | | |
| | Solutions Corp. Class A | 927,039 | 67,943 |
| * | NetApp Inc. | 1,100,152 | 60,464 |
| | Broadcom Corp. Class A | 1,381,179 | 60,150 |
| * | Juniper Networks Inc. | 1,601,834 | 59,140 |
| * | Adobe Systems Inc. | 1,618,258 | 49,810 |
| | Tyco Electronics Ltd. | 1,377,156 | 48,751 |
| * | Salesforce.com Inc. | 356,888 | 47,109 |
| * | Intuit Inc. | 919,391 | 45,326 |
| * | Yahoo! Inc. | 2,565,096 | 42,658 |
| * | Symantec Corp. | 2,431,927 | 40,710 |
| | | |
| | | | Market |
| | | | Value |
| | | Shares | ($000) |
| * | Citrix Systems Inc. | 575,974 | 39,402 |
| | Western Union Co. | 2,032,940 | 37,752 |
| * | Dell Inc. | 2,695,088 | 36,518 |
| * | SanDisk Corp. | 718,129 | 35,806 |
| | Automatic Data | | |
| | Processing Inc. | 757,599 | 35,062 |
| | Analog Devices Inc. | 917,985 | 34,581 |
| | Altera Corp. | 946,135 | 33,663 |
| * | F5 Networks Inc. | 247,959 | 32,274 |
| * | Marvell Technology | | |
| | Group Ltd. | 1,701,445 | 31,562 |
| | CA Inc. | 1,271,171 | 31,067 |
| | Amphenol Corp. Class A | 534,988 | 28,237 |
| * | Fiserv Inc. | 462,365 | 27,076 |
| * | Autodesk Inc. | 699,863 | 26,735 |
| * | Red Hat Inc. | 581,847 | 26,561 |
| * | Akamai Technologies Inc. | 559,261 | 26,313 |
| * | BMC Software Inc. | 550,023 | 25,928 |
| | Linear Technology Corp. | 691,204 | 23,909 |
| *,^ | First Solar Inc. | 171,292 | 22,292 |
| * | McAfee Inc. | 468,497 | 21,696 |
| * | Motorola Inc. | 2,389,792 | 21,675 |
| * | Teradata Corp. | 515,354 | 21,212 |
| | Activision Blizzard Inc. | 1,697,452 | 21,116 |
| * | Cree Inc. | 316,191 | 20,834 |
| * | VMware Inc. Class A | 223,931 | 19,910 |
| * | Rovi Corp. | 317,771 | 19,705 |
| * | NVIDIA Corp. | 1,149,384 | 17,701 |
| | VeriSign Inc. | 536,428 | 17,525 |
| * | Atmel Corp. | 1,421,853 | 17,517 |
| * | Skyworks Solutions Inc. | 550,257 | 15,754 |
| * | Trimble Navigation Ltd. | 366,909 | 14,651 |
| * | ANSYS Inc. | 278,659 | 14,510 |
| * | FLIR Systems Inc. | 487,216 | 14,495 |
| * | Nuance | | |
| | Communications Inc. | 724,292 | 13,168 |
| * | ON Semiconductor Corp. | 1,328,593 | 13,127 |
| | Factset Research | | |
| | Systems Inc. | 135,628 | 12,716 |
| * | Western Digital Corp. | 353,009 | 11,967 |
| | Avago Technologies Ltd. | 406,394 | 11,570 |
| | Xilinx Inc. | 398,784 | 11,557 |
| * | Alliance Data Systems Corp. | 162,132 | 11,516 |
| * | Equinix Inc. | 140,407 | 11,409 |
| | Global Payments Inc. | 245,563 | 11,347 |
| * | Dolby Laboratories Inc. | | |
| | Class A | 163,705 | 10,919 |
| | Paychex Inc. | 350,802 | 10,843 |
| * | Electronic Arts Inc. | 661,590 | 10,837 |
| | Broadridge Financial | | |
| | Solutions Inc. | 390,451 | 8,563 |
19
Growth Index Fund
| | | |
| | | | Market |
| | | | Value |
| | | Shares | ($000) |
| * | MEMC Electronic | | |
| | Materials Inc. | 700,699 | 7,890 |
| * | Brocade Communications | | |
| | Systems Inc. | 1,368,639 | 7,240 |
| * | Lam Research Corp. | 133,837 | 6,930 |
| * | Advanced Micro | | |
| | Devices Inc. | 618,040 | 5,056 |
| * | Genpact Ltd. | 303,876 | 4,619 |
| | Lender Processing | | |
| | Services Inc. | 143,655 | 4,241 |
| | DST Systems Inc. | 57,474 | 2,549 |
| | | | 5,904,576 |
| Materials (4.6%) | | |
| | Freeport-McMoRan | | |
| | Copper & Gold Inc. | 1,449,351 | 174,053 |
| | Monsanto Co. | 1,665,117 | 115,959 |
| | Newmont Mining Corp. | 1,517,009 | 93,190 |
| | Praxair Inc. | 942,586 | 89,989 |
| | Air Products & | | |
| | Chemicals Inc. | 654,559 | 59,532 |
| | Alcoa Inc. | 3,146,338 | 48,422 |
| | Mosaic Co. | 480,531 | 36,693 |
| | Ecolab Inc. | 718,474 | 36,225 |
| | CF Industries Holdings Inc. | 219,061 | 29,606 |
| | Sigma-Aldrich Corp. | 373,713 | 24,874 |
| | Sherwin-Williams Co. | 284,869 | 23,858 |
| | Lubrizol Corp. | 207,994 | 22,230 |
| | Celanese Corp. Class A | 480,793 | 19,794 |
| | Ball Corp. | 268,095 | 18,244 |
| | United States Steel Corp. | 287,451 | 16,793 |
| * | Crown Holdings Inc. | 499,501 | 16,673 |
| | Allegheny Technologies Inc. | 273,136 | 15,072 |
| | Nucor Corp. | 340,196 | 14,907 |
| | Nalco Holding Co. | 425,939 | 13,605 |
| | Scotts Miracle-Gro Co. | | |
| | Class A | 144,378 | 7,330 |
| | FMC Corp. | 74,350 | 5,940 |
| | Martin Marietta Materials Inc. | 49,087 | 4,528 |
| * | Titanium Metals Corp. | 180,819 | 3,107 |
| | | | 890,624 |
| | | |
| | | | Market |
| | | | Value |
| | | Shares | ($000) |
| Telecommunication Services (0.8%) | |
| * | American Tower Corp. | | |
| | Class A | 1,235,941 | 63,824 |
| * | Crown Castle | | |
| | International Corp. | 894,009 | 39,184 |
| * | NII Holdings Inc. | 518,638 | 23,162 |
| * | SBA Communications Corp. | |
| | Class A | 335,426 | 13,732 |
| * | MetroPCS | | |
| | Communications Inc. | 763,376 | 9,642 |
| *,^ | Clearwire Corp. Class A | 291,374 | 1,501 |
| | | | 151,045 |
| Utilities (0.2%) | | |
| * | AES Corp. | 2,078,434 | 25,315 |
| * | Calpine Corp. | 1,095,709 | 14,617 |
| | | | 39,932 |
| Total Common Stocks | | |
| (Cost $15,054,124) | | 19,250,247 |
| Temporary Cash Investment (0.2%) | |
| Money Market Fund (0.2%) | | |
| 1,2 | Vanguard Market | | |
| | Liquidity Fund, 0.211% | | |
| | (Cost $42,213) | 42,213,248 | 42,213 |
| Total Investments (100.2%) | | |
| (Cost $15,096,337) | | 19,292,460 |
| Other Assets and Liabilities (-0.2%) | |
| Other Assets | | 45,003 |
| Liabilities2 | | (91,198) |
| | | | (46,195) |
| Net Assets (100%) | | 19,246,265 |
20
Growth Index Fund
| |
| At December 31, 2010, net assets consisted of: |
| | Amount |
| | ($000) |
| Paid-in Capital | 16,821,392 |
| Overdistributed Net Investment Income | (29,586) |
| Accumulated Net Realized Losses | (1,741,664) |
| Unrealized Appreciation (Depreciation) | 4,196,123 |
| Net Assets | 19,246,265 |
| |
| Investor Shares—Net Assets | |
| Applicable to 121,608,653 outstanding | |
| $.001 par value shares of beneficial | |
| interest (unlimited authorization) | 3,842,780 |
| Net Asset Value Per Share— | |
| Investor Shares | $31.60 |
| |
| Admiral Shares—Net Assets | |
| Applicable to 149,118,945 outstanding | |
| $.001 par value shares of beneficial | |
| interest (unlimited authorization) | 4,712,424 |
| Net Asset Value Per Share— | |
| Admiral Shares | $31.60 |
| |
| | Amount |
| | ($000) |
| Signal Shares—Net Assets | |
| Applicable to 56,661,988 outstanding | |
| $.001 par value shares of beneficial | |
| interest (unlimited authorization) | 1,658,086 |
| Net Asset Value Per Share— | |
| Signal Shares | $29.26 |
| |
| Institutional Shares—Net Assets | |
| Applicable to 124,474,140 outstanding | |
| $.001 par value shares of beneficial | |
| interest (unlimited authorization) | 3,933,521 |
| Net Asset Value Per Share— | |
| Institutional Shares | $31.60 |
| |
| ETF Shares—Net Assets | |
| Applicable to 83,061,346 outstanding | |
| $.001 par value shares of beneficial | |
| interest (unlimited authorization) | 5,099,454 |
| Net Asset Value Per Share— | |
| ETF Shares | $61.39 |
See Note A in Notes to Financial Statements.
* Non-income-producing security.
^ Part of security position is on loan to broker-dealers. The total value of securities on loan is $27,718,000.
1 Affiliated money market fund available only to Vanguard funds and certain trusts and accounts managed by Vanguard. Rate shown is the 7-day yield.
2 Includes $28,765,000 of collateral received for securities on loan.
See accompanying Notes, which are an integral part of the Financial Statements.
21
Growth Index Fund
| |
| Statement of Operations | |
| |
| | Year Ended |
| | December 31, 2010 |
| | ($000) |
| Investment Income | |
| Income | |
| Dividends | 228,699 |
| Interest1 | 55 |
| Security Lending | 1,913 |
| Total Income | 230,667 |
| Expenses | |
| The Vanguard Group—Note B | |
| Investment Advisory Services | 914 |
| Management and Administrative—Investor Shares | 12,344 |
| Management and Administrative—Admiral Shares | 1,991 |
| Management and Administrative—Signal Shares | 1,246 |
| Management and Administrative—Institutional Shares | 1,498 |
| Management and Administrative—ETF Shares | 3,511 |
| Marketing and Distribution—Investor Shares | 1,409 |
| Marketing and Distribution—Admiral Shares | 307 |
| Marketing and Distribution—Signal Shares | 416 |
| Marketing and Distribution—Institutional Shares | 899 |
| Marketing and Distribution—ETF Shares | 1,145 |
| Custodian Fees | 144 |
| Auditing Fees | 28 |
| Shareholders’ Reports—Investor Shares | 179 |
| Shareholders’ Reports—Admiral Shares | 13 |
| Shareholders’ Reports—Signal Shares | 17 |
| Shareholders’ Reports—Institutional Shares | 35 |
| Shareholders’ Reports—ETF Shares | 141 |
| Trustees’ Fees and Expenses | 27 |
| Total Expenses | 26,264 |
| Net Investment Income | 204,403 |
| Realized Net Gain (Loss) on Investment Securities Sold | 533,992 |
| Change in Unrealized Appreciation (Depreciation) of Investment Securities | 2,021,272 |
| Net Increase (Decrease) in Net Assets Resulting from Operations | 2,759,667 |
| 1 Interest income from an affiliated company of the fund was $55,000. | |
See accompanying Notes, which are an integral part of the Financial Statements.
22
Growth Index Fund
| | |
| Statement of Changes in Net Assets | | |
| |
| | Year Ended December 31, |
| | 2010 | 2009 |
| | ($000) | ($000) |
| Increase (Decrease) in Net Assets | | |
| Operations | | |
| Net Investment Income | 204,403 | 168,420 |
| Realized Net Gain (Loss) | 533,992 | 199,009 |
| Change in Unrealized Appreciation (Depreciation) | 2,021,272 | 3,794,205 |
| Net Increase (Decrease) in Net Assets Resulting from Operations | 2,759,667 | 4,161,634 |
| Distributions | | |
| Net Investment Income | | |
| Investor Shares | (58,021) | (59,216) |
| Admiral Shares | (30,848) | (19,327) |
| Signal Shares | (19,042) | (15,471) |
| Institutional Shares | (44,551) | (34,330) |
| ETF Shares | (55,120) | (44,628) |
| Realized Capital Gain | | |
| Investor Shares | — | — |
| Admiral Shares | — | — |
| Signal Shares | — | — |
| Institutional Shares | — | — |
| ETF Shares | — | — |
| Total Distributions | (207,582) | (172,972) |
| Capital Share Transactions | | |
| Investor Shares | (2,707,567) | 4,289 |
| Admiral Shares | 2,706,044 | (86,171) |
| Signal Shares | 8,481 | 150,783 |
| Institutional Shares | 495,374 | 167,646 |
| ETF Shares | 522,195 | 176,302 |
| Net Increase (Decrease) from Capital Share Transactions | 1,024,527 | 412,849 |
| Total Increase (Decrease) | 3,576,612 | 4,401,511 |
| Net Assets | | |
| Beginning of Period | 15,669,653 | 11,268,142 |
| End of Period1 | 19,246,265 | 15,669,653 |
| 1 Net Assets—End of Period includes undistributed (overdistributed) net investment income of ($29,586,000) and ($26,407,000). |
See accompanying Notes, which are an integral part of the Financial Statements.
23
Growth Index Fund
Financial Highlights
| | | | | |
| Investor Shares | | | | | |
| |
| For a Share Outstanding | | | Year Ended December 31, |
| Throughout Each Period | 2010 | 2009 | 2008 | 2007 | 2006 |
| Net Asset Value, Beginning of Period | $27.32 | $20.29 | $33.23 | $29.77 | $27.54 |
| Investment Operations | | | | | |
| Net Investment Income | .315 | .276 | .261 | .270 | .241 |
| Net Realized and Unrealized Gain (Loss) | | | | | |
| on Investments | 4.284 | 7.035 | (12.939) | 3.460 | 2.228 |
| Total from Investment Operations | 4.599 | 7.311 | (12.678) | 3.730 | 2.469 |
| Distributions | | | | | |
| Dividends from Net Investment Income | (.319) | (.281) | (.262) | (.270) | (.239) |
| Distributions from Realized Capital Gains | — | — | — | — | — |
| Total Distributions | (.319) | (.281) | (.262) | (.270) | (.239) |
| Net Asset Value, End of Period | $31.60 | $27.32 | $20.29 | $33.23 | $29.77 |
| |
| Total Return1 | 16.96% | 36.29% | -38.32% | 12.56% | 9.01% |
| |
| Ratios/Supplemental Data | | | | | |
| Net Assets, End of Period (Millions) | $3,843 | $5,770 | $4,279 | $6,992 | $6,707 |
| Ratio of Total Expenses to | | | | | |
| Average Net Assets | 0.26% | 0.28% | 0.23% | 0.22% | 0.22% |
| Ratio of Net Investment Income to | | | | | |
| Average Net Assets | 1.13% | 1.20% | 0.93% | 0.83% | 0.86% |
| Portfolio Turnover Rate2 | 26% | 29% | 27% | 23% | 28% |
1 Total returns do not include account service fees that may have applied in the periods shown. Fund prospectuses provide information about any applicable account service fees.
2 Excludes the value of portfolio securities received or delivered as a result of in-kind purchases or redemptions of the fund’s capital shares, including ETF Creation Units.
See accompanying Notes, which are an integral part of the Financial Statements.
24
Growth Index Fund
Financial Highlights
| | | | | |
| Admiral Shares | | | | | |
| |
| For a Share Outstanding | | | Year Ended December 31, |
| Throughout Each Period | 2010 | 2009 | 2008 | 2007 | 2006 |
| Net Asset Value, Beginning of Period | $27.32 | $20.30 | $33.23 | $29.77 | $27.54 |
| Investment Operations | | | | | |
| Net Investment Income | .357 | .308 | .294 | .308 | .272 |
| Net Realized and Unrealized Gain (Loss) | | | | | |
| on Investments | 4.282 | 7.027 | (12.929) | 3.460 | 2.228 |
| Total from Investment Operations | 4.639 | 7.335 | (12.635) | 3.768 | 2.500 |
| Distributions | | | | | |
| Dividends from Net Investment Income | (.359) | (.315) | (.295) | (.308) | (.270) |
| Distributions from Realized Capital Gains | — | — | — | — | — |
| Total Distributions | (.359) | (.315) | (.295) | (.308) | (.270) |
| Net Asset Value, End of Period | $31.60 | $27.32 | $20.30 | $33.23 | $29.77 |
| |
| Total Return | 17.12% | 36.42% | -38.22% | 12.70% | 9.13% |
| |
| Ratios/Supplemental Data | | | | | |
| Net Assets, End of Period (Millions) | $4,712 | $1,641 | $1,296 | $2,203 | $2,505 |
| Ratio of Total Expenses to | | | | | |
| Average Net Assets | 0.12% | 0.14% | 0.11% | 0.10% | 0.11% |
| Ratio of Net Investment Income to | | | | | |
| Average Net Assets | 1.27% | 1.34% | 1.05% | 0.95% | 0.97% |
| Portfolio Turnover Rate1 | 26% | 29% | 27% | 23% | 28% |
1 Excludes the value of portfolio securities received or delivered as a result of in-kind purchases or redemptions of the fund’s capital shares, including ETF Creation Units.
See accompanying Notes, which are an integral part of the Financial Statements.
25
Growth Index Fund
Financial Highlights
| | | | |
| Signal Shares | | | | |
| | | | | June 4, |
| | | | | 20071 to |
| | Year Ended December 31, | Dec. 31, |
| For a Share Outstanding Throughout Each Period | 2010 | 2009 | 2008 | 2007 |
| Net Asset Value, Beginning of Period | $25.30 | $18.80 | $30.77 | $30.26 |
| Investment Operations | | | | |
| Net Investment Income | .331 | .286 | .273 | .168 |
| Net Realized and Unrealized Gain (Loss) on Investments | 3.963 | 6.507 | (11.970) | .563 |
| Total from Investment Operations | 4.294 | 6.793 | (11.697) | .731 |
| Distributions | | | | |
| Dividends from Net Investment Income | (.334) | (.293) | (.273) | (.221) |
| Distributions from Realized Capital Gains | — | — | — | — |
| Total Distributions | (.334) | (.293) | (.273) | (.221) |
| Net Asset Value, End of Period | $29.26 | $25.30 | $18.80 | $30.77 |
| |
| Total Return | 17.11% | 36.42% | -38.21% | 2.43% |
| |
| Ratios/Supplemental Data | | | | |
| Net Assets, End of Period (Millions) | $1,658 | $1,428 | $941 | $1,425 |
| Ratio of Total Expenses to Average Net Assets | 0.12% | 0.14% | 0.11% | 0.10%2 |
| Ratio of Net Investment Income to Average Net Assets | 1.27% | 1.34% | 1.05% | 0.95%2 |
| Portfolio Turnover Rate3 | 26% | 29% | 27% | 23% |
1 Inception.
2 Annualized.
3 Excludes the value of portfolio securities received or delivered as a result of in-kind purchases or redemptions of the fund’s capital shares,
including ETF Creation Units.
See accompanying Notes, which are an integral part of the Financial Statements.
26
Growth Index Fund
Financial Highlights
| | | | | |
| Institutional Shares | | | | | |
| |
| For a Share Outstanding | | | Year Ended December 31, |
| Throughout Each Period | 2010 | 2009 | 2008 | 2007 | 2006 |
| Net Asset Value, Beginning of Period | $27.32 | $20.30 | $33.23 | $29.77 | $27.54 |
| Investment Operations | | | | | |
| Net Investment Income | .369 | .322 | .305 | .318 | .280 |
| Net Realized and Unrealized Gain (Loss) | | | | | |
| on Investments | 4.283 | 7.027 | (12.930) | 3.460 | 2.228 |
| Total from Investment Operations | 4.652 | 7.349 | (12.625) | 3.778 | 2.508 |
| Distributions | | | | | |
| Dividends from Net Investment Income | (.372) | (.329) | (.305) | (.318) | (.278) |
| Distributions from Realized Capital Gains | — | — | — | — | — |
| Total Distributions | (.372) | (.329) | (.305) | (.318) | (.278) |
| Net Asset Value, End of Period | $31.60 | $27.32 | $20.30 | $33.23 | $29.77 |
| |
| Total Return | 17.17% | 36.50% | -38.19% | 12.73% | 9.16% |
| |
| Ratios/Supplemental Data | | | | | |
| Net Assets, End of Period (Millions) | $3,934 | $2,913 | $2,016 | $3,210 | $2,132 |
| Ratio of Total Expenses to | | | | | |
| Average Net Assets | 0.08% | 0.08% | 0.07% | 0.07% | 0.08% |
| Ratio of Net Investment Income to | | | | | |
| Average Net Assets | 1.31% | 1.40% | 1.09% | 0.98% | 1.00% |
| Portfolio Turnover Rate1 | 26% | 29% | 27% | 23% | 28% |
1 Excludes the value of portfolio securities received or delivered as a result of in-kind purchases or redemptions of the fund’s capital shares, including ETF Creation Units.
See accompanying Notes, which are an integral part of the Financial Statements.
27
Growth Index Fund
Financial Highlights
| | | | | |
| ETF Shares | | | | | |
| |
| For a Share Outstanding | | | Year Ended December 31, |
| Throughout Each Period | 2010 | 2009 | 2008 | 2007 | 2006 |
| Net Asset Value, Beginning of Period | $53.08 | $39.43 | $64.56 | $57.85 | $53.52 |
| Investment Operations | | | | | |
| Net Investment Income | .695 | .598 | .579 | .600 | .535 |
| Net Realized and Unrealized Gain (Loss) | | | | | |
| on Investments | 8.315 | 13.666 | (25.132) | 6.710 | 4.323 |
| Total from Investment Operations | 9.010 | 14.264 | (24.553) | 7.310 | 4.858 |
| Distributions | | | | | |
| Dividends from Net Investment Income | (.700) | (.614) | (.577) | (.600) | (.528) |
| Distributions from Realized Capital Gains | — | — | — | — | — |
| Total Distributions | (.700) | (.614) | (.577) | (.600) | (.528) |
| Net Asset Value, End of Period | $61.39 | $53.08 | $39.43 | $64.56 | $57.85 |
| |
| Total Return | 17.11% | 36.46% | -38.22% | 12.68% | 9.13% |
| |
| Ratios/Supplemental Data | | | | | |
| Net Assets, End of Period (Millions) | $5,099 | $3,917 | $2,736 | $3,232 | $1,336 |
| Ratio of Total Expenses to | | | | | |
| Average Net Assets | 0.12% | 0.14% | 0.10% | 0.10% | 0.11% |
| Ratio of Net Investment Income to | | | | | |
| Average Net Assets | 1.27% | 1.34% | 1.06% | 0.95% | 0.97% |
| Portfolio Turnover Rate1 | 26% | 29% | 27% | 23% | 28% |
1 Excludes the value of portfolio securities received or delivered as a result of in-kind purchases or redemptions of the fund’s capital shares, including ETF Creation Units.
See accompanying Notes, which are an integral part of the Financial Statements.
28
Growth Index Fund
Notes to Financial Statements
Vanguard Growth Index Fund is registered under the Investment Company Act of 1940 as an open-end investment company, or mutual fund. The fund offers five classes of shares: Investor Shares, Admiral Shares, Signal Shares, Institutional Shares, and ETF Shares. Investor Shares are available to any investor who meets the fund’s minimum purchase requirements. Admiral Shares, Signal Shares, and Institutional Shares are designed for investors who meet certain administrative, service, and account-size criteria. ETF Shares are listed for trading on the NYSE Arca, Inc.; they can be purchased and sold through a broker.
A. The following significant accounting policies conform to generally accepted accounting principles for U.S. mutual funds. The fund consistently follows such policies in preparing its financial statements.
1. Security Valuation: Securities are valued as of the close of trading on the New York Stock Exchange (generally 4 p.m., Eastern time) on the valuation date. Equity securities are valued at the latest quoted sales prices or official closing prices taken from the primary market in which each security trades; such securities not traded on the valuation date are valued at the mean of the latest quoted bid and asked prices. Securities for which market quotations are not readily available, or whose values have been materially affected by events occurring before the fund’s pricing time but after the close of the securities’ primary markets, are valued by methods deemed by the board of trustees to represent fair value. Investments in Vanguard Market Liquidity Fund are valued at that fund’s net asset value.
2. Federal Income Taxes: The fund intends to continue to qualify as a regulated investment company and distribute all of its taxable income. Management has analyzed the fund’s tax positions taken for all open federal income tax years (December 31, 2007–2010), and has concluded that no provision for federal income tax is required in the fund’s financial statements.
3. Distributions: Distributions to shareholders are recorded on the ex-dividend date.
4. Security Lending: The fund may lend its securities to qualified institutional borrowers to earn additional income. Security loans are required to be secured at all times by collateral at least equal to the market value of securities loaned. The fund invests cash collateral received in Vanguard Market Liquidity Fund, and records a liability for the return of the collateral, during the period the securities are on loan. Security lending income represents fees charged to borrowers plus income earned on investing cash collateral, less expenses associated with the loan.
5. Other: Dividend income is recorded on the ex-dividend date. Interest income includes income distributions received from Vanguard Market Liquidity Fund and is accrued daily. Security transactions are accounted for on the date securities are bought or sold. Costs used to determine realized gains (losses) on the sale of investment securities are those of the specific securities sold.
Each class of shares has equal rights as to assets and earnings, except that each class separately bears certain class-specific expenses related to maintenance of shareholder accounts (included in Management and Administrative expenses) and shareholder reporting. Marketing and distribution expenses are allocated to each class of shares based on a method approved by the board of trustees. Income, other non-class-specific expenses, and gains and losses on investments are allocated to each class of shares based on its relative net assets.
29
Growth Index Fund
B. The Vanguard Group furnishes at cost investment advisory, corporate management, administrative, marketing, and distribution services. The costs of such services are allocated to the fund under methods approved by the board of trustees. The fund has committed to provide up to 0.40% of its net assets in capital contributions to Vanguard. At December 31, 2010, the fund had contributed capital of $3,187,000 to Vanguard (included in Other Assets), representing 0.02% of the fund’s net assets and 1.27% of Vanguard’s capitalization. The fund’s trustees and officers are also directors and officers of Vanguard.
C. Various inputs may be used to determine the value of the fund’s investments. These inputs are summarized in three broad levels for financial statement purposes. The inputs or methodologies used to value securities are not necessarily an indication of the risk associated with investing in those securities.
Level 1—Quoted prices in active markets for identical securities.
Level 2—Other significant observable inputs (including quoted prices for similar securities, interest rates, prepayment speeds, credit risk, etc.).
Level 3—Significant unobservable inputs (including the fund’s own assumptions used to determine the fair value of investments).
At December 31, 2010, 100% of the fund’s investments were valued based on Level 1 inputs.
D. Distributions are determined on a tax basis and may differ from net investment income and realized capital gains for financial reporting purposes. Differences may be permanent or temporary. Permanent differences are reclassified among capital accounts in the financial statements to reflect their tax character. Temporary differences arise when certain items of income, expense, gain, or loss are recognized in different periods for financial statement and tax purposes; these differences will reverse at some time in the future. Differences in classification may also result from the treatment of short-term gains as ordinary income for tax purposes.
During the year ended December 31, 2010, the fund realized $37,719,000 of net capital gains resulting from in-kind redemptions—in which shareholders exchanged fund shares for securities held by the fund rather than for cash. Because such gains are not taxable to the fund, and are not distributed to shareholders, they have been reclassified from accumulated net realized losses to paid-in capital.
For tax purposes, at December 31, 2010, the fund had $1,092,000 of ordinary income available for distribution. The fund had available capital loss carryforwards totaling $1,739,149,000 to offset future net capital gains of $742,396,000 through December 31, 2011, and $996,753,000 through December 31, 2017. Capital loss carryforwards of $251,682,000 expired on December 31, 2010; accordingly, such losses have been reclassified from accumulated net realized losses to paid-in capital.
At December 31, 2010, the cost of investment securities for tax purposes was $15,096,347,000. Net unrealized appreciation of investment securities for tax purposes was $4,196,113,000, consisting of unrealized gains of $4,597,651,000 on securities that had risen in value since their purchase and $401,538,000 in unrealized losses on securities that had fallen in value since their purchase.
30
Growth Index Fund
E. During the year ended December 31, 2010, the fund purchased $5,431,557,000 of investment securities and sold $4,398,831,000 of investment securities, other than temporary cash investments.
F. Capital share transactions for each class of shares were:
| | | | |
| | | | Year Ended December 31, |
| | | 2010 | | 2009 |
| | Amount | Shares | Amount | Shares |
| | ($000) | (000) | ($000) | (000) |
| Investor Shares | | | | |
| Issued | 919,480 | 32,600 | 825,020 | 37,006 |
| Issued in Lieu of Cash Distributions | 55,692 | 1,966 | 56,637 | 2,446 |
| Redeemed | (3,682,739) | (124,166) | (877,368) | (39,063) |
| Net Increase (Decrease)—Investor Shares | (2,707,567) | (89,600) | 4,289 | 389 |
| Admiral Shares | | | | |
| Issued | 2,949,046 | 97,612 | 213,424 | 9,300 |
| Issued in Lieu of Cash Distributions | 27,724 | 939 | 16,508 | 712 |
| Redeemed | (270,726) | (9,503) | (316,103) | (13,793) |
| Net Increase (Decrease)—Admiral Shares | 2,706,044 | 89,048 | (86,171) | (3,781) |
| Signal Shares | | | | |
| Issued | 488,616 | 18,792 | 431,599 | 20,087 |
| Issued in Lieu of Cash Distributions | 15,924 | 599 | 13,019 | 605 |
| Redeemed | (496,059) | (19,178) | (293,835) | (14,327) |
| Net Increase (Decrease)—Signal Shares | 8,481 | 213 | 150,783 | 6,365 |
| Institutional Shares | | | | |
| Issued | 1,066,000 | 38,097 | 755,744 | 33,073 |
| Issued in Lieu of Cash Distributions | 39,276 | 1,367 | 29,495 | 1,269 |
| Redeemed | (609,902) | (21,604) | (617,593) | (27,050) |
| Net Increase (Decrease)—Institutional Shares | 495,374 | 17,860 | 167,646 | 7,292 |
| ETF Shares | | | | |
| Issued | 613,418 | 10,977 | 629,619 | 14,191 |
| Issued in Lieu of Cash Distributions | — | — | — | — |
| Redeemed | (91,223) | (1,700) | (453,317) | (9,800) |
| Net Increase (Decrease)—ETF Shares | 522,195 | 9,277 | 176,302 | 4,391 |
G. In preparing the financial statements as of December 31, 2010, management considered the impact of subsequent events for potential recognition or disclosure in these financial statements.
31
Value Index Fund
Fund Profile
As of December 31, 2010
| | | | | |
| Share-Class Characteristics | | | | | |
| | Investor | Admiral | Signal | Institutional | ETF |
| | Shares | Shares | Shares | Shares | Shares |
| Ticker Symbol | VIVAX | VVIAX | VVISX | VIVIX | VTV |
| Expense Ratio1 | 0.26% | 0.14% | 0.14% | 0.08% | 0.14% |
| 30-Day SEC Yield | 1.94% | 2.08% | 2.08% | 2.12% | 2.08% |
| | | |
| Portfolio Characteristics | | |
| | | MSCI US | DJ |
| | | Prime | U.S. Total |
| | | Market | Market |
| | Fund Value | Index | Index |
| Number of Stocks | 417 | 417 | 3,893 |
| Median Market Cap $51.3B | $51.3B | $29.6B |
| Price/Earnings Ratio | 15.3x | 15.3x | 18.3x |
| Price/Book Ratio | 1.6x | 1.6x | 2.2x |
| Return on Equity | 16.5% | 16.5% | 18.8% |
| Earnings Growth Rate | -0.3% | -0.3% | 6.2% |
| Dividend Yield | 2.5% | 2.5% | 1.7% |
| Foreign Holdings | 0.0% | 0.0% | 0.0% |
| Turnover Rate | 27% | — | — |
| Short-Term Reserves | 0.1% | — | — |
| | |
| Volatility Measures | | |
| | | DJ |
| | MSCI US | U.S. Total |
| | Prime Market | Market |
| | Value Index | Index |
| R-Squared | 1.00 | 0.96 |
| Beta | 1.00 | 0.98 |
These measures show the degree and timing of the fund’s fluctuations compared with the indexes over 36 months.
| | |
| Ten Largest Holdings (% of total net assets) |
| Exxon Mobil Corp. | Integrated Oil & | |
| | Gas | 6.0% |
| General Electric Co. | Industrial | |
| | Conglomerates | 3.1 |
| Chevron Corp. | Integrated Oil & | |
| | Gas | 2.9 |
| Procter & Gamble Co. | Household | |
| | Products | 2.9 |
| AT&T Inc. | Integrated | |
| | Telecommunication | |
| | Services | 2.8 |
| Johnson & Johnson | Pharmaceuticals | 2.7 |
| JPMorgan Chase & Co. | Diversified Financial | |
| | Services | 2.7 |
| Wells Fargo & Co. | Diversified Banks | 2.5 |
| Pfizer Inc. | Pharmaceuticals | 2.3 |
| Bank of America Corp. | Diversified Financial | |
| | Services | 2.1 |
| Top Ten | | 30.0% |
The holdings listed exclude any temporary cash investments and equity index products.
1 The expense ratios shown are from the prospectus dated April 29, 2010, and represent estimated costs for the current fiscal year. For the fiscal year ended December 31, 2010, the expense ratios were 0.26% for Investor Shares, 0.12% for Admiral Shares, 0.12% for Signal Shares, 0.08% for Institutional Shares, and 0.12% for ETF Shares.
32
Value Index Fund
| | | |
| Sector Diversification (% of equity exposure) |
| | | MSCI US | |
| | | Prime | DJ |
| | | Market | U.S. Total |
| | | Value | Market |
| | Fund | Index | Index |
| Consumer | | | |
| Discretionary | 6.4% | 6.4% | 11.9% |
| Consumer Staples | 8.6 | 8.6 | 9.5 |
| Energy | 15.7 | 15.7 | 10.6 |
| Financials | 25.0 | 25.0 | 16.6 |
| Health Care | 11.6 | 11.6 | 10.7 |
| Industrials | 10.9 | 10.9 | 11.4 |
| Information | | | |
| Technology | 6.7 | 6.7 | 18.9 |
| Materials | 3.3 | 3.3 | 4.5 |
| Telecommunication | | | |
| Services | 5.3 | 5.3 | 2.7 |
| Utilities | 6.5 | 6.5 | 3.2 |
Investment Focus
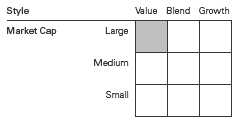
33
Value Index Fund
Performance Summary
All of the returns in this report represent past performance, which is not a guarantee of future results that may be achieved by the fund. (Current performance may be lower or higher than the performance data cited. For performance data current to the most recent month-end, visit our website at vanguard.com/performance.) Note, too, that both investment returns and principal value can fluctuate widely, so an investor’s shares, when sold, could be worth more or less than their original cost. The returns shown do not reflect taxes that a shareholder would pay on fund distributions or on the sale of fund shares.
Cumulative Performance: December 31, 2000, Through December 31, 2010
Initial Investment of $10,000
| | | | | |
| | | Average Annual Total Returns | |
| | | Periods Ended December 31, 2010 | |
| | | | | | Final Value |
| | | One | Five | Ten | of a $10,000 |
| | | Year | Years | Years | Investment |
| | Value Index Fund Investor Shares | 14.28% | 1.36% | 1.99% | $12,174 |
| •••••••• | Dow Jones U.S. Total Stock Market | | | | |
| | Index | 17.70 | 3.17 | 2.64 | 12,981 |
| – – – – | Spliced Value Index | 14.54 | 1.45 | 2.10 | 12,309 |
| | Large-Cap Value Funds Average | 13.15 | 0.97 | 1.52 | 11,629 |
Spliced Value Index: S&P 500/Barra Value Index through May 16, 2003; MSCI US Prime Market Value Index thereafter.
Large-Cap Value Funds Average: Derived from data provided by Lipper Inc.
| | | | |
| | | | | Final Value |
| | One | Five | Ten | of a $10,000 |
| | Year | Years | Years | Investment |
| Value Index Fund Admiral Shares | 14.45% | 1.47% | 2.08% | $12,292 |
| Dow Jones U.S. Total Stock Market | | | | |
| Index | 17.70 | 3.17 | 2.64 | 12,981 |
| Spliced Value Index | 14.54 | 1.45 | 2.10 | 12,309 |
See Financial Highlights for dividend and capital gains information.
34
Value Index Fund
| | | |
| | Average Annual Total Returns | |
| | Periods Ended December 31, 2010 | |
| | | Since | Final Value |
| | One | Inception | of a $10,000 |
| | Year | (6/4/2007) | Investment |
| Value Index Fund Signal Shares | 14.46% | -5.97% | $8,023 |
| Dow Jones U.S. Total Stock Market | | | |
| Index | 17.70 | -2.39 | 9,172 |
| MSCI US Prime Market Value Index | 14.54 | -6.02 | 8,008 |
| "Since Inception" performance is calculated from the Signal Shares’ inception date for both the fund and its comparative standards. |
| | | | |
| | | | | Final Value |
| | One | Five | Ten | of a $5,000,000 |
| | Year | Years | Years | Investment |
| Value Index Fund Institutional | | | | |
| Shares | 14.49% | 1.51% | 2.13% | $6,172,579 |
| Dow Jones U.S. Total Stock Market | | | | |
| Index | 17.70 | 3.17 | 2.64 | 6,490,386 |
| Spliced Value Index | 14.54 | 1.45 | 2.10 | 6,154,486 |
| | | | |
| | | | Since | Final Value |
| | One | Five | Inception | of a $10,000 |
| | Year | Years | (1/26/2004) | Investment |
| Value Index Fund | | | | |
| ETF Shares Net Asset Value | 14.45% | 1.48% | 3.68% | $12,844 |
| Dow Jones U.S. Total Stock Market Index | 17.70 | 3.17 | 4.30 | 13,390 |
| MSCI US Prime Market Value Index | 14.54 | 1.45 | 3.68 | 12,848 |
| "Since Inception" performance is calculated from the ETF Shares’ inception date for both the fund and its comparative standards. |
| | | |
| Cumulative Returns of ETF Shares: January 26, 2004, Through December 31, 2010 | | |
| | | | Since |
| | One | Five | Inception |
| | Year | Years | (1/26/2004) |
| Value Index Fund | | | |
| ETF Shares Market Price | 14.48% | 7.55% | 28.49% |
| Value Index Fund | | | |
| ETF Shares Net Asset Value | 14.45 | 7.60 | 28.44 |
| MSCI US Prime Market Value Index | 14.54 | 7.46 | 28.48 |
| "Since Inception" performance is calculated from the ETF Shares’ inception date for both the fund and its comparative standard. | |
35
Value Index Fund
Fiscal-Year Total Returns (%): December 31, 2000, Through December 31, 2010
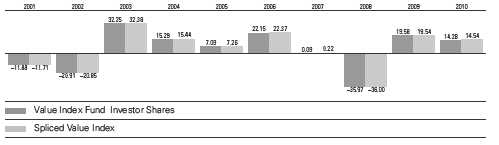
36
Value Index Fund
Financial Statements
Statement of Net Assets
As of December 31, 2010
The fund reports a complete list of its holdings in regulatory filings four times in each fiscal year, at the quarter-ends. For the second and fourth fiscal quarters, the lists appear in the fund’s semiannual and annual reports to shareholders. For the first and third fiscal quarters, the fund files the lists with the Securities and Exchange Commission on Form N-Q. Shareholders can look up the fund’s Forms N-Q on the SEC’s website at sec.gov. Forms N-Q may also be reviewed and copied at the SEC’s Public Reference Room (see the back cover of this report for further information).
| | | |
| | | | Market |
| | | | Value |
| | | Shares | ($000) |
| Common Stocks (100.0%) | | |
| Consumer Discretionary (6.4%) | |
| | Home Depot Inc. | 3,821,239 | 133,973 |
| | Walt Disney Co. | 2,685,766 | 100,743 |
| | Time Warner Inc. | 2,556,608 | 82,246 |
| | Comcast Corp. Class A | 3,204,837 | 70,410 |
| | Comcast Corp. Class A | | |
| | Special Shares | 2,327,574 | 48,437 |
| * | General Motors Co. | 1,193,966 | 44,010 |
| | Viacom Inc. Class B | 821,965 | 32,558 |
| | Macy’s Inc. | 959,990 | 24,288 |
| | Stanley Black & Decker Inc. | 357,960 | 23,937 |
| | Fortune Brands Inc. | 346,573 | 20,881 |
| | Mattel Inc. | 818,253 | 20,808 |
| * | Liberty Media Corp. - | | |
| | Interactive | 1,293,951 | 20,406 |
| | Limited Brands Inc. | 628,835 | 19,324 |
| | Genuine Parts Co. | 358,516 | 18,406 |
| | VF Corp. | 196,598 | 16,943 |
| | JC Penney Co. Inc. | 483,995 | 15,638 |
| | Whirlpool Corp. | 172,893 | 15,358 |
| | Darden Restaurants Inc. | 299,216 | 13,896 |
| | Hasbro Inc. | 286,425 | 13,513 |
| | Wyndham Worldwide Corp. | 405,727 | 12,156 |
| | Newell Rubbermaid Inc. | 633,123 | 11,510 |
| * | Royal Caribbean | | |
| | Cruises Ltd. | 206,483 | 9,705 |
| | H&R Block Inc. | 701,584 | 8,356 |
| ^ | Garmin Ltd. | 265,476 | 8,227 |
| | Gannett Co. Inc. | 542,350 | 8,184 |
| | DR Horton Inc. | 650,778 | 7,764 |
| | Leggett & Platt Inc. | 333,327 | 7,586 |
| * | Mohawk Industries Inc. | 132,398 | 7,515 |
| * | GameStop Corp. Class A | 324,596 | 7,427 |
| | Foot Locker Inc. | 354,614 | 6,957 |
| | Lennar Corp. Class A | 349,102 | 6,546 |
| * | DISH Network Corp. | | |
| | Class A | 309,075 | 6,076 |
| | | |
| | | | Market |
| | | | Value |
| | | Shares | ($000) |
| | Washington Post Co. | | |
| | Class B | 13,411 | 5,894 |
| * | Pulte Group Inc. | 782,269 | 5,883 |
| | Autoliv Inc. | 70,237 | 5,544 |
| | Brinker International Inc. | 230,627 | 4,815 |
| *,^ | Sears Holdings Corp. | 65,273 | 4,814 |
| * | NVR Inc. | 6,326 | 4,371 |
| * | TRW Automotive | | |
| | Holdings Corp. | 82,162 | 4,330 |
| * | Toll Brothers Inc. | 207,300 | 3,939 |
| * | Lear Corp. | 39,492 | 3,898 |
| * | Harman International | | |
| | Industries Inc. | 79,307 | 3,672 |
| | Phillips-Van Heusen Corp. | 52,935 | 3,335 |
| | American Eagle | | |
| | Outfitters Inc. | 211,804 | 3,099 |
| *,^ | AutoNation Inc. | 100,213 | 2,826 |
| * | Penn National Gaming Inc. | 75,444 | 2,652 |
| * | Lamar Advertising Co. | | |
| | Class A | 46,152 | 1,839 |
| * | Hyatt Hotels Corp. Class A | 34,980 | 1,601 |
| | Wendy’s/Arby’s Group Inc. | | |
| | Class A | 264,616 | 1,222 |
| * | Clear Channel Outdoor | | |
| | Holdings Inc. Class A | 32,640 | 458 |
| | | | 907,976 |
| Consumer Staples (8.6%) | | |
| | Procter & Gamble Co. | 6,452,522 | 415,091 |
| | Kraft Foods Inc. | 3,966,182 | 124,974 |
| | Altria Group Inc. | 4,739,092 | 116,676 |
| | Coca-Cola Co. | 1,654,375 | 108,808 |
| | CVS Caremark Corp. | 3,083,729 | 107,221 |
| | Archer-Daniels- | | |
| | Midland Co. | 1,461,849 | 43,972 |
| | Lorillard Inc. | 345,065 | 28,316 |
| | Reynolds American Inc. | 795,619 | 25,953 |
| | ConAgra Foods Inc. | 1,000,040 | 22,581 |
| | Bunge Ltd. | 303,096 | 19,859 |
| | Safeway Inc. | 868,132 | 19,524 |
37
Value Index Fund
| | | | |
| | | | | Market |
| | | | | Value |
| | | | Shares | ($000) |
| | Coca-Cola Enterprises Inc. | 779,415 | 19,509 |
| | Molson Coors Brewing Co. | | |
| | Class B | | 369,090 | 18,525 |
| | HJ Heinz Co. | | 362,134 | 17,911 |
| | JM Smucker Co. | | 271,735 | 17,839 |
| | Sara Lee Corp. | | 930,449 | 16,292 |
| | McCormick & Co. Inc. | 274,618 | 12,778 |
| | Tyson Foods Inc. Class A | 664,422 | 11,441 |
| | Church & Dwight Co. Inc. | 161,269 | 11,131 |
| | Dr Pepper Snapple | | | |
| | Group Inc. | | 271,606 | 9,550 |
| * | Constellation Brands Inc. | | |
| | Class A | | 425,152 | 9,417 |
| * | Ralcorp Holdings Inc. | 124,851 | 8,117 |
| * | Smithfield Foods Inc. | 339,607 | 7,006 |
| | Campbell Soup Co. | | 162,129 | 5,634 |
| | Hormel Foods Corp. | | 108,312 | 5,552 |
| | SUPERVALU Inc. | | 481,462 | 4,637 |
| | Brown-Forman Corp. | | | |
| | Class B | | 64,909 | 4,519 |
| * | Dean Foods Co. | | 413,642 | 3,657 |
| | | | | 1,216,490 |
| Energy (15.7%) | | | |
| | Exxon Mobil Corp. | 11,578,985 | 846,655 |
| | Chevron Corp. | | 4,572,190 | 417,212 |
| | ConocoPhillips | | 3,204,623 | 218,235 |
| | Occidental | | | |
| | Petroleum Corp. | | 1,847,019 | 181,193 |
| | Apache Corp. | | 868,818 | 103,589 |
| | Devon Energy Corp. | | 939,766 | 73,781 |
| | Marathon Oil Corp. | | 1,613,943 | 59,764 |
| | Chesapeake Energy Corp. | 1,488,080 | 38,556 |
| | Spectra Energy Corp. | 1,473,767 | 36,829 |
| | Williams Cos. Inc. | | 1,329,678 | 32,870 |
| | National Oilwell Varco Inc. | 476,561 | 32,049 |
| | Valero Energy Corp. | | 1,287,802 | 29,774 |
| | Noble Energy Inc. | | 258,470 | 22,249 |
| | Cimarex Energy Co. | | 191,301 | 16,936 |
| | Noble Corp. | | 378,364 | 13,534 |
| * | Pride International Inc. | 399,531 | 13,185 |
| | El Paso Corp. | | 800,779 | 11,019 |
| * | Newfield Exploration Co. | 151,935 | 10,956 |
| * | Denbury Resources Inc. | 560,835 | 10,706 |
| * | Plains Exploration & | | | |
| | Production Co. | | 318,708 | 10,243 |
| * | Rowan Cos. Inc. | | 260,725 | 9,102 |
| | Patterson-UTI Energy Inc. | 350,150 | 7,546 |
| | Southern Union Co. | | 268,610 | 6,465 |
| | Tidewater Inc. | | 116,859 | 6,292 |
| * | Kinder Morgan | | | |
| | Management LLC | | 92,224 | 6,168 |
| * | Tesoro Corp. | | 324,128 | 6,009 |
| * | Nabors Industries Ltd. | 226,510 | 5,314 |
| * | Forest Oil Corp. | | 85,852 | 3,260 |
| | | | | 2,229,491 |
| | | |
| | | | Market |
| | | | Value |
| | | Shares | ($000) |
| Financials (25.0%) | | |
| | JPMorgan Chase & Co. | 9,017,011 | 382,502 |
| | Wells Fargo & Co. | 11,306,050 | 350,374 |
| | Bank of America Corp. | 22,808,752 | 304,269 |
| | Goldman Sachs | | |
| | Group Inc. | 1,114,000 | 187,330 |
| * | Citigroup Inc. | 33,030,935 | 156,236 |
| | US Bancorp | 4,359,779 | 117,583 |
| * | Berkshire Hathaway Inc. | | |
| | Class B | 1,264,824 | 101,325 |
| | MetLife Inc. | 2,127,815 | 94,560 |
| | Bank of New York | | |
| | Mellon Corp. | 2,760,902 | 83,379 |
| | Morgan Stanley | 2,859,206 | 77,799 |
| | PNC Financial Services | | |
| | Group Inc. | 1,194,873 | 72,553 |
| | Prudential Financial Inc. | 1,057,514 | 62,087 |
| | Travelers Cos. Inc. | 1,068,896 | 59,548 |
| | ACE Ltd. | 770,726 | 47,978 |
| | Capital One | | |
| | Financial Corp. | 1,038,941 | 44,217 |
| | Chubb Corp. | 715,084 | 42,648 |
| | BB&T Corp. | 1,575,947 | 41,432 |
| | BlackRock Inc. | 200,296 | 38,172 |
| | Allstate Corp. | 1,162,487 | 37,060 |
| | Marsh & McLennan | | |
| | Cos. Inc. | 1,233,669 | 33,729 |
| | Vornado Realty Trust | 373,102 | 31,091 |
| | AON Corp. | 674,098 | 31,015 |
| | HCP Inc. | 829,825 | 30,529 |
| | Aflac Inc. | 535,254 | 30,204 |
| | Loews Corp. | 760,995 | 29,610 |
| | Fifth Third Bancorp | 1,810,999 | 26,585 |
| | Hartford Financial | | |
| | Services Group Inc. | 960,005 | 25,431 |
| | Invesco Ltd. | 1,050,835 | 25,283 |
| | Annaly Capital | | |
| | Management Inc. | 1,409,730 | 25,262 |
| | Principal Financial | | |
| | Group Inc. | 728,470 | 23,719 |
| | Simon Property Group Inc. | 233,138 | 23,195 |
| | Weyerhaeuser Co. | 1,218,520 | 23,067 |
| | Equity Residential | 419,021 | 21,768 |
| | Ameriprise Financial Inc. | 371,213 | 21,363 |
| | Lincoln National Corp. | 720,530 | 20,038 |
| | Regions Financial Corp. | 2,857,044 | 19,999 |
| | Ventas Inc. | 357,307 | 18,751 |
| | Progressive Corp. | 937,866 | 18,635 |
| | ProLogis | 1,267,249 | 18,299 |
| | Unum Group | 743,480 | 18,007 |
| | NYSE Euronext | 593,801 | 17,802 |
| | New York Community | | |
| | Bancorp Inc. | 941,358 | 17,745 |
| | Boston Properties Inc. | 206,029 | 17,739 |
| | KeyCorp | 2,002,622 | 17,723 |
38
Value Index Fund
| | | |
| | | | Market |
| | | | Value |
| | | Shares | ($000) |
| | XL Group plc Class A | 778,194 | 16,980 |
| | Comerica Inc. | 401,089 | 16,942 |
| | SunTrust Banks Inc. | 568,630 | 16,780 |
| | Kimco Realty Corp. | 923,139 | 16,653 |
| | M&T Bank Corp. | 189,662 | 16,510 |
| *,^ | American International | | |
| | Group Inc. | 276,738 | 15,946 |
| | Health Care REIT Inc. | 330,035 | 15,723 |
| | General Growth | | |
| | Properties Inc. | 962,368 | 14,897 |
| * | Genworth Financial Inc. | | |
| | Class A | 1,113,360 | 14,630 |
| | Macerich Co. | 295,573 | 14,001 |
| * | SLM Corp. | 1,103,392 | 13,892 |
| | Plum Creek Timber | | |
| | Co. Inc. | 367,573 | 13,766 |
| | Hudson City Bancorp Inc. | 1,076,728 | 13,718 |
| | Huntington | | |
| | Bancshares Inc. | 1,961,053 | 13,472 |
| | Willis Group Holdings plc | 387,304 | 13,412 |
| | PartnerRe Ltd. | 163,316 | 13,122 |
| | Leucadia National Corp. | 442,814 | 12,921 |
| | Legg Mason Inc. | 351,740 | 12,758 |
| | AMB Property Corp. | 382,779 | 12,138 |
| | SL Green Realty Corp. | 177,654 | 11,993 |
| | People’s United | | |
| | Financial Inc. | 842,503 | 11,803 |
| | Cincinnati Financial Corp. | 351,544 | 11,140 |
| | Torchmark Corp. | 183,795 | 10,980 |
| | Federal Realty | | |
| | Investment Trust | 139,791 | 10,894 |
| | AvalonBay Communities Inc. | 96,702 | 10,884 |
| | Everest Re Group Ltd. | 127,937 | 10,852 |
| | Nationwide Health | | |
| | Properties Inc. | 281,445 | 10,239 |
| * | Arch Capital Group Ltd. | 112,825 | 9,934 |
| | Rayonier Inc. | 182,481 | 9,584 |
| | UDR Inc. | 407,342 | 9,581 |
| | Zions Bancorporation | 393,755 | 9,541 |
| | Chimera Investment Corp. | 2,293,226 | 9,425 |
| | Assurant Inc. | 241,986 | 9,321 |
| | Axis Capital Holdings Ltd. | 259,240 | 9,302 |
| | Realty Income Corp. | 266,277 | 9,107 |
| | Reinsurance Group of | | |
| | America Inc. Class A | 166,170 | 8,925 |
| | WR Berkley Corp. | 303,644 | 8,314 |
| | Liberty Property Trust | 258,614 | 8,255 |
| * | Markel Corp. | 21,083 | 7,972 |
| | RenaissanceRe | | |
| | Holdings Ltd. | 124,575 | 7,934 |
| | Marshall & Ilsley Corp. | 1,139,524 | 7,886 |
| | Regency Centers Corp. | 185,881 | 7,852 |
| | Old Republic | | |
| | International Corp. | 558,471 | 7,612 |
| | | | |
| | | | | Market |
| | | | | Value |
| | | | Shares | ($000) |
| | HCC Insurance | | | |
| | Holdings Inc. | | 262,286 | 7,591 |
| | Cullen/Frost Bankers Inc. | 124,107 | 7,585 |
| | Transatlantic Holdings Inc. | 144,676 | 7,468 |
| | Raymond James | | | |
| | Financial Inc. | | 225,986 | 7,390 |
| * | NASDAQ OMX Group Inc. | 299,225 | 7,095 |
| | Jefferies Group Inc. | | 253,946 | 6,763 |
| | Fidelity National | | | |
| | Financial Inc. Class A | 492,403 | 6,736 |
| | Commerce Bancshares Inc. 169,336 | 6,728 |
| | Digital Realty Trust Inc. | 128,764 | 6,637 |
| | City National Corp. | | 106,537 | 6,537 |
| | Hospitality Properties Trust | 280,369 | 6,460 |
| | Assured Guaranty Ltd. | 355,460 | 6,292 |
| | Weingarten Realty Investors 259,887 | 6,175 |
| | Alexandria Real Estate | | |
| | Equities Inc. | | 79,845 | 5,849 |
| | White Mountains Insurance | |
| | Group Ltd. | | 17,291 | 5,803 |
| | Associated Banc-Corp | 373,247 | 5,655 |
| | American Financial | | | |
| | Group Inc. | | 172,481 | 5,569 |
| ^ | Federated Investors Inc. | | |
| | Class B | | 210,585 | 5,511 |
| | Duke Realty Corp. | | 370,763 | 4,620 |
| * | First Horizon National Corp. | 384,913 | 4,534 |
| | Piedmont Office Realty | | |
| | Trust Inc. Class A | | 211,428 | 4,258 |
| | Validus Holdings Ltd. | 137,859 | 4,220 |
| | Capitol Federal | | | |
| | Financial Inc. | | 325,863 | 3,881 |
| | BOK Financial Corp. | | 61,783 | 3,299 |
| | Mercury General Corp. | 62,143 | 2,673 |
| * | LPL Investment | | | |
| | Holdings Inc. | | 36,672 | 1,334 |
| | | | | 3,541,895 |
| Health Care (11.6%) | | | |
| | Johnson & Johnson | | 6,263,754 | 387,413 |
| | Pfizer Inc. | 18,279,443 | 320,073 |
| | Merck & Co. Inc. | | 6,989,567 | 251,904 |
| | Bristol-Myers Squibb Co. | 3,899,693 | 103,264 |
| | UnitedHealth Group Inc. | 2,556,732 | 92,324 |
| | Eli Lilly & Co. | | 2,360,111 | 82,698 |
| | Covidien plc | | 1,140,730 | 52,086 |
| * | WellPoint Inc. | | 909,162 | 51,695 |
| * | Amgen Inc. | | 762,618 | 41,868 |
| | Cardinal Health Inc. | | 798,606 | 30,595 |
| | Aetna Inc. | | 949,232 | 28,961 |
| * | Boston Scientific Corp. | 3,449,742 | 26,115 |
| | CIGNA Corp. | | 629,223 | 23,067 |
| * | Humana Inc. | | 384,886 | 21,069 |
| * | Forest Laboratories Inc. | 649,484 | 20,770 |
| | Beckman Coulter Inc. | 157,511 | 11,850 |
| * | Hologic Inc. | | 589,474 | 11,094 |
39
Value Index Fund
| | | |
| | | | Market |
| | | | Value |
| | | Shares | ($000) |
| * | Coventry Health Care Inc. | 337,394 | 8,907 |
| | Universal Health | | |
| | Services Inc. Class B | 204,378 | 8,874 |
| * | King Pharmaceuticals Inc. | 567,676 | 7,976 |
| | Pharmaceutical Product | | |
| | Development Inc. | 256,541 | 6,962 |
| | Omnicare Inc. | 268,731 | 6,823 |
| * | Alere Inc. | 183,166 | 6,704 |
| * | CareFusion Corp. | 252,614 | 6,492 |
| * | Kinetic Concepts Inc. | 146,839 | 6,150 |
| * | Endo Pharmaceuticals | | |
| | Holdings Inc. | 170,593 | 6,092 |
| * | Charles River Laboratories | |
| | International Inc. | 150,752 | 5,358 |
| * | Cephalon Inc. | 85,439 | 5,273 |
| * | Community Health | | |
| | Systems Inc. | 106,945 | 3,996 |
| | Lincare Holdings Inc. | 145,407 | 3,901 |
| | Warner Chilcott plc | | |
| | Class A | 90,600 | 2,044 |
| | | | 1,642,398 |
| Industrials (10.9%) | | |
| | General Electric Co. | 24,312,424 | 444,674 |
| | United | | |
| | Technologies Corp. | 2,007,155 | 158,003 |
| | 3M Co. | 1,540,706 | 132,963 |
| | Honeywell | | |
| | International Inc. | 1,084,415 | 57,648 |
| | CSX Corp. | 863,417 | 55,785 |
| | General Dynamics Corp. | 735,335 | 52,179 |
| | Illinois Tool Works Inc. | 973,380 | 51,979 |
| | Lockheed Martin Corp. | 700,834 | 48,995 |
| | Tyco International Ltd. | 1,132,022 | 46,911 |
| | Northrop Grumman Corp. | 635,410 | 41,162 |
| | Raytheon Co. | 850,513 | 39,413 |
| | Waste Management Inc. | 1,031,468 | 38,030 |
| | Eaton Corp. | 362,418 | 36,789 |
| | Boeing Co. | 553,296 | 36,108 |
| | Goodrich Corp. | 284,987 | 25,099 |
| | Dover Corp. | 424,519 | 24,813 |
| | Cooper Industries plc | 379,281 | 22,108 |
| | L-3 Communications | | |
| | Holdings Inc. | 260,441 | 18,359 |
| | Ingersoll-Rand plc | 367,283 | 17,295 |
| * | United Continental | | |
| | Holdings Inc. | 719,029 | 17,127 |
| | Parker Hannifin Corp. | 183,299 | 15,819 |
| | Rockwell Automation Inc. | 161,353 | 11,571 |
| | Pitney Bowes Inc. | 470,174 | 11,369 |
| | Southwest Airlines Co. | 848,496 | 11,014 |
| | KBR Inc. | 355,472 | 10,831 |
| | Masco Corp. | 818,738 | 10,365 |
| | Equifax Inc. | 284,246 | 10,119 |
| | Avery Dennison Corp. | 224,628 | 9,511 |
| | Timken Co. | 186,941 | 8,923 |
| | | |
| | | | Market |
| | | | Value |
| | | Shares | ($000) |
| | Cintas Corp. | 312,856 | 8,747 |
| | Pentair Inc. | 224,387 | 8,192 |
| | RR Donnelley & Sons Co. | 468,931 | 8,192 |
| * | URS Corp. | 190,556 | 7,929 |
| | Pall Corp. | 132,678 | 6,578 |
| | Ryder System Inc. | 119,179 | 6,274 |
| | Towers Watson & Co. | | |
| | Class A | 116,891 | 6,085 |
| * | Aecom Technology Corp. | 211,010 | 5,902 |
| | Manpower Inc. | 93,358 | 5,859 |
| * | Owens Corning | 170,292 | 5,305 |
| | Harsco Corp. | 182,660 | 5,173 |
| * | Hertz Global Holdings Inc. | 334,270 | 4,844 |
| | SPX Corp. | 56,994 | 4,075 |
| * | Terex Corp. | 123,496 | 3,833 |
| | | | 1,551,950 |
| Information Technology (6.7%) | |
| | Intel Corp. | 12,662,012 | 266,282 |
| | Hewlett-Packard Co. | 2,654,419 | 111,751 |
| | Corning Inc. | 3,551,366 | 68,612 |
| | Applied Materials Inc. | 3,054,161 | 42,911 |
| | Xerox Corp. | 3,145,259 | 36,233 |
| * | Motorola Inc. | 3,277,541 | 29,727 |
| * | Dell Inc. | 1,990,229 | 26,968 |
| | Automatic Data | | |
| | Processing Inc. | 559,553 | 25,896 |
| | Computer Sciences Corp. | 351,294 | 17,424 |
| * | Yahoo! Inc. | 1,019,751 | 16,958 |
| * | Micron Technology Inc. | 2,035,620 | 16,326 |
| * | Seagate Technology plc | 1,073,311 | 16,132 |
| | Maxim Integrated | | |
| | Products Inc. | 678,644 | 16,030 |
| | Fidelity National | | |
| | Information Services Inc. | 579,516 | 15,873 |
| | Paychex Inc. | 481,224 | 14,875 |
| | KLA-Tencor Corp. | 381,770 | 14,752 |
| | Microchip Technology Inc. | 423,151 | 14,476 |
| * | Flextronics | | |
| | International Ltd. | 1,784,374 | 14,007 |
| * | SAIC Inc. | 863,270 | 13,692 |
| | Harris Corp. | 293,495 | 13,295 |
| * | Avnet Inc. | 345,376 | 11,408 |
| * | Lam Research Corp. | 183,516 | 9,502 |
| * | Arrow Electronics Inc. | 267,981 | 9,178 |
| * | Synopsys Inc. | 335,474 | 9,028 |
| | Jabil Circuit Inc. | 444,583 | 8,932 |
| * | Western Digital Corp. | 260,772 | 8,840 |
| * | LSI Corp. | 1,459,491 | 8,742 |
| | Xilinx Inc. | 293,822 | 8,515 |
| | National | | |
| | Semiconductor Corp. | 544,741 | 7,496 |
| * | NVIDIA Corp. | 456,269 | 7,027 |
| * | Advanced Micro | | |
| | Devices Inc. | 846,878 | 6,928 |
| * | Ingram Micro Inc. | 355,919 | 6,795 |
40
Value Index Fund
| | | | |
| | | | | Market |
| | | | | Value |
| | | | Shares | ($000) |
| * | Novellus Systems Inc. | | 208,721 | 6,746 |
| * | Lexmark International Inc. | | | |
| | Class A | | 178,179 | 6,204 |
| * | IAC/InterActiveCorp | | 208,424 | 5,982 |
| | Total System Services Inc. | 381,239 | 5,863 |
| * | AOL Inc. | | 242,472 | 5,749 |
| | Tellabs Inc. | | 824,229 | 5,588 |
| * | Electronic Arts Inc. | | 262,158 | 4,294 |
| | Molex Inc. | | 141,031 | 3,204 |
| | Molex Inc. Class A | | 169,331 | 3,195 |
| | Lender Processing | | | |
| | Services Inc. | | 106,136 | 3,133 |
| | DST Systems Inc. | | 42,233 | 1,873 |
| | | | | 946,442 |
| Materials (3.3%) | | | |
| | EI du Pont de Nemours | | | |
| | & Co. | | 2,061,520 | 102,829 |
| | Dow Chemical Co. | | 2,637,621 | 90,048 |
| | PPG Industries Inc. | | 375,444 | 31,564 |
| | International Paper Co. | | 944,244 | 25,721 |
| | Cliffs Natural | | | |
| | Resources Inc. | | 308,036 | 24,030 |
| | Nucor Corp. | | 466,516 | 20,443 |
| | Walter Energy Inc. | | 120,372 | 15,388 |
| | Eastman Chemical Co. | | 164,340 | 13,818 |
| | Vulcan Materials Co. | | 291,356 | 12,925 |
| * | Owens-Illinois Inc. | | 372,058 | 11,422 |
| | Airgas Inc. | | 180,871 | 11,297 |
| | Albemarle Corp. | | 186,596 | 10,408 |
| | MeadWestvaco Corp. | | 388,547 | 10,164 |
| | International Flavors & | | | |
| | Fragrances Inc. | | 181,645 | 10,098 |
| | Sealed Air Corp. | | 362,852 | 9,235 |
| | Ashland Inc. | | 170,116 | 8,652 |
| | Steel Dynamics Inc. | | 468,381 | 8,571 |
| | Reliance Steel & | | | |
| | Aluminum Co. | | 160,356 | 8,194 |
| | FMC Corp. | | 101,807 | 8,133 |
| | Bemis Co. Inc. | | 247,822 | 8,094 |
| | Sonoco Products Co. | | 228,874 | 7,706 |
| | Valspar Corp. | | 214,321 | 7,390 |
| | United States Steel Corp. | | 114,082 | 6,665 |
| | Martin Marietta | | | |
| | Materials Inc. | | 67,134 | 6,192 |
| | Greif Inc. Class A | | 55,974 | 3,465 |
| * | Titanium Metals Corp. | | 71,907 | 1,235 |
| | | | | 473,687 |
| Telecommunication Services (5.3%) | |
| | AT&T Inc. | 13,437,384 | 394,790 |
| | Verizon | | | |
| | Communications Inc. | | 6,428,219 | 230,002 |
| | CenturyLink Inc. | | 685,624 | 31,655 |
| * | Sprint Nextel Corp. | | 6,707,704 | 28,374 |
| | | |
| | | | Market |
| | | | Value |
| | | Shares | ($000) |
| | Qwest Communications | | |
| | International Inc. | 3,559,916 | 27,091 |
| | Frontier | | |
| | Communications Corp. | 2,255,882 | 21,950 |
| | Windstream Corp. | 1,099,211 | 15,323 |
| | Telephone & | | |
| | Data Systems Inc. | 112,601 | 4,115 |
| | Telephone & | | |
| | Data Systems Inc. - | | |
| | Special Common Shares | 101,523 | 3,200 |
| * | United States Cellular Corp. | 42,528 | 2,124 |
| *,^ | Clearwire Corp. Class A | 116,108 | 598 |
| | | | 759,222 |
| Utilities (6.5%) | | |
| | Southern Co. | 1,889,156 | 72,222 |
| | Exelon Corp. | 1,503,188 | 62,593 |
| | Dominion Resources Inc. | 1,339,781 | 57,235 |
| | Duke Energy Corp. | 2,998,943 | 53,411 |
| | NextEra Energy Inc. | 898,505 | 46,713 |
| | PG&E Corp. | 888,324 | 42,497 |
| | American Electric | | |
| | Power Co. Inc. | 1,090,334 | 39,230 |
| | Public Service Enterprise | | |
| | Group Inc. | 1,150,676 | 36,603 |
| | Consolidated Edison Inc. | 642,777 | 31,863 |
| | Entergy Corp. | 424,884 | 30,095 |
| | Progress Energy Inc. | 665,410 | 28,932 |
| | PPL Corp. | 1,097,877 | 28,896 |
| | Sempra Energy | 535,547 | 28,106 |
| | Edison International | 703,919 | 27,171 |
| | FirstEnergy Corp. | 693,257 | 25,664 |
| | Xcel Energy Inc. | 1,045,170 | 24,614 |
| | DTE Energy Co. | 384,052 | 17,405 |
| | Wisconsin Energy Corp. | 265,945 | 15,654 |
| | Ameren Corp. | 544,190 | 15,341 |
| | CenterPoint Energy Inc. | 910,096 | 14,307 |
| | Constellation Energy | | |
| | Group Inc. | 435,805 | 13,349 |
| | Northeast Utilities | 400,137 | 12,756 |
| | Oneok Inc. | 229,964 | 12,756 |
| * | NRG Energy Inc. | 575,977 | 11,255 |
| | NiSource Inc. | 632,359 | 11,142 |
| | SCANA Corp. | 273,846 | 11,118 |
| | National Fuel Gas Co. | 158,478 | 10,399 |
| | Pinnacle West Capital Corp. | 247,013 | 10,239 |
| | OGE Energy Corp. | 221,497 | 10,087 |
| | American Water Works | | |
| | Co. Inc. | 397,578 | 10,055 |
| | NSTAR | 235,236 | 9,925 |
| | CMS Energy Corp. | 522,846 | 9,725 |
| | Allegheny Energy Inc. | 385,290 | 9,339 |
| | Pepco Holdings Inc. | 509,225 | 9,293 |
| | Alliant Energy Corp. | 251,578 | 9,251 |
| | Integrys Energy Group Inc. | 175,658 | 8,521 |
| | TECO Energy Inc. | 463,737 | 8,255 |
41
Value Index Fund
| | |
| | | Market |
| | | Value |
| | Shares | ($000) |
| MDU Resources Group Inc. | 406,329 | 8,236 |
| UGI Corp. | 250,110 | 7,899 |
| NV Energy Inc. | 534,439 | 7,509 |
| Energen Corp. | 155,417 | 7,500 |
| Aqua America Inc. | 312,015 | 7,014 |
| DPL Inc. | 270,651 | 6,958 |
| AGL Resources Inc. | 176,872 | 6,341 |
| | | 927,474 |
| Total Common Stocks | | |
| (Cost $13,540,151) | | 14,197,025 |
| Temporary Cash Investment (0.3%) | |
| Money Market Fund (0.3%) | | |
| 1,2 Vanguard Market | | |
| Liquidity Fund, 0.211% | | |
| (Cost $39,442) | 39,442,007 | 39,442 |
| Total Investments (100.3%) | | |
| (Cost $13,579,593) | | 14,236,467 |
| Other Assets and Liabilities (-0.3%) | |
| Other Assets | | 39,052 |
| Liabilities2 | | (78,539) |
| | | (39,487) |
| Net Assets (100%) | | 14,196,980 |
| |
| At December 31, 2010, net assets consisted of: |
| | Amount |
| | ($000) |
| Paid-in Capital | 16,069,285 |
| Overdistributed Net Investment Income | (18,620) |
| Accumulated Net Realized Losses | (2,510,559) |
| Unrealized Appreciation (Depreciation) | 656,874 |
| Net Assets | 14,196,980 |
| |
| Investor Shares—Net Assets | |
| Applicable to 111,445,359 outstanding | |
| $.001 par value shares of beneficial | |
| interest (unlimited authorization) | 2,316,656 |
| Net Asset Value Per Share— | |
| Investor Shares | $20.79 |
| |
| Admiral Shares—Net Assets | |
| Applicable to 148,268,161 outstanding | |
| $.001 par value shares of beneficial | |
| interest (unlimited authorization) | 3,082,266 |
| Net Asset Value Per Share— | |
| Admiral Shares | $20.79 |
| |
| Signal Shares—Net Assets | |
| Applicable to 47,046,662 outstanding | |
| $.001 par value shares of beneficial | |
| interest (unlimited authorization) | 1,017,716 |
| Net Asset Value Per Share— | |
| Signal Shares | $21.63 |
| |
| Institutional Shares—Net Assets | |
| Applicable to 165,973,039 outstanding | |
| $.001 par value shares of beneficial | |
| interest (unlimited authorization) | 3,450,346 |
| Net Asset Value Per Share— | |
| Institutional Shares | $20.79 |
| |
| ETF Shares—Net Assets | |
| Applicable to 81,253,271 outstanding | |
| $.001 par value shares of beneficial | |
| interest (unlimited authorization) | 4,329,996 |
| Net Asset Value Per Share— | |
| ETF Shares | $53.29 |
See Note A in Notes to Financial Statements.
* Non-income-producing security.
^ Part of security position is on loan to broker-dealers. The total value of securities on loan is $28,538,000.
1 Affiliated money market fund available only to Vanguard funds and certain trusts and accounts managed by Vanguard. Rate shown is the 7-day yield.
2 Includes $29,468,000 of collateral received for securities on loan.
REIT—Real Estate Investment Trust.
See accompanying Notes, which are an integral part of the Financial Statements.
42
Value Index Fund
| |
| Statement of Operations | |
| |
| | Year Ended |
| | December 31, 2010 |
| | ($000) |
| Investment Income | |
| Income | |
| Dividends | 333,148 |
| Interest1 | 14 |
| Security Lending | 858 |
| Total Income | 334,020 |
| Expenses | |
| The Vanguard Group—Note B | |
| Investment Advisory Services | 711 |
| Management and Administrative—Investor Shares | 7,202 |
| Management and Administrative—Admiral Shares | 1,575 |
| Management and Administrative—Signal Shares | 754 |
| Management and Administrative—Institutional Shares | 1,280 |
| Management and Administrative—ETF Shares | 2,874 |
| Marketing and Distribution—Investor Shares | 910 |
| Marketing and Distribution—Admiral Shares | 271 |
| Marketing and Distribution—Signal Shares | 271 |
| Marketing and Distribution—Institutional Shares | 825 |
| Marketing and Distribution—ETF Shares | 1,001 |
| Custodian Fees | 181 |
| Auditing Fees | 28 |
| Shareholders’ Reports—Investor Shares | 101 |
| Shareholders’ Reports—Admiral Shares | 10 |
| Shareholders’ Reports—Signal Shares | 12 |
| Shareholders’ Reports—Institutional Shares | 74 |
| Shareholders’ Reports—ETF Shares | 161 |
| Trustees’ Fees and Expenses | 19 |
| Total Expenses | 18,260 |
| Net Investment Income | 315,760 |
| Realized Net Gain (Loss) on Investment Securities Sold | 1,034,334 |
| Change in Unrealized Appreciation (Depreciation) of Investment Securities | 411,262 |
| Net Increase (Decrease) in Net Assets Resulting from Operations | 1,761,356 |
| 1 Interest income from an affiliated company of the fund was $14,000. | |
See accompanying Notes, which are an integral part of the Financial Statements.
43
Value Index Fund
| | |
| Statement of Changes in Net Assets | | |
| |
| | Year Ended December 31, |
| | 2010 | 2009 |
| | ($000) | ($000) |
| Increase (Decrease) in Net Assets | | |
| Operations | | |
| Net Investment Income | 315,760 | 304,146 |
| Realized Net Gain (Loss) | 1,034,334 | (1,182,895) |
| Change in Unrealized Appreciation (Depreciation) | 411,262 | 2,843,335 |
| Net Increase (Decrease) in Net Assets Resulting from Operations | 1,761,356 | 1,964,586 |
| Distributions | | |
| Net Investment Income | | |
| Investor Shares | (73,774) | (89,175) |
| Admiral Shares | (47,412) | (40,743) |
| Signal Shares | (23,713) | (24,281) |
| Institutional Shares | (79,304) | (75,494) |
| ETF Shares | (94,390) | (83,082) |
| Realized Capital Gain | | |
| Investor Shares | — | — |
| Admiral Shares | — | — |
| Signal Shares | — | — |
| Institutional Shares | — | — |
| ETF Shares | — | — |
| Total Distributions | (318,593) | (312,775) |
| Capital Share Transactions | | |
| Investor Shares | (1,363,607) | 222,645 |
| Admiral Shares | 1,427,492 | (34,694) |
| Signal Shares | 7,057 | 137,348 |
| Institutional Shares | 279,853 | 431,888 |
| ETF Shares | 761,989 | 558,365 |
| Net Increase (Decrease) from Capital Share Transactions | 1,112,784 | 1,315,552 |
| Total Increase (Decrease) | 2,555,547 | 2,967,363 |
| Net Assets | | |
| Beginning of Period | 11,641,433 | 8,674,070 |
| End of Period1 | 14,196,980 | 11,641,433 |
| 1 Net Assets—End of Period includes undistributed (overdistributed) net investment income of ($18,620,000) and ($15,787,000). |
See accompanying Notes, which are an integral part of the Financial Statements.
44
Value Index Fund
| | | | | |
| Financial Highlights | | | | | |
| |
| Investor Shares | | | | | |
| |
| For a Share Outstanding | | | Year Ended December 31, |
| Throughout Each Period | 2010 | 2009 | 2008 | 2007 | 2006 |
| Net Asset Value, Beginning of Period | $18.63 | $16.08 | $25.94 | $26.58 | $22.29 |
| Investment Operations | | | | | |
| Net Investment Income | .459 | .498 | .660 | .687 | .586 |
| Net Realized and Unrealized Gain (Loss) | | | | | |
| on Investments | 2.163 | 2.561 | (9.863) | (.644) | 4.295 |
| Total from Investment Operations | 2.622 | 3.059 | (9.203) | .043 | 4.881 |
| Distributions | | | | | |
| Dividends from Net Investment Income | (.462) | (.509) | (.657) | (.683) | (.591) |
| Distributions from Realized Capital Gains | — | — | — | — | — |
| Total Distributions | (.462) | (.509) | (.657) | (.683) | (.591) |
| Net Asset Value, End of Period | $20.79 | $18.63 | $16.08 | $25.94 | $26.58 |
| |
| Total Return1 | 14.28% | 19.58% | -35.97% | 0.09% | 22.15% |
| |
| Ratios/Supplemental Data | | | | | |
| Net Assets, End of Period (Millions) | $2,317 | $3,357 | $2,618 | $4,310 | $4,417 |
| Ratio of Total Expenses to | | | | | |
| Average Net Assets | 0.26% | 0.26% | 0.21% | 0.20% | 0.21% |
| Ratio of Net Investment Income to | | | | | |
| Average Net Assets | 2.43% | 3.09% | 3.14% | 2.49% | 2.48% |
| Portfolio Turnover Rate2 | 27% | 31% | 27% | 20% | 20% |
1 Total returns do not include account service fees that may have applied in the periods shown. Fund prospectuses provide information about any applicable account service fees.
2 Excludes the value of portfolio securities received or delivered as a result of in-kind purchases or redemptions of the fund’s capital shares, including ETF Creation Units.
See accompanying Notes, which are an integral part of the Financial Statements.
45
Value Index Fund
| | | | | |
| Financial Highlights | | | | | |
| |
| Admiral Shares | | | | | |
| |
| For a Share Outstanding | | | Year Ended December 31, |
| Throughout Each Period | 2010 | 2009 | 2008 | 2007 | 2006 |
| Net Asset Value, Beginning of Period | $18.63 | $16.08 | $25.94 | $26.58 | $22.29 |
| Investment Operations | | | | | |
| Net Investment Income | .488 | .517 | .681 | .710 | .611 |
| Net Realized and Unrealized Gain (Loss) | | | | | |
| on Investments | 2.162 | 2.562 | (9.863) | (.640) | 4.295 |
| Total from Investment Operations | 2.650 | 3.079 | (9.182) | .070 | 4.906 |
| Distributions | | | | | |
| Dividends from Net Investment Income | (.490) | (.529) | (.678) | (.710) | (.616) |
| Distributions from Realized Capital Gains | — | — | — | — | — |
| Total Distributions | (.490) | (.529) | (.678) | (.710) | (.616) |
| Net Asset Value, End of Period | $20.79 | $18.63 | $16.08 | $25.94 | $26.58 |
| |
| Total Return | 14.45% | 19.72% | -35.90% | 0.18% | 22.27% |
| |
| Ratios/Supplemental Data | | | | | |
| Net Assets, End of Period (Millions) | $3,082 | $1,421 | $1,262 | $2,069 | $2,625 |
| Ratio of Total Expenses to | | | | | |
| Average Net Assets | 0.12% | 0.14% | 0.11% | 0.10% | 0.11% |
| Ratio of Net Investment Income to | | | | | |
| Average Net Assets | 2.57% | 3.21% | 3.24% | 2.59% | 2.58% |
| Portfolio Turnover Rate1 | 27% | 31% | 27% | 20% | 20% |
1 Excludes the value of portfolio securities received or delivered as a result of in-kind purchases or redemptions of the fund’s capital shares, including ETF Creation Units.
See accompanying Notes, which are an integral part of the Financial Statements.
46
Value Index Fund
| | | | |
| Financial Highlights | | | | |
| |
| Signal Shares | | | | |
| | | | | June 4, |
| | | | | 20071 to |
| | Year Ended December 31, | Dec. 31, |
| For a Share Outstanding Throughout Each Period | 2010 | 2009 | 2008 | 2007 |
| Net Asset Value, Beginning of Period | $19.38 | $16.73 | $27.00 | $30.14 |
| Investment Operations | | | | |
| Net Investment Income | .508 | .538 | .710 | .442 |
| Net Realized and Unrealized Gain (Loss) | | | | |
| on Investments | 2.252 | 2.663 | (10.274) | (3.017) |
| Total from Investment Operations | 2.760 | 3.201 | (9.564) | (2.575) |
| Distributions | | | | |
| Dividends from Net Investment Income | (.510) | (.551) | (.706) | (.565) |
| Distributions from Realized Capital Gains | — | — | — | — |
| Total Distributions | (.510) | (.551) | (.706) | (.565) |
| Net Asset Value, End of Period | $21.63 | $19.38 | $16.73 | $27.00 |
| |
| Total Return | 14.46% | 19.70% | -35.93% | -8.61% |
| |
| Ratios/Supplemental Data | | | | |
| Net Assets, End of Period (Millions) | $1,018 | $907 | $638 | $864 |
| Ratio of Total Expenses to Average Net Assets | 0.12% | 0.14% | 0.11% | 0.10%2 |
| Ratio of Net Investment Income to Average Net Assets | 2.57% | 3.21% | 3.24% | 2.59%2 |
| Portfolio Turnover Rate3 | 27% | 31% | 27% | 20% |
1 Inception.
2 Annualized.
3 Excludes the value of portfolio securities received or delivered as a result of in-kind purchases or redemptions of the fund’s capital shares,
including ETF Creation Units.
See accompanying Notes, which are an integral part of the Financial Statements.
47
Value Index Fund
| | | | | |
| Financial Highlights | | | | | |
| |
| Institutional Shares | | | | | |
| |
| For a Share Outstanding | | | Year Ended December 31, |
| Throughout Each Period | 2010 | 2009 | 2008 | 2007 | 2006 |
| Net Asset Value, Beginning of Period | $18.63 | $16.08 | $25.94 | $26.58 | $22.29 |
| Investment Operations | | | | | |
| Net Investment Income | .496 | .527 | .690 | .722 | .618 |
| Net Realized and Unrealized Gain (Loss) | | | | | |
| on Investments | 2.162 | 2.562 | (9.864) | (.644) | 4.295 |
| Total from Investment Operations | 2.658 | 3.089 | (9.174) | .078 | 4.913 |
| Distributions | | | | | |
| Dividends from Net Investment Income | (.498) | (.539) | (.686) | (.718) | (.623) |
| Distributions from Realized Capital Gains | — | — | — | — | — |
| Total Distributions | (.498) | (.539) | (.686) | (.718) | (.623) |
| Net Asset Value, End of Period | $20.79 | $18.63 | $16.08 | $25.94 | $26.58 |
| |
| Total Return | 14.49% | 19.79% | -35.88% | 0.21% | 22.31% |
| |
| Ratios/Supplemental Data | | | | | |
| Net Assets, End of Period (Millions) | $3,450 | $2,812 | $1,992 | $2,660 | $2,209 |
| Ratio of Total Expenses to | | | | | |
| Average Net Assets | 0.08% | 0.08% | 0.07% | 0.07% | 0.08% |
| Ratio of Net Investment Income to | | | | | |
| Average Net Assets | 2.61% | 3.27% | 3.28% | 2.62% | 2.61% |
| Portfolio Turnover Rate1 | 27% | 31% | 27% | 20% | 20% |
1 Excludes the value of portfolio securities received or delivered as a result of in-kind purchases or redemptions of the fund’s capital shares, including ETF Creation Units.
See accompanying Notes, which are an integral part of the Financial Statements.
48
Value Index Fund
| | | | | |
| Financial Highlights | | | | | |
| |
| ETF Shares | | | | | |
| |
| For a Share Outstanding | | | Year Ended December 31, |
| Throughout Each Period | 2010 | 2009 | 2008 | 2007 | 2006 |
| Net Asset Value, Beginning of Period | $47.75 | $41.21 | $66.51 | $68.14 | $57.14 |
| Investment Operations | | | | | |
| Net Investment Income | 1.252 | 1.324 | 1.754 | 1.830 | 1.565 |
| Net Realized and Unrealized Gain (Loss) | | | | | |
| on Investments | 5.545 | 6.573 | (25.311) | (1.640) | 11.016 |
| Total from Investment Operations | 6.797 | 7.897 | (23.557) | .190 | 12.581 |
| Distributions | | | | | |
| Dividends from Net Investment Income | (1.257) | (1.357) | (1.743) | (1.820) | (1.581) |
| Distributions from Realized Capital Gains | — | — | — | — | — |
| Total Distributions | (1.257) | (1.357) | (1.743) | (1.820) | (1.581) |
| Net Asset Value, End of Period | $53.29 | $47.75 | $41.21 | $66.51 | $68.14 |
| |
| Total Return | 14.45% | 19.72% | -35.91% | 0.20% | 22.28% |
| |
| Ratios/Supplemental Data | | | | | |
| Net Assets, End of Period (Millions) | $4,330 | $3,145 | $2,165 | $2,215 | $1,646 |
| Ratio of Total Expenses to | | | | | |
| Average Net Assets | 0.12% | 0.14% | 0.10% | 0.10% | 0.11% |
| Ratio of Net Investment Income to | | | | | |
| Average Net Assets | 2.57% | 3.21% | 3.25% | 2.59% | 2.58% |
| Portfolio Turnover Rate1 | 27% | 31% | 27% | 20% | 20% |
1 Excludes the value of portfolio securities received or delivered as a result of in-kind purchases or redemptions of the fund’s capital shares, including ETF Creation Units.
See accompanying Notes, which are an integral part of the Financial Statements.
49
Value Index Fund
Notes to Financial Statements
Vanguard Value Index Fund is registered under the Investment Company Act of 1940 as an open-end investment company, or mutual fund. The fund offers five classes of shares: Investor Shares, Admiral Shares, Signal Shares, Institutional Shares, and ETF Shares. Investor Shares are available to any investor who meets the fund’s minimum purchase requirements. Admiral Shares, Signal Shares, and Institutional Shares are designed for investors who meet certain administrative, service, and account-size criteria. ETF Shares are listed for trading on the NYSE Arca, Inc.; they can be purchased and sold through a broker.
A. The following significant accounting policies conform to generally accepted accounting principles for U.S. mutual funds. The fund consistently follows such policies in preparing its financial statements.
1. Security Valuation: Securities are valued as of the close of trading on the New York Stock Exchange (generally 4 p.m., Eastern time) on the valuation date. Equity securities are valued at the latest quoted sales prices or official closing prices taken from the primary market in which each security trades; such securities not traded on the valuation date are valued at the mean of the latest quoted bid and asked prices. Securities for which market quotations are not readily available, or whose values have been materially affected by events occurring before the fund’s pricing time but after the close of the securities’ primary markets, are valued by methods deemed by the board of trustees to represent fair value. Investments in Vanguard Market Liquidity Fund are valued at that fund’s net asset value.
2. Federal Income Taxes: The fund intends to continue to qualify as a regulated investment company and distribute all of its taxable income. Management has analyzed the fund’s tax positions taken for all open federal income tax years (December 31, 2007–2010), and has concluded that no provision for federal income tax is required in the fund’s financial statements.
3. Distributions: Distributions to shareholders are recorded on the ex-dividend date.
4. Security Lending: The fund may lend its securities to qualified institutional borrowers to earn additional income. Security loans are required to be secured at all times by collateral at least equal to the market value of securities loaned. The fund invests cash collateral received in Vanguard Market Liquidity Fund, and records a liability for the return of the collateral, during the period the securities are on loan. Security lending income represents fees charged to borrowers plus income earned on investing cash collateral, less expenses associated with the loan.
5. Other: Dividend income is recorded on the ex-dividend date. Interest income includes income distributions received from Vanguard Market Liquidity Fund and is accrued daily. Security transactions are accounted for on the date securities are bought or sold. Costs used to determine realized gains (losses) on the sale of investment securities are those of the specific securities sold.
Each class of shares has equal rights as to assets and earnings, except that each class separately bears certain class-specific expenses related to maintenance of shareholder accounts (included in Management and Administrative expenses) and shareholder reporting. Marketing and distribution expenses are allocated to each class of shares based on a method approved by the board of trustees. Income, other non-class-specific expenses, and gains and losses on investments are allocated to each class of shares based on its relative net assets.
50
Value Index Fund
B. The Vanguard Group furnishes at cost investment advisory, corporate management, administrative, marketing, and distribution services. The costs of such services are allocated to the fund under methods approved by the board of trustees. The fund has committed to provide up to 0.40% of its net assets in capital contributions to Vanguard. At December 31, 2010, the fund had contributed capital of $2,305,000 to Vanguard (included in Other Assets), representing 0.02% of the fund’s net assets and 0.92% of Vanguard’s capitalization. The fund’s trustees and officers are also directors and officers of Vanguard.
C. Various inputs may be used to determine the value of the fund’s investments. These inputs are summarized in three broad levels for financial statement purposes. The inputs or methodologies used to value securities are not necessarily an indication of the risk associated with investing in those securities.
Level 1—Quoted prices in active markets for identical securities.
Level 2—Other significant observable inputs (including quoted prices for similar securities, interest rates, prepayment speeds, credit risk, etc.).
Level 3—Significant unobservable inputs (including the fund’s own assumptions used to determine the fair value of investments).
At December 31, 2010, 100% of the fund’s investments were valued based on Level 1 inputs.
D. Distributions are determined on a tax basis and may differ from net investment income and realized capital gains for financial reporting purposes. Differences may be permanent or temporary. Permanent differences are reclassified among capital accounts in the financial statements to reflect their tax character. Temporary differences arise when certain items of income, expense, gain, or loss are recognized in different periods for financial statement and tax purposes; these differences will reverse at some time in the future. Differences in classification may also result from the treatment of short-term gains as ordinary income for tax purposes.
During the year ended December 31, 2010, the fund realized $16,227,000 of net capital gains resulting from in-kind redemptions—in which shareholders exchanged fund shares for securities held by the fund rather than for cash. Because such gains are not taxable to the fund, and are not distributed to shareholders, they have been reclassified from accumulated net realized losses to paid-in capital.
For tax purposes, at December 31, 2010, the fund had $1,936,000 of ordinary income available for distribution. The fund had available capital loss carryforwards totaling $2,510,548,000 to offset future net capital gains of $188,450,000 through December 31, 2011, $40,920,000 through December 31, 2014, $73,605,000 through December 31, 2015, $574,313,000 through December 31, 2016, and $1,633,260,000 through December 31, 2017.
At December 31, 2010, the cost of investment securities for tax purposes was $13,579,604,000. Net unrealized appreciation of investment securities for tax purposes was $656,863,000, consisting of unrealized gains of $1,742,031,000 on securities that had risen in value since their purchase and $1,085,168,000 in unrealized losses on securities that had fallen in value since their purchase.
E. During the year ended December 31, 2010, the fund purchased $4,473,890,000 of investment securities and sold $3,363,075,000 of investment securities, other than temporary cash investments.
51
Value Index Fund
F. Capital share transactions for each class of shares were:
| | | | |
| | | | Year Ended December 31, |
| | | 2010 | | 2009 |
| | Amount | Shares | Amount | Shares |
| | ($000) | (000) | ($000) | (000) |
| Investor Shares | | | | |
| Issued | 629,201 | 32,879 | 818,659 | 54,892 |
| Issued in Lieu of Cash Distributions | 69,985 | 3,644 | 84,147 | 5,211 |
| Redeemed | (2,062,793) | (105,302) | (680,161) | (42,723) |
| Net Increase (Decrease)—Investor Shares | (1,363,607) | (68,779) | 222,645 | 17,380 |
| Admiral Shares | | | | |
| Issued | 1,639,299 | 83,030 | 199,402 | 12,749 |
| Issued in Lieu of Cash Distributions | 40,915 | 2,083 | 34,372 | 2,141 |
| Redeemed | (252,722) | (13,118) | (268,468) | (17,098) |
| Net Increase (Decrease)—Admiral Shares | 1,427,492 | 71,995 | (34,694) | (2,208) |
| Signal Shares | | | | |
| Issued | 289,825 | 14,527 | 319,685 | 19,549 |
| Issued in Lieu of Cash Distributions | 20,465 | 1,016 | 21,844 | 1,301 |
| Redeemed | (303,233) | (15,263) | (204,181) | (12,194) |
| Net Increase (Decrease)—Signal Shares | 7,057 | 280 | 137,348 | 8,656 |
| Institutional Shares | | | | |
| Issued | 631,302 | 33,152 | 736,050 | 45,857 |
| Issued in Lieu of Cash Distributions | 73,271 | 3,782 | 68,821 | 4,239 |
| Redeemed | (424,720) | (21,928) | (372,983) | (23,026) |
| Net Increase (Decrease)—Institutional Shares | 279,853 | 15,006 | 431,888 | 27,070 |
| ETF Shares | | | | |
| Issued | 805,945 | 16,295 | 1,503,873 | 34,815 |
| Issued in Lieu of Cash Distributions | — | — | — | — |
| Redeemed | (43,956) | (900) | (945,508) | (21,500) |
| Net Increase (Decrease)—ETF Shares | 761,989 | 15,395 | 558,365 | 13,315 |
G. In preparing the financial statements as of December 31, 2010, management considered the impact of subsequent events for potential recognition or disclosure in these financial statements.
52
Large-Cap Index Fund
Fund Profile
As of December 31, 2010
| | | | | |
| Share-Class Characteristics | | | | | |
| | Investor | Admiral | Signal | Institutional | ETF |
| | Shares | Shares | Shares | Shares | Shares |
| Ticker Symbol | VLACX | VLCAX | VLCSX | VLISX | VV |
| Expense Ratio1 | 0.26% | 0.12% | 0.12% | 0.08% | 0.12% |
| 30-Day SEC Yield | 1.31% | 1.45% | 1.45% | 1.49% | 1.45% |
| | | |
| Portfolio Characteristics | | |
| | | MSCI US | DJ |
| | | Prime | U.S. Total |
| | | Market | Market |
| | Fund | 750 Index | Index |
| Number of Stocks | 759 | 758 | 3,893 |
| Median Market Cap | $39.7B | $39.7B | $29.6B |
| Price/Earnings Ratio | 17.4x | 17.4x | 18.3x |
| Price/Book Ratio | 2.2x | 2.2x | 2.2x |
| Return on Equity | 19.9% | 19.7% | 18.8% |
| Earnings Growth Rate | 6.4% | 6.4% | 6.2% |
| Dividend Yield | 1.8% | 1.8% | 1.7% |
| Foreign Holdings | 0.0% | 0.0% | 0.0% |
| Turnover Rate | 8% | — | — |
| Short-Term Reserves | 0.1% | — | — |
| | |
| Volatility Measures | | |
| | | DJ |
| | MSCI US | U.S. Total |
| | Prime Market | Market |
| | 750 Index | Index |
| R-Squared | 1.00 | 1.00 |
| Beta | 1.00 | 0.97 |
These measures show the degree and timing of the fund’s fluctuations compared with the indexes over 36 months.
| | |
| Ten Largest Holdings (% of total net assets) |
| Exxon Mobil Corp. | Integrated Oil & | |
| | Gas | 3.0% |
| Apple Inc. | Computer | |
| | Hardware | 2.4 |
| Microsoft Corp. | Systems Software | 1.7 |
| General Electric Co. | Industrial | |
| | Conglomerates | 1.6 |
| International Business | IT Consulting & | |
| Machines Corp. | Other Services | 1.5 |
| Chevron Corp. | Integrated Oil & | |
| | Gas | 1.5 |
| Procter & Gamble Co. | Household | |
| | Products | 1.5 |
| AT&T Inc. | Integrated | |
| | Telecommunication | |
| | Services | 1.4 |
| Johnson & Johnson | Pharmaceuticals | 1.4 |
| JPMorgan Chase & Co. | Diversified Financial | |
| | Services | 1.3 |
| Top Ten | | 17.3% |
The holdings listed exclude any temporary cash investments and equity index products.
1 The expense ratios shown are from the prospectus dated April 29, 2010, and represent estimated costs for the current fiscal year. For the fiscal year ended December 31, 2010, the expense ratios were 0.26% for Investor Shares, 0.12% for Admiral Shares, 0.12% for Signal Shares, 0.08% for Institutional Shares, and 0.12% for ETF Shares.
53
Large-Cap Index Fund
| | | |
| Sector Diversification (% of equity exposure) |
| | | MSCI US | DJ |
| | | Prime | U.S. Total |
| | | Market | Market |
| | Fund 750 | Index | Index |
| Consumer | | | |
| Discretionary | 11.1% | 11.1% | 11.9% |
| Consumer Staples | 10.0 | 10.0 | 9.5 |
| Energy | 12.0 | 12.0 | 10.6 |
| Financials | 15.8 | 15.8 | 16.6 |
| Health Care | 11.1 | 11.1 | 10.7 |
| Industrials | 10.8 | 10.8 | 11.4 |
| Information | | | |
| Technology | 18.7 | 18.7 | 18.9 |
| Materials | 4.0 | 4.0 | 4.5 |
| Telecommunication | | | |
| Services | 3.1 | 3.1 | 2.7 |
| Utilities | 3.4 | 3.4 | 3.2 |
Investment Focus
54
Large-Cap Index Fund
Performance Summary
All of the returns in this report represent past performance, which is not a guarantee of future results that may be achieved by the fund. (Current performance may be lower or higher than the performance data cited. For performance data current to the most recent month-end, visit our website at vanguard.com/performance.) Note, too, that both investment returns and principal value can fluctuate widely, so an investor’s shares, when sold, could be worth more or less than their original cost. The returns shown do not reflect taxes that a shareholder would pay on fund distributions or on the sale of fund shares.
Cumulative Performance: January 30, 2004, Through December 31, 2010
Initial Investment of $10,000
| | | | | |
| | | Average Annual Total Returns | |
| | | Periods Ended December 31, 2010 | |
| | | | | Since | Final Value |
| | | One | Five | Inception | of a $10,000 |
| | | Year | Years | (1/30/2004) | Investment |
| | Large-Cap Index Fund Investor Shares | 15.63% | 2.64% | 4.09% | $13,195 |
| •••••••• | Dow Jones U.S. Total Stock Market | | | | |
| | Index | 17.70 | 3.17 | 4.65 | 13,691 |
| – – – – | MSCI US Prime Market 750 Index | 15.92 | 2.79 | 4.24 | 13,328 |
| | Large-Cap Core Funds Average | 12.86 | 1.37 | 2.54 | 11,894 |
Large-Cap Core Funds Average: Derived from data provided by Lipper Inc.
"Since Inception" performance is calculated from the Investor Shares’ inception date for both the fund and its comparative standards.
See Financial Highlights for dividend and capital gains information.
55
Large-Cap Index Fund
| | | | |
| | | Average Annual Total Returns | |
| | | Periods Ended December 31, 2010 | |
| | | | Since | Final Value |
| | One | Five | Inception | of a $10,000 |
| | Year | Years | (2/2/2004) | Investment |
| Large-Cap Index Fund Admiral | | | | |
| Shares | 15.81% | 2.77% | 4.16% | $13,251 |
| Dow Jones U.S. Total Stock Market | | | | |
| Index | 17.70 | 3.17 | 4.61 | 13,651 |
| MSCI US Prime Market 750 Index | 15.92 | 2.79 | 4.19 | 13,283 |
| "Since Inception" performance is calculated from the Admiral Shares’ inception date for both the fund and its comparative standards. |
| | | |
| | | Since | Final Value |
| | One | Inception | of a $10,000 |
| | Year | (8/30/2007) | Investment |
| Large-Cap Index Fund Signal Shares | 15.83% | -1.54% | $9,494 |
| Dow Jones U.S. Total Stock Market | | | |
| Index | 17.70 | -0.94 | 9,691 |
| MSCI US Prime Market 750 Index | 15.92 | -1.54 | 9,495 |
| "Since Inception" performance is calculated from the Signal Shares’ inception date for both the fund and its comparative standards. |
| | | | |
| | | | Since | Final Value |
| | One | Five | Inception | of a $5,000,000 |
| | Year | Years | (6/30/2005) | Investment |
| Large-Cap Index Fund Institutional | | | | |
| Shares | 15.85% | 2.80% | 3.68% | $6,099,807 |
| Dow Jones U.S. Total Stock Market | | | | |
| Index | 17.70 | 3.17 | 4.02 | 6,212,093 |
| MSCI US Prime Market 750 Index | 15.92 | 2.79 | 3.67 | 6,098,129 |
| "Since Inception" performance is calculated from the Institutional Shares’ inception date for both the fund and its comparative standards. |
| | | | |
| | | | Since | Final Value |
| | One | Five | Inception | of a $10,000 |
| | Year | Years | (1/27/2004) | Investment |
| Large-Cap Index Fund | | | | |
| ETF Shares Net Asset Value | 15.81% | 2.78% | 4.05% | $13,164 |
| Dow Jones U.S. Total Stock Market Index | 17.70 | 3.17 | 4.44 | 13,515 |
| MSCI US Prime Market 750 Index | 15.92 | 2.79 | 4.07 | 13,181 |
| "Since Inception" performance is calculated from the ETF Shares’ inception date for both the fund and its comparative standards. |
56
Large-Cap Index Fund
| | | |
| Cumulative Returns of ETF Shares: January 27, 2004, Through December 31, 2010 | |
| | | | Since |
| | One | Five | Inception |
| | Year | Years | (1/27/2004) |
| Large-Cap Index Fund | | | |
| ETF Shares Market Price | 15.84% | 14.68% | 31.69% |
| Large-Cap Index Fund | | | |
| ETF Shares Net Asset Value | 15.81 | 14.71 | 31.64 |
| MSCI US Prime Market 750 Index | 15.92 | 14.74 | 31.81 |
| "Since Inception" performance is calculated from the ETF Shares’ inception date for both the fund and its comparative standard. | |
Fiscal-Year Total Returns (%): January 30, 2004, Through December 31, 2010
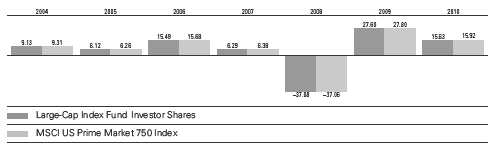
57
Large-Cap Index Fund
Financial Statements
Statement of Net Assets
As of December 31, 2010
The fund reports a complete list of its holdings in regulatory filings four times in each fiscal year, at the quarter-ends. For the second and fourth fiscal quarters, the lists appear in the fund’s semiannual and annual reports to shareholders. For the first and third fiscal quarters, the fund files the lists with the Securities and Exchange Commission on Form N-Q. Shareholders can look up the fund’s Forms N-Q on the SEC’s website at sec.gov. Forms N-Q may also be reviewed and copied at the SEC’s Public Reference Room (see the back cover of this report for further information).
| | | |
| | | | Market |
| | | | Value |
| | | Shares | ($000) |
| Common Stocks (99.8%)1 | | |
| Consumer Discretionary (11.1%) | |
| | McDonald’s Corp. | 384,625 | 29,524 |
| | Walt Disney Co. | 656,507 | 24,626 |
| * | Amazon.com Inc. | 129,490 | 23,308 |
| | Home Depot Inc. | 607,158 | 21,287 |
| * | Ford Motor Co. | 1,095,385 | 18,392 |
| | Comcast Corp. Class A | 692,199 | 15,208 |
| | Target Corp. | 247,629 | 14,890 |
| | Time Warner Inc. | 406,264 | 13,070 |
| | Lowe’s Cos. Inc. | 507,122 | 12,719 |
| * | DIRECTV Class A | 313,235 | 12,507 |
| | NIKE Inc. Class B | 134,284 | 11,471 |
| | News Corp. Class A | 781,745 | 11,382 |
| | Johnson Controls Inc. | 243,101 | 9,286 |
| | Starbucks Corp. | 267,258 | 8,587 |
| | Time Warner Cable Inc. | 128,355 | 8,475 |
| | Yum! Brands Inc. | 168,668 | 8,273 |
| | Viacom Inc. Class B | 200,801 | 7,954 |
| | Carnival Corp. | 165,868 | 7,648 |
| * | General Motors Co. | 189,691 | 6,992 |
| * | priceline.com Inc. | 17,470 | 6,980 |
| | Comcast Corp. Class A | | |
| | Special Shares | 318,448 | 6,627 |
| | TJX Cos. Inc. | 147,378 | 6,542 |
| | Staples Inc. | 263,871 | 6,008 |
| | Coach Inc. | 107,399 | 5,940 |
| * | Kohl’s Corp. | 105,589 | 5,738 |
| * | Las Vegas Sands Corp. | 119,307 | 5,482 |
| | Omnicom Group Inc. | 108,905 | 4,988 |
| * | Bed Bath & Beyond Inc. | 95,360 | 4,687 |
| | Best Buy Co. Inc. | 128,024 | 4,390 |
| | Marriott International Inc. | | |
| | Class A | 104,899 | 4,357 |
| | CBS Corp. Class B | 227,595 | 4,336 |
| | Starwood Hotels & | | |
| | Resorts Worldwide Inc. | 68,723 | 4,177 |
| | McGraw-Hill Cos. Inc. | 111,684 | 4,066 |
| | Macy’s Inc. | 152,563 | 3,860 |
| | | | |
| | | | | Market |
| | | | | Value |
| | | | Shares | ($000) |
| | Stanley Black & Decker Inc. | 56,745 | 3,795 |
| | Gap Inc. | | 164,193 | 3,635 |
| | Fortune Brands Inc. | | 55,114 | 3,321 |
| | Mattel Inc. | | 130,020 | 3,306 |
| * | Liberty Media Corp. - | | | |
| | Interactive | | 205,078 | 3,234 |
| | Virgin Media Inc. | | 113,991 | 3,105 |
| | Limited Brands Inc. | | 99,664 | 3,063 |
| | Cablevision Systems Corp. | | |
| | Class A | | 90,257 | 3,054 |
| * | O’Reilly Automotive Inc. | 50,150 | 3,030 |
| | Wynn Resorts Ltd. | | 29,065 | 3,018 |
| * | BorgWarner Inc. | | 41,242 | 2,984 |
| | Harley-Davidson Inc. | | 85,035 | 2,948 |
| | Genuine Parts Co. | | 56,832 | 2,918 |
| | Tiffany & Co. | | 45,824 | 2,853 |
| * | NetFlix Inc. | | 16,112 | 2,831 |
| | Ross Stores Inc. | | 43,991 | 2,782 |
| * | AutoZone Inc. | | 10,196 | 2,779 |
| | VF Corp. | | 31,236 | 2,692 |
| | Nordstrom Inc. | | 63,328 | 2,684 |
| | Polo Ralph Lauren Corp. | | |
| | Class A | | 23,476 | 2,604 |
| * | CarMax Inc. | | 80,842 | 2,577 |
| * | Dollar Tree Inc. | | 45,910 | 2,575 |
| | Autoliv Inc. | | 32,060 | 2,531 |
| | JC Penney Co. Inc. | | 76,927 | 2,485 |
| | Whirlpool Corp. | | 27,456 | 2,439 |
| * | Chipotle Mexican Grill Inc. | | |
| | Class A | | 11,213 | 2,385 |
| * | Royal Caribbean | | | |
| | Cruises Ltd. | | 50,575 | 2,377 |
| * | Sirius XM Radio Inc. | 1,405,246 | 2,305 |
| | Family Dollar Stores Inc. | 45,599 | 2,267 |
| | Darden Restaurants Inc. | 47,567 | 2,209 |
| | Hasbro Inc. | | 45,483 | 2,146 |
| * | Discovery | | | |
| | Communications Inc. | | |
| | Class A | | 49,241 | 2,053 |
| | Advance Auto Parts Inc. | 30,509 | 2,018 |
58
Large-Cap Index Fund
| | | |
| | | | Market |
| | | | Value |
| | | Shares | ($000) |
| * | TRW Automotive | | |
| | Holdings Corp. | 37,426 | 1,972 |
| | Wyndham Worldwide Corp. | 64,520 | 1,933 |
| | International | | |
| | Game Technology | 107,424 | 1,900 |
| * | Apollo Group Inc. Class A | 47,830 | 1,889 |
| | Expedia Inc. | 74,960 | 1,881 |
| * | Interpublic Group of | | |
| | Cos. Inc. | 176,765 | 1,877 |
| * | Discovery | | |
| | Communications Inc. | 51,041 | 1,873 |
| | Abercrombie & Fitch Co. | 31,949 | 1,841 |
| | Newell Rubbermaid Inc. | 100,330 | 1,824 |
| * | MGM Resorts International | 121,931 | 1,811 |
| * | Lear Corp. | 17,864 | 1,763 |
| * | Urban Outfitters Inc. | 48,619 | 1,741 |
| | PetSmart Inc. | 42,859 | 1,707 |
| | Scripps Networks | | |
| | Interactive Inc. Class A | 32,931 | 1,704 |
| * | Liberty Media Corp. - Capital | 26,082 | 1,632 |
| * | Liberty Global Inc. Class A | 43,180 | 1,528 |
| | Phillips-Van Heusen Corp. | 23,975 | 1,511 |
| * | DISH Network Corp. Class A | 75,338 | 1,481 |
| * | NVR Inc. | 2,005 | 1,385 |
| * | Fossil Inc. | 19,413 | 1,368 |
| * | Liberty Global Inc. | 39,388 | 1,335 |
| | H&R Block Inc. | 111,500 | 1,328 |
| ^ | Garmin Ltd. | 42,175 | 1,307 |
| | Gannett Co. Inc. | 85,957 | 1,297 |
| | DR Horton Inc. | 103,751 | 1,238 |
| * | Dick’s Sporting Goods Inc. | 32,842 | 1,232 |
| | Leggett & Platt Inc. | 52,915 | 1,204 |
| * | Mohawk Industries Inc. | 21,111 | 1,198 |
| *,^ | Sears Holdings Corp. | 16,039 | 1,183 |
| * | GameStop Corp. Class A | 51,599 | 1,181 |
| * | Liberty Media Corp. - Starz | 17,704 | 1,177 |
| * | Harman International | | |
| | Industries Inc. | 25,209 | 1,167 |
| * | Dollar General Corp. | 37,079 | 1,137 |
| * | LKQ Corp. | 49,119 | 1,116 |
| | Foot Locker Inc. | 56,628 | 1,111 |
| | DeVry Inc. | 23,108 | 1,109 |
| | Lennar Corp. Class A | 55,539 | 1,041 |
| | Guess? Inc. | 21,836 | 1,033 |
| * | Goodyear Tire & Rubber Co. | 83,759 | 993 |
| | American Eagle | | |
| | Outfitters Inc. | 67,073 | 981 |
| * | Toll Brothers Inc. | 50,955 | 968 |
| * | Pulte Group Inc. | 124,804 | 939 |
| | Washington Post Co. | | |
| | Class B | 2,123 | 933 |
| * | Penn National Gaming Inc. | 23,838 | 838 |
| * | Lamar Advertising Co. | | |
| | Class A | 20,911 | 833 |
| * | ITT Educational Services Inc. | 12,101 | 771 |
| | | | |
| | | | | Market |
| | | | | Value |
| | | | Shares | ($000) |
| | Brinker International Inc. | 36,541 | 763 |
| | Strayer Education Inc. | | 5,008 | 762 |
| * | Hyatt Hotels Corp. Class A | 15,948 | 730 |
| | News Corp. Class B | | 36,857 | 605 |
| | Wendy’s/Arby’s Group Inc. | | |
| | Class A | | 120,766 | 558 |
| | CTC Media Inc. | | 19,721 | 462 |
| * | AutoNation Inc. | | 15,801 | 446 |
| * | Clear Channel Outdoor | | |
| | Holdings Inc. Class A | 14,678 | 206 |
| * | Krispy Kreme | | | |
| | Doughnuts Inc. | | | |
| | Warrants Exp. 03/02/2012 | 20 | — |
| | | | | 502,583 |
| Consumer Staples (10.0%) | | |
| | Procter & Gamble Co. | 1,025,239 | 65,954 |
| | Coca-Cola Co. | | 751,071 | 49,398 |
| | Wal-Mart Stores Inc. | | 737,273 | 39,761 |
| | Philip Morris | | | |
| | International Inc. | | 662,224 | 38,760 |
| | PepsiCo Inc. | | 574,830 | 37,554 |
| | Kraft Foods Inc. | | 630,195 | 19,857 |
| | Altria Group Inc. | | 752,985 | 18,538 |
| | CVS Caremark Corp. | | 489,978 | 17,037 |
| | Colgate-Palmolive Co. | | 175,626 | 14,115 |
| | Walgreen Co. | | 351,688 | 13,702 |
| | Costco Wholesale Corp. | 158,750 | 11,463 |
| | Kimberly-Clark Corp. | | 147,968 | 9,328 |
| | General Mills Inc. | | 232,042 | 8,258 |
| | Archer-Daniels-Midland Co. | 232,364 | 6,989 |
| | Sysco Corp. | | 212,617 | 6,251 |
| | HJ Heinz Co. | | 114,963 | 5,686 |
| | Kroger Co. | | 220,454 | 4,929 |
| | Kellogg Co. | | 95,502 | 4,878 |
| | Mead Johnson Nutrition Co. | 73,917 | 4,601 |
| | Avon Products Inc. | | 154,967 | 4,503 |
| | Lorillard Inc. | | 54,813 | 4,498 |
| | Reynolds American Inc. | 126,431 | 4,124 |
| | Sara Lee Corp. | | 227,311 | 3,980 |
| | ConAgra Foods Inc. | | 158,832 | 3,586 |
| | Estee Lauder Cos. Inc. | | |
| | Class A | | 41,122 | 3,319 |
| | Clorox Co. | | 50,265 | 3,181 |
| | Bunge Ltd. | | 48,208 | 3,159 |
| | Safeway Inc. | | 137,925 | 3,102 |
| | Coca-Cola Enterprises Inc. | 123,540 | 3,092 |
| | Dr Pepper Snapple | | | |
| | Group Inc. | | 86,267 | 3,033 |
| | Molson Coors Brewing Co. | | |
| | Class B | | 58,500 | 2,936 |
| | JM Smucker Co. | | 43,194 | 2,836 |
| | Hershey Co. | | 56,964 | 2,686 |
| * | Whole Foods Market Inc. | 52,675 | 2,665 |
| | Campbell Soup Co. | | 73,656 | 2,560 |
| | Brown-Forman Corp. Class B | 29,402 | 2,047 |
59
Large-Cap Index Fund
| | | | |
| | | | | Market |
| | | | | Value |
| | | | Shares | ($000) |
| | McCormick & Co. Inc. | | 43,640 | 2,031 |
| | Tyson Foods Inc. Class A | 105,722 | 1,821 |
| | Church & Dwight Co. Inc. | 25,720 | 1,775 |
| * | Energizer Holdings Inc. | 24,109 | 1,758 |
| * | Constellation Brands Inc. | | |
| | Class A | | 67,684 | 1,499 |
| | Herbalife Ltd. | | 21,397 | 1,463 |
| * | Hansen Natural Corp. | | 27,028 | 1,413 |
| | Hormel Foods Corp. | | 26,566 | 1,362 |
| * | Green Mountain Coffee | | |
| | Roasters Inc. | | 40,621 | 1,335 |
| * | Ralcorp Holdings Inc. | | 19,873 | 1,292 |
| | Alberto-Culver Co. Class B | 32,153 | 1,191 |
| * | Smithfield Foods Inc. | | 54,235 | 1,119 |
| | Flowers Foods Inc. | | 30,116 | 810 |
| | SUPERVALU Inc. | | 76,372 | 735 |
| * | Dean Foods Co. | | 66,524 | 588 |
| | | | | 452,558 |
| Energy (12.0%) | | | |
| | Exxon Mobil Corp. | 1,839,806 | 134,527 |
| | Chevron Corp. | | 726,509 | 66,294 |
| | Schlumberger Ltd. | | 493,775 | 41,230 |
| | ConocoPhillips | | 509,210 | 34,677 |
| | Occidental Petroleum Corp. | 293,503 | 28,793 |
| | Apache Corp. | | 138,133 | 16,470 |
| | Anadarko Petroleum Corp. | 178,877 | 13,623 |
| | Halliburton Co. | | 329,644 | 13,459 |
| | Devon Energy Corp. | | 149,413 | 11,730 |
| | National Oilwell Varco Inc. | 151,516 | 10,189 |
| | Marathon Oil Corp. | | 256,412 | 9,495 |
| | Baker Hughes Inc. | | 155,665 | 8,899 |
| | Hess Corp. | | 109,736 | 8,399 |
| | EOG Resources Inc. | | 91,530 | 8,367 |
| | Peabody Energy Corp. | 97,205 | 6,219 |
| | Chesapeake Energy Corp. | 236,264 | 6,122 |
| * | Weatherford | | | |
| | International Ltd. | | 267,804 | 6,106 |
| | Spectra Energy Corp. | | 234,158 | 5,852 |
| | Noble Energy Inc. | | 63,187 | 5,439 |
| | Williams Cos. Inc. | | 211,228 | 5,222 |
| | Murphy Oil Corp. | | 65,858 | 4,910 |
| | Valero Energy Corp. | | 204,655 | 4,732 |
| * | Southwestern Energy Co. | 125,039 | 4,680 |
| * | Cameron International Corp. | 87,533 | 4,440 |
| | Consol Energy Inc. | | 81,529 | 3,974 |
| * | FMC Technologies Inc. | 43,417 | 3,860 |
| | Pioneer Natural | | | |
| | Resources Co. | | 41,970 | 3,644 |
| | El Paso Corp. | | 253,835 | 3,493 |
| * | Newfield Exploration Co. | 48,278 | 3,481 |
| | Noble Corp. | | 92,413 | 3,306 |
| * | Concho Resources Inc. | 31,612 | 2,771 |
| | Cimarex Energy Co. | | 30,390 | 2,690 |
| * | Ultra Petroleum Corp. | | 55,088 | 2,632 |
| * | Denbury Resources Inc. | 137,093 | 2,617 |
| | | | | |
| | | | | | Market |
| | | | | | Value |
| | | | | Shares | ($000) |
| * | Alpha Natural Resources Inc. | 43,538 | 2,614 |
| | Range Resources Corp. | | 57,804 | 2,600 |
| * | Nabors Industries Ltd. | | 102,801 | 2,412 |
| | QEP Resources Inc. | | | 63,324 | 2,299 |
| | EQT Corp. | | | 51,046 | 2,289 |
| * | Whiting Petroleum Corp. | | 18,451 | 2,162 |
| * | Pride International Inc. | | 63,522 | 2,096 |
| | Arch Coal Inc. | | | 58,685 | 2,057 |
| * | Petrohawk Energy Corp. | | 109,353 | 1,996 |
| * | Kinder Morgan | | | | |
| | Management LLC | | | 29,252 | 1,956 |
| | Massey Energy Co. | | | 34,885 | 1,872 |
| | Helmerich & Payne Inc. | | 38,318 | 1,858 |
| | Sunoco Inc. | | | 43,601 | 1,758 |
| * | McDermott International Inc. | 83,730 | 1,732 |
| | Diamond Offshore | | | | |
| | Drilling Inc. | | | 25,109 | 1,679 |
| * | Plains Exploration & | | | | |
| | Production Co. | | | 50,560 | 1,625 |
| * | Forest Oil Corp. | | | 38,986 | 1,480 |
| * | Rowan Cos. Inc. | | | 41,407 | 1,445 |
| * | Oceaneering International Inc. | 19,572 | 1,441 |
| | Core Laboratories NV | | 16,153 | 1,438 |
| | Cabot Oil & Gas Corp. | | 37,644 | 1,425 |
| | EXCO Resources Inc. | | 65,490 | 1,272 |
| * | Dresser-Rand Group Inc. | | 29,253 | 1,246 |
| | Patterson-UTI Energy Inc. | | 55,823 | 1,203 |
| | Southern Union Co. | | | 42,752 | 1,029 |
| | Tidewater Inc. | | | 18,640 | 1,004 |
| * | Tesoro Corp. | | | 51,708 | 959 |
| * | Continental Resources Inc. | | 12,202 | 718 |
| * | Quicksilver Resources Inc. | | 43,269 | 638 |
| * | Cobalt International | | | | |
| | Energy Inc. | | | 32,285 | 394 |
| | | | | | 541,039 |
| Financials (15.8%) | | | | |
| | JPMorgan Chase & Co. | 1,432,702 | 60,775 |
| | Wells Fargo & Co. | | 1,796,504 | 55,674 |
| * | Citigroup Inc. | 10,496,372 | 49,648 |
| | Bank of America Corp. | 3,624,031 | 48,345 |
| | Goldman Sachs Group Inc. | | 176,986 | 29,762 |
| * | Berkshire Hathaway Inc. | | | |
| | Class B | | | 309,153 | 24,766 |
| | US Bancorp | | | 692,725 | 18,683 |
| | American Express Co. | | 391,325 | 16,796 |
| | MetLife Inc. | | | 338,052 | 15,023 |
| | Bank of New York | | | | |
| | Mellon Corp. | | | 438,685 | 13,248 |
| | Morgan Stanley | | | 454,331 | 12,362 |
| | PNC Financial Services | | | |
| | Group Inc. | | | 189,818 | 11,526 |
| | Simon Property Group Inc. | | 105,912 | 10,537 |
| | Prudential Financial Inc. | | 168,051 | 9,866 |
| | Aflac Inc. | | | 170,147 | 9,601 |
| | Travelers Cos. Inc. | | | 169,838 | 9,462 |
60
Large-Cap Index Fund
| | | |
| | | | Market |
| | | | Value |
| | | Shares | ($000) |
| | State Street Corp. | 181,273 | 8,400 |
| | CME Group Inc. | 24,276 | 7,811 |
| | ACE Ltd. | 122,337 | 7,615 |
| | Capital One Financial Corp. | 164,993 | 7,022 |
| | Chubb Corp. | 113,588 | 6,774 |
| | BB&T Corp. | 250,355 | 6,582 |
| | Franklin Resources Inc. | 57,033 | 6,343 |
| | Charles Schwab Corp. | 366,588 | 6,272 |
| | BlackRock Inc. | 31,807 | 6,062 |
| | T Rowe Price Group Inc. | 92,562 | 5,974 |
| | Allstate Corp. | 184,718 | 5,889 |
| | Marsh & McLennan | | |
| | Cos. Inc. | 196,025 | 5,359 |
| | SunTrust Banks Inc. | 180,654 | 5,331 |
| | Equity Residential | 102,389 | 5,319 |
| | Public Storage | 52,280 | 5,302 |
| | Ameriprise Financial Inc. | 90,715 | 5,221 |
| | Vornado Realty Trust | 59,298 | 4,941 |
| | AON Corp. | 107,096 | 4,927 |
| | HCP Inc. | 131,803 | 4,849 |
| | Loews Corp. | 120,923 | 4,705 |
| | Progressive Corp. | 229,159 | 4,553 |
| | Northern Trust Corp. | 78,762 | 4,364 |
| | Boston Properties Inc. | 50,381 | 4,338 |
| | Host Hotels & Resorts Inc. | 239,541 | 4,281 |
| | Fifth Third Bancorp | 287,730 | 4,224 |
| | Hartford Financial | | |
| | Services Group Inc. | 152,544 | 4,041 |
| | Invesco Ltd. | 166,970 | 4,017 |
| | Annaly Capital | | |
| | Management Inc. | 224,009 | 4,014 |
| | Principal Financial | | |
| | Group Inc. | 115,749 | 3,769 |
| | Weyerhaeuser Co. | 193,165 | 3,657 |
| | Discover Financial Services | 196,625 | 3,643 |
| | AvalonBay | | |
| | Communities Inc. | 30,827 | 3,470 |
| * | CIT Group Inc. | 68,701 | 3,236 |
| | Regions Financial Corp. | 453,786 | 3,176 |
| | Lincoln National Corp. | 114,196 | 3,176 |
| | Ventas Inc. | 56,789 | 2,980 |
| | ProLogis | 200,797 | 2,900 |
| | Unum Group | 117,748 | 2,852 |
| | NYSE Euronext | 94,051 | 2,820 |
| | KeyCorp | 318,118 | 2,815 |
| | New York Community | | |
| | Bancorp Inc. | 149,069 | 2,810 |
| * | Intercontinental- | | |
| | Exchange Inc. | 22,720 | 2,707 |
| | Comerica Inc. | 63,730 | 2,692 |
| | XL Group plc Class A | 123,278 | 2,690 |
| | Kimco Realty Corp. | 146,240 | 2,638 |
| | M&T Bank Corp. | 30,197 | 2,629 |
| * | American International | | |
| | Group Inc. | 43,991 | 2,535 |
| | | |
| | | | Market |
| | | | Value |
| | | Shares | ($000) |
| | Health Care REIT Inc. | 52,413 | 2,497 |
| | General Growth | | |
| | Properties Inc. | 153,036 | 2,369 |
| * | Genworth Financial Inc. | | |
| | Class A | 176,885 | 2,324 |
| | Macerich Co. | 47,067 | 2,230 |
| * | SLM Corp. | 175,537 | 2,210 |
| | Plum Creek Timber Co. Inc. | 58,383 | 2,186 |
| | Hudson City Bancorp Inc. | 171,497 | 2,185 |
| * | CB Richard Ellis Group Inc. | | |
| | Class A | 104,722 | 2,145 |
| | Huntington Bancshares Inc. | 310,987 | 2,136 |
| | Willis Group Holdings plc | 61,314 | 2,123 |
| | PartnerRe Ltd. | 25,970 | 2,087 |
| | Leucadia National Corp. | 70,136 | 2,047 |
| | Legg Mason Inc. | 55,869 | 2,026 |
| | AMB Property Corp. | 60,782 | 1,927 |
| | SL Green Realty Corp. | 28,320 | 1,912 |
| | Moody’s Corp. | 71,973 | 1,910 |
| | People’s United | | |
| | Financial Inc. | 134,056 | 1,878 |
| * | Affiliated Managers | | |
| | Group Inc. | 18,419 | 1,828 |
| | Cincinnati Financial Corp. | 55,889 | 1,771 |
| | Torchmark Corp. | 29,251 | 1,747 |
| | Federal Realty | | |
| | Investment Trust | 22,167 | 1,727 |
| | Everest Re Group Ltd. | 20,340 | 1,725 |
| | Nationwide Health | | |
| | Properties Inc. | 44,838 | 1,631 |
| | Digital Realty Trust Inc. | 31,379 | 1,617 |
| * | MSCI Inc. Class A | 40,791 | 1,589 |
| * | Arch Capital Group Ltd. | 17,958 | 1,581 |
| | TD Ameritrade Holding Corp. | 83,260 | 1,581 |
| | UDR Inc. | 64,955 | 1,528 |
| | Rayonier Inc. | 28,986 | 1,522 |
| | Zions Bancorporation | 62,729 | 1,520 |
| | Chimera Investment Corp. | 364,460 | 1,498 |
| | Assurant Inc. | 38,514 | 1,484 |
| | Axis Capital Holdings Ltd. | 41,158 | 1,477 |
| | Realty Income Corp. | 42,389 | 1,450 |
| | Alexandria Real Estate | | |
| | Equities Inc. | 19,570 | 1,434 |
| | Reinsurance Group of | | |
| | America Inc. Class A | 26,505 | 1,424 |
| | WR Berkley Corp. | 48,212 | 1,320 |
| | Liberty Property Trust | 40,949 | 1,307 |
| | Eaton Vance Corp. | 42,847 | 1,295 |
| | Jones Lang LaSalle Inc. | 15,415 | 1,294 |
| * | Markel Corp. | 3,357 | 1,269 |
| | RenaissanceRe | | |
| | Holdings Ltd. | 19,770 | 1,259 |
| | Marshall & Ilsley Corp. | 180,774 | 1,251 |
| | Regency Centers Corp. | 29,564 | 1,249 |
61
Large-Cap Index Fund
| | | | |
| | | | | Market |
| | | | | Value |
| | | | Shares | ($000) |
| | Old Republic | | | |
| | International Corp. | | 88,787 | 1,210 |
| | Cullen/Frost Bankers Inc. | | 19,748 | 1,207 |
| | HCC Insurance Holdings Inc. | 41,587 | 1,204 |
| | Transatlantic Holdings Inc. | | 23,033 | 1,189 |
| | Raymond James | | | |
| | Financial Inc. | | 35,816 | 1,171 |
| | SEI Investments Co. | | 47,714 | 1,135 |
| | Duke Realty Corp. | | 91,066 | 1,135 |
| * | NASDAQ OMX Group Inc. | | 47,603 | 1,129 |
| * | First Horizon National Corp. | | 94,533 | 1,114 |
| | Fidelity National Financial Inc. | |
| | Class A | | 78,715 | 1,077 |
| | Commerce Bancshares Inc. | 26,995 | 1,073 |
| | Jefferies Group Inc. | | 40,190 | 1,070 |
| | Brown & Brown Inc. | | 43,894 | 1,051 |
| | City National Corp. | | 16,954 | 1,040 |
| | Hospitality Properties Trust | | 44,666 | 1,029 |
| | Assured Guaranty Ltd. | | 56,470 | 1,000 |
| | Weingarten Realty Investors | 41,415 | 984 |
| | White Mountains Insurance | | |
| | Group Ltd. | | 2,752 | 924 |
| | Associated Banc-Corp | | 59,743 | 905 |
| | American Financial | | | |
| | Group Inc. | | 27,339 | 883 |
| | Federated Investors Inc. | | | |
| | Class B | | 33,493 | 877 |
| | Janus Capital Group Inc. | | 66,230 | 859 |
| | Greenhill & Co. Inc. | | 9,038 | 738 |
| *,^ | St. Joe Co. | | 33,530 | 733 |
| | Piedmont Office Realty | | | |
| | Trust Inc. Class A | | 33,719 | 679 |
| | Validus Holdings Ltd. | | 21,965 | 672 |
| | Capitol Federal Financial Inc. | 51,416 | 612 |
| | BOK Financial Corp. | | 9,789 | 523 |
| | Mercury General Corp. | | 9,889 | 425 |
| | TFS Financial Corp. | | 33,116 | 299 |
| * | LPL Investment Holdings Inc. 5,811 | 211 |
| | CBOE Holdings Inc. | | 4,415 | 101 |
| | | | | 712,628 |
| Health Care (11.1%) | | | |
| | Johnson & Johnson | | 995,322 | 61,561 |
| | Pfizer Inc. | 2,904,385 | 50,856 |
| | Merck & Co. Inc. | 1,110,577 | 40,025 |
| | Abbott Laboratories | | 557,675 | 26,718 |
| * | Amgen Inc. | | 346,353 | 19,015 |
| | Bristol-Myers Squibb Co. | | 619,566 | 16,406 |
| | UnitedHealth Group Inc. | | 406,236 | 14,669 |
| | Medtronic Inc. | | 391,302 | 14,513 |
| | Eli Lilly & Co. | | 374,988 | 13,140 |
| * | Gilead Sciences Inc. | | 303,034 | 10,982 |
| | Baxter International Inc. | | 211,214 | 10,692 |
| * | Express Scripts Inc. | | 186,188 | 10,063 |
| * | Celgene Corp. | | 169,874 | 10,046 |
| * | Medco Health Solutions Inc. 156,711 | 9,602 |
| | | |
| | | | Market |
| | | | Value |
| | | Shares | ($000) |
| | Covidien plc | 181,119 | 8,270 |
| * | WellPoint Inc. | 144,341 | 8,207 |
| * | Thermo Fisher Scientific Inc. | 147,090 | 8,143 |
| | Allergan Inc. | 111,042 | 7,625 |
| | Becton Dickinson and Co. | 83,911 | 7,092 |
| | McKesson Corp. | 94,445 | 6,647 |
| * | Genzyme Corp. | 92,043 | 6,553 |
| * | Biogen Idec Inc. | 87,415 | 5,861 |
| | Stryker Corp. | 107,467 | 5,771 |
| * | Agilent Technologies Inc. | 125,764 | 5,210 |
| * | St. Jude Medical Inc. | 121,829 | 5,208 |
| | Cardinal Health Inc. | 126,860 | 4,860 |
| | Aetna Inc. | 150,859 | 4,603 |
| * | Boston Scientific Corp. | 547,975 | 4,148 |
| * | Zimmer Holdings Inc. | 72,633 | 3,899 |
| * | Life Technologies Corp. | 66,236 | 3,676 |
| | CIGNA Corp. | 99,934 | 3,664 |
| * | Intuitive Surgical Inc. | 14,189 | 3,657 |
| | AmerisourceBergen Corp. | | |
| | Class A | 100,780 | 3,439 |
| * | Hospira Inc. | 60,497 | 3,369 |
| * | Humana Inc. | 61,185 | 3,349 |
| * | Edwards Lifesciences Corp. | 40,984 | 3,313 |
| * | Forest Laboratories Inc. | 103,180 | 3,300 |
| * | Laboratory Corp. of | | |
| | America Holdings | 37,201 | 3,271 |
| | CR Bard Inc. | 33,916 | 3,112 |
| * | Varian Medical Systems Inc. | 44,006 | 3,049 |
| | Quest Diagnostics Inc. | 54,295 | 2,930 |
| * | Illumina Inc. | 44,794 | 2,837 |
| * | Alexion Pharmaceuticals Inc. | 32,597 | 2,626 |
| * | Waters Corp. | 33,310 | 2,589 |
| * | DaVita Inc. | 37,088 | 2,577 |
| * | Vertex Pharmaceuticals Inc. | 73,080 | 2,560 |
| * | Watson Pharmaceuticals Inc. | 47,890 | 2,474 |
| * | Cerner Corp. | 25,363 | 2,403 |
| * | Mylan Inc. | 111,824 | 2,363 |
| * | CareFusion Corp. | 80,148 | 2,060 |
| * | Henry Schein Inc. | 33,110 | 2,033 |
| | Perrigo Co. | 29,854 | 1,891 |
| * | ResMed Inc. | 54,554 | 1,890 |
| | Beckman Coulter Inc. | 25,046 | 1,884 |
| * | Mettler-Toledo | | |
| | International Inc. | 12,071 | 1,825 |
| * | Dendreon Corp. | 52,075 | 1,818 |
| * | Hologic Inc. | 93,748 | 1,764 |
| | DENTSPLY International Inc. | 49,020 | 1,675 |
| * | Cephalon Inc. | 27,042 | 1,669 |
| * | Human Genome | | |
| | Sciences Inc. | 67,898 | 1,622 |
| * | Endo Pharmaceuticals | | |
| | Holdings Inc. | 41,672 | 1,488 |
| * | IDEXX Laboratories Inc. | 20,753 | 1,437 |
| * | Coventry Health Care Inc. | 53,613 | 1,415 |
62
Large-Cap Index Fund
| | | | |
| | | | | Market |
| | | | | Value |
| | | | Shares | ($000) |
| | Universal Health | | | |
| | Services Inc. Class B | 32,446 | 1,409 |
| * | Community Health | | | |
| | Systems Inc. | | 34,170 | 1,277 |
| * | King Pharmaceuticals Inc. | 89,810 | 1,262 |
| * | Covance Inc. | | 23,437 | 1,205 |
| | Pharmaceutical Product | | |
| | Development Inc. | | 40,877 | 1,109 |
| | Omnicare Inc. | | 42,682 | 1,084 |
| * | Alere Inc. | | 29,172 | 1,068 |
| * | Gen-Probe Inc. | | 17,557 | 1,024 |
| | Patterson Cos. Inc. | | 33,382 | 1,022 |
| * | Kinetic Concepts Inc. | | 23,316 | 976 |
| | Lincare Holdings Inc. | | 35,599 | 955 |
| | Warner Chilcott plc | | | |
| | Class A | | 41,071 | 927 |
| * | Charles River Laboratories | | |
| | International Inc. | | 23,851 | 848 |
| | Techne Corp. | | 12,742 | 837 |
| * | Myriad Genetics Inc. | | 33,900 | 774 |
| * | Amylin Pharmaceuticals Inc. | 51,988 | 765 |
| * | Bio-Rad Laboratories Inc. | | |
| | Class A | | 6,969 | 724 |
| | | | | 502,680 |
| Industrials (10.8%) | | | |
| | General Electric Co. | 3,862,983 | 70,654 |
| | United Technologies Corp. | 318,894 | 25,103 |
| | Caterpillar Inc. | | 227,791 | 21,335 |
| | 3M Co. | | 244,820 | 21,128 |
| | United Parcel Service Inc. | | |
| | Class B | | 262,026 | 19,018 |
| | Union Pacific Corp. | | 179,837 | 16,664 |
| | Boeing Co. | | 251,175 | 16,392 |
| | Emerson Electric Co. | | 271,897 | 15,544 |
| | Honeywell International Inc. | 265,094 | 14,092 |
| | Deere & Co. | | 153,260 | 12,728 |
| | FedEx Corp. | | 107,950 | 10,040 |
| | Danaher Corp. | | 200,314 | 9,449 |
| | CSX Corp. | | 137,066 | 8,856 |
| | Norfolk Southern Corp. | 133,076 | 8,360 |
| | General Dynamics Corp. | 116,778 | 8,287 |
| | Illinois Tool Works Inc. | 154,527 | 8,252 |
| | Lockheed Martin Corp. | 111,303 | 7,781 |
| | Cummins Inc. | | 68,234 | 7,506 |
| | Tyco International Ltd. | 179,749 | 7,449 |
| | Precision Castparts Corp. | 51,427 | 7,159 |
| | PACCAR Inc. | | 118,456 | 6,802 |
| | Northrop Grumman Corp. | 100,942 | 6,539 |
| | Raytheon Co. | | 135,124 | 6,262 |
| | Waste Management Inc. | 163,857 | 6,041 |
| | Eaton Corp. | | 57,553 | 5,842 |
| | Ingersoll-Rand plc | | 116,632 | 5,492 |
| | Parker Hannifin Corp. | | 58,260 | 5,028 |
| | CH Robinson Worldwide Inc. | 59,957 | 4,808 |
| | Fluor Corp. | | 64,567 | 4,278 |
| | | |
| | | | Market |
| | | | Value |
| | | Shares | ($000) |
| | Expeditors International of | | |
| | Washington Inc. | 76,610 | 4,183 |
| | Republic Services Inc. | | |
| | Class A | 138,340 | 4,131 |
| | Goodrich Corp. | 45,297 | 3,989 |
| | Dover Corp. | 67,451 | 3,943 |
| | Rockwell Automation Inc. | 51,281 | 3,677 |
| * | Delta Air Lines Inc. | 284,410 | 3,584 |
| | Cooper Industries plc | 60,264 | 3,513 |
| | Southwest Airlines Co. | 268,964 | 3,491 |
| | Rockwell Collins Inc. | 56,812 | 3,310 |
| | ITT Corp. | 62,978 | 3,282 |
| | Joy Global Inc. | 37,375 | 3,242 |
| | WW Grainger Inc. | 21,823 | 3,014 |
| | L-3 Communications | | |
| | Holdings Inc. | 41,251 | 2,908 |
| | Fastenal Co. | 47,832 | 2,866 |
| * | United Continental | | |
| | Holdings Inc. | 113,834 | 2,712 |
| | Roper Industries Inc. | 34,026 | 2,601 |
| | Bucyrus International Inc. | | |
| | Class A | 27,812 | 2,486 |
| | Flowserve Corp. | 20,211 | 2,410 |
| * | Stericycle Inc. | 29,336 | 2,374 |
| | Textron Inc. | 99,203 | 2,345 |
| | AMETEK Inc. | 57,585 | 2,260 |
| | Pall Corp. | 42,182 | 2,091 |
| * | Jacobs Engineering | | |
| | Group Inc. | 45,432 | 2,083 |
| | Manpower Inc. | 29,696 | 1,864 |
| | Pitney Bowes Inc. | 74,759 | 1,808 |
| * | Kansas City Southern | 36,891 | 1,766 |
| | KBR Inc. | 56,446 | 1,720 |
| * | AGCO Corp. | 33,644 | 1,704 |
| | Masco Corp. | 129,974 | 1,646 |
| | Iron Mountain Inc. | 65,569 | 1,640 |
| | Equifax Inc. | 45,178 | 1,608 |
| * | Foster Wheeler AG | 46,127 | 1,592 |
| | Robert Half International Inc. | 50,628 | 1,549 |
| | Donaldson Co. Inc. | 26,255 | 1,530 |
| | Avery Dennison Corp. | 35,805 | 1,516 |
| * | Quanta Services Inc. | 75,865 | 1,511 |
| | Dun & Bradstreet Corp. | 18,063 | 1,483 |
| | Timken Co. | 29,727 | 1,419 |
| * | Verisk Analytics Inc. Class A | 40,834 | 1,392 |
| | Cintas Corp. | 49,497 | 1,384 |
| | JB Hunt Transport | | |
| | Services Inc. | 33,379 | 1,362 |
| * | Navistar International Corp. | 23,172 | 1,342 |
| | Pentair Inc. | 35,744 | 1,305 |
| * | Owens Corning | 41,831 | 1,303 |
| | RR Donnelley & Sons Co. | 74,411 | 1,300 |
| | SPX Corp. | 18,045 | 1,290 |
| * | URS Corp. | 30,294 | 1,261 |
| * | Terex Corp. | 39,377 | 1,222 |
63
Large-Cap Index Fund
| | | |
| | | | Market |
| | | | Value |
| | | Shares | ($000) |
| * | IHS Inc. Class A | 15,006 | 1,206 |
| * | Hertz Global Holdings Inc. | 82,141 | 1,190 |
| * | Babcock & Wilcox Co. | 41,966 | 1,074 |
| | MSC Industrial Direct Co. | | |
| | Class A | 16,192 | 1,047 |
| * | Shaw Group Inc. | 30,388 | 1,040 |
| | Ryder System Inc. | 18,937 | 997 |
| | Towers Watson & Co. | | |
| | Class A | 18,610 | 969 |
| * | Copart Inc. | 25,846 | 965 |
| * | Aecom Technology Corp. | 33,381 | 934 |
| * | Alliant Techsystems Inc. | 11,961 | 890 |
| | Harsco Corp. | 29,107 | 824 |
| | Covanta Holding Corp. | 47,608 | 818 |
| * | Spirit Aerosystems | | |
| | Holdings Inc. Class A | 38,894 | 809 |
| * | Sensata Technologies | | |
| | Holding NV | 22,013 | 663 |
| * | FTI Consulting Inc. | 16,795 | 626 |
| | | | 488,953 |
| Information Technology (18.6%) | |
| * | Apple Inc. | 330,070 | 106,467 |
| | Microsoft Corp. | 2,814,003 | 78,567 |
| | International Business | | |
| | Machines Corp. | 455,801 | 66,893 |
| * | Google Inc. Class A | 89,083 | 52,913 |
| | Oracle Corp. | 1,452,942 | 45,477 |
| | Intel Corp. | 2,011,754 | 42,307 |
| * | Cisco Systems Inc. | 2,063,634 | 41,747 |
| | Hewlett-Packard Co. | 843,539 | 35,513 |
| | QUALCOMM Inc. | 579,974 | 28,703 |
| * | EMC Corp. | 742,042 | 16,993 |
| | Texas Instruments Inc. | 431,899 | 14,037 |
| | Visa Inc. Class A | 179,505 | 12,634 |
| * | eBay Inc. | 426,725 | 11,876 |
| | Accenture plc Class A | 230,272 | 11,166 |
| | Corning Inc. | 564,306 | 10,902 |
| | Mastercard Inc. Class A | 38,617 | 8,654 |
| * | Dell Inc. | 631,887 | 8,562 |
| | Automatic Data | | |
| | Processing Inc. | 177,684 | 8,223 |
| * | Cognizant Technology | | |
| | Solutions Corp. Class A | 108,815 | 7,975 |
| * | Yahoo! Inc. | 462,760 | 7,696 |
| * | Motorola Inc. | 800,989 | 7,265 |
| * | NetApp Inc. | 128,898 | 7,084 |
| | Broadcom Corp. Class A | 161,915 | 7,051 |
| * | Juniper Networks Inc. | 187,730 | 6,931 |
| | Applied Materials Inc. | 485,200 | 6,817 |
| * | Adobe Systems Inc. | 189,785 | 5,842 |
| | Xerox Corp. | 499,716 | 5,757 |
| | Tyco Electronics Ltd. | 161,542 | 5,719 |
| * | Salesforce.com Inc. | 41,865 | 5,526 |
| * | Intuit Inc. | 107,793 | 5,314 |
| | | |
| | | | Market |
| | | | Value |
| | | Shares | ($000) |
| * | Symantec Corp. | 285,167 | 4,774 |
| * | Citrix Systems Inc. | 67,586 | 4,624 |
| | Western Union Co. | 238,590 | 4,431 |
| * | SanDisk Corp. | 84,156 | 4,196 |
| | Analog Devices Inc. | 107,729 | 4,058 |
| | Altera Corp. | 110,989 | 3,949 |
| * | F5 Networks Inc. | 29,087 | 3,786 |
| * | Marvell Technology | | |
| | Group Ltd. | 199,190 | 3,695 |
| | CA Inc. | 149,192 | 3,646 |
| | Paychex Inc. | 117,563 | 3,634 |
| | Amphenol Corp. Class A | 62,742 | 3,312 |
| * | NVIDIA Corp. | 207,422 | 3,194 |
| * | Fiserv Inc. | 54,290 | 3,179 |
| * | Autodesk Inc. | 82,153 | 3,138 |
| * | Red Hat Inc. | 68,293 | 3,118 |
| * | Akamai Technologies Inc. | 65,599 | 3,086 |
| * | BMC Software Inc. | 64,552 | 3,043 |
| * | Western Digital Corp. | 82,873 | 2,809 |
| | Linear Technology Corp. | 80,883 | 2,798 |
| | Computer Sciences Corp. | 55,842 | 2,770 |
| | Xilinx Inc. | 93,534 | 2,711 |
| *,^ | First Solar Inc. | 20,038 | 2,608 |
| * | Micron Technology Inc. | 322,531 | 2,587 |
| * | Seagate Technology plc | 170,548 | 2,563 |
| | Maxim Integrated | | |
| | Products Inc. | 107,816 | 2,547 |
| * | McAfee Inc. | 54,927 | 2,544 |
| | Fidelity National Information | | |
| | Services Inc. | 91,757 | 2,513 |
| * | Teradata Corp. | 60,492 | 2,490 |
| | Activision Blizzard Inc. | 199,150 | 2,477 |
| * | Cree Inc. | 36,991 | 2,437 |
| | KLA-Tencor Corp. | 60,653 | 2,344 |
| * | VMware Inc. Class A | 26,288 | 2,337 |
| * | Lam Research Corp. | 44,865 | 2,323 |
| * | Rovi Corp. | 37,184 | 2,306 |
| | Microchip Technology Inc. | 66,966 | 2,291 |
| * | Flextronics | | |
| | International Ltd. | 283,901 | 2,229 |
| * | SAIC Inc. | 137,318 | 2,178 |
| | Harris Corp. | 46,677 | 2,114 |
| * | Atmel Corp. | 166,850 | 2,056 |
| | VeriSign Inc. | 62,890 | 2,055 |
| * | Electronic Arts Inc. | 119,405 | 1,956 |
| * | Skyworks Solutions Inc. | 64,580 | 1,849 |
| * | Avnet Inc. | 54,627 | 1,804 |
| * | Trimble Navigation Ltd. | 43,094 | 1,721 |
| * | ANSYS Inc. | 32,746 | 1,705 |
| * | Advanced Micro | | |
| | Devices Inc. | 207,392 | 1,696 |
| * | FLIR Systems Inc. | 56,915 | 1,693 |
| * | Nuance | | |
| | Communications Inc. | 85,121 | 1,548 |
| * | ON Semiconductor Corp. | 155,494 | 1,536 |
64
Large-Cap Index Fund
| | | |
| | | | Market |
| | | | Value |
| | | Shares | ($000) |
| | Factset Research | | |
| | Systems Inc. | 15,953 | 1,496 |
| * | Arrow Electronics Inc. | 42,554 | 1,457 |
| * | Synopsys Inc. | 53,296 | 1,434 |
| | Jabil Circuit Inc. | 70,524 | 1,417 |
| * | LSI Corp. | 232,072 | 1,390 |
| | Avago Technologies Ltd. | 47,779 | 1,360 |
| * | Alliance Data Systems Corp. | 19,067 | 1,354 |
| * | Equinix Inc. | 16,531 | 1,343 |
| | Global Payments Inc. | 28,823 | 1,332 |
| * | Dolby Laboratories Inc. | | |
| | Class A | 19,086 | 1,273 |
| | National | | |
| | Semiconductor Corp. | 86,930 | 1,196 |
| * | Ingram Micro Inc. | 56,581 | 1,080 |
| * | Novellus Systems Inc. | 33,219 | 1,074 |
| | Broadridge Financial | | |
| | Solutions Inc. | 45,721 | 1,003 |
| | Lender Processing | | |
| | Services Inc. | 33,649 | 993 |
| * | Lexmark International Inc. | | |
| | Class A | 28,369 | 988 |
| * | IAC/InterActiveCorp | 33,119 | 951 |
| | Total System Services Inc. | 60,560 | 931 |
| * | MEMC Electronic | | |
| | Materials Inc. | 82,162 | 925 |
| * | AOL Inc. | 38,641 | 916 |
| | Tellabs Inc. | 130,446 | 884 |
| * | Brocade Communications | | |
| | Systems Inc. | 160,017 | 846 |
| | DST Systems Inc. | 13,453 | 597 |
| * | Genpact Ltd. | 35,689 | 542 |
| | Molex Inc. | 22,688 | 515 |
| | Molex Inc. Class A | 26,899 | 508 |
| | | | 842,874 |
| Materials (4.0%) | | |
| | Freeport-McMoRan | | |
| | Copper & Gold Inc. | 170,016 | 20,417 |
| | EI du Pont de | | |
| | Nemours & Co. | 327,525 | 16,337 |
| | Dow Chemical Co. | 419,105 | 14,308 |
| | Monsanto Co. | 195,288 | 13,600 |
| | Newmont Mining Corp. | 177,954 | 10,932 |
| | Praxair Inc. | 110,710 | 10,569 |
| | Air Products & | | |
| | Chemicals Inc. | 76,761 | 6,981 |
| | Alcoa Inc. | 368,918 | 5,678 |
| | PPG Industries Inc. | 59,699 | 5,019 |
| | Nucor Corp. | 114,022 | 4,996 |
| | Mosaic Co. | 56,351 | 4,303 |
| | Ecolab Inc. | 84,314 | 4,251 |
| | International Paper Co. | 149,999 | 4,086 |
| | Cliffs Natural Resources Inc. | 48,941 | 3,818 |
| | CF Industries Holdings Inc. | 25,705 | 3,474 |
| | United States Steel Corp. | 51,731 | 3,022 |
| | | |
| | | | Market |
| | | | Value |
| | | Shares | ($000) |
| | Sigma-Aldrich Corp. | 43,849 | 2,919 |
| | Sherwin-Williams Co. | 33,428 | 2,800 |
| | Lubrizol Corp. | 24,378 | 2,605 |
| | Walter Energy Inc. | 19,075 | 2,439 |
| | Celanese Corp. Class A | 56,255 | 2,316 |
| | Eastman Chemical Co. | 26,147 | 2,198 |
| | Ball Corp. | 31,430 | 2,139 |
| | Vulcan Materials Co. | 46,411 | 2,059 |
| | FMC Corp. | 24,923 | 1,991 |
| * | Crown Holdings Inc. | 58,543 | 1,954 |
| * | Owens-Illinois Inc. | 59,115 | 1,815 |
| | Airgas Inc. | 28,771 | 1,797 |
| | Allegheny Technologies Inc. | 32,077 | 1,770 |
| | Albemarle Corp. | 29,655 | 1,654 |
| | MeadWestvaco Corp. | 61,760 | 1,616 |
| | International Flavors & | | |
| | Fragrances Inc. | 28,788 | 1,600 |
| | Nalco Holding Co. | 50,015 | 1,597 |
| | Martin Marietta Materials Inc. | 16,488 | 1,521 |
| | Sealed Air Corp. | 57,725 | 1,469 |
| | Ashland Inc. | 27,029 | 1,375 |
| | Steel Dynamics Inc. | 74,657 | 1,366 |
| | Reliance Steel & | | |
| | Aluminum Co. | 25,514 | 1,304 |
| | Bemis Co. Inc. | 39,398 | 1,287 |
| | Sonoco Products Co. | 36,269 | 1,221 |
| | Valspar Corp. | 34,247 | 1,181 |
| | Scotts Miracle-Gro Co. | | |
| | Class A | 16,932 | 860 |
| * | Titanium Metals Corp. | 32,438 | 557 |
| | Greif Inc. Class A | 8,966 | 555 |
| | | | 179,756 |
| Telecommunication Services (3.0%) | |
| | AT&T Inc. | 2,135,080 | 62,729 |
| | Verizon | | |
| | Communications Inc. | 1,021,300 | 36,542 |
| * | American Tower Corp. | | |
| | Class A | 144,816 | 7,478 |
| | CenturyLink Inc. | 108,900 | 5,028 |
| * | Crown Castle | | |
| | International Corp. | 104,867 | 4,596 |
| * | Sprint Nextel Corp. | 1,065,667 | 4,508 |
| | Qwest Communications | | |
| | International Inc. | 565,495 | 4,303 |
| | Frontier | | |
| | Communications Corp. | 358,465 | 3,488 |
| * | NII Holdings Inc. | 60,863 | 2,718 |
| | Windstream Corp. | 174,650 | 2,435 |
| * | SBA Communications Corp. | |
| | Class A | 39,307 | 1,609 |
| * | MetroPCS | | |
| | Communications Inc. | 89,339 | 1,128 |
| | Telephone & Data | | |
| | Systems Inc. | 18,141 | 663 |
65
Large-Cap Index Fund
| | | |
| | | | Market |
| | | | Value |
| | | Shares | ($000) |
| | Telephone & | | |
| | Data Systems Inc. - | | |
| | Special Common Shares | 15,981 | 504 |
| * | United States Cellular Corp. | 6,702 | 335 |
| * | Clearwire Corp. Class A | 52,607 | 271 |
| | | | 138,335 |
| Utilities (3.4%) | | |
| | Southern Co. | 300,220 | 11,477 |
| | Exelon Corp. | 238,870 | 9,947 |
| | Dominion Resources Inc. | 212,873 | 9,094 |
| | Duke Energy Corp. | 476,123 | 8,480 |
| | NextEra Energy Inc. | 142,623 | 7,415 |
| | PG&E Corp. | 141,169 | 6,753 |
| | American Electric Power | | |
| | Co. Inc. | 173,089 | 6,228 |
| | Public Service Enterprise | | |
| | Group Inc. | 182,828 | 5,816 |
| | Consolidated Edison Inc. | 102,129 | 5,063 |
| | Entergy Corp. | 67,547 | 4,784 |
| | Progress Energy Inc. | 105,698 | 4,596 |
| | PPL Corp. | 174,463 | 4,592 |
| | Sempra Energy | 85,026 | 4,462 |
| | Edison International | 111,823 | 4,316 |
| | FirstEnergy Corp. | 110,173 | 4,079 |
| | Xcel Energy Inc. | 166,078 | 3,911 |
| * | AES Corp. | 243,243 | 2,963 |
| | DTE Energy Co. | 61,043 | 2,766 |
| | Wisconsin Energy Corp. | 42,137 | 2,480 |
| | Ameren Corp. | 86,493 | 2,438 |
| | CenterPoint Energy Inc. | 144,268 | 2,268 |
| | Constellation Energy | | |
| | Group Inc. | 69,360 | 2,124 |
| | Northeast Utilities | 63,756 | 2,033 |
| | Oneok Inc. | 36,533 | 2,026 |
| * | NRG Energy Inc. | 91,485 | 1,788 |
| | NiSource Inc. | 100,155 | 1,765 |
| | SCANA Corp. | 43,269 | 1,757 |
| * | Calpine Corp. | 128,534 | 1,715 |
| | National Fuel Gas Co. | 25,220 | 1,655 |
| | Pinnacle West Capital Corp. | 39,320 | 1,630 |
| | OGE Energy Corp. | 35,163 | 1,601 |
| | American Water Works | | |
| | Co. Inc. | 63,237 | 1,599 |
| | NSTAR | 37,400 | 1,578 |
| | CMS Energy Corp. | 83,210 | 1,548 |
| | Pepco Holdings Inc. | 81,014 | 1,478 |
| | Allegheny Energy Inc. | 60,988 | 1,478 |
| | | | |
| | | | | Market |
| | | | | Value |
| | | | Shares | ($000) |
| | Alliant Energy Corp. | | 40,060 | 1,473 |
| | Integrys Energy Group Inc. | 27,929 | 1,355 |
| | MDU Resources Group Inc. | 64,686 | 1,311 |
| | TECO Energy Inc. | | 73,630 | 1,311 |
| | UGI Corp. | | 39,695 | 1,254 |
| | NV Energy Inc. | | 84,977 | 1,194 |
| | Energen Corp. | | 24,701 | 1,192 |
| | Aqua America Inc. | | 49,646 | 1,116 |
| | DPL Inc. | | 43,035 | 1,106 |
| | AGL Resources Inc. | | 28,126 | 1,008 |
| | | | | 152,023 |
| Total Common Stocks | | | |
| (Cost $4,028,587) | | | 4,513,429 |
| Temporary Cash Investments (0.4%)1 | |
| Money Market Fund (0.4%) | | |
| 2,3 | Vanguard Market | | | |
| | Liquidity Fund, | | | |
| | 0.211% | 16,131,270 | 16,131 |
| |
| | | | Face | |
| | | | Amount | |
| | | | ($000) | |
| U.S. Government and Agency Obligations (0.0%) |
| 4 | Fannie Mae | | | |
| | Discount Notes, | | | |
| | 0.280%, 2/14/11 | | 100 | 100 |
| 4,5 | Freddie Mac | | | |
| | Discount Notes, | | | |
| | 0.250%, 3/21/11 | | 300 | 300 |
| 4,5 | Freddie Mac | | | |
| | Discount Notes, | | | |
| | 0.281%, 6/21/11 | | 350 | 350 |
| | | | | 750 |
| Total Temporary Cash Investments | |
| (Cost $16,881) | | | 16,881 |
| Total Investments (100.2%) | | |
| (Cost $4,045,468) | | | 4,530,310 |
| Other Assets and Liabilities (-0.2%) | |
| Other Assets | | | 8,239 |
| Liabilities3 | | | (18,654) |
| | | | | (10,415) |
| Net Assets (100%) | | | 4,519,895 |
66
Large-Cap Index Fund
| |
| At December 31, 2010, net assets consisted of: |
| | Amount |
| | ($000) |
| Paid-in Capital | 4,259,256 |
| Overdistributed Net Investment Income | (4,394) |
| Accumulated Net Realized Losses | (219,919) |
| Unrealized Appreciation (Depreciation) | |
| Investment Securities | 484,842 |
| Futures Contracts | 110 |
| Net Assets | 4,519,895 |
| |
| Investor Shares—Net Assets | |
| Applicable to 13,197,942 outstanding | |
| $.001 par value shares of beneficial | |
| interest (unlimited authorization) | 306,865 |
| Net Asset Value Per Share— | |
| Investor Shares | $23.25 |
| |
| Admiral Shares—Net Assets | |
| Applicable to 23,994,428 outstanding | |
| $.001 par value shares of beneficial | |
| interest (unlimited authorization) | 697,566 |
| Net Asset Value Per Share— | |
| Admiral Shares | $29.07 |
| | Amount |
| | ($000) |
| Signal Shares—Net Assets | |
| Applicable to 15,043,997 outstanding | |
| $.001 par value shares of beneficial | |
| interest (unlimited authorization) | 381,451 |
| Net Asset Value Per Share— | |
| Signal Shares | $25.36 |
| |
| Institutional Shares—Net Assets | |
| Applicable to 2,308,477 outstanding | |
| $.001 par value shares of beneficial | |
| interest (unlimited authorization) | 276,203 |
| Net Asset Value Per Share— | |
| Institutional Shares | $119.65 |
| |
| ETF Shares—Net Assets | |
| Applicable to 49,648,106 outstanding | |
| $.001 par value shares of beneficial | |
| interest (unlimited authorization) | 2,857,810 |
| Net Asset Value Per Share— | |
| ETF Shares | $57.56 |
See Note A in Notes to Financial Statements.
* Non-income-producing security.
^ Part of security position is on loan to broker-dealers. The total value of securities on loan is $4,698,000.
1 The fund invests a portion of its cash reserves in equity markets through the use of index futures contracts. After giving effect to futures investments, the fund’s effective common stock and temporary cash investment positions represent 100.0% and 0.2%, respectively, of net assets.
2 Affiliated money market fund available only to Vanguard funds and certain trusts and accounts managed by Vanguard. Rate shown is the 7-day yield.
3 Includes $4,850,000 of collateral received for securities on loan.
4 The issuer operates under a congressional charter; its securities are not backed by the full faith and credit of the U.S. government.
5 Securities with a value of $650,000 have been segregated as initial margin for open futures contracts.
REIT—Real Estate Investment Trust.
See accompanying Notes, which are an integral part of the Financial Statements.
67
Large-Cap Index Fund
| |
| Statement of Operations | |
| |
| |
| | Year Ended |
| | December 31, 2010 |
| | ($000) |
| Investment Income | |
| Income | |
| Dividends | 80,711 |
| Interest1 | 16 |
| Security Lending | 274 |
| Total Income | 81,001 |
| Expenses | |
| The Vanguard Group—Note B | |
| Investment Advisory Services | 291 |
| Management and Administrative—Investor Shares | 981 |
| Management and Administrative—Admiral Shares | 354 |
| Management and Administrative—Signal Shares | 253 |
| Management and Administrative—Institutional Shares | 92 |
| Management and Administrative—ETF Shares | 1,789 |
| Marketing and Distribution—Investor Shares | 141 |
| Marketing and Distribution—Admiral Shares | 67 |
| Marketing and Distribution—Signal Shares | 82 |
| Marketing and Distribution—Institutional Shares | 77 |
| Marketing and Distribution—ETF Shares | 749 |
| Custodian Fees | 144 |
| Auditing Fees | 30 |
| Shareholders’ Reports—Investor Shares | 25 |
| Shareholders’ Reports—Admiral Shares | 2 |
| Shareholders’ Reports—Signal Shares | 1 |
| Shareholders’ Reports—Institutional Shares | — |
| Shareholders’ Reports—ETF Shares | 216 |
| Trustees’ Fees and Expenses | 6 |
| Total Expenses | 5,300 |
| Net Investment Income | 75,701 |
| Realized Net Gain (Loss) | |
| Investment Securities Sold | 5,565 |
| Futures Contracts | 801 |
| Realized Net Gain (Loss) | 6,366 |
| Change in Unrealized Appreciation (Depreciation) | |
| Investment Securities | 527,528 |
| Futures Contracts | 69 |
| Change in Unrealized Appreciation (Depreciation) | 527,597 |
| Net Increase (Decrease) in Net Assets Resulting from Operations | 609,664 |
1 Interest income from an affiliated company of the fund was $12,000.
See accompanying Notes, which are an integral part of the Financial Statements.
68
Large-Cap Index Fund
| | |
| Statement of Changes in Net Assets | | |
| |
| | Year Ended December 31, |
| | 2010 | 2009 |
| | ($000) | ($000) |
| Increase (Decrease) in Net Assets | | |
| Operations | | |
| Net Investment Income | 75,701 | 77,095 |
| Realized Net Gain (Loss) | 6,366 | (41,748) |
| Change in Unrealized Appreciation (Depreciation) | 527,597 | 840,037 |
| Net Increase (Decrease) in Net Assets Resulting from Operations | 609,664 | 875,384 |
| Distributions | | |
| Net Investment Income | | |
| Investor Shares | (7,845) | (8,831) |
| Admiral Shares | (8,587) | (6,580) |
| Signal Shares | (6,266) | (4,595) |
| Institutional Shares | (4,906) | (6,135) |
| ETF Shares | (50,505) | (53,549) |
| Realized Capital Gain | | |
| Investor Shares | — | — |
| Admiral Shares | — | — |
| Signal Shares | — | — |
| Institutional Shares | — | — |
| ETF Shares | — | — |
| Total Distributions | (78,109) | (79,690) |
| Capital Share Transactions | | |
| Investor Shares | (195,407) | (17,470) |
| Admiral Shares | 309,402 | 11,594 |
| Signal Shares | 90,487 | 96,504 |
| Institutional Shares | (63,720) | 37,805 |
| ETF Shares | 30,284 | (3,836) |
| Net Increase (Decrease) from Capital Share Transactions | 171,046 | 124,597 |
| Total Increase (Decrease) | 702,601 | 920,291 |
| Net Assets | | |
| Beginning of Period | 3,817,294 | 2,897,003 |
| End of Period1 | 4,519,895 | 3,817,294 |
| 1 Net Assets—End of Period includes undistributed (overdistributed) net investment income of ($4,394,000) and ($1,986,000). | |
See accompanying Notes, which are an integral part of the Financial Statements.
69
Large-Cap Index Fund
Financial Highlights
| | | | | |
| Investor Shares | | | | | |
| |
| For a Share Outstanding | | | Year Ended December 31, |
| Throughout Each Period | 2010 | 2009 | 2008 | 2007 | 2006 |
| Net Asset Value, Beginning of Period | $20.47 | $16.41 | $26.59 | $25.42 | $22.38 |
| Investment Operations | | | | | |
| Net Investment Income | .372 | .387 | .416 | .426 | .393 |
| Net Realized and Unrealized Gain (Loss) | | | | | |
| on Investments | 2.791 | 4.075 | (10.191) | 1.171 | 3.044 |
| Total from Investment Operations | 3.163 | 4.462 | (9.775) | 1.597 | 3.437 |
| Distributions | | | | | |
| Dividends from Net Investment Income | (.383) | (.402) | (.405) | (.427) | (.397) |
| Distributions from Realized Capital Gains | — | — | — | — | — |
| Total Distributions | (.383) | (.402) | (.405) | (.427) | (.397) |
| Net Asset Value, End of Period | $23.25 | $20.47 | $16.41 | $26.59 | $25.42 |
| |
| Total Return1 | 15.63% | 27.60% | -37.08% | 6.29% | 15.49% |
| |
| Ratios/Supplemental Data | | | | | |
| Net Assets, End of Period (Millions) | $307 | $448 | $376 | $346 | $211 |
| Ratio of Total Expenses to | | | | | |
| Average Net Assets | 0.26% | 0.26% | 0.21% | 0.20% | 0.20% |
| Ratio of Net Investment Income to | | | | | |
| Average Net Assets | 1.78% | 2.24% | 2.12% | 1.69% | 1.74% |
| Portfolio Turnover Rate2 | 8% | 8% | 9% | 8% | 9% |
1 Total returns do not include account service fees that may have applied in the periods shown. Fund prospectuses provide information about any applicable account service fees.
2 Excludes the value of portfolio securities received or delivered as a result of in-kind purchases or redemptions of the fund’s capital shares, including ETF Creation Units.
See accompanying Notes, which are an integral part of the Financial Statements.
70
Large-Cap Index Fund
Financial Highlights
| | | | | |
| Admiral Shares | | | | | |
| |
| For a Share Outstanding | | | Year Ended December 31, |
| Throughout Each Period | 2010 | 2009 | 2008 | 2007 | 2006 |
| Net Asset Value, Beginning of Period | $25.59 | $20.51 | $33.25 | $31.78 | $27.98 |
| Investment Operations | | | | | |
| Net Investment Income | .503 | .516 | .547 | .570 | .514 |
| Net Realized and Unrealized Gain (Loss) | | | | | |
| on Investments | 3.495 | 5.097 | (12.750) | 1.470 | 3.806 |
| Total from Investment Operations | 3.998 | 5.613 | (12.203) | 2.040 | 4.320 |
| Distributions | | | | | |
| Dividends from Net Investment Income | (.518) | (.533) | (.537) | (.570) | (.520) |
| Distributions from Realized Capital Gains | — | — | — | — | — |
| Total Distributions | (.518) | (.533) | (.537) | (.570) | (.520) |
| Net Asset Value, End of Period | $29.07 | $25.59 | $20.51 | $33.25 | $31.78 |
| |
| Total Return | 15.81% | 27.80% | -37.05% | 6.43% | 15.58% |
| |
| Ratios/Supplemental Data | | | | | |
| Net Assets, End of Period (Millions) | $698 | $328 | $254 | $220 | $164 |
| Ratio of Total Expenses to | | | | | |
| Average Net Assets | 0.12% | 0.12% | 0.10% | 0.08% | 0.12% |
| Ratio of Net Investment Income to | | | | | |
| Average Net Assets | 1.92% | 2.38% | 2.23% | 1.81% | 1.82% |
| Portfolio Turnover Rate1 | 8% | 8% | 9% | 8% | 9% |
1 Excludes the value of portfolio securities received or delivered as a result of in-kind purchases or redemptions of the fund’s capital shares, including ETF Creation Units.
See accompanying Notes, which are an integral part of the Financial Statements.
71
Large-Cap Index Fund
Financial Highlights
| | | | |
| Signal Shares | | | | |
| | | | | Aug. 30, |
| | | | | 20071 to |
| | Year Ended December 31, | Dec. 31, |
| For a Share Outstanding Throughout Each Period | 2010 | 2009 | 2008 | 2007 |
| Net Asset Value, Beginning of Period | $22.32 | $17.89 | $29.00 | $28.74 |
| Investment Operations | | | | |
| Net Investment Income | .440 | .451 | .481 | .173 |
| Net Realized and Unrealized Gain (Loss) on Investments | 3.052 | 4.446 | (11.121) | .361 |
| Total from Investment Operations | 3.492 | 4.897 | (10.640) | .534 |
| Distributions | | | | |
| Dividends from Net Investment Income | (.452) | (.467) | (.470) | (.274) |
| Distributions from Realized Capital Gains | — | — | — | — |
| Total Distributions | (.452) | (.467) | (.470) | (.274) |
| Net Asset Value, End of Period | $25.36 | $22.32 | $17.89 | $29.00 |
| |
| Total Return | 15.83% | 27.81% | -37.03% | 1.85% |
| |
| Ratios/Supplemental Data | | | | |
| Net Assets, End of Period (Millions) | $381 | $247 | $102 | $39 |
| Ratio of Total Expenses to Average Net Assets | 0.12% | 0.12% | 0.10% | 0.08%2 |
| Ratio of Net Investment Income to Average Net Assets | 1.92% | 2.38% | 2.23% | 1.81%2 |
| Portfolio Turnover Rate3 | 8% | 8% | 9% | 8% |
1 Inception.
2 Annualized.
3 Excludes the value of portfolio securities received or delivered as a result of in-kind purchases or redemptions of the fund’s capital shares,
including ETF Creation Units.
See accompanying Notes, which are an integral part of the Financial Statements.
72
Large-Cap Index Fund
Financial Highlights
| | | | | |
| Institutional Shares | | | | | |
| |
| For a Share Outstanding | | | Year Ended December 31, |
| Throughout Each Period | 2010 | 2009 | 2008 | 2007 | 2006 |
| Net Asset Value, Beginning of Period | $105.33 | $84.43 | $136.82 | $130.78 | $115.14 |
| Investment Operations | | | | | |
| Net Investment Income | 2.111 | 2.160 | 2.283 | 2.344 | 2.151 |
| Net Realized and Unrealized Gain (Loss) | | | | | |
| on Investments | 14.383 | 20.973 | (52.440) | 6.047 | 15.660 |
| Total from Investment Operations | 16.494 | 23.133 | (50.157) | 8.391 | 17.811 |
| Distributions | | | | | |
| Dividends from Net Investment Income | (2.174) | (2.233) | (2.233) | (2.351) | (2.171) |
| Distributions from Realized Capital Gains | — | — | — | — | — |
| Total Distributions | (2.174) | (2.233) | (2.233) | (2.351) | (2.171) |
| Net Asset Value, End of Period | $119.65 | $105.33 | $84.43 | $136.82 | $130.78 |
| |
| Total Return | 15.85% | 27.84% | -37.01% | 6.42% | 15.61% |
| |
| Ratios/Supplemental Data | | | | | |
| Net Assets, End of Period (Millions) | $276 | $306 | $207 | $103 | $79 |
| Ratio of Total Expenses to | | | | | |
| Average Net Assets | 0.08% | 0.08% | 0.07% | 0.08% | 0.08% |
| Ratio of Net Investment Income to | | | | | |
| Average Net Assets | 1.96% | 2.42% | 2.26% | 1.81% | 1.86% |
| Portfolio Turnover Rate1 | 8% | 8% | 9% | 8% | 9% |
1 Excludes the value of portfolio securities received or delivered as a result of in-kind purchases or redemptions of the fund’s capital shares, including ETF Creation Units.
See accompanying Notes, which are an integral part of the Financial Statements.
73
Large-Cap Index Fund
Financial Highlights
| | | | | |
| ETF Shares | | | | | |
| |
| For a Share Outstanding | | | Year Ended December 31, |
| Throughout Each Period | 2010 | 2009 | 2008 | 2007 | 2006 |
| Net Asset Value, Beginning of Period | $50.67 | $40.61 | $65.83 | $62.92 | $55.40 |
| Investment Operations | | | | | |
| Net Investment Income | .996 | 1.022 | 1.098 | 1.136 | 1.044 |
| Net Realized and Unrealized Gain (Loss) | | | | | |
| on Investments | 6.920 | 10.095 | (25.243) | 2.912 | 7.529 |
| Total from Investment Operations | 7.916 | 11.117 | (24.145) | 4.048 | 8.573 |
| Distributions | | | | | |
| Dividends from Net Investment Income | (1.026) | (1.057) | (1.075) | (1.138) | (1.053) |
| Distributions from Realized Capital Gains | — | — | — | — | — |
| Total Distributions | (1.026) | (1.057) | (1.075) | (1.138) | (1.053) |
| Net Asset Value, End of Period | $57.56 | $50.67 | $40.61 | $65.83 | $62.92 |
| |
| Total Return | 15.81% | 27.80% | -37.02% | 6.44% | 15.61% |
| |
| Ratios/Supplemental Data | | | | | |
| Net Assets, End of Period (Millions) | $2,858 | $2,489 | $1,957 | $1,162 | $587 |
| Ratio of Total Expenses to | | | | | |
| Average Net Assets | 0.12% | 0.12% | 0.07% | 0.07% | 0.07% |
| Ratio of Net Investment Income to | | | | | |
| Average Net Assets | 1.92% | 2.38% | 2.26% | 1.82% | 1.87% |
| Portfolio Turnover Rate1 | 8% | 8% | 9% | 8% | 9% |
1 Excludes the value of portfolio securities received or delivered as a result of in-kind purchases or redemptions of the fund’s capital shares, including ETF Creation Units.
See accompanying Notes, which are an integral part of the Financial Statements.
74
Large-Cap Index Fund
Notes to Financial Statements
Vanguard Large-Cap Index Fund is registered under the Investment Company Act of 1940 as an open-end investment company, or mutual fund. The fund offers five classes of shares: Investor Shares, Admiral Shares, Signal Shares, Institutional Shares, and ETF Shares. Investor Shares are available to any investor who meets the fund’s minimum purchase requirements. Admiral Shares, Signal Shares, and Institutional Shares are designed for investors who meet certain administrative, service, and account-size criteria. ETF Shares are listed for trading on the NYSE Arca, Inc.; they can be purchased and sold through a broker.
A. The following significant accounting policies conform to generally accepted accounting principles for U.S. mutual funds. The fund consistently follows such policies in preparing its financial statements.
1. Security Valuation: Securities are valued as of the close of trading on the New York Stock Exchange (generally 4 p.m., Eastern time) on the valuation date. Equity securities are valued at the latest quoted sales prices or official closing prices taken from the primary market in which each security trades; such securities not traded on the valuation date are valued at the mean of the latest quoted bid and asked prices. Securities for which market quotations are not readily available, or whose values have been materially affected by events occurring before the fund’s pricing time but after the close of the securities’ primary markets, are valued by methods deemed by the board of trustees to represent fair value. Investments in Vanguard Market Liquidity Fund are valued at that fund’s net asset value. Temporary cash investments acquired over 60 days to maturity are valued using the latest bid prices or using valuations based on a matrix system (which considers such factors as security prices, yields, maturities, and ratings), both as furnished by independent pricing services. Other temporary cash investments are valued at amortized cost, which approximates market value.
2. Futures Contracts: The fund uses index futures contracts to a limited extent, with the objectives of maintaining full exposure to the stock market, enhancing returns, maintaining liquidity, and minimizing transaction costs. The fund may purchase futures contracts to immediately invest incoming cash in the market, or sell futures in response to cash outflows, thereby simulating a fully invested position in the underlying index while maintaining a cash balance for liquidity. The fund may seek to enhance returns by using futures contracts instead of the underlying securities when futures are believed to be priced more attractively than the underlying securities. The primary risks associated with the use of futures contracts are imperfect correlation between changes in market values of stocks held by the fund and the prices of futures contracts, and the possibility of an illiquid market.
Futures contracts are valued at their quoted daily settlement prices. The aggregate principal amounts of the contracts are not recorded in the Statement of Net Assets. Fluctuations in the value of the contracts are recorded in the Statement of Net Assets as an asset (liability) and in the Statement of Operations as unrealized appreciation (depreciation) until the contracts are closed, when they are recorded as realized futures gains (losses).
3. Federal Income Taxes: The fund intends to continue to qualify as a regulated investment company and distribute all of its taxable income. Management has analyzed the fund’s tax positions taken for all open federal income tax years (December 31, 2007–2010), and has concluded that no provision for federal income tax is required in the fund’s financial statements.
4. Distributions: Distributions to shareholders are recorded on the ex-dividend date.
75
Large-Cap Index Fund
5. Security Lending: The fund may lend its securities to qualified institutional borrowers to earn additional income. Security loans are required to be secured at all times by collateral at least equal to the market value of securities loaned. The fund invests cash collateral received in Vanguard Market Liquidity Fund, and records a liability for the return of the collateral, during the period the securities are on loan. Security lending income represents fees charged to borrowers plus income earned on investing cash collateral, less expenses associated with the loan.
6. Other: Dividend income is recorded on the ex-dividend date. Interest income includes income distributions received from Vanguard Market Liquidity Fund and is accrued daily. Security transactions are accounted for on the date securities are bought or sold. Costs used to determine realized gains (losses) on the sale of investment securities are those of the specific securities sold.
Each class of shares has equal rights as to assets and earnings, except that each class separately bears certain class-specific expenses related to maintenance of shareholder accounts (included in Management and Administrative expenses) and shareholder reporting. Marketing and distribution expenses are allocated to each class of shares based on a method approved by the board of trustees. Income, other non-class-specific expenses, and gains and losses on investments are allocated to each class of shares based on its relative net assets.
B. The Vanguard Group furnishes at cost investment advisory, corporate management, administrative, marketing, and distribution services. The costs of such services are allocated to the fund under methods approved by the board of trustees. The fund has committed to provide up to 0.40% of its net assets in capital contributions to Vanguard. At December 31, 2010, the fund had contributed capital of $739,000 to Vanguard (included in Other Assets), representing 0.02% of the fund’s net assets and 0.30% of Vanguard’s capitalization. The fund’s trustees and officers are also directors and officers of Vanguard.
C. Various inputs may be used to determine the value of the fund’s investments. These inputs are summarized in three broad levels for financial statement purposes. The inputs or methodologies used to value securities are not necessarily an indication of the risk associated with investing in those securities.
Level 1—Quoted prices in active markets for identical securities.
Level 2—Other significant observable inputs (including quoted prices for similar securities, interest rates, prepayment speeds, credit risk, etc.).
Level 3—Significant unobservable inputs (including the fund’s own assumptions used to determine the fair value of investments).
76
Large-Cap Index Fund
The following table summarizes the fund’s investments as of December 31, 2010, based on the inputs used to value them:
| | | |
| | Level 1 | Level 2 | Level 3 |
| Investments | ($000) | ($000) | ($000) |
| Common Stocks | 4,513,429 | — | — |
| Temporary Cash Investments | 16,131 | 750 | — |
| Futures Contracts—Liabilities1 | (8) | — | — |
| Total | 4,529,552 | 750 | — |
| 1 Represents variation margin on the last day of the reporting period. | | | |
D. At December 31, 2010, the aggregate settlement value of open futures contracts and the related unrealized appreciation (depreciation) were:
| | | | |
| | | | | ($000) |
| | | | Aggregate | |
| | | Number of | Settlement | Unrealized |
| | | Long (Short) | Value | Appreciation |
| Futures Contracts | Expiration | Contracts | Long (Short) | (Depreciation) |
| S&P 500 Index | March 2011 | 20 | 6,265 | 110 |
Unrealized appreciation (depreciation) on open futures contracts is required to be treated as realized gain (loss) for tax purposes.
E. Distributions are determined on a tax basis and may differ from net investment income and realized capital gains for financial reporting purposes. Differences may be permanent or temporary. Permanent differences are reclassified among capital accounts in the financial statements to reflect their tax character. Temporary differences arise when certain items of income, expense, gain, or loss are recognized in different periods for financial statement and tax purposes; these differences will reverse at some time in the future. Differences in classification may also result from the treatment of short-term gains as ordinary income for tax purposes.
During the year ended December 31, 2010, the fund realized $33,838,000 of net capital gains resulting from in-kind redemptions—in which shareholders exchanged fund shares for securities held by the fund rather than for cash. Because such gains are not taxable to the fund, and are not distributed to shareholders, they have been reclassified from accumulated net realized losses to paid-in capital.
For tax purposes, at December 31, 2010, the fund had $394,000 of ordinary income available for distribution. The fund had available capital loss carryforwards totaling $201,206,000 to offset future net capital gains of $11,000 through December 31, 2013, $463,000 through December 31, 2014, $1,570,000 through December 31, 2015, $48,005,000 through December 31, 2016, $117,390,000 through December 31, 2017, and $33,767,000 through December 31, 2018.
At December 31, 2010, the cost of investment securities for tax purposes was $4,064,071,000. Net unrealized appreciation of investment securities for tax purposes was $466,239,000, consisting of unrealized gains of $728,337,000 on securities that had risen in value since their purchase and $262,098,000 in unrealized losses on securities that had fallen in value since their purchase.
77
Large-Cap Index Fund
F. During the year ended December 31, 2010, the fund purchased $582,562,000 of investment securities and sold $410,919,000 of investment securities, other than temporary cash investments.
G. Capital share transactions for each class of shares were:
| | | | |
| | | | Year Ended December 31, |
| | | 2010 | | 2009 |
| | Amount | Shares | Amount | Shares |
| | ($000) | (000) | ($000) | (000) |
| Investor Shares | | | | |
| Issued | 212,649 | 10,107 | 212,151 | 12,664 |
| Issued in Lieu of Cash Distributions | 7,274 | 344 | 7,884 | 446 |
| Redeemed | (415,330) | (19,133) | (237,505) | (14,175) |
| Net Increase (Decrease)—Investor Shares | (195,407) | (8,682) | (17,470) | (1,065) |
| Admiral Shares | | | | |
| Issued | 397,481 | 14,514 | 132,003 | 6,333 |
| Issued in Lieu of Cash Distributions | 7,231 | 266 | 5,459 | 246 |
| Redeemed | (95,310) | (3,594) | (125,868) | (6,164) |
| Net Increase (Decrease)—Admiral Shares | 309,402 | 11,186 | 11,594 | 415 |
| Signal Shares | | | | |
| Issued | 159,203 | 6,977 | 166,455 | 8,851 |
| Issued in Lieu of Cash Distributions | 4,385 | 187 | 3,330 | 169 |
| Redeemed | (73,101) | (3,165) | (73,281) | (3,666) |
| Net Increase (Decrease)—Signal Shares | 90,487 | 3,999 | 96,504 | 5,354 |
| Institutional Shares | | | | |
| Issued | 60,095 | 560 | 87,330 | 999 |
| Issued in Lieu of Cash Distributions | 4,210 | 38 | 5,678 | 62 |
| Redeemed | (128,025) | (1,194) | (55,203) | (610) |
| Net Increase (Decrease)—Institutional Shares | (63,720) | (596) | 37,805 | 451 |
| ETF Shares | | | | |
| Issued | 138,340 | 2,628 | 345,480 | 8,726 |
| Issued in Lieu of Cash Distributions | — | — | — | — |
| Redeemed | (108,056) | (2,100) | (349,316) | (7,800) |
| Net Increase (Decrease)—ETF Shares | 30,284 | 528 | (3,836) | 926 |
H. In preparing the financial statements as of December 31, 2010, management considered the impact of subsequent events for potential recognition or disclosure in these financial statements.
78
Report of Independent Registered Public Accounting Firm
To the Trustees of Vanguard Index Funds and the Shareholders of Vanguard Growth Index Fund, Vanguard Value Index Fund and Vanguard Large-Cap Index Fund:
In our opinion, the accompanying statements of net assets and the related statements of operations and of changes in net assets and the financial highlights present fairly, in all material respects, the financial position of Vanguard Growth Index Fund, Vanguard Value Index Fund and Vanguard Large-Cap Index Fund (constituting separate portfolios of Vanguard Index Funds, hereafter referred to as the “Funds”) at December 31, 2010, the results of each of their operations for the year then ended, the changes in each of their net assets for each of the two years in the period then ended and the financial highlights for each of the periods indicated, in conformity with accounting principles generally accepted in the United States of America. These financial statements and financial highlights (hereafter referred to as “financial statements”) are the responsibility of the Funds’ management; our responsibil ity is to express an opinion on these financial statements based on our audits. We conducted our audits of these financial statements in accordance with the standards of the Public Company Accounting Oversight Board (United States). Those standards require that we plan and perform the audit to obtain reasonable assurance about whether the financial statements are free of material misstatement. An audit includes examining, on a test basis, evidence supporting the amounts and disclosures in the financial statements, assessing the accounting principles used and significant estimates made by management, and evaluating the overall financial statement presentation. We believe that our audits, which included confirmation of securities at December 31, 2010 by correspondence with the custodian and broker and by agreement to the underlying ownership records of Vanguard Market Liquidity Fund, provide a reasonable basis for our opinion.
PricewaterhouseCoopers LLP
Philadelphia, Pennsylvania
February 8, 2011
79
| Special 2010 tax information (unaudited) for Vanguard U.S. Stock Index Funds (Large-Capitalization Portfolios) |
This information for the fiscal year ended December 31, 2010, is included pursuant to provisions of the Internal Revenue Code.
The funds distributed qualified dividend income to shareholders during the fiscal year as follows:
| |
| | Qualified Dividend Income |
| Index Fund | ($000) |
| Growth | 207,582 |
| Value | 318,593 |
| Large-Cap | 78,109 |
For corporate shareholders, the percentage of investment income (dividend income plus short-term gains, if any) that qualifies for the dividends-received deduction is as follows:
| |
| Index Fund | Percentage |
| Growth | 100.0% |
| Value | 98.4 |
| Large-Cap | 98.0 |
80
Your Fund’s After-Tax Returns
This table presents returns for your fund both before and after taxes. The after-tax returns are shown in two ways: (1) assuming that an investor owned the fund during the entire period and paid taxes on the fund’s distributions, and (2) assuming that an investor paid taxes on the fund’s distributions and sold all shares at the end of each period.
Calculations are based on the highest individual federal income tax and capital gains tax rates in effect at the times of the distributions and the hypothetical sales. State and local taxes were not considered. After-tax returns reflect any qualified dividend income . (In the example, returns after the sale of fund shares may be higher than those assuming no sale. This occurs when the sale would have produced a capital loss. The calculation assumes that the investor received a tax deduction for the loss.) The table shows returns for Investor Shares only; returns for other share classes will differ. Please note that your actual after-tax returns will depend on your tax situation and may differ from those shown. Also note that if you own the fund in a tax-deferred account, such as an individual retirement account or a 401(k) plan, this information does not apply to you. Such accounts are not subject to current taxes.
Finally, keep in mind that a fund’s performance—whether before or after taxes—does not guarantee future results.
| | | |
| Average Annual Total Returns: U.S. Stock Index Funds Large-Capitalization Portfolios | |
| Periods Ended December 31, 2010 | | | |
| | One | Five | Ten |
| | Year | Years | Years |
| Growth Index Fund Investor Shares | | | |
| Returns Before Taxes | 16.96% | 3.83% | 1.30% |
| Returns After Taxes on Distributions | 16.76 | 3.67 | 1.11 |
| Returns After Taxes on Distributions and Sale of Fund Shares | 11.24 | 3.26 | 1.04 |
| |
| | One | Five | Ten |
| | Year | Years | Years |
| Value Index Fund Investor Shares | | | |
| Returns Before Taxes | 14.28% | 1.36% | 1.99% |
| Returns After Taxes on Distributions | 13.88 | 0.94 | 1.41 |
| Returns After Taxes on Distributions and Sale of Fund Shares | 9.76 | 1.14 | 1.52 |
| |
| | | | Since |
| | One | Five | Inception |
| | Year | Years | (1/30/2004) |
| Large-Cap Index Fund Investor Shares | | | |
| Returns Before Taxes | 15.63% | 2.64% | 4.09% |
| Returns After Taxes on Distributions | 15.32 | 2.36 | 3.80 |
| Returns After Taxes on Distributions and Sale of Fund Shares | 10.52 | 2.23 | 3.50 |
81
About Your Fund’s Expenses
As a shareholder of the fund, you incur ongoing costs, which include costs for portfolio management, administrative services, and shareholder reports (like this one), among others. Operating expenses, which are deducted from a fund’s gross income, directly reduce the investment return of the fund.
A fund’s expenses are expressed as a percentage of its average net assets. This figure is known as the expense ratio. The following examples are intended to help you understand the ongoing costs (in dollars) of investing in your fund and to compare these costs with those of other mutual funds. The examples are based on an investment of $1,000 made at the beginning of the period shown and held for the entire period.
The accompanying table illustrates your fund’s costs in two ways:
• Based on actual fund return. This section helps you to estimate the actual expenses that you paid over the period. The ”Ending Account Value“ shown is derived from the fund‘s actual return, and the third column shows the dollar amount that would have been paid by an investor who started with $1,000 in the fund. You may use the information here, together with the amount you invested, to estimate the expenses that you paid over the period.
To do so, simply divide your account value by $1,000 (for example, an $8,600 account value divided by $1,000 = 8.6), then multiply the result by the number given for your fund under the heading ”Expenses Paid During Period.“
• Based on hypothetical 5% yearly return. This section is intended to help you compare your fund‘s costs with those of other mutual funds. It assumes that the fund had a yearly return of 5% before expenses, but that the expense ratio is unchanged. In this case—because the return used is not the fund’s actual return—the results do not apply to your investment. The example is useful in making comparisons because the Securities and Exchange Commission requires all mutual funds to calculate expenses based on a 5% return. You can assess your fund’s costs by comparing this hypothetical example with the hypothetical examples that appear in shareholder reports of other funds.
Note that the expenses shown in the table are meant to highlight and help you compare ongoing costs only and do not reflect transaction costs incurred by the fund for buying and selling securities. Further, the expenses do not include the account service fee described in the prospectus. If such a fee were applied to your account, your costs would be higher. Your fund does not charge transaction fees, such as purchase or redemption fees, nor does it carry a “sales load.” The calculations assume no shares were bought or sold during the period. Your actual costs may have been higher or lower, depending on the amount of your investment and the timing of any purchases or redemptions.
You can find more information about the fund’s expenses, including annual expense ratios, in the Financial Statements section of this report. For additional information on operating expenses and other shareholder costs, please refer to your fund’s current prospectus.
82
| | | |
| Six Months Ended December 31, 2010 | | | |
| | Beginning | Ending | Expenses |
| | Account Value | Account Value | Paid During |
| | 6/30/2010 | 12/31/2010 | Period |
| Based on Actual Fund Return | | | |
| Growth Index Fund | | | |
| Investor Shares | $1,000.00 | $1,269.94 | $1.49 |
| Admiral Shares | 1,000.00 | 1,270.79 | 0.69 |
| Signal Shares | 1,000.00 | 1,270.65 | 0.69 |
| Institutional Shares | 1,000.00 | 1,271.13 | 0.46 |
| ETF Shares | 1,000.00 | 1,270.70 | 0.69 |
| Value Index Fund | | | |
| Investor Shares | $1,000.00 | $1,208.63 | $1.45 |
| Admiral Shares | 1,000.00 | 1,209.48 | 0.67 |
| Signal Shares | 1,000.00 | 1,209.15 | 0.67 |
| Institutional Shares | 1,000.00 | 1,209.09 | 0.45 |
| ETF Shares | 1,000.00 | 1,209.17 | 0.67 |
| Large-Cap Index Fund | | | |
| Investor Shares | $1,000.00 | $1,239.00 | $1.47 |
| Admiral Shares | 1,000.00 | 1,239.56 | 0.68 |
| Signal Shares | 1,000.00 | 1,239.93 | 0.68 |
| Institutional Shares | 1,000.00 | 1,239.93 | 0.45 |
| ETF Shares | 1,000.00 | 1,239.65 | 0.68 |
83
| | | |
| Six Months Ended December 31, 2010 | | | |
| | Beginning | Ending | Expenses |
| | Account Value | Account Value | Paid During |
| | 6/30/2010 | 12/31/2010 | Period |
| Based on Hypothetical 5% Yearly Return | | | |
| Growth Index Fund | | | |
| Investor Shares | $1,000.00 | $1,023.89 | $1.33 |
| Admiral Shares | 1,000.00 | 1,024.60 | 0.61 |
| Signal Shares | 1,000.00 | 1,024.60 | 0.61 |
| Institutional Shares | 1,000.00 | 1,024.80 | 0.41 |
| ETF Shares | 1,000.00 | 1,024.60 | 0.61 |
| Value Index Fund | | | |
| Investor Shares | $1,000.00 | $1,023.89 | $1.33 |
| Admiral Shares | 1,000.00 | 1,024.60 | 0.61 |
| Signal Shares | 1,000.00 | 1,024.60 | 0.61 |
| Institutional Shares | 1,000.00 | 1,024.80 | 0.41 |
| ETF Shares | 1,000.00 | 1,024.60 | 0.61 |
| Large-Cap Index Fund | | | |
| Investor Shares | $1,000.00 | $1,023.89 | $1.33 |
| Admiral Shares | 1,000.00 | 1,024.60 | 0.61 |
| Signal Shares | 1,000.00 | 1,024.60 | 0.61 |
| Institutional Shares | 1,000.00 | 1,024.80 | 0.41 |
| ETF Shares | 1,000.00 | 1,024.60 | 0.61 |
The calculations are based on expenses incurred in the most recent six-month period. The funds’ annualized six-month expense ratios for that period are: for the Growth Index Fund, 0.26% for Investor Shares, 0.12% for Admiral Shares, 0.12% for Signal Shares, 0.08% for Institutional Shares, and 0.12% for ETF Shares; for the Value Index Fund, 0.26% for Investor Shares, 0.12% for Admiral Shares, 0.12% for Signal Shares, 0.08% for Institutional Shares, and 0.12% for ETF Shares; and for the Large-Cap Index Fund, 0.26% for Investor Shares, 0.12% for Admiral Shares, 0.12% for Signal Shares, 0.08% for Institutional Shares, and 0.12% for ETF Shares. The dollar amounts shown as “Expenses Paid” are equal to the annualized expense ratio multiplied by the average account value over the period, multiplied by the number of days in the most recent six-month period, then divided by the number of days in the most recent 12-month period.
84
Glossary
30-Day SEC Yield. A fund’s 30-day SEC yield is derived using a formula specified by the U.S. Securities and Exchange Commission. Under the formula, data related to the fund’s security holdings in the previous 30 days are used to calculate the fund’s hypothetical net income for that period, which is then annualized and divided by the fund’s estimated average net assets over the calculation period. For the purposes of this calculation, a security’s income is based on its current market yield to maturity (in the case of bonds) or its projected dividend yield (for stocks). Because the SEC yield represents hypothetical annualized income, it will differ—at times significantly—from the fund’s actual experience. As a result, the fund’s income distributions may be higher or lower than implied by the SEC yield.
Beta. A measure of the magnitude of a fund’s past share-price fluctuations in relation to the ups and downs of a given market index. The index is assigned a beta of 1.00. Compared with a given index, a fund with a beta of 1.20 typically would have seen its share price rise or fall by 12% when the index rose or fell by 10%. For this report, beta is based on returns over the past 36 months for both the fund and the index. Note that a fund’s beta should be reviewed in conjunction with its R-squared (see definition). The lower the R-squared, the less correlation there is between the fund and the index, and the less reliable beta is as an indicator of volatility.
Dividend Yield. Dividend income earned by stocks, expressed as a percentage of the aggregate market value (or of net asset value, for a fund). The yield is determined by dividing the amount of the annual dividends by the aggregate value (or net asset value) at the end of the period. For a fund, the dividend yield is based solely on stock holdings and does not include any income produced by other investments.
Earnings Growth Rate. The average annual rate of growth in earnings over the past five years for the stocks now in a fund.
Equity Exposure. A measure that reflects a fund’s investments in stocks and stock futures. Any holdings in short-term reserves are excluded.
Expense Ratio. The percentage of a fund’s average net assets used to pay its annual administrative and advisory expenses. These expenses directly reduce returns to investors.
Foreign Holdings. The percentage of a fund represented by stocks or depositary receipts of companies based outside the United States.
Inception Date. The date on which the assets of a fund (or one of its share classes) are first invested in accordance with the fund’s investment objective. For funds with a subscription period, the inception date is the day after that period ends. Investment performance is measured from the inception date.
Median Market Cap. An indicator of the size of companies in which a fund invests; the midpoint of market capitalization (market price x shares outstanding) of a fund’s stocks, weighted by the proportion of the fund’s assets invested in each stock. Stocks representing half of the fund’s assets have market capitalizations above the median, and the rest are below it.
Price/Book Ratio. The share price of a stock divided by its net worth, or book value, per share. For a fund, the weighted average price/book ratio of the stocks it holds.
85
Price/Earnings Ratio. The ratio of a stock’s current price to its per-share earnings over the past year. For a fund, the weighted average P/E of the stocks it holds. P/E is an indicator of market expectations about corporate prospects; the higher the P/E, the greater the expectations for a company’s future growth.
R-Squared. A measure of how much of a fund’s past returns can be explained by the returns from the market in general, as measured by a given index. If a fund’s total returns were precisely synchronized with an index’s returns, its R-squared would be 1.00. If the fund’s returns bore no relationship to the index’s returns, its R-squared would be 0. For this report, R-squared is based on returns over the past 36 months for both the fund and the index.
Return on Equity. The annual average rate of return generated by a company during the past five years for each dollar of shareholder’s equity (net income divided by shareholder’s equity). For a fund, the weighted average return on equity for the companies whose stocks it holds.
Short-Term Reserves. The percentage of a fund invested in highly liquid, short-term securities that can be readily converted to cash.
Turnover Rate. An indication of the fund’s trading activity. Funds with high turnover rates incur higher transaction costs and may be more likely to distribute capital gains (which may be taxable to investors). The turnover rate excludes in-kind transactions, which have minimal impact on costs.
86
This page intentionally left blank.
The People Who Govern Your Fund
The trustees of your mutual fund are there to see that the fund is operated and managed in your best interests since, as a shareholder, you are a part owner of the fund. Your fund’s trustees also serve on the board of directors of The Vanguard Group, Inc., which is owned by the Vanguard funds and provides services to them on an at-cost basis.
A majority of Vanguard’s board members are independent, meaning that they have no affiliation with Vanguard or the funds they oversee, apart from the sizable personal investments they have made as private individuals. The independent board members have distinguished backgrounds in business, academia, and public service. Each of the trustees and executive officers oversees 179 Vanguard funds.
The following table provides information for each trustee and executive officer of the fund. More information about the trustees is in the Statement of Additional Information, which can be obtained, without charge, by contacting Vanguard at 800-662-7447, or online at vanguard.com.
| |
| Interested Trustee1 | Amy Gutmann |
| | Born 1949. Trustee Since June 2006. Principal |
| F. William McNabb III | Occupation(s) During the Past Five Years: President |
| Born 1957. Trustee Since July 2009. Chairman of the | of the University of Pennsylvania; Christopher H. |
| Board. Principal Occupation(s) During the Past Five | Browne Distinguished Professor of Political Science |
| Years: Chairman of the Board of The Vanguard Group, | in the School of Arts and Sciences with secondary |
| Inc., and of each of the investment companies served | appointments at the Annenberg School for Commu- |
| by The Vanguard Group, since January 2010; Director | nication and the Graduate School of Education |
| of The Vanguard Group since 2008; Chief Executive | of the University of Pennsylvania; Director of |
| Officer and President of The Vanguard Group and of | Carnegie Corporation of New York, Schuylkill River |
| each of the investment companies served by The | Development Corporation, and Greater Philadelphia |
| Vanguard Group since 2008; Director of Vanguard | Chamber of Commerce; Trustee of the National |
| Marketing Corporation; Managing Director of The | Constitution Center; Chair of the Presidential |
| Vanguard Group (1995–2008) . | Commission for the Study of Bioethical Issues. |
| |
| | JoAnn Heffernan Heisen |
| Independent Trustees | Born 1950. Trustee Since July 1998. Principal |
| | Occupation(s) During the Past Five Years: Corporate |
| Emerson U. Fullwood | Vice President and Chief Global Diversity Officer |
| Born 1948. Trustee Since January 2008. Principal | since 2006 (retired 2008) and Member of the |
| Occupation(s) During the Past Five Years: Executive | Executive Committee (retired 2008) of Johnson & |
| Chief Staff and Marketing Officer for North America | Johnson (pharmaceuticals/consumer products); Vice |
| and Corporate Vice President (retired 2008) of Xerox | President and Chief Information Officer of Johnson & |
| Corporation (document management products and | Johnson (1997–2005); Director of the University |
| services); Director of SPX Corporation (multi-industry | Medical Center at Princeton and Women’s Research |
| manufacturing), the United Way of Rochester, | and Education Institute; Member of the Advisory |
| Amerigroup Corporation (managed health care), | Board of the Maxwell School of Citizenship and Public |
| the University of Rochester Medical Center, and | Affairs at Syracuse University. |
| Monroe Community College Foundation. | |
| | F. Joseph Loughrey |
| Rajiv L. Gupta | Born 1949. Trustee Since October 2009. Principal |
| Born 1945. Trustee Since December 2001.2 | Occupation(s) During the Past Five Years: President |
| Principal Occupation(s) During the Past Five Years: | and Chief Operating Officer since 2005 (retired 2009) |
| Chairman and Chief Executive Officer (retired 2009) | and Vice Chairman of the Board (2008–2009) of |
| and President (2006–2008) of Rohm and Haas Co. | Cummins Inc. (industrial machinery); Director of |
| (chemicals); Director of Tyco International, Ltd. | SKF AB (industrial machinery), Hillenbrand, Inc. |
| (diversified manufacturing and services) and Hewlett- | (specialized consumer services), Sauer-Danfoss Inc. |
| Packard Co. (electronic computer manufacturing); | (machinery), the Lumina Foundation for Education, |
| Trustee of The Conference Board; Member of the | and Oxfam America; Chairman of the Advisory |
| Board of Managers of Delphi Automotive LLP | Council for the College of Arts and Letters at the |
| (automotive components) . | University of Notre Dame. |
| | |
| André F. Perold | Kathryn J. Hyatt | |
| Born 1952. Trustee Since December 2004. Principal | Born 1955. Treasurer Since November 2008. Principal |
| Occupation(s) During the Past Five Years: George | Occupation(s) During the Past Five Years: Principal |
| Gund Professor of Finance and Banking at the Harvard | of The Vanguard Group, Inc.; Treasurer of each of |
| Business School; Chair of the Investment Committee | the investment companies served by The Vanguard |
| of HighVista Strategies LLC (private investment firm) . | Group since 2008; Assistant Treasurer of each of the |
| | investment companies served by The Vanguard Group |
| Alfred M. Rankin, Jr. | (1988–2008) . | |
| Born 1941. Trustee Since January 1993. Principal | | |
| Occupation(s) During the Past Five Years: Chairman, | Heidi Stam | |
| President, and Chief Executive Officer of NACCO | Born 1956. Secretary Since July 2005. Principal |
| Industries, Inc. (forklift trucks/housewares/lignite); | Occupation(s) During the Past Five Years: Managing |
| Director of Goodrich Corporation (industrial products/ | Director of The Vanguard Group, Inc., since 2006; |
| aircraft systems and services); Chairman of the | General Counsel of The Vanguard Group since 2005; |
| Federal Reserve Bank of Cleveland; Trustee of The | Secretary of The Vanguard Group and of each of the |
| Cleveland Museum of Art. | investment companies served by The Vanguard Group |
| | since 2005; Director and Senior Vice President of |
| Peter F. Volanakis | Vanguard Marketing Corporation since 2005; |
| Born 1955. Trustee Since July 2009. Principal | Principal of The Vanguard Group (1997–2006). |
| Occupation(s) During the Past Five Years: President | | |
| since 2007 and Chief Operating Officer since 2005 | | |
| of Corning Incorporated (communications equipment); | Vanguard Senior Management Team |
| President of Corning Technologies (2001–2005); | | |
| Director of Corning Incorporated and Dow Corning; | R. Gregory Barton | Michael S. Miller |
| Trustee of the Corning Incorporated Foundation and | Mortimer J. Buckley | James M. Norris |
| the Corning Museum of Glass; Overseer of the | Kathleen C. Gubanich | Glenn W. Reed |
| Amos Tuck School of Business Administration at | Paul A. Heller | George U. Sauter |
| Dartmouth College. | | |
| |
| | Chairman Emeritus and Senior Advisor |
| Executive Officers | | |
| | John J. Brennan | |
| Glenn Booraem | Chairman, 1996–2009 | |
| Born 1967. Controller Since July 2010. Principal | Chief Executive Officer and President, 1996–2008 |
| Occupation(s) During the Past Five Years: Principal | | |
| of The Vanguard Group, Inc.; Controller of each of | | |
| the investment companies served by The Vanguard | Founder | |
| Group since 2010; Assistant Controller of each of | | |
| the investment companies served by The Vanguard | John C. Bogle | |
| Group (2001–2010) . | Chairman and Chief Executive Officer, 1974–1996 |
| |
| Thomas J. Higgins | | |
| Born 1957. Chief Financial Officer Since September | | |
| 2008. Principal Occupation(s) During the Past Five | | |
| Years: Principal of The Vanguard Group, Inc.; Chief | | |
| Financial Officer of each of the investment companies | | |
| served by The Vanguard Group since 2008; Treasurer | | |
| of each of the investment companies served by The | | |
| Vanguard Group (1998–2008) . | | |
1 Mr. McNabb is considered an “interested person,” as defined in the Investment Company Act of 1940, because he is an officer of the Vanguard funds.
2 December 2002 for Vanguard Equity Income Fund, Vanguard Growth Equity Fund, the Vanguard Municipal Bond Funds, and the Vanguard State Tax-Exempt Funds.
|  |
| P.O. Box 2600 |
| Valley Forge, PA 19482-2600 |
Connect with Vanguard® > vanguard.com
| Fund Information > 800-662-7447 | |
| Direct Investor Account Services > 800-662-2739 | |
| Institutional Investor Services > 800-523-1036 | |
| Text Telephone for People | |
| With Hearing Impairment > 800-749-7273 | |
| |
| This material may be used in conjunction | |
| with the offering of shares of any Vanguard | |
| fund only if preceded or accompanied by | |
| the fund’s current prospectus. | |
| |
| All comparative mutual fund data are from Lipper Inc. or | |
| Morningstar, Inc., unless otherwise noted. | |
| |
| You can obtain a free copy of Vanguard’s proxy voting | |
| guidelines by visiting vanguard.com/proxyreporting or by | |
| calling Vanguard at 800-662-2739. The guidelines are | |
| also available from the SEC’s website, sec.gov. In | |
| addition, you may obtain a free report on how your fund | |
| voted the proxies for securities it owned during the 12 | |
| months ended June 30. To get the report, visit either | |
| vanguard.com/proxyreporting or sec.gov. | |
| |
| You can review and copy information about your fund at | |
| the SEC’s Public Reference Room in Washington, D.C. To | |
| find out more about this public service, call the SEC at | |
| 202-551-8090. Information about your fund is also | |
| available on the SEC’s website, and you can receive | |
| copies of this information, for a fee, by sending a | |
| request in either of two ways: via e-mail addressed to | |
| publicinfo@sec.gov or via regular mail addressed to the | |
| Public Reference Section, Securities and Exchange | |
| Commission, Washington, DC 20549-1520. | |
| | © 2011 The Vanguard Group, Inc. |
| | All rights reserved. |
| | Vanguard Marketing Corporation, Distributor. |
| |
| | Q03070 022011 |
 |
| Vanguard Total Stock Market |
| Index Fund Annual Report |
|
| December 31, 2010 |
|
 |
|
|
> Vanguard Total Stock Market Index Fund closely tracked the 17.28% return of its benchmark index in 2010.
> Consumer discretionary and industrial stocks, two sectors that are keenly sensitive to the rhythms of the business cycle, posted especially strong returns.
> The fund outpaced the average returns of its peer group, which consists largely of actively managed funds, over the past year and the past decade.
| |
| Contents | |
| Your Fund’s Total Returns. | 1 |
| Chairman’s Letter. | 2 |
| Fund Profile. | 7 |
| Performance Summary. | 9 |
| Financial Statements. | 12 |
| Your Fund’s After-Tax Returns. | 29 |
| About Your Fund’s Expenses. | 30 |
| Glossary. | 32 |

Total Stock Market Index Fund
Please note: The opinions expressed in this report are just that—informed opinions. They should not be considered promises or advice. Also, please keep in mind that the information and opinions cover the period through the date on the front of this report. Of course, the risks of investing in your fund are spelled out in the prospectus.
See the Glossary for definitions of investment terms used in this report.
Cover photograph: Jean Maher.
Your Fund’s Total Returns
| |
| Fiscal Year Ended December 31, 2010 | |
| | Total |
| | Returns |
| Vanguard Total Stock Market Index Fund | |
| Investor Shares | 17.09% |
| Admiral™ Shares | 17.26 |
| Signal® Shares | 17.23 |
| Institutional Shares | 17.23 |
| ETF Shares | |
| Market Price | 17.28 |
| Net Asset Value | 17.26 |
| MSCI US Broad Market Index | 17.28 |
| Multi-Cap Core Funds Average | 15.55 |
| Multi-Cap Core Funds Average: Derived from data provided by Lipper Inc. | |
Admiral Shares carry lower expenses and are available to investors who meet certain account-balance requirements. Signal Shares and Institutional Shares are available to certain institutional investors who meet specific administrative, service, and account-size criteria. The Vanguard ETF® Shares shown are traded on the NYSE Arca exchange and are available only through brokers. The table provides ETF returns based on both the NYSE Arca market price and the net asset value for a share. U.S. Pat. No. 6,879,964 B2; 7,337,138.
For the ETF Shares, the market price is determined by the midpoint of the bid-offer spread as of the closing time of the New York Stock Exchange (generally 4 p.m., Eastern time). The net asset value is also determined as of the NYSE closing time. For more information about how the ETF Shares' market prices have compared with their net asset value, visit vanguard.com, select your ETF, and then select the Price and Performance tab. The ETF premium/discount analysis there shows the percentages of days on which the ETF Shares' market price was above or below the NAV.
| | | | |
| Your Fund’s Performance at a Glance | | | | |
| December 31, 2009 , Through December 31, 2010 | | | | |
| | | | Distributions Per Share |
| | Starting | Ending | Income | Capital |
| | Share Price | Share Price | Dividends | Gains |
| Vanguard Total Stock Market Index Fund | | | | |
| Investor Shares | $27.45 | $31.56 | $0.530 | $0.000 |
| Admiral Shares | 27.45 | 31.57 | 0.561 | 0.000 |
| Signal Shares | 26.50 | 30.47 | 0.542 | 0.000 |
| Institutional Shares | 27.46 | 31.57 | 0.565 | 0.000 |
| ETF Shares | 56.39 | 64.86 | 1.148 | 0.000 |
1

Chairman’s Letter
Dear Shareholder,
The first half of 2010 was marked by uncertainty about the strength of the global economic recovery and the sovereign debt crisis in Europe. As evidence of a solid economic rebound mounted, and as plans to aid struggling countries in Europe materialized, the market posted robust gains in the second half of the year.
Vanguard Total Stock Market Index Fund, which holds a blend of growth and value stocks of all market capitalizations, closely tracked the performance of its benchmark, the MSCI US Broad Market Index, which posted a 17.28% gain for the year. The average return of the fund’s peer group was 15.55%.
A broad market index fund can be a tax-efficient stock market investment. Despite its strong return, Vanguard Total Stock Market Index Fund distributed no capital gains in 2010. If you hold the fund in a taxable account, you may wish to review the after-tax returns that appear later in this report.
Please note that on October 6, Vanguard broadened the availability of our lower-cost Admiral Shares. We reduced the minimum investment requirement for these shares to $10,000 in most of our broad-market index funds, down from $100,000. The change is part of our ongoing efforts to lower the cost of investing for our clients.
2
Stocks rallied as the forecast seemed to brighten
After a series of false starts, hesitations, and retreats, global stock markets finished 2010 with powerful gains. As the prospect of a double-dip recession faded, the broad U.S. stock market clambered higher, shrugging off high unemployment and distress in Europe’s debt markets to return more than 17%. Small- and mid-capitalization stocks did even better.
Outside the United States, gains were more muted, in part because Europe’s sovereign debt challenges continued to reverberate through local stock markets. Emerging markets were the best performers. Asia’s developed markets performed weakly, though the strength of the yen, the Australian dollar, and other regional currencies bolstered returns for U.S.-based investors.
The fixed income market reprised a familiar theme
Although U.S. Treasury securities rallied through the summer, total return tables were dominated by riskier bonds for the full 12 months, a pattern we also saw in 2009. Low interest rates and a sense that the economic recovery was gathering momentum prompted investors to seek higher yields in both high-quality and below-investment-grade corporate bonds. The broad U.S. bond market returned 6.54%. Late in the year, yields bounced off
| | | |
| Market Barometer | | | |
| |
| | | Average Annual Total Returns |
| | | Periods Ended December 31, 2010 |
| | One | Three | Five |
| | Year | Years | Years |
| Stocks | | | |
| Russell 1000 Index (Large-caps) | 16.10% | -2.37% | 2.59% |
| Russell 2000 Index (Small-caps) | 26.86 | 2.22 | 4.47 |
| Dow Jones U.S. Total Stock Market Index | 17.70 | -1.56 | 3.17 |
| MSCI All Country World Index ex USA (International) | 11.60 | -4.58 | 5.29 |
| |
| Bonds | | | |
| Barclays Capital U.S. Aggregate Bond Index (Broad | | | |
| taxable market) | 6.54% | 5.90% | 5.80% |
| Barclays Capital Municipal Bond Index (Broad | | | |
| tax-exempt market) | 2.38 | 4.08 | 4.09 |
| Citigroup Three-Month U.S. Treasury Bill Index | 0.13 | 0.69 | 2.29 |
| |
| CPI | | | |
| Consumer Price Index | 1.50% | 1.43% | 2.18% |
3
summer lows, putting pressure on bond prices. The dynamic was especially pronounced among municipal bonds.
As it has since December 2008, the Fed held its target for short-term interest rates near 0%, keeping the returns available from money market instruments such as the 3-month Treasury bill in the same neighborhood.
Most market sectors displayed signs of strength during the year
Vanguard Total Stock Market Index Fund, designed to track the performance of the broad U.S. market, was bolstered by an apparent acceleration of the U.S. economic recovery. As fears faded that the U.S. would slip back into recession, and as the prospects for an uptick in consumer spending and in business investment brightened, the market enjoyed a strong rally.
Gains were broad-based, with all but the health care and utilities sectors posting double-digit returns. Consumer discretionary and industrial stocks turned in the best performances.
Consumer discretionary stocks gained more than 30% for the period. The economic recovery and a rebound in advertising helped power strong performance by media stocks. And with consumer spending showing signs of improvement, restaurants and hotels, resorts, and cruise lines posted major gains.
| | | | | | |
| Expense Ratios | | | | | | |
| Your Fund Compared With Its Peer Group | | | | | | |
| | | | | | | Peer |
| | Investor | Admiral | Signal | Institutional | ETF | Group |
| | Shares | Shares | Shares | Shares | Shares | Average |
| Total Stock Market Index Fund | 0.18% | 0.07% | 0.07% | 0.06% | 0.07% | 1.20% |
The fund expense ratios shown are from the prospectus dated April 29, 2010, and represent estimated costs for the current fiscal year. For the fiscal year ended December 31, 2010, the fund’s expense ratios were: 0.17% for Investor Shares, 0.06% for Admiral Shares, 0.06% for Signal Shares, 0.05% for Institutional Shares, and 0.06% for ETF Shares. The peer-group expense ratio is derived from data provided by Lipper Inc. and captures information through year-end 2009.
Peer group: Multi-Cap Core Funds.
4
Stocks in the industrial sector were close behind, returning 27%. Machinery stocks, which were hit hard in the recession, continued to benefit from the ongoing U.S. recovery. Shares of companies that make and sell construction and farm machinery and heavy trucks saw outsized returns, a consequence, perhaps, of the global boom in prices of agricultural products. Energy and materials stocks, two sectors with an industrial flavor, also delivered impressive gains.
Financial stocks rose as banks, brokerages, and insurance companies continued to put some distance between the financial crisis and their financial statements. Insurance stocks, in particular, saw healthy returns. And despite a high number of bank failures during the year, commercial banks overall posted good returns as credit quality for most of the group continued to show gradual improvement.
The utilities and health care sectors produced more pedestrian returns. A variety of company-specific concerns weighed on the big pharmaceutical companies and medical-equipment makers, while the sluggish economic expansion left power producers with idle capacity.
Over the last ten years the Total Stock Market Index Fund’s Investor Shares have produced an average annual return of 2.45%. That is in line with the benchmark return over the period and nearly one
| |
| Total Returns | |
| Ten Years Ended December 31, 2010 | |
| | Average |
| | Annual Return |
| Total Stock Market Index Fund Investor Shares | 2.45% |
| Spliced Total Stock Market Index | 2.56 |
| Multi-Cap Core Funds Average | 1.63 |
Spliced Total Stock Market Index: Dow Jones Wilshire 5000 Index through April 22, 2005; MSCI US Broad Market Index thereafter.
Multi-Cap Core Funds Average: Derived from data provided by Lipper Inc.
The figures shown represent past performance, which is not a guarantee of future results. (Current performance may be lower or higher than the performance data cited. For performance data current to the most recent month-end, visit our website at vanguard.com/performance.) Note, too, that both investment returns and principal value can fluctuate widely, so an investor’s shares, when sold, could be worth more or less than their original cost.
5
percentage point higher than the average for its peer group of funds, many of which are actively managed.
Tight index tracking is the definition of success for an index fund manager. The goal is simple, but the task can be challenging, especially during episodes of extreme volatility, such as the bursting of the tech stock bubble early in the decade and the global financial crisis near the end. The fund’s success in tracking its index is a testament to the expertise of the fund’s advisor, Vanguard Quantitative Equity Group. Drawing on more than 30 years of experience, this group of professionals uses well-honed portfolio construction and trading methodologies that have allowed Vanguard to provide effective index-tracking fund management regardless of the market’s volatility or direction. The fund has also benefited from its low costs, which close the gap between index results and your results.
A tough decade demands perspective from investors
Although investors may be less than enthusiastic about the returns of the Total Stock Market Index Fund and other equity funds over the last ten years, it is critical to put those returns in perspective. This decade was among the worst in U.S. stock market history. Investors who are willing to weather these sometimes long-lasting storms can keep themselves in position to earn better returns when the stock market recovers, as it has over the past two years.
A key to waiting out the storm is to resist impulses such as the often counterproductive urge to flee when markets turn rough. Balance and diversification, which can blunt the impact of downturns, are useful allies in this struggle. That is why Vanguard counsels investors to build a diversified portfolio of stock, bond, and money market investments tailored to their risk tolerance and time horizon in order to be best positioned to prosper, regardless of the market’s short-term gyrations. Vanguard Total Stock Market Index Fund, with its broad mandate and low cost, can be a useful core element in such a portfolio.
As always, thank you for entrusting your assets to Vanguard.
Sincerely,

F. William McNabb III
Chairman and Chief Executive Officer
January 18, 2011
6
Total Stock Market Index Fund
Fund Profile
As of December 31, 2010
| | | | | |
| Share-Class Characteristics | | | | | |
| | Investor | Admiral | Signal | Institutional | ETF |
| | Shares | Shares | Shares | Shares | Shares |
| Ticker Symbol | VTSMX | VTSAX | VTSSX | VITSX | VTI |
| Expense Ratio1 | 0.18% | 0.07% | 0.07% | 0.06% | 0.07% |
| 30-Day SEC Yield | 1.38% | 1.50% | 1.50% | 1.51% | 1.50% |
| | |
| Portfolio Characteristics | | |
| | | MSCI US |
| | | Broad Market |
| | Fund | Index |
| Number of Stocks | 3,389 | 3,490 |
| Median Market Cap | $29.7B | $29.7B |
| Price/Earnings Ratio | 18.1x | 18.1x |
| Price/Book Ratio | 2.2x | 2.2x |
| Return on Equity | 18.8% | 18.7% |
| Earnings Growth Rate | 6.2% | 6.2% |
| Dividend Yield | 1.7% | 1.7% |
| Foreign Holdings | 0.0% | 0.0% |
| Turnover Rate | 5% | — |
| Short-Term Reserves | 0.0% | — |
| |
| Volatility Measures | |
| | MSCI US |
| | Broad Market |
| | Index |
| R-Squared | 1.00 |
| Beta | 1.00 |
These measures show the degree and timing of the fund’s fluctuations compared with the index over 36 months.
| | |
| Ten Largest Holdings (% of total net assets) |
| Exxon Mobil Corp. | Integrated Oil & | |
| | Gas | 2.6% |
| Apple Inc. | Computer | |
| | Hardware | 2.1 |
| Microsoft Corp. | Systems Software | 1.5 |
| General Electric Co. | Industrial | |
| | Conglomerates | 1.4 |
| International Business | IT Consulting & | |
| Machines Corp. | Other Services | 1.3 |
| Chevron Corp. | Integrated Oil & | |
| | Gas | 1.3 |
| Procter & Gamble Co. | Household | |
| | Products | 1.3 |
| AT&T Inc. | Integrated | |
| | Telecommunication | |
| | Services | 1.2 |
| Johnson & Johnson | Pharmaceuticals | 1.2 |
| JPMorgan Chase & Co. | Diversified Financial | |
| | Services | 1.2 |
| Top Ten | | 15.1% |
The holdings listed exclude any temporary cash investments and equity index products.
1 The expense ratios shown are from the prospectus dated April 29, 2010, and represent estimated costs for the current fiscal year. For the fiscal year ended December 31, 2010, the expense ratios were 0.17% for Investor Shares, 0.06% for Admiral Shares, 0.06% for Signal Shares, 0.05% for Institutional Shares, and 0.06% for ETF Shares.
7
Total Stock Market Index Fund
| | |
| Sector Diversification (% of equity exposure) |
| | | MSCI US |
| | | Broad Market |
| | Fund | Index |
| Consumer Discretionary | 11.5% | 11.5% |
| Consumer Staples | 9.1 | 9.1 |
| Energy | 11.3 | 11.3 |
| Financials | 16.3 | 16.3 |
| Health Care | 11.2 | 11.2 |
| Industrials | 11.5 | 11.5 |
| Information Technology | 18.7 | 18.7 |
| Materials | 4.2 | 4.2 |
| Telecommunication | | |
| Services | 2.8 | 2.8 |
| Utilities | 3.4 | 3.4 |
Investment Focus
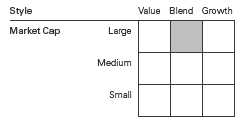
8
Total Stock Market Index Fund
Performance Summary
All of the returns in this report represent past performance, which is not a guarantee of future results that may be achieved by the fund. (Current performance may be lower or higher than the performance data cited. For performance data current to the most recent month-end, visit our website at vanguard.com/performance.) Note, too, that both investment returns and principal value can fluctuate widely, so an investor’s shares, when sold, could be worth more or less than their original cost. The returns shown do not reflect taxes that a shareholder would pay on fund distributions or on the sale of fund shares.
Cumulative Performance: December 31, 2000, Through December 31, 2010
Initial Investment of $10,000
| | | | |
| | Average Annual Total Returns | |
| | Periods Ended December 31, 2010 | |
| | | | | Final Value |
| | One | Five | Ten | of a $10,000 |
| | Year | Years | Years | Investment |
| Total Stock Market Index Fund | | | | |
| Investor Shares | 17.09% | 2.94% | 2.45% | $12,744 |
| – – – – Spliced Total Stock Market Index | 17.28 | 3.04 | 2.56 | 12,873 |
| Multi-Cap Core Funds Average | 15.55 | 2.14 | 1.63 | 11,759 |
Spliced Total Stock Market Index: Dow Jones Wilshire 5000 Index through April 22, 2005; MSCI US Broad Market Index thereafter.
Multi-Cap Core Funds Average: Derived from data provided by Lipper Inc.
| | | | |
| | | | | Final Value |
| | One | Five | Ten | of a $10,000 |
| | Year | Years | Years | Investment |
| Total Stock Market Index Fund | | | | |
| Admiral Shares | 17.26% | 3.05% | 2.54% | $12,849 |
| Spliced Total Stock Market Index | 17.28 | 3.04 | 2.56 | 12,873 |
See Financial Highlights for dividend and capital gains information.
9
Total Stock Market Index Fund
| | | |
| | Average Annual Total Returns | |
| | Periods Ended December 31, 2010 | |
| | | Since | Final Value |
| | One | Inception | of a $10,000 |
| | Year | (9/1/2006) | Investment |
| Total Stock Market Index Fund | | | |
| Signal Shares | 17.23% | 2.11% | $10,945 |
| MSCI US Broad Market Index | 17.28 | 2.10 | 10,941 |
| "Since Inception" performance is calculated from the Signal Shares’ inception date for both the fund and its comparative standard. |
| | | | |
| | | | | Final Value |
| | One | Five | Ten | of a $5,000,000 |
| | Year | Years | Years | Investment |
| Total Stock Market Index Fund | | | | |
| Institutional Shares | 17.23% | 3.07% | 2.57% | $6,446,035 |
| Spliced Total Stock Market Index | 17.28 | 3.04 | 2.56 | 6,436,328 |
| | | | |
| | | | Since | Final Value |
| | One | Five | Inception | of a $10,000 |
| | Year | Years | (5/24/2001) | Investment |
| Total Stock Market Index Fund | | | | |
| ETF Shares Net Asset Value | 17.26% | 3.05% | 2.78% | $13,010 |
| Spliced Total Stock Market Index | 17.28 | 3.04 | 2.80 | 13,035 |
| "Since Inception" performance is calculated from the ETF Shares’ inception date for both the fund and its comparative standard. |
| | | |
| Cumulative Returns of ETF Shares: May 24, 2001, Through December 31, 2010 | | |
| | | | Since |
| | One | Five | Inception |
| | Year | Years | (5/24/2001) |
| Total Stock Market Index Fund | | | |
| ETF Shares Market Price | 17.28% | 16.30% | 30.17% |
| Total Stock Market Index Fund | | | |
| ETF Shares Net Asset Value | 17.26 | 16.23 | 30.10 |
| Spliced Total Stock Market Index | 17.28 | 16.17 | 30.35 |
| "Since Inception" performance is calculated from the ETF Shares’ inception date for both the fund and its comparative standard. | |
10
Total Stock Market Index Fund
Fiscal-Year Total Returns (%): December 31, 2000, Through December 31, 2010
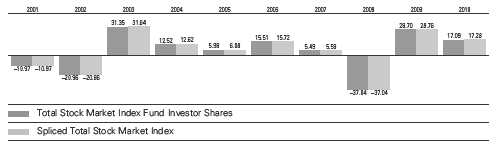
11
Total Stock Market Index Fund
Financial Statements
Statement of Net Assets—Investments Summary
As of December 31, 2010
This Statement summarizes the fund’s holdings by asset type. Details are reported for each of the fund’s 50 largest individual holdings and for investments that, in total for any issuer, represent more than 1% of the fund’s net assets. The total value of smaller holdings is reported as a single amount within each category.
The fund reports a complete list of its holdings in regulatory filings four times in each fiscal year, at the quarter-ends. For the second and fourth fiscal quarters, the complete listing of the fund’s holdings is available electronically on vanguard.com and on the Securities and Exchange Commission’s website (sec.gov), or you can have it mailed to you without charge by calling 800-662-7447. For the first and third fiscal quarters, the fund files the lists with the SEC on Form N-Q. Shareholders can look up the fund’s Forms N-Q on the SEC’s website. Forms N-Q may also be reviewed and copied at the SEC’s Public Reference Room (see the back cover of this report for further information).
| | | |
| | | Market | Percentage |
| | | Value | of Net |
| | Shares | ($000) | Assets |
| Common Stocks | | | |
| Consumer Discretionary | | | |
| McDonald’s Corp. | 11,225,994 | 861,707 | 0.6% |
| Walt Disney Co. | 19,163,740 | 718,832 | 0.5% |
| * Amazon.com Inc. | 3,778,648 | 680,157 | 0.4% |
| Home Depot Inc. | 17,723,306 | 621,379 | 0.4% |
| Comcast Corp. Class A | 25,077,409 | 550,951 | 0.4% |
| * Ford Motor Co. | 31,975,185 | 536,863 | 0.4% |
| Consumer Discretionary—Other † | | 13,285,931 | 8.8% |
| | | 17,255,820 | 11.5% |
| Consumer Staples | | | |
| Procter & Gamble Co. | 29,931,918 | 1,925,520 | 1.3% |
| Coca-Cola Co. | 21,925,943 | 1,442,069 | 1.0% |
| Wal-Mart Stores Inc. | 21,519,464 | 1,160,545 | 0.8% |
| Philip Morris International Inc. | 19,332,844 | 1,131,551 | 0.7% |
| PepsiCo Inc. | 16,779,844 | 1,096,227 | 0.7% |
| Kraft Foods Inc. | 18,398,143 | 579,725 | 0.4% |
| Altria Group Inc. | 21,979,710 | 541,140 | 0.4% |
| CVS Caremark Corp. | 14,302,234 | 497,289 | 0.3% |
| Consumer Staples—Other † | | 5,334,879 | 3.5% |
| | | 13,708,945 | 9.1% |
| Energy | | | |
| Exxon Mobil Corp. | 53,712,947 | 3,927,491 | 2.6% |
| Chevron Corp. | 21,209,399 | 1,935,358 | 1.3% |
| Schlumberger Ltd. | 14,413,899 | 1,203,561 | 0.8% |
| ConocoPhillips | 14,863,013 | 1,012,171 | 0.7% |
| Occidental Petroleum Corp. | 8,566,076 | 840,332 | 0.5% |
| Energy—Other † | | 7,984,684 | 5.3% |
| | | 16,903,597 | 11.2% |
12
Total Stock Market Index Fund
| | | | |
| | | | Market | Percentage |
| | | | Value | of Net |
| | | Shares | ($000) | Assets |
| Financials | | | |
| | JPMorgan Chase & Co. | 41,827,829 | 1,774,336 | 1.2% |
| | Wells Fargo & Co. | 52,446,811 | 1,625,327 | 1.1% |
| * | Citigroup Inc. | 306,443,491 | 1,449,478 | 1.0% |
| | Bank of America Corp. | 105,803,854 | 1,411,423 | 0.9% |
| | Goldman Sachs Group Inc. | 5,177,573 | 870,661 | 0.6% |
| * | Berkshire Hathaway Inc. Class B | 7,785,640 | 623,708 | 0.4% |
| | US Bancorp | 20,220,570 | 545,349 | 0.4% |
| | American Express Co. | 11,421,553 | 490,213 | 0.3% |
| | Financials—Other † | | 15,683,114 | 10.4% |
| | | | 24,473,609 | 16.3% |
| Health Care | | | |
| | Johnson & Johnson | 29,056,092 | 1,797,119 | 1.2% |
| | Pfizer Inc. | 84,795,299 | 1,484,766 | 1.0% |
| | Merck & Co. Inc. | 32,422,657 | 1,168,513 | 0.8% |
| | Abbott Laboratories | 16,280,003 | 779,975 | 0.5% |
| * | Amgen Inc. | 10,108,959 | 554,982 | 0.3% |
| *,1 | Matrixx Initiatives Inc. | 505,277 | 4,275 | 0.0% |
| | Health Care—Other † | | 10,948,273 | 7.3% |
| | | | 16,737,903 | 11.1% |
| Industrials | | | |
| | General Electric Co. | 112,779,731 | 2,062,741 | 1.4% |
| | United Technologies Corp. | 9,308,980 | 732,803 | 0.5% |
| | Caterpillar Inc. | 6,649,371 | 622,780 | 0.4% |
| | 3M Co. | 7,145,461 | 616,653 | 0.4% |
| | United Parcel Service Inc. Class B | 7,646,821 | 555,006 | 0.4% |
| | Industrials—Other † | | 12,603,467 | 8.3% |
| | | | 17,193,450 | 11.4% |
| Information Technology | | | |
| * | Apple Inc. | 9,637,108 | 3,108,546 | 2.1% |
| | Microsoft Corp. | 82,156,540 | 2,293,811 | 1.5% |
| | International Business Machines Corp. | 13,304,985 | 1,952,640 | 1.3% |
| * | Google Inc. Class A | 2,599,875 | 1,544,248 | 1.0% |
| | Oracle Corp. | 42,417,288 | 1,327,661 | 0.9% |
| | Intel Corp. | 58,736,536 | 1,235,229 | 0.8% |
| * | Cisco Systems Inc. | 60,245,714 | 1,218,771 | 0.8% |
| | Hewlett-Packard Co. | 24,622,736 | 1,036,617 | 0.7% |
| | QUALCOMM Inc. | 16,930,085 | 837,870 | 0.6% |
| * | EMC Corp. | 21,658,896 | 495,989 | 0.3% |
| | Information Technology—Other † | | 12,910,432 | 8.6% |
| | | | 27,961,814 | 18.6% |
| Materials | | | |
| | Freeport-McMoRan Copper & Gold Inc. | 4,961,905 | 595,875 | 0.4% |
| | Materials—Other † | | 5,751,979 | 3.8% |
| | | | 6,347,854 | 4.2% |
| Telecommunication Services | | | |
| | AT&T Inc. | 62,333,712 | 1,831,365 | 1.2% |
| | Verizon Communications Inc. | 29,813,847 | 1,066,739 | 0.7% |
| | Telecommunication Services—Other † | | 1,317,013 | 0.9% |
| | | | 4,215,117 | 2.8% |
| |
| Utilities † | | 5,064,451 | 3.4% |
| Total Common Stocks (Cost $134,126,170) | | 149,862,560 | 99.6%2 |
13
Total Stock Market Index Fund
| | | | |
| | | | Market | Percentage |
| | | | Value | of Net |
| | Coupon | Shares | ($000) | Assets |
| Temporary Cash Investments | | | | |
| Money Market Fund | | | | |
| 3,4 Vanguard Market Liquidity Fund 0.211% | 1,122,830,000 | | 1,122,830 | 0.7% |
| |
| 5U.S. Government and Agency Obligations † | | | 69,969 | 0.1% |
| Total Temporary Cash Investments (Cost $1,192,797) | | | 1,192,799 | 0.8%2 |
| 6Total Investments (Cost $135,318,967) | | | 151,055,359 | 100.4% |
| Other Assets and Liabilities | | | | |
| Other Assets | | | 362,864 | 0.2% |
| Liabilities4 | | | (979,353) | (0.6%) |
| | | | (616,489) | (0.4%) |
| Net Assets | | | 150,438,870 | 100.0% |
| |
| At December 31, 2010, net assets consisted of: | |
| | Amount |
| | ($000) |
| Paid-in Capital | 137,668,791 |
| Overdistributed Net Investment Income | (118,752) |
| Accumulated Net Realized Losses | (2,854,159) |
| Unrealized Appreciation (Depreciation) | |
| Investment Securities | 15,736,392 |
| Futures Contracts | 6,598 |
| Net Assets | 150,438,870 |
| |
| Investor Shares—Net Assets | |
| Applicable to 1,776,199,526 outstanding $.001 par value shares of | |
| beneficial interest (unlimited authorization) | 56,062,515 |
| Net Asset Value Per Share—Investor Shares | $31.56 |
14
Total Stock Market Index Fund
| |
| | Amount |
| | ($000) |
| Admiral Shares—Net Assets | |
| Applicable to 1,494,777,436 outstanding $.001 par value shares of | |
| beneficial interest (unlimited authorization) | 47,190,165 |
| Net Asset Value Per Share—Admiral Shares | $31.57 |
| |
| Signal Shares—Net Assets | |
| Applicable to 179,549,416 outstanding $.001 par value shares of | |
| beneficial interest (unlimited authorization) | 5,470,847 |
| Net Asset Value Per Share—Signal Shares | $30.47 |
| |
| Institutional Shares—Net Assets | |
| Applicable to 753,307,644 outstanding $.001 par value shares of | |
| beneficial interest (unlimited authorization) | 23,784,949 |
| Net Asset Value Per Share—Institutional Shares | $31.57 |
| |
| ETF Shares—Net Assets | |
| Applicable to 276,468,622 outstanding $.001 par value shares of | |
| beneficial interest (unlimited authorization) | 17,930,394 |
| Net Asset Value Per Share—ETF Shares | $64.86 |
See Note A in Notes to Financial Statements.
* Non-income-producing security.
† Represents the aggregate value, by category, of securities that are not among the 50 largest holdings and, in total for any issuer, represent 1% or less of net assets.
1 Considered an affiliated company of the fund as the fund owns more than 5% of the outstanding voting securities of such company.
2 The fund invests a portion of its cash reserves in equity markets through the use of index futures contracts. After giving effect to futures investments, the fund’s effective common stock and temporary cash investment positions represent 100.0% and 0.4%, respectively, of net assets.
3 Affiliated money market fund available only to Vanguard funds and certain trusts and accounts managed by Vanguard. Rate shown is the 7-day yield.
4 Includes $581,675,000 of collateral received for securities on loan.
5 Securities with a value of $62,973,000 have been segregated as initial margin for open futures contracts.
6 The total value of securities on loan is $539,942,000.
See accompanying Notes, which are an integral part of the Financial Statements.
15
Total Stock Market Index Fund
| |
| Statement of Operations | |
| |
| |
| | Year Ended |
| | December 31, 2010 |
| | ($000) |
| Investment Income | |
| Income | |
| Dividends1 | 2,644,160 |
| Interest1 | 1,035 |
| Security Lending | 38,218 |
| Total Income | 2,683,413 |
| Expenses | |
| The Vanguard Group—Note B | |
| Investment Advisory Services | 6,416 |
| Management and Administrative—Investor Shares | 84,422 |
| Management and Administrative—Admiral Shares | 10,927 |
| Management and Administrative—Signal Shares | 1,179 |
| Management and Administrative—Institutional Shares | 2,814 |
| Management and Administrative—ETF Shares | 3,409 |
| Marketing and Distribution—Investor Shares | 16,879 |
| Marketing and Distribution—Admiral Shares | 5,523 |
| Marketing and Distribution—Signal Shares | 1,378 |
| Marketing and Distribution—Institutional Shares | 5,122 |
| Marketing and Distribution—ETF Shares | 4,027 |
| Custodian Fees | 1,695 |
| Auditing Fees | 33 |
| Shareholders’ Reports—Investor Shares | 346 |
| Shareholders’ Reports—Admiral Shares | 61 |
| Shareholders’ Reports—Signal Shares | 16 |
| Shareholders’ Reports—Institutional Shares | 84 |
| Shareholders’ Reports—ETF Shares | 383 |
| Trustees’ Fees and Expenses | 201 |
| Total Expenses | 144,915 |
| Net Investment Income | 2,538,498 |
| Realized Net Gain (Loss) | |
| Investment Securities Sold1 | 2,937,053 |
| Futures Contracts | 95,071 |
| Realized Net Gain (Loss) | 3,032,124 |
| Change in Unrealized Appreciation (Depreciation) | |
| Investment Securities | 17,103,431 |
| Futures Contracts | 4,612 |
| Change in Unrealized Appreciation (Depreciation) | 17,108,043 |
| Net Increase (Decrease) in Net Assets Resulting from Operations | 22,678,665 |
1 Dividend income, interest income, and realized net gain (loss) from affiliated companies of the fund were $0, $943,000, and $35,000, respectively.
See accompanying Notes, which are an integral part of the Financial Statements.
16
Total Stock Market Index Fund
| | |
| Statement of Changes in Net Assets | | |
| |
| | Year Ended December 31, |
| | 2010 | 2009 |
| | ($000) | ($000) |
| Increase (Decrease) in Net Assets | | |
| Operations | | |
| Net Investment Income | 2,538,498 | 2,175,575 |
| Realized Net Gain (Loss) | 3,032,124 | 2,308,726 |
| Change in Unrealized Appreciation (Depreciation) | 17,108,043 | 21,880,122 |
| Net Increase (Decrease) in Net Assets Resulting from Operations | 22,678,665 | 26,364,423 |
| Distributions | | |
| Net Investment Income | | |
| Investor Shares | (1,125,436) | (1,040,191) |
| Admiral Shares | (669,720) | (513,860) |
| Signal Shares | (95,990) | (92,000) |
| Institutional Shares | (389,295) | (294,741) |
| ETF Shares | (297,379) | (249,604) |
| Realized Capital Gain | | |
| Investor Shares | — | — |
| Admiral Shares | — | — |
| Signal Shares | — | — |
| Institutional Shares | — | — |
| ETF Shares | — | — |
| Total Distributions | (2,577,820) | (2,190,396) |
| Capital Share Transactions | | |
| Investor Shares | (11,084,647) | 6,625,263 |
| Admiral Shares | 14,427,940 | 3,502,702 |
| Signal Shares | (5,204) | 76,072 |
| Institutional Shares | 4,677,116 | 2,143,723 |
| ETF Shares | 2,309,471 | 1,572,390 |
| Net Increase (Decrease) from Capital Share Transactions | 10,324,676 | 13,920,150 |
| Total Increase (Decrease) | 30,425,521 | 38,094,177 |
| Net Assets | | |
| Beginning of Period | 120,013,349 | 81,919,172 |
| End of Period1 | 150,438,870 | 120,013,349 |
| 1 Net Assets—End of Period includes undistributed (overdistributed) net investment income of ($118,752,000) and ($79,430,000). |
See accompanying Notes, which are an integral part of the Financial Statements.
17
Total Stock Market Index Fund
| | | | | |
| Financial Highlights | | | | | |
| |
| Investor Shares | | | | | |
| |
| For a Share Outstanding | | | Year Ended December 31, |
| Throughout Each Period | 2010 | 2009 | 2008 | 2007 | 2006 |
| Net Asset Value, Beginning of Period | $27.45 | $21.80 | $35.36 | $34.09 | $30.00 |
| Investment Operations | | | | | |
| Net Investment Income | .523 | .514 | .592 | .604 | .523 |
| Net Realized and Unrealized Gain (Loss) | | | | | |
| on Investments | 4.117 | 5.651 | (13.566) | 1.268 | 4.091 |
| Total from Investment Operations | 4.640 | 6.165 | (12.974) | 1.872 | 4.614 |
| Distributions | | | | | |
| Dividends from Net Investment Income | (.530) | (.515) | (.586) | (.602) | (.524) |
| Distributions from Realized Capital Gains | — | — | — | — | — |
| Total Distributions | (.530) | (.515) | (.586) | (.602) | (.524) |
| Net Asset Value, End of Period | $31.56 | $27.45 | $21.80 | $35.36 | $34.09 |
| |
| Total Return1 | 17.09% | 28.70% | -37.04% | 5.49% | 15.51% |
| |
| Ratios/Supplemental Data | | | | | |
| Net Assets, End of Period (Millions) | $56,063 | $58,004 | $39,440 | $50,183 | $39,095 |
| Ratio of Total Expenses to | | | | | |
| Average Net Assets | 0.17% | 0.18% | 0.16% | 0.15% | 0.19% |
| Ratio of Net Investment Income to | | | | | |
| Average Net Assets | 1.85% | 2.22% | 2.04% | 1.71% | 1.66% |
| Portfolio Turnover Rate2 | 5% | 5% | 5% | 4% | 4% |
1 Total returns do not include account service fees that may have applied in the periods shown. Fund prospectuses provide information about any applicable account service fees.
2 Excludes the value of portfolio securities received or delivered as a result of in-kind purchases or redemptions of the fund’s capital shares, including ETF Creation Units.
See accompanying Notes, which are an integral part of the Financial Statements.
18
Total Stock Market Index Fund
| | | | | |
| Financial Highlights | | | | | |
| |
| Admiral Shares | | | | | |
| |
| For a Share Outstanding | | | Year Ended December 31, |
| Throughout Each Period | 2010 | 2009 | 2008 | 2007 | 2006 |
| Net Asset Value, Beginning of Period | $27.45 | $21.80 | $35.36 | $34.09 | $30.00 |
| Investment Operations | | | | | |
| Net Investment Income | .554 | .539 | .615 | .631 | .555 |
| Net Realized and Unrealized Gain (Loss) | | | | | |
| on Investments | 4.127 | 5.650 | (13.566) | 1.268 | 4.091 |
| Total from Investment Operations | 4.681 | 6.189 | (12.951) | 1.899 | 4.646 |
| Distributions | | | | | |
| Dividends from Net Investment Income | (.561) | (.539) | (.609) | (.629) | (.556) |
| Distributions from Realized Capital Gains | — | — | — | — | — |
| Total Distributions | (.561) | (.539) | (.609) | (.629) | (.556) |
| Net Asset Value, End of Period | $31.57 | $27.45 | $21.80 | $35.36 | $34.09 |
| |
| Total Return | 17.26% | 28.83% | -36.99% | 5.57% | 15.63% |
| |
| Ratios/Supplemental Data | | | | | |
| Net Assets, End of Period (Millions) | $47,190 | $27,762 | $18,781 | $27,895 | $26,853 |
| Ratio of Total Expenses to | | | | | |
| Average Net Assets | 0.06% | 0.07% | 0.08% | 0.07% | 0.09% |
| Ratio of Net Investment Income to | | | | | |
| Average Net Assets | 1.96% | 2.33% | 2.12% | 1.79% | 1.76% |
| Portfolio Turnover Rate1 | 5% | 5% | 5% | 4% | 4% |
1 Excludes the value of portfolio securities received or delivered as a result of in-kind purchases or redemptions of the fund’s capital shares, including ETF Creation Units.
See accompanying Notes, which are an integral part of the Financial Statements.
19
Total Stock Market Index Fund
| | | | | |
| Financial Highlights | | | | | |
| |
| Signal Shares | | | | | |
| | | | | | Sept. 1, |
| | | | | | 20061 to |
| For a Share Outstanding | Year Ended December 31, | Dec. 31, |
| Throughout Each Period | 2010 | 2009 | 2008 | 2007 | 2006 |
| Net Asset Value, Beginning of Period | $26.50 | $21.04 | $34.13 | $32.91 | $30.47 |
| Investment Operations | | | | | |
| Net Investment Income | .535 | .520 | .595 | .607 | .181 |
| Net Realized and Unrealized Gain (Loss) | | | | | |
| on Investments | 3.977 | 5.459 | (13.096) | 1.220 | 2.536 |
| Total from Investment Operations | 4.512 | 5.979 | (12.501) | 1.827 | 2.717 |
| Distributions | | | | | |
| Dividends from Net Investment Income | (.542) | (.519) | (.589) | (.607) | (.277) |
| Distributions from Realized Capital Gains | — | — | — | — | — |
| Total Distributions | (.542) | (.519) | (.589) | (.607) | (.277) |
| Net Asset Value, End of Period | $30.47 | $26.50 | $21.04 | $34.13 | $32.91 |
| |
| Total Return | 17.23% | 28.85% | -36.99% | 5.55% | 8.95% |
| |
| Ratios/Supplemental Data | | | | | |
| Net Assets, End of Period (Millions) | $5,471 | $4,757 | $3,717 | $4,655 | $381 |
| Ratio of Total Expenses to | | | | | |
| Average Net Assets | 0.06% | 0.07% | 0.08% | 0.07% | 0.09%2 |
| Ratio of Net Investment Income to | | | | | |
| Average Net Assets | 1.96% | 2.33% | 2.12% | 1.79% | 1.76%2 |
| Portfolio Turnover Rate3 | 5% | 5% | 5% | 4% | 4% |
1 Inception.
2 Annualized.
3 Excludes the value of portfolio securities received or delivered as a result of in-kind purchases or redemptions of the fund’s capital shares,
including ETF Creation Units.
See accompanying Notes, which are an integral part of the Financial Statements.
20
Total Stock Market Index Fund
| | | | | |
| Financial Highlights | | | | | |
| |
| Institutional Shares | | | | | |
| |
| For a Share Outstanding | | | Year Ended December 31, |
| Throughout Each Period | 2010 | 2009 | 2008 | 2007 | 2006 |
| Net Asset Value, Beginning of Period | $27.46 | $21.81 | $35.36 | $34.10 | $30.00 |
| Investment Operations | | | | | |
| Net Investment Income | .558 | .541 | .624 | .638 | .573 |
| Net Realized and Unrealized Gain (Loss) | | | | | |
| on Investments | 4.117 | 5.650 | (13.557) | 1.260 | 4.091 |
| Total from Investment Operations | 4.675 | 6.191 | (12.933) | 1.898 | 4.664 |
| Distributions | | | | | |
| Dividends from Net Investment Income | (.565) | (.541) | (.617) | (.638) | (.564) |
| Distributions from Realized Capital Gains | — | — | — | — | — |
| Total Distributions | (.565) | (.541) | (.617) | (.638) | (.564) |
| Net Asset Value, End of Period | $31.57 | $27.46 | $21.81 | $35.36 | $34.10 |
| |
| Total Return | 17.23% | 28.83% | -36.94% | 5.56% | 15.69% |
| |
| Ratios/Supplemental Data | | | | | |
| Net Assets, End of Period (Millions) | $23,785 | $16,047 | $10,782 | $13,396 | $12,262 |
| Ratio of Total Expenses to | | | | | |
| Average Net Assets | 0.05% | 0.06% | 0.05% | 0.05% | 0.06% |
| Ratio of Net Investment Income to | | | | | |
| Average Net Assets | 1.97% | 2.34% | 2.15% | 1.81% | 1.79% |
| Portfolio Turnover Rate1 | 5% | 5% | 5% | 4% | 4% |
1 Excludes the value of portfolio securities received or delivered as a result of in-kind purchases or redemptions of the fund’s capital shares, including ETF Creation Units.
See accompanying Notes, which are an integral part of the Financial Statements.
21
Total Stock Market Index Fund
| | | | | |
| Financial Highlights | | | | | |
| |
| ETF Shares | | | | | |
| |
| For a Share Outstanding | | | Year Ended December 31, |
| Throughout Each Period | 2010 | 2009 | 20081 | 20071 | 20061 |
| Net Asset Value, Beginning of Period | $56.39 | $44.78 | $72.64 | $70.04 | $61.63 |
| Investment Operations | | | | | |
| Net Investment Income | 1.133 | 1.106 | 1.270 | 1.298 | 1.152 |
| Net Realized and Unrealized Gain (Loss) | | | | | |
| on Investments | 8.485 | 11.611 | (27.874) | 2.600 | 8.409 |
| Total from Investment Operations | 9.618 | 12.717 | (26.604) | 3.898 | 9.561 |
| Distributions | | | | | |
| Dividends from Net Investment Income | (1.148) | (1.107) | (1.256) | (1.298) | (1.151) |
| Distributions from Realized Capital Gains | — | — | — | — | — |
| Total Distributions | (1.148) | (1.107) | (1.256) | (1.298) | (1.151) |
| Net Asset Value, End of Period | $64.86 | $56.39 | $44.78 | $72.64 | $70.04 |
| |
| Total Return | 17.26% | 28.82% | -36.97% | 5.56% | 15.66% |
| |
| Ratios/Supplemental Data | | | | | |
| Net Assets, End of Period (Millions) | $17,930 | $13,443 | $9,199 | $10,255 | $6,885 |
| Ratio of Total Expenses to | | | | | |
| Average Net Assets | 0.06% | 0.07% | 0.07% | 0.07% | 0.07% |
| Ratio of Net Investment Income to | | | | | |
| Average Net Assets | 1.96% | 2.33% | 2.13% | 1.79% | 1.78% |
| Portfolio Turnover Rate2 | 5% | 5% | 5% | 4% | 4% |
1 Adjusted to reflect a 2-for-1 share split as of the close of business on June 13, 2008.
2 Excludes the value of portfolio securities received or delivered as a result of in-kind purchases or redemptions of the fund’s capital shares,
including ETF Creation Units.
See accompanying Notes, which are an integral part of the Financial Statements.
22
Total Stock Market Index Fund
Notes to Financial Statements
Vanguard Total Stock Market Index Fund is registered under the Investment Company Act of 1940 as an open-end investment company, or mutual fund. The fund offers five classes of shares: Investor Shares, Admiral Shares, Signal Shares, Institutional Shares, and ETF Shares. Investor Shares are available to any investor who meets the fund’s minimum purchase requirements. Admiral Shares, Signal Shares, and Institutional Shares are designed for investors who meet certain administrative, service, and account-size criteria. ETF Shares are listed for trading on the NYSE Arca, Inc.; they can be purchased and sold through a broker.
A. The following significant accounting policies conform to generally accepted accounting principles for U.S. mutual funds. The fund consistently follows such policies in preparing its financial statements.
1. Security Valuation: Securities are valued as of the close of trading on the New York Stock Exchange (generally 4 p.m., Eastern time) on the valuation date. Equity securities are valued at the latest quoted sales prices or official closing prices taken from the primary market in which each security trades; such securities not traded on the valuation date are valued at the mean of the latest quoted bid and asked prices. Securities for which market quotations are not readily available, or whose values have been materially affected by events occurring before the fund’s pricing time but after the close of the securities’ primary markets, are valued by methods deemed by the board of trustees to represent fair value. Investments in Vanguard Market Liquidity Fund are valued at that fund’s net asset value. Temporary cash investments acquired over 60 days to maturity are valued using the latest bid prices or using valuations based on a matrix system (which considers such factors as security prices, yields, maturities, and ratings), both as furnished by independent pricing services. Other temporary cash investments are valued at amortized cost, which approximates market value.
2. Futures Contracts: The fund uses index futures contracts to a limited extent, with the objectives of maintaining full exposure to the stock market, enhancing returns, maintaining liquidity, and minimizing transaction costs. The fund may purchase futures contracts to immediately invest incoming cash in the market, or sell futures in response to cash outflows, thereby simulating a fully invested position in the underlying index while maintaining a cash balance for liquidity. The fund may seek to enhance returns by using futures contracts instead of the underlying securities when futures are believed to be priced more attractively than the underlying securities. The primary risks associated with the use of futures contracts are imperfect correlation between changes in market values of stocks held by the fund and the prices of futures contracts, and the possibility of an illiquid market.
Futures contracts are valued at their quoted daily settlement prices. The aggregate principal amounts of the contracts are not recorded in the Statement of Net Assets. Fluctuations in the value of the contracts are recorded in the Statement of Net Assets as an asset (liability) and in the Statement of Operations as unrealized appreciation (depreciation) until the contracts are closed, when they are recorded as realized futures gains (losses).
3. Federal Income Taxes: The fund intends to continue to qualify as a regulated investment company and distribute all of its taxable income. Management has analyzed the fund’s tax positions taken for all open federal income tax years (December 31, 2007–2010), and has concluded that no provision for federal income tax is required in the fund’s financial statements.
4. Distributions: Distributions to shareholders are recorded on the ex-dividend date.
5. Security Lending: The fund may lend its securities to qualified institutional borrowers to earn additional income. Security loans are required to be secured at all times by collateral at least equal to the market value of securities loaned. The fund invests cash collateral received in Vanguard Market
23
Total Stock Market Index Fund
Liquidity Fund, and records a liability for the return of the collateral, during the period the securities are on loan. Security lending income represents fees charged to borrowers plus income earned on investing cash collateral, less expenses associated with the loan.
6. Other: Dividend income is recorded on the ex-dividend date. Interest income includes income distributions received from Vanguard Market Liquidity Fund and is accrued daily. Security transactions are accounted for on the date securities are bought or sold. Costs used to determine realized gains (losses) on the sale of investment securities are those of the specific securities sold.
Each class of shares has equal rights as to assets and earnings, except that each class separately bears certain class-specific expenses related to maintenance of shareholder accounts (included in Management and Administrative expenses) and shareholder reporting. Marketing and distribution expenses are allocated to each class of shares based on a method approved by the board of trustees. Income, other non-class-specific expenses, and gains and losses on investments are allocated to each class of shares based on its relative net assets.
B. The Vanguard Group furnishes at cost investment advisory, corporate management, administrative, marketing, and distribution services. The costs of such services are allocated to the fund under methods approved by the board of trustees. The fund has committed to provide up to 0.40% of its net assets in capital contributions to Vanguard. At December 31, 2010, the fund had contributed capital of $25,640,000 to Vanguard (included in Other Assets), representing 0.02% of the fund’s net assets and 10.25% of Vanguard’s capitalization. The fund’s trustees and officers are also directors and officers of Vanguard.
C. Various inputs may be used to determine the value of the fund’s investments. These inputs are summarized in three broad levels for financial statement purposes. The inputs or methodologies used to value securities are not necessarily an indication of the risk associated with investing in those securities.
Level 1—Quoted prices in active markets for identical securities.
Level 2—Other significant observable inputs (including quoted prices for similar securities, interest rates, prepayment speeds, credit risk, etc.).
Level 3—Significant unobservable inputs (including the fund’s own assumptions used to determine the fair value of investments).
The following table summarizes the fund’s investments as of December 31, 2010, based on the inputs
used to value them:
| | | |
| | Level 1 | Level 2 | Level 3 |
| Investments | ($000) | ($000) | ($000) |
| Common Stocks | 149,862,481 | 79 | — |
| Temporary Cash Investments | 1,122,830 | 69,969 | — |
| Futures Contracts—Assets1 | 80 | — | — |
| Futures Contracts—Liabilities1 | (1,193) | — | — |
| Total | 150,984,198 | 70,048 | — |
| 1 Represents variation margin on the last day of the reporting period. | | | |
24
Total Stock Market Index Fund
The following table summarizes changes in investments valued based on Level 3 inputs during the year ended December 31, 2010:
| |
| | Investments in |
| | Common Stocks |
| Amount Valued Based on Level 3 Inputs | ($000) |
| Balance as of December 31, 2009 | 105 |
| Total Sales | (68) |
| Net Realized Gain (Loss) | (737) |
| Change in Unrealized Appreciation (Depreciation) | 700 |
| Balance as of December 31, 2010 | — |
D. At December 31, 2010, the aggregate settlement value of open futures contracts and the related unrealized appreciation (depreciation) were:
| | | | |
| | | | | ($000) |
| | | | Aggregate | |
| | | Number of | Settlement | Unrealized |
| | | Long (Short) | Value | Appreciation |
| Futures Contracts | Expiration | Contracts | Long (Short) | (Depreciation) |
| S&P 500 Index | March 2011 | 1,380 | 432,285 | 5,664 |
| E-mini S&P 500 Index | March 2011 | 950 | 59,518 | (237) |
| E-mini Russell 2000 Index | March 2011 | 700 | 54,761 | 837 |
| S&P MidCap 400 Index | March 2011 | 56 | 25,348 | 334 |
Unrealized appreciation (depreciation) on open futures contracts is required to be treated as realized gain (loss) for tax purposes.
E. Distributions are determined on a tax basis and may differ from net investment income and realized capital gains for financial reporting purposes. Differences may be permanent or temporary. Permanent differences are reclassified among capital accounts in the financial statements to reflect their tax character. Temporary differences arise when certain items of income, expense, gain, or loss are recognized in different periods for financial statement and tax purposes; these differences will reverse at some time in the future. Differences in classification may also result from the treatment of short-term gains as ordinary income for tax purposes.
During the year ended December 31, 2010, the fund realized $3,256,405,000 of net capital gains resulting from in-kind redemptions—in which shareholders exchanged fund shares for securities held by the fund rather than for cash. Because such gains are not taxable to the fund, and are not distributed to shareholders, they have been reclassified from accumulated net realized losses to paid-in capital.
In December 2007, the fund issued 17,301,549 capital shares for a value of $583,408,000 in connection with a nontaxable in-kind transfer of investment securities from a common trust fund. The securities received in the transfer had net unrealized appreciation, creating a difference between the cost of investments for financial statement and tax purposes that reverses when the securities are sold; $59,748,000 of this difference remained at December 31, 2009. Through December 31, 2010, the remaining securities were sold; as a result the remaining difference between financial statement and tax-basis realized and unrealized gains and losses reversed during the current period.
25
Total Stock Market Index Fund
For tax purposes, at December 31, 2010, the fund had $34,151,000 of ordinary income available for distribution. The fund had available capital loss carryforwards totaling $2,492,045,000 to offset future net capital gains of $209,043,000 through December 31, 2013, $19,516,000 through December 31, 2015, and $2,263,486,000 through December 31, 2016. In addition, the fund realized losses of $169,635,000 during the period from November 1, 2010, through December 31, 2010, which are deferred and will be treated as realized for tax purposes in fiscal 2011.
At December 31, 2010, the cost of investment securities for tax purposes was $135,501,129,000. Net unrealized appreciation of investment securities for tax purposes was $15,554,230,000, consisting of unrealized gains of $29,058,771,000 on securities that had risen in value since their purchase and $13,504,541,000 in unrealized losses on securities that had fallen in value since their purchase.
F. During the year ended December 31, 2010, the fund purchased $22,022,781,000 of investment securities and sold $12,021,550,000 of investment securities, other than temporary cash investments.
G. Capital share transactions for each class of shares were:
| | | | |
| | | | Year Ended December 31, |
| | | 2010 | | 2009 |
| | Amount | Shares | Amount | Shares |
| | ($000) | (000) | ($000) | (000) |
| Investor Shares | | | | |
| Issued | 14,339,216 | 519,171 | 13,704,175 | 613,438 |
| Issued in Lieu of Cash Distributions | 1,115,478 | 38,783 | 1,027,960 | 43,501 |
| Redeemed | (26,539,341) | (894,960) | (8,106,872) | (352,832) |
| Net Increase (Decrease)—Investor Shares | (11,084,647) | (337,006) | 6,625,263 | 304,107 |
| Admiral Shares | | | | |
| Issued | 17,632,806 | 596,622 | 6,218,375 | 270,647 |
| Issued in Lieu of Cash Distributions | 586,309 | 20,085 | 443,938 | 18,729 |
| Redeemed | (3,791,175) | (133,185) | (3,159,611) | (139,499) |
| Net Increase (Decrease)—Admiral Shares | 14,427,940 | 483,522 | 3,502,702 | 149,877 |
| Signal Shares | | | | |
| Issued | 1,525,728 | 55,528 | 1,437,692 | 66,128 |
| Issued in Lieu of Cash Distributions | 87,239 | 3,123 | 84,769 | 3,719 |
| Redeemed | (1,618,171) | (58,645) | (1,446,389) | (66,963) |
| Net Increase (Decrease)—Signal Shares | (5,204) | 6 | 76,072 | 2,884 |
| Institutional Shares | | | | |
| Issued | 8,452,000 | 298,623 | 4,339,078 | 187,044 |
| Issued in Lieu of Cash Distributions | 356,581 | 12,291 | 262,034 | 11,047 |
| Redeemed | (4,131,465) | (142,035) | (2,457,389) | (108,092) |
| Net Increase (Decrease)—Institutional Shares | 4,677,116 | 168,879 | 2,143,723 | 89,999 |
| ETF Shares | | | | |
| Issued | 8,218,216 | 132,994 | 2,229,514 | 47,357 |
| Issued in Lieu of Cash Distributions | — | — | — | — |
| Redeemed | (5,908,745) | (94,900) | (657,124) | (14,400) |
| Net Increase (Decrease)—ETF Shares | 2,309,471 | 38,094 | 1,572,390 | 32,957 |
26
Total Stock Market Index Fund
H. The fund has invested in a company that is considered to be an affiliated company of the fund because the fund owns more than 5% of the outstanding voting securities of the company. Transactions during the period in securities of this company were as follows:
| | | | | |
| | | | Current Period Transactions | |
| | Dec. 31, 2009 | | Proceeds from | | Dec. 31, 2010 |
| | Market | Purchases | Securities | Dividend | Market |
| | Value | at Cost | Sold | Income | Value |
| | ($000) | ($000) | ($000) | ($000) | ($000) |
| Matrixx Initiatives Inc. | N/A1 | 241 | 73 | — | 4,275 |
| 1 Not applicable — At December 31, 2009, the issuer was not an affiliated company of the fund. | | |
I. In preparing the financial statements as of December 31, 2010, management considered the impact of subsequent events for potential recognition or disclosure in these financial statements.
27
Report of Independent Registered Public Accounting Firm
To the Trustees of Vanguard Index Funds and the Shareholders of Vanguard Total Stock Market Index Fund:
In our opinion, the statement of net assets–investments summary and the related statements of operations and of changes in net assets and the financial highlights present fairly, in all material respects, the financial position of Vanguard Total Stock Market Index Fund (constituting a separate portfolio of Vanguard Index Funds, hereafter referred to as the “Fund”) at December 31, 2010, the results of its operations for the year then ended, the changes in its net assets for each of the two years in the period then ended and the financial highlights for each of the periods indicated, in conformity with accounting principles generally accepted in the United States of America. These financial statements and financial highlights (hereafter referred to as “financial statements”) are the responsibility of the Fund’s management; our responsibility is to express an opinion on these financial statements based on our audits. We conducted our audits of these financial statements in accordance with the standards of the Public Company Accounting Oversight Board (United States). Those standards require that we plan and perform the audit to obtain reasonable assurance about whether the financial statements are free of material misstatement. An audit includes examining, on a test basis, evidence supporting the amounts and disclosures in the financial statements, assessing the accounting principles used and significant estimates made by management, and evaluating the overall financial statement presentation. We believe that our audits, which included confirmation of securities at December 31, 2010 by correspondence with the custodian and broker and by agreement to the underlying ownership records of Vanguard Market Liquidity Fund, provide a reasonable basis for our opinion.
PricewaterhouseCoopers LLP
Philadelphia, Pennsylvania
February 8, 2011
| Special 2010 tax information (unaudited) for Vanguard Total Stock Market Index Fund |
This information for the fiscal year ended December 31, 2010, is included pursuant to provisions of the Internal Revenue Code.
The fund distributed $2,577,820,000 of qualified dividend income to shareholders during the fiscal year.
For corporate shareholders, 94.3% of investment income (dividend income plus short-term gains, if any) qualifies for the dividends-received deduction.
28
Your Fund’s After-Tax Returns
This table presents returns for your fund both before and after taxes. The after-tax returns are shown in two ways: (1) assuming that an investor owned the fund during the entire period and paid taxes on the fund’s distributions, and (2) assuming that an investor paid taxes on the fund’s distributions and sold all shares at the end of each period.
Calculations are based on the highest individual federal income tax and capital gains tax rates in effect at the times of the distributions and the hypothetical sales. State and local taxes were not considered. After-tax returns reflect any qualified dividend income . (In the example, returns after the sale of fund shares may be higher than those assuming no sale. This occurs when the sale would have produced a capital loss. The calculation assumes that the investor received a tax deduction for the loss.) The table shows returns for Investor Shares only; returns for other share classes will differ. Please note that your actual after-tax returns will depend on your tax situation and may differ from those shown. Also note that if you own the fund in a tax-deferred account, such as an individual retirement account or a 401(k) plan, this information does not apply to you. Such accounts are not subject to current taxes.
Finally, keep in mind that a fund’s performance—whether before or after taxes—does not guarantee future results.
| | | |
| Average Annual Total Returns: Total Stock Market Index Fund Investor Shares | | |
| Periods Ended December 31, 2010 | | | |
| | One | Five | Ten |
| | Year | Years | Years |
| Returns Before Taxes | 17.09% | 2.94% | 2.45% |
| Returns After Taxes on Distributions | 16.77 | 2.65 | 2.14 |
| Returns After Taxes on Distributions and Sale of Fund Shares | 11.48 | 2.49 | 2.01 |
29
About Your Fund’s Expenses
As a shareholder of the fund, you incur ongoing costs, which include costs for portfolio management, administrative services, and shareholder reports (like this one), among others. Operating expenses, which are deducted from a fund’s gross income, directly reduce the investment return of the fund.
A fund’s expenses are expressed as a percentage of its average net assets. This figure is known as the expense ratio. The following examples are intended to help you understand the ongoing costs (in dollars) of investing in your fund and to compare these costs with those of other mutual funds. The examples are based on an investment of $1,000 made at the beginning of the period shown and held for the entire period.
The accompanying table illustrates your fund’s costs in two ways:
• Based on actual fund return. This section helps you to estimate the actual expenses that you paid over the period. The ”Ending Account Value“ shown is derived from the fund‘s actual return, and the third column shows the dollar amount that would have been paid by an investor who started with $1,000 in the fund. You may use the information here, together with the amount you invested, to estimate the expenses that you paid over the period.
To do so, simply divide your account value by $1,000 (for example, an $8,600 account value divided by $1,000 = 8.6), then multiply the result by the number given for your fund under the heading ”Expenses Paid During Period.“
• Based on hypothetical 5% yearly return. This section is intended to help you compare your fund‘s costs with those of other mutual funds. It assumes that the fund had a yearly return of 5% before expenses, but that the expense ratio is unchanged. In this case—because the return used is not the fund’s actual return—the results do not apply to your investment. The example is useful in making comparisons because the Securities and Exchange Commission requires all mutual funds to calculate expenses based on a 5% return. You can assess your fund’s costs by comparing this hypothetical example with the hypothetical examples that appear in shareholder reports of other funds.
Note that the expenses shown in the table are meant to highlight and help you compare ongoing costs only and do not reflect transaction costs incurred by the fund for buying and selling securities. Further, the expenses do not include the account service fee described in the prospectus. If such a fee were applied to your account, your costs would be higher. Your fund does not charge transaction fees, such as purchase or redemption fees, nor does it carry a “sales load.” The calculations assume no shares were bought or sold during the period. Your actual costs may have been higher or lower, depending on the amount of your investment and the timing of any purchases or redemptions.
You can find more information about the fund’s expenses, including annual expense ratios, in the Financial Statements section of this report. For additional information on operating expenses and other shareholder costs, please refer to your fund’s current prospectus.
30
| | | |
| Six Months Ended December 31, 2010 | | | |
| | Beginning | Ending | Expenses |
| | Account Value | Account Value | Paid During |
| Total Stock Market Index Fund | 6/30/2010 | 12/31/2010 | Period |
| Based on Actual Fund Return | | | |
| Investor Shares | $1,000.00 | $1,245.73 | $0.96 |
| Admiral Shares | 1,000.00 | 1,246.79 | 0.28 |
| Signal Shares | 1,000.00 | 1,246.70 | 0.28 |
| Institutional Shares | 1,000.00 | 1,246.38 | 0.23 |
| ETF Shares | 1,000.00 | 1,246.88 | 0.28 |
| Based on Hypothetical 5% Yearly Return | | | |
| Investor Shares | $1,000.00 | $1,024.35 | $0.87 |
| Admiral Shares | 1,000.00 | 1,024.95 | 0.26 |
| Signal Shares | 1,000.00 | 1,024.95 | 0.26 |
| Institutional Shares | 1,000.00 | 1,025.00 | 0.20 |
| ETF Shares | 1,000.00 | 1,024.95 | 0.26 |
The calculations are based on expenses incurred in the most recent six-month period. The fund’s annualized six-month expense ratios for that period are: 0.17% for Investor Shares, 0.05% for Admiral Shares, 0.05% for Signal Shares, 0.04% for Institutional Shares, and 0.05% for ETF Shares. The dollar amounts shown as “Expenses Paid” are equal to the annualized expense ratio multiplied by the average account value over the period, multiplied by the number of days in the most recent six-month period, then divided by the number of days in the most recent 12-month period.
31
Glossary
30-Day SEC Yield. A fund’s 30-day SEC yield is derived using a formula specified by the U.S. Securities and Exchange Commission. Under the formula, data related to the fund’s security holdings in the previous 30 days are used to calculate the fund’s hypothetical net income for that period, which is then annualized and divided by the fund’s estimated average net assets over the calculation period. For the purposes of this calculation, a security’s income is based on its current market yield to maturity (in the case of bonds) or its projected dividend yield (for stocks). Because the SEC yield represents hypothetical annualized income, it will differ—at times significantly—from the fund’s actual experience. As a result, the fund’s income distributions may be higher or lower than implied by the SEC yield.
Beta. A measure of the magnitude of a fund’s past share-price fluctuations in relation to the ups and downs of a given market index. The index is assigned a beta of 1.00. Compared with a given index, a fund with a beta of 1.20 typically would have seen its share price rise or fall by 12% when the index rose or fell by 10%. For this report, beta is based on returns over the past 36 months for both the fund and the index. Note that a fund’s beta should be reviewed in conjunction with its R-squared (see definition). The lower the R-squared, the less correlation there is between the fund and the index, and the less reliable beta is as an indicator of volatility.
Dividend Yield. Dividend income earned by stocks, expressed as a percentage of the aggregate market value (or of net asset value, for a fund). The yield is determined by dividing the amount of the annual dividends by the aggregate value (or net asset value) at the end of the period. For a fund, the dividend yield is based solely on stock holdings and does not include any income produced by other investments.
Earnings Growth Rate. The average annual rate of growth in earnings over the past five years for the stocks now in a fund.
Equity Exposure. A measure that reflects a fund’s investments in stocks and stock futures. Any holdings in short-term reserves are excluded.
Expense Ratio. The percentage of a fund’s average net assets used to pay its annual administrative and advisory expenses. These expenses directly reduce returns to investors.
Foreign Holdings. The percentage of a fund represented by stocks or depositary receipts of companies based outside the United States.
Inception Date. The date on which the assets of a fund (or one of its share classes) are first invested in accordance with the fund’s investment objective. For funds with a subscription period, the inception date is the day after that period ends. Investment performance is measured from the inception date.
Median Market Cap. An indicator of the size of companies in which a fund invests; the midpoint of market capitalization (market price x shares outstanding) of a fund’s stocks, weighted by the proportion of the fund’s assets invested in each stock. Stocks representing half of the fund’s assets have market capitalizations above the median, and the rest are below it.
Price/Book Ratio. The share price of a stock divided by its net worth, or book value, per share. For a fund, the weighted average price/book ratio of the stocks it holds.
32
Price/Earnings Ratio. The ratio of a stock’s current price to its per-share earnings over the past year. For a fund, the weighted average P/E of the stocks it holds. P/E is an indicator of market expectations about corporate prospects; the higher the P/E, the greater the expectations for a company’s future growth.
R-Squared. A measure of how much of a fund’s past returns can be explained by the returns from the market in general, as measured by a given index. If a fund’s total returns were precisely synchronized with an index’s returns, its R-squared would be 1.00. If the fund’s returns bore no relationship to the index’s returns, its R-squared would be 0. For this report, R-squared is based on returns over the past 36 months for both the fund and the index.
Return on Equity. The annual average rate of return generated by a company during the past five years for each dollar of shareholder’s equity (net income divided by shareholder’s equity). For a fund, the weighted average return on equity for the companies whose stocks it holds.
Short-Term Reserves. The percentage of a fund invested in highly liquid, short-term securities that can be readily converted to cash.
Turnover Rate. An indication of the fund’s trading activity. Funds with high turnover rates incur higher transaction costs and may be more likely to distribute capital gains (which may be taxable to investors). The turnover rate excludes in-kind transactions, which have minimal impact on costs.
33
This page intentionally left blank.
This page intentionally left blank.
The People Who Govern Your Fund
The trustees of your mutual fund are there to see that the fund is operated and managed in your best interests since, as a shareholder, you are a part owner of the fund. Your fund’s trustees also serve on the board of directors of The Vanguard Group, Inc., which is owned by the Vanguard funds and provides services to them on an at-cost basis.
A majority of Vanguard’s board members are independent, meaning that they have no affiliation with Vanguard or the funds they oversee, apart from the sizable personal investments they have made as private individuals. The independent board members have distinguished backgrounds in business, academia, and public service. Each of the trustees and executive officers oversees 179 Vanguard funds.
The following table provides information for each trustee and executive officer of the fund. More information about the trustees is in the Statement of Additional Information, which can be obtained, without charge, by contacting Vanguard at 800-662-7447, or online at vanguard.com.
| |
| Interested Trustee1 | Amy Gutmann |
| | Born 1949. Trustee Since June 2006. Principal |
| F. William McNabb III | Occupation(s) During the Past Five Years: President |
| Born 1957. Trustee Since July 2009. Chairman of the | of the University of Pennsylvania; Christopher H. |
| Board. Principal Occupation(s) During the Past Five | Browne Distinguished Professor of Political Science |
| Years: Chairman of the Board of The Vanguard Group, | in the School of Arts and Sciences with secondary |
| Inc., and of each of the investment companies served | appointments at the Annenberg School for Commu- |
| by The Vanguard Group, since January 2010; Director | nication and the Graduate School of Education |
| of The Vanguard Group since 2008; Chief Executive | of the University of Pennsylvania; Director of |
| Officer and President of The Vanguard Group and of | Carnegie Corporation of New York, Schuylkill River |
| each of the investment companies served by The | Development Corporation, and Greater Philadelphia |
| Vanguard Group since 2008; Director of Vanguard | Chamber of Commerce; Trustee of the National |
| Marketing Corporation; Managing Director of The | Constitution Center; Chair of the Presidential |
| Vanguard Group (1995–2008) . | Commission for the Study of Bioethical Issues. |
| |
| | JoAnn Heffernan Heisen |
| Independent Trustees | Born 1950. Trustee Since July 1998. Principal |
| | Occupation(s) During the Past Five Years: Corporate |
| Emerson U. Fullwood | Vice President and Chief Global Diversity Officer |
| Born 1948. Trustee Since January 2008. Principal | since 2006 (retired 2008) and Member of the |
| Occupation(s) During the Past Five Years: Executive | Executive Committee (retired 2008) of Johnson & |
| Chief Staff and Marketing Officer for North America | Johnson (pharmaceuticals/consumer products); Vice |
| and Corporate Vice President (retired 2008) of Xerox | President and Chief Information Officer of Johnson & |
| Corporation (document management products and | Johnson (1997–2005); Director of the University |
| services); Director of SPX Corporation (multi-industry | Medical Center at Princeton and Women’s Research |
| manufacturing), the United Way of Rochester, | and Education Institute; Member of the Advisory |
| Amerigroup Corporation (managed health care), | Board of the Maxwell School of Citizenship and Public |
| the University of Rochester Medical Center, and | Affairs at Syracuse University. |
| Monroe Community College Foundation. | |
| | F. Joseph Loughrey |
| Rajiv L. Gupta | Born 1949. Trustee Since October 2009. Principal |
| Born 1945. Trustee Since December 2001.2 | Occupation(s) During the Past Five Years: President |
| Principal Occupation(s) During the Past Five Years: | and Chief Operating Officer since 2005 (retired 2009) |
| Chairman and Chief Executive Officer (retired 2009) | and Vice Chairman of the Board (2008–2009) of |
| and President (2006–2008) of Rohm and Haas Co. | Cummins Inc. (industrial machinery); Director of |
| (chemicals); Director of Tyco International, Ltd. | SKF AB (industrial machinery), Hillenbrand, Inc. |
| (diversified manufacturing and services) and Hewlett- | (specialized consumer services), Sauer-Danfoss Inc. |
| Packard Co. (electronic computer manufacturing); | (machinery), the Lumina Foundation for Education, |
| Trustee of The Conference Board; Member of the | and Oxfam America; Chairman of the Advisory |
| Board of Managers of Delphi Automotive LLP | Council for the College of Arts and Letters at the |
| (automotive components) . | University of Notre Dame. |
| | |
| André F. Perold | Kathryn J. Hyatt | |
| Born 1952. Trustee Since December 2004. Principal | Born 1955. Treasurer Since November 2008. Principal |
| Occupation(s) During the Past Five Years: George | Occupation(s) During the Past Five Years: Principal |
| Gund Professor of Finance and Banking at the Harvard | of The Vanguard Group, Inc.; Treasurer of each of |
| Business School; Chair of the Investment Committee | the investment companies served by The Vanguard |
| of HighVista Strategies LLC (private investment firm) . | Group since 2008; Assistant Treasurer of each of the |
| | investment companies served by The Vanguard Group |
| Alfred M. Rankin, Jr. | (1988–2008) . | |
| Born 1941. Trustee Since January 1993. Principal | | |
| Occupation(s) During the Past Five Years: Chairman, | Heidi Stam | |
| President, and Chief Executive Officer of NACCO | Born 1956. Secretary Since July 2005. Principal |
| Industries, Inc. (forklift trucks/housewares/lignite); | Occupation(s) During the Past Five Years: Managing |
| Director of Goodrich Corporation (industrial products/ | Director of The Vanguard Group, Inc., since 2006; |
| aircraft systems and services); Chairman of the | General Counsel of The Vanguard Group since 2005; |
| Federal Reserve Bank of Cleveland; Trustee of The | Secretary of The Vanguard Group and of each of the |
| Cleveland Museum of Art. | investment companies served by The Vanguard Group |
| | since 2005; Director and Senior Vice President of |
| Peter F. Volanakis | Vanguard Marketing Corporation since 2005; |
| Born 1955. Trustee Since July 2009. Principal | Principal of The Vanguard Group (1997–2006). |
| Occupation(s) During the Past Five Years: President | | |
| since 2007 and Chief Operating Officer since 2005 | | |
| of Corning Incorporated (communications equipment); | Vanguard Senior Management Team |
| President of Corning Technologies (2001–2005); | | |
| Director of Corning Incorporated and Dow Corning; | R. Gregory Barton | Michael S. Miller |
| Trustee of the Corning Incorporated Foundation and | Mortimer J. Buckley | James M. Norris |
| the Corning Museum of Glass; Overseer of the | Kathleen C. Gubanich | Glenn W. Reed |
| Amos Tuck School of Business Administration at | Paul A. Heller | George U. Sauter |
| Dartmouth College. | | |
| |
| | Chairman Emeritus and Senior Advisor |
| Executive Officers | | |
| | John J. Brennan | |
| Glenn Booraem | Chairman, 1996–2009 | |
| Born 1967. Controller Since July 2010. Principal | Chief Executive Officer and President, 1996–2008 |
| Occupation(s) During the Past Five Years: Principal | | |
| of The Vanguard Group, Inc.; Controller of each of | | |
| the investment companies served by The Vanguard | Founder | |
| Group since 2010; Assistant Controller of each of | | |
| the investment companies served by The Vanguard | John C. Bogle | |
| Group (2001–2010) . | Chairman and Chief Executive Officer, 1974–1996 |
| |
| Thomas J. Higgins | | |
| Born 1957. Chief Financial Officer Since September | | |
| 2008. Principal Occupation(s) During the Past Five | | |
| Years: Principal of The Vanguard Group, Inc.; Chief | | |
| Financial Officer of each of the investment companies | | |
| served by The Vanguard Group since 2008; Treasurer | | |
| of each of the investment companies served by The | | |
| Vanguard Group (1998–2008) . | | |
1 Mr. McNabb is considered an “interested person,” as defined in the Investment Company Act of 1940, because he is an officer of the
Vanguard funds.
2 December 2002 for Vanguard Equity Income Fund, Vanguard Growth Equity Fund, the Vanguard Municipal Bond Funds, and the
Vanguard State Tax-Exempt Funds.
|  |
| P.O. Box 2600 |
| Valley Forge, PA 19482-2600 |
Connect with Vanguard® > vanguard.com
| The funds or securities referred to herein are not |
| Fund Information > 800-662-7447 | sponsored, endorsed, or promoted by MSCI, and MSCI |
| Direct Investor Account Services > 800-662-2739 | bears no liability with respect to any such funds or |
| Institutional Investor Services > 800-523-1036 | securities. For any such funds or securities, the |
| Text Telephone for People | prospectus or the Statement of Additional Information |
| With Hearing Impairment > 800-749-7273 | contains a more detailed description of the limited |
| | relationship MSCI has with The Vanguard Group and |
| This material may be used in conjunction | any related funds. |
| with the offering of shares of any Vanguard | |
| fund only if preceded or accompanied by | |
| the fund’s current prospectus. | |
| |
| All comparative mutual fund data are from Lipper Inc. or | |
| Morningstar, Inc., unless otherwise noted. | |
| |
| You can obtain a free copy of Vanguard’s proxy voting | |
| guidelines by visiting vanguard.com/proxyreporting or by | |
| calling Vanguard at 800-662-2739. The guidelines are | |
| also available from the SEC’s website, sec.gov. In | |
| addition, you may obtain a free report on how your fund | |
| voted the proxies for securities it owned during the 12 | |
| months ended June 30. To get the report, visit either | |
| vanguard.com/proxyreporting or sec.gov. | |
| |
| You can review and copy information about your fund at | |
| the SEC’s Public Reference Room in Washington, D.C. To | |
| find out more about this public service, call the SEC at | |
| 202-551-8090. Information about your fund is also | |
| available on the SEC’s website, and you can receive | |
| copies of this information, for a fee, by sending a | |
| request in either of two ways: via e-mail addressed to | |
| publicinfo@sec.gov or via regular mail addressed to the | |
| Public Reference Section, Securities and Exchange | |
| Commission, Washington, DC 20549-1520. | |
| | © 2011 The Vanguard Group, Inc. |
| | All rights reserved. |
| | Vanguard Marketing Corporation, Distributor. |
| |
| | Q850 022011 |
| | |
| Vanguard® Total Stock Market Index Fund | | |
| Schedule of Investments | | |
| December 31, 2010 | | |
| |
| | | Market |
| | | Value |
| | Shares | ($000) |
| Common Stocks (99.6%)1 | | |
| Consumer Discretionary (11.5%) | | |
| McDonald's Corp. | 11,225,994 | 861,707 |
| Walt Disney Co. | 19,163,740 | 718,832 |
| * Amazon.com Inc. | 3,778,648 | 680,157 |
| Home Depot Inc. | 17,723,306 | 621,379 |
| Comcast Corp. Class A | 25,077,409 | 550,951 |
| * Ford Motor Co. | 31,975,185 | 536,863 |
| Target Corp. | 7,227,299 | 434,577 |
| Time Warner Inc. | 11,855,625 | 381,395 |
| Lowe's Cos. Inc. | 14,797,466 | 371,120 |
| * DIRECTV Class A | 9,140,273 | 364,971 |
| News Corp. Class A | 23,642,763 | 344,239 |
| NIKE Inc. Class B | 3,915,886 | 334,495 |
| Johnson Controls Inc. | 7,105,263 | 271,421 |
| Starbucks Corp. | 7,810,802 | 250,961 |
| Time Warner Cable Inc. | 3,750,819 | 247,667 |
| Yum! Brands Inc. | 4,927,312 | 241,685 |
| Viacom Inc. Class B | 5,868,508 | 232,452 |
| Carnival Corp. | 4,844,657 | 223,387 |
| * General Motors Co. | 5,539,708 | 204,194 |
| * priceline.com Inc. | 510,658 | 204,033 |
| TJX Cos. Inc. | 4,304,496 | 191,077 |
| Staples Inc. | 7,699,363 | 175,314 |
| Coach Inc. | 3,138,940 | 173,615 |
| * Kohl's Corp. | 3,084,760 | 167,626 |
| * Las Vegas Sands Corp. | 3,483,889 | 160,085 |
| Omnicom Group Inc. | 3,177,742 | 145,541 |
| * Bed Bath & Beyond Inc. | 2,786,405 | 136,952 |
| Best Buy Co. Inc. | 3,736,754 | 128,133 |
| Marriott International Inc. Class A | 3,060,485 | 127,133 |
| CBS Corp. Class B | 6,650,854 | 126,699 |
| Starwood Hotels & Resorts Worldwide Inc. | 2,004,656 | 121,843 |
| McGraw-Hill Cos. Inc. | 3,264,119 | 118,847 |
| Macy's Inc. | 4,457,621 | 112,778 |
| Stanley Black & Decker Inc. | 1,659,508 | 110,971 |
| Gap Inc. | 4,816,074 | 106,628 |
| Fortune Brands Inc. | 1,608,954 | 96,939 |
| Mattel Inc. | 3,803,685 | 96,728 |
| * Liberty Media Corp. - Interactive | 6,014,925 | 94,855 |
| Comcast Corp. Class A Special Shares | 4,424,361 | 92,071 |
| Virgin Media Inc. | 3,330,589 | 90,725 |
| Limited Brands Inc. | 2,922,587 | 89,811 |
| Cablevision Systems Corp. Class A | 2,648,968 | 89,641 |
| * O'Reilly Automotive Inc. | 1,467,266 | 88,652 |
| Wynn Resorts Ltd. | 848,040 | 88,060 |
| * BorgWarner Inc. | 1,204,478 | 87,156 |
| Harley-Davidson Inc. | 2,488,016 | 86,260 |
| Genuine Parts Co. | 1,666,654 | 85,566 |
| Tiffany & Co. | 1,344,826 | 83,742 |
| * NetFlix Inc. | 469,998 | 82,579 |
| Ross Stores Inc. | 1,291,345 | 81,678 |
| * AutoZone Inc. | 298,413 | 81,344 |
| VF Corp. | 913,672 | 78,740 |
| Nordstrom Inc. | 1,852,086 | 78,491 |
| Polo Ralph Lauren Corp. Class A | 685,653 | 76,053 |
| * CarMax Inc. | 2,363,830 | 75,359 |
| * Dollar Tree Inc. | 1,341,384 | 75,225 |
| Autoliv Inc. | 934,729 | 73,788 |
| JC Penney Co. Inc. | 2,247,033 | 72,602 |
| Whirlpool Corp. | 804,819 | 71,492 |
| * Chipotle Mexican Grill Inc. Class A | 329,089 | 69,984 |
| * Royal Caribbean Cruises Ltd. | 1,477,301 | 69,433 |
1
| | | |
| Vanguard® Total Stock Market Index Fund | | |
| Schedule of Investments | | |
| December 31, 2010 | | |
| |
| | | | Market |
| | | | Value |
| | | Shares | ($000) |
| *,^ | Sirius XM Radio Inc. | 41,150,990 | 67,488 |
| | Family Dollar Stores Inc. | 1,332,944 | 66,261 |
| | Darden Restaurants Inc. | 1,391,383 | 64,616 |
| | Hasbro Inc. | 1,329,234 | 62,713 |
| * | Discovery Communications Inc. Class A | 1,442,014 | 60,132 |
| | Advance Auto Parts Inc. | 891,638 | 58,982 |
| * | TRW Automotive Holdings Corp. | 1,095,217 | 57,718 |
| | Wyndham Worldwide Corp. | 1,889,586 | 56,612 |
| | International Game Technology | 3,153,529 | 55,786 |
| * | Apollo Group Inc. Class A | 1,398,642 | 55,232 |
| | Expedia Inc. | 2,191,370 | 54,981 |
| * | Discovery Communications Inc. | 1,495,449 | 54,868 |
| * | Interpublic Group of Cos. Inc. | 5,165,885 | 54,862 |
| | Abercrombie & Fitch Co. | 930,694 | 53,636 |
| | Newell Rubbermaid Inc. | 2,935,292 | 53,364 |
| * | MGM Resorts International | 3,572,922 | 53,058 |
| * | Lear Corp. | 523,468 | 51,672 |
| * | Urban Outfitters Inc. | 1,422,802 | 50,951 |
| | PetSmart Inc. | 1,254,114 | 49,939 |
| | Scripps Networks Interactive Inc. Class A | 963,809 | 49,877 |
| * | Liberty Media Corp. - Capital | 762,556 | 47,706 |
| *,^ | Liberty Global Inc. Class A | 1,263,719 | 44,710 |
| | Phillips-Van Heusen Corp. | 701,555 | 44,205 |
| | Gentex Corp. | 1,480,606 | 43,767 |
| * | DISH Network Corp. Class A | 2,216,431 | 43,575 |
| * | NVR Inc. | 59,298 | 40,976 |
| * | Fossil Inc. | 566,265 | 39,910 |
| * | Signet Jewelers Ltd. | 906,857 | 39,358 |
| * | Liberty Global Inc. | 1,159,766 | 39,304 |
| | H&R Block Inc. | 3,263,752 | 38,871 |
| ^ | Garmin Ltd. | 1,236,104 | 38,307 |
| | Gannett Co. Inc. | 2,517,459 | 37,988 |
| | Tractor Supply Co. | 769,398 | 37,308 |
| | Williams-Sonoma Inc. | 1,030,253 | 36,770 |
| | DR Horton Inc. | 3,031,860 | 36,170 |
| * | Dick's Sporting Goods Inc. | 961,766 | 36,066 |
| | Leggett & Platt Inc. | 1,550,120 | 35,281 |
| * | Mohawk Industries Inc. | 617,331 | 35,040 |
| * | GameStop Corp. Class A | 1,512,762 | 34,612 |
| *,^ | Sears Holdings Corp. | 468,580 | 34,558 |
| * | Liberty Media Corp. - Starz | 517,585 | 34,409 |
| * | Harman International Industries Inc. | 735,985 | 34,076 |
| * | Dollar General Corp. | 1,090,374 | 33,442 |
| * | Lululemon Athletica Inc. | 488,317 | 33,411 |
| * | LKQ Corp. | 1,450,217 | 32,949 |
| * | Deckers Outdoor Corp. | 409,386 | 32,644 |
| | Foot Locker Inc. | 1,654,595 | 32,463 |
| | DeVry Inc. | 674,613 | 32,368 |
| | Tupperware Brands Corp. | 673,847 | 32,122 |
| * | Panera Bread Co. Class A | 314,770 | 31,858 |
| | Sotheby's | 707,239 | 31,826 |
| | Guess? Inc. | 641,170 | 30,340 |
| | Jarden Corp. | 978,304 | 30,200 |
| * | Goodyear Tire & Rubber Co. | 2,457,390 | 29,120 |
| | American Eagle Outfitters Inc. | 1,959,637 | 28,669 |
| * | Toll Brothers Inc. | 1,484,223 | 28,200 |
| * | Tempur-Pedic International Inc. | 701,861 | 28,117 |
| * | WMS Industries Inc. | 613,065 | 27,735 |
| * | J Crew Group Inc. | 639,777 | 27,600 |
| ^ | Washington Post Co. Class B | 62,615 | 27,519 |
| * | Pulte Group Inc. | 3,636,474 | 27,346 |
| * | Tenneco Inc. | 637,725 | 26,249 |
| | Polaris Industries Inc. | 336,196 | 26,230 |
| * | Warnaco Group Inc. | 474,803 | 26,147 |
2
| | | |
| Vanguard® Total Stock Market Index Fund | | |
| Schedule of Investments | | |
| December 31, 2010 | | |
| |
| | | | Market |
| | | | Value |
| | | Shares | ($000) |
| * | Big Lots Inc. | 856,368 | 26,085 |
| * | Dana Holding Corp. | 1,497,669 | 25,775 |
| * | Hanesbrands Inc. | 1,009,367 | 25,638 |
| | Lennar Corp. Class A | 1,361,194 | 25,522 |
| | RadioShack Corp. | 1,338,924 | 24,757 |
| * | Penn National Gaming Inc. | 701,765 | 24,667 |
| * | Lamar Advertising Co. Class A | 617,732 | 24,610 |
| * | Aeropostale Inc. | 986,677 | 24,312 |
| * | Bally Technologies Inc. | 572,161 | 24,139 |
| | Chico's FAS Inc. | 1,915,718 | 23,046 |
| | Rent-A-Center Inc. | 705,592 | 22,777 |
| * | ITT Educational Services Inc. | 356,199 | 22,686 |
| | Brinker International Inc. | 1,084,190 | 22,638 |
| ^ | Strayer Education Inc. | 146,557 | 22,309 |
| * | DreamWorks Animation SKG Inc. Class A | 745,497 | 21,970 |
| | Service Corp. International | 2,645,699 | 21,827 |
| | John Wiley & Sons Inc. Class A | 479,518 | 21,693 |
| * | Hyatt Hotels Corp. Class A | 469,559 | 21,487 |
| *,^ | Under Armour Inc. Class A | 388,771 | 21,320 |
| | Dillard's Inc. Class A | 497,610 | 18,879 |
| * | Carter's Inc. | 634,757 | 18,732 |
| * | Cheesecake Factory Inc. | 604,401 | 18,531 |
| * | Coinstar Inc. | 327,127 | 18,463 |
| * | Career Education Corp. | 858,456 | 17,796 |
| | Brunswick Corp. | 946,752 | 17,742 |
| * | Dress Barn Inc. | 668,016 | 17,649 |
| * | AnnTaylor Stores Corp. | 629,449 | 17,241 |
| * | Madison Square Garden Inc. Class A | 665,291 | 17,151 |
| * | Valassis Communications Inc. | 529,738 | 17,137 |
| * | Live Nation Entertainment Inc. | 1,481,809 | 16,922 |
| * | Jo-Ann Stores Inc. | 278,236 | 16,755 |
| | Aaron's Inc. | 817,943 | 16,678 |
| | Wendy's/Arby's Group Inc. Class A | 3,608,224 | 16,670 |
| | Wolverine World Wide Inc. | 522,776 | 16,666 |
| * | Life Time Fitness Inc. | 401,949 | 16,476 |
| * | Vail Resorts Inc. | 310,784 | 16,173 |
| * | OfficeMax Inc. | 907,495 | 16,063 |
| * | Office Depot Inc. | 2,952,175 | 15,942 |
| * | CROCS Inc. | 921,312 | 15,773 |
| * | Saks Inc. | 1,461,614 | 15,639 |
| * | Sally Beauty Holdings Inc. | 1,072,849 | 15,588 |
| * | Eastman Kodak Co. | 2,876,547 | 15,418 |
| * | Iconix Brand Group Inc. | 770,844 | 14,885 |
| * | Collective Brands Inc. | 694,002 | 14,643 |
| | Jones Group Inc. | 936,755 | 14,557 |
| * | Orient-Express Hotels Ltd. Class A | 1,080,473 | 14,035 |
| | Cracker Barrel Old Country Store Inc. | 254,117 | 13,918 |
| | Cooper Tire & Rubber Co. | 588,725 | 13,882 |
| | Hillenbrand Inc. | 664,628 | 13,831 |
| | Weight Watchers International Inc. | 367,414 | 13,774 |
| | CTC Media Inc. | 584,780 | 13,701 |
| * | New York Times Co. Class A | 1,395,688 | 13,678 |
| | Monro Muffler Brake Inc. | 395,398 | 13,677 |
| | Meredith Corp. | 388,917 | 13,476 |
| ^ | Six Flags Entertainment Corp. | 245,840 | 13,374 |
| | Men's Wearhouse Inc. | 535,124 | 13,367 |
| * | Childrens Place Retail Stores Inc. | 267,967 | 13,302 |
| * | HSN Inc. | 431,931 | 13,234 |
| *,^ | AutoNation Inc. | 467,302 | 13,178 |
| * | Pier 1 Imports Inc. | 1,247,843 | 13,102 |
| | Thor Industries Inc. | 380,525 | 12,923 |
| * | Gaylord Entertainment Co. | 354,420 | 12,738 |
| | Cinemark Holdings Inc. | 728,185 | 12,554 |
| | Morningstar Inc. | 236,379 | 12,547 |
3
| | | |
| Vanguard® Total Stock Market Index Fund | | |
| Schedule of Investments | | |
| December 31, 2010 | | |
| |
| | | | Market |
| | | | Value |
| | | Shares | ($000) |
| * | Jack in the Box Inc. | 590,552 | 12,478 |
| | Choice Hotels International Inc. | 320,116 | 12,251 |
| | PF Chang's China Bistro Inc. | 249,229 | 12,078 |
| | Arbitron Inc. | 289,938 | 12,038 |
| | Pool Corp. | 530,854 | 11,965 |
| * | JOS A Bank Clothiers Inc. | 294,741 | 11,884 |
| * | Ulta Salon Cosmetics & Fragrance Inc. | 345,321 | 11,741 |
| * | Hibbett Sports Inc. | 317,171 | 11,704 |
| | MDC Holdings Inc. | 404,895 | 11,649 |
| * | Pinnacle Entertainment Inc. | 827,876 | 11,607 |
| | KB Home | 843,998 | 11,386 |
| | National CineMedia Inc. | 570,283 | 11,354 |
| | Matthews International Corp. Class A | 324,562 | 11,353 |
| | Buckle Inc. | 299,915 | 11,328 |
| * | Steven Madden Ltd. | 266,630 | 11,124 |
| * | Exide Technologies | 1,173,678 | 11,044 |
| * | Timberland Co. Class A | 448,562 | 11,030 |
| *,^ | Capella Education Co. | 164,412 | 10,947 |
| | Regal Entertainment Group Class A | 909,035 | 10,672 |
| | Bob Evans Farms Inc. | 323,171 | 10,652 |
| | Finish Line Inc. Class A | 618,682 | 10,635 |
| * | DSW Inc. Class A | 269,091 | 10,521 |
| | Regis Corp. | 616,676 | 10,237 |
| * | Domino's Pizza Inc. | 639,165 | 10,195 |
| | Group 1 Automotive Inc. | 240,889 | 10,060 |
| | Cato Corp. Class A | 353,618 | 9,693 |
| *,^ | Tesla Motors Inc. | 347,662 | 9,258 |
| * | CEC Entertainment Inc. | 236,747 | 9,193 |
| * | Liz Claiborne Inc. | 1,274,928 | 9,128 |
| * | Helen of Troy Ltd. | 304,191 | 9,047 |
| *,^ | Blue Nile Inc. | 156,711 | 8,942 |
| * | Biglari Holdings Inc. | 21,529 | 8,831 |
| | Columbia Sportswear Co. | 144,867 | 8,735 |
| * | Cabela's Inc. | 390,412 | 8,491 |
| | American Greetings Corp. Class A | 381,903 | 8,463 |
| * | Modine Manufacturing Co. | 545,511 | 8,455 |
| * | Ruby Tuesday Inc. | 646,178 | 8,439 |
| * | Texas Roadhouse Inc. Class A | 489,921 | 8,412 |
| ^ | Scholastic Corp. | 283,662 | 8,379 |
| ^ | Nutrisystem Inc. | 396,731 | 8,343 |
| * | Genesco Inc. | 221,250 | 8,295 |
| * | Quiksilver Inc. | 1,625,451 | 8,241 |
| * | 99 Cents Only Stores | 516,190 | 8,228 |
| * | Standard Pacific Corp. | 1,751,912 | 8,059 |
| * | Lions Gate Entertainment Corp. | 1,213,798 | 7,902 |
| *,^ | Education Management Corp. | 432,927 | 7,836 |
| * | Shutterfly Inc. | 218,820 | 7,665 |
| * | BJ's Restaurants Inc. | 213,517 | 7,565 |
| * | Skechers U.S.A. Inc. Class A | 377,686 | 7,554 |
| | Stage Stores Inc. | 435,038 | 7,544 |
| | Ryland Group Inc. | 437,816 | 7,456 |
| * | Buffalo Wild Wings Inc. | 166,429 | 7,298 |
| * | American Axle & Manufacturing Holdings Inc. | 565,455 | 7,272 |
| * | Scientific Games Corp. Class A | 724,856 | 7,220 |
| * | Charming Shoppes Inc. | 2,025,499 | 7,191 |
| | International Speedway Corp. Class A | 271,521 | 7,106 |
| * | Papa John's International Inc. | 252,717 | 7,000 |
| * | Penske Automotive Group Inc. | 401,637 | 6,997 |
| * | True Religion Apparel Inc. | 313,310 | 6,974 |
| * | Vitamin Shoppe Inc. | 205,405 | 6,910 |
| * | DineEquity Inc. | 135,996 | 6,715 |
| ^ | Barnes & Noble Inc. | 468,711 | 6,632 |
| * | Meritage Homes Corp. | 295,799 | 6,567 |
| * | Pre-Paid Legal Services Inc. | 106,848 | 6,438 |
4
| | | |
| Vanguard® Total Stock Market Index Fund | | |
| Schedule of Investments | | |
| December 31, 2010 | | |
| |
| | | | Market |
| | | | Value |
| | | Shares | ($000) |
| * | Zumiez Inc. | 239,013 | 6,422 |
| * | American Public Education Inc. | 168,581 | 6,278 |
| | PEP Boys-Manny Moe & Jack | 466,153 | 6,260 |
| | Ameristar Casinos Inc. | 394,011 | 6,158 |
| * | Belo Corp. Class A | 860,089 | 6,089 |
| | Sonic Automotive Inc. Class A | 459,855 | 6,088 |
| | Superior Industries International Inc. | 286,133 | 6,072 |
| * | Shuffle Master Inc. | 529,744 | 6,066 |
| * | K12 Inc. | 211,215 | 6,053 |
| * | Interval Leisure Group Inc. | 372,314 | 6,009 |
| | Fred's Inc. Class A | 435,256 | 5,989 |
| *,^ | Boyd Gaming Corp. | 562,305 | 5,960 |
| | Brown Shoe Co. Inc. | 417,848 | 5,821 |
| * | Clear Channel Outdoor Holdings Inc. Class A | 411,477 | 5,777 |
| | Sturm Ruger & Co. Inc. | 364,750 | 5,577 |
| * | EW Scripps Co. Class A | 543,445 | 5,516 |
| * | Talbots Inc. | 643,227 | 5,480 |
| * | Mediacom Communications Corp. Class A | 647,338 | 5,476 |
| * | Steiner Leisure Ltd. | 115,124 | 5,376 |
| | Callaway Golf Co. | 658,772 | 5,316 |
| ^ | PetMed Express Inc. | 297,962 | 5,307 |
| | Ethan Allen Interiors Inc. | 264,464 | 5,292 |
| * | Sonic Corp. | 519,883 | 5,261 |
| | Universal Technical Institute Inc. | 237,941 | 5,239 |
| * | La-Z-Boy Inc. | 573,099 | 5,169 |
| | Harte-Hanks Inc. | 404,800 | 5,169 |
| | Stewart Enterprises Inc. Class A | 771,263 | 5,160 |
| * | California Pizza Kitchen Inc. | 297,053 | 5,133 |
| * | Federal-Mogul Corp. | 246,327 | 5,087 |
| *,^ | Corinthian Colleges Inc. | 971,841 | 5,063 |
| * | Rentrak Corp. | 163,857 | 4,942 |
| * | Asbury Automotive Group Inc. | 266,824 | 4,931 |
| * | iRobot Corp. | 197,210 | 4,907 |
| * | Maidenform Brands Inc. | 195,364 | 4,644 |
| | Churchill Downs Inc. | 104,681 | 4,543 |
| * | G-III Apparel Group Ltd. | 128,837 | 4,529 |
| * | Wet Seal Inc. Class A | 1,211,264 | 4,482 |
| | Express Inc. | 235,695 | 4,431 |
| * | Lumber Liquidators Holdings Inc. | 177,744 | 4,428 |
| * | Peet's Coffee & Tea Inc. | 105,590 | 4,407 |
| * | Knology Inc. | 281,880 | 4,406 |
| * | Denny's Corp. | 1,222,092 | 4,375 |
| * | Jakks Pacific Inc. | 239,459 | 4,363 |
| * | Krispy Kreme Doughnuts Inc. | 619,637 | 4,325 |
| * | Dorman Products Inc. | 116,860 | 4,235 |
| | CPI Corp. | 185,348 | 4,180 |
| * | Select Comfort Corp. | 457,343 | 4,176 |
| | Lennar Corp. Class B | 266,260 | 4,146 |
| | News Corp. Class B | 247,731 | 4,068 |
| | Sinclair Broadcast Group Inc. Class A | 495,741 | 4,055 |
| * | Beazer Homes USA Inc. | 752,089 | 4,054 |
| * | Grand Canyon Education Inc. | 203,269 | 3,982 |
| * | Fuel Systems Solutions Inc. | 134,970 | 3,965 |
| * | Retail Ventures Inc. | 239,131 | 3,898 |
| * | Winnebago Industries Inc. | 254,296 | 3,865 |
| | HOT Topic Inc. | 612,028 | 3,837 |
| * | Ascent Media Corp. Class A | 98,771 | 3,828 |
| | Drew Industries Inc. | 166,426 | 3,781 |
| * | RC2 Corp. | 171,637 | 3,737 |
| | Standard Motor Products Inc. | 269,914 | 3,698 |
| * | Unifi Inc. | 217,263 | 3,678 |
| * | Perry Ellis International Inc. | 132,659 | 3,644 |
| * | Red Robin Gourmet Burgers Inc. | 163,640 | 3,513 |
| * | Universal Electronics Inc. | 119,371 | 3,387 |
5
| | | |
| Vanguard® Total Stock Market Index Fund | | |
| Schedule of Investments | | |
| December 31, 2010 | | |
| |
| | | | Market |
| | | | Value |
| | | Shares | ($000) |
| * | Core-Mark Holding Co. Inc. | 92,769 | 3,302 |
| *,^ | hhgregg Inc. | 156,455 | 3,278 |
| * | America's Car-Mart Inc. | 120,901 | 3,274 |
| * | K-Swiss Inc. Class A | 260,977 | 3,254 |
| * | Rue21 Inc. | 110,534 | 3,240 |
| *,^ | Hovnanian Enterprises Inc. Class A | 787,352 | 3,220 |
| * | Movado Group Inc. | 197,890 | 3,194 |
| * | Journal Communications Inc. Class A | 624,003 | 3,151 |
| * | Systemax Inc. | 223,222 | 3,147 |
| * | Furniture Brands International Inc. | 604,735 | 3,108 |
| *,^ | Bridgepoint Education Inc. | 159,872 | 3,038 |
| | Big 5 Sporting Goods Corp. | 196,933 | 3,007 |
| | Hooker Furniture Corp. | 208,201 | 2,942 |
| * | Stoneridge Inc. | 185,567 | 2,930 |
| * | Citi Trends Inc. | 119,121 | 2,924 |
| | World Wrestling Entertainment Inc. Class A | 204,253 | 2,909 |
| * | Pacific Sunwear of California Inc. | 536,204 | 2,906 |
| * | Coldwater Creek Inc. | 906,201 | 2,873 |
| | Oxford Industries Inc. | 110,790 | 2,837 |
| * | Geeknet Inc. | 111,582 | 2,788 |
| * | Famous Dave's Of America Inc. | 248,210 | 2,768 |
| | Lincoln Educational Services Corp. | 174,618 | 2,708 |
| * | Cavco Industries Inc. | 55,200 | 2,577 |
| * | Amerigon Inc. | 234,876 | 2,555 |
| | Stein Mart Inc. | 275,099 | 2,545 |
| * | Kid Brands Inc. | 291,432 | 2,492 |
| * | Carmike Cinemas Inc. | 322,731 | 2,491 |
| * | Steinway Musical Instruments Inc. | 124,555 | 2,472 |
| | Christopher & Banks Corp. | 398,347 | 2,450 |
| * | AH Belo Corp. Class A | 277,411 | 2,413 |
| | Blyth Inc. | 69,509 | 2,397 |
| * | CKX Inc. | 591,748 | 2,385 |
| * | AFC Enterprises Inc. | 170,181 | 2,366 |
| * | ChinaCast Education Corp. | 297,192 | 2,306 |
| * | Arctic Cat Inc. | 156,285 | 2,288 |
| | Volcom Inc. | 118,330 | 2,233 |
| | Strattec Security Corp. | 66,743 | 2,225 |
| | Marcus Corp. | 166,453 | 2,209 |
| * | Overstock.com Inc. | 134,000 | 2,208 |
| | Cherokee Inc. | 115,811 | 2,178 |
| * | Drugstore.Com Inc. | 967,516 | 2,138 |
| * | Warner Music Group Corp. | 377,578 | 2,126 |
| * | Smith & Wesson Holding Corp. | 550,906 | 2,060 |
| * | Kirkland's Inc. | 145,595 | 2,043 |
| | Gaiam Inc. Class A | 263,014 | 2,025 |
| * | Isle of Capri Casinos Inc. | 196,698 | 2,010 |
| *,^ | McClatchy Co. Class A | 422,181 | 1,972 |
| | Lithia Motors Inc. Class A | 137,048 | 1,958 |
| * | Cost Plus Inc. | 201,549 | 1,955 |
| | Spartan Motors Inc. | 314,997 | 1,918 |
| * | Leapfrog Enterprises Inc. | 341,575 | 1,896 |
| * | O'Charleys Inc. | 262,662 | 1,891 |
| * | Monarch Casino & Resort Inc. | 150,288 | 1,879 |
| * | Destination Maternity Corp. | 49,067 | 1,861 |
| *,^ | Wonder Auto Technology Inc. | 246,203 | 1,856 |
| | Haverty Furniture Cos. Inc. | 142,941 | 1,855 |
| * | LIN TV Corp. Class A | 340,392 | 1,804 |
| | Speedway Motorsports Inc. | 117,123 | 1,794 |
| * | Midas Inc. | 217,761 | 1,766 |
| | Mac-Gray Corp. | 117,860 | 1,762 |
| * | Jackson Hewitt Tax Service Inc. | 803,767 | 1,752 |
| *,^ | Bon-Ton Stores Inc. | 135,766 | 1,719 |
| * | Zale Corp. | 397,772 | 1,695 |
| * | Playboy Enterprises Inc. Class B | 323,691 | 1,690 |
6
| | | |
| Vanguard® Total Stock Market Index Fund | | |
| Schedule of Investments | | |
| December 31, 2010 | | |
| |
| | | | Market |
| | | | Value |
| | | Shares | ($000) |
| * | Shoe Carnival Inc. | 62,345 | 1,683 |
| * | Carriage Services Inc. Class A | 341,594 | 1,657 |
| * | Entercom Communications Corp. Class A | 138,464 | 1,603 |
| * | Audiovox Corp. Class A | 185,001 | 1,597 |
| * | Morgans Hotel Group Co. | 175,856 | 1,595 |
| | Weyco Group Inc. | 64,673 | 1,584 |
| * | M/I Homes Inc. | 100,961 | 1,553 |
| * | Multimedia Games Inc. | 277,155 | 1,547 |
| | Learning Tree International Inc. | 158,070 | 1,511 |
| * | Jamba Inc. | 662,916 | 1,505 |
| * | Cumulus Media Inc. Class A | 338,258 | 1,458 |
| | CSS Industries Inc. | 70,136 | 1,446 |
| * | Carrols Restaurant Group Inc. | 185,734 | 1,378 |
| | Ambassadors Group Inc. | 117,916 | 1,356 |
| | Shiloh Industries Inc. | 108,341 | 1,295 |
| * | Kenneth Cole Productions Inc. Class A | 103,048 | 1,287 |
| | Bebe Stores Inc. | 213,109 | 1,270 |
| * | Daily Journal Corp. | 17,525 | 1,260 |
| *,^ | Martha Stewart Living Omnimedia Class A | 280,887 | 1,242 |
| * | Orbitz Worldwide Inc. | 217,358 | 1,215 |
| *,^ | Brookfield Homes Corp. | 128,829 | 1,211 |
| * | Libbey Inc. | 76,580 | 1,185 |
| * | Saga Communications Inc. Class A | 44,453 | 1,170 |
| | Skyline Corp. | 44,299 | 1,155 |
| | Dover Downs Gaming & Entertainment Inc. | 334,607 | 1,138 |
| * | Lifetime Brands Inc. | 80,818 | 1,135 |
| * | Tuesday Morning Corp. | 214,618 | 1,133 |
| *,^ | SuperMedia Inc. | 129,154 | 1,125 |
| * | Red Lion Hotels Corp. | 139,524 | 1,113 |
| * | Dex One Corp. | 147,022 | 1,097 |
| * | Casual Male Retail Group Inc. | 230,633 | 1,093 |
| * | New York & Co. Inc. | 244,853 | 1,082 |
| *,^ | Deer Consumer Products Inc. | 90,251 | 1,014 |
| * | McCormick & Schmick's Seafood Restaurants Inc. | 111,113 | 1,010 |
| * | Sealy Corp. | 344,499 | 1,006 |
| * | Joe's Jeans Inc. | 642,685 | 1,003 |
| *,^ | Morton's Restaurant Group Inc. | 154,616 | 1,002 |
| * | West Marine Inc. | 91,832 | 972 |
| * | Heelys Inc. | 318,621 | 969 |
| * | MarineMax Inc. | 101,809 | 952 |
| | PRIMEDIA Inc. | 219,224 | 921 |
| * | Marine Products Corp. | 136,678 | 910 |
| * | Town Sports International Holdings Inc. | 223,722 | 908 |
| * | Fisher Communications Inc. | 41,285 | 900 |
| *,^ | Fuqi International Inc. | 139,077 | 887 |
| * | American Apparel Inc. | 530,315 | 880 |
| * | Navarre Corp. | 403,662 | 856 |
| * | Build-A-Bear Workshop Inc. | 110,719 | 846 |
| * | Cache Inc. | 180,108 | 800 |
| * | Luby's Inc. | 126,085 | 791 |
| | Outdoor Channel Holdings Inc. | 108,358 | 777 |
| * | Benihana Inc. Class A | 93,985 | 764 |
| * | Hastings Entertainment Inc. | 119,921 | 734 |
| * | Great Wolf Resorts Inc. | 267,831 | 702 |
| * | Stanley Furniture Co. Inc. | 222,499 | 692 |
| * | Premier Exhibitions Inc. | 345,029 | 680 |
| * | Lee Enterprises Inc. | 247,849 | 610 |
| * | Bassett Furniture Industries Inc. | 144,687 | 608 |
| * | Johnson Outdoors Inc. Class A | 48,020 | 601 |
| | Escalade Inc. | 93,954 | 597 |
| * | Valuevision Media Inc. Class A | 96,996 | 593 |
| * | 1-800-Flowers.com Inc. Class A | 210,914 | 567 |
| * | Radio One Inc. | 494,810 | 554 |
| | Books-A-Million Inc. | 90,607 | 526 |
7
| | | |
| Vanguard® Total Stock Market Index Fund | | |
| Schedule of Investments | | |
| December 31, 2010 | | |
| |
| | | | Market |
| | | | Value |
| | | Shares | ($000) |
| *,^ | China MediaExpress Holdings Inc. | 32,566 | 516 |
| * | dELiA*s Inc. | 289,676 | 504 |
| * | Beasley Broadcasting Group Inc. Class A | 84,001 | 503 |
| *,^ | Quantum Fuel Systems Technologies Worldwide Inc. | 1,100,346 | 495 |
| * | Harris Interactive Inc. | 396,283 | 483 |
| * | Media General Inc. Class A | 83,158 | 481 |
| * | Century Casinos Inc. | 194,327 | 470 |
| * | Nautilus Inc. | 256,489 | 457 |
| * | Rick's Cabaret International Inc. | 57,903 | 453 |
| * | Entravision Communications Corp. Class A | 174,530 | 449 |
| * | MTR Gaming Group Inc. | 207,998 | 420 |
| * | Ruth's Hospitality Group Inc. | 88,824 | 411 |
| * | Reading International Inc. Class A | 80,185 | 405 |
| * | Bluegreen Corp. | 125,034 | 403 |
| *,^ | Conn's Inc. | 83,142 | 389 |
| * | Caribou Coffee Co. Inc. | 37,648 | 379 |
| * | Gray Television Inc. | 201,600 | 377 |
| * | Nexstar Broadcasting Group Inc. Class A | 61,008 | 365 |
| * | Dover Motorsports Inc. | 204,192 | 363 |
| * | Vitacost.com Inc. | 63,377 | 361 |
| * | Dixie Group Inc. | 99,243 | 356 |
| * | Empire Resorts Inc. | 321,191 | 331 |
| * | Hallwood Group Inc. | 12,464 | 330 |
| | Collectors Universe | 23,330 | 325 |
| * | Hollywood Media Corp. | 189,451 | 311 |
| * | Duckwall-ALCO Stores Inc. | 24,464 | 308 |
| * | Benihana Inc. Class A | 37,839 | 306 |
| * | Borders Group Inc. | 336,816 | 303 |
| | Emerson Radio Corp. | 146,301 | 290 |
| * | Canterbury Park Holding Corp. | 24,382 | 283 |
| * | Trans World Entertainment Corp. | 160,912 | 274 |
| * | Princeton Review Inc. | 228,204 | 269 |
| *,^ | Universal Travel Group | 42,843 | 262 |
| * | Lakes Entertainment Inc. | 91,909 | 262 |
| | Gaming Partners International Corp. | 40,727 | 252 |
| * | Spanish Broadcasting System Inc. | 343,600 | 243 |
| | Salem Communications Corp. Class A | 75,695 | 240 |
| * | NIVS IntelliMedia Technology Group Inc. | 104,553 | 236 |
| *,^ | China Automotive Systems Inc. | 16,878 | 230 |
| * | Delta Apparel Inc. | 16,453 | 222 |
| * | VCG Holding Corp. | 96,831 | 211 |
| * | LodgeNet Interactive Corp. | 43,342 | 184 |
| * | SORL Auto Parts Inc. | 21,166 | 181 |
| *,^ | Crown Media Holdings Inc. Class A | 67,000 | 176 |
| * | Sport Chalet Inc. Class A | 63,784 | 173 |
| | Frisch's Restaurants Inc. | 7,570 | 169 |
| * | Culp Inc. | 14,057 | 146 |
| * | Private Media Group Inc. | 125,794 | 138 |
| * | Nobel Learning Communities Inc. | 17,389 | 127 |
| * | AC Moore Arts & Crafts Inc. | 45,984 | 116 |
| * | Atrinsic Inc. | 35,997 | 95 |
| * | Hovnanian Enterprises Inc. Class B | 19,300 | 79 |
| * | Tandy Brands Accessories Inc. | 17,460 | 50 |
| | Flexsteel Industries | 2,161 | 38 |
| * | Forward Industries Inc. | 11,810 | 38 |
| * | Global Traffic Network Inc. | 2,498 | 23 |
| * | SPAR Group Inc. | 16,145 | 15 |
| * | Sport Chalet Inc. Class B | 1,820 | 7 |
| * | Emmis Communications Corp. Class A | 6,535 | 5 |
| * | Krispy Kreme Doughnuts Inc. Warrants Exp. 03/02/2012 | 9,739 | 3 |
| * | US Auto Parts Network Inc. | 299 | 3 |
| | Educational Development Corp. | 281 | 2 |
| | | | 17,255,820 |
8
| | |
| Vanguard® Total Stock Market Index Fund | | |
| Schedule of Investments | | |
| December 31, 2010 | | |
| |
| | | Market |
| | | Value |
| | Shares | ($000) |
| Consumer Staples (9.1%) | | |
| Procter & Gamble Co. | 29,931,918 | 1,925,520 |
| Coca-Cola Co. | 21,925,943 | 1,442,069 |
| Wal-Mart Stores Inc. | 21,519,464 | 1,160,545 |
| Philip Morris International Inc. | 19,332,844 | 1,131,551 |
| PepsiCo Inc. | 16,779,844 | 1,096,227 |
| Kraft Foods Inc. | 18,398,143 | 579,725 |
| Altria Group Inc. | 21,979,710 | 541,140 |
| CVS Caremark Corp. | 14,302,234 | 497,289 |
| Colgate-Palmolive Co. | 5,125,149 | 411,908 |
| Walgreen Co. | 10,262,186 | 399,815 |
| Costco Wholesale Corp. | 4,630,706 | 334,383 |
| Kimberly-Clark Corp. | 4,319,408 | 272,295 |
| General Mills Inc. | 6,776,741 | 241,184 |
| Archer-Daniels-Midland Co. | 6,785,425 | 204,106 |
| Sysco Corp. | 6,208,208 | 182,521 |
| HJ Heinz Co. | 3,360,968 | 166,233 |
| Kroger Co. | 6,431,388 | 143,806 |
| Kellogg Co. | 2,788,435 | 142,433 |
| Mead Johnson Nutrition Co. | 2,159,995 | 134,460 |
| Avon Products Inc. | 4,529,615 | 131,631 |
| Lorillard Inc. | 1,602,012 | 131,461 |
| Reynolds American Inc. | 3,694,180 | 120,504 |
| Sara Lee Corp. | 6,633,768 | 116,157 |
| ConAgra Foods Inc. | 4,635,633 | 104,673 |
| Estee Lauder Cos. Inc. Class A | 1,202,949 | 97,078 |
| Clorox Co. | 1,469,070 | 92,963 |
| Bunge Ltd. | 1,407,789 | 92,238 |
| Safeway Inc. | 4,034,856 | 90,744 |
| Coca-Cola Enterprises Inc. | 3,620,797 | 90,629 |
| Dr Pepper Snapple Group Inc. | 2,526,142 | 88,819 |
| Molson Coors Brewing Co. Class B | 1,713,650 | 86,008 |
| JM Smucker Co. | 1,261,679 | 82,829 |
| Hershey Co. | 1,671,935 | 78,832 |
| * Whole Foods Market Inc. | 1,545,752 | 78,200 |
| Campbell Soup Co. | 2,154,576 | 74,872 |
| Brown-Forman Corp. Class B | 861,852 | 60,002 |
| McCormick & Co. Inc. | 1,276,063 | 59,375 |
| Tyson Foods Inc. Class A | 3,090,296 | 53,215 |
| Church & Dwight Co. Inc. | 751,435 | 51,864 |
| * Energizer Holdings Inc. | 705,016 | 51,396 |
| * Constellation Brands Inc. Class A | 1,981,712 | 43,895 |
| Herbalife Ltd. | 626,275 | 42,818 |
| * Hansen Natural Corp. | 792,929 | 41,454 |
| Hormel Foods Corp. | 775,028 | 39,728 |
| * Green Mountain Coffee Roasters Inc. | 1,190,759 | 39,128 |
| Del Monte Foods Co. | 2,067,437 | 38,868 |
| * Ralcorp Holdings Inc. | 581,022 | 37,772 |
| Corn Products International Inc. | 796,786 | 36,652 |
| Alberto-Culver Co. Class B | 936,848 | 34,701 |
| * Smithfield Foods Inc. | 1,576,909 | 32,532 |
| * BJ's Wholesale Club Inc. | 574,817 | 27,534 |
| Flowers Foods Inc. | 881,302 | 23,716 |
| SUPERVALU Inc. | 2,240,718 | 21,578 |
| * TreeHouse Foods Inc. | 374,218 | 19,119 |
| Nu Skin Enterprises Inc. Class A | 603,285 | 18,255 |
| * United Natural Foods Inc. | 482,650 | 17,704 |
| Casey's General Stores Inc. | 404,555 | 17,198 |
| * Dean Foods Co. | 1,943,221 | 17,178 |
| * Central European Distribution Corp. | 717,932 | 16,441 |
| Ruddick Corp. | 443,700 | 16,346 |
| ^ Diamond Foods Inc. | 233,538 | 12,420 |
| Lancaster Colony Corp. | 212,778 | 12,171 |
| * Darling International Inc. | 903,751 | 12,002 |
9
| | | |
| Vanguard® Total Stock Market Index Fund | | |
| Schedule of Investments | | |
| December 31, 2010 | | |
| |
| | | | Market |
| | | | Value |
| | | Shares | ($000) |
| * | Hain Celestial Group Inc. | 440,687 | 11,925 |
| | Fresh Del Monte Produce Inc. | 469,436 | 11,712 |
| | Universal Corp. | 258,727 | 10,530 |
| * | Boston Beer Co. Inc. Class A | 101,225 | 9,625 |
| ^ | Vector Group Ltd. | 555,264 | 9,617 |
| | Sanderson Farms Inc. | 230,014 | 9,005 |
| * | Chiquita Brands International Inc. | 627,833 | 8,802 |
| *,^ | Zhongpin Inc. | 371,945 | 7,588 |
| | Nash Finch Co. | 173,918 | 7,393 |
| | Andersons Inc. | 193,115 | 7,020 |
| | WD-40 Co. | 159,180 | 6,412 |
| | Snyders-Lance Inc. | 272,597 | 6,390 |
| | J&J Snack Foods Corp. | 130,229 | 6,282 |
| | Tootsie Roll Industries Inc. | 213,761 | 6,193 |
| | B&G Foods Inc. Class A | 449,919 | 6,177 |
| | Pricesmart Inc. | 148,850 | 5,661 |
| * | Rite Aid Corp. | 6,186,428 | 5,464 |
| ^ | Cal-Maine Foods Inc. | 154,745 | 4,887 |
| | Weis Markets Inc. | 118,088 | 4,763 |
| * | Prestige Brands Holdings Inc. | 388,185 | 4,639 |
| * | Elizabeth Arden Inc. | 198,111 | 4,559 |
| * | Heckmann Corp. | 875,210 | 4,402 |
| | Spartan Stores Inc. | 252,715 | 4,284 |
| * | Pantry Inc. | 209,729 | 4,165 |
| * | Medifast Inc. | 142,318 | 4,110 |
| * | USANA Health Sciences Inc. | 92,907 | 4,037 |
| *,^ | Dole Food Co. Inc. | 294,021 | 3,972 |
| * | Winn-Dixie Stores Inc. | 537,790 | 3,856 |
| | Coca-Cola Bottling Co. Consolidated | 68,699 | 3,818 |
| * | Central Garden and Pet Co. Class A | 381,888 | 3,773 |
| * | Alliance One International Inc. | 761,381 | 3,228 |
| * | Smart Balance Inc. | 666,921 | 2,888 |
| | Inter Parfums Inc. | 149,296 | 2,814 |
| * | Pilgrim's Pride Corp. | 396,536 | 2,811 |
| | Imperial Sugar Co. | 206,924 | 2,767 |
| | Village Super Market Inc. Class A | 81,795 | 2,699 |
| | Calavo Growers Inc. | 103,200 | 2,379 |
| * | Central Garden and Pet Co. | 230,873 | 2,272 |
| | Oil-Dri Corp. of America | 105,597 | 2,269 |
| *,^ | Feihe International Inc. | 206,132 | 2,193 |
| * | Physicians Formula Holdings Inc. | 582,740 | 2,191 |
| * | John B. Sanfilippo & Son Inc. | 172,854 | 2,150 |
| | Ingles Markets Inc. Class A | 103,513 | 1,987 |
| * | Revlon Inc. Class A | 192,679 | 1,896 |
| * | Nutraceutical International Corp. | 131,986 | 1,873 |
| | Schiff Nutrition International Inc. | 196,033 | 1,780 |
| | Limoneira Co. | 59,217 | 1,700 |
| | Tasty Baking Co. | 226,547 | 1,423 |
| | National Beverage Corp. | 105,045 | 1,380 |
| *,^ | American Oriental Bioengineering Inc. | 556,979 | 1,337 |
| *,^ | Lifeway Foods Inc. | 112,340 | 1,073 |
| * | Seneca Foods Corp. Class A | 39,536 | 1,067 |
| * | Inventure Foods Inc. | 228,974 | 991 |
| | Alico Inc. | 39,757 | 948 |
| | Female Health Co. | 163,258 | 929 |
| * | Omega Protein Corp. | 112,677 | 913 |
| * | Reddy Ice Holdings Inc. | 306,291 | 842 |
| *,^ | Star Scientific Inc. | 422,617 | 824 |
| | Griffin Land & Nurseries Inc. | 21,953 | 711 |
| | Farmer Bros Co. | 38,108 | 678 |
| * | Susser Holdings Corp. | 46,811 | 648 |
| *,^ | China-Biotics Inc. | 43,410 | 638 |
| *,^ | China Sky One Medical Inc. | 90,944 | 634 |
| | MGP Ingredients Inc. | 55,676 | 615 |
10
| | | |
| Vanguard® Total Stock Market Index Fund | | |
| Schedule of Investments | | |
| December 31, 2010 | | |
| |
| | | | Market |
| | | | Value |
| | | Shares | ($000) |
| * | HQ Sustainable Maritime Industries Inc. | 84,816 | 405 |
| * | Mannatech Inc. | 218,373 | 393 |
| * | Parlux Fragrances Inc. | 133,041 | 391 |
| | Reliv International Inc. | 146,308 | 277 |
| *,^ | AgFeed Industries Inc. | 89,234 | 262 |
| * | Harbinger Group Inc. | 41,634 | 258 |
| * | Overhill Farms Inc. | 32,351 | 187 |
| *,^ | Jones Soda Co. | 139,211 | 164 |
| * | Orchids Paper Products Co. | 5,513 | 67 |
| * | Crystal Rock Holdings Inc. | 32,920 | 22 |
| | | | 13,708,945 |
| Energy (11.2%) | | |
| | Exxon Mobil Corp. | 53,712,947 | 3,927,491 |
| | Chevron Corp. | 21,209,399 | 1,935,358 |
| | Schlumberger Ltd. | 14,413,899 | 1,203,561 |
| | ConocoPhillips | 14,863,013 | 1,012,171 |
| | Occidental Petroleum Corp. | 8,566,076 | 840,332 |
| | Apache Corp. | 4,029,123 | 480,392 |
| | Anadarko Petroleum Corp. | 5,219,116 | 397,488 |
| | Halliburton Co. | 9,621,403 | 392,842 |
| | Devon Energy Corp. | 4,357,874 | 342,137 |
| | National Oilwell Varco Inc. | 4,422,542 | 297,416 |
| | Marathon Oil Corp. | 7,489,404 | 277,333 |
| | Baker Hughes Inc. | 4,549,105 | 260,072 |
| | Hess Corp. | 3,200,561 | 244,971 |
| | EOG Resources Inc. | 2,674,539 | 244,480 |
| | Peabody Energy Corp. | 2,840,782 | 181,753 |
| | Chesapeake Energy Corp. | 6,899,925 | 178,777 |
| * | Weatherford International Ltd. | 7,819,335 | 178,281 |
| | Spectra Energy Corp. | 6,833,619 | 170,772 |
| | Noble Energy Inc. | 1,843,133 | 158,657 |
| | Williams Cos. Inc. | 6,165,331 | 152,407 |
| | Murphy Oil Corp. | 1,923,596 | 143,404 |
| | Valero Energy Corp. | 5,979,636 | 138,249 |
| * | Southwestern Energy Co. | 3,654,510 | 136,788 |
| * | Cameron International Corp. | 2,557,717 | 129,753 |
| | Consol Energy Inc. | 2,384,305 | 116,211 |
| * | FMC Technologies Inc. | 1,265,330 | 112,500 |
| | Pioneer Natural Resources Co. | 1,225,007 | 106,355 |
| | El Paso Corp. | 7,423,434 | 102,146 |
| * | Newfield Exploration Co. | 1,408,890 | 101,595 |
| | Noble Corp. | 2,706,069 | 96,796 |
| * | Concho Resources Inc. | 921,509 | 80,789 |
| | Cimarex Energy Co. | 888,240 | 78,636 |
| * | Ultra Petroleum Corp. | 1,610,690 | 76,943 |
| * | Denbury Resources Inc. | 4,007,808 | 76,509 |
| * | Alpha Natural Resources Inc. | 1,273,394 | 76,442 |
| | Range Resources Corp. | 1,692,395 | 76,124 |
| * | Nabors Industries Ltd. | 3,014,065 | 70,710 |
| | QEP Resources Inc. | 1,852,925 | 67,280 |
| | EQT Corp. | 1,496,705 | 67,112 |
| * | Whiting Petroleum Corp. | 539,591 | 63,235 |
| * | Pride International Inc. | 1,852,728 | 61,140 |
| | Arch Coal Inc. | 1,716,978 | 60,197 |
| * | Petrohawk Energy Corp. | 3,194,758 | 58,304 |
| * | Kinder Morgan Management LLC | 866,813 | 57,972 |
| | Massey Energy Co. | 1,026,686 | 55,082 |
| | Helmerich & Payne Inc. | 1,120,041 | 54,300 |
| | Sunoco Inc. | 1,275,971 | 51,434 |
| * | McDermott International Inc. | 2,449,982 | 50,690 |
| ^ | Diamond Offshore Drilling Inc. | 735,848 | 49,206 |
| * | Plains Exploration & Production Co. | 1,482,863 | 47,659 |
| * | Forest Oil Corp. | 1,135,926 | 43,131 |
| * | Rowan Cos. Inc. | 1,212,623 | 42,333 |
11
| | | |
| Vanguard® Total Stock Market Index Fund | | |
| Schedule of Investments | | |
| December 31, 2010 | | |
| |
| | | | Market |
| | | | Value |
| | | Shares | ($000) |
| | Core Laboratories NV | 472,875 | 42,110 |
| * | Oceaneering International Inc. | 571,151 | 42,054 |
| | Cabot Oil & Gas Corp. | 1,101,934 | 41,708 |
| | SM Energy Co. | 667,546 | 39,338 |
| | EXCO Resources Inc. | 1,907,089 | 37,036 |
| * | Dresser-Rand Group Inc. | 856,777 | 36,490 |
| * | Atlas Energy Inc. | 826,724 | 36,351 |
| | Patterson-UTI Energy Inc. | 1,631,731 | 35,164 |
| * | Oil States International Inc. | 534,913 | 34,283 |
| * | Brigham Exploration Co. | 1,230,488 | 33,518 |
| | Southern Union Co. | 1,249,024 | 30,064 |
| | Tidewater Inc. | 545,482 | 29,369 |
| * | Superior Energy Services Inc. | 839,025 | 29,357 |
| * | SandRidge Energy Inc. | 3,850,073 | 28,183 |
| * | Tesoro Corp. | 1,513,116 | 28,053 |
| * | Dril-Quip Inc. | 336,300 | 26,137 |
| | World Fuel Services Corp. | 677,299 | 24,491 |
| | Holly Corp. | 568,628 | 23,183 |
| * | Atwood Oceanics Inc. | 620,203 | 23,177 |
| | Berry Petroleum Co. Class A | 513,585 | 22,444 |
| * | Gran Tierra Energy Inc. | 2,708,946 | 21,807 |
| | CARBO Ceramics Inc. | 209,862 | 21,729 |
| | SEACOR Holdings Inc. | 212,879 | 21,520 |
| * | Rosetta Resources Inc. | 560,921 | 21,113 |
| * | Continental Resources Inc. | 358,736 | 21,112 |
| | Frontier Oil Corp. | 1,131,169 | 20,372 |
| * | Unit Corp. | 434,814 | 20,210 |
| | Lufkin Industries Inc. | 318,670 | 19,882 |
| * | Complete Production Services Inc. | 665,845 | 19,676 |
| * | Quicksilver Resources Inc. | 1,275,742 | 18,804 |
| * | Energy XXI Bermuda Ltd. | 648,872 | 17,954 |
| * | Key Energy Services Inc. | 1,343,078 | 17,433 |
| * | Swift Energy Co. | 445,117 | 17,426 |
| * | Bristow Group Inc. | 365,391 | 17,301 |
| * | Bill Barrett Corp. | 417,288 | 17,163 |
| * | Patriot Coal Corp. | 829,976 | 16,077 |
| * | Northern Oil and Gas Inc. | 585,991 | 15,945 |
| * | Exterran Holdings Inc. | 641,100 | 15,354 |
| * | Stone Energy Corp. | 662,347 | 14,764 |
| * | Oasis Petroleum Inc. | 540,756 | 14,665 |
| * | McMoRan Exploration Co. | 849,201 | 14,555 |
| * | International Coal Group Inc. | 1,848,490 | 14,307 |
| * | Cloud Peak Energy Inc. | 610,478 | 14,181 |
| * | ION Geophysical Corp. | 1,596,300 | 13,537 |
| * | Carrizo Oil & Gas Inc. | 389,574 | 13,436 |
| * | Helix Energy Solutions Group Inc. | 1,066,949 | 12,953 |
| * | Comstock Resources Inc. | 505,118 | 12,406 |
| | Overseas Shipholding Group Inc. | 310,823 | 11,009 |
| * | Cobalt International Energy Inc. | 884,366 | 10,798 |
| * | Kodiak Oil & Gas Corp. | 1,606,759 | 10,605 |
| * | USEC Inc. | 1,605,008 | 9,662 |
| * | Western Refining Inc. | 902,716 | 9,551 |
| * | James River Coal Co. | 372,048 | 9,424 |
| * | Tetra Technologies Inc. | 791,536 | 9,396 |
| * | Enbridge Energy Management LLC | 136,854 | 8,738 |
| * | Petroleum Development Corp. | 204,141 | 8,617 |
| | Contango Oil & Gas Co. | 141,334 | 8,187 |
| *,^ | ATP Oil & Gas Corp. | 486,626 | 8,146 |
| | Penn Virginia Corp. | 481,381 | 8,097 |
| * | Rex Energy Corp. | 554,426 | 7,568 |
| | RPC Inc. | 401,236 | 7,270 |
| * | Global Industries Ltd. | 1,002,544 | 6,948 |
| * | Hornbeck Offshore Services Inc. | 316,774 | 6,614 |
| * | CVR Energy Inc. | 434,730 | 6,599 |
12
| | | |
| Vanguard® Total Stock Market Index Fund | | |
| Schedule of Investments | | |
| December 31, 2010 | | |
| |
| | | | Market |
| | | | Value |
| | | Shares | ($000) |
| * | Tesco Corp. | 413,284 | 6,563 |
| * | Cal Dive International Inc. | 1,129,433 | 6,404 |
| * | Gulfmark Offshore Inc. | 204,537 | 6,218 |
| * | Gulfport Energy Corp. | 284,124 | 6,151 |
| * | Newpark Resources Inc. | 937,808 | 5,777 |
| * | Hercules Offshore Inc. | 1,664,193 | 5,758 |
| | Gulf Island Fabrication Inc. | 202,166 | 5,697 |
| *,^ | Clean Energy Fuels Corp. | 402,563 | 5,571 |
| * | Clayton Williams Energy Inc. | 65,351 | 5,488 |
| * | Parker Drilling Co. | 1,197,302 | 5,472 |
| * | Venoco Inc. | 295,430 | 5,451 |
| * | Willbros Group Inc. | 551,926 | 5,420 |
| | W&T Offshore Inc. | 301,766 | 5,393 |
| * | Petroquest Energy Inc. | 685,108 | 5,159 |
| * | Resolute Energy Corp. | 328,835 | 4,854 |
| * | Pioneer Drilling Co. | 539,682 | 4,755 |
| * | Endeavour International Corp. | 330,490 | 4,561 |
| * | Goodrich Petroleum Corp. | 257,162 | 4,536 |
| * | Harvest Natural Resources Inc. | 363,542 | 4,424 |
| *,^ | Rentech Inc. | 3,502,532 | 4,273 |
| * | T-3 Energy Services Inc. | 103,866 | 4,137 |
| * | Approach Resources Inc. | 174,731 | 4,036 |
| * | Warren Resources Inc. | 892,081 | 4,032 |
| * | Energy Partners Ltd. | 253,036 | 3,760 |
| * | Basic Energy Services Inc. | 223,596 | 3,685 |
| *,^ | BPZ Resources Inc. | 751,901 | 3,579 |
| * | Callon Petroleum Co. | 602,060 | 3,564 |
| * | Vaalco Energy Inc. | 474,801 | 3,400 |
| * | Matrix Service Co. | 272,655 | 3,321 |
| *,^ | Hyperdynamics Corp. | 669,264 | 3,320 |
| * | OYO Geospace Corp. | 32,823 | 3,253 |
| * | Allis-Chalmers Energy Inc. | 455,449 | 3,229 |
| * | Abraxas Petroleum Corp. | 703,545 | 3,215 |
| | General Maritime Corp. | 860,059 | 2,795 |
| | Crosstex Energy Inc. | 308,004 | 2,729 |
| * | Magnum Hunter Resources Corp. | 357,097 | 2,571 |
| *,^ | Uranium Energy Corp. | 423,741 | 2,559 |
| * | Georesources Inc. | 114,295 | 2,538 |
| *,^ | Delta Petroleum Corp. | 3,232,657 | 2,457 |
| * | Toreador Resources Corp. | 157,156 | 2,439 |
| * | Dawson Geophysical Co. | 74,754 | 2,385 |
| * | FX Energy Inc. | 369,395 | 2,272 |
| * | Vantage Drilling Co. | 1,108,329 | 2,250 |
| * | Bolt Technology Corp. | 164,653 | 2,168 |
| * | Uranium Resources Inc. | 603,118 | 2,051 |
| * | Syntroleum Corp. | 1,104,399 | 2,043 |
| *,^ | Cheniere Energy Inc. | 364,841 | 2,014 |
| *,^ | CAMAC Energy Inc. | 1,006,186 | 2,002 |
| * | Gastar Exploration Ltd. | 440,314 | 1,893 |
| ^ | Houston American Energy Corp. | 102,589 | 1,856 |
| | Panhandle Oil and Gas Inc. Class A | 64,764 | 1,776 |
| * | Natural Gas Services Group Inc. | 88,668 | 1,677 |
| * | REX American Resources Corp. | 108,101 | 1,660 |
| * | Bronco Drilling Co. Inc. | 203,655 | 1,629 |
| * | Oilsands Quest Inc. | 3,834,423 | 1,611 |
| *,^ | GMX Resources Inc. | 278,705 | 1,538 |
| * | Double Eagle Petroleum Co. | 286,284 | 1,406 |
| * | PHI Inc. | 74,237 | 1,399 |
| * | Westmoreland Coal Co. | 105,670 | 1,262 |
| *,^ | Green Plains Renewable Energy Inc. | 103,852 | 1,169 |
| *,^ | L&L Energy Inc. | 107,834 | 1,165 |
| * | Seahawk Drilling Inc. | 108,968 | 975 |
| * | Union Drilling Inc. | 123,367 | 898 |
| ^ | Alon USA Energy Inc. | 143,145 | 856 |
13
| | | |
| Vanguard® Total Stock Market Index Fund | | |
| Schedule of Investments | | |
| December 31, 2010 | | |
| |
| | | | Market |
| | | | Value |
| | | Shares | ($000) |
| * | CREDO Petroleum Corp. | 105,571 | 855 |
| | Delek US Holdings Inc. | 111,599 | 812 |
| * | ENGlobal Corp. | 215,766 | 803 |
| *,^ | Uranerz Energy Corp. | 197,387 | 788 |
| * | Mitcham Industries Inc. | 64,385 | 744 |
| *,^ | Pacific Ethanol Inc. | 906,818 | 654 |
| * | RAM Energy Resources Inc. | 355,533 | 654 |
| * | Global Geophysical Services Inc. | 52,067 | 540 |
| *,^ | Verenium Corp. | 160,189 | 513 |
| *,^ | GeoGlobal Resources Inc. | 609,855 | 482 |
| *,^ | Isramco Inc. | 5,655 | 477 |
| * | Gasco Energy Inc. | 942,746 | 331 |
| * | TGC Industries Inc. | 78,239 | 297 |
| * | China Integrated Energy Inc. | 34,612 | 254 |
| * | Barnwell Industries Inc. | 63,061 | 231 |
| *,^ | China North East Petroleum Holdings Ltd. | 39,366 | 227 |
| *,^ | BMB Munai Inc. | 185,888 | 160 |
| * | Contango ORE Inc. | 14,513 | 152 |
| * | HKN Inc. | 37,464 | 131 |
| * | Geokinetics Inc. | 13,286 | 123 |
| *,^ | Sulphco Inc. | 705,085 | 120 |
| * | GeoMet Inc. | 103,208 | 119 |
| *,^ | Tri-Valley Corp. | 196,976 | 112 |
| *,^ | NGAS Resources Inc. | 185,947 | 104 |
| * | Evolution Petroleum Corp. | 14,849 | 97 |
| *,^ | Cano Petroleum Inc. | 227,469 | 88 |
| | Adams Resources & Energy Inc. | 1,304 | 31 |
| * | Evergreen Energy Inc. | 41,289 | 27 |
| * | Cubic Energy Inc. | 26,705 | 27 |
| * | GreenHunter Energy Inc. | 4,759 | 4 |
| * | PrimeEnergy Corp. | 190 | 4 |
| | | | 16,903,597 |
| Financials (16.3%) | | |
| | JPMorgan Chase & Co. | 41,827,829 | 1,774,336 |
| | Wells Fargo & Co. | 52,446,811 | 1,625,327 |
| * | Citigroup Inc. | 306,443,491 | 1,449,478 |
| | Bank of America Corp. | 105,803,854 | 1,411,423 |
| | Goldman Sachs Group Inc. | 5,177,573 | 870,661 |
| * | Berkshire Hathaway Inc. Class B | 7,785,640 | 623,708 |
| | US Bancorp | 20,220,570 | 545,349 |
| | American Express Co. | 11,421,553 | 490,213 |
| | MetLife Inc. | 9,866,764 | 438,479 |
| | Bank of New York Mellon Corp. | 12,802,708 | 386,642 |
| | Morgan Stanley | 13,258,190 | 360,755 |
| | PNC Financial Services Group Inc. | 5,540,638 | 336,428 |
| | Simon Property Group Inc. | 3,089,498 | 307,374 |
| | Prudential Financial Inc. | 4,906,314 | 288,050 |
| | Aflac Inc. | 4,968,803 | 280,390 |
| | Travelers Cos. Inc. | 4,959,724 | 276,306 |
| | State Street Corp. | 5,296,279 | 245,430 |
| | CME Group Inc. | 709,318 | 228,223 |
| | ACE Ltd. | 3,575,829 | 222,595 |
| | Capital One Financial Corp. | 4,819,585 | 205,122 |
| | Chubb Corp. | 3,318,746 | 197,930 |
| | BB&T Corp. | 7,311,775 | 192,227 |
| | Franklin Resources Inc. | 1,665,225 | 185,190 |
| | Charles Schwab Corp. | 10,707,907 | 183,212 |
| | BlackRock Inc. | 929,275 | 177,101 |
| | T Rowe Price Group Inc. | 2,703,239 | 174,467 |
| | Allstate Corp. | 5,390,455 | 171,848 |
| | Marsh & McLennan Cos. Inc. | 5,725,327 | 156,530 |
| | SunTrust Banks Inc. | 5,278,380 | 155,765 |
| | Equity Residential | 2,988,795 | 155,268 |
14
| | | |
| Vanguard® Total Stock Market Index Fund | | |
| Schedule of Investments | | |
| December 31, 2010 | | |
| |
| | | | Market |
| | | | Value |
| | | Shares | ($000) |
| | Public Storage | 1,524,786 | 154,644 |
| | Ameriprise Financial Inc. | 2,647,337 | 152,354 |
| | Vornado Realty Trust | 1,732,395 | 144,360 |
| | AON Corp. | 3,129,843 | 144,004 |
| | HCP Inc. | 3,854,078 | 141,792 |
| | Loews Corp. | 3,527,804 | 137,267 |
| | Progressive Corp. | 6,697,748 | 133,084 |
| | Northern Trust Corp. | 2,297,527 | 127,306 |
| | Boston Properties Inc. | 1,469,482 | 126,522 |
| | Host Hotels & Resorts Inc. | 6,999,520 | 125,081 |
| | Fifth Third Bancorp | 8,396,514 | 123,261 |
| | Hartford Financial Services Group Inc. | 4,450,130 | 117,884 |
| | Invesco Ltd. | 4,878,131 | 117,368 |
| | Annaly Capital Management Inc. | 6,546,443 | 117,312 |
| | Principal Financial Group Inc. | 3,382,641 | 110,139 |
| | Weyerhaeuser Co. | 5,658,135 | 107,108 |
| | Discover Financial Services | 5,736,603 | 106,299 |
| | AvalonBay Communities Inc. | 900,600 | 101,363 |
| * | Berkshire Hathaway Inc. Class A | 826 | 99,492 |
| * | CIT Group Inc. | 2,009,825 | 94,663 |
| | Lincoln National Corp. | 3,346,009 | 93,052 |
| | Regions Financial Corp. | 13,266,814 | 92,868 |
| | Ventas Inc. | 1,659,569 | 87,094 |
| | ProLogis | 5,885,317 | 84,984 |
| | Unum Group | 3,455,067 | 83,682 |
| | NYSE Euronext | 2,757,551 | 82,671 |
| | New York Community Bancorp Inc. | 4,370,959 | 82,393 |
| | KeyCorp | 9,299,794 | 82,303 |
| * | IntercontinentalExchange Inc. | 664,865 | 79,219 |
| | XL Group plc Class A | 3,613,699 | 78,851 |
| | Comerica Inc. | 1,862,808 | 78,685 |
| | Kimco Realty Corp. | 4,287,900 | 77,354 |
| | M&T Bank Corp. | 881,999 | 76,778 |
| *,^ | American International Group Inc. | 1,284,810 | 74,031 |
| | Health Care REIT Inc. | 1,533,638 | 73,063 |
| | General Growth Properties Inc. | 4,475,397 | 69,279 |
| * | Genworth Financial Inc. Class A | 5,169,546 | 67,928 |
| | Macerich Co. | 1,376,562 | 65,208 |
| * | SLM Corp. | 5,130,489 | 64,593 |
| | Plum Creek Timber Co. Inc. | 1,709,680 | 64,028 |
| | Hudson City Bancorp Inc. | 5,007,369 | 63,794 |
| * | CB Richard Ellis Group Inc. Class A | 3,058,346 | 62,635 |
| | Huntington Bancshares Inc. | 9,111,385 | 62,595 |
| | Willis Group Holdings plc | 1,805,938 | 62,540 |
| | PartnerRe Ltd. | 759,802 | 61,050 |
| | Leucadia National Corp. | 2,052,551 | 59,893 |
| | Legg Mason Inc. | 1,636,370 | 59,351 |
| | AMB Property Corp. | 1,781,259 | 56,484 |
| | Moody's Corp. | 2,107,366 | 55,929 |
| | SL Green Realty Corp. | 827,431 | 55,860 |
| | People's United Financial Inc. | 3,975,458 | 55,696 |
| * | Affiliated Managers Group Inc. | 540,666 | 53,645 |
| | Cincinnati Financial Corp. | 1,630,148 | 51,659 |
| | Torchmark Corp. | 855,262 | 51,093 |
| | Federal Realty Investment Trust | 650,055 | 50,659 |
| | Everest Re Group Ltd. | 595,046 | 50,472 |
| | Nationwide Health Properties Inc. | 1,309,436 | 47,637 |
| ^ | Digital Realty Trust Inc. | 918,883 | 47,359 |
| * | MSCI Inc. Class A | 1,195,951 | 46,594 |
| | TD Ameritrade Holding Corp. | 2,438,358 | 46,304 |
| * | Arch Capital Group Ltd. | 525,600 | 46,279 |
| | UDR Inc. | 1,898,189 | 44,645 |
| | Rayonier Inc. | 849,083 | 44,594 |
| | Zions Bancorporation | 1,833,721 | 44,431 |
15
| | |
| Vanguard® Total Stock Market Index Fund | | |
| Schedule of Investments | | |
| December 31, 2010 | | |
| |
| | | Market |
| | | Value |
| | Shares | ($000) |
| Chimera Investment Corp. | 10,672,659 | 43,865 |
| Assurant Inc. | 1,126,962 | 43,411 |
| Axis Capital Holdings Ltd. | 1,205,561 | 43,256 |
| Realty Income Corp. | 1,235,548 | 42,256 |
| Alexandria Real Estate Equities Inc. | 572,912 | 41,972 |
| Reinsurance Group of America Inc. Class A | 778,636 | 41,821 |
| WR Berkley Corp. | 1,413,502 | 38,702 |
| Liberty Property Trust | 1,208,787 | 38,584 |
| Camden Property Trust | 707,374 | 38,184 |
| Jones Lang LaSalle Inc. | 450,854 | 37,836 |
| Eaton Vance Corp. | 1,250,784 | 37,811 |
| * Markel Corp. | 98,976 | 37,426 |
| * E*Trade Financial Corp. | 2,328,475 | 37,256 |
| RenaissanceRe Holdings Ltd. | 580,670 | 36,983 |
| Essex Property Trust Inc. | 322,250 | 36,807 |
| Marshall & Ilsley Corp. | 5,304,826 | 36,709 |
| Regency Centers Corp. | 866,527 | 36,602 |
| Old Republic International Corp. | 2,626,557 | 35,800 |
| HCC Insurance Holdings Inc. | 1,225,067 | 35,453 |
| Ares Capital Corp. | 2,143,363 | 35,323 |
| Cullen/Frost Bankers Inc. | 576,055 | 35,208 |
| Transatlantic Holdings Inc. | 674,908 | 34,839 |
| Raymond James Financial Inc. | 1,052,208 | 34,407 |
| * Popular Inc. | 10,793,771 | 33,892 |
| SEI Investments Co. | 1,402,855 | 33,374 |
| * NASDAQ OMX Group Inc. | 1,399,941 | 33,193 |
| Duke Realty Corp. | 2,659,458 | 33,137 |
| * First Horizon National Corp. | 2,774,510 | 32,684 |
| Senior Housing Properties Trust | 1,486,965 | 32,624 |
| Arthur J Gallagher & Co. | 1,110,469 | 32,292 |
| Waddell & Reed Financial Inc. Class A | 908,252 | 32,052 |
| Apartment Investment & Management Co. | 1,235,184 | 31,917 |
| Fidelity National Financial Inc. Class A | 2,324,130 | 31,794 |
| Developers Diversified Realty Corp. | 2,251,941 | 31,730 |
| Commerce Bancshares Inc. | 794,761 | 31,576 |
| Jefferies Group Inc. | 1,177,788 | 31,364 |
| First Niagara Financial Group Inc. | 2,213,031 | 30,938 |
| Brown & Brown Inc. | 1,286,928 | 30,809 |
| City National Corp. | 498,932 | 30,614 |
| Hospitality Properties Trust | 1,306,982 | 30,113 |
| BRE Properties Inc. | 681,722 | 29,655 |
| Taubman Centers Inc. | 582,948 | 29,427 |
| Assured Guaranty Ltd. | 1,655,031 | 29,294 |
| East West Bancorp Inc. | 1,483,495 | 29,002 |
| Weingarten Realty Investors | 1,207,294 | 28,685 |
| Mack-Cali Realty Corp. | 837,559 | 27,690 |
| White Mountains Insurance Group Ltd. | 82,456 | 27,672 |
| * American Capital Ltd. | 3,627,405 | 27,423 |
| Allied World Assurance Co. Holdings Ltd. | 450,293 | 26,765 |
| Associated Banc-Corp | 1,757,686 | 26,629 |
| American Financial Group Inc. | 807,228 | 26,065 |
| ^ Federated Investors Inc. Class B | 979,280 | 25,628 |
| BioMed Realty Trust Inc. | 1,373,725 | 25,620 |
| Janus Capital Group Inc. | 1,938,187 | 25,138 |
| MFA Financial Inc. | 2,992,424 | 24,418 |
| Highwoods Properties Inc. | 765,262 | 24,374 |
| Protective Life Corp. | 914,522 | 24,363 |
| Corporate Office Properties Trust | 696,020 | 24,326 |
| Bank of Hawaii Corp. | 513,564 | 24,245 |
| CBL & Associates Properties Inc. | 1,383,781 | 24,216 |
| * SVB Financial Group | 446,223 | 23,672 |
| National Retail Properties Inc. | 890,630 | 23,602 |
| Aspen Insurance Holdings Ltd. | 820,620 | 23,486 |
| Valley National Bancorp | 1,635,912 | 23,394 |
16
| | | |
| Vanguard® Total Stock Market Index Fund | | |
| Schedule of Investments | | |
| December 31, 2010 | | |
| |
| | | | Market |
| | | | Value |
| | | Shares | ($000) |
| | Endurance Specialty Holdings Ltd. | 499,423 | 23,008 |
| | Entertainment Properties Trust | 496,313 | 22,954 |
| | Apollo Investment Corp. | 2,071,948 | 22,936 |
| | FirstMerit Corp. | 1,153,916 | 22,836 |
| | StanCorp Financial Group Inc. | 504,141 | 22,757 |
| | Omega Healthcare Investors Inc. | 1,001,876 | 22,482 |
| | Hanover Insurance Group Inc. | 479,216 | 22,389 |
| | Tanger Factory Outlet Centers | 431,993 | 22,114 |
| | American Campus Communities Inc. | 693,242 | 22,017 |
| | Fulton Financial Corp. | 2,126,330 | 21,986 |
| | Alterra Capital Holdings Ltd. | 1,014,674 | 21,958 |
| | Greenhill & Co. Inc. | 267,818 | 21,875 |
| | Home Properties Inc. | 393,183 | 21,818 |
| * | Forest City Enterprises Inc. Class A | 1,305,449 | 21,788 |
| * | Signature Bank | 433,734 | 21,687 |
| *,^ | St. Joe Co. | 990,456 | 21,641 |
| | Mid-America Apartment Communities Inc. | 340,735 | 21,633 |
| | Erie Indemnity Co. Class A | 326,376 | 21,368 |
| * | Stifel Financial Corp. | 341,205 | 21,168 |
| | Synovus Financial Corp. | 7,882,075 | 20,809 |
| * | Alleghany Corp. | 67,568 | 20,701 |
| * | MBIA Inc. | 1,717,861 | 20,597 |
| | Washington Federal Inc. | 1,204,519 | 20,380 |
| | Kilroy Realty Corp. | 558,826 | 20,380 |
| | Washington Real Estate Investment Trust | 654,838 | 20,293 |
| | TCF Financial Corp. | 1,366,618 | 20,240 |
| | Piedmont Office Realty Trust Inc. Class A | 993,583 | 20,011 |
| * | ProAssurance Corp. | 327,883 | 19,870 |
| | Platinum Underwriters Holdings Ltd. | 441,054 | 19,834 |
| | Validus Holdings Ltd. | 646,432 | 19,787 |
| | LaSalle Hotel Properties | 746,334 | 19,703 |
| | CommonWealth REIT | 771,093 | 19,671 |
| * | MGIC Investment Corp. | 1,929,561 | 19,662 |
| | American Capital Agency Corp. | 681,103 | 19,575 |
| | CapitalSource Inc. | 2,756,439 | 19,571 |
| | DiamondRock Hospitality Co. | 1,630,319 | 19,564 |
| | Douglas Emmett Inc. | 1,176,036 | 19,522 |
| | Post Properties Inc. | 519,178 | 18,846 |
| | Prosperity Bancshares Inc. | 473,896 | 18,615 |
| | Equity Lifestyle Properties Inc. | 309,902 | 17,333 |
| | Westamerica Bancorporation | 312,340 | 17,325 |
| * | CNO Financial Group Inc. | 2,548,124 | 17,276 |
| | Iberiabank Corp. | 285,761 | 16,897 |
| ^ | Capitol Federal Financial Inc. | 1,384,560 | 16,490 |
| | Brandywine Realty Trust | 1,408,069 | 16,404 |
| | Trustmark Corp. | 649,532 | 16,134 |
| | Starwood Property Trust Inc. | 729,163 | 15,662 |
| | BOK Financial Corp. | 291,108 | 15,545 |
| | Webster Financial Corp. | 785,057 | 15,466 |
| | Extra Space Storage Inc. | 886,112 | 15,418 |
| * | Texas Capital Bancshares Inc. | 716,824 | 15,247 |
| | NewAlliance Bancshares Inc. | 1,014,723 | 15,201 |
| | Montpelier Re Holdings Ltd. | 759,197 | 15,138 |
| | Umpqua Holdings Corp. | 1,228,622 | 14,965 |
| | Delphi Financial Group Inc. | 518,197 | 14,945 |
| | First American Financial Corp. | 998,748 | 14,921 |
| | Hatteras Financial Corp. | 482,236 | 14,597 |
| | Whitney Holding Corp. | 1,014,150 | 14,350 |
| | UMB Financial Corp. | 345,480 | 14,310 |
| | Healthcare Realty Trust Inc. | 671,689 | 14,220 |
| * | Pinnacle Financial Partners Inc. | 1,041,932 | 14,149 |
| | Northwest Bancshares Inc. | 1,185,305 | 13,939 |
| | Potlatch Corp. | 427,234 | 13,906 |
| * | PHH Corp. | 594,885 | 13,772 |
17
| | | |
| Vanguard® Total Stock Market Index Fund | | |
| Schedule of Investments | | |
| December 31, 2010 | | |
| |
| | | | Market |
| | | | Value |
| | | Shares | ($000) |
| * | Portfolio Recovery Associates Inc. | 182,154 | 13,698 |
| | Susquehanna Bancshares Inc. | 1,390,139 | 13,457 |
| | Cathay General Bancorp | 799,571 | 13,353 |
| *,^ | iStar Financial Inc. | 1,705,709 | 13,339 |
| | DuPont Fabros Technology Inc. | 624,232 | 13,277 |
| * | Knight Capital Group Inc. Class A | 957,722 | 13,207 |
| * | Western Alliance Bancorp | 1,788,562 | 13,164 |
| | Unitrin Inc. | 534,410 | 13,114 |
| | Astoria Financial Corp. | 941,544 | 13,097 |
| * | Sunstone Hotel Investors Inc. | 1,262,954 | 13,046 |
| | Colonial Properties Trust | 717,563 | 12,952 |
| ^ | United Bankshares Inc. | 442,442 | 12,919 |
| | Medical Properties Trust Inc. | 1,189,344 | 12,881 |
| | BancorpSouth Inc. | 804,738 | 12,836 |
| * | Ezcorp Inc. Class A | 469,414 | 12,735 |
| * | Ashford Hospitality Trust Inc. | 1,316,543 | 12,705 |
| | Mercury General Corp. | 293,840 | 12,638 |
| * | MF Global Holdings Ltd. | 1,488,930 | 12,447 |
| | Argo Group International Holdings Ltd. | 331,950 | 12,432 |
| | EastGroup Properties Inc. | 289,230 | 12,240 |
| * | Strategic Hotels & Resorts Inc. | 2,289,294 | 12,110 |
| | FNB Corp. | 1,231,911 | 12,097 |
| | Wintrust Financial Corp. | 365,976 | 12,088 |
| | National Health Investors Inc. | 268,009 | 12,066 |
| | DCT Industrial Trust Inc. | 2,250,175 | 11,948 |
| | Old National Bancorp | 999,058 | 11,879 |
| | Symetra Financial Corp. | 866,870 | 11,876 |
| | Redwood Trust Inc. | 793,699 | 11,850 |
| | Cash America International Inc. | 318,034 | 11,745 |
| | PS Business Parks Inc. | 210,168 | 11,711 |
| | International Bancshares Corp. | 582,973 | 11,677 |
| | Glacier Bancorp Inc. | 770,057 | 11,636 |
| | Radian Group Inc. | 1,424,616 | 11,497 |
| | First Financial Bancorp | 621,166 | 11,479 |
| | Invesco Mortgage Capital Inc. | 517,998 | 11,313 |
| | Tower Group Inc. | 438,261 | 11,211 |
| | Lexington Realty Trust | 1,388,241 | 11,037 |
| | Hancock Holding Co. | 313,027 | 10,912 |
| | Sovran Self Storage Inc. | 295,782 | 10,888 |
| | Franklin Street Properties Corp. | 762,580 | 10,867 |
| | First Citizens BancShares Inc. Class A | 56,225 | 10,629 |
| | Community Bank System Inc. | 372,336 | 10,340 |
| * | PMI Group Inc. | 3,053,548 | 10,077 |
| | Selective Insurance Group Inc. | 545,063 | 9,893 |
| | Capstead Mortgage Corp. | 777,429 | 9,788 |
| | National Penn Bancshares Inc. | 1,196,868 | 9,611 |
| | RLI Corp. | 181,140 | 9,523 |
| | Getty Realty Corp. | 289,794 | 9,065 |
| | KBW Inc. | 324,336 | 9,055 |
| | Hersha Hospitality Trust Class A | 1,371,065 | 9,049 |
| | MB Financial Inc. | 522,425 | 9,048 |
| | Ramco-Gershenson Properties Trust | 723,343 | 9,006 |
| | Infinity Property & Casualty Corp. | 145,480 | 8,991 |
| | NBT Bancorp Inc. | 371,004 | 8,960 |
| | Cousins Properties Inc. | 1,060,742 | 8,847 |
| | Prospect Capital Corp. | 817,295 | 8,827 |
| | TFS Financial Corp. | 974,890 | 8,793 |
| * | Piper Jaffray Cos. | 248,165 | 8,688 |
| | First Midwest Bancorp Inc. | 750,881 | 8,650 |
| | Alexander's Inc. | 20,932 | 8,630 |
| | U-Store-It Trust | 904,433 | 8,619 |
| | Anworth Mortgage Asset Corp. | 1,224,286 | 8,570 |
| * | Nara Bancorp Inc. | 866,829 | 8,512 |
| | First Financial Bankshares Inc. | 164,430 | 8,416 |
18
| | |
| Vanguard® Total Stock Market Index Fund | | |
| Schedule of Investments | | |
| December 31, 2010 | | |
| |
| | | Market |
| | | Value |
| | Shares | ($000) |
| Columbia Banking System Inc. | 398,864 | 8,400 |
| Equity One Inc. | 461,167 | 8,384 |
| * First Cash Financial Services Inc. | 268,620 | 8,325 |
| LTC Properties Inc. | 294,339 | 8,265 |
| * World Acceptance Corp. | 155,374 | 8,204 |
| American National Insurance Co. | 95,392 | 8,167 |
| PrivateBancorp Inc. Class A | 567,774 | 8,165 |
| Employers Holdings Inc. | 461,499 | 8,067 |
| Investors Real Estate Trust | 891,322 | 7,995 |
| * FelCor Lodging Trust Inc. | 1,135,596 | 7,995 |
| * Dollar Financial Corp. | 274,972 | 7,872 |
| * Investment Technology Group Inc. | 479,895 | 7,856 |
| CVB Financial Corp. | 900,704 | 7,809 |
| Provident Financial Services Inc. | 512,184 | 7,749 |
| Park National Corp. | 105,548 | 7,670 |
| City Holding Co. | 208,581 | 7,557 |
| Interactive Brokers Group Inc. | 422,683 | 7,532 |
| S&T Bancorp Inc. | 327,037 | 7,388 |
| Acadia Realty Trust | 405,014 | 7,387 |
| PacWest Bancorp | 344,435 | 7,364 |
| * Greenlight Capital Re Ltd. Class A | 271,744 | 7,285 |
| Fifth Street Finance Corp. | 598,076 | 7,261 |
| Horace Mann Educators Corp. | 402,468 | 7,261 |
| BlackRock Kelso Capital Corp. | 654,912 | 7,243 |
| * Ocwen Financial Corp. | 758,301 | 7,234 |
| * Navigators Group Inc. | 142,726 | 7,186 |
| First Potomac Realty Trust | 426,462 | 7,173 |
| optionsXpress Holdings Inc. | 457,443 | 7,168 |
| * FBR Capital Markets Corp. | 1,871,666 | 7,150 |
| * Hilltop Holdings Inc. | 701,116 | 6,955 |
| Government Properties Income Trust | 259,605 | 6,955 |
| Solar Capital Ltd. | 275,700 | 6,832 |
| Nelnet Inc. Class A | 285,901 | 6,773 |
| * Altisource Portfolio Solutions SA | 235,002 | 6,747 |
| Pebblebrook Hotel Trust | 328,446 | 6,674 |
| Pennsylvania Real Estate Investment Trust | 457,924 | 6,654 |
| * Internet Capital Group Inc. | 463,342 | 6,589 |
| Inland Real Estate Corp. | 746,477 | 6,569 |
| Safety Insurance Group Inc. | 136,270 | 6,482 |
| Cypress Sharpridge Investments Inc. | 501,538 | 6,475 |
| Bank of the Ozarks Inc. | 147,284 | 6,385 |
| * National Financial Partners Corp. | 471,973 | 6,324 |
| Sterling Bancshares Inc. | 898,176 | 6,305 |
| First Commonwealth Financial Corp. | 866,769 | 6,137 |
| * Kindred Healthcare Inc. | 333,212 | 6,121 |
| Chemical Financial Corp. | 274,777 | 6,086 |
| MarketAxess Holdings Inc. | 290,603 | 6,047 |
| Primerica Inc. | 247,488 | 6,002 |
| MCG Capital Corp. | 857,507 | 5,977 |
| Glimcher Realty Trust | 711,196 | 5,974 |
| Saul Centers Inc. | 125,616 | 5,948 |
| Compass Diversified Holdings | 335,522 | 5,935 |
| * Forestar Group Inc. | 306,317 | 5,912 |
| American Equity Investment Life Holding Co. | 470,714 | 5,907 |
| Trustco Bank Corp. NY | 929,223 | 5,891 |
| Brookline Bancorp Inc. | 537,438 | 5,831 |
| Oritani Financial Corp. | 473,130 | 5,791 |
| * Investors Bancorp Inc. | 440,732 | 5,782 |
| Wilmington Trust Corp. | 1,331,296 | 5,778 |
| Harleysville Group Inc. | 151,197 | 5,555 |
| * Pico Holdings Inc. | 172,507 | 5,486 |
| Sun Communities Inc. | 164,310 | 5,473 |
| * Enstar Group Ltd. | 64,539 | 5,459 |
| * Credit Acceptance Corp. | 86,250 | 5,414 |
19
| | |
| Vanguard® Total Stock Market Index Fund | | |
| Schedule of Investments | | |
| December 31, 2010 | | |
| |
| | | Market |
| | | Value |
| | Shares | ($000) |
| * Safeguard Scientifics Inc. | 312,864 | 5,344 |
| Hercules Technology Growth Capital Inc. | 512,501 | 5,309 |
| Meadowbrook Insurance Group Inc. | 504,623 | 5,172 |
| * CNA Surety Corp. | 218,166 | 5,166 |
| BGC Partners Inc. Class A | 617,177 | 5,129 |
| Associated Estates Realty Corp. | 333,546 | 5,100 |
| Oriental Financial Group Inc. | 406,416 | 5,076 |
| Flagstone Reinsurance Holdings SA | 400,770 | 5,050 |
| Dime Community Bancshares Inc. | 345,133 | 5,035 |
| Evercore Partners Inc. Class A | 146,160 | 4,969 |
| * LPL Investment Holdings Inc. | 129,685 | 4,717 |
| Boston Private Financial Holdings Inc. | 716,844 | 4,695 |
| * AMERISAFE Inc. | 264,523 | 4,629 |
| TICC Capital Corp. | 411,390 | 4,612 |
| Home Bancshares Inc. | 208,050 | 4,583 |
| Resource Capital Corp. | 620,721 | 4,581 |
| Flushing Financial Corp. | 325,917 | 4,563 |
| * Newcastle Investment Corp. | 679,970 | 4,556 |
| SCBT Financial Corp. | 135,267 | 4,430 |
| ^ Life Partners Holdings Inc. | 231,534 | 4,429 |
| * Hanmi Financial Corp. | 3,822,786 | 4,396 |
| * United Community Banks Inc. | 2,223,070 | 4,335 |
| Independent Bank Corp. | 158,430 | 4,286 |
| PennantPark Investment Corp. | 347,901 | 4,258 |
| Provident New York Bancorp | 405,279 | 4,251 |
| * Citizens Inc. | 566,509 | 4,220 |
| Duff & Phelps Corp. Class A | 248,857 | 4,196 |
| Amtrust Financial Services Inc. | 234,638 | 4,106 |
| United Fire & Casualty Co. | 182,858 | 4,081 |
| WesBanco Inc. | 214,559 | 4,068 |
| * Financial Engines Inc. | 202,953 | 4,025 |
| * FPIC Insurance Group Inc. | 107,562 | 3,975 |
| Community Trust Bancorp Inc. | 135,460 | 3,923 |
| Universal Health Realty Income Trust | 106,490 | 3,890 |
| Retail Opportunity Investments Corp. | 390,712 | 3,872 |
| Cohen & Steers Inc. | 148,196 | 3,868 |
| GAMCO Investors Inc. | 80,498 | 3,865 |
| * MPG Office Trust Inc. | 1,398,047 | 3,845 |
| FBL Financial Group Inc. Class A | 132,494 | 3,799 |
| * First Industrial Realty Trust Inc. | 433,065 | 3,794 |
| National Western Life Insurance Co. Class A | 22,510 | 3,753 |
| Artio Global Investors Inc. Class A | 254,234 | 3,750 |
| Simmons First National Corp. Class A | 129,864 | 3,701 |
| ViewPoint Financial Group | 307,520 | 3,595 |
| * Eagle Bancorp Inc. | 248,297 | 3,583 |
| 1st Source Corp. | 174,972 | 3,541 |
| First Financial Corp. | 100,169 | 3,520 |
| Walter Investment Management Corp. | 194,978 | 3,498 |
| * TradeStation Group Inc. | 517,531 | 3,493 |
| Advance America Cash Advance Centers Inc. | 611,314 | 3,448 |
| * Ameris Bancorp | 323,290 | 3,407 |
| Washington Trust Bancorp Inc. | 155,532 | 3,403 |
| * Beneficial Mutual Bancorp Inc. | 384,579 | 3,396 |
| * Tejon Ranch Co. | 122,758 | 3,382 |
| ^ TowneBank | 206,776 | 3,286 |
| * eHealth Inc. | 231,332 | 3,283 |
| Education Realty Trust Inc. | 422,083 | 3,280 |
| Sterling Bancorp | 312,874 | 3,276 |
| Cardinal Financial Corp. | 281,331 | 3,272 |
| GFI Group Inc. | 695,920 | 3,264 |
| * Virtus Investment Partners Inc. | 71,536 | 3,246 |
| Sandy Spring Bancorp Inc. | 175,727 | 3,239 |
| Arrow Financial Corp. | 117,378 | 3,229 |
| Wilshire Bancorp Inc. | 420,248 | 3,202 |
20
| | | |
| Vanguard® Total Stock Market Index Fund | | |
| Schedule of Investments | | |
| December 31, 2010 | | |
| |
| | | | Market |
| | | | Value |
| | | Shares | ($000) |
| | Southwest Bancorp Inc. | 258,155 | 3,201 |
| | Danvers Bancorp Inc. | 177,875 | 3,143 |
| | NorthStar Realty Finance Corp. | 651,399 | 3,094 |
| | SY Bancorp Inc. | 125,486 | 3,081 |
| | ESSA Bancorp Inc. | 228,516 | 3,021 |
| | OneBeacon Insurance Group Ltd. Class A | 198,638 | 3,011 |
| | Union First Market Bankshares Corp. | 203,589 | 3,009 |
| * | Tree.com Inc. | 318,563 | 3,007 |
| | Maiden Holdings Ltd. | 382,138 | 3,004 |
| | Federal Agricultural Mortgage Corp. | 183,443 | 2,994 |
| | WSFS Financial Corp. | 62,751 | 2,977 |
| | MVC Capital Inc. | 203,610 | 2,973 |
| | StellarOne Corp. | 204,284 | 2,970 |
| | CapLease Inc. | 509,860 | 2,967 |
| | Great Southern Bancorp Inc. | 125,081 | 2,951 |
| | Calamos Asset Management Inc. Class A | 210,741 | 2,950 |
| | Parkway Properties Inc. | 167,966 | 2,943 |
| * | Phoenix Cos. Inc. | 1,154,119 | 2,931 |
| | Renasant Corp. | 172,660 | 2,920 |
| | OceanFirst Financial Corp. | 226,460 | 2,915 |
| | Urstadt Biddle Properties Inc. Class A | 149,268 | 2,903 |
| | Camden National Corp. | 79,681 | 2,887 |
| | Agree Realty Corp. | 109,810 | 2,876 |
| | State Auto Financial Corp. | 165,061 | 2,875 |
| * | International Assets Holding Corp. | 121,563 | 2,869 |
| | CBOE Holdings Inc. | 125,137 | 2,861 |
| | Westfield Financial Inc. | 306,241 | 2,833 |
| | Abington Bancorp Inc. | 237,373 | 2,832 |
| | Republic Bancorp Inc. Class A | 119,187 | 2,831 |
| * | Global Indemnity plc | 137,748 | 2,817 |
| * | Bancorp Inc. | 274,646 | 2,793 |
| | Suffolk Bancorp | 112,513 | 2,777 |
| | Cedar Shopping Centers Inc. | 439,376 | 2,764 |
| * | LaBranche & Co. Inc. | 763,327 | 2,748 |
| | Bank Mutual Corp. | 571,330 | 2,731 |
| * | Gleacher & Co. Inc. | 1,118,575 | 2,651 |
| | Lakeland Financial Corp. | 121,162 | 2,600 |
| | Tompkins Financial Corp. | 66,073 | 2,587 |
| | SeaBright Holdings Inc. | 279,283 | 2,575 |
| | Two Harbors Investment Corp. | 260,507 | 2,550 |
| | Lakeland Bancorp Inc. | 231,056 | 2,535 |
| | First Mercury Financial Corp. | 153,369 | 2,515 |
| | Territorial Bancorp Inc. | 123,105 | 2,451 |
| * | Citizens Republic Bancorp Inc. | 3,923,771 | 2,413 |
| | Trico Bancshares | 148,702 | 2,402 |
| | One Liberty Properties Inc. | 143,269 | 2,393 |
| | National Bankshares Inc. | 75,898 | 2,390 |
| | Capital Southwest Corp. | 22,916 | 2,379 |
| | First Bancorp | 155,351 | 2,378 |
| | Southside Bancshares Inc. | 112,820 | 2,377 |
| * | Encore Capital Group Inc. | 100,015 | 2,345 |
| * | Primus Guaranty Ltd. | 460,714 | 2,340 |
| | Mission West Properties Inc. | 346,917 | 2,321 |
| | Northfield Bancorp Inc. | 173,703 | 2,314 |
| | Student Loan Corp. | 71,084 | 2,306 |
| | Consolidated-Tomoka Land Co. | 78,805 | 2,277 |
| | Kite Realty Group Trust | 416,557 | 2,254 |
| | Donegal Group Inc. Class A | 155,039 | 2,245 |
| *,^ | Taylor Capital Group Inc. | 169,766 | 2,232 |
| | Colony Financial Inc. | 111,342 | 2,229 |
| * | First Marblehead Corp. | 1,024,591 | 2,223 |
| | Winthrop Realty Trust | 171,536 | 2,194 |
| | First Merchants Corp. | 246,231 | 2,182 |
| * | Virginia Commerce Bancorp Inc. | 352,230 | 2,177 |
21
| | | |
| Vanguard® Total Stock Market Index Fund | | |
| Schedule of Investments | | |
| December 31, 2010 | | |
| |
| | | | Market |
| | | | Value |
| | | Shares | ($000) |
| | Bancfirst Corp. | 52,763 | 2,173 |
| | First of Long Island Corp. | 74,558 | 2,155 |
| | Univest Corp. of Pennsylvania | 112,133 | 2,150 |
| | Chesapeake Lodging Trust | 113,981 | 2,144 |
| | Mercer Insurance Group Inc. | 76,546 | 2,143 |
| * | RAIT Financial Trust | 977,927 | 2,142 |
| | Medallion Financial Corp. | 256,133 | 2,100 |
| | MainSource Financial Group Inc. | 201,259 | 2,095 |
| * | Seacoast Banking Corp. of Florida | 1,431,759 | 2,090 |
| * | Flagstar Bancorp Inc. | 1,282,122 | 2,090 |
| | Cogdell Spencer Inc. | 357,782 | 2,075 |
| | Diamond Hill Investment Group Inc. | 28,644 | 2,072 |
| | West Bancorporation Inc. | 264,693 | 2,062 |
| | Berkshire Hills Bancorp Inc. | 93,022 | 2,056 |
| * | Center Financial Corp. | 268,350 | 2,034 |
| | Hudson Valley Holding Corp. | 80,895 | 2,003 |
| | Baldwin & Lyons Inc. | 84,992 | 2,000 |
| | Gladstone Capital Corp. | 173,361 | 1,997 |
| | National Interstate Corp. | 90,476 | 1,936 |
| * | NewStar Financial Inc. | 181,425 | 1,918 |
| | Pennymac Mortgage Investment Trust | 105,048 | 1,907 |
| | Monmouth Real Estate Investment Corp. Class A | 222,826 | 1,894 |
| ^ | Kohlberg Capital Corp. | 270,549 | 1,886 |
| | Bryn Mawr Bank Corp. | 107,921 | 1,883 |
| * | Metro Bancorp Inc. | 170,489 | 1,877 |
| | Presidential Life Corp. | 187,852 | 1,865 |
| | Westwood Holdings Group Inc. | 46,631 | 1,863 |
| | Oppenheimer Holdings Inc. Class A | 70,989 | 1,861 |
| * | Harris & Harris Group Inc. | 424,111 | 1,858 |
| ^ | German American Bancorp Inc. | 99,792 | 1,838 |
| | Peoples Bancorp Inc. | 117,282 | 1,835 |
| | Sanders Morris Harris Group Inc. | 252,248 | 1,829 |
| * | HFF Inc. Class A | 185,760 | 1,794 |
| * | Arbor Realty Trust Inc. | 296,498 | 1,767 |
| | BankFinancial Corp. | 181,200 | 1,767 |
| | Gladstone Commercial Corp. | 93,285 | 1,757 |
| | First Busey Corp. | 370,595 | 1,742 |
| | Orrstown Financial Services Inc. | 62,717 | 1,719 |
| | Merchants Bancshares Inc. | 60,951 | 1,680 |
| | EMC Insurance Group Inc. | 72,761 | 1,647 |
| | NGP Capital Resources Co. | 176,578 | 1,625 |
| | Heartland Financial USA Inc. | 92,975 | 1,623 |
| * | Meridian Interstate Bancorp Inc. | 137,476 | 1,621 |
| | SWS Group Inc. | 318,400 | 1,608 |
| | Stewart Information Services Corp. | 138,520 | 1,597 |
| | Apollo Commercial Real Estate Finance Inc. | 97,497 | 1,594 |
| *,^ | BankAtlantic Bancorp Inc. Class A | 1,378,004 | 1,585 |
| | US Global Investors Inc. Class A | 193,434 | 1,573 |
| * | West Coast Bancorp | 555,448 | 1,566 |
| | Ames National Corp. | 71,756 | 1,555 |
| | Penns Woods Bancorp Inc. | 38,938 | 1,550 |
| | Main Street Capital Corp. | 84,529 | 1,538 |
| | First Community Bancshares Inc. | 102,856 | 1,537 |
| | Triangle Capital Corp. | 80,493 | 1,529 |
| | Capital City Bank Group Inc. | 119,238 | 1,502 |
| | First Bancorp Inc. | 94,736 | 1,496 |
| | United Financial Bancorp Inc. | 97,015 | 1,481 |
| * | Guaranty Bancorp | 1,017,076 | 1,434 |
| | Financial Institutions Inc. | 75,535 | 1,433 |
| * | Sun Bancorp Inc. | 304,525 | 1,413 |
| | Bancorp Rhode Island Inc. | 48,492 | 1,411 |
| | First Financial Holdings Inc. | 121,661 | 1,400 |
| ^ | CompuCredit Holdings Corp. | 199,933 | 1,396 |
| * | Penson Worldwide Inc. | 278,463 | 1,362 |
22
| | | |
| Vanguard® Total Stock Market Index Fund | | |
| Schedule of Investments | | |
| December 31, 2010 | | |
| |
| | | | Market |
| | | | Value |
| | | Shares | ($000) |
| | Center Bancorp Inc. | 164,991 | 1,338 |
| * | Thomas Properties Group Inc. | 313,154 | 1,321 |
| | American National Bankshares Inc. | 54,738 | 1,289 |
| * | Fox Chase Bancorp Inc. | 108,506 | 1,286 |
| * | Ladenburg Thalmann Financial Services Inc. | 1,054,302 | 1,234 |
| | Gladstone Investment Corp. | 160,589 | 1,228 |
| | ESB Financial Corp. | 75,364 | 1,224 |
| * | Marlin Business Services Corp. | 93,245 | 1,180 |
| * | American Safety Insurance Holdings Ltd. | 55,077 | 1,178 |
| | Hudson Pacific Properties Inc. | 77,585 | 1,168 |
| | Banner Corp. | 493,319 | 1,144 |
| * | BRT Realty Trust | 155,302 | 1,117 |
| | Centerstate Banks Inc. | 140,787 | 1,115 |
| | Rome Bancorp Inc. | 87,865 | 1,056 |
| | Eastern Insurance Holdings Inc. | 86,042 | 1,025 |
| | Arlington Asset Investment Corp. Class A | 42,216 | 1,013 |
| * | Kennedy-Wilson Holdings Inc. | 101,032 | 1,009 |
| | Resource America Inc. Class A | 145,651 | 998 |
| * | Maui Land & Pineapple Co. Inc. | 197,804 | 985 |
| | Asta Funding Inc. | 121,223 | 982 |
| | Kansas City Life Insurance Co. | 29,619 | 978 |
| *,^ | Macatawa Bank Corp. | 233,210 | 961 |
| | Home Federal Bancorp Inc. | 77,515 | 951 |
| | CoBiz Financial Inc. | 155,405 | 945 |
| | Peapack Gladstone Financial Corp. | 72,003 | 940 |
| | State Bancorp Inc. | 99,414 | 920 |
| | Epoch Holding Corp. | 58,832 | 914 |
| | Washington Banking Co. | 65,948 | 904 |
| | First Interstate Bancsystem Inc. | 58,590 | 893 |
| * | Heritage Financial Corp. | 63,776 | 888 |
| *,^ | Pacific Mercantile Bancorp | 238,218 | 884 |
| ^ | Mercantile Bank Corp. | 106,928 | 867 |
| | TF Financial Corp. | 38,607 | 862 |
| | Indiana Community Bancorp | 50,871 | 862 |
| * | Cowen Group Inc. Class A | 184,036 | 858 |
| | Citizens & Northern Corp. | 56,770 | 844 |
| | UMH Properties Inc. | 82,174 | 838 |
| | Century Bancorp Inc. Class A | 30,764 | 824 |
| | THL Credit Inc. | 62,183 | 809 |
| | Shore Bancshares Inc. | 75,769 | 799 |
| | Alliance Financial Corp. | 23,512 | 761 |
| * | Asset Acceptance Capital Corp. | 127,569 | 756 |
| | Comm Bancorp Inc. | 17,113 | 754 |
| | Kaiser Federal Financial Group Inc. | 64,777 | 750 |
| | Bank of Marin Bancorp | 21,388 | 749 |
| | PMC Commercial Trust | 87,413 | 741 |
| * | Republic First Bancorp Inc. | 303,377 | 737 |
| | Enterprise Financial Services Corp. | 70,293 | 735 |
| | Horizon Bancorp | 26,874 | 719 |
| | Norwood Financial Corp. | 25,756 | 715 |
| * | NewBridge Bancorp | 150,661 | 702 |
| | Bridge Bancorp Inc. | 27,866 | 687 |
| * | Crawford & Co. Class B | 201,129 | 684 |
| * | Cape Bancorp Inc. | 79,328 | 674 |
| | Dynex Capital Inc. | 60,634 | 662 |
| * | First Acceptance Corp. | 367,126 | 653 |
| | Pacific Continental Corp. | 64,372 | 648 |
| | Alliance Bancorp Inc. of Pennsylvania | 70,053 | 636 |
| | United Security Bancshares | 56,459 | 631 |
| | First Financial Northwest Inc. | 157,098 | 630 |
| *,^ | Central Pacific Financial Corp. | 410,655 | 628 |
| | Urstadt Biddle Properties Inc. | 37,652 | 625 |
| | First South Bancorp Inc. | 96,445 | 624 |
| * | Grubb & Ellis Co. | 489,090 | 621 |
23
| | | |
| Vanguard® Total Stock Market Index Fund | | |
| Schedule of Investments | | |
| December 31, 2010 | | |
| |
| | | | Market |
| | | | Value |
| | | Shares | ($000) |
| | Sierra Bancorp | 56,574 | 607 |
| | ECB Bancorp Inc. | 44,979 | 606 |
| | Rockville Financial Inc. | 49,126 | 600 |
| * | Hallmark Financial Services | 65,122 | 593 |
| | Excel Trust Inc. | 48,484 | 587 |
| * | 1st United Bancorp Inc. | 84,871 | 586 |
| *,^ | First BanCorp | 1,274,256 | 586 |
| | CFS Bancorp Inc. | 110,786 | 579 |
| | Cheviot Financial Corp. | 63,085 | 561 |
| * | Avatar Holdings Inc. | 28,277 | 560 |
| * | Waterstone Financial Inc. | 168,127 | 546 |
| *,^ | BancTrust Financial Group Inc. | 204,604 | 546 |
| | Provident Financial Holdings Inc. | 74,909 | 542 |
| * | Intervest Bancshares Corp. Class A | 182,810 | 537 |
| | CreXus Investment Corp. | 40,820 | 535 |
| * | Gramercy Capital Corp. | 227,370 | 525 |
| * | Stratus Properties Inc. | 57,847 | 525 |
| *,^ | Cascade Bancorp | 61,545 | 520 |
| | Federal Agricultural Mortgage Corp. Class A | 38,986 | 513 |
| *,^ | Green Bankshares Inc. | 159,807 | 511 |
| | Codorus Valley Bancorp Inc. | 53,978 | 511 |
| * | Heritage Commerce Corp. | 109,781 | 493 |
| | Eastern Virginia Bankshares Inc. | 126,332 | 487 |
| | Cohen & Co. Inc. | 109,238 | 474 |
| | Firstbank Corp. | 80,504 | 472 |
| | Pulaski Financial Corp. | 61,804 | 468 |
| | Middleburg Financial Corp. | 31,462 | 450 |
| | Universal Insurance Holdings Inc. | 90,682 | 442 |
| * | AmeriServ Financial Inc. | 275,908 | 436 |
| | Roma Financial Corp. | 41,112 | 436 |
| | MutualFirst Financial Inc. | 46,295 | 431 |
| * | First Defiance Financial Corp. | 36,169 | 430 |
| | Meta Financial Group Inc. | 30,814 | 422 |
| | JMP Group Inc. | 54,896 | 419 |
| ^ | First Pactrust Bancorp Inc. | 30,534 | 405 |
| | Commercial National Financial Corp. | 21,484 | 399 |
| | Citizens South Banking Corp. | 91,570 | 394 |
| | Hingham Institution for Savings | 8,966 | 391 |
| | Ohio Valley Banc Corp. | 20,002 | 390 |
| | First United Corp. | 111,713 | 383 |
| | LNB Bancorp Inc. | 77,935 | 380 |
| | CNB Financial Corp. | 25,231 | 374 |
| | Parkvale Financial Corp. | 40,091 | 364 |
| ^ | Bar Harbor Bankshares | 12,448 | 363 |
| *,^ | Sterling Financial Corp. | 18,760 | 356 |
| | Investors Title Co. | 11,410 | 355 |
| * | First Place Financial Corp. | 134,971 | 352 |
| | Independence Holding Co. | 42,852 | 345 |
| | New Hampshire Thrift Bancshares Inc. | 24,649 | 309 |
| * | Unity Bancorp Inc. | 48,676 | 304 |
| | HopFed Bancorp Inc. | 32,661 | 293 |
| * | Terreno Realty Corp. | 15,835 | 284 |
| * | Doral Financial Corp. | 201,702 | 278 |
| ^ | Old Second Bancorp Inc. | 166,779 | 269 |
| | Ameriana Bancorp | 68,086 | 263 |
| | Hawthorn Bancshares Inc. | 29,943 | 257 |
| * | Home Bancorp Inc. | 18,581 | 257 |
| * | United Community Financial Corp. | 198,152 | 256 |
| | C&F Financial Corp. | 10,410 | 236 |
| * | Encore Bancshares Inc. | 23,000 | 236 |
| | QC Holdings Inc. | 61,199 | 229 |
| * | Cadence Financial Corp. | 92,632 | 228 |
| | VIST Financial Corp. | 31,796 | 228 |
| | Wayne Savings Bancshares Inc. | 24,050 | 216 |
24
| | | |
| Vanguard® Total Stock Market Index Fund | | |
| Schedule of Investments | | |
| December 31, 2010 | | |
| |
| | | | Market |
| | | | Value |
| | | Shares | ($000) |
| *,^ | Anchor Bancorp Wisconsin Inc. | 178,580 | 214 |
| | Legacy Bancorp Inc. | 16,238 | 213 |
| * | ZipRealty Inc. | 81,054 | 211 |
| * | Preferred Bank | 119,653 | 211 |
| | Capital Bank Corp. | 83,181 | 207 |
| | Tower Bancorp Inc. | 9,373 | 207 |
| | Peoples Financial Corp. | 13,467 | 202 |
| * | Yadkin Valley Financial Corp. | 111,047 | 201 |
| * | American Independence Corp. | 41,127 | 199 |
| *,^ | Capital Trust Inc. Class A | 127,823 | 198 |
| *,^ | Premierwest Bancorp | 581,721 | 195 |
| | Farmers Capital Bank Corp. | 39,550 | 193 |
| * | MBT Financial Corp. | 105,290 | 187 |
| | Old Point Financial Corp. | 15,350 | 186 |
| | First M&F Corp. | 48,598 | 179 |
| * | Consumer Portfolio Services Inc. | 150,448 | 179 |
| *,^ | Integra Bank Corp. | 241,129 | 174 |
| | Porter Bancorp Inc. | 16,831 | 174 |
| * | Jefferson Bancshares Inc. | 53,095 | 172 |
| * | BCSB Bancorp Inc. | 14,689 | 165 |
| | Midsouth Bancorp Inc. | 10,078 | 155 |
| *,^ | Hampton Roads Bankshares Inc. | 297,411 | 155 |
| | Citizens Holding Co. | 7,250 | 153 |
| *,^ | United Security Bancshares | 39,385 | 148 |
| | Golub Capital BDC Inc. | 8,634 | 148 |
| * | HMN Financial Inc. | 48,991 | 138 |
| | Chatham Lodging Trust | 7,535 | 130 |
| * | Colony Bankcorp Inc. | 32,093 | 130 |
| * | WSB Holdings Inc. | 54,365 | 126 |
| * | North Valley Bancorp | 14,600 | 122 |
| * | Camco Financial Corp. | 81,365 | 119 |
| * | Vestin Realty Mortgage II Inc. | 74,073 | 107 |
| *,^ | Superior Bancorp | 186,854 | 107 |
| * | Southern Community Financial Corp. | 90,201 | 99 |
| * | Crawford & Co. Class A | 39,173 | 95 |
| * | United Western Bancorp Inc. | 315,394 | 91 |
| * | Royal Bancshares of Pennsylvania Inc. | 64,104 | 87 |
| * | Rodman & Renshaw Capital Group Inc. | 30,710 | 82 |
| *,^ | Capitol Bancorp Ltd. | 140,497 | 73 |
| * | Bank of Granite Corp. | 135,374 | 71 |
| * | Transcontinental Realty Investors Inc. | 10,488 | 70 |
| * | Atlantic Coast Federal Corp. | 35,849 | 61 |
| ^ | Auburn National Bancorporation Inc. | 2,872 | 58 |
| * | First Security Group Inc. | 57,626 | 52 |
| | HF Financial Corp. | 4,851 | 52 |
| | California First National Bancorp | 3,617 | 52 |
| | Oneida Financial Corp. | 5,232 | 41 |
| | Prudential Bancorp Inc. of Pennsylvania | 6,528 | 39 |
| | Landmark Bancorp Inc. | 2,271 | 39 |
| * | Nicholas Financial Inc. | 3,793 | 38 |
| * | Firstcity Financial Corp. | 4,455 | 36 |
| * | Independent Bank Corp. | 27,468 | 36 |
| * | Community Capital Corp. | 13,074 | 34 |
| | Northeast Bancorp | 2,088 | 32 |
| | United Bancshares Inc. | 2,815 | 27 |
| | National Security Group Inc. | 1,748 | 21 |
| | Community Bankers Trust Corp. | 19,449 | 20 |
| * | Valley National Bancorp Warrants Exp. 06/30/2015 | 6,511 | 18 |
| | Wilber Corp. | 1,734 | 18 |
| * | Summit Financial Group Inc. | 4,007 | 15 |
| | Bank of Kentucky Financial Corp. | 763 | 15 |
| * | TIB Financial Corp. Rights Exp. 01/10/2011 | 1,032,930 | 13 |
| | 21st Century Holding Co. | 3,118 | 10 |
| | SI Financial Group Inc. | 1,087 | 10 |
25
| | |
| Vanguard® Total Stock Market Index Fund | | |
| Schedule of Investments | | |
| December 31, 2010 | | |
| |
| | | Market |
| | | Value |
| | Shares | ($000) |
| Northrim BanCorp Inc. | 453 | 9 |
| GAINSCO Inc. | 711 | 6 |
| Monroe Bancorp | 358 | 5 |
| * Salisbury Bancorp Inc. | 189 | 5 |
| * Severn Bancorp Inc. | 1,059 | 4 |
| Brooklyn Federal Bancorp Inc. | 2,576 | 3 |
| * Union Bankshares Inc. | 175 | 3 |
| * Tower Financial Corp. | 376 | 3 |
| WVS Financial Corp. | 189 | 2 |
| * Mid Penn Bancorp Inc. | 176 | 1 |
| Community Bank Shares of Indiana Inc. | 78 | 1 |
| * 1st Constitution Bancorp | 70 | 1 |
| * First Citizens Banc Corp. | 146 | 1 |
| Peoples Bancorp of North Carolina Inc. | 100 | 1 |
| * Bridge Capital Holdings | 51 | — |
| Timberland Bancorp Inc. | 100 | — |
| | | 24,473,609 |
| Health Care (11.1%) | | |
| Johnson & Johnson | 29,056,092 | 1,797,119 |
| Pfizer Inc. | 84,795,299 | 1,484,766 |
| Merck & Co. Inc. | 32,422,657 | 1,168,513 |
| Abbott Laboratories | 16,280,003 | 779,975 |
| * Amgen Inc. | 10,108,959 | 554,982 |
| Bristol-Myers Squibb Co. | 18,083,519 | 478,852 |
| UnitedHealth Group Inc. | 11,856,139 | 428,125 |
| Medtronic Inc. | 11,420,624 | 423,591 |
| Eli Lilly & Co. | 10,944,207 | 383,485 |
| * Gilead Sciences Inc. | 8,849,718 | 320,714 |
| Baxter International Inc. | 6,166,983 | 312,173 |
| * Express Scripts Inc. | 5,438,023 | 293,925 |
| * Celgene Corp. | 4,960,331 | 293,354 |
| * Medco Health Solutions Inc. | 4,575,544 | 280,344 |
| Covidien plc | 5,292,097 | 241,637 |
| * WellPoint Inc. | 4,217,696 | 239,818 |
| * Thermo Fisher Scientific Inc. | 4,298,798 | 237,981 |
| Allergan Inc. | 3,245,350 | 222,858 |
| Becton Dickinson and Co. | 2,449,416 | 207,025 |
| McKesson Corp. | 2,758,691 | 194,157 |
| * Genzyme Corp. | 2,688,964 | 191,454 |
| * Biogen Idec Inc. | 2,550,814 | 171,032 |
| Stryker Corp. | 3,139,316 | 168,581 |
| * Agilent Technologies Inc. | 3,670,254 | 152,059 |
| * St. Jude Medical Inc. | 3,555,759 | 152,009 |
| Cardinal Health Inc. | 3,702,476 | 141,842 |
| Aetna Inc. | 4,407,480 | 134,472 |
| * Boston Scientific Corp. | 16,020,185 | 121,273 |
| * Zimmer Holdings Inc. | 2,122,205 | 113,920 |
| * Life Technologies Corp. | 1,935,970 | 107,446 |
| CIGNA Corp. | 2,921,703 | 107,110 |
| * Intuitive Surgical Inc. | 414,976 | 106,960 |
| AmerisourceBergen Corp. Class A | 2,948,312 | 100,596 |
| * Hospira Inc. | 1,766,968 | 98,402 |
| * Humana Inc. | 1,789,570 | 97,961 |
| * Edwards Lifesciences Corp. | 1,197,158 | 96,778 |
| * Forest Laboratories Inc. | 3,019,258 | 96,556 |
| * Laboratory Corp. of America Holdings | 1,087,082 | 95,576 |
| CR Bard Inc. | 990,192 | 90,870 |
| * Varian Medical Systems Inc. | 1,286,100 | 89,101 |
| Quest Diagnostics Inc. | 1,590,847 | 85,858 |
| * Illumina Inc. | 1,311,368 | 83,062 |
| * Alexion Pharmaceuticals Inc. | 952,172 | 76,697 |
| * Waters Corp. | 973,511 | 75,652 |
| * DaVita Inc. | 1,085,299 | 75,417 |
| * Vertex Pharmaceuticals Inc. | 2,138,681 | 74,918 |
26
| | |
| Vanguard® Total Stock Market Index Fund | | |
| Schedule of Investments | | |
| December 31, 2010 | | |
| |
| | | Market |
| | | Value |
| | Shares | ($000) |
| * Watson Pharmaceuticals Inc. | 1,399,868 | 72,303 |
| * Cerner Corp. | 741,644 | 70,263 |
| * Mylan Inc. | 3,267,631 | 69,045 |
| * CareFusion Corp. | 2,349,314 | 60,377 |
| * Henry Schein Inc. | 965,236 | 59,256 |
| * ResMed Inc. | 1,596,402 | 55,299 |
| Perrigo Co. | 873,025 | 55,289 |
| Beckman Coulter Inc. | 731,790 | 55,053 |
| * Mettler-Toledo International Inc. | 358,671 | 54,235 |
| * Dendreon Corp. | 1,523,408 | 53,197 |
| * Hologic Inc. | 2,743,315 | 51,629 |
| DENTSPLY International Inc. | 1,435,710 | 49,058 |
| * Cephalon Inc. | 793,300 | 48,962 |
| * Human Genome Sciences Inc. | 1,985,054 | 47,423 |
| * Endo Pharmaceuticals Holdings Inc. | 1,221,073 | 43,604 |
| * IDEXX Laboratories Inc. | 614,198 | 42,515 |
| * Coventry Health Care Inc. | 1,569,833 | 41,444 |
| Universal Health Services Inc. Class B | 951,081 | 41,296 |
| * Community Health Systems Inc. | 996,017 | 37,221 |
| * King Pharmaceuticals Inc. | 2,641,333 | 37,111 |
| * Allscripts Healthcare Solutions Inc. | 1,881,902 | 36,264 |
| * United Therapeutics Corp. | 568,671 | 35,951 |
| * Covance Inc. | 685,170 | 35,225 |
| * Tenet Healthcare Corp. | 5,137,714 | 34,371 |
| * Mednax Inc. | 505,151 | 33,992 |
| Pharmaceutical Product Development Inc. | 1,201,448 | 32,607 |
| PerkinElmer Inc. | 1,244,203 | 32,125 |
| Omnicare Inc. | 1,251,615 | 31,778 |
| * Alere Inc. | 850,535 | 31,130 |
| * Gen-Probe Inc. | 520,179 | 30,352 |
| Patterson Cos. Inc. | 985,365 | 30,182 |
| * BioMarin Pharmaceutical Inc. | 1,085,244 | 29,226 |
| * Kinetic Concepts Inc. | 689,226 | 28,865 |
| * Salix Pharmaceuticals Ltd. | 612,162 | 28,747 |
| * Health Net Inc. | 1,032,225 | 28,169 |
| Lincare Holdings Inc. | 1,039,777 | 27,897 |
| Cooper Cos. Inc. | 491,648 | 27,699 |
| Warner Chilcott plc Class A | 1,197,688 | 27,020 |
| Hill-Rom Holdings Inc. | 675,806 | 26,606 |
| * Health Management Associates Inc. Class A | 2,675,274 | 25,522 |
| * Charles River Laboratories International Inc. | 699,555 | 24,862 |
| Techne Corp. | 378,201 | 24,836 |
| * Onyx Pharmaceuticals Inc. | 669,804 | 24,696 |
| * Regeneron Pharmaceuticals Inc. | 730,760 | 23,991 |
| * AMERIGROUP Corp. | 538,497 | 23,651 |
| * Brookdale Senior Living Inc. Class A | 1,094,276 | 23,428 |
| STERIS Corp. | 632,587 | 23,064 |
| * Myriad Genetics Inc. | 1,005,501 | 22,966 |
| Teleflex Inc. | 421,323 | 22,671 |
| * Amylin Pharmaceuticals Inc. | 1,536,019 | 22,595 |
| * Dionex Corp. | 185,262 | 21,863 |
| * LifePoint Hospitals Inc. | 584,148 | 21,467 |
| * Bio-Rad Laboratories Inc. Class A | 204,919 | 21,281 |
| * Incyte Corp. Ltd. | 1,284,341 | 21,269 |
| * Emergency Medical Services Corp. Class A | 322,103 | 20,811 |
| * Healthsouth Corp. | 986,189 | 20,424 |
| * VCA Antech Inc. | 872,545 | 20,322 |
| Owens & Minor Inc. | 674,625 | 19,854 |
| * InterMune Inc. | 532,812 | 19,394 |
| * Catalyst Health Solutions Inc. | 406,468 | 18,897 |
| * HMS Holdings Corp. | 290,684 | 18,828 |
| * Sirona Dental Systems Inc. | 442,513 | 18,488 |
| Medicis Pharmaceutical Corp. Class A | 645,227 | 17,286 |
| * Haemonetics Corp. | 269,305 | 17,015 |
27
| | | |
| Vanguard® Total Stock Market Index Fund | | |
| Schedule of Investments | | |
| December 31, 2010 | | |
| |
| | | | Market |
| | | | Value |
| | | Shares | ($000) |
| * | Magellan Health Services Inc. | 357,289 | 16,893 |
| * | Thoratec Corp. | 586,209 | 16,601 |
| | Masimo Corp. | 565,759 | 16,447 |
| * | Theravance Inc. | 654,782 | 16,415 |
| | Chemed Corp. | 244,264 | 15,513 |
| * | Talecris Biotherapeutics Holdings Corp. | 656,542 | 15,297 |
| * | American Medical Systems Holdings Inc. | 809,397 | 15,265 |
| | Quality Systems Inc. | 216,425 | 15,111 |
| * | Immucor Inc. | 748,151 | 14,836 |
| * | Pharmasset Inc. | 341,233 | 14,813 |
| | West Pharmaceutical Services Inc. | 355,903 | 14,663 |
| * | Cepheid Inc. | 638,818 | 14,533 |
| * | Par Pharmaceutical Cos. Inc. | 375,347 | 14,455 |
| * | Viropharma Inc. | 834,016 | 14,445 |
| *,^ | athenahealth Inc. | 343,009 | 14,056 |
| * | Centene Corp. | 553,975 | 14,038 |
| * | Healthspring Inc. | 522,221 | 13,854 |
| * | PSS World Medical Inc. | 610,134 | 13,789 |
| * | WellCare Health Plans Inc. | 453,561 | 13,707 |
| * | Seattle Genetics Inc. | 916,233 | 13,698 |
| * | Cubist Pharmaceuticals Inc. | 626,464 | 13,406 |
| * | Parexel International Corp. | 625,638 | 13,282 |
| * | Volcano Corp. | 484,507 | 13,232 |
| * | Nektar Therapeutics | 1,007,231 | 12,943 |
| * | Alkermes Inc. | 1,015,772 | 12,474 |
| * | Align Technology Inc. | 611,347 | 11,946 |
| * | Bruker Corp. | 707,395 | 11,743 |
| * | Martek Biosciences Corp. | 369,125 | 11,554 |
| * | Impax Laboratories Inc. | 573,239 | 11,528 |
| * | Acorda Therapeutics Inc. | 415,767 | 11,334 |
| * | Auxilium Pharmaceuticals Inc. | 528,233 | 11,146 |
| * | Integra LifeSciences Holdings Corp. | 232,076 | 10,977 |
| * | NuVasive Inc. | 419,676 | 10,765 |
| * | Amedisys Inc. | 306,503 | 10,268 |
| | Invacare Corp. | 338,799 | 10,218 |
| * | NxStage Medical Inc. | 404,687 | 10,069 |
| | Meridian Bioscience Inc. | 428,660 | 9,928 |
| * | Isis Pharmaceuticals Inc. | 977,840 | 9,896 |
| * | Ariad Pharmaceuticals Inc. | 1,921,101 | 9,798 |
| * | Neogen Corp. | 235,001 | 9,642 |
| * | Cyberonics Inc. | 310,531 | 9,633 |
| * | Exelixis Inc. | 1,133,075 | 9,303 |
| * | MedAssets Inc. | 452,349 | 9,133 |
| *,^ | Vivus Inc. | 957,335 | 8,970 |
| | Universal American Corp. | 434,876 | 8,893 |
| * | Momenta Pharmaceuticals Inc. | 585,215 | 8,761 |
| *,^ | MannKind Corp. | 1,086,740 | 8,759 |
| | Computer Programs & Systems Inc. | 186,500 | 8,736 |
| * | Questcor Pharmaceuticals Inc. | 584,495 | 8,610 |
| * | Savient Pharmaceuticals Inc. | 772,425 | 8,605 |
| *,^ | Protalix BioTherapeutics Inc. | 836,218 | 8,345 |
| * | Medivation Inc. | 548,385 | 8,319 |
| * | Halozyme Therapeutics Inc. | 1,020,961 | 8,086 |
| * | Gentiva Health Services Inc. | 303,373 | 8,070 |
| * | Targacept Inc. | 296,594 | 7,860 |
| * | Medicines Co. | 544,277 | 7,691 |
| * | HeartWare International Inc. | 87,049 | 7,623 |
| * | Arthrocare Corp. | 241,586 | 7,504 |
| | PDL BioPharma Inc. | 1,177,819 | 7,338 |
| * | DexCom Inc. | 536,880 | 7,328 |
| * | Amsurg Corp. Class A | 348,086 | 7,292 |
| * | Corvel Corp. | 150,200 | 7,262 |
| *,^ | Geron Corp. | 1,402,503 | 7,251 |
| * | CONMED Corp. | 271,418 | 7,174 |
28
| | | |
| Vanguard® Total Stock Market Index Fund | | |
| Schedule of Investments | | |
| December 31, 2010 | | |
| |
| | | | Market |
| | | | Value |
| | | Shares | ($000) |
| * | Celera Corp. | 1,121,178 | 7,063 |
| * | Luminex Corp. | 385,310 | 7,043 |
| * | Zoll Medical Corp. | 187,249 | 6,971 |
| * | Emeritus Corp. | 350,760 | 6,913 |
| * | Air Methods Corp. | 116,501 | 6,555 |
| * | MWI Veterinary Supply Inc. | 101,867 | 6,433 |
| * | Emergent Biosolutions Inc. | 267,901 | 6,285 |
| * | Accelrys Inc. | 749,412 | 6,220 |
| * | Wright Medical Group Inc. | 398,343 | 6,186 |
| | Analogic Corp. | 124,913 | 6,184 |
| | Landauer Inc. | 102,732 | 6,161 |
| *,^ | Sequenom Inc. | 750,228 | 6,017 |
| * | Abaxis Inc. | 223,385 | 5,998 |
| * | Enzon Pharmaceuticals Inc. | 489,935 | 5,962 |
| * | Natus Medical Inc. | 418,175 | 5,930 |
| * | Hi-Tech Pharmacal Co. Inc. | 236,683 | 5,905 |
| *,^ | Immunogen Inc. | 623,832 | 5,777 |
| * | Conceptus Inc. | 408,820 | 5,642 |
| * | Hanger Orthopedic Group Inc. | 257,987 | 5,467 |
| * | Insulet Corp. | 351,620 | 5,450 |
| * | Greatbatch Inc. | 217,952 | 5,264 |
| * | Molina Healthcare Inc. | 188,239 | 5,242 |
| | Cantel Medical Corp. | 223,571 | 5,232 |
| * | Affymetrix Inc. | 1,033,247 | 5,197 |
| * | Bio-Reference Labs Inc. | 233,279 | 5,174 |
| * | IPC The Hospitalist Co. Inc. | 129,904 | 5,068 |
| * | RehabCare Group Inc. | 211,766 | 5,019 |
| * | Micromet Inc. | 615,745 | 5,000 |
| * | Endologix Inc. | 663,262 | 4,742 |
| * | Merit Medical Systems Inc. | 296,028 | 4,686 |
| *,^ | Immunomedics Inc. | 1,301,854 | 4,661 |
| * | Inspire Pharmaceuticals Inc. | 549,504 | 4,616 |
| * | AVANIR Pharmaceuticals Inc. | 1,128,161 | 4,603 |
| * | Nabi Biopharmaceuticals | 791,251 | 4,581 |
| * | Neurocrine Biosciences Inc. | 597,078 | 4,562 |
| * | Quidel Corp. | 311,467 | 4,501 |
| * | ICU Medical Inc. | 122,722 | 4,479 |
| * | Allos Therapeutics Inc. | 950,241 | 4,381 |
| * | LHC Group Inc. | 144,537 | 4,336 |
| * | Omnicell Inc. | 296,696 | 4,287 |
| * | Sunrise Senior Living Inc. | 786,461 | 4,286 |
| *,2 | Matrixx Initiatives Inc. | 505,277 | 4,275 |
| * | Healthways Inc. | 370,567 | 4,135 |
| * | Five Star Quality Care Inc. | 583,755 | 4,127 |
| * | Ligand Pharmaceuticals Inc. Class B | 458,493 | 4,090 |
| * | Rigel Pharmaceuticals Inc. | 538,133 | 4,052 |
| * | Lexicon Pharmaceuticals Inc. | 2,813,524 | 4,051 |
| * | Orthofix International NV | 139,697 | 4,051 |
| * | Chindex International Inc. | 244,185 | 4,027 |
| * | PharMerica Corp. | 350,158 | 4,009 |
| * | AMAG Pharmaceuticals Inc. | 220,538 | 3,992 |
| *,^ | Delcath Systems Inc. | 401,534 | 3,935 |
| * | SonoSite Inc. | 123,996 | 3,918 |
| * | NPS Pharmaceuticals Inc. | 493,536 | 3,899 |
| *,^ | SIGA Technologies Inc. | 277,854 | 3,890 |
| * | Assisted Living Concepts Inc. Class A | 117,072 | 3,808 |
| * | eResearchTechnology Inc. | 517,438 | 3,803 |
| | Pain Therapeutics Inc. | 562,536 | 3,797 |
| | Sabra Healthcare REIT Inc. | 205,559 | 3,782 |
| * | Ardea Biosciences Inc. | 143,965 | 3,743 |
| *,^ | Novavax Inc. | 1,516,640 | 3,685 |
| * | Alnylam Pharmaceuticals Inc. | 371,071 | 3,659 |
| * | Accuray Inc. | 520,733 | 3,515 |
| * | Rural/Metro Corp. | 228,218 | 3,327 |
29
| | | |
| Vanguard® Total Stock Market Index Fund | | |
| Schedule of Investments | | |
| December 31, 2010 | | |
| |
| | | | Market |
| | | | Value |
| | | Shares | ($000) |
| * | Vanda Pharmaceuticals Inc. | 346,499 | 3,278 |
| * | Emdeon Inc. Class A | 232,303 | 3,145 |
| * | US Physical Therapy Inc. | 157,111 | 3,114 |
| * | Palomar Medical Technologies Inc. | 219,065 | 3,113 |
| * | Select Medical Holdings Corp. | 418,892 | 3,062 |
| * | BioScrip Inc. | 583,607 | 3,052 |
| * | Obagi Medical Products Inc. | 262,752 | 3,035 |
| * | Medidata Solutions Inc. | 125,932 | 3,007 |
| * | Angiodynamics Inc. | 194,377 | 2,988 |
| * | OraSure Technologies Inc. | 518,460 | 2,981 |
| * | BMP Sunstone Corp. | 299,340 | 2,966 |
| * | Genoptix Inc. | 154,314 | 2,935 |
| * | Triple-S Management Corp. Class B | 152,416 | 2,908 |
| | Ensign Group Inc. | 116,309 | 2,893 |
| * | Sangamo Biosciences Inc. | 433,332 | 2,877 |
| * | Spectrum Pharmaceuticals Inc. | 417,418 | 2,868 |
| * | Chelsea Therapeutics International Ltd. | 381,565 | 2,862 |
| * | Symmetry Medical Inc. | 308,183 | 2,851 |
| * | Depomed Inc. | 442,551 | 2,815 |
| * | Sciclone Pharmaceuticals Inc. | 669,358 | 2,798 |
| * | Optimer Pharmaceuticals Inc. | 245,012 | 2,771 |
| * | Sun Healthcare Group Inc. | 210,941 | 2,670 |
| * | Akorn Inc. | 437,608 | 2,656 |
| * | Kensey Nash Corp. | 95,425 | 2,656 |
| * | TomoTherapy Inc. | 733,113 | 2,647 |
| * | AMN Healthcare Services Inc. | 430,841 | 2,645 |
| | America Service Group Inc. | 174,551 | 2,643 |
| * | Almost Family Inc. | 68,463 | 2,630 |
| * | Opko Health Inc. | 704,236 | 2,585 |
| * | Synovis Life Technologies Inc. | 158,298 | 2,550 |
| * | Cross Country Healthcare Inc. | 300,805 | 2,548 |
| * | Spectranetics Corp. | 492,162 | 2,540 |
| * | Jazz Pharmaceuticals Inc. | 125,285 | 2,466 |
| *,^ | StemCells Inc. | 2,278,668 | 2,461 |
| * | Cypress Bioscience Inc. | 369,696 | 2,396 |
| *,^ | AVI BioPharma Inc. | 1,125,578 | 2,386 |
| * | ABIOMED Inc. | 248,243 | 2,386 |
| * | Durect Corp. | 691,242 | 2,385 |
| *,^ | MAKO Surgical Corp. | 154,572 | 2,353 |
| | National Healthcare Corp. | 50,747 | 2,348 |
| *,^ | Cadence Pharmaceuticals Inc. | 309,439 | 2,336 |
| * | Accretive Health Inc. | 142,831 | 2,321 |
| * | Vascular Solutions Inc. | 197,290 | 2,312 |
| *,^ | Metabolix Inc. | 189,724 | 2,309 |
| * | CryoLife Inc. | 410,635 | 2,226 |
| * | XenoPort Inc. | 260,998 | 2,224 |
| * | Repligen Corp. | 464,533 | 2,179 |
| *,^ | BioCryst Pharmaceuticals Inc. | 416,950 | 2,156 |
| | Young Innovations Inc. | 66,915 | 2,142 |
| *,^ | Cel-Sci Corp. | 2,583,034 | 2,125 |
| * | Staar Surgical Co. | 348,171 | 2,124 |
| * | CardioNet Inc. | 453,090 | 2,120 |
| *,^ | Clinical Data Inc. | 132,785 | 2,113 |
| *,^ | Cell Therapeutics Inc. | 5,783,694 | 2,111 |
| * | Pozen Inc. | 316,448 | 2,104 |
| * | Arqule Inc. | 356,211 | 2,091 |
| * | Genomic Health Inc. | 97,722 | 2,090 |
| | Atrion Corp. | 11,647 | 2,090 |
| * | Synta Pharmaceuticals Corp. | 340,076 | 2,081 |
| *,^ | Keryx Biopharmaceuticals Inc. | 444,821 | 2,037 |
| * | Vital Images Inc. | 144,491 | 2,020 |
| * | MAP Pharmaceuticals Inc. | 120,538 | 2,018 |
| * | IRIS International Inc. | 196,045 | 2,006 |
| * | American Dental Partners Inc. | 147,261 | 1,989 |
30
| | | |
| Vanguard® Total Stock Market Index Fund | | |
| Schedule of Investments | | |
| December 31, 2010 | | |
| |
| | | | Market |
| | | | Value |
| | | Shares | ($000) |
| * | CPEX Pharmaceuticals Inc. | 80,736 | 1,948 |
| * | Capital Senior Living Corp. | 288,532 | 1,933 |
| * | Cytokinetics Inc. | 916,494 | 1,915 |
| * | Alphatec Holdings Inc. | 704,507 | 1,902 |
| * | Exactech Inc. | 100,427 | 1,890 |
| * | Medcath Corp. | 135,447 | 1,889 |
| * | Enzo Biochem Inc. | 357,044 | 1,885 |
| * | Albany Molecular Research Inc. | 333,285 | 1,873 |
| *,^ | Arena Pharmaceuticals Inc. | 1,069,872 | 1,840 |
| * | PDI Inc. | 174,583 | 1,840 |
| * | Orthovita Inc. | 906,555 | 1,822 |
| * | Progenics Pharmaceuticals Inc. | 332,554 | 1,816 |
| * | Rochester Medical Corp. | 165,714 | 1,810 |
| * | SuperGen Inc. | 688,694 | 1,804 |
| *,^ | Orexigen Therapeutics Inc. | 220,374 | 1,781 |
| * | Skilled Healthcare Group Inc. | 196,881 | 1,768 |
| * | Stereotaxis Inc. | 461,605 | 1,768 |
| * | SurModics Inc. | 147,671 | 1,753 |
| * | Pharmacyclics Inc. | 286,425 | 1,741 |
| * | Idenix Pharmaceuticals Inc. | 343,186 | 1,730 |
| * | Unilife Corp. | 322,249 | 1,708 |
| * | Santarus Inc. | 506,647 | 1,657 |
| * | Kendle International Inc. | 150,693 | 1,641 |
| * | Exact Sciences Corp. | 265,623 | 1,588 |
| * | Cambrex Corp. | 300,368 | 1,553 |
| * | Cynosure Inc. Class A | 148,504 | 1,519 |
| *,^ | Cerus Corp. | 615,261 | 1,514 |
| * | Allied Healthcare International Inc. | 594,994 | 1,493 |
| * | Dynavax Technologies Corp. | 465,871 | 1,491 |
| * | RTI Biologics Inc. | 544,934 | 1,455 |
| * | Medical Action Industries Inc. | 150,759 | 1,444 |
| * | Furiex Pharmaceuticals Inc. | 97,450 | 1,408 |
| * | Caliper Life Sciences Inc. | 219,672 | 1,393 |
| * | Anika Therapeutics Inc. | 198,810 | 1,318 |
| * | Alliance HealthCare Services Inc. | 308,921 | 1,310 |
| * | Dyax Corp. | 602,927 | 1,290 |
| * | Transcend Services Inc. | 63,631 | 1,247 |
| * | BioMimetic Therapeutics Inc. | 97,590 | 1,239 |
| * | Team Health Holdings Inc. | 78,681 | 1,223 |
| *,^ | Peregrine Pharmaceuticals Inc. | 530,502 | 1,220 |
| * | Icad Inc. | 895,631 | 1,218 |
| *,^ | ZIOPHARM Oncology Inc. | 260,939 | 1,216 |
| *,^ | Osiris Therapeutics Inc. | 145,254 | 1,131 |
| * | PROLOR Biotech Inc. | 172,421 | 1,116 |
| * | Providence Service Corp. | 68,709 | 1,104 |
| * | Columbia Laboratories Inc. | 482,053 | 1,094 |
| * | Curis Inc. | 550,362 | 1,090 |
| * | Harvard Bioscience Inc. | 263,074 | 1,076 |
| * | LCA-Vision Inc. | 186,543 | 1,073 |
| * | Metropolitan Health Networks Inc. | 238,724 | 1,067 |
| | Psychemedics Corp. | 129,048 | 1,056 |
| | Utah Medical Products Inc. | 39,566 | 1,055 |
| * | Insmed Inc. | 1,662,336 | 1,049 |
| * | Cutera Inc. | 119,615 | 992 |
| *,^ | GenVec Inc. | 1,761,312 | 986 |
| * | KV Pharmaceutical Co. Class A | 371,986 | 949 |
| * | Continucare Corp. | 198,118 | 927 |
| *,^ | Cytori Therapeutics Inc. | 178,066 | 924 |
| * | Affymax Inc. | 137,395 | 914 |
| * | Myrexis Inc. | 217,811 | 906 |
| * | ISTA Pharmaceuticals Inc. | 172,247 | 884 |
| * | Merge Healthcare Inc. | 228,827 | 853 |
| * | Hansen Medical Inc. | 579,348 | 852 |
| * | Theragenics Corp. | 548,813 | 829 |
31
| | | |
| Vanguard® Total Stock Market Index Fund | | |
| Schedule of Investments | | |
| December 31, 2010 | | |
| |
| | | | Market |
| | | | Value |
| | | Shares | ($000) |
| *,^ | Celldex Therapeutics Inc. | 195,729 | 806 |
| * | Ironwood Pharmaceuticals Inc. | 75,858 | 785 |
| | Maxygen Inc. | 199,696 | 785 |
| * | Corcept Therapeutics Inc. | 199,387 | 770 |
| * | Digirad Corp. | 365,211 | 767 |
| * | Array Biopharma Inc. | 251,192 | 751 |
| * | Vical Inc. | 363,973 | 735 |
| * | RadNet Inc. | 255,771 | 721 |
| * | Adolor Corp. | 585,565 | 709 |
| *,^ | Hemispherx Biopharma Inc. | 1,358,729 | 667 |
| * | Strategic Diagnostics Inc. | 356,430 | 638 |
| * | Acadia Pharmaceuticals Inc. | 524,981 | 625 |
| * | Biolase Technology Inc. | 347,253 | 604 |
| * | Codexis Inc. | 54,656 | 579 |
| *,^ | MELA Sciences Inc. | 168,965 | 566 |
| *,^ | Biosante Pharmaceuticals Inc. | 342,056 | 561 |
| | Medtox Scientific Inc. | 41,314 | 541 |
| *,^ | Biotime Inc. | 64,333 | 536 |
| * | Mediware Information Systems | 48,549 | 522 |
| *,^ | Poniard Pharmaceuticals Inc. | 995,330 | 518 |
| * | Amicus Therapeutics Inc. | 111,669 | 515 |
| * | XOMA Ltd. | 100,321 | 515 |
| *,^ | Oncothyreon Inc. | 156,518 | 509 |
| * | OncoGenex Pharmaceutical Inc. | 29,890 | 502 |
| * | Nanosphere Inc. | 113,965 | 497 |
| * | Zalicus Inc. | 305,048 | 482 |
| *,^ | Inovio Pharmaceuticals Inc. | 417,456 | 480 |
| *,^ | Arrowhead Research Corp. | 523,663 | 469 |
| * | Lannett Co. Inc. | 83,308 | 466 |
| * | Caraco Pharmaceutical Laboratories Ltd. | 101,939 | 463 |
| * | Orchid Cellmark Inc. | 237,729 | 461 |
| * | Infinity Pharmaceuticals Inc. | 77,710 | 461 |
| * | Dusa Pharmaceuticals Inc. | 188,050 | 461 |
| *,^ | Aastrom Biosciences Inc. | 178,067 | 456 |
| * | Antigenics Inc. | 441,872 | 442 |
| * | AtriCure Inc. | 40,471 | 414 |
| * | Cumberland Pharmaceuticals Inc. | 67,355 | 403 |
| * | CombiMatrix Corp. | 183,417 | 394 |
| * | Synergetics USA Inc. | 83,734 | 393 |
| * | Solta Medical Inc. | 126,289 | 385 |
| * | Inhibitex Inc. | 143,774 | 374 |
| * | American Caresource Holdings Inc. | 259,932 | 364 |
| | Daxor Corp. | 39,040 | 361 |
| * | Alexza Pharmaceuticals Inc. | 285,567 | 357 |
| * | Anadys Pharmaceuticals Inc. | 244,242 | 347 |
| * | Entremed Inc. | 67,712 | 345 |
| * | Sucampo Pharmaceuticals Inc. Class A | 88,035 | 338 |
| *,^ | Apricus Biosciences Inc. | 94,262 | 327 |
| * | Idera Pharmaceuticals Inc. | 110,380 | 317 |
| * | Telik Inc. | 409,132 | 311 |
| * | CytRx Corp. | 295,669 | 299 |
| * | Omeros Corp. | 34,757 | 286 |
| * | GTx Inc. | 105,807 | 280 |
| * | Discovery Laboratories Inc. | 76,580 | 255 |
| * | Hooper Holmes Inc. | 334,146 | 236 |
| | National Research Corp. | 6,837 | 234 |
| *,^ | Biodel Inc. | 125,695 | 230 |
| *,^ | ARCA Biopharma Inc. | 71,706 | 227 |
| * | Cardiovascular Systems Inc. | 18,111 | 211 |
| | MedQuist Inc. | 24,216 | 209 |
| * | Animal Health International Inc. | 69,889 | 201 |
| * | Bovie Medical Corp. | 58,045 | 189 |
| * | ThermoGenesis Corp. | 48,994 | 171 |
| *,^ | BSD Medical Corp. | 34,917 | 161 |
32
| | | |
| Vanguard® Total Stock Market Index Fund | | |
| Schedule of Investments | | |
| December 31, 2010 | | |
| |
| | | | Market |
| | | | Value |
| | | Shares | ($000) |
| * | Transcept Pharmaceuticals Inc. | 21,369 | 158 |
| * | AspenBio Pharma Inc. | 201,074 | 121 |
| * | Heska Corp. | 24,368 | 121 |
| * | Retractable Technologies Inc. | 67,863 | 119 |
| *,^ | Repros Therapeutics Inc. | 37,517 | 114 |
| * | Capstone Therapeutics Corp. | 195,643 | 113 |
| * | TranS1 Inc. | 47,024 | 97 |
| *,^ | RXi Pharmaceuticals Corp. | 28,929 | 75 |
| * | Biospecifics Technologies Corp. | 2,567 | 66 |
| *,^ | OXiGENE Inc. | 234,192 | 53 |
| * | Vision-Sciences Inc. | 36,045 | 50 |
| *,^ | Celsion Corp. | 23,511 | 48 |
| * | Pure Bioscience | 21,685 | 48 |
| *,^ | Somaxon Pharmaceuticals Inc. | 13,921 | 44 |
| * | BioClinica Inc. | 9,841 | 44 |
| * | ProPhase Labs Inc. | 29,309 | 35 |
| * | IVAX Diagnostics Inc. | 61,175 | 35 |
| * | Acura Pharmaceuticals Inc. | 9,753 | 32 |
| * | Bionovo Inc. | 27,526 | 31 |
| * | SCOLR Pharma Inc. | 81,873 | 30 |
| * | ADVENTRX Pharmaceuticals Inc. | 9,396 | 24 |
| * | Sharps Compliance Corp. | 4,824 | 21 |
| * | NovaMed Inc. | 1,242 | 14 |
| * | ARYx Therapeutics Inc. | 32,859 | 9 |
| * | Molecular Insight Pharmaceuticals Inc. | 17,708 | 3 |
| * | MediciNova Inc. | 570 | 3 |
| * | KV Pharmaceutical Co. Class B | 500 | 1 |
| | | | 16,737,903 |
| Industrials (11.4%) | | |
| | General Electric Co. | 112,779,731 | 2,062,741 |
| | United Technologies Corp. | 9,308,980 | 732,803 |
| | Caterpillar Inc. | 6,649,371 | 622,780 |
| | 3M Co. | 7,145,461 | 616,653 |
| | United Parcel Service Inc. Class B | 7,646,821 | 555,006 |
| | Union Pacific Corp. | 5,248,035 | 486,283 |
| | Boeing Co. | 7,331,151 | 478,431 |
| | Emerson Electric Co. | 7,934,349 | 453,607 |
| | Honeywell International Inc. | 7,736,210 | 411,257 |
| | Deere & Co. | 4,469,600 | 371,200 |
| | FedEx Corp. | 3,153,964 | 293,350 |
| | Danaher Corp. | 5,854,143 | 276,140 |
| | CSX Corp. | 4,006,633 | 258,869 |
| | Norfolk Southern Corp. | 3,889,220 | 244,321 |
| | General Dynamics Corp. | 3,411,407 | 242,073 |
| | Illinois Tool Works Inc. | 4,516,836 | 241,199 |
| | Lockheed Martin Corp. | 3,251,972 | 227,345 |
| | Cummins Inc. | 1,993,141 | 219,265 |
| | Tyco International Ltd. | 5,251,171 | 217,609 |
| | Precision Castparts Corp. | 1,500,916 | 208,943 |
| | PACCAR Inc. | 3,461,952 | 198,785 |
| | Northrop Grumman Corp. | 2,949,407 | 191,063 |
| | Raytheon Co. | 3,924,855 | 181,878 |
| | Waste Management Inc. | 4,782,729 | 176,339 |
| | Eaton Corp. | 1,681,001 | 170,638 |
| | Ingersoll-Rand plc | 3,403,842 | 160,287 |
| | Parker Hannifin Corp. | 1,701,860 | 146,871 |
| | CH Robinson Worldwide Inc. | 1,751,488 | 140,452 |
| | Fluor Corp. | 1,888,060 | 125,103 |
| | Expeditors International of Washington Inc. | 2,240,531 | 122,333 |
33
| | |
| Vanguard® Total Stock Market Index Fund | | |
| Schedule of Investments | | |
| December 31, 2010 | | |
| |
| | | Market |
| | | Value |
| | Shares | ($000) |
| Republic Services Inc. Class A | 4,038,782 | 120,598 |
| Goodrich Corp. | 1,323,017 | 116,518 |
| Dover Corp. | 1,970,583 | 115,181 |
| Rockwell Automation Inc. | 1,495,947 | 107,274 |
| * Delta Air Lines Inc. | 8,317,396 | 104,799 |
| Cooper Industries plc | 1,760,878 | 102,642 |
| Southwest Airlines Co. | 7,880,113 | 102,284 |
| Rockwell Collins Inc. | 1,660,131 | 96,719 |
| ITT Corp. | 1,840,074 | 95,886 |
| Joy Global Inc. | 1,089,778 | 94,538 |
| WW Grainger Inc. | 637,119 | 87,993 |
| L-3 Communications Holdings Inc. | 1,210,661 | 85,340 |
| Fastenal Co. | 1,403,260 | 84,069 |
| * United Continental Holdings Inc. | 3,342,701 | 79,623 |
| Roper Industries Inc. | 994,843 | 76,036 |
| Bucyrus International Inc. Class A | 812,998 | 72,682 |
| Flowserve Corp. | 591,729 | 70,546 |
| * Stericycle Inc. | 856,069 | 69,273 |
| Textron Inc. | 2,900,885 | 68,577 |
| AMETEK Inc. | 1,687,657 | 66,241 |
| Pall Corp. | 1,234,154 | 61,189 |
| * Jacobs Engineering Group Inc. | 1,328,834 | 60,927 |
| Manpower Inc. | 869,069 | 54,543 |
| Pitney Bowes Inc. | 2,187,245 | 52,888 |
| * Kansas City Southern | 1,081,411 | 51,756 |
| KBR Inc. | 1,654,274 | 50,406 |
| * AGCO Corp. | 984,696 | 49,885 |
| Masco Corp. | 3,809,236 | 48,225 |
| Iron Mountain Inc. | 1,919,765 | 48,013 |
| Equifax Inc. | 1,322,508 | 47,081 |
| * Foster Wheeler AG | 1,349,351 | 46,580 |
| Donaldson Co. Inc. | 779,416 | 45,424 |
| Robert Half International Inc. | 1,478,780 | 45,251 |
| * Quanta Services Inc. | 2,227,846 | 44,379 |
| Avery Dennison Corp. | 1,046,203 | 44,296 |
| Dun & Bradstreet Corp. | 528,041 | 43,347 |
| Timken Co. | 870,513 | 41,550 |
| * WABCO Holdings Inc. | 681,675 | 41,534 |
| * Verisk Analytics Inc. Class A | 1,201,751 | 40,956 |
| Cintas Corp. | 1,456,198 | 40,715 |
| JB Hunt Transport Services Inc. | 978,958 | 39,951 |
| * Navistar International Corp. | 684,579 | 39,644 |
| RR Donnelley & Sons Co. | 2,183,064 | 38,138 |
| Pentair Inc. | 1,044,390 | 38,131 |
| Gardner Denver Inc. | 553,391 | 38,084 |
| * Owens Corning | 1,222,276 | 38,074 |
| * BE Aerospace Inc. | 1,027,991 | 38,067 |
| SPX Corp. | 529,145 | 37,829 |
| * URS Corp. | 887,865 | 36,944 |
| * Terex Corp. | 1,150,346 | 35,707 |
| * IHS Inc. Class A | 442,998 | 35,613 |
| * TransDigm Group Inc. | 494,431 | 35,604 |
| Snap-On Inc. | 617,383 | 34,932 |
| * Hertz Global Holdings Inc. | 2,399,050 | 34,762 |
| Kennametal Inc. | 864,580 | 34,116 |
| IDEX Corp. | 866,509 | 33,898 |
| * Oshkosh Corp. | 960,481 | 33,847 |
| Hubbell Inc. Class B | 555,475 | 33,401 |
| Waste Connections Inc. | 1,169,812 | 32,205 |
| * Babcock & Wilcox Co. | 1,231,421 | 31,512 |
| MSC Industrial Direct Co. Class A | 478,412 | 30,948 |
| * Shaw Group Inc. | 891,104 | 30,503 |
| Baldor Electric Co. | 475,438 | 29,972 |
| Nordson Corp. | 326,170 | 29,969 |
34
| | |
| Vanguard® Total Stock Market Index Fund | | |
| Schedule of Investments | | |
| December 31, 2010 | | |
| |
| | | Market |
| | | Value |
| | Shares | ($000) |
| Ryder System Inc. | 565,293 | 29,757 |
| Lincoln Electric Holdings Inc. | 453,369 | 29,591 |
| * Corrections Corp. of America | 1,175,870 | 29,467 |
| Towers Watson & Co. Class A | 548,464 | 28,553 |
| * Copart Inc. | 758,988 | 28,348 |
| * AMR Corp. | 3,553,795 | 27,684 |
| * Aecom Technology Corp. | 983,380 | 27,505 |
| Regal-Beloit Corp. | 410,959 | 27,436 |
| Wabtec Corp. | 513,904 | 27,180 |
| * Thomas & Betts Corp. | 558,908 | 26,995 |
| Acuity Brands Inc. | 459,637 | 26,507 |
| * Alliant Techsystems Inc. | 353,071 | 26,279 |
| Carlisle Cos. Inc. | 649,787 | 25,823 |
| Graco Inc. | 645,437 | 25,463 |
| * GrafTech International Ltd. | 1,281,619 | 25,427 |
| * Kirby Corp. | 548,206 | 24,148 |
| Harsco Corp. | 849,715 | 24,064 |
| Covanta Holding Corp. | 1,397,735 | 24,027 |
| * WESCO International Inc. | 453,743 | 23,958 |
| * Spirit Aerosystems Holdings Inc. Class A | 1,131,541 | 23,547 |
| Woodward Governor Co. | 620,120 | 23,292 |
| Lennox International Inc. | 490,305 | 23,187 |
| CLARCOR Inc. | 539,631 | 23,145 |
| UTi Worldwide Inc. | 1,085,661 | 23,016 |
| Trinity Industries Inc. | 847,881 | 22,562 |
| Crane Co. | 535,185 | 21,980 |
| * Genesee & Wyoming Inc. Class A | 414,005 | 21,922 |
| * Esterline Technologies Corp. | 319,267 | 21,899 |
| * Alaska Air Group Inc. | 381,784 | 21,643 |
| Landstar System Inc. | 528,472 | 21,636 |
| * Clean Harbors Inc. | 252,436 | 21,225 |
| Toro Co. | 342,791 | 21,130 |
| Con-way Inc. | 577,782 | 21,129 |
| * EMCOR Group Inc. | 708,674 | 20,537 |
| Valmont Industries Inc. | 225,013 | 19,965 |
| * General Cable Corp. | 557,215 | 19,553 |
| * Sensata Technologies Holding NV | 648,471 | 19,525 |
| * ArvinMeritor Inc. | 943,009 | 19,351 |
| Actuant Corp. Class A | 725,239 | 19,306 |
| * Hexcel Corp. | 1,039,530 | 18,805 |
| * FTI Consulting Inc. | 502,856 | 18,746 |
| Triumph Group Inc. | 206,429 | 18,457 |
| Belden Inc. | 500,335 | 18,422 |
| Manitowoc Co. Inc. | 1,404,608 | 18,414 |
| * Geo Group Inc. | 731,055 | 18,028 |
| Alexander & Baldwin Inc. | 440,382 | 17,629 |
| * JetBlue Airways Corp. | 2,661,402 | 17,592 |
| GATX Corp. | 494,804 | 17,457 |
| * US Airways Group Inc. | 1,729,873 | 17,316 |
| * Avis Budget Group Inc. | 1,097,845 | 17,082 |
| * Teledyne Technologies Inc. | 388,497 | 17,082 |
| Watsco Inc. | 270,247 | 17,047 |
| Brady Corp. Class A | 522,602 | 17,042 |
| * Moog Inc. Class A | 418,862 | 16,671 |
| * Tetra Tech Inc. | 660,053 | 16,541 |
| * United Stationers Inc. | 255,496 | 16,303 |
| Curtiss-Wright Corp. | 490,194 | 16,274 |
| * EnerSys | 498,989 | 16,028 |
| * Middleby Corp. | 189,013 | 15,956 |
| AO Smith Corp. | 406,320 | 15,473 |
| * Atlas Air Worldwide Holdings Inc. | 276,302 | 15,426 |
| HNI Corp. | 485,214 | 15,139 |
| * United Rentals Inc. | 647,394 | 14,728 |
| Herman Miller Inc. | 580,975 | 14,699 |
35
| | | |
| Vanguard® Total Stock Market Index Fund | | |
| Schedule of Investments | | |
| December 31, 2010 | | |
| |
| | | | Market |
| | | | Value |
| | | Shares | ($000) |
| *,^ | American Superconductor Corp. | 513,531 | 14,682 |
| | Kaydon Corp. | 359,186 | 14,626 |
| * | Old Dominion Freight Line Inc. | 450,278 | 14,404 |
| | Rollins Inc. | 716,435 | 14,150 |
| * | HUB Group Inc. Class A | 397,945 | 13,984 |
| | Corporate Executive Board Co. | 367,343 | 13,794 |
| | Brink's Co. | 508,778 | 13,676 |
| | Applied Industrial Technologies Inc. | 408,045 | 13,253 |
| | Mueller Industries Inc. | 403,028 | 13,179 |
| | Simpson Manufacturing Co. Inc. | 424,820 | 13,131 |
| * | Dollar Thrifty Automotive Group Inc. | 276,225 | 13,054 |
| * | II-VI Inc. | 281,135 | 13,033 |
| | Knight Transportation Inc. | 672,197 | 12,772 |
| * | TrueBlue Inc. | 709,480 | 12,764 |
| | Deluxe Corp. | 550,930 | 12,682 |
| * | Polypore International Inc. | 308,088 | 12,548 |
| * | USG Corp. | 741,878 | 12,486 |
| | ABM Industries Inc. | 472,786 | 12,434 |
| * | CoStar Group Inc. | 211,248 | 12,159 |
| * | DigitalGlobe Inc. | 371,130 | 11,769 |
| | Watts Water Technologies Inc. Class A | 319,092 | 11,676 |
| | Werner Enterprises Inc. | 505,391 | 11,422 |
| * | AAR Corp. | 415,748 | 11,421 |
| * | Insituform Technologies Inc. Class A | 429,822 | 11,395 |
| | Mine Safety Appliances Co. | 365,296 | 11,372 |
| * | Korn/Ferry International | 476,092 | 11,002 |
| | Healthcare Services Group Inc. | 666,182 | 10,839 |
| | ESCO Technologies Inc. | 285,975 | 10,821 |
| | Resources Connection Inc. | 579,581 | 10,774 |
| | Robbins & Myers Inc. | 300,838 | 10,764 |
| * | Orbital Sciences Corp. | 617,753 | 10,582 |
| | Briggs & Stratton Corp. | 533,487 | 10,504 |
| | Granite Construction Inc. | 380,510 | 10,437 |
| * | AirTran Holdings Inc. | 1,376,555 | 10,173 |
| * | GeoEye Inc. | 236,676 | 10,033 |
| | Forward Air Corp. | 351,747 | 9,983 |
| | Barnes Group Inc. | 477,296 | 9,866 |
| * | SYKES Enterprises Inc. | 486,648 | 9,860 |
| | Heartland Express Inc. | 614,353 | 9,842 |
| * | Chart Industries Inc. | 282,362 | 9,538 |
| | Skywest Inc. | 582,974 | 9,106 |
| * | EnPro Industries Inc. | 218,917 | 9,098 |
| | Raven Industries Inc. | 186,829 | 8,910 |
| * | MasTec Inc. | 609,608 | 8,894 |
| * | Blount International Inc. | 559,477 | 8,817 |
| | Applied Signal Technology Inc. | 230,829 | 8,746 |
| | American Science & Engineering Inc. | 102,480 | 8,734 |
| | Armstrong World Industries Inc. | 202,216 | 8,695 |
| * | Macquarie Infrastructure Co. LLC | 410,579 | 8,692 |
| * | Acacia Research - Acacia Technologies | 331,250 | 8,593 |
| | Allegiant Travel Co. Class A | 174,329 | 8,584 |
| * | Beacon Roofing Supply Inc. | 468,594 | 8,374 |
| | Cubic Corp. | 174,220 | 8,214 |
| | Interface Inc. Class A | 524,821 | 8,213 |
| * | Ceradyne Inc. | 257,660 | 8,124 |
| | Knoll Inc. | 484,588 | 8,107 |
| | Arkansas Best Corp. | 295,175 | 8,094 |
| | HEICO Corp. Class A | 213,530 | 7,969 |
| | Universal Forest Products Inc. | 202,045 | 7,860 |
| | CIRCOR International Inc. | 182,267 | 7,706 |
| * | SFN Group Inc. | 788,194 | 7,693 |
| | Steelcase Inc. Class A | 716,338 | 7,572 |
| * | RBC Bearings Inc. | 193,556 | 7,564 |
| | Ameron International Corp. | 98,456 | 7,519 |
36
| | | |
| Vanguard® Total Stock Market Index Fund | | |
| Schedule of Investments | | |
| December 31, 2010 | | |
| |
| | | | Market |
| | | | Value |
| | | Shares | ($000) |
| * | Altra Holdings Inc. | 372,410 | 7,396 |
| * | Mobile Mini Inc. | 371,805 | 7,321 |
| | Administaff Inc. | 249,137 | 7,300 |
| | Unifirst Corp. | 131,344 | 7,230 |
| * | Sauer-Danfoss Inc. | 255,537 | 7,219 |
| | Lindsay Corp. | 121,441 | 7,217 |
| * | Dycom Industries Inc. | 487,162 | 7,186 |
| | Quanex Building Products Corp. | 378,369 | 7,178 |
| | Franklin Electric Co. Inc. | 184,273 | 7,172 |
| * | Griffon Corp. | 555,289 | 7,074 |
| * | Wabash National Corp. | 594,029 | 7,039 |
| | Mueller Water Products Inc. Class A | 1,674,751 | 6,984 |
| * | Interline Brands Inc. | 303,792 | 6,917 |
| | Kaman Corp. | 237,031 | 6,891 |
| | Albany International Corp. | 288,971 | 6,846 |
| * | Navigant Consulting Inc. | 742,433 | 6,830 |
| *,^ | Harbin Electric Inc. | 383,166 | 6,648 |
| * | Advisory Board Co. | 136,552 | 6,504 |
| | Sun Hydraulics Corp. | 170,756 | 6,455 |
| | Tennant Co. | 166,190 | 6,383 |
| | Seaboard Corp. | 3,173 | 6,317 |
| * | Ladish Co. Inc. | 128,850 | 6,263 |
| | Badger Meter Inc. | 140,591 | 6,217 |
| * | Colfax Corp. | 328,263 | 6,043 |
| | Aircastle Ltd. | 575,415 | 6,013 |
| | TAL International Group Inc. | 191,942 | 5,925 |
| | Titan International Inc. | 298,048 | 5,824 |
| | National Presto Industries Inc. | 44,773 | 5,821 |
| * | Layne Christensen Co. | 168,686 | 5,806 |
| * | Kforce Inc. | 358,442 | 5,800 |
| * | Huron Consulting Group Inc. | 218,401 | 5,777 |
| | Comfort Systems USA Inc. | 437,114 | 5,757 |
| * | Kelly Services Inc. Class A | 302,656 | 5,690 |
| | McGrath Rentcorp | 216,782 | 5,684 |
| *,^ | A123 Systems Inc. | 592,984 | 5,657 |
| | Heidrick & Struggles International Inc. | 196,498 | 5,630 |
| * | Amerco Inc. | 58,518 | 5,620 |
| | Tutor Perini Corp. | 255,626 | 5,473 |
| | US Ecology Inc. | 313,183 | 5,443 |
| | FreightCar America Inc. | 185,616 | 5,372 |
| * | Astec Industries Inc. | 164,635 | 5,336 |
| * | Consolidated Graphics Inc. | 109,720 | 5,314 |
| *,^ | EnerNOC Inc. | 221,346 | 5,292 |
| | Encore Wire Corp. | 210,466 | 5,278 |
| * | Celadon Group Inc. | 352,180 | 5,209 |
| | Tredegar Corp. | 265,475 | 5,145 |
| * | Rush Enterprises Inc. Class A | 249,407 | 5,098 |
| | G&K Services Inc. Class A | 163,103 | 5,042 |
| *,^ | Advanced Battery Technologies Inc. | 1,295,920 | 4,989 |
| * | Force Protection Inc. | 895,444 | 4,934 |
| * | 3D Systems Corp. | 151,199 | 4,761 |
| | AAON Inc. | 167,956 | 4,738 |
| | NACCO Industries Inc. Class A | 43,549 | 4,719 |
| * | NN Inc. | 380,938 | 4,708 |
| | Ennis Inc. | 275,079 | 4,704 |
| * | Higher One Holdings Inc. | 227,024 | 4,593 |
| * | Team Inc. | 189,272 | 4,580 |
| * | Flow International Corp. | 1,111,287 | 4,545 |
| | John Bean Technologies Corp. | 223,461 | 4,498 |
| | EnergySolutions Inc. | 794,762 | 4,427 |
| | Viad Corp. | 173,480 | 4,419 |
| | Apogee Enterprises Inc. | 324,190 | 4,367 |
| | Cascade Corp. | 92,273 | 4,363 |
| * | Aerovironment Inc. | 162,214 | 4,352 |
37
| | | |
| Vanguard® Total Stock Market Index Fund | | |
| Schedule of Investments | | |
| December 31, 2010 | | |
| |
| | | | Market |
| | | | Value |
| | | Shares | ($000) |
| | Gorman-Rupp Co. | 131,026 | 4,235 |
| * | M&F Worldwide Corp. | 181,846 | 4,201 |
| * | LB Foster Co. Class A | 102,576 | 4,199 |
| * | Astronics Corp. | 199,576 | 4,191 |
| | Standex International Corp. | 137,521 | 4,113 |
| * | RSC Holdings Inc. | 420,983 | 4,100 |
| * | Exponent Inc. | 107,245 | 4,025 |
| | Aceto Corp. | 445,177 | 4,007 |
| | AZZ Inc. | 99,743 | 3,991 |
| * | GenCorp Inc. | 761,539 | 3,937 |
| * | Greenbrier Cos. Inc. | 182,847 | 3,838 |
| *,^ | Genco Shipping & Trading Ltd. | 265,933 | 3,829 |
| * | Columbus McKinnon Corp. | 184,410 | 3,747 |
| *,^ | Ener1 Inc. | 981,124 | 3,718 |
| * | MYR Group Inc. | 174,233 | 3,659 |
| * | On Assignment Inc. | 446,862 | 3,642 |
| | Twin Disc Inc. | 119,237 | 3,560 |
| * | American Reprographics Co. | 463,675 | 3,519 |
| * | Hawaiian Holdings Inc. | 445,270 | 3,491 |
| * | Cenveo Inc. | 649,183 | 3,467 |
| * | Capstone Turbine Corp. | 3,559,491 | 3,416 |
| | Dynamic Materials Corp. | 151,221 | 3,413 |
| * | ACCO Brands Corp. | 398,796 | 3,398 |
| * | H&E Equipment Services Inc. | 291,592 | 3,374 |
| * | Kadant Inc. | 142,771 | 3,365 |
| * | ICF International Inc. | 129,721 | 3,336 |
| | Marten Transport Ltd. | 155,296 | 3,320 |
| | Houston Wire & Cable Co. | 242,036 | 3,253 |
| | HEICO Corp. | 63,723 | 3,252 |
| * | Taser International Inc. | 688,687 | 3,237 |
| | Great Lakes Dredge & Dock Corp. | 438,514 | 3,232 |
| * | Metalico Inc. | 538,480 | 3,166 |
| * | Generac Holdings Inc. | 195,376 | 3,159 |
| * | Orion Marine Group Inc. | 269,132 | 3,122 |
| * | CBIZ Inc. | 493,635 | 3,080 |
| * | Michael Baker Corp. | 98,888 | 3,075 |
| * | APAC Customer Services Inc. | 504,464 | 3,062 |
| | Federal Signal Corp. | 443,797 | 3,044 |
| | Insteel Industries Inc. | 243,504 | 3,041 |
| * | Furmanite Corp. | 438,966 | 3,033 |
| | CDI Corp. | 161,021 | 2,993 |
| * | FuelCell Energy Inc. | 1,292,365 | 2,985 |
| | Miller Industries Inc. | 205,837 | 2,929 |
| * | Dolan Co. | 206,862 | 2,880 |
| * | Titan Machinery Inc. | 149,126 | 2,878 |
| * | Air Transport Services Group Inc. | 362,033 | 2,860 |
| * | School Specialty Inc. | 205,304 | 2,860 |
| * | Gibraltar Industries Inc. | 210,341 | 2,854 |
| * | Quality Distribution Inc. | 308,419 | 2,804 |
| * | Powell Industries Inc. | 84,688 | 2,785 |
| | Ducommun Inc. | 127,381 | 2,774 |
| * | Trimas Corp. | 135,506 | 2,772 |
| * | Dynamex Inc. | 110,492 | 2,736 |
| * | KAR Auction Services Inc. | 191,692 | 2,645 |
| * | Commercial Vehicle Group Inc. | 162,245 | 2,636 |
| | American Woodmark Corp. | 103,787 | 2,547 |
| | Met-Pro Corp. | 214,584 | 2,534 |
| | Schawk Inc. Class A | 122,840 | 2,528 |
| * | Builders FirstSource Inc. | 1,276,378 | 2,514 |
| | Graham Corp. | 125,332 | 2,507 |
| | Vicor Corp. | 152,142 | 2,495 |
| *,^ | China BAK Battery Inc. | 1,253,443 | 2,419 |
| * | Innerworkings Inc. | 358,798 | 2,350 |
| | Ampco-Pittsburgh Corp. | 83,248 | 2,335 |
38
| | | |
| Vanguard® Total Stock Market Index Fund | | |
| Schedule of Investments | | |
| December 31, 2010 | | |
| |
| | | | Market |
| | | | Value |
| | | Shares | ($000) |
| * | Pacer International Inc. | 340,742 | 2,331 |
| | Alamo Group Inc. | 83,601 | 2,326 |
| * | Trex Co. Inc. | 96,418 | 2,310 |
| * | Eagle Bulk Shipping Inc. | 463,628 | 2,309 |
| *,^ | Valence Technology Inc. | 1,351,017 | 2,270 |
| * | Republic Airways Holdings Inc. | 305,799 | 2,238 |
| * | Satcon Technology Corp. | 493,163 | 2,219 |
| *,^ | Fushi Copperweld Inc. | 249,841 | 2,219 |
| | LSI Industries Inc. | 260,808 | 2,206 |
| * | Tecumseh Products Co. Class A | 165,910 | 2,165 |
| * | Casella Waste Systems Inc. Class A | 303,575 | 2,152 |
| * | Park-Ohio Holdings Corp. | 102,932 | 2,152 |
| * | RailAmerica Inc. | 165,617 | 2,145 |
| * | Pinnacle Airlines Corp. | 267,720 | 2,115 |
| * | Sterling Construction Co. Inc. | 158,718 | 2,070 |
| * | American Railcar Industries Inc. | 93,445 | 2,068 |
| * | GP Strategies Corp. | 193,797 | 1,984 |
| * | Fuel Tech Inc. | 203,161 | 1,973 |
| * | Lydall Inc. | 236,517 | 1,904 |
| | Barrett Business Services Inc. | 120,617 | 1,876 |
| * | Herley Industries Inc. | 106,129 | 1,838 |
| | International Shipholding Corp. | 72,152 | 1,833 |
| * | Saia Inc. | 108,405 | 1,798 |
| * | Broadwind Energy Inc. | 775,036 | 1,790 |
| | Lawson Products Inc. | 70,592 | 1,757 |
| * | DXP Enterprises Inc. | 72,132 | 1,731 |
| | Todd Shipyards Corp. | 76,118 | 1,704 |
| | Courier Corp. | 109,589 | 1,701 |
| * | CAI International Inc. | 86,625 | 1,698 |
| | Multi-Color Corp. | 86,434 | 1,682 |
| * | CRA International Inc. | 70,974 | 1,669 |
| * | Odyssey Marine Exploration Inc. | 592,756 | 1,648 |
| | Horizon Lines Inc. Class A | 375,490 | 1,641 |
| * | Pike Electric Corp. | 189,300 | 1,624 |
| * | Northwest Pipe Co. | 67,028 | 1,611 |
| * | Hurco Cos. Inc. | 67,604 | 1,599 |
| * | Rush Enterprises Inc. Class B | 88,113 | 1,584 |
| * | Hudson Highland Group Inc. | 270,260 | 1,576 |
| * | Standard Parking Corp. | 81,834 | 1,546 |
| * | WCA Waste Corp. | 310,518 | 1,503 |
| | Kimball International Inc. Class B | 213,755 | 1,475 |
| *,^ | Orion Energy Systems Inc. | 437,439 | 1,457 |
| * | LaBarge Inc. | 88,078 | 1,384 |
| * | NCI Building Systems Inc. | 98,483 | 1,378 |
| * | Energy Recovery Inc. | 374,514 | 1,371 |
| | Intersections Inc. | 130,939 | 1,370 |
| * | Ultralife Corp. | 207,203 | 1,370 |
| * | Willis Lease Finance Corp. | 104,923 | 1,367 |
| * | Innovative Solutions & Support Inc. | 238,521 | 1,352 |
| * | USA Truck Inc. | 99,517 | 1,317 |
| * | Volt Information Sciences Inc. | 151,544 | 1,311 |
| * | PMFG Inc. | 78,139 | 1,281 |
| * | LMI Aerospace Inc. | 80,102 | 1,281 |
| | VSE Corp. | 36,498 | 1,205 |
| | Superior Uniform Group Inc. | 107,163 | 1,179 |
| * | Kratos Defense & Security Solutions Inc. | 89,166 | 1,174 |
| * | Hill International Inc. | 166,935 | 1,080 |
| *,^ | YRC Worldwide Inc. | 285,724 | 1,063 |
| * | Active Power Inc. | 421,656 | 1,037 |
| *,^ | China Valves Technology Inc. | 96,737 | 1,014 |
| *,^ | SmartHeat Inc. | 187,797 | 992 |
| * | US Home Systems Inc. | 192,987 | 944 |
| * | PowerSecure International Inc. | 119,374 | 929 |
| * | UQM Technologies Inc. | 393,695 | 902 |
39
| | | |
| Vanguard® Total Stock Market Index Fund | | |
| Schedule of Investments | | |
| December 31, 2010 | | |
| |
| | | | Market |
| | | | Value |
| | | Shares | ($000) |
| * | United Capital Corp. | 27,624 | 898 |
| * | Universal Truckload Services Inc. | 54,784 | 872 |
| * | Perma-Fix Environmental Services | 504,100 | 827 |
| | Standard Register Co. | 238,394 | 813 |
| | Hardinge Inc. | 83,298 | 811 |
| * | Frozen Food Express Industries | 179,601 | 797 |
| *,^ | Altair Nanotechnologies Inc. | 272,668 | 753 |
| * | BlueLinx Holdings Inc. | 205,535 | 752 |
| * | Omega Flex Inc. | 43,249 | 715 |
| * | Magnetek Inc. | 513,668 | 693 |
| * | PAM Transportation Services Inc. | 61,373 | 689 |
| | LS Starrett Co. Class A | 57,946 | 677 |
| | Baltic Trading Ltd. | 65,876 | 673 |
| * | Covenant Transportation Group Inc. Class A | 66,725 | 649 |
| | Preformed Line Products Co. | 11,046 | 646 |
| * | Patriot Transportation Holding Inc. | 6,893 | 641 |
| * | SL Industries Inc. | 36,437 | 636 |
| *,^ | Lihua International Inc. | 54,093 | 608 |
| * | TBS International plc Class A | 205,666 | 592 |
| * | TRC Cos. Inc. | 151,253 | 529 |
| * | Plug Power Inc. | 1,305,500 | 484 |
| | Douglas Dynamics Inc. | 30,213 | 458 |
| | Hubbell Inc. Class A | 7,600 | 431 |
| | Virco Manufacturing | 159,426 | 415 |
| *,^ | Lime Energy Co. | 103,904 | 414 |
| *,^ | Hoku Corp. | 151,111 | 399 |
| * | Document Security Systems Inc. | 73,397 | 391 |
| * | Sypris Solutions Inc. | 91,511 | 390 |
| * | Integrated Electrical Services Inc. | 111,464 | 389 |
| * | Xerium Technologies Inc. | 21,911 | 349 |
| * | Ceco Environmental Corp. | 54,111 | 323 |
| * | Roadrunner Transportation Systems Inc. | 19,711 | 285 |
| * | AT Cross Co. Class A | 28,113 | 271 |
| * | Mistras Group Inc. | 19,631 | 265 |
| * | LECG Corp. | 183,248 | 253 |
| *,^ | Ascent Solar Technologies Inc. | 72,735 | 244 |
| * | Applied Energetics Inc. | 286,652 | 244 |
| * | Raytheon Co. Warrants Exp. 06/16/2011 | 19,938 | 174 |
| * | Argan Inc. | 16,586 | 154 |
| * | China Fire & Security Group Inc. | 23,147 | 152 |
| * | Ocean Power Technologies Inc. | 23,689 | 135 |
| *,^ | Akeena Solar Inc. | 276,849 | 131 |
| * | Franklin Covey Co. | 15,108 | 130 |
| * | Amrep Corp. | 10,401 | 125 |
| * | Innotrac Corp. | 73,831 | 107 |
| * | China Architectural Engineering Inc. | 65,465 | 104 |
| * | Key Technology Inc. | 5,309 | 90 |
| * | PGT Inc. | 24,655 | 60 |
| | Eastern Co. | 3,261 | 58 |
| * | Arotech Corp. | 12,222 | 20 |
| * | Duoyuan Printing Inc. | 3,743 | 11 |
| * | Innovaro Inc. | 3,814 | 5 |
| * | Heritage-Crystal Clean Inc. | 47 | — |
| | | | 17,193,450 |
| Information Technology (18.6%) | | |
| * | Apple Inc. | 9,637,108 | 3,108,546 |
| | Microsoft Corp. | 82,156,540 | 2,293,811 |
| | International Business Machines Corp. | 13,304,985 | 1,952,640 |
| * | Google Inc. Class A | 2,599,875 | 1,544,248 |
| | Oracle Corp. | 42,417,288 | 1,327,661 |
| | Intel Corp. | 58,736,536 | 1,235,229 |
| * | Cisco Systems Inc. | 60,245,714 | 1,218,771 |
| | Hewlett-Packard Co. | 24,622,736 | 1,036,617 |
40
| | | |
| Vanguard® Total Stock Market Index Fund | | |
| Schedule of Investments | | |
| December 31, 2010 | | |
| |
| | | | Market |
| | | | Value |
| | | Shares | ($000) |
| | QUALCOMM Inc. | 16,930,085 | 837,870 |
| * | EMC Corp. | 21,658,896 | 495,989 |
| | Texas Instruments Inc. | 12,603,396 | 409,610 |
| | Visa Inc. Class A | 5,239,474 | 368,754 |
| * | eBay Inc. | 12,453,638 | 346,585 |
| | Accenture plc Class A | 6,720,306 | 325,868 |
| | Corning Inc. | 16,479,532 | 318,385 |
| | Mastercard Inc. Class A | 1,128,194 | 252,840 |
| * | Dell Inc. | 18,467,168 | 250,230 |
| | Automatic Data Processing Inc. | 5,192,178 | 240,294 |
| * | Cognizant Technology Solutions Corp. Class A | 3,174,652 | 232,670 |
| * | Yahoo! Inc. | 13,515,789 | 224,768 |
| * | Motorola Inc. | 23,394,677 | 212,190 |
| * | NetApp Inc. | 3,767,677 | 207,072 |
| | Broadcom Corp. Class A | 4,730,351 | 206,007 |
| * | Juniper Networks Inc. | 5,485,835 | 202,537 |
| | Applied Materials Inc. | 14,170,555 | 199,096 |
| * | Adobe Systems Inc. | 5,538,427 | 170,473 |
| | Xerox Corp. | 14,583,288 | 167,999 |
| | Tyco Electronics Ltd. | 4,713,577 | 166,861 |
| * | Salesforce.com Inc. | 1,221,416 | 161,227 |
| * | Intuit Inc. | 3,146,725 | 155,134 |
| * | Symantec Corp. | 8,324,123 | 139,346 |
| * | Citrix Systems Inc. | 1,971,270 | 134,855 |
| | Western Union Co. | 6,971,115 | 129,454 |
| * | SanDisk Corp. | 2,460,099 | 122,661 |
| | Analog Devices Inc. | 3,147,719 | 118,575 |
| | Altera Corp. | 3,243,223 | 115,394 |
| * | F5 Networks Inc. | 849,702 | 110,597 |
| * | Marvell Technology Group Ltd. | 5,834,870 | 108,237 |
| | CA Inc. | 4,363,315 | 106,639 |
| | Paychex Inc. | 3,435,647 | 106,196 |
| | Amphenol Corp. Class A | 1,837,188 | 96,967 |
| * | NVIDIA Corp. | 6,061,487 | 93,347 |
| * | Fiserv Inc. | 1,587,514 | 92,965 |
| * | Autodesk Inc. | 2,403,941 | 91,831 |
| * | Red Hat Inc. | 1,995,792 | 91,108 |
| * | Akamai Technologies Inc. | 1,918,566 | 90,269 |
| * | BMC Software Inc. | 1,888,892 | 89,042 |
| * | Western Digital Corp. | 2,422,862 | 82,135 |
| | Linear Technology Corp. | 2,371,124 | 82,017 |
| | Computer Sciences Corp. | 1,630,740 | 80,885 |
| | Xilinx Inc. | 2,734,678 | 79,251 |
| *,^ | First Solar Inc. | 588,056 | 76,530 |
| * | Micron Technology Inc. | 9,453,194 | 75,815 |
| * | Seagate Technology plc | 4,983,703 | 74,905 |
| | Maxim Integrated Products Inc. | 3,155,901 | 74,542 |
| * | McAfee Inc. | 1,605,957 | 74,372 |
| | Fidelity National Information Services Inc. | 2,689,835 | 73,675 |
| * | Teradata Corp. | 1,767,115 | 72,734 |
| | Activision Blizzard Inc. | 5,828,688 | 72,509 |
| * | Cree Inc. | 1,084,618 | 71,465 |
| | KLA-Tencor Corp. | 1,775,060 | 68,588 |
| * | VMware Inc. Class A | 769,654 | 68,430 |
| * | Lam Research Corp. | 1,312,155 | 67,943 |
| * | Rovi Corp. | 1,087,628 | 67,444 |
| ^ | Microchip Technology Inc. | 1,960,531 | 67,070 |
| * | Flextronics International Ltd. | 8,311,536 | 65,246 |
| * | SAIC Inc. | 4,015,942 | 63,693 |
| | Harris Corp. | 1,365,518 | 61,858 |
| | VeriSign Inc. | 1,842,424 | 60,192 |
| * | Atmel Corp. | 4,866,412 | 59,954 |
| * | Electronic Arts Inc. | 3,495,490 | 57,256 |
41
| | | |
| Vanguard® Total Stock Market Index Fund | | |
| Schedule of Investments | | |
| December 31, 2010 | | |
| |
| | | | Market |
| | | | Value |
| | | Shares | ($000) |
| * | Skyworks Solutions Inc. | 1,894,034 | 54,226 |
| * | Avnet Inc. | 1,601,692 | 52,904 |
| * | Trimble Navigation Ltd. | 1,278,633 | 51,056 |
| * | ANSYS Inc. | 954,714 | 49,712 |
| * | FLIR Systems Inc. | 1,669,100 | 49,656 |
| * | Advanced Micro Devices Inc. | 6,068,209 | 49,638 |
| * | Riverbed Technology Inc. | 1,300,123 | 45,725 |
| * | Nuance Communications Inc. | 2,494,635 | 45,352 |
| * | ON Semiconductor Corp. | 4,548,403 | 44,938 |
| | Factset Research Systems Inc. | 466,849 | 43,772 |
| * | Informatica Corp. | 981,859 | 43,231 |
| * | Arrow Electronics Inc. | 1,246,862 | 42,705 |
| * | Synopsys Inc. | 1,561,027 | 42,007 |
| | Jabil Circuit Inc. | 2,072,809 | 41,643 |
| * | LSI Corp. | 6,793,072 | 40,690 |
| *,^ | Alliance Data Systems Corp. | 557,064 | 39,568 |
| | Global Payments Inc. | 847,062 | 39,143 |
| | Avago Technologies Ltd. | 1,372,887 | 39,086 |
| * | Equinix Inc. | 479,317 | 38,949 |
| | Solera Holdings Inc. | 744,352 | 38,200 |
| * | Dolby Laboratories Inc. Class A | 562,635 | 37,528 |
| * | MICROS Systems Inc. | 852,874 | 37,407 |
| * | Polycom Inc. | 902,000 | 35,160 |
| * | VeriFone Systems Inc. | 908,910 | 35,048 |
| | National Semiconductor Corp. | 2,546,292 | 35,037 |
| * | TIBCO Software Inc. | 1,735,581 | 34,208 |
| * | JDS Uniphase Corp. | 2,357,376 | 34,135 |
| * | Ingram Micro Inc. | 1,668,269 | 31,847 |
| * | Novellus Systems Inc. | 976,614 | 31,564 |
| * | CommScope Inc. | 1,008,546 | 31,487 |
| *,^ | Rackspace Hosting Inc. | 996,878 | 31,312 |
| * | Monster Worldwide Inc. | 1,298,284 | 30,678 |
| * | Cypress Semiconductor Corp. | 1,611,785 | 29,947 |
| * | WebMD Health Corp. | 581,869 | 29,710 |
| | Broadridge Financial Solutions Inc. | 1,336,821 | 29,316 |
| * | Varian Semiconductor Equipment Associates Inc. | 789,391 | 29,184 |
| | Lender Processing Services Inc. | 986,384 | 29,118 |
| * | Lexmark International Inc. Class A | 831,441 | 28,951 |
| * | IAC/InterActiveCorp | 968,769 | 27,804 |
| * | Compuware Corp. | 2,380,830 | 27,784 |
| * | Parametric Technology Corp. | 1,222,244 | 27,537 |
| | Total System Services Inc. | 1,785,590 | 27,462 |
| * | Gartner Inc. | 816,900 | 27,121 |
| * | Teradyne Inc. | 1,930,900 | 27,110 |
| * | MEMC Electronic Materials Inc. | 2,399,911 | 27,023 |
| * | AOL Inc. | 1,139,154 | 27,009 |
| * | Atheros Communications Inc. | 750,712 | 26,966 |
| * | Vishay Intertechnology Inc. | 1,819,412 | 26,709 |
| * | NCR Corp. | 1,713,276 | 26,333 |
| | Tellabs Inc. | 3,842,501 | 26,052 |
| | Jack Henry & Associates Inc. | 868,146 | 25,306 |
| * | Rambus Inc. | 1,213,894 | 24,861 |
| * | Brocade Communications Systems Inc. | 4,687,902 | 24,799 |
| * | Concur Technologies Inc. | 466,017 | 24,200 |
| * | Itron Inc. | 430,994 | 23,899 |
| * | Cadence Design Systems Inc. | 2,879,353 | 23,783 |
| * | Tech Data Corp. | 537,795 | 23,674 |
| | National Instruments Corp. | 624,655 | 23,512 |
| * | Zebra Technologies Corp. | 615,676 | 23,390 |
| * | Ariba Inc. | 962,408 | 22,607 |
| | Diebold Inc. | 701,978 | 22,498 |
| * | International Rectifier Corp. | 752,722 | 22,348 |
| * | Novell Inc. | 3,720,372 | 22,025 |
| | ADTRAN Inc. | 598,153 | 21,659 |
42
| | | |
| Vanguard® Total Stock Market Index Fund | | |
| Schedule of Investments | | |
| December 31, 2010 | | |
| |
| | | | Market |
| | | | Value |
| | | Shares | ($000) |
| * | Finisar Corp. | 726,522 | 21,570 |
| * | VistaPrint NV | 468,019 | 21,529 |
| * | Silicon Laboratories Inc. | 458,043 | 21,079 |
| * | PMC - Sierra Inc. | 2,447,862 | 21,027 |
| * | NeuStar Inc. Class A | 800,493 | 20,853 |
| *,^ | Ciena Corp. | 989,619 | 20,831 |
| * | Fairchild Semiconductor International Inc. Class A | 1,323,456 | 20,659 |
| * | Sohu.com Inc. | 323,047 | 20,510 |
| * | Microsemi Corp. | 887,997 | 20,335 |
| | Intersil Corp. Class A | 1,322,598 | 20,196 |
| * | RF Micro Devices Inc. | 2,741,447 | 20,150 |
| * | QLogic Corp. | 1,152,980 | 19,624 |
| * | InterDigital Inc. | 469,540 | 19,552 |
| * | TriQuint Semiconductor Inc. | 1,658,876 | 19,392 |
| | Plantronics Inc. | 514,320 | 19,143 |
| * | Progress Software Corp. | 450,997 | 19,086 |
| * | Netlogic Microsystems Inc. | 604,924 | 19,001 |
| * | MercadoLibre Inc. | 282,632 | 18,837 |
| * | Quest Software Inc. | 672,670 | 18,660 |
| *,^ | Veeco Instruments Inc. | 431,947 | 18,556 |
| | Anixter International Inc. | 305,921 | 18,273 |
| * | Wright Express Corp. | 386,087 | 17,760 |
| | DST Systems Inc. | 399,513 | 17,718 |
| | CoreLogic Inc. | 954,535 | 17,678 |
| * | Acme Packet Inc. | 329,017 | 17,491 |
| * | Convergys Corp. | 1,326,976 | 17,476 |
| * | CACI International Inc. Class A | 323,580 | 17,279 |
| * | Viasat Inc. | 386,192 | 17,151 |
| * | Omnivision Technologies Inc. | 566,426 | 16,772 |
| * | Aruba Networks Inc. | 795,223 | 16,604 |
| * | Genpact Ltd. | 1,055,111 | 16,038 |
| * | Hittite Microwave Corp. | 260,743 | 15,916 |
| | Molex Inc. | 698,697 | 15,874 |
| * | Arris Group Inc. | 1,350,124 | 15,148 |
| * | Semtech Corp. | 664,332 | 15,040 |
| * | GSI Commerce Inc. | 633,790 | 14,704 |
| * | SuccessFactors Inc. | 506,511 | 14,669 |
| * | Digital River Inc. | 423,363 | 14,572 |
| * | Cavium Networks Inc. | 380,930 | 14,353 |
| *,^ | Blackboard Inc. | 346,718 | 14,319 |
| | Molex Inc. Class A | 757,865 | 14,301 |
| * | j2 Global Communications Inc. | 484,311 | 14,021 |
| * | ValueClick Inc. | 870,538 | 13,955 |
| | Sapient Corp. | 1,150,582 | 13,922 |
| * | Acxiom Corp. | 811,714 | 13,921 |
| * | Spansion Inc. Class A | 668,165 | 13,831 |
| * | Mentor Graphics Corp. | 1,141,441 | 13,697 |
| * | Cymer Inc. | 303,101 | 13,661 |
| * | Lawson Software Inc. | 1,474,383 | 13,638 |
| | Syntel Inc. | 285,214 | 13,630 |
| * | Blue Coat Systems Inc. | 450,851 | 13,467 |
| * | Plexus Corp. | 433,209 | 13,403 |
| * | Fortinet Inc. | 411,097 | 13,299 |
| * | Netgear Inc. | 376,577 | 12,683 |
| * | Ultimate Software Group Inc. | 259,001 | 12,595 |
| * | CommVault Systems Inc. | 439,062 | 12,566 |
| * | MKS Instruments Inc. | 508,833 | 12,461 |
| | Blackbaud Inc. | 479,283 | 12,413 |
| * | Benchmark Electronics Inc. | 677,539 | 12,304 |
| | MAXIMUS Inc. | 186,951 | 12,260 |
| * | Coherent Inc. | 270,373 | 12,205 |
| | Power Integrations Inc. | 303,707 | 12,191 |
| * | Tessera Technologies Inc. | 540,615 | 11,975 |
| * | Rofin-Sinar Technologies Inc. | 337,583 | 11,964 |
43
| | | |
| Vanguard® Total Stock Market Index Fund | | |
| Schedule of Investments | | |
| December 31, 2010 | | |
| |
| | | | Market |
| | | | Value |
| | | Shares | ($000) |
| * | Aspen Technology Inc. | 940,615 | 11,946 |
| | Cognex Corp. | 404,742 | 11,908 |
| * | JDA Software Group Inc. | 425,106 | 11,903 |
| * | Unisys Corp. | 452,477 | 11,715 |
| * | Loral Space & Communications Inc. | 151,275 | 11,573 |
| * | Integrated Device Technology Inc. | 1,696,238 | 11,297 |
| * | Take-Two Interactive Software Inc. | 914,136 | 11,189 |
| | Littelfuse Inc. | 236,263 | 11,119 |
| * | Cirrus Logic Inc. | 688,815 | 11,007 |
| *,^ | Ebix Inc. | 454,528 | 10,759 |
| * | L-1 Identity Solutions Inc. | 896,585 | 10,678 |
| * | TiVo Inc. | 1,235,707 | 10,664 |
| *,^ | Synaptics Inc. | 362,171 | 10,641 |
| * | Taleo Corp. Class A | 384,503 | 10,631 |
| *,^ | Power-One Inc. | 1,033,008 | 10,537 |
| | Fair Isaac Corp. | 448,315 | 10,477 |
| * | Advent Software Inc. | 177,096 | 10,257 |
| * | Universal Display Corp. | 333,825 | 10,232 |
| * | Sanmina-SCI Corp. | 890,372 | 10,221 |
| * | Cabot Microelectronics Corp. | 242,605 | 10,056 |
| * | TeleTech Holdings Inc. | 487,041 | 10,028 |
| * | FEI Co. | 379,386 | 10,020 |
| | Earthlink Inc. | 1,160,777 | 9,983 |
| *,^ | Constant Contact Inc. | 320,816 | 9,942 |
| * | Entegris Inc. | 1,316,426 | 9,834 |
| * | Mantech International Corp. Class A | 237,508 | 9,816 |
| * | EchoStar Corp. Class A | 389,741 | 9,732 |
| * | Emulex Corp. | 820,404 | 9,566 |
| * | Infinera Corp. | 922,868 | 9,533 |
| * | Websense Inc. | 469,493 | 9,507 |
| * | SRA International Inc. Class A | 463,525 | 9,479 |
| * | ACI Worldwide Inc. | 352,014 | 9,459 |
| *,^ | STEC Inc. | 530,625 | 9,366 |
| *,^ | AsiaInfo-Linkage Inc. | 558,389 | 9,252 |
| * | Amkor Technology Inc. | 1,215,926 | 8,986 |
| * | TTM Technologies Inc. | 595,568 | 8,880 |
| * | MIPS Technologies Inc. Class A | 582,707 | 8,834 |
| * | Sonic Solutions Inc. | 583,679 | 8,755 |
| * | Diodes Inc. | 324,152 | 8,749 |
| * | OpenTable Inc. | 123,428 | 8,699 |
| * | Art Technology Group Inc. | 1,448,814 | 8,664 |
| * | Lattice Semiconductor Corp. | 1,429,258 | 8,661 |
| * | DTS Inc. | 176,253 | 8,645 |
| | Comtech Telecommunications Corp. | 304,683 | 8,449 |
| * | SAVVIS Inc. | 327,728 | 8,364 |
| * | Silicon Image Inc. | 1,136,715 | 8,355 |
| * | MicroStrategy Inc. Class A | 97,039 | 8,294 |
| * | DealerTrack Holdings Inc. | 411,632 | 8,261 |
| * | GT Solar International Inc. | 904,566 | 8,250 |
| * | Scansource Inc. | 257,320 | 8,208 |
| * | Sonus Networks Inc. | 3,070,744 | 8,199 |
| * | Verigy Ltd. | 627,210 | 8,166 |
| * | Euronet Worldwide Inc. | 459,536 | 8,014 |
| * | Checkpoint Systems Inc. | 383,279 | 7,876 |
| * | Entropic Communications Inc. | 651,329 | 7,868 |
| * | Tekelec | 652,579 | 7,772 |
| * | Manhattan Associates Inc. | 253,380 | 7,738 |
| * | Stratasys Inc. | 235,034 | 7,672 |
| * | Applied Micro Circuits Corp. | 712,464 | 7,609 |
| * | DG FastChannel Inc. | 263,006 | 7,596 |
| | Black Box Corp. | 197,973 | 7,580 |
| *,^ | SunPower Corp. Class A | 590,520 | 7,576 |
| * | Ixia | 450,523 | 7,560 |
| | Micrel Inc. | 578,962 | 7,521 |
44
| | | |
| Vanguard® Total Stock Market Index Fund | | |
| Schedule of Investments | | |
| December 31, 2010 | | |
| |
| | | | Market |
| | | | Value |
| | | Shares | ($000) |
| * | Compellent Technologies Inc. | 271,886 | 7,501 |
| * | THQ Inc. | 1,235,734 | 7,489 |
| * | Harmonic Inc. | 869,541 | 7,452 |
| * | IPG Photonics Corp. | 222,134 | 7,024 |
| * | RealNetworks Inc. | 1,667,679 | 7,004 |
| * | RightNow Technologies Inc. | 295,477 | 6,994 |
| * | Rogers Corp. | 182,282 | 6,972 |
| | AVX Corp. | 447,190 | 6,900 |
| * | Smith Micro Software Inc. | 433,670 | 6,826 |
| * | Intermec Inc. | 537,739 | 6,808 |
| * | Quantum Corp. | 1,817,603 | 6,761 |
| * | OSI Systems Inc. | 182,855 | 6,649 |
| * | Brooks Automation Inc. | 732,503 | 6,644 |
| * | Synchronoss Technologies Inc. | 246,491 | 6,584 |
| * | Newport Corp. | 373,043 | 6,480 |
| * | Measurement Specialties Inc. | 220,637 | 6,476 |
| * | Ultratech Inc. | 325,607 | 6,473 |
| * | Tyler Technologies Inc. | 306,778 | 6,369 |
| * | Volterra Semiconductor Corp. | 274,694 | 6,362 |
| | iGate Corp. | 318,760 | 6,283 |
| * | Ancestry.com Inc. | 218,892 | 6,199 |
| * | Radiant Systems Inc. | 316,490 | 6,194 |
| * | SYNNEX Corp. | 197,849 | 6,173 |
| | United Online Inc. | 931,195 | 6,146 |
| * | Brightpoint Inc. | 703,963 | 6,146 |
| * | Terremark Worldwide Inc. | 471,792 | 6,110 |
| * | Insight Enterprises Inc. | 462,960 | 6,093 |
| * | Standard Microsystems Corp. | 210,215 | 6,060 |
| * | Hypercom Corp. | 722,915 | 6,051 |
| * | Avid Technology Inc. | 345,573 | 6,034 |
| * | ATMI Inc. | 302,279 | 6,027 |
| * | CSG Systems International Inc. | 315,626 | 5,978 |
| * | Sourcefire Inc. | 229,322 | 5,946 |
| * | SunPower Corp. Class B | 475,649 | 5,903 |
| * | Netscout Systems Inc. | 251,291 | 5,782 |
| * | Net 1 UEPS Technologies Inc. | 470,498 | 5,768 |
| * | Electronics for Imaging Inc. | 402,069 | 5,754 |
| * | Oclaro Inc. | 426,502 | 5,608 |
| * | Zoran Corp. | 636,765 | 5,604 |
| | MTS Systems Corp. | 148,468 | 5,562 |
| | Forrester Research Inc. | 156,287 | 5,515 |
| * | LTX-Credence Corp. | 741,901 | 5,490 |
| * | Epicor Software Corp. | 541,707 | 5,471 |
| * | Maxwell Technologies Inc. | 286,631 | 5,414 |
| * | Bottomline Technologies Inc. | 246,846 | 5,359 |
| | Heartland Payment Systems Inc. | 339,911 | 5,241 |
| * | LogMeIn Inc. | 116,788 | 5,178 |
| * | Monolithic Power Systems Inc. | 312,630 | 5,165 |
| * | ExlService Holdings Inc. | 239,269 | 5,139 |
| * | Mercury Computer Systems Inc. | 278,795 | 5,124 |
| | Pegasystems Inc. | 136,288 | 4,992 |
| * | support.com Inc. | 769,293 | 4,985 |
| *,^ | Travelzoo Inc. | 119,936 | 4,944 |
| | Park Electrochemical Corp. | 164,517 | 4,936 |
| * | Cardtronics Inc. | 275,520 | 4,877 |
| * | SolarWinds Inc. | 249,828 | 4,809 |
| * | comScore Inc. | 215,006 | 4,797 |
| | Opnet Technologies Inc. | 178,755 | 4,785 |
| * | Magma Design Automation Inc. | 951,702 | 4,768 |
| * | Electro Scientific Industries Inc. | 292,454 | 4,688 |
| * | Move Inc. | 1,811,214 | 4,655 |
| * | FARO Technologies Inc. | 141,503 | 4,647 |
| * | Advanced Energy Industries Inc. | 339,516 | 4,631 |
| * | Kulicke & Soffa Industries Inc. | 640,024 | 4,608 |
45
| | | |
| Vanguard® Total Stock Market Index Fund | | |
| Schedule of Investments | | |
| December 31, 2010 | | |
| |
| | | | Market |
| | | | Value |
| | | Shares | ($000) |
| * | Sigma Designs Inc. | 322,198 | 4,566 |
| | EPIQ Systems Inc. | 330,890 | 4,543 |
| * | Kenexa Corp. | 205,141 | 4,470 |
| * | FormFactor Inc. | 497,536 | 4,418 |
| * | NVE Corp. | 75,177 | 4,347 |
| | Daktronics Inc. | 272,672 | 4,341 |
| * | Knot Inc. | 435,031 | 4,298 |
| * | S1 Corp. | 621,355 | 4,287 |
| * | TNS Inc. | 205,668 | 4,278 |
| * | SMART Modular Technologies WWH Inc. | 737,898 | 4,250 |
| * | Oplink Communications Inc. | 229,437 | 4,238 |
| ^ | VirnetX Holding Corp. | 277,292 | 4,118 |
| * | Echelon Corp. | 400,622 | 4,082 |
| * | Anadigics Inc. | 585,222 | 4,056 |
| * | LivePerson Inc. | 352,301 | 3,981 |
| | NIC Inc. | 407,967 | 3,961 |
| * | BroadSoft Inc. | 163,664 | 3,908 |
| * | Vocus Inc. | 141,275 | 3,908 |
| | Methode Electronics Inc. | 300,146 | 3,893 |
| * | NetSuite Inc. | 155,192 | 3,880 |
| * | Verint Systems Inc. | 120,930 | 3,833 |
| * | Sycamore Networks Inc. | 184,581 | 3,801 |
| *,^ | QuinStreet Inc. | 193,484 | 3,717 |
| *,^ | Rubicon Technology Inc. | 175,357 | 3,697 |
| * | Ceva Inc. | 179,490 | 3,680 |
| * | Symmetricom Inc. | 518,169 | 3,674 |
| * | Limelight Networks Inc. | 612,444 | 3,558 |
| * | LoopNet Inc. | 315,873 | 3,509 |
| * | Imation Corp. | 334,740 | 3,451 |
| * | Novatel Wireless Inc. | 357,542 | 3,415 |
| * | LeCroy Corp. | 342,209 | 3,367 |
| * | ModusLink Global Solutions Inc. | 493,590 | 3,307 |
| * | IXYS Corp. | 277,299 | 3,222 |
| * | Interactive Intelligence Inc. | 123,061 | 3,219 |
| * | Supertex Inc. | 131,458 | 3,179 |
| * | Dice Holdings Inc. | 221,054 | 3,172 |
| * | Perficient Inc. | 252,858 | 3,161 |
| | CTS Corp. | 284,566 | 3,147 |
| * | Zix Corp. | 734,019 | 3,134 |
| * | Globecomm Systems Inc. | 313,240 | 3,132 |
| * | UTStarcom Inc. | 1,484,184 | 3,057 |
| * | Aviat Networks Inc. | 602,768 | 3,056 |
| * | Integrated Silicon Solution Inc. | 379,884 | 3,050 |
| * | Infospace Inc. | 365,546 | 3,034 |
| | Keynote Systems Inc. | 207,484 | 3,033 |
| * | KVH Industries Inc. | 252,691 | 3,020 |
| * | Monotype Imaging Holdings Inc. | 270,498 | 3,003 |
| * | Lionbridge Technologies Inc. | 811,768 | 2,995 |
| * | Kopin Corp. | 718,240 | 2,988 |
| *,^ | KIT Digital Inc. | 184,861 | 2,965 |
| | Cohu Inc. | 177,931 | 2,950 |
| * | Intevac Inc. | 208,709 | 2,924 |
| * | Kemet Corp. | 198,379 | 2,892 |
| * | Extreme Networks | 935,733 | 2,891 |
| * | PROS Holdings Inc. | 250,028 | 2,848 |
| * | Anaren Inc. | 135,087 | 2,817 |
| | Electro Rent Corp. | 173,066 | 2,797 |
| * | EMS Technologies Inc. | 141,103 | 2,791 |
| * | Pericom Semiconductor Corp. | 251,642 | 2,763 |
| *,^ | China Security & Surveillance Technology Inc. | 501,740 | 2,674 |
| * | Hackett Group Inc. | 750,678 | 2,635 |
| *,^ | Energy Conversion Devices Inc. | 570,590 | 2,625 |
| | Telular Corp. | 382,126 | 2,545 |
| | DDi Corp. | 215,359 | 2,533 |
46
| | | |
| Vanguard® Total Stock Market Index Fund | | |
| Schedule of Investments | | |
| December 31, 2010 | | |
| |
| | | | Market |
| | | | Value |
| | | Shares | ($000) |
| *,^ | Evergreen Solar Inc. | 4,336,057 | 2,528 |
| | Stamps.com Inc. | 189,778 | 2,515 |
| * | TeleCommunication Systems Inc. Class A | 535,475 | 2,501 |
| *,^ | Vishay Precision Group Inc. | 131,531 | 2,478 |
| * | VASCO Data Security International Inc. | 300,167 | 2,440 |
| * | Cogo Group Inc. | 274,630 | 2,430 |
| | Marchex Inc. Class B | 254,225 | 2,425 |
| * | Global Cash Access Holdings Inc. | 758,079 | 2,418 |
| * | Digi International Inc. | 217,702 | 2,416 |
| * | Gerber Scientific Inc. | 305,193 | 2,402 |
| *,^ | Wave Systems Corp. Class A | 605,056 | 2,384 |
| * | Axcelis Technologies Inc. | 687,103 | 2,377 |
| | American Software Inc. Class A | 349,988 | 2,369 |
| | Cass Information Systems Inc. | 61,908 | 2,349 |
| * | Seachange International Inc. | 273,836 | 2,341 |
| * | Online Resources Corp. | 501,235 | 2,331 |
| | Bel Fuse Inc. Class B | 97,366 | 2,327 |
| * | Silicon Graphics International Corp. | 257,318 | 2,324 |
| * | ShoreTel Inc. | 292,157 | 2,282 |
| * | Advanced Analogic Technologies Inc. | 567,513 | 2,276 |
| * | Spectrum Control Inc. | 151,647 | 2,273 |
| * | Exar Corp. | 324,438 | 2,265 |
| * | Multi-Fineline Electronix Inc. | 83,979 | 2,225 |
| * | Super Micro Computer Inc. | 191,493 | 2,210 |
| * | Saba Software Inc. | 360,339 | 2,205 |
| * | Powerwave Technologies Inc. | 859,444 | 2,183 |
| * | Mindspeed Technologies Inc. | 343,467 | 2,095 |
| * | Web.com Group Inc. | 245,489 | 2,074 |
| * | Ciber Inc. | 439,445 | 2,057 |
| * | DemandTec Inc. | 188,548 | 2,044 |
| * | DSP Group Inc. | 249,619 | 2,032 |
| * | Openwave Systems Inc. | 954,994 | 2,025 |
| * | Rimage Corp. | 133,488 | 1,990 |
| * | Agilysys Inc. | 348,748 | 1,963 |
| * | Dynamics Research Corp. | 146,212 | 1,959 |
| * | NU Horizons Electronics Corp. | 277,296 | 1,933 |
| * | Photronics Inc. | 323,713 | 1,913 |
| | Renaissance Learning Inc. | 159,244 | 1,885 |
| * | Integral Systems Inc. | 187,964 | 1,863 |
| | Richardson Electronics Ltd. | 157,827 | 1,845 |
| * | QuickLogic Corp. | 289,115 | 1,842 |
| * | Bsquare Corp. | 208,268 | 1,822 |
| * | Ultra Clean Holdings | 193,977 | 1,806 |
| * | X-Rite Inc. | 393,195 | 1,797 |
| * | Radisys Corp. | 199,597 | 1,776 |
| * | Rudolph Technologies Inc. | 214,802 | 1,768 |
| * | Internap Network Services Corp. | 288,389 | 1,753 |
| * | Pulse Electronics Corp. | 327,955 | 1,745 |
| * | MoSys Inc. | 305,177 | 1,736 |
| * | Transact Technologies Inc. | 183,229 | 1,717 |
| * | AXT Inc. | 163,788 | 1,710 |
| * | Zygo Corp. | 139,414 | 1,705 |
| * | SS&C Technologies Holdings Inc. | 82,393 | 1,690 |
| *,^ | Rosetta Stone Inc. | 78,724 | 1,671 |
| * | Computer Task Group Inc. | 151,270 | 1,646 |
| * | Comverge Inc. | 235,639 | 1,628 |
| * | PRGX Global Inc. | 256,593 | 1,624 |
| * | MoneyGram International Inc. | 589,588 | 1,598 |
| * | PC Mall Inc. | 205,458 | 1,555 |
| * | Liquidity Services Inc. | 109,408 | 1,537 |
| * | LoJack Corp. | 234,486 | 1,515 |
| * | Cray Inc. | 205,843 | 1,472 |
| * | SRS Labs Inc. | 165,949 | 1,462 |
| *,^ | China Information Technology Inc. | 277,233 | 1,444 |
47
| | | |
| Vanguard® Total Stock Market Index Fund | | |
| Schedule of Investments | | |
| December 31, 2010 | | |
| |
| | | | Market |
| | | | Value |
| | | Shares | ($000) |
| * | Mattson Technology Inc. | 480,645 | 1,442 |
| * | Actuate Corp. | 250,287 | 1,427 |
| * | FalconStor Software Inc. | 425,727 | 1,426 |
| * | GSE Systems Inc. | 393,436 | 1,424 |
| * | Ness Technologies Inc. | 233,577 | 1,387 |
| * | Westell Technologies Inc. Class A | 417,176 | 1,364 |
| * | Pervasive Software Inc. | 259,825 | 1,341 |
| * | Trident Microsystems Inc. | 746,499 | 1,329 |
| *,^ | Microvision Inc. | 712,651 | 1,326 |
| * | Tollgrade Communications Inc. | 141,677 | 1,315 |
| * | LaserCard Corp. | 202,658 | 1,265 |
| * | Immersion Corp. | 186,322 | 1,250 |
| * | RAE Systems Inc. | 775,605 | 1,249 |
| * | Calix Inc. | 69,975 | 1,183 |
| * | Ramtron International Corp. | 350,497 | 1,181 |
| * | Nanometrics Inc. | 89,755 | 1,152 |
| * | Emcore Corp. | 1,045,794 | 1,129 |
| * | Conexant Systems Inc. | 690,751 | 1,126 |
| * | BigBand Networks Inc. | 394,841 | 1,106 |
| * | NCI Inc. Class A | 46,740 | 1,075 |
| * | PC-Tel Inc. | 177,982 | 1,068 |
| * | PC Connection Inc. | 118,614 | 1,051 |
| * | Concurrent Computer Corp. | 207,336 | 1,045 |
| | TheStreet.com Inc. | 383,875 | 1,025 |
| * | Virtusa Corp. | 59,711 | 977 |
| | Ipass Inc. | 780,202 | 975 |
| * | ORBCOMM Inc. | 375,543 | 973 |
| * | iGO Inc. | 239,547 | 920 |
| * | FSI International Inc. | 206,497 | 913 |
| * | StarTek Inc. | 179,399 | 910 |
| | Evolving Systems Inc. | 105,890 | 881 |
| * | CPI International Inc. | 44,673 | 864 |
| * | PLX Technology Inc. | 236,220 | 853 |
| * | Network Equipment Technologies Inc. | 182,022 | 843 |
| * | Cyberoptics Corp. | 98,614 | 842 |
| * | Callidus Software Inc. | 164,462 | 829 |
| * | Datalink Corp. | 171,256 | 827 |
| *,^ | Research Frontiers Inc. | 154,525 | 822 |
| * | PAR Technology Corp. | 138,968 | 793 |
| * | Innodata Isogen Inc. | 278,199 | 793 |
| * | Reis Inc. | 112,419 | 787 |
| | Imergent Inc. | 150,388 | 675 |
| * | Fabrinet | 30,125 | 648 |
| * | Hutchinson Technology Inc. | 174,346 | 647 |
| * | Aware Inc. | 223,308 | 625 |
| * | PDF Solutions Inc. | 129,562 | 624 |
| * | ID Systems Inc. | 182,589 | 604 |
| * | QAD Inc. Class A | 64,048 | 583 |
| * | CalAmp Corp. | 180,376 | 566 |
| * | Opnext Inc. | 320,667 | 564 |
| * | LRAD Corp. | 200,003 | 538 |
| * | Digimarc Corp. | 17,354 | 521 |
| * | Pixelworks Inc. | 144,289 | 505 |
| * | Looksmart Ltd. | 230,997 | 487 |
| * | Presstek Inc. | 217,340 | 482 |
| * | TechTarget Inc. | 59,880 | 475 |
| * | MEMSIC Inc. | 142,697 | 469 |
| * | Edgewater Technology Inc. | 198,888 | 467 |
| * | Amtech Systems Inc. | 18,540 | 466 |
| * | Rainmaker Systems Inc. | 322,737 | 445 |
| * | Spire Corp. | 83,254 | 434 |
| * | Frequency Electronics Inc. | 63,740 | 428 |
| * | Network Engines Inc. | 256,877 | 390 |
| * | Newtek Business Services Inc. | 208,903 | 359 |
48
| | | |
| Vanguard® Total Stock Market Index Fund | | |
| Schedule of Investments | | |
| December 31, 2010 | | |
| |
| | | | Market |
| | | | Value |
| | | Shares | ($000) |
| * | Transwitch Corp. | 166,986 | 359 |
| * | Tier Technologies Inc. Class B | 59,239 | 355 |
| * | Ditech Networks Inc. | 246,535 | 353 |
| * | WebMediaBrands Inc. | 217,830 | 349 |
| * | Echo Global Logistics Inc. | 28,571 | 344 |
| * | Market Leader Inc. | 187,338 | 330 |
| * | Planar Systems Inc. | 148,396 | 303 |
| * | Performance Technologies Inc. | 163,819 | 278 |
| * | AuthenTec Inc. | 109,619 | 274 |
| | Bel Fuse Inc. Class A | 10,580 | 270 |
| * | Cinedigm Digital Cinema Corp. Class A | 140,893 | 232 |
| * | GTSI Corp. | 48,304 | 227 |
| * | NaviSite Inc. | 58,129 | 214 |
| * | Zhone Technologies Inc. | 77,257 | 206 |
| * | Dot Hill Systems Corp. | 116,829 | 203 |
| * | Video Display Corp. | 48,546 | 193 |
| * | Viasystems Group Inc. | 9,529 | 192 |
| * | Identive Group Inc. | 74,888 | 189 |
| * | Vertro Inc. | 33,580 | 165 |
| * | QAD Inc. Class B | 16,012 | 159 |
| * | Guidance Software Inc. | 21,780 | 157 |
| * | Autobytel Inc. | 170,280 | 146 |
| * | Deltek Inc. | 20,030 | 145 |
| * | Ikanos Communications Inc. | 105,198 | 141 |
| *,^ | Parkervision Inc. | 280,495 | 123 |
| * | Lantronix Inc. | 30,590 | 113 |
| * | Intellicheck Mobilisa Inc. | 75,312 | 103 |
| * | EndWave Corp. | 45,134 | 102 |
| * | Wireless Telecom Group Inc. | 98,456 | 86 |
| * | Selectica Inc. | 16,769 | 82 |
| * | Numerex Corp. Class A | 7,636 | 68 |
| * | Management Network Group Inc. | 25,306 | 66 |
| * | Authentidate Holding Corp. | 140,687 | 63 |
| * | Superconductor Technologies Inc. | 24,014 | 36 |
| * | Glu Mobile Inc. | 13,479 | 28 |
| * | Occam Networks Inc. | 614 | 5 |
| * | Dialogic Inc. | 739 | 3 |
| * | Information Services Group Inc. | 598 | 1 |
| | | | 27,961,814 |
| Materials (4.2%) | | |
| | Freeport-McMoRan Copper & Gold Inc. | 4,961,905 | 595,875 |
| | EI du Pont de Nemours & Co. | 9,560,550 | 476,880 |
| | Dow Chemical Co. | 12,231,419 | 417,581 |
| | Monsanto Co. | 5,699,081 | 396,884 |
| | Newmont Mining Corp. | 5,196,060 | 319,194 |
| | Praxair Inc. | 3,229,746 | 308,344 |
| | Air Products & Chemicals Inc. | 2,242,654 | 203,969 |
| | Alcoa Inc. | 10,768,543 | 165,728 |
| | PPG Industries Inc. | 1,741,454 | 146,404 |
| | Nucor Corp. | 3,327,436 | 145,808 |
| | Mosaic Co. | 1,646,900 | 125,757 |
| | Ecolab Inc. | 2,463,689 | 124,219 |
| | International Paper Co. | 4,378,324 | 119,266 |
| | Cliffs Natural Resources Inc. | 1,430,252 | 111,574 |
| | CF Industries Holdings Inc. | 752,068 | 101,642 |
| | United States Steel Corp. | 1,516,388 | 88,587 |
| | Sigma-Aldrich Corp. | 1,283,007 | 85,397 |
| | Sherwin-Williams Co. | 976,621 | 81,792 |
| | Lubrizol Corp. | 713,910 | 76,303 |
| | Walter Energy Inc. | 559,797 | 71,564 |
| | Celanese Corp. Class A | 1,651,459 | 67,991 |
| | Eastman Chemical Co. | 764,090 | 64,245 |
49
| | |
| Vanguard® Total Stock Market Index Fund | | |
| Schedule of Investments | | |
| December 31, 2010 | | |
| |
| | | Market |
| | | Value |
| | Shares | ($000) |
| Ball Corp. | 920,411 | 62,634 |
| Vulcan Materials Co. | 1,356,793 | 60,187 |
| FMC Corp. | 728,489 | 58,199 |
| * Crown Holdings Inc. | 1,710,003 | 57,080 |
| * Owens-Illinois Inc. | 1,730,636 | 53,131 |
| Airgas Inc. | 840,938 | 52,525 |
| Allegheny Technologies Inc. | 935,826 | 51,639 |
| Albemarle Corp. | 866,812 | 48,351 |
| MeadWestvaco Corp. | 1,808,263 | 47,304 |
| International Flavors & Fragrances Inc. | 842,402 | 46,829 |
| Nalco Holding Co. | 1,463,729 | 46,751 |
| Martin Marietta Materials Inc. | 481,312 | 44,396 |
| Sealed Air Corp. | 1,689,431 | 42,996 |
| Ashland Inc. | 793,056 | 40,335 |
| Steel Dynamics Inc. | 2,179,458 | 39,884 |
| Reliance Steel & Aluminum Co. | 746,737 | 38,158 |
| Bemis Co. Inc. | 1,155,341 | 37,733 |
| Sonoco Products Co. | 1,070,961 | 36,059 |
| Aptargroup Inc. | 724,631 | 34,471 |
| Valspar Corp. | 999,323 | 34,457 |
| Domtar Corp. | 452,211 | 34,332 |
| Huntsman Corp. | 2,019,437 | 31,523 |
| Compass Minerals International Inc. | 345,442 | 30,838 |
| RPM International Inc. | 1,385,111 | 30,611 |
| * Hecla Mining Co. | 2,685,643 | 30,240 |
| * Solutia Inc. | 1,299,099 | 29,983 |
| Royal Gold Inc. | 538,593 | 29,423 |
| Packaging Corp. of America | 1,102,655 | 28,493 |
| Cytec Industries Inc. | 522,991 | 27,750 |
| * WR Grace & Co. | 775,482 | 27,243 |
| * Rockwood Holdings Inc. | 687,014 | 26,876 |
| * Coeur d'Alene Mines Corp. | 952,295 | 26,017 |
| Scotts Miracle-Gro Co. Class A | 500,226 | 25,396 |
| Cabot Corp. | 661,425 | 24,903 |
| Temple-Inland Inc. | 1,092,134 | 23,197 |
| * Allied Nevada Gold Corp. | 844,866 | 22,228 |
| Rock-Tenn Co. Class A | 395,402 | 21,332 |
| * Stillwater Mining Co. | 974,215 | 20,799 |
| Commercial Metals Co. | 1,222,838 | 20,287 |
| Sensient Technologies Corp. | 528,632 | 19,417 |
| AK Steel Holding Corp. | 1,174,870 | 19,233 |
| Silgan Holdings Inc. | 535,410 | 19,173 |
| Carpenter Technology Corp. | 470,367 | 18,928 |
| * Intrepid Potash Inc. | 483,071 | 18,014 |
| Olin Corp. | 844,081 | 17,321 |
| * Titanium Metals Corp. | 960,177 | 16,496 |
| Greif Inc. Class A | 263,519 | 16,312 |
| NewMarket Corp. | 131,761 | 16,255 |
| Schnitzer Steel Industries Inc. | 244,271 | 16,217 |
| * Ferro Corp. | 921,817 | 13,495 |
| Minerals Technologies Inc. | 200,625 | 13,123 |
| * Louisiana-Pacific Corp. | 1,358,675 | 12,853 |
| * OM Group Inc. | 329,605 | 12,693 |
| Eagle Materials Inc. | 449,120 | 12,688 |
| * PolyOne Corp. | 993,302 | 12,406 |
| Schweitzer-Mauduit International Inc. | 196,141 | 12,341 |
| Worthington Industries Inc. | 653,637 | 12,027 |
| ^ Texas Industries Inc. | 258,359 | 11,828 |
| Globe Specialty Metals Inc. | 675,748 | 11,549 |
| * Georgia Gulf Corp. | 458,008 | 11,020 |
| HB Fuller Co. | 524,790 | 10,769 |
| Arch Chemicals Inc. | 258,162 | 9,792 |
| Balchem Corp. | 287,011 | 9,704 |
| Buckeye Technologies Inc. | 454,592 | 9,551 |
50
| | | |
| Vanguard® Total Stock Market Index Fund | | |
| Schedule of Investments | | |
| December 31, 2010 | | |
| |
| | | | Market |
| | | | Value |
| | | Shares | ($000) |
| * | Century Aluminum Co. | 596,882 | 9,270 |
| | Kaiser Aluminum Corp. | 180,314 | 9,032 |
| * | RTI International Metals Inc. | 334,134 | 9,015 |
| * | Calgon Carbon Corp. | 594,341 | 8,986 |
| * | US Gold Corp. | 1,066,134 | 8,604 |
| * | Clearwater Paper Corp. | 105,151 | 8,233 |
| * | Brush Engineered Materials Inc. | 209,921 | 8,111 |
| | AMCOL International Corp. | 260,006 | 8,060 |
| | Westlake Chemical Corp. | 174,052 | 7,566 |
| | Deltic Timber Corp. | 132,465 | 7,463 |
| * | Omnova Solutions Inc. | 884,178 | 7,392 |
| | Innophos Holdings Inc. | 201,916 | 7,285 |
| | PH Glatfelter Co. | 593,092 | 7,277 |
| | Koppers Holdings Inc. | 201,987 | 7,227 |
| * | Horsehead Holding Corp. | 551,651 | 7,194 |
| | A Schulman Inc. | 310,386 | 7,105 |
| | Stepan Co. | 86,594 | 6,605 |
| * | Kraton Performance Polymers Inc. | 189,055 | 5,851 |
| | Haynes International Inc. | 135,388 | 5,663 |
| ^ | Hawkins Inc. | 121,125 | 5,378 |
| * | Innospec Inc. | 245,271 | 5,004 |
| | Zep Inc. | 249,646 | 4,963 |
| | Quaker Chemical Corp. | 116,044 | 4,836 |
| * | Graphic Packaging Holding Co. | 1,128,611 | 4,390 |
| *,^ | STR Holdings Inc. | 209,973 | 4,199 |
| * | KapStone Paper and Packaging Corp. | 271,456 | 4,153 |
| * | Zoltek Cos. Inc. | 352,682 | 4,073 |
| | Olympic Steel Inc. | 141,513 | 4,059 |
| | Wausau Paper Corp. | 471,193 | 4,057 |
| | Boise Inc. | 490,462 | 3,889 |
| * | Spartech Corp. | 393,942 | 3,687 |
| | Neenah Paper Inc. | 185,933 | 3,659 |
| * | LSB Industries Inc. | 121,548 | 2,949 |
| * | General Moly Inc. | 439,695 | 2,849 |
| | Myers Industries Inc. | 271,799 | 2,647 |
| * | AM Castle & Co. | 135,986 | 2,503 |
| *,^ | Mercer International Inc. | 314,066 | 2,434 |
| * | TPC Group Inc. | 73,879 | 2,240 |
| *,^ | Yongye International Inc. | 244,426 | 2,053 |
| * | AEP Industries Inc. | 78,796 | 2,045 |
| * | Headwaters Inc. | 441,159 | 2,021 |
| *,^ | China Direct Industries Inc. | 1,280,444 | 1,933 |
| * | US Energy Corp. Wyoming | 313,512 | 1,906 |
| * | Capital Gold Corp. | 354,646 | 1,798 |
| * | Noranda Aluminum Holding Corp. | 119,598 | 1,746 |
| * | Golden Minerals Co. | 65,321 | 1,744 |
| | American Vanguard Corp. | 194,871 | 1,664 |
| * | Universal Stainless & Alloy | 52,606 | 1,646 |
| * | Puda Coal Inc. | 115,417 | 1,645 |
| * | Senomyx Inc. | 223,327 | 1,592 |
| *,^ | ShengdaTech Inc. | 311,543 | 1,527 |
| * | Landec Corp. | 207,255 | 1,239 |
| * | Graham Packaging Co. Inc. | 89,861 | 1,172 |
| * | United States Lime & Minerals Inc. | 26,723 | 1,126 |
| *,^ | Paramount Gold and Silver Corp. | 278,819 | 1,112 |
| | Chase Corp. | 67,372 | 1,098 |
| *,^ | Gulf Resources Inc. | 101,268 | 1,083 |
| *,^ | General Steel Holdings Inc. | 364,490 | 1,046 |
| *,^ | China Green Agriculture Inc. | 111,731 | 1,006 |
| *,^ | Flotek Industries Inc. | 178,097 | 971 |
| * | Ampal American Israel Class A | 328,259 | 758 |
| * | American Pacific Corp. | 125,785 | 723 |
| * | Penford Corp. | 110,922 | 678 |
| * | Metals USA Holdings Corp. | 35,104 | 535 |
51
| | | |
| Vanguard® Total Stock Market Index Fund | | |
| Schedule of Investments | | |
| December 31, 2010 | | |
| |
| | | | Market |
| | | | Value |
| | | Shares | ($000) |
| * | Nanophase Technologies Corp. | 349,493 | 412 |
| * | Verso Paper Corp. | 75,714 | 259 |
| *,^ | China Agritech Inc. | 15,731 | 193 |
| * | Rock of Ages Corp. | 23,568 | 123 |
| *,^ | China Precision Steel Inc. | 64,208 | 109 |
| * | Solitario Exploration & Royalty Corp. | 23,513 | 86 |
| * | Continental Materials Corp. | 3,495 | 75 |
| * | Sutor Technology Group Ltd. | 5,725 | 12 |
| | KMG Chemicals Inc. | 546 | 9 |
| * | Orient Paper Inc. | 298 | 2 |
| | | | 6,347,854 |
| Telecommunication Services (2.8%) | | |
| | AT&T Inc. | 62,333,712 | 1,831,365 |
| | Verizon Communications Inc. | 29,813,847 | 1,066,739 |
| * | American Tower Corp. Class A | 4,232,598 | 218,571 |
| | CenturyLink Inc. | 3,178,591 | 146,756 |
| * | Crown Castle International Corp. | 3,065,141 | 134,345 |
| * | Sprint Nextel Corp. | 31,148,780 | 131,759 |
| | Qwest Communications International Inc. | 16,530,475 | 125,797 |
| | Frontier Communications Corp. | 10,481,643 | 101,986 |
| * | NII Holdings Inc. | 1,779,365 | 79,466 |
| | Windstream Corp. | 5,109,812 | 71,231 |
| * | SBA Communications Corp. Class A | 1,152,114 | 47,168 |
| * | MetroPCS Communications Inc. | 2,613,444 | 33,008 |
| | Telephone & Data Systems Inc. | 733,547 | 26,811 |
| * | tw telecom inc Class A | 1,532,130 | 26,123 |
| * | Syniverse Holdings Inc. | 745,058 | 22,985 |
| * | Level 3 Communications Inc. | 17,685,772 | 17,332 |
| * | United States Cellular Corp. | 185,265 | 9,252 |
| | Telephone & Data Systems Inc. - Special Common Shares | 273,772 | 8,629 |
| | AboveNet Inc. | 144,263 | 8,434 |
| *,^ | Clearwire Corp. Class A | 1,549,685 | 7,981 |
| * | Leap Wireless International Inc. | 640,194 | 7,849 |
| | NTELOS Holdings Corp. | 379,024 | 7,220 |
| * | Cincinnati Bell Inc. | 2,414,084 | 6,759 |
| * | Neutral Tandem Inc. | 399,442 | 5,768 |
| | Consolidated Communications Holdings Inc. | 283,680 | 5,475 |
| | Alaska Communications Systems Group Inc. | 477,807 | 5,304 |
| * | Cogent Communications Group Inc. | 371,668 | 5,255 |
| * | PAETEC Holding Corp. | 1,264,014 | 4,727 |
| | Shenandoah Telecommunications Co. | 250,443 | 4,691 |
| * | General Communication Inc. Class A | 361,982 | 4,583 |
| * | Premiere Global Services Inc. | 560,397 | 3,811 |
| * | Cbeyond Inc. | 229,610 | 3,508 |
| | USA Mobility Inc. | 194,539 | 3,457 |
| | Atlantic Tele-Network Inc. | 90,032 | 3,452 |
| * | Global Crossing Ltd. | 250,953 | 3,242 |
| * | Hughes Communications Inc. | 74,262 | 3,003 |
| | HickoryTech Corp. | 285,780 | 2,744 |
| * | Vonage Holdings Corp. | 1,223,933 | 2,742 |
| * | Iridium Communications Inc. | 294,229 | 2,427 |
| * | ICO Global Communications Holdings Ltd. | 1,581,592 | 2,372 |
| * | 8x8 Inc. | 982,275 | 2,338 |
| *,^ | Globalstar Inc. | 1,457,911 | 2,114 |
| | IDT Corp. Class B | 77,174 | 1,980 |
| * | SureWest Communications | 115,137 | 1,232 |
| | Warwick Valley Telephone Co. | 88,420 | 1,225 |
| * | FiberTower Corp. | 189,474 | 845 |
| * | Arbinet Corp. | 84,203 | 702 |
| | IDT Corp. | 21,611 | 554 |
| | | | 4,215,117 |
| Utilities (3.4%) | | |
| | Southern Co. | 8,759,884 | 334,890 |
| | Exelon Corp. | 6,974,408 | 290,414 |
52
| | |
| Vanguard® Total Stock Market Index Fund | | |
| Schedule of Investments | | |
| December 31, 2010 | | |
| |
| | | Market |
| | | Value |
| | Shares | ($000) |
| Dominion Resources Inc. | 6,217,132 | 265,596 |
| Duke Energy Corp. | 13,917,153 | 247,864 |
| NextEra Energy Inc. | 4,168,255 | 216,708 |
| PG&E Corp. | 4,122,810 | 197,235 |
| American Electric Power Co. Inc. | 5,058,946 | 182,021 |
| Public Service Enterprise Group Inc. | 5,335,496 | 169,722 |
| Consolidated Edison Inc. | 2,984,544 | 147,944 |
| Entergy Corp. | 1,969,820 | 139,522 |
| Progress Energy Inc. | 3,089,518 | 134,332 |
| PPL Corp. | 5,097,809 | 134,174 |
| Sempra Energy | 2,486,410 | 130,487 |
| Edison International | 3,268,720 | 126,173 |
| FirstEnergy Corp. | 3,218,515 | 119,149 |
| Xcel Energy Inc. | 4,853,559 | 114,301 |
| * AES Corp. | 7,139,104 | 86,954 |
| DTE Energy Co. | 1,782,824 | 80,798 |
| Wisconsin Energy Corp. | 1,235,128 | 72,700 |
| Ameren Corp. | 2,530,159 | 71,325 |
| CenterPoint Energy Inc. | 4,224,344 | 66,407 |
| Constellation Energy Group Inc. | 2,030,446 | 62,193 |
| Northeast Utilities | 1,863,811 | 59,418 |
| Oneok Inc. | 1,069,967 | 59,351 |
| * NRG Energy Inc. | 2,679,715 | 52,362 |
| NiSource Inc. | 2,941,215 | 51,824 |
| SCANA Corp. | 1,266,340 | 51,413 |
| * Calpine Corp. | 3,764,086 | 50,213 |
| National Fuel Gas Co. | 737,460 | 48,392 |
| Pinnacle West Capital Corp. | 1,149,173 | 47,633 |
| OGE Energy Corp. | 1,033,713 | 47,075 |
| American Water Works Co. Inc. | 1,848,528 | 46,749 |
| NSTAR | 1,102,437 | 46,512 |
| CMS Energy Corp. | 2,433,582 | 45,265 |
| Allegheny Energy Inc. | 1,794,347 | 43,495 |
| Alliant Energy Corp. | 1,178,570 | 43,336 |
| Pepco Holdings Inc. | 2,368,100 | 43,218 |
| Integrys Energy Group Inc. | 816,845 | 39,625 |
| MDU Resources Group Inc. | 1,901,259 | 38,539 |
| TECO Energy Inc. | 2,156,636 | 38,388 |
| UGI Corp. | 1,167,282 | 36,863 |
| NV Energy Inc. | 2,498,719 | 35,107 |
| Energen Corp. | 722,687 | 34,877 |
| ITC Holdings Corp. | 535,152 | 33,169 |
| Aqua America Inc. | 1,448,289 | 32,558 |
| DPL Inc. | 1,264,949 | 32,522 |
| Questar Corp. | 1,852,974 | 32,260 |
| Westar Energy Inc. | 1,249,017 | 31,425 |
| * GenOn Energy Inc. | 8,083,359 | 30,798 |
| Atmos Energy Corp. | 962,531 | 30,031 |
| AGL Resources Inc. | 821,971 | 29,468 |
| Great Plains Energy Inc. | 1,430,376 | 27,735 |
| Nicor Inc. | 485,318 | 24,227 |
| Hawaiian Electric Industries Inc. | 996,261 | 22,705 |
| Piedmont Natural Gas Co. Inc. | 766,007 | 21,418 |
| Vectren Corp. | 823,503 | 20,900 |
| Cleco Corp. | 649,860 | 19,990 |
| WGL Holdings Inc. | 541,972 | 19,386 |
| IDACORP Inc. | 515,152 | 19,050 |
| New Jersey Resources Corp. | 441,326 | 19,026 |
| Southwest Gas Corp. | 486,277 | 17,832 |
| Portland General Electric Co. | 804,321 | 17,454 |
| South Jersey Industries Inc. | 319,422 | 16,872 |
| UIL Holdings Corp. | 511,179 | 15,315 |
| Unisource Energy Corp. | 386,321 | 13,846 |
| Avista Corp. | 587,564 | 13,232 |
53
| | | | | |
| Vanguard® Total Stock Market Index Fund | | | | |
| Schedule of Investments | | | | |
| December 31, 2010 | | | | |
| |
| | | | | | Market |
| | | | | | Value |
| | | | | Shares | ($000) |
| | Northwest Natural Gas Co. | | | 284,302 | 13,211 |
| * | El Paso Electric Co. | | | 468,879 | 12,908 |
| | Allete Inc. | | | 341,050 | 12,708 |
| | PNM Resources Inc. | | | 932,147 | 12,137 |
| | Black Hills Corp. | | | 398,230 | 11,947 |
| | NorthWestern Corp. | | | 387,162 | 11,162 |
| | MGE Energy Inc. | | | 244,475 | 10,454 |
| | Laclede Group Inc. | | | 246,572 | 9,010 |
| | Otter Tail Corp. | | | 383,965 | 8,655 |
| | Empire District Electric Co. | | | 375,875 | 8,344 |
| | California Water Service Group | | | 213,643 | 7,962 |
| | CH Energy Group Inc. | | | 154,444 | 7,551 |
| ^ | Ormat Technologies Inc. | | | 225,854 | 6,681 |
| | American States Water Co. | | | 178,779 | 6,162 |
| * | Dynegy Inc. Class A | | | 1,034,051 | 5,811 |
| | Chesapeake Utilities Corp. | | | 122,040 | 5,067 |
| | Middlesex Water Co. | | | 235,412 | 4,320 |
| | SJW Corp. | | | 152,695 | 4,042 |
| | Connecticut Water Service Inc. | | | 133,353 | 3,718 |
| | Central Vermont Public Service Corp. | | | 114,654 | 2,506 |
| | Unitil Corp. | | | 99,792 | 2,269 |
| | York Water Co. | | | 126,455 | 2,186 |
| | Consolidated Water Co. Ltd. | | | 158,667 | 1,455 |
| | Artesian Resources Corp. Class A | | | 37,008 | 701 |
| | Pennichuck Corp. | | | 25,012 | 684 |
| * | Cadiz Inc. | | | 53,431 | 665 |
| *,^ | China Natural Gas Inc. | | | 33,652 | 185 |
| * | Purecycle Corp. | | | 26,728 | 95 |
| * | Synthesis Energy Systems Inc. | | | 33,142 | 39 |
| | RGC Resources Inc. | | | 1,039 | 33 |
| |
| | | | | | 5,064,451 |
| Total Common Stocks (Cost $134,126,170) | | | | 149,862,560 |
| |
| |
| | | Coupon | | | |
| |
| Temporary Cash Investments (0.8%)1 | | | | |
| Money Market Fund (0.7%) | | | | |
| 3,4 | Vanguard Market Liquidity Fund | 0.211% | | 1,122,830,000 | 1,122,830 |
| |
| | | | | Face | |
| | | | Maturity | Amount | |
| | | | Date | ($000) | |
| U.S. Government and Agency Obligations (0.1%) | | | | |
| 5,6 | Fannie Mae Discount Notes | 0.200% | 2/14/11 | 30,000 | 29,993 |
| 5,6 | Freddie Mac Discount Notes | 0.296% | 3/31/11 | 15,000 | 14,992 |
| 5,6 | Freddie Mac Discount Notes | 0.205% | 4/19/11 | 25,000 | 24,984 |
| | | | | | 69,969 |
| Total Temporary Cash Investments (Cost $1,192,797) | | | | 1,192,799 |
| Total Investments (100.4%) (Cost $135,318,967) | | | | 151,055,359 |
| Other Assets and Liabilities—Net (-0.4%)4 | | | | (616,489) |
| Net Assets (100%) | | | | 150,438,870 |
* Non-income-producing security.
^ Part of security position is on loan to broker-dealers. The total value of securities on loan is $539,942,000.
1 The fund invests a portion of its cash reserves in equity markets through the use of index futures contracts. After giving effect to futures investments, the fund's effective common stock and temporary cash investment positions represent 100.0% and 0.4%, respectively, of net assets.
2 Considered an affiliated company of the fund as the fund owns more than 5% of the outstanding voting securities of such company.
54
Vanguard® Total Stock Market Index Fund
Schedule of Investments
December 31, 2010
3 Affiliated money market fund available only to Vanguard funds and certain trusts and accounts managed by Vanguard. Rate shown is the 7-day yield.
4 Includes $581,675,000 of collateral received for securities on loan.
5 The issuer operates under a congressional charter; its securities are not backed by the full faith and credit of the U.S. government.
6 Securities with a value of $62,973,000 have been segregated as initial margin for open futures contracts.
REIT—Real Estate Investment Trust.
55
Report of Independent Registered Public Accounting Firm
To the Trustees of Vanguard Index Funds and the Shareholders of Vanguard Total Stock Market Index Fund:
We have audited, in accordance with the standards of the Public Company Accounting Oversight Board (United States), the financial statements (not presented herein) of Vanguard Total Stock Market Index Fund (constituting a separate portfolio of Vanguard Index Funds, hereafter referred to as the “Fund”) as of December 31, 2010 and for the year then ended and have issued our unqualified report thereon dated February 8, 2011. Our audit included an audit of the Fund’s schedule of investments as of December 31, 2010. This schedule of investments is the responsibility of the Fund’s management. Our responsibility is to express an opinion on this schedule of investments based on our audit.
In our opinion, the accompanying schedule of investments referred to above, when read in conjunction with the financial statements of the Fund referred to above, presents fairly, in all material respects, the information set forth therein.
PricewaterhouseCoopers LLP
Philadelphia, PA
February 8, 2011
56
|
| © 2011The Vanguard Group. Inc. |
| All rights reserved. |
| Vanguard Marketing Corporation, Distributor. |
| |
| SNA 850_022011 |
Item 2: Code of Ethics. The Registrant has adopted a code of ethics that applies to the Registrant’s principal executive officer, principal financial officer, principal accounting officer or controller or persons performing similar functions. The Code of Ethics was amended during the reporting period covered by this report to make certain technical, non-material changes.
Item 3: Audit Committee Financial Expert. The following members of the Audit Committee have been determined by the Registrant’s Board of Trustees to be Audit Committee Financial Experts serving on its Audit Committee, and to be independent: Charles D. Ellis, Rajiv L. Gupta, JoAnn Heffernan Heisen, André F. Perold, and Alfred M. Rankin, Jr.
Item 4: Principal Accountant Fees and Services.
(a) Audit Fees.
Audit Fees of the Registrant
Fiscal Year Ended December 31, 2010: $367,000
Fiscal Year Ended December 31, 2009: $328,000
Aggregate Audit Fees of Registered Investment Companies in the Vanguard Group.
Fiscal Year Ended December 31, 2010: $3,607,060
Fiscal Year Ended December 31, 2009: $3,354,640
(b) Audit-Related Fees.
Fiscal Year Ended December 31, 2010: $791,350
Fiscal Year Ended December 31, 2009: $876,210
Includes fees billed in connection with assurance and related services provided to the Registrant, The Vanguard Group, Inc., Vanguard Marketing Corporation, and other registered investment companies in the Vanguard Group.
(c) Tax Fees.
Fiscal Year Ended December 31, 2010: $336,090
Fiscal Year Ended December 31, 2009: $423,070
Includes fees billed in connection with tax compliance, planning and advice services provided to the Registrant, The Vanguard Group, Inc., Vanguard Marketing Corporation, and other registered investment companies in the Vanguard Group and related to income and excise taxes.
(d) All Other Fees.
Fiscal Year Ended December 31, 2010: $16,000
Fiscal Year Ended December 31, 2009: $0
Includes fees billed for services related to risk management and privacy matters. Services were provided to the Registrant, The Vanguard Group, Inc., Vanguard Marketing Corporation, and other registered investment companies in the Vanguard Group.
(e) (1) Pre-Approval Policies. The policy of the Registrant’s Audit Committee is to consider and, if appropriate, approve before the principal accountant is engaged for such services, all specific audit and non-audit services provided to: (1) the Registrant; (2) The Vanguard Group, Inc.; (3) other entities controlled by The Vanguard Group, Inc. that provide ongoing services to the Registrant; and (4) other registered investment companies in the Vanguard Group. In making a determination, the Audit Committee considers whether the services are consistent with maintaining the principal accountant’s independence.
In the event of a contingency situation in which the principal accountant is needed to provide services in between scheduled Audit Committee meetings, the Chairman of the Audit Committee would be called on to consider and, if appropriate, pre-approve audit or permitted non-audit services in an amount sufficient to complete services through the next Audit Committee meeting, and to determine if such services would be consistent with maintaining the accountant’s independence. At the next scheduled Audit Committee meeting, services and fees would be presented to the Audit Committee for formal consideration, and, if appropriate, approval by the entire Audit Committee. The Audit Committee would again consider whether such services and fees are consistent with maintaining the principal accountant’s independence.
The Registrant’s Audit Committee is informed at least annually of all audit and non-audit services provided by the principal accountant to the Vanguard complex, whether such services are provided to: (1) the Registrant; (2) The Vanguard Group, Inc.; (3) other entities controlled by The Vanguard Group, Inc. that provide ongoing services to the Registrant; or (4) other registered investment companies in the Vanguard Group.
(2) No percentage of the principal accountant’s fees or services were approved pursuant to the waiver provision of paragraph (c)(7)(i)(C) of Rule 2-01 of Regulation S-X.
(f) For the most recent fiscal year, over 50% of the hours worked under the principal accountant’s engagement were not performed by persons other than full-time, permanent employees of the principal accountant.
(g) Aggregate Non-Audit Fees.
Fiscal Year Ended December 31, 2010: $352,090
Fiscal Year Ended December 31, 2009: $423,070
Includes fees billed for non-audit services provided to the Registrant, The Vanguard Group, Inc., Vanguard Marketing Corporation, and other registered investment companies in the Vanguard Group.
(h) For the most recent fiscal year, the Audit Committee has determined that the provision of all non-audit services was consistent with maintaining the principal accountant’s independence.
Item 5: Audit Committee of Listed Registrants.
The Registrant is a listed issuer as defined in Rule 10A-3 under the Securities Exchange Act of 1934 (“Exchange Act”). The Registrant has a separately-designated standing audit committee established in accordance with Section 3(a)(58)(A) of the Exchange Act. The Registrant’s audit committee members are: Emerson U. Fullwood, Rajiv L. Gupta, Amy Gutmann, JoAnn Heffernan Heisen, F. Joseph Loughrey, André F. Perold, Alfred M. Rankin, Jr., and Peter F. Volanakis.
Item 6: Investments.
Not Applicable.
Item 7: Disclosure of Proxy Voting Policies and Procedures for Closed-End Management Investment Companies.
Not Applicable.
Item 8: Portfolio Managers of Closed-End Management Investment Companies.
Not Applicable.
Item 9: Purchase of Equity Securities by Closed-End Management Investment Company and Affiliated Purchasers.
Not Applicable.
Item 10: Submission of Matters to a Vote of Security Holders.
Not Applicable.
Item 11: Controls and Procedures.
(a) Disclosure Controls and Procedures. The Principal Executive and Financial Officers concluded that the Registrant's Disclosure Controls and Procedures are effective based on their evaluation of the Disclosure Controls and Procedures as of a date within 90 days of the filing date of this report.
(b) Internal Control Over Financial Reporting. There were no significant changes in Registrant’s Internal Control Over Financial Reporting or in other factors that could significantly affect this control subsequent to the date of the evaluation, including any corrective actions with regard to significant deficiencies and material weaknesses.
Item 12: Exhibits.
(a) Code of Ethics.
(b) Certifications.
Pursuant to the requirements of the Securities Exchange Act of 1934 and the Investment Company Act of 1940, the registrant has duly caused this report to be signed on its behalf by the undersigned, thereunto duly authorized.
| |
| | VANGUARD INDEX FUNDS |
| |
| By: | /s/ F. WILLIAM MCNABB III* |
| | F. WILLIAM MCNABB III |
| | CHIEF EXECUTIVE OFFICER |
| |
| Date: February 17, 2011 |
Pursuant to the requirements of the Securities Exchange Act of 1934 and the Investment Company Act of 1940, this report has been signed below by the following persons on behalf of the registrant and in the capacities and on the dates indicated.
| |
| | VANGUARD INDEX FUNDS |
| |
| By: | /s/ F. WILLIAM MCNABB III* |
| | F. WILLIAM MCNABB III |
| | CHIEF EXECUTIVE OFFICER |
| |
| Date: February 17, 2011 |
| |
| | VANGUARD INDEX FUNDS |
| |
| By: | /s/ THOMAS J. HIGGINS* |
| | THOMAS J. HIGGINS |
| | CHIEF FINANCIAL OFFICER |
| |
| Date: February 17, 2011 |
* By: /s/ Heidi Stam
Heidi Stam, pursuant to a Power of Attorney filed on April 26, 2010, see file Number 33-53683,
Incorporated by Reference.