UNITED STATES
SECURITIES AND EXCHANGE COMMISSION
Washington, D.C. 20549
FORM N-CSR
CERTIFIED SHAREHOLDER REPORT
OF
REGISTERED MANAGEMENT INVESTMENT COMPANIES
Investment Company Act file number: 811-02652
Name of Registrant: Vanguard Index Funds
Address of Registrant:
P.O. Box 2600
Valley Forge, PA 19482
Name and address of agent for service:
Heidi Stam, Esquire
P.O. Box 876
Valley Forge, PA 19482
Registrant’s telephone number, including area code: (610) 669-1000
Date of fiscal year end: December 31
Date of reporting period: January 1, 2015 – December 31, 2015
Item 1: Reports to Shareholders

Annual Report | December 31, 2015
Vanguard 500 Index Fund
Vanguard’s Principles for Investing Success
We want to give you the best chance of investment success. These principles, grounded in Vanguard’s research and experience, can put you on the right path.
Goals. Create clear, appropriate investment goals.
Balance. Develop a suitable asset allocation using broadly diversified funds. Cost. Minimize cost.
Discipline. Maintain perspective and long-term discipline.
A single theme unites these principles: Focus on the things you can control.
We believe there is no wiser course for any investor.
| |
| Contents | |
| Your Fund’s Total Returns. | 1 |
| Chairman’s Letter. | 2 |
| Fund Profile. | 9 |
| Performance Summary. | 11 |
| Financial Statements. | 13 |
| Your Fund’s After-Tax Returns. | 32 |
| About Your Fund’s Expenses. | 33 |
| Glossary. | 35 |
Please note: The opinions expressed in this report are just that—informed opinions. They should not be considered promises or advice. Also, please keep in mind that the information and opinions cover the period through the date on the front of this report. Of course, the risks of investing in your fund are spelled out in the prospectus.
See the Glossary for definitions of investment terms used in this report.
About the cover: Pictured is a sailing block on the Brilliant, a 1932 schooner docked in Mystic, Connecticut. A type of pulley, the sailing block helps coordinate the setting of the sails. At Vanguard, the intricate coordination of technology and people allows us to help millions of clients around the world reach their financial goals.
| |
| Your Fund’s Total Returns | |
| |
| |
| |
| |
| Fiscal Year Ended December 31, 2015 | |
| | Total |
| | Returns |
| Vanguard 500 Index Fund | |
| Investor Shares | 1.25% |
| ETF Shares | |
| Market Price | 1.32 |
| Net Asset Value | 1.35 |
| Admiral™ Shares | 1.36 |
| S&P 500 Index | 1.38 |
| Large-Cap Core Funds Average | -0.66 |
Large-Cap Core Funds Average: Derived from data provided by Lipper, a Thomson Reuters Company.
Admiral Shares carry lower expenses and are available to investors who meet certain account-balance requirements. The Vanguard ETF® Shares shown are traded on the NYSE Arca exchange and are available only through brokers. The table provides ETF returns based on both the NYSE Arca market price and the net asset value for a share. U.S. Pat. Nos. 6,879,964; 7,337,138; 7,720,749; 7,925,573; 8,090,646; and 8,417,623.
For the ETF Shares, the market price is determined by the midpoint of the bid-offer spread as of the closing time of the New York Stock Exchange (generally 4 p.m., Eastern time). The net asset value is also determined as of the NYSE closing time. For more information about how the ETF Shares' market prices have compared with their net asset value, visit vanguard.com, select your ETF, and then select the Price and Performance tab. The ETF premium/discount analysis there shows the percentages of days on which the ETF Shares' market price was above or below the NAV.
| | | | |
| Your Fund’s Performance at a Glance | | | | |
| December 31, 2014, Through December 31, 2015 | | | | |
| | | | Distributions Per Share |
| | Starting | Ending | | |
| | Share | Share | Income | Capital |
| | Price | Price | Dividends | Gains |
| Vanguard 500 Index Fund | | | | |
| Investor Shares | $189.89 | $188.48 | $3.747 | $0.000 |
| ETF Shares | 188.45 | 187.05 | 3.931 | 0.000 |
| Admiral Shares | 189.89 | 188.48 | 3.961 | 0.000 |
1

Chairman’s Letter
Dear Shareholder,
The fiscal year ended December 31, 2015, was a tumultuous one for the world’s financial markets, and the broad U.S. stock market navigated a bumpy road to modest gains. Stocks of larger domestic companies such as those held in Vanguard 500 Index Fund generally outperformed their mid- and small-sized counterparts.
In this investment environment, your fund returned 1.25% for Investor Shares, closely tracking its benchmark, the Standard & Poor’s 500 Index, and surpassing the –0.66% average return of its peers.
Results among the fund’s ten market sectors were mixed. Half posted gains; consumer discretionary, technology, and health care stocks added most to returns. Energy stocks were a notable drag on performance.
If you hold shares of the fund in a taxable account, you may wish to review the section on after-tax returns that appears later in this report.
Despite troubles, U.S. stocks eked out a seventh year of gains
U.S. stocks returned 0.48% for the 12 months ended December 31, 2015. Although the broad market recorded its worst performance since 2008, it still posted gains for the seventh straight calendar year when dividends are factored into returns.
2
Stocks rose modestly over the first half of the year but slid in August and September as concerns mounted that China’s economic slowdown would spread globally. Falling oil and commodity prices also affected economies and markets across the world for better or worse. Central banks in Europe and Asia bolstered their stimulus efforts against weak growth and low inflation. And in December, the Federal Reserve ended months of uncertainty when it raised the target for short-term interest rates to 0.25%–0.5%.
International stocks returned about –5%, restrained by the U.S. dollar’s strength against many foreign currencies. Emerging markets fared the worst.
U.S. bonds ended the year with a slender advance
The broad U.S. taxable bond market gained 0.55% over the 12 months; income accounted for the modestly positive result. The yield of the 10-year Treasury note ended December at 2.30%, up from 2.19% a year earlier. (Bond prices and yields move in opposite directions.)
Investors focused on the Fed’s stance on short-term interest rates and alternately embraced or avoided safe-haven assets depending on the stock market’s strength.
International bond markets (as measured by the Barclays Global Aggregate Index ex USD) returned –6.02%, reduced by the
| | | |
| Market Barometer | | | |
| |
| | | Average Annual Total Returns |
| | | Periods Ended December 31, 2015 |
| | One | Three | Five |
| | Year | Years | Years |
| Stocks | | | |
| Russell 1000 Index (Large-caps) | 0.92% | 15.01% | 12.44% |
| Russell 2000 Index (Small-caps) | -4.41 | 11.65 | 9.19 |
| Russell 3000 Index (Broad U.S. market) | 0.48 | 14.74 | 12.18 |
| FTSE All-World ex US Index (International) | -4.72 | 2.04 | 1.48 |
| |
| Bonds | | | |
| Barclays U.S. Aggregate Bond Index (Broad taxable market) | 0.55% | 1.44% | 3.25% |
| Barclays Municipal Bond Index (Broad tax-exempt market) | 3.30 | 3.16 | 5.35 |
| Citigroup Three-Month U.S. Treasury Bill Index | 0.03 | 0.02 | 0.04 |
| |
| CPI | | | |
| Consumer Price Index | 0.73% | 1.00% | 1.53% |
3
dollar’s strength against many foreign currencies. Without this currency effect, returns were modestly positive.
Although the Fed raised its target for short-term interest rates in mid-December, returns for money market funds and savings accounts remained limited by the 0%–0.25% levels in place for much of the past seven years.
Energy’s double-digit decline offset gains in several sectors
The 500 Index Fund invests in 500 of the largest U.S. companies, which span many different industries and account for about three-fourths of the U.S. stock market’s value. As I mentioned, stocks of large-cap companies returned more than those of smaller companies, boosting your fund’s performance relative to the broad market.
Most segments of the U.S. economy grew, propped up by shoppers’ overall confidence and their willingness and ability to spend. This trend benefited the consumer discretionary and consumer staples sectors, which were among the market’s top performers. Internet retailers led the way in consumer discretionary; home improvement stores and restaurants also excelled. In consumer goods, notable showings came from tobacco, beverage, and packaged food companies.
| | | | |
| Expense Ratios | | | | |
| Your Fund Compared With Its Peer Group | | | | |
| |
| |
| | Investor | ETF | Admiral | Peer Group |
| | Shares | Shares | Shares | Average |
| 500 Index Fund | 0.17% | 0.05% | 0.05% | 1.12% |
The fund expense ratios shown are from the prospectus dated April 28, 2015, and represent estimated costs for the current fiscal year. For the fiscal year ended December 31, 2015, the fund’s expense ratios were 0.16% for Investor Shares, 0.05% for ETF Shares, and 0.05% for Admiral Shares. The peer-group expense ratio is derived from data provided by Lipper, a Thomson Reuters Company, and captures information through year-end 2014.
Peer group: Large-Cap Core Funds.
4
The information technology and health care sectors also boosted performance; however, their returns paled compared with those of some robust recent periods. In IT, gains from internet and software firms were partially offset by poor results from technology hardware and communications equipment companies.
Merger-and-acquisition activity, vibrant drug pipelines, and favorable long-term demographic and economic trends lifted the health care sector. But political controversy over high drug prices and lofty valuations of biotechnology stocks led to a few stumbles. The fund’s tiny holding in telecommunications was also positive.
Much of the contribution made by these industries was erased by a double-digit decline in energy. The lengthy and sharp slide of oil prices punished the sector. Their effect was worsened by high production levels from some leading oil-producing countries and concerns about the slower growth in China, the world’s largest oil importer.
Natural gas prices also dropped, though not as dramatically. Some integrated oil and gas firms held up better than others, but the majority of companies engaged in production and exploration as well as services and distribution suffered.
| |
| Total Returns | |
| Ten Years Ended December 31, 2015 | |
| | Average |
| | Annual Return |
| 500 Index Fund Investor Shares | 7.18% |
| S&P 500 Index | 7.31 |
| Large-Cap Core Funds Average | 5.91 |
| Large-Cap Core Funds Average: Derived from data provided by Lipper, a Thomson Reuters Company. | |
The figures shown represent past performance, which is not a guarantee of future results. (Current performance may be lower or higher than the performance data cited. For performance data current to the most recent month-end, visit our website at vanguard.com/performance.) Note, too, that both investment returns and principal value can fluctuate widely, so an investor’s shares, when sold, could be worth more or less than their original cost.
5
Stocks in the financial, industrials, materials, and utilities sectors also weighed on the fund’s performance.
The fund’s long-term record continues to be admirable
Over the last ten years, Vanguard 500 Index Fund’s Investor Shares have produced an average annual return of 7.18%. That’s more than 1 percentage point better than the average return of peer funds.
Most important, the fund has succeeded in meeting its primary objective of closely tracking its index over the long-term. That was no easy feat during a period that included the worst global recession since the Great Depression. This success is a tribute to the experience, talent, and sophisticated systems of the fund’s advisor, Vanguard Equity Index Group. Low expenses––which allow you to keep more of the fund’s return—have helped as well.
Vanguard’s outlook for investors: Not bearish, but cautious
In Vanguard’s recently published global economic and investment outlook, Global Chief Economist Joseph Davis and his team discuss various market and economic events 2016 may bring, along with challenges and opportunities for investors.
Our forecast includes “frustratingly fragile” economic growth and more modest long-term returns from the global stock and bond markets. The report cautions that for the decade ending 2025, returns for a balanced portfolio are likely to be moderately below historical averages.
Our simulations indicate that the average annualized returns of a 60% equity/40% bond portfolio for the decade are most likely to be centered in the 3%–5% range after inflation, below the actual average after-inflation return of 5.5% for the same portfolio since 1926.
Even so, Vanguard’s steadfast belief in its principles for investing success—focusing on clear goals, a suitable asset allocation, low costs, and long-term discipline—remains unchanged.
For more information about our expectations and the probability of various outcomes, see
Vanguard’s Economic and Investment Outlook, available at vanguard.com/research.
IMPORTANT: The projections or other information generated by the Vanguard Capital Markets Model® (VCMM) regarding the likelihood of various investment outcomes are hypothetical in nature, do not reflect actual investment results, and are not guarantees of future results. Distribution of return outcomes from VCMM derived from 10,000 simulations for U.S. equity returns and fixed income returns. Simulations as of September 30, 2015. Results from the model may vary with each use and over time. For more information, please see page 7.
6
To reach your long-term goals, be realistic and try to save more
Although there have been times when it felt as if stocks and bonds were riding a roller coaster, returns have generally risen in recent years. The broad global stock market in particular has posted some impressive gains since its turnaround began in 2009.
But 2015 served as a reminder that results aren’t always favorable. The U.S. stock and bond markets were barely positive, and international stocks and unhedged bonds finished in the red.
In Vanguard’s recently updated long-term look at the economy and markets, our global economists explain why they expect economic growth to remain “frustratingly fragile” and why their outlook for stock and bond markets is the most guarded since 2006. (For more details, see the box on page 6 and Vanguard’s Economic and Investment Outlook, available at vanguard.com/research.)
Given these muted expectations, what’s the best course of action? I’ve often encouraged shareholders to focus on the things they can control. That advice holds true today.
Consider saving more than you think you may need. That’s one way you can prepare for the volatility that may lie ahead, particularly as markets adjust to changes in policies from the Fed and other central banks.
IMPORTANT: The projections or other information generated by the Vanguard Capital Markets Model (VCMM) regarding the likelihood of various investment outcomes are hypothetical in nature, do not reflect actual investment results, and are not guarantees of future results. VCMM results will vary with each use and over time.
The VCMM projections are based on a statistical analysis of historical data. Future returns may behave differently from the historical patterns captured in the VCMM. More important, the VCMM may be underestimating extreme negative scenarios unobserved in the historical period on which the model estimation is based.
The VCMM is a proprietary financial simulation tool developed and maintained by Vanguard’s primary investment research and advice teams. The model forecasts distributions of future returns for a wide array of broad asset classes. Those asset classes include U.S. and international equity markets, several maturities of the U.S. Treasury and corporate fixed income markets, international fixed income markets, U.S. money markets, commodities, and certain alternative investment strategies. The theoretical and empirical foundation for the VCMM is that the returns of various asset classes reflect the compensation investors require for bearing different types of systematic risk (beta). At the core of the model are estimates of the dynamic statistical relationship between risk factors and asset returns, obtained from statistical analysis based on available monthly financial and economic data from as early as 1960. Using a system of estimated equations, the model then applies a Monte Carlo simulation method to project the estimated interrelationships among risk factors and asset classes as well as uncertainty and randomness over time. The model generates a large set of simulated outcomes for each asset class over several time horizons. Forecasts are obtained by computing measures of central tendency in these simulations. Results produced by the tool will vary with each use and over time.
7
And, as always, investors would be well- served to follow Vanguard’s principles for investing success:
• Goals. Create clear, appropriate investment goals.
• Balance. Develop a suitable asset allocation using broadly diversified funds.
• Cost. Minimize cost.
• Discipline. Maintain perspective and long-term discipline.
As with saving, each of these principles is within your control, and focusing on them can keep you on the right path.
As always, thank you for investing with Vanguard.
Sincerely,

F. William McNabb III
Chairman and Chief Executive Officer
January 11, 2016
8
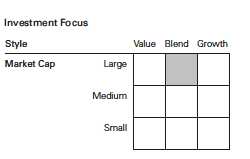
| | | |
| 500 Index Fund | | |
| |
| |
| Fund Profile | | |
| As of December 31, 2015 | | |
| |
| Share-Class Characteristics | | |
| |
| |
| | Investor | ETF Admiral |
| | Shares | Shares | Shares |
| Ticker Symbol | VFINX | VOO | VFIAX |
| Expense Ratio1 | 0.17% | 0.05% | 0.05% |
| 30-Day SEC Yield | 1.99% | 2.12% | 2.14% |
| |
| Portfolio Characteristics | | |
| | | | DJ |
| | | | U.S. |
| | | | Total |
| | | | Market |
| | | S&P 500 | FA |
| | Fund | Index | Index |
| Number of Stocks | 503 | 504 | 3,960 |
| Median Market Cap | $81.0B | $81.0B | $51.4B |
| Price/Earnings Ratio | 20.5x | 20.5x | 21.9x |
| Price/Book Ratio | 2.8x | 2.8x | 2.7x |
| Return on Equity | 18.5% | 18.3% | 17.2% |
| Earnings Growth Rate | 9.2% | 9.2% | 9.5% |
| Dividend Yield | 2.2% | 2.2% | 2.1% |
| Foreign Holdings | 0.0% | 0.0% | 0.0% |
| Turnover Rate | 3% | — | — |
| Short-Term Reserves | 0.0% | — | — |
| | |
| Volatility Measures | | |
| | | DJ |
| | | U.S. Total |
| | S&P 500 | Market |
| | Index | FA Index |
| R-Squared | 1.00 | 0.99 |
| Beta | 1.00 | 0.98 |
| These measures show the degree and timing of the fund’s | |
| fluctuations compared with the indexes over 36 months. | |
| |
| Ten Largest Holdings (% of total net assets) |
| Apple Inc. | Technology | |
| | Hardware, Storage & | |
| | Peripherals | 3.3% |
| Alphabet Inc. | Internet Software & | |
| | Services | 2.5 |
| Microsoft Corp. | Systems Software | 2.5 |
| Exxon Mobil Corp. | Integrated Oil & Gas | 1.8 |
| General Electric Co. | Industrial | |
| | Conglomerates | 1.6 |
| Johnson & Johnson | Pharmaceuticals | 1.6 |
| Amazon.com Inc. | Internet Retail | 1.4 |
| Wells Fargo & Co. | Diversified Banks | 1.4 |
| Berkshire Hathaway Inc. Multi-Sector Holdings | 1.4 |
| JPMorgan Chase & Co. | Diversified Banks | 1.4 |
| Top Ten | | 18.9% |
| The holdings listed exclude any temporary cash investments and |
| equity index products. | | |
1 The expense ratios shown are from the prospectus dated April 28, 2015, and represent estimated costs for the current fiscal year. For the fiscal year ended December 31, 2015, the expense ratios were 0.16% for Investor Shares, 0.05% for ETF Shares, and 0.05% for Admiral Shares.
9
500 Index Fund
Sector Diversification (% of equity exposure)
| | | |
| | | | DJ |
| | | | U.S. Total |
| | | S&P 500 | Market |
| | Fund | Index | FA Index |
| Consumer | | | |
| Discretionary | 12.9% | 12.9% | 13.4% |
| Consumer Staples | 10.1 | 10.1 | 8.8 |
| Energy | 6.5 | 6.5 | 5.9 |
| Financials | 16.5 | 16.5 | 18.2 |
| Health Care | 15.1 | 15.1 | 14.8 |
| Industrials | 10.0 | 10.0 | 10.5 |
| Information | | | |
| Technology | 20.7 | 20.7 | 20.0 |
| Materials | 2.8 | 2.8 | 3.1 |
| Telecommunication | | | |
| Services | 2.4 | 2.4 | 2.2 |
| Utilities | 3.0 | 3.0 | 3.1 |
10
500 Index Fund
Performance Summary
All of the returns in this report represent past performance, which is not a guarantee of future results that may be achieved by the fund. (Current performance may be lower or higher than the performance data cited. For performance data current to the most recent month-end, visit our website at vanguard.com/performance.) Note, too, that both investment returns and principal value can fluctuate widely, so an investor’s shares, when sold, could be worth more or less than their original cost. The returns shown do not reflect taxes that a shareholder would pay on fund distributions or on the sale of fund shares.
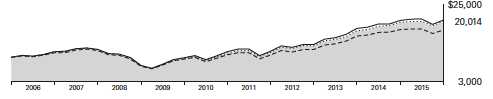
Cumulative Performance: December 31, 2005, Through December 31, 2015
Initial Investment of $10,000
| | | | | |
| | | | Average Annual Total Returns | |
| | | Periods Ended December 31, 2015 | |
| | | | | | Final Value |
| | | One | Five | Ten | of a $10,000 |
| | | Year | Years | Years | Investment |
| | 500 Index Fund*Investor Shares | 1.25% | 12.40% | 7.18% | $20,014 |
| •••••••• | S&P 500 Index | 1.38 | 12.57 | 7.31 | 20,242 |
| – – – – | Large-Cap Core Funds Average | -0.66 | 10.65 | 5.91 | 17,750 |
| | Dow Jones U.S. Total Stock Market | | | | |
| | Float Adjusted Index | 0.44 | 12.14 | 7.48 | 20,563 |
| Large-Cap Core Funds Average: Derived from data provided by Lipper, a Thomson Reuters Company. | | |
| |
| | | | | Since | Final Value |
| | | One | Five | Inception | of a $10,000 |
| | | Year | Years | (9/7/2010) | Investment |
| 500 Index Fund | | | | |
| ETF Shares Net Asset Value | 1.35% | 12.53% | 14.89% | $20,914 |
| S&P 500 Index | 1.38 | 12.57 | 14.93 | 20,951 |
| Dow Jones U.S. Total Stock Market Float | | | | |
| Adjusted Index | 0.44 | 12.14 | 14.78 | 20,805 |
| "Since Inception" performance is calculated from the ETF Shares’ inception date for both the fund and its comparative standards. |
See Financial Highlights for dividend and capital gains information.
11
| | | | |
| 500 Index Fund | | | | |
| |
| |
| |
| | | Average Annual Total Returns | |
| | Periods Ended December 31, 2015 | |
| | | | | Final Value |
| | One | Five | Ten | of a $10,000 |
| | Year | Years | Years | Investment |
| 500 Index Fund Admiral Shares | 1.36% | 12.53% | 7.30% | $20,228 |
| S&P 500 Index | 1.38 | 12.57 | 7.31 | 20,242 |
| Dow Jones U.S. Total Stock Market Float | | | | |
| Adjusted Index | 0.44 | 12.14 | 7.48 | 20,563 |
| |
| |
| Cumulative Returns of ETF Shares: September 7, 2010, Through December 31, 2015 | |
| | | | | Since |
| | | One | Five | Inception |
| | | Year | Years | (9/7/2010) |
| 500 Index Fund ETF Shares Market Price | | 1.32% | 80.33% | 109.10% |
| 500 Index Fund ETF Shares Net Asset Value | | 1.35 | 80.45 | 109.14 |
| S&P 500 Index | | 1.38 | 80.75 | 109.51 |
"Since Inception" performance is calculated from the ETF Shares’ inception date for both the fund and its comparative standards.
Fiscal-Year Total Returns (%): December 31, 2005, Through December 31, 2015
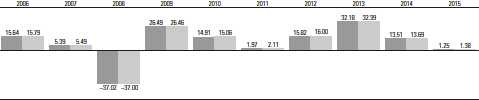
500 Index Fund Investor Shares
S&P 500 Index
12
500 Index Fund
Financial Statements
Statement of Net Assets
As of December 31, 2015
The fund reports a complete list of its holdings in regulatory filings four times in each fiscal year, at the quarter-ends. For the second and fourth fiscal quarters, the lists appear in the fund’s semiannual and annual reports to shareholders. For the first and third fiscal quarters, the fund files the lists with the Securities and Exchange Commission on Form N-Q. Shareholders can look up the fund’s Forms N-Q on the SEC’s website at sec.gov. Forms N-Q may also be reviewed and copied at the SEC’s Public Reference Room (see the back cover of this report for further information).
| | | |
| | | | Market |
| | | | Value• |
| | | Shares | ($000) |
| Common Stocks (99.7%)1 | | |
| Consumer Discretionary (12.9%) | |
| * | Amazon.com Inc. | 4,693,197 | 3,172,085 |
| | Home Depot Inc. | 15,480,227 | 2,047,260 |
| | Walt Disney Co. | 18,569,818 | 1,951,316 |
| | Comcast Corp. Class A | 29,813,682 | 1,682,386 |
| | McDonald’s Corp. | 11,211,142 | 1,324,484 |
| | Starbucks Corp. | 18,128,618 | 1,088,261 |
| | NIKE Inc. Class B | 16,476,255 | 1,029,766 |
| | Lowe’s Cos. Inc. | 11,172,885 | 849,586 |
| * | Priceline Group Inc. | 607,823 | 774,944 |
| | Ford Motor Co. | 47,589,246 | 670,532 |
| | Time Warner Cable Inc. | 3,457,584 | 641,693 |
| | Time Warner Inc. | 9,761,049 | 631,247 |
| * | Netflix Inc. | 5,218,020 | 596,837 |
| | General Motors Co. | 17,289,809 | 588,026 |
| | TJX Cos. Inc. | 8,174,389 | 579,646 |
| | Target Corp. | 7,521,508 | 546,137 |
| | Twenty-First Century | | |
| | Fox Inc. Class A | 19,558,585 | 531,211 |
| | Yum! Brands Inc. | 5,265,033 | 384,611 |
| | Johnson Controls Inc. | 7,907,407 | 312,263 |
| | Carnival Corp. | 5,619,507 | 306,151 |
| * | O’Reilly Automotive Inc. | 1,204,279 | 305,188 |
| | L Brands Inc. | 3,109,558 | 297,958 |
| | Delphi Automotive plc | 3,419,533 | 293,157 |
| * | AutoZone Inc. | 372,181 | 276,125 |
| | Ross Stores Inc. | 4,944,569 | 266,067 |
| | VF Corp. | 4,163,691 | 259,190 |
| | Dollar General Corp. | 3,551,850 | 255,271 |
| | CBS Corp. Class B | 5,294,831 | 249,545 |
| | Omnicom Group Inc. | 2,957,526 | 223,766 |
| * | Dollar Tree Inc. | 2,866,444 | 221,347 |
| | Royal Caribbean | | |
| | Cruises Ltd. | 2,094,843 | 212,019 |
| * | Chipotle Mexican | | |
| | Grill Inc. Class A | 380,751 | 182,703 |
| | Expedia Inc. | 1,436,763 | 178,590 |
| | | |
| | | | Market |
| | | | Value• |
| | | Shares | ($000) |
| * | Under Armour Inc. | | |
| | Class A | 2,198,843 | 177,249 |
| | Viacom Inc. Class B | 4,238,227 | 174,445 |
| | Genuine Parts Co. | 1,840,480 | 158,079 |
| | Marriott International | | |
| | Inc. Class A | 2,354,245 | 157,829 |
| * | Mohawk Industries Inc. | 776,133 | 146,992 |
| | Newell Rubbermaid Inc. | 3,260,671 | 143,730 |
| | Starwood Hotels & | | |
| | Resorts Worldwide Inc. | 2,059,428 | 142,677 |
| | Hanesbrands Inc. | 4,783,193 | 140,769 |
| | Tractor Supply Co. | 1,639,911 | 140,212 |
| | Whirlpool Corp. | 954,573 | 140,198 |
| | Advance Auto Parts Inc. | 894,005 | 134,557 |
| | Macy’s Inc. | 3,837,657 | 134,241 |
| * | CarMax Inc. | 2,473,708 | 133,506 |
| | DR Horton Inc. | 4,005,829 | 128,307 |
| | Signet Jewelers Ltd. | 971,888 | 120,213 |
| | BorgWarner Inc. | 2,736,205 | 118,286 |
| * | TripAdvisor Inc. | 1,379,357 | 117,590 |
| | Interpublic Group | | |
| | of Cos. Inc. | 4,960,385 | 115,478 |
| | Mattel Inc. | 4,142,576 | 112,554 |
| | Best Buy Co. Inc. | 3,643,674 | 110,950 |
| | Coach Inc. | 3,387,720 | 110,880 |
| | Kohl’s Corp. | 2,319,708 | 110,488 |
| | Goodyear Tire | | |
| | & Rubber Co. | 3,287,564 | 107,405 |
| | Lennar Corp. Class A | 2,185,607 | 106,898 |
| | Harley-Davidson Inc. | 2,344,586 | 106,421 |
| | Tiffany & Co. | 1,361,612 | 103,877 |
| | Wyndham Worldwide | | |
| | Corp. | 1,418,837 | 103,079 |
| * | Bed Bath & Beyond Inc. | 2,039,455 | 98,404 |
| | H&R Block Inc. | 2,882,293 | 96,009 |
| | Hasbro Inc. | 1,370,689 | 92,330 |
| * | Michael Kors | | |
| | Holdings Ltd. | 2,249,189 | 90,103 |
13
| | | |
| 500 Index Fund | | |
| |
| |
| |
| | | | Market |
| | | | Value• |
| | | Shares | ($000) |
| | Darden Restaurants Inc. | 1,409,355 | 89,691 |
| | Cablevision Systems | | |
| | Corp. Class A | 2,719,877 | 86,764 |
| | Nordstrom Inc. | 1,662,869 | 82,827 |
| | Harman International | | |
| | Industries Inc. | 869,088 | 81,877 |
| | Ralph Lauren Corp. | | |
| | Class A | 718,726 | 80,124 |
| | News Corp. Class A | 5,980,264 | 79,896 |
| * | Discovery | | |
| | Communications Inc. | 3,152,678 | 79,511 |
| | Staples Inc. | 7,869,341 | 74,523 |
| | PVH Corp. | 1,009,265 | 74,332 |
| | Leggett & Platt Inc. | 1,664,591 | 69,946 |
| | Gap Inc. | 2,801,061 | 69,186 |
| | TEGNA Inc. | 2,710,630 | 69,175 |
| | PulteGroup Inc. | 3,877,920 | 69,105 |
| | Wynn Resorts Ltd. | 993,591 | 68,747 |
| | Scripps Networks | | |
| | Interactive Inc. Class A | 1,156,916 | 63,873 |
| * | AutoNation Inc. | 933,683 | 55,704 |
| | Garmin Ltd. | 1,441,268 | 53,572 |
| * | Discovery | | |
| | Communications Inc. | | |
| | Class A | 1,828,846 | 48,794 |
| ^ | GameStop Corp. Class A | 1,287,178 | 36,092 |
| * | Urban Outfitters Inc. | 1,059,470 | 24,103 |
| *,^ | Fossil Group Inc. | 505,875 | 18,495 |
| | | | 28,179,461 |
| Consumer Staples (10.0%) | | |
| | Procter & Gamble Co. | 33,217,094 | 2,637,769 |
| | Coca-Cola Co. | 47,789,337 | 2,053,030 |
| | PepsiCo Inc. | 17,787,530 | 1,777,330 |
| | Philip Morris | | |
| | International Inc. | 18,916,182 | 1,662,922 |
| | Altria Group Inc. | 23,938,921 | 1,393,485 |
| | CVS Health Corp. | 13,519,773 | 1,321,828 |
| | Wal-Mart Stores Inc. | 19,155,772 | 1,174,249 |
| | Walgreens Boots | | |
| | Alliance Inc. | 10,634,833 | 905,609 |
| | Mondelez | | |
| | International Inc. | | |
| | Class A | 19,402,729 | 870,018 |
| | Costco Wholesale Corp. | 5,340,398 | 862,474 |
| | Colgate-Palmolive Co. | 10,950,786 | 729,541 |
| | Kimberly-Clark Corp. | 4,431,875 | 564,178 |
| | Kraft Heinz Co. | 7,259,490 | 528,201 |
| | Kroger Co. | 11,884,831 | 497,142 |
| | Reynolds American Inc. | 10,119,879 | 467,032 |
| | General Mills Inc. | 7,297,180 | 420,755 |
| | Constellation Brands | | |
| | Inc. Class A | 2,113,869 | 301,100 |
| * | Monster Beverage Corp. | 1,831,396 | 272,805 |
| | |
| | | Market |
| | | Value• |
| | Shares | ($000) |
| Archer-Daniels- | | |
| Midland Co. | 7,285,415 | 267,229 |
| Sysco Corp. | 6,409,541 | 262,791 |
| Estee Lauder Cos. Inc. | | |
| Class A | 2,717,269 | 239,283 |
| Kellogg Co. | 3,115,176 | 225,134 |
| ConAgra Foods Inc. | 5,285,120 | 222,821 |
| Dr Pepper Snapple | | |
| Group Inc. | 2,306,011 | 214,920 |
| Clorox Co. | 1,575,931 | 199,875 |
| Tyson Foods Inc. Class A | 3,609,297 | 192,484 |
| Mead Johnson | | |
| Nutrition Co. | 2,406,636 | 190,004 |
| Molson Coors | | |
| Brewing Co. Class B | 1,923,663 | 180,670 |
| JM Smucker Co. | 1,461,013 | 180,201 |
| Hershey Co. | 1,754,015 | 156,581 |
| Whole Foods Market Inc. | 4,166,090 | 139,564 |
| Church & Dwight Co. Inc. | 1,600,678 | 135,866 |
| Hormel Foods Corp. | 1,646,862 | 130,234 |
| Keurig Green | | |
| Mountain Inc. | 1,418,030 | 127,594 |
| Coca-Cola | | |
| Enterprises Inc. | 2,548,897 | 125,508 |
| Brown-Forman Corp. | | |
| Class B | 1,240,598 | 123,167 |
| McCormick & Co. Inc. | 1,419,558 | 121,457 |
| Campbell Soup Co. | 2,192,444 | 115,213 |
| | | 21,990,064 |
| Energy (6.5%) | | |
| Exxon Mobil Corp. | 50,827,997 | 3,962,042 |
| Chevron Corp. | 22,978,906 | 2,067,182 |
| Schlumberger Ltd. | 15,397,402 | 1,073,969 |
| ConocoPhillips | 15,074,112 | 703,810 |
| Occidental | | |
| Petroleum Corp. | 9,324,610 | 630,437 |
| EOG Resources Inc. | 6,711,452 | 475,104 |
| Phillips 66 | 5,796,349 | 474,141 |
| Valero Energy Corp. | 5,878,697 | 415,683 |
| Halliburton Co. | 10,448,559 | 355,669 |
| Marathon | | |
| Petroleum Corp. | 6,506,946 | 337,320 |
| Kinder Morgan Inc. | 22,340,269 | 333,317 |
| Anadarko | | |
| Petroleum Corp. | 6,203,812 | 301,381 |
| Baker Hughes Inc. | 5,323,985 | 245,702 |
| Pioneer Natural | | |
| Resources Co. | 1,823,684 | 228,653 |
| Williams Cos. Inc. | 8,329,555 | 214,070 |
| Apache Corp. | 4,614,870 | 205,223 |
| Spectra Energy Corp. | 8,196,726 | 196,230 |
| Noble Energy Inc. | 5,195,881 | 171,100 |
| Tesoro Corp. | 1,469,635 | 154,855 |
14
| | | |
| 500 Index Fund | | |
| |
| |
| |
| | | | Market |
| | | | Value• |
| | | Shares | ($000) |
| | National Oilwell | | |
| | Varco Inc. | 4,587,121 | 153,623 |
| | Devon Energy Corp. | 4,716,320 | 150,922 |
| * | Cameron | | |
| | International Corp. | 2,333,038 | 147,448 |
| | Hess Corp. | 2,933,785 | 142,230 |
| | Marathon Oil Corp. | 8,276,185 | 104,197 |
| | Cimarex Energy Co. | 1,155,572 | 103,285 |
| | EQT Corp. | 1,864,183 | 97,180 |
| | Columbia Pipeline | | |
| | Group Inc. | 4,755,170 | 95,103 |
| | Cabot Oil & Gas Corp. | 5,057,888 | 89,474 |
| * | FMC Technologies Inc. | 2,788,339 | 80,890 |
| ^ | Helmerich & Payne Inc. | 1,317,924 | 70,575 |
| * | Newfield Exploration Co. | 1,976,168 | 64,344 |
| | ONEOK Inc. | 2,558,976 | 63,104 |
| ^ | Transocean Ltd. | 4,182,312 | 51,777 |
| | Range Resources Corp. | 2,068,542 | 50,907 |
| | Murphy Oil Corp. | 1,974,909 | 44,337 |
| | Ensco plc Class A | 2,876,549 | 44,270 |
| *,^ | Southwestern | | |
| | Energy Co. | 4,697,023 | 33,396 |
| ^ | Chesapeake | | |
| | Energy Corp. | 6,317,893 | 28,431 |
| ^ | CONSOL Energy Inc. | 2,799,513 | 22,116 |
| ^ | Diamond Offshore | | |
| | Drilling Inc. | 787,999 | 16,627 |
| | | | 14,200,124 |
| Financials (16.4%) | | |
| | Wells Fargo & Co. | 56,751,662 | 3,085,020 |
| | JPMorgan Chase & Co. | 44,945,183 | 2,967,730 |
| * | Berkshire Hathaway Inc. | | |
| | Class B | 21,311,016 | 2,813,907 |
| | Bank of America Corp. | 127,132,211 | 2,139,635 |
| | Citigroup Inc. | 36,372,174 | 1,882,260 |
| | American International | | |
| | Group Inc. | 15,103,195 | 935,945 |
| | Goldman Sachs | | |
| | Group Inc. | 4,843,160 | 872,883 |
| | US Bancorp | 20,074,999 | 856,600 |
| | Simon Property | | |
| | Group Inc. | 3,777,601 | 734,517 |
| | American Express Co. | 10,214,445 | 710,415 |
| | MetLife Inc. | 13,572,143 | 654,313 |
| | PNC Financial Services | | |
| | Group Inc. | 6,199,924 | 590,915 |
| | Morgan Stanley | 18,439,020 | 586,545 |
| | Bank of New York | | |
| | Mellon Corp. | 13,344,090 | 550,043 |
| | BlackRock Inc. | 1,541,713 | 524,984 |
| | American Tower | | |
| | Corporation | 5,171,360 | 501,363 |
| | Charles Schwab Corp. | 14,627,019 | 481,668 |
| | | |
| | | | Market |
| | | | Value• |
| | | Shares | ($000) |
| | Capital One | | |
| | Financial Corp. | 6,495,785 | 468,866 |
| | ACE Ltd. | 3,957,922 | 462,483 |
| | Prudential Financial Inc. | 5,481,875 | 446,279 |
| | Public Storage | 1,796,966 | 445,109 |
| | Travelers Cos. Inc. | 3,714,224 | 419,187 |
| | CME Group Inc. | 4,129,432 | 374,127 |
| | Intercontinental | | |
| | Exchange Inc. | 1,449,744 | 371,511 |
| | Chubb Corp. | 2,772,120 | 367,694 |
| | Equity Residential | 4,447,246 | 362,851 |
| | BB&T Corp. | 9,524,807 | 360,133 |
| | Marsh & McLennan | | |
| | Cos. Inc. | 6,368,738 | 353,147 |
| | Crown Castle | | |
| | International Corp. | 4,074,948 | 352,279 |
| | State Street Corp. | 4,926,069 | 326,894 |
| | McGraw Hill | | |
| | Financial Inc. | 3,299,974 | 325,311 |
| | Aflac Inc. | 5,209,965 | 312,077 |
| * | Synchrony Financial | 10,180,000 | 309,574 |
| | Aon plc | 3,344,135 | 308,363 |
| | AvalonBay | | |
| | Communities Inc. | 1,671,096 | 307,699 |
| | Welltower Inc. | 4,320,428 | 293,919 |
| | Allstate Corp. | 4,728,511 | 293,593 |
| | Discover Financial | | |
| | Services | 5,218,973 | 279,841 |
| | Prologis Inc. | 6,401,120 | 274,736 |
| | SunTrust Banks Inc. | 6,221,638 | 266,535 |
| | Boston Properties Inc. | 1,874,858 | 239,119 |
| | M&T Bank Corp. | 1,953,197 | 236,688 |
| | Ventas Inc. | 4,065,203 | 229,399 |
| | Equinix Inc. | 756,555 | 228,782 |
| | Progressive Corp. | 7,135,893 | 226,921 |
| | Ameriprise Financial Inc. | 2,125,630 | 226,210 |
| | T. Rowe Price Group Inc. | 3,065,468 | 219,150 |
| | Hartford Financial | | |
| | Services Group Inc. | 5,000,715 | 217,331 |
| | HCP Inc. | 5,677,382 | 217,103 |
| | Vornado Realty Trust | 2,163,660 | 216,280 |
| | Moody’s Corp. | 2,099,752 | 210,689 |
| * | Berkshire Hathaway Inc. | | |
| | Class A | 1,042 | 206,108 |
| | Fifth Third Bancorp | 9,697,384 | 194,917 |
| | General Growth | | |
| | Properties Inc. | 7,108,660 | 193,427 |
| | Essex Property Trust Inc. | 806,171 | 193,005 |
| | Northern Trust Corp. | 2,653,392 | 191,283 |
| | Weyerhaeuser Co. | 6,231,621 | 186,824 |
| | Invesco Ltd. | 5,174,533 | 173,243 |
| | Franklin Resources Inc. | 4,626,096 | 170,333 |
| | Realty Income Corp. | 3,047,087 | 157,321 |
15
| | | |
| 500 Index Fund | | |
| |
| |
| |
| | | | Market |
| | | | Value• |
| | | Shares | ($000) |
| | Regions Financial Corp. | 15,937,126 | 152,996 |
| | Lincoln National Corp. | 3,021,034 | 151,837 |
| | Principal Financial | | |
| | Group Inc. | 3,323,663 | 149,498 |
| | XL Group plc Class A | 3,634,955 | 142,418 |
| | Host Hotels | | |
| | & Resorts Inc. | 9,175,564 | 140,753 |
| | SL Green Realty Corp. | 1,217,090 | 137,507 |
| | KeyCorp | 10,197,859 | 134,510 |
| | Kimco Realty Corp. | 5,045,576 | 133,506 |
| | Macerich Co. | 1,642,830 | 132,560 |
| | Loews Corp. | 3,417,229 | 131,222 |
| * | CBRE Group Inc. | | |
| | Class A | 3,549,014 | 122,725 |
| | Huntington | | |
| | Bancshares Inc. | 9,738,224 | 107,705 |
| | Cincinnati Financial Corp. | 1,802,095 | 106,630 |
| * | E*TRADE Financial Corp. | 3,579,392 | 106,093 |
| * | Affiliated Managers | | |
| | Group Inc. | 659,615 | 105,380 |
| | Plum Creek | | |
| | Timber Co. Inc. | 2,121,429 | 101,235 |
| | Unum Group | 2,975,095 | 99,041 |
| | Comerica Inc. | 2,160,828 | 90,387 |
| | Nasdaq Inc. | 1,405,047 | 81,732 |
| | Torchmark Corp. | 1,401,719 | 80,122 |
| | Apartment Investment | | |
| | & Management Co. | 1,912,595 | 76,561 |
| | Leucadia National Corp. | 4,075,893 | 70,880 |
| | Zions Bancorporation | 2,497,739 | 68,188 |
| | Assurant Inc. | 805,025 | 64,837 |
| | Iron Mountain Inc. | 2,349,538 | 63,461 |
| | People’s United | | |
| | Financial Inc. | 3,793,403 | 61,264 |
| | Legg Mason Inc. | 1,317,805 | 51,698 |
| | Navient Corp. | 4,431,933 | 50,746 |
| | | | 36,020,576 |
| Health Care (15.1%) | | |
| | Johnson & Johnson | 33,783,378 | 3,470,229 |
| | Pfizer Inc. | 75,369,987 | 2,432,943 |
| | Merck & Co. Inc. | 34,107,913 | 1,801,580 |
| | Gilead Sciences Inc. | 17,596,138 | 1,780,553 |
| * | Allergan plc | 4,812,082 | 1,503,776 |
| | Amgen Inc. | 9,210,001 | 1,495,059 |
| | Bristol-Myers Squibb Co. | 20,368,906 | 1,401,177 |
| | UnitedHealth Group Inc. | 11,636,964 | 1,368,972 |
| | Medtronic plc | 17,168,408 | 1,320,594 |
| | AbbVie Inc. | 19,959,431 | 1,182,397 |
| * | Celgene Corp. | 9,592,443 | 1,148,791 |
| | Eli Lilly & Co. | 11,916,236 | 1,004,062 |
| * | Biogen Inc. | 2,721,506 | 833,733 |
| | Abbott Laboratories | 18,212,965 | 817,944 |
| | | |
| | | | Market |
| | | | Value• |
| | | Shares | ($000) |
| * | Express Scripts | | |
| | Holding Co. | 8,256,806 | 721,727 |
| | Thermo Fisher | | |
| | Scientific Inc. | 4,872,624 | 691,182 |
| | McKesson Corp. | 2,809,425 | 554,103 |
| * | Alexion | | |
| | Pharmaceuticals Inc. | 2,750,943 | 524,742 |
| * | Regeneron | | |
| | Pharmaceuticals Inc. | 947,855 | 514,562 |
| | Aetna Inc. | 4,257,258 | 460,295 |
| | Cigna Corp. | 3,145,070 | 460,218 |
| | Anthem Inc. | 3,187,341 | 444,443 |
| | Becton Dickinson | | |
| | and Co. | 2,572,867 | 396,453 |
| * | Vertex | | |
| | Pharmaceuticals Inc. | 2,999,905 | 377,478 |
| | Cardinal Health Inc. | 4,016,519 | 358,555 |
| | Stryker Corp. | 3,856,023 | 358,379 |
| * | Illumina Inc. | 1,787,364 | 343,076 |
| | Humana Inc. | 1,809,572 | 323,027 |
| * | Boston Scientific Corp. | 16,423,193 | 302,844 |
| * | Mylan NV | 5,042,935 | 272,671 |
| | Zoetis Inc. | 5,592,590 | 267,997 |
| * | HCA Holdings Inc. | 3,832,340 | 259,181 |
| | Baxalta Inc. | 6,626,734 | 258,641 |
| | Perrigo Co. plc | 1,787,300 | 258,622 |
| | Baxter International Inc. | 6,678,323 | 254,778 |
| * | Intuitive Surgical Inc. | 456,175 | 249,145 |
| | AmerisourceBergen | | |
| | Corp. Class A | 2,384,892 | 247,337 |
| * | Cerner Corp. | 3,717,142 | 223,660 |
| | Zimmer Biomet | | |
| | Holdings Inc. | 2,089,735 | 214,386 |
| | St. Jude Medical Inc. | 3,450,836 | 213,158 |
| * | Edwards | | |
| | Lifesciences Corp. | 2,633,398 | 207,986 |
| | CR Bard Inc. | 901,915 | 170,859 |
| | Agilent Technologies Inc. | 4,045,731 | 169,152 |
| * | Henry Schein Inc. | 1,012,287 | 160,134 |
| * | Endo International plc | 2,541,212 | 155,573 |
| * | Laboratory Corp. of | | |
| | America Holdings | 1,235,442 | 152,750 |
| * | DaVita HealthCare | | |
| | Partners Inc. | 2,034,872 | 141,851 |
| * | Waters Corp. | 996,875 | 134,159 |
| | Universal Health | | |
| | Services Inc. Class B | 1,113,162 | 133,012 |
| | Quest Diagnostics Inc. | 1,749,881 | 124,487 |
| * | Mallinckrodt plc | 1,416,928 | 105,745 |
| | DENTSPLY | | |
| | International Inc. | 1,709,232 | 104,007 |
| * | Varian Medical | | |
| | Systems Inc. | 1,184,003 | 95,667 |
16
| | | |
| 500 Index Fund | | |
| |
| |
| |
| | | | Market |
| | | | Value• |
| | | Shares | ($000) |
| | PerkinElmer Inc. | 1,368,603 | 73,316 |
| | Patterson Cos. Inc. | 1,021,716 | 46,192 |
| * | Tenet Healthcare Corp. | 1,217,518 | 36,891 |
| | | | 33,124,251 |
| Industrials (10.0%) | | |
| | General Electric Co. | 115,233,118 | 3,589,512 |
| | 3M Co. | 7,517,516 | 1,132,439 |
| | Boeing Co. | 7,689,254 | 1,111,789 |
| | Honeywell | | |
| | International Inc. | 9,409,617 | 974,554 |
| | United Technologies | | |
| | Corp. | 10,071,909 | 967,608 |
| | United Parcel Service | | |
| | Inc. Class B | 8,499,452 | 817,902 |
| | Union Pacific Corp. | 10,428,287 | 815,492 |
| | Lockheed Martin Corp. | 3,226,605 | 700,657 |
| | Danaher Corp. | 7,279,083 | 676,081 |
| | General Dynamics Corp. | 3,627,988 | 498,341 |
| | Delta Air Lines Inc. | 9,602,148 | 486,733 |
| | Caterpillar Inc. | 7,108,560 | 483,098 |
| | FedEx Corp. | 3,206,210 | 477,693 |
| | Raytheon Co. | 3,676,099 | 457,785 |
| | Northrop Grumman Corp. | 2,226,652 | 420,414 |
| | Precision Castparts Corp. | 1,679,815 | 389,734 |
| | Emerson Electric Co. | 7,991,488 | 382,233 |
| | Illinois Tool Works Inc. | 3,994,054 | 370,169 |
| | Southwest Airlines Co. | 7,940,111 | 341,901 |
| | American Airlines | | |
| | Group Inc. | 7,695,585 | 325,908 |
| | CSX Corp. | 11,902,889 | 308,880 |
| | Norfolk Southern Corp. | 3,645,103 | 308,339 |
| | Eaton Corp. plc | 5,650,180 | 294,035 |
| | Deere & Co. | 3,806,141 | 290,294 |
| | Waste Management Inc. | 5,069,558 | 270,562 |
| * | United Continental | | |
| | Holdings Inc. | 4,551,485 | 260,800 |
| | Roper Technologies Inc. | 1,230,634 | 233,562 |
| | Nielsen Holdings plc | 4,444,481 | 207,113 |
| | PACCAR Inc. | 4,315,135 | 204,537 |
| | Stanley Black | | |
| | & Decker Inc. | 1,827,835 | 195,085 |
| | Cummins Inc. | 2,005,208 | 176,478 |
| | Ingersoll-Rand plc | 3,186,858 | 176,201 |
| | Rockwell Automation Inc. | 1,611,616 | 165,368 |
| | Tyco International plc | 5,161,000 | 164,584 |
| | Equifax Inc. | 1,446,339 | 161,079 |
| | Parker-Hannifin Corp. | 1,660,054 | 160,992 |
| | AMETEK Inc. | 2,904,013 | 155,626 |
| | Rockwell Collins Inc. | 1,604,612 | 148,106 |
| * | Verisk Analytics Inc. | | |
| | Class A | 1,902,820 | 146,289 |
| ^ | Fastenal Co. | 3,536,562 | 144,363 |
| | | |
| | | | Market |
| | | | Value• |
| | | Shares | ($000) |
| | WW Grainger Inc. | 705,197 | 142,866 |
| | Textron Inc. | 3,340,871 | 140,350 |
| | Republic Services Inc. | | |
| | Class A | 2,924,808 | 128,662 |
| * | Stericycle Inc. | 1,037,424 | 125,113 |
| | Snap-on Inc. | 708,896 | 121,526 |
| | Masco Corp. | 4,111,616 | 116,359 |
| | Dover Corp. | 1,893,654 | 116,100 |
| | L-3 Communications | | |
| | Holdings Inc. | 956,935 | 114,363 |
| | Pentair plc | 2,200,354 | 108,984 |
| | CH Robinson | | |
| | Worldwide Inc. | 1,755,908 | 108,901 |
| | Expeditors International | | |
| | of Washington Inc. | 2,278,091 | 102,742 |
| | Kansas City Southern | 1,333,744 | 99,591 |
| | Cintas Corp. | 1,068,715 | 97,307 |
| * | United Rentals Inc. | 1,134,470 | 82,295 |
| | Fluor Corp. | 1,730,650 | 81,721 |
| | JB Hunt Transport | | |
| | Services Inc. | 1,106,460 | 81,170 |
| | Xylem Inc. | 2,192,078 | 80,011 |
| | Allegion plc | 1,172,224 | 77,273 |
| | Robert Half | | |
| | International Inc. | 1,620,912 | 76,410 |
| | Flowserve Corp. | 1,600,165 | 67,335 |
| | ADT Corp. | 2,016,769 | 66,513 |
| * | Jacobs Engineering | | |
| | Group Inc. | 1,495,874 | 62,752 |
| | Pitney Bowes Inc. | 2,410,413 | 49,775 |
| | Dun & Bradstreet Corp. | 442,075 | 45,945 |
| * | Quanta Services Inc. | 1,954,425 | 39,577 |
| | Ryder System Inc. | 652,579 | 37,086 |
| | | | 21,963,063 |
| Information Technology (20.6%) | |
| | Apple Inc. | 68,072,998 | 7,165,364 |
| | Microsoft Corp. | 97,529,827 | 5,410,955 |
| * | Facebook Inc. Class A | 27,721,421 | 2,901,324 |
| * | Alphabet Inc. Class A | 3,557,003 | 2,767,384 |
| * | Alphabet Inc. | 3,627,884 | 2,753,129 |
| | Intel Corp. | 57,616,995 | 1,984,905 |
| | Visa Inc. Class A | 23,765,217 | 1,842,993 |
| | Cisco Systems Inc. | 61,976,650 | 1,682,976 |
| | International Business | | |
| | Machines Corp. | 10,897,010 | 1,499,646 |
| | Oracle Corp. | 39,089,499 | 1,427,939 |
| | MasterCard Inc. Class A | 12,089,930 | 1,177,076 |
| | QUALCOMM Inc. | 18,351,839 | 917,317 |
| | Accenture plc Class A | 7,628,432 | 797,171 |
| | Texas Instruments Inc. | 12,385,269 | 678,837 |
| | EMC Corp. | 23,671,726 | 607,890 |
| * | salesforce.com inc | 7,620,528 | 597,449 |
17
| | | |
| 500 Index Fund | | |
| |
| |
| |
| | | | Market |
| | | | Value• |
| | | Shares | ($000) |
| * | Adobe Systems Inc. | 6,089,940 | 572,089 |
| * | PayPal Holdings Inc. | 13,573,393 | 491,357 |
| | Automatic Data | | |
| | Processing Inc. | 5,630,902 | 477,050 |
| | Avago Technologies | | |
| | Ltd. Class A | 3,201,186 | 464,652 |
| * | Cognizant Technology | | |
| | Solutions Corp. Class A | 7,423,919 | 445,584 |
| | Broadcom Corp. Class A | 6,849,203 | 396,021 |
| * | eBay Inc. | 13,486,092 | 370,598 |
| * | Yahoo! Inc. | 10,607,189 | 352,795 |
| | Hewlett Packard | | |
| | Enterprise Co. | 21,954,371 | 333,706 |
| | Intuit Inc. | 3,223,118 | 311,031 |
| | TE Connectivity Ltd. | 4,716,324 | 304,722 |
| | Corning Inc. | 14,442,664 | 264,012 |
| | Applied Materials Inc. | 14,029,401 | 261,929 |
| | HP Inc. | 22,053,915 | 261,118 |
| * | Electronic Arts Inc. | 3,794,541 | 260,761 |
| * | Fiserv Inc. | 2,790,153 | 255,187 |
| | Activision Blizzard Inc. | 6,159,431 | 238,432 |
| | Analog Devices Inc. | 3,809,781 | 210,757 |
| | Paychex Inc. | 3,917,422 | 207,192 |
| * | Alliance Data | | |
| | Systems Corp. | 746,397 | 206,431 |
| | NVIDIA Corp. | 6,239,671 | 205,659 |
| | Fidelity National | | |
| | Information | | |
| | Services Inc. | 3,387,028 | 205,254 |
| | Amphenol Corp. Class A | 3,763,355 | 196,560 |
| * | Micron Technology Inc. | 13,255,180 | 187,693 |
| | SanDisk Corp. | 2,450,020 | 186,177 |
| * | Red Hat Inc. | 2,231,642 | 184,802 |
| | Skyworks Solutions Inc. | 2,333,608 | 179,291 |
| | Symantec Corp. | 8,246,948 | 173,186 |
| | Western Digital Corp. | 2,828,780 | 169,868 |
| * | Autodesk Inc. | 2,761,398 | 168,252 |
| | Lam Research Corp. | 1,933,607 | 153,567 |
| | Xilinx Inc. | 3,137,104 | 147,350 |
| * | Citrix Systems Inc. | 1,877,847 | 142,059 |
| | Motorola Solutions Inc. | 1,961,428 | 134,260 |
| | Seagate Technology plc | 3,650,480 | 133,827 |
| | KLA-Tencor Corp. | 1,903,648 | 132,018 |
| | Harris Corp. | 1,518,756 | 131,980 |
| | Linear Technology Corp. | 2,919,310 | 123,983 |
| | Xerox Corp. | 11,617,426 | 123,493 |
| | Juniper Networks Inc. | 4,333,456 | 119,603 |
| | Microchip | | |
| | Technology Inc. | 2,482,128 | 115,518 |
| * | Akamai | | |
| | Technologies Inc. | 2,175,375 | 114,490 |
| | Western Union Co. | 6,177,262 | 110,635 |
| | | |
| | | | Market |
| | | | Value• |
| | | Shares | ($000) |
| | CA Inc. | 3,808,382 | 108,767 |
| *,^ | VeriSign Inc. | 1,199,211 | 104,763 |
| | Total System | | |
| | Services Inc. | 2,066,288 | 102,901 |
| | NetApp Inc. | 3,572,469 | 94,778 |
| * | Qorvo Inc. | 1,727,322 | 87,921 |
| * | F5 Networks Inc. | 859,000 | 83,289 |
| * | First Solar Inc. | 925,885 | 61,099 |
| | CSRA Inc. | 1,682,294 | 50,469 |
| | FLIR Systems Inc. | 1,689,738 | 47,431 |
| * | Teradata Corp. | 1,624,469 | 42,918 |
| | | | 45,221,640 |
| Materials (2.8%) | | |
| | EI du Pont de | | |
| | Nemours & Co. | 10,700,280 | 712,639 |
| | Dow Chemical Co. | 13,729,543 | 706,797 |
| | Monsanto Co. | 5,370,022 | 529,054 |
| | LyondellBasell | | |
| | Industries NV Class A | 4,389,768 | 381,471 |
| | Ecolab Inc. | 3,244,830 | 371,144 |
| | Praxair Inc. | 3,477,653 | 356,112 |
| | PPG Industries Inc. | 3,287,427 | 324,863 |
| | Air Products | | |
| | & Chemicals Inc. | 2,367,005 | 307,971 |
| | Sherwin-Williams Co. | 966,139 | 250,810 |
| | International Paper Co. | 5,061,132 | 190,805 |
| | Alcoa Inc. | 15,994,101 | 157,862 |
| | Nucor Corp. | 3,901,789 | 157,242 |
| | Vulcan Materials Co. | 1,627,459 | 154,560 |
| | WestRock Co. | 3,138,795 | 143,192 |
| | Eastman Chemical Co. | 1,814,090 | 122,469 |
| | Ball Corp. | 1,664,135 | 121,032 |
| | International Flavors | | |
| | & Fragrances Inc. | 979,643 | 117,204 |
| | Newmont Mining Corp. | 6,468,646 | 116,371 |
| | CF Industries | | |
| | Holdings Inc. | 2,849,385 | 116,283 |
| | Mosaic Co. | 4,093,586 | 112,942 |
| | Martin Marietta | | |
| | Materials Inc. | 808,638 | 110,444 |
| | Airgas Inc. | 792,530 | 109,623 |
| | Sealed Air Corp. | 2,412,583 | 107,601 |
| | Freeport-McMoRan Inc. | 14,125,319 | 95,628 |
| | Avery Dennison Corp. | 1,114,296 | 69,822 |
| | FMC Corp. | 1,633,839 | 63,932 |
| * | Owens-Illinois Inc. | 1,964,697 | 34,225 |
| | | | 6,042,098 |
| Telecommunication Services (2.4%) | |
| | AT&T Inc. | 75,113,560 | 2,584,658 |
| | Verizon | | |
| | Communications Inc. | 49,679,357 | 2,296,180 |
18
| | | |
| 500 Index Fund | | |
| |
| |
| |
| | | | Market |
| | | | Value• |
| | | Shares | ($000) |
| * | Level 3 | | |
| | Communications Inc. | 3,522,937 | 191,507 |
| | CenturyLink Inc. | 6,702,299 | 168,630 |
| | Frontier | | |
| | Communications Corp. | 14,283,626 | 66,704 |
| | | | 5,307,679 |
| Utilities (3.0%) | | |
| | Duke Energy Corp. | 8,403,981 | 599,960 |
| | NextEra Energy Inc. | 5,622,746 | 584,147 |
| | Southern Co. | 11,097,371 | 519,246 |
| | Dominion Resources Inc. | 7,268,517 | 491,642 |
| | American Electric | | |
| | Power Co. Inc. | 5,992,274 | 349,170 |
| | PG&E Corp. | 5,987,872 | 318,495 |
| | Exelon Corp. | 11,226,781 | 311,768 |
| | PPL Corp. | 8,201,655 | 279,922 |
| | Sempra Energy | 2,878,773 | 270,633 |
| | Public Service | | |
| | Enterprise Group Inc. | 6,177,033 | 238,989 |
| | Edison International | 3,977,608 | 235,514 |
| | Consolidated Edison Inc. | 3,579,359 | 230,045 |
| | Xcel Energy Inc. | 6,195,704 | 222,488 |
| | Eversource Energy | 3,872,323 | 197,760 |
| | WEC Energy Group Inc. | 3,853,944 | 197,746 |
| | DTE Energy Co. | 2,191,004 | 175,697 |
| | FirstEnergy Corp. | 5,164,534 | 163,871 |
| | Entergy Corp. | 2,177,670 | 148,865 |
| | Ameren Corp. | 2,961,996 | 128,047 |
| | CMS Energy Corp. | 3,382,355 | 122,035 |
| | SCANA Corp. | 1,746,435 | 105,642 |
| | CenterPoint Energy Inc. | 5,258,014 | 96,537 |
| | AGL Resources Inc. | 1,469,436 | 93,765 |
| | Pinnacle West | | |
| | Capital Corp. | 1,354,687 | 87,350 |
| | Pepco Holdings Inc. | 3,099,406 | 80,616 |
| | AES Corp. | 8,226,719 | 78,730 |
| | TECO Energy Inc. | 2,874,779 | 76,613 |
| | NiSource Inc. | 3,896,288 | 76,017 |
| | NRG Energy Inc. | 3,843,329 | 45,236 |
| | | | 6,526,546 |
| Total Common Stocks | | |
| (Cost $136,704,127) | | 218,575,502 |
| Temporary Cash Investments (0.3%)1 | |
| Money Market Fund (0.3%) | | |
| 2,3 | Vanguard Market | | |
| | Liquidity Fund, | | |
| | 0.363% | 727,067,519 | 727,068 |
| | | |
| | | Face | Market |
| | | Amount | Value• |
| | | ($000) | ($000) |
| U.S. Government and Agency Obligations (0.0%) |
| 4,5 | Federal Home Loan | | |
| | Bank Discount Notes, | | |
| | 0.200%, 2/5/16 | 15,000 | 14,996 |
| 4,5 | Federal Home Loan | | |
| | Bank Discount Notes, | | |
| | 0.355%, 3/4/16 | 10,000 | 9,993 |
| 4 | Federal Home Loan | | |
| | Bank Discount Notes, | | |
| | 0.245%, 4/20/16 | 5,000 | 4,993 |
| 5,6 | Freddie Mac Discount | | |
| | Notes, 0.220%, 3/30/16 | 5,000 | 4,996 |
| 5,6 | Freddie Mac Discount | | |
| | Notes, 0.220%, 4/15/16 | 25,000 | 24,972 |
| | | | 59,950 |
| Total Temporary Cash Investments | |
| (Cost $787,036) | | 787,018 |
| Total Investments (100.0%) | | |
| (Cost $137,491,163) | 219,362,520 |
| |
| | | | Amount |
| | | | ($000) |
| Other Assets and Liabilities (0.0%) | |
| Other Assets | | |
| Investment in Vanguard | | 19,191 |
| Receivables for Investment | | |
| Securities Sold | | 307,538 |
| Receivables for Accrued Income | | 291,879 |
| Receivables for Capital Shares Issued | 150,063 |
| Total Other Assets | | 768,671 |
| Liabilities | | |
| Payables for Investment | | |
| Securities Purchased | | (98,857) |
| Collateral for Securities on Loan | | (86,704) |
| Payables for Capital Shares Redeemed | (511,714) |
| Payables to Vanguard | | (152,750) |
| Other Liabilities | | (9,462) |
| Total Liabilities | | (859,487) |
| Net Assets (100%) | 219,271,704 |
19
| |
| 500 Index Fund | |
| |
| |
| |
| At December 31, 2015, net assets consisted of: |
| | Amount |
| | ($000) |
| Paid-in Capital | 140,689,954 |
| Overdistributed Net Investment Income (93,881) |
| Accumulated Net Realized Losses | (3,207,594) |
| Unrealized Appreciation (Depreciation) | |
| Investment Securities | 81,871,357 |
| Futures Contracts | 11,868 |
| Net Assets | 219,271,704 |
| |
| |
| Investor Shares—Net Assets | |
| Applicable to 138,432,933 outstanding | |
| $.001 par value shares of beneficial | |
| interest (unlimited authorization) | 26,092,149 |
| Net Asset Value Per Share— | |
| Investor Shares | $188.48 |
| |
| |
| ETF Shares—Net Assets | |
| Applicable to 216,201,503 outstanding | |
| $.001 par value shares of beneficial | |
| interest (unlimited authorization) | 40,439,887 |
| Net Asset Value Per Share— | |
| ETF Shares | $187.05 |
| |
| |
| Admiral Shares—Net Assets | |
| Applicable to 810,371,769 outstanding | |
| $.001 par value shares of beneficial | |
| interest (unlimited authorization) | 152,739,668 |
| Net Asset Value Per Share— | |
| Admiral Shares | $188.48 |
• See Note A in Notes to Financial Statements.
* Non-income-producing security.
^ Includes partial security positions on loan to broker-dealers. The total value of securities on loan is $81,700,000.
1 The fund invests a portion of its cash reserves in equity markets through the use of index futures contracts. After giving effect to futures investments, the fund’s effective common stock and temporary cash investment positions represent 100.0% and 0.0%, respectively, of net assets.
2 Affiliated money market fund available only to Vanguard funds and certain trusts and accounts managed by Vanguard. Rate shown is the 7-day yield.
3 Includes $86,704,000 of collateral received for securities on loan.
4 The issuer operates under a congressional charter; its securities are generally neither guaranteed by the U.S. Treasury nor backed by the full faith and credit of the U.S. government.
5 Securities with a value of $35,566,000 have been segregated as initial margin for open futures contracts.
6 The issuer was placed under federal conservatorship in September 2008; since that time, its daily operations have been managed by the
Federal Housing Finance Agency and it receives capital from the U.S. Treasury, as needed to maintain a positive net worth, in exchange for senior preferred stock.
See accompanying Notes, which are an integral part of the Financial Statements.
20
| |
| 500 Index Fund | |
| |
| |
| Statement of Operations | |
| |
| | Year Ended |
| | December 31, 2015 |
| | ($000) |
| Investment Income | |
| Income | |
| Dividends | 4,535,889 |
| Interest1 | 1,479 |
| Securities Lending | 7,288 |
| Total Income | 4,544,656 |
| Expenses | |
| The Vanguard Group—Note B | |
| Investment Advisory Services | 11,148 |
| Management and Administrative—Investor Shares | 35,883 |
| Management and Administrative—ETF Shares | 10,991 |
| Management and Administrative—Admiral Shares | 47,687 |
| Marketing and Distribution—Investor Shares | 5,608 |
| Marketing and Distribution—ETF Shares | 3,465 |
| Marketing and Distribution—Admiral Shares | 14,572 |
| Custodian Fees | 1,424 |
| Auditing Fees | 40 |
| Shareholders’ Reports—Investor Shares | 404 |
| Shareholders’ Reports—ETF Shares | 262 |
| Shareholders’ Reports—Admiral Shares | 533 |
| Trustees’ Fees and Expenses | 148 |
| Total Expenses | 132,165 |
| Net Investment Income | 4,412,491 |
| Realized Net Gain (Loss) | |
| Investment Securities Sold | 5,842,252 |
| Futures Contracts | 21,526 |
| Realized Net Gain (Loss) | 5,863,778 |
| Change in Unrealized Appreciation (Depreciation) | |
| Investment Securities | (7,362,773) |
| Futures Contracts | (3,953) |
| Change in Unrealized Appreciation (Depreciation) | (7,366,726) |
| Net Increase (Decrease) in Net Assets Resulting from Operations | 2,909,543 |
| 1 Interest income from an affiliated company of the fund was $1,411,000. | |
See accompanying Notes, which are an integral part of the Financial Statements.
21
| | |
| 500 Index Fund | | |
| |
| |
| Statement of Changes in Net Assets | | |
| |
| | Year Ended December 31, |
| | 2015 | 2014 |
| | ($000) | ($000) |
| Increase (Decrease) in Net Assets | | |
| Operations | | |
| Net Investment Income | 4,412,491 | 3,491,270 |
| Realized Net Gain (Loss) | 5,863,778 | 2,934,840 |
| Change in Unrealized Appreciation (Depreciation) | (7,366,726) | 16,592,771 |
| Net Increase (Decrease) in Net Assets Resulting from Operations | 2,909,543 | 23,018,881 |
| Distributions | | |
| Net Investment Income | | |
| Investor Shares | (534,841) | (507,320) |
| ETF Shares | (728,706) | (414,084) |
| Admiral Shares | (3,127,986) | (2,181,851) |
| Signal Shares | — | (376,834) |
| Realized Capital Gain | | |
| Investor Shares | — | — |
| ETF Shares | — | — |
| Admiral Shares | — | — |
| Signal Shares | — | — |
| Total Distributions | (4,391,533) | (3,480,089) |
| Capital Share Transactions | | |
| Investor Shares | (1,787,828) | (2,739,056) |
| ETF Shares | 13,021,182 | 10,322,174 |
| Admiral Shares | 10,808,168 | 48,413,004 |
| Signal Shares | — | (36,640,079) |
| Net Increase (Decrease) from Capital Share Transactions | 22,041,522 | 19,356,043 |
| Total Increase (Decrease) | 20,559,532 | 38,894,835 |
| Net Assets | | |
| Beginning of Period | 198,712,172 | 159,817,337 |
| End of Period1 | 219,271,704 | 198,712,172 |
1 Net Assets—End of Period includes undistributed (overdistributed) net investment income of ($93,881,000) and ($114,839,000).
See accompanying Notes, which are an integral part of the Financial Statements.
22
| | | | | |
| 500 Index Fund | | | | | |
| |
| |
| Financial Highlights | | | | | |
| |
| |
| Investor Shares | | | | | |
| |
| For a Share Outstanding | | | Year Ended December 31, |
| Throughout Each Period | 2015 | 2014 | 2013 | 2012 | 2011 |
| Net Asset Value, Beginning of Period | $189.89 | $170.36 | $131.37 | $115.80 | $115.82 |
| Investment Operations | | | | | |
| Net Investment Income | 3.775 | 3.326 | 2.956 | 2.709 | 2.246 |
| Net Realized and Unrealized Gain (Loss) | | | | | |
| on Investments | (1.438) | 19.507 | 38.982 | 15.560 | (.020) |
| Total from Investment Operations | 2.337 | 22.833 | 41.938 | 18.269 | 2.226 |
| Distributions | | | | | |
| Dividends from Net Investment Income | (3.747) | (3.303) | (2.948) | (2.699) | (2.246) |
| Distributions from Realized Capital Gains | — | — | — | — | — |
| Total Distributions | (3.747) | (3.303) | (2.948) | (2.699) | (2.246) |
| Net Asset Value, End of Period | $188.48 | $189.89 | $170.36 | $131.37 | $115.80 |
| |
| Total Return1 | 1.25% | 13.51% | 32.18% | 15.82% | 1.97% |
| |
| Ratios/Supplemental Data | | | | | |
| Net Assets, End of Period (Millions) | $26,092 | $28,040 | $27,758 | $24,821 | $25,967 |
| Ratio of Total Expenses to | | | | | |
| Average Net Assets | 0.16% | 0.17% | 0.17% | 0.17% | 0.17% |
| Ratio of Net Investment Income to | | | | | |
| Average Net Assets | 2.00% | 1.88% | 1.95% | 2.13% | 1.92% |
| Portfolio Turnover Rate2 | 3% | 3% | 3% | 3% | 4% |
1 Total returns do not include account service fees that may have applied in the periods shown. Fund prospectuses provide information about any applicable account service fees.
2 Excludes the value of portfolio securities received or delivered as a result of in-kind purchases or redemptions of the fund’s capital shares, including ETF Creation Units.
See accompanying Notes, which are an integral part of the Financial Statements.
23
| | | | | |
| 500 Index Fund | | | | | |
| |
| |
| Financial Highlights | | | | | |
| |
| |
| ETF Shares | | | | | |
| |
| For a Share Outstanding | | | Year Ended December 31, |
| Throughout Each Period | 2015 | 2014 | 20131 | 20121 | 20111 |
| Net Asset Value, Beginning of Period | $188.45 | $169.07 | $130.38 | $114.92 | $114.94 |
| Investment Operations | | | | | |
| Net Investment Income | 3.958 | 3.518 | 3.117 | 2.846 | 2.372 |
| Net Realized and Unrealized Gain (Loss) | | | | | |
| on Investments | (1.427) | 19.352 | 38.681 | 15.450 | (.020) |
| Total from Investment Operations | 2.531 | 22.870 | 41.798 | 18.296 | 2.352 |
| Distributions | | | | | |
| Dividends from Net Investment Income | (3.931) | (3.490) | (3.108) | (2.836) | (2.372) |
| Distributions from Realized Capital Gains | — | — | — | — | — |
| Total Distributions | (3.931) | (3.490) | (3.108) | (2.836) | (2.372) |
| Net Asset Value, End of Period | $187.05 | $188.45 | $169.07 | $130.38 | $114.92 |
| |
| Total Return | 1.35% | 13.63% | 32.33% | 15.98% | 2.09% |
| |
| Ratios/Supplemental Data | | | | | |
| Net Assets, End of Period (Millions) | $40,440 | $27,630 | $15,037 | $6,628 | $2,366 |
| Ratio of Total Expenses to | | | | | |
| Average Net Assets | 0.05% | 0.05% | 0.05% | 0.05% | 0.05% |
| Ratio of Net Investment Income to | | | | | |
| Average Net Assets | 2.11% | 2.00% | 2.07% | 2.25% | 2.04% |
| Portfolio Turnover Rate2 | 3% | 3% | 3% | 3% | 4% |
1 Adjusted to reflect a 1-for-2 reverse share split as of the close of business on October 24, 2013.
2 Excludes the value of portfolio securities received or delivered as a result of in-kind purchases or redemptions of the fund’s capital shares, including ETF Creation Units.
See accompanying Notes, which are an integral part of the Financial Statements.
24
| | | | | |
| 500 Index Fund | | | | | |
| |
| |
| Financial Highlights | | | | | |
| |
| |
| Admiral Shares | | | | | |
| |
| For a Share Outstanding | | | Year Ended December 31, |
| Throughout Each Period | 2015 | 2014 | 2013 | 2012 | 2011 |
| Net Asset Value, Beginning of Period | $189.89 | $170.36 | $131.37 | $115.80 | $115.83 |
| Investment Operations | | | | | |
| Net Investment Income | 3.990 | 3.544 | 3.142 | 2.866 | 2.391 |
| Net Realized and Unrealized Gain (Loss) | | | | | |
| on Investments | (1.439) | 19.503 | 38.980 | 15.560 | (.031) |
| Total from Investment Operations | 2.551 | 23.047 | 42.122 | 18.426 | 2.360 |
| Distributions | | | | | |
| Dividends from Net Investment Income | (3.961) | (3.517) | (3.132) | (2.856) | (2.390) |
| Distributions from Realized Capital Gains | — | — | — | — | — |
| Total Distributions | (3.961) | (3.517) | (3.132) | (2.856) | (2.390) |
| Net Asset Value, End of Period | $188.48 | $189.89 | $170.36 | $131.37 | $115.80 |
| |
| Total Return1 | 1.36% | 13.64% | 32.33% | 15.96% | 2.08% |
| |
| Ratios/Supplemental Data | | | | | |
| Net Assets, End of Period (Millions) | $152,740 | $143,043 | $82,357 | $59,749 | $51,925 |
| Ratio of Total Expenses to | | | | | |
| Average Net Assets | 0.05% | 0.05% | 0.05% | 0.05% | 0.05% |
| Ratio of Net Investment Income to | | | | | |
| Average Net Assets | 2.11% | 2.00% | 2.07% | 2.25% | 2.04% |
| Portfolio Turnover Rate2 | 3% | 3% | 3% | 3% | 4% |
1 Total returns do not include account service fees that may have applied in the periods shown. Fund prospectuses provide information about any applicable account service fees.
2 Excludes the value of portfolio securities received or delivered as a result of in-kind purchases or redemptions of the fund’s capital shares, including ETF Creation Units.
See accompanying Notes, which are an integral part of the Financial Statements.
25
500 Index Fund
Notes to Financial Statements
Vanguard 500 Index Fund is registered under the Investment Company Act of 1940 as an open-end investment company, or mutual fund. The fund offers three classes of shares: Investor Shares, ETF Shares, and Admiral Shares. Investor Shares are available to any investor who meets the fund’s minimum purchase requirements. ETF Shares are listed for trading on NYSE Arca; they can be purchased and sold through a broker. Admiral Shares are designed for investors who meet certain administrative, service, and account-size criteria. Prior to October 24, 2014, the fund offered Signal Shares. Effective at the close of business on October 24, 2014, the Signal Shares were converted to Admiral Shares.
A. The following significant accounting policies conform to generally accepted accounting principles for U.S. investment companies. The fund consistently follows such policies in preparing its financial statements.
1. Security Valuation: Securities are valued as of the close of trading on the New York Stock Exchange (generally 4 p.m., Eastern time) on the valuation date. Equity securities are valued at the latest quoted sales prices or official closing prices taken from the primary market in which each security trades; such securities not traded on the valuation date are valued at the mean of the latest quoted bid and asked prices. Securities for which market quotations are not readily available, or whose values have been materially affected by events occurring before the fund’s pricing time but after the close of the securities’ primary markets, are valued by methods deemed by the board of trustees to represent fair value. Investments in Vanguard Market Liquidity Fund are valued at that fund’s net asset value. Temporary cash investments acquired over 60 days to maturity are valued using the latest bid prices or using valuations based on a matrix system (which considers such factors as security prices, yields, maturities, and ratings), both as furnished by independent pricing services. Other temporary cash investments are valued at amortized cost, which approximates market value.
2. Futures Contracts: The fund uses index futures contracts to a limited extent, with the objectives of maintaining full exposure to the stock market, enhancing returns, maintaining liquidity, and minimizing transaction costs. The fund may purchase futures contracts to immediately invest incoming cash in the market, or sell futures in response to cash outflows, thereby simulating a fully invested position in the underlying index while maintaining a cash balance for liquidity. The fund may seek to enhance returns by using futures contracts instead of the underlying securities when futures are believed to be priced more attractively than the underlying securities. The primary risks associated with the use of futures contracts are imperfect correlation between changes in market values of stocks held by the fund and the prices of futures contracts, and the possibility of an illiquid market. Counterparty risk involving futures is mitigated because a regulated clearinghouse is the counterparty instead of the clearing broker. To further mitigate counterparty risk, the fund trades futures contracts on an exchange, monitors the financial strength of its clearing brokers and clearinghouse, and has entered into clearing agreements with its clearing brokers. The clearinghouse imposes initial margin requirements to secure the fund’s performance and requires daily settlement of variation margin representing changes in the market value of each contract.
Futures contracts are valued at their quoted daily settlement prices. The aggregate settlement values of the contracts are not recorded in the Statement of Net Assets. Fluctuations in the value of the contracts are recorded in the Statement of Net Assets as an asset (liability) and in the Statement of Operations as unrealized appreciation (depreciation) until the contracts are closed, when they are recorded as realized futures gains (losses).
26
500 Index Fund
During the year ended December 31, 2015, the fund’s average investments in long and short futures contracts represented less than 1% and 0% of net assets, respectively, based on the average of aggregate settlement values at each quarter-end during the period.
3. Federal Income Taxes: The fund intends to continue to qualify as a regulated investment company and distribute all of its taxable income. Management has analyzed the fund’s tax positions taken for all open federal income tax years (December 31, 2012–2015), and has concluded that no provision for federal income tax is required in the fund’s financial statements.
4. Distributions: Distributions to shareholders are recorded on the ex-dividend date.
5. Securities Lending: To earn additional income, the fund lends its securities to qualified institutional borrowers. Security loans are subject to termination by the fund at any time and are required to be secured at all times by collateral in an amount at least equal to the market value of securities loaned. Daily market fluctuations could cause the value of loaned securities to be more or less than the value of the collateral received. When this occurs, the collateral is adjusted and settled on the next business day. The fund further mitigates its counterparty risk by entering into securities lending transactions only with a diverse group of prequalified counterparties, monitoring their financial strength, and entering into master securities lending agreements with its counterparties. The master securities lending agreements provide that, in the event of a counterparty’s default (including bankruptcy), the fund may terminate any loans with that borrower, determine the net amount owed, and sell or retain the collateral up to the net amount owed to the fund; however, such actions may be subject to legal proceedings. While collateral mitigates counterparty risk, in the absence of a default the fund may experience delays and costs in recovering the securities loaned. The fund invests cash collateral received in Vanguard Market Liquidity Fund, and records a liability in the Statement of Net Assets for the return of the collateral, during the period the securities are on loan. Securities lending income represents fees charged to borrowers plus income earned on invested cash collateral, less expenses associated with the loan.
6. Credit Facility: The fund and certain other funds managed by The Vanguard Group (“Vanguard”) participate in a $3 billion committed credit facility provided by a syndicate of lenders pursuant to a credit agreement that may be renewed annually; each fund is individually liable for its borrowings, if any, under the credit facility. Borrowings may be utilized for temporary and emergency purposes, and are subject to the fund’s regulatory and contractual borrowing restrictions. The participating funds are charged administrative fees and an annual commitment fee of 0.06% of the undrawn amount of the facility; these fees are allocated to the funds based on a method approved by the fund’s board of trustees and included in Management and Administrative expenses on the fund’s Statement of Operations. Any borrowings under this facility bear interest at a rate equal to the higher of the federal funds rate or LIBOR reference rate plus an agreed-upon spread.
The fund had no borrowings outstanding at December 31, 2015, or at any time during the period then ended.
7. Other: Dividend income is recorded on the ex-dividend date. Interest income includes income distributions received from Vanguard Market Liquidity Fund and is accrued daily. Premiums and discounts on debt securities purchased are amortized and accreted, respectively, to interest income
27
500 Index Fund
over the lives of the respective securities. Security transactions are accounted for on the date securities are bought or sold. Costs used to determine realized gains (losses) on the sale of investment securities are those of the specific securities sold.
Each class of shares has equal rights as to assets and earnings, except that each class separately bears certain class-specific expenses related to maintenance of shareholder accounts (included in Management and Administrative expenses) and shareholder reporting. Marketing and distribution expenses are allocated to each class of shares based on a method approved by the board of trustees. Income, other non-class-specific expenses, and gains and losses on investments are allocated to each class of shares based on its relative net assets.
B. In accordance with the terms of a Funds’ Service Agreement (the “FSA”) between Vanguard and the fund, Vanguard furnishes to the fund investment advisory, corporate management, administrative, marketing, and distribution services at Vanguard’s cost of operations (as defined by the FSA). These costs of operations are allocated to the fund based on methods and guidelines approved by the board of trustees. Vanguard does not require reimbursement in the current period for certain costs of operations (such as deferred compensation/benefits and risk/insurance costs); the fund’s liability for these costs of operations is included in Payables to Vanguard on the Statement of Net Assets.
Upon the request of Vanguard, the fund may invest up to 0.40% of its net assets as capital in Vanguard. At December 31, 2015, the fund had contributed to Vanguard capital in the amount of $19,191,000, representing 0.01% of the fund’s net assets and 7.68% of Vanguard’s capitalization. The fund’s trustees and officers are also directors and employees, respectively, of Vanguard.
C. Various inputs may be used to determine the value of the fund’s investments. These inputs are summarized in three broad levels for financial statement purposes. The inputs or methodologies used to value securities are not necessarily an indication of the risk associated with investing in those securities.
Level 1—Quoted prices in active markets for identical securities.
Level 2—Other significant observable inputs (including quoted prices for similar securities, interest rates, prepayment speeds, credit risk, etc.).
Level 3—Significant unobservable inputs (including the fund’s own assumptions used to determine the fair value of investments).
The following table summarizes the market value of the fund’s investments as of December 31, 2015, based on the inputs used to value them:
| | | |
| | Level 1 | Level 2 | Level 3 |
| Investments | ($000) | ($000) | ($000) |
| Common Stocks | 218,575,502 | — | — |
| Temporary Cash Investments | 727,068 | 59,950 | — |
| Futures Contracts—Liabilities1 | (7,042) | — | — |
| Total | 219,295,528 | 59,950 | — |
| 1 Represents variation margin on the last day of the reporting period. | | | |
28
500 Index Fund
D. At December 31, 2015, the aggregate settlement value of open futures contracts and the related unrealized appreciation (depreciation) were:
| | | | |
| | | | | ($000) |
| | | | Aggregate | |
| | | Number of | Settlement | Unrealized |
| | | Long (Short) | Value | Appreciation |
| Futures Contracts | Expiration | Contracts | Long (Short) | (Depreciation) |
| E-mini S&P 500 Index | March 2016 | 7,335 | 746,483 | 11,868 |
Unrealized appreciation (depreciation) on open futures contracts is required to be treated as realized gain (loss) for tax purposes.
E. Distributions are determined on a tax basis and may differ from net investment income and realized capital gains for financial reporting purposes. Differences may be permanent or temporary. Permanent differences are reclassified among capital accounts in the financial statements to reflect their tax character. Temporary differences arise when certain items of income, expense, gain, or loss are recognized in different periods for financial statement and tax purposes. These differences will reverse at some time in the future. Differences in classification may also result from the treatment of short-term gains as ordinary income for tax purposes.
During the year ended December 31, 2015, the fund realized $5,126,301,000 of net capital gains resulting from in-kind redemptions—in which shareholders exchanged fund shares for securities held by the fund rather than for cash. Because such gains are not taxable to the fund, and are not distributed to shareholders, they have been reclassified from accumulated net realized losses to paid-in capital.
For tax purposes, at December 31, 2015, the fund had $48,966,000 of ordinary income available for distribution. The fund used capital loss carryforwards of $733,524,000 to offset taxable capital gains realized during the year ended December 31, 2015. At December 31, 2015, the fund had available capital losses totaling $3,192,114,000 to offset future net capital gains. Of this amount, $1,763,970,000 is subject to expiration on December 31, 2016. Capital losses of $1,428,144,000 realized beginning in fiscal 2011 may be carried forward indefinitely under the Regulated Investment Company Modernization Act of 2010, but must be used before any expiring loss carryforwards. Capital loss carryforwards of $6,044,000 expired on December 31, 2015; accordingly, such losses have been reclassified from accumulated net realized losses to paid-in capital.
At December 31, 2015, the cost of investment securities for tax purposes was $137,491,163,000. Net unrealized appreciation of investment securities for tax purposes was $81,871,357,000, consisting of unrealized gains of $87,278,396,000 on securities that had risen in value since their purchase and $5,407,039,000 in unrealized losses on securities that had fallen in value since their purchase.
F. During the year ended December 31, 2015, the fund purchased $37,105,407,000 of investment securities and sold $14,830,808,000 of investment securities, other than temporary cash investments. Purchases and sales include $19,682,785,000 and $7,643,689,000, respectively, in connection with in-kind purchases and redemptions of the fund’s capital shares.
29
500 Index Fund
| | | | |
| G. Capital share transactions for each class of shares were: | | | |
| | | | Year Ended December 31, |
| | | 2015 | | 2014 |
| | Amount | Shares | Amount | Shares |
| | ($000) | (000) | ($000) | (000) |
| Investor Shares | | | | |
| Issued | 4,224,397 | 22,264 | 4,071,923 | 22,874 |
| Issued in Lieu of Cash Distributions | 508,696 | 2,701 | 484,554 | 2,675 |
| Redeemed | (6,520,921) | (34,197) | (7,295,533) | (40,819) |
| Net Increase (Decrease)—Investor Shares | (1,787,828) | (9,232) | (2,739,056) | (15,270) |
| ETF Shares | | | | |
| Issued | 20,357,295 | 109,061 | 12,851,957 | 72,128 |
| Issued in Lieu of Cash Distributions | — | — | — | — |
| Redeemed | (7,336,113) | (39,475) | (2,529,783) | (14,450) |
| Net Increase (Decrease) —ETF Shares | 13,021,182 | 69,586 | 10,322,174 | 57,678 |
| Admiral Shares | | | | |
| Issued1 | 25,665,048 | 135,111 | 53,038,579 | 294,996 |
| Issued in Connection with Acquisition of | | | | |
| Vanguard Tax-Managed Growth and Income | — | — | 3,371,686 | 19,420 |
| Issued in Lieu of Cash Distributions | 2,791,940 | 14,841 | 1,975,813 | 10,858 |
| Redeemed | (17,648,820) | (92,866) | (9,973,074) | (55,414) |
| Net Increase (Decrease) —Admiral Shares | 10,808,168 | 57,086 | 48,413,004 | 269,860 |
| Signal Shares | | | | |
| Issued | — | — | 4,684,525 | 32,628 |
| Issued in Lieu of Cash Distributions | — | — | 327,487 | 2,226 |
| Redeemed1 | — | — | (41,652,091) | (281,192) |
| Net Increase (Decrease)—Signal Shares | — | — | (36,640,079) | (246,338) |
1 Admiral Shares Issued and Signal Shares Redeemed include $26,198,274,000 from the conversion of Signal Shares to Admiral Shares during the 2014 fiscal year.
H. On May 16, 2014, the fund acquired all of the net assets of Vanguard Tax-Managed Growth and Income Fund pursuant to a plan of reorganization approved by the funds’ board of trustees on September 26, 2013. The purpose of the transaction was to combine two funds with similar investment strategies. The acquisition was accomplished by a tax-free exchange of 19,420,000 of Vanguard 500 Index Fund’s capital shares for the 45,479,000 shares of Vanguard Tax-Managed Growth and Income Fund outstanding on May 16, 2014. Each class of shares of Vanguard Tax-Managed Growth and Income Fund was exchanged for the Admiral Shares of Vanguard 500 Index Fund. Vanguard Tax-Managed Growth and Income Fund’s net assets of $3,371,686,000, including $1,348,485,000 of unrealized appreciation, were combined with Vanguard 500 Index Fund’s net assets of $168,166,924,000, resulting in combined net assets of $171,538,610,000 on May 16, 2014.
I. Management has determined that no material events or transactions occurred subsequent to December 31, 2015, that would require recognition or disclosure in these financial statements.
30
Report of Independent Registered Public Accounting Firm
To the Board of Trustees of Vanguard Index Funds and the Shareholders of Vanguard 500 Index Fund:
In our opinion, the accompanying statement of net assets and the related statements of operations and of changes in net assets and the financial highlights present fairly, in all material respects, the financial position of Vanguard 500 Index Fund (constituting a separate portfolio of Vanguard Index Funds, hereafter referred to as the “Fund”) at December 31, 2015, the results of its operations for the year then ended, the changes in its net assets for each of the two years in the period then ended, and the financial highlights for each of the five years in the period then ended, in conformity with accounting principles generally accepted in the United States of America. These financial statements and financial highlights (hereafter referred to as “financial statements”) are the responsibility of the Fund’s management. Our responsibility is to express an opinion on these financial statements based on our audits. We conducted our audits of these financial statements in accordance with the standards of the Public Company Accounting Oversight Board (United States). Those standards require that we plan and perform the audit to obtain reasonable assurance about whether the financial statements are free of material misstatement. An audit includes examining, on a test basis, evidence supporting the amounts and disclosures in the financial statements, assessing the accounting principles used and significant estimates made by management, and evaluating the overall financial statement presentation. We believe that our audits, which included confirmation of securities at December 31, 2015 by correspondence with the custodian and brokers, by agreement to the underlying ownership records of the transfer agent and the application of alternative auditing procedures where securities purchased had not been received, provide a reasonable basis for our opinion.
/s/PricewaterhouseCoopers LLP
Philadelphia, Pennsylvania
February 11, 2016
Special 2015 tax information (unaudited) for Vanguard 500 Index Fund
This information for the fiscal year ended December 31, 2015, is included pursuant to provisions of the Internal Revenue Code.
The fund distributed $4,391,533,000 of qualified dividend income to shareholders during the fiscal year.
For corporate shareholders, 93.6% of investment income (dividend income plus short-term gains, if any) qualifies for the dividends-received deduction.
31
Your Fund’s After-Tax Returns
This table presents returns for your fund both before and after taxes. The after-tax returns are shown in two ways: (1) assuming that an investor owned the fund during the entire period and paid taxes on the fund’s distributions, and (2) assuming that an investor paid taxes on the fund’s distributions and sold all shares at the end of each period.
Calculations are based on the highest individual federal income tax and capital gains tax rates in effect at the times of the distributions and the hypothetical sales. State and local taxes were not considered. After-tax returns reflect any qualified dividend income. (In the example, returns after the sale of fund shares may be higher than those assuming no sale. This occurs when the sale would have produced a capital loss. The calculation assumes that the investor received a tax deduction for the loss.)
The table shows returns for Investor Shares only; returns for other share classes will differ. Please note that your actual after-tax returns will depend on your tax situation and may differ from those shown. Also note that if you own the fund in a tax-deferred account, such as an individual retirement account or a 401(k) plan, this information does not apply to you. Such accounts are not subject to current taxes.
Finally, keep in mind that a fund’s performance—whether before or after taxes—does not guarantee future results.
Average Annual Total Returns: 500 Index Fund Investor Shares
Periods Ended December 31, 2015
| | | |
| | One | Five | Ten |
| | Year | Years | Years |
| Returns Before Taxes | 1.25% | 12.40% | 7.18% |
| Returns After Taxes on Distributions | 0.77 | 11.96 | 6.81 |
| Returns After Taxes on Distributions and Sale of Fund Shares | 1.09 | 9.91 | 5.81 |
32
About Your Fund’s Expenses
As a shareholder of the fund, you incur ongoing costs, which include costs for portfolio management, administrative services, and shareholder reports (like this one), among others. Operating expenses, which are deducted from a fund’s gross income, directly reduce the investment return of the fund.
A fund’s expenses are expressed as a percentage of its average net assets. This figure is known as the expense ratio. The following examples are intended to help you understand the ongoing costs (in dollars) of investing in your fund and to compare these costs with those of other mutual funds. The examples are based on an investment of $1,000 made at the beginning of the period shown and held for the entire period.
The accompanying table illustrates your fund’s costs in two ways:
• Based on actual fund return. This section helps you to estimate the actual expenses that you paid over the period. The ”Ending Account Value“ shown is derived from the fund‘s actual return, and the third column shows the dollar amount that would have been paid by an investor who started with $1,000 in the fund. You may use the information here, together with the amount you invested, to estimate the expenses that you paid over the period.
To do so, simply divide your account value by $1,000 (for example, an $8,600 account value divided by $1,000 = 8.6), then multiply the result by the number given for your fund under the heading ”Expenses Paid During Period.“
• Based on hypothetical 5% yearly return. This section is intended to help you compare your fund‘s costs with those of other mutual funds. It assumes that the fund had a yearly return of 5% before expenses, but that the expense ratio is unchanged. In this case—because the return used is not the fund’s actual return—the results do not apply to your investment. The example is useful in making comparisons because the Securities and Exchange Commission requires all mutual funds to calculate expenses based on a 5% return. You can assess your fund’s costs by comparing this hypothetical example with the hypothetical examples that appear in shareholder reports of other funds.
Note that the expenses shown in the table are meant to highlight and help you compare ongoing costs only and do not reflect transaction costs incurred by the fund for buying and selling securities. Further, the expenses do not include any purchase, redemption, or account service fees described in the fund prospectus. If such fees were applied to your account, your costs would be higher. Your fund does not carry a “sales load.”
The calculations assume no shares were bought or sold during the period. Your actual costs may have been higher or lower, depending on the amount of your investment and the timing of any purchases or redemptions.
You can find more information about the fund’s expenses, including annual expense ratios, in the Financial Statements section of this report. For additional information on operating expenses and other shareholder costs, please refer to your fund’s current prospectus.
33
| | | |
| Six Months Ended December 31, 2015 | | | |
| | Beginning | Ending | Expenses |
| | Account Value | Account Value | Paid During |
| 500 Index Fund | 6/30/2015 | 12/31/2015 | Period |
| Based on Actual Fund Return | | | |
| Investor Shares | $1,000.00 | $1,000.73 | $0.86 |
| ETF Shares | 1,000.00 | 1,001.22 | 0.30 |
| Admiral Shares | 1,000.00 | 1,001.32 | 0.25 |
| Based on Hypothetical 5% Yearly Return | | | |
| Investor Shares | $1,000.00 | $1,024.35 | $0.87 |
| ETF Shares | 1,000.00 | 1,024.90 | 0.31 |
| Admiral Shares | 1,000.00 | 1,024.95 | 0.26 |
The calculations are based on expenses incurred in the most recent six-month period. The fund’s annualized six-month expense ratios for that period are 0.17% for Investor Shares, 0.06% for ETF Shares, and 0.05% for Admiral Shares. The dollar amounts shown as “Expenses Paid” are equal to the annualized expense ratio multiplied by the average account value over the period, multiplied by the number of days in the most recent six-month period, then divided by the number of days in the most recent 12-month period (184/365).
34
Glossary
30-Day SEC Yield. A fund’s 30-day SEC yield is derived using a formula specified by the U.S. Securities and Exchange Commission. Under the formula, data related to the fund’s security holdings in the previous 30 days are used to calculate the fund’s hypothetical net income for that period, which is then annualized and divided by the fund’s estimated average net assets over the calculation period. For the purposes of this calculation, a security’s income is based on its current market yield to maturity (for bonds), its actual income (for asset-backed securities), or its projected dividend yield (for stocks). Because the SEC yield represents hypothetical annualized income, it will differ—at times significantly—from the fund’s actual experience. As a result, the fund’s income distributions may be higher or lower than implied by the SEC yield.
Beta. A measure of the magnitude of a fund’s past share-price fluctuations in relation to the ups and downs of a given market index. The index is assigned a beta of 1.00. Compared with a given index, a fund with a beta of 1.20 typically would have seen its share price rise or fall by 12% when the index rose or fell by 10%. For this report, beta is based on returns over the past 36 months for both the fund and the index. Note that a fund’s beta should be reviewed in conjunction with its R-squared (see definition). The lower the R-squared, the less correlation there is between the fund and the index, and the less reliable beta is as an indicator of volatility.
Dividend Yield. Dividend income earned by stocks, expressed as a percentage of the aggregate market value (or of net asset value, for a fund). The yield is determined by dividing the amount of the annual dividends by the aggregate value (or net asset value) at the end of the period. For a fund, the dividend yield is based solely on stock holdings and does not include any income produced by other investments.
Earnings Growth Rate. The average annual rate of growth in earnings over the past five years for the stocks now in a fund.
Equity Exposure. A measure that reflects a fund’s investments in stocks and stock futures. Any holdings in short-term reserves are excluded.
Expense Ratio. A fund’s total annual operating expenses expressed as a percentage of the fund’s average net assets. The expense ratio includes management and administrative expenses, but does not include the transaction costs of buying and selling portfolio securities.
Foreign Holdings. The percentage of a fund represented by securities or depositary receipts of companies based outside the United States.
Inception Date. The date on which the assets of a fund (or one of its share classes) are first invested in accordance with the fund’s investment objective. For funds with a subscription period, the inception date is the day after that period ends. Investment performance is measured from the inception date.
Median Market Cap. An indicator of the size of companies in which a fund invests; the midpoint of market capitalization (market price x shares outstanding) of a fund’s stocks, weighted by the proportion of the fund’s assets invested in each stock. Stocks representing half of the fund’s assets have market capitalizations above the median, and the rest are below it.
Price/Book Ratio. The share price of a stock divided by its net worth, or book value, per share. For a fund, the weighted average price/book ratio of the stocks it holds.
35
Price/Earnings Ratio. The ratio of a stock’s current price to its per-share earnings over the past year. For a fund, the weighted average P/E of the stocks it holds. P/E is an indicator of market expectations about corporate prospects; the higher the P/E, the greater the expectations for a company’s future growth.
R-Squared. A measure of how much of a fund’s past returns can be explained by the returns from the market in general, as measured by a given index. If a fund’s total returns were precisely synchronized with an index’s returns, its R-squared would be 1.00. If the fund’s returns bore no relationship to the index’s returns, its R-squared would be 0. For this report, R-squared is based on returns over the past 36 months for both the fund and the index.
Return on Equity. The annual average rate of return generated by a company during the past five years for each dollar of shareholder’s equity (net income divided by shareholder’s equity). For a fund, the weighted average return on equity for the companies whose stocks it holds.
Short-Term Reserves. The percentage of a fund invested in highly liquid, short-term securities that can be readily converted to cash.
Turnover Rate. An indication of the fund’s trading activity. Funds with high turnover rates incur higher transaction costs and may be more likely to distribute capital gains (which may be taxable to investors). The turnover rate excludes in-kind transactions, which have minimal impact on costs.
36
This page intentionally left blank.
This page intentionally left blank.
This page intentionally left blank.
The People Who Govern Your Fund
The trustees of your mutual fund are there to see that the fund is operated and managed in your best interests since, as a shareholder, you are a part owner of the fund. Your fund’s trustees also serve on the board of directors of The Vanguard Group, Inc., which is owned by the Vanguard funds and provides services to them on an at-cost basis.
A majority of Vanguard’s board members are independent, meaning that they have no affiliation with Vanguard or the funds they oversee, apart from the sizable personal investments they have made as private individuals. The independent board members have distinguished backgrounds in business, academia, and public service. Each of the trustees and executive officers oversees 194 Vanguard funds.
The following table provides information for each trustee and executive officer of the fund. More information about the trustees is in the Statement of Additional Information, which can be obtained, without charge, by contacting Vanguard at 800-662-7447, or online at vanguard.com.
InterestedTrustee1
F. William McNabb III
Born 1957. Trustee Since July 2009. Chairman of the Board. Principal Occupation(s) During the Past Five Years and Other Experience: Chairman of the Board of The Vanguard Group, Inc., and of each of the investment companies served by The Vanguard Group, since January 2010; Director of The Vanguard Group since 2008; Chief Executive Officer and President of The Vanguard Group, and of each of the investment companies served by The Vanguard Group, since 2008; Director of Vanguard Marketing Corporation; Managing Director of The Vanguard Group (1995–2008).
IndependentTrustees
Emerson U. Fullwood
Born 1948. Trustee Since January 2008. Principal Occupation(s) During the Past Five Years and Other Experience: Executive Chief Staff and Marketing Officer for North America and Corporate Vice President (retired 2008) of Xerox Corporation (document management products and services); Executive in Residence and 2009–2010 Distinguished Minett Professor at the Rochester Institute of Technology; Director of SPX Corporation (multi-industry manufacturing), the United Way of Rochester, the University of Rochester Medical Center, Monroe Community College Foundation, and North Carolina A&T University.
Rajiv L. Gupta
Born 1945. Trustee Since December 2001.2 Principal Occupation(s) During the Past Five Years and Other Experience: Chairman and Chief Executive Officer (retired 2009) and President (2006–2008) of Rohm and Haas Co. (chemicals); Director of Tyco International PLC (diversified manufacturing and services), Hewlett-Packard Co. (electronic computer manufacturing), and Delphi Automotive PLC (automotive components); Senior Advisor at New Mountain Capital.
Amy Gutmann
Born 1949. Trustee Since June 2006. Principal Occupation(s) During the Past Five Years and Other Experience: President of the University of Pennsylvania; Christopher H. Browne Distinguished Professor of Political Science, School of Arts and Sciences, and Professor of Communication, Annenberg School for Communication, with secondary faculty appointments in the Department of Philosophy, School of Arts and Sciences, and at the Graduate School of Education, University of Pennsylvania; Trustee of the National Constitution Center; Chair of the Presidential Commission for the Study of Bioethical Issues.
JoAnn Heffernan Heisen
Born 1950. Trustee Since July 1998. Principal Occupation(s) During the Past Five Years and Other Experience: Corporate Vice President and Chief Global Diversity Officer (retired 2008) and Member of the Executive Committee (1997–2008) of Johnson & Johnson (pharmaceuticals/medical devices/consumer products); Director of Skytop Lodge Corporation (hotels) and the Robert Wood Johnson Foundation; Member of the Advisory Board of the Institute for Women’s Leadership at Rutgers University.
F. Joseph Loughrey
Born 1949. Trustee Since October 2009. Principal Occupation(s) During the Past Five Years and Other Experience: President and Chief Operating Officer (retired 2009) of Cummins Inc. (industrial machinery); Chairman of the Board of Hillenbrand, Inc. (specialized consumer services), and of Oxfam America; Director of SKF AB (industrial machinery), Hyster-Yale Materials Handling, Inc. (forklift trucks), the Lumina Foundation for Education, and the V Foundation for Cancer Research; Member of the Advisory Council for the College of Arts and Letters and of the Advisory Board to the Kellogg Institute for International Studies, both at the University of Notre Dame.
Mark Loughridge
Born 1953. Trustee Since March 2012. Principal Occupation(s) During the Past Five Years and Other Experience: Senior Vice President and Chief Financial Officer (retired 2013) at IBM (information technology services); Fiduciary Member of IBM’s Retirement Plan Committee (2004–2013); Director of the Dow Chemical Company; Member of the Council on Chicago Booth.
Scott C. Malpass
Born 1962. Trustee Since March 2012. Principal Occupation(s) During the Past Five Years and Other Experience: Chief Investment Officer and Vice President at the University of Notre Dame; Assistant Professor of Finance at the Mendoza College of Business at Notre Dame; Member of the Notre Dame 403(b) Investment Committee; Board Member of TIFF Advisory Services, Inc., and Catholic Investment Services, Inc. (investment advisors); Member of the Investment Advisory Committee of Major League Baseball.
André F. Perold
Born 1952. Trustee Since December 2004. Principal Occupation(s) During the Past Five Years and Other Experience: George Gund Professor of Finance and Banking, Emeritus at the Harvard Business School (retired 2011); Chief Investment Officer and Managing Partner of HighVista Strategies LLC (private investment firm); Director of Rand Merchant Bank; Overseer of the Museum of Fine Arts Boston.
Peter F. Volanakis
Born 1955. Trustee Since July 2009. Principal Occupation(s) During the Past Five Years and Other Experience: President and Chief Operating Officer (retired 2010) of Corning Incorporated (communications equipment); Trustee of Colby-Sawyer College; Member of the Advisory Board of the Norris Cotton Cancer Center and of the Advisory Board of the Parthenon Group (strategy consulting).
Executive Officers
Glenn Booraem
Born 1967. Treasurer Since May 2015. Principal Occupation(s) During the Past Five Years and Other Experience: Principal of The Vanguard Group, Inc.; Treasurer of each of the investment companies served by The Vanguard Group; Controller of each of the investment companies served by The Vanguard Group (2010–2015); Assistant Controller of each of the investment companies served by The Vanguard Group (2001–2010).
Thomas J. Higgins
Born 1957. Chief Financial Officer Since September 2008. Principal Occupation(s) During the Past Five Years and Other Experience: Principal of The Vanguard Group, Inc.; Chief Financial Officer of each of the investment companies served by The Vanguard Group; Treasurer of each of the investment companies served by The Vanguard Group (1998–2008).
Peter Mahoney
Born 1974. Controller Since May 2015. Principal Occupation(s) During the Past Five Years and Other Experience: Head of Global Fund Accounting at The Vanguard Group, Inc.; Controller of each of the investment companies served by The Vanguard Group; Head of International Fund Services at The Vanguard Group (2008–2014).
Heidi Stam
Born 1956. Secretary Since July 2005. Principal Occupation(s) During the Past Five Years and Other Experience: Managing Director of The Vanguard Group, Inc.; General Counsel of The Vanguard Group; Secretary of The Vanguard Group and of each of the investment companies served by The Vanguard Group; Director and Senior Vice President of Vanguard Marketing Corporation.
Vanguard Senior Management Team
Mortimer J. Buckley
Kathleen C. Gubanich
Paul A. Heller
Martha G. King
John T. Marcante
Chris D. McIsaac
James M. Norris
Thomas M. Rampulla
Glenn W. Reed
Karin A. Risi
Chairman Emeritus and Senior Advisor
John J. Brennan
Chairman, 1996–2009
Chief Executive Officer and President, 1996–2008
Founder John C. Bogle
Chairman and Chief Executive Officer, 1974–1996
1 Mr. McNabb is considered an “interested person,” as defined in the Investment Company Act of 1940, because he is an officer of the Vanguard funds.
2 December 2002 for Vanguard Equity Income Fund, the Vanguard Municipal Bond Funds, and the Vanguard State Tax-Exempt Funds.
 |
| P.O. Box 2600 |
| Valley Forge, PA 19482-2600 |
Connect with Vanguard® > vanguard.com
| |
| Fund Information > 800-662-7447 | The index is a product of S&P Dow Jones Indices LLC |
| Direct Investor Account Services > 800-662-2739 | (“SPDJI”), and has been licensed for use by Vanguard. |
| | Standard & Poor’s® and S&P® are registered |
| Institutional Investor Services > 800-523-1036 | trademarks of Standard & Poor’s Financial Services LLC |
| Text Telephone for People | (“S&P”); Dow Jones® is a registered trademark of Dow |
| Who Are Deaf or Hard of Hearing> 800-749-7273 | Jones Trademark Holdings LLC (“Dow Jones”); S&P® |
| | and S&P 500® are trademarks of S&P; and these |
| This material may be used in conjunction | trademarks have been licensed for use by SPDJI and |
| with the offering of shares of any Vanguard | sublicensed for certain purposes by Vanguard. |
| fund only if preceded or accompanied by | Vanguard product(s) are not sponsored, endorsed, sold |
| | or promoted by SPDJI, Dow Jones, S&P, or their |
| the fund’s current prospectus. | respective affiliates and none of such parties make any |
| All comparative mutual fund data are from Lipper, a | representation regarding the advisability of investing in |
| Thomson Reuters Company, or Morningstar, Inc., unless | such product(s) nor do they have any liability for any |
| otherwise noted. | errors, omissions, or interruptions of the index. |
| |
| You can obtain a free copy of Vanguard’s proxy voting | |
| guidelines by visiting vanguard.com/proxyreporting or by | |
| calling Vanguard at 800-662-2739. The guidelines are | |
| also available from the SEC’s website, sec.gov. In | |
| addition, you may obtain a free report on how your fund | |
| voted the proxies for securities it owned during the 12 | |
| months ended June 30. To get the report, visit either | |
| vanguard.com/proxyreporting or sec.gov. | |
| |
| You can review and copy information about your fund at | |
| the SEC’s Public Reference Room in Washington, D.C. To | |
| find out more about this public service, call the SEC at | |
| 202-551-8090. Information about your fund is also | |
| available on the SEC’s website, and you can receive | |
| copies of this information, for a fee, by sending a | |
| request in either of two ways: via email addressed to | |
| publicinfo@sec.gov or via regular mail addressed to the | |
| Public Reference Section, Securities and Exchange | |
| Commission, Washington, DC 20549-1520. | |
| |
| | © 2016 The Vanguard Group, Inc. |
| | All rights reserved. |
| | Vanguard Marketing Corporation, Distributor. |
| |
| | Q400 022016 |

Annual Report | December 31, 2015
Vanguard U.S. Stock Index Funds
Small-Capitalization Portfolios
Vanguard Small-Cap Index Fund
Vanguard Small-Cap Growth Index Fund
Vanguard Small-Cap Value Index Fund
Vanguard’s Principles for Investing Success
We want to give you the best chance of investment success. These principles, grounded in Vanguard’s research and experience, can put you on the right path.
Goals. Create clear, appropriate investment goals.
Balance. Develop a suitable asset allocation using broadly diversified funds. Cost. Minimize cost.
Discipline. Maintain perspective and long-term discipline.
A single theme unites these principles: Focus on the things you can control.
We believe there is no wiser course for any investor.
| |
| Contents | |
| Your Fund’s Total Returns. | 1 |
| Chairman’s Letter. | 4 |
| Small-Cap Index Fund. | 11 |
| Small-Cap Growth Index Fund. | 34 |
| Small-Cap Value Index Fund. | 55 |
| Your Fund’s After-Tax Returns. | 78 |
| About Your Fund’s Expenses. | 79 |
| Glossary. | 82 |
Please note: The opinions expressed in this report are just that—informed opinions. They should not be considered promises or advice. Also, please keep in mind that the information and opinions cover the period through the date on the front of this report. Of course, the risks of investing in your fund are spelled out in the prospectus.
See the Glossary for definitions of investment terms used in this report.
About the cover: Pictured is a sailing block on the Brilliant, a 1932 schooner docked in Mystic, Connecticut. A type of pulley, the sailing block helps coordinate the setting of the sails. At Vanguard, the intricate coordination of technology and people allows us to help millions of clients around the world reach their financial goals.
| |
| Your Fund’s Total Returns | |
| |
| |
| |
| |
| Fiscal Year Ended December 31, 2015 | |
| | Total |
| | Returns |
| Vanguard Small-Cap Index Fund | |
| Investor Shares | -3.78% |
| ETF Shares | |
| Market Price | -3.67 |
| Net Asset Value | -3.65 |
| Admiral™ Shares | -3.64 |
| Institutional Shares | -3.63 |
| Institutional Plus Shares | -3.62 |
| CRSP US Small Cap Index | -3.68 |
| Small-Cap Core Funds Average | -5.21 |
| Small-Cap Core Funds Average: Derived from data provided by Lipper, a Thomson Reuters Company. | |
| Vanguard Small-Cap Growth Index Fund | |
| Investor Shares | -2.64% |
| ETF Shares | |
| Market Price | -2.57 |
| Net Asset Value | -2.51 |
| Admiral Shares | -2.52 |
| Institutional Shares | -2.52 |
| CRSP US Small Cap Growth Index | -2.60 |
| Small-Cap Growth Funds Average | -2.24 |
Small-Cap Growth Funds Average: Derived from data provided by Lipper, a Thomson Reuters Company.
Admiral Shares carry lower expenses and are available to investors who meet certain account-balance requirements. Institutional Shares and Institutional Plus Shares are available to certain institutional investors who meet specific administrative, service, and account-size criteria. The Vanguard ETF® Shares shown are traded on the NYSE Arca exchange and are available only through brokers. The table provides ETF returns based on both the NYSE Arca market price and the net asset value for a share. U.S. Pat. Nos. 6,879,964; 7,337,138; 7,720,749; 7,925,573; 8,090,646; and 8,417,623.
1
| |
| Your Fund’s Total Returns | |
| |
| |
| |
| |
| Fiscal Year Ended December 31, 2015 | |
| | Total |
| | Returns |
| Vanguard Small-Cap Value Index Fund | |
| Investor Shares | -4.78% |
| ETF Shares | |
| Market Price | -4.67 |
| Net Asset Value | -4.67 |
| Admiral Shares | -4.65 |
| Institutional Shares | -4.67 |
| CRSP US Small Cap Value Index | -4.64 |
| Small-Cap Value Funds Average | -6.90 |
Small-Cap Value Funds Average: Derived from data provided by Lipper, a Thomson Reuters Company.
Admiral Shares carry lower expenses and are available to investors who meet certain account-balance requirements. Institutional Shares and Institutional Plus Shares are available to certain institutional investors who meet specific administrative, service, and account-size criteria. The Vanguard ETF® Shares shown are traded on the NYSE Arca exchange and are available only through brokers. The table provides ETF returns based on both the NYSE Arca market price and the net asset value for a share. U.S. Pat. Nos. 6,879,964; 7,337,138; 7,720,749; 7,925,573; 8,090,646; and 8,417,623.
For the ETF Shares, the market price is determined by the midpoint of the bid-offer spread as of the closing time of the New York Stock Exchange (generally 4 p.m., Eastern time). The net asset value is also determined as of the NYSE closing time. For more information about how the ETF Shares' market prices have compared with their net asset value, visit vanguard.com, select your ETF, and then select the Price and Performance tab. The ETF premium/discount analysis there shows the percentages of days on which the ETF Shares' market price was above or below the NAV.
2
| | | | |
| Your Fund’s Performance at a Glance | | | |
| |
| |
| |
| |
| December 31, 2014, Through December 31, 2015 | | | | |
| | | | Distributions Per Share |
| | Starting | Ending | | |
| | Share | Share | Income | Capital |
| | Price | Price | Dividends | Gains |
| Vanguard Small-Cap Index Fund | | | | |
| Investor Shares | $55.86 | $53.03 | $0.717 | $0.000 |
| ETF Shares | 116.61 | 110.71 | 1.637 | 0.000 |
| Admiral Shares | 55.87 | 53.05 | 0.784 | 0.000 |
| Institutional Shares | 55.87 | 53.05 | 0.789 | 0.000 |
| Institutional Plus Shares | 161.27 | 153.11 | 2.310 | 0.000 |
| Vanguard Small-Cap Growth Index Fund | | | | |
| Investor Shares | $35.40 | $34.18 | $0.287 | $0.000 |
| ETF Shares | 125.88 | 121.53 | 1.190 | 0.000 |
| Admiral Shares | 44.26 | 42.73 | 0.417 | 0.000 |
| Institutional Shares | 35.45 | 34.22 | 0.337 | 0.000 |
| Vanguard Small-Cap Value Index Fund | | | | |
| Investor Shares | $25.34 | $23.69 | $0.438 | $0.000 |
| ETF Shares | 105.71 | 98.81 | 1.963 | 0.000 |
| Admiral Shares | 45.42 | 42.46 | 0.843 | 0.000 |
| Institutional Shares | 25.39 | 23.73 | 0.473 | 0.000 |
3

Chairman’s Letter
Dear Shareholder,
After three straight years of double-digit returns, the broad U.S. stock market limped to results of less than 1 percent for the 12 months ended December 31, 2015. Small-capitalization stocks fared worse: They finished in negative territory, well behind their large-cap counterparts, as investors became more risk-averse in the uncertain environment. It was their worst annual performance since 2008.
Vanguard’s three small-cap U.S. index funds recorded returns that ranged from –4.78% for the Vanguard Small-Cap Value Index Fund to –2.64% for the Vanguard Small-Cap Growth Index Fund. The broader-based Vanguard Small-Cap Index Fund, which includes both growth and value stocks, fell in between, with a return of –3.78%. (All returns are for Investor Shares.)
All three funds closely tracked their target indexes. Although it is not the funds’ objective to outperform funds that invest in similar stocks, the Small-Cap Index Fund and Small-Cap Value Index Fund surpassed the average return of their peers. The Small-Cap Growth Index Fund trailed its comparable industry average by less than 1 percentage point.
If you hold any of these funds in a taxable account, you may wish to review the discussion of after-tax returns that appears later in this report.
4
Despite troubles, U.S. stocks eked out a seventh year of gains
U.S. stocks returned 0.48% for the 12 months. Although the broad market recorded its worst performance since 2008, it still posted gains for the seventh straight calendar year when dividends are factored into returns.
Stocks rose modestly over the first half of the year but slid in August and September as concerns mounted that China’s economic slowdown would spread globally. Falling oil and commodity prices also affected economies and markets across the world for better or worse. Central banks in Europe and Asia bolstered their stimulus efforts against weak growth and low inflation. And in
December, the Federal Reserve ended months of uncertainty when it raised the target for short-term interest rates to 0.25%–0.5%.
International stocks returned about –5%, restrained by the U.S. dollar’s strength against many foreign currencies. Emerging markets fared the worst.
U.S. bonds ended the year with a slender advance
The broad U.S. taxable bond market gained 0.55% over the 12 months; income accounted for the modestly positive result. The yield of the 10-year Treasury note ended December at 2.30%, up from 2.19% a year earlier. (Bond prices and yields move in opposite directions.)
| | | |
| Market Barometer | | | |
| |
| | | Average Annual Total Returns |
| | | Periods Ended December 31, 2015 |
| | One | Three | Five |
| | Year | Years | Years |
| Stocks | | | |
| Russell 1000 Index (Large-caps) | 0.92% | 15.01% | 12.44% |
| Russell 2000 Index (Small-caps) | -4.41 | 11.65 | 9.19 |
| Russell 3000 Index (Broad U.S. market) | 0.48 | 14.74 | 12.18 |
| FTSE All-World ex US Index (International) | -4.72 | 2.04 | 1.48 |
| |
| Bonds | | | |
| Barclays U.S. Aggregate Bond Index (Broad taxable market) | 0.55% | 1.44% | 3.25% |
| Barclays Municipal Bond Index (Broad tax-exempt market) | 3.30 | 3.16 | 5.35 |
| Citigroup Three-Month U.S. Treasury Bill Index | 0.03 | 0.02 | 0.04 |
| |
| CPI | | | |
| Consumer Price Index | 0.73% | 1.00% | 1.53% |
5
Investors focused on the Fed’s stance on short-term interest rates and alternately embraced or avoided safe-haven assets depending on the stock market’s strength.
International bond markets (as measured by the Barclays Global Aggregate Index ex USD) returned –6.02%, reduced by the dollar’s strength. Without this currency effect, returns were modestly positive.
Although the Fed raised its target for short-term interest rates in mid-December, returns for money market funds and savings accounts remained limited by the 0%–0.25% levels in place for much of the past seven years.
Small-cap stocks lagged in challenging markets
Small-cap stocks, which make up about 10% of the broad U.S. market, provide investors with both opportunities and challenges. Small companies generally have greater potential for growth than larger ones. They’re often younger and nimbler and can sometimes find a market niche or capitalize on a market trend that leads to a surge in profits. At the same time, small companies are usually more vulnerable to setbacks; they don’t benefit from the diversification of business lines or the resources and cash reserves of larger firms.
| | | | | | |
| Expense Ratios | | | | | | |
| Your Fund Compared With Its Peer Group | | | | | | |
| |
| | | | | | | Peer |
| | Investor | ETF | Admiral | Institutional | Institutional | Group |
| | Shares | Shares | Shares | Shares | Plus Shares | Average |
| Small-Cap Index Fund | 0.23% | 0.09% | 0.09% | 0.08% | 0.06% | 1.29% |
| Small-Cap Growth Index Fund | 0.23 | 0.09 | 0.09 | 0.08 | — | 1.39 |
| Small-Cap Value Index Fund | 0.23 | 0.09 | 0.09 | 0.08 | — | 1.35 |
The fund expense ratios shown are from the prospectus dated April 28, 2015, and represent estimated costs for the current fiscal year. For the fiscal year ended December 31, 2015, the funds’ expense ratios were: for the Small-Cap Index Fund, 0.20% for Investor Shares, 0.08% for ETF Shares, 0.08% for Admiral Shares, 0.07% for Institutional Shares, and 0.05% for Institutional Plus Shares; for the Small-Cap Growth Index Fund, 0.20% for Investor Shares, 0.08% for ETF Shares, 0.08% for Admiral Shares, and 0.07% for Institutional Shares; and for the Small-Cap Value Index Fund, 0.20% for Investor Shares, 0.08% for ETF Shares, 0.08% for Admiral Shares, and 0.07% for Institutional Shares. The peer-group expense ratios are derived from data provided by Lipper, a Thomson Reuters Company, and capture information through year-end 2014.
Peer groups: For the Small-Cap Index Fund, Small-Cap Core Funds; for the Small-Cap Growth Index Fund, Small-Cap Growth Funds; and for the Small-Cap Value Index Fund, Small-Cap Value Funds.
6
When broader markets are unsettled, investors have traditionally favored the relative safety provided by larger, more established companies, whose results tend to be more predictable and less volatile. Small-caps, which led large-caps in cumulative return through the first six years after the financial crisis, lost their momentum amid the 2015 market weakness.
The difficulties were most apparent among oil and gas stocks, which sank 30% or more in all three funds. The sharp slide of oil prices punished the sector, in part because of high production levels
from some leading oil-producing countries and concerns about the slower growth in China, the world’s largest oil importer. Companies engaged in production and exploration and services and distribution all suffered.
Commodity prices also fell, hurting stocks in the funds’ basic materials sector, including metals and mining, forestry and paper, and chemical businesses. Results were also negative in the consumer goods, consumer services, industrials, and telecommunications sectors, although the declines weren’t always as glaring.
| |
| Total Returns | |
| Ten Years Ended December 31, 2015 | |
| | Average |
| | Annual Return |
| Small-Cap Index Fund Investor Shares | 7.81% |
| Spliced Small-Cap Index | 7.87 |
| Small-Cap Core Funds Average | 5.81 |
| For a benchmark description, see the Glossary. | |
| Small-Cap Core Funds Average: Derived from data provided by Lipper, a Thomson Reuters Company. | |
| |
| Small-Cap Growth Index Fund Investor Shares | 8.22% |
| Spliced Small-Cap Growth Index | 8.25 |
| Small-Cap Growth Funds Average | 6.36 |
| For a benchmark description, see the Glossary. | |
| Small-Cap Growth Funds Average: Derived from data provided by Lipper, a Thomson Reuters Company. | |
| |
| Small-Cap Value Index Fund Investor Shares | 7.15% |
| Spliced Small-Cap Value Index | 7.28 |
| Small-Cap Value Funds Average | 5.71 |
| For a benchmark description, see the Glossary. | |
| Small-Cap Value Funds Average: Derived from data provided by Lipper, a Thomson Reuters Company. | |
The figures shown represent past performance, which is not a guarantee of future results. (Current performance may be lower or higher than the performance data cited. For performance data current to the most recent month-end, visit our website at vanguard.com/performance.) Note, too, that both investment returns and principal value can fluctuate widely, so an investor’s shares, when sold, could be worth more or less than their original cost.
7
Health care and technology, two traditional growth-oriented sectors, led returns for the Small-Cap Index Fund and the Growth Index Fund. Long-term demographic and economic trends continue to propel health care stocks, and merger-and-acquisition activity and robust drug pipelines also lent a boost. Still, returns for the sector didn’t compare with those of recent years, as the lofty valuations of biotechnology stocks and controversy over high drug prices rattled investors at times.
Technology stocks produced muted gains, but results fluctuated across the sector’s business segments. Leaders
included software and service firms that differentiated themselves in the marketplace, delivered innovative products and solutions, and capitalized on the continued shift to mobile and cloud computing.
Financials, the largest sector for all three funds, reflected the overall sluggishness that enveloped both the broader and small-cap markets. Banks—which stand to benefit from the increase in short-term interest rates—and insurance companies carried the sector; asset managers, consumer finance firms, and mortgage companies had a rougher time.
Vanguard’s outlook for investors: Not bearish, but cautious
In Vanguard’s recently published global economic and investment outlook, Global Chief Economist Joseph Davis and his team discuss various market and economic events 2016 may bring, along with challenges and opportunities for investors.
Our forecast includes “frustratingly fragile” economic growth and more modest long-term returns from the global stock and bond markets. The report cautions that for the decade ending 2025, returns for a balanced portfolio are likely to be moderately below historical averages.
Our simulations indicate that the average annualized returns of a 60% equity/40% bond portfolio for the decade are most likely to be centered in the 3%–5% range after inflation, below the actual average after-inflation return of 5.5% for the same portfolio since 1926.
Even so, Vanguard’s steadfast belief in its principles for investing success—focusing on clear goals, a suitable asset allocation, low costs, and long-term discipline—remains unchanged.
For more information about our expectations and the probability of various outcomes, see
Vanguard’s Economic and Investment Outlook, available at vanguard.com/research.
IMPORTANT: The projections or other information generated by the Vanguard Capital Markets Model® (VCMM) regarding the likelihood of various investment outcomes are hypothetical in nature, do not reflect actual investment results, and are not guarantees of future results. Distribution of return outcomes from VCMM, derived from 10,000 simulations for U.S. equity returns and fixed income returns. Simulations as of September 30, 2015. Results from the model may vary with each use and over time. For more information, please see page 9.
8
All three small-cap index funds tightly tracked their benchmarks
For the decade ended December 31, 2015, each of the three small-cap index funds generated an average annual return of more than 7%. Most important, all three funds met their primary objective of tightly tracking their benchmark returns over a volatile period that included the worst bear market in 75 years and the subsequent recovery.
Index tracking may appear simple from the outside, but it requires sophisticated trading and portfolio construction techniques. The funds’ success in tracking their indexes is a testament to the expertise and experience of their advisor, Vanguard Equity Index Group.
Additionally, over the decade, all three funds topped the average annual returns of their peer funds, many of which are
actively managed. The Small-Cap Index Fund’s return was 2 percentage points ahead of its peer average, and the other two funds surpassed their peers by more than 1 percentage point.
To reach your long-term goals, be realistic and try to save more
Although there have been times when it felt as if stocks and bonds were riding a roller coaster, the markets have generally risen in recent years. The broad global stock market in particular has posted some impressive gains since its turnaround began in 2009.
But 2015 served as a reminder that markets aren’t always favorable. The U.S. stock and bond markets were barely positive, and international stocks and unhedged bonds finished in the red.
IMPORTANT: The projections or other information generated by the Vanguard Capital Markets Model (VCMM) regarding the likelihood of various investment outcomes are hypothetical in nature, do not reflect actual investment results, and are not guarantees of future results. VCMM results will vary with each use and over time.
The VCMM projections are based on a statistical analysis of historical data. Future returns may behave differently from the historical patterns captured in the VCMM. More important, the VCMM may be underestimating extreme negative scenarios unobserved in the historical period on which the model estimation is based.
The VCMM is a proprietary financial simulation tool developed and maintained by Vanguard’s primary investment research and advice teams. The model forecasts distributions of future returns for a wide array of broad asset classes. Those asset classes include U.S. and international equity markets, several maturities of the U.S. Treasury and corporate fixed income markets, international fixed income markets, U.S. money markets, commodities, and certain alternative investment strategies. The theoretical and empirical foundation for the VCMM is that the returns of various asset classes reflect the compensation investors require for bearing different types of systematic risk (beta). At the core of the model are estimates of the dynamic statistical relationship between risk factors and asset returns, obtained from statistical analysis based on available monthly financial and economic data from as early as 1960. Using a system of estimated equations, the model then applies a Monte Carlo simulation method to project the estimated interrelationships among risk factors and asset classes as well as uncertainty and randomness over time. The model generates a large set of simulated outcomes for each asset class over several time horizons. Forecasts are obtained by computing measures of central tendency in these simulations. Results produced by the tool will vary with each use and over time.
9
In Vanguard’s recently updated long-term look at the economy and markets, our global economists explain why they expect economic growth to remain “frustratingly fragile,” and why their outlook for stock and bond markets is the most guarded since 2006. (For more details, see the box on page 8 and Vanguard’s Economic and Investment Outlook, available at vanguard.com/research.)
Given these muted expectations, what’s the best course of action? I’ve often encouraged shareholders to focus on the things they can control. That advice holds true today.
Consider saving more than you think you may need. That’s one way you can prepare for the volatility that may lie ahead, particularly as markets adjust to changes in policies from the Fed and other central banks.
And, as always, investors would be well-
served to follow Vanguard’s principles
for investing success:
• Goals. Create clear, appropriate investment goals.
• Balance. Develop a suitable asset allocation using broadly diversified funds.
• Cost. Minimize cost.
• Discipline. Maintain perspective and long-term discipline.
As with saving, each of these principles is within your control, and focusing on them can keep you on the right path.
As always, thank you for investing with Vanguard.
Sincerely,

F. William McNabb III
Chairman and Chief Executive Officer
January 20, 2016
10
| | | | | |
| Small-Cap Index Fund | | | | |
| |
| |
| Fund Profile | | | | | |
| As of December 31, 2015 | | | | | |
| |
| Share-Class Characteristics | | | | | |
| | Investor | | Admiral | Institutional | Institutional |
| | Shares | ETF Shares | Shares | Shares | Plus Shares |
| Ticker Symbol | NAESX | VB | VSMAX | VSCIX | VSCPX |
| Expense Ratio1 | 0.23% | 0.09% | 0.09% | 0.08% | 0.06% |
| 30-Day SEC Yield | 1.50% | 1.60% | 1.59% | 1.61% | 1.63% |
| | | |
| Portfolio Characteristics | | |
| | | | DJ |
| | | | U.S. |
| | | CRSP US | Total |
| | | Small Cap | Market |
| | Fund | Index FA Index |
| Number of Stocks | 1,509 | 1,489 | 3,960 |
| Median Market Cap | $3.0B | $3.0B | $51.4B |
| Price/Earnings Ratio | 28.8x | 28.3x | 21.9x |
| Price/Book Ratio | 2.2x | 2.3x | 2.7x |
| Return on Equity | 11.5% | 11.6% | 17.2% |
| Earnings Growth | | | |
| Rate | 11.1% | 11.1% | 9.5% |
| Dividend Yield | 1.7% | 1.7% | 2.1% |
| Foreign Holdings | 0.0% | 0.0% | 0.0% |
| Turnover Rate | 11% | — | — |
| Short-Term | | | |
| Reserves | 0.2% | — | — |
| |
| Sector Diversification (% of equity exposure) |
| | | | DJ |
| | | CRSP US U.S. Total |
| | | Small Cap | Market |
| | Fund | Index FA Index |
| Basic Materials | 2.8% | 2.8% | 2.3% |
| Consumer Goods | 7.5 | 7.5 | 10.3 |
| Consumer Services | 13.0 | 13.0 | 14.2 |
| Financials | 26.6 | 26.7 | 19.5 |
| Health Care | 11.3 | 11.2 | 14.0 |
| Industrials | 18.6 | 18.5 | 12.2 |
| Oil & Gas | 3.4 | 3.4 | 5.9 |
| Technology | 12.1 | 12.1 | 16.4 |
| Telecommunications | 0.3 | 0.4 | 2.2 |
| Utilities | 4.4 | 4.4 | 3.0 |
| | |
| Volatility Measures | | |
| | | DJ |
| | Spliced | U.S. Total |
| | Small-Cap | Market |
| | Index | FA Index |
| R-Squared | 1.00 | 0.83 |
| Beta | 1.00 | 1.08 |
These measures show the degree and timing of the fund’s fluctuations compared with the indexes over 36 months.
Ten Largest Holdings (% of total net assets)
| | |
| AGL Resources Inc. | Gas Distribution | 0.3% |
| Ionis Pharmaceuticals | | |
| Inc. | Biotechnology | 0.3 |
| Signature Bank | Banks | 0.3 |
| Duke Realty Corp. | Industrial & Office | |
| | REITs | 0.3 |
| Arthur J Gallagher & Co. | Property & Casualty | |
| | Insurance | 0.3 |
| JetBlue Airways Corp. | Airlines | 0.3 |
| Spirit AeroSystems | | |
| Holdings Inc. | Aerospace | 0.3 |
| Waste Connections Inc. | Waste & Disposal | |
| | Services | 0.3 |
| Ingredion Inc. | Food Products | 0.3 |
| Mid-America Apartment | | |
| Communities Inc. | Residential REITs | 0.3 |
| Top Ten | | 3.0% |
The holdings listed exclude any temporary cash investments and equity index products.
1 The expense ratios shown are from the prospectus dated April 28, 2015, and represent estimated costs for the current fiscal year. For the fiscal year ended December 31, 2015, the expense ratios were 0.20% for Investor Shares, 0.08% for ETF Shares, 0.08% for Admiral Shares, 0.07% for Institutional Shares, and 0.05% for Institutional Plus Shares.
11
Small-Cap Index Fund
Investment Focus
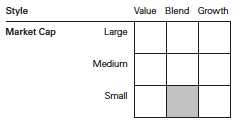
12
Small-Cap Index Fund
Performance Summary
All of the returns in this report represent past performance, which is not a guarantee of future results that may be achieved by the fund. (Current performance may be lower or higher than the performance data cited. For performance data current to the most recent month-end, visit our website at vanguard.com/performance.) Note, too, that both investment returns and principal value can fluctuate widely, so an investor’s shares, when sold, could be worth more or less than their original cost. The returns shown do not reflect taxes that a shareholder would pay on fund distributions or on the sale of fund shares.
Cumulative Performance: December 31, 2005, Through December 31, 2015
Initial Investment of $10,000
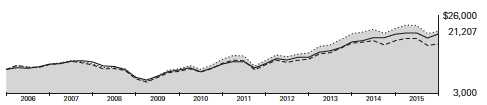
| | | | | |
| | | | Average Annual Total Returns | |
| | | Periods Ended December 31, 2015 | |
| | | | | | Final Value |
| | | One | Five | Ten | of a $10,000 |
| | | Year | Years | Years | Investment |
| | Small-Cap Index Fund*Investor | | | | |
| | Shares | -3.78% | 10.28% | 7.81% | $21,207 |
| •••••••• | Spliced Small-Cap Index | -3.68 | 10.40 | 7.87 | 21,337 |
| – – – – | Small-Cap Core Funds Average | -5.21 | 8.25 | 5.81 | 17,583 |
| | Dow Jones U.S. Total Stock Market | | | | |
| | Float Adjusted Index | 0.44 | 12.14 | 7.48 | 20,563 |
| For a benchmark description, see the Glossary. | | | | |
| Small-Cap Core Funds Average: Derived from data provided by Lipper, a Thomson Reuters Company. | | |
| |
| | | | | | Final Value |
| | | One | Five | Ten | of a $10,000 |
| | | Year | Years | Years | Investment |
| Small-Cap Index Fund | | | | |
| ETF Shares Net Asset Value | -3.65% | 10.43% | 7.95% | $21,491 |
| Spliced Small-Cap Index | -3.68 | 10.40 | 7.87 | 21,337 |
| Dow Jones U.S. Total Stock Market Float | | | | |
| Adjusted Index | 0.44 | 12.14 | 7.48 | 20,563 |
See Financial Highlights for dividend and capital gains information.
13
| | | | |
| Small-Cap Index Fund | | | | |
| |
| |
| |
| | | Average Annual Total Returns | |
| | Periods Ended December 31, 2015 | |
| | | | | Final Value |
| | One | Five | Ten | of a $10,000 |
| | Year | Years | Years | Investment |
| Small-Cap Index Fund Admiral Shares | -3.64% | 10.43% | 7.95% | $21,480 |
| Spliced Small-Cap Index | -3.68 | 10.40 | 7.87 | 21,337 |
| Dow Jones U.S. Total Stock Market Float | | | | |
| Adjusted Index | 0.44 | 12.14 | 7.48 | 20,563 |
| |
| |
| | | | | Final Value |
| | One | Five | Ten | of a $5,000,000 |
| | Year | Years | Years | Investment |
| Small-Cap Index Fund Institutional Shares | -3.63% | 10.45% | 7.98% | $10,774,795 |
| Spliced Small-Cap Index | -3.68 | 10.40 | 7.87 | 10,668,643 |
| Dow Jones U.S. Total Stock Market Float | | | | |
| Adjusted Index | 0.44 | 12.14 | 7.48 | 10,281,716 |
| |
| |
| |
| | | | Since | Final Value |
| | One | Five | Inception | of a $100,000,000 |
| | Year | Years | (12/17/2010) | Investment |
| Small-Cap Index Fund Institutional Plus Shares | -3.62% | 10.47% | 10.57% | $165,883,754 |
| Spliced Small-Cap Index | -3.68 | 10.40 | 10.50 | 165,370,544 |
| Dow Jones U.S. Total Stock Market Float | | | | |
| Adjusted Index | 0.44 | 12.14 | 12.30 | 179,414,550 |
| "Since Inception" performance is calculated from the Institutional Plus Shares’ inception date for both the fund and its comparative standards. |
| | | |
| Cumulative Returns of ETF Shares: December 31, 2005, Through December 31, 2015 | |
| | One | Five | Ten |
| | Year | Years | Years |
| Small-Cap Index Fund ETF Shares Market Price | -3.67% | 64.10% | 115.36% |
| Small-Cap Index Fund ETF Shares Net Asset Value | -3.65 | 64.24 | 114.91 |
| Spliced Small-Cap Index | -3.68 | 64.03 | 113.37 |
14
Small-Cap Index Fund
Fiscal-Year Total Returns (%): December 31, 2005, Through December 31, 2015
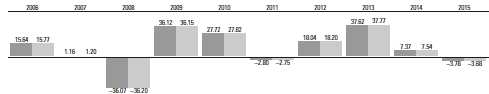
|
| Small-Cap Index Fund Investor Shares |
| Spliced Small-Cap Index |
| For a benchmark description, see the Glossary. |
15
Small-Cap Index Fund
Financial Statements
Statement of Net Assets—Investments Summary
As of December 31, 2015
This Statement summarizes the fund’s holdings by asset type. Details are reported for each of the fund’s 50 largest individual holdings and for investments that, in total for any issuer, represent more than 1% of the fund’s net assets. The total value of smaller holdings is reported as a single amount within each category.
The fund reports a complete list of its holdings in regulatory filings four times in each fiscal year, at the quarter-ends. For the second and fourth fiscal quarters, the complete listing of the fund’s holdings is available electronically on vanguard.com and on the Securities and Exchange Commission’s website (sec.gov), or you can have it mailed to you without charge by calling 800-662-7447. For the first and third fiscal quarters, the fund files the lists with the SEC on Form N-Q. Shareholders can look up the fund’s Forms N-Q on the SEC’s website. Forms N-Q may also be reviewed and copied at the SEC’s Public Reference Room (see the back cover of this report for further information).
| | | |
| | | Market | Percentage |
| | | Value• | of Net |
| | Shares | ($000) | Assets |
| Common Stocks | | | |
| Basic Materials | | | |
| RPM International Inc. | 2,657,503 | 117,090 | 0.2% |
| Basic Materials—Other † | | 1,390,740 | 2.6% |
| | | 1,507,830 | 2.8% |
| Consumer Goods | | | |
| Ingredion Inc. | 1,429,053 | 136,960 | 0.2% |
| * Middleby Corp. | 1,144,917 | 123,502 | 0.2% |
| Consumer Goods—Other † | | 3,750,769 | 7.0% |
| | | 4,011,231 | 7.4% |
| Consumer Services | | | |
| * JetBlue Airways Corp. | 6,292,913 | 142,534 | 0.3% |
| Cablevision Systems Corp. Class A | 4,223,013 | 134,714 | 0.3% |
| Domino’s Pizza Inc. | 1,091,553 | 121,435 | 0.2% |
| TEGNA Inc. | 4,428,457 | 113,014 | 0.2% |
| Consumer Services—Other † | | 6,478,907 | 12.0% |
| | | 6,990,604 | 13.0% |
| Financials | | | |
| * Signature Bank | 954,765 | 146,432 | 0.3% |
| Duke Realty Corp. | 6,896,207 | 144,958 | 0.3% |
| Arthur J Gallagher & Co. | 3,528,332 | 144,450 | 0.3% |
| Mid-America Apartment Communities Inc. | 1,505,674 | 136,730 | 0.3% |
| Omega Healthcare Investors Inc. | 3,735,693 | 130,675 | 0.3% |
| Regency Centers Corp. | 1,880,780 | 128,119 | 0.2% |
| Apartment Investment & Management Co. | 3,124,434 | 125,071 | 0.2% |
| * SVB Financial Group | 1,028,506 | 122,289 | 0.2% |
| * Liberty Ventures Class A | 2,692,106 | 121,441 | 0.2% |
| East West Bancorp Inc. | 2,874,261 | 119,454 | 0.2% |
| Kilroy Realty Corp. | 1,841,999 | 116,562 | 0.2% |
| WP Carey Inc. | 1,876,859 | 110,735 | 0.2% |
| Financials—Other † | | 12,729,801 | 23.6% |
| | | 14,276,717 | 26.5% |
16
| | | | |
| Small-Cap Index Fund | | | |
| |
| |
| |
| | | | Market | Percentage |
| | | | Value• | of Net |
| | | Shares | ($000) | Assets |
| Health Care | | | |
| * | Ionis Pharmaceuticals Inc. | 2,399,196 | 148,582 | 0.3% |
| * | United Therapeutics Corp. | 865,881 | 135,606 | 0.3% |
| * | MEDNAX Inc. | 1,878,371 | 134,604 | 0.3% |
| * | STERIS plc | 1,715,663 | 129,258 | 0.2% |
| * | DexCom Inc. | 1,542,565 | 126,336 | 0.2% |
| * | Sirona Dental Systems Inc. | 1,116,458 | 122,330 | 0.2% |
| * | Dyax Corp. | 2,938,682 | 110,553 | 0.2% |
| | Health Care—Other † | | 5,139,722 | 9.5% |
| | | | 6,046,991 | 11.2% |
| Industrials | | | |
| * | Spirit AeroSystems Holdings Inc. Class A | 2,804,057 | 140,399 | 0.3% |
| | Waste Connections Inc. | 2,444,300 | 137,663 | 0.3% |
| | Valspar Corp. | 1,586,717 | 131,618 | 0.3% |
| * | CoStar Group Inc. | 616,467 | 127,418 | 0.3% |
| | Broadridge Financial Solutions Inc. | 2,368,590 | 127,264 | 0.2% |
| | Allegion plc | 1,915,715 | 126,284 | 0.2% |
| | Jack Henry & Associates Inc. | 1,596,638 | 124,634 | 0.2% |
| | Packaging Corp. of America | 1,951,971 | 123,072 | 0.2% |
| | PerkinElmer Inc. | 2,235,871 | 119,776 | 0.2% |
| * | HD Supply Holdings Inc. | 3,977,697 | 119,450 | 0.2% |
| | Huntington Ingalls Industries Inc. | 938,354 | 119,030 | 0.2% |
| | IDEX Corp. | 1,528,438 | 117,094 | 0.2% |
| | Carlisle Cos. Inc. | 1,298,388 | 115,154 | 0.2% |
| | AO Smith Corp. | 1,495,891 | 114,600 | 0.2% |
| | Industrials—Other † | | 8,220,954 | 15.3% |
| | | | 9,964,410 | 18.5% |
| |
| Oil & Gas † | | 1,838,678 | 3.4% |
| |
| 1Other † | | 2,366 | 0.0% |
| |
| Technology | | | |
| | CDW Corp. | 3,024,983 | 127,170 | 0.3% |
| *,^ | athenahealth Inc. | 775,613 | 124,850 | 0.2% |
| * | Cadence Design Systems Inc. | 5,941,510 | 123,643 | 0.2% |
| | SS&C Technologies Holdings Inc. | 1,651,057 | 112,718 | 0.2% |
| | Technology—Other † | | 6,024,102 | 11.2% |
| | | | 6,512,483 | 12.1% |
| |
| Telecommunications † | | 187,057 | 0.3% |
| |
| Utilities | | | |
| | AGL Resources Inc. | 2,401,674 | 153,251 | 0.3% |
| | Atmos Energy Corp. | 2,027,541 | 127,816 | 0.3% |
| | TECO Energy Inc. | 4,698,471 | 125,214 | 0.2% |
| | ITC Holdings Corp. | 3,064,601 | 120,286 | 0.2% |
| | Westar Energy Inc. Class A | 2,823,125 | 119,729 | 0.2% |
| | UGI Corp. | 3,451,012 | 116,506 | 0.2% |
| | Utilities—Other † | | 1,578,636 | 2.9% |
| | | | 2,341,438 | 4.3% |
| Total Common Stocks (Cost $45,856,081) | | 53,679,805 | 99.5%2 |
17
| | | | |
| Small-Cap Index Fund | | | | |
| |
| |
| |
| | | | Market | Percentage |
| | | | Value• | of Net |
| | Coupon | Shares | ($000) | Assets |
| Temporary Cash Investments | | | | |
| Money Market Fund | | | | |
| 3,4 Vanguard Market Liquidity Fund | 0.363% | 1,171,603,570 | 1,171,604 | 2.2% |
| |
| 5U.S. Government and Agency Obligations † | | | 12,600 | 0.0% |
| Total Temporary Cash Investments (Cost $1,184,205) | | 1,184,204 | 2.2%2 |
| Total Investments (Cost $47,040,286) | | | 54,864,009 | 101.7% |
| |
| | | | Amount | |
| | | | ($000) | |
| Other Assets and Liabilities | | | | |
| Other Assets | | | | |
| Investment in Vanguard | | | 4,862 | |
| Receivables for Investment Securities Sold | | | 6,741 | |
| Receivables for Accrued Income | | | 87,005 | |
| Receivables for Capital Shares Issued | | | 101,748 | |
| Other Assets | | | 107 | |
| Total Other Assets | | | 200,463 | 0.4% |
| Liabilities | | | | |
| Payables for Investment Securities Purchased | | | (46,546) | |
| Collateral for Securities on Loan | | | (932,404) | |
| Payables for Capital Shares Redeemed | | | (105,611) | |
| Payables to Vanguard | | | (35,162) | |
| Other Liabilities | | | (7,608) | |
| Total Liabilities | | | (1,127,331) | (2.1%) |
| Net Assets | | | 53,937,141 | 100.0% |
| |
| |
| At December 31, 2015, net assets consisted of: | | | | |
| | | | | Amount |
| | | | | ($000) |
| Paid-in Capital | | | | 48,569,159 |
| Overdistributed Net Investment Income | | | | (28,872) |
| Accumulated Net Realized Losses | | | | (2,430,308) |
| Unrealized Appreciation (Depreciation) | | | | |
| Investment Securities | | | | 7,823,723 |
| Futures Contracts | | | | 2,131 |
| Swap Contracts | | | | 1,308 |
| Net Assets | | | | 53,937,141 |
| |
| |
| Investor Shares—Net Assets | | | | |
| Applicable to 76,510,494 outstanding $.001 par value shares of | | | |
| beneficial interest (unlimited authorization) | | | | 4,057,539 |
| Net Asset Value Per Share—Investor Shares | | | | $53.03 |
18
| |
| Small-Cap Index Fund | |
| |
| |
| |
| | Amount |
| | ($000) |
| ETF Shares—Net Assets | |
| Applicable to 103,681,539 outstanding $.001 par value shares of | |
| beneficial interest (unlimited authorization) | 11,478,091 |
| Net Asset Value Per Share—ETF Shares | $110.71 |
| |
| Admiral Shares—Net Assets | |
| Applicable to 404,187,778 outstanding $.001 par value shares of | |
| beneficial interest (unlimited authorization) | 21,441,040 |
| Net Asset Value Per Share—Admiral Shares | $53.05 |
| |
| Institutional Shares—Net Assets | |
| Applicable to 189,195,170 outstanding $.001 par value shares of | |
| beneficial interest (unlimited authorization) | 10,035,937 |
| Net Asset Value Per Share—Institutional Shares | $53.05 |
| |
| Institutional Plus Shares—Net Assets | |
| Applicable to 45,224,928 outstanding $.001 par value shares of | |
| beneficial interest (unlimited authorization) | 6,924,534 |
| Net Asset Value Per Share—Institutional Plus Shares | $153.11 |
• See Note A in Notes to Financial Statements.
* Non-income-producing security.
^ Includes partial security positions on loan to broker-dealers. The total value of securities on loan is $875,518,000.
† Represents the aggregate value, by category, of securities that are not among the 50 largest holdings and, in total for any issuer, represent 1% or less of net assets.
1 “Other” represents securities that are not classified by the fund’s benchmark index.
2 The fund invests a portion of its cash reserves in equity markets through the use of index futures contracts and swap contracts. After giving effect to futures and swap investments, the fund’s effective common stock and temporary cash investment positions represent 100.0% and 1.7%, respectively, of net assets.
3 Affiliated money market fund available only to Vanguard funds and certain trusts and accounts managed by Vanguard. Rate shown is the
7-day yield.
4 Includes $932,404,000 of collateral received for securities on loan.
5 Securities with a value of $9,886,000 have been segregated as initial margin for open futures contracts.
See accompanying Notes, which are an integral part of the Financial Statements.
19
| |
| Small-Cap Index Fund | |
| |
| |
| Statement of Operations | |
| |
| |
| | Year Ended |
| | December 31, 2015 |
| | ($000) |
| Investment Income | |
| Income | |
| Dividends | 786,472 |
| Interest1 | 420 |
| Securities Lending | 48,537 |
| Total Income | 835,429 |
| Expenses | |
| The Vanguard Group—Note B | |
| Investment Advisory Services | 3,698 |
| Management and Administrative—Investor Shares | 7,298 |
| Management and Administrative—ETF Shares | 6,171 |
| Management and Administrative—Admiral Shares | 12,381 |
| Management and Administrative—Institutional Shares | 5,153 |
| Management and Administrative—Institutional Plus Shares | 2,108 |
| Marketing and Distribution—Investor Shares | 1,052 |
| Marketing and Distribution—ETF Shares | 1,115 |
| Marketing and Distribution—Admiral Shares | 2,495 |
| Marketing and Distribution—Institutional Shares | 789 |
| Marketing and Distribution—Institutional Plus Shares | 408 |
| Custodian Fees | 1,353 |
| Auditing Fees | 43 |
| Shareholders’ Reports—Investor Shares | 105 |
| Shareholders’ Reports—ETF Shares | 431 |
| Shareholders’ Reports—Admiral Shares | 200 |
| Shareholders’ Reports—Institutional Shares | 146 |
| Shareholders’ Reports—Institutional Plus Shares | 75 |
| Trustees’ Fees and Expenses | 38 |
| Total Expenses | 45,059 |
| Net Investment Income | 790,370 |
| Realized Net Gain (Loss) | |
| Investment Securities Sold | 2,726,740 |
| Futures Contracts | (2,236) |
| Swap Contracts | (20,006) |
| Realized Net Gain (Loss) | 2,704,498 |
| Change in Unrealized Appreciation (Depreciation) | |
| Investment Securities | (5,657,095) |
| Futures Contracts | 1,565 |
| Swap Contracts | (253) |
| Change in Unrealized Appreciation (Depreciation) | (5,655,783) |
| Net Increase (Decrease) in Net Assets Resulting from Operations | (2,160,915) |
| 1 Interest income from an affiliated company of the fund was $400,000. | |
| See accompanying Notes, which are an integral part of the Financial Statements. | |
20
| | |
| Small-Cap Index Fund | | |
| |
| |
| Statement of Changes in Net Assets | | |
| |
| | Year Ended December 31, |
| | 2015 | 2014 |
| | ($000) | ($000) |
| Increase (Decrease) in Net Assets | | |
| Operations | | |
| Net Investment Income | 790,370 | 721,996 |
| Realized Net Gain (Loss) | 2,704,498 | 1,922,898 |
| Change in Unrealized Appreciation (Depreciation) | (5,655,783) | 847,521 |
| Net Increase (Decrease) in Net Assets Resulting from Operations | (2,160,915) | 3,492,415 |
| Distributions | | |
| Net Investment Income | | |
| Investor Shares | (55,298) | (58,444) |
| ETF Shares | (164,546) | (141,190) |
| Admiral Shares | (309,236) | (282,281) |
| Signal Shares | — | (604) |
| Institutional Shares | (148,089) | (140,213) |
| Institutional Plus Shares | (101,667) | (86,737) |
| Realized Capital Gain | | |
| Investor Shares | — | — |
| ETF Shares | — | — |
| Admiral Shares | — | — |
| Signal Shares | — | — |
| Institutional Shares | — | — |
| Institutional Plus Shares | — | — |
| Total Distributions | (778,836) | (709,469) |
| Capital Share Transactions | | |
| Investor Shares | (344,117) | (713,524) |
| ETF Shares | 2,265,366 | 1,073,291 |
| Admiral Shares | 2,571,958 | 8,931,404 |
| Signal Shares | — | (7,473,215) |
| Institutional Shares | 605,267 | 234,336 |
| Institutional Plus Shares | 1,305,476 | 1,394,607 |
| Net Increase (Decrease) from Capital Share Transactions | 6,403,950 | 3,446,899 |
| Total Increase (Decrease) | 3,464,199 | 6,229,845 |
| Net Assets | | |
| Beginning of Period | 50,472,942 | 44,243,097 |
| End of Period1 | 53,937,141 | 50,472,942 |
1 Net Assets—End of Period includes undistributed (overdistributed) net investment income of ($28,872,000) and ($20,922,000).
See accompanying Notes, which are an integral part of the Financial Statements.
21
| | | | | |
| Small-Cap Index Fund | | | | | |
| |
| |
| Financial Highlights | | | | | |
| |
| |
| Investor Shares | | | | | |
| |
| For a Share Outstanding | | | Year Ended December 31, |
| Throughout Each Period | 2015 | 2014 | 2013 | 2012 | 2011 |
| Net Asset Value, Beginning of Period | $55.86 | $52.69 | $38.74 | $33.38 | $34.75 |
| Investment Operations | | | | | |
| Net Investment Income | .727 | .730 | .609 | .659 | .402 |
| Net Realized and Unrealized Gain (Loss) | | | | | |
| on Investments | (2.840) | 3.148 | 13.958 | 5.363 | (1.375) |
| Total from Investment Operations | (2.113) | 3.878 | 14.567 | 6.022 | (.973) |
| Distributions | | | | | |
| Dividends from Net Investment Income | (.717) | (.708) | (.617) | (. 662) | (. 397) |
| Distributions from Realized Capital Gains | — | — | — | — | — |
| Total Distributions | (.717) | (.708) | (.617) | (. 662) | (. 397) |
| Net Asset Value, End of Period | $53.03 | $55.86 | $52.69 | $38.74 | $33.38 |
| |
| Total Return1 | -3.78% | 7.37% | 37.62% | 18.04% | -2.80% |
| |
| Ratios/Supplemental Data | | | | | |
| Net Assets, End of Period (Millions) | $4,058 | $4,606 | $5,041 | $3,813 | $3,925 |
| Ratio of Total Expenses to Average Net Assets | 0.20% | 0.23% | 0.24% | 0.24% | 0.24% |
| Ratio of Net Investment Income to | | | | | |
| Average Net Assets | 1.33% | 1.40% | 1.39% | 1.82% | 1.15% |
| Portfolio Turnover Rate2 | 11% | 10% | 29% | 14% | 17% |
1 Total returns do not include account service fees that may have applied in the periods shown. Fund prospectuses provide information about any applicable account service fees.
2 Excludes the value of portfolio securities received or delivered as a result of in-kind purchases or redemptions of the fund’s capital shares, including ETF Creation Units.
See accompanying Notes, which are an integral part of the Financial Statements.
22
| | | | | |
| Small-Cap Index Fund | | | | | |
| |
| |
| Financial Highlights | | | | | |
| |
| |
| ETF Shares | | | | | |
| |
| For a Share Outstanding | | | Year Ended December 31, |
| Throughout Each Period | 2015 | 2014 | 2013 | 2012 | 2011 |
| Net Asset Value, Beginning of Period | $116.61 | $110.02 | $80.89 | $69.70 | $72.58 |
| Investment Operations | | | | | |
| Net Investment Income | 1.668 | 1.707 | 1.424 | 1.500 | .957 |
| Net Realized and Unrealized Gain (Loss) | | | | | |
| on Investments | (5.931) | 6.556 | 29.145 | 11.194 | (2.891) |
| Total from Investment Operations | (4.263) | 8.263 | 30.569 | 12.694 | (1.934) |
| Distributions | | | | | |
| Dividends from Net Investment Income | (1.637) | (1.673) | (1.439) | (1.504) | (.946) |
| Distributions from Realized Capital Gains | — | — | — | — | — |
| Total Distributions | (1.637) | (1.673) | (1.439) | (1.504) | (.946) |
| Net Asset Value, End of Period | $110.71 | $116.61 | $110.02 | $80.89 | $69.70 |
| |
| Total Return | -3.65% | 7.51% | 37.80% | 18.22% | -2.68% |
| |
| Ratios/Supplemental Data | | | | | |
| Net Assets, End of Period (Millions) | $11,478 | $9,833 | $8,217 | $4,691 | $3,683 |
| Ratio of Total Expenses to Average Net Assets | 0.08% | 0.09% | 0.09% | 0.10% | 0.10% |
| Ratio of Net Investment Income to | | | | | |
| Average Net Assets | 1.45% | 1.54% | 1.54% | 1.96% | 1.29% |
| Portfolio Turnover Rate1 | 11% | 10% | 29% | 14% | 17% |
1 Excludes the value of portfolio securities received or delivered as a result of in-kind purchases or redemptions of the fund’s capital shares, including ETF Creation Units.
See accompanying Notes, which are an integral part of the Financial Statements.
23
| | | | | |
| Small-Cap Index Fund | | | | | |
| |
| |
| Financial Highlights | | | | | |
| |
| |
| Admiral Shares | | | | | |
| |
| For a Share Outstanding | | | Year Ended December 31, |
| Throughout Each Period | 2015 | 2014 | 2013 | 2012 | 2011 |
| Net Asset Value, Beginning of Period | $55.87 | $52.72 | $38.76 | $33.39 | $34.78 |
| Investment Operations | | | | | |
| Net Investment Income | .797 | .817 | .681 | .717 | .461 |
| Net Realized and Unrealized Gain (Loss) | | | | | |
| on Investments | (2.833) | 3.133 | 13.968 | 5.372 | (1.395) |
| Total from Investment Operations | (2.036) | 3.950 | 14.649 | 6.089 | (.934) |
| Distributions | | | | | |
| Dividends from Net Investment Income | (.784) | (.800) | (.689) | (.719) | (.456) |
| Distributions from Realized Capital Gains | — | — | — | — | — |
| Total Distributions | (.784) | (.800) | (.689) | (.719) | (.456) |
| Net Asset Value, End of Period | $53.05 | $55.87 | $52.72 | $38.76 | $33.39 |
| |
| Total Return1 | -3.64% | 7.50% | 37.81% | 18.24% | -2.69% |
| |
| Ratios/Supplemental Data | | | | | |
| Net Assets, End of Period (Millions) | $21,441 | $20,034 | $10,126 | $6,541 | $5,525 |
| Ratio of Total Expenses to Average Net Assets | 0.08% | 0.09% | 0.09% | 0.10% | 0.10% |
| Ratio of Net Investment Income to | | | | | |
| Average Net Assets | 1.45% | 1.54% | 1.54% | 1.96% | 1.29% |
| Portfolio Turnover Rate2 | 11% | 10% | 29% | 14% | 17% |
1 Total returns do not include account service fees that may have applied in the periods shown. Fund prospectuses provide information about any applicable account service fees.
2 Excludes the value of portfolio securities received or delivered as a result of in-kind purchases or redemptions of the fund’s capital shares, including ETF Creation Units.
See accompanying Notes, which are an integral part of the Financial Statements.
24
| | | | | |
| Small-Cap Index Fund | | | | | |
| |
| |
| Financial Highlights | | | | | |
| |
| |
| Institutional Shares | | | | | |
| |
| For a Share Outstanding | | | Year Ended December 31, |
| Throughout Each Period | 2015 | 2014 | 2013 | 2012 | 2011 |
| Net Asset Value, Beginning of Period | $55.87 | $52.71 | $38.76 | $33.39 | $34.77 |
| Investment Operations | | | | | |
| Net Investment Income | . 803 | .821 | .686 | .724 | .467 |
| Net Realized and Unrealized Gain (Loss) | | | | | |
| on Investments | (2.834) | 3.144 | 13.957 | 5.372 | (1.385) |
| Total from Investment Operations | (2.031) | 3.965 | 14.643 | 6.096 | (.918) |
| Distributions | | | | | |
| Dividends from Net Investment Income | (.789) | (. 805) | (. 693) | (.726) | (. 462) |
| Distributions from Realized Capital Gains | — | — | — | — | — |
| Total Distributions | (.789) | (. 805) | (. 693) | (.726) | (. 462) |
| Net Asset Value, End of Period | $53.05 | $55.87 | $52.71 | $38.76 | $33.39 |
| |
| Total Return | -3.63% | 7.53% | 37.80% | 18.26% | -2.65% |
| |
| Ratios/Supplemental Data | | | | | |
| Net Assets, End of Period (Millions) | $10,036 | $9,975 | $9,185 | $5,955 | $4,894 |
| Ratio of Total Expenses to Average Net Assets | 0.07% | 0.08% | 0.08% | 0.08% | 0.08% |
| Ratio of Net Investment Income to | | | | | |
| Average Net Assets | 1.46% | 1.55% | 1.55% | 1.98% | 1.31% |
| Portfolio Turnover Rate1 | 11% | 10% | 29% | 14% | 17% |
1 Excludes the value of portfolio securities received or delivered as a result of in-kind purchases or redemptions of the fund’s capital shares, including ETF Creation Units.
See accompanying Notes, which are an integral part of the Financial Statements.
25
| | | | | |
| Small-Cap Index Fund | | | | | |
| |
| |
| Financial Highlights | | | | | |
| |
| |
| Institutional Plus Shares | | | | | |
| |
| For a Share Outstanding | | | Year Ended December 31, |
| Throughout Each Period | 2015 | 2014 | 2013 | 2012 | 2011 |
| Net Asset Value, Beginning of Period | $161.27 | $152.16 | $111.87 | $96.37 | $100.38 |
| Investment Operations | | | | | |
| Net Investment Income | 2.353 | 2.405 | 2.007 | 2.114 | 1.373 |
| Net Realized and Unrealized Gain (Loss) | | | | | |
| on Investments | (8.203) | 9.062 | 40.311 | 15.506 | (4.023) |
| Total from Investment Operations | (5.850) | 11.467 | 42.318 | 17.620 | (2.650) |
| Distributions | | | | | |
| Dividends from Net Investment Income | (2.310) | (2.357) | (2.028) | (2.120) | (1.360) |
| Distributions from Realized Capital Gains | — | — | — | — | — |
| Total Distributions | (2.310) | (2.357) | (2.028) | (2.120) | (1.360) |
| Net Asset Value, End of Period | $153.11 | $161.27 | $152.16 | $111.87 | $96.37 |
| |
| Total Return | -3.62% | 7.55% | 37.85% | 18.29% | -2.65% |
| |
| Ratios/Supplemental Data | | | | | |
| Net Assets, End of Period (Millions) | $6,925 | $6,024 | $4,323 | $2,435 | $1,840 |
| Ratio of Total Expenses to Average Net Assets | 0.05% | 0.06% | 0.06% | 0.06% | 0.06% |
| Ratio of Net Investment Income to | | | | | |
| Average Net Assets | 1.48% | 1.57% | 1.57% | 2.00% | 1.33% |
| Portfolio Turnover Rate1 | 11% | 10% | 29% | 14% | 17% |
1 Excludes the value of portfolio securities received or delivered as a result of in-kind purchases or redemptions of the fund’s capital shares, including ETF Creation Units.
See accompanying Notes, which are an integral part of the Financial Statements.
26
Small-Cap Index Fund
Notes to Financial Statements
Vanguard Small-Cap Index Fund is registered under the Investment Company Act of 1940 as an open-end investment company, or mutual fund. The fund offers five classes of shares: Investor Shares, ETF Shares, Admiral Shares, Institutional Shares, and Institutional Plus Shares. Investor Shares are available to any investor who meets the fund’s minimum purchase requirements. ETF Shares are listed for trading on NYSE Arca; they can be purchased and sold through a broker. Admiral Shares, Institutional Shares, and Institutional Plus Shares are designed for investors who meet certain administrative, service, and account-size criteria. Prior to October 24, 2014, the fund offered Signal Shares. Effective October 24, 2014, the Signal Shares were converted to Admiral Shares.
A. The following significant accounting policies conform to generally accepted accounting principles for U.S. investment companies. The fund consistently follows such policies in preparing its financial statements.
1. Security Valuation: Securities are valued as of the close of trading on the New York Stock Exchange (generally 4 p.m., Eastern time) on the valuation date. Equity securities are valued at the latest quoted sales prices or official closing prices taken from the primary market in which each security trades; such securities not traded on the valuation date are valued at the mean of the latest quoted bid and asked prices. Securities for which market quotations are not readily available, or whose values have been materially affected by events occurring before the fund’s pricing time but after the close of the securities’ primary markets, are valued by methods deemed by the board of trustees to represent fair value. Investments in Vanguard Market Liquidity Fund are valued at that fund’s net asset value. Temporary cash investments acquired over 60 days to maturity are valued using the latest bid prices or using valuations based on a matrix system (which considers such factors as security prices, yields, maturities, and ratings), both as furnished by independent pricing services. Other temporary cash investments are valued at amortized cost, which approximates market value.
2. Futures Contracts: The fund uses index futures contracts to a limited extent, with the objectives of maintaining full exposure to the stock market, enhancing returns, maintaining liquidity, and minimizing transaction costs. The fund may purchase futures contracts to immediately invest incoming cash in the market, or sell futures in response to cash outflows, thereby simulating a fully invested position in the underlying index while maintaining a cash balance for liquidity. The fund may seek to enhance returns by using futures contracts instead of the underlying securities when futures are believed to be priced more attractively than the underlying securities. The primary risks associated with the use of futures contracts are imperfect correlation between changes in market values of stocks held by the fund and the prices of futures contracts, and the possibility of an illiquid market. Counterparty risk involving futures is mitigated because a regulated clearinghouse is the counterparty instead of the clearing broker. To further mitigate counterparty risk, the fund trades futures contracts on an exchange, monitors the financial strength of its clearing brokers and clearinghouse, and has entered into clearing agreements with its clearing brokers. The clearinghouse imposes initial margin requirements to secure the fund’s performance and requires daily settlement of variation margin representing changes in the market value of each contract.
Futures contracts are valued at their quoted daily settlement prices. The aggregate settlement values of the contracts are not recorded in the Statement of Net Assets. Fluctuations in the value of the contracts are recorded in the Statement of Net Assets as an asset (liability) and in the Statement of Operations as unrealized appreciation (depreciation) until the contracts are closed, when they are recorded as realized futures gains (losses).
27
Small-Cap Index Fund
During the year ended December 31, 2015, the fund’s average investments in long and short futures contracts represented less than 1% and 0% of net assets, respectively, based on the average of aggregate settlement values at each quarter-end during the period.
3. Swap Contracts: The fund has entered into equity swap contracts to earn the total return on selected reference stocks in the fund’s target index. Under the terms of the swaps, the fund receives the total return on the referenced stock (i.e., receiving the increase or paying the decrease in value of the selected reference stock and receiving the equivalent of any dividends in respect of the selected referenced stock) over a specified period of time, applied to a notional amount that represents the value of a designated number of shares of the selected reference stock at the beginning of the equity swap contract. The fund also pays a floating rate that is based on short-term interest rates, applied to the notional amount. At the same time, the fund invests an amount approximating the notional amount of the swap in high-quality temporary cash investments.
The notional amounts of swap contracts are not recorded in the Statement of Net Assets. Swaps are valued daily based on market quotations received from independent pricing services or recognized dealers and the change in value is recorded in the Statement of Net Assets as an asset (liability) and in the Statement of Operations as unrealized appreciation (depreciation) until termination of the swap, at which time realized gain (loss) is recorded. A risk associated with all types of swaps is the possibility that a counterparty may default on its obligation to pay net amounts due to the fund. The fund’s maximum amount subject to counterparty risk is the unrealized appreciation on the swap contract. The fund mitigates its counterparty risk by entering into swaps only with a diverse group of prequalified counterparties, monitoring their financial strength, entering into master netting arrangements with its counterparties, and requiring its counterparties to transfer collateral as security for their performance. In the event of a counterparty’s default (including bankruptcy), the fund may terminate any swap contracts with that counterparty, determine the net amount owed by either party in accordance with its master netting arrangements, and sell or retain any collateral held up to the net amount owed to the fund under the master netting arrangements. The swap contracts contain provisions whereby a counterparty may terminate open contracts if the fund net assets decline below a certain level, triggering a payment by the fund if the fund is in a net liability position at the time of the termination. The payment amount would be reduced by any collateral the fund has pledged. Any securities pledged as collateral for open contracts are noted in the Statement of Net Assets. The value of collateral received or pledged is compared daily to the value of the swap contracts exposure with each counterparty, and any difference, if in excess of a specified minimum transfer amount, is adjusted and settled within two business days.
During the year ended December 31, 2015, the fund’s average amounts of investments in total return swaps represented less than 1% of net assets, based on the average of notional amounts at each quarter-end during the period.
4. Federal Income Taxes: The fund intends to continue to qualify as a regulated investment company and distribute all of its taxable income. Management has analyzed the fund’s tax positions taken for all open federal income tax years (December 31, 2012–2015), and has concluded that no provision for federal income tax is required in the fund’s financial statements.
5. Distributions: Distributions to shareholders are recorded on the ex-dividend date.
28
Small-Cap Index Fund
6. Securities Lending: To earn additional income, the fund lends its securities to qualified institutional borrowers. Security loans are subject to termination by the fund at any time and are required to be secured at all times by collateral in an amount at least equal to the market value of securities loaned. Daily market fluctuations could cause the value of loaned securities to be more or less than the value of the collateral received. When this occurs, the collateral is adjusted and settled on the next business day. The fund further mitigates its counterparty risk by entering into securities lending transactions only with a diverse group of prequalified counterparties, monitoring their financial strength, and entering into master securities lending agreements with its counterparties. The master securities lending agreements provide that, in the event of a counterparty’s default (including bankruptcy), the fund may terminate any loans with that borrower, determine the net amount owed, and sell or retain the collateral up to the net amount owed to the fund; however, such actions may be subject to legal proceedings. While collateral mitigates counterparty risk, in the absence of a default the fund may experience delays and costs in recovering the securities loaned. The fund invests cash collateral received in Vanguard Market Liquidity Fund, and records a liability in the Statement of Net Assets for the return of the collateral, during the period the securities are on loan. Securities lending income represents fees charged to borrowers plus income earned on invested cash collateral, less expenses associated with the loan.
7. Credit Facility: The fund and certain other funds managed by The Vanguard Group (“Vanguard”) participate in a $3 billion committed credit facility provided by a syndicate of lenders pursuant to a credit agreement that may be renewed annually; each fund is individually liable for its borrowings, if any, under the credit facility. Borrowings may be utilized for temporary and emergency purposes, and are subject to the fund’s regulatory and contractual borrowing restrictions. The participating funds are charged administrative fees and an annual commitment fee of 0.06% of the undrawn amount of the facility; these fees are allocated to the funds based on a method approved by the fund’s board of trustees and included in Management and Administrative expenses on the fund’s Statement of Operations. Any borrowings under this facility bear interest at a rate equal to the higher of the federal funds rate or LIBOR reference rate plus an agreed-upon spread.
The fund had no borrowings outstanding at December 31, 2015, or at any time during the period then ended.
8. Other: Dividend income is recorded on the ex-dividend date. Interest income includes income distributions received from Vanguard Market Liquidity Fund and is accrued daily. Premiums and discounts on debt securities purchased are amortized and accreted, respectively, to interest income over the lives of the respective securities. Security transactions are accounted for on the date securities are bought or sold. Costs used to determine realized gains (losses) on the sale of investment securities are those of the specific securities sold.
Each class of shares has equal rights as to assets and earnings, except that each class separately bears certain class-specific expenses related to maintenance of shareholder accounts (included in Management and Administrative expenses) and shareholder reporting. Marketing and distribution expenses are allocated to each class of shares based on a method approved by the board of trustees. Income, other non-class-specific expenses, and gains and losses on investments are allocated to each class of shares based on its relative net assets.
29
Small-Cap Index Fund
B. In accordance with the terms of a Funds’ Service Agreement (the “FSA”) between Vanguard and the fund, Vanguard furnishes to the fund investment advisory, corporate management, administrative, marketing, and distribution services at Vanguard’s cost of operations (as defined by the FSA). These costs of operations are allocated to the fund based on methods and guidelines approved by the board of trustees. Vanguard does not require reimbursement in the current period for certain costs of operations (such as deferred compensation/benefits and risk/insurance costs); the fund’s liability for these costs of operations is included in Payables to Vanguard on the Statement of Net Assets.
Upon the request of Vanguard, the fund may invest up to 0.40% of its net assets as capital in Vanguard. At December 31, 2015, the fund had contributed to Vanguard capital in the amount of $4,862,000, representing 0.01% of the fund’s net assets and 1.94% of Vanguard’s capitalization. The fund’s trustees and officers are also directors and employees, respectively, of Vanguard.
C. Various inputs may be used to determine the value of the fund’s investments. These inputs are summarized in three broad levels for financial statement purposes. The inputs or methodologies used to value securities are not necessarily an indication of the risk associated with investing in those securities.
Level 1—Quoted prices in active markets for identical securities.
Level 2—Other significant observable inputs (including quoted prices for similar securities, interest rates, prepayment speeds, credit risk, etc.).
Level 3—Significant unobservable inputs (including the fund’s own assumptions used to determine the fair value of investments).
The following table summarizes the market value of the fund’s investments as of December 31, 2015, based on the inputs used to value them:
| | | |
| | Level 1 | Level 2 | Level 3 |
| Investments | ($000) | ($000) | ($000) |
| Common Stocks | 53,677,439 | — | 2,366 |
| Temporary Cash Investments | 1,171,604 | 12,600 | — |
| Futures Contracts—Liabilities1 | (2,120) | — | — |
| Swap Contracts—Assets | — | 1,334 | — |
| Swap Contracts—Liabilities | — | (26) | — |
| Total | 54,846,923 | 13,908 | 2,366 |
| 1 Represents variation margin on the last day of the reporting period. | | | |
30
Small-Cap Index Fund
D. At December 31, 2015, the aggregate settlement value of open futures contracts and the related unrealized appreciation (depreciation) were:
| | | | |
| | | | | ($000) |
| | | | Aggregate | |
| | | Number of | Settlement | Unrealized |
| | | Long (Short) | Value | Appreciation |
| Futures Contracts | Expiration | Contracts | Long (Short) | (Depreciation) |
| E-mini Russell 2000 Index | March 2016 | 1,611 | 182,285 | 1,985 |
| E-mini S&P MidCap 400 Index | March 2016 | 225 | 31,354 | 146 |
| | | | | 2,131 |
Unrealized appreciation (depreciation) on open futures contracts is required to be treated as realized gain (loss) for tax purposes.
At December 31, 2015, the fund had the following open total return swap contracts:
| | | | | |
| | | | | Floating | Unrealized |
| | | | Notional | Interest Rate | Appreciation |
| | Termination | | Amount | Received | (Depreciation) |
| Reference Entity | Date | Counterparty | ($000) | (Paid) | ($000) |
| Ambac Financial Group Inc. | 1/11/16 | GSBUSA | 3,252 | (0.693%) | (26) |
| Empire State Realty Trust Inc. | 2/17/16 | GSBUSA | 12,207 | (0.695%) | 388 |
| SLM Corp. | 3/24/16 | GSI | 29,302 | (0.818%) | 946 |
| | | | | | 1,308 |
| GSBUSA—Goldman Sachs Bank USA. | | | | | |
| GSI—Goldman Sachs International. | | | | | |
At December 31, 2015, the counterparty had deposited in segregated accounts securities with a value of $1,462,000 in connection with amounts due to the fund for open swap contracts.
E. Distributions are determined on a tax basis and may differ from net investment income and realized capital gains for financial reporting purposes. Differences may be permanent or temporary. Permanent differences are reclassified among capital accounts in the financial statements to reflect their tax character. Temporary differences arise when certain items of income, expense, gain, or loss are recognized in different periods for financial statement and tax purposes. These differences will reverse at some time in the future. Differences in classification may also result from the treatment of short-term gains as ordinary income for tax purposes.
Certain of the fund’s investments are in securities considered to be passive foreign investment companies, for which any unrealized appreciation and/or realized gains are required to be included in distributable net income for tax purposes. During the year ended December 31, 2015, the fund realized gains on the sale of passive foreign investment companies of $335,000, which have been included in current and prior periods’ taxable income; accordingly, such gains have been reclassified from accumulated net realized losses to overdistributed net investment income. Passive foreign investment companies held at December 31, 2015, had unrealized appreciation of $7,784,000, all of which has been distributed and is reflected in the balance of overdistributed net investment income.
31
Small-Cap Index Fund
During the year ended December 31, 2015, the fund realized $3,204,238,000 of net capital gains resulting from in-kind redemptions—in which shareholders exchanged fund shares for securities held by the fund rather than for cash. Because such gains are not taxable to the fund, and are not distributed to shareholders, they have been reclassified from accumulated net realized losses to paid-in capital.
Realized and unrealized gains (losses) on certain of the fund’s swap contracts are treated as ordinary income (loss) for tax purposes. Realized losses of $20,006,000 on swap contracts have been reclassified from accumulated net realized losses to overdistributed net investment income.
For tax purposes, at December 31, 2015, the fund had $12,678,000 of ordinary income available for distribution. At December 31, 2015, the fund had available capital losses totaling $2,428,148,000 to offset future net capital gains. Of this amount, $946,157,000 is subject to expiration dates; $342,008,000 may be used to offset future net capital gains through December 31, 2017, and $604,149,000 through December 31, 2018. Capital losses of $1,481,991,000 realized beginning in fiscal 2011 may be carried forward indefinitely under the Regulated Investment Company Modernization Act of 2010, but must be used before any expiring loss carryforwards.
At December 31, 2015, the cost of investment securities for tax purposes was $47,048,070,000. Net unrealized appreciation of investment securities for tax purposes was $7,815,939,000, consisting of unrealized gains of $12,587,003,000 on securities that had risen in value since their purchase and $4,771,064,000 in unrealized losses on securities that had fallen in value since their purchase.
F. During the year ended December 31, 2015, the fund purchased $18,555,526,000 of investment securities and sold $12,142,217,000 of investment securities, other than temporary cash investments. Purchases and sales include $8,511,788,000 and $6,363,001,000, respectively, in connection with in-kind purchases and redemptions of the fund’s capital shares.
G. Capital share transactions for each class of shares were:
| | | | |
| | | | Year Ended December 31, |
| | | 2015 | | 2014 |
| | Amount | Shares | Amount | Shares |
| | ($000) | (000) | ($000) | (000) |
| Investor Shares | | | | |
| Issued | 789,795 | 13,998 | 851,229 | 15,868 |
| Issued in Lieu of Cash Distributions | 52,866 | 995 | 55,933 | 1,007 |
| Redeemed | (1,186,778) | (20,951) | (1,620,686) | (30,084) |
| Net Increase (Decrease)—Investor Shares | (344,117) | (5,958) | (713,524) | (13,209) |
| ETF Shares | | | | |
| Issued | 8,612,974 | 73,729 | 5,781,785 | 50,837 |
| Issued in Lieu of Cash Distributions | — | — | — | — |
| Redeemed | (6,347,608) | (54,375) | (4,708,494) | (41,200) |
| Net Increase (Decrease)—ETF Shares | 2,265,366 | 19,354 | 1,073,291 | 9,637 |
32
Small-Cap Index Fund
| | | | |
| | | | Year Ended December 31, |
| | | 2015 | | 2014 |
| | Amount | Shares | Amount | Shares |
| | ($000) | (000) | ($000) | (000) |
| Admiral Shares | | | | |
| Issued1 | 5,433,397 | 96,234 | 10,602,930 | 197,427 |
| Issued in Lieu of Cash Distributions | 280,050 | 5,270 | 257,067 | 4,627 |
| Redeemed | (3,141,489) | (55,875) | (1,928,593) | (35,574) |
| Net Increase (Decrease) —Admiral Shares | 2,571,958 | 45,629 | 8,931,404 | 166,480 |
| Signal Shares | | | | |
| Issued | — | — | 1,290,733 | 26,829 |
| Issued in Lieu of Cash Distributions | — | — | 563 | 12 |
| Redeemed1 | — | — | (8,764,511) | (181,622) |
| Net Increase (Decrease)—Signal Shares | — | — | (7,473,215) | (154,781) |
| Institutional Shares | | | | |
| Issued | 2,887,916 | 51,179 | 2,788,243 | 51,626 |
| Issued in Lieu of Cash Distributions | 139,432 | 2,624 | 127,690 | 2,297 |
| Redeemed | (2,422,081) | (43,144) | (2,681,597) | (49,632) |
| Net Increase (Decrease) —Institutional Shares | 605,267 | 10,659 | 234,336 | 4,291 |
| Institutional Plus Shares | | | | |
| Issued | 2,240,610 | 13,600 | 2,060,025 | 13,223 |
| Issued in Lieu of Cash Distributions | 97,241 | 634 | 86,737 | 541 |
| Redeemed | (1,032,375) | (6,361) | (752,155) | (4,820) |
| Net Increase (Decrease) —Institutional Plus Shares | 1,305,476 | 7,873 | 1,394,607 | 8,944 |
1 Admiral Shares Issued and Signal Shares Redeemed include $4,639,074,000 from the conversion of Signal Shares to Admiral Shares during the 2014 fiscal year.
H. Management has determined that no material events or transactions occurred subsequent to December 31, 2015, that would require recognition or disclosure in these financial statements.
33
| | | | |
| Small-Cap Growth Index Fund | | | |
| |
| |
| Fund Profile | | | | |
| As of December 31, 2015 | | | | |
| |
| Share-Class Characteristics | | | | |
| | Investor | | Admiral | Institutional |
| | Shares | ETF Shares | Shares | Shares |
| Ticker Symbol | VISGX | VBK | VSGAX | VSGIX |
| Expense Ratio1 | 0.23% | 0.09% | 0.09% | 0.08% |
| 30-Day SEC Yield | 0.87% | 1.00% | 1.00% | 1.00% |
| | | |
| Portfolio Characteristics | | |
| | | | DJ |
| | | CRSP US | U.S. |
| | | Small Cap | Total |
| | | Growth | Market |
| | Fund | Index | FA Index |
| Number of Stocks | 740 | 721 | 3,960 |
| Median Market Cap | $3.2B | $3.2B | $51.4B |
| Price/Earnings Ratio | 45.5x | 45.5x | 21.9x |
| Price/Book Ratio | 3.2x | 3.2x | 2.7x |
| Return on Equity | 12.7% | 12.9% | 17.2% |
| Earnings Growth | | | |
| Rate | 14.3% | 14.3% | 9.5% |
| Dividend Yield | 1.1% | 1.1% | 2.1% |
| Foreign Holdings | 0.0% | 0.0% | 0.0% |
| Turnover Rate | 23% | — | — |
| Short-Term | | | |
| Reserves | 0.0% | — | — |
| |
| Sector Diversification (% of equity exposure) |
| | | CRSP US | DJ |
| | | Small Cap | U.S. Total |
| | | Growth | Market |
| | Fund | Index | FA Index |
| Basic Materials | 1.5% | 1.5% | 2.3% |
| Consumer Goods | 8.2 | 8.3 | 10.3 |
| Consumer Services | 14.2 | 14.2 | 14.2 |
| Financials | 21.4 | 21.4 | 19.5 |
| Health Care | 17.2 | 17.2 | 14.0 |
| Industrials | 17.0 | 17.0 | 12.2 |
| Oil & Gas | 2.6 | 2.6 | 5.9 |
| Technology | 16.9 | 16.9 | 16.4 |
| Telecommunications | 0.2 | 0.1 | 2.2 |
| Utilities | 0.8 | 0.8 | 3.0 |
| | |
| Volatility Measures | | |
| | | DJ |
| | Spliced | U.S. Total |
| | Small-Cap | Market |
| | Growth Index | FA Index |
| R-Squared | 1.00 | 0.74 |
| Beta | 1.00 | 1.04 |
These measures show the degree and timing of the fund’s fluctuations compared with the indexes over 36 months.
Ten Largest Holdings (% of total net assets)
| | |
| Ionis Pharmaceuticals | | |
| Inc. | Biotechnology | 0.6% |
| Signature Bank | Banks | 0.6 |
| Waste Connections Inc. | Waste & Disposal | |
| | Services | 0.6 |
| United Therapeutics | | |
| Corp. | Biotechnology | 0.6 |
| MEDNAX Inc. | Health Care | |
| | Providers | 0.5 |
| Regency Centers Corp. | Retail REITs | 0.5 |
| CoStar Group Inc. | Business Support | |
| | Services | 0.5 |
| DexCom Inc. | Business Support | |
| | Services | 0.5 |
| athenahealth Inc. | Software | 0.5 |
| Jack Henry & Associates Financial | |
| Inc. | Administration | 0.5 |
| Top Ten | | 5.4% |
The holdings listed exclude any temporary cash investments and equity index products.
1 The expense ratios shown are from the prospectus dated April 28, 2015, and represent estimated costs for the current fiscal year. For the fiscal year ended December 31, 2015, the expense ratios were 0.20% for Investor Shares, 0.08% for ETF Shares, 0.08% for Admiral Shares, and 0.07% for Institutional Shares.
34
Small-Cap Growth Index Fund
Investment Focus

35
Small-Cap Growth Index Fund
Performance Summary
All of the returns in this report represent past performance, which is not a guarantee of future results that may be achieved by the fund. (Current performance may be lower or higher than the performance data cited. For performance data current to the most recent month-end, visit our website at vanguard.com/performance.) Note, too, that both investment returns and principal value can fluctuate widely, so an investor’s shares, when sold, could be worth more or less than their original cost. The returns shown do not reflect taxes that a shareholder would pay on fund distributions or on the sale of fund shares.
Cumulative Performance: December 31, 2005, Through December 31, 2015
Initial Investment of $10,000
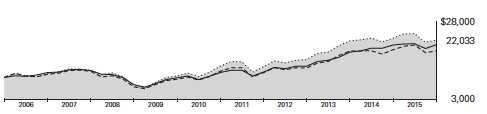
| | | | | |
| | | | Average Annual Total Returns | |
| | | Periods Ended December 31, 2015 | |
| |
| | | | | | Final Value |
| | | One | Five | Ten | of a $10,000 |
| | | Year | Years | Years | Investment |
| |
| | Small-Cap Growth Index | | | | |
| | Fund*Investor Shares | -2.64% | 10.05% | 8.22% | $22,033 |
| |
| •••••••• | Spliced Small-Cap Growth Index | -2.60 | 10.09 | 8.25 | 22,089 |
| |
| – – – – | Small-Cap Growth Funds Average | -2.24 | 9.10 | 6.36 | 18,532 |
| | Dow Jones U.S. Total Stock Market | | | | |
| | Float Adjusted Index | 0.44 | 12.14 | 7.48 | 20,563 |
For a benchmark description, see the Glossary.
Small-Cap Growth Funds Average: Derived from data provided by Lipper, a Thomson Reuters Company.
| | | | |
| | | | | Final Value |
| | One | Five | Ten | of a $10,000 |
| | Year | Years | Years | Investment |
| Small-Cap Growth Index Fund | | | | |
| ETF Shares Net Asset Value | -2.51% | 10.20% | 8.36% | $22,317 |
| Spliced Small-Cap Growth Index | -2.60 | 10.09 | 8.25 | 22,089 |
| Dow Jones U.S. Total Stock Market Float | | | | |
| Adjusted Index | 0.44 | 12.14 | 7.48 | 20,563 |
See Financial Highlights for dividend and capital gains information.
36
| | | |
| Small-Cap Growth Index Fund | | | |
| |
| |
| |
| | Average Annual Total Returns | |
| | Periods Ended December 31, 2015 | |
| | | Since | Final Value |
| | One | Inception | of a $10,000 |
| | Year | (9/27/2011) | Investment |
| Small-Cap Growth Index Fund Admiral Shares | -2.52% | 14.50% | $17,805 |
| Spliced Small-Cap Growth Index | -2.60 | 14.38 | 17,726 |
| Dow Jones U.S. Total Stock Market Float | | | |
| Adjusted Index | 0.44 | 16.09 | 18,884 |
| "Since Inception" performance is calculated from the Admiral Shares’ inception date for both the fund and its comparative standards. |
| | | | |
| | | | | Final Value |
| | One | Five | Ten | of a $5,000,000 |
| | Year | Years | Years | Investment |
| Small-Cap Growth Index Fund Institutional | | | | |
| Shares | -2.52% | 10.21% | 8.39% | $11,191,118 |
| Spliced Small-Cap Growth Index | -2.60 | 10.09 | 8.25 | 11,044,293 |
| Dow Jones U.S. Total Stock Market Float | | | | |
| Adjusted Index | 0.44 | 12.14 | 7.48 | 10,281,716 |
| |
| |
| |
| Cumulative Returns of ETF Shares: December 31, 2005, Through December 31, 2015 | |
| | | One | Five | Ten |
| | | Year | Years | Years |
| Small-Cap Growth Index Fund ETF Shares Market | | | | |
| Price | | -2.57% | 62.33% | 123.35% |
| Small-Cap Growth Index Fund ETF Shares Net | | | | |
| Asset Value | | -2.51 | 62.54 | 123.17 |
| Spliced Small-Cap Growth Index | | -2.60 | 61.71 | 120.89 |
37
Small-Cap Growth Index Fund
Fiscal-Year Total Returns (%): December 31, 2005, Through December 31, 2015

|
| Small-Cap Growth Index Fund Investor Shares |
| Spliced Small-Cap Growth Index |
| For a benchmark description, see the Glossary. |
38
Small-Cap Growth Index Fund
Financial Statements
Statement of Net Assets—Investments Summary
As of December 31, 2015
This Statement summarizes the fund’s holdings by asset type. Details are reported for each of the fund’s 50 largest individual holdings and for investments that, in total for any issuer, represent more than 1% of the fund’s net assets. The total value of smaller holdings is reported as a single amount within each category.
The fund reports a complete list of its holdings in regulatory filings four times in each fiscal year, at the quarter-ends. For the second and fourth fiscal quarters, the complete listing of the fund’s holdings is available electronically on vanguard.com and on the Securities and Exchange Commission’s website (sec.gov), or you can have it mailed to you without charge by calling 800-662-7447. For the first and third fiscal quarters, the fund files the lists with the SEC on Form N-Q. Shareholders can look up the fund’s Forms N-Q on the SEC’s website. Forms N-Q may also be reviewed and copied at the SEC’s Public Reference Room (see the back cover of this report for further information).
| | | |
| | | Market | Percentage |
| | | Value• | of Net |
| | Shares | ($000) | Assets |
| Common Stocks | | | |
| Basic Materials † | | 229,660 | 1.5% |
| |
| Consumer Goods | | | |
| * Middleby Corp. | 703,886 | 75,928 | 0.5% |
| * Toll Brothers Inc. | 1,948,209 | 64,875 | 0.4% |
| Gentex Corp. | 3,559,142 | 56,982 | 0.4% |
| Brunswick Corp. | 1,118,244 | 56,482 | 0.4% |
| Carter’s Inc. | 606,280 | 53,977 | 0.4% |
| * Tempur Sealy International Inc. | 764,391 | 53,859 | 0.3% |
| Consumer Goods—Other † | | 878,963 | 5.8% |
| | | 1,241,066 | 8.2% |
| Consumer Services | | | |
| Domino’s Pizza Inc. | 671,241 | 74,676 | 0.5% |
| Vail Resorts Inc. | 448,780 | 57,439 | 0.4% |
| * Panera Bread Co. Class A | 292,116 | 56,898 | 0.4% |
| * AMC Networks Inc. Class A | 748,216 | 55,877 | 0.3% |
| Consumer Services—Other † | | 1,894,551 | 12.5% |
| | | 2,139,441 | 14.1% |
| Financials | | | |
| * Signature Bank | 586,914 | 90,015 | 0.6% |
| Regency Centers Corp. | 1,156,126 | 78,755 | 0.5% |
| * SVB Financial Group | 632,383 | 75,190 | 0.5% |
| Kilroy Realty Corp. | 1,132,286 | 71,651 | 0.5% |
| WP Carey Inc. | 1,153,626 | 68,064 | 0.5% |
| CBOE Holdings Inc. | 1,012,409 | 65,705 | 0.4% |
| * Forest City Enterprises Inc. Class A | 2,957,792 | 64,864 | 0.4% |
| DDR Corp. | 3,780,036 | 63,656 | 0.4% |
| Equity LifeStyle Properties Inc. | 931,528 | 62,105 | 0.4% |
| CubeSmart | 2,012,363 | 61,619 | 0.4% |
| Lamar Advertising Co. Class A | 1,006,598 | 60,376 | 0.4% |
| American Campus Communities Inc. | 1,379,291 | 57,020 | 0.4% |
39
| | | | |
| Small-Cap Growth Index Fund | | | |
| |
| |
| |
| | | | Market | Percentage |
| | | | Value• | of Net |
| | | Shares | ($000) | Assets |
| | Douglas Emmett Inc. | 1,712,205 | 53,387 | 0.4% |
| | Financials—Other † | | 2,357,141 | 15.6% |
| | | | 3,229,548 | 21.4% |
| Health Care | | | |
| * | Ionis Pharmaceuticals Inc. | 1,474,889 | 91,340 | 0.6% |
| * | United Therapeutics Corp. | 532,366 | 83,374 | 0.6% |
| * | MEDNAX Inc. | 1,154,603 | 82,739 | 0.5% |
| * | DexCom Inc. | 948,212 | 77,659 | 0.5% |
| * | Sirona Dental Systems Inc. | 686,306 | 75,199 | 0.5% |
| * | Dyax Corp. | 1,806,681 | 67,967 | 0.4% |
| * | Neurocrine Biosciences Inc. | 1,058,324 | 59,869 | 0.4% |
| * | Align Technology Inc. | 829,550 | 54,626 | 0.4% |
| * | Seattle Genetics Inc. | 1,198,733 | 53,799 | 0.4% |
| | Health Care—Other † | | 1,957,999 | 12.9% |
| | | | 2,604,571 | 17.2% |
| Industrials | | | |
| | Waste Connections Inc. | 1,502,373 | 84,614 | 0.6% |
| * | CoStar Group Inc. | 378,933 | 78,322 | 0.5% |
| | Jack Henry & Associates Inc. | 981,424 | 76,610 | 0.5% |
| * | HD Supply Holdings Inc. | 2,445,238 | 73,430 | 0.5% |
| | AO Smith Corp. | 919,531 | 70,445 | 0.5% |
| | Lennox International Inc. | 525,532 | 65,639 | 0.4% |
| * | Keysight Technologies Inc. | 2,080,710 | 58,947 | 0.4% |
| | Hexcel Corp. | 1,160,078 | 53,886 | 0.3% |
| | Industrials—Other † | | 2,009,059 | 13.3% |
| | | | 2,570,952 | 17.0% |
| Oil & Gas | | | |
| * | Diamondback Energy Inc. | 818,686 | 54,770 | 0.3% |
| | Oil & Gas—Other † | | 343,617 | 2.3% |
| | | | 398,387 | 2.6% |
| |
| 1Other † | | — | 0.0% |
| |
| Technology | | | |
| * | athenahealth Inc. | 476,872 | 76,762 | 0.5% |
| * | Cadence Design Systems Inc. | 3,653,538 | 76,030 | 0.5% |
| | SS&C Technologies Holdings Inc. | 1,014,940 | 69,290 | 0.5% |
| * | Tyler Technologies Inc. | 375,038 | 65,377 | 0.4% |
| * | Ultimate Software Group Inc. | 334,322 | 65,363 | 0.4% |
| * | Manhattan Associates Inc. | 897,286 | 59,373 | 0.4% |
| | IAC/InterActiveCorp | 948,152 | 56,937 | 0.4% |
| * | Fortinet Inc. | 1,798,199 | 56,050 | 0.4% |
| | Technology—Other † | | 2,034,476 | 13.4% |
| | | | 2,559,658 | 16.9% |
| |
| Telecommunications † | | 21,504 | 0.2% |
| |
| Utilities | | | |
| | ITC Holdings Corp. | 1,883,629 | 73,932 | 0.5% |
| | Utilities—Other † | | 42,447 | 0.3% |
| | | | 116,379 | 0.8% |
| Total Common Stocks (Cost $12,948,157) | | 15,111,166 | 99.9%2 |
40
| | | | |
| Small-Cap Growth Index Fund | | | | |
| |
| |
| |
| | | | Market | Percentage |
| | | | Value• | of Net |
| | Coupon | Shares | ($000) | Assets |
| Temporary Cash Investments | | | | |
| Money Market Fund | | | | |
| 3,4 Vanguard Market Liquidity Fund | 0.363% | 408,781,607 | 408,782 | 2.7% |
| |
| 5U.S. Government and Agency Obligations † | | | 3,197 | 0.0% |
| Total Temporary Cash Investments (Cost $411,979) | | | 411,979 | 2.7%2 |
| 6Total Investments (Cost $13,360,136) | | | 15,523,145 | 102.6% |
| |
| | | | Amount | |
| | | | ($000) | |
| Other Assets and Liabilities | | | | |
| Other Assets | | | | |
| Investment in Vanguard | | | 1,358 | |
| Receivables for Investment Securities Sold | | | 714 | |
| Receivables for Accrued Income | | | 19,798 | |
| Receivables for Capital Shares Issued | | | 16,751 | |
| Other Assets | | | 603 | |
| Total Other Assets | | | 39,224 | 0.2% |
| Liabilities | | | | |
| Payables for Investment Securities Purchased | | | (24,675) | |
| Collateral for Securities on Loan | | | (353,007) | |
| Payables for Capital Shares Redeemed | | | (39,096) | |
| Payables to Vanguard | | | (10,641) | |
| Other Liabilities | | | (636) | |
| Total Liabilities | | | (428,055) | (2.8%) |
| Net Assets | | | 15,134,314 | 100.0% |
| |
| |
| At December 31, 2015, net assets consisted of: | | | | |
| | | | | Amount |
| | | | | ($000) |
| Paid-in Capital | | | | 14,155,518 |
| Overdistributed Net Investment Income | | | | (4,790) |
| Accumulated Net Realized Losses | | | | (1,180,099) |
| Unrealized Appreciation (Depreciation) | | | | |
| Investment Securities | | | | 2,163,009 |
| Futures Contracts | | | | 676 |
| Net Assets | | | | 15,134,314 |
| |
| |
| Investor Shares—Net Assets | | | | |
| Applicable to 58,097,511 outstanding $.001 par value shares of | | | |
| beneficial interest (unlimited authorization) | | | | 1,986,042 |
| Net Asset Value Per Share—Investor Shares | | | | $34.18 |
41
| |
| Small-Cap Growth Index Fund | |
| |
| |
| |
| | Amount |
| | ($000) |
| ETF Shares—Net Assets | |
| Applicable to 36,390,036 outstanding $.001 par value shares of | |
| beneficial interest (unlimited authorization) | 4,422,311 |
| Net Asset Value Per Share—ETF Shares | $121.53 |
| |
| Admiral Shares—Net Assets | |
| Applicable to 138,846,989 outstanding $.001 par value shares of | |
| beneficial interest (unlimited authorization) | 5,933,143 |
| Net Asset Value Per Share—Admiral Shares | $42.73 |
| |
| Institutional Shares—Net Assets | |
| Applicable to 81,609,263 outstanding $.001 par value shares of | |
| beneficial interest (unlimited authorization) | 2,792,818 |
| Net Asset Value Per Share—Institutional Shares | $34.22 |
• See Note A in Notes to Financial Statements.
* Non-income-producing security.
† Represents the aggregate value, by category, of securities that are not among the 50 largest holdings and, in total for any issuer, represent 1% or less of net assets.
1 “Other” represents securities that are not classified by the fund’s benchmark index.
2 The fund invests a portion of its cash reserves in equity markets through the use of index futures contracts. After giving effect to futures investments, the fund’s effective common stock and temporary cash investment positions represent 100.1% and 2.5%, respectively, of net assets.
3 Affiliated money market fund available only to Vanguard funds and certain trusts and accounts managed by Vanguard. Rate shown is the 7-day yield.
4 Includes $353,007,000 of collateral received for securities on loan.
5 Securities with a value of $2,398,000 have been segregated as initial margin for open futures contracts.
6 The total value of securities on loan is $333,291,000.
See accompanying Notes, which are an integral part of the Financial Statements.
42
| |
| Small-Cap Growth Index Fund | |
| |
| |
| Statement of Operations | |
| |
| | Year Ended |
| | December 31, 2015 |
| | ($000) |
| Investment Income | |
| Income | |
| Dividends | 143,813 |
| Interest1 | 92 |
| Securities Lending | 22,208 |
| Total Income | 166,113 |
| Expenses | |
| The Vanguard Group—Note B | |
| Investment Advisory Services | 1,775 |
| Management and Administrative—Investor Shares | 3,493 |
| Management and Administrative—ETF Shares | 2,257 |
| Management and Administrative—Admiral Shares | 3,004 |
| Management and Administrative—Institutional Shares | 1,578 |
| Marketing and Distribution—Investor Shares | 581 |
| Marketing and Distribution—ETF Shares | 394 |
| Marketing and Distribution—Admiral Shares | 775 |
| Marketing and Distribution—Institutional Shares | 273 |
| Custodian Fees | 340 |
| Auditing Fees | 41 |
| Shareholders’ Reports—Investor Shares | 60 |
| Shareholders’ Reports—ETF Shares | 239 |
| Shareholders’ Reports—Admiral Shares | 68 |
| Shareholders’ Reports—Institutional Shares | 65 |
| Trustees’ Fees and Expenses | 12 |
| Total Expenses | 14,955 |
| Net Investment Income | 151,158 |
| Realized Net Gain (Loss) | |
| Investment Securities Sold | 1,021,706 |
| Futures Contracts | (804) |
| Swap Contracts | (455) |
| Realized Net Gain (Loss) | 1,020,447 |
| Change in Unrealized Appreciation (Depreciation) | |
| Investment Securities | (1,652,389) |
| Futures Contracts | (308) |
| Change in Unrealized Appreciation (Depreciation) | (1,652,697) |
| Net Increase (Decrease) in Net Assets Resulting from Operations | (481,092) |
| 1 Interest income from an affiliated company of the fund was $85,000. | |
| |
| |
| See accompanying Notes, which are an integral part of the Financial Statements. | |
43
| | |
| Small-Cap Growth Index Fund | | |
| |
| |
| Statement of Changes in Net Assets | | |
| |
| | Year Ended December 31, |
| | 2015 | 2014 |
| | ($000) | ($000) |
| Increase (Decrease) in Net Assets | | |
| Operations | | |
| Net Investment Income | 151,158 | 151,506 |
| Realized Net Gain (Loss) | 1,020,447 | 613,425 |
| Change in Unrealized Appreciation (Depreciation) | (1,652,697) | (165,944) |
| Net Increase (Decrease) in Net Assets Resulting from Operations | (481,092) | 598,987 |
| Distributions | | |
| Net Investment Income | | |
| Investor Shares | (17,081) | (20,119) |
| ETF Shares | (42,821) | (39,218) |
| Admiral Shares | (56,786) | (54,091) |
| Institutional Shares | (31,997) | (37,186) |
| Realized Capital Gain | | |
| Investor Shares | — | — |
| ETF Shares | — | — |
| Admiral Shares | — | — |
| Institutional Shares | — | — |
| Total Distributions | (148,685) | (150,614) |
| Capital Share Transactions | | |
| Investor Shares | (276,043) | (601,893) |
| ETF Shares | 689,690 | 141,108 |
| Admiral Shares | 738,083 | 399,387 |
| Institutional Shares | (732,337) | (242,092) |
| Net Increase (Decrease) from Capital Share Transactions | 419,393 | (303,490) |
| Total Increase (Decrease) | (210,384) | 144,883 |
| Net Assets | | |
| Beginning of Period | 15,344,698 | 15,199,815 |
| End of Period1 | 15,134,314 | 15,344,698 |
| 1 Net Assets—End of Period includes undistributed (overdistributed) net investment income of ($4,790,000) and ($6,808,000). | |
See accompanying Notes, which are an integral part of the Financial Statements.
44
| | | | | |
| Small-Cap Growth Index Fund | | | | | |
| |
| |
| Financial Highlights | | | | | |
| |
| |
| Investor Shares | | | | | |
| |
| For a Share Outstanding | | | Year Ended December 31, |
| Throughout Each Period | 2015 | 2014 | 2013 | 2012 | 2011 |
| Net Asset Value, Beginning of Period | $35.40 | $34.37 | $25.03 | $21.49 | $21.92 |
| Investment Operations | | | | | |
| Net Investment Income | . 292 | . 303 | .168 | .223 | .086 |
| Net Realized and Unrealized Gain (Loss) | | | | | |
| on Investments | (1.225) | 1.029 | 9.336 | 3.541 | (.431) |
| Total from Investment Operations | (.933) | 1.332 | 9.504 | 3.764 | (. 345) |
| Distributions | | | | | |
| Dividends from Net Investment Income | (.287) | (. 302) | (.164) | (.224) | (.085) |
| Distributions from Realized Capital Gains | — | — | — | — | — |
| Total Distributions | (.287) | (. 302) | (.164) | (.224) | (.085) |
| Net Asset Value, End of Period | $34.18 | $35.40 | $34.37 | $25.03 | $21.49 |
| |
| Total Return1 | -2.64% | 3.88% | 37.98% | 17.52% | -1.58% |
| |
| Ratios/Supplemental Data | | | | | |
| Net Assets, End of Period (Millions) | $1,986 | $2,326 | $2,859 | $2,649 | $2,613 |
| Ratio of Total Expenses to Average Net Assets | 0.20% | 0.23% | 0.24% | 0.24% | 0.24% |
| Ratio of Net Investment Income to | | | | | |
| Average Net Assets | 0.82% | 0.87% | 0.63% | 0.97% | 0.37% |
| Portfolio Turnover Rate2 | 23% | 26% | 50% | 37% | 40% |
1 Total returns do not include account service fees that may have applied in the periods shown. Fund prospectuses provide information about any applicable account service fees.
2 Excludes the value of portfolio securities received or delivered as a result of in-kind purchases or redemptions of the fund’s capital shares, including ETF Creation Units.
See accompanying Notes, which are an integral part of the Financial Statements.
45
| | | | | |
| Small-Cap Growth Index Fund | | | | | |
| |
| |
| Financial Highlights | | | | | |
| |
| |
| ETF Shares | | | | | |
| |
| For a Share Outstanding | | | Year Ended December 31, |
| Throughout Each Period | 2015 | 2014 | 2013 | 2012 | 2011 |
| Net Asset Value, Beginning of Period | $125.88 | $122.23 | $89.03 | $76.45 | $77.98 |
| Investment Operations | | | | | |
| Net Investment Income | 1.202 | 1.277 | .802 | .925 | .424 |
| Net Realized and Unrealized Gain (Loss) | | | | | |
| on Investments | (4.362) | 3.643 | 33.188 | 12.578 | (1.535) |
| Total from Investment Operations | (3.160) | 4.920 | 33.990 | 13.503 | (1.111) |
| Distributions | | | | | |
| Dividends from Net Investment Income | (1.190) | (1.270) | (.790) | (. 923) | (. 419) |
| Distributions from Realized Capital Gains | — | — | — | — | — |
| Total Distributions | (1.190) | (1.270) | (.790) | (. 923) | (. 419) |
| Net Asset Value, End of Period | $121.53 | $125.88 | $122.23 | $89.03 | $76.45 |
| |
| Total Return | -2.51% | 4.02% | 38.18% | 17.67% | -1.43% |
| |
| Ratios/Supplemental Data | | | | | |
| Net Assets, End of Period (Millions) | $4,422 | $3,900 | $3,637 | $2,209 | $1,857 |
| Ratio of Total Expenses to Average Net Assets | 0.08% | 0.09% | 0.09% | 0.10% | 0.10% |
| Ratio of Net Investment Income to | | | | | |
| Average Net Assets | 0.94% | 1.01% | 0.78% | 1.11% | 0.51% |
| Portfolio Turnover Rate1 | 23% | 26% | 50% | 37% | 40% |
1 Excludes the value of portfolio securities received or delivered as a result of in-kind purchases or redemptions of the fund’s capital shares, including ETF Creation Units.
See accompanying Notes, which are an integral part of the Financial Statements.
46
| | | | | |
| Small-Cap Growth Index Fund | | | | | |
| |
| |
| Financial Highlights | | | | | |
| |
| |
| Admiral Shares | | | | | |
| | | | | | |
| | | | | | Sept. 27, |
| | | Year Ended December 31, | 20111 to |
| For a Share Outstanding | | | | | Dec. 31, |
| Throughout Each Period | 2015 | 2014 | 2013 | 2012 | 2011 |
| Net Asset Value, Beginning of Period | $44.26 | $42.98 | $31.30 | $26.88 | $25.00 |
| Investment Operations | | | | | |
| Net Investment Income | . 421 | .449 | .284 | .326 | .031 |
| Net Realized and Unrealized Gain (Loss) | | | | | |
| on Investments | (1.534) | 1.277 | 11.676 | 4.420 | 1.962 |
| Total from Investment Operations | (1.113) | 1.726 | 11.960 | 4.746 | 1.993 |
| Distributions | | | | | |
| Dividends from Net Investment Income | (.417) | (.446) | (. 280) | (. 326) | (.113) |
| Distributions from Realized Capital Gains | — | — | — | — | — |
| Total Distributions | (.417) | (.446) | (. 280) | (. 326) | (.113) |
| Net Asset Value, End of Period | $42.73 | $44.26 | $42.98 | $31.30 | $26.88 |
| |
| Total Return2 | -2.52% | 4.02% | 38.22% | 17.66% | 7.97% |
| |
| Ratios/Supplemental Data | | | | | |
| Net Assets, End of Period (Millions) | $5,933 | $5,434 | $4,881 | $2,539 | $1,781 |
| Ratio of Total Expenses to Average Net Assets | 0.08% | 0.09% | 0.09% | 0.10% | 0.10%3 |
| Ratio of Net Investment Income to | | | | | |
| Average Net Assets | 0.94% | 1.01% | 0.78% | 1.11% | 0.51%3 |
| Portfolio Turnover Rate 4 | 23% | 26% | 50% | 37% | 40% |
1 Inception.
2 Total returns do not include account service fees that may have applied in the periods shown. Fund prospectuses provide information about any applicable account service fees.
3 Annualized.
4 Excludes the value of portfolio securities received or delivered as a result of in-kind purchases or redemptions of the fund’s capital shares, including ETF Creation Units.
See accompanying Notes, which are an integral part of the Financial Statements.
47
| | | | | |
| Small-Cap Growth Index Fund | | | | | |
| |
| |
| Financial Highlights | | | | | |
| |
| |
| Institutional Shares | | | | | |
| |
| For a Share Outstanding | | | Year Ended December 31, |
| Throughout Each Period | 2015 | 2014 | 2013 | 2012 | 2011 |
| Net Asset Value, Beginning of Period | $35.45 | $34.42 | $25.07 | $21.53 | $21.96 |
| Investment Operations | | | | | |
| Net Investment Income | . 341 | .362 | .229 | .265 | .125 |
| Net Realized and Unrealized Gain (Loss) | | | | | |
| on Investments | (1.234) | 1.028 | 9.346 | 3.540 | (.432) |
| Total from Investment Operations | (.893) | 1.390 | 9.575 | 3.805 | (.307) |
| Distributions | | | | | |
| Dividends from Net Investment Income | (.337) | (. 360) | (. 225) | (. 265) | (.123) |
| Distributions from Realized Capital Gains | — | — | — | — | — |
| Total Distributions | (.337) | (. 360) | (. 225) | (. 265) | (.123) |
| Net Asset Value, End of Period | $34.22 | $35.45 | $34.42 | $25.07 | $21.53 |
| |
| Total Return | -2.52% | 4.04% | 38.20% | 17.68% | -1.40% |
| |
| Ratios/Supplemental Data | | | | | |
| Net Assets, End of Period (Millions) | $2,793 | $3,685 | $3,823 | $2,302 | $1,622 |
| Ratio of Total Expenses to Average Net Assets | 0.07% | 0.08% | 0.08% | 0.08% | 0.08% |
| Ratio of Net Investment Income to | | | | | |
| Average Net Assets | 0.95% | 1.02% | 0.79% | 1.13% | 0.53% |
| Portfolio Turnover Rate1 | 23% | 26% | 50% | 37% | 40% |
1 Excludes the value of portfolio securities received or delivered as a result of in-kind purchases or redemptions of the fund’s capital shares, including ETF Creation Units.
See accompanying Notes, which are an integral part of the Financial Statements.
48
Small-Cap Growth Index Fund
Notes to Financial Statements
Vanguard Small-Cap Growth Index Fund is registered under the Investment Company Act of 1940 as an open-end investment company, or mutual fund. The fund offers four classes of shares: Investor Shares, ETF Shares, Admiral Shares, and Institutional Shares. Investor Shares are available to any investor who meets the fund’s minimum purchase requirements. ETF Shares are listed for trading on NYSE Arca; they can be purchased and sold through a broker. Admiral Shares and Institutional Shares are designed for investors who meet certain administrative, service, and account-size criteria.
A. The following significant accounting policies conform to generally accepted accounting principles for U.S. investment companies. The fund consistently follows such policies in preparing its financial statements.
1. Security Valuation: Securities are valued as of the close of trading on the New York Stock Exchange (generally 4 p.m., Eastern time) on the valuation date. Equity securities are valued at the latest quoted sales prices or official closing prices taken from the primary market in which each security trades; such securities not traded on the valuation date are valued at the mean of the latest quoted bid and asked prices. Securities for which market quotations are not readily available, or whose values have been materially affected by events occurring before the fund’s pricing time but after the close of the securities’ primary markets, are valued by methods deemed by the board of trustees to represent fair value. Investments in Vanguard Market Liquidity Fund are valued at that fund’s net asset value. Temporary cash investments acquired over 60 days to maturity are valued using the latest bid prices or using valuations based on a matrix system (which considers such factors as security prices, yields, maturities, and ratings), both as furnished by independent pricing services. Other temporary cash investments are valued at amortized cost, which approximates market value.
2. Futures Contracts: The fund uses index futures contracts to a limited extent, with the objectives of maintaining full exposure to the stock market, enhancing returns, maintaining liquidity, and minimizing transaction costs. The fund may purchase futures contracts to immediately invest incoming cash in the market, or sell futures in response to cash outflows, thereby simulating a fully invested position in the underlying index while maintaining a cash balance for liquidity. The fund may seek to enhance returns by using futures contracts instead of the underlying securities when futures are believed to be priced more attractively than the underlying securities. The primary risks associated with the use of futures contracts are imperfect correlation between changes in market values of stocks held by the fund and the prices of futures contracts, and the possibility of an illiquid market. Counterparty risk involving futures is mitigated because a regulated clearinghouse is the counterparty instead of the clearing broker. To further mitigate counterparty risk, the fund trades futures contracts on an exchange, monitors the financial strength of its clearing brokers and clearinghouse, and has entered into clearing agreements with its clearing brokers. The clearinghouse imposes initial margin requirements to secure the fund’s performance and requires daily settlement of variation margin representing changes in the market value of each contract.
Futures contracts are valued at their quoted daily settlement prices. The aggregate settlement values of the contracts are not recorded in the Statement of Net Assets. Fluctuations in the value of the contracts are recorded in the Statement of Net Assets as an asset (liability) and in the Statement of Operations as unrealized appreciation (depreciation) until the contracts are closed, when they are recorded as realized futures gains (losses).
During the year ended December 31, 2015, the fund’s average investments in long and short futures contracts represented less than 1% and 0% of net assets, respectively, based on the average of aggregate settlement values at each quarter-end during the period.
49
Small-Cap Growth Index Fund
3. Swap Contracts: The fund has entered into equity swap contracts to earn the total return on selected reference stocks in the fund’s target index. Under the terms of the swaps, the fund receives the total return on the referenced stock (i.e., receiving the increase or paying the decrease in value of the selected reference stock and receiving the equivalent of any dividends in respect of the selected referenced stock) over a specified period of time, applied to a notional amount that represents the value of a designated number of shares of the selected reference stock at the beginning of the equity swap contract. The fund also pays a floating rate that is based on short-term interest rates, applied to the notional amount. At the same time, the fund invests an amount approximating the notional amount of the swap in high-quality temporary cash investments.
The notional amounts of swap contracts are not recorded in the Statement of Net Assets. Swaps are valued daily based on market quotations received from independent pricing services or recognized dealers and the change in value is recorded in the Statement of Net Assets as an asset (liability) and in the Statement of Operations as unrealized appreciation (depreciation) until termination of the swap, at which time realized gain (loss) is recorded. A risk associated with all types of swaps is the possibility that a counterparty may default on its obligation to pay net amounts due to the fund. The fund’s maximum amount subject to counterparty risk is the unrealized appreciation on the swap contract. The fund mitigates its counterparty risk by entering into swaps only with a diverse group of prequalified counterparties, monitoring their financial strength, entering into master netting arrangements with its counterparties, and requiring its counterparties to transfer collateral as security for their performance. In the event of a counterparty’s default (including bankruptcy), the fund may terminate any swap contracts with that counterparty, determine the net amount owed by either party in accordance with its master netting arrangements, and sell or retain any collateral held up to the net amount owed to the fund under the master netting arrangements. The swap contracts contain provisions whereby a counterparty may terminate open contracts if the fund net assets decline below a certain level, triggering a payment by the fund if the fund is in a net liability position at the time of the termination. The payment amount would be reduced by any collateral the fund has pledged. Any securities pledged as collateral for open contracts are noted in the Statement of Net Assets. The value of collateral received or pledged is compared daily to the value of the swap contracts exposure with each counterparty, and any difference, if in excess of a specified minimum transfer amount, is adjusted and settled within two business days.
During the year ended December 31, 2015, the fund’s average amounts of investments in total return swaps represented less than 1% of net assets, based on the average of notional amounts at each quarter-end during the period. The fund had no open swap contracts at December 31, 2015.
4. Federal Income Taxes: The fund intends to continue to qualify as a regulated investment company and distribute all of its taxable income. Management has analyzed the fund’s tax positions taken for all open federal income tax years (December 31, 2012–2015), and has concluded that no provision for federal income tax is required in the fund’s financial statements.
5. Distributions: Distributions to shareholders are recorded on the ex-dividend date.
6. Securities Lending: To earn additional income, the fund lends its securities to qualified institutional borrowers. Security loans are subject to termination by the fund at any time, and are required to be secured at all times by collateral in an amount at least equal to the market value of securities loaned. Daily market fluctuations could cause the value of loaned securities to be more or less than the value of the collateral received. When this occurs, the collateral is adjusted and settled on the next business day. The fund further mitigates its counterparty risk by entering into securities lending transactions
50
Small-Cap Growth Index Fund
only with a diverse group of prequalified counterparties, monitoring their financial strength, and entering into master securities lending agreements with its counterparties. The master securities lending agreements provide that, in the event of a counterparty’s default (including bankruptcy), the fund may terminate any loans with that borrower, determine the net amount owed, and sell or retain the collateral up to the net amount owed to the fund; however, such actions may be subject to legal proceedings. While collateral mitigates counterparty risk, in the absence of a default the fund may experience delays and costs in recovering the securities loaned. The fund invests cash collateral received in Vanguard Market Liquidity Fund, and records a liability in the Statement of Net Assets for the return of the collateral, during the period the securities are on loan. Securities lending income represents fees charged to borrowers plus income earned on invested cash collateral, less expenses associated with the loan.
7. Credit Facility: The fund and certain other funds managed by The Vanguard Group (“Vanguard”) participate in a $3 billion committed credit facility provided by a syndicate of lenders pursuant to a credit agreement that may be renewed annually; each fund is individually liable for its borrowings, if any, under the credit facility. Borrowings may be utilized for temporary and emergency purposes, and are subject to the fund’s regulatory and contractual borrowing restrictions. The participating funds are charged administrative fees and an annual commitment fee of 0.06% of the undrawn amount of the facility; these fees are allocated to the funds based on a method approved by the fund’s board of trustees and included in Management and Administrative expenses on the fund’s Statement of Operations. Any borrowings under this facility bear interest at a rate equal to the higher of the federal funds rate or LIBOR reference rate plus an agreed-upon spread.
The fund had no borrowings outstanding at December 31, 2015, or at any time during the period then ended.
8. Other: Dividend income is recorded on the ex-dividend date. Interest income includes income distributions received from Vanguard Market Liquidity Fund and is accrued daily. Premiums and discounts on debt securities purchased are amortized and accreted, respectively, to interest income over the lives of the respective securities. Security transactions are accounted for on the date securities are bought or sold. Costs used to determine realized gains (losses) on the sale of investment securities are those of the specific securities sold.
Each class of shares has equal rights as to assets and earnings, except that each class separately bears certain class-specific expenses related to maintenance of shareholder accounts (included in Management and Administrative expenses) and shareholder reporting. Marketing and distribution expenses are allocated to each class of shares based on a method approved by the board of trustees. Income, other non-class-specific expenses, and gains and losses on investments are allocated to each class of shares based on its relative net assets.
B. In accordance with the terms of a Funds’ Service Agreement (the “FSA”) between Vanguard and the fund, Vanguard furnishes to the fund investment advisory, corporate management, administrative, marketing, and distribution services at Vanguard’s cost of operations (as defined by the FSA). These costs of operations are allocated to the fund based on methods and guidelines approved by the board of trustees. Vanguard does not require reimbursement in the current period for certain costs of operations (such as deferred compensation/benefits and risk/insurance costs); the fund’s liability for these costs of operations is included in Payables to Vanguard on the Statement of Net Assets.
51
Small-Cap Growth Index Fund
Upon the request of Vanguard, the fund may invest up to 0.40% of its net assets as capital in Vanguard. At December 31, 2015, the fund had contributed to Vanguard capital in the amount of $1,358,000, representing 0.01% of the fund’s net assets and 0.54% of Vanguard’s capitalization. The fund’s trustees and officers are also directors and employees, respectively, of Vanguard.
C. Various inputs may be used to determine the value of the fund’s investments. These inputs are summarized in three broad levels for financial statement purposes. The inputs or methodologies used to value securities are not necessarily an indication of the risk associated with investing in those securities.
Level 1—Quoted prices in active markets for identical securities.
Level 2—Other significant observable inputs (including quoted prices for similar securities, interest rates, prepayment speeds, credit risk, etc.).
Level 3—Significant unobservable inputs (including the fund’s own assumptions used to determine the fair value of investments).
The following table summarizes the market value of the fund’s investments as of December 31, 2015, based on the inputs used to value them:
| | | |
| | Level 1 | Level 2 | Level 3 |
| Investments | ($000) | ($000) | ($000) |
| Common Stocks | 15,111,166 | — | — |
| Temporary Cash Investments | 408,782 | 3,197 | — |
| Futures Contracts—Assets1 | 138 | — | — |
| Futures Contracts—Liabilities1 | (591) | — | — |
| Total | 15,519,495 | 3,197 | — |
| 1 Represents variation margin on the last day of the reporting period. | | | |
D. At December 31, 2015, the aggregate settlement value of open futures contracts and the related unrealized appreciation (depreciation) were:
| | | | |
| | | | | ($000) |
| | | | Aggregate | |
| | | Number of | Settlement | Unrealized |
| | | Long (Short) | Value | Appreciation |
| Futures Contracts | Expiration | Contracts | Long (Short) | (Depreciation) |
| E-mini Russell 2000 Index | March 2016 | 273 | 30,890 | 655 |
| E-mini S&P 500 Index | March 2016 | 10 | 1,018 | 21 |
| | | | | 676 |
Unrealized appreciation (depreciation) on open futures contracts is required to be treated as realized gain (loss) for tax purposes.
52
Small-Cap Growth Index Fund
E. Distributions are determined on a tax basis and may differ from net investment income and realized capital gains for financial reporting purposes. Differences may be permanent or temporary. Permanent differences are reclassified among capital accounts in the financial statements to reflect their tax character. Temporary differences arise when certain items of income, expense, gain, or loss are recognized in different periods for financial statement and tax purposes. These differences will reverse at some time in the future. Differences in classification may also result from the treatment of short-term gains as ordinary income for tax purposes.
During the year ended December 31, 2015, the fund realized $1,462,463,000 of net capital gains resulting from in-kind redemptions—in which shareholders exchanged fund shares for securities held by the fund rather than for cash. Because such gains are not taxable to the fund, and are not distributed to shareholders, they have been reclassified from accumulated net realized losses to paid-in capital.
Realized and unrealized gains (losses) on certain of the fund’s swap contracts are treated as ordinary income (loss) for tax purposes. Realized losses of $455,000 on swap contracts have been reclassified from accumulated net realized losses to undistributed net investment income.
For tax purposes, at December 31, 2015, the fund had $5,089,000 of ordinary income available for distribution. At December 31, 2015, the fund had available capital losses totaling $1,179,420,000 to offset future net capital gains. Of this amount, $504,200,000 is subject to expiration dates; $243,082,000 may be used to offset future net capital gains through December 31, 2017 and $261,118,000 through December 31, 2018. Capital losses of $675,220,000 realized beginning in fiscal 2011 may be carried forward indefinitely under the Regulated Investment Company Modernization Act of 2010, but must be used before any expiring loss carryforwards.
At December 31, 2015, the cost of investment securities for tax purposes was $13,360,136,000. Net unrealized appreciation of investment securities for tax purposes was $2,163,009,000, consisting of unrealized gains of $3,447,782,000 on securities that had risen in value since their purchase and $1,284,773,000 in unrealized losses on securities that had fallen in value since their purchase.
F. During the year ended December 31, 2015, the fund purchased $7,238,163,000 of investment securities and sold $6,790,814,000 of investment securities, other than temporary cash investments. Purchases and sales include $3,168,337,000 and $3,171,729,000, respectively, in connection with in-kind purchases and redemptions of the fund’s capital shares.
53
Small-Cap Growth Index Fund
G. Capital share transactions for each class of shares were:
| | | | |
| | | | Year Ended December 31, |
| | | 2015 | | 2014 |
| | Amount | Shares | Amount | Shares |
| | ($000) | (000) | ($000) | (000) |
| Investor Shares | | | | |
| Issued | 445,273 | 12,230 | 538,287 | 15,576 |
| Issued in Lieu of Cash Distributions | 16,016 | 467 | 18,576 | 526 |
| Redeemed | (737,332) | (20,291) | (1,158,756) | (33,579) |
| Net Increase (Decrease)—Investor Shares | (276,043) | (7,594) | (601,893) | (17,477) |
| ETF Shares | | | | |
| Issued | 3,792,432 | 29,561 | 2,016,134 | 16,221 |
| Issued in Lieu of Cash Distributions | — | — | — | — |
| Redeemed | (3,102,742) | (24,150) | (1,875,026) | (15,000) |
| Net Increase (Decrease)—ETF Shares | 689,690 | 5,411 | 141,108 | 1,221 |
| Admiral Shares | | | | |
| Issued | 1,619,752 | 35,551 | 1,547,647 | 35,829 |
| Issued in Lieu of Cash Distributions | 52,365 | 1,221 | 50,550 | 1,144 |
| Redeemed | (934,034) | (20,690) | (1,198,810) | (27,773) |
| Net Increase (Decrease) —Admiral Shares | 738,083 | 16,082 | 399,387 | 9,200 |
| Institutional Shares | | | | |
| Issued | 617,232 | 16,815 | 668,519 | 19,413 |
| Issued in Lieu of Cash Distributions | 30,844 | 897 | 36,304 | 1,026 |
| Redeemed | (1,380,413) | (40,068) | (946,915) | (27,558) |
| Net Increase (Decrease) —Institutional Shares | (732,337) | (22,356) | (242,092) | (7,119) |
H. Management has determined that no material events or transactions occurred subsequent to December 31, 2015, that would require recognition or disclosure in these financial statements.
54
| | | | |
| Small-Cap Value Index Fund | | | |
| |
| |
| Fund Profile | | | | |
| As of December 31, 2015 | | | | |
| |
| Share-Class Characteristics | | | | |
| | Investor | | Admiral | Institutional |
| | Shares | ETF Shares | Shares | Shares |
| Ticker Symbol | VISVX | VBR | VSIAX | VSIIX |
| Expense Ratio1 | 0.23% | 0.09% | 0.09% | 0.08% |
| 30-Day SEC Yield | 2.00% | 2.13% | 2.13% | 2.13% |
| | | |
| Portfolio Characteristics | | |
| | | | DJ |
| | | | U.S. |
| | | CRSP US | Total |
| | | Small Cap | Market |
| | Fund | Value Index | FA Index |
| Number of Stocks | 869 | 854 | 3,960 |
| Median Market Cap | $3.0B | $3.0B | $51.4B |
| Price/Earnings Ratio | 21.8x | 21.3x | 21.9x |
| Price/Book Ratio | 1.8x | 1.8x | 2.7x |
| Return on Equity | 10.7% | 10.7% | 17.2% |
| Earnings Growth | | | |
| Rate | 9.0% | 9.0% | 9.5% |
| Dividend Yield | 2.3% | 2.3% | 2.1% |
| Foreign Holdings | 0.0% | 0.0% | 0.0% |
| Turnover Rate | 16% | — | — |
| Short-Term | | | |
| Reserves | 0.1% | — | — |
| |
| Sector Diversification (% of equity exposure) |
| | | | DJ |
| | | CRSP US U.S. Total |
| | | Small Cap | Market |
| | Fund Value Index | FA Index |
| Basic Materials | 3.9% | 3.9% | 2.3% |
| Consumer Goods | 6.8 | 6.8 | 10.3 |
| Consumer Services | 12.1 | 12.0 | 14.2 |
| Financials | 31.1 | 31.2 | 19.5 |
| Health Care | 6.2 | 6.2 | 14.0 |
| Industrials | 19.8 | 19.8 | 12.2 |
| Oil & Gas | 4.1 | 4.1 | 5.9 |
| Technology | 8.1 | 8.1 | 16.4 |
| Telecommunications | 0.5 | 0.5 | 2.2 |
| Utilities | 7.4 | 7.4 | 3.0 |
| | |
| Volatility Measures | | |
| | | DJ |
| | Spliced | U.S. Total |
| | Small-Cap | Market |
| | Value Index | FA Index |
| R-Squared | 1.00 | 0.85 |
| Beta | 1.00 | 1.10 |
These measures show the degree and timing of the fund’s fluctuations compared with the indexes over 36 months.
Ten Largest Holdings (% of total net assets)
| | |
| AGL Resources Inc. | Gas Distribution | 0.5% |
| Arthur J Gallagher & Co. | Property & Casualty | |
| | Insurance | 0.5 |
| JetBlue Airways Corp. | Airlines | 0.5 |
| Spirit AeroSystems | | |
| Holdings Inc. | Aerospace | 0.5 |
| Ingredion Inc. | Food Products | 0.5 |
| Cablevision Systems | Broadcasting & | |
| Corp. | Entertainment | 0.5 |
| Valspar Corp. | Building Materials & | |
| | Fixtures | 0.5 |
| Atmos Energy Corp. | Gas Distribution | 0.4 |
| Broadridge Financial | Financial | |
| Solutions Inc. | Administration | 0.4 |
| CDW Corp. | Computer Services | 0.4 |
| Top Ten | | 4.7% |
The holdings listed exclude any temporary cash investments and equity index products.
1 The expense ratios shown are from the prospectus dated April 28, 2015, and represent estimated costs for the current fiscal year. For the fiscal year ended December 31, 2015, the expense ratios were 0.20% for Investor Shares, 0.08% for ETF Shares, 0.08% for Admiral Shares, and 0.07% for Institutional Shares.
55
Small-Cap Value Index Fund
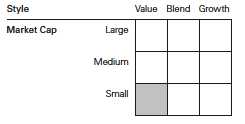
56
Small-Cap Value Index Fund
Performance Summary
All of the returns in this report represent past performance, which is not a guarantee of future results that may be achieved by the fund. (Current performance may be lower or higher than the performance data cited. For performance data current to the most recent month-end, visit our website at vanguard.com/performance.) Note, too, that both investment returns and principal value can fluctuate widely, so an investor’s shares, when sold, could be worth more or less than their original cost. The returns shown do not reflect taxes that a shareholder would pay on fund distributions or on the sale of fund shares.
|
| Cumulative Performance: December 31, 2005, Through December 31, 2015 |
| Initial Investment of $10,000 |
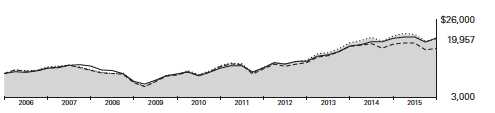
| | | | | |
| | | | Average Annual Total Returns | |
| | | Periods Ended December 31, 2015 | |
| |
| | | | | | Final Value |
| | | One | Five | Ten | of a $10,000 |
| | | Year | Years | Years | Investment |
| |
| | Small-Cap Value Index Fund*Investor | | | | |
| | Shares | -4.78% | 10.26% | 7.15% | $19,957 |
| |
| •••••••• | Spliced Small-Cap Value Index | -4.64 | 10.45 | 7.28 | 20,201 |
| |
| – – – – | Small-Cap Value Funds Average | -6.90 | 7.67 | 5.71 | 17,431 |
| | Dow Jones U.S. Total Stock Market | | | | |
| | Float Adjusted Index | 0.44 | 12.14 | 7.48 | 20,563 |
For a benchmark description, see the Glossary.
Small-Cap Value Funds Average: Derived from data provided by Lipper, a Thomson Reuters Company.
| | | | |
| | | | | Final Value |
| | One | Five | Ten | of a $10,000 |
| | Year | Years | Years | Investment |
| Small-Cap Value Index Fund | | | | |
| ETF Shares Net Asset Value | -4.67% | 10.41% | 7.29% | $20,216 |
| Spliced Small-Cap Value Index | -4.64 | 10.45 | 7.28 | 20,201 |
| Dow Jones U.S. Total Stock Market Float | | | | |
| Adjusted Index | 0.44 | 12.14 | 7.48 | 20,563 |
See Financial Highlights for dividend and capital gains information.
57
| | | |
| Small-Cap Value Index Fund | | | |
| |
| |
| |
| | Average Annual Total Returns | |
| | Periods Ended December 31, 2015 | |
| | | Since | Final Value |
| | One | Inception | of a $10,000 |
| | Year | (9/27/2011) | Investment |
| Small-Cap Value Index Fund Admiral Shares | -4.65% | 16.00% | $18,817 |
| Spliced Small-Cap Value Index | -4.64 | 16.04 | 18,851 |
| Dow Jones U.S. Total Stock Market Float | | | |
| Adjusted Index | 0.44 | 16.09 | 18,884 |
| "Since Inception" performance is calculated from the Admiral Shares’ inception date for both the fund and its comparative standards. |
| | | | |
| | | | | Final Value |
| | One | Five | Ten | of a $5,000,000 |
| | Year | Years | Years | Investment |
| Small-Cap Value Index Fund Institutional | | | | |
| Shares | -4.67% | 10.43% | 7.33% | $10,140,545 |
| Spliced Small-Cap Value Index | -4.64 | 10.45 | 7.28 | 10,100,259 |
| Dow Jones U.S. Total Stock Market Float | | | | |
| Adjusted Index | 0.44 | 12.14 | 7.48 | 10,281,716 |
| |
| |
| |
| Cumulative Returns of ETF Shares: December 31, 2005, Through December 31, 2015 | |
| | | One | Five | Ten |
| | | Year | Years | Years |
| Small-Cap Value Index Fund ETF Shares Market | | | | |
| Price | | -4.67% | 63.90% | 102.35% |
| Small-Cap Value Index Fund ETF Shares Net Asset | | | | |
| Value | | -4.67 | 64.05 | 102.16 |
| Spliced Small-Cap Value Index | | -4.64 | 64.36 | 102.01 |
58
Small-Cap Value Index Fund
Fiscal-Year Total Returns (%): December 31, 2005, Through December 31, 2015
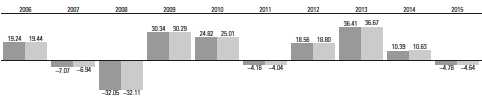
|
| Small-Cap Value Index Fund Investor Shares |
| Spliced Small-Cap Value Index |
| For a benchmark description, see the Glossary. |
59
Small-Cap Value Index Fund
Financial Statements
Statement of Net Assets—Investments Summary
As of December 31, 2015
This Statement summarizes the fund’s holdings by asset type. Details are reported for each of the fund’s 50 largest individual holdings and for investments that, in total for any issuer, represent more than 1% of the fund’s net assets. The total value of smaller holdings is reported as a single amount within each category.
The fund reports a complete list of its holdings in regulatory filings four times in each fiscal year, at the quarter-ends. For the second and fourth fiscal quarters, the complete listing of the fund’s holdings is available electronically on vanguard.com and on the Securities and Exchange Commission’s website (sec.gov), or you can have it mailed to you without charge by calling 800-662-7447. For the first and third fiscal quarters, the fund files the lists with the SEC on Form N-Q. Shareholders can look up the fund’s Forms N-Q on the SEC’s website. Forms N-Q may also be reviewed and copied at the SEC’s Public Reference Room (see the back cover of this report for further information).
| | | |
| | | Market | Percentage |
| | | Value• | of Net |
| | Shares | ($000) | Assets |
| Common Stocks | | | |
| Basic Materials | | | |
| RPM International Inc. | 1,499,582 | 66,072 | 0.4% |
| Basic Materials—Other † | | 572,302 | 3.5% |
| | | 638,374 | 3.9% |
| Consumer Goods | | | |
| Ingredion Inc. | 806,420 | 77,287 | 0.5% |
| Leggett & Platt Inc. | 1,457,257 | 61,234 | 0.4% |
| Pinnacle Foods Inc. | 1,314,337 | 55,807 | 0.3% |
| * Visteon Corp. | 460,149 | 52,687 | 0.3% |
| Goodyear Tire & Rubber Co. | 1,515,526 | 49,512 | 0.3% |
| Consumer Goods—Other † | | 824,992 | 5.0% |
| | | 1,121,519 | 6.8% |
| Consumer Services | | | |
| * JetBlue Airways Corp. | 3,551,268 | 80,436 | 0.5% |
| Cablevision Systems Corp. Class A | 2,383,196 | 76,024 | 0.5% |
| TEGNA Inc. | 2,498,829 | 63,770 | 0.4% |
| KAR Auction Services Inc. | 1,550,253 | 57,406 | 0.3% |
| Service Corp. International | 2,104,201 | 54,751 | 0.3% |
| Casey’s General Stores Inc. | 439,412 | 52,927 | 0.3% |
| Consumer Services—Other † | | 1,591,908 | 9.7% |
| | | 1,977,222 | 12.0% |
| Financials | | | |
| Arthur J Gallagher & Co. | 1,991,605 | 81,536 | 0.5% |
| Apartment Investment & Management Co. | 1,763,178 | 70,580 | 0.4% |
| East West Bancorp Inc. | 1,621,989 | 67,410 | 0.4% |
| National Retail Properties Inc. | 1,534,721 | 61,466 | 0.4% |
| American Financial Group Inc. | 787,643 | 56,773 | 0.4% |
| RenaissanceRe Holdings Ltd. | 494,259 | 55,945 | 0.4% |
| StanCorp Financial Group Inc. | 477,264 | 54,351 | 0.3% |
| Starwood Property Trust Inc. | 2,545,031 | 52,326 | 0.3% |
| Liberty Property Trust | 1,665,648 | 51,718 | 0.3% |
60
| | | | |
| Small-Cap Value Index Fund | | | |
| |
| |
| |
| | | | Market | Percentage |
| | | | Value• | of Net |
| | | Shares | ($000) | Assets |
| | Taubman Centers Inc. | 644,959 | 49,481 | 0.3% |
| | Old Republic International Corp. | 2,652,204 | 49,411 | 0.3% |
| | Financials—Other † | | 4,458,689 | 27.1% |
| | | | 5,109,686 | 31.1% |
| Health Care | | | |
| | Teleflex Inc. | 468,883 | 61,635 | 0.4% |
| * | Health Net Inc. | 827,641 | 56,660 | 0.3% |
| | Health Care—Other † | | 900,452 | 5.5% |
| | | | 1,018,747 | 6.2% |
| Industrials | | | |
| * | Spirit AeroSystems Holdings Inc. Class A | 1,582,284 | 79,225 | 0.5% |
| | Valspar Corp. | 895,660 | 74,295 | 0.5% |
| | Broadridge Financial Solutions Inc. | 1,336,658 | 71,819 | 0.4% |
| | Allegion plc | 1,081,007 | 71,260 | 0.4% |
| | PerkinElmer Inc. | 1,261,656 | 67,587 | 0.4% |
| | Huntington Ingalls Industries Inc. | 529,492 | 67,166 | 0.4% |
| | IDEX Corp. | 862,440 | 66,072 | 0.4% |
| | Carlisle Cos. Inc. | 732,631 | 64,977 | 0.4% |
| | Orbital ATK Inc. | 663,022 | 59,234 | 0.4% |
| * | AECOM | 1,706,631 | 51,250 | 0.3% |
| | AptarGroup Inc. | 703,805 | 51,131 | 0.3% |
| * | Berry Plastics Group Inc. | 1,352,557 | 48,936 | 0.3% |
| | Bemis Co. Inc. | 1,081,738 | 48,343 | 0.3% |
| | Industrials—Other † | | 2,432,006 | 14.8% |
| | | | 3,253,301 | 19.8% |
| Oil & Gas | | | |
| * | Newfield Exploration Co. | 1,841,879 | 59,972 | 0.4% |
| * | First Solar Inc. | 853,156 | 56,300 | 0.3% |
| | Oil & Gas—Other † | | 555,150 | 3.4% |
| | | | 671,422 | 4.1% |
| |
| 1Other † | | 1,196 | 0.0% |
| |
| Technology | | | |
| | CDW Corp. | 1,707,058 | 71,765 | 0.4% |
| | Ingram Micro Inc. | 1,687,225 | 51,258 | 0.3% |
| | Teradyne Inc. | 2,316,531 | 47,883 | 0.3% |
| | Technology—Other † | | 1,151,311 | 7.0% |
| | | | 1,322,217 | 8.0% |
| |
| Telecommunications † | | 85,151 | 0.5% |
| |
| Utilities | | | |
| | AGL Resources Inc. | 1,355,241 | 86,478 | 0.5% |
| | Atmos Energy Corp. | 1,144,115 | 72,125 | 0.5% |
| | TECO Energy Inc. | 2,651,403 | 70,660 | 0.4% |
| | Westar Energy Inc. Class A | 1,593,085 | 67,563 | 0.4% |
| | UGI Corp. | 1,947,467 | 65,746 | 0.4% |
| | Aqua America Inc. | 1,988,654 | 59,262 | 0.4% |
| | Piedmont Natural Gas Co. Inc. | 892,699 | 50,902 | 0.3% |
| | Utilities—Other † | | 741,519 | 4.5% |
| | | | 1,214,255 | 7.4% |
| Total Common Stocks (Cost $14,861,700) | | 16,413,090 | 99.8%2 |
61
| | | | |
| Small-Cap Value Index Fund | | | | |
| |
| |
| |
| | | | Market | Percentage |
| | | | Value• | of Net |
| | Coupon | Shares | ($000) | Assets |
| Temporary Cash Investments | | | | |
| Money Market Fund | | | | |
| 3,4 Vanguard Market Liquidity Fund | 0.363% | 246,960,112 | 246,960 | 1.5% |
| |
| 5U.S. Government and Agency Obligations † | | | 3,992 | 0.0% |
| Total Temporary Cash Investments (Cost $250,953) | | | 250,952 | 1.5%2 |
| 6Total Investments (Cost $15,112,653) | | | 16,664,042 | 101.3% |
| |
| | | | Amount | |
| | | | ($000) | |
| Other Assets and Liabilities | | | | |
| Other Assets | | | | |
| Investment in Vanguard | | | 1,493 | |
| Receivables for Investment Securities Sold | | | 21,402 | |
| Receivables for Accrued Income | | | 30,522 | |
| Receivables for Capital Shares Issued | | | 23,299 | |
| Other Assets | | | 22,684 | |
| Total Other Assets | | | 99,400 | 0.6% |
| Liabilities | | | | |
| Payables for Investment Securities Purchased | | | (79,252) | |
| Collateral for Securities on Loan | | | (160,934) | |
| Payables for Capital Shares Redeemed | | | (57,705) | |
| Payables to Vanguard | | | (12,282) | |
| Other Liabilities | | | (799) | |
| Total Liabilities | | | (310,972) | (1.9%) |
| Net Assets | | | 16,452,470 | 100.0% |
| |
| |
| At December 31, 2015, net assets consisted of: | | | | |
| | | | | Amount |
| | | | | ($000) |
| Paid-in Capital | | | | 16,144,180 |
| Overdistributed Net Investment Income | | | | (12,759) |
| Accumulated Net Realized Losses | | | | (1,230,214) |
| Unrealized Appreciation (Depreciation) | | | | |
| Investment Securities | | | | 1,551,389 |
| Futures Contracts | | | | (111) |
| Swap Contracts | | | | (15) |
| Net Assets | | | | 16,452,470 |
| |
| |
| Investor Shares—Net Assets | | | | |
| Applicable to 83,236,076 outstanding $.001 par value shares of | | | |
| beneficial interest (unlimited authorization) | | | | 1,971,917 |
| Net Asset Value Per Share—Investor Shares | | | | $23.69 |
62
| |
| Small-Cap Value Index Fund | |
| |
| |
| |
| | Amount |
| | ($000) |
| ETF Shares—Net Assets | |
| Applicable to 57,480,112 outstanding $.001 par value shares of | |
| beneficial interest (unlimited authorization) | 5,679,377 |
| Net Asset Value Per Share—ETF Shares | $98.81 |
| |
| Admiral Shares—Net Assets | |
| Applicable to 152,322,199 outstanding $.001 par value shares of | |
| beneficial interest (unlimited authorization) | 6,466,978 |
| Net Asset Value Per Share—Admiral Shares | $42.46 |
| |
| Institutional Shares—Net Assets | |
| Applicable to 98,365,921 outstanding $.001 par value shares of | |
| beneficial interest (unlimited authorization) | 2,334,198 |
| Net Asset Value Per Share—Institutional Shares | $23.73 |
• See Note A in Notes to Financial Statements.
* Non-income-producing security.
† Represents the aggregate value, by category, of securities that are not among the 50 largest holdings and, in total for any issuer, represent
1% or less of net assets.
1 “Other” represents securities that are not classified by the fund’s benchmark index.
2 The fund invests a portion of its cash reserves in equity markets through the use of index futures contracts and swap contracts. After giving effect to futures and swap investments, the fund’s effective common stock and temporary cash investment positions represent 100.0% and 1.3%, respectively, of net assets.
3 Affiliated money market fund available only to Vanguard funds and certain trusts and accounts managed by Vanguard. Rate shown is the 7-day yield.
4 Includes $160,934,000 of collateral received for securities on loan.
5 Securities with a value of $2,395,000 have been segregated as initial margin for open futures contracts.
6 The total value of securities on loan is $150,673,000.
See accompanying Notes, which are an integral part of the Financial Statements.
63
| |
| Small-Cap Value Index Fund | |
| |
| |
| Statement of Operations | |
| |
| | Year Ended |
| | December 31, 2015 |
| | ($000) |
| Investment Income | |
| Income | |
| Dividends | 318,175 |
| Interest1 | 107 |
| Securities Lending | 7,211 |
| Total Income | 325,493 |
| Expenses | |
| The Vanguard Group—Note B | |
| Investment Advisory Services | 1,819 |
| Management and Administrative—Investor Shares | 3,442 |
| Management and Administrative—ETF Shares | 2,779 |
| Management and Administrative—Admiral Shares | 3,136 |
| Management and Administrative—Institutional Shares | 1,099 |
| Marketing and Distribution—Investor Shares | 562 |
| Marketing and Distribution—ETF Shares | 496 |
| Marketing and Distribution—Admiral Shares | 805 |
| Marketing and Distribution—Institutional Shares | 167 |
| Custodian Fees | 511 |
| Auditing Fees | 42 |
| Shareholders’ Reports—Investor Shares | 54 |
| Shareholders’ Reports—ETF Shares | 267 |
| Shareholders’ Reports—Admiral Shares | 63 |
| Shareholders’ Reports—Institutional Shares | 50 |
| Trustees’ Fees and Expenses | 12 |
| Total Expenses | 15,304 |
| Net Investment Income | 310,189 |
| Realized Net Gain (Loss) | |
| Investment Securities Sold | 603,893 |
| Futures Contracts | 1,347 |
| Swap Contracts | (1,559) |
| Realized Net Gain (Loss) | 603,681 |
| Change in Unrealized Appreciation (Depreciation) | |
| Investment Securities | (1,746,693) |
| Futures Contracts | (745) |
| Swap Contracts | (15) |
| Change in Unrealized Appreciation (Depreciation) | (1,747,453) |
| Net Increase (Decrease) in Net Assets Resulting from Operations | (833,583) |
| 1 Interest income from an affiliated company of the fund was $100,000. | |
| |
| See accompanying Notes, which are an integral part of the Financial Statements. | |
64
| | |
| Small-Cap Value Index Fund | | |
| |
| |
| Statement of Changes in Net Assets | | |
| |
| | Year Ended December 31, |
| | 2015 | 2014 |
| | ($000) | ($000) |
| Increase (Decrease) in Net Assets | | |
| Operations | | |
| Net Investment Income | 310,189 | 262,217 |
| Realized Net Gain (Loss) | 603,681 | 729,874 |
| Change in Unrealized Appreciation (Depreciation) | (1,747,453) | 389,227 |
| Net Increase (Decrease) in Net Assets Resulting from Operations | (833,583) | 1,381,318 |
| Distributions | | |
| Net Investment Income | | |
| Investor Shares | (37,107) | (36,592) |
| ETF Shares | (109,974) | (84,373) |
| Admiral Shares | (122,857) | (100,009) |
| Institutional Shares | (46,306) | (33,614) |
| Realized Capital Gain | | |
| Investor Shares | — | — |
| ETF Shares | — | — |
| Admiral Shares | — | — |
| Institutional Shares | — | — |
| Total Distributions | (316,244) | (254,588) |
| Capital Share Transactions | | |
| Investor Shares | (185,953) | (270,292) |
| ETF Shares | 1,201,693 | 594,219 |
| Admiral Shares | 1,133,431 | 987,250 |
| Institutional Shares | 585,111 | 76,809 |
| Net Increase (Decrease) from Capital Share Transactions | 2,734,282 | 1,387,986 |
| Total Increase (Decrease) | 1,584,455 | 2,514,716 |
| Net Assets | | |
| Beginning of Period | 14,868,015 | 12,353,299 |
| End of Period1 | 16,452,470 | 14,868,015 |
1 Net Assets—End of Period includes undistributed (overdistributed) net investment income of ($12,759,000) and ($5,425,000).
See accompanying Notes, which are an integral part of the Financial Statements.
65
| | | | | |
| Small-Cap Value Index Fund | | | | | |
| |
| |
| Financial Highlights | | | | | |
| |
| |
| Investor Shares | | | | | |
| |
| For a Share Outstanding | | | Year Ended December 31, |
| Throughout Each Period | 2015 | 2014 | 2013 | 2012 | 2011 |
| Net Asset Value, Beginning of Period | $25.34 | $23.33 | $17.40 | $15.04 | $16.01 |
| Investment Operations | | | | | |
| Net Investment Income | . 431 | .425 | . 394 | .428 | .309 |
| Net Realized and Unrealized Gain (Loss) | | | | | |
| on Investments | (1.643) | 1.995 | 5.936 | 2.364 | (. 974) |
| Total from Investment Operations | (1.212) | 2.420 | 6.330 | 2.792 | (.665) |
| Distributions | | | | | |
| Dividends from Net Investment Income | (.438) | (.410) | (.400) | (.432) | (.305) |
| Distributions from Realized Capital Gains | — | — | — | — | — |
| Total Distributions | (.438) | (.410) | (.400) | (.432) | (.305) |
| Net Asset Value, End of Period | $23.69 | $25.34 | $23.33 | $17.40 | $15.04 |
| |
| Total Return1 | -4.78% | 10.39% | 36.41% | 18.56% | -4.16% |
| |
| Ratios/Supplemental Data | | | | | |
| Net Assets, End of Period (Millions) | $1,972 | $2,293 | $2,375 | $2,001 | $1,980 |
| Ratio of Total Expenses to Average Net Assets | 0.20% | 0.23% | 0.24% | 0.24% | 0.24% |
| Ratio of Net Investment Income to | | | | | |
| Average Net Assets | 1.78% | 1.84% | 2.03% | 2.66% | 1.90% |
| Portfolio Turnover Rate2 | 16% | 12% | 47% | 25% | 30% |
1 Total returns do not include account service fees that may have applied in the periods shown. Fund prospectuses provide information about any applicable account service fees.
2 Excludes the value of portfolio securities received or delivered as a result of in-kind purchases or redemptions of the fund’s capital shares, including ETF Creation Units.
See accompanying Notes, which are an integral part of the Financial Statements.
66
| | | | | |
| Small-Cap Value Index Fund | | | | | |
| |
| |
| Financial Highlights | | | | | |
| |
| |
| ETF Shares | | | | | |
| |
| For a Share Outstanding | | | Year Ended December 31, |
| Throughout Each Period | 2015 | 2014 | 2013 | 2012 | 2011 |
| Net Asset Value, Beginning of Period | $105.71 | $97.32 | $72.60 | $62.73 | $66.80 |
| Investment Operations | | | | | |
| Net Investment Income | 1.933 | 1.933 | 1.796 | 1.896 | 1.393 |
| Net Realized and Unrealized Gain (Loss) | | | | | |
| on Investments | (6.870) | 8.326 | 24.742 | 9.877 | (4.083) |
| Total from Investment Operations | (4.937) | 10.259 | 26.538 | 11.773 | (2.690) |
| Distributions | | | | | |
| Dividends from Net Investment Income | (1.963) | (1.869) | (1.818) | (1.903) | (1.380) |
| Distributions from Realized Capital Gains | — | — | — | — | — |
| Total Distributions | (1.963) | (1.869) | (1.818) | (1.903) | (1.380) |
| Net Asset Value, End of Period | $98.81 | $105.71 | $97.32 | $72.60 | $62.73 |
| |
| Total Return | -4.67% | 10.55% | 36.57% | 18.78% | -4.05% |
| |
| Ratios/Supplemental Data | | | | | |
| Net Assets, End of Period (Millions) | $5,679 | $4,874 | $3,908 | $2,281 | $1,755 |
| Ratio of Total Expenses to Average Net Assets | 0.08% | 0.09% | 0.09% | 0.10% | 0.10% |
| Ratio of Net Investment Income to | | | | | |
| Average Net Assets | 1.90% | 1.98% | 2.18% | 2.80% | 2.04% |
| Portfolio Turnover Rate1 | 16% | 12% | 47% | 25% | 30% |
1 Excludes the value of portfolio securities received or delivered as a result of in-kind purchases or redemptions of the fund’s capital shares, including ETF Creation Units.
See accompanying Notes, which are an integral part of the Financial Statements.
67
| | | | | |
| Small-Cap Value Index Fund | | | | | |
| |
| |
| Financial Highlights | | | | | |
| |
| |
| Admiral Shares | | | | | |
| | | | | | Sept. 27, |
| | | | | | 20111 to |
| | | Year Ended December 31, | |
| For a Share Outstanding | | | | | Dec. 31, |
| Throughout Each Period | 2015 | 2014 | 2013 | 2012 | 2011 |
| Net Asset Value, Beginning of Period | $45.42 | $41.82 | $31.20 | $26.96 | $25.00 |
| Investment Operations | | | | | |
| Net Investment Income | . 830 | .831 | .773 | .814 | .196 |
| Net Realized and Unrealized Gain (Loss) | | | | | |
| on Investments | (2.947) | 3.573 | 10.629 | 4.245 | 2.320 |
| Total from Investment Operations | (2.117) | 4.404 | 11.402 | 5.059 | 2.516 |
| Distributions | | | | | |
| Dividends from Net Investment Income | (.843) | (. 804) | (.782) | (. 819) | (.556) |
| Distributions from Realized Capital Gains | — | — | — | — | — |
| Total Distributions | (.843) | (. 804) | (.782) | (. 819) | (.556) |
| Net Asset Value, End of Period | $42.46 | $45.42 | $41.82 | $31.20 | $26.96 |
| |
| Total Return2 | -4.65% | 10.55% | 36.58% | 18.77% | 10.05% |
| |
| Ratios/Supplemental Data | | | | | |
| Net Assets, End of Period (Millions) | $6,467 | $5,775 | $4,371 | $2,563 | $1,941 |
| Ratio of Total Expenses to Average Net Assets | 0.08% | 0.09% | 0.09% | 0.10% | 0.10%3 |
| Ratio of Net Investment Income to | | | | | |
| Average Net Assets | 1.90% | 1.98% | 2.18% | 2.80% | 2.04% 3 |
| Portfolio Turnover Rate 4 | 16% | 12% | 47% | 25% | 30% |
1 Inception.
2 Total returns do not include account service fees that may have applied in the periods shown. Fund prospectuses provide information about any applicable account service fees.
3 Annualized.
4 Excludes the value of portfolio securities received or delivered as a result of in-kind purchases or redemptions of the fund’s capital shares, including ETF Creation Units.
See accompanying Notes, which are an integral part of the Financial Statements.
68
| | | | | |
| Small-Cap Value Index Fund | | | | | |
| |
| |
| Financial Highlights | | | | | |
| |
| |
| Institutional Shares | | | | | |
| |
| For a Share Outstanding | | | Year Ended December 31, |
| Throughout Each Period | 2015 | 2014 | 2013 | 2012 | 2011 |
| Net Asset Value, Beginning of Period | $25.39 | $23.37 | $17.44 | $15.07 | $16.04 |
| Investment Operations | | | | | |
| Net Investment Income | . 465 | .467 | .434 | .459 | .338 |
| Net Realized and Unrealized Gain (Loss) | | | | | |
| on Investments | (1.652) | 2.004 | 5.935 | 2.371 | (.973) |
| Total from Investment Operations | (1.187) | 2.471 | 6.369 | 2.830 | (.635) |
| Distributions | | | | | |
| Dividends from Net Investment Income | (.473) | (. 451) | (.439) | (.460) | (.335) |
| Distributions from Realized Capital Gains | — | — | — | — | — |
| Total Distributions | (.473) | (. 451) | (.439) | (.460) | (.335) |
| Net Asset Value, End of Period | $23.73 | $25.39 | $23.37 | $17.44 | $15.07 |
| |
| Total Return | -4.67% | 10.59% | 36.55% | 18.78% | -3.97% |
| |
| Ratios/Supplemental Data | | | | | |
| Net Assets, End of Period (Millions) | $2,334 | $1,927 | $1,699 | $979 | $722 |
| Ratio of Total Expenses to Average Net Assets | 0.07% | 0.08% | 0.08% | 0.08% | 0.08% |
| Ratio of Net Investment Income to | | | | | |
| Average Net Assets | 1.91% | 1.99% | 2.19% | 2.82% | 2.06% |
| Portfolio Turnover Rate1 | 16% | 12% | 47% | 25% | 30% |
1 Excludes the value of portfolio securities received or delivered as a result of in-kind purchases or redemptions of the fund’s capital shares, including ETF Creation Units.
See accompanying Notes, which are an integral part of the Financial Statements.
69
Small-Cap Value Index Fund
Notes to Financial Statements
Vanguard Small-Cap Value Index Fund is registered under the Investment Company Act of 1940 as an open-end investment company, or mutual fund. The fund offers four classes of shares: Investor Shares, ETF Shares, Admiral Shares, and Institutional Shares. Investor Shares are available to any investor who meets the fund’s minimum purchase requirements. ETF Shares are listed for trading on NYSE Arca; they can be purchased and sold through a broker. Admiral Shares and Institutional Shares are designed for investors who meet certain administrative, service, and account-size criteria
A. The following significant accounting policies conform to generally accepted accounting principles for U.S. investment companies. The fund consistently follows such policies in preparing its financial statements.
1. Security Valuation: Securities are valued as of the close of trading on the New York Stock Exchange (generally 4 p.m., Eastern time) on the valuation date. Equity securities are valued at the latest quoted sales prices or official closing prices taken from the primary market in which each security trades; such securities not traded on the valuation date are valued at the mean of the latest quoted bid and asked prices. Securities for which market quotations are not readily available, or whose values have been materially affected by events occurring before the fund’s pricing time but after the close of the securities’ primary markets, are valued by methods deemed by the board of trustees to represent fair value. Investments in Vanguard Market Liquidity Fund are valued at that fund’s net asset value. Temporary cash investments acquired over 60 days to maturity are valued using the latest bid prices or using valuations based on a matrix system (which considers such factors as security prices, yields, maturities, and ratings), both as furnished by independent pricing services. Other temporary cash investments are valued at amortized cost, which approximates market value.
2. Futures Contracts: The fund uses index futures contracts to a limited extent, with the objectives of maintaining full exposure to the stock market, enhancing returns, maintaining liquidity, and minimizing transaction costs. The fund may purchase futures contracts to immediately invest incoming cash in the market, or sell futures in response to cash outflows, thereby simulating a fully invested position in the underlying index while maintaining a cash balance for liquidity. The fund may seek to enhance returns by using futures contracts instead of the underlying securities when futures are believed to be priced more attractively than the underlying securities. The primary risks associated with the use of futures contracts are imperfect correlation between changes in market values of stocks held by the fund and the prices of futures contracts, and the possibility of an illiquid market. Counterparty risk involving futures is mitigated because a regulated clearinghouse is the counterparty instead of the clearing broker. To further mitigate counterparty risk, the fund trades futures contracts on an exchange, monitors the financial strength of its clearing brokers and clearinghouse, and has entered into clearing agreements with its clearing brokers. The clearinghouse imposes initial margin requirements to secure the fund’s performance and requires daily settlement of variation margin representing changes in the market value of each contract.
Futures contracts are valued at their quoted daily settlement prices. The aggregate settlement values of the contracts are not recorded in the Statement of Net Assets. Fluctuations in the value of the contracts are recorded in the Statement of Net Assets as an asset (liability) and in the Statement of Operations as unrealized appreciation (depreciation) until the contracts are closed, when they are recorded as realized futures gains (losses).
During the year ended December 31, 2015, the fund’s average investments in long and short futures contracts represented less than 1% and 0% of net assets, respectively, based on the average of aggregate settlement values at each quarter-end during the period.
70
Small-Cap Value Index Fund
3. Swap Contracts: The fund has entered into equity swap contracts to earn the total return on selected reference stocks in the fund’s target index. Under the terms of the swaps, the fund receives the total return on the referenced stock (i.e., receiving the increase or paying the decrease in value of the selected reference stock and receiving the equivalent of any dividends in respect of the selected referenced stock) over a specified period of time, applied to a notional amount that represents the value of a designated number of shares of the selected reference stock at the beginning of the equity swap contract. The fund also pays a floating rate that is based on short-term interest rates, applied to the notional amount. At the same time, the fund invests an amount approximating the notional amount of the swap in high-quality temporary cash investments.
The notional amounts of swap contracts are not recorded in the Statement of Net Assets. Swaps are valued daily based on market quotations received from independent pricing services or recognized dealers and the change in value is recorded in the Statement of Net Assets as an asset (liability) and in the Statement of Operations as unrealized appreciation (depreciation) until termination of the swap, at which time realized gain (loss) is recorded. A risk associated with all types of swaps is the possibility that a counterparty may default on its obligation to pay net amounts due to the fund. The fund’s maximum amount subject to counterparty risk is the unrealized appreciation on the swap contract. The fund mitigates its counterparty risk by entering into swaps only with a diverse group of prequalified counterparties, monitoring their financial strength, entering into master netting arrangements with its counterparties, and requiring its counterparties to transfer collateral as security for their performance. In the event of a counterparty’s default (including bankruptcy), the fund may terminate any swap contracts with that counterparty, determine the net amount owed by either party in accordance with its master netting arrangements, and sell or retain any collateral held up to the net amount owed to the fund under the master netting arrangements. The swap contracts contain provisions whereby a counterparty may terminate open contracts if the fund net assets decline below a certain level, triggering a payment by the fund if the fund is in a net liability position at the time of the termination. The payment amount would be reduced by any collateral the fund has pledged. Any securities pledged as collateral for open contracts are noted in the Statement of Net Assets. The value of collateral received or pledged is compared daily to the value of the swap contracts exposure with each counterparty, and any difference, if in excess of a specified minimum transfer amount, is adjusted and settled within two business days.
During the year ended December 31, 2015, the fund’s average amounts of investments in total return swaps represented less than 1% of net assets, based on the average of notional amounts at each quarter-end during the period.
4. Federal Income Taxes: The fund intends to continue to qualify as a regulated investment company and distribute all of its taxable income. Management has analyzed the fund’s tax positions taken for all open federal income tax years (December 31, 2012–2015), and has concluded that no provision for federal income tax is required in the fund’s financial statements.
5. Distributions: Distributions to shareholders are recorded on the ex-dividend date.
6. Securities Lending: To earn additional income, the fund lends its securities to qualified institutional borrowers. Security loans are subject to termination by the fund at any time and are required to be secured at all times by collateral in an amount at least equal to the market value of securities loaned. Daily market fluctuations could cause the value of loaned securities to be more or less than the value of the collateral received. When this occurs, the collateral is adjusted and settled on the next business
71
Small-Cap Value Index Fund
day. The fund further mitigates its counterparty risk by entering into securities lending transactions only with a diverse group of prequalified counterparties, monitoring their financial strength, and entering into master securities lending agreements with its counterparties. The master securities lending agreements provide that, in the event of a counterparty’s default (including bankruptcy), the fund may terminate any loans with that borrower, determine the net amount owed, and sell or retain the collateral up to the net amount owed to the fund; however, such actions may be subject to legal proceedings. While collateral mitigates counterparty risk, in the absence of a default the fund may experience delays and costs in recovering the securities loaned. The fund invests cash collateral received in Vanguard Market Liquidity Fund, and records a liability in the Statement of Net Assets for the return of the collateral, during the period the securities are on loan. Securities lending income represents fees charged to borrowers plus income earned on invested cash collateral, less expenses associated with the loan.
7. Credit Facility: The fund and certain other funds managed by The Vanguard Group (“Vanguard”) participate in a $3 billion committed credit facility provided by a syndicate of lenders pursuant to a credit agreement that may be renewed annually; each fund is individually liable for its borrowings, if any, under the credit facility. Borrowings may be utilized for temporary and emergency purposes, and are subject to the fund’s regulatory and contractual borrowing restrictions. The participating funds are charged administrative fees and an annual commitment fee of 0.06% of the undrawn amount of the facility; these fees are allocated to the funds based on a method approved by the fund’s board of trustees and included in Management and Administrative expenses on the fund’s Statement of Operations. Any borrowings under this facility bear interest at a rate equal to the higher of the federal funds rate or LIBOR reference rate plus an agreed-upon spread.
The fund had no borrowings outstanding at December 31, 2015, or at any time during the period then ended.
8. Other: Dividend income is recorded on the ex-dividend date. Interest income includes income distributions received from Vanguard Market Liquidity Fund and is accrued daily. Premiums and discounts on debt securities purchased are amortized and accreted, respectively, to interest income over the lives of the respective securities. Security transactions are accounted for on the date securities are bought or sold. Costs used to determine realized gains (losses) on the sale of investment securities are those of the specific securities sold.
Each class of shares has equal rights as to assets and earnings, except that each class separately bears certain class-specific expenses related to maintenance of shareholder accounts (included in Management and Administrative expenses) and shareholder reporting. Marketing and distribution expenses are allocated to each class of shares based on a method approved by the board of trustees. Income, other non-class-specific expenses, and gains and losses on investments are allocated to each class of shares based on its relative net assets.
B. In accordance with the terms of a Funds’ Service Agreement (the “FSA”) between Vanguard and the fund, Vanguard furnishes to the fund investment advisory, corporate management, administrative, marketing, and distribution services at Vanguard’s cost of operations (as defined by the FSA). These costs of operations are allocated to the fund based on methods and guidelines approved by the board of trustees. Vanguard does not require reimbursement in the current period for certain costs of operations (such as deferred compensation/benefits and risk/insurance costs); the fund’s liability for these costs of operations is included in Payables to Vanguard on the Statement of Net Assets.
72
Small-Cap Value Index Fund
Upon the request of Vanguard, the fund may invest up to 0.40% of its net assets as capital in Vanguard. At December 31, 2015, the fund had contributed to Vanguard capital in the amount of $1,493,000, representing 0.01% of the fund’s net assets and 0.60% of Vanguard’s capitalization. The fund’s trustees and officers are also directors and employees, respectively, of Vanguard.
C. Various inputs may be used to determine the value of the fund’s investments. These inputs are summarized in three broad levels for financial statement purposes. The inputs or methodologies used to value securities are not necessarily an indication of the risk associated with investing in those securities.
Level 1—Quoted prices in active markets for identical securities.
Level 2—Other significant observable inputs (including quoted prices for similar securities, interest rates, prepayment speeds, credit risk, etc.).
Level 3—Significant unobservable inputs (including the fund’s own assumptions used to determine the fair value of investments).
The following table summarizes the market value of the fund’s investments as of December 31, 2015, based on the inputs used to value them:
| | | |
| | Level 1 | Level 2 | Level 3 |
| Investments | ($000) | ($000) | ($000) |
| Common Stocks | 16,411,894 | — | 1,196 |
| Temporary Cash Investments | 246,960 | 3,992 | — |
| Futures Contracts—Assets1 | 54 | — | — |
| Futures Contracts—Liabilities1 | (547) | — | — |
| Swap Contracts—Liabilities | — | (15) | — |
| Total | 16,658,361 | 3,977 | 1,196 |
| 1 Represents variation margin on the last day of the reporting period. | | | |
D. At December 31, 2015, the aggregate settlement value of open futures contracts and the related unrealized appreciation (depreciation) were:
| | | | |
| | | | | ($000) |
| | | | Aggregate | |
| | | Number of | Settlement | Unrealized |
| | | Long (Short) | Value | Appreciation |
| Futures Contracts | Expiration | Contracts | Long (Short) | (Depreciation) |
| E-mini Russell 2000 Index | March 2016 | 296 | 33,492 | (34) |
| E-mini S&P MidCap 400 Index | March 2016 | 60 | 8,361 | (77) |
| | | | | (111) |
Unrealized appreciation (depreciation) on open futures contracts is required to be treated as realized gain (loss) for tax purposes.
73
Small-Cap Value Index Fund
At December 31, 2015, the fund had the following open total return swap contracts:
| | | | | |
| | | | | Floating | Unrealized |
| | | | Notional | Interest Rate | Appreciation |
| | Termination | | Amount | Received | (Depreciation) |
| Reference Entity | Date | Counterparty | ($000) | (Paid) | ($000) |
| Ambac Financial Group Inc. | 1/11/16 | GSBUSA | 1,874 | (0.693%) | (15) |
| GSBUSA—Goldman Sachs Bank USA. | | | | | |
E. Distributions are determined on a tax basis and may differ from net investment income and realized capital gains for financial reporting purposes. Differences may be permanent or temporary. Permanent differences are reclassified among capital accounts in the financial statements to reflect their tax character. Temporary differences arise when certain items of income, expense, gain, or loss are recognized in different periods for financial statement and tax purposes. These differences will reverse at some time in the future. Differences in classification may also result from the treatment of short-term gains as ordinary income for tax purposes.
Certain of the fund’s investments are in securities considered to be passive foreign investment companies, for which any unrealized appreciation and/or realized gains are required to be included in distributable net income for tax purposes. During the year ended December 31, 2015, the fund realized gains on the sale of passive foreign investment companies of $280,000, which have been included in current and prior periods’ taxable income; accordingly, such gains have been reclassified from accumulated net realized losses to overdistributed net investment income. Passive foreign investment companies held at December 31, 2015, had unrealized appreciation of $4,611,000, of which all has been distributed and is reflected in the balance of overdistributed net investment income.
During the year ended December 31, 2015, the fund realized $944,968,000 of net capital gains resulting from in-kind redemptions—in which shareholders exchanged fund shares for securities held by the fund rather than for cash. Because such gains are not taxable to the fund, and are not distributed to shareholders, they have been reclassified from accumulated net realized losses to paid-in capital.
Realized and unrealized gains (losses) on certain of the fund’s swap contracts are treated as ordinary income (loss) for tax purposes. Realized losses of $1,559,000 on swap contracts have been reclassified from accumulated net realized losses to overdistributed net investment income.
For tax purposes, at December 31, 2015, the fund had $2,260,000 of ordinary income available for distribution. At December 31, 2015, the fund had available capital losses totaling $1,229,284,000 to offset future net capital gains. Of this amount, $876,582,000 is subject to expiration dates; $487,808,000 may be used to offset future net capital gains through December 31, 2017, and $388,774,000 through December 31, 2018. Capital losses of $352,702,000 realized beginning in fiscal 2011 may be carried forward indefinitely under the Regulated Investment Company Modernization Act of 2010, but must be used before any expiring loss carryforwards.
At December 31, 2015, the cost of investment securities for tax purposes was $15,117,264,000. Net unrealized appreciation of investment securities for tax purposes was $1,546,778,000, consisting of unrealized gains of $2,995,062,000 on securities that had risen in value since their purchase and $1,448,284,000 in unrealized losses on securities that had fallen in value since their purchase.
74
Small-Cap Value Index Fund
F. During the year ended December 31, 2015, the fund purchased $7,533,085,000 of investment securities and sold $4,756,731,000 of investment securities, other than temporary cash investments. Purchases and sales include $3,370,543,000 and $2,236,124,000, respectively, in connection with in-kind purchases and redemptions of the fund’s capital shares.
G. Capital share transactions for each class of shares were:
| | | | |
| | | | Year Ended December 31, |
| | | 2015 | | 2014 |
| | Amount | Shares | Amount | Shares |
| | ($000) | (000) | ($000) | (000) |
| Investor Shares | | | | |
| Issued | 553,081 | 21,859 | 530,028 | 21,851 |
| Issued in Lieu of Cash Distributions | 34,543 | 1,457 | 33,953 | 1,353 |
| Redeemed | (773,577) | (30,550) | (834,273) | (34,552) |
| Net Increase (Decrease)—Investor Shares | (185,953) | (7,234) | (270,292) | (11,348) |
| ETF Shares | | | | |
| Issued | 3,498,833 | 33,427 | 2,005,418 | 19,645 |
| Issued in Lieu of Cash Distributions | — | — | — | — |
| Redeemed | (2,297,140) | (22,050) | (1,411,199) | (13,700) |
| Net Increase (Decrease)—ETF Shares | 1,201,693 | 11,377 | 594,219 | 5,945 |
| Admiral Shares | | | | |
| Issued | 1,945,006 | 43,019 | 1,642,479 | 37,771 |
| Issued in Lieu of Cash Distributions | 110,002 | 2,591 | 89,878 | 1,998 |
| Redeemed | (921,577) | (20,420) | (745,107) | (17,154) |
| Net Increase (Decrease) —Admiral Shares | 1,133,431 | 25,190 | 987,250 | 22,615 |
| Institutional Shares | | | | |
| Issued | 1,034,933 | 40,325 | 510,432 | 21,007 |
| Issued in Lieu of Cash Distributions | 42,411 | 1,788 | 30,703 | 1,222 |
| Redeemed | (492,233) | (19,662) | (464,326) | (19,020) |
| Net Increase (Decrease) —Institutional Shares | 585,111 | 22,451 | 76,809 | 3,209 |
H. Management has determined that no material events or transactions occurred subsequent to December 31, 2015, that would require recognition or disclosure in these financial statements.
75
Report of Independent Registered Public Accounting Firm
To the Board of Trustees of Vanguard Index Funds and the Shareholders of Vanguard Small-Cap Index Fund, Vanguard Small-Cap Growth Index Fund and Vanguard Small-Cap Value Index Fund:
In our opinion, the accompanying statements of net assets—investments summary and the related statements of operations and of changes in net assets and the financial highlights present fairly, in all material respects, the financial position of Vanguard Small-Cap Index Fund, Vanguard Small-Cap Growth Index Fund and Vanguard Small-Cap Value Index Fund (constituting separate portfolios of Vanguard Index Funds, hereafter referred to as the “Funds”) at December 31, 2015, the results of each of their operations for the year then ended, the changes in each of their net assets for each of the two years in the period then ended, and the financial highlights for each of the periods indicated, in conformity with accounting principles generally accepted in the United States of America. These financial statements and financial highlights (hereafter referred to as “financial statements”) are the responsibility of the Funds’ management. Our responsibility is to express an opinion on these financial statements based on our audits. We conducted our audits of these financial statements in accordance with the standards of the Public Company Accounting Oversight Board (United States). Those standards require that we plan and perform the audit to obtain reasonable assurance about whether the financial statements are free of material misstatement. An audit includes examining, on a test basis, evidence supporting the amounts and disclosures in the financial statements, assessing the accounting principles used and significant estimates made by management, and evaluating the overall financial statement presentation. We believe that our audits, which included confirmation of securities at December 31, 2015 by correspondence with the custodians and brokers, by agreement to the underlying ownership records of the transfer agent and the application of alternative auditing procedures where securities purchased had not been received, provide a reasonable basis for our opinion.
/s/PricewaterhouseCoopers LLP
Philadelphia, Pennsylvania
February 16, 2016
76
Special 2015 tax information (unaudited) for Vanguard U.S. Stock Index Funds (Small-Capitalization Portfolios)
This information for the fiscal year ended December 31, 2015, is included pursuant to provisions of the Internal Revenue Code.
The funds distributed qualified dividend income to shareholders during the fiscal year as follows:
| |
| Fund | ($000) |
| Small-Cap Index Fund | 558,503 |
| Small-Cap Growth Index Fund | 82,149 |
| Small-Cap Value Index Fund | 243,540 |
For corporate shareholders, the percentage of investment income (dividend income plus short-term gains, if any) that qualifies for the dividends-received deduction is as follows:
| |
| Fund | Percentage |
| Small-Cap Index Fund | 68.4% |
| Small-Cap Growth Index Fund | 54.5 |
| Small-Cap Value Index Fund | 72.9 |
77
Your Fund’s After-Tax Returns
This table presents returns for your fund both before and after taxes. The after-tax returns are shown in two ways: (1) assuming that an investor owned the fund during the entire period and paid taxes on the fund’s distributions, and (2) assuming that an investor paid taxes on the fund’s distributions and sold all shares at the end of each period.
Calculations are based on the highest individual federal income tax and capital gains tax rates in effect at the times of the distributions and the hypothetical sales. State and local taxes were not considered. After-tax returns reflect any qualified dividend income. (In the example, returns after the sale of fund shares may be higher than those assuming no sale. This occurs when the sale would have produced a capital loss. The calculation assumes that the investor received a tax deduction for the loss.)
The table shows returns for Investor Shares only; returns for other share classes will differ. Please note that your actual after-tax returns will depend on your tax situation and may differ from those shown. Also note that if you own the fund in a tax-deferred account, such as an individual retirement account or a 401(k) plan, this information does not apply to you. Such accounts are not subject to current taxes.
Finally, keep in mind that a fund’s performance—whether before or after taxes—does not guarantee future results.
Average Annual Total Returns: U.S. Stock Index Funds Small-Capitalization Portfolios
Periods Ended December 31, 2015
| | | |
| | One | Five | Ten |
| | Year | Years | Years |
| Small-Cap Index Fund Investor Shares | | | |
| Returns Before Taxes | -3.78% | 10.28% | 7.81% |
| Returns After Taxes on Distributions | -4.16 | 9.90 | 7.48 |
| Returns After Taxes on Distributions and Sale of Fund Shares | -1.96 | 8.09 | 6.27 |
| |
| | One | Five | Ten |
| | Year | Years | Years |
| Small-Cap Growth Index Fund Investor Shares | | | |
| Returns Before Taxes | -2.64% | 10.05% | 8.22% |
| Returns After Taxes on Distributions | -2.90 | 9.84 | 8.07 |
| Returns After Taxes on Distributions and Sale of Fund Shares | -1.40 | 7.93 | 6.68 |
| |
| | One | Five | Ten |
| | Year | Years | Years |
| Small-Cap Value Index Fund Investor Shares | | | |
| Returns Before Taxes | -4.78% | 10.26% | 7.15% |
| Returns After Taxes on Distributions | -5.27 | 9.72 | 6.66 |
| Returns After Taxes on Distributions and Sale of Fund Shares | -2.44 | 8.04 | 5.68 |
78
About Your Fund’s Expenses
As a shareholder of the fund, you incur ongoing costs, which include costs for portfolio management, administrative services, and shareholder reports (like this one), among others. Operating expenses, which are deducted from a fund’s gross income, directly reduce the investment return of the fund.
A fund’s expenses are expressed as a percentage of its average net assets. This figure is known as the expense ratio. The following examples are intended to help you understand the ongoing costs (in dollars) of investing in your fund and to compare these costs with those of other mutual funds. The examples are based on an investment of $1,000 made at the beginning of the period shown and held for the entire period.
The accompanying table illustrates your fund’s costs in two ways:
• Based on actual fund return. This section helps you to estimate the actual expenses that you paid over the period. The ”Ending Account Value“ shown is derived from the fund‘s actual return, and the third column shows the dollar amount that would have been paid by an investor who started with $1,000 in the fund. You may use the information here, together with the amount you invested, to estimate the expenses that you paid over the period.
To do so, simply divide your account value by $1,000 (for example, an $8,600 account value divided by $1,000 = 8.6), then multiply the result by the number given for your fund under the heading ”Expenses Paid During Period.“
• Based on hypothetical 5% yearly return. This section is intended to help you compare your fund‘s costs with those of other mutual funds. It assumes that the fund had a yearly return of 5% before expenses, but that the expense ratio is unchanged. In this case—because the return used is not the fund’s actual return—the results do not apply to your investment. The example is useful in making comparisons because the Securities and Exchange Commission requires all mutual funds to calculate expenses based on a 5% return. You can assess your fund’s costs by comparing this hypothetical example with the hypothetical examples that appear in shareholder reports of other funds.
Note that the expenses shown in the table are meant to highlight and help you compare ongoing costs only and do not reflect transaction costs incurred by the fund for buying and selling securities. Further, the expenses do not include any purchase, redemption, or account service fees described in the fund prospectus. If such fees were applied to your account, your costs would be higher. Your fund does not carry a “sales load.”
The calculations assume no shares were bought or sold during the period. Your actual costs may have been higher or lower, depending on the amount of your investment and the timing of any purchases or redemptions.
You can find more information about the fund’s expenses, including annual expense ratios, in the Financial Statements section of this report. For additional information on operating expenses and other shareholder costs, please refer to your fund’s current prospectus.
79
| | | |
| Six Months Ended December 31, 2015 | | | |
| | Beginning | Ending | Expenses |
| | Account Value | Account Value | Paid During |
| | 6/30/2015 | 12/31/2015 | Period |
| Based on Actual Fund Return | | | |
| Small-Cap Index Fund | | | |
| Investor Shares | $1,000.00 | $924.08 | $0.87 |
| ETF Shares | 1,000.00 | 924.58 | 0.44 |
| Admiral Shares | 1,000.00 | 924.61 | 0.44 |
| Institutional Shares | 1,000.00 | 924.70 | 0.34 |
| Institutional Plus Shares | 1,000.00 | 924.74 | 0.24 |
| Small-Cap Growth Index Fund | | | |
| Investor Shares | $1,000.00 | $913.60 | $0.96 |
| ETF Shares | 1,000.00 | 914.46 | 0.34 |
| Admiral Shares | 1,000.00 | 914.31 | 0.34 |
| Institutional Shares | 1,000.00 | 914.48 | 0.34 |
| Small-Cap Value Index Fund | | | |
| Investor Shares | $1,000.00 | $933.22 | $0.97 |
| ETF Shares | 1,000.00 | 933.66 | 0.39 |
| Admiral Shares | 1,000.00 | 933.90 | 0.39 |
| Institutional Shares | 1,000.00 | 933.57 | 0.34 |
80
| | | |
| Six Months Ended December 31, 2015 | | | |
| | Beginning | Ending | Expenses |
| | Account Value | Account Value | Paid During |
| | 6/30/2015 | 12/31/2015 | Period |
| Based on Hypothetical 5% Yearly Return | | | |
| Small-Cap Index Fund | | | |
| Investor Shares | $1,000.00 | $1,024.30 | $0.92 |
| ETF Shares | 1,000.00 | 1,024.75 | 0.46 |
| Admiral Shares | 1,000.00 | 1,024.75 | 0.46 |
| Institutional Shares | 1,000.00 | 1,024.85 | 0.36 |
| Institutional Plus Shares | 1,000.00 | 1,024.95 | 0.26 |
| Small-Cap Growth Index Fund | | | |
| Investor Shares | $1,000.00 | $1,024.20 | $1.02 |
| ETF Shares | 1,000.00 | 1,024.85 | 0.36 |
| Admiral Shares | 1,000.00 | 1,024.85 | 0.36 |
| Institutional Shares | 1,000.00 | 1,024.85 | 0.36 |
| Small-Cap Value Index Fund | | | |
| Investor Shares | $1,000.00 | $1,024.20 | $1.02 |
| ETF Shares | 1,000.00 | 1,024.80 | 0.41 |
| Admiral Shares | 1,000.00 | 1,024.80 | 0.41 |
| Institutional Shares | 1,000.00 | 1,024.85 | 0.36 |
The calculations are based on expenses incurred in the most recent six-month period. The funds’ annualized six-month expense ratios for that period are: for the Small-Cap Index Fund, 0.18% for Investor Shares, 0.09% for ETF Shares, 0.09% for Admiral Shares, 0.07% for Institutional Shares, and 0.05% for Institutional Plus Shares; for the Small-Cap Growth Index Fund, 0.20% for Investor Shares, 0.07% for ETF Shares, 0.07% for Admiral Shares, and 0.07% for Institutional Shares; and for the Small-Cap Value Index Fund, 0.20% for Investor Shares, 0.08% for ETF Shares, 0.08% for Admiral Shares, and 0.07% for Institutional Shares. The dollar amounts shown as “Expenses Paid” are equal to the annualized expense ratio multiplied by the average account value over the period, multiplied by the number of days in the most recent six-month period, then divided by the number of days in the most recent 12-month period (184/365).
81
Glossary
30-Day SEC Yield. A fund’s 30-day SEC yield is derived using a formula specified by the U.S. Securities and Exchange Commission. Under the formula, data related to the fund’s security holdings in the previous 30 days are used to calculate the fund’s hypothetical net income for that period, which is then annualized and divided by the fund’s estimated average net assets over the calculation period. For the purposes of this calculation, a security’s income is based on its current market yield to maturity (for bonds), its actual income (for asset-backed securities), or its projected dividend yield (for stocks). Because the SEC yield represents hypothetical annualized income, it will differ—at times significantly—from the fund’s actual experience. As a result, the fund’s income distributions may be higher or lower than implied by the SEC yield.
Beta. A measure of the magnitude of a fund’s past share-price fluctuations in relation to the ups and downs of a given market index. The index is assigned a beta of 1.00. Compared with a given index, a fund with a beta of 1.20 typically would have seen its share price rise or fall by 12% when the index rose or fell by 10%. For this report, beta is based on returns over the past 36 months for both the fund and the index. Note that a fund’s beta should be reviewed in conjunction with its R-squared (see definition). The lower the R-squared, the less correlation there is between the fund and the index, and the less reliable beta is as an indicator of volatility.
Dividend Yield. Dividend income earned by stocks, expressed as a percentage of the aggregate market value (or of net asset value, for a fund). The yield is determined by dividing the amount of the annual dividends by the aggregate value (or net asset value) at the end of the period. For a fund, the dividend yield is based solely on stock holdings and does not include any income produced by other investments.
Earnings Growth Rate. The average annual rate of growth in earnings over the past five years for the stocks now in a fund.
Equity Exposure. A measure that reflects a fund’s investments in stocks and stock futures. Any holdings in short-term reserves are excluded.
Expense Ratio. A fund’s total annual operating expenses expressed as a percentage of the fund’s average net assets. The expense ratio includes management and administrative expenses, but does not include the transaction costs of buying and selling portfolio securities.
Foreign Holdings. The percentage of a fund represented by securities or depositary receipts of companies based outside the United States.
Inception Date. The date on which the assets of a fund (or one of its share classes) are first invested in accordance with the fund’s investment objective. For funds with a subscription period, the inception date is the day after that period ends. Investment performance is measured from the inception date.
Median Market Cap. An indicator of the size of companies in which a fund invests; the midpoint of market capitalization (market price x shares outstanding) of a fund’s stocks, weighted by the proportion of the fund’s assets invested in each stock. Stocks representing half of the fund’s assets have market capitalizations above the median, and the rest are below it.
Price/Book Ratio. The share price of a stock divided by its net worth, or book value, per share. For a fund, the weighted average price/book ratio of the stocks it holds.
82
Price/Earnings Ratio. The ratio of a stock’s current price to its per-share earnings over the past year. For a fund, the weighted average P/E of the stocks it holds. P/E is an indicator of market expectations about corporate prospects; the higher the P/E, the greater the expectations for a company’s future growth.
R-Squared. A measure of how much of a fund’s past returns can be explained by the returns from the market in general, as measured by a given index. If a fund’s total returns were precisely synchronized with an index’s returns, its R-squared would be 1.00. If the fund’s returns bore no relationship to the index’s returns, its R-squared would be 0. For this report, R-squared is based on returns over the past 36 months for both the fund and the index.
Return on Equity. The annual average rate of return generated by a company during the past five years for each dollar of shareholder’s equity (net income divided by shareholder’s equity). For a fund, the weighted average return on equity for the companies whose stocks it holds.
Short-Term Reserves. The percentage of a fund invested in highly liquid, short-term securities that can be readily converted to cash.
Turnover Rate. An indication of the fund’s trading activity. Funds with high turnover rates incur higher transaction costs and may be more likely to distribute capital gains (which may be taxable to investors). The turnover rate excludes in-kind transactions, which have minimal impact on costs.
Benchmark Information
Spliced Small-Cap Growth Index: S&P SmallCap 600 Growth Index (formerly known as the S&P SmallCap 600/Barra Growth Index) through May 16, 2003; MSCI US Small Cap Growth Index through April 16, 2013; CRSP US Small Cap Growth Index thereafter.
Spliced Small-Cap Index: Russell 2000 Index through May 16, 2003; MSCI US Small Cap 1750 Index through January 30, 2013; CRSP US Small Cap Index thereafter.
Spliced Small-Cap Value Index: S&P SmallCap 600 Value Index (formerly known as the S&P SmallCap 600/Barra Value Index) through May 16, 2003; MSCI US Small Cap Value Index through April 16, 2013; CRSP US Small Cap Value Index thereafter.
83
The People Who Govern Your Fund
The trustees of your mutual fund are there to see that the fund is operated and managed in your best interests since, as a shareholder, you are a part owner of the fund. Your fund’s trustees also serve on the board of directors of The Vanguard Group, Inc., which is owned by the Vanguard funds and provides services to them on an at-cost basis.
A majority of Vanguard’s board members are independent, meaning that they have no affiliation with Vanguard or the funds they oversee, apart from the sizable personal investments they have made as private individuals. The independent board members have distinguished backgrounds in business, academia, and public service. Each of the trustees and executive officers oversees 194 Vanguard funds.
The following table provides information for each trustee and executive officer of the fund. More information about the trustees is in the Statement of Additional Information, which can be obtained, without charge, by contacting Vanguard at 800-662-7447, or online at vanguard.com.
InterestedTrustee1
F. William McNabb III
Born 1957. Trustee Since July 2009. Chairman of the Board. Principal Occupation(s) During the Past Five Years and Other Experience: Chairman of the Board of The Vanguard Group, Inc., and of each of the investment companies served by The Vanguard Group, since January 2010; Director of The Vanguard Group since 2008; Chief Executive Officer and President of The Vanguard Group, and of each of the investment companies served by The Vanguard Group, since 2008; Director of Vanguard Marketing Corporation; Managing Director of The Vanguard Group (1995–2008).
IndependentTrustees
Emerson U. Fullwood
Born 1948. Trustee Since January 2008. Principal Occupation(s) During the Past Five Years and Other Experience: Executive Chief Staff and Marketing Officer for North America and Corporate Vice President (retired 2008) of Xerox Corporation (document management products and services); Executive in Residence and 2009–2010 Distinguished Minett Professor at the Rochester Institute of Technology; Director of SPX Corporation (multi-industry manufacturing), the United Way of Rochester, the University of Rochester Medical Center, Monroe Community College Foundation, and North Carolina A&T University.
Rajiv L. Gupta
Born 1945. Trustee Since December 2001.2 Principal Occupation(s) During the Past Five Years and Other Experience: Chairman and Chief Executive Officer (retired 2009) and President (2006–2008) of Rohm and Haas Co. (chemicals); Director of Tyco International PLC (diversified manufacturing and services), Hewlett-Packard Co. (electronic computer manufacturing), and Delphi Automotive PLC (automotive components); Senior Advisor at New Mountain Capital.
Amy Gutmann
Born 1949. Trustee Since June 2006. Principal Occupation(s) During the Past Five Years and Other Experience: President of the University of Pennsylvania; Christopher H. Browne Distinguished Professor of Political Science, School of Arts and Sciences, and Professor of Communication, Annenberg School for Communication, with secondary faculty appointments in the Department of Philosophy, School of Arts and Sciences, and at the Graduate School of Education, University of Pennsylvania; Trustee of the National Constitution Center; Chair of the Presidential Commission for the Study of Bioethical Issues.
JoAnn Heffernan Heisen
Born 1950. Trustee Since July 1998. Principal Occupation(s) During the Past Five Years and Other Experience: Corporate Vice President and Chief Global Diversity Officer (retired 2008) and Member of the Executive Committee (1997–2008) of Johnson & Johnson (pharmaceuticals/medical devices/consumer products); Director of Skytop Lodge Corporation (hotels) and the Robert Wood Johnson Foundation; Member of the Advisory Board of the Institute for Women’s Leadership at Rutgers University.
F. Joseph Loughrey
Born 1949. Trustee Since October 2009. Principal Occupation(s) During the Past Five Years and Other Experience: President and Chief Operating Officer (retired 2009) of Cummins Inc. (industrial machinery); Chairman of the Board of Hillenbrand, Inc. (specialized consumer services), and of Oxfam America; Director of SKF AB (industrial machinery), Hyster-Yale Materials Handling, Inc. (forklift trucks), the Lumina Foundation for Education, and the V Foundation for Cancer Research; Member of the Advisory Council for the College of Arts and Letters and of the Advisory Board to the Kellogg Institute for International Studies, both at the University of Notre Dame.
Mark Loughridge
Born 1953. Trustee Since March 2012. Principal Occupation(s) During the Past Five Years and Other Experience: Senior Vice President and Chief Financial Officer (retired 2013) at IBM (information technology services); Fiduciary Member of IBM’s Retirement Plan Committee (2004–2013); Director of the Dow Chemical Company; Member of the Council on Chicago Booth.
Scott C. Malpass
Born 1962. Trustee Since March 2012. Principal Occupation(s) During the Past Five Years and Other Experience: Chief Investment Officer and Vice President at the University of Notre Dame; Assistant Professor of Finance at the Mendoza College of Business at Notre Dame; Member of the Notre Dame 403(b) Investment Committee; Board Member of TIFF Advisory Services, Inc., and Catholic Investment Services, Inc. (investment advisors); Member of the Investment Advisory Committee of Major League Baseball.
André F. Perold
Born 1952. Trustee Since December 2004. Principal Occupation(s) During the Past Five Years and Other Experience: George Gund Professor of Finance and Banking, Emeritus at the Harvard Business School (retired 2011); Chief Investment Officer and Managing Partner of HighVista Strategies LLC (private investment firm); Director of Rand Merchant Bank; Overseer of the Museum of Fine Arts Boston.
Peter F. Volanakis
Born 1955. Trustee Since July 2009. Principal Occupation(s) During the Past Five Years and Other Experience: President and Chief Operating Officer (retired 2010) of Corning Incorporated (communications equipment); Trustee of Colby-Sawyer College; Member of the Advisory Board of the Norris Cotton Cancer Center and of the Advisory Board of the Parthenon Group (strategy consulting).
Executive Officers
Glenn Booraem
Born 1967. Treasurer Since May 2015. Principal Occupation(s) During the Past Five Years and Other Experience: Principal of The Vanguard Group, Inc.; Treasurer of each of the investment companies served by The Vanguard Group; Controller of each of the investment companies served by The Vanguard Group (2010–2015); Assistant Controller of each of the investment companies served by The Vanguard Group (2001–2010).
Thomas J. Higgins
Born 1957. Chief Financial Officer Since September 2008. Principal Occupation(s) During the Past Five Years and Other Experience: Principal of The Vanguard Group, Inc.; Chief Financial Officer of each of the investment companies served by The Vanguard Group; Treasurer of each of the investment companies served by The Vanguard Group (1998–2008).
Peter Mahoney
Born 1974. Controller Since May 2015. Principal Occupation(s) During the Past Five Years and Other Experience: Head of Global Fund Accounting at The Vanguard Group, Inc.; Controller of each of the investment companies served by The Vanguard Group; Head of International Fund Services at The Vanguard Group (2008–2014).
Heidi Stam
Born 1956. Secretary Since July 2005. Principal Occupation(s) During the Past Five Years and Other Experience: Managing Director of The Vanguard Group, Inc.; General Counsel of The Vanguard Group; Secretary of The Vanguard Group and of each of the investment companies served by The Vanguard Group; Director and Senior Vice President of Vanguard Marketing Corporation.
Vanguard Senior Management Team
Mortimer J. Buckley
Kathleen C. Gubanich
Paul A. Heller
Martha G. King
John T. Marcante
Chris D. McIsaac
James M. Norris
Thomas M. Rampulla
Glenn W. Reed
Karin A. Risi
Chairman Emeritus and Senior Advisor
John J. Brennan
Chairman, 1996–2009
Chief Executive Officer and President, 1996–2008
Founder John C. Bogle
Chairman and Chief Executive Officer, 1974–1996
1 Mr. McNabb is considered an “interested person,” as defined in the Investment Company Act of 1940, because he is an officer of the Vanguard funds.
2 December 2002 for Vanguard Equity Income Fund, the Vanguard Municipal Bond Funds, and the Vanguard State Tax-Exempt Funds.

|
| P.O. Box 2600 |
| Valley Forge, PA 19482-2600 |
Connect with Vanguard® > vanguard.com
| |
| Fund Information > 800-662-7447 | |
| Direct Investor Account Services > 800-662-2739 | |
| Institutional Investor Services > 800-523-1036 | |
| Text Telephone for People | |
| Who Are Deaf or Hard of Hearing> 800-749-7273 | |
| |
| This material may be used in conjunction | |
| with the offering of shares of any Vanguard | |
| fund only if preceded or accompanied by | |
| the fund’s current prospectus. | |
| |
| All comparative mutual fund data are from Lipper, a | |
| Thomson Reuters Company, or Morningstar, Inc., unless | |
| otherwise noted. | |
| |
| You can obtain a free copy of Vanguard’s proxy voting | |
| guidelines by visiting vanguard.com/proxyreporting or by | |
| calling Vanguard at 800-662-2739. The guidelines are | |
| also available from the SEC’s website, sec.gov. In | |
| addition, you may obtain a free report on how your fund | |
| voted the proxies for securities it owned during the 12 | |
| months ended June 30. To get the report, visit either | |
| vanguard.com/proxyreporting or sec.gov. | |
| |
| You can review and copy information about your fund at | |
| the SEC’s Public Reference Room in Washington, D.C. To | |
| find out more about this public service, call the SEC at | |
| 202-551-8090. Information about your fund is also | |
| available on the SEC’s website, and you can receive | |
| copies of this information, for a fee, by sending a | |
| request in either of two ways: via email addressed to | |
| publicinfo@sec.gov or via regular mail addressed to the | |
| Public Reference Section, Securities and Exchange | |
| Commission, Washington, DC 20549-1520. | |
| |
| | © 2016 The Vanguard Group, Inc. |
| | All rights reserved. |
| | Vanguard Marketing Corporation, Distributor. |
| |
| | Q480 022016 |

Annual Report | December 31, 2015
Vanguard U.S. Stock Index Funds
Mid-Capitalization Portfolios
Vanguard Extended Market Index Fund
Vanguard Mid-Cap Index Fund
Vanguard Mid-Cap Growth Index Fund
Vanguard Mid-Cap Value Index Fund
Vanguard’s Principles for Investing Success
We want to give you the best chance of investment success. These principles, grounded in Vanguard’s research and experience, can put you on the right path.
Goals. Create clear, appropriate investment goals.
Balance. Develop a suitable asset allocation using broadly diversified funds. Cost. Minimize cost.
Discipline. Maintain perspective and long-term discipline.
A single theme unites these principles: Focus on the things you can control.
We believe there is no wiser course for any investor.
| |
| Contents | |
| Your Fund’s Total Returns. | 1 |
| Chairman’s Letter. | 4 |
| Extended Market Index Fund. | 11 |
| Mid-Cap Index Fund. | 33 |
| Mid-Cap Growth Index Fund. | 56 |
| Mid-Cap Value Index Fund. | 73 |
| Your Fund’s After-Tax Returns. | 92 |
| About Your Fund’s Expenses. | 94 |
| Glossary. | 97 |
Please note: The opinions expressed in this report are just that—informed opinions. They should not be considered promises or advice. Also, please keep in mind that the information and opinions cover the period through the date on the front of this report. Of course, the risks of investing in your fund are spelled out in the prospectus.
See the Glossary for definitions of investment terms used in this report.
About the cover: Pictured is a sailing block on the Brilliant, a 1932 schooner docked in Mystic, Connecticut. A type of pulley, the sailing block helps coordinate the setting of the sails. At Vanguard, the intricate coordination of technology and people allows us to help millions of clients around the world reach their financial goals.
| |
| Your Fund’s Total Returns | |
| |
| |
| |
| |
| Fiscal Year Ended December 31, 2015 | |
| | Total |
| | Returns |
| Vanguard Extended Market Index Fund | |
| Investor Shares | -3.39% |
| ETF Shares | |
| Market Price | -3.26 |
| Net Asset Value | -3.26 |
| Admiral™ Shares | -3.27 |
| Institutional Shares | -3.24 |
| Institutional Plus Shares | -3.23 |
| S&P Completion Index | -3.35 |
| Mid-Cap Core Funds Average | -4.19 |
| Mid-Cap Core Funds Average: Derived from data provided by Lipper, a Thomson Reuters Company. | |
| Vanguard Mid-Cap Index Fund | |
| Investor Shares | -1.46% |
| ETF Shares | |
| Market Price | -1.35 |
| Net Asset Value | -1.34 |
| Admiral Shares | -1.34 |
| Institutional Shares | -1.33 |
| Institutional Plus Shares | -1.30 |
| CRSP US Mid Cap Index | -1.28 |
| Mid-Cap Core Funds Average | -4.19 |
Mid-Cap Core Funds Average: Derived from data provided by Lipper, a Thomson Reuters Company.
Admiral Shares carry lower expenses and are available to investors who meet certain account-balance requirements. Institutional Shares and Institutional Plus Shares are available to certain institutional investors who meet specific administrative, service, and account-size criteria. The Vanguard ETF® Shares shown are traded on the NYSE Arca exchange and are available only through brokers. The table provides ETF returns based on both the NYSE Arca market price and the net asset value for a share. U.S. Pat. Nos. 6,879,964; 7,337,138; 7,720,749; 7,925,573; 8,090,646; and 8,417,623.
1
| |
| Your Fund’s Total Returns | |
| |
| |
| |
| |
| Fiscal Year Ended December 31, 2015 | |
| | Total |
| | Returns |
| Vanguard Mid-Cap Growth Index Fund | |
| Investor Shares | -1.13% |
| ETF Shares | |
| Market Price | -1.01 |
| Net Asset Value | -1.00 |
| Admiral Shares | -0.98 |
| CRSP US Mid Cap Growth Index | -0.93 |
| Mid-Cap Growth Funds Average | -1.16 |
| Mid-Cap Growth Funds Average: Derived from data provided by Lipper, a Thomson Reuters Company. | |
| Vanguard Mid-Cap Value Index Fund | |
| Investor Shares | -1.91% |
| ETF Shares | |
| Market Price | -1.80 |
| Net Asset Value | -1.80 |
| Admiral Shares | -1.80 |
| CRSP US Mid Cap Value Index | -1.75 |
| Mid-Cap Value Funds Average | -4.84 |
Mid-Cap Value Funds Average: Derived from data provided by Lipper, a Thomson Reuters Company.
Admiral Shares carry lower expenses and are available to investors who meet certain account-balance requirements. Institutional Shares and Institutional Plus Shares are available to certain institutional investors who meet specific administrative, service, and account-size criteria. The Vanguard ETF® Shares shown are traded on the NYSE Arca exchange and are available only through brokers. The table provides ETF returns based on both the NYSE Arca market price and the net asset value for a share. U.S. Pat. Nos. 6,879,964; 7,337,138; 7,720,749; 7,925,573; 8,090,646; and 8,417,623.
For the ETF Shares, the market price is determined by the midpoint of the bid-offer spread as of the closing time of the New York Stock Exchange (generally 4 p.m., Eastern time). The net asset value is also determined as of the NYSE closing time. For more information about how the ETF Shares' market prices have compared with their net asset value, visit vanguard.com, select your ETF, and then select the Price and Performance tab. The ETF premium/discount analysis there shows the percentages of days on which the ETF Shares' market price was above or below the NAV.
2
| | | | |
| Your Fund’s Performance at a Glance | | | |
| |
| |
| |
| |
| December 31, 2014, Through December 31, 2015 | | | | |
| | | | Distributions Per Share |
| | Starting | Ending | | |
| | Share | Share | Income | Capital |
| | Price | Price | Dividends | Gains |
| Vanguard Extended Market Index Fund | | | | |
| Investor Shares | $66.63 | $63.61 | $0.765 | $0.000 |
| ETF Shares | 87.79 | 83.80 | 1.128 | 0.000 |
| Admiral Shares | 66.61 | 63.58 | 0.856 | 0.000 |
| Institutional Shares | 66.60 | 63.58 | 0.869 | 0.000 |
| Institutional Plus Shares | 164.36 | 156.89 | 2.175 | 0.000 |
| Vanguard Mid-Cap Index Fund | | | | |
| Investor Shares | $33.72 | $32.79 | $0.435 | $0.000 |
| ETF Shares | 123.50 | 120.07 | 1.766 | 0.000 |
| Admiral Shares | 152.97 | 148.72 | 2.180 | 0.000 |
| Institutional Shares | 33.79 | 32.85 | 0.485 | 0.000 |
| Institutional Plus Shares | 166.65 | 162.03 | 2.424 | 0.000 |
| Vanguard Mid-Cap Growth Index Fund | | | | |
| Investor Shares | $39.94 | $39.22 | $0.269 | $0.000 |
| ETF Shares | 101.57 | 99.75 | 0.810 | 0.000 |
| Admiral Shares | 43.72 | 42.94 | 0.352 | 0.000 |
| Vanguard Mid-Cap Value Index Fund | | | | |
| Investor Shares | $35.19 | $33.86 | $0.647 | $0.000 |
| ETF Shares | 89.39 | 85.99 | 1.758 | 0.000 |
| Admiral Shares | 46.30 | 44.54 | 0.909 | 0.000 |
3

Chairman’s Letter
Dear Shareholder,
U.S. stocks registered a very small gain in 2015 amid volatility across global markets. Midsize- and small-company stocks didn’t keep pace with larger-company stocks, which represent the lion’s share of the value of the U.S. market.
In this environment, the three Vanguard Mid-Cap Index Funds delivered negative returns between –1% and –2% for the 12 months ended December 31, 2015. Vanguard Extended Market Index Fund, which includes both small- and mid-capitalization holdings, finished with a return of –3.39% (all returns cited are for Investor Shares).
All four funds covered in this report closely tracked their target indexes, and all recorded results that were ahead of the average returns of peer funds.
If you hold your fund in a taxable account, you may wish to review the after-tax returns that appear later in this report.
Despite troubles, U.S. stocks eked out a seventh year of gains
U.S. stocks returned 0.48% for the 12 months ended December 31, 2015. Although the broad market recorded its worst performance since 2008, it still posted gains for the seventh straight calendar year when dividends are factored into returns.
4
Stocks rose modestly over the first half of the year but slid in August and September as concerns mounted that China’s economic slowdown would spread globally. Falling oil and commodity prices also affected economies and markets across the world for better or worse. Central banks in Europe and Asia bolstered their stimulus efforts against weak growth and low inflation. And in December, the Federal Reserve ended months of uncertainty when it raised the target for short-term interest rates to 0.25%–0.5%.
International stocks returned about –5%, restrained by the U.S. dollar’s strength against many foreign currencies. Emerging markets fared the worst.
U.S. bonds ended the year with a slender advance
The broad U.S. taxable bond market gained 0.55% over the 12 months; income accounted for the modestly positive result. The yield of the 10-year Treasury note ended December at 2.30%, up from 2.19% a year earlier. (Bond prices and yields move in opposite directions.)
Investors focused on the Fed’s stance on short-term interest rates and alternately embraced or avoided safe-haven assets depending on the stock market’s strength.
International bond markets (as measured by the Barclays Global Aggregate Index ex USD) returned –6.02%, reduced by the
| | | |
| Market Barometer | | | |
| |
| | | Average Annual Total Returns |
| | | Periods Ended December 31, 2015 |
| | One | Three | Five |
| | Year | Years | Years |
| Stocks | | | |
| Russell 1000 Index (Large-caps) | 0.92% | 15.01% | 12.44% |
| Russell 2000 Index (Small-caps) | -4.41 | 11.65 | 9.19 |
| Russell 3000 Index (Broad U.S. market) | 0.48 | 14.74 | 12.18 |
| FTSE All-World ex US Index (International) | -4.72 | 2.04 | 1.48 |
| |
| Bonds | | | |
| Barclays U.S. Aggregate Bond Index (Broad taxable market) | 0.55% | 1.44% | 3.25% |
| Barclays Municipal Bond Index (Broad tax-exempt market) | 3.30 | 3.16 | 5.35 |
| Citigroup Three-Month U.S. Treasury Bill Index | 0.03 | 0.02 | 0.04 |
| |
| CPI | | | |
| Consumer Price Index | 0.73% | 1.00% | 1.53% |
5
dollar’s strength against many foreign currencies. Without this currency effect, returns were modestly positive.
Although the Fed raised its target for short-term interest rates in mid-December, returns for money market funds and savings accounts remained limited by the 0%–0.25% levels in place for much of the past seven years.
Smaller-company stocks lagged mid-cap stocks
The Extended Market Index Fund, which includes both mid- and small-capitalization stocks, underperformed the three Vanguard Mid-Cap Index Funds. At the same time, growth stocks did a bit better than value, causing the Mid-Cap Growth Fund to finish slightly ahead of the others. (Value stocks tend to sell at relatively low prices in relation to their earnings or book value. Growth stocks typically have higher valuations because of the earnings and revenue potential of the underlying companies.)
The performance of all four funds was hurt notably by energy-related stocks, which returned –25% or worse. The sharp slide in oil prices punished the sector, in part because of high output levels from some leading oil-producing countries and concerns about the slower growth in China, the world’s largest oil importer. Natural gas prices also dropped, though not as dramatically. The vast majority of companies engaged in exploration, production, and services suffered.
| | | | | | |
| Expense Ratios | | | | | | |
| Your Fund Compared With Its Peer Group | | | | | | |
| |
| | | | | | | Peer |
| | Investor | ETF | Admiral | Institutional | Institutional | Group |
| | Shares | Shares | Shares | Shares | Plus Shares | Average |
| Extended Market Index Fund | 0.23% | 0.10% | 0.10% | 0.08% | 0.06% | 1.19% |
| Mid-Cap Index Fund | 0.23 | 0.09 | 0.09 | 0.08 | 0.06 | 1.19 |
| Mid-Cap Growth Index Fund | 0.23 | 0.09 | 0.09 | — | — | 1.31 |
| Mid-Cap Value Index Fund | 0.23 | 0.09 | 0.09 | — | — | 1.29 |
The fund expense ratios shown are from the prospectus dated April 28, 2015, and represent estimated costs for the current fiscal year. For the fiscal year ended December 31, 2015, the funds’ expense ratios were: for the Extended Market Index Fund, 0.22% for Investor Shares, 0.09% for ETF Shares, 0.09% for Admiral Shares, 0.07% for Institutional Shares, and 0.05% for Institutional Plus Shares; for the Mid-Cap Index Fund, 0.20% for Investor Shares, 0.08% for ETF Shares, 0.08% for Admiral Shares, 0.07% for Institutional Shares, and 0.05% for Institutional Plus Shares; for the Mid-Cap Growth Index Fund, 0.20% for Investor Shares, 0.08% for ETF Shares, and 0.08% for Admiral Shares; and for the Mid-Cap Value Index Fund, 0.20% for Investor Shares, 0.08% for ETF Shares, and 0.08% for Admiral Shares. The peer-group expense ratios are derived from data provided by Lipper, a Thomson Reuters Company, and capture information through year-end 2014.
Peer groups: For the Extended Market and Mid-Cap Index Funds, Mid-Cap Core Funds; for the Mid-Cap Growth Index Fund, Mid-Cap Growth Funds; for the Mid-Cap Value Index Fund, Mid-Cap Value Funds.
6
Stocks of companies involved in basic materials sank at least –13% in three of the four funds, as the prices of many commodities fell along with the price of oil. Metals and mining firms posted the poorest results, but chemical companies, which make up the largest subsector, also struggled. Materials stocks produced a modest gain only in the Mid-Cap Growth Index Fund, but their presence in that fund is quite small.
Among other sectors, industrials and utilities hurt performance in all four funds.
There were bright spots. Health care stocks climbed between 9% and 11% in the four funds as favorable long-term demographic and economic trends continued to lift the sector. Mid-cap biotechnology and health care equipment firms were particularly strong.
| |
| Total Returns | |
| Ten Years Ended December 31, 2015 | |
| | Average |
| | Annual Return |
| Extended Market Index Fund Investor Shares | 7.64% |
| S&P Completion Index | 7.68 |
| Mid-Cap Core Funds Average | 6.59 |
| Mid-Cap Core Funds Average: Derived from data provided by Lipper, a Thomson Reuters Company. | |
| |
| Mid-Cap Index Fund Investor Shares | 7.76% |
| Spliced Mid-Cap Index | 7.94 |
| Mid-Cap Core Funds Average | 6.59 |
| For a benchmark description, see the Glossary. | |
| Mid-Cap Core Funds Average: Derived from data provided by Lipper, a Thomson Reuters Company. | |
| |
| Mid-Cap Growth Index Fund Investor Shares (Returns since inception: 8/24/2006) | 8.00% |
| Spliced Mid-Cap Growth Index | 8.18 |
| Mid-Cap Growth Funds Average | 7.38 |
| For a benchmark description, see the Glossary. | |
| Mid-Cap Growth Funds Average: Derived from data provided by Lipper, a Thomson Reuters Company. | |
| |
| Mid-Cap Value Index Fund Investor Shares (Returns since inception: 8/24/2006) | 7.80% |
| Spliced Mid-Cap Value Index | 7.99 |
| Mid-Cap Value Funds Average | 6.66 |
| For a benchmark description, see the Glossary. | |
| Mid-Cap Value Funds Average: Derived from data provided by Lipper, a Thomson Reuters Company. | |
The figures shown represent past performance, which is not a guarantee of future results. (Current performance may be lower or higher than the performance data cited. For performance data current to the most recent month-end, visit our website at vanguard.com/performance.) Note, too, that both investment returns and principal value can fluctuate widely, so an investor’s shares, when sold, could be worth more or less than their original cost.
7
The financial sector recorded positive returns of between 2% and 5%. Strength in REITs (real estate investment trusts) and nonlife-insurance companies more than offset losses among consumer finance firms.
Technology stocks returned 1%–2%. Good results in the communications equipment and software subsectors were partially offset by negative returns among equipment and hardware companies.
Over the decade just ended, the funds produced solid returns
For the ten years ended December 31, 2015, the average annual return was 7.64% for the Extended Market Index Fund and 7.76% for the Mid-Cap Index Fund. The two other funds were launched not quite ten years ago. The average annual return since inception was 8.00% for the Mid-Cap Growth Index Fund and 7.80% for the Mid-Cap Value Index Fund. In each case, the results exceeded the average annual returns of peers.
Vanguard’s outlook for investors: Not bearish, but cautious
In Vanguard’s recently published global economic and investment outlook, Global Chief Economist Joseph Davis and his team discuss various market and economic events 2016 may bring, along with challenges and opportunities for investors.
Our forecast includes “frustratingly fragile” economic growth and more modest long-term returns from the global stock and bond markets. The report cautions that for the decade ending 2025, returns for a balanced portfolio are likely to be moderately below historical averages.
Our simulations indicate that the average annualized returns of a 60% equity/40% bond portfolio for the decade are most likely to be centered in the 3%–5% range after inflation, below the actual average after-inflation return of 5.5% for the same portfolio since 1926.
Even so, Vanguard’s steadfast belief in its principles for investing success—focusing on clear goals, a suitable asset allocation, low costs, and long-term discipline—remains unchanged.
For more information about our expectations and the probability of various outcomes, see
Vanguard’s Economic and Investment Outlook, available at vanguard.com/research.
IMPORTANT: The projections or other information generated by the Vanguard Capital Markets Model® (VCMM) regarding the likelihood of various investment outcomes are hypothetical in nature, do not reflect actual investment results, and are not guarantees of future results. Distribution of return outcomes from VCMM, derived from 10,000 simulations for U.S. equity returns and fixed income returns. Simulations as of September 30, 2015. Results from the model may vary with each use and over time. For more information, please see page 9.
8
All four funds have closely tracked their target indexes, thanks to the expertise of Vanguard Equity Index Group, the advisor overseeing the funds. It was helped by the funds’ low expenses—a key factor for investors looking to increase their chances of success.
To reach your long-term goals, be realistic and try to save more
Although there have been times when it felt as if stocks and bonds were riding a roller coaster, the markets have generally risen in recent years. The broad global stock market in particular has posted some impressive gains since its turnaround began in 2009.
But 2015 served as a reminder that markets aren’t always favorable. The U.S. stock and bond markets were barely positive, and international stocks and unhedged bonds finished in the red.
In Vanguard’s recently updated long-term look at the economy and markets, our global economists explain why they expect economic growth to remain “frustratingly fragile,” and why their outlook for stock and bond markets is the most guarded since 2006. (For more details, see the box on page 8 and Vanguard’s Economic and Investment Outlook, available at vanguard.com/research.)
Given these muted expectations, what’s the best course of action? I’ve often encouraged shareholders to focus on the things they can control. That advice holds true today.
Consider saving more than you think you may need. That’s one way you can prepare for the volatility that may lie ahead, particularly as markets adjust to changes in policies from the Fed and other central banks.
IMPORTANT: The projections or other information generated by the Vanguard Capital Markets Model (VCMM) regarding the likelihood of various investment outcomes are hypothetical in nature, do not reflect actual investment results, and are not guarantees of future results. VCMM results will vary with each use and over time.
The VCMM projections are based on a statistical analysis of historical data. Future returns may behave differently from the historical patterns captured in the VCMM. More important, the VCMM may be underestimating extreme negative scenarios unobserved in the historical period on which the model estimation is based.
The VCMM is a proprietary financial simulation tool developed and maintained by Vanguard’s primary investment research and advice teams. The model forecasts distributions of future returns for a wide array of broad asset classes. Those asset classes include U.S. and international equity markets, several maturities of the U.S. Treasury and corporate fixed income markets, international fixed income markets, U.S. money markets, commodities, and certain alternative investment strategies. The theoretical and empirical foundation for the VCMM is that the returns of various asset classes reflect the compensation investors require for bearing different types of systematic risk (beta). At the core of the model are estimates of the dynamic statistical relationship between risk factors and asset returns, obtained from statistical analysis based on available monthly financial and economic data from as early as 1960. Using a system of estimated equations, the model then applies a Monte Carlo simulation method to project the estimated interrelationships among risk factors and asset classes as well as uncertainty and randomness over time. The model generates a large set of simulated outcomes for each asset class over several time horizons. Forecasts are obtained by computing measures of central tendency in these simulations. Results produced by the tool will vary with each use and over time.
9
And, as always, investors would be well-
served to follow Vanguard’s principles for
investing success:
• Goals. Create clear, appropriate
investment goals.
• Balance. Develop a suitable asset
allocation using broadly diversified funds.
• Cost. Minimize cost.
• Discipline. Maintain perspective and
long-term discipline.
As with saving, each of these principles is within your control, and focusing on them can keep you on the right path.
As always, thank you for investing with Vanguard.
Sincerely,

F. William McNabb III
Chairman and Chief Executive Officer
January 19, 2016
10
| | | | | |
| Extended Market Index Fund | | | |
| |
| |
| Fund Profile | | | | | |
| As of December 31, 2015 | | | | | |
| |
| Share-Class Characteristics | | | | | |
| | Investor | | Admiral | Institutional | Institutional |
| | Shares | ETF Shares | Shares | Shares | Plus Shares |
| Ticker Symbol | VEXMX | VXF | VEXAX | VIEIX | VEMPX |
| Expense Ratio1 | 0.23% | 0.10% | 0.10% | 0.08% | 0.06% |
| 30-Day SEC Yield | 1.26% | 1.40% | 1.39% | 1.41% | 1.46% |
| | | |
| Portfolio Characteristics | | |
| | | | DJ |
| | | | U.S. |
| | | S&P | Total |
| | | Completion | Market |
| | Fund | Index FA Index |
| Number of Stocks | 3,361 | 3,438 | 3,960 |
| Median Market Cap | $3.7B | $3.7B | $51.4B |
| Price/Earnings Ratio | 32.1x | 32.2x | 21.9x |
| Price/Book Ratio | 2.3x | 2.3x | 2.7x |
| Return on Equity | 11.6% | 11.6% | 17.2% |
| Earnings Growth | | | |
| Rate | 11.2% | 11.2% | 9.5% |
| Dividend Yield | 1.5% | 1.5% | 2.1% |
| Foreign Holdings | 0.0% | 0.0% | 0.0% |
| Turnover Rate | 6% | — | — |
| Short-Term | | | |
| Reserves | 0.0% | — | — |
Sector Diversification (% of equity exposure)
| | | |
| | | | DJ |
| | | S&P | U.S. Total |
| | | Completion | Market |
| | Fund | Index | FA Index |
| Consumer Discretionary | 15.4% | 15.4% | 13.4% |
| Consumer Staples | 3.2 | 3.1 | 8.8 |
| Energy | 3.2 | 3.3 | 5.9 |
| Financials | 26.0 | 26.1 | 18.2 |
| Health Care | 13.5 | 13.5 | 14.8 |
| Industrials | 12.9 | 12.9 | 10.5 |
| Information Technology | 16.8 | 16.8 | 20.0 |
| Materials | 4.4 | 4.4 | 3.1 |
| Telecommunication | | | |
| Services | 1.1 | 1.1 | 2.2 |
| Utilities | 3.5 | 3.4 | 3.1 |
| | |
| Volatility Measures | | |
| | | DJ |
| | S&P | U.S. Total |
| | Completion | Market |
| | Index | FA Index |
| R-Squared | 1.00 | 0.84 |
| Beta | 1.00 | 1.07 |
These measures show the degree and timing of the fund’s fluctuations compared with the indexes over 36 months.
Ten Largest Holdings (% of total net assets)
| | |
| Liberty Global plc | Cable & Satellite | 0.9% |
| LinkedIn Corp. | Internet Software & | |
| | Services | 0.6 |
| Tesla Motors Inc. | Automobile | |
| | Manufacturers | 0.6 |
| Incyte Corp. | Biotechnology | 0.4 |
| BioMarin Pharmaceutical | | |
| Inc. | Biotechnology | 0.4 |
| Las Vegas Sands Corp. | Casinos & Gaming | 0.4 |
| Charter Communications | | |
| Inc. | Cable & Satellite | 0.3 |
| Twitter Inc. | Internet Software & | |
| | Services | 0.3 |
| Citizens Financial Group | | |
| Inc. | Regional Banks | 0.3 |
| SBA Communications | Wireless | |
| Corp. | Telecommunication | |
| | Services | 0.3 |
| Top Ten | | 4.5% |
The holdings listed exclude any temporary cash investments and equity index products.
1 The expense ratios shown are from the prospectus dated April 28, 2015, and represent estimated costs for the current fiscal year. For the fiscal year ended December 31, 2015, the expense ratios were 0.22% for Investor Shares, 0.09% for ETF Shares, 0.09% for Admiral Shares, 0.07% for Institutional Shares, and 0.05% for Institutional Plus Shares.
11
Extended Market Index Fund
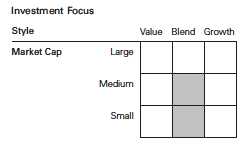
12
Extended Market Index Fund
Performance Summary
All of the returns in this report represent past performance, which is not a guarantee of future results that may be achieved by the fund. (Current performance may be lower or higher than the performance data cited. For performance data current to the most recent month-end, visit our website at vanguard.com/performance.) Note, too, that both investment returns and principal value can fluctuate widely, so an investor’s shares, when sold, could be worth more or less than their original cost. The returns shown do not reflect taxes that a shareholder would pay on fund distributions or on the sale of fund shares.
Cumulative Performance: December 31, 2005, Through December 31, 2015
Initial Investment of $10,000
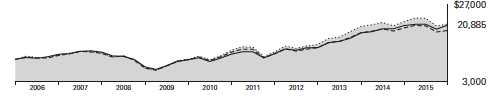
| | | | | |
| | | | Average Annual Total Returns | |
| | | Periods Ended December 31, 2015 | |
| | | | | | Final Value |
| | | One | Five | Ten | of a $10,000 |
| | | Year | Years | Years | Investment |
| | Extended Market Index | | | | |
| | Fund*Investor Shares | -3.39% | 10.31% | 7.64% | $20,885 |
| •••••••• | S&P Completion Index | -3.35 | 10.37 | 7.68 | 20,958 |
| – – – – | Mid-Cap Core Funds Average | -4.19 | 9.18 | 6.59 | 18,927 |
| | Dow Jones U.S. Total Stock Market | | | | |
| | Float Adjusted Index | 0.44 | 12.14 | 7.48 | 20,563 |
| Mid-Cap Core Funds Average: Derived from data provided by Lipper, a Thomson Reuters Company. | | |
| |
| | | | | | Final Value |
| | | One | Five | Ten | of a $10,000 |
| | | Year | Years | Years | Investment |
| Extended Market Index Fund | | | | |
| ETF Shares Net Asset Value | -3.26% | 10.45% | 7.80% | $21,192 |
| S&P Completion Index | -3.35 | 10.37 | 7.68 | 20,958 |
| Dow Jones U.S. Total Stock Market Float | | | | |
| Adjusted Index | 0.44 | 12.14 | 7.48 | 20,563 |
See Financial Highlights for dividend and capital gains information.
13
| | | | |
| Extended Market Index Fund | | | | |
| |
| |
| |
| | Average Annual Total Returns | |
| | Periods Ended December 31, 2015 | |
| | | | | Final Value |
| | One | Five | Ten | of a $10,000 |
| | Year | Years | Years | Investment |
| Extended Market Index Fund Admiral Shares | -3.27% | 10.46% | 7.80% | $21,184 |
| S&P Completion Index | -3.35 | 10.37 | 7.68 | 20,958 |
| Dow Jones U.S. Total Stock Market Float | | | | |
| Adjusted Index | 0.44 | 12.14 | 7.48 | 20,563 |
| |
| |
| | | | | Final Value |
| | One | Five | Ten | of a $5,000,000 |
| | Year | Years | Years | Investment |
| Extended Market Index Fund Institutional | | | | |
| Shares | -3.24% | 10.48% | 7.83% | $10,622,868 |
| S&P Completion Index | -3.35 | 10.37 | 7.68 | 10,478,939 |
| Dow Jones U.S. Total Stock Market Float | | | | |
| Adjusted Index | 0.44 | 12.14 | 7.48 | 10,281,716 |
| |
| |
| |
| | | | Since | Final Value |
| | One | | Inception of a $100,000,000 |
| | Year | | (1/14/2011) | Investment |
| Extended Market Index Fund Institutional Plus | | | | |
| Shares | -3.23% | | 9.89% | $159,652,605 |
| S&P Completion Index | -3.35 | | 9.76 | 158,698,942 |
| Dow Jones U.S. Total Stock Market Float | | | | |
| Adjusted Index | 0.44 | | 11.58 | 172,249,189 |
"Since Inception" performance is calculated from the Institutional Plus Shares’ inception date for both the fund and its comparative standards.
| | | |
| Cumulative Returns of ETF Shares: December 31, 2005, Through December 31, 2015 | |
| | One | Five | Ten |
| | Year | Years | Years |
| Extended Market Index Fund ETF Shares Market | | | |
| Price | -3.26% | 64.35% | 112.10% |
| Extended Market Index Fund ETF Shares Net Asset | | | |
| Value | -3.26 | 64.41 | 111.92 |
| S&P Completion Index | -3.35 | 63.81 | 109.58 |
14
Extended Market Index Fund
Fiscal-Year Total Returns (%): December 31, 2005, Through December 31, 2015
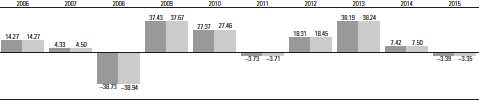
Extended Market Index Fund Investor Shares
S&P Completion Index
15
Extended Market Index Fund
Financial Statements
Statement of Net Assets—Investments Summary
As of December 31, 2015
This Statement summarizes the fund’s holdings by asset type. Details are reported for each of the fund’s 50 largest individual holdings and for investments that, in total for any issuer, represent more than 1% of the fund’s net assets. The total value of smaller holdings is reported as a single amount within each category.
The fund reports a complete list of its holdings in regulatory filings four times in each fiscal year, at the quarter-ends. For the second and fourth fiscal quarters, the complete listing of the fund’s holdings is available electronically on vanguard.com and on the Securities and Exchange Commission’s website (sec.gov), or you can have it mailed to you without charge by calling 800-662-7447. For the first and third fiscal quarters, the fund files the lists with the SEC on Form N-Q. Shareholders can look up the fund’s Forms N-Q on the SEC’s website. Forms N-Q may also be reviewed and copied at the SEC’s Public Reference Room (see the back cover of this report for further information).
| | | | |
| | | | Market | Percentage |
| | | | Value• | of Net |
| | | Shares | ($000) | Assets |
| Common Stocks | | | |
| Consumer Discretionary | | | |
| * | Liberty Global plc | 6,928,207 | 282,463 | 0.7% |
| *,^ | Tesla Motors Inc. | 1,048,669 | 251,691 | 0.6% |
| | Las Vegas Sands Corp. | 3,808,202 | 166,952 | 0.4% |
| *,^ | Charter Communications Inc. Class A | 788,729 | 144,416 | 0.3% |
| * | DISH Network Corp. Class A | 2,334,721 | 133,499 | 0.3% |
| * | Jarden Corp. | 2,152,174 | 122,932 | 0.3% |
| * | Ulta Salon Cosmetics & Fragrance Inc. | 662,040 | 122,477 | 0.3% |
| | Hilton Worldwide Holdings Inc. | 5,444,994 | 116,523 | 0.3% |
| ^ | Autoliv Inc. | 909,284 | 113,451 | 0.3% |
| * | MGM Resorts International | 4,910,508 | 111,567 | 0.3% |
| * | Norwegian Cruise Line Holdings Ltd. | 1,654,377 | 96,947 | 0.2% |
| | Lear Corp. | 779,675 | 95,767 | 0.2% |
| * | LKQ Corp. | 3,152,502 | 93,409 | 0.2% |
| | Foot Locker Inc. | 1,431,746 | 93,192 | 0.2% |
| * | Sirius XM Holdings Inc. | 22,795,136 | 92,776 | 0.2% |
| | Consumer Discretionary—Other † | | 4,521,930 | 10.6% |
| | | | 6,559,992 | 15.4% |
| Consumer Staples | | | |
| | Bunge Ltd. | 1,486,309 | 101,485 | 0.3% |
| | Consumer Staples—Other † | | 1,247,662 | 2.9% |
| | | | 1,349,147 | 3.2% |
| Energy | | | |
| * | Concho Resources Inc. | 1,346,263 | 125,014 | 0.3% |
| * | Cheniere Energy Inc. | 2,460,812 | 91,665 | 0.2% |
| | Energy—Other † | | 1,169,453 | 2.7% |
| | | | 1,386,132 | 3.2% |
| Financials | | | |
| | Citizens Financial Group Inc. | 5,465,700 | 143,147 | 0.3% |
| * | Markel Corp. | 145,248 | 128,305 | 0.3% |
| | Digital Realty Trust Inc. | 1,528,874 | 115,613 | 0.3% |
| | Extra Space Storage Inc. | 1,290,277 | 113,815 | 0.3% |
16
| | | |
| Extended Market Index Fund | | | |
| |
| |
| |
| | | Market | Percentage |
| | | Value• | of Net |
| | Shares | ($000) | Assets |
| Federal Realty Investment Trust | 726,289 | 106,111 | 0.3% |
| UDR Inc. | 2,732,496 | 102,660 | 0.2% |
| First Republic Bank | 1,493,455 | 98,658 | 0.2% |
| TD Ameritrade Holding Corp. | 2,787,545 | 96,756 | 0.2% |
| Willis Group Holdings plc | 1,872,619 | 90,953 | 0.2% |
| Annaly Capital Management Inc. | 9,668,341 | 90,689 | 0.2% |
| Financials—Other † | | 9,989,374 | 23.5% |
| | | 11,076,081 | 26.0% |
| Health Care | | | |
| * Incyte Corp. | 1,767,077 | 191,640 | 0.5% |
| * BioMarin Pharmaceutical Inc. | 1,688,086 | 176,844 | 0.4% |
| * Alkermes plc | 1,572,046 | 124,789 | 0.3% |
| * Hologic Inc. | 2,567,332 | 99,330 | 0.3% |
| * Mettler-Toledo International Inc. | 285,485 | 96,817 | 0.2% |
| * Jazz Pharmaceuticals plc | 643,232 | 90,413 | 0.2% |
| Health Care—Other † | | 4,954,776 | 11.6% |
| | | 5,734,609 | 13.5% |
| Industrials | | | |
| * TransDigm Group Inc. | 558,132 | 127,505 | 0.3% |
| Acuity Brands Inc. | 454,111 | 106,171 | 0.3% |
| Alaska Air Group Inc. | 1,314,899 | 105,863 | 0.2% |
| Towers Watson & Co. Class A | 725,438 | 93,190 | 0.2% |
| Fortune Brands Home & Security Inc. | 1,668,396 | 92,596 | 0.2% |
| Industrials—Other † | | 4,970,961 | 11.7% |
| | | 5,496,286 | 12.9% |
| Information Technology | | | |
| * LinkedIn Corp. Class A | 1,203,420 | 270,866 | 0.6% |
| * Twitter Inc. | 6,190,671 | 143,252 | 0.3% |
| * ServiceNow Inc. | 1,556,291 | 134,713 | 0.3% |
| * Palo Alto Networks Inc. | 758,208 | 133,551 | 0.3% |
| * FleetCor Technologies Inc. | 802,314 | 114,675 | 0.3% |
| Maxim Integrated Products Inc. | 2,954,372 | 112,266 | 0.3% |
| * Workday Inc. Class A | 1,158,547 | 92,313 | 0.2% |
| Information Technology—Other † | | 6,130,559 | 14.4% |
| | | 7,132,195 | 16.7% |
| Materials | | | |
| Celanese Corp. Class A | 1,524,722 | 102,660 | 0.3% |
| Materials—Other † | | 1,762,716 | 4.1% |
| | | 1,865,376 | 4.4% |
| |
| 1Other † | | 2,066 | 0.0% |
| |
| Telecommunication Services | | | |
| * SBA Communications Corp. Class A | 1,306,319 | 137,255 | 0.3% |
| * T-Mobile US Inc. | 2,871,050 | 112,315 | 0.3% |
| Telecommunication Services—Other † | | 225,036 | 0.5% |
| | | 474,606 | 1.1% |
| Utilities | | | |
| American Water Works Co. Inc. | 1,870,754 | 111,778 | 0.3% |
| Utilities—Other † | | 1,367,055 | 3.2% |
| | | 1,478,833 | 3.5% |
| Total Common Stocks (Cost $35,640,073) | | 42,555,323 | 99.9%2 |
17
| | | | |
| Extended Market Index Fund | | | | |
| |
| |
| |
| | | | Market | Percentage |
| | | | Value• | of Net |
| | Coupon | Shares | ($000) | Assets |
| Temporary Cash Investments | | | | |
| Money Market Fund | | | | |
| 3,4 Vanguard Market Liquidity Fund | 0.363% | 1,041,896,037 | 1,041,896 | 2.5% |
| 5U.S. Government and Agency Obligations † | | | 11,985 | 0.0% |
| Total Temporary Cash Investments (Cost $1,053,884) | | | 1,053,881 | 2.5%2 |
| Total Investments (Cost $36,693,957) | | | 43,609,204 | 102.4% |
| |
| | | | Amount | |
| | | | ($000) | |
| Other Assets and Liabilities | | | | |
| Other Assets | | | | |
| Investment in Vanguard | | | 3,849 | |
| Receivables for Investment Securities Sold | | | 167,144 | |
| Receivables for Accrued Income | | | 65,697 | |
| Receivables for Capital Shares Issued | | | 235,535 | |
| Other Assets | | | 667 | |
| Total Other Assets | | | 472,892 | 1.1% |
| Liabilities | | | | |
| Payables for Investment Securities Purchased | | | (30,481) | |
| Collateral for Securities on Loan | | | (897,282) | |
| Payables for Capital Shares Redeemed | | | (513,797) | |
| Payables to Vanguard | | | (28,966) | |
| Other Liabilities | | | (8,250) | |
| Total Liabilities | | | (1,478,776) | (3.5%) |
| Net Assets | | | 42,603,320 | 100.0% |
| |
| |
| At December 31, 2015, net assets consisted of: | | | | |
| | | | | Amount |
| | | | | ($000) |
| Paid-in Capital | | | | 36,210,801 |
| Undistributed Net Investment Income | | | | 2,759 |
| Accumulated Net Realized Losses | | | | (526,382) |
| Unrealized Appreciation (Depreciation) | | | | |
| Investment Securities | | | | 6,915,247 |
| Futures Contracts | | | | 909 |
| Swap Contracts | | | | (14) |
| Net Assets | | | | 42,603,320 |
| |
| |
| Investor Shares—Net Assets | | | | |
| Applicable to 32,075,577 outstanding $.001 par value shares of beneficial interest | | |
| (unlimited authorization) | | | | 2,040,245 |
| Net Asset Value Per Share—Investor Shares | | | | $63.61 |
| |
| |
| ETF Shares—Net Assets | | | | |
| Applicable to 50,979,740 outstanding $.001 par value shares of beneficial interest | | |
| (unlimited authorization) | | | | 4,272,234 |
| Net Asset Value Per Share—ETF Shares | | | | $83.80 |
18
| |
| Extended Market Index Fund | |
| |
| |
| |
| | Amount |
| | ($000) |
| Admiral Shares—Net Assets | |
| Applicable to 206,729,735 outstanding $.001 par value shares of beneficial interest | |
| (unlimited authorization) | 13,143,451 |
| Net Asset Value Per Share—Admiral Shares | $63.58 |
| |
| Institutional Shares—Net Assets | |
| Applicable to 135,605,865 outstanding $.001 par value shares of beneficial interest | |
| (unlimited authorization) | 8,621,153 |
| Net Asset Value Per Share—Institutional Shares | $63.58 |
| |
| Institutional Plus Shares—Net Assets | |
| Applicable to 92,588,939 outstanding $.001 par value shares of beneficial interest | |
| (unlimited authorization) | 14,526,237 |
| Net Asset Value Per Share—Institutional Plus Shares | $156.89 |
• See Note A in Notes to Financial Statements.
* Non-income-producing security.
^ Includes partial security positions on loan to broker-dealers. The total value of securities on loan is $837,297,000.
† Represents the aggregate value, by category, of securities that are not among the 50 largest holdings and, in total for any issuer, represent 1% or less of net assets.
1 “Other” represents securities that are not classified by the fund’s benchmark index.
2 The fund invests a portion of its cash reserves in equity markets through the use of index futures contracts. After giving effect to futures investments, the fund’s effective common stock and temporary cash investment positions represent 100.1% and 2.3%, respectively, of net assets.
3 Affiliated money market fund available only to Vanguard funds and certain trusts and accounts managed by Vanguard. Rate shown is the 7-day yield.
4 Includes $897,282,000 of collateral received for securities on loan.
5 Securities with a value of $7,390,000 have been segregated as initial margin for open futures contracts.
See accompanying Notes, which are an integral part of the Financial Statements.
19
| |
| Extended Market Index Fund | |
| |
| |
| Statement of Operations | |
| |
| |
| | Year Ended |
| | December 31, 2015 |
| | ($000) |
| Investment Income | |
| Income | |
| Dividends | 582,282 |
| Interest1 | 284 |
| Securities Lending | 44,034 |
| Total Income | 626,600 |
| Expenses | |
| The Vanguard Group—Note B | |
| Investment Advisory Services | 3,228 |
| Management and Administrative—Investor Shares | 4,203 |
| Management and Administrative—ETF Shares | 2,682 |
| Management and Administrative—Admiral Shares | 9,163 |
| Management and Administrative—Institutional Shares | 4,440 |
| Management and Administrative—Institutional Plus Shares | 4,777 |
| Marketing and Distribution—Investor Shares | 515 |
| Marketing and Distribution—ETF Shares | 449 |
| Marketing and Distribution—Admiral Shares | 1,402 |
| Marketing and Distribution—Institutional Shares | 706 |
| Marketing and Distribution—Institutional Plus Shares | 879 |
| Custodian Fees | 1,071 |
| Auditing Fees | 50 |
| Shareholders’ Reports—Investor Shares | 74 |
| Shareholders’ Reports—ETF Shares | 119 |
| Shareholders’ Reports—Admiral Shares | 105 |
| Shareholders’ Reports—Institutional Shares | 147 |
| Shareholders’ Reports—Institutional Plus Shares | 179 |
| Trustees’ Fees and Expenses | 31 |
| Total Expenses | 34,220 |
| Net Investment Income | 592,380 |
| Realized Net Gain (Loss) | |
| Investment Securities Sold | 2,796,109 |
| Futures Contracts | 3,007 |
| Swap Contracts | (1,668) |
| Realized Net Gain (Loss) | 2,797,448 |
| Change in Unrealized Appreciation (Depreciation) | |
| Investment Securities | (4,924,849) |
| Futures Contracts | (3,822) |
| Swap Contracts | (14) |
| Change in Unrealized Appreciation (Depreciation) | (4,928,685) |
| Net Increase (Decrease) in Net Assets Resulting from Operations | (1,538,857) |
| 1 Interest income from an affiliated company of the fund was $269,000. | |
| See accompanying Notes, which are an integral part of the Financial Statements. | |
20
| | |
| Extended Market Index Fund | | |
| |
| |
| Statement of Changes in Net Assets | | |
| |
| | Year Ended December 31, |
| | 2015 | 2014 |
| | ($000) | ($000) |
| Increase (Decrease) in Net Assets | | |
| Operations | | |
| Net Investment Income | 592,380 | 545,258 |
| Realized Net Gain (Loss) | 2,797,448 | 1,576,936 |
| Change in Unrealized Appreciation (Depreciation) | (4,928,685) | 721,732 |
| Net Increase (Decrease) in Net Assets Resulting from Operations | (1,538,857) | 2,843,926 |
| Distributions | | |
| Net Investment Income | | |
| Investor Shares | (25,453) | (27,824) |
| ETF Shares | (54,815) | (46,904) |
| Admiral Shares | (173,450) | (167,142) |
| Signal Shares | — | (648) |
| Institutional Shares | (115,520) | (111,484) |
| Institutional Plus Shares | (203,574) | (182,833) |
| Realized Capital Gain | | |
| Investor Shares | — | — |
| ETF Shares | — | — |
| Admiral Shares | — | — |
| Signal Shares | — | — |
| Institutional Shares | — | — |
| Institutional Plus Shares | — | — |
| Total Distributions | (572,812) | (536,835) |
| Capital Share Transactions | | |
| Investor Shares | (203,394) | (559,893) |
| ETF Shares | 822,145 | 340,980 |
| Admiral Shares | 929,458 | 3,311,312 |
| Signal Shares | — | (2,792,473) |
| Institutional Shares | 467,816 | 278,847 |
| Institutional Plus Shares | 1,646,756 | 1,549,959 |
| Net Increase (Decrease) from Capital Share Transactions | 3,662,781 | 2,128,732 |
| Total Increase (Decrease) | 1,551,112 | 4,435,823 |
| Net Assets | | |
| Beginning of Period | 41,052,208 | 36,616,385 |
| End of Period1 | 42,603,320 | 41,052,208 |
1 Net Assets—End of Period includes undistributed (overdistributed) net investment income of $2,759,000 and ($15,397,000).
See accompanying Notes, which are an integral part of the Financial Statements.
21
| | | | | |
| Extended Market Index Fund | | | | | |
| |
| |
| Financial Highlights | | | | | |
| |
| |
| Investor Shares | | | | | |
| |
| For a Share Outstanding | | | Year Ended December 31, |
| Throughout Each Period | 2015 | 2014 | 2013 | 2012 | 2011 |
| Net Asset Value, Beginning of Period | $66.63 | $62.76 | $45.86 | $39.34 | $41.26 |
| Investment Operations | | | | | |
| Net Investment Income | .795 | .795 | .602 | .688 | .385 |
| Net Realized and Unrealized Gain (Loss) | | | | | |
| on Investments | (3.050) | 3.857 | 16.903 | 6.515 | (1.923) |
| Total from Investment Operations | (2.255) | 4.652 | 17.505 | 7.203 | (1.538) |
| Distributions | | | | | |
| Dividends from Net Investment Income | (.765) | (.782) | (. 605) | (. 683) | (. 382) |
| Distributions from Realized Capital Gains | — | — | — | — | — |
| Total Distributions | (.765) | (.782) | (. 605) | (. 683) | (. 382) |
| Net Asset Value, End of Period | $63.61 | $66.63 | $62.76 | $45.86 | $39.34 |
| |
| Total Return1 | -3.39% | 7.42% | 38.19% | 18.31% | -3.73% |
| |
| Ratios/Supplemental Data | | | | | |
| Net Assets, End of Period (Millions) | $2,040 | $2,341 | $2,749 | $2,857 | $2,753 |
| Ratio of Total Expenses to | | | | | |
| Average Net Assets | 0.22% | 0.23% | 0.24% | 0.24% | 0.24% |
| Ratio of Net Investment Income to | | | | | |
| Average Net Assets | 1.20% | 1.27% | 1.19% | 1.62% | 0.93% |
| Portfolio Turnover Rate2 | 6% | 9% | 11% | 12% | 14% |
1 Total returns do not include account service fees that may have applied in the periods shown. Fund prospectuses provide information about any applicable account service fees.
2 Excludes the value of portfolio securities received or delivered as a result of in-kind purchases or redemptions of the fund’s capital shares, including ETF Creation Units.
See accompanying Notes, which are an integral part of the Financial Statements.
22
| | | | | |
| Extended Market Index Fund | | | | | |
| |
| |
| Financial Highlights | | | | | |
| |
| |
| ETF Shares | | | | | |
| |
| For a Share Outstanding | | | Year Ended December 31, |
| Throughout Each Period | 2015 | 2014 | 2013 | 2012 | 2011 |
| Net Asset Value, Beginning of Period | $87.79 | $82.71 | $60.46 | $51.87 | $54.42 |
| Investment Operations | | | | | |
| Net Investment Income | 1.171 | 1.178 | .934 | 1.000 | .593 |
| Net Realized and Unrealized Gain (Loss) | | | | | |
| on Investments | (4.033) | 5.061 | 22.256 | 8.582 | (2.553) |
| Total from Investment Operations | (2.862) | 6.239 | 23.190 | 9.582 | (1.960) |
| Distributions | | | | | |
| Dividends from Net Investment Income | (1.128) | (1.159) | (.940) | (. 992) | (. 590) |
| Distributions from Realized Capital Gains | — | — | — | — | — |
| Total Distributions | (1.128) | (1.159) | (.940) | (. 992) | (. 590) |
| Net Asset Value, End of Period | $83.80 | $87.79 | $82.71 | $60.46 | $51.87 |
| |
| Total Return | -3.26% | 7.55% | 38.37% | 18.48% | -3.61% |
| |
| Ratios/Supplemental Data | | | | | |
| Net Assets, End of Period (Millions) | $4,272 | $3,659 | $3,105 | $1,477 | $1,148 |
| Ratio of Total Expenses to | | | | | |
| Average Net Assets | 0.09% | 0.10% | 0.10% | 0.10% | 0.10% |
| Ratio of Net Investment Income to | | | | | |
| Average Net Assets | 1.33% | 1.40% | 1.33% | 1.76% | 1.07% |
| Portfolio Turnover Rate1 | 6% | 9% | 11% | 12% | 14% |
1 Excludes the value of portfolio securities received or delivered as a result of in-kind purchases or redemptions of the fund’s capital shares, including ETF Creation Units.
See accompanying Notes, which are an integral part of the Financial Statements.
23
| | | | | |
| Extended Market Index Fund | | | | | |
| |
| |
| Financial Highlights | | | | | |
| |
| |
| Admiral Shares | | | | | |
| |
| For a Share Outstanding | | | Year Ended December 31, |
| Throughout Each Period | 2015 | 2014 | 2013 | 2012 | 2011 |
| Net Asset Value, Beginning of Period | $66.61 | $62.75 | $45.87 | $39.35 | $41.28 |
| Investment Operations | | | | | |
| Net Investment Income | . 887 | .895 | .706 | .758 | .450 |
| Net Realized and Unrealized Gain (Loss) | | | | | |
| on Investments | (3.061) | 3.845 | 16.884 | 6.513 | (1.932) |
| Total from Investment Operations | (2.174) | 4.740 | 17.590 | 7.271 | (1.482) |
| Distributions | | | | | |
| Dividends from Net Investment Income | (.856) | (.880) | (.710) | (.751) | (.448) |
| Distributions from Realized Capital Gains | — | — | — | — | — |
| Total Distributions | (.856) | (.880) | (.710) | (.751) | (.448) |
| Net Asset Value, End of Period | $63.58 | $66.61 | $62.75 | $45.87 | $39.35 |
| |
| Total Return1 | -3.27% | 7.56% | 38.37% | 18.48% | -3.59% |
| |
| Ratios/Supplemental Data | | | | | |
| Net Assets, End of Period (Millions) | $13,143 | $12,852 | $8,864 | $5,970 | $5,018 |
| Ratio of Total Expenses to | | | | | |
| Average Net Assets | 0.09% | 0.10% | 0.10% | 0.10% | 0.10% |
| Ratio of Net Investment Income to | | | | | |
| Average Net Assets | 1.33% | 1.40% | 1.33% | 1.76% | 1.07% |
| Portfolio Turnover Rate2 | 6% | 9% | 11% | 12% | 14% |
1 Total returns do not include account service fees that may have applied in the periods shown. Fund prospectuses provide information about any applicable account service fees.
2 Excludes the value of portfolio securities received or delivered as a result of in-kind purchases or redemptions of the fund’s capital shares, including ETF Creation Units.
See accompanying Notes, which are an integral part of the Financial Statements.
24
| | | | | |
| Extended Market Index Fund | | | | | |
| |
| |
| Financial Highlights | | | | | |
| |
| |
| Institutional Shares | | | | | |
| |
| For a Share Outstanding | | | Year Ended December 31, |
| Throughout Each Period | 2015 | 2014 | 2013 | 2012 | 2011 |
| Net Asset Value, Beginning of Period | $66.60 | $62.75 | $45.86 | $39.34 | $41.27 |
| Investment Operations | | | | | |
| Net Investment Income | . 899 | .908 | .715 | .764 | .460 |
| Net Realized and Unrealized Gain (Loss) | | | | | |
| on Investments | (3.050) | 3.833 | 16.895 | 6.514 | (1.933) |
| Total from Investment Operations | (2.151) | 4.741 | 17.610 | 7.278 | (1.473) |
| Distributions | | | | | |
| Dividends from Net Investment Income | (.869) | (.891) | (.720) | (.758) | (.457) |
| Distributions from Realized Capital Gains | — | — | — | — | — |
| Total Distributions | (.869) | (.891) | (.720) | (.758) | (.457) |
| Net Asset Value, End of Period | $63.58 | $66.60 | $62.75 | $45.86 | $39.34 |
| |
| Total Return | -3.24% | 7.56% | 38.42% | 18.50% | -3.57% |
| |
| Ratios/Supplemental Data | | | | | |
| Net Assets, End of Period (Millions) | $8,621 | $8,567 | $7,812 | $5,496 | $5,810 |
| Ratio of Total Expenses to | | | | | |
| Average Net Assets | 0.07% | 0.08% | 0.08% | 0.08% | 0.08% |
| Ratio of Net Investment Income to | | | | | |
| Average Net Assets | 1.35% | 1.42% | 1.35% | 1.78% | 1.09% |
| Portfolio Turnover Rate1 | 6% | 9% | 11% | 12% | 14% |
1 Excludes the value of portfolio securities received or delivered as a result of in-kind purchases or redemptions of the fund’s capital shares, including ETF Creation Units.
See accompanying Notes, which are an integral part of the Financial Statements.
25
| | | | | |
| Extended Market Index Fund | | | | | |
| |
| |
| Financial Highlights | | | | | |
| |
| |
| Institutional Plus Shares | | | | | |
| | | | | | |
| | | | | | Jan. 14, |
| | | | 20111 to |
| For a Share Outstanding | | Year Ended December 31, | Dec. 31, |
| Throughout Each Period | 2015 | 2014 | 2013 | 2012 | 2011 |
| Net Asset Value, Beginning of Period | $164.36 | $154.84 | $113.18 | $97.10 | $105.13 |
| Investment Operations | | | | | |
| Net Investment Income | 2.254 | 2.273 | 1.797 | 1.917 | 1.139 |
| Net Realized and Unrealized Gain (Loss) | | | | | |
| on Investments | (7.549) | 9.481 | 41.671 | 16.064 | (8.015) |
| Total from Investment Operations | (5.295) | 11.754 | 43.468 | 17.981 | (6.876) |
| Distributions | | | | | |
| Dividends from Net Investment Income | (2.175) | (2.234) | (1.808) | (1.901) | (1.154) |
| Distributions from Realized Capital Gains | — | — | — | — | — |
| Total Distributions | (2.175) | (2.234) | (1.808) | (1.901) | (1.154) |
| Net Asset Value, End of Period | $156.89 | $164.36 | $154.84 | $113.18 | $97.10 |
| |
| Total Return | -3.23% | 7.60% | 38.43% | 18.52% | -6.54% |
| |
| Ratios/Supplemental Data | | | | | |
| Net Assets, End of Period (Millions) | $14,526 | $13,634 | $11,347 | $5,477 | $1,307 |
| Ratio of Total Expenses to | | | | | |
| Average Net Assets | 0.05% | 0.06% | 0.06% | 0.06% | 0.06%2 |
| Ratio of Net Investment Income to | | | | | |
| Average Net Assets | 1.37% | 1.44% | 1.37% | 1.80% | 1.11%2 |
| Portfolio Turnover Rate 3 | 6% | 9% | 11% | 12% | 14% |
1 Inception.
2 Annualized.
3 Excludes the value of portfolio securities received or delivered as a result of in-kind purchases or redemptions of the fund’s capital shares, including ETF Creation Units.
See accompanying Notes, which are an integral part of the Financial Statements.
26
Extended Market Index Fund
Notes to Financial Statements
Vanguard Extended Market Index Fund is registered under the Investment Company Act of 1940 as an open-end investment company, or mutual fund. The fund offers five classes of shares: Investor Shares, ETF Shares, Admiral Shares, Institutional Shares, and Institutional Plus Shares. Investor Shares are available to any investor who meets the fund’s minimum purchase requirements. ETF Shares are listed for trading on NYSE Arca; they can be purchased and sold through a broker. Admiral Shares, Institutional Shares, and Institutional Plus Shares are designed for investors who meet certain administrative, service, and account-size criteria. Prior to October 24, 2014, the fund offered Signal Shares. Effective October 24, 2014, the Signal Shares were converted to Admiral Shares.
A. The following significant accounting policies conform to generally accepted accounting principles for U.S. investment companies. The fund consistently follows such policies in preparing its financial statements.
1. Security Valuation: Securities are valued as of the close of trading on the New York Stock Exchange (generally 4 p.m., Eastern time) on the valuation date. Equity securities are valued at the latest quoted sales prices or official closing prices taken from the primary market in which each security trades; such securities not traded on the valuation date are valued at the mean of the latest quoted bid and asked prices. Securities for which market quotations are not readily available, or whose values have been materially affected by events occurring before the fund’s pricing time but after the close of the securities’ primary markets, are valued by methods deemed by the board of trustees to represent fair value. Investments in Vanguard Market Liquidity Fund are valued at that fund’s net asset value. Temporary cash investments acquired over 60 days to maturity are valued using the latest bid prices or using valuations based on a matrix system (which considers such factors as security prices, yields, maturities, and ratings), both as furnished by independent pricing services. Other temporary cash investments are valued at amortized cost, which approximates market value.
2. Futures Contracts: The fund uses index futures contracts to a limited extent, with the objectives of maintaining full exposure to the stock market, enhancing returns, maintaining liquidity, and minimizing transaction costs. The fund may purchase futures contracts to immediately invest incoming cash in the market, or sell futures in response to cash outflows, thereby simulating a fully invested position in the underlying index while maintaining a cash balance for liquidity. The fund may seek to enhance returns by using futures contracts instead of the underlying securities when futures are believed to be priced more attractively than the underlying securities. The primary risks associated with the use of futures contracts are imperfect correlation between changes in market values of stocks held by the fund and the prices of futures contracts, and the possibility of an illiquid market. Counterparty risk involving futures is mitigated because a regulated clearinghouse is the counterparty instead of the clearing broker. To further mitigate counterparty risk, the fund trades futures contracts on an exchange, monitors the financial strength of its clearing brokers and clearinghouse, and has entered into clearing agreements with its clearing brokers. The clearinghouse imposes initial margin requirements to secure the fund’s performance and requires daily settlement of variation margin representing changes in the market value of each contract.
Futures contracts are valued at their quoted daily settlement prices. The aggregate settlement values of the contracts are not recorded in the Statement of Net Assets. Fluctuations in the value of the contracts are recorded in the Statement of Net Assets as an asset (liability) and in the Statement of Operations as unrealized appreciation (depreciation) until the contracts are closed, when they are recorded as realized futures gains (losses).
During the year ended December 31, 2015, the fund’s average investments in long and short futures contracts represented less than 1% and 0% of net assets, respectively, based on the average of aggregate settlement values at each quarter-end during the period.
27
Extended Market Index Fund
3. Swap Contracts: The fund has entered into equity swap contracts to earn the total return on selected reference stocks in the fund’s target index. Under the terms of the swaps, the fund receives the total return on the referenced stock (i.e., receiving the increase or paying the decrease in value of the selected reference stock and receiving the equivalent of any dividends in respect of the selected referenced stock) over a specified period of time, applied to a notional amount that represents the value of a designated number of shares of the selected reference stock at the beginning of the equity swap contract. The fund also pays a floating rate that is based on short-term interest rates, applied to the notional amount. At the same time, the fund invests an amount approximating the notional amount of the swap in high-quality temporary cash investments.
The notional amounts of swap contracts are not recorded in the Statement of Net Assets. Swaps are valued daily based on market quotations received from independent pricing services or recognized dealers and the change in value is recorded in the Statement of Net Assets as an asset (liability) and in the Statement of Operations as unrealized appreciation (depreciation) until termination of the swap, at which time realized gain (loss) is recorded. A risk associated with all types of swaps is the possibility that a counterparty may default on its obligation to pay net amounts due to the fund.
The fund’s maximum amount subject to counterparty risk is the unrealized appreciation on the swap contract. The fund mitigates its counterparty risk by entering into swaps only with a diverse group of prequalified counterparties, monitoring their financial strength, entering into master netting arrangements with its counterparties, and requiring its counterparties to transfer collateral as security for their performance. In the event of a counterparty’s default (including bankruptcy), the fund may terminate any swap contracts with that counterparty, determine the net amount owed by either party in accordance with its master netting arrangements, and sell or retain any collateral held up to the net amount owed to the fund under the master netting arrangements. The swap contracts contain provisions whereby a counterparty may terminate open contracts if the fund net assets decline below a certain level, triggering a payment by the fund if the fund is in a net liability position at the time of the termination. The payment amount would be reduced by any collateral the fund has pledged. Any securities pledged as collateral for open contracts are noted in the Statement of Net Assets. The value of collateral received or pledged is compared daily to the value of the swap contracts exposure with each counterparty, and any difference, if in excess of a specified minimum transfer amount, is adjusted and settled within two business days.
During the year ended December 31, 2015, the fund’s average amounts of investments in total return swaps represented less than 1% of net assets, based on the average of notional amounts at each quarter-end during the period.
4. Federal Income Taxes: The fund intends to continue to qualify as a regulated investment company and distribute all of its taxable income. Management has analyzed the fund’s tax positions taken for all open federal income tax years (December 31, 2012–2015), and has concluded that no provision for federal income tax is required in the fund’s financial statements.
5. Distributions: Distributions to shareholders are recorded on the ex-dividend date.
6. Securities Lending: To earn additional income, the fund lends its securities to qualified institutional borrowers. Security loans are subject to termination by the fund at any time and are required to be secured at all times by collateral in an amount at least equal to the market value of securities loaned. Daily market fluctuations could cause the value of loaned securities to be more or less than the value of the collateral received. When this occurs, the collateral is adjusted and settled on the next business day. The fund further mitigates its counterparty risk by entering into securities lending transactions only with a diverse group of prequalified counterparties, monitoring their financial strength, and
28
Extended Market Index Fund
entering into master securities lending agreements with its counterparties. The master securities lending agreements provide that, in the event of a counterparty’s default (including bankruptcy), the fund may terminate any loans with that borrower, determine the net amount owed, and sell or retain the collateral up to the net amount owed to the fund; however, such actions may be subject to legal proceedings. While collateral mitigates counterparty risk, in the absence of a default the fund may experience delays and costs in recovering the securities loaned. The fund invests cash collateral received in Vanguard Market Liquidity Fund, and records a liability in the Statement of Net Assets for the return of the collateral, during the period the securities are on loan. Securities lending income represents fees charged to borrowers plus income earned on invested cash collateral, less expenses associated with the loan.
7. Credit Facility: The fund and certain other funds managed by The Vanguard Group (“Vanguard”) participate in a $3 billion committed credit facility provided by a syndicate of lenders pursuant to a credit agreement that may be renewed annually; each fund is individually liable for its borrowings, if any, under the credit facility. Borrowings may be utilized for temporary and emergency purposes, and are subject to the fund’s regulatory and contractual borrowing restrictions. The participating funds are charged administrative fees and an annual commitment fee of 0.06% of the undrawn amount of the facility; these fees are allocated to the funds based on a method approved by the fund’s board of trustees and included in Management and Administrative expenses on the fund’s Statement of Operations. Any borrowings under this facility bear interest at a rate equal to the higher of the federal funds rate or LIBOR reference rate plus an agreed-upon spread.
The fund had no borrowings outstanding at December 31, 2015, or at any time during the period then ended.
8. Other: Dividend income is recorded on the ex-dividend date. Interest income includes income distributions received from Vanguard Market Liquidity Fund and is accrued daily. Premiums and discounts on debt securities purchased are amortized and accreted, respectively, to interest income over the lives of the respective securities. Security transactions are accounted for on the date securities are bought or sold. Costs used to determine realized gains (losses) on the sale of investment securities are those of the specific securities sold.
Each class of shares has equal rights as to assets and earnings, except that each class separately bears certain class-specific expenses related to maintenance of shareholder accounts (included in Management and Administrative expenses) and shareholder reporting. Marketing and distribution expenses are allocated to each class of shares based on a method approved by the board of trustees. Income, other non-class-specific expenses, and gains and losses on investments are allocated to each class of shares based on its relative net assets.
B. In accordance with the terms of a Funds’ Service Agreement (the “FSA”) between Vanguard and the fund, Vanguard furnishes to the fund investment advisory, corporate management, administrative, marketing, and distribution services at Vanguard’s cost of operations (as defined by the FSA). These costs of operations are allocated to the fund based on methods and guidelines approved by the board of trustees. Vanguard does not require reimbursement in the current period for certain costs of operations (such as deferred compensation/benefits and risk/insurance costs); the fund’s liability for these costs of operations is included in Payables to Vanguard on the Statement of Net Assets.
Upon the request of Vanguard, the fund may invest up to 0.40% of its net assets as capital in Vanguard. At December 31, 2015, the fund had contributed to Vanguard capital in the amount of $3,849,000, representing 0.01% of the fund’s net assets and 1.54% of Vanguard’s capitalization. The fund’s trustees and officers are also directors and employees, respectively, of Vanguard.
29
Extended Market Index Fund
C. Various inputs may be used to determine the value of the fund’s investments. These inputs are summarized in three broad levels for financial statement purposes. The inputs or methodologies used to value securities are not necessarily an indication of the risk associated with investing in those securities.
Level 1—Quoted prices in active markets for identical securities.
Level 2—Other significant observable inputs (including quoted prices for similar securities, interest rates, prepayment speeds, credit risk, etc.).
Level 3—Significant unobservable inputs (including the fund’s own assumptions used to determine the fair value of investments).
The following table summarizes the market value of the fund’s investments as of December 31, 2015, based on the inputs used to value them:
| | | |
| | Level 1 | Level 2 | Level 3 |
| Investments | ($000) | ($000) | ($000) |
| Common Stocks | 42,553,220 | 295 | 1,808 |
| Temporary Cash Investments | 1,041,896 | 11,985 | — |
| Futures Contracts—Assets1 | 658 | — | — |
| Futures Contracts—Liabilities1 | (2,128) | — | — |
| Swap Contracts—Liabilities | — | (14) | — |
| Total | 43,593,646 | 12,266 | 1,808 |
| 1 Represents variation margin on the last day of the reporting period. | | | |
D. At December 31, 2015, the aggregate settlement value of open futures contracts and the related unrealized appreciation (depreciation) were:
| | | | |
| | | | | ($000) |
| | | | Aggregate | |
| | | Number of | Settlement | Unrealized |
| | | Long (Short) | Value | Appreciation |
| Futures Contracts | Expiration | Contracts | Long (Short) | (Depreciation) |
| E-mini S&P MidCap 400 | March 2016 | 403 | 56,158 | 682 |
| E-mini Russell 2000 Index | March 2016 | 245 | 27,722 | 227 |
| | | | | 909 |
Unrealized appreciation (depreciation) on open futures contracts is required to be treated as realized gain (loss) for tax purposes.
| | | | | |
| At December 31, 2015, the fund had the following open total return swap contracts: | |
| |
| | | | | Floating | Unrealized |
| | | | Notional | Interest Rate | Appreciation |
| | Termination | | Amount | Received | (Depreciation) |
| Reference Entity | Date | Counterparty | ($000) | (Paid) | ($000) |
| Ambac Financial Group Inc. | 1/11/16 | GSCM | 1,732 | (0.693) | (14) |
| GSCM—Goldman Sachs Capital Markets. | | | | | |
30
Extended Market Index Fund
E. Distributions are determined on a tax basis and may differ from net investment income and realized capital gains for financial reporting purposes. Differences may be permanent or temporary. Permanent differences are reclassified among capital accounts in the financial statements to reflect their tax character. Temporary differences arise when certain items of income, expense, gain, or loss are recognized in different periods for financial statement and tax purposes. These differences will reverse at some time in the future. Differences in classification may also result from the treatment of short-term gains as ordinary income for tax purposes.
Certain of the fund’s investments are in securities considered to be passive foreign investment companies, for which any unrealized appreciation and/or realized gains are required to be included in distributable net income for tax purposes. During the year ended December 31, 2015, the fund realized gains on the sale of passive foreign investment companies of $256,000, which have been included in current and prior periods’ taxable income; accordingly, such gains have been reclassified from accumulated net realized losses to undistributed net investment income. Passive foreign investment companies held at December 31, 2015, had unrealized appreciation of $4,886,000, of which all has been distributed and is reflected in the balance of undistributed net investment income.
During the year ended December 31, 2015, the fund realized $2,937,851,000 of net capital gains resulting from in-kind redemptions—in which shareholders exchanged fund shares for securities held by the fund rather than for cash. Because such gains are not taxable to the fund, and are not distributed to shareholders, they have been reclassified from accumulated net realized losses to paid-in capital.
Realized and unrealized gains (losses) on certain of the fund’s swap contracts are treated as ordinary income (loss) for tax purposes. Realized losses of $1,668,000 on swap contracts have been reclassified from accumulated net realized losses to undistributed net investment income.
For tax purposes, at December 31, 2015, the fund had $33,477,000 of ordinary income available for distribution. At December 31, 2015, the fund had available capital losses totaling $524,285,000 to offset future net capital gains. Of this amount, $74,162,000 is subject to expiration dates; $49,578,000 may be used to offset future net capital gains through December 31, 2017, and $24,584,000 through December 31, 2018. Capital losses of $450,123,000 realized beginning in fiscal 2011 may be carried forward indefinitely under the Regulated Investment Company Modernization Act of 2010, but must be used before any expiring loss carryforwards.
At December 31, 2015, the cost of investment securities for tax purposes was $36,698,843,000. Net unrealized appreciation of investment securities for tax purposes was $6,910,361,000, consisting of unrealized gains of $11,325,084,000 on securities that had risen in value since their purchase and $4,414,723,000 in unrealized losses on securities that had fallen in value since their purchase.
F. During the year ended December 31, 2015, the fund purchased $12,233,513,000 of investment securities and sold $8,327,851,000 of investment securities, other than temporary cash investments. Purchases and sales include $6,659,336,000 and $5,537,163,000, respectively, in connection with in-kind purchases and redemptions of the fund’s capital shares.
31
Extended Market Index Fund
G. Capital share transactions for each class of shares were:
| | | | |
| | | | Year Ended December 31, |
| | | 2015 | | 2014 |
| | Amount | Shares | Amount | Shares |
| | ($000) | (000) | ($000) | (000) |
| Investor Shares | | | | |
| Issued | 349,644 | 5,171 | 428,761 | 6,716 |
| Issued in Lieu of Cash Distributions | 24,858 | 386 | 27,189 | 410 |
| Redeemed | (577,896) | (8,608) | (1,015,843) | (15,803) |
| Net Increase (Decrease)—Investor Shares | (203,394) | (3,051) | (559,893) | (8,677) |
| ETF Shares | | | | |
| Issued | 6,474,730 | 72,703 | 3,618,659 | 42,340 |
| Issued in Lieu of Cash Distributions | — | — | — | — |
| Redeemed | (5,652,585) | (63,400) | (3,277,679) | (38,200) |
| Net Increase (Decrease)—ETF Shares | 822,145 | 9,303 | 340,980 | 4,140 |
| Admiral Shares | | | | |
| Issued1 | 2,647,376 | 39,234 | 4,347,600 | 67,825 |
| Issued in Lieu of Cash Distributions | 151,949 | 2,362 | 147,624 | 2,228 |
| Redeemed | (1,869,867) | (27,811) | (1,183,912) | (18,362) |
| Net Increase (Decrease) —Admiral Shares | 929,458 | 13,785 | 3,311,312 | 51,691 |
| Signal Shares | | | | |
| Issued | — | — | 530,845 | 9,725 |
| Issued in Lieu of Cash Distributions | — | — | 568 | 10 |
| Redeemed1 | — | — | (3,323,886) | (60,553) |
| Net Increase (Decrease)—Signal Shares | — | — | (2,792,473) | (50,818) |
| Institutional Shares | | | | |
| Issued | 2,581,127 | 38,366 | 2,742,036 | 42,446 |
| Issued in Lieu of Cash Distributions | 108,833 | 1,692 | 105,177 | 1,587 |
| Redeemed | (2,222,144) | (33,075) | (2,568,366) | (39,916) |
| Net Increase (Decrease) —Institutional Shares | 467,816 | 6,983 | 278,847 | 4,117 |
| Institutional Plus Shares | | | | |
| Issued | 3,613,868 | 21,550 | 2,976,636 | 18,704 |
| Issued in Lieu of Cash Distributions | 203,574 | 1,283 | 180,167 | 1,102 |
| Redeemed | (2,170,686) | (13,196) | (1,606,844) | (10,133) |
| Net Increase (Decrease) —Institutional Plus Shares | 1,646,756 | 9,637 | 1,549,959 | 9,673 |
1 Admiral Shares Issued and Signal Shares Redeemed include $1,738,974,000 from the conversion of Signal Shares to Admiral Shares during the 2014 fiscal year.
H. Management has determined that no material events or transactions occurred subsequent to December 31, 2015, that would require recognition or disclosure in these financial statements.
32
| | | | | |
| Mid-Cap Index Fund | | | | | |
| |
| |
| Fund Profile | | | | | |
| As of December 31, 2015 | | | | | |
| |
| Share-Class Characteristics | | | | | |
| | Investor | | Admiral | Institutional | Institutional |
| | Shares | ETF Shares | Shares | Shares | Plus Shares |
| Ticker Symbol | VIMSX | VO | VIMAX | VMCIX | VMCPX |
| Expense Ratio1 | 0.23% | 0.09% | 0.09% | 0.08% | 0.06% |
| 30-Day SEC Yield | 1.34% | 1.45% | 1.44% | 1.45% | 1.47% |
| | | |
| Portfolio Characteristics | | |
| | | | DJ |
| | | | U.S. |
| | | CRSP US | Total |
| | | Mid Cap | Market |
| | Fund | Index FA Index |
| Number of Stocks | 365 | 362 | 3,960 |
| Median Market Cap | $10.8B | $10.8B | $51.4B |
| Price/Earnings Ratio | 26.1x | 25.8x | 21.9x |
| Price/Book Ratio | 2.6x | 2.6x | 2.7x |
| Return on Equity | 15.6% | 15.2% | 17.2% |
| Earnings Growth | | | |
| Rate | 11.6% | 11.6% | 9.5% |
| Dividend Yield | 1.6% | 1.6% | 2.1% |
| Foreign Holdings | 0.0% | 0.0% | 0.0% |
| Turnover Rate | 15% | — | — |
| Short-Term | | | |
| Reserves | 0.1% | — | — |
Sector Diversification (% of equity exposure)
| | | |
| | | | DJ |
| | | CRSP US U.S. Total |
| | | Mid Cap | Market |
| | Fund | Index FA Index |
| Basic Materials | 4.0% | 4.0% | 2.3% |
| Consumer Goods | 14.5 | 14.5 | 10.3 |
| Consumer Services | 13.9 | 13.9 | 14.2 |
| Financials | 19.6 | 19.6 | 19.5 |
| Health Care | 8.8 | 8.8 | 14.0 |
| Industrials | 16.8 | 16.8 | 12.2 |
| Oil & Gas | 4.9 | 4.9 | 5.9 |
| Technology | 11.5 | 11.5 | 16.4 |
| Telecommunications | 1.2 | 1.2 | 2.2 |
| Utilities | 4.8 | 4.8 | 3.0 |
| | |
| Volatility Measures | | |
| | | DJ |
| | Spliced | U.S. Total |
| | Mid-Cap | Market |
| | Index | FA Index |
| R-Squared | 1.00 | 0.94 |
| Beta | 1.00 | 0.99 |
These measures show the degree and timing of the fund’s fluctuations compared with the indexes over 36 months.
Ten Largest Holdings (% of total net assets)
| | |
| Ross Stores Inc. | Apparel Retailers | 0.7% |
| Fiserv Inc. | Financial | |
| | Administration | 0.7 |
| Electronic Arts Inc. | Toys | 0.7 |
| Roper Technologies Inc. | Electronic Equipment | 0.6 |
| Equinix Inc. | Specialty REITs | 0.6 |
| Cerner Corp. | Software | 0.6 |
| ConAgra Foods Inc. | Food Products | 0.6 |
| Incyte Corp. | Biotechnology | 0.6 |
| Royal Caribbean Cruises | | |
| Ltd. | Recreational Services | 0.6 |
| Hartford Financial | | |
| Services Group Inc. | Full Line Insurance | 0.6 |
| Top Ten | | 6.3% |
The holdings listed exclude any temporary cash investments and equity index products.
1 The expense ratios shown are from the prospectus dated April 28, 2015, and represent estimated costs for the current fiscal year. For the fiscal year ended December 31, 2015, the expense ratios were 0.20% for Investor Shares, 0.08% for ETF Shares, 0.08% for Admiral Shares, 0.07% for Institutional Shares, and 0.05% for Institutional Plus Shares.
33
Mid-Cap Index Fund
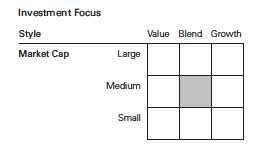
34
Mid-Cap Index Fund
Performance Summary
All of the returns in this report represent past performance, which is not a guarantee of future results that may be achieved by the fund. (Current performance may be lower or higher than the performance data cited. For performance data current to the most recent month-end, visit our website at vanguard.com/performance.) Note, too, that both investment returns and principal value can fluctuate widely, so an investor’s shares, when sold, could be worth more or less than their original cost. The returns shown do not reflect taxes that a shareholder would pay on fund distributions or on the sale of fund shares.
Cumulative Performance: December 31, 2005, Through December 31, 2015
Initial Investment of $10,000
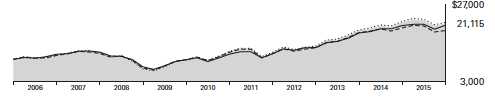
| | | | | |
| | | | Average Annual Total Returns | |
| | | Periods Ended December 31, 2015 | |
| | | | | | Final Value |
| | | One | Five | Ten | of a $10,000 |
| | | Year | Years | Years | Investment |
| | Mid-Cap Index Fund*Investor Shares | -1.46% | 11.37% | 7.76% | $21,115 |
| •••••••• | Spliced Mid-Cap Index | -1.28 | 11.58 | 7.94 | 21,467 |
| – – – – | Mid-Cap Core Funds Average | -4.19 | 9.18 | 6.59 | 18,927 |
| | Dow Jones U.S. Total Stock Market | | | | |
| | Float Adjusted Index | 0.44 | 12.14 | 7.48 | 20,563 |
| For a benchmark description, see the Glossary. | | | | |
| Mid-Cap Core Funds Average: Derived from data provided by Lipper, a Thomson Reuters Company. | | |
| |
| | | | | | Final Value |
| | | One | Five | Ten | of a $10,000 |
| | | Year | Years | Years | Investment |
| Mid-Cap Index Fund | | | | |
| ETF Shares Net Asset Value | -1.34% | 11.52% | 7.89% | $21,374 |
| Spliced Mid-Cap Index | -1.28 | 11.58 | 7.94 | 21,467 |
| Dow Jones U.S. Total Stock Market Float | | | | |
| Adjusted Index | 0.44 | 12.14 | 7.48 | 20,563 |
See Financial Highlights for dividend and capital gains information.
35
| | | | |
| Mid-Cap Index Fund | | | | |
| |
| |
| |
| | | Average Annual Total Returns | |
| | Periods Ended December 31, 2015 | |
| | | | | Final Value |
| | One | Five | Ten | of a $10,000 |
| | Year | Years | Years | Investment |
| Mid-Cap Index Fund Admiral Shares | -1.34% | 11.52% | 7.90% | $21,387 |
| Spliced Mid-Cap Index | -1.28 | 11.58 | 7.94 | 21,467 |
| Dow Jones U.S. Total Stock Market Float | | | | |
| Adjusted Index | 0.44 | 12.14 | 7.48 | 20,563 |
| |
| |
| | | | | Final Value |
| | One | Five | Ten | of a $5,000,000 |
| | Year | Years | Years | Investment |
| Mid-Cap Index Fund Institutional Shares | -1.33% | 11.53% | 7.93% | $10,725,791 |
| Spliced Mid-Cap Index | -1.28 | 11.58 | 7.94 | 10,733,630 |
| Dow Jones U.S. Total Stock Market Float | | | | |
| Adjusted Index | 0.44 | 12.14 | 7.48 | 10,281,716 |
| |
| |
| |
| | | | Since | Final Value |
| | One | Five | Inception | of a $100,000,000 |
| | Year | Years | (12/15/2010) | Investment |
| Mid-Cap Index Fund Institutional Plus Shares | -1.30% | 11.56% | 11.93% | $176,552,788 |
| Spliced Mid-Cap Index | -1.28 | 11.58 | 11.95 | 176,701,548 |
| Dow Jones U.S. Total Stock Market Float | | | | |
| Adjusted Index | 0.44 | 12.14 | 12.48 | 180,956,654 |
"Since Inception" performance is calculated from the Institutional Plus Shares’ inception date for both the fund and its comparative standards.
| | | |
| Cumulative Returns of ETF Shares: December 31, 2005, Through December 31, 2015 | |
| | One | Five | Ten |
| | Year | Years | Years |
| Mid-Cap Index Fund ETF Shares Market Price | -1.35% | 72.39% | 113.76% |
| Mid-Cap Index Fund ETF Shares Net Asset Value | -1.34 | 72.47 | 113.74 |
| Spliced Mid-Cap Index | -1.28 | 72.94 | 114.67 |
36
Mid-Cap Index Fund
Fiscal-Year Total Returns (%): December 31, 2005, Through December 31, 2015
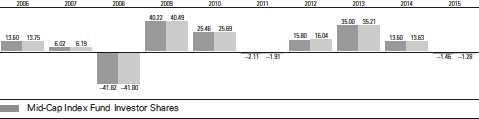
Spliced Mid-Cap Index
For a benchmark description, see the Glossary.
37
Mid-Cap Index Fund
Financial Statements
Statement of Net Assets
As of December 31, 2015
The fund reports a complete list of its holdings in regulatory filings four times in each fiscal year, at the quarter-ends. For the second and fourth fiscal quarters, the lists appear in the fund’s semiannual and annual reports to shareholders. For the first and third fiscal quarters, the fund files the lists with the Securities and Exchange Commission on Form N-Q. Shareholders can look up the fund’s Forms N-Q on the SEC’s website at sec.gov. Forms N-Q may also be reviewed and copied at the SEC’s Public Reference Room (see the back cover of this report for further information).
| | | |
| | | | Market |
| | | | Value• |
| | | Shares | ($000) |
| Common Stocks (99.8%)1 | | |
| Basic Materials (4.0%) | | |
| | Alcoa Inc. | 28,003,459 | 276,394 |
| | Celanese Corp. Class A | 3,135,907 | 211,141 |
| | International Flavors | | |
| | & Fragrances Inc. | 1,715,332 | 205,222 |
| | Eastman Chemical Co. | 3,017,641 | 203,721 |
| | Newmont Mining Corp. | 11,309,843 | 203,464 |
| | CF Industries | | |
| | Holdings Inc. | 4,981,974 | 203,314 |
| | Airgas Inc. | 1,385,811 | 191,685 |
| | Freeport-McMoRan Inc. | 24,694,819 | 167,184 |
| * | WR Grace & Co. | 1,509,185 | 150,300 |
| | Ashland Inc. | 1,427,308 | 146,585 |
| | Albemarle Corp. | 2,397,259 | 134,270 |
| | Avery Dennison Corp. | 1,947,391 | 122,024 |
| | FMC Corp. | 2,854,937 | 111,714 |
| | Mosaic Co. | 3,403,199 | 93,894 |
| | Reliance Steel | | |
| | & Aluminum Co. | 1,454,839 | 84,250 |
| * | Axalta Coating | | |
| | Systems Ltd. | 3,050,487 | 81,295 |
| | Westlake Chemical Corp. | 850,395 | 46,193 |
| | Huntsman Corp. | 2,229,688 | 25,352 |
| | | | 2,658,002 |
| Consumer Goods (14.4%) | | |
| * | Electronic Arts Inc. | 6,311,177 | 433,704 |
| | ConAgra Foods Inc. | 9,253,287 | 390,119 |
| | Dr Pepper Snapple | | |
| | Group Inc. | 4,037,484 | 376,293 |
| | Clorox Co. | 2,759,332 | 349,966 |
| | Tyson Foods Inc. Class A | 6,319,285 | 337,007 |
| | JM Smucker Co. | 2,557,843 | 315,484 |
| * | Under Armour Inc. | | |
| | Class A | 3,849,978 | 310,347 |
| | Molson Coors Brewing | | |
| | Co. Class B | 3,133,792 | 294,326 |
| | Genuine Parts Co. | 3,061,459 | 262,949 |
| | Delphi Automotive plc | 2,993,430 | 256,627 |
| * | Jarden Corp. | 4,474,524 | 255,585 |
| | | |
| | | | Market |
| | | | Value• |
| | | Shares | ($000) |
| * | Mohawk Industries Inc. | 1,343,215 | 254,391 |
| | Newell Rubbermaid Inc. | 5,709,246 | 251,664 |
| | Hanesbrands Inc. | 8,375,110 | 246,479 |
| | Whirlpool Corp. | 1,671,421 | 245,482 |
| | DR Horton Inc. | 7,486,840 | 239,803 |
| | Church & Dwight Co. Inc. | 2,802,765 | 237,899 |
| | Hormel Foods Corp. | 2,826,972 | 223,557 |
| | Coca-Cola | | |
| | Enterprises Inc. | 4,365,987 | 214,981 |
| | Keurig Green | | |
| | Mountain Inc. | 2,387,520 | 214,829 |
| | Snap-on Inc. | 1,240,842 | 212,718 |
| | Bunge Ltd. | 3,043,712 | 207,825 |
| | BorgWarner Inc. | 4,791,090 | 207,119 |
| | McCormick & Co. Inc. | 2,360,314 | 201,948 |
| | Lear Corp. | 1,608,914 | 197,623 |
| | Mattel Inc. | 7,253,706 | 197,083 |
| | Coach Inc. | 5,929,140 | 194,061 |
| | Lennar Corp. Class A | 3,945,109 | 192,955 |
| | Harley-Davidson Inc. | 4,099,066 | 186,057 |
| * | LKQ Corp. | 5,874,144 | 174,051 |
| | Hasbro Inc. | 2,396,394 | 161,421 |
| * | Michael Kors | | |
| | Holdings Ltd. | 3,735,689 | 149,652 |
| | Harman International | | |
| | Industries Inc. | 1,520,662 | 143,262 |
| | Ralph Lauren Corp. | | |
| | Class A | 1,256,596 | 140,085 |
| * | NVR Inc. | 79,462 | 130,556 |
| | PVH Corp. | 1,763,637 | 129,892 |
| | Leucadia National Corp. | 6,967,294 | 121,161 |
| | PulteGroup Inc. | 6,713,472 | 119,634 |
| * | WABCO Holdings Inc. | 1,164,043 | 119,035 |
| | Polaris Industries Inc. | 1,330,695 | 114,373 |
| *,^ | lululemon athletica Inc. | 2,094,585 | 109,903 |
| * | Edgewell Personal | | |
| | Care Co. | 1,328,844 | 104,141 |
| | Goodyear Tire | | |
| | & Rubber Co. | 2,872,691 | 93,851 |
| * | WhiteWave Foods Co. | | |
| | Class A | 1,886,822 | 73,416 |
38
| | | |
| Mid-Cap Index Fund | | |
| |
| |
| |
| | | | Market |
| | | | Value• |
| | | Shares | ($000) |
| *,^ | Fitbit Inc. Class A | 1,268,949 | 37,548 |
| ^ | Pilgrim’s Pride Corp. | 1,394,492 | 30,804 |
| | Coty Inc. Class A | 1,090,387 | 27,947 |
| | Lennar Corp. Class B | 82,620 | 3,320 |
| | Constellation Brands Inc. | | |
| | Class A | 4,696 | 669 |
| * | Monster Beverage Corp. | 4,430 | 660 |
| | | | 9,494,262 |
| Consumer Services (13.8%) | | |
| | Ross Stores Inc. | 8,722,289 | 469,346 |
| | Royal Caribbean | | |
| | Cruises Ltd. | 3,761,872 | 380,739 |
| * | Dollar Tree Inc. | 4,767,698 | 368,162 |
| | Nielsen Holdings plc | 7,057,357 | 328,873 |
| * | Chipotle Mexican | | |
| | Grill Inc. Class A | 666,620 | 319,878 |
| | Expedia Inc. | 2,489,782 | 309,480 |
| *,^ | Charter Communications | | |
| | Inc. Class A | 1,556,534 | 285,001 |
| | Tractor Supply Co. | 2,871,426 | 245,507 |
| * | Ulta Salon Cosmetics | | |
| | & Fragrance Inc. | 1,298,406 | 240,205 |
| | Marriott International Inc. | | |
| | Class A | 3,572,437 | 239,496 |
| * | United Continental | | |
| | Holdings Inc. | 4,082,617 | 233,934 |
| * | CarMax Inc. | 4,331,352 | 233,763 |
| | Advance Auto Parts Inc. | 1,487,159 | 223,832 |
| * | MGM Resorts | | |
| | International | 9,635,151 | 218,911 |
| | Alaska Air Group Inc. | 2,696,036 | 217,058 |
| | AmerisourceBergen | | |
| | Corp. Class A | 2,087,796 | 216,525 |
| | Dollar General Corp. | 2,991,705 | 215,014 |
| | Signet Jewelers Ltd. | 1,700,560 | 210,342 |
| * | TripAdvisor Inc. | 2,387,137 | 203,503 |
| | Interpublic Group | | |
| | of Cos. Inc. | 8,685,661 | 202,202 |
| * | Norwegian Cruise | | |
| | Line Holdings Ltd. | 3,408,654 | 199,747 |
| | Kohl’s Corp. | 4,155,455 | 197,924 |
| | H&R Block Inc. | 5,907,164 | 196,768 |
| | Foot Locker Inc. | 2,977,999 | 193,838 |
| | Best Buy Co. Inc. | 6,257,443 | 190,539 |
| | Wyndham | | |
| | Worldwide Corp. | 2,480,609 | 180,216 |
| | Tiffany & Co. | 2,328,401 | 177,634 |
| * | IHS Inc. Class A | 1,456,739 | 172,522 |
| * | Bed Bath & Beyond Inc. | 3,387,410 | 163,442 |
| | Aramark | 4,863,237 | 156,839 |
| | Darden Restaurants Inc. | 2,463,936 | 156,805 |
| | Nordstrom Inc. | 3,016,318 | 150,243 |
| * | Discovery | | |
| | Communications Inc. | 5,570,290 | 140,483 |
| | News Corp. Class A | 10,501,700 | 140,303 |
| | | |
| | | | Market |
| | | | Value• |
| | | Shares | ($000) |
| | FactSet Research | | |
| | Systems Inc. | 841,358 | 136,780 |
| | Staples Inc. | 13,751,006 | 130,222 |
| * | Liberty Interactive Corp. | | |
| | QVC Group Class A | 4,745,566 | 129,649 |
| | Whole Foods Market Inc. | 3,645,663 | 122,130 |
| | Wynn Resorts Ltd. | 1,736,097 | 120,121 |
| * | Hertz Global Holdings Inc. | 8,069,828 | 114,834 |
| | Williams-Sonoma Inc. | 1,744,984 | 101,924 |
| * | AutoNation Inc. | 1,654,605 | 98,714 |
| | Scripps Networks | | |
| | Interactive Inc. Class A | 1,621,063 | 89,499 |
| * | Rite Aid Corp. | 11,182,082 | 87,667 |
| * | Discovery | | |
| | Communications Inc. | | |
| | Class A | 3,211,527 | 85,683 |
| | Gap Inc. | 2,391,102 | 59,060 |
| * | Hyatt Hotels Corp. Class A 593,016 | 27,884 |
| | News Corp. Class B | 209,094 | 2,919 |
| * | O’Reilly Automotive Inc. | 2,680 | 679 |
| | | | 9,086,839 |
| Financials (19.6%) | | |
| | Equinix Inc. | 1,316,194 | 398,017 |
| | Hartford Financial | | |
| | Services Group Inc. | 8,755,263 | 380,504 |
| | M&T Bank Corp. | 3,076,691 | 372,833 |
| | Moody’s Corp. | 3,591,890 | 360,410 |
| | Essex Property Trust Inc. | 1,411,484 | 337,923 |
| | Citizens Financial | | |
| | Group Inc. | 11,277,997 | 295,371 |
| | Equifax Inc. | 2,532,421 | 282,036 |
| | Principal Financial | | |
| | Group Inc. | 6,257,487 | 281,462 |
| | Realty Income Corp. | 5,335,117 | 275,452 |
| | Macerich Co. | 3,384,279 | 273,078 |
| | AvalonBay | | |
| | Communities Inc. | 1,462,923 | 269,368 |
| | Regions Financial Corp. | 27,903,891 | 267,877 |
| | Lincoln National Corp. | 5,289,636 | 265,857 |
| | Welltower Inc. | 3,782,094 | 257,296 |
| * | Markel Corp. | 283,288 | 250,243 |
| | XL Group plc Class A | 6,364,521 | 249,362 |
| | SL Green Realty Corp. | 2,131,163 | 240,779 |
| | Digital Realty Trust Inc. | 3,128,127 | 236,549 |
| | KeyCorp | 17,855,723 | 235,517 |
| | Kimco Realty Corp. | 8,392,721 | 222,071 |
| | Extra Space Storage Inc. | 2,506,919 | 221,135 |
| | Federal Realty | | |
| | Investment Trust | 1,483,362 | 216,719 |
| | UDR Inc. | 5,600,575 | 210,414 |
| * | CBRE Group Inc. Class A | 6,071,382 | 209,948 |
| | First Republic Bank | 3,104,024 | 205,052 |
| | Cincinnati Financial Corp. | 3,327,227 | 196,872 |
| | FNF Group | 5,619,106 | 194,814 |
| | Western Union Co. | 10,800,353 | 193,434 |
39
| | | |
| Mid-Cap Index Fund | | |
| |
| |
| |
| | | | Market |
| | | | Value• |
| | | Shares | ($000) |
| | Annaly Capital | | |
| | Management Inc. | 20,259,777 | 190,037 |
| | Huntington | | |
| | Bancshares Inc. | 17,020,481 | 188,247 |
| * | E*TRADE Financial Corp. | 6,259,218 | 185,523 |
| * | Affiliated Managers | | |
| | Group Inc. | 1,154,507 | 184,444 |
| | Plum Creek | | |
| | Timber Co. Inc. | 3,708,877 | 176,988 |
| * | Arch Capital Group Ltd. | 2,486,538 | 173,436 |
| | Unum Group | 5,201,230 | 173,149 |
| * | Ally Financial Inc. | 9,263,218 | 172,666 |
| | CIT Group Inc. | 4,293,734 | 170,461 |
| | Voya Financial Inc. | 4,600,438 | 169,802 |
| | Willis Group Holdings plc | 3,465,234 | 168,306 |
| | SEI Investments Co. | 3,167,264 | 165,965 |
| | New York Community | | |
| | Bancorp Inc. | 9,842,724 | 160,633 |
| | Raymond James | | |
| | Financial Inc. | 2,752,548 | 159,565 |
| | Comerica Inc. | 3,775,953 | 157,948 |
| | Jones Lang LaSalle Inc. | 962,326 | 153,837 |
| | VEREIT Inc. | 19,334,374 | 153,128 |
| | Torchmark Corp. | 2,503,268 | 143,087 |
| | Nasdaq Inc. | 2,456,299 | 142,883 |
| | Camden Property Trust | 1,855,919 | 142,460 |
| | MSCI Inc. Class A | 1,974,314 | 142,407 |
| | Alexandria Real Estate | | |
| | Equities Inc. | 1,548,970 | 139,965 |
| | PartnerRe Ltd. | 921,291 | 128,741 |
| | American Capital | | |
| | Agency Corp. | 7,401,996 | 128,351 |
| | Everest Re Group Ltd. | 690,420 | 126,409 |
| | Lazard Ltd. Class A | 2,772,523 | 124,791 |
| | Reinsurance Group of | | |
| | America Inc. Class A | 1,404,747 | 120,176 |
| | Zions Bancorporation | 4,364,827 | 119,160 |
| * | Realogy Holdings Corp. | 3,130,756 | 114,805 |
| | Axis Capital Holdings Ltd. | 1,956,532 | 109,996 |
| | Iron Mountain Inc. | 4,060,216 | 109,666 |
| | WR Berkley Corp. | 1,975,525 | 108,160 |
| | People’s United | | |
| | Financial Inc. | 6,628,219 | 107,046 |
| | Brixmor Property | | |
| | Group Inc. | 4,145,296 | 107,032 |
| | Legg Mason Inc. | 2,302,850 | 90,341 |
| | Navient Corp. | 7,744,615 | 88,676 |
| * | Alleghany Corp. | 158,112 | 75,567 |
| * | LendingClub Corp. | 6,058,015 | 66,941 |
| | Assurant Inc. | 703,793 | 56,684 |
| ^ | LPL Financial Holdings Inc. 869,469 | 37,083 |
| * | Santander Consumer | | |
| | USA Holdings Inc. | 2,305,795 | 36,547 |
| | | | 12,871,502 |
| | | |
| | | | Market |
| | | | Value• |
| | | Shares | ($000) |
| Health Care (8.8%) | | |
| * | Incyte Corp. | 3,578,156 | 388,051 |
| * | Edwards | | |
| | Lifesciences Corp. | 4,610,782 | 364,160 |
| * | BioMarin | | |
| | Pharmaceutical Inc. | 3,446,712 | 361,077 |
| | CR Bard Inc. | 1,579,349 | 299,192 |
| * | Endo International plc | 4,840,235 | 296,319 |
| * | Henry Schein Inc. | 1,772,533 | 280,397 |
| * | Laboratory Corp. of | | |
| | America Holdings | 2,161,005 | 267,187 |
| * | Boston Scientific Corp. | 14,376,548 | 265,103 |
| * | Alkermes plc | 3,207,508 | 254,612 |
| * | DaVita HealthCare | | |
| | Partners Inc. | 3,608,129 | 251,523 |
| | Universal Health | | |
| | Services Inc. Class B | 1,949,235 | 232,914 |
| * | Waters Corp. | 1,657,629 | 223,084 |
| | Quest Diagnostics Inc. | 3,064,079 | 217,979 |
| * | Hologic Inc. | 5,442,403 | 210,567 |
| * | Mallinckrodt plc | 2,477,212 | 184,874 |
| | DENTSPLY | | |
| | International Inc. | 2,988,297 | 181,838 |
| * | Jazz Pharmaceuticals plc | 1,248,227 | 175,451 |
| * | Medivation Inc. | 3,497,738 | 169,081 |
| * | Varian Medical | | |
| | Systems Inc. | 2,069,997 | 167,256 |
| | ResMed Inc. | 2,983,590 | 160,189 |
| * | Alnylam | | |
| | Pharmaceuticals Inc. | 1,538,820 | 144,864 |
| * | IDEXX Laboratories Inc. | 1,943,520 | 141,721 |
| | Cooper Cos. Inc. | 1,038,765 | 139,402 |
| * | Quintiles Transnational | | |
| | Holdings Inc. | 1,709,431 | 117,369 |
| * | Envision Healthcare | | |
| | Holdings Inc. | 3,994,921 | 103,748 |
| | Patterson Cos. Inc. | 1,875,996 | 84,814 |
| * | Centene Corp. | 1,210,391 | 79,656 |
| * | Intercept | | |
| | Pharmaceuticals Inc. | 169,153 | 25,263 |
| | | | 5,787,691 |
| Industrials (16.8%) | | |
| * | Fiserv Inc. | 4,884,904 | 446,773 |
| | Roper Technologies Inc. | 2,154,692 | 408,939 |
| | Fidelity National | | |
| | Information Services Inc. 6,030,916 | 365,474 |
| | Amphenol Corp. Class A | 6,588,925 | 344,140 |
| * | Alliance Data | | |
| | Systems Corp. | 1,241,460 | 343,351 |
| | AMETEK Inc. | 5,084,641 | 272,486 |
| | Vulcan Materials Co. | 2,849,720 | 270,638 |
| * | FleetCor Technologies Inc. 1,871,498 | 267,493 |
| | Rockwell Collins Inc. | 2,809,609 | 259,327 |
| | WestRock Co. | 5,596,987 | 255,335 |
| * | Verisk Analytics Inc. | | |
| | Class A | 3,259,406 | 250,583 |
40
| | | |
| Mid-Cap Index Fund | | |
| |
| |
| |
| | | | Market |
| | | | Value• |
| | | Shares | ($000) |
| * | TransDigm Group Inc. | 1,090,176 | 249,051 |
| ^ | WW Grainger Inc. | 1,207,880 | 244,704 |
| | Fastenal Co. | 5,882,521 | 240,125 |
| | Textron Inc. | 5,264,714 | 221,171 |
| * | Stericycle Inc. | 1,816,526 | 219,073 |
| | Xerox Corp. | 20,557,899 | 218,530 |
| | Acuity Brands Inc. | 932,694 | 218,064 |
| | Ball Corp. | 2,913,880 | 211,927 |
| | Masco Corp. | 7,192,052 | 203,535 |
| | Dover Corp. | 3,312,420 | 203,084 |
| * | Mettler-Toledo | | |
| | International Inc. | 584,759 | 198,309 |
| | Martin Marietta | | |
| | Materials Inc. | 1,413,202 | 193,015 |
| | Pentair plc | 3,851,178 | 190,749 |
| | Towers Watson & Co. | | |
| | Class A | 1,484,373 | 190,683 |
| | CH Robinson | | |
| | Worldwide Inc. | 3,068,540 | 190,311 |
| | Fortune Brands Home | | |
| | & Security Inc. | 3,411,883 | 189,360 |
| | Sealed Air Corp. | 4,217,987 | 188,122 |
| | L-3 Communications | | |
| | Holdings Inc. | 1,507,265 | 180,133 |
| | Expeditors International | | |
| | of Washington Inc. | 3,982,685 | 179,619 |
| | Total System | | |
| | Services Inc. | 3,537,823 | 176,184 |
| | Kansas City Southern | 2,331,770 | 174,113 |
| | Cintas Corp. | 1,845,222 | 168,007 |
| * | Sensata Technologies | | |
| | Holding NV | 3,637,629 | 167,549 |
| * | Vantiv Inc. Class A | 3,337,073 | 158,244 |
| * | Crown Holdings Inc. | 2,978,530 | 151,011 |
| * | United Rentals Inc. | 1,983,308 | 143,869 |
| | JB Hunt Transport | | |
| | Services Inc. | 1,958,815 | 143,699 |
| | Fluor Corp. | 3,025,517 | 142,865 |
| | Xylem Inc. | 3,832,239 | 139,877 |
| | Wabtec Corp. | 1,958,248 | 139,271 |
| | ManpowerGroup Inc. | 1,572,836 | 132,574 |
| | Robert Half | | |
| | International Inc. | 2,693,058 | 126,951 |
| | Avnet Inc. | 2,820,455 | 120,828 |
| | Flowserve Corp. | 2,796,122 | 117,661 |
| | ADT Corp. | 3,523,958 | 116,220 |
| * | Trimble Navigation Ltd. | 5,351,567 | 114,791 |
| * | Hubbell Inc. Class B | 1,131,352 | 114,312 |
| | Macquarie | | |
| | Infrastructure Corp. | 1,540,715 | 111,856 |
| | Owens Corning | 2,366,319 | 111,288 |
| * | Jacobs Engineering | | |
| | Group Inc. | 2,618,528 | 109,847 |
| * | Arrow Electronics Inc. | 2,017,364 | 109,301 |
| | B/E Aerospace Inc. | 2,234,316 | 94,668 |
| | Global Payments Inc. | 1,387,596 | 89,514 |
| | | |
| | | | Market |
| | | | Value• |
| | | Shares | ($000) |
| | Allison Transmission | | |
| | Holdings Inc. | 3,290,358 | 85,187 |
| | FLIR Systems Inc. | 3,012,423 | 84,559 |
| ^ | Chicago Bridge | | |
| | & Iron Co. NV | 2,017,459 | 78,661 |
| * | First Data Corp. Class A | 3,845,085 | 61,598 |
| | Donaldson Co. Inc. | 1,417,810 | 40,634 |
| | AGCO Corp. | 777,113 | 35,273 |
| * | Quanta Services Inc. | 1,630,387 | 33,015 |
| * | Colfax Corp. | 926,013 | 21,622 |
| | | | 11,029,153 |
| Oil & Gas (4.9%) | | |
| | Tesoro Corp. | 2,573,374 | 271,156 |
| * | Cameron International | | |
| | Corp. | 4,080,986 | 257,918 |
| * | Concho Resources Inc. | 2,760,404 | 256,331 |
| | Marathon Oil Corp. | 14,469,543 | 182,172 |
| | Cimarex Energy Co. | 2,020,233 | 180,568 |
| | EQT Corp. | 3,259,082 | 169,896 |
| | Columbia Pipeline | | |
| | Group Inc. | 8,313,505 | 166,270 |
| * | Cheniere Energy Inc. | 4,286,430 | 159,670 |
| | Cabot Oil & Gas Corp. | 8,842,460 | 156,423 |
| | HollyFrontier Corp. | 3,907,779 | 155,881 |
| * | FMC Technologies Inc. | 4,870,831 | 141,303 |
| * | Weatherford | | |
| | International plc | 16,644,257 | 139,645 |
| *,^ | Antero Resources Corp. | 5,623,280 | 122,587 |
| | Helmerich & Payne Inc. | 2,187,724 | 117,153 |
| | OGE Energy Corp. | 4,266,796 | 112,174 |
| ^ | Core Laboratories NV | 905,241 | 98,436 |
| ^ | Transocean Ltd. | 7,386,410 | 91,444 |
| ^ | Range Resources Corp. | 3,460,691 | 85,168 |
| | Oceaneering | | |
| | International Inc. | 2,101,378 | 78,844 |
| | Murphy Oil Corp. | 3,493,355 | 78,426 |
| | Energen Corp. | 1,684,428 | 69,045 |
| | Ensco plc Class A | 2,517,009 | 38,737 |
| * | Southwestern Energy Co. | 4,109,896 | 29,221 |
| ^ | Chesapeake Energy Corp. | 6,398,545 | 28,793 |
| | | | 3,187,261 |
| Technology (11.5%) | | |
| * | Cerner Corp. | 6,581,123 | 395,986 |
| | NVIDIA Corp. | 10,924,534 | 360,073 |
| | SanDisk Corp. | 4,289,671 | 325,972 |
| * | Red Hat Inc. | 3,907,362 | 323,569 |
| | Skyworks Solutions Inc. | 4,085,763 | 313,909 |
| * | Palo Alto Networks Inc. | 1,744,477 | 307,272 |
| * | Autodesk Inc. | 4,834,969 | 294,595 |
| * | ServiceNow Inc. | 3,228,685 | 279,475 |
| | Lam Research Corp. | 3,385,660 | 268,889 |
| | Xilinx Inc. | 5,492,784 | 257,996 |
| * | Citrix Systems Inc. | 3,123,616 | 236,302 |
| | Seagate Technology plc | 6,391,745 | 234,321 |
| | KLA-Tencor Corp. | 3,333,332 | 231,167 |
| | Harris Corp. | 2,659,366 | 231,099 |
41
| | | |
| Mid-Cap Index Fund | | |
| |
| |
| |
| | | | Market |
| | | | Value• |
| | | Shares | ($000) |
| | Maxim Integrated | | |
| | Products Inc. | 6,075,203 | 230,858 |
| | Linear Technology Corp. | 5,111,710 | 217,094 |
| | Juniper Networks Inc. | 7,835,108 | 216,249 |
| | Microchip Technology Inc. 4,124,647 | 191,961 |
| * | Akamai Technologies Inc. | 3,611,638 | 190,080 |
| * | Workday Inc. Class A | 2,371,551 | 188,965 |
| * | VeriSign Inc. | 2,025,032 | 176,907 |
| * | ANSYS Inc. | 1,901,293 | 175,870 |
| | NetApp Inc. | 6,300,439 | 167,151 |
| * | Splunk Inc. | 2,744,899 | 161,428 |
| * | Qorvo Inc. | 3,019,838 | 153,710 |
| * | Gartner Inc. | 1,681,710 | 152,531 |
| * | Synopsys Inc. | 3,331,769 | 151,962 |
| * | F5 Networks Inc. | 1,517,021 | 147,090 |
| | Western Digital Corp. | 2,354,083 | 141,363 |
| * | Nuance | | |
| | Communications Inc. | 5,292,289 | 105,264 |
| | Garmin Ltd. | 2,441,219 | 90,740 |
| | CSRA Inc. | 2,916,817 | 87,505 |
| | CDK Global Inc. | 1,703,980 | 80,888 |
| | Marvell Technology | | |
| | Group Ltd. | 8,906,583 | 78,556 |
| * | NetSuite Inc. | 849,615 | 71,894 |
| * | IMS Health Holdings Inc. | 2,819,994 | 71,825 |
| * | Tableau Software Inc. | | |
| | Class A | 561,293 | 52,885 |
| | Computer Sciences Corp. | 1,491,108 | 48,729 |
| * | Teradata Corp. | 1,421,706 | 37,561 |
| * | Premier Inc. Class A | 932,134 | 32,876 |
| * | FireEye Inc. | 1,544,768 | 32,038 |
| * | Rackspace Hosting Inc. | 1,223,906 | 30,989 |
| | | | 7,545,594 |
| Telecommunications (1.2%) | | |
| * | Level 3 | | |
| | Communications Inc. | 6,092,110 | 331,167 |
| * | SBA Communications | | |
| | Corp. Class A | 2,696,498 | 283,321 |
| | Frontier Communications | | |
| | Corp. | 24,958,960 | 116,558 |
| * | Zayo Group Holdings Inc. | 1,043,904 | 27,758 |
| | | | 758,804 |
| Utilities (4.8%) | | |
| | Eversource Energy | 6,779,461 | 346,227 |
| | WEC Energy Group Inc. | 6,747,664 | 346,223 |
| | DTE Energy Co. | 3,833,127 | 307,379 |
| | American Water | | |
| | Works Co. Inc. | 3,836,135 | 229,209 |
| | Ameren Corp. | 5,186,316 | 224,205 |
| | CMS Energy Corp. | 5,939,700 | 214,304 |
| | SCANA Corp. | 2,748,112 | 166,233 |
| | CenterPoint Energy Inc. | 8,732,947 | 160,337 |
| | Pinnacle West | | |
| | Capital Corp. | 2,369,437 | 152,781 |
| | Alliant Energy Corp. | 2,421,974 | 151,252 |
| | Pepco Holdings Inc. | 5,418,470 | 140,934 |
| | | | |
| | | | | Market |
| | | | | Value• |
| | | Shares | | ($000) |
| | AES Corp. | 14,375,740 | | 137,576 |
| | NiSource Inc. | 6,808,403 | | 132,832 |
| | Entergy Corp. | 1,905,664 | | 130,271 |
| * | Calpine Corp. | 7,624,029 | | 110,320 |
| | ONEOK Inc. | 4,471,409 | | 110,265 |
| | NRG Energy Inc. | 3,358,269 | | 39,527 |
| | National Fuel Gas Co. | 859,458 | | 36,742 |
| * | Avangrid Inc. | 660,399 | | 25,359 |
| | | | 3,161,976 |
| Total Common Stocks | | | |
| (Cost $54,243,524) | | 65,581,084 |
| Temporary Cash Investments (0.9%)1 | | |
| Money Market Fund (0.9%) | | | |
| 2,3 | Vanguard Market Liquidity | | |
| | Fund, 0.363% | 592,394,474 | | 592,394 |
| |
| | | Face | | |
| | | Amount | | |
| | | ($000) | | |
| U.S. Government and Agency Obligations (0.0%) |
| 4 | Federal Home Loan | | | |
| | Bank Discount Notes, | | | |
| | 0.466%, 3/7/16 | 3,100 | | 3,098 |
| 4,5 | Federal Home Loan | | | |
| | Bank Discount Notes, | | | |
| | 0.371%, 5/4/16 | 8,000 | | 7,986 |
| | | | | 11,084 |
| Total Temporary Cash | | | |
| Investments (Cost $603,482) | | 603,478 |
| Total Investments (100.7%) | | | |
| (Cost $54,847,006) | | 66,184,562 |
| |
| | | | | Amount |
| | | | | ($000) |
| Other Assets and Liabilities (-0.7%) | | |
| Other Assets | | | |
| Investment in Vanguard | | | 5,819 |
| Receivables for Investment Securities Sold | 514 |
| Receivables for Accrued Income | | 84,018 |
| Receivables for Capital Shares Issued | | 145,985 |
| Other Assets | | | 4 |
| Total Other Assets | | | 236,340 |
| Liabilities | | | |
| Payables for Investment Securities | | |
| Purchased | | | (36,227) |
| Collateral for Securities on Loan | | (400,410) |
| Payables for Capital Shares Redeemed | | (190,949) |
| Payables to Vanguard | | | (37,919) |
| Other Liabilities | | | (31,579) |
| Total Liabilities | | | (697,084) |
| Net Assets (100%) | | 65,723,818 |
42
Mid-Cap Index Fund
At December 31, 2015, net assets consisted of:
Amount ($000)
| |
| Paid-in Capital | 56,344,390 |
| Overdistributed Net Investment Income | (7,594) |
| Accumulated Net Realized Losses | (1,952,081) |
| Unrealized Appreciation (Depreciation) | |
| Investment Securities | 11,337,556 |
| Futures Contracts | 1,547 |
| Net Assets | 65,723,818 |
| |
| |
| Investor Shares—Net Assets | |
| Applicable to 126,272,644 outstanding | |
| $.001 par value shares of beneficial | |
| interest (unlimited authorization) | 4,140,072 |
| Net Asset Value Per Share— | |
| Investor Shares | $32.79 |
| |
| |
| ETF Shares—Net Assets | |
| Applicable to 108,136,526 outstanding | |
| $.001 par value shares of beneficial | |
| interest (unlimited authorization) | 12,984,375 |
| Net Asset Value Per Share— | |
| ETF Shares | $120.07 |
| |
| | Amount |
| | ($000) |
| Admiral Shares—Net Assets | |
| Applicable to 168,506,054 outstanding | |
| $.001 par value shares of beneficial | |
| interest (unlimited authorization) | 25,060,922 |
| Net Asset Value Per Share— | |
| Admiral Shares | $148.72 |
| |
| |
| Institutional Shares—Net Assets | |
| Applicable to 373,741,433 outstanding | |
| $.001 par value shares of beneficial | |
| interest (unlimited authorization) | 12,278,418 |
| Net Asset Value Per Share— | |
| Institutional Shares | $32.85 |
| |
| |
| Institutional Plus Shares—Net Assets | |
| Applicable to 69,494,516 outstanding | |
| $.001 par value shares of beneficial | |
| interest (unlimited authorization) | 11,260,031 |
| Net Asset Value Per Share— | |
| Institutional Plus Shares | $162.03 |
• See Note A in Notes to Financial Statements.
* Non-income-producing security.
^ Includes partial security positions on loan to broker-dealers. The total value of securities on loan is $387,022,000.
1 The fund invests a portion of its cash reserves in equity markets through the use of index futures contracts and swap contracts. After giving
effect to futures and swap investments, the fund’s effective common stock and temporary cash investment positions represent 100.0% and 0.7%, respectively, of net assets.
2 Affiliated money market fund available only to Vanguard funds and certain trusts and accounts managed by Vanguard. Rate shown is the 7-day yield.
3 Includes $400,410,000 of collateral received for securities on loan.
4 The issuer operates under a congressional charter; its securities are generally neither guaranteed by the U.S. Treasury nor backed by the full faith and credit of the U.S. government.
5 Securities with a value of $7,587,000 have been segregated as initial margin for open futures contracts.
See accompanying Notes, which are an integral part of the Financial Statements.
43
| |
| Mid-Cap Index Fund | |
| |
| |
| Statement of Operations | |
| |
| | Year Ended |
| | December 31, 2015 |
| | ($000) |
| Investment Income | |
| Income | |
| Dividends | 991,606 |
| Interest1 | 359 |
| Securities Lending | 13,982 |
| Total Income | 1,005,947 |
| Expenses | |
| The Vanguard Group—Note B | |
| Investment Advisory Services | 4,152 |
| Management and Administrative—Investor Shares | 7,590 |
| Management and Administrative—ETF Shares | 7,042 |
| Management and Administrative—Admiral Shares | 14,512 |
| Management and Administrative—Institutional Shares | 6,504 |
| Management and Administrative—Institutional Plus Shares | 3,918 |
| Marketing and Distribution—Investor Shares | 1,015 |
| Marketing and Distribution—ETF Shares | 1,179 |
| Marketing and Distribution—Admiral Shares | 2,814 |
| Marketing and Distribution—Institutional Shares | 918 |
| Marketing and Distribution—Institutional Plus Shares | 715 |
| Custodian Fees | 598 |
| Auditing Fees | 39 |
| Shareholders’ Reports—Investor Shares | 128 |
| Shareholders’ Reports—ETF Shares | 317 |
| Shareholders’ Reports—Admiral Shares | 260 |
| Shareholders’ Reports—Institutional Shares | 130 |
| Shareholders’ Reports—Institutional Plus Shares | 109 |
| Trustees’ Fees and Expenses | 44 |
| Total Expenses | 51,984 |
| Net Investment Income | 953,963 |
| Realized Net Gain (Loss) | |
| Investment Securities Sold | 2,972,483 |
| Futures Contracts | 956 |
| Realized Net Gain (Loss) | 2,973,439 |
| Change in Unrealized Appreciation (Depreciation) | |
| Investment Securities | (4,921,118) |
| Futures Contracts | (3,390) |
| Change in Unrealized Appreciation (Depreciation) | (4,924,508) |
| Net Increase (Decrease) in Net Assets Resulting from Operations | (997,106) |
| 1 Interest income from an affiliated company of the fund was $340,000. | |
| See accompanying Notes, which are an integral part of the Financial Statements. | |
44
| | |
| Mid-Cap Index Fund | | |
| |
| |
| Statement of Changes in Net Assets | | |
| |
| | Year Ended December 31, |
| | 2015 | 2014 |
| | ($000) | ($000) |
| Increase (Decrease) in Net Assets | | |
| Operations | | |
| Net Investment Income | 953,963 | 748,697 |
| Realized Net Gain (Loss) | 2,973,439 | 2,009,672 |
| Change in Unrealized Appreciation (Depreciation) | (4,924,508) | 4,090,158 |
| Net Increase (Decrease) in Net Assets Resulting from Operations | (997,106) | 6,848,527 |
| Distributions | | |
| Net Investment Income | | |
| Investor Shares | (55,549) | (52,495) |
| ETF Shares | (185,676) | (127,541) |
| Admiral Shares | (357,030) | (277,621) |
| Signal Shares | — | (1,467) |
| Institutional Shares | (177,330) | (143,706) |
| Institutional Plus Shares | (166,136) | (140,654) |
| Realized Capital Gain | | |
| Investor Shares | — | — |
| ETF Shares | — | — |
| Admiral Shares | — | — |
| Signal Shares | — | — |
| Institutional Shares | — | — |
| Institutional Plus Shares | — | — |
| Total Distributions | (941,721) | (743,484) |
| Capital Share Transactions | | |
| Investor Shares | (363,862) | (737,083) |
| ETF Shares | 3,479,124 | 2,167,390 |
| Admiral Shares | 3,709,404 | 10,038,885 |
| Signal Shares | — | (7,553,705) |
| Institutional Shares | 1,484,151 | 610,917 |
| Institutional Plus Shares | 426,054 | 1,572,671 |
| Net Increase (Decrease) from Capital Share Transactions | 8,734,871 | 6,099,075 |
| Total Increase (Decrease) | 6,796,044 | 12,204,118 |
| Net Assets | | |
| Beginning of Period | 58,927,774 | 46,723,656 |
| End of Period1 | 65,723,818 | 58,927,774 |
1 Net Assets—End of Period includes undistributed (overdistributed) net investment income of ($7,594,000) and ($19,836,000).
See accompanying Notes, which are an integral part of the Financial Statements.
45
| | | | | |
| Mid-Cap Index Fund | | | | | |
| |
| |
| Financial Highlights | | | | | |
| |
| |
| Investor Shares | | | | | |
| |
| For a Share Outstanding | | | Year Ended December 31, |
| Throughout Each Period | 2015 | 2014 | 2013 | 2012 | 2011 |
| Net Asset Value, Beginning of Period | $33.72 | $30.02 | $22.47 | $19.65 | $20.31 |
| Investment Operations | | | | | |
| Net Investment Income | . 444 | .387 | .299 | .286 | .233 |
| Net Realized and Unrealized Gain (Loss) | | | | | |
| on Investments | (. 939) | 3.697 | 7.560 | 2.818 | (. 661) |
| Total from Investment Operations | (.495) | 4.084 | 7.859 | 3.104 | (. 428) |
| Distributions | | | | | |
| Dividends from Net Investment Income | (.435) | (.384) | (. 309) | (. 284) | (.232) |
| Distributions from Realized Capital Gains | — | — | — | — | — |
| Total Distributions | (.435) | (.384) | (. 309) | (. 284) | (.232) |
| Net Asset Value, End of Period | $32.79 | $33.72 | $30.02 | $22.47 | $19.65 |
| |
| Total Return1 | -1.46% | 13.60% | 35.00% | 15.80% | -2.11% |
| |
| Ratios/Supplemental Data | | | | | |
| Net Assets, End of Period (Millions) | $4,140 | $4,607 | $4,797 | $3,887 | $4,168 |
| Ratio of Total Expenses to | | | | | |
| Average Net Assets | 0.20% | 0.23% | 0.24% | 0.24% | 0.24% |
| Ratio of Net Investment Income to | | | | | |
| Average Net Assets | 1.35% | 1.30% | 1.16% | 1.36% | 1.15% |
| Portfolio Turnover Rate2 | 15% | 11% | 32% | 17% | 22% |
1 Total returns do not include account service fees that may have applied in the periods shown. Fund prospectuses provide information about any applicable account service fees.
2 Excludes the value of portfolio securities received or delivered as a result of in-kind purchases or redemptions of the fund’s capital shares, including ETF Creation Units.
See accompanying Notes, which are an integral part of the Financial Statements.
46
| | | | | |
| Mid-Cap Index Fund | | | | | |
| |
| |
| Financial Highlights | | | | | |
| |
| |
| ETF Shares | | | | | |
| |
| For a Share Outstanding | | | Year Ended December 31, |
| Throughout Each Period | 2015 | 2014 | 2013 | 2012 | 2011 |
| Net Asset Value, Beginning of Period | $123.50 | $109.96 | $82.33 | $71.99 | $74.42 |
| Investment Operations | | | | | |
| Net Investment Income | 1.793 | 1.609 | 1.255 | 1.173 | .976 |
| Net Realized and Unrealized Gain (Loss) | | | | | |
| on Investments | (3.457) | 13.524 | 27.668 | 10.329 | (2.430) |
| Total from Investment Operations | (1.664) | 15.133 | 28.923 | 11.502 | (1.454) |
| Distributions | | | | | |
| Dividends from Net Investment Income | (1.766) | (1.593) | (1.293) | (1.162) | (.976) |
| Distributions from Realized Capital Gains | — | — | — | — | — |
| Total Distributions | (1.766) | (1.593) | (1.293) | (1.162) | (.976) |
| Net Asset Value, End of Period | $120.07 | $123.50 | $109.96 | $82.33 | $71.99 |
| |
| Total Return | -1.34% | 13.76% | 35.15% | 15.98% | -1.96% |
| |
| Ratios/Supplemental Data | | | | | |
| Net Assets, End of Period (Millions) | $12,984 | $9,879 | $6,728 | $3,926 | $3,241 |
| Ratio of Total Expenses to | | | | | |
| Average Net Assets | 0.08% | 0.09% | 0.09% | 0.10% | 0.10% |
| Ratio of Net Investment Income to | | | | | |
| Average Net Assets | 1.47% | 1.44% | 1.31% | 1.50% | 1.29% |
| Portfolio Turnover Rate1 | 15% | 11% | 32% | 17% | 22% |
1 Excludes the value of portfolio securities received or delivered as a result of in-kind purchases or redemptions of the fund’s capital shares, including ETF Creation Units.
See accompanying Notes, which are an integral part of the Financial Statements.
47
| | | | | |
| Mid-Cap Index Fund | | | | | |
| |
| |
| Financial Highlights | | | | | |
| |
| |
| Admiral Shares | | | | | |
| |
| For a Share Outstanding | | | Year Ended December 31, |
| Throughout Each Period | 2015 | 2014 | 2013 | 2012 | 2011 |
| Net Asset Value, Beginning of Period | $152.97 | $136.19 | $101.97 | $89.15 | $92.17 |
| Investment Operations | | | | | |
| Net Investment Income | 2.214 | 1.987 | 1.550 | 1.450 | 1.212 |
| Net Realized and Unrealized Gain (Loss) | | | | | |
| on Investments | (4.284) | 16.759 | 34.269 | 12.808 | (3.023) |
| Total from Investment Operations | (2.070) | 18.746 | 35.819 | 14.258 | (1.811) |
| Distributions | | | | | |
| Dividends from Net Investment Income | (2.180) | (1.966) | (1.599) | (1.438) | (1.209) |
| Distributions from Realized Capital Gains | — | — | — | — | — |
| Total Distributions | (2.180) | (1.966) | (1.599) | (1.438) | (1.209) |
| Net Asset Value, End of Period | $148.72 | $152.97 | $136.19 | $101.97 | $89.15 |
| |
| Total Return1 | -1.34% | 13.76% | 35.15% | 15.99% | -1.97% |
| |
| Ratios/Supplemental Data | | | | | |
| Net Assets, End of Period (Millions) | $25,061 | $22,125 | $10,251 | $6,895 | $5,989 |
| Ratio of Total Expenses to | | | | | |
| Average Net Assets | 0.08% | 0.09% | 0.09% | 0.10% | 0.10% |
| Ratio of Net Investment Income to | | | | | |
| Average Net Assets | 1.47% | 1.44% | 1.31% | 1.50% | 1.29% |
| Portfolio Turnover Rate2 | 15% | 11% | 32% | 17% | 22% |
1 Total returns do not include account service fees that may have applied in the periods shown. Fund prospectuses provide information about any applicable account service fees.
2 Excludes the value of portfolio securities received or delivered as a result of in-kind purchases or redemptions of the fund’s capital shares, including ETF Creation Units.
See accompanying Notes, which are an integral part of the Financial Statements.
48
| | | | | |
| Mid-Cap Index Fund | | | | | |
| |
| |
| Financial Highlights | | | | | |
| |
| |
| Institutional Shares | | | | | |
| |
| For a Share Outstanding | | | Year Ended December 31, |
| Throughout Each Period | 2015 | 2014 | 2013 | 2012 | 2011 |
| Net Asset Value, Beginning of Period | $33.79 | $30.08 | $22.52 | $19.69 | $20.36 |
| Investment Operations | | | | | |
| Net Investment Income | . 492 | .442 | .344 | .325 | .271 |
| Net Realized and Unrealized Gain (Loss) | | | | | |
| on Investments | (.947) | 3.704 | 7.571 | 2.827 | (. 669) |
| Total from Investment Operations | (.455) | 4.146 | 7.915 | 3.152 | (.398) |
| Distributions | | | | | |
| Dividends from Net Investment Income | (.485) | (. 436) | (. 355) | (. 322) | (. 272) |
| Distributions from Realized Capital Gains | — | — | — | — | — |
| Total Distributions | (.485) | (. 436) | (. 355) | (. 322) | (. 272) |
| Net Asset Value, End of Period | $32.85 | $33.79 | $30.08 | $22.52 | $19.69 |
| |
| Total Return | -1.33% | 13.78% | 35.17% | 16.01% | -1.96% |
| |
| Ratios/Supplemental Data | | | | | |
| Net Assets, End of Period (Millions) | $12,278 | $11,172 | $9,368 | $7,057 | $5,611 |
| Ratio of Total Expenses to | | | | | |
| Average Net Assets | 0.07% | 0.08% | 0.08% | 0.08% | 0.08% |
| Ratio of Net Investment Income to | | | | | |
| Average Net Assets | 1.48% | 1.45% | 1.32% | 1.52% | 1.31% |
| Portfolio Turnover Rate1 | 15% | 11% | 32% | 17% | 22% |
1 Excludes the value of portfolio securities received or delivered as a result of in-kind purchases or redemptions of the fund’s capital shares, including ETF Creation Units.
See accompanying Notes, which are an integral part of the Financial Statements.
49
| | | | | |
| Mid-Cap Index Fund | | | | | |
| |
| |
| Financial Highlights | | | | | |
| |
| |
| Institutional Plus Shares | | | | | |
| |
| For a Share Outstanding | | | Year Ended December 31, |
| Throughout Each Period | 2015 | 2014 | 2013 | 2012 | 2011 |
| Net Asset Value, Beginning of Period | $166.65 | $148.37 | $111.08 | $97.12 | $100.40 |
| Investment Operations | | | | | |
| Net Investment Income | 2.461 | 2.210 | 1.726 | 1.624 | 1.358 |
| Net Realized and Unrealized Gain (Loss) | | | | | |
| on Investments | (4.657) | 18.256 | 37.343 | 13.945 | (3.280) |
| Total from Investment Operations | (2.196) | 20.466 | 39.069 | 15.569 | (1.922) |
| Distributions | | | | | |
| Dividends from Net Investment Income | (2.424) | (2.186) | (1.779) | (1.609) | (1.358) |
| Distributions from Realized Capital Gains | — | — | — | — | — |
| Total Distributions | (2.424) | (2.186) | (1.779) | (1.609) | (1.358) |
| Net Asset Value, End of Period | $162.03 | $166.65 | $148.37 | $111.08 | $97.12 |
| |
| Total Return | -1.30% | 13.79% | 35.20% | 16.03% | -1.91% |
| |
| Ratios/Supplemental Data | | | | | |
| Net Assets, End of Period (Millions) | $11,260 | $11,144 | $8,468 | $5,428 | $3,393 |
| Ratio of Total Expenses to | | | | | |
| Average Net Assets | 0.05% | 0.06% | 0.06% | 0.06% | 0.06% |
| Ratio of Net Investment Income to | | | | | |
| Average Net Assets | 1.50% | 1.47% | 1.34% | 1.54% | 1.33% |
| Portfolio Turnover Rate1 | 15% | 11% | 32% | 17% | 22% |
1 Excludes the value of portfolio securities received or delivered as a result of in-kind purchases or redemptions of the fund’s capital shares, including ETF Creation Units.
See accompanying Notes, which are an integral part of the Financial Statements.
50
Mid-Cap Index Fund
Notes to Financial Statements
Vanguard Mid-Cap Index Fund is registered under the Investment Company Act of 1940 as an open-end investment company, or mutual fund. The fund offers five classes of shares: Investor Shares, ETF Shares, Admiral Shares, Institutional Shares, and Institutional Plus Shares. Investor Shares are available to any investor who meets the fund’s minimum purchase requirements. ETF Shares are listed for trading on NYSE Arca; they can be purchased and sold through a broker. Admiral Shares, Institutional Shares, and Institutional Plus Shares are designed for investors who meet certain administrative, service, and account-size criteria. Prior to October 24, 2014, the fund offered Signal Shares. Effective at the close of business on October 24, 2014, the Signal Shares were converted to Admiral Shares.
A. The following significant accounting policies conform to generally accepted accounting principles for U.S. investment companies. The fund consistently follows such policies in preparing its financial statements.
1. Security Valuation: Securities are valued as of the close of trading on the New York Stock Exchange (generally 4 p.m., Eastern time) on the valuation date. Equity securities are valued at the latest quoted sales prices or official closing prices taken from the primary market in which each security trades; such securities not traded on the valuation date are valued at the mean of the latest quoted bid and asked prices. Securities for which market quotations are not readily available, or whose values have been materially affected by events occurring before the fund’s pricing time but after the close of the securities’ primary markets, are valued by methods deemed by the board of trustees to represent fair value. Investments in Vanguard Market Liquidity Fund are valued at that fund’s net asset value. Temporary cash investments acquired over 60 days to maturity are valued using the latest bid prices or using valuations based on a matrix system (which considers such factors as security prices, yields, maturities, and ratings), both as furnished by independent pricing services. Other temporary cash investments are valued at amortized cost, which approximates market value.
2. Futures Contracts: The fund uses index futures contracts to a limited extent, with the objectives of maintaining full exposure to the stock market, enhancing returns, maintaining liquidity, and minimizing transaction costs. The fund may purchase futures contracts to immediately invest incoming cash in the market, or sell futures in response to cash outflows, thereby simulating a fully invested position in the underlying index while maintaining a cash balance for liquidity. The fund may seek to enhance returns by using futures contracts instead of the underlying securities when futures are believed to be priced more attractively than the underlying securities. The primary risks associated with the use of futures contracts are imperfect correlation between changes in market values of stocks held by the fund and the prices of futures contracts, and the possibility of an illiquid market. Counterparty risk involving futures is mitigated because a regulated clearinghouse is the counterparty instead of the clearing broker. To further mitigate counterparty risk, the fund trades futures contracts on an exchange, monitors the financial strength of its clearing brokers and clearinghouse, and has entered into clearing agreements with its clearing brokers. The clearinghouse imposes initial margin requirements to secure the fund’s performance and requires daily settlement of variation margin representing changes in the market value of each contract.
Futures contracts are valued at their quoted daily settlement prices. The aggregate settlement values of the contracts are not recorded in the Statement of Net Assets. Fluctuations in the value of the contracts are recorded in the Statement of Net Assets as an asset (liability) and in the Statement of Operations as unrealized appreciation (depreciation) until the contracts are closed, when they are recorded as realized futures gains (losses).
51
Mid-Cap Index Fund
During the year ended December 31, 2015, the fund’s average investments in long and short futures contracts represented less than 1% and 0% of net assets, respectively, based on the average of aggregate settlement values at each quarter-end during the period.
3. Federal Income Taxes: The fund intends to continue to qualify as a regulated investment company and distribute all of its taxable income. Management has analyzed the fund’s tax positions taken for all open federal income tax years (December 31, 2012–2015), and has concluded that no provision for federal income tax is required in the fund’s financial statements.
4. Distributions: Distributions to shareholders are recorded on the ex-dividend date.
5. Securities Lending: To earn additional income, the fund lends its securities to qualified institutional borrowers. Security loans are subject to termination by the fund at any time and are required to be secured at all times by collateral in an amount at least equal to the market value of securities loaned. Daily market fluctuations could cause the value of loaned securities to be more or less than the value of the collateral received. When this occurs, the collateral is adjusted and settled on the next business day. The fund further mitigates its counterparty risk by entering into securities lending transactions only with a diverse group of prequalified counterparties, monitoring their financial strength, and entering into master securities lending agreements with its counterparties. The master securities lending agreements provide that, in the event of a counterparty’s default (including bankruptcy), the fund may terminate any loans with that borrower, determine the net amount owed, and sell or retain the collateral up to the net amount owed to the fund; however, such actions may be subject to legal proceedings. While collateral mitigates counterparty risk, in the absence of a default the fund may experience delays and costs in recovering the securities loaned. The fund invests cash collateral received in Vanguard Market Liquidity Fund, and records a liability in the Statement of Net Assets for the return of the collateral, during the period the securities are on loan. Securities lending income represents fees charged to borrowers plus income earned on invested cash collateral, less expenses associated with the loan.
6. Credit Facility: The fund and certain other funds managed by The Vanguard Group (“Vanguard”) participate in a $3 billion committed credit facility provided by a syndicate of lenders pursuant to a credit agreement that may be renewed annually; each fund is individually liable for its borrowings, if any, under the credit facility. Borrowings may be utilized for temporary and emergency purposes, and are subject to the fund’s regulatory and contractual borrowing restrictions. The participating funds are charged administrative fees and an annual commitment fee of 0.06% of the undrawn amount of the facility; these fees are allocated to the funds based on a method approved by the fund’s board of trustees and included in Management and Administrative expenses on the fund’s Statement of Operations. Any borrowings under this facility bear interest at a rate equal to the higher of the federal funds rate or LIBOR reference rate plus an agreed-upon spread.
The fund had no borrowings outstanding at December 31, 2015, or at any time during the period then ended.
7. Other: Dividend income is recorded on the ex-dividend date. Interest income includes income distributions received from Vanguard Market Liquidity Fund and is accrued daily. Premiums and discounts on debt securities purchased are amortized and accreted, respectively, to interest income over the lives of the respective securities. Security transactions are accounted for on the date securities are bought or sold. Costs used to determine realized gains (losses) on the sale of investment securities are those of the specific securities sold.
52
Mid-Cap Index Fund
Each class of shares has equal rights as to assets and earnings, except that each class separately bears certain class-specific expenses related to maintenance of shareholder accounts (included in Management and Administrative expenses) and shareholder reporting. Marketing and distribution expenses are allocated to each class of shares based on a method approved by the board of trustees. Income, other non-class-specific expenses, and gains and losses on investments are allocated to each class of shares based on its relative net assets.
B. In accordance with the terms of a Funds’ Service Agreement (the “FSA”) between Vanguard and the fund, Vanguard furnishes to the fund investment advisory, corporate management, administrative, marketing, and distribution services at Vanguard’s cost of operations (as defined by the FSA). These costs of operations are allocated to the fund based on methods and guidelines approved by the board of trustees. Vanguard does not require reimbursement in the current period for certain costs of operations (such as deferred compensation/benefits and risk/insurance costs); the fund’s liability for these costs of operations is included in Payables to Vanguard on the Statement of Net Assets.
Upon the request of Vanguard, the fund may invest up to 0.40% of its net assets as capital in Vanguard. At December 31, 2015, the fund had contributed to Vanguard capital in the amount of $5,819,000, representing 0.01% of the fund’s net assets and 2.33% of Vanguard’s capitalization. The fund’s trustees and officers are also directors and employees, respectively, of Vanguard.
C. Various inputs may be used to determine the value of the fund’s investments. These inputs are summarized in three broad levels for financial statement purposes. The inputs or methodologies used to value securities are not necessarily an indication of the risk associated with investing in those securities.
Level 1—Quoted prices in active markets for identical securities.
Level 2—Other significant observable inputs (including quoted prices for similar securities, interest rates, prepayment speeds, credit risk, etc.).
Level 3—Significant unobservable inputs (including the fund’s own assumptions used to determine the fair value of investments).
The following table summarizes the market value of the fund’s investments as of December 31, 2015, based on the inputs used to value them:
| | | |
| | Level 1 | Level 2 | Level 3 |
| Investments | ($000) | ($000) | ($000) |
| Common Stocks | 65,581,084 | — | — |
| Temporary Cash Investments | 592,394 | 11,084 | — |
| Futures Contracts—Liabilities1 | (1,491) | — | — |
| Total | 66,171,987 | 11,084 | — |
| 1 Represents variation margin on the last day of the reporting period. | | | |
53
Mid-Cap Index Fund
D. At December 31, 2015, the aggregate settlement value of open futures contracts and the related unrealized appreciation (depreciation) were:
| | | | |
| | | | | ($000) |
| | | | Aggregate | |
| | | Number of | Settlement | Unrealized |
| | | Long (Short) | Value | Appreciation |
| Futures Contracts | Expiration | Contracts | Long (Short) | (Depreciation) |
| E-mini S&P 500 Index | March 2016 | 900 | 91,593 | 637 |
| E-mini S&P MidCap 400 Index | March 2016 | 482 | 67,167 | 910 |
| | | | | 1,547 |
Unrealized appreciation (depreciation) on open futures contracts is required to be treated as realized gain (loss) for tax purposes.
E. Distributions are determined on a tax basis and may differ from net investment income and realized capital gains for financial reporting purposes. Differences may be permanent or temporary. Permanent differences are reclassified among capital accounts in the financial statements to reflect their tax character. Temporary differences arise when certain items of income, expense, gain, or loss are recognized in different periods for financial statement and tax purposes. These differences will reverse at some time in the future. Differences in classification may also result from the treatment of short-term gains as ordinary income for tax purposes.
During the year ended December 31, 2015, the fund realized $4,221,102,000 of net capital gains resulting from in-kind redemptions—in which shareholders exchanged fund shares for securities held by the fund rather than for cash. Because such gains are not taxable to the fund, and are not distributed to shareholders, they have been reclassified from accumulated net realized losses to paid-in capital.
For tax purposes, at December 31, 2015, the fund had $25,830,000 of ordinary income available for distribution. At December 31, 2015, the fund had available capital losses totaling $1,949,337,000 to offset future net capital gains. Of this amount, $294,968,000 is subject to expiration on December 31, 2018. Capital losses of $1,654,369,000 realized beginning in fiscal 2011 may be carried forward indefinitely under the Regulated Investment Company Modernization Act of 2010, but must be used before any expiring loss carryforwards.
At December 31, 2015, the cost of investment securities for tax purposes was $54,847,006,000. Net unrealized appreciation of investment securities for tax purposes was $11,337,556,000, consisting of unrealized gains of $14,370,918,000 on securities that had risen in value since their purchase and $3,033,362,000 in unrealized losses on securities that had fallen in value since their purchase.
F. During the year ended December 31, 2015, the fund purchased $27,381,469,000 of investment securities and sold $18,531,674,000 of investment securities, other than temporary cash investments. Purchases and sales include $11,810,404,000 and $9,059,213,000, respectively, in connection with in-kind purchases and redemptions of the fund’s capital shares.
54
Mid-Cap Index Fund
| | | | |
| G. Capital share transactions for each class of shares were: | | | |
| | | | Year Ended December 31, |
| | | 2015 | | 2014 |
| | Amount | Shares | Amount | Shares |
| | ($000) | (000) | ($000) | (000) |
| Investor Shares | | | | |
| Issued | 860,039 | 25,140 | 784,652 | 24,892 |
| Issued in Lieu of Cash Distributions | 52,328 | 1,606 | 48,972 | 1,453 |
| Redeemed | (1,276,229) | (37,116) | (1,570,707) | (49,520) |
| Net Increase (Decrease)—Investor Shares | (363,862) | (10,370) | (737,083) | (23,175) |
| ETF Shares | | | | |
| Issued | 12,613,214 | 100,772 | 6,971,484 | 59,710 |
| Issued in Lieu of Cash Distributions | — | — | — | — |
| Redeemed | (9,134,090) | (72,625) | (4,804,094) | (40,900) |
| Net Increase (Decrease) —ETF Shares | 3,479,124 | 28,147 | 2,167,390 | 18,810 |
| Admiral Shares | | | | |
| Issued1 | 7,061,299 | 45,458 | 11,618,535 | 80,324 |
| Issued in Lieu of Cash Distributions | 319,756 | 2,164 | 249,866 | 1,632 |
| Redeemed | (3,671,651) | (23,756) | (1,829,516) | (12,582) |
| Net Increase (Decrease) —Admiral Shares | 3,709,404 | 23,866 | 10,038,885 | 69,374 |
| Signal Shares | | | | |
| Issued | — | — | 1,487,330 | 33,613 |
| Issued in Lieu of Cash Distributions | — | — | 1,279 | 29 |
| Redeemed1 | — | — | (9,042,314) | (199,142) |
| Net Increase (Decrease)—Signal Shares | — | — | (7,553,705) | (165,500) |
| Institutional Shares | | | | |
| Issued | 3,536,524 | 102,942 | 3,463,625 | 108,721 |
| Issued in Lieu of Cash Distributions | 165,251 | 5,063 | 134,444 | 3,977 |
| Redeemed | (2,217,624) | (64,898) | (2,987,152) | (93,468) |
| Net Increase (Decrease) —Institutional Shares | 1,484,151 | 43,107 | 610,917 | 19,230 |
| Institutional Plus Shares | | | | |
| Issued | 1,723,360 | 10,254 | 2,981,121 | 18,866 |
| Issued in Lieu of Cash Distributions | 158,363 | 984 | 135,623 | 814 |
| Redeemed | (1,455,669) | (8,616) | (1,544,073) | (9,879) |
| Net Increase (Decrease) —Institutional Plus Shares | 426,054 | 2,622 | 1,572,671 | 9,801 |
1 Admiral Shares Issued and Signal Shares Redeemed include $4,942,217,000 from the conversion of Signal Shares to Admiral Shares during the 2014 fiscal year.
H. Management has determined that no material events or transactions occurred subsequent to December 31, 2015, that would require recognition or disclosure in these financial statements.
55
Mid-Cap Growth Index Fund
Fund Profile
As of December 31, 2015
Share-Class Characteristics
| | | |
| | Investor | ETF | Admiral |
| | Shares | Shares | Shares |
| Ticker Symbol | VMGIX | VOT | VMGMX |
| Expense Ratio1 | 0.23% | 0.09% | 0.09% |
| 30-Day SEC Yield | 0.67% | 0.77% | 0.78% |
| |
| Portfolio Characteristics | | |
| | | CRSP US | DJ |
| | | Mid Cap | U.S. Total |
| | | Growth | Market |
| | Fund | Index FA Index |
| Number of Stocks | 170 | 168 | 3,960 |
| Median Market Cap | $11.8B | $11.8B | $51.4B |
| Price/Earnings Ratio | 32.5x | 32.5x | 21.9x |
| Price/Book Ratio | 4.5x | 4.5x | 2.7x |
| Return on Equity | 18.5% | 18.0% | 17.2% |
| Earnings Growth Rate | 16.9% | 16.9% | 9.5% |
| Dividend Yield | 0.9% | 0.9% | 2.1% |
| Foreign Holdings | 0.0% | 0.0% | 0.0% |
| Turnover Rate | 23% | — | — |
| Short-Term Reserves | 0.1% | — | — |
Sector Diversification (% of equity exposure)
| | | |
| | | CRSP US | DJ |
| | | Mid Cap | U.S. Total |
| | | Growth | Market |
| | Fund | Index | FA Index |
| Basic Materials | 0.9% | 0.9% | 2.3% |
| Consumer Goods | 11.5 | 11.5 | 10.3 |
| Consumer Services | 17.5 | 17.5 | 14.2 |
| Financials | 14.3 | 14.3 | 19.5 |
| Health Care | 12.0 | 12.0 | 14.0 |
| Industrials | 22.3 | 22.3 | 12.2 |
| Oil & Gas | 3.7 | 3.7 | 5.9 |
| Technology | 15.3 | 15.3 | 16.4 |
| Telecommunications | 2.1 | 2.1 | 2.2 |
| Utilities | 0.4 | 0.4 | 3.0 |
| | |
| Volatility Measures | | |
| | | DJ |
| | Spliced | U.S. Total |
| | Mid-Cap | Market |
| | Growth Index | FA Index |
| R-Squared | 1.00 | 0.87 |
| Beta | 1.00 | 0.99 |
These measures show the degree and timing of the fund’s fluctuations compared with the indexes over 36 months.
Ten Largest Holdings (% of total net assets)
| | |
| Ross Stores Inc. | Apparel Retailers | 1.5% |
| Fiserv Inc. | Financial | |
| | Administration | 1.4 |
| Electronic Arts Inc. | Toys | 1.4 |
| Roper Technologies Inc. | Electronic Equipment | 1.3 |
| Equinix Inc. | Specialty REITs | 1.3 |
| Cerner Corp. | Software | 1.3 |
| Incyte Corp. | Biotechnology | 1.2 |
| Dollar Tree Inc. | Specialty Retailers | 1.2 |
| Edwards Lifesciences | | |
| Corp. | Medical Supplies | 1.2 |
| BioMarin Pharmaceutical | | |
| Inc. | Biotechnology | 1.2 |
| Top Ten | | 13.0% |
The holdings listed exclude any temporary cash investments and equity index products.
1 The expense ratios shown are from the prospectus dated April 28, 2015, and represent estimated costs for the current fiscal year. For the fiscal year ended December 31, 2015, the expense ratios were 0.20% for Investor Shares, 0.08% for ETF Shares, and 0.08% for Admiral Shares.
56
Mid-Cap Growth Index Fund
Performance Summary
All of the returns in this report represent past performance, which is not a guarantee of future results that may be achieved by the fund. (Current performance may be lower or higher than the performance data cited. For performance data current to the most recent month-end, visit our website at vanguard.com/performance.) Note, too, that both investment returns and principal value can fluctuate widely, so an investor’s shares, when sold, could be worth more or less than their original cost. The returns shown do not reflect taxes that a shareholder would pay on fund distributions or on the sale of fund shares.
Cumulative Performance: August 24, 2006, Through December 31, 2015
Initial Investment of $10,000
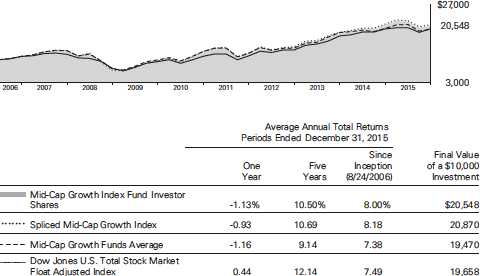
For a benchmark description, see the Glossary.
Mid-Cap Growth Funds Average: Derived from data provided by Lipper, a Thomson Reuters Company.
"Since Inception" performance is calculated from the Investor Shares’ inception date for both the fund and its comparative standards.
| | | | |
| | | | Since | Final Value |
| | One | Five | Inception | of a $10,000 |
| | Year | Years | (8/17/2006) | Investment |
| Mid-Cap Growth Index Fund | | | | |
| ETF Shares Net Asset Value | -1.00% | 10.65% | 7.97% | $20,516 |
| Spliced Mid-Cap Growth Index | -0.93 | 10.69 | 8.00 | 20,574 |
| Dow Jones U.S. Total Stock Market Float | | | | |
| Adjusted Index | 0.44 | 12.14 | 7.44 | 19,596 |
"Since Inception" performance is calculated from the ETF Shares’ inception date for both the fund and its comparative standards.
See Financial Highlights for dividend and capital gains information.
57
| | | |
| Mid-Cap Growth Index Fund | | | |
| |
| |
| |
| | Average Annual Total Returns | |
| | Periods Ended December 31, 2015 | |
| | | Since | Final Value |
| | One | Inception | of a $10,000 |
| | Year | (9/27/2011) | Investment |
| Mid-Cap Growth Index Fund Admiral Shares | -0.98% | 14.42% | $17,755 |
| Spliced Mid-Cap Growth Index | -0.93 | 14.46 | 17,776 |
| Dow Jones U.S. Total Stock Market Float | | | |
| Adjusted Index | 0.44 | 16.09 | 18,884 |
| "Since Inception" performance is calculated from the Admiral Shares’ inception date for both the fund and its comparative standards. |
| | | |
| Cumulative Returns of ETF Shares: August 17, 2006, Through December 31, 2015 | | |
| | | | Since |
| | One | Five | Inception |
| | Year | Years | (8/17/2006) |
| Mid-Cap Growth Index Fund ETF Shares Market | | | |
| Price | -1.01% | 65.77% | 105.14% |
| Mid-Cap Growth Index Fund ETF Shares Net Asset | | | |
| Value | -1.00 | 65.88 | 105.16 |
| Spliced Mid-Cap Growth Index | -0.93 | 66.19 | 105.74 |
| "Since Inception" performance is calculated from the ETF Shares’ inception date for both the fund and its comparative standards. |
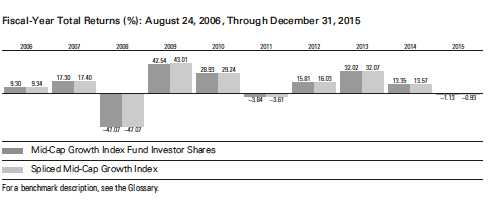
58
Mid-Cap Growth Index Fund
Financial Statements
Statement of Net Assets
As of December 31, 2015
The fund reports a complete list of its holdings in regulatory filings four times in each fiscal year, at the quarter-ends. For the second and fourth fiscal quarters, the lists appear in the fund’s semiannual and annual reports to shareholders. For the first and third fiscal quarters, the fund files the lists with the Securities and Exchange Commission on Form N-Q. Shareholders can look up the fund’s Forms N-Q on the SEC’s website at sec.gov. Forms N-Q may also be reviewed and copied at the SEC’s Public Reference Room (see the back cover of this report for further information).
| | | |
| | | | Market |
| | | | Value• |
| | | Shares | ($000) |
| Common Stocks (99.7%)1 | | |
| Basic Materials (0.9%) | | |
| | Airgas Inc. | 317,628 | 43,934 |
| * | Axalta Coating | | |
| | Systems Ltd. | 697,748 | 18,595 |
| | Westlake Chemical Corp. | 97,977 | 5,322 |
| | | | 67,851 |
| Consumer Goods (11.5%) | | |
| * | Electronic Arts Inc. | 1,445,678 | 99,347 |
| * | Under Armour Inc. | | |
| | Class A | 881,931 | 71,092 |
| * | Jarden Corp. | 1,025,168 | 58,558 |
| * | Mohawk Industries Inc. | 307,650 | 58,266 |
| | Hanesbrands Inc. | 1,918,326 | 56,456 |
| | Church & Dwight Co. Inc. | 641,977 | 54,491 |
| | Keurig Green Mountain Inc. 546,880 | 49,208 |
| | Snap-on Inc. | 284,395 | 48,754 |
| | McCormick & Co. Inc. | 540,952 | 46,284 |
| * | LKQ Corp. | 1,346,234 | 39,889 |
| * | Michael Kors | | |
| | Holdings Ltd. | 855,361 | 34,266 |
| | Harman International | | |
| | Industries Inc. | 348,221 | 32,806 |
| * | NVR Inc. | 18,202 | 29,906 |
| * | WABCO Holdings Inc. | 266,639 | 27,266 |
| | Polaris Industries Inc. | 304,966 | 26,212 |
| | Hormel Foods Corp. | 323,697 | 25,598 |
| *,^ | lululemon athletica Inc. | 479,875 | 25,179 |
| * | WhiteWave Foods Co. | | |
| | Class A | 430,719 | 16,759 |
| | Leucadia National Corp. | 797,675 | 13,872 |
| *,^ | Fitbit Inc. Class A | 289,204 | 8,558 |
| * | Monster Beverage Corp. | 742 | 110 |
| | | | 822,877 |
| Consumer Services (17.5%) | | |
| | Ross Stores Inc. | 1,997,939 | 107,509 |
| * | Dollar Tree Inc. | 1,092,079 | 84,330 |
| * | Chipotle Mexican Grill Inc. | | |
| | Class A | 152,693 | 73,270 |
| | Expedia Inc. | 570,374 | 70,898 |
| | | |
| | | | Market |
| | | | Value• |
| | | Shares | ($000) |
| *,^ | Charter Communications | | |
| | Inc. Class A | 356,611 | 65,295 |
| | Tractor Supply Co. | 657,768 | 56,239 |
| * | Ulta Salon Cosmetics | | |
| | & Fragrance Inc. | 297,433 | 55,025 |
| | Marriott International Inc. | | |
| | Class A | 818,312 | 54,860 |
| * | CarMax Inc. | 992,086 | 53,543 |
| | Advance Auto Parts Inc. | 340,725 | 51,283 |
| | Alaska Air Group Inc. | 617,545 | 49,719 |
| | Dollar General Corp. | 685,254 | 49,249 |
| | Signet Jewelers Ltd. | 389,719 | 48,204 |
| * | TripAdvisor Inc. | 546,818 | 46,616 |
| * | Norwegian Cruise Line | | |
| | Holdings Ltd. | 780,765 | 45,753 |
| | Wyndham Worldwide Corp. 568,476 | 41,300 |
| | Tiffany & Co. | 533,845 | 40,727 |
| * | IHS Inc. Class A | 333,559 | 39,503 |
| | Nordstrom Inc. | 690,635 | 34,401 |
| | FactSet Research | | |
| | Systems Inc. | 192,756 | 31,336 |
| * | Liberty Interactive Corp. | | |
| | QVC Group Class A | 1,086,760 | 29,690 |
| * | MGM Resorts | | |
| | International | 1,103,077 | 25,062 |
| | Williams-Sonoma Inc. | 399,779 | 23,351 |
| * | AutoNation Inc. | 379,144 | 22,620 |
| | Scripps Networks | | |
| | Interactive Inc. Class A | 370,054 | 20,431 |
| * | Discovery | | |
| | Communications Inc. | 637,361 | 16,074 |
| * | Discovery | | |
| | Communications Inc. | | |
| | Class A | 365,717 | 9,757 |
| * | Hyatt Hotels Corp. Class A | 136,049 | 6,397 |
| * | O’Reilly Automotive Inc. | 419 | 106 |
| | | | 1,252,548 |
| Financials (14.2%) | | |
| | Equinix Inc. | 301,482 | 91,168 |
| | Moody’s Corp. | 822,747 | 82,554 |
| | Essex Property Trust Inc. | 323,298 | 77,401 |
59
| | | |
| Mid-Cap Growth Index Fund | | |
| |
| |
| |
| | | | Market |
| | | | Value• |
| | | Shares | ($000) |
| | Macerich Co. | 775,438 | 62,570 |
| | AvalonBay | | |
| | Communities Inc. | 335,117 | 61,705 |
| | Welltower Inc. | 866,345 | 58,937 |
| | Digital Realty Trust Inc. | 716,493 | 54,181 |
| | Extra Space Storage Inc. | 574,216 | 50,652 |
| | Federal Realty | | |
| | Investment Trust | 339,897 | 49,659 |
| * | CBRE Group Inc. Class A | 1,390,690 | 48,090 |
| * | E*TRADE Financial Corp. | 1,434,396 | 42,516 |
| * | Affiliated Managers | | |
| | Group Inc. | 264,406 | 42,242 |
| | SEI Investments Co. | 724,899 | 37,985 |
| | VEREIT Inc. | 4,426,805 | 35,060 |
| | MSCI Inc. Class A | 452,115 | 32,611 |
| | Alexandria Real Estate | | |
| | Equities Inc. | 354,688 | 32,050 |
| | Realty Income Corp. | 610,556 | 31,523 |
| | Lazard Ltd. Class A | 634,933 | 28,578 |
| * | Realogy Holdings Corp. | 717,102 | 26,296 |
| | Brixmor Property Group Inc. 949,589 | 24,518 |
| | Raymond James | | |
| | Financial Inc. | 314,975 | 18,259 |
| | Camden Property Trust | 212,404 | 16,304 |
| * | LendingClub Corp. | 1,385,484 | 15,310 |
| | | | 1,020,169 |
| Health Care (12.0%) | | |
| * | Incyte Corp. | 819,599 | 88,886 |
| * | Edwards | | |
| | Lifesciences Corp. | 1,056,173 | 83,417 |
| * | BioMarin | | |
| | Pharmaceutical Inc. | 789,473 | 82,705 |
| | CR Bard Inc. | 361,792 | 68,538 |
| * | Alkermes plc | 734,716 | 58,322 |
| * | DaVita HealthCare | | |
| | Partners Inc. | 826,456 | 57,612 |
| * | Waters Corp. | 379,893 | 51,126 |
| | DENTSPLY | | |
| | International Inc. | 684,896 | 41,676 |
| * | Jazz Pharmaceuticals plc | 286,138 | 40,220 |
| * | Medivation Inc. | 801,743 | 38,756 |
| * | Varian Medical | | |
| | Systems Inc. | 474,633 | 38,350 |
| | ResMed Inc. | 683,201 | 36,681 |
| * | Alnylam | | |
| | Pharmaceuticals Inc. | 352,405 | 33,175 |
| * | IDEXX Laboratories Inc. | 445,008 | 32,450 |
| | Cooper Cos. Inc. | 237,841 | 31,918 |
| * | Quintiles Transnational | | |
| | Holdings Inc. | 391,567 | 26,885 |
| * | Envision Healthcare | | |
| | Holdings Inc. | 914,902 | 23,760 |
| * | Centene Corp. | 276,813 | 18,217 |
| *,^ | Intercept | | |
| | Pharmaceuticals Inc. | 39,064 | 5,834 |
| | | | 858,528 |
| | | |
| | | | Market |
| | | | Value• |
| | | Shares | ($000) |
| Industrials (22.3%) | | |
| * | Fiserv Inc. | 1,118,978 | 102,342 |
| | Roper Technologies Inc. | 493,595 | 93,679 |
| | Amphenol Corp. Class A | 1,509,284 | 78,830 |
| * | Alliance Data Systems | | |
| | Corp. | 284,364 | 78,647 |
| | AMETEK Inc. | 1,164,987 | 62,432 |
| | Vulcan Materials Co. | 652,944 | 62,010 |
| * | FleetCor Technologies Inc. | 428,826 | 61,292 |
| * | Verisk Analytics Inc. | | |
| | Class A | 746,635 | 57,401 |
| * | TransDigm Group Inc. | 249,714 | 57,047 |
| | WW Grainger Inc. | 276,757 | 56,068 |
| | Fastenal Co. | 1,346,704 | 54,972 |
| * | Stericycle Inc. | 416,089 | 50,180 |
| | Acuity Brands Inc. | 213,639 | 49,949 |
| | Masco Corp. | 1,647,402 | 46,621 |
| * | Mettler-Toledo | | |
| | International Inc. | 133,937 | 45,422 |
| | Martin Marietta | | |
| | Materials Inc. | 323,835 | 44,229 |
| | Pentair plc | 882,550 | 43,713 |
| | CH Robinson | | |
| | Worldwide Inc. | 703,236 | 43,615 |
| | Fortune Brands Home | | |
| | & Security Inc. | 781,936 | 43,397 |
| | Expeditors International | | |
| | of Washington Inc. | 912,758 | 41,165 |
| | Total System Services Inc. | 810,729 | 40,374 |
| | Kansas City Southern | 533,899 | 39,866 |
| * | Sensata Technologies | | |
| | Holding NV | 833,232 | 38,379 |
| * | Vantiv Inc. Class A | 765,159 | 36,284 |
| * | United Rentals Inc. | 454,101 | 32,941 |
| | JB Hunt Transport | | |
| | Services Inc. | 448,495 | 32,902 |
| | Wabtec Corp. | 448,395 | 31,890 |
| | Robert Half | | |
| | International Inc. | 616,770 | 29,075 |
| * | Trimble Navigation Ltd. | 1,225,672 | 26,291 |
| | Macquarie | | |
| | Infrastructure Corp. | 351,814 | 25,542 |
| | B/E Aerospace Inc. | 511,027 | 21,652 |
| | Global Payments Inc. | 318,030 | 20,516 |
| | Chicago Bridge | | |
| | & Iron Co. NV | 461,399 | 17,990 |
| * | First Data Corp. Class A | 879,377 | 14,088 |
| | Donaldson Co. Inc. | 325,111 | 9,318 |
| * | Quanta Services Inc. | 187,372 | 3,794 |
| | | | 1,593,913 |
| Oil & Gas (3.6%) | | |
| * | Concho Resources Inc. | 632,308 | 58,716 |
| | EQT Corp. | 746,991 | 38,941 |
| * | Cheniere Energy Inc. | 981,495 | 36,561 |
| | Cabot Oil & Gas Corp. | 2,024,637 | 35,816 |
| *,^ | Antero Resources Corp. | 1,287,680 | 28,071 |
60
| | | | |
| Mid-Cap Growth Index Fund | | |
| |
| |
| |
| | | | | Market |
| | | | | Value• |
| | | | Shares | ($000) |
| | Core Laboratories NV | 207,479 | 22,561 |
| | Cimarex Energy Co. | | 231,515 | 20,693 |
| | Range Resources Corp. | 786,640 | 19,359 |
| | | | | 260,718 |
| Technology (15.2%) | | | |
| * | Cerner Corp. | | 1,507,466 | 90,704 |
| * | Red Hat Inc. | | 895,135 | 74,126 |
| | Skyworks Solutions Inc. | 935,949 | 71,909 |
| * | Palo Alto Networks Inc. | 399,623 | 70,390 |
| * | Autodesk Inc. | | 1,107,656 | 67,490 |
| * | ServiceNow Inc. | | 739,620 | 64,022 |
| | Lam Research Corp. | | 775,488 | 61,589 |
| * | Citrix Systems Inc. | | 715,496 | 54,127 |
| | Linear Technology Corp. | 1,170,863 | 49,727 |
| | Microchip Technology Inc. | 944,773 | 43,970 |
| * | Akamai Technologies Inc. | 827,671 | 43,560 |
| * | Workday Inc. Class A | 543,706 | 43,323 |
| * | VeriSign Inc. | | 463,688 | 40,508 |
| * | ANSYS Inc. | | 435,397 | 40,274 |
| * | Splunk Inc. | | 628,486 | 36,961 |
| * | Qorvo Inc. | | 691,476 | 35,196 |
| * | Gartner Inc. | | 385,056 | 34,925 |
| * | F5 Networks Inc. | | 347,447 | 33,688 |
| | Xilinx Inc. | | 628,639 | 29,527 |
| | KLA-Tencor Corp. | | 381,667 | 26,469 |
| | CDK Global Inc. | | 389,791 | 18,503 |
| * | NetSuite Inc. | | 194,398 | 16,450 |
| * | Tableau Software Inc. | | |
| | Class A | | 128,455 | 12,103 |
| | CSRA Inc. | | 333,582 | 10,007 |
| * | Premier Inc. Class A | | 213,237 | 7,521 |
| * | FireEye Inc. | | 354,634 | 7,355 |
| * | Rackspace Hosting Inc. | 281,006 | 7,115 |
| | | | | 1,091,539 |
| Telecommunications (2.1%) | | |
| * | Level 3 | | | |
| | Communications Inc. | 1,395,440 | 75,856 |
| * | SBA Communications | | |
| | Corp. Class A | | 617,728 | 64,905 |
| * | Zayo Group Holdings Inc. | 241,594 | 6,424 |
| | | | | 147,185 |
| Utilities (0.4%) | | | |
| * | Calpine Corp. | | 1,747,988 | 25,293 |
| Total Common Stocks | | | |
| (Cost $6,526,203) | | | 7,140,621 |
| Temporary Cash Investments (1.3%)1 | |
| Money Market Fund (1.3%) | | |
| 2,3 | Vanguard Market Liquidity | | |
| | Fund, 0.363% | 92,642,900 | 92,643 |
| | | | |
| | | Face | | Market |
| | | Amount | | Value• |
| | | ($000) | | ($000) |
| U.S. Government and Agency Obligations (0.0%) |
| 4,5 | Federal Home | | | |
| | Loan Bank Discount | | | |
| | Notes, 0.371%, 5/4/16 | 1,000 | | 998 |
| 4 | United States | | | |
| | Treasury Bill, | | | |
| | 0.536%, 6/9/16 | 1,000 | | 998 |
| | | | | 1,996 |
| Total Temporary Cash Investments | | |
| (Cost $94,639) | | | 94,639 |
| Total Investments (101.0%) | | | |
| (Cost $6,620,842) | | 7,235,260 |
| |
| | | | | Amount |
| | | | | ($000) |
| Other Assets and Liabilities (-1.0%) | | |
| Other Assets | | | |
| Investment in Vanguard | | | 630 |
| Receivables for Investment Securities Sold | 271 |
| Receivables for Accrued Income | | | 6,043 |
| Receivables for Capital Shares Issued | | 9,635 |
| Other Assets | | | 67 |
| Total Other Assets | | | 16,646 |
| Liabilities | | | |
| Payables for Investment | | | |
| Securities Purchased | | | (6,534) |
| Collateral for Securities on Loan | | | (60,430) |
| Payables for Capital Shares Redeemed | | (18,182) |
| Payables to Vanguard | | | (3,021) |
| Other Liabilities | | | (906) |
| Total Liabilities | | | (89,073) |
| Net Assets (100%) | | 7,162,833 |
61
Mid-Cap Growth Index Fund
At December 31, 2015, net assets consisted of:
Amount
($000)
| |
| Paid-in Capital | 6,910,608 |
| Overdistributed Net Investment Income | (2,276) |
| Accumulated Net Realized Losses | (359,952) |
| Unrealized Appreciation (Depreciation) | |
| Investment Securities | 614,418 |
| Futures Contracts | 35 |
| Net Assets | 7,162,833 |
| |
| |
| Investor Shares—Net Assets | |
| Applicable to 13,816,184 outstanding | |
| $.001 par value shares of beneficial | |
| interest (unlimited authorization) | 541,917 |
| Net Asset Value Per Share— | |
| Investor Shares | $39.22 |
| |
| |
| ETF Shares—Net Assets | |
| Applicable to 33,101,858 outstanding | |
| $.001 par value shares of beneficial | |
| interest (unlimited authorization) | 3,301,849 |
| Net Asset Value Per Share— | |
| ETF Shares | $99.75 |
| |
| |
| Admiral Shares—Net Assets | |
| Applicable to 77,299,899 outstanding | |
| $.001 par value shares of beneficial | |
| interest (unlimited authorization) | 3,319,067 |
| Net Asset Value Per Share— | |
| Admiral Shares | $42.94 |
• See Note A in Notes to Financial Statements.
* Non-income-producing security.
^ Includes partial security positions on loan to broker-dealers. The total value of securities on loan is $58,875,000.
1 The fund invests a portion of its cash reserves in equity markets through the use of index futures contracts. After giving effect to futures investments, the fund’s effective common stock and temporary cash investment positions represent 100.0% and 1.0%, respectively, of net assets.
2 Affiliated money market fund available only to Vanguard funds and certain trusts and accounts managed by Vanguard. Rate shown is the 7-day yield.
3 Includes $60,430,000 of collateral received for securities on loan.
4 Securities with a value of $1,397,000 have been segregated as initial margin for open futures contracts.
5 The issuer operates under a congressional charter; its securities are generally neither guaranteed by the U.S. Treasury nor backed by the full faith and credit of the U.S. government.
See accompanying Notes, which are an integral part of the Financial Statements.
62
| |
| Mid-Cap Growth Index Fund | |
| |
| |
| Statement of Operations | |
| |
| | Year Ended |
| | December 31, 2015 |
| | ($000) |
| Investment Income | |
| Income | |
| Dividends | 61,241 |
| Interest1 | 51 |
| Securities Lending | 930 |
| Total Income | 62,222 |
| Expenses | |
| The Vanguard Group—Note B | |
| Investment Advisory Services | 1,107 |
| Management and Administrative—Investor Shares | 887 |
| Management and Administrative—ETF Shares | 1,588 |
| Management and Administrative—Admiral Shares | 1,355 |
| Marketing and Distribution—Investor Shares | 154 |
| Marketing and Distribution—ETF Shares | 316 |
| Marketing and Distribution—Admiral Shares | 385 |
| Custodian Fees | 89 |
| Auditing Fees | 36 |
| Shareholders’ Reports—Investor Shares | 31 |
| Shareholders’ Reports—ETF Shares | 158 |
| Shareholders’ Reports—Admiral Shares | 44 |
| Trustees’ Fees and Expenses | 5 |
| Total Expenses | 6,155 |
| Net Investment Income | 56,067 |
| Realized Net Gain (Loss) | |
| Investment Securities Sold | 269,967 |
| Futures Contracts | (652) |
| Realized Net Gain (Loss) | 269,315 |
| Change in Unrealized Appreciation (Depreciation) | |
| Investment Securities | (475,123) |
| Futures Contracts | (344) |
| Change in Unrealized Appreciation (Depreciation) | (475,467) |
| Net Increase (Decrease) in Net Assets Resulting from Operations | (150,085) |
| 1 Interest income from an affiliated company of the fund was $47,000. | |
See accompanying Notes, which are an integral part of the Financial Statements.
63
| | |
| Mid-Cap Growth Index Fund | | |
| |
| |
| Statement of Changes in Net Assets | | |
| |
| | Year Ended December 31, |
| | 2015 | 2014 |
| | ($000) | ($000) |
| Increase (Decrease) in Net Assets | | |
| Operations | | |
| Net Investment Income | 56,067 | 42,700 |
| Realized Net Gain (Loss) | 269,315 | 157,046 |
| Change in Unrealized Appreciation (Depreciation) | (475,467) | 418,266 |
| Net Increase (Decrease) in Net Assets Resulting from Operations | (150,085) | 618,012 |
| Distributions | | |
| Net Investment Income | | |
| Investor Shares | (3,858) | (3,540) |
| ETF Shares | (27,055) | (21,317) |
| Admiral Shares | (25,969) | (17,637) |
| Realized Capital Gain | | |
| Investor Shares | — | — |
| ETF Shares | — | — |
| Admiral Shares | — | — |
| Total Distributions | (56,882) | (42,494) |
| Capital Share Transactions | | |
| Investor Shares | (8,440) | (100,159) |
| ETF Shares | 683,080 | 544,372 |
| Admiral Shares | 1,153,268 | 465,380 |
| Net Increase (Decrease) from Capital Share Transactions | 1,827,908 | 909,593 |
| Total Increase (Decrease) | 1,620,941 | 1,485,111 |
| Net Assets | | |
| Beginning of Period | 5,541,892 | 4,056,781 |
| End of Period1 | 7,162,833 | 5,541,892 |
1 Net Assets—End of Period includes undistributed (overdistributed) net investment income of ($2,276,000) and ($1,461,000).
See accompanying Notes, which are an integral part of the Financial Statements.
64
| | | | | |
| Mid-Cap Growth Index Fund | | | | | |
| |
| |
| Financial Highlights | | | | | |
| |
| |
| Investor Shares | | | | | |
| |
| For a Share Outstanding | | | Year Ended December 31, |
| Throughout Each Period | 2015 | 2014 | 2013 | 2012 | 2011 |
| Net Asset Value, Beginning of Period | $39.94 | $35.46 | $26.99 | $23.43 | $24.46 |
| Investment Operations | | | | | |
| Net Investment Income | . 268 | .258 | .169 | .146 | .087 |
| Net Realized and Unrealized Gain (Loss) | | | | | |
| on Investments | (.719) | 4.476 | 8.470 | 3.559 | (1.027) |
| Total from Investment Operations | (.451) | 4.734 | 8.639 | 3.705 | (.940) |
| Distributions | | | | | |
| Dividends from Net Investment Income | (.269) | (.254) | (.169) | (.145) | (.090) |
| Distributions from Realized Capital Gains | — | — | — | — | — |
| Total Distributions | (.269) | (.254) | (.169) | (.145) | (.090) |
| Net Asset Value, End of Period | $39.22 | $39.94 | $35.46 | $26.99 | $23.43 |
| |
| Total Return1 | -1.13% | 13.35% | 32.02% | 15.81% | -3.84% |
| |
| Ratios/Supplemental Data | | | | | |
| Net Assets, End of Period (Millions) | $542 | $562 | $595 | $483 | $503 |
| Ratio of Total Expenses to | | | | | |
| Average Net Assets | 0.20% | 0.23% | 0.24% | 0.24% | 0.24% |
| Ratio of Net Investment Income to | | | | | |
| Average Net Assets | 0.70% | 0.79% | 0.57% | 0.58% | 0.35% |
| Portfolio Turnover Rate2 | 23% | 17% | 64% | 38% | 41% |
1 Total returns do not include account service fees that may have applied in the periods shown. Fund prospectuses provide information about any applicable account service fees.
2 Excludes the value of portfolio securities received or delivered as a result of in-kind purchases or redemptions of the fund’s capital shares, including ETF Creation Units.
See accompanying Notes, which are an integral part of the Financial Statements.
65
| | | | | |
| Mid-Cap Growth Index Fund | | | | | |
| |
| |
| Financial Highlights | | | | | |
| |
| |
| ETF Shares | | | | | |
| |
| For a Share Outstanding | | | Year Ended December 31, |
| Throughout Each Period | 2015 | 2014 | 2013 | 2012 | 2011 |
| Net Asset Value, Beginning of Period | $101.57 | $90.20 | $68.64 | $59.61 | $62.23 |
| Investment Operations | | | | | |
| Net Investment Income | . 805 | .816 | .556 | .474 | .316 |
| Net Realized and Unrealized Gain (Loss) | | | | | |
| on Investments | (1.815) | 11.359 | 21.558 | 9.029 | (2.617) |
| Total from Investment Operations | (1.010) | 12.175 | 22.114 | 9.503 | (2.301) |
| Distributions | | | | | |
| Dividends from Net Investment Income | (.810) | (.805) | (.554) | (.473) | (. 319) |
| Distributions from Realized Capital Gains | — | — | — | — | — |
| Total Distributions | (.810) | (.805) | (.554) | (.473) | (. 319) |
| Net Asset Value, End of Period | $99.75 | $101.57 | $90.20 | $68.64 | $59.61 |
| |
| Total Return | -1.00% | 13.49% | 32.23% | 15.94% | -3.70% |
| |
| Ratios/Supplemental Data | | | | | |
| Net Assets, End of Period (Millions) | $3,302 | $2,716 | $1,896 | $1,200 | $1,095 |
| Ratio of Total Expenses to | | | | | |
| Average Net Assets | 0.08% | 0.09% | 0.09% | 0.10% | 0.10% |
| Ratio of Net Investment Income to | | | | | |
| Average Net Assets | 0.82% | 0.93% | 0.72% | 0.72% | 0.49% |
| Portfolio Turnover Rate1 | 23% | 17% | 64% | 38% | 41% |
1 Excludes the value of portfolio securities received or delivered as a result of in-kind purchases or redemptions of the fund’s capital shares, including ETF Creation Units.
See accompanying Notes, which are an integral part of the Financial Statements.
66
| | | | | |
| Mid-Cap Growth Index Fund | | | | | |
| |
| |
| Financial Highlights | | | | | |
| |
| |
| Admiral Shares | | | | | |
| | | | | | Sept. 27, |
| | | | | | 20111 to |
| | | Year Ended December 31, | |
| For a Share Outstanding | | | | | Dec. 31, |
| Throughout Each Period | 2015 | 2014 | 2013 | 2012 | 2011 |
| Net Asset Value, Beginning of Period | $43.72 | $38.83 | $29.55 | $25.66 | $25.00 |
| Investment Operations | | | | | |
| Net Investment Income | . 349 | .350 | .239 | .205 | .027 |
| Net Realized and Unrealized Gain (Loss) | | | | | |
| on Investments | (.777) | 4.886 | 9.279 | 3.889 | 0.736 |
| Total from Investment Operations | (.428) | 5.236 | 9.518 | 4.094 | 0.763 |
| Distributions | | | | | |
| Dividends from Net Investment Income | (.352) | (.346) | (. 238) | (.204) | (.103) |
| Distributions from Realized Capital Gains | — | — | — | — | — |
| Total Distributions | (.352) | (.346) | (. 238) | (.204) | (.103) |
| Net Asset Value, End of Period | $42.94 | $43.72 | $38.83 | $29.55 | $25.66 |
| |
| Total Return2 | -0.98% | 13.48% | 32.22% | 15.96% | 3.05% |
| |
| Ratios/Supplemental Data | | | | | |
| Net Assets, End of Period (Millions) | $3,319 | $2,264 | $1,566 | $913 | $525 |
| Ratio of Total Expenses to | | | | | |
| Average Net Assets | 0.08% | 0.09% | 0.09% | 0.10% | 0.10%3 |
| Ratio of Net Investment Income to | | | | | |
| Average Net Assets | 0.82% | 0.93% | 0.72% | 0.72% | 0.49%3 |
| Portfolio Turnover Rate 4 | 23% | 17% | 64% | 38% | 41% |
1 Inception.
2 Total returns do not include account service fees that may have applied in the periods shown. Fund prospectuses provide information about any applicable account service fees.
3 Annualized.
4 Excludes the value of portfolio securities received or delivered as a result of in-kind purchases or redemptions of the fund’s capital shares, including ETF Creation Units.
See accompanying Notes, which are an integral part of the Financial Statements.
67
Mid-Cap Growth Index Fund
Notes to Financial Statements
Vanguard Mid-Cap Growth Index Fund is registered under the Investment Company Act of 1940 as an open-end investment company, or mutual fund. The fund offers three classes of shares: Investor Shares, ETF Shares, and Admiral Shares. Investor Shares are available to any investor who meets the fund’s minimum purchase requirements. ETF Shares are listed for trading on NYSE Arca; they can be purchased and sold through a broker. Admiral Shares are designed for investors who meet certain administrative, service, and account-size criteria.
A. The following significant accounting policies conform to generally accepted accounting principles for U.S. investment companies. The fund consistently follows such policies in preparing its financial statements.
1. Security Valuation: Securities are valued as of the close of trading on the New York Stock Exchange (generally 4 p.m., Eastern time) on the valuation date. Equity securities are valued at the latest quoted sales prices or official closing prices taken from the primary market in which each security trades; such securities not traded on the valuation date are valued at the mean of the latest quoted bid and asked prices. Securities for which market quotations are not readily available, or whose values have been materially affected by events occurring before the fund’s pricing time but after the close of the securities’ primary markets, are valued by methods deemed by the board of trustees to represent fair value. Investments in Vanguard Market Liquidity Fund are valued at that fund’s net asset value. Temporary cash investments acquired over 60 days to maturity are valued using the latest bid prices or using valuations based on a matrix system (which considers such factors as security prices, yields, maturities, and ratings), both as furnished by independent pricing services. Other temporary cash investments are valued at amortized cost, which approximates market value.
2. Futures Contracts: The fund uses index futures contracts to a limited extent, with the objectives of maintaining full exposure to the stock market, enhancing returns, maintaining liquidity, and minimizing transaction costs. The fund may purchase futures contracts to immediately invest incoming cash in the market, or sell futures in response to cash outflows, thereby simulating a fully invested position in the underlying index while maintaining a cash balance for liquidity. The fund may seek to enhance returns by using futures contracts instead of the underlying securities when futures are believed to be priced more attractively than the underlying securities. The primary risks associated with the use of futures contracts are imperfect correlation between changes in market values of stocks held by the fund and the prices of futures contracts, and the possibility of an illiquid market. Counterparty risk involving futures is mitigated because a regulated clearinghouse is the counterparty instead of the clearing broker. To further mitigate counterparty risk, the fund trades futures contracts on an exchange, monitors the financial strength of its clearing brokers and clearinghouse, and has entered into clearing agreements with its clearing brokers. The clearinghouse imposes initial margin requirements to secure the fund’s performance and requires daily settlement of variation margin representing changes in the market value of each contract.
Futures contracts are valued at their quoted daily settlement prices. The aggregate settlement values of the contracts are not recorded in the Statement of Net Assets. Fluctuations in the value of the contracts are recorded in the Statement of Net Assets as an asset (liability) and in the Statement of Operations as unrealized appreciation (depreciation) until the contracts are closed, when they are recorded as realized futures gains (losses).
68
Mid-Cap Growth Index Fund
During the year ended December 31, 2015, the fund’s average investments in long and short futures contracts represented less than 1% and 0% of net assets, respectively, based on the average of aggregate settlement values at each quarter-end during the period.
3. Federal Income Taxes: The fund intends to continue to qualify as a regulated investment company and distribute all of its taxable income. Management has analyzed the fund’s tax positions taken for all open federal income tax years (December 31, 2012–2015), and has concluded that no provision for federal income tax is required in the fund’s financial statements.
4. Distributions: Distributions to shareholders are recorded on the ex-dividend date.
5. Securities Lending: To earn additional income, the fund lends its securities to qualified institutional borrowers. Security loans are subject to termination by the fund at any time and are required to be secured at all times by collateral in an amount at least equal to the market value of securities loaned. Daily market fluctuations could cause the value of loaned securities to be more or less than the value of the collateral received. When this occurs, the collateral is adjusted and settled on the next business day. The fund further mitigates its counterparty risk by entering into securities lending transactions only with a diverse group of prequalified counterparties, monitoring their financial strength, and entering into master securities lending agreements with its counterparties. The master securities lending agreements provide that, in the event of a counterparty’s default (including bankruptcy), the fund may terminate any loans with that borrower, determine the net amount owed, and sell or retain the collateral up to the net amount owed to the fund; however, such actions may be subject to legal proceedings. While collateral mitigates counterparty risk, in the absence of a default the fund may experience delays and costs in recovering the securities loaned. The fund invests cash collateral received in Vanguard Market Liquidity Fund, and records a liability in the Statement of Net Assets for the return of the collateral, during the period the securities are on loan. Securities lending income represents fees charged to borrowers plus income earned on invested cash collateral, less expenses associated with the loan.
6. Credit Facility: The fund and certain other funds managed by The Vanguard Group (“Vanguard”) participate in a $3 billion committed credit facility provided by a syndicate of lenders pursuant to a credit agreement that may be renewed annually; each fund is individually liable for its borrowings, if any, under the credit facility. Borrowings may be utilized for temporary and emergency purposes, and are subject to the fund’s regulatory and contractual borrowing restrictions. The participating funds are charged administrative fees and an annual commitment fee of 0.06% of the undrawn amount of the facility; these fees are allocated to the funds based on a method approved by the fund’s board of trustees and included in Management and Administrative expenses on the fund’s Statement of Operations. Any borrowings under this facility bear interest at a rate equal to the higher of the federal funds rate or LIBOR reference rate plus an agreed-upon spread.
The fund had no borrowings outstanding at December 31, 2015, or at any time during the period then ended.
7. Other: Dividend income is recorded on the ex-dividend date. Interest income includes income distributions received from Vanguard Market Liquidity Fund and is accrued daily. Premiums and discounts on debt securities purchased are amortized and accreted, respectively, to interest income over the lives of the respective securities. Security transactions are accounted for on the date securities are bought or sold. Costs used to determine realized gains (losses) on the sale of investment securities are those of the specific securities sold.
69
Mid-Cap Growth Index Fund
Each class of shares has equal rights as to assets and earnings, except that each class separately bears certain class-specific expenses related to maintenance of shareholder accounts (included in Management and Administrative expenses) and shareholder reporting. Marketing and distribution expenses are allocated to each class of shares based on a method approved by the board of trustees. Income, other non-class-specific expenses, and gains and losses on investments are allocated to each class of shares based on its relative net assets.
B. In accordance with the terms of a Funds’ Service Agreement (the “FSA”) between Vanguard and the fund, Vanguard furnishes to the fund investment advisory, corporate management, administrative, marketing, and distribution services at Vanguard’s cost of operations (as defined by the FSA). These costs of operations are allocated to the fund based on methods and guidelines approved by the board of trustees. Vanguard does not require reimbursement in the current period for certain costs of operations (such as deferred compensation/benefits and risk/insurance costs); the fund’s liability for these costs of operations is included in Payables to Vanguard on the Statement of Net Assets.
Upon the request of Vanguard, the fund may invest up to 0.40% of its net assets as capital in Vanguard. At December 31, 2015, the fund had contributed to Vanguard capital in the amount of $630,000, representing 0.01% of the fund’s net assets and 0.25% of Vanguard’s capitalization. The fund’s trustees and officers are also directors and employees, respectively, of Vanguard.
C. Various inputs may be used to determine the value of the fund’s investments. These inputs are summarized in three broad levels for financial statement purposes. The inputs or methodologies used to value securities are not necessarily an indication of the risk associated with investing in those securities.
Level 1—Quoted prices in active markets for identical securities.
Level 2—Other significant observable inputs (including quoted prices for similar securities, interest rates, prepayment speeds, credit risk, etc.).
Level 3—Significant unobservable inputs (including the fund’s own assumptions used to determine the fair value of investments).
The following table summarizes the market value of the fund’s investments as of December 31, 2015, based on the inputs used to value them:
| | | |
| | Level 1 | Level 2 | Level 3 |
| Investments | ($000) | ($000) | ($000) |
| Common Stocks | 7,140,621 | — | — |
| Temporary Cash Investments | 92,643 | 1,996 | — |
| Futures Contracts—Assets1 | 67 | — | — |
| Futures Contracts—Liabilities1 | (342) | — | — |
| Total | 7,232,989 | 1,996 | — |
| 1 Represents variation margin on the last day of the reporting period. | | | |
70
Mid-Cap Growth Index Fund
D. At December 31, 2015, the aggregate settlement value of open futures contracts and the related unrealized appreciation (depreciation) were:
| | | | |
| | | | | ($000) |
| | | | Aggregate | |
| | | Number of | Settlement | Unrealized |
| | | Long (Short) | Value | Appreciation |
| Futures Contracts | Expiration | Contracts | Long (Short) | (Depreciation) |
| E-mini S&P 500 Index | March 2016 | 130 | 13,230 | (66) |
| E-mini S&P MidCap 400 Index | March 2016 | 60 | 8,361 | 101 |
| | | | | 35 |
Unrealized appreciation (depreciation) on open futures contracts is required to be treated as realized gain (loss) for tax purposes.
E. Distributions are determined on a tax basis and may differ from net investment income and realized capital gains for financial reporting purposes. Differences may be permanent or temporary. Permanent differences are reclassified among capital accounts in the financial statements to reflect their tax character. Temporary differences arise when certain items of income, expense, gain, or loss are recognized in different periods for financial statement and tax purposes. These differences will reverse at some time in the future. Differences in classification may also result from the treatment of short-term gains as ordinary income for tax purposes.
During the year ended December 31, 2015, the fund realized $469,416,000 of net capital gains resulting from in-kind redemptions—in which shareholders exchanged fund shares for securities held by the fund rather than for cash. Because such gains are not taxable to the fund, and are not distributed to shareholders, they have been reclassified from accumulated net realized losses to paid-in capital.
For tax purposes, at December 31, 2015, the fund had $356,000 of ordinary income available for distribution. At December 31, 2015, the fund had available capital losses totaling $359,917,000 to offset future net capital gains. Of this amount, $73,214,000 is subject to expiration on December 31, 2018. Capital losses of $286,703,000 realized beginning in fiscal 2011 may be carried forward indefinitely under the Regulated Investment Company Modernization Act of 2010, but must be used before any expiring loss carryforwards.
At December 31, 2015, the cost of investment securities for tax purposes was $6,620,842,000. Net unrealized appreciation of investment securities for tax purposes was $614,418,000, consisting of unrealized gains of $999,148,000 on securities that had risen in value since their purchase and $384,730,000 in unrealized losses on securities that had fallen in value since their purchase.
F. During the year ended December 31, 2015, the fund purchased $4,697,294,000 of investment securities and sold $2,892,266,000 of investment securities, other than temporary cash investments. Purchases and sales include $1,990,050,000 and $1,360,982,000, respectively, in connection with in-kind purchases and redemptions of the fund’s capital shares.
71
Mid-Cap Growth Index Fund
| | | | |
| G. Capital share transactions for each class of shares were: | | | |
| | | | Year Ended December 31, |
| | | 2015 | | 2014 |
| | Amount | Shares | Amount | Shares |
| | ($000) | (000) | ($000) | (000) |
| Investor Shares | | | | |
| Issued | 238,852 | 5,803 | 189,831 | 5,112 |
| Issued in Lieu of Cash Distributions | 3,761 | 96 | 3,457 | 86 |
| Redeemed | (251,053) | (6,150) | (293,447) | (7,905) |
| Net Increase (Decrease)—Investor Shares | (8,440) | (251) | (100,159) | (2,707) |
| ETF Shares | | | | |
| Issued | 2,076,252 | 19,811 | 1,081,871 | 11,223 |
| Issued in Lieu of Cash Distributions | — | — | — | — |
| Redeemed | (1,393,172) | (13,450) | (537,499) | (5,500) |
| Net Increase (Decrease)—ETF Shares | 683,080 | 6,361 | 544,372 | 5,723 |
| Admiral Shares | | | | |
| Issued | 1,742,625 | 38,699 | 901,483 | 22,083 |
| Issued in Lieu of Cash Distributions | 23,858 | 555 | 16,329 | 373 |
| Redeemed | (613,215) | (13,738) | (452,432) | (11,004) |
| Net Increase (Decrease) —Admiral Shares | 1,153,268 | 25,516 | 465,380 | 11,452 |
H. Management has determined that no material events or transactions occurred subsequent to December 31, 2015, that would require recognition or disclosure in these financial statements.
72
Mid-Cap Value Index Fund
Fund Profile
As of December 31, 2015
Share-Class Characteristics
| | | |
| | Investor | ETF | Admiral |
| | Shares | Shares | Shares |
| Ticker Symbol | VMVIX | VOE | VMVAX |
| Expense Ratio1 | 0.23% | 0.09% | 0.09% |
| 30-Day SEC Yield | 1.94% | 2.05% | 2.05% |
| |
| Portfolio Characteristics | | |
| | | CRSP US | DJ |
| | | Mid Cap | U.S. Total |
| | | Value | Market |
| | Fund | Index | FA Index |
| Number of Stocks | 210 | 208 | 3,960 |
| Median Market Cap | $10.0B | $10.0B | $51.4B |
| Price/Earnings Ratio | 22.0x | 21.6x | 21.9x |
| Price/Book Ratio | 1.8x | 1.9x | 2.7x |
| Return on Equity | 13.5% | 13.2% | 17.2% |
| Earnings Growth Rate | 7.1% | 7.1% | 9.5% |
| Dividend Yield | 2.2% | 2.2% | 2.1% |
| Foreign Holdings | 0.0% | 0.0% | 0.0% |
| Turnover Rate | 20% | — | — |
| Short-Term Reserves | 0.0% | — | — |
Sector Diversification (% of equity exposure)
| | | |
| | | CRSP US | DJ |
| | | Mid Cap | U.S. Total |
| | | Value | Market |
| | Fund | Index | FA Index |
| Basic Materials | 6.9% | 6.9% | 2.3% |
| Consumer Goods | 17.1 | 17.1 | 10.3 |
| Consumer Services | 10.5 | 10.5 | 14.2 |
| Financials | 24.5 | 24.5 | 19.5 |
| Health Care | 5.9 | 5.9 | 14.0 |
| Industrials | 11.8 | 11.8 | 12.2 |
| Oil & Gas | 6.0 | 6.0 | 5.9 |
| Technology | 8.1 | 8.1 | 16.4 |
| Telecommunications | 0.3 | 0.3 | 2.2 |
| Utilities | 8.9 | 8.9 | 3.0 |
| | |
| Volatility Measures | | |
| | | DJ |
| | Spliced | U.S. Total |
| | Mid-Cap | Market |
| | Value Index | FA Index |
| R-Squared | 1.00 | 0.95 |
| Beta | 1.00 | 0.99 |
| These measures show the degree and timing of the fund’s | |
| fluctuations compared with the indexes over 36 months. | |
| |
| Ten Largest Holdings (% of total net assets) |
| ConAgra Foods Inc. | Food Products | 1.1% |
| Royal Caribbean Cruises | | |
| Ltd. | Recreational Services | 1.1 |
| Hartford Financial | | |
| Services Group Inc. | Full Line Insurance | 1.1 |
| Dr Pepper Snapple | | |
| Group Inc. | Soft Drinks | 1.1 |
| M&T Bank Corp. | Banks | 1.1 |
| Fidelity National | Financial | |
| Information Services Inc. Administration | 1.1 |
| NVIDIA Corp. | Semiconductors | 1.0 |
| Clorox Co. | Nondurable | |
| | Household Products | 1.0 |
| Eversource Energy | Conventional | |
| | Electricity | 1.0 |
| WEC Energy Group Inc. | Multiutilities | 1.0 |
| Top Ten | | 10.6% |
| The holdings listed exclude any temporary cash investments and |
| equity index products. | | |
1 The expense ratios shown are from the prospectus dated April 28, 2015, and represent estimated costs for the current fiscal year. For the fiscal year ended December 31, 2015, the expense ratios were 0.20% for Investor Shares, 0.08% for ETF Shares, and 0.08% for Admiral Shares.
73
Mid-Cap Value Index Fund
Performance Summary
All of the returns in this report represent past performance, which is not a guarantee of future results that may be achieved by the fund. (Current performance may be lower or higher than the performance data cited. For performance data current to the most recent month-end, visit our website at vanguard.com/performance.) Note, too, that both investment returns and principal value can fluctuate widely, so an investor’s shares, when sold, could be worth more or less than their original cost. The returns shown do not reflect taxes that a shareholder would pay on fund distributions or on the sale of fund shares.
Cumulative Performance: August 24, 2006, Through December 31, 2015
Initial Investment of $10,000
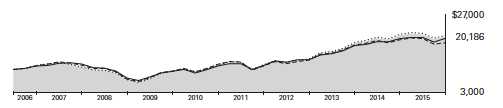
| | | | | |
| | | | Average Annual Total Returns | |
| | | Periods Ended December 31, 2015 | |
| | | | | Since | Final Value |
| | | One | Five | Inception | of a $10,000 |
| | | Year | Years | (8/24/2006) | Investment |
| | Mid-Cap Value Index Fund*Investor | | | | |
| | Shares | -1.91% | 12.11% | 7.80% | $20,186 |
| •••••••• | Spliced Mid-Cap Value Index | -1.75 | 12.33 | 7.99 | 20,532 |
| – – – – | Mid-Cap Value Funds Average | -4.84 | 9.50 | 6.66 | 18,284 |
| | Dow Jones U.S. Total Stock Market | | | | |
| | Float Adjusted Index | 0.44 | 12.14 | 7.49 | 19,658 |
| For a benchmark description, see the Glossary. | | | | |
| Mid-Cap Value Funds Average: Derived from data provided by Lipper, a Thomson Reuters Company. | | |
| "Since Inception" performance is calculated from the Investor Shares’ inception date for both the fund and its comparative standards. |
| |
| | | | | Since | Final Value |
| | | One | Five | Inception | of a $10,000 |
| | | Year | Years | (8/17/2006) | Investment |
| Mid-Cap Value Index Fund | | | | |
| ETF Shares Net Asset Value | -1.80% | 12.25% | 7.86% | $20,323 |
| Spliced Mid-Cap Value Index | -1.75 | 12.33 | 7.91 | 20,419 |
| Dow Jones U.S. Total Stock Market Float | | | | |
| Adjusted Index | 0.44 | 12.14 | 7.44 | 19,596 |
| "Since Inception" performance is calculated from the ETF Shares’ inception date for both the fund and its comparative standards. |
See Financial Highlights for dividend and capital gains information.
74
| | | |
| Mid-Cap Value Index Fund | | | |
| |
| |
| |
| | Average Annual Total Returns | |
| | Periods Ended December 31, 2015 | |
| | | Since | Final Value |
| | One | Inception | of a $10,000 |
| | Year | (9/27/2011) | Investment |
| Mid-Cap Value Index Fund Admiral Shares | -1.80% | 17.02% | $19,538 |
| Spliced Mid-Cap Value Index | -1.75 | 17.10 | 19,593 |
| Dow Jones U.S. Total Stock Market Float | | | |
| Adjusted Index | 0.44 | 16.09 | 18,884 |
| "Since Inception" performance is calculated from the Admiral Shares’ inception date for both the fund and its comparative standards. |
| | | |
| Cumulative Returns of ETF Shares: August 17, 2006, Through December 31, 2015 | | |
| | | | Since |
| | One | Five | Inception |
| | Year | Years | (8/17/2006) |
| Mid-Cap Value Index Fund ETF Shares Market Price | -1.80% | 78.11% | 103.23% |
| Mid-Cap Value Index Fund ETF Shares Net Asset | | | |
| Value | -1.80 | 78.21 | 103.23 |
| Spliced Mid-Cap Value Index | -1.75 | 78.83 | 104.19 |
| "Since Inception" performance is calculated from the ETF Shares’ inception date for both the fund and its comparative standards. |
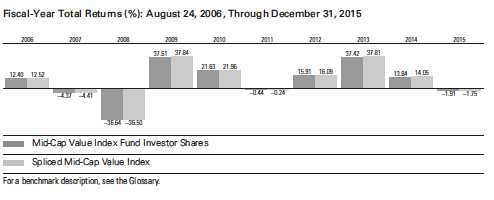
75
Mid-Cap Value Index Fund
Financial Statements
Statement of Net Assets
As of December 31, 2015
The fund reports a complete list of its holdings in regulatory filings four times in each fiscal year, at the quarter-ends. For the second and fourth fiscal quarters, the lists appear in the fund’s semiannual and annual reports to shareholders. For the first and third fiscal quarters, the fund files the lists with the Securities and Exchange Commission on Form N-Q. Shareholders can look up the fund’s Forms N-Q on the SEC’s website at sec.gov. Forms N-Q may also be reviewed and copied at the SEC’s Public Reference Room (see the back cover of this report for further information).
| | | |
| | | | Market |
| | | | Value• |
| | | Shares | ($000) |
| Common Stocks (99.7%)1 | | |
| Basic Materials (6.8%) | | |
| | Alcoa Inc. | 7,164,489 | 70,714 |
| | Celanese Corp. Class A | 801,275 | 53,950 |
| | International Flavors | | |
| | & Fragrances Inc. | 438,316 | 52,440 |
| | Newmont Mining Corp. | 2,895,141 | 52,084 |
| | Eastman Chemical Co. | 771,006 | 52,051 |
| | CF Industries | | |
| | Holdings Inc. | 1,275,293 | 52,045 |
| | Freeport-McMoRan Inc. | 6,312,262 | 42,734 |
| * | WR Grace & Co. | 385,965 | 38,438 |
| | Ashland Inc. | 364,954 | 37,481 |
| | Albemarle Corp. | 612,959 | 34,332 |
| | Avery Dennison Corp. | 497,525 | 31,175 |
| | FMC Corp. | 731,466 | 28,622 |
| | Mosaic Co. | 872,398 | 24,069 |
| | Reliance Steel | | |
| | & Aluminum Co. | 371,290 | 21,501 |
| | Huntsman Corp. | 569,600 | 6,476 |
| | Westlake Chemical Corp. | 108,286 | 5,882 |
| | | | 603,994 |
| Consumer Goods (17.1%) | | |
| | ConAgra Foods Inc. | 2,366,559 | 99,774 |
| | Dr Pepper Snapple | | |
| | Group Inc. | 1,032,647 | 96,243 |
| | Clorox Co. | 705,829 | 89,520 |
| | Tyson Foods Inc. Class A | 1,616,419 | 86,204 |
| | JM Smucker Co. | 654,463 | 80,722 |
| | Molson Coors Brewing Co. | | |
| | Class B | 801,826 | 75,308 |
| | Genuine Parts Co. | 783,408 | 67,287 |
| | Delphi Automotive plc | 766,058 | 65,674 |
| | Newell Rubbermaid Inc. | 1,460,933 | 64,398 |
| | Whirlpool Corp. | 427,720 | 62,819 |
| | DR Horton Inc. | 1,915,907 | 61,367 |
| | Coca-Cola Enterprises Inc. 1,117,578 | 55,030 |
| | Bunge Ltd. | 779,472 | 53,222 |
| | | |
| | | | Market |
| | | | Value• |
| | | Shares | ($000) |
| | BorgWarner Inc. | 1,226,358 | 53,016 |
| | Lear Corp. | 411,244 | 50,513 |
| | Mattel Inc. | 1,856,913 | 50,452 |
| | Coach Inc. | 1,515,583 | 49,605 |
| | Lennar Corp. Class A | 977,822 | 47,825 |
| | Harley-Davidson Inc. | 1,047,748 | 47,557 |
| | Hasbro Inc. | 612,620 | 41,266 |
| | Ralph Lauren Corp. | | |
| | Class A | 321,370 | 35,826 |
| | PVH Corp. | 450,999 | 33,216 |
| | PulteGroup Inc. | 1,716,754 | 30,593 |
| | Hormel Foods Corp. | 362,075 | 28,633 |
| * | Edgewell Personal Care Co. 340,619 | 26,694 |
| | Goodyear Tire | | |
| | & Rubber Co. | 736,500 | 24,061 |
| | Leucadia National Corp. | 889,464 | 15,468 |
| ^ | Pilgrim’s Pride Corp. | 348,425 | 7,697 |
| | Coty Inc. Class A | 278,627 | 7,141 |
| | Lennar Corp. Class B | 50,677 | 2,036 |
| | | | 1,509,167 |
| Consumer Services (10.5%) | | |
| | Royal Caribbean | | |
| | Cruises Ltd. | 962,146 | 97,379 |
| | Nielsen Holdings plc | 1,805,361 | 84,130 |
| * | United Continental | | |
| | Holdings Inc. | 1,044,776 | 59,866 |
| | AmerisourceBergen | | |
| | Corp. Class A | 534,451 | 55,428 |
| | Interpublic Group | | |
| | of Cos. Inc. | 2,223,390 | 51,760 |
| | Kohl’s Corp. | 1,062,198 | 50,592 |
| | H&R Block Inc. | 1,509,231 | 50,272 |
| | Foot Locker Inc. | 761,190 | 49,546 |
| | Best Buy Co. Inc. | 1,599,496 | 48,705 |
| * | Bed Bath & Beyond Inc. | 865,933 | 41,781 |
| | Aramark | 1,243,215 | 40,094 |
| | Darden Restaurants Inc. | 629,863 | 40,084 |
| | News Corp. Class A | 2,539,285 | 33,925 |
| | Staples Inc. | 3,515,856 | 33,295 |
76
| | | |
| Mid-Cap Value Index Fund | | |
| |
| |
| |
| | | | Market |
| | | | Value• |
| | | Shares | ($000) |
| | Whole Foods Market Inc. | 932,337 | 31,233 |
| | Wynn Resorts Ltd. | 444,742 | 30,772 |
| * | Hertz Global Holdings Inc. | 2,067,177 | 29,416 |
| * | MGM Resorts | | |
| | International | 1,233,838 | 28,033 |
| * | Rite Aid Corp. | 2,853,421 | 22,371 |
| * | Discovery | | |
| | Communications Inc. | 711,143 | 17,935 |
| | Gap Inc. | 610,873 | 15,088 |
| * | Discovery | | |
| | Communications Inc. | | |
| | Class A | 408,160 | 10,890 |
| | News Corp. Class B | 198,909 | 2,777 |
| | | | 925,372 |
| Financials (24.4%) | | |
| | Hartford Financial | | |
| | Services Group Inc. | 2,239,258 | 97,318 |
| | M&T Bank Corp. | 786,973 | 95,365 |
| | Citizens Financial | | |
| | Group Inc. | 2,885,239 | 75,564 |
| | Equifax Inc. | 647,987 | 72,166 |
| | Principal Financial | | |
| | Group Inc. | 1,600,917 | 72,009 |
| | Regions Financial Corp. | 7,139,477 | 68,539 |
| | Lincoln National Corp. | 1,353,503 | 68,027 |
| * | Markel Corp. | 72,502 | 64,045 |
| | XL Group plc Class A | 1,628,588 | 63,808 |
| | SL Green Realty Corp. | 545,420 | 61,622 |
| | KeyCorp | 4,569,490 | 60,272 |
| | Kimco Realty Corp. | 2,148,116 | 56,839 |
| | UDR Inc. | 1,433,617 | 53,861 |
| | First Republic Bank | 794,570 | 52,489 |
| | Cincinnati Financial Corp. | 850,120 | 50,302 |
| | FNF Group | 1,436,353 | 49,798 |
| | Western Union Co. | 2,759,356 | 49,420 |
| | Annaly Capital | | |
| | Management Inc. | 5,176,212 | 48,553 |
| | Huntington | | |
| | Bancshares Inc. | 4,350,644 | 48,118 |
| | Plum Creek | | |
| | Timber Co. Inc. | 948,044 | 45,241 |
| * | Arch Capital Group Ltd. | 635,312 | 44,313 |
| | Unum Group | 1,329,474 | 44,258 |
| * | Ally Financial Inc. | 2,367,859 | 44,137 |
| | CIT Group Inc. | 1,097,580 | 43,574 |
| | Voya Financial Inc. | 1,175,970 | 43,405 |
| | Willis Group Holdings plc | 885,884 | 43,027 |
| | New York Community | | |
| | Bancorp Inc. | 2,516,031 | 41,062 |
| | Comerica Inc. | 965,300 | 40,379 |
| | Jones Lang LaSalle Inc. | 246,469 | 39,401 |
| | Torchmark Corp. | 640,013 | 36,583 |
| | Nasdaq Inc. | 627,989 | 36,530 |
| | Realty Income Corp. | 681,757 | 35,199 |
| | | |
| | | | Market |
| | | | Value• |
| | | Shares | ($000) |
| | PartnerRe Ltd. | 236,056 | 32,987 |
| | American Capital | | |
| | Agency Corp. | 1,892,718 | 32,820 |
| | Everest Re Group Ltd. | 176,916 | 32,392 |
| | Reinsurance Group of | | |
| | America Inc. Class A | 359,911 | 30,790 |
| | Zions Bancorporation | 1,116,282 | 30,475 |
| | Axis Capital Holdings Ltd. | 501,383 | 28,188 |
| | Iron Mountain Inc. | 1,040,180 | 28,095 |
| | WR Berkley Corp. | 506,250 | 27,717 |
| | People’s United | | |
| | Financial Inc. | 1,698,315 | 27,428 |
| | Legg Mason Inc. | 587,725 | 23,056 |
| | Navient Corp. | 1,976,280 | 22,628 |
| | Raymond James | | |
| | Financial Inc. | 351,444 | 20,373 |
| * | Alleghany Corp. | 40,347 | 19,283 |
| | Camden Property Trust | 237,010 | 18,193 |
| | Assurant Inc. | 179,686 | 14,472 |
| ^ | LPL Financial Holdings Inc. | 220,635 | 9,410 |
| * | Santander Consumer | | |
| | USA Holdings Inc. | 584,805 | 9,269 |
| | | | 2,152,800 |
| Health Care (5.9%) | | |
| * | Endo International plc | 1,238,405 | 75,815 |
| * | Henry Schein Inc. | 453,570 | 71,750 |
| * | Laboratory Corp. of | | |
| | America Holdings | 553,002 | 68,373 |
| * | Boston Scientific Corp. | 3,678,451 | 67,831 |
| | Universal Health | | |
| | Services Inc. Class B | 498,954 | 59,620 |
| | Quest Diagnostics Inc. | 782,926 | 55,698 |
| * | Hologic Inc. | 1,393,108 | 53,899 |
| * | Mallinckrodt plc | 633,268 | 47,261 |
| | Patterson Cos. Inc. | 478,728 | 21,643 |
| | | | 521,890 |
| Industrials (11.8%) | | |
| | Fidelity National | | |
| | Information Services Inc. 1,542,582 | 93,481 |
| | Rockwell Collins Inc. | 719,015 | 66,365 |
| | WestRock Co. | 1,432,232 | 65,338 |
| | Textron Inc. | 1,347,461 | 56,607 |
| | Xerox Corp. | 5,261,735 | 55,932 |
| | Ball Corp. | 744,502 | 54,148 |
| | Dover Corp. | 846,327 | 51,888 |
| | Towers Watson | | |
| | & Co. Class A | 379,321 | 48,728 |
| | Sealed Air Corp. | 1,078,201 | 48,088 |
| | L-3 Communications | | |
| | Holdings Inc. | 385,363 | 46,055 |
| | Cintas Corp. | 471,771 | 42,955 |
| * | Crown Holdings Inc. | 761,462 | 38,606 |
| | Fluor Corp. | 773,617 | 36,530 |
| | Xylem Inc. | 979,842 | 35,764 |
77
| | | |
| Mid-Cap Value Index Fund | | |
| |
| |
| |
| | | | Market |
| | | | Value• |
| | | Shares | ($000) |
| | ManpowerGroup Inc. | 402,178 | 33,900 |
| | Avnet Inc. | 722,437 | 30,949 |
| | Flowserve Corp. | 715,027 | 30,088 |
| | ADT Corp. | 901,200 | 29,722 |
| * | Hubbell Inc. Class B | 288,064 | 29,106 |
| | Owens Corning | 606,358 | 28,517 |
| * | Jacobs Engineering | | |
| | Group Inc. | 669,703 | 28,094 |
| * | Arrow Electronics Inc. | 516,007 | 27,957 |
| | Allison Transmission | | |
| | Holdings Inc. | 839,685 | 21,739 |
| | FLIR Systems Inc. | 765,046 | 21,475 |
| | AGCO Corp. | 198,501 | 9,010 |
| * | Colfax Corp. | 237,872 | 5,554 |
| * | Quanta Services Inc. | 208,782 | 4,228 |
| | | | 1,040,824 |
| Oil & Gas (5.9%) | | |
| | Tesoro Corp. | 658,537 | 69,390 |
| * | Cameron International | | |
| | Corp. | 1,044,272 | 65,998 |
| | Marathon Oil Corp. | 3,698,586 | 46,565 |
| | Columbia Pipeline | | |
| | Group Inc. | 2,125,030 | 42,501 |
| | HollyFrontier Corp. | 999,028 | 39,851 |
| * | FMC Technologies Inc. | 1,245,352 | 36,128 |
| * | Weatherford | | |
| | International plc | 4,255,173 | 35,701 |
| | Helmerich & Payne Inc. | 560,534 | 30,016 |
| | OGE Energy Corp. | 1,091,222 | 28,688 |
| ^ | Transocean Ltd. | 1,892,771 | 23,432 |
| | Cimarex Energy Co. | 257,918 | 23,053 |
| | Oceaneering | | |
| | International Inc. | 533,814 | 20,029 |
| | Murphy Oil Corp. | 891,423 | 20,012 |
| | Energen Corp. | 429,911 | 17,622 |
| | Ensco plc Class A | 643,059 | 9,897 |
| * | Southwestern Energy Co. 1,049,943 | 7,465 |
| ^ | Chesapeake Energy Corp. 1,634,608 | 7,356 |
| | | | 523,704 |
| Other (0.0%) | | |
| * | Safeway Inc CVR | | |
| | (Casa Ley) Exp. 1/30/2018 1,233 | — |
| * | Safeway Inc CVR | | |
| | (PDC) Exp. 1/30/2017 | 1,233 | — |
| | | | — |
| Technology (8.1%) | | |
| | NVIDIA Corp. | 2,794,184 | 92,096 |
| | SanDisk Corp. | 1,097,465 | 83,396 |
| | Seagate Technology plc | 1,635,790 | 59,968 |
| | Harris Corp. | 680,665 | 59,150 |
| | Maxim Integrated | | |
| | Products Inc. | 1,554,814 | 59,083 |
| | | |
| | | | Market |
| | | | Value• |
| | | Shares | ($000) |
| | Juniper Networks Inc. | 2,005,396 | 55,349 |
| | NetApp Inc. | 1,610,537 | 42,728 |
| * | Synopsys Inc. | 851,804 | 38,851 |
| | Western Digital Corp. | 601,348 | 36,111 |
| | Xilinx Inc. | 701,947 | 32,971 |
| | KLA-Tencor Corp. | 425,895 | 29,536 |
| * | Nuance | | |
| | Communications Inc. | 1,356,181 | 26,975 |
| | Garmin Ltd. | 623,007 | 23,157 |
| | Marvell Technology | | |
| | Group Ltd. | 2,258,651 | 19,921 |
| * | IMS Health Holdings Inc. | 716,977 | 18,261 |
| | Computer Sciences Corp. | 379,172 | 12,391 |
| | CSRA Inc. | 372,701 | 11,181 |
| * | Teradata Corp. | 363,262 | 9,597 |
| | | | 710,722 |
| Telecommunications (0.3%) | | |
| | Frontier Communications | | |
| | Corp. | 6,382,526 | 29,806 |
| |
| Utilities (8.9%) | | |
| | Eversource Energy | 1,734,149 | 88,563 |
| | WEC Energy Group Inc. | 1,725,975 | 88,560 |
| | DTE Energy Co. | 980,650 | 78,638 |
| | American Water | | |
| | Works Co. Inc. | 981,828 | 58,664 |
| | Ameren Corp. | 1,327,403 | 57,384 |
| | CMS Energy Corp. | 1,520,394 | 54,856 |
| | SCANA Corp. | 702,534 | 42,496 |
| | CenterPoint Energy Inc. | 2,232,313 | 40,985 |
| | Pinnacle West | | |
| | Capital Corp. | 605,368 | 39,034 |
| | Alliant Energy Corp. | 619,185 | 38,668 |
| | Pepco Holdings Inc. | 1,385,380 | 36,034 |
| | AES Corp. | 3,675,469 | 35,174 |
| | NiSource Inc. | 1,740,862 | 33,964 |
| | Entergy Corp. | 487,352 | 33,315 |
| | ONEOK Inc. | 1,145,808 | 28,256 |
| | NRG Energy Inc. | 857,931 | 10,098 |
| | National Fuel Gas Co. | 219,603 | 9,388 |
| * | Avangrid Inc. | 168,735 | 6,480 |
| | | | 780,557 |
| Total Common Stocks | | |
| (Cost $8,088,304) | | 8,798,836 |
| Temporary Cash Investments (0.6%)1 | |
| Money Market Fund (0.6%) | | |
| 2,3 | Vanguard Market | | |
| | Liquidity Fund, 0.363% | 51,443,771 | 51,444 |
78
| | |
| Mid-Cap Value Index Fund | | |
| |
| |
| |
| | Face | Market |
| | Amount | Value• |
| | ($000) | ($000) |
U.S. Government and Agency Obligations (0.0%)
| | |
| 4,5 Federal Home Loan | | |
| Bank Discount Notes, | | |
| 0.290%, 4/29/16 | 2,000 | 1,997 |
| Total Temporary Cash Investments | |
| (Cost $53,442) | | 53,441 |
| Total Investments (100.3%) | | |
| (Cost $8,141,746) | | 8,852,277 |
| |
| | | Amount |
| | | ($000) |
| Other Assets and Liabilities (-0.3%) | |
| Other Assets | | |
| Investment in Vanguard | | 772 |
Receivables for Investment Securities Sold 6,749
| |
| Receivables for Accrued Income | 14,715 |
| Receivables for Capital Shares Issued | 7,628 |
| Other Assets | 4 |
| Total Other Assets | 29,868 |
| Liabilities | |
| Payables for Investment | |
| Securities Purchased | (20,936) |
| Collateral for Securities on Loan | (22,954) |
| Payables for Capital Shares Redeemed | (12,015) |
| Payables to Vanguard | (3,010) |
| Other Liabilities | (452) |
| Total Liabilities | (59,367) |
| Net Assets (100%) | 8,822,778 |
At December 31, 2015, net assets consisted of:
Amount ($000)
| |
| Paid-in Capital | 8,375,202 |
| Undistributed Net Investment Income | 2,955 |
| Accumulated Net Realized Losses | (266,099) |
| Unrealized Appreciation (Depreciation) | |
| Investment Securities | 710,531 |
| Futures Contracts | 189 |
| Net Assets | 8,822,778 |
| |
| |
| Investor Shares—Net Assets | |
| Applicable to 17,377,722 outstanding | |
| $.001 par value shares of beneficial | |
| interest (unlimited authorization) | 588,372 |
| Net Asset Value Per Share— | |
| Investor Shares | $33.86 |
| |
| |
| ETF Shares—Net Assets | |
| Applicable to 50,593,599 outstanding | |
| $.001 par value shares of beneficial | |
| interest (unlimited authorization) | 4,350,767 |
| Net Asset Value Per Share— | |
| ETF Shares | $85.99 |
| |
| |
| Admiral Shares—Net Assets | |
| Applicable to 87,186,085 outstanding | |
| $.001 par value shares of beneficial | |
| interest (unlimited authorization) | 3,883,639 |
| Net Asset Value Per Share— | |
| Admiral Shares | $44.54 |
• See Note A in Notes to Financial Statements.
* Non-income-producing security.
^ Includes partial security positions on loan to broker-dealers. The total value of securities on loan is $21,512,000.
1 The fund invests a portion of its cash reserves in equity markets through the use of index futures contracts. After giving effect to futures investments, the fund’s effective common stock and temporary cash investment positions represent 100.0% and 0.3%, respectively, of net assets.
2 Affiliated money market fund available only to Vanguard funds and certain trusts and accounts managed by Vanguard. Rate shown is the 7-day yield.
3 Includes $22,954,000 of collateral received for securities on loan.
4 The issuer operates under a congressional charter; its securities are generally neither guaranteed by the U.S. Treasury nor backed by the full faith and credit of the U.S. government.
5 Securities with a value of $1,098,000 have been segregated as initial margin for open futures contracts.
See accompanying Notes, which are an integral part of the Financial Statements.
79
| |
| Mid-Cap Value Index Fund | |
| |
| |
| Statement of Operations | |
| |
| | Year Ended |
| | December 31, 2015 |
| | ($000) |
| Investment Income | |
| Income | |
| Dividends | 176,751 |
| Interest1 | 41 |
| Securities Lending | 2,198 |
| Total Income | 178,990 |
| Expenses | |
| The Vanguard Group—Note B | |
| Investment Advisory Services | 1,250 |
| Management and Administrative—Investor Shares | 954 |
| Management and Administrative—ETF Shares | 1,797 |
| Management and Administrative—Admiral Shares | 1,619 |
| Marketing and Distribution—Investor Shares | 163 |
| Marketing and Distribution—ETF Shares | 401 |
| Marketing and Distribution—Admiral Shares | 477 |
| Custodian Fees | 107 |
| Auditing Fees | 38 |
| Shareholders’ Reports—Investor Shares | 22 |
| Shareholders’ Reports—ETF Shares | 220 |
| Shareholders’ Reports—Admiral Shares | 47 |
| Trustees’ Fees and Expenses | 5 |
| Total Expenses | 7,100 |
| Net Investment Income | 171,890 |
| Realized Net Gain (Loss) | |
| Investment Securities Sold | 290,308 |
| Futures Contracts | (363) |
| Realized Net Gain (Loss) | 289,945 |
| Change in Unrealized Appreciation (Depreciation) | |
| Investment Securities | (628,360) |
| Futures Contracts | 104 |
| Change in Unrealized Appreciation (Depreciation) | (628,256) |
| Net Increase (Decrease) in Net Assets Resulting from Operations | (166,421) |
| 1 Interest income from an affiliated company of the fund was $36,000. | |
See accompanying Notes, which are an integral part of the Financial Statements.
80
| | |
| Mid-Cap Value Index Fund | | |
| |
| |
| Statement of Changes in Net Assets | | |
| |
| | Year Ended December 31, |
| | 2015 | 2014 |
| | ($000) | ($000) |
| Increase (Decrease) in Net Assets | | |
| Operations | | |
| Net Investment Income | 171,890 | 113,788 |
| Realized Net Gain (Loss) | 289,945 | 285,132 |
| Change in Unrealized Appreciation (Depreciation) | (628,256) | 374,279 |
| Net Increase (Decrease) in Net Assets Resulting from Operations | (166,421) | 773,199 |
| Distributions | | |
| Net Investment Income | | |
| Investor Shares | (11,384) | (9,388) |
| ETF Shares | (84,188) | (56,508) |
| Admiral Shares | (73,446) | (47,110) |
| Realized Capital Gain | | |
| Investor Shares | — | — |
| ETF Shares | — | — |
| Admiral Shares | — | — |
| Total Distributions | (169,018) | (113,006) |
| Capital Share Transactions | | |
| Investor Shares | (17,234) | (82,189) |
| ETF Shares | 1,106,022 | 822,050 |
| Admiral Shares | 1,138,592 | 881,381 |
| Net Increase (Decrease) from Capital Share Transactions | 2,227,380 | 1,621,242 |
| Total Increase (Decrease) | 1,891,941 | 2,281,435 |
| Net Assets | | |
| Beginning of Period | 6,930,837 | 4,649,402 |
| End of Period1 | 8,822,778 | 6,930,837 |
1 Net Assets—End of Period includes undistributed (overdistributed) net investment income of $2,955,000 and $83,000.
See accompanying Notes, which are an integral part of the Financial Statements.
81
| | | | | |
| Mid-Cap Value Index Fund | | | | | |
| |
| |
| Financial Highlights | | | | | |
| |
| |
| Investor Shares | | | | | |
| |
| For a Share Outstanding | | | Year Ended December 31, |
| Throughout Each Period | 2015 | 2014 | 2013 | 2012 | 2011 |
| Net Asset Value, Beginning of Period | $35.19 | $31.38 | $23.16 | $20.34 | $20.85 |
| Investment Operations | | | | | |
| Net Investment Income | . 658 | .539 | . 441 | .423 | .417 |
| Net Realized and Unrealized Gain (Loss) | | | | | |
| on Investments | (1.341) | 3.804 | 8.218 | 2.813 | (.509) |
| Total from Investment Operations | (.683) | 4.343 | 8.659 | 3.236 | (.092) |
| Distributions | | | | | |
| Dividends from Net Investment Income | (.647) | (. 533) | (. 439) | (.416) | (.418) |
| Distributions from Realized Capital Gains | — | — | — | — | — |
| Total Distributions | (.647) | (. 533) | (. 439) | (.416) | (.418) |
| Net Asset Value, End of Period | $33.86 | $35.19 | $31.38 | $23.16 | $20.34 |
| |
| Total Return1 | -1.91% | 13.84% | 37.42% | 15.91% | -0.44% |
| |
| Ratios/Supplemental Data | | | | | |
| Net Assets, End of Period (Millions) | $588 | $628 | $640 | $487 | $455 |
| Ratio of Total Expenses to | | | | | |
| Average Net Assets | 0.20% | 0.23% | 0.24% | 0.24% | 0.24% |
| Ratio of Net Investment Income to | | | | | |
| Average Net Assets | 2.01% | 1.86% | 1.80% | 2.21% | 1.97% |
| Portfolio Turnover Rate2 | 20% | 14% | 46% | 33% | 41% |
1 Total returns do not include account service fees that may have applied in the periods shown. Fund prospectuses provide information about any applicable account service fees.
2 Excludes the value of portfolio securities received or delivered as a result of in-kind purchases or redemptions of the fund’s capital shares, including ETF Creation Units.
See accompanying Notes, which are an integral part of the Financial Statements.
82
| | | | | |
| Mid-Cap Value Index Fund | | | | | |
| |
| |
| Financial Highlights | | | | | |
| |
| |
| ETF Shares | | | | | |
| |
| For a Share Outstanding | | | Year Ended December 31, |
| Throughout Each Period | 2015 | 2014 | 2013 | 2012 | 2011 |
| Net Asset Value, Beginning of Period | $89.39 | $79.73 | $58.82 | $51.67 | $52.97 |
| Investment Operations | | | | | |
| Net Investment Income | 1.785 | 1.504 | 1.232 | 1.156 | 1.134 |
| Net Realized and Unrealized Gain (Loss) | | | | | |
| on Investments | (3.427) | 9.647 | 20.901 | 7.130 | (1.297) |
| Total from Investment Operations | (1.642) | 11.151 | 22.133 | 8.286 | (.163) |
| Distributions | | | | | |
| Dividends from Net Investment Income | (1.758) | (1.491) | (1.223) | (1.136) | (1.137) |
| Distributions from Realized Capital Gains | — | — | — | — | — |
| Total Distributions | (1.758) | (1.491) | (1.223) | (1.136) | (1.137) |
| Net Asset Value, End of Period | $85.99 | $89.39 | $79.73 | $58.82 | $51.67 |
| |
| Total Return | -1.80% | 13.98% | 37.65% | 16.04% | -0.32% |
| |
| Ratios/Supplemental Data | | | | | |
| Net Assets, End of Period (Millions) | $4,351 | $3,407 | $2,256 | $1,147 | $785 |
| Ratio of Total Expenses to | | | | | |
| Average Net Assets | 0.08% | 0.09% | 0.09% | 0.10% | 0.10% |
| Ratio of Net Investment Income to | | | | | |
| Average Net Assets | 2.13% | 2.00% | 1.95% | 2.35% | 2.11% |
| Portfolio Turnover Rate1 | 20% | 14% | 46% | 33% | 41% |
1 Excludes the value of portfolio securities received or delivered as a result of in-kind purchases or redemptions of the fund’s capital shares, including ETF Creation Units.
See accompanying Notes, which are an integral part of the Financial Statements.
83
| | | | | |
| Mid-Cap Value Index Fund | | | | | |
| |
| |
| Financial Highlights | | | | | |
| |
| |
| Admiral Shares | | | | | |
| | | | | | |
| | | | | | Sept. 27, |
| | | | 20111 to |
| For a Share Outstanding | | Year Ended December 31, | Dec. 31, |
| Throughout Each Period | 2015 | 2014 | 2013 | 2012 | 2011 |
| Net Asset Value, Beginning of Period | $46.30 | $41.30 | $30.47 | $26.77 | $25.00 |
| Investment Operations | | | | | |
| Net Investment Income | . 924 | .780 | .638 | .598 | .157 |
| Net Realized and Unrealized Gain (Loss) | | | | | |
| on Investments | (1.775) | 4.994 | 10.826 | 3.692 | 2.165 |
| Total from Investment Operations | (.851) | 5.774 | 11.464 | 4.290 | 2.322 |
| Distributions | | | | | |
| Dividends from Net Investment Income | (.909) | (.774) | (.634) | (. 590) | (. 552) |
| Distributions from Realized Capital Gains | — | — | — | — | — |
| Total Distributions | (.909) | (.774) | (.634) | (. 590) | (. 552) |
| Net Asset Value, End of Period | $44.54 | $46.30 | $41.30 | $30.47 | $26.77 |
| |
| Total Return2 | -1.80% | 13.98% | 37.66% | 16.02% | 9.29% |
| |
| Ratios/Supplemental Data | | | | | |
| Net Assets, End of Period (Millions) | $3,884 | $2,896 | $1,753 | $724 | $268 |
| Ratio of Total Expenses to | | | | | |
| Average Net Assets | 0.08% | 0.09% | 0.09% | 0.10% | 0.10%3 |
| Ratio of Net Investment Income to | | | | | |
| Average Net Assets | 2.13% | 2.00% | 1.95% | 2.35% | 2.11%3 |
| Portfolio Turnover Rate 4 | 20% | 14% | 46% | 33% | 41% |
| 1 | Inception. |
| 2 | Total returns do not include account service fees that may have applied in the periods shown. Fund prospectuses provide information about any applicable account service fees. |
| 3 | Annualized. |
| 4 | Excludes the value of portfolio securities received or delivered as a result of in-kind purchases or redemptions of the fund’s capital shares, including ETF Creation Units. |
See accompanying Notes, which are an integral part of the Financial Statements.
84
Mid-Cap Value Index Fund
Notes to Financial Statements
Vanguard Mid-Cap Value Index Fund is registered under the Investment Company Act of 1940 as an open-end investment company, or mutual fund. The fund offers three classes of shares: Investor Shares, ETF Shares, and Admiral Shares. Investor Shares are available to any investor who meets the fund’s minimum purchase requirements. ETF Shares are listed for trading on NYSE Arca; they can be purchased and sold through a broker. Admiral Shares are designed for investors who meet certain administrative, service, and account-size criteria.
A. The following significant accounting policies conform to generally accepted accounting principles for U.S. investment companies. The fund consistently follows such policies in preparing its financial statements.
1. Security Valuation: Securities are valued as of the close of trading on the New York Stock Exchange (generally 4 p.m., Eastern time) on the valuation date. Equity securities are valued at the latest quoted sales prices or official closing prices taken from the primary market in which each security trades; such securities not traded on the valuation date are valued at the mean of the latest quoted bid and asked prices. Securities for which market quotations are not readily available, or whose values have been materially affected by events occurring before the fund’s pricing time but after the close of the securities’ primary markets, are valued by methods deemed by the board of trustees to represent fair value. Investments in Vanguard Market Liquidity Fund are valued at that fund’s net asset value. Temporary cash investments acquired over 60 days to maturity are valued using the latest bid prices or using valuations based on a matrix system (which considers such factors as security prices, yields, maturities, and ratings), both as furnished by independent pricing services. Other temporary cash investments are valued at amortized cost, which approximates market value.
2. Futures Contracts: The fund uses index futures contracts to a limited extent, with the objectives of maintaining full exposure to the stock market, enhancing returns, maintaining liquidity, and minimizing transaction costs. The fund may purchase futures contracts to immediately invest incoming cash in the market, or sell futures in response to cash outflows, thereby simulating a fully invested position in the underlying index while maintaining a cash balance for liquidity. The fund may seek to enhance returns by using futures contracts instead of the underlying securities when futures are believed to be priced more attractively than the underlying securities. The primary risks associated with the use of futures contracts are imperfect correlation between changes in market values of stocks held by the fund and the prices of futures contracts, and the possibility of an illiquid market. Counterparty risk involving futures is mitigated because a regulated clearinghouse is the counterparty instead of the clearing broker. To further mitigate counterparty risk, the fund trades futures contracts on an exchange, monitors the financial strength of its clearing brokers and clearinghouse, and has entered into clearing agreements with its clearing brokers. The clearinghouse imposes initial margin requirements to secure the fund’s performance and requires daily settlement of variation margin representing changes in the market value of each contract.
Futures contracts are valued at their quoted daily settlement prices. The aggregate settlement values of the contracts are not recorded in the Statement of Net Assets. Fluctuations in the value of the contracts are recorded in the Statement of Net Assets as an asset (liability) and in the Statement of Operations as unrealized appreciation (depreciation) until the contracts are closed, when they are recorded as realized futures gains (losses).
85
Mid-Cap Value Index Fund
During the year ended December 31, 2015, the fund’s average investments in long and short futures contracts represented less than 1% and 0% of net assets, respectively, based on the average of aggregate settlement values at each quarter-end during the period.
3. Federal Income Taxes: The fund intends to continue to qualify as a regulated investment company and distribute all of its taxable income. Management has analyzed the fund’s tax positions taken for all open federal income tax years (December 31, 2012–2015), and has concluded that no provision for federal income tax is required in the fund’s financial statements.
4. Distributions: Distributions to shareholders are recorded on the ex-dividend date.
5. Securities Lending: To earn additional income, the fund lends its securities to qualified institutional borrowers. Security loans are subject to termination by the fund at any time and are required to be secured at all times by collateral in an amount at least equal to the market value of securities loaned. Daily market fluctuations could cause the value of loaned securities to be more or less than the value of the collateral received. When this occurs, the collateral is adjusted and settled on the next business day. The fund further mitigates its counterparty risk by entering into securities lending transactions only with a diverse group of prequalified counterparties, monitoring their financial strength, and entering into master securities lending agreements with its counterparties. The master securities lending agreements provide that, in the event of a counterparty’s default (including bankruptcy), the fund may terminate any loans with that borrower, determine the net amount owed, and sell or retain the collateral up to the net amount owed to the fund; however, such actions may be subject to legal proceedings. While collateral mitigates counterparty risk, in the absence of a default the fund may experience delays and costs in recovering the securities loaned. The fund invests cash collateral received in Vanguard Market Liquidity Fund, and records a liability in the Statement of Net Assets for the return of the collateral, during the period the securities are on loan. Securities lending income represents fees charged to borrowers plus income earned on invested cash collateral, less expenses associated with the loan.
6. Credit Facility: The fund and certain other funds managed by The Vanguard Group (“Vanguard”) participate in a $3 billion committed credit facility provided by a syndicate of lenders pursuant to a credit agreement that may be renewed annually; each fund is individually liable for its borrowings, if any, under the credit facility. Borrowings may be utilized for temporary and emergency purposes, and are subject to the fund’s regulatory and contractual borrowing restrictions. The participating funds are charged administrative fees and an annual commitment fee of 0.06% of the undrawn amount of the facility; these fees are allocated to the funds based on a method approved by the fund’s board of trustees and included in Management and Administrative expenses on the fund’s Statement of Operations. Any borrowings under this facility bear interest at a rate equal to the higher of the federal funds rate or LIBOR reference rate plus an agreed-upon spread.
The fund had no borrowings outstanding at December 31, 2015, or at any time during the period then ended.
7. Other: Dividend income is recorded on the ex-dividend date. Interest income includes income distributions received from Vanguard Market Liquidity Fund and is accrued daily. Premiums and discounts on debt securities purchased are amortized and accreted, respectively, to interest income over the lives of the respective securities. Security transactions are accounted for on the date securities are bought or sold. Costs used to determine realized gains (losses) on the sale of investment securities are those of the specific securities sold.
86
Mid-Cap Value Index Fund
Each class of shares has equal rights as to assets and earnings, except that each class separately bears certain class-specific expenses related to maintenance of shareholder accounts (included in Management and Administrative expenses) and shareholder reporting. Marketing and distribution expenses are allocated to each class of shares based on a method approved by the board of trustees. Income, other non-class-specific expenses, and gains and losses on investments are allocated to each class of shares based on its relative net assets.
B. In accordance with the terms of a Funds’ Service Agreement (the “FSA”) between Vanguard and the fund, Vanguard furnishes to the fund investment advisory, corporate management, administrative, marketing, and distribution services at Vanguard’s cost of operations (as defined by the FSA). These costs of operations are allocated to the fund based on methods and guidelines approved by the board of trustees. Vanguard does not require reimbursement in the current period for certain costs of operations (such as deferred compensation/benefits and risk/insurance costs); the fund’s liability for these costs of operations is included in Payables to Vanguard on the Statement of Net Assets.
Upon the request of Vanguard, the fund may invest up to 0.40% of its net assets as capital in Vanguard. At December 31, 2015, the fund had contributed to Vanguard capital in the amount of $772,000, representing 0.01% of the fund’s net assets and 0.31% of Vanguard’s capitalization. The fund’s trustees and officers are also directors and employees, respectively, of Vanguard.
C. Various inputs may be used to determine the value of the fund’s investments. These inputs are summarized in three broad levels for financial statement purposes. The inputs or methodologies used to value securities are not necessarily an indication of the risk associated with investing in those securities.
Level 1—Quoted prices in active markets for identical securities.
Level 2—Other significant observable inputs (including quoted prices for similar securities, interest rates, prepayment speeds, credit risk, etc.).
Level 3—Significant unobservable inputs (including the fund’s own assumptions used to determine the fair value of investments).
The following table summarizes the market value of the fund’s investments as of December 31, 2015, based on the inputs used to value them:
| | | |
| | Level 1 | Level 2 | Level 3 |
| Investments | ($000) | ($000) | ($000) |
| Common Stocks | 8,798,836 | — | — |
| Temporary Cash Investments | 51,444 | 1,997 | — |
| Futures Contracts—Liabilities1 | (185) | — | — |
| Total | 8,850,095 | 1,997 | — |
| 1 Represents variation margin on the last day of the reporting period. | | | |
87
Mid-Cap Value Index Fund
D. At December 31, 2015, the aggregate settlement value of open futures contracts and the related unrealized appreciation (depreciation) were:
| | | | |
| | | | | ($000) |
| | | | Aggregate | |
| | | Number of | Settlement | Unrealized |
| | | Long (Short) | Value | Appreciation |
| Futures Contracts | Expiration | Contracts | Long (Short) | (Depreciation) |
| E-mini S&P 500 Index | March 2016 | 130 | 13,230 | 109 |
| E-mini S&P MidCap 400 Index | March 2016 | 46 | 6,410 | 80 |
| | | | | 189 |
Unrealized appreciation (depreciation) on open futures contracts is required to be treated as realized gain (loss) for tax purposes.
E. Distributions are determined on a tax basis and may differ from net investment income and realized capital gains for financial reporting purposes. Differences may be permanent or temporary. Permanent differences are reclassified among capital accounts in the financial statements to reflect their tax character. Temporary differences arise when certain items of income, expense, gain, or loss are recognized in different periods for financial statement and tax purposes. These differences will reverse at some time in the future. Differences in classification may also result from the treatment of short-term gains as ordinary income for tax purposes.
During the year ended December 31, 2015, the fund realized $523,500,000 of net capital gains resulting from in-kind redemptions—in which shareholders exchanged fund shares for securities held by the fund rather than for cash. Because such gains are not taxable to the fund, and are not distributed to shareholders, they have been reclassified from accumulated net realized losses to paid-in capital.
For tax purposes, at December 31, 2015, the fund had $5,523,000 of ordinary income available for distribution. At December 31, 2015, the fund had available capital losses totaling $265,910,000 to offset future net capital gains. Of this amount, $4,037,000 is subject to expiration on December 31, 2018. Capital losses of $261,873,000 realized beginning in fiscal 2011 may be carried forward indefinitely under the Regulated Investment Company Modernization Act of 2010, but must be used before any expiring loss carryforwards.
At December 31, 2015, the cost of investment securities for tax purposes was $8,141,746,000. Net unrealized appreciation of investment securities for tax purposes was $710,531,000, consisting of unrealized gains of $1,198,629,000 on securities that had risen in value since their purchase and $488,098,000 in unrealized losses on securities that had fallen in value since their purchase.
F. During the year ended December 31, 2015, the fund purchased $5,278,660,000 of investment securities and sold $3,060,771,000 of investment securities, other than temporary cash investments. Purchases and sales include $2,366,767,000 and $1,447,073,000, respectively, in connection with in-kind purchases and redemptions of the fund’s capital shares.
88
Mid-Cap Value Index Fund
| | | | |
| G. Capital share transactions for each class of shares were: | | | |
| | | | Year Ended December 31, |
| | | 2015 | | 2014 |
| | Amount | Shares | Amount | Shares |
| | ($000) | (000) | ($000) | (000) |
| Investor Shares | | | | |
| Issued | 252,836 | 7,160 | 242,958 | 7,334 |
| Issued in Lieu of Cash Distributions | 11,039 | 331 | 9,078 | 258 |
| Redeemed | (281,109) | (7,951) | (334,225) | (10,146) |
| Net Increase (Decrease)—Investor Shares | (17,234) | (460) | (82,189) | (2,554) |
| ETF Shares | | | | |
| Issued | 2,585,412 | 28,956 | 1,679,901 | 19,912 |
| Issued in Lieu of Cash Distributions | — | — | — | — |
| Redeemed | (1,479,390) | (16,475) | (857,851) | (10,100) |
| Net Increase (Decrease)—ETF Shares | 1,106,022 | 12,481 | 822,050 | 9,812 |
| Admiral Shares | | | | |
| Issued | 1,833,183 | 39,490 | 1,424,892 | 32,520 |
| Issued in Lieu of Cash Distributions | 65,747 | 1,498 | 41,864 | 905 |
| Redeemed | (760,338) | (16,347) | (585,375) | (13,334) |
| Net Increase (Decrease) —Admiral Shares | 1,138,592 | 24,641 | 881,381 | 20,091 |
H. Management has determined that no material events or transactions occurred subsequent to December 31, 2015, that would require recognition or disclosure in these financial statements.
89
Report of Independent Registered Public Accounting Firm
To the Board of Trustees of Vanguard Index Funds and the Shareholders of Vanguard Extended Market Index Fund, Vanguard Mid-Cap Index Fund, Vanguard Mid-Cap Growth Index Fund and Vanguard Mid-Cap Value Index Fund: In our opinion, the accompanying statements of net assets, statement of net assets—investments summary and the related statements of operations and of changes in net assets and the financial highlights present fairly, in all material respects, the financial position of Vanguard Extended Market Index Fund, Vanguard Mid-Cap Index Fund, Vanguard Mid-Cap Growth Index Fund and Vanguard Mid-Cap Value Index Fund (constituting separate portfolios of Vanguard Index Funds, hereafter referred to as the “Funds”) at December 31, 2015, the results of each of their operations for the year then ended, the changes in each of their net assets for each of the two years in the period then ended, and the financial highlights for each of the periods indicated, in conformity with accounting principles generally accepted in the United States of America. These financial statements and financial highlights (hereafter referred to as “financial statements”) are the responsibility of the Funds’ management. Our responsibility is to express an opinion on these financial statements based on our audits. We conducted our audits of these financial statements in accordance with the standards of the Public Company Accounting Oversight Board (United States). Those standards require that we plan and perform the audit to obtain reasonable assurance about whether the financial statements are free of material misstatement. An audit includes examining, on a test basis, evidence supporting the amounts and disclosures in the financial statements, assessing the accounting principles used and significant estimates made by management, and evaluating the overall financial statement presentation. We believe that our audits, which included confirmation of securities at December 31, 2015 by correspondence with the custodians and brokers, by agreement to the underlying ownership records of the transfer agent and the application of alternative auditing procedures where securities purchased had not been received, provide a reasonable basis for our opinion.
/s/PricewaterhouseCoopers LLP
Philadelphia, Pennsylvania
February 11, 2016
90
Special 2015 tax information (unaudited) for Vanguard U.S. Stock Index Funds (Mid-Capitalization Portfolios)
This information for the fiscal year ended December 31, 2015, is included pursuant to provisions of the Internal Revenue Code.
The funds distributed qualified dividend income to shareholders during the fiscal year as follows:
| |
| Fund | ($000) |
| Extended Market Index Fund | 405,781 |
| Mid-Cap Index Fund | 836,248 |
| Mid-Cap Growth Index Fund | 43,401 |
| Mid-Cap Value Index Fund | 155,902 |
For corporate shareholders, the percentage of investment income (dividend income plus short-term gains, if any) that qualifies for the dividends-received deduction is as follows:
| |
| Fund | Percentage |
| Extended Market Index Fund | 66.1% |
| Mid-Cap Index Fund | 80.7 |
| Mid-Cap Growth Index Fund | 70.7 |
| Mid-Cap Value Index Fund | 82.5 |
91
Your Fund’s After-Tax Returns
This table presents returns for your fund both before and after taxes. The after-tax returns are shown in two ways: (1) assuming that an investor owned the fund during the entire period and paid taxes on the fund’s distributions, and (2) assuming that an investor paid taxes on the fund’s distributions and sold all shares at the end of each period.
Calculations are based on the highest individual federal income tax and capital gains tax rates in effect at the times of the distributions and the hypothetical sales. State and local taxes were not considered. After-tax returns reflect any qualified dividend income. (In the example, returns after the sale of fund shares may be higher than those assuming no sale. This occurs when the sale would have produced a capital loss. The calculation assumes that the investor received a tax deduction for the loss.)
The table shows returns for Investor Shares only; returns for other share classes will differ. Please note that your actual after-tax returns will depend on your tax situation and may differ from those shown. Also note that if you own the fund in a tax-deferred account, such as an individual retirement account or a 401(k) plan, this information does not apply to you. Such accounts are not subject to current taxes.
Finally, keep in mind that a fund’s performance—whether before or after taxes—does not guarantee future results.
Average Annual Total Returns: U.S. Stock Index Funds Mid-Capitalization Portfolios
Periods Ended December 31, 2015
| | | |
| | One | Five | Ten |
| | Year | Years | Years |
| Extended Market Index Fund Investor Shares | | | |
| Returns Before Taxes | -3.39% | 10.31% | 7.64% |
| Returns After Taxes on Distributions | -3.73 | 9.99 | 7.36 |
| Returns After Taxes on Distributions and Sale of Fund Shares | -1.76 | 8.13 | 6.15 |
| |
| | One | Five | Ten |
| | Year | Years | Years |
| Mid-Cap Index Fund Investor Shares | | | |
| Returns Before Taxes | -1.46% | 11.37% | 7.76% |
| Returns After Taxes on Distributions | -1.79 | 11.08 | 7.50 |
| Returns After Taxes on Distributions and Sale of Fund Shares | -0.60 | 9.04 | 6.28 |
| |
| | | | Since |
| | One | Five | Inception |
| | Year | Years | (8/24/2006) |
| Mid-Cap Growth Index Fund Investor Shares | | | |
| Returns Before Taxes | -1.13% | 10.50% | 8.00% |
| Returns After Taxes on Distributions | -1.32 | 10.36 | 7.90 |
| Returns After Taxes on Distributions and Sale of Fund Shares | -0.54 | 8.34 | 6.50 |
92
Average Annual Total Returns: U.S. Stock Index Funds Mid-Capitalization Portfolios
Periods Ended December 31, 2015
| | | |
| | | | Since |
| | One | Five | Inception |
| | Year | Years | (8/24/2006) |
| Mid-Cap Value Index Fund Investor Shares | | | |
| Returns Before Taxes | -1.91% | 12.11% | 7.80% |
| Returns After Taxes on Distributions | -2.38 | 11.69 | 7.39 |
| Returns After Taxes on Distributions and Sale of Fund Shares | -0.75 | 9.64 | 6.25 |
93
About Your Fund’s Expenses
As a shareholder of the fund, you incur ongoing costs, which include costs for portfolio management, administrative services, and shareholder reports (like this one), among others. Operating expenses, which are deducted from a fund’s gross income, directly reduce the investment return of the fund.
A fund’s expenses are expressed as a percentage of its average net assets. This figure is known as the expense ratio. The following examples are intended to help you understand the ongoing costs (in dollars) of investing in your fund and to compare these costs with those of other mutual funds. The examples are based on an investment of $1,000 made at the beginning of the period shown and held for the entire period.
The accompanying table illustrates your fund’s costs in two ways:
• Based on actual fund return. This section helps you to estimate the actual expenses that you paid over the period. The ”Ending Account Value“ shown is derived from the fund‘s actual return, and the third column shows the dollar amount that would have been paid by an investor who started with $1,000 in the fund. You may use the information here, together with the amount you invested, to estimate the expenses that you paid over the period.
To do so, simply divide your account value by $1,000 (for example, an $8,600 account value divided by $1,000 = 8.6), then multiply the result by the number given for your fund under the heading ”Expenses Paid During Period.“
• Based on hypothetical 5% yearly return. This section is intended to help you compare your fund‘s costs with those of other mutual funds. It assumes that the fund had a yearly return of 5% before expenses, but that the expense ratio is unchanged. In this case—because the return used is not the fund’s actual return—the results do not apply to your investment. The example is useful in making comparisons because the Securities and Exchange Commission requires all mutual funds to calculate expenses based on a 5% return. You can assess your fund’s costs by comparing this hypothetical example with the hypothetical examples that appear in shareholder reports of other funds.
Note that the expenses shown in the table are meant to highlight and help you compare ongoing costs only and do not reflect transaction costs incurred by the fund for buying and selling securities. Further, the expenses do not include any purchase, redemption, or account service fees described in the fund prospectus. If such fees were applied to your account, your costs would be higher. Your fund does not carry a “sales load.”
The calculations assume no shares were bought or sold during the period. Your actual costs may have been higher or lower, depending on the amount of your investment and the timing of any purchases or redemptions.
You can find more information about the fund’s expenses, including annual expense ratios, in the Financial Statements section of this report. For additional information on operating expenses and other shareholder costs, please refer to your fund’s current prospectus.
94
| | | |
| Six Months Ended December 31, 2015 | | | |
| | Beginning | Ending | Expenses |
| | Account Value | Account Value | Paid During |
| | 6/30/2015 | 12/31/2015 | Period |
| Based on Actual Fund Return | | | |
| Extended Market Index Fund | | | |
| Investor Shares | $1,000.00 | $922.12 | $1.11 |
| ETF Shares | 1,000.00 | 922.74 | 0.44 |
| Admiral Shares | 1,000.00 | 922.67 | 0.48 |
| Institutional Shares | 1,000.00 | 922.85 | 0.39 |
| Institutional Plus Shares | 1,000.00 | 922.91 | 0.24 |
| Mid-Cap Index Fund | | | |
| Investor Shares | $1,000.00 | $956.93 | $0.94 |
| ETF Shares | 1,000.00 | 957.35 | 0.44 |
| Admiral Shares | 1,000.00 | 957.37 | 0.44 |
| Institutional Shares | 1,000.00 | 957.30 | 0.39 |
| Institutional Plus Shares | 1,000.00 | 957.56 | 0.30 |
| Mid-Cap Growth Index Fund | | | |
| Investor Shares | $1,000.00 | $943.50 | $0.93 |
| ETF Shares | 1,000.00 | 944.05 | 0.44 |
| Admiral Shares | 1,000.00 | 944.07 | 0.39 |
| Mid-Cap Value Index Fund | | | |
| Investor Shares | $1,000.00 | $968.87 | $0.94 |
| ETF Shares | 1,000.00 | 969.32 | 0.45 |
| Admiral Shares | 1,000.00 | 969.38 | 0.45 |
95
| | | |
| Six Months Ended December 31, 2015 | | | |
| | Beginning | Ending | Expenses |
| | Account Value | Account Value | Paid During |
| | 6/30/2015 | 12/31/2015 | Period |
| Based on Hypothetical 5% Yearly Return | | | |
| Extended Market Index Fund | | | |
| Investor Shares | $1,000.00 | $1,024.05 | $1.17 |
| ETF Shares | 1,000.00 | 1,024.75 | 0.46 |
| Admiral Shares | 1,000.00 | 1,024.70 | 0.51 |
| Institutional Shares | 1,000.00 | 1,024.80 | 0.41 |
| Institutional Plus Shares | 1,000.00 | 1,024.95 | 0.26 |
| Mid-Cap Index Fund | | | |
| Investor Shares | $1,000.00 | $1,024.25 | $0.97 |
| ETF Shares | 1,000.00 | 1,024.75 | 0.46 |
| Admiral Shares | 1,000.00 | 1,024.75 | 0.46 |
| Institutional Shares | 1,000.00 | 1,024.80 | 0.41 |
| Institutional Plus Shares | 1,000.00 | 1,024.90 | 0.31 |
| Mid-Cap Growth Index Fund | | | |
| Investor Shares | $1,000.00 | $1,024.25 | $0.97 |
| ETF Shares | 1,000.00 | 1,024.75 | 0.46 |
| Admiral Shares | 1,000.00 | 1,024.80 | 0.41 |
| Mid-Cap Value Index Fund | | | |
| Investor Shares | $1,000.00 | $1,024.25 | $0.97 |
| ETF Shares | 1,000.00 | 1,024.75 | 0.46 |
| Admiral Shares | 1,000.00 | 1,024.75 | 0.46 |
The calculations are based on expenses incurred in the most recent six-month period. The funds’ annualized six-month expense ratios for that period are: for the Extended Market Index Fund, 0.23% for Investor Shares, 0.09% for ETF Shares, 0.10% for Admiral Shares, 0.08% for Institutional Shares, and 0.05% for Institutional Plus Shares; for the Mid-Cap Index Fund, 0.19% for Investor Shares, 0.09% for ETF Shares, 0.09% for Admiral Shares, 0.08% for Institutional Shares, and 0.06% for Institutional Plus Shares; for the Mid-Cap Growth Index Fund, 0.19% for Investor Shares, 0.09% for ETF Shares, and 0.08% for Admiral Shares; and for the Mid-Cap Value Index Fund, 0.19% for Investor Shares, 0.09% for ETF Shares, and 0.09% for Admiral Shares. The dollar amounts shown as “Expenses Paid” are equal to the annualized expense ratio multiplied by the average account value over the period, multiplied by the number of days in the most recent six-month period, then divided by the number of days in the most recent 12-month period (184/365).
96
Glossary
30-Day SEC Yield. A fund’s 30-day SEC yield is derived using a formula specified by the U.S. Securities and Exchange Commission. Under the formula, data related to the fund’s security holdings in the previous 30 days are used to calculate the fund’s hypothetical net income for that period, which is then annualized and divided by the fund’s estimated average net assets over the calculation period. For the purposes of this calculation, a security’s income is based on its current market yield to maturity (for bonds), its actual income (for asset-backed securities), or its projected dividend yield (for stocks). Because the SEC yield represents hypothetical annualized income, it will differ—at times significantly—from the fund’s actual experience. As a result, the fund’s income distributions may be higher or lower than implied by the SEC yield.
Beta. A measure of the magnitude of a fund’s past share-price fluctuations in relation to the ups and downs of a given market index. The index is assigned a beta of 1.00. Compared with a given index, a fund with a beta of 1.20 typically would have seen its share price rise or fall by 12% when the index rose or fell by 10%. For this report, beta is based on returns over the past 36 months for both the fund and the index. Note that a fund’s beta should be reviewed in conjunction with its R-squared (see definition). The lower the R-squared, the less correlation there is between the fund and the index, and the less reliable beta is as an indicator of volatility.
Dividend Yield. Dividend income earned by stocks, expressed as a percentage of the aggregate market value (or of net asset value, for a fund). The yield is determined by dividing the amount of the annual dividends by the aggregate value (or net asset value) at the end of the period. For a fund, the dividend yield is based solely on stock holdings and does not include any income produced by other investments.
Earnings Growth Rate. The average annual rate of growth in earnings over the past five years for the stocks now in a fund.
Equity Exposure. A measure that reflects a fund’s investments in stocks and stock futures. Any holdings in short-term reserves are excluded.
Expense Ratio. A fund’s total annual operating expenses expressed as a percentage of the fund’s average net assets. The expense ratio includes management and administrative expenses, but does not include the transaction costs of buying and selling portfolio securities.
Foreign Holdings. The percentage of a fund represented by securities or depositary receipts of companies based outside the United States.
Inception Date. The date on which the assets of a fund (or one of its share classes) are first invested in accordance with the fund’s investment objective. For funds with a subscription period, the inception date is the day after that period ends. Investment performance is measured from the inception date.
Median Market Cap. An indicator of the size of companies in which a fund invests; the midpoint of market capitalization (market price x shares outstanding) of a fund’s stocks, weighted by the proportion of the fund’s assets invested in each stock. Stocks representing half of the fund’s assets have market capitalizations above the median, and the rest are below it.
Price/Book Ratio. The share price of a stock divided by its net worth, or book value, per share. For a fund, the weighted average price/book ratio of the stocks it holds.
97
Price/Earnings Ratio. The ratio of a stock’s current price to its per-share earnings over the past year. For a fund, the weighted average P/E of the stocks it holds. P/E is an indicator of market expectations about corporate prospects; the higher the P/E, the greater the expectations for a company’s future growth.
R-Squared. A measure of how much of a fund’s past returns can be explained by the returns from the market in general, as measured by a given index. If a fund’s total returns were precisely synchronized with an index’s returns, its R-squared would be 1.00. If the fund’s returns bore no relationship to the index’s returns, its R-squared would be 0. For this report, R-squared is based on returns over the past 36 months for both the fund and the index.
Return on Equity. The annual average rate of return generated by a company during the past five years for each dollar of shareholder’s equity (net income divided by shareholder’s equity). For a fund, the weighted average return on equity for the companies whose stocks it holds.
Short-Term Reserves. The percentage of a fund invested in highly liquid, short-term securities that can be readily converted to cash.
Turnover Rate. An indication of the fund’s trading activity. Funds with high turnover rates incur higher transaction costs and may be more likely to distribute capital gains (which may be taxable to investors). The turnover rate excludes in-kind transactions, which have minimal impact on costs.
Benchmark Information
Spliced Mid-Cap Growth Index: MSCI US Mid Cap Growth Index through April 16, 2013; CRSP US Mid Cap Growth Index thereafter.
Spliced Mid-Cap Index: S&P MidCap 400 Index through May 16, 2003; MSCI US Mid Cap 450 Index through January 30, 2013; CRSP US Mid Cap Index thereafter.
Spliced Mid-Cap Value Index: MSCI US Mid Cap Value Index through April 16, 2013; CRSP US Mid Cap Value Index thereafter.
98
This page intentionally left blank.
The People Who Govern Your Fund
The trustees of your mutual fund are there to see that the fund is operated and managed in your best interests since, as a shareholder, you are a part owner of the fund. Your fund’s trustees also serve on the board of directors of The Vanguard Group, Inc., which is owned by the Vanguard funds and provides services to them on an at-cost basis.
A majority of Vanguard’s board members are independent, meaning that they have no affiliation with Vanguard or the funds they oversee, apart from the sizable personal investments they have made as private individuals. The independent board members have distinguished backgrounds in business, academia, and public service. Each of the trustees and executive officers oversees 194 Vanguard funds.
The following table provides information for each trustee and executive officer of the fund. More information about the trustees is in the Statement of Additional Information, which can be obtained, without charge, by contacting Vanguard at 800-662-7447, or online at vanguard.com.
InterestedTrustee1
F. William McNabb III
Born 1957. Trustee Since July 2009. Chairman of the Board. Principal Occupation(s) During the Past Five Years and Other Experience: Chairman of the Board of The Vanguard Group, Inc., and of each of the investment companies served by The Vanguard Group, since January 2010; Director of The Vanguard Group since 2008; Chief Executive Officer and President of The Vanguard Group, and of each of the investment companies served by The Vanguard Group, since 2008; Director of Vanguard Marketing Corporation; Managing Director of The Vanguard Group (1995–2008).
IndependentTrustees
Emerson U. Fullwood
Born 1948. Trustee Since January 2008. Principal Occupation(s) During the Past Five Years and Other Experience: Executive Chief Staff and Marketing Officer for North America and Corporate Vice President (retired 2008) of Xerox Corporation (document management products and services); Executive in Residence and 2009–2010 Distinguished Minett Professor at the Rochester Institute of Technology; Director of SPX Corporation (multi-industry manufacturing), the United Way of Rochester, the University of Rochester Medical Center, Monroe Community College Foundation, and North Carolina A&T University.
Rajiv L. Gupta
Born 1945. Trustee Since December 2001.2 Principal Occupation(s) During the Past Five Years and Other Experience: Chairman and Chief Executive Officer (retired 2009) and President (2006–2008) of Rohm and Haas Co. (chemicals); Director of Tyco International PLC (diversified manufacturing and services), Hewlett-Packard Co. (electronic computer manufacturing), and Delphi Automotive PLC (automotive components); Senior Advisor at New Mountain Capital.
Amy Gutmann
Born 1949. Trustee Since June 2006. Principal Occupation(s) During the Past Five Years and Other Experience: President of the University of Pennsylvania; Christopher H. Browne Distinguished Professor of Political Science, School of Arts and Sciences, and Professor of Communication, Annenberg School for Communication, with secondary faculty appointments in the Department of Philosophy, School of Arts and Sciences, and at the Graduate School of Education, University of Pennsylvania; Trustee of the National Constitution Center; Chair of the Presidential Commission for the Study of Bioethical Issues.
JoAnn Heffernan Heisen
Born 1950. Trustee Since July 1998. Principal Occupation(s) During the Past Five Years and Other Experience: Corporate Vice President and Chief Global Diversity Officer (retired 2008) and Member of the Executive Committee (1997–2008) of Johnson & Johnson (pharmaceuticals/medical devices/consumer products); Director of Skytop Lodge Corporation (hotels) and the Robert Wood Johnson Foundation; Member of the Advisory Board of the Institute for Women’s Leadership at Rutgers University.
F. Joseph Loughrey
Born 1949. Trustee Since October 2009. Principal Occupation(s) During the Past Five Years and Other Experience: President and Chief Operating Officer (retired 2009) of Cummins Inc. (industrial machinery); Chairman of the Board of Hillenbrand, Inc. (specialized consumer services), and of Oxfam America; Director of SKF AB (industrial machinery), Hyster-Yale Materials Handling, Inc. (forklift trucks), the Lumina Foundation for Education, and the V Foundation for Cancer Research; Member of the Advisory Council for the College of Arts and Letters and of the Advisory Board to the Kellogg Institute for International Studies, both at the University of Notre Dame.
Mark Loughridge
Born 1953. Trustee Since March 2012. Principal Occupation(s) During the Past Five Years and Other Experience: Senior Vice President and Chief Financial Officer (retired 2013) at IBM (information technology services); Fiduciary Member of IBM’s Retirement Plan Committee (2004–2013); Director of the Dow Chemical Company; Member of the Council on Chicago Booth.
Scott C. Malpass
Born 1962. Trustee Since March 2012. Principal Occupation(s) During the Past Five Years and Other Experience: Chief Investment Officer and Vice President at the University of Notre Dame; Assistant Professor of Finance at the Mendoza College of Business at Notre Dame; Member of the Notre Dame 403(b) Investment Committee; Board Member of TIFF Advisory Services, Inc., and Catholic Investment Services, Inc. (investment advisors); Member of the Investment Advisory Committee of Major League Baseball.
André F. Perold
Born 1952. Trustee Since December 2004. Principal Occupation(s) During the Past Five Years and Other Experience: George Gund Professor of Finance and Banking, Emeritus at the Harvard Business School (retired 2011); Chief Investment Officer and Managing Partner of HighVista Strategies LLC (private investment firm); Director of Rand Merchant Bank; Overseer of the Museum of Fine Arts Boston.
Peter F. Volanakis
Born 1955. Trustee Since July 2009. Principal Occupation(s) During the Past Five Years and Other Experience: President and Chief Operating Officer (retired 2010) of Corning Incorporated (communications equipment); Trustee of Colby-Sawyer College; Member of the Advisory Board of the Norris Cotton Cancer Center and of the Advisory Board of the Parthenon Group (strategy consulting).
Executive Officers
Glenn Booraem
Born 1967. Treasurer Since May 2015. Principal Occupation(s) During the Past Five Years and Other Experience: Principal of The Vanguard Group, Inc.; Treasurer of each of the investment companies served by The Vanguard Group; Controller of each of the investment companies served by The Vanguard Group (2010–2015); Assistant Controller of each of the investment companies served by The Vanguard Group (2001–2010).
Thomas J. Higgins
Born 1957. Chief Financial Officer Since September 2008. Principal Occupation(s) During the Past Five Years and Other Experience: Principal of The Vanguard Group, Inc.; Chief Financial Officer of each of the investment companies served by The Vanguard Group; Treasurer of each of the investment companies served by The Vanguard Group (1998–2008).
Peter Mahoney
Born 1974. Controller Since May 2015. Principal Occupation(s) During the Past Five Years and Other Experience: Head of Global Fund Accounting at The Vanguard Group, Inc.; Controller of each of the investment companies served by The Vanguard Group; Head of International Fund Services at The Vanguard Group (2008–2014).
Heidi Stam
Born 1956. Secretary Since July 2005. Principal Occupation(s) During the Past Five Years and Other Experience: Managing Director of The Vanguard Group, Inc.; General Counsel of The Vanguard Group; Secretary of The Vanguard Group and of each of the investment companies served by The Vanguard Group; Director and Senior Vice President of Vanguard Marketing Corporation.
Vanguard Senior Management Team
Mortimer J. Buckley
Kathleen C. Gubanich
Paul A. Heller
Martha G. King
John T. Marcante
Chris D. McIsaac
James M. Norris
Thomas M. Rampulla
Glenn W. Reed
Karin A. Risi
Chairman Emeritus and Senior Advisor
John J. Brennan
Chairman, 1996–2009
Chief Executive Officer and President, 1996–2008
Founder John C. Bogle
Chairman and Chief Executive Officer, 1974–1996
1 Mr. McNabb is considered an “interested person,” as defined in the Investment Company Act of 1940, because he is an officer of the Vanguard funds.
2 December 2002 for Vanguard Equity Income Fund, the Vanguard Municipal Bond Funds, and the Vanguard State Tax-Exempt Funds.
 |
| P.O. Box 2600 |
| Valley Forge, PA 19482-2600 |
Connect with Vanguard® > vanguard.com
| |
| Fund Information > 800-662-7447 | The index is a product of S&P Dow Jones Indices LLC |
| Direct Investor Account Services > 800-662-2739 | (“SPDJI”), and has been licensed for use by Vanguard. |
| | Standard & Poor’s® and S&P® are registered |
| Institutional Investor Services > 800-523-1036 | trademarks of Standard & Poor’s Financial Services LLC |
| Text Telephone for People | (“S&P”); Dow Jones® is a registered trademark of Dow |
| Who Are Deaf or Hard of Hearing> 800-749-7273 | Jones Trademark Holdings LLC (“Dow Jones”); S&P® |
| | and S&P 500® are trademarks of S&P; and these |
| This material may be used in conjunction | trademarks have been licensed for use by SPDJI and |
| with the offering of shares of any Vanguard | sublicensed for certain purposes by Vanguard. |
| fund only if preceded or accompanied by | Vanguard product(s) are not sponsored, endorsed, sold |
| | or promoted by SPDJI, Dow Jones, S&P, or their |
| the fund’s current prospectus. | respective affiliates and none of such parties make any |
| All comparative mutual fund data are from Lipper, a | representation regarding the advisability of investing in |
| Thomson Reuters Company, or Morningstar, Inc., unless | such product(s) nor do they have any liability for any |
| otherwise noted. | errors, omissions, or interruptions of the index. |
| |
| You can obtain a free copy of Vanguard’s proxy voting | |
| guidelines by visiting vanguard.com/proxyreporting or by | |
| calling Vanguard at 800-662-2739. The guidelines are | |
| also available from the SEC’s website, sec.gov. In | |
| addition, you may obtain a free report on how your fund | |
| voted the proxies for securities it owned during the 12 | |
| months ended June 30. To get the report, visit either | |
| vanguard.com/proxyreporting or sec.gov. | |
| |
| You can review and copy information about your fund at | |
| the SEC’s Public Reference Room in Washington, D.C. To | |
| find out more about this public service, call the SEC at | |
| 202-551-8090. Information about your fund is also | |
| available on the SEC’s website, and you can receive | |
| copies of this information, for a fee, by sending a | |
| request in either of two ways: via email addressed to | |
| publicinfo@sec.gov or via regular mail addressed to the | |
| Public Reference Section, Securities and Exchange | |
| Commission, Washington, DC 20549-1520. | |
| |
| | © 2016 The Vanguard Group, Inc. |
| | All rights reserved. |
| | Vanguard Marketing Corporation, Distributor. |
| |
| | Q980 022016 |

Annual Report | December 31, 2015
Vanguard U.S. Stock Index Funds
Large-Capitalization Portfolios
Vanguard Growth Index Fund
Vanguard Value Index Fund
Vanguard Large-Cap Index Fund
Vanguard’s Principles for Investing Success
We want to give you the best chance of investment success. These principles, grounded in Vanguard’s research and experience, can put you on the right path.
Goals. Create clear, appropriate investment goals.
Balance. Develop a suitable asset allocation using broadly diversified funds. Cost. Minimize cost.
Discipline. Maintain perspective and long-term discipline.
A single theme unites these principles: Focus on the things you can control.
We believe there is no wiser course for any investor.
| |
| Contents | |
| Your Fund’s Total Returns. | 1 |
| Chairman’s Letter. | 4 |
| Growth Index Fund. | 11 |
| Value Index Fund. | 32 |
| Large-Cap Index Fund. | 53 |
| Your Fund’s After-Tax Returns. | 79 |
| About Your Fund’s Expenses. | 80 |
| Glossary. | 83 |
Please note: The opinions expressed in this report are just that—informed opinions. They should not be considered promises or advice. Also, please keep in mind that the information and opinions cover the period through the date on the front of this report. Of course, the risks of investing in your fund are spelled out in the prospectus.
See the Glossary for definitions of investment terms used in this report.
About the cover: Pictured is a sailing block on the Brilliant, a 1932 schooner docked in Mystic, Connecticut. A type of pulley, the sailing block helps coordinate the setting of the sails. At Vanguard, the intricate coordination of technology and people allows us to help millions of clients around the world reach their financial goals.
| |
| Your Fund’s Total Returns | |
| |
| |
| |
| |
| Fiscal Year Ended December 31, 2015 | |
| | Total |
| | Returns |
| Vanguard Growth Index Fund | |
| Investor Shares | 3.17% |
| ETF Shares | |
| Market Price | 3.30 |
| Net Asset Value | 3.32 |
| Admiral™ Shares | 3.30 |
| Institutional Shares | 3.33 |
| CRSP US Large Cap Growth Index | 3.38 |
| Large-Cap Growth Funds Average | 4.89 |
| Large-Cap Growth Funds Average: Derived from data provided by Lipper, a Thomson Reuters Company. | |
| Vanguard Value Index Fund | |
| Investor Shares | -1.03% |
| ETF Shares | |
| Market Price | -0.92 |
| Net Asset Value | -0.89 |
| Admiral Shares | -0.86 |
| Institutional Shares | -0.85 |
| CRSP US Large Cap Value Index | -0.86 |
| Large-Cap Value Funds Average | -4.16 |
Large-Cap Value Funds Average: Derived from data provided by Lipper, a Thomson Reuters Company.
Admiral Shares carry lower expenses and are available to investors who meet certain account-balance requirements. Institutional Shares are available to certain institutional investors who meet specific administrative, service, and account-size criteria. The Vanguard ETF® Shares shown are traded on the NYSE Arca exchange and are available only through brokers. The table provides ETF returns based on both the NYSE Arca market price and the net asset value for a share. U.S. Pat. Nos. 6,879,964; 7,337,138; 7,720,749; 7,925,573; 8,090,646; and 8,417,623.
1
| |
| Your Fund’s Total Returns | |
| |
| |
| |
| |
| Fiscal Year Ended December 31, 2015 | |
| | Total |
| | Returns |
| Vanguard Large-Cap Index Fund | |
| Investor Shares | 0.93% |
| ETF Shares | |
| Market Price | 1.05 |
| Net Asset Value | 1.07 |
| Admiral Shares | 1.07 |
| Institutional Shares | 1.07 |
| CRSP US Large Cap Index | 1.11 |
| Large-Cap Core Funds Average | -0.66 |
Large-Cap Core Funds Average: Derived from data provided by Lipper, a Thomson Reuters Company.
Admiral Shares carry lower expenses and are available to investors who meet certain account-balance requirements. Institutional Shares are available to certain institutional investors who meet specific administrative, service, and account-size criteria. The Vanguard ETF® Shares shown are traded on the NYSE Arca exchange and are available only through brokers. The table provides ETF returns based on both the NYSE Arca market price and the net asset value for a share. U.S. Pat. Nos. 6,879,964; 7,337,138; 7,720,749; 7,925,573; 8,090,646; and 8,417,623.
For the ETF Shares, the market price is determined by the midpoint of the bid-offer spread as of the closing time of the New York Stock Exchange (generally 4 p.m., Eastern time). The net asset value is also determined as of the NYSE closing time. For more information about how the ETF Shares' market prices have compared with their net asset value, visit vanguard.com, select your ETF, and then select the Price and Performance tab. The ETF premium/discount analysis there shows the percentages of days on which the ETF Shares' market price was above or below the NAV.
2
| | | | |
| Your Fund’s Performance at a Glance | | | |
| |
| |
| |
| |
| December 31, 2014, Through December 31, 2015 | | | | |
| | | | Distributions Per Share |
| | Starting | Ending | | |
| | Share | Share | Income | Capital |
| | Price | Price | Dividends | Gains |
| Vanguard Growth Index Fund | | | | |
| Investor Shares | $53.71 | $54.78 | $0.636 | $0.000 |
| ETF Shares | 104.33 | 106.40 | 1.388 | 0.000 |
| Admiral Shares | 53.71 | 54.77 | 0.715 | 0.000 |
| Institutional Shares | 53.70 | 54.77 | 0.720 | 0.000 |
| Vanguard Value Index Fund | | | | |
| Investor Shares | $32.95 | $31.82 | $0.782 | $0.000 |
| ETF Shares | 84.45 | 81.56 | 2.123 | 0.000 |
| Admiral Shares | 32.94 | 31.82 | 0.828 | 0.000 |
| Institutional Shares | 32.94 | 31.82 | 0.831 | 0.000 |
| Vanguard Large-Cap Index Fund | | | | |
| Investor Shares | $38.12 | $37.78 | $0.694 | $0.000 |
| ETF Shares | 94.36 | 93.52 | 1.831 | 0.000 |
| Admiral Shares | 47.65 | 47.23 | 0.926 | 0.000 |
| Institutional Shares | 196.14 | 194.40 | 3.824 | 0.000 |
3

Chairman’s Letter
Dear Shareholder,
The year ended December 31, 2015, was a tumultuous one for the world’s financial markets. Not immune to the volatility, the broad U.S. stock market navigated a bumpy road to modest gains. Growth stocks outpaced their value counterparts, while large-capitalization stocks exceeded mid-caps and small-caps.
In this investment environment, Vanguard’s three large-capitalization U.S. index funds produced varying results. Vanguard Growth Index Fund returned 3.17%, while Vanguard Value Index Fund returned –1.03%. Vanguard Large-Cap Index Fund, which holds both growth and value stocks, returned 0.93%. (All returns are for the funds’ Investor Shares.) Each fund closely tracked its target index for the fiscal year.
If you hold any of these funds in a taxable account, you may wish to review the table of after-tax returns that appears later in this report.
Despite troubles, U.S. stocks eked out a seventh year of gains
U.S. stocks returned 0.48% for the 12 months ended December 31, 2015. Although the broad market recorded its worst performance since 2008, it still posted gains for the seventh straight calendar year when dividends are factored into returns.
4
Stocks rose modestly over the first half of the year but slid in August and September as concerns mounted that China’s economic slowdown would spread globally. Falling oil and commodity prices also affected economies and markets across the world for better or worse. Central banks in Europe and Asia bolstered their stimulus efforts against weak growth and low inflation. And in December, the Federal Reserve ended months of uncertainty when it raised the target for short-term interest rates to 0.25%–0.5%.
International stocks returned about –5%, restrained by the U.S. dollar’s strength against many foreign currencies. Emerging markets fared the worst.
U.S. bonds ended the year with a slender advance
The broad U.S. taxable bond market gained 0.55% over the 12 months; income accounted for the modestly positive result. The yield of the 10-year Treasury note ended December at 2.30%, up from 2.19% a year earlier. (Bond prices and yields move in opposite directions.)
Investors focused on the Fed’s stance on short-term interest rates and alternately embraced or avoided safe-haven assets depending on the stock market’s strength.
International bond markets (as measured by the Barclays Global Aggregate Index ex USD) returned –6.02%, reduced by
| | | |
| Market Barometer | | | |
| |
| | | Average Annual Total Returns |
| | | Periods Ended December 31, 2015 |
| | One | Three | Five |
| | Year | Years | Years |
| Stocks | | | |
| Russell 1000 Index (Large-caps) | 0.92% | 15.01% | 12.44% |
| Russell 2000 Index (Small-caps) | -4.41 | 11.65 | 9.19 |
| Russell 3000 Index (Broad U.S. market) | 0.48 | 14.74 | 12.18 |
| FTSE All-World ex US Index (International) | -4.72 | 2.04 | 1.48 |
| |
| Bonds | | | |
| Barclays U.S. Aggregate Bond Index (Broad taxable market) | 0.55% | 1.44% | 3.25% |
| Barclays Municipal Bond Index (Broad tax-exempt market) | 3.30 | 3.16 | 5.35 |
| Citigroup Three-Month U.S. Treasury Bill Index | 0.03 | 0.02 | 0.04 |
| |
| CPI | | | |
| Consumer Price Index | 0.73% | 1.00% | 1.53% |
5
the dollar’s strength against many foreign currencies. Without this currency effect, returns were modestly positive.
Although the Fed raised its target for short-term interest rates in mid-December, returns for money market funds and savings accounts remained limited by the 0%–0.25% levels in place for much of the past seven years.
Gains in some sectors were offset by energy’s double-digit decline
Vanguard’s three large-cap index funds provide exposure to some of the United States’ biggest companies. Investors can invest broadly in the large-cap market through the Large-Cap Index Fund, or focus specifically on large-cap growth or value stocks through one of the other two funds.
As I mentioned earlier, growth stocks trumped their value counterparts for the 12 months. The performance of Vanguard’s large-cap index funds mirrored this broad market trend, with the Growth Index Fund outpacing the Value Index Fund by several percentage points. Results by sector were mixed, and the performance of a few sectors varied between the funds.
For the most part the U.S. economy grew, boosted by shoppers’ overall confidence and their willingness and ability to spend. This trend benefited the consumer
| | | | | |
| Expense Ratios | | | | | |
| Your Fund Compared With Its Peer Group | | | | | |
| |
| | Investor | ETF | Admiral | Institutional | Peer Group |
| | Shares | Shares | Shares | Shares | Average |
| Growth Index Fund | 0.23% | 0.09% | 0.09% | 0.08% | 1.21% |
| Value Index Fund | 0.23 | 0.09 | 0.09 | 0.08 | 1.13 |
| Large-Cap Index Fund | 0.23 | 0.09 | 0.09 | 0.08 | 1.12 |
The fund expense ratios shown are from the prospectus dated April 28, 2015, and represent estimated costs for the current fiscal year. For the fiscal year ended December 31, 2015, the funds’ expense ratios were: for the Growth Index Fund, 0.22% for Investor Shares, 0.08% for ETF Shares, 0.08% for Admiral Shares, and 0.07% for Institutional Shares; for the Value Index Fund, 0.22% for Investor Shares, 0.08% for ETF Shares, 0.08% for Admiral Shares, and 0.07% for Institutional Shares; and for the Large-Cap Index Fund, 0.20% for Investor Shares, 0.08% for ETF Shares, 0.08% for Admiral Shares, and 0.07% for Institutional Shares. The peer-group expense ratios are derived from data provided by Lipper, a Thomson Reuters Company, and capture information through year-end 2014.
Peer groups: For the Growth Index Fund, Large-Cap Growth Funds; for the Value Index Fund, Large-Cap Value Funds; and for the Large-Cap Index Fund, Large-Cap Core Funds.
6
services and consumer goods sectors. Consumer services was the top performer in both the Growth Index Fund and the Large-Cap Index Fund, with internet retailers, home improvement stores, and restaurants generally leading the way. (The sector posted a negative result for the Value Index Fund.) Within the consumer goods sector, tobacco and beverage companies did very well in each of the three funds.
Gains in the information technology and health care sectors also helped the funds’ performance; however, returns for both paled compared with those seen in some recent periods. The tiny telecommunications sector also posted a positive result for each fund.
Much of the contribution made by these sectors was erased by a double-digit decline in oil and gas, which was the most significant detractor in all three funds by a wide margin. The lengthy and sharp slide of oil prices punished the sector, in part because of high production levels from some leading oil-producing countries and concerns about the slower growth in China, the world’s largest oil importer. Natural
| |
| Total Returns | |
| Ten Years Ended December 31, 2015 | |
| | Average |
| | Annual Return |
| Growth Index Fund Investor Shares | 8.30% |
| Spliced Growth Index | 8.51 |
| Large-Cap Growth Funds Average | 6.95 |
| For a benchmark description, see the Glossary. | |
| Large-Cap Growth Funds Average: Derived from data provided by Lipper, a Thomson Reuters Company. | |
| |
| Value Index Fund Investor Shares | 6.33% |
| Spliced Value Index | 6.49 |
| Large-Cap Value Funds Average | 5.25 |
| For a benchmark description, see the Glossary. | |
| Large-Cap Value Funds Average: Derived from data provided by Lipper, a Thomson Reuters Company. | |
| |
| Large-Cap Index Fund Investor Shares | 7.33% |
| Spliced Large Cap Index | 7.51 |
| Large-Cap Core Funds Average | 5.91 |
| For a benchmark description, see the Glossary. | |
| Large-Cap Core Funds Average: Derived from data provided by Lipper, a Thomson Reuters Company. | |
The figures shown represent past performance, which is not a guarantee of future results. (Current performance may be lower or higher than the performance data cited. For performance data current to the most recent month-end, visit our website at vanguard.com/performance.) Note, too, that both investment returns and principal value can fluctuate widely, so an investor’s shares, when sold, could be worth more or less than their original cost.
7
gas prices also dropped, though not as dramatically. Some integrated oil and gas firms held up better than others, but most production and exploration companies suffered, as did most equipment, services, and distribution companies.
Stocks in the utilities and basic materials sectors also weighed on the funds’ returns. While the performance of financials and industrials varied among the funds, the broad market results for these sectors were negative.
The funds continue to meet their long-term objectives
Over the last ten years the three large-cap index funds recorded average annual returns ranging from 6.33% for the Value Index Fund to 8.30% for the Growth Index Fund. The Large-Cap Index Fund posted an average annual return of 7.33%.
Most important, the funds have succeeded in meeting their primary objective of closely tracking their respective indexes over the long term—no easy feat during a period that
|
| Vanguard’s outlook for investors: Not bearish, but cautious |
| |
| In Vanguard’s recently published global economic and investment outlook, Global Chief |
| Economist Joseph Davis and his team discuss various market and economic events 2016 |
| may bring, along with challenges and opportunities for investors. |
| |
| Our forecast includes “frustratingly fragile” economic growth and more modest long-term |
| returns from the global stock and bond markets. The report cautions that for the decade ending |
| 2025, returns for a balanced portfolio are likely to be moderately below historical averages. |
| |
| Our simulations indicate that the average annualized returns of a 60% equity/40% bond |
| portfolio for the decade are most likely to be centered in the 3%–5% range after inflation, |
| below the actual average after-inflation return of 5.5% for the same portfolio since 1926. |
| |
| Even so, Vanguard’s steadfast belief in its principles for investing success—focusing on clear |
| goals, a suitable asset allocation, low costs, and long-term discipline—remains unchanged. |
| |
| For more information about our expectations and the probability of various outcomes, see |
| Vanguard’s Economic and Investment Outlook, available at vanguard.com/research. |
IMPORTANT: The projections or other information generated by the Vanguard Capital Markets Model® (VCMM) regarding the likelihood of various investment outcomes are hypothetical in nature, do not reflect actual investment results, and are not guarantees of future results. Distribution of return outcomes from VCMM, derived from 10,000 simulations for U.S. equity returns and fixed income returns. Simulations as of September 30, 2015. Results from the model may vary with each use and over time. For more information, please see page 9.
8
included the worst global recession since the Great Depression. That they did so is a tribute to the experience, talent, and sophisticated systems of their advisor, Vanguard Equity Index Group. The funds’ low expenses––which allow you to keep more of the return on your investment––have helped in these efforts.
To reach your long-term goals, be realistic and try to save more
Although there have been times when it felt as if stocks and bonds were riding a roller coaster, the markets have generally risen in recent years. The broad global stock market in particular has posted some impressive gains since its turnaround began in 2009.
But 2015 served as a reminder that markets aren’t always favorable. The U.S. stock and bond markets were basically flat, and international stocks and unhedged bonds finished in the red.
In Vanguard’s recently updated long-term look at the economy and markets, our global economists explain why they expect economic growth to remain “frustratingly fragile,” and why their outlook for stock and bond markets is the most guarded since 2006. (For more details, see the box on page 8 and Vanguard’s Economic and Investment Outlook, available at vanguard.com/research.)
IMPORTANT: The projections or other information generated by the Vanguard Capital Markets Model (VCMM) regarding the likelihood of various investment outcomes are hypothetical in nature, do not reflect actual investment results, and are not guarantees of future results. VCMM results will vary with each use and over time.
The VCMM projections are based on a statistical analysis of historical data. Future returns may behave differently from the historical patterns captured in the VCMM. More important, the VCMM may be underestimating extreme negative scenarios unobserved in the historical period on which the model estimation is based.
The VCMM is a proprietary financial simulation tool developed and maintained by Vanguard’s primary investment research and advice teams. The model forecasts distributions of future returns for a wide array of broad asset classes. Those asset classes include U.S. and international equity markets, several maturities of the U.S. Treasury and corporate fixed income markets, international fixed income markets, U.S. money markets, commodities, and certain alternative investment strategies. The theoretical and empirical foundation for the VCMM is that the returns of various asset classes reflect the compensation investors require for bearing different types of systematic risk (beta). At the core of the model are estimates of the dynamic statistical relationship between risk factors and asset returns, obtained from statistical analysis based on available monthly financial and economic data from as early as 1960. Using a system of estimated equations, the model then applies a Monte Carlo simulation method to project the estimated interrelationships among risk factors and asset classes as well as uncertainty and randomness over time. The model generates a large set of simulated outcomes for each asset class over several time horizons. Forecasts are obtained by computing measures of central tendency in these simulations. Results produced by the tool will vary with each use and over time.
9
Given these muted expectations, what’s the best course of action? I’ve often encouraged shareholders to focus on the things they can control. That advice holds true today.
Consider saving more than you think you may need. That’s one way you can prepare for the volatility that may lie ahead, particularly as markets adjust to changes in policies from the Fed and other central banks.
And, as always, investors would be well-served to follow Vanguard’s principles for investing success:
• Goals. Create clear, appropriate investment goals.
• Balance. Develop a suitable asset allocation using broadly diversified funds.
• Cost. Minimize cost.
• Discipline. Maintain perspective and long-term discipline.
As with saving, each of these principles is within your control, and focusing on them can keep you on the right path.
As always, thank you for investing with Vanguard.
Sincerely,

F. William McNabb III
Chairman and Chief Executive Officer
January 11, 2016
10
| | | | |
| Growth Index Fund | | | | |
| |
| |
| Fund Profile | | | | |
| As of December 31, 2015 | | | | |
| |
| Share-Class Characteristics | | | | |
| | Investor | | Admiral | Institutional |
| | Shares | ETF Shares | Shares | Shares |
| Ticker Symbol | VIGRX | VUG | VIGAX | VIGIX |
| Expense Ratio1 | 0.23% | 0.09% | 0.09% | 0.08% |
| 30-Day SEC Yield | 1.21% | 1.35% | 1.35% | 1.37% |
| | | |
| Portfolio Characteristics | | |
| | | | DJ |
| | | | U.S. |
| | | CRSP US | Total |
| | | Large Cap | Market |
| | | Growth | FA |
| | Fund | Index | Index |
| Number of Stocks | 351 | 351 | 3,960 |
| Median Market Cap | $63.3B | $63.3B | $51.4B |
| Price/Earnings Ratio | 25.9x | 25.9x | 21.9x |
| Price/Book Ratio | 4.8x | 4.8x | 2.7x |
| Return on Equity | 21.6% | 21.1% | 17.2% |
| Earnings Growth | | | |
| Rate | 14.9% | 14.9% | 9.5% |
| Dividend Yield | 1.4% | 1.4% | 2.1% |
| Foreign Holdings | 0.0% | 0.0% | 0.0% |
| Turnover Rate | 9% | — | — |
| Short-Term | | | |
| Reserves | 0.1% | — | — |
Sector Diversification (% of equity exposure)
| | | |
| | | CRSP US | DJ |
| | | Large Cap | U.S. Total |
| | | Growth | Market |
| | Fund | Index FA | Index |
| Basic Materials | 1.0% | 1.0% | 2.3% |
| Consumer Goods | 10.3 | 10.3 | 10.3 |
| Consumer Services | 22.8 | 22.8 | 14.2 |
| Financials | 12.6 | 12.6 | 19.5 |
| Health Care | 15.1 | 15.1 | 14.0 |
| Industrials | 11.6 | 11.6 | 12.2 |
| Oil & Gas | 2.6 | 2.6 | 5.9 |
| Technology | 23.6 | 23.6 | 16.4 |
| Telecommunications | 0.3 | 0.3 | 2.2 |
| Utilities | 0.1 | 0.1 | 3.0 |
| | |
| Volatility Measures | | |
| | | DJ |
| | | U.S. Total |
| | Spliced | Market |
| | Growth Index | FA Index |
| R-Squared | 1.00 | 0.95 |
| Beta | 1.00 | 1.02 |
These measures show the degree and timing of the fund’s fluctuations compared with the indexes over 36 months.
Ten Largest Holdings (% of total net assets)
| | |
| Apple Inc. | Computer Hardware | 6.3% |
| Alphabet Inc. | Internet | 5.1 |
| Amazon.com Inc. | Broadline Retailers | 2.9 |
| Facebook Inc. | Internet | 2.6 |
| Coca-Cola Co. | Soft Drinks | 1.9 |
| Home Depot Inc. | Home Improvement | |
| | Retailers | 1.9 |
| Walt Disney Co. | Broadcasting & | |
| | Entertainment | 1.8 |
| Visa Inc. | Consumer Finance | 1.7 |
| Gilead Sciences Inc. | Biotechnology | 1.7 |
| Comcast Corp. | Broadcasting & | |
| | Entertainment | 1.6 |
| Top Ten | | 27.5% |
The holdings listed exclude any temporary cash investments and equity index products.
1 The expense ratios shown are from the prospectus dated April 28, 2015, and represent estimated costs for the current fiscal year. For the fiscal year ended December 31, 2015, the expense ratios were 0.22% for Investor Shares, 0.08% for ETF Shares, 0.08% for Admiral Shares, and 0.07% for Institutional Shares.
11
Growth Index Fund
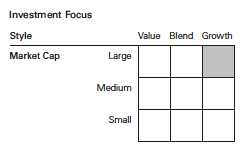
12
Growth Index Fund
Performance Summary
All of the returns in this report represent past performance, which is not a guarantee of future results that may be achieved by the fund. (Current performance may be lower or higher than the performance data cited. For performance data current to the most recent month-end, visit our website at vanguard.com/performance.) Note, too, that both investment returns and principal value can fluctuate widely, so an investor’s shares, when sold, could be worth more or less than their original cost. The returns shown do not reflect taxes that a shareholder would pay on fund distributions or on the sale of fund shares.
Cumulative Performance: December 31, 2005, Through December 31, 2015
Initial Investment of $10,000
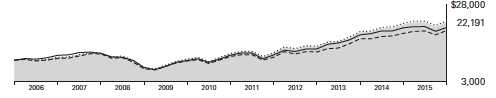
| | | | | |
| | | | Average Annual Total Returns | |
| | | Periods Ended December 31, 2015 | |
| | | | | | Final Value |
| | | One | Five | Ten | of a $10,000 |
| | | Year | Years | Years | Investment |
| | Growth Index Fund*Investor Shares | 3.17% | 12.96% | 8.30% | $22,191 |
| •••••••• | Spliced Growth Index | 3.38 | 13.21 | 8.51 | 22,632 |
| – – – – | Large-Cap Growth Funds Average | 4.89 | 11.82 | 6.95 | 19,575 |
| | Dow Jones U.S. Total Stock Market | | | | |
| | Float Adjusted Index | 0.44 | 12.14 | 7.48 | 20,563 |
| For a benchmark description, see the Glossary. | | | | |
| Large-Cap Growth Funds Average: Derived from data provided by Lipper, a Thomson Reuters Company. | | |
| |
| | | | | | Final Value |
| | | One | Five | Ten | of a $10,000 |
| | | Year | Years | Years | Investment |
| Growth Index Fund | | | | |
| ETF Shares Net Asset Value | 3.32% | 13.12% | 8.44% | $22,491 |
| Spliced Growth Index | 3.38 | 13.21 | 8.51 | 22,632 |
| Dow Jones U.S. Total Stock Market Float | | | | |
| Adjusted Index | 0.44 | 12.14 | 7.48 | 20,563 |
See Financial Highlights for dividend and capital gains information.
13
| | | | |
| Growth Index Fund | | | | |
| |
| |
| |
| | | Average Annual Total Returns | |
| | Periods Ended December 31, 2015 | |
| | | | | Final Value |
| | One | Five | Ten | of a $10,000 |
| | Year | Years | Years | Investment |
| Growth Index Fund Admiral Shares | 3.30% | 13.12% | 8.44% | $22,491 |
| Spliced Growth Index | 3.38 | 13.21 | 8.51 | 22,632 |
| Dow Jones U.S. Total Stock Market Float | | | | |
| Adjusted Index | 0.44 | 12.14 | 7.48 | 20,563 |
| | | | |
| | | | | Final Value |
| | One | Five | Ten | of a $5,000,000 |
| | Year | Years | Years | Investment |
| |
| Growth Index Fund Institutional Shares | 3.33% | 13.14% | 8.47% | $11,276,007 |
| |
| Spliced Growth Index | 3.38 | 13.21 | 8.51 | 11,316,177 |
| Dow Jones U.S. Total Stock Market Float | | | | |
| Adjusted Index | 0.44 | 12.14 | 7.48 | 10,281,716 |
| | | |
| Cumulative Returns of ETF Shares: December 31, 2005, Through December 31, 2015 | |
| | One | Five | Ten |
| | Year | Years | Years |
| Growth Index Fund ETF Shares Market Price | 3.30% | 85.21% | 124.98% |
| Growth Index Fund ETF Shares Net Asset Value | 3.32 | 85.26 | 124.91 |
| Spliced Growth Index | 3.38 | 85.97 | 126.32 |
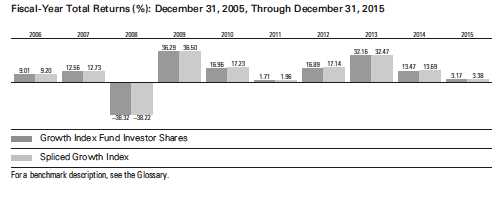
14
Growth Index Fund
Financial Statements
Statement of Net Assets
As of December 31, 2015
The fund reports a complete list of its holdings in regulatory filings four times in each fiscal year, at the quarter-ends. For the second and fourth fiscal quarters, the lists appear in the fund’s semiannual and annual reports to shareholders. For the first and third fiscal quarters, the fund files the lists with the Securities and Exchange Commission on Form N-Q. Shareholders can look up the fund’s Forms N-Q on the SEC’s website at sec.gov. Forms N-Q may also be reviewed and copied at the SEC’s Public Reference Room (see the back cover of this report for further information).
| | | |
| | | | Market |
| | | | Value• |
| | | Shares | ($000) |
| Common Stocks (99.9%)1 | | |
| Basic Materials (1.0%) | | |
| | Ecolab Inc. | 1,503,092 | 171,924 |
| | Praxair Inc. | 1,620,159 | 165,904 |
| | International Flavors & | | |
| | Fragrances Inc. | 454,112 | 54,330 |
| | Airgas Inc. | 366,678 | 50,719 |
| * | WR Grace & Co. | 399,350 | 39,771 |
| * | Axalta Coating Systems | | |
| | Ltd. | 806,726 | 21,499 |
| | Westlake Chemical Corp. | 222,305 | 12,076 |
| | | | 516,223 |
| Consumer Goods (10.3%) | | |
| | Coca-Cola Co. | 22,137,447 | 951,025 |
| | Philip Morris | | |
| | International Inc. | 8,762,510 | 770,312 |
| | NIKE Inc. Class B | 7,632,389 | 477,024 |
| | Colgate-Palmolive Co. | 5,072,837 | 337,952 |
| | Monsanto Co. | 2,487,599 | 245,078 |
| | Reynolds American Inc. | 4,849,620 | 223,810 |
| *,^ | Tesla Motors Inc. | 555,474 | 133,319 |
| | Constellation Brands Inc. | | |
| | Class A | 930,302 | 132,512 |
| * | Monster Beverage Corp. | 866,119 | 129,017 |
| | VF Corp. | 1,928,910 | 120,075 |
| * | Electronic Arts Inc. | 1,669,978 | 114,761 |
| | Estee Lauder Cos. Inc. | | |
| | Class A | 1,258,791 | 110,849 |
| | Mead Johnson Nutrition | | |
| | Co. | 1,114,895 | 88,021 |
| * | Under Armour Inc. | | |
| | Class A | 1,018,653 | 82,114 |
| | Hershey Co. | 794,909 | 70,962 |
| * | Jarden Corp. | 1,183,966 | 67,628 |
| * | Mohawk Industries Inc. | 355,548 | 67,337 |
| | Hanesbrands Inc. | 2,218,406 | 65,288 |
| | Church & Dwight Co. Inc. | 741,917 | 62,974 |
| | Hormel Foods Corp. | 747,697 | 59,128 |
| | Brown-Forman Corp. | | |
| | Class B | 586,607 | 58,238 |
| | | |
| | | | Market |
| | | | Value• |
| | | Shares | ($000) |
| | Keurig Green Mountain | | |
| | Inc. | 631,425 | 56,816 |
| | Snap-on Inc. | 328,627 | 56,337 |
| | Activision Blizzard Inc. | 1,449,045 | 56,093 |
| | BorgWarner Inc. | 1,267,081 | 54,776 |
| | McCormick & Co. Inc. | 624,552 | 53,437 |
| | Harley-Davidson Inc. | 1,084,607 | 49,230 |
| * | LKQ Corp. | 1,554,319 | 46,054 |
| | Stanley Black & Decker | | |
| | Inc. | 423,166 | 45,165 |
| * | Michael Kors Holdings | | |
| | Ltd. | 988,425 | 39,596 |
| | Harman International | | |
| | Industries Inc. | 402,710 | 37,939 |
| | Ralph Lauren Corp. | | |
| | Class A | 332,430 | 37,059 |
| * | NVR Inc. | 21,013 | 34,524 |
| | DR Horton Inc. | 990,093 | 31,713 |
| * | WABCO Holdings Inc. | 308,770 | 31,575 |
| | Polaris Industries Inc. | 351,882 | 30,244 |
| *,^ | lululemon athletica Inc. | 555,824 | 29,164 |
| | Lennar Corp. Class A | 532,437 | 26,042 |
| * | WhiteWave Foods Co. | | |
| | Class A | 498,431 | 19,394 |
| | Leucadia National Corp. | 921,840 | 16,031 |
| *,^ | Fitbit Inc. Class A | 333,535 | 9,869 |
| | Coty Inc. Class A | 288,267 | 7,388 |
| | Lennar Corp. Class B | 180 | 7 |
| | | | 5,135,877 |
| Consumer Services (22.8%) | | |
| * | Amazon.com Inc. | 2,120,995 | 1,433,559 |
| | Home Depot Inc. | 7,170,936 | 948,356 |
| | Walt Disney Co. | 8,415,047 | 884,253 |
| | Comcast Corp. Class A | 13,810,611 | 779,333 |
| | McDonald’s Corp. | 5,193,301 | 613,537 |
| | Starbucks Corp. | 7,977,904 | 478,914 |
| | Costco Wholesale Corp. | 2,473,884 | 399,532 |
| | Lowe’s Cos. Inc. | 5,232,954 | 397,914 |
| | Walgreens Boots | | |
| | Alliance Inc. | 4,618,516 | 393,290 |
| * | Priceline Group Inc. | 281,570 | 358,988 |
15
| | | |
| Growth Index Fund | | |
| |
| |
| |
| | | | Market |
| | | | Value• |
| | | Shares | ($000) |
| | Time Warner Cable Inc. | 1,601,706 | 297,261 |
| * | Netflix Inc. | 2,296,313 | 262,652 |
| | TJX Cos. Inc. | 3,623,391 | 256,935 |
| | Twenty-First Century Fox | | |
| | Inc. Class A | 7,151,030 | 194,222 |
| | Yum! Brands Inc. | 2,439,034 | 178,171 |
| | Southwest Airlines Co. | 3,678,246 | 158,385 |
| | American Airlines Group | | |
| | Inc. | 3,564,965 | 150,976 |
| | Time Warner Inc. | 2,147,786 | 138,897 |
| * | O’Reilly Automotive Inc. | 529,989 | 134,310 |
| | L Brands Inc. | 1,395,894 | 133,755 |
| * | AutoZone Inc. | 172,413 | 127,915 |
| | Ross Stores Inc. | 2,307,966 | 124,192 |
| | Dollar General Corp. | 1,583,191 | 113,784 |
| | CBS Corp. Class B | 2,370,317 | 111,713 |
| | Royal Caribbean Cruises | | |
| | Ltd. | 995,323 | 100,737 |
| | Las Vegas Sands Corp. | 2,250,729 | 98,672 |
| * | Dollar Tree Inc. | 1,261,503 | 97,413 |
| | Nielsen Holdings plc | 1,867,361 | 87,019 |
| * | Chipotle Mexican Grill Inc. | | |
| | Class A | 176,392 | 84,642 |
| | Expedia Inc. | 658,776 | 81,886 |
| *,^ | Charter Communications | | |
| | Inc. Class A | 411,812 | 75,403 |
| * | DISH Network Corp. | | |
| | Class A | 1,207,774 | 69,060 |
| * | Liberty Interactive Corp. | | |
| | QVC Group Class A | 2,512,460 | 68,640 |
| | Starwood Hotels & | | |
| | Resorts Worldwide Inc. | 956,821 | 66,289 |
| | Hilton Worldwide | | |
| | Holdings Inc. | 3,071,657 | 65,733 |
| | Tractor Supply Co. | 760,093 | 64,988 |
| | Whole Foods Market Inc. | 1,932,051 | 64,724 |
| | Carnival Corp. | 1,168,895 | 63,681 |
| * | Ulta Salon Cosmetics & | | |
| | Fragrance Inc. | 343,683 | 63,581 |
| | Marriott International Inc. | | |
| | Class A | 946,274 | 63,438 |
| * | CarMax Inc. | 1,147,339 | 61,922 |
| | Advance Auto Parts Inc. | 393,305 | 59,196 |
| * | MGM Resorts | | |
| | International | 2,548,269 | 57,897 |
| | Alaska Air Group Inc. | 714,215 | 57,501 |
| | Signet Jewelers Ltd. | 450,571 | 55,731 |
| * | TripAdvisor Inc. | 631,380 | 53,825 |
| | Twenty-First Century Fox | | |
| | Inc. | 1,954,482 | 53,221 |
| * | Norwegian Cruise Line | | |
| | Holdings Ltd. | 901,498 | 52,828 |
| | H&R Block Inc. | 1,562,321 | 52,041 |
| | Foot Locker Inc. | 788,586 | 51,329 |
| * | Sirius XM Holdings Inc. | 11,785,673 | 47,968 |
| | | |
| | | | Market |
| | | | Value• |
| | | Shares | ($000) |
| | Wyndham Worldwide | | |
| | Corp. | 656,283 | 47,679 |
| | Tiffany & Co. | 616,685 | 47,047 |
| * | IHS Inc. Class A | 385,448 | 45,649 |
| * | Bed Bath & Beyond Inc. | 896,242 | 43,244 |
| | Nordstrom Inc. | 798,014 | 39,749 |
| * | Discovery | | |
| | Communications Inc. | 1,475,091 | 37,202 |
| | FactSet Research | | |
| | Systems Inc. | 222,636 | 36,194 |
| | Williams-Sonoma Inc. | 463,113 | 27,050 |
| * | AutoNation Inc. | 437,661 | 26,111 |
| | Scripps Networks | | |
| | Interactive Inc. Class A | 428,259 | 23,644 |
| * | Discovery | | |
| | Communications Inc. | | |
| | Class A | 845,928 | 22,569 |
| * | Liberty Media Corp. | 533,884 | 20,330 |
| ^ | Wynn Resorts Ltd. | 229,671 | 15,891 |
| ^ | Gap Inc. | 632,392 | 15,620 |
| * | Hertz Global Holdings Inc. | 1,067,566 | 15,191 |
| * | Liberty Media Corp. | | |
| | Class A | 259,647 | 10,191 |
| * | Hyatt Hotels Corp. Class A | 156,780 | 7,372 |
| | CBS Corp. Class A | 2,760 | 144 |
| | | | 11,371,086 |
| Financials (12.6%) | | |
| | Visa Inc. Class A | 11,008,745 | 853,728 |
| | MasterCard Inc. Class A | 5,600,448 | 545,260 |
| | Simon Property Group Inc. | 1,749,975 | 340,265 |
| | American Tower | | |
| | Corporation | 2,395,556 | 232,249 |
| | Charles Schwab Corp. | 6,701,441 | 220,678 |
| | Public Storage | 832,437 | 206,195 |
| | BlackRock Inc. | 602,885 | 205,294 |
| | Intercontinental | | |
| | Exchange Inc. | 671,599 | 172,104 |
| | Equity Residential | 2,060,179 | 168,090 |
| | Marsh & McLennan Cos. | | |
| | Inc. | 2,950,275 | 163,593 |
| | Crown Castle | | |
| | International Corp. | 1,887,688 | 163,191 |
| | McGraw Hill Financial Inc. | 1,528,751 | 150,704 |
| | Aon plc | 1,549,169 | 142,849 |
| | AvalonBay Communities | | |
| | Inc. | 774,093 | 142,534 |
| | Welltower Inc. | 2,001,481 | 136,161 |
| | Prologis Inc. | 2,963,863 | 127,209 |
| | Boston Properties Inc. | 868,594 | 110,780 |
| | Ventas Inc. | 1,883,291 | 106,274 |
| | Equinix Inc. | 348,271 | 105,317 |
| | T. Rowe Price Group Inc. | 1,349,082 | 96,446 |
| | Vornado Realty Trust | 959,706 | 95,932 |
| | Moody’s Corp. | 950,379 | 95,361 |
| | Essex Property Trust Inc. | 373,481 | 89,415 |
| | Weyerhaeuser Co. | 2,887,725 | 86,574 |
16
| | | |
| Growth Index Fund | | |
| |
| |
| |
| | | | Market |
| | | | Value• |
| | | Shares | ($000) |
| | General Growth | | |
| | Properties Inc. | 2,994,713 | 81,486 |
| | Invesco Ltd. | 2,397,281 | 80,261 |
| | Equifax Inc. | 670,003 | 74,618 |
| | Realty Income Corp. | 1,411,642 | 72,883 |
| | Macerich Co. | 895,400 | 72,250 |
| * | Markel Corp. | 74,985 | 66,238 |
| | SL Green Realty Corp. | 564,149 | 63,738 |
| | Digital Realty Trust Inc. | 828,019 | 62,615 |
| | Extra Space Storage Inc. | 662,991 | 58,482 |
| | Federal Realty Investment | | |
| | Trust | 392,801 | 57,388 |
| | UDR Inc. | 1,481,203 | 55,649 |
| * | CBRE Group Inc. Class A | 1,605,796 | 55,528 |
| | HCP Inc. | 1,314,608 | 50,271 |
| * | E*TRADE Financial Corp. | 1,656,075 | 49,086 |
| * | Affiliated Managers | | |
| | Group Inc. | 305,816 | 48,857 |
| | TD Ameritrade Holding | | |
| | Corp. | 1,365,119 | 47,383 |
| | Plum Creek Timber Co. | | |
| | Inc. | 982,985 | 46,908 |
| | SEI Investments Co. | 839,194 | 43,974 |
| | Raymond James Financial | | |
| | Inc. | 729,756 | 42,304 |
| | Jones Lang LaSalle Inc. | 254,689 | 40,715 |
| | VEREIT Inc. | 5,119,957 | 40,550 |
| | Camden Property Trust | 491,497 | 37,727 |
| | MSCI Inc. Class A | 522,349 | 37,677 |
| | Alexandria Real Estate | | |
| | Equities Inc. | 409,864 | 37,035 |
| | Lazard Ltd. Class A | 734,164 | 33,045 |
| | Host Hotels & Resorts | | |
| | Inc. | 2,126,182 | 32,616 |
| * | Realogy Holdings Corp. | 829,003 | 30,400 |
| | Kimco Realty Corp. | 1,110,765 | 29,391 |
| | Iron Mountain Inc. | 1,074,297 | 29,017 |
| | Brixmor Property Group | | |
| | Inc. | 1,096,801 | 28,319 |
| * | LendingClub Corp. | 1,602,049 | 17,703 |
| ^ | LPL Financial Holdings | | |
| | Inc. | 227,927 | 9,721 |
| | | | 6,290,038 |
| Health Care (15.0%) | | |
| | Gilead Sciences Inc. | 8,151,031 | 824,803 |
| * | Allergan plc | 2,229,109 | 696,597 |
| | Amgen Inc. | 4,288,463 | 696,146 |
| * | Celgene Corp. | 4,443,521 | 532,156 |
| | AbbVie Inc. | 8,783,554 | 520,338 |
| * | Biogen Inc. | 1,260,697 | 386,214 |
| * | Express Scripts Holding | | |
| | Co. | 3,824,858 | 334,331 |
| | Thermo Fisher Scientific | | |
| | Inc. | 2,257,210 | 320,185 |
| | Medtronic plc | 3,997,537 | 307,491 |
| | | |
| | | | Market |
| | | | Value• |
| | | Shares | ($000) |
| * | Regeneron | | |
| | Pharmaceuticals Inc. | 433,311 | 235,232 |
| * | Alexion Pharmaceuticals | | |
| | Inc. | 1,210,653 | 230,932 |
| | Becton Dickinson and Co. | 1,191,861 | 183,654 |
| * | Vertex Pharmaceuticals | | |
| | Inc. | 1,389,698 | 174,866 |
| * | Illumina Inc. | 828,016 | 158,933 |
| | Stryker Corp. | 1,699,027 | 157,908 |
| | Zoetis Inc. | 2,534,458 | 121,451 |
| * | Mylan NV | 2,224,985 | 120,305 |
| * | Intuitive Surgical Inc. | 211,329 | 115,419 |
| | Perrigo Co. plc | 786,577 | 113,818 |
| * | Incyte Corp. | 946,749 | 102,675 |
| * | Edwards Lifesciences | | |
| | Corp. | 1,219,962 | 96,353 |
| * | BioMarin Pharmaceutical | | |
| | Inc. | 911,981 | 95,539 |
| | CR Bard Inc. | 417,836 | 79,155 |
| * | Henry Schein Inc. | 468,924 | 74,179 |
| * | Laboratory Corp. of | | |
| | America Holdings | 572,055 | 70,729 |
| * | Alkermes plc | 848,675 | 67,368 |
| * | DaVita HealthCare | | |
| | Partners Inc. | 955,697 | 66,622 |
| | Baxalta Inc. | 1,536,558 | 59,972 |
| * | Waters Corp. | 439,134 | 59,099 |
| * | Mallinckrodt plc | 655,380 | 48,911 |
| | DENTSPLY International | | |
| | Inc. | 790,745 | 48,117 |
| * | Jazz Pharmaceuticals plc | 330,355 | 46,435 |
| * | Medivation Inc. | 925,532 | 44,740 |
| * | Varian Medical Systems | | |
| | Inc. | 547,679 | 44,252 |
| | ResMed Inc. | 790,995 | 42,468 |
| * | Alnylam Pharmaceuticals | | |
| | Inc. | 407,169 | 38,331 |
| * | IDEXX Laboratories Inc. | 514,154 | 37,492 |
| | Cooper Cos. Inc. | 274,899 | 36,891 |
| * | Quintiles Transnational | | |
| | Holdings Inc. | 452,346 | 31,058 |
| | Universal Health Services | | |
| | Inc. Class B | 258,352 | 30,870 |
| * | Envision Healthcare | | |
| | Holdings Inc. | 1,055,647 | 27,415 |
| * | Centene Corp. | 320,094 | 21,065 |
| * | Intercept Pharmaceuticals | | |
| | Inc. | 44,752 | 6,684 |
| | | | 7,507,199 |
| Industrials (11.6%) | | |
| | 3M Co. | 3,482,316 | 524,576 |
| | United Parcel Service Inc. | | |
| | Class B | 3,937,216 | 378,878 |
| | Union Pacific Corp. | 4,830,707 | 377,761 |
| | Accenture plc Class A | 3,533,733 | 369,275 |
| | Danaher Corp. | 3,294,456 | 305,989 |
17
| | | |
| Growth Index Fund | | |
| |
| |
| |
| | | | Market |
| | | | Value• |
| | | Shares | ($000) |
| | Boeing Co. | 1,799,886 | 260,246 |
| * | PayPal Holdings Inc. | 6,564,160 | 237,623 |
| | Automatic Data | | |
| | Processing Inc. | 2,478,019 | 209,938 |
| | Precision Castparts Corp. | 739,262 | 171,516 |
| * | LinkedIn Corp. Class A | 653,051 | 146,989 |
| * | Fiserv Inc. | 1,292,524 | 118,214 |
| | Sherwin-Williams Co. | 447,570 | 116,189 |
| | FedEx Corp. | 758,561 | 113,018 |
| | Roper Technologies Inc. | 570,107 | 108,201 |
| | Paychex Inc. | 1,835,244 | 97,066 |
| | Fidelity National | | |
| | Information Services Inc. 1,595,723 | 96,701 |
| | Amphenol Corp. Class A | 1,743,422 | 91,059 |
| * | Alliance Data Systems | | |
| | Corp. | 328,497 | 90,852 |
| | Agilent Technologies Inc. | 1,874,322 | 78,365 |
| | Rockwell Automation Inc. | 746,620 | 76,611 |
| | AMETEK Inc. | 1,345,429 | 72,102 |
| | Vulcan Materials Co. | 753,940 | 71,602 |
| * | FleetCor Technologies Inc. | 495,168 | 70,774 |
| * | Verisk Analytics Inc. | | |
| | Class A | 862,770 | 66,330 |
| * | TransDigm Group Inc. | 288,754 | 65,966 |
| ^ | WW Grainger Inc. | 319,850 | 64,798 |
| ^ | Fastenal Co. | 1,555,827 | 63,509 |
| | Textron Inc. | 1,394,675 | 58,590 |
| * | Stericycle Inc. | 480,808 | 57,985 |
| | Acuity Brands Inc. | 247,076 | 57,766 |
| | Masco Corp. | 1,901,985 | 53,826 |
| * | Mettler-Toledo | | |
| | International Inc. | 154,932 | 52,542 |
| | Martin Marietta Materials | | |
| | Inc. | 373,914 | 51,069 |
| | Pentair plc | 1,019,082 | 50,475 |
| | Towers Watson & Co. | | |
| | Class A | 392,603 | 50,434 |
| | CH Robinson Worldwide | | |
| | Inc. | 811,871 | 50,352 |
| | Fortune Brands Home & | | |
| | Security Inc. | 902,704 | 50,100 |
| | Sealed Air Corp. | 1,115,954 | 49,772 |
| | Expeditors International | | |
| | of Washington Inc. | 1,053,790 | 47,526 |
| | PACCAR Inc. | 999,866 | 47,394 |
| | Total System Services Inc. | 936,016 | 46,614 |
| | Kansas City Southern | 616,906 | 46,064 |
| | Cintas Corp. | 488,204 | 44,451 |
| * | Sensata Technologies | | |
| | Holding NV | 962,888 | 44,351 |
| | Cummins Inc. | 502,549 | 44,229 |
| * | Vantiv Inc. Class A | 882,832 | 41,864 |
| * | United Rentals Inc. | 524,698 | 38,062 |
| | JB Hunt Transport | | |
| | Services Inc. | 518,199 | 38,015 |
| | Wabtec Corp. | 518,557 | 36,880 |
| | | |
| | | | Market |
| | | | Value• |
| | | Shares | ($000) |
| | Robert Half International | | |
| | Inc. | 712,408 | 33,583 |
| * | Trimble Navigation Ltd. | 1,415,939 | 30,372 |
| * | Hubbell Inc. Class B | 299,093 | 30,220 |
| | Macquarie Infrastructure | | |
| | Corp. | 406,687 | 29,525 |
| | B/E Aerospace Inc. | 590,834 | 25,034 |
| | Global Payments Inc. | 367,076 | 23,680 |
| | FLIR Systems Inc. | 793,514 | 22,274 |
| ^ | Chicago Bridge & Iron Co. | | |
| | NV | 533,231 | 20,791 |
| * | First Data Corp. Class A | 1,016,870 | 16,290 |
| | Owens Corning | 312,852 | 14,713 |
| | Allison Transmission | | |
| | Holdings Inc. | 435,142 | 11,266 |
| | Donaldson Co. Inc. | 374,871 | 10,744 |
| * | Quanta Services Inc. | 216,167 | 4,377 |
| * | Colfax Corp. | 122,882 | 2,869 |
| | | | 5,778,247 |
| Oil & Gas (2.6%) | | |
| | Schlumberger Ltd. | 3,566,233 | 248,745 |
| | EOG Resources Inc. | 3,109,063 | 220,091 |
| | Anadarko Petroleum | | |
| | Corp. | 2,873,901 | 139,614 |
| | Pioneer Natural | | |
| | Resources Co. | 844,810 | 105,922 |
| | Williams Cos. Inc. | 3,816,416 | 98,082 |
| | Kinder Morgan Inc. | 5,363,897 | 80,029 |
| | Noble Energy Inc. | 2,420,802 | 79,717 |
| * | Concho Resources Inc. | 730,683 | 67,851 |
| | Cimarex Energy Co. | 534,565 | 47,779 |
| | EQT Corp. | 863,054 | 44,991 |
| * | Cheniere Energy Inc. | 1,133,962 | 42,240 |
| | Cabot Oil & Gas Corp. | 2,341,579 | 41,423 |
| *,^ | Antero Resources Corp. | 1,487,395 | 32,425 |
| | Core Laboratories NV | 239,406 | 26,033 |
| | Range Resources Corp. | 910,353 | 22,404 |
| * | Continental Resources | | |
| | Inc. | 529,568 | 12,169 |
| | Oceaneering International | | |
| | Inc. | 276,562 | 10,377 |
| | | | 1,319,892 |
| Technology (23.6%) | | |
| | Apple Inc. | 29,956,509 | 3,153,222 |
| * | Alphabet Inc. Class A | 1,647,701 | 1,281,928 |
| * | Facebook Inc. Class A | 12,199,227 | 1,276,771 |
| * | Alphabet Inc. | 1,660,993 | 1,260,494 |
| | Oracle Corp. | 18,090,021 | 660,829 |
| | QUALCOMM Inc. | 8,501,233 | 424,934 |
| | Texas Instruments Inc. | 5,737,337 | 314,463 |
| | EMC Corp. | 10,970,820 | 281,731 |
| * | salesforce.com inc | 3,567,671 | 279,705 |
| * | Adobe Systems Inc. | 2,680,065 | 251,765 |
| | Avago Technologies Ltd. | | |
| | Class A | 1,482,916 | 215,245 |
18
| | | |
| Growth Index Fund | | |
| |
| |
| |
| | | | Market |
| | | | Value• |
| | | Shares | ($000) |
| * | Cognizant Technology | | |
| | Solutions Corp. Class A | 3,439,141 | 206,417 |
| * | Yahoo! Inc. | 4,806,950 | 159,879 |
| | Intuit Inc. | 1,418,480 | 136,883 |
| * | Cerner Corp. | 1,741,360 | 104,778 |
| | Analog Devices Inc. | 1,764,909 | 97,635 |
| | NVIDIA Corp. | 2,890,614 | 95,275 |
| * | Micron Technology Inc. | 6,140,813 | 86,954 |
| * | Red Hat Inc. | 1,033,856 | 85,614 |
| | Skyworks Solutions Inc. | 1,081,025 | 83,055 |
| * | Palo Alto Networks Inc. | 461,506 | 81,290 |
| * | Autodesk Inc. | 1,279,332 | 77,950 |
| * | ServiceNow Inc. | 854,278 | 73,946 |
| | Lam Research Corp. | 895,836 | 71,147 |
| | Xilinx Inc. | 1,453,397 | 68,266 |
| * | Twitter Inc. | 2,897,931 | 67,058 |
| | Applied Materials Inc. | 3,398,936 | 63,458 |
| * | Citrix Systems Inc. | 826,171 | 62,500 |
| | KLA-Tencor Corp. | 882,968 | 61,234 |
| | Maxim Integrated | | |
| | Products Inc. | 1,606,796 | 61,058 |
| | Linear Technology Corp. | 1,352,998 | 57,462 |
| | Microchip Technology Inc. 1,090,857 | 50,769 |
| * | Akamai Technologies Inc. | 955,583 | 50,292 |
| * | Workday Inc. Class A | 627,475 | 49,997 |
| * | VeriSign Inc. | 535,724 | 46,801 |
| * | ANSYS Inc. | 503,027 | 46,530 |
| * | Splunk Inc. | 726,333 | 42,716 |
| * | Qorvo Inc. | 798,919 | 40,665 |
| * | Gartner Inc. | 445,401 | 40,398 |
| * | F5 Networks Inc. | 401,780 | 38,957 |
| | Juniper Networks Inc. | 1,036,135 | 28,597 |
| *,^ | VMware Inc. Class A | 446,092 | 25,235 |
| | CDK Global Inc. | 452,226 | 21,467 |
| * | NetSuite Inc. | 224,755 | 19,019 |
| * | Tableau Software Inc. | | |
| | Class A | 148,567 | 13,998 |
| | CSRA Inc. | 385,638 | 11,569 |
| * | Premier Inc. Class A | 246,501 | 8,694 |
| * | FireEye Inc. | 408,449 | 8,471 |
| * | Rackspace Hosting Inc. | 323,560 | 8,193 |
| | | | 11,755,314 |
| Telecommunications (0.3%) | | |
| * | Level 3 Communications | | |
| | Inc. | 1,611,939 | 87,625 |
| * | SBA Communications | | |
| | Corp. Class A | 713,403 | 74,957 |
| * | Zayo Group Holdings Inc. | 278,856 | 7,415 |
| | | | 169,997 |
| Utilities (0.1%) | | |
| * | Calpine Corp. | 2,016,209 | 29,175 |
| Total Common Stocks | | |
| (Cost $33,226,428) | | 49,873,048 |
| | | |
| | | | Market |
| | | | Value• |
| | | Shares | ($000) |
| Temporary Cash Investments (0.5%)1 | |
| Money Market Fund (0.5%) | |
| 2,3 | Vanguard Market | | |
| | Liquidity Fund, | | |
| | 0.363% | 223,568,229 | 223,568 |
| |
| | | Face | |
| | | Amount | |
| | | ($000) | |
| U.S. Government and Agency Obligations (0.0%) |
| 4 | Federal Home Loan Bank | |
| | Discount Notes, | | |
| | 0.466%, 3/7/16 | 2,700 | 2,698 |
| 4,5 | Federal Home Loan Bank | |
| | Discount Notes, | | |
| | 0.617%, 6/10/16 | 2,000 | 1,995 |
| 5 | United States Treasury Bill, | |
| | 0.536%, 6/9/16 | 3,000 | 2,994 |
| | | | 7,687 |
| Total Temporary Cash Investments | |
| (Cost $231,253) | | 231,255 |
| Total Investments (100.4%) | |
| (Cost $33,457,681) | | 50,104,303 |
| |
| | | | Amount |
| | | | ($000) |
| Other Assets and Liabilities (-0.4%) | |
| Other Assets | | |
| Investment in Vanguard | 4,421 |
| Receivables for Investment Securities | |
| Sold | | 59,427 |
| Receivables for Accrued Income | 51,072 |
| Receivables for Capital Shares Issued | 32,456 |
| Total Other Assets | | 147,376 |
| Liabilities | | |
| Payables for Investment Securities | |
| Purchased | | (45,487) |
| Collateral for Securities on Loan | (157,063) |
| Payables for Capital Shares Redeemed | (113,167) |
| Payables for Distributions | (137) |
| Payables to Vanguard | | (34,151) |
| Other Liabilities | | (933) |
| Total Liabilities | | (350,938) |
| Net Assets (100%) | | 49,900,741 |
19
Growth Index Fund
At December 31, 2015, net assets consisted of:
Amount ($000)
| |
| Paid-in Capital | 34,305,454 |
| Overdistributed Net Investment Income | (12,559) |
| Accumulated Net Realized Losses | (1,038,630) |
| Unrealized Appreciation (Depreciation) | |
| Investment Securities | 16,646,622 |
| Futures Contracts | (146) |
| Net Assets | 49,900,741 |
| |
| |
| Investor Shares—Net Assets | |
| Applicable to 55,464,772 outstanding | |
| $.001 par value shares of beneficial | |
| interest (unlimited authorization) | 3,038,163 |
| Net Asset Value Per Share— | |
| Investor Shares | $54.78 |
| |
| |
| ETF Shares—Net Assets | |
| Applicable to 194,607,921 outstanding | |
| $.001 par value shares of beneficial | |
| interest (unlimited authorization) | 20,705,797 |
| Net Asset Value Per Share— | |
| ETF Shares | $106.40 |
| |
| | Amount |
| | ($000) |
| Admiral Shares—Net Assets | |
| Applicable to 306,318,756 outstanding | |
| $.001 par value shares of beneficial | |
| interest (unlimited authorization) | 16,776,681 |
| Net Asset Value Per Share— | |
| Admiral Shares | $54.77 |
| |
| |
| Institutional Shares—Net Assets | |
| Applicable to 171,266,628 outstanding | |
| $.001 par value shares of beneficial | |
| interest (unlimited authorization) | 9,380,100 |
| Net Asset Value Per Share— | |
| Institutional Shares | $54.77 |
• See Note A in Notes to Financial Statements.
* Non-income-producing security.
^ Includes partial security positions on loan to broker-dealers. The total value of securities on loan is $153,372,000.
1 The fund invests a portion of its cash reserves in equity markets through the use of index futures contracts. After giving effect to futures investments, the fund’s effective common stock and temporary cash investment positions represent 100.0% and 0.4%, respectively, of net assets.
2 Affiliated money market fund available only to Vanguard funds and certain trusts and accounts managed by Vanguard. Rate shown is the 7-day yield.
3 Includes $157,063,000 of collateral received for securities on loan.
4 The issuer operates under a congressional charter; its securities are generally neither guaranteed by the U.S. Treasury nor backed by the full faith and credit of the U.S. government.
5 Securities with a value of $1,597,000 have been segregated as initial margin for open futures contracts.
See accompanying Notes, which are an integral part of the Financial Statements.
20
| |
| Growth Index Fund | |
| |
| |
| Statement of Operations | |
| |
| | Year Ended |
| | December 31, 2015 |
| | ($000) |
| Investment Income | |
| Income | |
| Dividends | 684,197 |
| Interest1 | 130 |
| Securities Lending | 1,553 |
| Total Income | 685,880 |
| Expenses | |
| The Vanguard Group—Note B | |
| Investment Advisory Services | 3,424 |
| Management and Administrative—Investor Shares | 6,016 |
| Management and Administrative—ETF Shares | 11,478 |
| Management and Administrative—Admiral Shares | 9,728 |
| Management and Administrative—Institutional Shares | 5,163 |
| Marketing and Distribution—Investor Shares | 637 |
| Marketing and Distribution—ETF Shares | 1,750 |
| Marketing and Distribution—Admiral Shares | 1,687 |
| Marketing and Distribution—Institutional Shares | 650 |
| Custodian Fees | 414 |
| Auditing Fees | 35 |
| Shareholders’ Reports—Investor Shares | 73 |
| Shareholders’ Reports—ETF Shares | 517 |
| Shareholders’ Reports—Admiral Shares | 113 |
| Shareholders’ Reports—Institutional Shares | 84 |
| Trustees’ Fees and Expenses | 33 |
| Total Expenses | 41,802 |
| Net Investment Income | 644,078 |
| Realized Net Gain (Loss) | |
| Investment Securities Sold | 1,319,530 |
| Futures Contracts | 1,886 |
| Realized Net Gain (Loss) | 1,321,416 |
| Change in Unrealized Appreciation (Depreciation) | |
| Investment Securities | (487,944) |
| Futures Contracts | (97) |
| Change in Unrealized Appreciation (Depreciation) | (488,041) |
| Net Increase (Decrease) in Net Assets Resulting from Operations | 1,477,453 |
| 1 Interest income from an affiliated company of the fund was $123,000. | |
| |
| |
| |
| See accompanying Notes, which are an integral part of the Financial Statements. | |
21
| | |
| Growth Index Fund | | |
| |
| |
| Statement of Changes in Net Assets | | |
| |
| | Year Ended December 31, |
| | 2015 | 2014 |
| | ($000) | ($000) |
| Increase (Decrease) in Net Assets | | |
| Operations | | |
| Net Investment Income | 644,078 | 523,580 |
| Realized Net Gain (Loss) | 1,321,416 | 1,039,791 |
| Change in Unrealized Appreciation (Depreciation) | (488,041) | 3,657,488 |
| Net Increase (Decrease) in Net Assets Resulting from Operations | 1,477,453 | 5,220,859 |
| Distributions | | |
| Net Investment Income | | |
| Investor Shares | (36,400) | (38,744) |
| ETF Shares | (254,190) | (195,683) |
| Admiral Shares | (210,975) | (144,943) |
| Signal Shares | — | (29,371) |
| Institutional Shares | (129,494) | (113,385) |
| Realized Capital Gain | | |
| Investor Shares | — | — |
| ETF Shares | — | — |
| Admiral Shares | — | — |
| Signal Shares | — | — |
| Institutional Shares | — | — |
| Total Distributions | (631,059) | (522,126) |
| Capital Share Transactions | | |
| Investor Shares | (300,941) | (759,519) |
| ETF Shares | 3,020,841 | 2,345,702 |
| Admiral Shares | 1,591,285 | 5,700,280 |
| Signal Shares | — | (4,926,987) |
| Institutional Shares | (318,776) | 518,280 |
| Net Increase (Decrease) from Capital Share Transactions | 3,992,409 | 2,877,756 |
| Total Increase (Decrease) | 4,838,803 | 7,576,489 |
| Net Assets | | |
| Beginning of Period | 45,061,938 | 37,485,449 |
| End of Period1 | 49,900,741 | 45,061,938 |
1 Net Assets—End of Period includes undistributed (overdistributed) net investment income of ($12,559,000) and ($25,578,000).
See accompanying Notes, which are an integral part of the Financial Statements.
22
| | | | | |
| Growth Index Fund | | | | | |
| |
| |
| Financial Highlights | | | | | |
| |
| |
| Investor Shares | | | | | |
| |
| For a Share Outstanding | | | Year Ended December 31, |
| Throughout Each Period | 2015 | 2014 | 2013 | 2012 | 2011 |
| Net Asset Value, Beginning of Period | $53.71 | $47.87 | $36.65 | $31.79 | $31.60 |
| Investment Operations | | | | | |
| Net Investment Income | . 652 | . 579 | .508 | .509 | . 351 |
| Net Realized and Unrealized Gain (Loss) | | | | | |
| on Investments | 1.054 | 5.837 | 11.219 | 4.853 | .183 |
| Total from Investment Operations | 1.706 | 6.416 | 11.727 | 5.362 | .534 |
| Distributions | | | | | |
| Dividends from Net Investment Income | (.636) | (.576) | (.507) | (. 502) | (. 344) |
| Distributions from Realized Capital Gains | — | — | — | — | — |
| Total Distributions | (.636) | (.576) | (.507) | (. 502) | (. 344) |
| Net Asset Value, End of Period | $54.78 | $53.71 | $47.87 | $36.65 | $31.79 |
| |
| Total Return1 | 3.17% | 13.47% | 32.16% | 16.89% | 1.71% |
| |
| Ratios/Supplemental Data | | | | | |
| Net Assets, End of Period (Millions) | $3,038 | $3,270 | $3,630 | $3,105 | $2,897 |
| Ratio of Total Expenses to Average Net Assets | 0.22% | 0.23% | 0.24% | 0.24% | 0.24% |
| Ratio of Net Investment Income to | | | | | |
| Average Net Assets | 1.20% | 1.17% | 1.22% | 1.45% | 1.10% |
| Portfolio Turnover Rate2 | 9% | 9% | 32% | 21% | 23% |
1 Total returns do not include account service fees that may have applied in the periods shown. Fund prospectuses provide information about any applicable account service fees.
2 Excludes the value of portfolio securities received or delivered as a result of in-kind purchases or redemptions of the fund’s capital shares, including ETF Creation Units.
See accompanying Notes, which are an integral part of the Financial Statements.
23
| | | | | |
| Growth Index Fund | | | | | |
| |
| |
| Financial Highlights | | | | | |
| |
| |
| ETF Shares | | | | | |
| |
| For a Share Outstanding | | | Year Ended December 31, |
| Throughout Each Period | 2015 | 2014 | 2013 | 2012 | 2011 |
| Net Asset Value, Beginning of Period | $104.33 | $92.99 | $71.19 | $61.76 | $61.39 |
| Investment Operations | | | | | |
| Net Investment Income | 1.420 | 1.268 | 1.112 | 1.087 | .776 |
| Net Realized and Unrealized Gain (Loss) | | | | | |
| on Investments | 2.038 | 11.332 | 21.798 | 9.416 | .360 |
| Total from Investment Operations | 3.458 | 12.600 | 22.910 | 10.503 | 1.136 |
| Distributions | | | | | |
| Dividends from Net Investment Income | (1.388) | (1.260) | (1.110) | (1.073) | (.766) |
| Distributions from Realized Capital Gains | — | — | — | — | — |
| Total Distributions | (1.388) | (1.260) | (1.110) | (1.073) | (.766) |
| Net Asset Value, End of Period | $106.40 | $104.33 | $92.99 | $71.19 | $61.76 |
| |
| Total Return | 3.32% | 13.62% | 32.38% | 17.03% | 1.87% |
| |
| Ratios/Supplemental Data | | | | | |
| Net Assets, End of Period (Millions) | $20,706 | $17,340 | $13,265 | $8,467 | $6,046 |
| Ratio of Total Expenses to Average Net Assets | 0.08% | 0.09% | 0.09% | 0.10% | 0.10% |
| Ratio of Net Investment Income to | | | | | |
| Average Net Assets | 1.34% | 1.31% | 1.37% | 1.59% | 1.24% |
| Portfolio Turnover Rate1 | 9% | 9% | 32% | 21% | 23% |
1 Excludes the value of portfolio securities received or delivered as a result of in-kind purchases or redemptions of the fund’s capital shares, including ETF Creation Units.
See accompanying Notes, which are an integral part of the Financial Statements.
24
| | | | | |
| Growth Index Fund | | | | | |
| |
| |
| Financial Highlights | | | | | |
| |
| |
| Admiral Shares | | | | | |
| |
| For a Share Outstanding | | | Year Ended December 31, |
| Throughout Each Period | 2015 | 2014 | 2013 | 2012 | 2011 |
| Net Asset Value, Beginning of Period | $53.71 | $47.87 | $36.64 | $31.79 | $31.60 |
| Investment Operations | | | | | |
| Net Investment Income | .731 | .653 | .572 | .560 | .399 |
| Net Realized and Unrealized Gain (Loss) | | | | | |
| on Investments | 1.044 | 5.836 | 11.229 | 4.842 | .185 |
| Total from Investment Operations | 1.775 | 6.489 | 11.801 | 5.402 | .584 |
| Distributions | | | | | |
| Dividends from Net Investment Income | (.715) | (.649) | (.571) | (. 552) | (. 394) |
| Distributions from Realized Capital Gains | — | — | — | — | — |
| Total Distributions | (.715) | (.649) | (.571) | (. 552) | (. 394) |
| Net Asset Value, End of Period | $54.77 | $53.71 | $47.87 | $36.64 | $31.79 |
| |
| Total Return1 | 3.30% | 13.63% | 32.40% | 17.01% | 1.87% |
| |
| Ratios/Supplemental Data | | | | | |
| Net Assets, End of Period (Millions) | $16,777 | $14,907 | $7,903 | $5,774 | $4,819 |
| Ratio of Total Expenses to Average Net Assets | 0.08% | 0.09% | 0.09% | 0.10% | 0.10% |
| Ratio of Net Investment Income to | | | | | |
| Average Net Assets | 1.34% | 1.31% | 1.37% | 1.59% | 1.24% |
| Portfolio Turnover Rate2 | 9% | 9% | 32% | 21% | 23% |
1 Total returns do not include account service fees that may have applied in the periods shown. Fund prospectuses provide information about any applicable account service fees.
2 Excludes the value of portfolio securities received or delivered as a result of in-kind purchases or redemptions of the fund’s capital shares, including ETF Creation Units.
See accompanying Notes, which are an integral part of the Financial Statements.
25
| | | | | |
| Growth Index Fund | | | | | |
| |
| |
| Financial Highlights | | | | | |
| |
| |
| Institutional Shares | | | | | |
| |
| For a Share Outstanding | | | Year Ended December 31, |
| Throughout Each Period | 2015 | 2014 | 2013 | 2012 | 2011 |
| Net Asset Value, Beginning of Period | $53.70 | $47.87 | $36.64 | $31.79 | $31.60 |
| Investment Operations | | | | | |
| Net Investment Income | .737 | .657 | .576 | .567 | .405 |
| Net Realized and Unrealized Gain (Loss) | | | | | |
| on Investments | 1.053 | 5.826 | 11.229 | 4.842 | .186 |
| Total from Investment Operations | 1.790 | 6.483 | 11.805 | 5.409 | .591 |
| Distributions | | | | | |
| Dividends from Net Investment Income | (.720) | (. 653) | (. 575) | (. 559) | (. 401) |
| Distributions from Realized Capital Gains | — | — | — | — | — |
| Total Distributions | (.720) | (. 653) | (. 575) | (. 559) | (. 401) |
| Net Asset Value, End of Period | $54.77 | $53.70 | $47.87 | $36.64 | $31.79 |
| |
| Total Return | 3.33% | 13.62% | 32.41% | 17.04% | 1.89% |
| |
| Ratios/Supplemental Data | | | | | |
| Net Assets, End of Period (Millions) | $9,380 | $9,545 | $8,015 | $6,189 | $4,726 |
| Ratio of Total Expenses to Average Net Assets | 0.07% | 0.08% | 0.08% | 0.08% | 0.08% |
| Ratio of Net Investment Income to | | | | | |
| Average Net Assets | 1.35% | 1.32% | 1.38% | 1.61% | 1.26% |
| Portfolio Turnover Rate1 | 9% | 9% | 32% | 21% | 23% |
1 Excludes the value of portfolio securities received or delivered as a result of in-kind purchases or redemptions of the fund’s capital shares, including ETF Creation Units.
See accompanying Notes, which are an integral part of the Financial Statements.
26
Growth Index Fund
Notes to Financial Statements
Vanguard Growth Index Fund is registered under the Investment Company Act of 1940 as an open-end investment company, or mutual fund. The fund offers four classes of shares: Investor Shares, ETF Shares, Admiral Shares, and Institutional Shares. Investor Shares are available to any investor who meets the fund’s minimum purchase requirements. ETF Shares are listed for trading on NYSE Arca; they can be purchased and sold through a broker. Admiral Shares and Institutional Shares are designed for investors who meet certain administrative, service, and account-size criteria. Prior to October 24, 2014, the fund offered Signal Shares. Effective at the close of business on October 24, 2014, the Signal Shares were converted to Admiral Shares.
A. The following significant accounting policies conform to generally accepted accounting principles for U.S. investment companies. The fund consistently follows such policies in preparing its financial statements.
1. Security Valuation: Securities are valued as of the close of trading on the New York Stock Exchange (generally 4 p.m., Eastern time) on the valuation date. Equity securities are valued at the latest quoted sales prices or official closing prices taken from the primary market in which each security trades; such securities not traded on the valuation date are valued at the mean of the latest quoted bid and asked prices. Securities for which market quotations are not readily available, or whose values have been materially affected by events occurring before the fund’s pricing time but after the close of the securities’ primary markets, are valued by methods deemed by the board of trustees to represent fair value. Investments in Vanguard Market Liquidity Fund are valued at that fund’s net asset value. Temporary cash investments acquired over 60 days to maturity are valued using the latest bid prices or using valuations based on a matrix system (which considers such factors as security prices, yields, maturities, and ratings), both as furnished by independent pricing services. Other temporary cash investments are valued at amortized cost, which approximates market value.
2. Futures Contracts: The fund uses index futures contracts to a limited extent, with the objectives of maintaining full exposure to the stock market, enhancing returns, maintaining liquidity, and minimizing transaction costs. The fund may purchase futures contracts to immediately invest incoming cash in the market, or sell futures in response to cash outflows, thereby simulating a fully invested position in the underlying index while maintaining a cash balance for liquidity. The fund may seek to enhance returns by using futures contracts instead of the underlying securities when futures are believed to be priced more attractively than the underlying securities. The primary risks associated with the use of futures contracts are imperfect correlation between changes in market values of stocks held by the fund and the prices of futures contracts, and the possibility of an illiquid market. Counterparty risk involving futures is mitigated because a regulated clearinghouse is the counterparty instead of the clearing broker. To further mitigate counterparty risk, the fund trades futures contracts on an exchange, monitors the financial strength of its clearing brokers and clearinghouse, and has entered into clearing agreements with its clearing brokers. The clearinghouse imposes initial margin requirements to secure the fund’s performance and requires daily settlement of variation margin representing changes in the market value of each contract.
Futures contracts are valued at their quoted daily settlement prices. The aggregate settlement values of the contracts are not recorded in the Statement of Net Assets. Fluctuations in the value of the contracts are recorded in the Statement of Net Assets as an asset (liability) and in the Statement of Operations as unrealized appreciation (depreciation) until the contracts are closed, when they are recorded as realized futures gains (losses).
27
Growth Index Fund
During the year ended December 31, 2015, the fund’s average investments in long and short futures contracts represented less than 1% and 0% of net assets, respectively, based on the average of aggregate settlement values at each quarter-end during the period.
3. Federal Income Taxes: The fund intends to continue to qualify as a regulated investment company and distribute all of its taxable income. Management has analyzed the fund’s tax positions taken for all open federal income tax years (December 31, 2012–2015), and has concluded that no provision for federal income tax is required in the fund’s financial statements.
4. Distributions: Distributions to shareholders are recorded on the ex-dividend date.
5. Securities Lending: To earn additional income, the fund lends its securities to qualified institutional borrowers. Security loans are subject to termination by the fund at any time and are required to be secured at all times by collateral in an amount at least equal to the market value of securities loaned. Daily market fluctuations could cause the value of loaned securities to be more or less than the value of the collateral received. When this occurs, the collateral is adjusted and settled on the next business day. The fund further mitigates its counterparty risk by entering into securities lending transactions only with a diverse group of prequalified counterparties, monitoring their financial strength, and entering into master securities lending agreements with its counterparties. The master securities lending agreements provide that, in the event of a counterparty’s default (including bankruptcy), the fund may terminate any loans with that borrower, determine the net amount owed, and sell or retain the collateral up to the net amount owed to the fund; however, such actions may be subject to legal proceedings. While collateral mitigates counterparty risk, in the absence of a default the fund may experience delays and costs in recovering the securities loaned. The fund invests cash collateral received in Vanguard Market Liquidity Fund, and records a liability in the Statement of Net Assets for the return of the collateral, during the period the securities are on loan. Securities lending income represents fees charged to borrowers plus income earned on invested cash collateral, less expenses associated with the loan.
6. Credit Facility: The fund and certain other funds managed by The Vanguard Group (“Vanguard”) participate in a $3 billion committed credit facility provided by a syndicate of lenders pursuant to a credit agreement that may be renewed annually; each fund is individually liable for its borrowings, if any, under the credit facility. Borrowings may be utilized for temporary and emergency purposes, and are subject to the fund’s regulatory and contractual borrowing restrictions. The participating funds are charged administrative fees and an annual commitment fee of 0.06% of the undrawn amount of the facility; these fees are allocated to the funds based on a method approved by the fund’s board of trustees and included in Management and Administrative expenses on the fund’s Statement of Operations. Any borrowings under this facility bear interest at a rate equal to the higher of the federal funds rate or LIBOR reference rate plus an agreed-upon spread.
The fund had no borrowings outstanding at December 31, 2015, or at any time during the period then ended.
7. Other: Dividend income is recorded on the ex-dividend date. Interest income includes income distributions received from Vanguard Market Liquidity Fund and is accrued daily. Premiums and discounts on debt securities purchased are amortized and accreted, respectively, to interest income over the lives of the respective securities. Security transactions are accounted for on the date securities are bought or sold. Costs used to determine realized gains (losses) on the sale of investment securities are those of the specific securities sold.
28
Growth Index Fund
Each class of shares has equal rights as to assets and earnings, except that each class separately bears certain class-specific expenses related to maintenance of shareholder accounts (included in Management and Administrative expenses) and shareholder reporting. Marketing and distribution expenses are allocated to each class of shares based on a method approved by the board of trustees. Income, other non-class-specific expenses, and gains and losses on investments are allocated to each class of shares based on its relative net assets.
B. In accordance with the terms of a Funds’ Service Agreement (the “FSA”) between Vanguard and the fund, Vanguard furnishes to the fund investment advisory, corporate management, administrative, marketing, and distribution services at Vanguard’s cost of operations (as defined by the FSA). These costs of operations are allocated to the fund based on methods and guidelines approved by the board of trustees. Vanguard does not require reimbursement in the current period for certain costs of operations (such as deferred compensation/benefits and risk/insurance costs); the fund’s liability for these costs of operations is included in Payables to Vanguard on the Statement of Net Assets.
Upon the request of Vanguard, the fund may invest up to 0.40% of its net assets as capital in Vanguard. At December 31, 2015, the fund had contributed to Vanguard capital in the amount of $4,421,000, representing 0.01% of the fund’s net assets and 1.77% of Vanguard’s capitalization. The fund’s trustees and officers are also directors and employees, respectively, of Vanguard.
C. Various inputs may be used to determine the value of the fund’s investments. These inputs are summarized in three broad levels for financial statement purposes. The inputs or methodologies used to value securities are not necessarily an indication of the risk associated with investing in those securities.
Level 1—Quoted prices in active markets for identical securities.
Level 2—Other significant observable inputs (including quoted prices for similar securities, interest rates, prepayment speeds, credit risk, etc.).
Level 3—Significant unobservable inputs (including the fund’s own assumptions used to determine the fair value of investments).
The following table summarizes the market value of the fund’s investments as of December 31, 2015, based on the inputs used to value them:
| | | |
| | Level 1 | Level 2 | Level 3 |
| Investments | ($000) | ($000) | ($000) |
| Common Stocks | 49,873,048 | — | — |
| Temporary Cash Investments | 223,568 | 7,687 | — |
| Futures Contracts—Liabilities1 | (313) | — | — |
| Total | 50,096,303 | 7,687 | — |
| 1 Represents variation margin on the last day of the reporting period. | | | |
29
Growth Index Fund
D. At December 31, 2015, the aggregate settlement value of open futures contracts and the related unrealized appreciation (depreciation) were:
| | | | |
| | | | | ($000) |
| | | | Aggregate | |
| | | Number of | Settlement | Unrealized |
| | | Long (Short) | Value | Appreciation |
| Futures Contracts | Expiration | Contracts | Long (Short) | (Depreciation) |
| E-mini S&P 500 Index | March 2016 | 326 | 33,177 | (146) |
Unrealized appreciation (depreciation) on open futures contracts is required to be treated as realized gain (loss) for tax purposes.
E. Distributions are determined on a tax basis and may differ from net investment income and realized capital gains for financial reporting purposes. Differences may be permanent or temporary. Permanent differences are reclassified among capital accounts in the financial statements to reflect their tax character. Temporary differences arise when certain items of income, expense, gain, or loss are recognized in different periods for financial statement and tax purposes. These differences will reverse at some time in the future. Differences in classification may also result from the treatment of short-term gains as ordinary income for tax purposes.
During the year ended December 31, 2015, the fund realized $1,947,855,000 of net capital gains resulting from in-kind redemptions—in which shareholders exchanged fund shares for securities held by the fund rather than for cash. Because such gains are not taxable to the fund, and are not distributed to shareholders, they have been reclassified from accumulated net realized losses to paid-in capital.
For tax purposes, at December 31, 2015, the fund had $16,412,000 of ordinary income available for distribution. At December 31, 2015, the fund had available capital losses totaling $1,036,271,000 to offset future net capital gains. Of this amount, $300,177,000 is subject to expiration on December 31, 2017. Capital losses of $736,094,000 realized beginning in fiscal 2011 may be carried forward indefinitely under the Regulated Investment Company Modernization Act of 2010, but must be used before any expiring loss carryforwards.
At December 31, 2015, the cost of investment securities for tax purposes was $33,457,681,000. Net unrealized appreciation of investment securities for tax purposes was $16,646,622,000, consisting of unrealized gains of $17,618,436,000 on securities that had risen in value since their purchase and $971,814,000 in unrealized losses on securities that had fallen in value since their purchase.
F. During the year ended December 31, 2015, the fund purchased $12,299,246,000 of investment securities and sold $8,289,624,000 of investment securities, other than temporary cash investments. Purchases and sales include $6,050,798,000 and $3,869,116,000, respectively, in connection with in-kind purchases and redemptions of the fund’s capital shares.
30
Growth Index Fund
| | | | |
| G. Capital share transactions for each class of shares were: | | | |
| | | | Year Ended December 31, |
| | | 2015 | | 2014 |
| | Amount | Shares | Amount | Shares |
| | ($000) | (000) | ($000) | (000) |
| Investor Shares | | | | |
| Issued | 480,677 | 8,715 | 420,778 | 8,503 |
| Issued in Lieu of Cash Distributions | 34,042 | 615 | 36,263 | 710 |
| Redeemed | (815,660) | (14,748) | (1,216,560) | (24,167) |
| Net Increase (Decrease)—Investor Shares | (300,941) | (5,418) | (759,519) | (14,954) |
| ETF Shares | | | | |
| Issued | 6,718,956 | 62,729 | 4,907,919 | 49,655 |
| Issued in Lieu of Cash Distributions | — | — | — | — |
| Redeemed | (3,698,115) | (34,325) | (2,562,217) | (26,100) |
| Net Increase (Decrease) —ETF Shares | 3,020,841 | 28,404 | 2,345,702 | 23,555 |
| Admiral Shares | | | | |
| Issued1 | 3,735,301 | 67,661 | 6,782,733 | 133,839 |
| Issued in Lieu of Cash Distributions | 188,346 | 3,407 | 131,501 | 2,548 |
| Redeemed | (2,332,362) | (42,325) | (1,213,954) | (23,920) |
| Net Increase (Decrease) —Admiral Shares | 1,591,285 | 28,743 | 5,700,280 | 112,467 |
| Signal Shares | | | | |
| Issued | — | — | 597,797 | 13,239 |
| Issued in Lieu of Cash Distributions | — | — | 25,487 | 555 |
| Redeemed1 | — | — | (5,550,271) | (119,196) |
| Net Increase (Decrease)—Signal Shares | — | — | (4,926,987) | (105,402) |
| Institutional Shares | | | | |
| Issued | 1,835,127 | 33,331 | 2,238,828 | 44,415 |
| Issued in Lieu of Cash Distributions | 120,650 | 2,183 | 106,184 | 2,070 |
| Redeemed | (2,274,553) | (41,972) | (1,826,732) | (36,204) |
| Net Increase (Decrease) —Institutional Shares | (318,776) | (6,458) | 518,280 | 10,281 |
1 Admiral Shares Issued and Signal Shares Redeemed include $3,661,751,000 from the conversion of Signal Shares to Admiral Shares during the 2014 fiscal year.
H. Management has determined that no material events or transactions occurred subsequent to December 31, 2015, that would require recognition or disclosure in these financial statements.
31
| | | | |
| Value Index Fund | | | | |
| |
| |
| Fund Profile | | | | |
| As of December 31, 2015 | | | | |
| |
| Share-Class Characteristics | | | | |
| | Investor | | Admiral | Institutional |
| | Shares | ETF Shares | Shares | Shares |
| Ticker Symbol | VIVAX | VTV | VVIAX | VIVIX |
| Expense Ratio1 | 0.23% | 0.09% | 0.09% | 0.08% |
| 30-Day SEC Yield | 2.50% | 2.64% | 2.64% | 2.64% |
| | | |
| Portfolio Characteristics | | |
| | | | DJ |
| | | | U.S. |
| | | | Total |
| | | CRSP US | Market |
| | | Large Cap | FA |
| | Fund Value | Index | Index |
| Number of Stocks | 328 | 327 | 3,960 |
| Median Market Cap | $85.5B | $81.0B | $51.4B |
| Price/Earnings Ratio | 18.0x | 18.0x | 21.9x |
| Price/Book Ratio | 2.0x | 2.0x | 2.7x |
| Return on Equity | 15.7% | 15.6% | 17.2% |
| Earnings Growth | | | |
| Rate | 5.0% | 4.8% | 9.5% |
| Dividend Yield | 2.7% | 2.7% | 2.1% |
| Foreign Holdings | 0.0% | 0.0% | 0.0% |
| Turnover Rate | 8% | — | — |
| Short-Term | | | |
| Reserves | 0.1% | — | — |
Sector Diversification (% of equity exposure)
| | | |
| | | | DJ |
| | | CRSP US | U.S. Total |
| | | Large Cap | Market |
| | Fund | Value Index | FA Index |
| Basic Materials | 3.3% | 3.3% | 2.3% |
| Consumer Goods | 11.2 | 11.2 | 10.3 |
| Consumer Services | 6.5 | 6.5 | 14.2 |
| Financials | 23.3 | 23.4 | 19.5 |
| Health Care | 13.7 | 13.7 | 14.0 |
| Industrials | 11.3 | 11.3 | 12.2 |
| Oil & Gas | 9.8 | 9.8 | 5.9 |
| Technology | 11.0 | 10.9 | 16.4 |
| Telecommunications | 4.4 | 4.4 | 2.2 |
| Utilities | 5.5 | 5.5 | 3.0 |
| | |
| Volatility Measures | | |
| | | DJ |
| | | U.S. Total |
| | Spliced | Market |
| | Value Index | FA Index |
| R-Squared | 1.00 | 0.94 |
| Beta | 1.00 | 0.95 |
These measures show the degree and timing of the fund’s fluctuations compared with the indexes over 36 months.
Ten Largest Holdings (% of total net assets)
| | |
| Microsoft Corp. | Software | 4.3% |
| Exxon Mobil Corp. | Integrated Oil & Gas | 3.3 |
| General Electric Co. | Diversified Industrials | 3.0 |
| Johnson & Johnson | Pharmaceuticals | 2.9 |
| Berkshire Hathaway Inc. Reinsurance | 2.6 |
| Wells Fargo & Co. | Banks | 2.5 |
| JPMorgan Chase & Co. | Banks | 2.5 |
| Procter & Gamble Co. | Nondurable | |
| | Household Products | 2.2 |
| AT&T Inc. | Fixed Line | |
| | Telecommunications | 2.1 |
| Pfizer Inc. | Pharmaceuticals | 2.0 |
| Top Ten | | 27.4% |
The holdings listed exclude any temporary cash investments and equity index products.
1 The expense ratios shown are from the prospectus dated April 28, 2015, and represent estimated costs for the current fiscal year. For the fiscal year ended December 31, 2015, the expense ratios were 0.22% for Investor Shares, 0.08% for ETF Shares, 0.08% for Admiral Shares, and 0.07% for Institutional Shares.
32
Value Index Fund

33
Value Index Fund
Performance Summary
All of the returns in this report represent past performance, which is not a guarantee of future results that may be achieved by the fund. (Current performance may be lower or higher than the performance data cited. For performance data current to the most recent month-end, visit our website at vanguard.com/performance.) Note, too, that both investment returns and principal value can fluctuate widely, so an investor’s shares, when sold, could be worth more or less than their original cost. The returns shown do not reflect taxes that a shareholder would pay on fund distributions or on the sale of fund shares.
Cumulative Performance: December 31, 2005, Through December 31, 2015
Initial Investment of $10,000
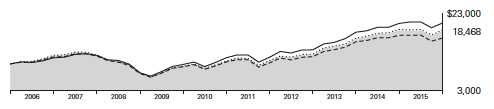
| | | | | |
| | | | Average Annual Total Returns | |
| | | Periods Ended December 31, 2015 | |
| | | | | | Final Value |
| | | One | Five | Ten | of a $10,000 |
| | | Year | Years | Years | Investment |
| | Value Index Fund*Investor Shares | -1.03% | 11.54% | 6.33% | $18,468 |
| •••••••• | Spliced Value Index | -0.86 | 11.77 | 6.49 | 18,747 |
| – – – – | Large-Cap Value Funds Average | -4.16 | 9.70 | 5.25 | 16,676 |
| | Dow Jones U.S. Total Stock Market | | | | |
| | Float Adjusted Index | 0.44 | 12.14 | 7.48 | 20,563 |
| For a benchmark description, see the Glossary. | | | | |
| Large-Cap Value Funds Average: Derived from data provided by Lipper, a Thomson Reuters Company. | | |
| |
| | | | | | Final Value |
| | | One | Five | Ten | of a $10,000 |
| | | Year | Years | Years | Investment |
| Value Index Fund | | | | |
| ETF Shares Net Asset Value | -0.89% | 11.70% | 6.47% | $18,712 |
| Spliced Value Index | -0.86 | 11.77 | 6.49 | 18,747 |
| Dow Jones U.S. Total Stock Market Float | | | | |
| Adjusted Index | 0.44 | 12.14 | 7.48 | 20,563 |
See Financial Highlights for dividend and capital gains information.
34
| | | | |
| Value Index Fund | | | | |
| |
| |
| |
| | | Average Annual Total Returns | |
| | Periods Ended December 31, 2015 | |
| | | | | Final Value |
| | One | Five | Ten | of a $10,000 |
| | Year | Years | Years | Investment |
| Value Index Fund Admiral Shares | -0.86% | 11.70% | 6.46% | $18,709 |
| Spliced Value Index | -0.86 | 11.77 | 6.49 | 18,747 |
| Dow Jones U.S. Total Stock Market Float | | | | |
| Adjusted Index | 0.44 | 12.14 | 7.48 | 20,563 |
| |
| |
| | | | | Final Value |
| | One | Five | Ten | of a $5,000,000 |
| | Year | Years | Years | Investment |
| Value Index Fund Institutional Shares | -0.85% | 11.72% | 6.49% | $9,380,066 |
| Spliced Value Index | -0.86 | 11.77 | 6.49 | 9,373,337 |
| Dow Jones U.S. Total Stock Market Float | | | | |
| Adjusted Index | 0.44 | 12.14 | 7.48 | 10,281,716 |
| |
| |
| |
| Cumulative Returns of ETF Shares: December 31, 2005, Through December 31, 2015 | |
| | | One | Five | Ten |
| | | Year | Years | Years |
| Value Index Fund ETF Shares Market Price | | -0.92% | 73.81% | 86.93% |
| Value Index Fund ETF Shares Net Asset Value | | -0.89 | 73.91 | 87.12 |
| Spliced Value Index | | -0.86 | 74.45 | 87.47 |

35
Value Index Fund
Financial Statements
Statement of Net Assets
As of December 31, 2015
The fund reports a complete list of its holdings in regulatory filings four times in each fiscal year, at the quarter-ends. For the second and fourth fiscal quarters, the lists appear in the fund’s semiannual and annual reports to shareholders. For the first and third fiscal quarters, the fund files the lists with the Securities and Exchange Commission on Form N-Q. Shareholders can look up the fund’s Forms N-Q on the SEC’s website at sec.gov. Forms N-Q may also be reviewed and copied at the SEC’s Public Reference Room (see the back cover of this report for further information).
| | |
| | | Market |
| | | Value• |
| | Shares | ($000) |
| Common Stocks (99.9%)1 | | |
| Basic Materials (3.3%) | | |
| Dow Chemical Co. | 4,402,841 | 226,658 |
| EI du Pont de Nemours | | |
| & Co. | 3,330,451 | 221,808 |
| LyondellBasell Industries | | |
| NV Class A | 1,366,082 | 118,713 |
| PPG Industries Inc. | 1,023,438 | 101,136 |
| Air Products & Chemicals | | |
| Inc. | 736,475 | 95,823 |
| International Paper Co. | 1,574,982 | 59,377 |
| Alcoa Inc. | 4,979,297 | 49,146 |
| Nucor Corp. | 1,214,748 | 48,954 |
| Celanese Corp. Class A | 557,846 | 37,560 |
| Eastman Chemical Co. | 536,551 | 36,223 |
| Newmont Mining Corp. | 2,012,505 | 36,205 |
| CF Industries Holdings | | |
| Inc. | 886,363 | 36,172 |
| Mosaic Co. | 1,211,798 | 33,433 |
| Freeport-McMoRan Inc. | 4,385,933 | 29,693 |
| Ashland Inc. | 254,331 | 26,120 |
| Albemarle Corp. | 426,327 | 23,879 |
| Avery Dennison Corp. | 345,503 | 21,649 |
| FMC Corp. | 507,855 | 19,872 |
| Reliance Steel & | | |
| Aluminum Co. | 258,106 | 14,947 |
| Huntsman Corp. | 393,936 | 4,479 |
| | | 1,241,847 |
| Consumer Goods (11.2%) | | |
| Procter & Gamble Co. | 10,338,611 | 820,989 |
| PepsiCo Inc. | 5,536,249 | 553,182 |
| Altria Group Inc. | 7,450,889 | 433,716 |
| Mondelez International | | |
| Inc. Class A | 5,737,122 | 257,253 |
| Ford Motor Co. | 14,812,155 | 208,703 |
| General Motors Co. | 5,322,316 | 181,012 |
| Kimberly-Clark Corp. | 1,379,374 | 175,594 |
| Kraft Heinz Co. | 2,305,586 | 167,754 |
| | | |
| | | | Market |
| | | | Value• |
| | | Shares | ($000) |
| | General Mills Inc. | 2,270,822 | 130,936 |
| | Johnson Controls Inc. | 2,461,654 | 97,211 |
| | Delphi Automotive plc | 1,063,862 | 91,205 |
| | Archer-Daniels-Midland | | |
| | Co. | 2,268,986 | 83,226 |
| | ConAgra Foods Inc. | 1,644,359 | 69,326 |
| | Kellogg Co. | 942,360 | 68,104 |
| | Dr Pepper Snapple Group | | |
| | Inc. | 717,538 | 66,875 |
| | Clorox Co. | 490,363 | 62,193 |
| | Tyson Foods Inc. Class A | 1,123,115 | 59,896 |
| | JM Smucker Co. | 454,908 | 56,108 |
| | Molson Coors Brewing Co. | | |
| | Class B | 557,187 | 52,331 |
| | Genuine Parts Co. | 544,349 | 46,754 |
| | Newell Rubbermaid Inc. | 1,015,345 | 44,756 |
| | Whirlpool Corp. | 297,254 | 43,658 |
| | Coca-Cola Enterprises Inc. | 776,727 | 38,246 |
| | Activision Blizzard Inc. | 973,896 | 37,699 |
| | Campbell Soup Co. | 706,791 | 37,142 |
| | Bunge Ltd. | 541,960 | 37,005 |
| | Lear Corp. | 286,360 | 35,174 |
| | Mattel Inc. | 1,290,788 | 35,071 |
| | Coach Inc. | 1,054,176 | 34,503 |
| | Stanley Black & Decker | | |
| | Inc. | 284,830 | 30,400 |
| | Hasbro Inc. | 426,909 | 28,757 |
| | PVH Corp. | 313,748 | 23,107 |
| | DR Horton Inc. | 664,284 | 21,277 |
| | PulteGroup Inc. | 1,191,749 | 21,237 |
| * | Edgewell Personal Care | | |
| | Co. | 235,890 | 18,487 |
| | Lennar Corp. Class A | 356,003 | 17,412 |
| | Goodyear Tire & Rubber | | |
| | Co. | 511,989 | 16,727 |
| | Leucadia National Corp. | 620,888 | 10,797 |
| ^ | Pilgrim’s Pride Corp. | 241,854 | 5,343 |
| | Lennar Corp. Class B | 1,431 | 57 |
| | | | 4,219,223 |
36
| | | |
| Value Index Fund | | |
| |
| |
| |
| | | | Market |
| | | | Value• |
| | | Shares | ($000) |
| Consumer Services (6.5%) | | |
| | CVS Health Corp. | 4,207,972 | 411,413 |
| | Wal-Mart Stores Inc. | 5,482,387 | 336,070 |
| | McKesson Corp. | 874,351 | 172,448 |
| | Target Corp. | 2,341,016 | 169,981 |
| | Delta Air Lines Inc. | 2,988,485 | 151,486 |
| | Kroger Co. | 3,513,845 | 146,984 |
| * | eBay Inc. | 4,335,255 | 119,133 |
| | Cardinal Health Inc. | 1,250,151 | 111,601 |
| | Time Warner Inc. | 1,442,397 | 93,280 |
| * | United Continental | | |
| | Holdings Inc. | 1,452,479 | 83,227 |
| | Sysco Corp. | 1,931,856 | 79,206 |
| | AmerisourceBergen Corp. | | |
| | Class A | 742,788 | 77,035 |
| | Omnicom Group Inc. | 920,115 | 69,616 |
| | Viacom Inc. Class B | 1,290,677 | 53,124 |
| | Carnival Corp. | 785,274 | 42,782 |
| | Macy’s Inc. | 1,195,055 | 41,803 |
| | Interpublic Group of Cos. | | |
| | Inc. | 1,545,484 | 35,979 |
| | Kohl’s Corp. | 739,947 | 35,244 |
| | Best Buy Co. Inc. | 1,114,019 | 33,922 |
| | Aramark | 866,473 | 27,944 |
| | Darden Restaurants Inc. | 438,234 | 27,889 |
| | News Corp. Class A | 1,892,143 | 25,279 |
| | Staples Inc. | 2,441,266 | 23,119 |
| * | Rite Aid Corp. | 1,984,505 | 15,559 |
| * | Liberty Media Corp. | 359,579 | 13,693 |
| | Wynn Resorts Ltd. | 154,696 | 10,703 |
| | Gap Inc. | 425,929 | 10,520 |
| * | Hertz Global Holdings Inc. | 716,008 | 10,189 |
| * | Liberty Media Corp. | | |
| | Class A | 173,498 | 6,810 |
| | News Corp. Class B | 12,704 | 177 |
| | | | 2,436,216 |
| Financials (23.3%) | | |
| * | Berkshire Hathaway Inc. | | |
| | Class B | 7,256,108 | 958,096 |
| | Wells Fargo & Co. | 17,469,428 | 949,638 |
| | JPMorgan Chase & Co. | 13,988,908 | 923,688 |
| | Bank of America Corp. | 39,569,190 | 665,949 |
| | Citigroup Inc. | 10,754,564 | 556,549 |
| | American International | | |
| | Group Inc. | 4,465,820 | 276,747 |
| | US Bancorp | 6,330,760 | 270,133 |
| | Goldman Sachs Group | | |
| | Inc. | 1,458,770 | 262,914 |
| | American Express Co. | 3,179,250 | 221,117 |
| | PNC Financial Services | | |
| | Group Inc. | 1,929,658 | 183,916 |
| | Morgan Stanley | 5,518,378 | 175,540 |
| | MetLife Inc. | 3,379,352 | 162,919 |
| | Bank of New York | | |
| | Mellon Corp. | 3,945,519 | 162,634 |
| | | |
| | | | Market |
| | | | Value• |
| | | Shares | ($000) |
| | Capital One Financial | | |
| | Corp. | 2,021,663 | 145,924 |
| | Prudential Financial Inc. | 1,706,026 | 138,888 |
| | ACE Ltd. | 1,170,166 | 136,734 |
| | Travelers Cos. Inc. | 1,155,905 | 130,455 |
| | Chubb Corp. | 862,755 | 114,436 |
| | BB&T Corp. | 2,964,374 | 112,083 |
| | CME Group Inc. | 1,220,943 | 110,617 |
| | State Street Corp. | 1,457,470 | 96,718 |
| *,^ | Synchrony Financial | 3,167,237 | 96,316 |
| | Allstate Corp. | 1,471,132 | 91,343 |
| | Aflac Inc. | 1,460,365 | 87,476 |
| | Discover Financial | | |
| | Services | 1,625,431 | 87,156 |
| | SunTrust Banks Inc. | 1,937,787 | 83,015 |
| | Ameriprise Financial Inc. | 661,235 | 70,369 |
| | Hartford Financial | | |
| | Services Group Inc. | 1,555,786 | 67,614 |
| | Progressive Corp. | 2,109,398 | 67,079 |
| | M&T Bank Corp. | 546,840 | 66,266 |
| | Fifth Third Bancorp | 3,017,598 | 60,654 |
| | Northern Trust Corp. | 834,481 | 60,158 |
| | Citizens Financial Group | | |
| | Inc. | 2,005,044 | 52,512 |
| | Franklin Resources Inc. | 1,371,007 | 50,480 |
| | Principal Financial Group | | |
| | Inc. | 1,112,494 | 50,040 |
| | Regions Financial Corp. | 4,961,705 | 47,632 |
| | Lincoln National Corp. | 940,551 | 47,272 |
| | XL Group plc Class A | 1,131,849 | 44,346 |
| | Loews Corp. | 1,145,315 | 43,980 |
| | KeyCorp | 3,176,011 | 41,892 |
| | First Republic Bank | 552,395 | 36,491 |
| | Cincinnati Financial Corp. | 592,115 | 35,035 |
| | FNF Group | 1,000,477 | 34,687 |
| | Western Union Co. | 1,921,858 | 34,420 |
| | HCP Inc. | 884,614 | 33,828 |
| | Annaly Capital | | |
| | Management Inc. | 3,605,769 | 33,822 |
| | Huntington Bancshares | | |
| | Inc. | 3,030,483 | 33,517 |
| * | Arch Capital Group Ltd. | 442,696 | 30,878 |
| | Unum Group | 926,329 | 30,837 |
| * | Ally Financial Inc. | 1,649,913 | 30,754 |
| | CIT Group Inc. | 764,717 | 30,359 |
| | Voya Financial Inc. | 819,202 | 30,237 |
| | Willis Group Holdings plc | 615,979 | 29,918 |
| | New York Community | | |
| | Bancorp Inc. | 1,753,418 | 28,616 |
| | Comerica Inc. | 672,681 | 28,138 |
| | Torchmark Corp. | 446,110 | 25,500 |
| | Nasdaq Inc. | 437,709 | 25,461 |
| | PartnerRe Ltd. | 163,478 | 22,844 |
| | American Capital Agency | | |
| | Corp. | 1,313,986 | 22,784 |
37
| | | |
| Value Index Fund | | |
| |
| |
| |
| | | | Market |
| | | | Value• |
| | | Shares | ($000) |
| | Everest Re Group Ltd. | 122,522 | 22,433 |
| | Host Hotels & Resorts | | |
| | Inc. | 1,431,008 | 21,952 |
| | Reinsurance Group of | | |
| | America Inc. Class A | 249,326 | 21,330 |
| | Zions Bancorporation | 776,343 | 21,194 |
| | Kimco Realty Corp. | 744,889 | 19,710 |
| | Axis Capital Holdings Ltd. | 347,195 | 19,519 |
| | WR Berkley Corp. | 351,168 | 19,226 |
| | People’s United Financial | | |
| | Inc. | 1,178,767 | 19,037 |
| | Legg Mason Inc. | 408,486 | 16,025 |
| | Navient Corp. | 1,374,021 | 15,733 |
| * | Alleghany Corp. | 28,022 | 13,393 |
| | Assurant Inc. | 124,845 | 10,055 |
| * | Santander Consumer | | |
| | USA Holdings Inc. | 410,561 | 6,507 |
| * | Berkshire Hathaway Inc. | | |
| | Class A | 14 | 2,769 |
| | | | 8,778,304 |
| Health Care (13.7%) | | |
| | Johnson & Johnson | 10,514,806 | 1,080,081 |
| | Pfizer Inc. | 23,458,454 | 757,239 |
| | Merck & Co. Inc. | 10,615,945 | 560,734 |
| | Bristol-Myers Squibb Co. | 6,339,742 | 436,111 |
| | UnitedHealth Group Inc. | 3,621,928 | 426,084 |
| | Eli Lilly & Co. | 3,789,723 | 319,322 |
| | Abbott Laboratories | 5,668,770 | 254,584 |
| | Medtronic plc | 2,685,912 | 206,600 |
| | Aetna Inc. | 1,324,879 | 143,246 |
| | Cigna Corp. | 978,865 | 143,237 |
| | Anthem Inc. | 991,559 | 138,263 |
| | Humana Inc. | 563,308 | 100,556 |
| * | Boston Scientific Corp. | 5,114,823 | 94,317 |
| * | HCA Holdings Inc. | 1,240,064 | 83,866 |
| | Baxter International Inc. | 2,080,137 | 79,357 |
| | Zimmer Biomet Holdings | | |
| | Inc. | 657,907 | 67,495 |
| | St. Jude Medical Inc. | 1,073,803 | 66,329 |
| * | Endo International plc | 860,980 | 52,709 |
| | Baxalta Inc. | 1,032,705 | 40,307 |
| | Quest Diagnostics Inc. | 545,070 | 38,776 |
| * | Hologic Inc. | 967,801 | 37,444 |
| | Universal Health | | |
| | Services Inc. Class B | 172,953 | 20,666 |
| | Patterson Cos. Inc. | 332,755 | 15,044 |
| | | | 5,162,367 |
| Industrials (11.3%) | | |
| | General Electric Co. | 35,865,510 | 1,117,211 |
| | United Technologies | | |
| | Corp. | 3,202,231 | 307,638 |
| | Honeywell International | | |
| | Inc. | 2,782,244 | 288,157 |
| | Lockheed Martin Corp. | 992,606 | 215,544 |
| | | |
| | | | Market |
| | | | Value• |
| | | Shares | ($000) |
| | Boeing Co. | 1,209,290 | 174,851 |
| | Caterpillar Inc. | 2,212,358 | 150,352 |
| | Raytheon Co. | 1,144,129 | 142,478 |
| | General Dynamics Corp. | 1,020,984 | 140,242 |
| | Northrop Grumman Corp. | 692,921 | 130,831 |
| | Emerson Electric Co. | 2,486,885 | 118,948 |
| | Illinois Tool Works Inc. | 1,174,082 | 108,814 |
| | CSX Corp. | 3,707,037 | 96,198 |
| | Norfolk Southern Corp. | 1,134,127 | 95,936 |
| | TE Connectivity Ltd. | 1,468,210 | 94,861 |
| | Eaton Corp. plc | 1,757,759 | 91,474 |
| | Waste Management Inc. | 1,697,711 | 90,607 |
| | Deere & Co. | 1,185,397 | 90,410 |
| | FedEx Corp. | 509,431 | 75,900 |
| | Ingersoll-Rand plc | 991,842 | 54,839 |
| | Tyco International plc | 1,606,656 | 51,236 |
| | Parker-Hannifin Corp. | 516,706 | 50,110 |
| | Rockwell Collins Inc. | 499,635 | 46,116 |
| | WestRock Co. | 995,379 | 45,409 |
| | Republic Services Inc. | | |
| | Class A | 924,177 | 40,655 |
| | Xerox Corp. | 3,656,526 | 38,869 |
| | Ball Corp. | 518,459 | 37,708 |
| | Dover Corp. | 589,397 | 36,136 |
| | L-3 Communications | | |
| | Holdings Inc. | 268,461 | 32,084 |
| | PACCAR Inc. | 670,850 | 31,798 |
| | Cummins Inc. | 336,976 | 29,657 |
| * | Crown Holdings Inc. | 530,776 | 26,910 |
| | Fluor Corp. | 539,168 | 25,460 |
| | Xylem Inc. | 682,883 | 24,925 |
| | ManpowerGroup Inc. | 279,160 | 23,531 |
| | Avnet Inc. | 500,614 | 21,446 |
| | Flowserve Corp. | 497,363 | 20,929 |
| | ADT Corp. | 625,446 | 20,627 |
| * | Jacobs Engineering | | |
| | Group Inc. | 464,771 | 19,497 |
| * | Arrow Electronics Inc. | 358,213 | 19,408 |
| | Owens Corning | 209,993 | 9,876 |
| | Allison Transmission | | |
| | Holdings Inc. | 293,072 | 7,588 |
| | AGCO Corp. | 137,791 | 6,254 |
| * | Quanta Services Inc. | 145,543 | 2,947 |
| * | Colfax Corp. | 82,779 | 1,933 |
| | | | 4,256,400 |
| Oil & Gas (9.8%) | | |
| | Exxon Mobil Corp. | 15,819,839 | 1,233,156 |
| | Chevron Corp. | 7,151,992 | 643,393 |
| | ConocoPhillips | 4,691,774 | 219,059 |
| | Occidental Petroleum | | |
| | Corp. | 2,902,325 | 196,226 |
| | Schlumberger Ltd. | 2,396,160 | 167,132 |
| | Phillips 66 | 1,824,237 | 149,223 |
| | Valero Energy Corp. | 1,829,441 | 129,360 |
| | Halliburton Co. | 3,089,750 | 105,175 |
38
| | | |
| Value Index Fund | | |
| |
| |
| |
| | | | Market |
| | | | Value• |
| | | Shares | ($000) |
| | Marathon Petroleum | | |
| | Corp. | 2,025,451 | 104,999 |
| | Baker Hughes Inc. | 1,658,382 | 76,534 |
| | Apache Corp. | 1,435,963 | 63,857 |
| | Spectra Energy Corp. | 2,550,820 | 61,067 |
| | Kinder Morgan Inc. | 3,604,051 | 53,772 |
| | Tesoro Corp. | 457,580 | 48,215 |
| | National Oilwell Varco Inc. | 1,428,057 | 47,826 |
| | Devon Energy Corp. | 1,484,106 | 47,491 |
| | Hess Corp. | 979,075 | 47,466 |
| * | Cameron International | | |
| | Corp. | 725,691 | 45,864 |
| | Marathon Oil Corp. | 2,576,442 | 32,437 |
| | Columbia Pipeline Group | | |
| | Inc. | 1,480,996 | 29,620 |
| | HollyFrontier Corp. | 696,140 | 27,769 |
| * | FMC Technologies Inc. | 866,465 | 25,136 |
| * | Weatherford International | | |
| | plc | 2,956,119 | 24,802 |
| | Helmerich & Payne Inc. | 388,322 | 20,795 |
| | OGE Energy Corp. | 757,412 | 19,912 |
| ^ | Transocean Ltd. | 1,310,328 | 16,222 |
| | Murphy Oil Corp. | 620,957 | 13,941 |
| | Energen Corp. | 300,354 | 12,312 |
| | Oceaneering International | | |
| | Inc. | 186,288 | 6,990 |
| | Ensco plc Class A | 444,789 | 6,845 |
| * | Southwestern Energy Co. | 726,168 | 5,163 |
| ^ | Chesapeake Energy Corp. | 1,130,656 | 5,088 |
| | | | 3,686,847 |
| Other (0.0%)2 | | |
| * | Safeway Inc CVR (Casa | | |
| | Ley) Expire 1/30/2018 | 376 | — |
| * | Safeway Inc CVR (PDC) | | |
| | Expire 1/30/2017 | 376 | — |
| | | | — |
| Technology (10.9%) | | |
| | Microsoft Corp. | 28,837,683 | 1,599,915 |
| | Intel Corp. | 17,933,012 | 617,792 |
| | Cisco Systems Inc. | 19,289,936 | 523,818 |
| | International Business | | |
| | Machines Corp. | 3,317,875 | 456,606 |
| | Broadcom Corp. Class A | 2,131,364 | 123,235 |
| | Hewlett Packard | | |
| | Enterprise Co. | 6,856,589 | 104,220 |
| | Corning Inc. | 4,498,117 | 82,226 |
| | HP Inc. | 6,863,433 | 81,263 |
| | SanDisk Corp. | 762,547 | 57,946 |
| | Symantec Corp. | 2,566,892 | 53,905 |
| | Western Digital Corp. | 837,093 | 50,267 |
| | Applied Materials Inc. | 2,282,243 | 42,609 |
| | Seagate Technology plc | 1,136,991 | 41,682 |
| | Motorola Solutions Inc. | 603,807 | 41,331 |
| | Harris Corp. | 472,908 | 41,096 |
| | | |
| | | | Market |
| | | | Value• |
| | | Shares | ($000) |
| | CA Inc. | 1,251,919 | 35,755 |
| | NetApp Inc. | 1,122,269 | 29,774 |
| * | Synopsys Inc. | 593,712 | 27,079 |
| | Juniper Networks Inc. | 696,330 | 19,219 |
| * | Nuance Communications | | |
| | Inc. | 940,076 | 18,698 |
| | Garmin Ltd. | 433,912 | 16,129 |
| | Marvell Technology | | |
| | Group Ltd. | 1,572,538 | 13,870 |
| * | IMS Health Holdings Inc. | 497,625 | 12,674 |
| | Computer Sciences Corp. | 264,681 | 8,650 |
| | CSRA Inc. | 257,735 | 7,732 |
| * | Teradata Corp. | 252,135 | 6,661 |
| | | | 4,114,152 |
| Telecommunications (4.4%) | | |
| | AT&T Inc. | 23,378,626 | 804,459 |
| | Verizon | | |
| | Communications Inc. | 15,462,361 | 714,670 |
| | CenturyLink Inc. | 2,086,008 | 52,484 |
| * | T-Mobile US Inc. | 1,085,895 | 42,480 |
| | Frontier | | |
| | Communications Corp. | 4,430,896 | 20,692 |
| *,^ | Sprint Corp. | 2,255,677 | 8,166 |
| | | | 1,642,951 |
| Utilities (5.5%) | | |
| | Duke Energy Corp. | 2,615,733 | 186,737 |
| | NextEra Energy Inc. | 1,750,048 | 181,813 |
| | Southern Co. | 3,453,878 | 161,607 |
| | Dominion Resources Inc. | 2,262,145 | 153,012 |
| | American Electric Power | | |
| | Co. Inc. | 1,865,254 | 108,688 |
| | PG&E Corp. | 1,862,971 | 99,091 |
| | Exelon Corp. | 3,496,448 | 97,096 |
| | PPL Corp. | 2,547,473 | 86,945 |
| | Sempra Energy | 896,590 | 84,288 |
| | Public Service Enterprise | | |
| | Group Inc. | 1,921,653 | 74,349 |
| | Edison International | 1,237,464 | 73,270 |
| | Consolidated Edison Inc. | 1,113,543 | 71,567 |
| | Xcel Energy Inc. | 1,927,608 | 69,220 |
| | WEC Energy Group Inc. | 1,199,395 | 61,541 |
| | Eversource Energy | 1,204,984 | 61,539 |
| | DTE Energy Co. | 681,432 | 54,644 |
| | FirstEnergy Corp. | 1,607,686 | 51,012 |
| | Entergy Corp. | 678,040 | 46,351 |
| | American Water Works | | |
| | Co. Inc. | 682,370 | 40,772 |
| | Ameren Corp. | 922,588 | 39,884 |
| | CMS Energy Corp. | 1,055,734 | 38,091 |
| | SCANA Corp. | 489,452 | 29,607 |
| | CenterPoint Energy Inc. | 1,555,787 | 28,564 |
| | Pinnacle West Capital | | |
| | Corp. | 421,962 | 27,208 |
| | Alliant Energy Corp. | 429,992 | 26,853 |
39
| | | |
| Value Index Fund | | |
| |
| |
| |
| | | | Market |
| | | | Value• |
| | | Shares | ($000) |
| | Pepco Holdings Inc. | 965,253 | 25,106 |
| | AES Corp. | 2,551,974 | 24,422 |
| | NiSource Inc. | 1,212,120 | 23,649 |
| | ONEOK Inc. | 793,465 | 19,567 |
| | NRG Energy Inc. | 593,215 | 6,982 |
| | National Fuel Gas Co. | 151,849 | 6,492 |
| * | Avangrid Inc. | 117,061 | 4,495 |
| | | | 2,064,462 |
| Total Common Stocks | | |
| (Cost $32,272,131) | | 37,602,769 |
| Temporary Cash Investments (0.2%)1 | |
| Money Market Fund (0.2%) | | |
| 3,4 | Vanguard Market | | |
| | Liquidity Fund, | | |
| | 0.363% | 60,837,264 | 60,837 |
| |
| | | Face | |
| | | Amount | |
| | | ($000) | |
| U.S. Government and Agency Obligations (0.0%) |
| 5,6 | Fannie Mae Discount | | |
| | Notes, 0.250%, 4/20/16 | 3,000 | 2,997 |
| 5 | Freddie Mac Discount | | |
| | Notes, 0.220%, 4/15/16 | 2,900 | 2,897 |
| | | | 5,894 |
| Total Temporary Cash Investments | |
| (Cost $66,733) | | 66,731 |
| Total Investments (100.1%) | | |
| (Cost $32,338,864) | | 37,669,500 |
| |
| | Amount |
| | ($000) |
| Other Assets and Liabilities (-0.1%) | |
| Other Assets | |
| Investment in Vanguard | 3,287 |
| Receivables for Accrued Income | 62,374 |
| Receivables for Investment Securities | |
| Sold | 20,795 |
| Receivables for Capital Shares Issued | 19,335 |
| Total Other Assets | 105,791 |
| Liabilities | |
| Payables for Investment Securities | |
| Purchased | (51,806) |
| Collateral for Securities on Loan | (22,732) |
| Payables for Capital Shares Redeemed | (47,946) |
| Payables to Vanguard | (23,387) |
| Other Liabilities | (460) |
| Total Liabilities | (146,331) |
| Net Assets (100%) | 37,628,960 |
| |
| |
| At December 31, 2015, net assets consisted of: |
| | Amount |
| | ($000) |
| Paid-in Capital | 32,915,457 |
| Overdistributed Net Investment Income | (11,718) |
| Accumulated Net Realized Losses | (605,344) |
| Unrealized Appreciation (Depreciation) | |
| Investment Securities | 5,330,636 |
| Futures Contracts | (71) |
| Net Assets | 37,628,960 |
40
| |
| Value Index Fund | |
| |
| |
| |
| |
| | Amount |
| | ($000) |
| Investor Shares—Net Assets | |
| Applicable to 43,905,386 outstanding | |
| $.001 par value shares of beneficial | |
| interest (unlimited authorization) | 1,397,166 |
| Net Asset Value Per Share— | |
| Investor Shares | $31.82 |
| |
| |
| ETF Shares—Net Assets | |
| Applicable to 228,639,212 outstanding | |
| $.001 par value shares of beneficial | |
| interest (unlimited authorization) | 18,648,401 |
| Net Asset Value Per Share— | |
| ETF Shares | $81.56 |
| |
| | Amount |
| | ($000) |
| Admiral Shares—Net Assets | |
| Applicable to 327,108,244 outstanding | |
| $.001 par value shares of beneficial | |
| interest (unlimited authorization) | 10,407,547 |
| Net Asset Value Per Share— | |
| Admiral Shares | $31.82 |
| |
| |
| Institutional Shares—Net Assets | |
| Applicable to 225,544,281 outstanding | |
| $.001 par value shares of beneficial | |
| interest (unlimited authorization) | 7,175,846 |
| Net Asset Value Per Share— | |
| Institutional Shares | $31.82 |
• See Note A in Notes to Financial Statements.
* Non-income-producing security.
^ Includes partial security positions on loan to broker-dealers. The total value of securities on loan is $21,019,000.
1 The fund invests a portion of its cash reserves in equity markets through the use of index futures contracts. After giving effect to futures investments, the fund’s effective common stock and temporary cash investment positions represent 100.0% and 0.1%, respectively, of net assets.
2 “Other” represents securities that are not classified by the fund’s benchmark index.
3 Affiliated money market fund available only to Vanguard funds and certain trusts and accounts managed by Vanguard. Rate shown is the 7-day yield.
4 Includes $22,732,000 of collateral received for securities on loan.
5 The issuer was placed under federal conservatorship in September 2008; since that time, its daily operations have been managed by the Federal Housing Finance Agency and it receives capital from the U.S. Treasury, as needed to maintain a positive net worth, in exchange for senior preferred stock.
6 Securities with a value of $1,299,000 have been segregated as initial margin for open futures contracts.
See accompanying Notes, which are an integral part of the Financial Statements.
41
| |
| Value Index Fund | |
| |
| |
| Statement of Operations | |
| |
| | Year Ended |
| | December 31, 2015 |
| | ($000) |
| Investment Income | |
| Income | |
| Dividends | 991,998 |
| Interest1 | 52 |
| Securities Lending | 2,163 |
| Total Income | 994,213 |
| Expenses | |
| The Vanguard Group—Note B | |
| Investment Advisory Services | 2,921 |
| Management and Administrative—Investor Shares | 2,769 |
| Management and Administrative—ETF Shares | 10,498 |
| Management and Administrative—Admiral Shares | 5,800 |
| Management and Administrative—Institutional Shares | 4,067 |
| Marketing and Distribution—Investor Shares | 324 |
| Marketing and Distribution—ETF Shares | 1,892 |
| Marketing and Distribution—Admiral Shares | 1,103 |
| Marketing and Distribution—Institutional Shares | 523 |
| Custodian Fees | 351 |
| Auditing Fees | 35 |
| Shareholders’ Reports—Investor Shares | 59 |
| Shareholders’ Reports—ETF Shares | 408 |
| Shareholders’ Reports—Admiral Shares | 66 |
| Shareholders’ Reports—Institutional Shares | 91 |
| Trustees’ Fees and Expenses | 25 |
| Total Expenses | 30,932 |
| Net Investment Income | 963,281 |
| Realized Net Gain (Loss) | |
| Investment Securities Sold | 999,548 |
| Futures Contracts | 1,988 |
| Realized Net Gain (Loss) | 1,001,536 |
| Change in Unrealized Appreciation (Depreciation) | |
| Investment Securities | (2,333,435) |
| Futures Contracts | (828) |
| Change in Unrealized Appreciation (Depreciation) | (2,334,263) |
| Net Increase (Decrease) in Net Assets Resulting from Operations | (369,446) |
| 1 Interest income from an affiliated company of the fund was $45,000. | |
| |
| |
| |
| See accompanying Notes, which are an integral part of the Financial Statements. | |
42
| | |
| Value Index Fund | | |
| |
| |
| Statement of Changes in Net Assets | | |
| |
| | Year Ended December 31, |
| | 2015 | 2014 |
| | ($000) | ($000) |
| Increase (Decrease) in Net Assets | | |
| Operations | | |
| Net Investment Income | 963,281 | 760,683 |
| Realized Net Gain (Loss) | 1,001,536 | 775,230 |
| Change in Unrealized Appreciation (Depreciation) | (2,334,263) | 2,496,375 |
| Net Increase (Decrease) in Net Assets Resulting from Operations | (369,446) | 4,032,288 |
| Distributions | | |
| Net Investment Income | | |
| Investor Shares | (35,713) | (35,831) |
| ETF Shares | (471,450) | (347,057) |
| Admiral Shares | (258,590) | (167,901) |
| Signal Shares | — | (36,929) |
| Institutional Shares | (198,037) | (168,638) |
| Realized Capital Gain | | |
| Investor Shares | — | — |
| ETF Shares | — | — |
| Admiral Shares | — | — |
| Signal Shares | — | — |
| Institutional Shares | — | — |
| Total Distributions | (963,790) | (756,356) |
| Capital Share Transactions | | |
| Investor Shares | (143,297) | (306,591) |
| ETF Shares | 1,990,497 | 3,316,990 |
| Admiral Shares | 1,048,344 | 3,915,243 |
| Signal Shares | — | (3,070,690) |
| Institutional Shares | (364,225) | 700,914 |
| Net Increase (Decrease) from Capital Share Transactions | 2,531,319 | 4,555,866 |
| Total Increase (Decrease) | 1,198,083 | 7,831,798 |
| Net Assets | | |
| Beginning of Period | 36,430,877 | 28,599,079 |
| End of Period1 | 37,628,960 | 36,430,877 |
1 Net Assets—End of Period includes undistributed (overdistributed) net investment income of ($11,718,000) and ($11,209,000).
See accompanying Notes, which are an integral part of the Financial Statements.
43
| | | | | |
| Value Index Fund | | | | | |
| |
| |
| Financial Highlights | | | | | |
| |
| |
| Investor Shares | | | | | |
| |
| For a Share Outstanding | | | Year Ended December 31, |
| Throughout Each Period | 2015 | 2014 | 2013 | 2012 | 2011 |
| Net Asset Value, Beginning of Period | $32.95 | $29.78 | $22.93 | $20.47 | $20.79 |
| Investment Operations | | | | | |
| Net Investment Income | .782 | .691 | .621 | . 595 | . 521 |
| Net Realized and Unrealized Gain (Loss) | | | | | |
| on Investments | (1.130) | 3.164 | 6.847 | 2.458 | (. 325) |
| Total from Investment Operations | (.348) | 3.855 | 7.468 | 3.053 | .196 |
| Distributions | | | | | |
| Dividends from Net Investment Income | (.782) | (. 685) | (.618) | (. 593) | (. 516) |
| Distributions from Realized Capital Gains | — | — | — | — | — |
| Total Distributions | (.782) | (. 685) | (.618) | (. 593) | (. 516) |
| Net Asset Value, End of Period | $31.82 | $32.95 | $29.78 | $22.93 | $20.47 |
| |
| Total Return1 | -1.03% | 13.05% | 32.85% | 15.00% | 1.00% |
| |
| Ratios/Supplemental Data | | | | | |
| Net Assets, End of Period (Millions) | $1,397 | $1,593 | $1,731 | $1,482 | $1,814 |
| Ratio of Total Expenses to Average Net Assets | 0.22% | 0.23% | 0.24% | 0.24% | 0.24% |
| Ratio of Net Investment Income to | | | | | |
| Average Net Assets | 2.44% | 2.25% | 2.35% | 2.71% | 2.52% |
| Portfolio Turnover Rate2 | 8% | 6% | 25% | 22% | 23% |
1 Total returns do not include account service fees that may have applied in the periods shown. Fund prospectuses provide information about any applicable account service fees.
2 Excludes the value of portfolio securities received or delivered as a result of in-kind purchases or redemptions of the fund’s capital shares, including ETF Creation Units.
See accompanying Notes, which are an integral part of the Financial Statements.
44
| | | | | |
| Value Index Fund | | | | | |
| |
| |
| Financial Highlights | | | | | |
| |
| |
| ETF Shares | | | | | |
| |
| For a Share Outstanding | | | Year Ended December 31, |
| Throughout Each Period | 2015 | 2014 | 2013 | 2012 | 2011 |
| Net Asset Value, Beginning of Period | $84.45 | $76.34 | $58.79 | $52.48 | $53.29 |
| Investment Operations | | | | | |
| Net Investment Income | 2.123 | 1.888 | 1.700 | 1.613 | 1.414 |
| Net Realized and Unrealized Gain (Loss) | | | | | |
| on Investments | (2.890) | 8.095 | 17.538 | 6.305 | (. 821) |
| Total from Investment Operations | (.767) | 9.983 | 19.238 | 7.918 | .593 |
| Distributions | | | | | |
| Dividends from Net Investment Income | (2.123) | (1.873) | (1.688) | (1.608) | (1.403) |
| Distributions from Realized Capital Gains | — | — | — | — | — |
| Total Distributions | (2.123) | (1.873) | (1.688) | (1.608) | (1.403) |
| Net Asset Value, End of Period | $81.56 | $84.45 | $76.34 | $58.79 | $52.48 |
| |
| Total Return | -0.89% | 13.19% | 33.03% | 15.19% | 1.16% |
| |
| Ratios/Supplemental Data | | | | | |
| Net Assets, End of Period (Millions) | $18,648 | $17,277 | $12,461 | $7,027 | $5,049 |
| Ratio of Total Expenses to Average Net Assets | 0.08% | 0.09% | 0.09% | 0.10% | 0.10% |
| Ratio of Net Investment Income to | | | | | |
| Average Net Assets | 2.58% | 2.39% | 2.50% | 2.85% | 2.66% |
| Portfolio Turnover Rate1 | 8% | 6% | 25% | 22% | 23% |
1 Excludes the value of portfolio securities received or delivered as a result of in-kind purchases or redemptions of the fund’s capital shares, including ETF Creation Units.
See accompanying Notes, which are an integral part of the Financial Statements.
45
| | | | | |
| Value Index Fund | | | | | |
| |
| |
| Financial Highlights | | | | | |
| |
| |
| Admiral Shares | | | | | |
| |
| For a Share Outstanding | | | Year Ended December 31, |
| Throughout Each Period | 2015 | 2014 | 2013 | 2012 | 2011 |
| Net Asset Value, Beginning of Period | $32.94 | $29.78 | $22.93 | $20.47 | $20.79 |
| Investment Operations | | | | | |
| Net Investment Income | . 829 | .737 | .663 | .629 | . 551 |
| Net Realized and Unrealized Gain (Loss) | | | | | |
| on Investments | (1.121) | 3.154 | 6.845 | 2.458 | (. 325) |
| Total from Investment Operations | (.292) | 3.891 | 7.508 | 3.087 | .226 |
| Distributions | | | | | |
| Dividends from Net Investment Income | (.828) | (.731) | (.658) | (.627) | (.546) |
| Distributions from Realized Capital Gains | — | — | — | — | — |
| Total Distributions | (.828) | (.731) | (.658) | (.627) | (.546) |
| Net Asset Value, End of Period | $31.82 | $32.94 | $29.78 | $22.93 | $20.47 |
| |
| Total Return1 | -0.86% | 13.18% | 33.05% | 15.18% | 1.14% |
| |
| Ratios/Supplemental Data | | | | | |
| Net Assets, End of Period (Millions) | $10,408 | $9,701 | $5,054 | $3,539 | $3,116 |
| Ratio of Total Expenses to Average Net Assets | 0.08% | 0.09% | 0.09% | 0.10% | 0.10% |
| Ratio of Net Investment Income to | | | | | |
| Average Net Assets | 2.58% | 2.39% | 2.50% | 2.85% | 2.66% |
| Portfolio Turnover Rate2 | 8% | 6% | 25% | 22% | 23% |
1 Total returns do not include account service fees that may have applied in the periods shown. Fund prospectuses provide information about any applicable account service fees.
2 Excludes the value of portfolio securities received or delivered as a result of in-kind purchases or redemptions of the fund’s capital shares, including ETF Creation Units.
See accompanying Notes, which are an integral part of the Financial Statements.
46
| | | | | |
| Value Index Fund | | | | | |
| |
| |
| Financial Highlights | | | | | |
| |
| |
| Institutional Shares | | | | | |
| |
| For a Share Outstanding | | | Year Ended December 31, |
| Throughout Each Period | 2015 | 2014 | 2013 | 2012 | 2011 |
| Net Asset Value, Beginning of Period | $32.94 | $29.78 | $22.93 | $20.47 | $20.79 |
| Investment Operations | | | | | |
| Net Investment Income | . 831 | .739 | .666 | .633 | .556 |
| Net Realized and Unrealized Gain (Loss) | | | | | |
| on Investments | (1.120) | 3.154 | 6.846 | 2.458 | (. 325) |
| Total from Investment Operations | (.289) | 3.893 | 7.512 | 3.091 | .231 |
| Distributions | | | | | |
| Dividends from Net Investment Income | (.831) | (.733) | (. 662) | (. 631) | (. 551) |
| Distributions from Realized Capital Gains | — | — | — | — | — |
| Total Distributions | (.831) | (.733) | (. 662) | (. 631) | (. 551) |
| Net Asset Value, End of Period | $31.82 | $32.94 | $29.78 | $22.93 | $20.47 |
| |
| Total Return | -0.85% | 13.19% | 33.07% | 15.20% | 1.17% |
| |
| Ratios/Supplemental Data | | | | | |
| Net Assets, End of Period (Millions) | $7,176 | $7,860 | $6,431 | $4,369 | $3,449 |
| Ratio of Total Expenses to Average Net Assets | 0.07% | 0.08% | 0.08% | 0.08% | 0.08% |
| Ratio of Net Investment Income to | | | | | |
| Average Net Assets | 2.59% | 2.40% | 2.51% | 2.87% | 2.68% |
| Portfolio Turnover Rate1 | 8% | 6% | 25% | 22% | 23% |
1 Excludes the value of portfolio securities received or delivered as a result of in-kind purchases or redemptions of the fund’s capital shares, including ETF Creation Units.
See accompanying Notes, which are an integral part of the Financial Statements.
47
Value Index Fund
Notes to Financial Statements
Vanguard Value Index Fund is registered under the Investment Company Act of 1940 as an open-end investment company, or mutual fund. The fund offers four classes of shares: Investor Shares, ETF Shares, Admiral Shares, and Institutional Shares. Investor Shares are available to any investor who meets the fund’s minimum purchase requirements. ETF Shares are listed for trading on NYSE Arca; they can be purchased and sold through a broker. Admiral Shares and Institutional Shares are designed for investors who meet certain administrative, service, and account-size criteria. Prior to October 24, 2014, the fund offered Signal Shares. Effective at the close of business on October 24, 2014, the Signal Shares were converted to Admiral Shares.
A. The following significant accounting policies conform to generally accepted accounting principles for U.S. investment companies. The fund consistently follows such policies in preparing its financial statements.
1. Security Valuation: Securities are valued as of the close of trading on the New York Stock Exchange (generally 4 p.m., Eastern time) on the valuation date. Equity securities are valued at the latest quoted sales prices or official closing prices taken from the primary market in which each security trades; such securities not traded on the valuation date are valued at the mean of the latest quoted bid and asked prices. Securities for which market quotations are not readily available, or whose values have been materially affected by events occurring before the fund’s pricing time but after the close of the securities’ primary markets, are valued by methods deemed by the board of trustees to represent fair value. Investments in Vanguard Market Liquidity Fund are valued at that fund’s net asset value. Temporary cash investments acquired over 60 days to maturity are valued using the latest bid prices or using valuations based on a matrix system (which considers such factors as security prices, yields, maturities, and ratings), both as furnished by independent pricing services. Other temporary cash investments are valued at amortized cost, which approximates market value.
2. Futures Contracts: The fund uses index futures contracts to a limited extent, with the objectives of maintaining full exposure to the stock market, enhancing returns, maintaining liquidity, and minimizing transaction costs. The fund may purchase futures contracts to immediately invest incoming cash in the market, or sell futures in response to cash outflows, thereby simulating a fully invested position in the underlying index while maintaining a cash balance for liquidity. The fund may seek to enhance returns by using futures contracts instead of the underlying securities when futures are believed to be priced more attractively than the underlying securities. The primary risks associated with the use of futures contracts are imperfect correlation between changes in market values of stocks held by the fund and the prices of futures contracts, and the possibility of an illiquid market. Counterparty risk involving futures is mitigated because a regulated clearinghouse is the counterparty instead of the clearing broker. To further mitigate counterparty risk, the fund trades futures contracts on an exchange, monitors the financial strength of its clearing brokers and clearinghouse, and has entered into clearing agreements with its clearing brokers. The clearinghouse imposes initial margin requirements to secure the fund’s performance and requires daily settlement of variation margin representing changes in the market value of each contract.
Futures contracts are valued at their quoted daily settlement prices. The aggregate settlement values of the contracts are not recorded in the Statement of Net Assets. Fluctuations in the value of the contracts are recorded in the Statement of Net Assets as an asset (liability) and in the Statement of Operations as unrealized appreciation (depreciation) until the contracts are closed, when they are recorded as realized futures gains (losses).
48
Value Index Fund
During the year ended December 31, 2015, the fund’s average investments in long and short futures contracts represented less than 1% and 0% of net assets, respectively, based on the average of aggregate settlement values at each quarter-end during the period.
3. Federal Income Taxes: The fund intends to continue to qualify as a regulated investment company and distribute all of its taxable income. Management has analyzed the fund’s tax positions taken for all open federal income tax years (December 31, 2012–2015), and has concluded that no provision for federal income tax is required in the fund’s financial statements.
4. Distributions: Distributions to shareholders are recorded on the ex-dividend date.
5. Securities Lending: To earn additional income, the fund lends its securities to qualified institutional borrowers. Security loans are subject to termination by the fund at any time and are required to be secured at all times by collateral in an amount at least equal to the market value of securities loaned. Daily market fluctuations could cause the value of loaned securities to be more or less than the value of the collateral received. When this occurs, the collateral is adjusted and settled on the next business day. The fund further mitigates its counterparty risk by entering into securities lending transactions only with a diverse group of prequalified counterparties, monitoring their financial strength, and entering into master securities lending agreements with its counterparties. The master securities lending agreements provide that, in the event of a counterparty’s default (including bankruptcy), the fund may terminate any loans with that borrower, determine the net amount owed, and sell or retain the collateral up to the net amount owed to the fund; however, such actions may be subject to legal proceedings. While collateral mitigates counterparty risk, in the absence of a default the fund may experience delays and costs in recovering the securities loaned. The fund invests cash collateral received in Vanguard Market Liquidity Fund, and records a liability in the Statement of Net Assets for the return of the collateral, during the period the securities are on loan. Securities lending income represents fees charged to borrowers plus income earned on invested cash collateral, less expenses associated with the loan.
6. Credit Facility: The fund and certain other funds managed by The Vanguard Group (“Vanguard”) participate in a $3 billion committed credit facility provided by a syndicate of lenders pursuant to a credit agreement that may be renewed annually; each fund is individually liable for its borrowings, if any, under the credit facility. Borrowings may be utilized for temporary and emergency purposes, and are subject to the fund’s regulatory and contractual borrowing restrictions. The participating funds are charged administrative fees and an annual commitment fee of 0.06% of the undrawn amount of the facility; these fees are allocated to the funds based on a method approved by the fund’s board of trustees and included in Management and Administrative expenses on the fund’s Statement of Operations. Any borrowings under this facility bear interest at a rate equal to the higher of the federal funds rate or LIBOR reference rate plus an agreed-upon spread.
The fund had no borrowings outstanding at December 31, 2015, or at any time during the period then ended.
7. Other: Dividend income is recorded on the ex-dividend date. Interest income includes income distributions received from Vanguard Market Liquidity Fund and is accrued daily. Premiums and discounts on debt securities purchased are amortized and accreted, respectively, to interest income over the lives of the respective securities. Security transactions are accounted for on the date securities are bought or sold. Costs used to determine realized gains (losses) on the sale of investment securities are those of the specific securities sold.
49
Value Index Fund
Each class of shares has equal rights as to assets and earnings, except that each class separately bears certain class-specific expenses related to maintenance of shareholder accounts (included in Management and Administrative expenses) and shareholder reporting. Marketing and distribution expenses are allocated to each class of shares based on a method approved by the board of trustees. Income, other non-class-specific expenses, and gains and losses on investments are allocated to each class of shares based on its relative net assets.
B. In accordance with the terms of a Funds’ Service Agreement (the “FSA”) between Vanguard and the fund, Vanguard furnishes to the fund investment advisory, corporate management, administrative, marketing, and distribution services at Vanguard’s cost of operations (as defined by the FSA). These costs of operations are allocated to the fund based on methods and guidelines approved by the board of trustees. Vanguard does not require reimbursement in the current period for certain costs of operations (such as deferred compensation/benefits and risk/insurance costs); the fund’s liability for these costs of operations is included in Payables to Vanguard on the Statement of Net Assets.
Upon the request of Vanguard, the fund may invest up to 0.40% of its net assets as capital in Vanguard. At December 31, 2015, the fund had contributed to Vanguard capital in the amount of $3,287,000, representing 0.01% of the fund’s net assets and 1.31% of Vanguard’s capitalization. The fund’s trustees and officers are also directors and employees, respectively, of Vanguard.
C. Various inputs may be used to determine the value of the fund’s investments. These inputs are summarized in three broad levels for financial statement purposes. The inputs or methodologies used to value securities are not necessarily an indication of the risk associated with investing in those securities.
Level 1—Quoted prices in active markets for identical securities.
Level 2—Other significant observable inputs (including quoted prices for similar securities, interest rates, prepayment speeds, credit risk, etc.).
Level 3—Significant unobservable inputs (including the fund’s own assumptions used to determine the fair value of investments).
The following table summarizes the market value of the fund’s investments as of December 31, 2015, based on the inputs used to value them:
| | | |
| | Level 1 | Level 2 | Level 3 |
| Investments | ($000) | ($000) | ($000) |
| Common Stocks | 37,602,769 | — | — |
| Temporary Cash Investments | 60,837 | 5,894 | — |
| Futures Contracts—Liabilities1 | (252) | — | — |
| Total | 37,663,354 | 5,894 | — |
| 1 Represents variation margin on the last day of the reporting period. | | | |
50
Value Index Fund
D. At December 31, 2015, the aggregate settlement value of open futures contracts and the related unrealized appreciation (depreciation) were:
| | | | |
| | | | | ($000) |
| | | | Aggregate | |
| | | Number of | Settlement | Unrealized |
| | | Long (Short) | Value | Appreciation |
| Futures Contracts | Expiration | Contracts | Long (Short) | (Depreciation) |
| E-mini S&P 500 Index | March 2016 | 263 | 26,766 | (71) |
Unrealized appreciation (depreciation) on open futures contracts is required to be treated as realized gain (loss) for tax purposes.
E. Distributions are determined on a tax basis and may differ from net investment income and realized capital gains for financial reporting purposes. Differences may be permanent or temporary. Permanent differences are reclassified among capital accounts in the financial statements to reflect their tax character. Temporary differences arise when certain items of income, expense, gain, or loss are recognized in different periods for financial statement and tax purposes. These differences will reverse at some time in the future. Differences in classification may also result from the treatment of short-term gains as ordinary income for tax purposes.
During the year ended December 31, 2015, the fund realized $1,249,696,000 of net capital gains resulting from in-kind redemptions—in which shareholders exchanged fund shares for securities held by the fund rather than for cash. Because such gains are not taxable to the fund, and are not distributed to shareholders, they have been reclassified from accumulated net realized losses to paid-in capital.
For tax purposes, at December 31, 2015, the fund had $9,688,000 of ordinary income available for distribution. At December 31, 2015, the fund had available capital losses totaling $605,415,000 to offset future net capital gains. Of this amount, $333,377,000 is subject to expiration on December 31, 2017. Capital losses of $272,038,000 realized beginning in fiscal 2011 may be carried forward indefinitely under the Regulated Investment Company Modernization Act of 2010, but must be used before any expiring loss carryforwards.
At December 31, 2015, the cost of investment securities for tax purposes was $32,338,864,000. Net unrealized appreciation of investment securities for tax purposes was $5,330,636,000, consisting of unrealized gains of $6,945,089,000 on securities that had risen in value since their purchase and $1,614,453,000 in unrealized losses on securities that had fallen in value since their purchase.
F. During the year ended December 31, 2015, the fund purchased $9,128,409,000 of investment securities and sold $6,583,495,000 of investment securities, other than temporary cash investments. Purchases and sales include $4,736,551,000 and $3,671,355,000, respectively, in connection with in-kind purchases and redemptions of the fund’s capital shares.
51
Value Index Fund
| | | | |
| G. Capital share transactions for each class of shares were: | | | |
| | | | Year Ended December 31, |
| | | 2015 | | 2014 |
| | Amount | Shares | Amount | Shares |
| | ($000) | (000) | ($000) | (000) |
| Investor Shares | | | | |
| Issued | 275,870 | 8,479 | 261,517 | 8,495 |
| Issued in Lieu of Cash Distributions | 32,444 | 1,019 | 32,630 | 1,030 |
| Redeemed | (451,611) | (13,942) | (600,738) | (19,287) |
| Net Increase (Decrease)—Investor Shares | (143,297) | (4,444) | (306,591) | (9,762) |
| ETF Shares | | | | |
| Issued | 5,278,259 | 64,091 | 5,343,205 | 66,443 |
| Issued in Lieu of Cash Distributions | — | — | — | — |
| Redeemed | (3,287,762) | (40,025) | (2,026,215) | (25,100) |
| Net Increase (Decrease) —ETF Shares | 1,990,497 | 24,066 | 3,316,990 | 41,343 |
| Admiral Shares | | | | |
| Issued1 | 2,416,764 | 74,734 | 4,582,857 | 146,113 |
| Issued in Lieu of Cash Distributions | 224,383 | 7,061 | 146,426 | 4,589 |
| Redeemed | (1,592,803) | (49,173) | (814,040) | (25,922) |
| Net Increase (Decrease) —Admiral Shares | 1,048,344 | 32,622 | 3,915,243 | 124,780 |
| Signal Shares | | | | |
| Issued | — | — | 430,803 | 13,612 |
| Issued in Lieu of Cash Distributions | — | — | 31,496 | 975 |
| Redeemed1 | — | — | (3,532,989) | (108,917) |
| Net Increase (Decrease)—Signal Shares | — | — | (3,070,690) | (94,330) |
| Institutional Shares | | | | |
| Issued | 1,341,949 | 41,541 | 1,577,334 | 50,613 |
| Issued in Lieu of Cash Distributions | 187,885 | 5,907 | 163,170 | 5,138 |
| Redeemed | (1,894,059) | (60,499) | (1,039,590) | (33,119) |
| Net Increase (Decrease) —Institutional Shares | (364,225) | (13,051) | 700,914 | 22,632 |
1 Admiral Shares Issued and Signal Shares Redeemed include $2,591,331,000 from the conversion of Signal Shares to Admiral Shares during the 2014 fiscal year.
H. Management has determined that no material events or transactions occurred subsequent to December 31, 2015, that would require recognition or disclosure in these financial statements.
52
| | | | |
| Large-Cap Index Fund | | | | |
| |
| |
| Fund Profile | | | | |
| As of December 31, 2015 | | | | |
| |
| Share-Class Characteristics | | | | |
| | Investor | | Admiral | Institutional |
| | Shares | ETF Shares | Shares | Shares |
| Ticker Symbol | VLACX | VV | VLCAX | VLISX |
| Expense Ratio1 | 0.23% | 0.09% | 0.09% | 0.08% |
| 30-Day SEC Yield | 1.93% | 2.02% | 2.02% | 2.03% |
| | | |
| Portfolio Characteristics | | |
| | | | DJ |
| | | | U.S. |
| | | | Total |
| | | CRSP US | Market |
| | | Large Cap | FA |
| | Fund | Index | Index |
| Number of Stocks | 646 | 645 | 3,960 |
| Median Market Cap | $71.1B | $70.6B | $51.4B |
| Price/Earnings Ratio | 21.1x | 21.1x | 21.9x |
| Price/Book Ratio | 2.8x | 2.8x | 2.7x |
| Return on Equity | 18.3% | 18.0% | 17.2% |
| Earnings Growth | | | |
| Rate | 9.3% | 9.2% | 9.5% |
| Dividend Yield | 2.1% | 2.1% | 2.1% |
| Foreign Holdings | 0.0% | 0.0% | 0.0% |
| Turnover Rate | 4% | — | — |
| Short-Term | | | |
| Reserves | 0.1% | — | — |
| |
| Sector Diversification (% of equity exposure) |
| | | | DJ |
| | | CRSP US | U.S. Total |
| | | Large Cap | Market |
| | Fund | Index | FA Index |
| Basic Materials | 2.2% | 2.2% | 2.3% |
| Consumer Goods | 10.8 | 10.8 | 10.3 |
| Consumer Services | 14.2 | 14.2 | 14.2 |
| Financials | 18.3 | 18.3 | 19.5 |
| Health Care | 14.4 | 14.4 | 14.0 |
| Industrials | 11.4 | 11.4 | 12.2 |
| Oil & Gas | 6.4 | 6.4 | 5.9 |
| Technology | 16.9 | 16.9 | 16.4 |
| Telecommunications | 2.5 | 2.5 | 2.2 |
| Utilities | 2.9 | 2.9 | 3.0 |
| | |
| Volatility Measures | | |
| | | DJ |
| | Spliced | U.S. Total |
| | Large Cap | Market |
| | Index | FA Index |
| R-Squared | 1.00 | 0.99 |
| Beta | 1.00 | 0.98 |
| These measures show the degree and timing of the fund’s | |
| fluctuations compared with the indexes over 36 months. | |
| |
| Ten Largest Holdings (% of total net assets) |
| Apple Inc. | Computer Hardware | 3.0% |
| Alphabet Inc. | Internet | 2.4 |
| Microsoft Corp. | Software | 2.2 |
| Exxon Mobil Corp. | Integrated Oil & Gas | 1.7 |
| General Electric Co. | Diversified Industrials | 1.6 |
| Johnson & Johnson | Pharmaceuticals | 1.5 |
| Amazon.com Inc. | Broadline Retailers | 1.4 |
| Berkshire Hathaway Inc. Reinsurance | 1.3 |
| Wells Fargo & Co. | Banks | 1.3 |
| JPMorgan Chase & Co. | Banks | 1.3 |
| Top Ten | | 17.7% |
| The holdings listed exclude any temporary cash investments and |
| equity index products. | | |
1 The expense ratios shown are from the prospectus dated April 28, 2015, and represent estimated costs for the current fiscal year. For the fiscal year ended December 31, 2015, the expense ratios were 0.20% for Investor Shares, 0.08% for ETF Shares, 0.08% for Admiral Shares, and 0.07% for Institutional Shares.
53
Large-Cap Index Fund
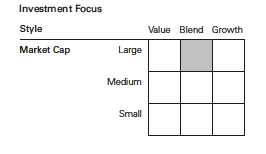
54
Large-Cap Index Fund
Performance Summary
All of the returns in this report represent past performance, which is not a guarantee of future results that may be achieved by the fund. (Current performance may be lower or higher than the performance data cited. For performance data current to the most recent month-end, visit our website at vanguard.com/performance.) Note, too, that both investment returns and principal value can fluctuate widely, so an investor’s shares, when sold, could be worth more or less than their original cost. The returns shown do not reflect taxes that a shareholder would pay on fund distributions or on the sale of fund shares.
Cumulative Performance: December 31, 2005, Through December 31, 2015
Initial Investment of $10,000
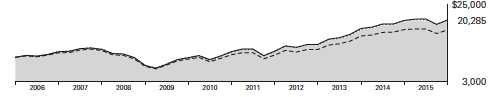
| | | | | |
| | | | Average Annual Total Returns | |
| | | Periods Ended December 31, 2015 | |
| | | | | | Final Value |
| | | One | Five | Ten | of a $10,000 |
| | | Year | Years | Years | Investment |
| | Large-Cap Index Fund*Investor | | | | |
| | Shares | 0.93% | 12.23% | 7.33% | $20,285 |
| •••••••• | Spliced Large Cap Index | 1.11 | 12.46 | 7.51 | 20,636 |
| – – – – | Large-Cap Core Funds Average | -0.66 | 10.65 | 5.91 | 17,750 |
| | Dow Jones U.S. Total Stock Market | | | | |
| | Float Adjusted Index | 0.44 | 12.14 | 7.48 | 20,563 |
| For a benchmark description, see the Glossary. | | | | |
| Large-Cap Core Funds Average: Derived from data provided by Lipper, a Thomson Reuters Company. | | |
| |
| | | | | | Final Value |
| | | One | Five | Ten | of a $10,000 |
| | | Year | Years | Years | Investment |
| Large-Cap Index Fund | | | | |
| ETF Shares Net Asset Value | 1.07% | 12.38% | 7.48% | $20,565 |
| Spliced Large Cap Index | 1.11 | 12.46 | 7.51 | 20,636 |
| Dow Jones U.S. Total Stock Market Float | | | | |
| Adjusted Index | 0.44 | 12.14 | 7.48 | 20,563 |
See Financial Highlights for dividend and capital gains information.
55
| | | | |
| Large-Cap Index Fund | | | | |
| |
| |
| |
| | | Average Annual Total Returns | |
| | Periods Ended December 31, 2015 | |
| | | | | Final Value |
| | One | Five | Ten | of a $10,000 |
| | Year | Years | Years | Investment |
| Large-Cap Index Fund Admiral Shares | 1.07% | 12.38% | 7.47% | $20,545 |
| Spliced Large Cap Index | 1.11 | 12.46 | 7.51 | 20,636 |
| Dow Jones U.S. Total Stock Market Float | | | | |
| Adjusted Index | 0.44 | 12.14 | 7.48 | 20,563 |
| |
| |
| | | | | Final Value |
| | One | Five | Ten | of a $5,000,000 |
| | Year | Years | Years | Investment |
| Large-Cap Index Fund Institutional Shares | 1.07% | 12.40% | 7.49% | $10,294,760 |
| Spliced Large Cap Index | 1.11 | 12.46 | 7.51 | 10,318,121 |
| Dow Jones U.S. Total Stock Market Float | | | | |
| Adjusted Index | 0.44 | 12.14 | 7.48 | 10,281,716 |
| | | |
| Cumulative Returns of ETF Shares: December 31, 2005, Through December 31, 2015 | |
| | One | Five | Ten |
| | Year | Years | Years |
| Large-Cap Index Fund ETF Shares Market Price | 1.05% | 79.20% | 105.50% |
| Large-Cap Index Fund ETF Shares Net Asset Value | 1.07 | 79.27 | 105.65 |
| Spliced Large Cap Index | 1.11 | 79.85 | 106.36 |

56
Large-Cap Index Fund
Financial Statements
Statement of Net Assets
As of December 31, 2015
The fund reports a complete list of its holdings in regulatory filings four times in each fiscal year, at the quarter-ends. For the second and fourth fiscal quarters, the lists appear in the fund’s semiannual and annual reports to shareholders. For the first and third fiscal quarters, the fund files the lists with the Securities and Exchange Commission on Form N-Q. Shareholders can look up the fund’s Forms N-Q on the SEC’s website at sec.gov. Forms N-Q may also be reviewed and copied at the SEC’s Public Reference Room (see the back cover of this report for further information).
| | | |
| | | | Market |
| | | | Value• |
| | | Shares | ($000) |
| Common Stocks (99.7%)1 | | |
| Basic Materials (2.2%) | | |
| | Dow Chemical Co. | 688,850 | 35,462 |
| | EI du Pont de Nemours & | | |
| | Co. | 521,092 | 34,705 |
| | LyondellBasell Industries | | |
| | NV Class A | 213,775 | 18,577 |
| | Ecolab Inc. | 158,118 | 18,086 |
| | Praxair Inc. | 170,347 | 17,443 |
| | PPG Industries Inc. | 160,107 | 15,822 |
| | Air Products & Chemicals | | |
| | Inc. | 115,322 | 15,005 |
| | International Paper Co. | 246,394 | 9,289 |
| | Alcoa Inc. | 777,824 | 7,677 |
| | Nucor Corp. | 189,840 | 7,651 |
| | Celanese Corp. Class A | 87,048 | 5,861 |
| | International Flavors & | | |
| | Fragrances Inc. | 47,791 | 5,718 |
| | Eastman Chemical Co. | 83,850 | 5,661 |
| | Newmont Mining Corp. | 314,240 | 5,653 |
| | CF Industries Holdings Inc. | 138,435 | 5,649 |
| | Airgas Inc. | 38,483 | 5,323 |
| | Mosaic Co. | 189,196 | 5,220 |
| | Freeport-McMoRan Inc. | 686,118 | 4,645 |
| * | WR Grace & Co. | 41,901 | 4,173 |
| | Ashland Inc. | 39,799 | 4,087 |
| | Albemarle Corp. | 66,668 | 3,734 |
| | Avery Dennison Corp. | 54,202 | 3,396 |
| | FMC Corp. | 79,478 | 3,110 |
| | Reliance Steel & | | |
| | Aluminum Co. | 41,163 | 2,384 |
| * | Axalta Coating Systems | | |
| | Ltd. | 84,781 | 2,259 |
| | Westlake Chemical Corp. | 23,481 | 1,275 |
| | Huntsman Corp. | 61,748 | 702 |
| | | | 248,567 |
| Consumer Goods (10.8%) | | |
| | Procter & Gamble Co. | 1,617,838 | 128,472 |
| | Coca-Cola Co. | 2,327,604 | 99,994 |
| | | |
| | | | Market |
| | | | Value• |
| | | Shares | ($000) |
| | PepsiCo Inc. | 866,519 | 86,583 |
| | Philip Morris International | | |
| | Inc. | 921,409 | 81,001 |
| | Altria Group Inc. | 1,166,253 | 67,888 |
| | NIKE Inc. Class B | 802,722 | 50,170 |
| | Mondelez International | | |
| | Inc. Class A | 897,599 | 40,248 |
| | Colgate-Palmolive Co. | 533,252 | 35,525 |
| | Ford Motor Co. | 2,317,390 | 32,652 |
| | General Motors Co. | 832,824 | 28,324 |
| | Kimberly-Clark Corp. | 215,819 | 27,474 |
| | Kraft Heinz Co. | 360,740 | 26,247 |
| | Monsanto Co. | 261,613 | 25,774 |
| | Reynolds American Inc. | 509,861 | 23,530 |
| | General Mills Inc. | 355,402 | 20,492 |
| | Johnson Controls Inc. | 385,117 | 15,208 |
| | Delphi Automotive plc | 166,616 | 14,284 |
| *,^ | Tesla Motors Inc. | 58,400 | 14,017 |
| | Constellation Brands Inc. | | |
| | Class A | 97,921 | 13,948 |
| * | Monster Beverage Corp. | 91,125 | 13,574 |
| | Archer-Daniels-Midland Co. | 354,879 | 13,017 |
| | VF Corp. | 203,007 | 12,637 |
| * | Electronic Arts Inc. | 175,697 | 12,074 |
| | Activision Blizzard Inc. | 304,576 | 11,790 |
| | Estee Lauder Cos. Inc. | | |
| | Class A | 132,355 | 11,655 |
| | ConAgra Foods Inc. | 257,589 | 10,860 |
| | Kellogg Co. | 147,650 | 10,671 |
| | Dr Pepper Snapple Group | | |
| | Inc. | 112,558 | 10,490 |
| | Clorox Co. | 76,705 | 9,728 |
| | Stanley Black & Decker | | |
| | Inc. | 89,109 | 9,511 |
| | Tyson Foods Inc. Class A | 175,906 | 9,381 |
| | Mead Johnson Nutrition | | |
| | Co. | 117,365 | 9,266 |
| | JM Smucker Co. | 71,122 | 8,772 |
| * | Under Armour Inc. | | |
| | Class A | 106,969 | 8,623 |
57
| | | |
| Large-Cap Index Fund | | |
| |
| |
| |
| | | | Market |
| | | | Value• |
| | | Shares | ($000) |
| | Molson Coors Brewing Co. | | |
| | Class B | 87,317 | 8,201 |
| | Hershey Co. | 83,658 | 7,468 |
| | Genuine Parts Co. | 85,189 | 7,317 |
| * | Jarden Corp. | 124,328 | 7,102 |
| * | Mohawk Industries Inc. | 37,319 | 7,068 |
| | Newell Rubbermaid Inc. | 158,661 | 6,994 |
| | Hanesbrands Inc. | 232,534 | 6,843 |
| | Whirlpool Corp. | 46,496 | 6,829 |
| | DR Horton Inc. | 207,917 | 6,660 |
| | Church & Dwight Co. Inc. | 77,840 | 6,607 |
| | Hormel Foods Corp. | 78,582 | 6,214 |
| | Brown-Forman Corp. | | |
| | Class B | 61,600 | 6,116 |
| | Coca-Cola Enterprises Inc. | 121,671 | 5,991 |
| | Keurig Green Mountain Inc. | 66,268 | 5,963 |
| | Snap-on Inc. | 34,603 | 5,932 |
| | Campbell Soup Co. | 110,405 | 5,802 |
| | Bunge Ltd. | 84,646 | 5,780 |
| | BorgWarner Inc. | 133,264 | 5,761 |
| | McCormick & Co. Inc. | 65,601 | 5,613 |
| | Lear Corp. | 44,848 | 5,509 |
| | Mattel Inc. | 201,418 | 5,473 |
| | Lennar Corp. Class A | 110,752 | 5,417 |
| | Coach Inc. | 164,759 | 5,393 |
| | Harley-Davidson Inc. | 113,837 | 5,167 |
| * | LKQ Corp. | 163,325 | 4,839 |
| | Hasbro Inc. | 66,720 | 4,494 |
| * | Michael Kors Holdings Ltd. | 103,684 | 4,154 |
| | Harman International | | |
| | Industries Inc. | 42,311 | 3,986 |
| | Ralph Lauren Corp. Class A | 35,127 | 3,916 |
| * | NVR Inc. | 2,205 | 3,623 |
| | PVH Corp. | 49,061 | 3,613 |
| | Leucadia National Corp. | 193,643 | 3,367 |
| | PulteGroup Inc. | 186,919 | 3,331 |
| * | WABCO Holdings Inc. | 32,465 | 3,320 |
| | Polaris Industries Inc. | 37,062 | 3,185 |
| * | lululemon athletica Inc. | 58,463 | 3,068 |
| * | Edgewell Personal Care Co. | 37,137 | 2,910 |
| | Goodyear Tire & Rubber Co. | 79,875 | 2,610 |
| * | WhiteWave Foods Co. | | |
| | Class A | 52,388 | 2,038 |
| *,^ | Fitbit Inc. Class A | 34,711 | 1,027 |
| ^ | Pilgrim’s Pride Corp. | 38,837 | 858 |
| | Coty Inc. Class A | 30,178 | 773 |
| | Lennar Corp. Class B | 1,161 | 47 |
| | | | 1,200,259 |
| Consumer Services (14.1%) | | |
| * | Amazon.com Inc. | 223,035 | 150,747 |
| | Home Depot Inc. | 754,049 | 99,723 |
| | Walt Disney Co. | 884,946 | 92,990 |
| | Comcast Corp. Class A 1,452,256 | 81,951 |
| | McDonald’s Corp. | 545,982 | 64,502 |
| | CVS Health Corp. | 658,640 | 64,395 |
| | | |
| | | | Market |
| | | | Value• |
| | | Shares | ($000) |
| | Wal-Mart Stores Inc. | 858,232 | 52,610 |
| | Starbucks Corp. | 839,136 | 50,373 |
| | Costco Wholesale Corp. | 260,108 | 42,007 |
| | Lowe’s Cos. Inc. | 550,159 | 41,834 |
| | Walgreens Boots Alliance | | |
| | Inc. | 485,546 | 41,347 |
| * | Priceline Group Inc. | 29,605 | 37,745 |
| | Time Warner Cable Inc. | 168,429 | 31,259 |
| | Time Warner Inc. | 451,573 | 29,203 |
| * | Netflix Inc. | 241,450 | 27,617 |
| | TJX Cos. Inc. | 381,004 | 27,017 |
| | McKesson Corp. | 136,877 | 26,996 |
| | Target Corp. | 366,355 | 26,601 |
| | Twenty-First Century Fox | | |
| | Inc. Class A | 900,321 | 24,453 |
| | Delta Air Lines Inc. | 467,699 | 23,708 |
| | Kroger Co. | 549,813 | 22,999 |
| | Yum! Brands Inc. | 256,475 | 18,736 |
| * | eBay Inc. | 678,175 | 18,636 |
| | Cardinal Health Inc. | 195,662 | 17,467 |
| | Southwest Airlines Co. | 386,714 | 16,652 |
| | American Airlines Group | | |
| | Inc. | 374,854 | 15,875 |
| * | O’Reilly Automotive Inc. | 55,765 | 14,132 |
| | L Brands Inc. | 146,845 | 14,071 |
| * | AutoZone Inc. | 18,133 | 13,453 |
| | Carnival Corp. | 245,837 | 13,393 |
| | Ross Stores Inc. | 242,890 | 13,070 |
| * | United Continental | | |
| | Holdings Inc. | 227,296 | 13,024 |
| | Sysco Corp. | 302,198 | 12,390 |
| | AmerisourceBergen Corp. | | |
| | Class A | 116,146 | 12,046 |
| | Dollar General Corp. | 166,606 | 11,974 |
| | CBS Corp. Class B | 246,730 | 11,628 |
| | Omnicom Group Inc. | 143,882 | 10,886 |
| | Royal Caribbean Cruises | | |
| | Ltd. | 104,549 | 10,581 |
| | Las Vegas Sands Corp. | 236,882 | 10,385 |
| * | Dollar Tree Inc. | 132,832 | 10,257 |
| | Nielsen Holdings plc | 196,638 | 9,163 |
| * | Chipotle Mexican Grill Inc. | | |
| | Class A | 18,522 | 8,888 |
| | Expedia Inc. | 69,348 | 8,620 |
| | Viacom Inc. Class B | 201,262 | 8,284 |
| *,^ | Charter Communications | | |
| | Inc. Class A | 43,231 | 7,916 |
| * | DISH Network Corp. | | |
| | Class A | 126,812 | 7,251 |
| * | Liberty Interactive Corp. | | |
| | QVC Group Class A | 264,179 | 7,217 |
| | Starwood Hotels & Resorts | | |
| | Worldwide Inc. | 100,399 | 6,956 |
| | Hilton Worldwide Holdings | | |
| | Inc. | 322,525 | 6,902 |
58
| | | |
| Large-Cap Index Fund | | |
| |
| |
| |
| | | | Market |
| | | | Value• |
| | | Shares | ($000) |
| | Tractor Supply Co. | 80,111 | 6,850 |
| | Whole Foods Market Inc. | 203,288 | 6,810 |
| * | Ulta Salon Cosmetics & | | |
| | Fragrance Inc. | 36,209 | 6,699 |
| | Marriott International Inc. | | |
| | Class A | 99,535 | 6,673 |
| | Macy’s Inc. | 186,570 | 6,526 |
| * | CarMax Inc. | 120,714 | 6,515 |
| | Advance Auto Parts Inc. | 41,464 | 6,241 |
| * | MGM Resorts | | |
| | International | 267,672 | 6,082 |
| | Alaska Air Group Inc. | 75,185 | 6,053 |
| | Signet Jewelers Ltd. | 47,278 | 5,848 |
| * | TripAdvisor Inc. | 66,397 | 5,660 |
| | Interpublic Group of Cos. | | |
| | Inc. | 242,317 | 5,641 |
| * | Norwegian Cruise Line | | |
| | Holdings Ltd. | 94,708 | 5,550 |
| | Kohl’s Corp. | 115,456 | 5,499 |
| | H&R Block Inc. | 164,128 | 5,467 |
| | Foot Locker Inc. | 82,836 | 5,392 |
| | Best Buy Co. Inc. | 173,840 | 5,293 |
| * | Sirius XM Holdings Inc. | 1,237,314 | 5,036 |
| | Wyndham Worldwide | | |
| | Corp. | 69,211 | 5,028 |
| | Tiffany & Co. | 64,988 | 4,958 |
| * | IHS Inc. Class A | 40,564 | 4,804 |
| * | Bed Bath & Beyond Inc. | 94,856 | 4,577 |
| | Aramark | 135,236 | 4,361 |
| | Darden Restaurants Inc. | 68,479 | 4,358 |
| * | Liberty Media Corp. | 112,317 | 4,277 |
| | Nordstrom Inc. | 84,180 | 4,193 |
| * | Discovery | | |
| | Communications Inc. | 154,828 | 3,905 |
| | FactSet Research | | |
| | Systems Inc. | 23,440 | 3,811 |
| | News Corp. Class A | 283,791 | 3,791 |
| | Staples Inc. | 382,172 | 3,619 |
| | Wynn Resorts Ltd. | 48,289 | 3,341 |
| | Gap Inc. | 132,742 | 3,279 |
| * | Hertz Global Holdings Inc. | 224,158 | 3,190 |
| | Williams-Sonoma Inc. | 48,497 | 2,833 |
| * | AutoNation Inc. | 45,935 | 2,741 |
| | Scripps Networks | | |
| | Interactive Inc. Class A | 45,150 | 2,493 |
| * | Rite Aid Corp. | 310,501 | 2,434 |
| * | Discovery | | |
| | Communications Inc. | | |
| | Class A | 88,529 | 2,362 |
| * | Liberty Media Corp. | | |
| | Class A | 54,661 | 2,145 |
| | Twenty-First Century Fox | | |
| | Inc. | 57,160 | 1,556 |
| * | Hyatt Hotels Corp. | | |
| | Class A | 16,381 | 770 |
| | | |
| | | | Market |
| | | | Value• |
| | | Shares | ($000) |
| | News Corp. Class B | 14,516 | 203 |
| | CBS Corp. Class A | 2,867 | 149 |
| | Viacom Inc. Class A | 985 | 43 |
| | | | 1,576,986 |
| Financials (18.2%) | | |
| * | Berkshire Hathaway Inc. | | |
| | Class B | 1,129,882 | 149,190 |
| | Wells Fargo & Co. | 2,733,993 | 148,620 |
| | JPMorgan Chase & Co. | 2,189,336 | 144,562 |
| | Bank of America Corp. | 6,191,897 | 104,210 |
| | Visa Inc. Class A | 1,157,687 | 89,779 |
| | Citigroup Inc. | 1,683,194 | 87,105 |
| | MasterCard Inc. Class A | 589,006 | 57,346 |
| | American International | | |
| | Group Inc. | 698,718 | 43,300 |
| | US Bancorp | 990,448 | 42,262 |
| | Goldman Sachs Group Inc. | 228,256 | 41,139 |
| | Simon Property Group Inc. | 184,006 | 35,778 |
| | American Express Co. | 497,426 | 34,596 |
| | PNC Financial Services | | |
| | Group Inc. | 302,007 | 28,784 |
| | Morgan Stanley | 863,453 | 27,466 |
| | MetLife Inc. | 528,801 | 25,493 |
| | Bank of New York Mellon | | |
| | Corp. | 617,645 | 25,459 |
| | American Tower | | |
| | Corporation | 251,840 | 24,416 |
| | Charles Schwab Corp. | 704,452 | 23,198 |
| | Capital One Financial Corp. | 316,540 | 22,848 |
| | Prudential Financial Inc. | 267,166 | 21,750 |
| | Public Storage | 87,516 | 21,678 |
| | BlackRock Inc. | 63,378 | 21,581 |
| | ACE Ltd. | 183,110 | 21,396 |
| | Travelers Cos. Inc. | 181,091 | 20,438 |
| | Intercontinental Exchange | | |
| | Inc. | 70,564 | 18,083 |
| | Chubb Corp. | 135,066 | 17,915 |
| | Equity Residential | 216,627 | 17,675 |
| | BB&T Corp. | 463,879 | 17,539 |
| | CME Group Inc. | 191,069 | 17,311 |
| | Marsh & McLennan Cos. | | |
| | Inc. | 310,238 | 17,203 |
| | Crown Castle International | | |
| | Corp. | 198,495 | 17,160 |
| | McGraw Hill Financial Inc. | 160,797 | 15,851 |
| | State Street Corp. | 227,946 | 15,127 |
| * | Synchrony Financial | 495,891 | 15,080 |
| | Aon plc | 162,802 | 15,012 |
| | AvalonBay Communities | | |
| | Inc. | 81,473 | 15,002 |
| | Welltower Inc. | 210,520 | 14,322 |
| | Allstate Corp. | 230,294 | 14,299 |
| | Aflac Inc. | 228,732 | 13,701 |
| | Discover Financial | | |
| | Services | 254,239 | 13,632 |
59
| | | |
| Large-Cap Index Fund | | |
| |
| |
| |
| | | | Market |
| | | | Value• |
| | | Shares | ($000) |
| | Prologis Inc. | 311,632 | 13,375 |
| | SunTrust Banks Inc. | 303,564 | 13,005 |
| | Boston Properties Inc. | 91,246 | 11,638 |
| | Ventas Inc. | 198,192 | 11,184 |
| | Equinix Inc. | 36,656 | 11,085 |
| | Ameriprise Financial Inc. | 103,600 | 11,025 |
| | Hartford Financial Services | | |
| | Group Inc. | 243,627 | 10,588 |
| | HCP Inc. | 276,777 | 10,584 |
| | Progressive Corp. | 330,547 | 10,511 |
| | M&T Bank Corp. | 85,752 | 10,391 |
| | T. Rowe Price Group Inc. | 141,970 | 10,149 |
| | Vornado Realty Trust | 101,015 | 10,097 |
| | Moody’s Corp. | 100,004 | 10,034 |
| | Fifth Third Bancorp | 472,700 | 9,501 |
| | Essex Property Trust Inc. | 39,301 | 9,409 |
| | Northern Trust Corp. | 130,515 | 9,409 |
| | Weyerhaeuser Co. | 303,998 | 9,114 |
| | General Growth Properties | | |
| | Inc. | 314,587 | 8,560 |
| | Invesco Ltd. | 252,884 | 8,467 |
| | Citizens Financial Group Inc. | 314,188 | 8,229 |
| | Franklin Resources Inc. | 214,838 | 7,910 |
| | Equifax Inc. | 70,390 | 7,839 |
| | Principal Financial Group | | |
| | Inc. | 173,832 | 7,819 |
| | Realty Income Corp. | 148,213 | 7,652 |
| | Macerich Co. | 94,074 | 7,591 |
| | Regions Financial Corp. | 777,406 | 7,463 |
| | Lincoln National Corp. | 147,367 | 7,407 |
| * | Markel Corp. | 7,879 | 6,960 |
| | XL Group plc Class A | 177,350 | 6,949 |
| | Loews Corp. | 178,845 | 6,868 |
| | Host Hotels & Resorts Inc. | 446,320 | 6,847 |
| | SL Green Realty Corp. | 59,205 | 6,689 |
| | Digital Realty Trust Inc. | 86,944 | 6,575 |
| | KeyCorp | 496,442 | 6,548 |
| | Kimco Realty Corp. | 233,207 | 6,171 |
| | Extra Space Storage Inc. | 69,736 | 6,151 |
| | Federal Realty Investment | | |
| | Trust | 41,258 | 6,028 |
| | UDR Inc. | 155,663 | 5,848 |
| * | CBRE Group Inc. Class A | 168,627 | 5,831 |
| | First Republic Bank | 86,210 | 5,695 |
| | Cincinnati Financial Corp. | 92,666 | 5,483 |
| | FNF Group | 156,183 | 5,415 |
| | Western Union Co. | 301,898 | 5,407 |
| | Annaly Capital | | |
| | Management Inc. | 562,757 | 5,279 |
| | Huntington Bancshares Inc. | 474,023 | 5,243 |
| * | E*TRADE Financial Corp. | 173,999 | 5,157 |
| * | Affiliated Managers Group | | |
| | Inc. | 32,236 | 5,150 |
| | TD Ameritrade Holding | | |
| | Corp. | 143,977 | 4,997 |
| | | |
| | | | Market |
| | | | Value• |
| | | Shares | ($000) |
| | Plum Creek Timber Co. | | |
| | Inc. | 103,282 | 4,929 |
| | Unum Group | 145,703 | 4,850 |
| * | Arch Capital Group Ltd. | 69,190 | 4,826 |
| * | Ally Financial Inc. | 257,481 | 4,799 |
| | CIT Group Inc. | 119,600 | 4,748 |
| | Voya Financial Inc. | 127,725 | 4,714 |
| | Willis Group Holdings plc | 96,315 | 4,678 |
| | SEI Investments Co. | 87,992 | 4,611 |
| | New York Community | | |
| | Bancorp Inc. | 273,988 | 4,471 |
| | Raymond James Financial | | |
| | Inc. | 76,835 | 4,454 |
| | Comerica Inc. | 104,768 | 4,382 |
| | Jones Lang LaSalle Inc. | 26,788 | 4,282 |
| | VEREIT Inc. | 537,349 | 4,256 |
| | Torchmark Corp. | 69,453 | 3,970 |
| | Nasdaq Inc. | 68,174 | 3,966 |
| | Camden Property Trust | 51,615 | 3,962 |
| | MSCI Inc. Class A | 54,780 | 3,951 |
| | Alexandria Real Estate | | |
| | Equities Inc. | 43,117 | 3,896 |
| | PartnerRe Ltd. | 25,650 | 3,584 |
| | American Capital Agency | | |
| | Corp. | 206,490 | 3,581 |
| | Everest Re Group Ltd. | 19,321 | 3,537 |
| | Lazard Ltd. Class A | 77,056 | 3,468 |
| | Reinsurance Group of | | |
| | America Inc. Class A | 39,192 | 3,353 |
| | Zions Bancorporation | 121,343 | 3,313 |
| * | Realogy Holdings Corp. | 87,059 | 3,192 |
| | Axis Capital Holdings Ltd. | 54,312 | 3,053 |
| | Iron Mountain Inc. | 112,833 | 3,048 |
| | WR Berkley Corp. | 55,112 | 3,017 |
| | People’s United Financial | | |
| | Inc. | 184,331 | 2,977 |
| | Brixmor Property Group | | |
| | Inc. | 115,171 | 2,974 |
| | Legg Mason Inc. | 64,935 | 2,547 |
| | Navient Corp. | 214,951 | 2,461 |
| * | Alleghany Corp. | 4,455 | 2,129 |
| * | LendingClub Corp. | 168,285 | 1,860 |
| | Assurant Inc. | 19,565 | 1,576 |
| * | Berkshire Hathaway Inc. | | |
| | Class A | 6 | 1,187 |
| ^ | LPL Financial Holdings Inc. | 23,818 | 1,016 |
| * | Santander Consumer USA | | |
| | Holdings Inc. | 63,200 | 1,002 |
| | Communications Sales & | | |
| | Leasing Inc. | 105 | 2 |
| | | | 2,035,255 |
| Health Care (14.3%) | | |
| | Johnson & Johnson | 1,645,657 | 169,042 |
| | Pfizer Inc. | 3,670,777 | 118,493 |
| | Merck & Co. Inc. | 1,661,468 | 87,759 |
60
| | | |
| Large-Cap Index Fund | | |
| |
| |
| |
| | | | Market |
| | | | Value• |
| | | Shares | ($000) |
| | Gilead Sciences Inc. | 857,136 | 86,734 |
| * | Allergan plc | 234,407 | 73,252 |
| | Amgen Inc. | 451,020 | 73,214 |
| | Bristol-Myers Squibb Co. | 992,324 | 68,262 |
| | UnitedHealth Group Inc. | 566,941 | 66,695 |
| | Medtronic plc | 840,825 | 64,676 |
| * | Celgene Corp. | 467,405 | 55,976 |
| | AbbVie Inc. | 923,376 | 54,701 |
| | Eli Lilly & Co. | 593,208 | 49,984 |
| * | Biogen Inc. | 132,529 | 40,600 |
| | Abbott Laboratories | 886,960 | 39,833 |
| * | Express Scripts Holding Co. | 402,111 | 35,148 |
| | Thermo Fisher Scientific | | |
| | Inc. | 237,368 | 33,671 |
| * | Regeneron | | |
| | Pharmaceuticals Inc. | 45,555 | 24,730 |
| * | Alexion Pharmaceuticals | | |
| | Inc. | 127,336 | 24,289 |
| | Cigna Corp. | 153,242 | 22,424 |
| | Aetna Inc. | 207,355 | 22,419 |
| | Anthem Inc. | 155,258 | 21,649 |
| | Becton Dickinson and Co. | 125,325 | 19,311 |
| * | Vertex Pharmaceuticals Inc. | 146,261 | 18,404 |
| * | Illumina Inc. | 87,178 | 16,733 |
| | Stryker Corp. | 178,641 | 16,603 |
| | Humana Inc. | 88,215 | 15,747 |
| * | Boston Scientific Corp. | 799,831 | 14,749 |
| * | HCA Holdings Inc. | 193,976 | 13,119 |
| | Zoetis Inc. | 266,676 | 12,779 |
| * | Mylan NV | 233,990 | 12,652 |
| | Baxalta Inc. | 322,936 | 12,604 |
| | Baxter International Inc. | 325,368 | 12,413 |
| * | Intuitive Surgical Inc. | 22,235 | 12,144 |
| | Perrigo Co. plc | 82,631 | 11,957 |
| * | Incyte Corp. | 99,447 | 10,785 |
| | Zimmer Biomet Holdings | | |
| | Inc. | 103,130 | 10,580 |
| | St. Jude Medical Inc. | 168,278 | 10,395 |
| * | Edwards Lifesciences Corp. | 128,466 | 10,146 |
| * | BioMarin Pharmaceutical | | |
| | Inc. | 96,043 | 10,061 |
| | CR Bard Inc. | 43,915 | 8,319 |
| * | Endo International plc | 134,916 | 8,260 |
| * | Henry Schein Inc. | 49,415 | 7,817 |
| * | Laboratory Corp. of | | |
| | America Holdings | 60,110 | 7,432 |
| * | Alkermes plc | 89,128 | 7,075 |
| * | DaVita HealthCare Partners | | |
| | Inc. | 100,573 | 7,011 |
| | Universal Health Services | | |
| | Inc. Class B | 54,400 | 6,500 |
| * | Waters Corp. | 46,106 | 6,205 |
| | Quest Diagnostics Inc. | 85,196 | 6,061 |
| * | Hologic Inc. | 151,197 | 5,850 |
| * | Mallinckrodt plc | 69,193 | 5,164 |
| | | |
| | | | Market |
| | | | Value• |
| | | Shares | ($000) |
| | DENTSPLY International | | |
| | Inc. | 83,121 | 5,058 |
| * | Jazz Pharmaceuticals plc | 34,709 | 4,879 |
| * | Medivation Inc. | 97,198 | 4,699 |
| * | Varian Medical Systems | | |
| | Inc. | 57,501 | 4,646 |
| | ResMed Inc. | 83,262 | 4,470 |
| * | Alnylam Pharmaceuticals | | |
| | Inc. | 42,789 | 4,028 |
| * | IDEXX Laboratories Inc. | 54,109 | 3,946 |
| | Cooper Cos. Inc. | 28,894 | 3,878 |
| * | Quintiles Transnational | | |
| | Holdings Inc. | 47,576 | 3,267 |
| * | Envision Healthcare | | |
| | Holdings Inc. | 110,903 | 2,880 |
| | Patterson Cos. Inc. | 52,388 | 2,368 |
| * | Centene Corp. | 33,637 | 2,214 |
| * | Intercept Pharmaceuticals | | |
| | Inc. | 4,660 | 696 |
| | | | 1,597,456 |
| Industrials (11.4%) | | |
| | General Electric Co. | 5,612,948 | 174,843 |
| | 3M Co. | 366,086 | 55,147 |
| | Boeing Co. | 378,624 | 54,745 |
| | United Technologies Corp. | 501,020 | 48,133 |
| | Honeywell International | | |
| | Inc. | 435,307 | 45,085 |
| | United Parcel Service Inc. | | |
| | Class B | 413,973 | 39,837 |
| | Union Pacific Corp. | 507,826 | 39,712 |
| | Accenture plc Class A | 371,530 | 38,825 |
| | Lockheed Martin Corp. | 155,292 | 33,722 |
| | Danaher Corp. | 346,342 | 32,168 |
| * | PayPal Holdings Inc. | 690,022 | 24,979 |
| | FedEx Corp. | 159,523 | 23,767 |
| | Caterpillar Inc. | 346,320 | 23,536 |
| | Raytheon Co. | 179,136 | 22,308 |
| | Automatic Data | | |
| | Processing Inc. | 260,589 | 22,077 |
| | General Dynamics Corp. | 159,898 | 21,964 |
| | Northrop Grumman Corp. | 108,559 | 20,497 |
| | Emerson Electric Co. | 389,197 | 18,615 |
| | Precision Castparts Corp. | 77,718 | 18,031 |
| | Illinois Tool Works Inc. | 183,869 | 17,041 |
| * | LinkedIn Corp. Class A | 68,660 | 15,454 |
| | CSX Corp. | 579,674 | 15,043 |
| | Norfolk Southern Corp. | 177,564 | 15,020 |
| | TE Connectivity Ltd. | 229,751 | 14,844 |
| | Eaton Corp. plc | 275,202 | 14,321 |
| | Waste Management Inc. | 265,487 | 14,169 |
| | Deere & Co. | 185,478 | 14,146 |
| * | Fiserv Inc. | 135,903 | 12,430 |
| | Sherwin-Williams Co. | 47,073 | 12,220 |
| | Roper Technologies Inc. | 59,934 | 11,375 |
| | Paychex Inc. | 193,172 | 10,217 |
61
| | | |
| Large-Cap Index Fund | | |
| |
| |
| |
| | | | Market |
| | | | Value• |
| | | Shares | ($000) |
| | Fidelity National Information | | |
| | Services Inc. | 167,990 | 10,180 |
| | PACCAR Inc. | 210,458 | 9,976 |
| | Amphenol Corp. Class A | 183,538 | 9,586 |
| * | Alliance Data Systems Corp. | 34,504 | 9,543 |
| | Cummins Inc. | 105,647 | 9,298 |
| | Ingersoll-Rand plc | 155,349 | 8,589 |
| | Agilent Technologies Inc. | 197,098 | 8,241 |
| | Rockwell Automation Inc. | 78,564 | 8,061 |
| | Tyco International plc | 250,979 | 8,004 |
| | Parker-Hannifin Corp. | 81,007 | 7,856 |
| | AMETEK Inc. | 141,681 | 7,593 |
| | Vulcan Materials Co. | 79,178 | 7,520 |
| * | FleetCor Technologies Inc. | 51,987 | 7,430 |
| | Rockwell Collins Inc. | 78,059 | 7,205 |
| | WestRock Co. | 155,530 | 7,095 |
| * | Verisk Analytics Inc. | | |
| | Class A | 90,551 | 6,962 |
| * | TransDigm Group Inc. | 30,273 | 6,916 |
| | WW Grainger Inc. | 33,648 | 6,817 |
| | Fastenal Co. | 163,408 | 6,670 |
| | Republic Services Inc. | | |
| | Class A | 144,674 | 6,364 |
| | Textron Inc. | 146,922 | 6,172 |
| * | Stericycle Inc. | 50,520 | 6,093 |
| | Xerox Corp. | 570,774 | 6,067 |
| | Acuity Brands Inc. | 25,897 | 6,055 |
| | Ball Corp. | 81,073 | 5,896 |
| | Dover Corp. | 92,376 | 5,664 |
| | Masco Corp. | 199,606 | 5,649 |
| * | Mettler-Toledo International | | |
| | Inc. | 16,345 | 5,543 |
| | Martin Marietta Materials | | |
| | Inc. | 39,254 | 5,361 |
| | Pentair plc | 107,072 | 5,303 |
| | Towers Watson & Co. | | |
| | Class A | 41,274 | 5,302 |
| | CH Robinson Worldwide | | |
| | Inc. | 85,340 | 5,293 |
| | Fortune Brands Home & | | |
| | Security Inc. | 94,863 | 5,265 |
| | Sealed Air Corp. | 117,087 | 5,222 |
| | Expeditors International of | | |
| | Washington Inc. | 111,390 | 5,024 |
| | L-3 Communications | | |
| | Holdings Inc. | 41,861 | 5,003 |
| | Total System Services Inc. | 98,347 | 4,898 |
| | Kansas City Southern | 65,075 | 4,859 |
| | Cintas Corp. | 51,472 | 4,687 |
| * | Sensata Technologies | | |
| | Holding NV | 101,114 | 4,657 |
| * | Vantiv Inc. Class A | 92,754 | 4,398 |
| * | Crown Holdings Inc. | 82,846 | 4,200 |
| * | United Rentals Inc. | 55,071 | 3,995 |
| | JB Hunt Transport | | |
| | Services Inc. | 54,329 | 3,986 |
| | | |
| | | | Market |
| | | | Value• |
| | | Shares | ($000) |
| | Fluor Corp. | 83,959 | 3,965 |
| | Xylem Inc. | 106,911 | 3,902 |
| | Wabtec Corp. | 54,458 | 3,873 |
| | ManpowerGroup Inc. | 43,644 | 3,679 |
| | Robert Half International | | |
| | Inc. | 75,496 | 3,559 |
| | Avnet Inc. | 79,152 | 3,391 |
| | Flowserve Corp. | 78,513 | 3,304 |
| | ADT Corp. | 97,893 | 3,228 |
| * | Trimble Navigation Ltd. | 148,608 | 3,188 |
| * | Hubbell Inc. Class B | 31,291 | 3,162 |
| | Macquarie Infrastructure | | |
| | Corp. | 42,756 | 3,104 |
| | Owens Corning | 65,794 | 3,094 |
| * | Jacobs Engineering Group | | |
| | Inc. | 72,809 | 3,054 |
| * | Arrow Electronics Inc. | 56,160 | 3,043 |
| | B/E Aerospace Inc. | 62,623 | 2,653 |
| | Global Payments Inc. | 38,575 | 2,488 |
| | Allison Transmission | | |
| | Holdings Inc. | 91,305 | 2,364 |
| | FLIR Systems Inc. | 83,516 | 2,344 |
| | Chicago Bridge & Iron Co. | | |
| | NV | 56,354 | 2,197 |
| * | First Data Corp. Class A | 106,793 | 1,711 |
| | Donaldson Co. Inc. | 39,236 | 1,124 |
| | AGCO Corp. | 21,824 | 991 |
| * | Quanta Services Inc. | 45,311 | 918 |
| * | Colfax Corp. | 25,745 | 601 |
| | | | 1,273,706 |
| Oil & Gas (6.4%) | | |
| | Exxon Mobil Corp. | 2,475,800 | 192,989 |
| | Chevron Corp. | 1,119,352 | 100,697 |
| | Schlumberger Ltd. | 749,799 | 52,298 |
| | ConocoPhillips | 734,035 | 34,272 |
| | Occidental Petroleum | | |
| | Corp. | 454,067 | 30,699 |
| | Phillips 66 | 285,533 | 23,357 |
| | EOG Resources Inc. | 326,900 | 23,141 |
| | Valero Energy Corp. | 286,157 | 20,234 |
| | Kinder Morgan Inc. | 1,127,731 | 16,826 |
| | Halliburton Co. | 483,383 | 16,454 |
| | Marathon Petroleum Corp. | 316,913 | 16,429 |
| | Anadarko Petroleum Corp. | 302,200 | 14,681 |
| | Baker Hughes Inc. | 259,498 | 11,976 |
| | Pioneer Natural | | |
| | Resources Co. | 88,984 | 11,157 |
| | Williams Cos. Inc. | 401,662 | 10,323 |
| | Apache Corp. | 225,008 | 10,006 |
| | Spectra Energy Corp. | 399,696 | 9,569 |
| | Noble Energy Inc. | 254,873 | 8,393 |
| | Tesoro Corp. | 71,657 | 7,550 |
| | National Oilwell Varco Inc. | 223,746 | 7,493 |
| | Devon Energy Corp. | 231,863 | 7,420 |
| | Hess Corp. | 152,928 | 7,414 |
62
| | | |
| Large-Cap Index Fund | | |
| |
| |
| |
| | | | Market |
| | | | Value• |
| | | Shares | ($000) |
| * | Cameron International | | |
| | Corp. | 113,490 | 7,172 |
| * | Concho Resources Inc. | 76,694 | 7,122 |
| | Marathon Oil Corp. | 402,113 | 5,063 |
| | Cimarex Energy Co. | 56,179 | 5,021 |
| | EQT Corp. | 90,615 | 4,724 |
| | Columbia Pipeline Group | | |
| | Inc. | 231,137 | 4,623 |
| * | Cheniere Energy Inc. | 118,983 | 4,432 |
| | Cabot Oil & Gas Corp. | 245,789 | 4,348 |
| | HollyFrontier Corp. | 108,573 | 4,331 |
| * | FMC Technologies Inc. | 135,846 | 3,941 |
| * | Weatherford International | | |
| | plc | 462,470 | 3,880 |
| * | Antero Resources Corp. | 156,343 | 3,408 |
| | Helmerich & Payne Inc. | 60,922 | 3,262 |
| | OGE Energy Corp. | 118,690 | 3,120 |
| ^ | Core Laboratories NV | 25,068 | 2,726 |
| | Transocean Ltd. | 205,079 | 2,539 |
| | Range Resources Corp. | 95,967 | 2,362 |
| | Oceaneering International | | |
| | Inc. | 57,924 | 2,173 |
| | Murphy Oil Corp. | 96,571 | 2,168 |
| | Energen Corp. | 47,077 | 1,930 |
| * | Continental Resources Inc. | 55,346 | 1,272 |
| | Ensco plc Class A | 69,826 | 1,075 |
| * | Southwestern Energy Co. | 113,959 | 810 |
| ^ | Chesapeake Energy Corp. | 177,455 | 798 |
| | | | 715,678 |
| Technology (16.9%) | | |
| | Apple Inc. | 3,150,010 | 331,570 |
| | Microsoft Corp. | 4,513,122 | 250,388 |
| * | Alphabet Inc. Class A | 173,244 | 134,786 |
| * | Facebook Inc. Class A | 1,282,656 | 134,243 |
| * | Alphabet Inc. | 174,676 | 132,558 |
| | Intel Corp. | 2,806,584 | 96,687 |
| | Cisco Systems Inc. | 3,018,936 | 81,979 |
| | International Business | | |
| | Machines Corp. | 519,150 | 71,445 |
| | Oracle Corp. | 1,902,316 | 69,492 |
| | QUALCOMM Inc. | 893,704 | 44,672 |
| | Texas Instruments Inc. | 603,180 | 33,060 |
| | EMC Corp. | 1,153,389 | 29,619 |
| * | salesforce.com inc | 375,065 | 29,405 |
| * | Adobe Systems Inc. | 281,773 | 26,470 |
| | Avago Technologies Ltd. | | |
| | Class A | 155,968 | 22,639 |
| * | Cognizant Technology | | |
| | Solutions Corp. Class A | 361,603 | 21,703 |
| | Broadcom Corp. Class A | 333,555 | 19,286 |
| * | Yahoo! Inc. | 505,335 | 16,807 |
| | Hewlett Packard | | |
| | Enterprise Co. | 1,073,217 | 16,313 |
| | Intuit Inc. | 149,136 | 14,392 |
| | Applied Materials Inc. | 714,076 | 13,332 |
| | Corning Inc. | 703,448 | 12,859 |
| | | |
| | | | Market |
| | | | Value• |
| | | Shares | ($000) |
| | HP Inc. | 1,073,617 | 12,712 |
| * | Cerner Corp. | 183,046 | 11,014 |
| | Analog Devices Inc. | 185,453 | 10,259 |
| | NVIDIA Corp. | 304,288 | 10,029 |
| * | Micron Technology Inc. | 646,311 | 9,152 |
| | SanDisk Corp. | 119,500 | 9,081 |
| * | Red Hat Inc. | 108,835 | 9,013 |
| | Skyworks Solutions Inc. | 113,509 | 8,721 |
| * | Palo Alto Networks Inc. | 48,473 | 8,538 |
| | Symantec Corp. | 402,080 | 8,444 |
| * | Autodesk Inc. | 134,736 | 8,209 |
| | Western Digital Corp. | 130,729 | 7,850 |
| * | ServiceNow Inc. | 89,761 | 7,770 |
| | Lam Research Corp. | 94,060 | 7,470 |
| | Xilinx Inc. | 152,571 | 7,166 |
| * | Twitter Inc. | 305,104 | 7,060 |
| * | Citrix Systems Inc. | 87,072 | 6,587 |
| | Seagate Technology plc | 177,920 | 6,523 |
| | Motorola Solutions Inc. | 94,628 | 6,477 |
| | KLA-Tencor Corp. | 92,949 | 6,446 |
| | Harris Corp. | 73,941 | 6,426 |
| | Maxim Integrated | | |
| | Products Inc. | 168,741 | 6,412 |
| | Linear Technology Corp. | 142,020 | 6,032 |
| | Juniper Networks Inc. | 217,672 | 6,008 |
| | CA Inc. | 195,376 | 5,580 |
| | Microchip Technology Inc. | 114,489 | 5,328 |
| * | Akamai Technologies Inc. | 100,435 | 5,286 |
| * | Workday Inc. Class A | 65,967 | 5,256 |
| * | VeriSign Inc. | 56,473 | 4,934 |
| * | ANSYS Inc. | 53,101 | 4,912 |
| | NetApp Inc. | 175,000 | 4,643 |
| * | Splunk Inc. | 76,264 | 4,485 |
| * | Qorvo Inc. | 83,877 | 4,269 |
| * | Gartner Inc. | 46,851 | 4,249 |
| * | Synopsys Inc. | 92,637 | 4,225 |
| * | F5 Networks Inc. | 42,270 | 4,099 |
| * | Nuance Communications | | |
| | Inc. | 147,181 | 2,927 |
| *,^ | VMware Inc. Class A | 46,918 | 2,654 |
| | Garmin Ltd. | 68,200 | 2,535 |
| | CSRA Inc. | 81,333 | 2,440 |
| | CDK Global Inc. | 47,445 | 2,252 |
| | Marvell Technology Group | | |
| | Ltd. | 245,396 | 2,164 |
| * | NetSuite Inc. | 23,615 | 1,998 |
| * | IMS Health Holdings Inc. | 78,345 | 1,995 |
| | | |
| | Class A | 15,663 | 1,476 |
| | Computer Sciences Corp. | 41,577 | 1,359 |
| * | Teradata Corp. | 39,393 | 1,041 |
| * | Premier Inc. Class A | 25,884 | 913 |
| * | FireEye Inc. | 42,832 | 888 |
| * | Rackspace Hosting Inc. | 33,892 | 858 |
| | | | 1,879,870 |
63
| | | |
| Large-Cap Index Fund | | |
| |
| |
| |
| | | | Market |
| | | | Value• |
| | | Shares | ($000) |
| Telecommunications (2.5%) | | |
| | AT&T Inc. | 3,659,058 | 125,908 |
| | Verizon Communications | | |
| | Inc. | 2,419,683 | 111,838 |
| * | Level 3 Communications | | |
| | Inc. | 169,273 | 9,202 |
| | CenturyLink Inc. | 326,819 | 8,223 |
| * | SBA Communications | | |
| | Corp. Class A | 75,094 | 7,890 |
| * | T-Mobile US Inc. | 169,611 | 6,635 |
| | Frontier Communications | | |
| | Corp. | 693,726 | 3,240 |
| *,^ | Sprint Corp. | 353,141 | 1,278 |
| * | Zayo Group Holdings Inc. | 28,641 | 761 |
| | | | 274,975 |
| Utilities (2.9%) | | |
| | Duke Energy Corp. | 409,311 | 29,221 |
| | NextEra Energy Inc. | 273,881 | 28,454 |
| | Southern Co. | 540,405 | 25,286 |
| | Dominion Resources Inc. | 353,968 | 23,942 |
| | American Electric Power | | |
| | Co. Inc. | 291,886 | 17,008 |
| | PG&E Corp. | 291,606 | 15,511 |
| | Exelon Corp. | 546,823 | 15,185 |
| | PPL Corp. | 398,541 | 13,602 |
| | Sempra Energy | 140,325 | 13,192 |
| | Public Service Enterprise | | |
| | Group Inc. | 301,023 | 11,647 |
| | Edison International | 193,995 | 11,486 |
| | Consolidated Edison Inc. | 174,493 | 11,215 |
| | Xcel Energy Inc. | 301,971 | 10,844 |
| | WEC Energy Group Inc. | 187,926 | 9,642 |
| | Eversource Energy | 188,805 | 9,642 |
| | DTE Energy Co. | 106,490 | 8,539 |
| | FirstEnergy Corp. | 251,932 | 7,994 |
| | Entergy Corp. | 106,167 | 7,258 |
| | American Water Works | | |
| | Co. Inc. | 106,664 | 6,373 |
| | Ameren Corp. | 144,072 | 6,228 |
| | CMS Energy Corp. | 165,031 | 5,954 |
| | SCANA Corp. | 76,395 | 4,621 |
| | CenterPoint Energy Inc. | 242,775 | 4,457 |
| | Pinnacle West Capital Corp. | 65,863 | 4,247 |
| | Alliant Energy Corp. | 67,313 | 4,204 |
| | Pepco Holdings Inc. | 150,615 | 3,918 |
| | AES Corp. | 402,129 | 3,848 |
| | NiSource Inc. | 189,301 | 3,693 |
| | ONEOK Inc. | 124,424 | 3,068 |
| * | Calpine Corp. | 211,968 | 3,067 |
| | NRG Energy Inc. | 93,088 | 1,096 |
| | National Fuel Gas Co. | 23,759 | 1,016 |
| * | Avangrid Inc. | 18,335 | 704 |
| | | | 326,162 |
| Total Common Stocks | | |
| (Cost $7,905,784) | | 11,128,914 |
| | | |
| | | | Market |
| | | | Value• |
| | | Shares | ($000) |
| Temporary Cash Investments (0.4%)1 | |
| Money Market Fund (0.4%) | |
| 2,3 | Vanguard Market | | |
| | Liquidity Fund, | | |
| | 0.363% | 43,923,000 | 43,923 |
| |
| | | Face | |
| | | Amount | |
| | | ($000) | |
| U.S. Government and Agency Obligations (0.0%) |
| 4,5 | Federal Home Loan Bank | |
| | Discount Notes, | | |
| | 0.371%, 5/4/16 | 2,000 | 1,997 |
| 5,6 | Freddie Mac Discount Notes, | |
| | 0.245%, 1/5/16 | 500 | 500 |
| | | | 2,497 |
| Total Temporary Cash Investments | |
| (Cost $46,421) | | 46,420 |
| Total Investments (100.1%) | |
| (Cost $7,952,205) | | 11,175,334 |
| |
| | | | Amount |
| | | | ($000) |
| Other Assets and Liabilities (-0.1%) | |
| Other Assets | | |
| Investment in Vanguard | | 977 |
| Receivables for Accrued Income | 15,093 |
| Receivables for Capital Shares Issued | 5,762 |
| Other Assets | | 1 |
| Total Other Assets | | 21,833 |
| Liabilities | | |
| Payables for Investment Securities | |
| Purchased | | (4,001) |
| Collateral for Securities on Loan | (17,861) |
| Payables for Capital Shares Redeemed | (3,645) |
| Payables to Vanguard | | (6,115) |
| Other Liabilities | | (1,129) |
| Total Liabilities | | (32,751) |
| Net Assets (100%) | | 11,164,416 |
64
Large-Cap Index Fund
At December 31, 2015, net assets consisted of:
Amount ($000)
| |
| Paid-in Capital | 8,021,229 |
| Overdistributed Net Investment Income | (2,246) |
| Accumulated Net Realized Losses | (78,071) |
| Unrealized Appreciation (Depreciation) | |
| Investment Securities | 3,223,129 |
| Futures Contracts | 375 |
| Net Assets | 11,164,416 |
| |
| |
| Investor Shares—Net Assets | |
| Applicable to 9,915,383 outstanding | |
| $.001 par value shares of beneficial | |
| interest (unlimited authorization) | 374,588 |
| Net Asset Value Per Share— | |
| Investor Shares | $37.78 |
| |
| |
| ETF Shares—Net Assets | |
| Applicable to 69,173,951 outstanding | |
| $.001 par value shares of beneficial | |
| interest (unlimited authorization) | 6,469,347 |
| Net Asset Value Per Share— | |
| ETF Shares | $93.52 |
| |
| | Amount |
| | ($000) |
| Admiral Shares—Net Assets | |
| Applicable to 74,671,102 outstanding | |
| $.001 par value shares of beneficial | |
| interest (unlimited authorization) | 3,526,786 |
| Net Asset Value Per Share— | |
| Admiral Shares | $47.23 |
| |
| |
| Institutional Shares—Net Assets | |
| Applicable to 4,082,800 outstanding | |
| $.001 par value shares of beneficial | |
| interest (unlimited authorization) | 793,695 |
| Net Asset Value Per Share— | |
| Institutional Shares | $194.40 |
• See Note A in Notes to Financial Statements.
* Non-income-producing security.
^ Includes partial security positions on loan to broker-dealers. The total value of securities on loan is $17,283,000.
1 The fund invests a portion of its cash reserves in equity markets through the use of index futures contracts. After giving effect to futures investments, the fund’s effective common stock and temporary cash investment positions represent 100.0% and 0.1%, respectively, of net assets.
2 Affiliated money market fund available only to Vanguard funds and certain trusts and accounts managed by Vanguard. Rate shown is the 7-day yield.
3 Includes $17,861,000 of collateral received for securities on loan.
4 The issuer operates under a congressional charter; its securities are generally neither guaranteed by the U.S. Treasury nor backed by the full faith and credit of the U.S. government.
5 Securities with a value of $1,498,000 have been segregated as initial margin for open futures contracts.
6 The issuer was placed under federal conservatorship in September 2008; since that time, its daily operations have been managed by the Federal Housing Finance Agency and it receives capital from the U.S. Treasury, as needed to maintain a positive net worth, in exchange for senior preferred stock.
See accompanying Notes, which are an integral part of the Financial Statements.
65
| |
| Large-Cap Index Fund | |
| |
| |
| Statement of Operations | |
| |
| | Year Ended |
| | December 31, 2015 |
| | ($000) |
| Investment Income | |
| Income | |
| Dividends | 218,216 |
| Interest1 | 53 |
| Securities Lending | 448 |
| Total Income | 218,717 |
| Expenses | |
| The Vanguard Group—Note B | |
| Investment Advisory Services | 1,503 |
| Management and Administrative—Investor Shares | 596 |
| Management and Administrative—ETF Shares | 3,282 |
| Management and Administrative—Admiral Shares | 1,684 |
| Management and Administrative—Institutional Shares | 396 |
| Marketing and Distribution—Investor Shares | 102 |
| Marketing and Distribution—ETF Shares | 412 |
| Marketing and Distribution—Admiral Shares | 397 |
| Marketing and Distribution—Institutional Shares | 47 |
| Custodian Fees | 254 |
| Auditing Fees | 37 |
| Shareholders’ Reports—Investor Shares | 9 |
| Shareholders’ Reports—ETF Shares | 90 |
| Shareholders’ Reports—Admiral Shares | 22 |
| Shareholders’ Reports—Institutional Shares | — |
| Trustees’ Fees and Expenses | 7 |
| Total Expenses | 8,838 |
| Net Investment Income | 209,879 |
| Realized Net Gain (Loss) | |
| Investment Securities Sold | 176,277 |
| Futures Contracts | 1,485 |
| Realized Net Gain (Loss) | 177,762 |
| Change in Unrealized Appreciation (Depreciation) | |
| Investment Securities | (266,590) |
| Futures Contracts | 508 |
| Change in Unrealized Appreciation (Depreciation) | (266,082) |
| Net Increase (Decrease) in Net Assets Resulting from Operations | 121,559 |
| 1 Interest income from an affiliated company of the fund was $49,000. | |
| |
| |
| |
| See accompanying Notes, which are an integral part of the Financial Statements. | |
66
| | |
| Large-Cap Index Fund | | |
| |
| |
| Statement of Changes in Net Assets | | |
| |
| | Year Ended December 31, |
| | 2015 | 2014 |
| | ($000) | ($000) |
| Increase (Decrease) in Net Assets | | |
| Operations | | |
| Net Investment Income | 209,879 | 168,901 |
| Realized Net Gain (Loss) | 177,762 | 78,903 |
| Change in Unrealized Appreciation (Depreciation) | (266,082) | 894,834 |
| Net Increase (Decrease) in Net Assets Resulting from Operations | 121,559 | 1,142,638 |
| Distributions | | |
| Net Investment Income | | |
| Investor Shares | (7,047) | (6,736) |
| ETF Shares | (118,790) | (96,408) |
| Admiral Shares | (65,966) | (42,273) |
| Signal Shares | — | (8,303) |
| Institutional Shares | (16,266) | (15,380) |
| Realized Capital Gain | | |
| Investor Shares | — | — |
| ETF Shares | — | — |
| Admiral Shares | — | — |
| Signal Shares | — | — |
| Institutional Shares | — | — |
| Total Distributions | (208,069) | (169,100) |
| Capital Share Transactions | | |
| Investor Shares | (21,473) | (34,285) |
| ETF Shares | 897,520 | 361,077 |
| Admiral Shares | 472,088 | 1,404,615 |
| Signal Shares | — | (975,311) |
| Institutional Shares | (56,061) | 18,594 |
| Net Increase (Decrease) from Capital Share Transactions | 1,292,074 | 774,690 |
| Total Increase (Decrease) | 1,205,564 | 1,748,228 |
| Net Assets | | |
| Beginning of Period | 9,958,852 | 8,210,624 |
| End of Period1 | 11,164,416 | 9,958,852 |
1 Net Assets—End of Period includes undistributed (overdistributed) net investment income of ($2,246,000) and ($4,056,000).
See accompanying Notes, which are an integral part of the Financial Statements.
67
| | | | | |
| Large-Cap Index Fund | | | | | |
| |
| |
| Financial Highlights | | | | | |
| |
| |
| Investor Shares | | | | | |
| |
| For a Share Outstanding | | | Year Ended December 31, |
| Throughout Each Period | 2015 | 2014 | 2013 | 2012 | 2011 |
| Net Asset Value, Beginning of Period | $38.12 | $34.24 | $26.32 | $23.16 | $23.25 |
| Investment Operations | | | | | |
| Net Investment Income | .702 | .624 | .556 | .521 | . 421 |
| Net Realized and Unrealized Gain (Loss) | | | | | |
| on Investments | (.348) | 3.879 | 7.921 | 3.159 | (.095) |
| Total from Investment Operations | .354 | 4.503 | 8.477 | 3.680 | .326 |
| Distributions | | | | | |
| Dividends from Net Investment Income | (.694) | (. 623) | (. 557) | (. 520) | (. 416) |
| Distributions from Realized Capital Gains | — | — | — | — | — |
| Total Distributions | (.694) | (. 623) | (. 557) | (. 520) | (. 416) |
| Net Asset Value, End of Period | $37.78 | $38.12 | $34.24 | $26.32 | $23.16 |
| |
| Total Return1 | 0.93% | 13.24% | 32.45% | 15.94% | 1.44% |
| |
| Ratios/Supplemental Data | | | | | |
| Net Assets, End of Period (Millions) | $375 | $399 | $391 | $290 | $293 |
| Ratio of Total Expenses to Average Net Assets | 0.20% | 0.23% | 0.24% | 0.24% | 0.24% |
| Ratio of Net Investment Income to | | | | | |
| Average Net Assets | 1.86% | 1.76% | 1.82% | 2.08% | 1.81% |
| Portfolio Turnover Rate2 | 4% | 3% | 9% | 8% | 7% |
1 Total returns do not include account service fees that may have applied in the periods shown. Fund prospectuses provide information about any applicable account service fees.
2 Excludes the value of portfolio securities received or delivered as a result of in-kind purchases or redemptions of the fund’s capital shares, including ETF Creation Units.
See accompanying Notes, which are an integral part of the Financial Statements.
68
| | | | | |
| Large-Cap Index Fund | | | | | |
| |
| |
| Financial Highlights | | | | | |
| |
| |
| ETF Shares | | | | | |
| |
| For a Share Outstanding | | | Year Ended December 31, |
| Throughout Each Period | 2015 | 2014 | 2013 | 2012 | 2011 |
| Net Asset Value, Beginning of Period | $94.36 | $84.76 | $65.15 | $57.34 | $57.56 |
| Investment Operations | | | | | |
| Net Investment Income | 1.850 | 1.672 | 1.488 | 1.383 | 1.126 |
| Net Realized and Unrealized Gain (Loss) | | | | | |
| on Investments | (. 859) | 9.599 | 19.610 | 7.807 | (. 234) |
| Total from Investment Operations | .991 | 11.271 | 21.098 | 9.190 | .892 |
| Distributions | | | | | |
| Dividends from Net Investment Income | (1.831) | (1.671) | (1.488) | (1.380) | (1.112) |
| Distributions from Realized Capital Gains | — | — | — | — | — |
| Total Distributions | (1.831) | (1.671) | (1.488) | (1.380) | (1.112) |
| Net Asset Value, End of Period | $93.52 | $94.36 | $84.76 | $65.15 | $57.34 |
| |
| Total Return | 1.07% | 13.39% | 32.65% | 16.09% | 1.58% |
| |
| Ratios/Supplemental Data | | | | | |
| Net Assets, End of Period (Millions) | $6,469 | $5,619 | $4,707 | $3,577 | $3,021 |
| Ratio of Total Expenses to Average Net Assets | 0.08% | 0.09% | 0.09% | 0.10% | 0.10% |
| Ratio of Net Investment Income to | | | | | |
| Average Net Assets | 1.98% | 1.90% | 1.97% | 2.22% | 1.95% |
| Portfolio Turnover Rate1 | 4% | 3% | 9% | 8% | 7% |
1 Excludes the value of portfolio securities received or delivered as a result of in-kind purchases or redemptions of the fund’s capital shares, including ETF Creation Units.
See accompanying Notes, which are an integral part of the Financial Statements.
69
| | | | | |
| Large-Cap Index Fund | | | | | |
| |
| |
| Financial Highlights | | | | | |
| |
| |
| Admiral Shares | | | | | |
| |
| For a Share Outstanding | | | Year Ended December 31, |
| Throughout Each Period | 2015 | 2014 | 2013 | 2012 | 2011 |
| Net Asset Value, Beginning of Period | $47.65 | $42.81 | $32.90 | $28.96 | $29.07 |
| Investment Operations | | | | | |
| Net Investment Income | . 936 | . 846 | .752 | .698 | .569 |
| Net Realized and Unrealized Gain (Loss) | | | | | |
| on Investments | (. 430) | 4.839 | 9.909 | 3.939 | (.116) |
| Total from Investment Operations | .506 | 5.685 | 10.661 | 4.637 | .453 |
| Distributions | | | | | |
| Dividends from Net Investment Income | (.926) | (.845) | (.751) | (.697) | (.563) |
| Distributions from Realized Capital Gains | — | — | — | — | — |
| Total Distributions | (.926) | (.845) | (.751) | (.697) | (.563) |
| Net Asset Value, End of Period | $47.23 | $47.65 | $42.81 | $32.90 | $28.96 |
| |
| Total Return1 | 1.07% | 13.38% | 32.66% | 16.06% | 1.60% |
| |
| Ratios/Supplemental Data | | | | | |
| Net Assets, End of Period (Millions) | $3,527 | $3,085 | $1,438 | $981 | $796 |
| Ratio of Total Expenses to Average Net Assets | 0.08% | 0.09% | 0.09% | 0.10% | 0.10% |
| Ratio of Net Investment Income to | | | | | |
| Average Net Assets | 1.98% | 1.90% | 1.97% | 2.22% | 1.95% |
| Portfolio Turnover Rate2 | 4% | 3% | 9% | 8% | 7% |
1 Total returns do not include account service fees that may have applied in the periods shown. Fund prospectuses provide information about any applicable account service fees.
2 Excludes the value of portfolio securities received or delivered as a result of in-kind purchases or redemptions of the fund’s capital shares, including ETF Creation Units.
See accompanying Notes, which are an integral part of the Financial Statements.
70
| | | | | |
| Large-Cap Index Fund | | | | | |
| |
| |
| Financial Highlights | | | | | |
| |
| |
| Institutional Shares | | | | | |
| |
| For a Share Outstanding | | | Year Ended December 31, |
| Throughout Each Period | 2015 | 2014 | 2013 | 2012 | 2011 |
| Net Asset Value, Beginning of Period | $196.14 | $176.18 | $135.42 | $119.18 | $119.65 |
| Investment Operations | | | | | |
| Net Investment Income | 3.865 | 3.492 | 3.105 | 2.903 | 2.366 |
| Net Realized and Unrealized Gain (Loss) | | | | | |
| on Investments | (1.781) | 19.957 | 40.761 | 16.234 | (. 499) |
| Total from Investment Operations | 2.084 | 23.449 | 43.866 | 19.137 | 1.867 |
| Distributions | | | | | |
| Dividends from Net Investment Income | (3.824) | (3.489) | (3.106) | (2.897) | (2.337) |
| Distributions from Realized Capital Gains | — | — | — | — | — |
| Total Distributions | (3.824) | (3.489) | (3.106) | (2.897) | (2.337) |
| Net Asset Value, End of Period | $194.40 | $196.14 | $176.18 | $135.42 | $119.18 |
| |
| Total Return | 1.07% | 13.41% | 32.65% | 16.11% | 1.60% |
| |
| Ratios/Supplemental Data | | | | | |
| Net Assets, End of Period (Millions) | $794 | $857 | $750 | $752 | $504 |
| Ratio of Total Expenses to Average Net Assets | 0.07% | 0.08% | 0.08% | 0.08% | 0.08% |
| Ratio of Net Investment Income to | | | | | |
| Average Net Assets | 1.99% | 1.91% | 1.98% | 2.24% | 1.97% |
| Portfolio Turnover Rate1 | 4% | 3% | 9% | 8% | 7% |
1 Excludes the value of portfolio securities received or delivered as a result of in-kind purchases or redemptions of the fund’s capital shares, including ETF Creation Units.
See accompanying Notes, which are an integral part of the Financial Statements.
71
Large-Cap Index Fund
Notes to Financial Statements
Vanguard Large-Cap Index Fund is registered under the Investment Company Act of 1940 as an open-end investment company, or mutual fund. The fund offers four classes of shares: Investor Shares, ETF Shares, Admiral Shares, and Institutional Shares. Investor Shares are available to any investor who meets the fund’s minimum purchase requirements. ETF Shares are listed for trading on NYSE Arca; they can be purchased and sold through a broker. Admiral Shares and Institutional Shares are designed for investors who meet certain administrative, service, and account-size criteria. Prior to October 24, 2014, the fund offered Signal Shares. Effective at the close of business on October 24, 2014, the Signal Shares were converted to Admiral Shares.
A. The following significant accounting policies conform to generally accepted accounting principles for U.S. investment companies. The fund consistently follows such policies in preparing its financial statements.
1. Security Valuation: Securities are valued as of the close of trading on the New York Stock Exchange (generally 4 p.m., Eastern time) on the valuation date. Equity securities are valued at the latest quoted sales prices or official closing prices taken from the primary market in which each security trades; such securities not traded on the valuation date are valued at the mean of the latest quoted bid and asked prices. Securities for which market quotations are not readily available, or whose values have been materially affected by events occurring before the fund’s pricing time but after the close of the securities’ primary markets, are valued by methods deemed by the board of trustees to represent fair value. Investments in Vanguard Market Liquidity Fund are valued at that fund’s net asset value. Temporary cash investments acquired over 60 days to maturity are valued using the latest bid prices or using valuations based on a matrix system (which considers such factors as security prices, yields, maturities, and ratings), both as furnished by independent pricing services. Other temporary cash investments are valued at amortized cost, which approximates market value.
2. Futures Contracts: The fund uses index futures contracts to a limited extent, with the objectives of maintaining full exposure to the stock market, enhancing returns, maintaining liquidity, and minimizing transaction costs. The fund may purchase futures contracts to immediately invest incoming cash in the market, or sell futures in response to cash outflows, thereby simulating a fully invested position in the underlying index while maintaining a cash balance for liquidity. The fund may seek to enhance returns by using futures contracts instead of the underlying securities when futures are believed to be priced more attractively than the underlying securities. The primary risks associated with the use of futures contracts are imperfect correlation between changes in market values of stocks held by the fund and the prices of futures contracts, and the possibility of an illiquid market. Counterparty risk involving futures is mitigated because a regulated clearinghouse is the counterparty instead of the clearing broker. To further mitigate counterparty risk, the fund trades futures contracts on an exchange, monitors the financial strength of its clearing brokers and clearinghouse, and has entered into clearing agreements with its clearing brokers. The clearinghouse imposes initial margin requirements to secure the fund’s performance and requires daily settlement of variation margin representing changes in the market value of each contract.
Futures contracts are valued at their quoted daily settlement prices. The aggregate settlement values of the contracts are not recorded in the Statement of Net Assets. Fluctuations in the value of the contracts are recorded in the Statement of Net Assets as an asset (liability) and in the Statement of Operations as unrealized appreciation (depreciation) until the contracts are closed, when they are recorded as realized futures gains (losses).
72
Large-Cap Index Fund
During the year ended December 31, 2015, the fund’s average investments in long and short futures contracts represented less than 1% and 0% of net assets, respectively, based on the average of aggregate settlement values at each quarter-end during the period.
3. Federal Income Taxes: The fund intends to continue to qualify as a regulated investment company and distribute all of its taxable income. Management has analyzed the fund’s tax positions taken for all open federal income tax years (December 31, 2012–2015), and has concluded that no provision for federal income tax is required in the fund’s financial statements.
4. Distributions: Distributions to shareholders are recorded on the ex-dividend date.
5. Securities Lending: To earn additional income, the fund lends its securities to qualified institutional borrowers. Security loans are subject to termination by the fund at any time and are required to be secured at all times by collateral in an amount at least equal to the market value of securities loaned. Daily market fluctuations could cause the value of loaned securities to be more or less than the value of the collateral received. When this occurs, the collateral is adjusted and settled on the next business day. The fund further mitigates its counterparty risk by entering into securities lending transactions only with a diverse group of prequalified counterparties, monitoring their financial strength, and entering into master securities lending agreements with its counterparties. The master securities lending agreements provide that, in the event of a counterparty’s default (including bankruptcy), the fund may terminate any loans with that borrower, determine the net amount owed, and sell or retain the collateral up to the net amount owed to the fund; however, such actions may be subject to legal proceedings. While collateral mitigates counterparty risk, in the absence of a default the fund may experience delays and costs in recovering the securities loaned. The fund invests cash collateral received in Vanguard Market Liquidity Fund, and records a liability in the Statement of Net Assets for the return of the collateral, during the period the securities are on loan. Securities lending income represents fees charged to borrowers plus income earned on invested cash collateral, less expenses associated with the loan.
6. Credit Facility: The fund and certain other funds managed by The Vanguard Group (“Vanguard”) participate in a $3 billion committed credit facility provided by a syndicate of lenders pursuant to a credit agreement that may be renewed annually; each fund is individually liable for its borrowings, if any, under the credit facility. Borrowings may be utilized for temporary and emergency purposes, and are subject to the fund’s regulatory and contractual borrowing restrictions. The participating funds are charged administrative fees and an annual commitment fee of 0.06% of the undrawn amount of the facility; these fees are allocated to the funds based on a method approved by the fund’s board of trustees and included in Management and Administrative expenses on the fund’s Statement of Operations. Any borrowings under this facility bear interest at a rate equal to the higher of the federal funds rate or LIBOR reference rate plus an agreed-upon spread.
The fund had no borrowings outstanding at December 31, 2015, or at any time during the period then ended.
7. Other: Dividend income is recorded on the ex-dividend date. Interest income includes income distributions received from Vanguard Market Liquidity Fund and is accrued daily. Premiums and discounts on debt securities purchased are amortized and accreted, respectively, to interest income over the lives of the respective securities. Security transactions are accounted for on the date securities are bought or sold. Costs used to determine realized gains (losses) on the sale of investment securities are those of the specific securities sold.
73
Large-Cap Index Fund
Each class of shares has equal rights as to assets and earnings, except that each class separately bears certain class-specific expenses related to maintenance of shareholder accounts (included in Management and Administrative expenses) and shareholder reporting. Marketing and distribution expenses are allocated to each class of shares based on a method approved by the board of trustees. Income, other non-class-specific expenses, and gains and losses on investments are allocated to each class of shares based on its relative net assets.
B. In accordance with the terms of a Funds’ Service Agreement (the “FSA”) between Vanguard and the fund, Vanguard furnishes to the fund investment advisory, corporate management, administrative, marketing, and distribution services at Vanguard’s cost of operations (as defined by the FSA). These costs of operations are allocated to the fund based on methods and guidelines approved by the board of trustees. Vanguard does not require reimbursement in the current period for certain costs of operations (such as deferred compensation/benefits and risk/insurance costs); the fund’s liability for these costs of operations is included in Payables to Vanguard on the Statement of Net Assets.
Upon the request of Vanguard, the fund may invest up to 0.40% of its net assets as capital in Vanguard. At December 31, 2015, the fund had contributed to Vanguard capital in the amount of $977,000, representing 0.01% of the fund’s net assets and 0.39% of Vanguard’s capitalization. The fund’s trustees and officers are also directors and employees, respectively, of Vanguard.
C. Various inputs may be used to determine the value of the fund’s investments. These inputs are summarized in three broad levels for financial statement purposes. The inputs or methodologies used to value securities are not necessarily an indication of the risk associated with investing in those securities.
Level 1—Quoted prices in active markets for identical securities.
Level 2—Other significant observable inputs (including quoted prices for similar securities, interest rates, prepayment speeds, credit risk, etc.).
Level 3—Significant unobservable inputs (including the fund’s own assumptions used to determine the fair value of investments).
The following table summarizes the market value of the fund’s investments as of December 31, 2015, based on the inputs used to value them:
| | | |
| | Level 1 | Level 2 | Level 3 |
| Investments | ($000) | ($000) | ($000) |
| Common Stocks | 11,128,914 | — | — |
| Temporary Cash Investments | 43,923 | 2,497 | — |
| Futures Contracts—Liabilities1 | (300) | — | — |
| Total | 11,172,537 | 2,497 | — |
| 1 Represents variation margin on the last day of the reporting period. | | | |
74
Large-Cap Index Fund
D. At December 31, 2015, the aggregate settlement value of open futures contracts and the related unrealized appreciation (depreciation) were:
| | | | |
| | | | | ($000) |
| | | | Aggregate | |
| | | Number of | Settlement | Unrealized |
| | | Long (Short) | Value | Appreciation |
| Futures Contracts | Expiration | Contracts | Long (Short) | (Depreciation) |
| E-mini S&P 500 Index | March 2016 | 313 | 31,854 | 375 |
Unrealized appreciation (depreciation) on open futures contracts is required to be treated as realized gain (loss) for tax purposes.
E. Distributions are determined on a tax basis and may differ from net investment income and realized capital gains for financial reporting purposes. Differences may be permanent or temporary. Permanent differences are reclassified among capital accounts in the financial statements to reflect their tax character. Temporary differences arise when certain items of income, expense, gain, or loss are recognized in different periods for financial statement and tax purposes. These differences will reverse at some time in the future. Differences in classification may also result from the treatment of short-term gains as ordinary income for tax purposes.
During the year ended December 31, 2015, the fund realized $219,948,000 of net capital gains resulting from in-kind redemptions—in which shareholders exchanged fund shares for securities held by the fund rather than for cash. Because such gains are not taxable to the fund, and are not distributed to shareholders, they have been reclassified from accumulated net realized losses to paid-in capital.
For tax purposes, at December 31, 2015, the fund had $3,287,000 of ordinary income available for distribution. At December 31, 2015, the fund had available capital losses totaling $77,696,000 to offset future net capital gains. Of this amount, $24,177,000 is subject to expiration on December 31, 2018. Capital losses of $53,519,000 realized beginning in fiscal 2011 may be carried forward indefinitely under the Regulated Investment Company Modernization Act of 2010, but must be used before any expiring loss carryforwards.
At December 31, 2015, the cost of investment securities for tax purposes was $7,952,205,000. Net unrealized appreciation of investment securities for tax purposes was $3,223,129,000, consisting of unrealized gains of $3,518,049,000 on securities that had risen in value since their purchase and $294,920,000 in unrealized losses on securities that had fallen in value since their purchase.
F. During the year ended December 31, 2015, the fund purchased $2,085,703,000 of investment securities and sold $810,296,000 of investment securities, other than temporary cash investments. Purchases and sales include $1,211,483,000 and $385,107,000, respectively, in connection with in-kind purchases and redemptions of the fund’s capital shares.
75
Large-Cap Index Fund
| | | | |
| G. Capital share transactions for each class of shares were: | | | |
| | | | Year Ended December 31, |
| | | 2015 | | 2014 |
| | Amount | Shares | Amount | Shares |
| | ($000) | (000) | ($000) | (000) |
| Investor Shares | | | | |
| Issued | 98,843 | 2,587 | 106,030 | 2,965 |
| Issued in Lieu of Cash Distributions | 6,789 | 179 | 6,503 | 178 |
| Redeemed | (127,105) | (3,310) | (146,818) | (4,093) |
| Net Increase (Decrease)—Investor Shares | (21,473) | (544) | (34,285) | (950) |
| ETF Shares | | | | |
| Issued | 1,322,830 | 14,153 | 504,034 | 5,617 |
| Issued in Lieu of Cash Distributions | — | — | — | — |
| Redeemed | (425,310) | (4,525) | (142,957) | (1,600) |
| Net Increase (Decrease)—ETF Shares | 897,520 | 9,628 | 361,077 | 4,017 |
| Admiral Shares | | | | |
| Issued1 | 972,187 | 20,442 | 1,699,952 | 37,699 |
| Issued in Lieu of Cash Distributions | 54,837 | 1,157 | 35,505 | 772 |
| Redeemed | (554,936) | (11,655) | (330,842) | (7,335) |
| Net Increase (Decrease) —Admiral Shares | 472,088 | 9,944 | 1,404,615 | 31,136 |
| Signal Shares | | | | |
| Issued | — | — | 114,250 | 3,015 |
| Issued in Lieu of Cash Distributions | — | — | 6,333 | 163 |
| Redeemed1 | — | — | (1,095,894) | (27,966) |
| Net Increase (Decrease)—Signal Shares | — | — | (975,311) | (24,788) |
| Institutional Shares | | | | |
| Issued | 82,055 | 414 | 83,405 | 454 |
| Issued in Lieu of Cash Distributions | 10,669 | 55 | 12,519 | 67 |
| Redeemed | (148,785) | (755) | (77,330) | (408) |
| Net Increase (Decrease) —Institutional Shares | (56,061) | (286) | 18,594 | 113 |
1 Admiral Shares Issued and Signal Shares Redeemed include $947,676,000 from the conversion of Signal Shares to Admiral Shares during the 2014 fiscal year.
H. Management has determined that no material events or transactions occurred subsequent to December 31, 2015, that would require recognition or disclosure in these financial statements.
76
Report of Independent Registered Public Accounting Firm
To the Board of Trustees of Vanguard Index Funds and the Shareholders of Vanguard Growth Index Fund, Vanguard Value Index Fund and Vanguard Large-Cap Index Fund:
In our opinion, the accompanying statements of net assets and the related statements of operations and of changes in net assets and the financial highlights present fairly, in all material respects, the financial position of Vanguard Growth Index Fund, Vanguard Value Index Fund and Vanguard Large-Cap Index Fund (constituting separate portfolios of Vanguard Index Funds, hereafter referred to as the “Funds”) at December 31, 2015, the results of each of their operations for the year then ended, the changes in each of their net assets for each of the two years in the period then ended, and the financial highlights for each of the five years in the period then ended, in conformity with accounting principles generally accepted in the United States of America. These financial statements and financial highlights (hereafter referred to as “financial statements”) are the responsibility of the Funds’ management. Our responsibility is to express an opinion on these financial statements based on our audits. We conducted our audits of these financial statements in accordance with the standards of the Public Company Accounting Oversight Board (United States). Those standards require that we plan and perform the audit to obtain reasonable assurance about whether the financial statements are free of material misstatement. An audit includes examining, on a test basis, evidence supporting the amounts and disclosures in the financial statements, assessing the accounting principles used and significant estimates made by management, and evaluating the overall financial statement presentation. We believe that our audits, which included confirmation of securities at December 31, 2015 by correspondence with the custodians and brokers, by agreement to the underlying ownership records of the transfer agent and the application of alternative auditing procedures where securities purchased had not been received, provide a reasonable basis for our opinion.
/s/PricewaterhouseCoopers LLP
Philadelphia, Pennsylvania
February 11, 2016
77
Special 2015 tax information (unaudited) for Vanguard U.S. Stock Index Funds (Large-Capitalization Portfolios)
This information for the fiscal year ended December 31, 2015, is included pursuant to provisions of the Internal Revenue Code.
The funds distributed qualified dividend income to shareholders during the fiscal year as follows:
| |
| Fund | ($000) |
| Growth Index Fund | 596,225 |
| Value Index Fund | 963,790 |
| Large-Cap Index Fund | 208,069 |
For corporate shareholders, the percentage of investment income (dividend income plus short-term gains, if any) that qualifies for the dividends-received deduction is as follows:
| |
| Fund | Percentage |
| Growth Index Fund | 89.1% |
| Value Index Fund | 97.9 |
| Large-Cap Index Fund | 95.5 |
78
Your Fund’s After-Tax Returns
This table presents returns for your fund both before and after taxes. The after-tax returns are shown in two ways: (1) assuming that an investor owned the fund during the entire period and paid taxes on the fund’s distributions, and (2) assuming that an investor paid taxes on the fund’s distributions and sold all shares at the end of each period.
Calculations are based on the highest individual federal income tax and capital gains tax rates in effect at the times of the distributions and the hypothetical sales. State and local taxes were not considered. After-tax returns reflect any qualified dividend income. (In the example, returns after the sale of fund shares may be higher than those assuming no sale. This occurs when the sale would have produced a capital loss. The calculation assumes that the investor received a tax deduction for the loss.)
The table shows returns for Investor Shares only; returns for other share classes will differ. Please note that your actual after-tax returns will depend on your tax situation and may differ from those shown. Also note that if you own the fund in a tax-deferred account, such as an individual retirement account or a 401(k) plan, this information does not apply to you. Such accounts are not subject to current taxes.
Finally, keep in mind that a fund’s performance—whether before or after taxes—does not guarantee future results.
Average Annual Total Returns: U.S. Stock Index Funds Large-Capitalization Portfolios
Periods Ended December 31, 2015
| | | |
| | One | Five | Ten |
| | Year | Years | Years |
| Growth Index Fund Investor Shares | | | |
| Returns Before Taxes | 3.17% | 12.96% | 8.30% |
| Returns After Taxes on Distributions | 2.88 | 12.69 | 8.08 |
| Returns After Taxes on Distributions and Sale of Fund Shares | 2.02 | 10.38 | 6.77 |
| |
| | One | Five | Ten |
| | Year | Years | Years |
| Value Index Fund Investor Shares | | | |
| Returns Before Taxes | -1.03% | 11.54% | 6.33% |
| Returns After Taxes on Distributions | -1.61 | 11.00 | 5.85 |
| Returns After Taxes on Distributions and Sale of Fund Shares | -0.12 | 9.20 | 5.09 |
| |
| | One | Five | Ten |
| | Year | Years | Years |
| Large-Cap Index Fund Investor Shares | | | |
| Returns Before Taxes | 0.93% | 12.23% | 7.33% |
| Returns After Taxes on Distributions | 0.50 | 11.82 | 6.98 |
| Returns After Taxes on Distributions and Sale of Fund Shares | 0.89 | 9.77 | 5.94 |
79
About Your Fund’s Expenses
As a shareholder of the fund, you incur ongoing costs, which include costs for portfolio management, administrative services, and shareholder reports (like this one), among others. Operating expenses, which are deducted from a fund’s gross income, directly reduce the investment return of the fund.
A fund’s expenses are expressed as a percentage of its average net assets. This figure is known as the expense ratio. The following examples are intended to help you understand the ongoing costs (in dollars) of investing in your fund and to compare these costs with those of other mutual funds. The examples are based on an investment of $1,000 made at the beginning of the period shown and held for the entire period.
The accompanying table illustrates your fund’s costs in two ways:
• Based on actual fund return. This section helps you to estimate the actual expenses that you paid over the period. The ”Ending Account Value“ shown is derived from the fund‘s actual return, and the third column shows the dollar amount that would have been paid by an investor who started with $1,000 in the fund. You may use the information here, together with the amount you invested, to estimate the expenses that you paid over the period.
To do so, simply divide your account value by $1,000 (for example, an $8,600 account value divided by $1,000 = 8.6), then multiply the result by the number given for your fund under the heading ”Expenses Paid During Period.“
• Based on hypothetical 5% yearly return. This section is intended to help you compare your fund‘s costs with those of other mutual funds. It assumes that the fund had a yearly return of 5% before expenses, but that the expense ratio is unchanged. In this case—because the return used is not the fund’s actual return—the results do not apply to your investment. The example is useful in making comparisons because the Securities and Exchange Commission requires all mutual funds to calculate expenses based on a 5% return. You can assess your fund’s costs by comparing this hypothetical example with the hypothetical examples that appear in shareholder reports of other funds.
Note that the expenses shown in the table are meant to highlight and help you compare ongoing costs only and do not reflect transaction costs incurred by the fund for buying and selling securities. Further, the expenses do not include any purchase, redemption, or account service fees described in the fund prospectus. If such fees were applied to your account, your costs would be higher. Your fund does not carry a “sales load.”
The calculations assume no shares were bought or sold during the period. Your actual costs may have been higher or lower, depending on the amount of your investment and the timing of any purchases or redemptions.
You can find more information about the fund’s expenses, including annual expense ratios, in the Financial Statements section of this report. For additional information on operating expenses and other shareholder costs, please refer to your fund’s current prospectus.
80
| | | |
| Six Months Ended December 31, 2015 | | | |
| | Beginning | Ending | Expenses |
| | Account Value | Account Value | Paid During |
| | 6/30/2015 | 12/31/2015 | Period |
| Based on Actual Fund Return | | | |
| Growth Index Fund | | | |
| Investor Shares | $1,000.00 | $1,000.26 | $1.16 |
| ETF Shares | 1,000.00 | 1,001.03 | 0.45 |
| Admiral Shares | 1,000.00 | 1,000.97 | 0.45 |
| Institutional Shares | 1,000.00 | 1,001.03 | 0.35 |
| Value Index Fund | | | |
| Investor Shares | $1,000.00 | $991.29 | $1.15 |
| ETF Shares | 1,000.00 | 991.82 | 0.45 |
| Admiral Shares | 1,000.00 | 992.03 | 0.45 |
| Institutional Shares | 1,000.00 | 992.06 | 0.40 |
| Large-Cap Index Fund | | | |
| Investor Shares | $1,000.00 | $995.71 | $0.91 |
| ETF Shares | 1,000.00 | 996.24 | 0.45 |
| Admiral Shares | 1,000.00 | 996.10 | 0.45 |
| Institutional Shares | 1,000.00 | 996.23 | 0.40 |
81
| | | |
| Six Months Ended December 31, 2015 | | | |
| | Beginning | Ending | Expenses |
| | Account Value | Account Value | Paid During |
| | 6/30/2015 | 12/31/2015 | Period |
| Based on Hypothetical 5% Yearly Return | | | |
| Growth Index Fund | | | |
| Investor Shares | $1,000.00 | $1,024.05 | $1.17 |
| ETF Shares | 1,000.00 | 1,024.75 | 0.46 |
| Admiral Shares | 1,000.00 | 1,024.75 | 0.46 |
| Institutional Shares | 1,000.00 | 1,024.85 | 0.36 |
| Value Index Fund | | | |
| Investor Shares | $1,000.00 | $1,024.05 | $1.17 |
| ETF Shares | 1,000.00 | 1,024.75 | 0.46 |
| Admiral Shares | 1,000.00 | 1,024.75 | 0.46 |
| Institutional Shares | 1,000.00 | 1,024.80 | 0.41 |
| Large-Cap Index Fund | | | |
| Investor Shares | $1,000.00 | $1,024.30 | $0.92 |
| ETF Shares | 1,000.00 | 1,024.75 | 0.46 |
| Admiral Shares | 1,000.00 | 1,024.75 | 0.46 |
| Institutional Shares | 1,000.00 | 1,024.80 | 0.41 |
The calculations are based on expenses incurred in the most recent six-month period. The funds’ annualized six-month expense ratios for that period are: for the Growth Index Fund, 0.23% for Investor Shares, 0.09% for ETF Shares, 0.09% for Admiral Shares, and 0.07% for Institutional Shares; for the Value Index Fund, 0.23% for Investor Shares, 0.09% for ETF Shares, 0.09% for Admiral Shares, and 0.08% for Institutional Shares; and for the Large-Cap Index Fund, 0.18% for Investor Shares, 0.09% for ETF Shares, 0.09% for Admiral Shares, and 0.08% for Institutional Shares. The dollar amounts shown as “Expenses Paid” are equal to the annualized expense ratio multiplied by the average account value over the period, multiplied by the number of days in the most recent six-month period, then divided by the number of days in the most recent 12-month period (184/365).
82
Glossary
30-Day SEC Yield. A fund’s 30-day SEC yield is derived using a formula specified by the U.S. Securities and Exchange Commission. Under the formula, data related to the fund’s security holdings in the previous 30 days are used to calculate the fund’s hypothetical net income for that period, which is then annualized and divided by the fund’s estimated average net assets over the calculation period. For the purposes of this calculation, a security’s income is based on its current market yield to maturity (for bonds), its actual income (for asset-backed securities), or its projected dividend yield (for stocks). Because the SEC yield represents hypothetical annualized income, it will differ—at times significantly—from the fund’s actual experience. As a result, the fund’s income distributions may be higher or lower than implied by the SEC yield.
Beta. A measure of the magnitude of a fund’s past share-price fluctuations in relation to the ups and downs of a given market index. The index is assigned a beta of 1.00. Compared with a given index, a fund with a beta of 1.20 typically would have seen its share price rise or fall by 12% when the index rose or fell by 10%. For this report, beta is based on returns over the past 36 months for both the fund and the index. Note that a fund’s beta should be reviewed in conjunction with its R-squared (see definition). The lower the R-squared, the less correlation there is between the fund and the index, and the less reliable beta is as an indicator of volatility.
Dividend Yield. Dividend income earned by stocks, expressed as a percentage of the aggregate market value (or of net asset value, for a fund). The yield is determined by dividing the amount of the annual dividends by the aggregate value (or net asset value) at the end of the period. For a fund, the dividend yield is based solely on stock holdings and does not include any income produced by other investments.
Earnings Growth Rate. The average annual rate of growth in earnings over the past five years for the stocks now in a fund.
Equity Exposure. A measure that reflects a fund’s investments in stocks and stock futures. Any holdings in short-term reserves are excluded.
Expense Ratio. A fund’s total annual operating expenses expressed as a percentage of the fund’s average net assets. The expense ratio includes management and administrative expenses, but does not include the transaction costs of buying and selling portfolio securities.
Foreign Holdings. The percentage of a fund represented by securities or depositary receipts of companies based outside the United States.
Inception Date. The date on which the assets of a fund (or one of its share classes) are first invested in accordance with the fund’s investment objective. For funds with a subscription period, the inception date is the day after that period ends. Investment performance is measured from the inception date.
Median Market Cap. An indicator of the size of companies in which a fund invests; the midpoint of market capitalization (market price x shares outstanding) of a fund’s stocks, weighted by the proportion of the fund’s assets invested in each stock. Stocks representing half of the fund’s assets have market capitalizations above the median, and the rest are below it.
Price/Book Ratio. The share price of a stock divided by its net worth, or book value, per share. For a fund, the weighted average price/book ratio of the stocks it holds.
83
Price/Earnings Ratio. The ratio of a stock’s current price to its per-share earnings over the past year. For a fund, the weighted average P/E of the stocks it holds. P/E is an indicator of market expectations about corporate prospects; the higher the P/E, the greater the expectations for a company’s future growth.
R-Squared. A measure of how much of a fund’s past returns can be explained by the returns from the market in general, as measured by a given index. If a fund’s total returns were precisely synchronized with an index’s returns, its R-squared would be 1.00. If the fund’s returns bore no relationship to the index’s returns, its R-squared would be 0. For this report, R-squared is based on returns over the past 36 months for both the fund and the index.
Return on Equity. The annual average rate of return generated by a company during the past five years for each dollar of shareholder’s equity (net income divided by shareholder’s equity). For a fund, the weighted average return on equity for the companies whose stocks it holds.
Short-Term Reserves. The percentage of a fund invested in highly liquid, short-term securities that can be readily converted to cash.
Turnover Rate. An indication of the fund’s trading activity. Funds with high turnover rates incur higher transaction costs and may be more likely to distribute capital gains (which may be taxable to investors). The turnover rate excludes in-kind transactions, which have minimal impact on costs.
Benchmark Information
Spliced Growth Index: S&P 500 Growth Index (formerly known as the S&P 500/Barra Growth Index) through May 16, 2003; MSCI US Prime Market Growth Index through April 16, 2013; CRSP US Large Cap Growth Index thereafter.
Spliced Large Cap Index: MSCI US Prime Market 750 Index through January 30, 2013; CRSP US Large Cap Index thereafter.
Spliced Value Index: S&P 500 Value Index (formerly known as the S&P 500/Barra Value Index) through May 16, 2003; MSCI US Prime Market Value Index through April 16, 2013; CRSP US Large Cap Value Index thereafter.
84
This page intentionally left blank.
This page intentionally left blank.
This page intentionally left blank.
The People Who Govern Your Fund
The trustees of your mutual fund are there to see that the fund is operated and managed in your best interests since, as a shareholder, you are a part owner of the fund. Your fund’s trustees also serve on the board of directors of The Vanguard Group, Inc., which is owned by the Vanguard funds and provides services to them on an at-cost basis.
A majority of Vanguard’s board members are independent, meaning that they have no affiliation with Vanguard or the funds they oversee, apart from the sizable personal investments they have made as private individuals. The independent board members have distinguished backgrounds in business, academia, and public service. Each of the trustees and executive officers oversees 194 Vanguard funds.
The following table provides information for each trustee and executive officer of the fund. More information about the trustees is in the Statement of Additional Information, which can be obtained, without charge, by contacting Vanguard at 800-662-7447, or online at vanguard.com.
InterestedTrustee1
F. William McNabb III
Born 1957. Trustee Since July 2009. Chairman of the Board. Principal Occupation(s) During the Past Five Years and Other Experience: Chairman of the Board of The Vanguard Group, Inc., and of each of the investment companies served by The Vanguard Group, since January 2010; Director of The Vanguard Group since 2008; Chief Executive Officer and President of The Vanguard Group, and of each of the investment companies served by The Vanguard Group, since 2008; Director of Vanguard Marketing Corporation; Managing Director of The Vanguard Group (1995–2008).
IndependentTrustees
Emerson U. Fullwood
Born 1948. Trustee Since January 2008. Principal Occupation(s) During the Past Five Years and Other Experience: Executive Chief Staff and Marketing Officer for North America and Corporate Vice President (retired 2008) of Xerox Corporation (document management products and services); Executive in Residence and 2009–2010 Distinguished Minett Professor at the Rochester Institute of Technology; Director of SPX Corporation (multi-industry manufacturing), the United Way of Rochester, the University of Rochester Medical Center, Monroe Community College Foundation, and North Carolina A&T University.
Rajiv L. Gupta
Born 1945. Trustee Since December 2001.2 Principal Occupation(s) During the Past Five Years and Other Experience: Chairman and Chief Executive Officer (retired 2009) and President (2006–2008) of Rohm and Haas Co. (chemicals); Director of Tyco International PLC (diversified manufacturing and services), Hewlett-Packard Co. (electronic computer manufacturing), and Delphi Automotive PLC (automotive components); Senior Advisor at New Mountain Capital.
Amy Gutmann
Born 1949. Trustee Since June 2006. Principal Occupation(s) During the Past Five Years and Other Experience: President of the University of Pennsylvania; Christopher H. Browne Distinguished Professor of Political Science, School of Arts and Sciences, and Professor of Communication, Annenberg School for Communication, with secondary faculty appointments in the Department of Philosophy, School of Arts and Sciences, and at the Graduate School of Education, University of Pennsylvania; Trustee of the National Constitution Center; Chair of the Presidential Commission for the Study of Bioethical Issues.
JoAnn Heffernan Heisen
Born 1950. Trustee Since July 1998. Principal Occupation(s) During the Past Five Years and Other Experience: Corporate Vice President and Chief Global Diversity Officer (retired 2008) and Member of the Executive Committee (1997–2008) of Johnson & Johnson (pharmaceuticals/medical devices/consumer products); Director of Skytop Lodge Corporation (hotels) and the Robert Wood Johnson Foundation; Member of the Advisory Board of the Institute for Women’s Leadership at Rutgers University.
F. Joseph Loughrey
Born 1949. Trustee Since October 2009. Principal Occupation(s) During the Past Five Years and Other Experience: President and Chief Operating Officer (retired 2009) of Cummins Inc. (industrial machinery); Chairman of the Board of Hillenbrand, Inc. (specialized consumer services), and of Oxfam America; Director of SKF AB (industrial machinery), Hyster-Yale Materials Handling, Inc. (forklift trucks), the Lumina Foundation for Education, and the V Foundation for Cancer Research; Member of the Advisory Council for the College of Arts and Letters and of the Advisory Board to the Kellogg Institute for International Studies, both at the University of Notre Dame.
Mark Loughridge
Born 1953. Trustee Since March 2012. Principal Occupation(s) During the Past Five Years and Other Experience: Senior Vice President and Chief Financial Officer (retired 2013) at IBM (information technology services); Fiduciary Member of IBM’s Retirement Plan Committee (2004–2013); Director of the Dow Chemical Company; Member of the Council on Chicago Booth.
Scott C. Malpass
Born 1962. Trustee Since March 2012. Principal Occupation(s) During the Past Five Years and Other Experience: Chief Investment Officer and Vice President at the University of Notre Dame; Assistant Professor of Finance at the Mendoza College of Business at Notre Dame; Member of the Notre Dame 403(b) Investment Committee; Board Member of TIFF Advisory Services, Inc., and Catholic Investment Services, Inc. (investment advisors); Member of the Investment Advisory Committee of Major League Baseball.
André F. Perold
Born 1952. Trustee Since December 2004. Principal Occupation(s) During the Past Five Years and Other Experience: George Gund Professor of Finance and Banking, Emeritus at the Harvard Business School (retired 2011); Chief Investment Officer and Managing Partner of HighVista Strategies LLC (private investment firm); Director of Rand Merchant Bank; Overseer of the Museum of Fine Arts Boston.
Peter F. Volanakis
Born 1955. Trustee Since July 2009. Principal Occupation(s) During the Past Five Years and Other Experience: President and Chief Operating Officer (retired 2010) of Corning Incorporated (communications equipment); Trustee of Colby-Sawyer College; Member of the Advisory Board of the Norris Cotton Cancer Center and of the Advisory Board of the Parthenon Group (strategy consulting).
Executive Officers
Glenn Booraem
Born 1967. Treasurer Since May 2015. Principal Occupation(s) During the Past Five Years and Other Experience: Principal of The Vanguard Group, Inc.; Treasurer of each of the investment companies served by The Vanguard Group; Controller of each of the investment companies served by The Vanguard Group (2010–2015); Assistant Controller of each of the investment companies served by The Vanguard Group (2001–2010).
Thomas J. Higgins
Born 1957. Chief Financial Officer Since September 2008. Principal Occupation(s) During the Past Five Years and Other Experience: Principal of The Vanguard Group, Inc.; Chief Financial Officer of each of the investment companies served by The Vanguard Group; Treasurer of each of the investment companies served by The Vanguard Group (1998–2008).
Peter Mahoney
Born 1974. Controller Since May 2015. Principal Occupation(s) During the Past Five Years and Other Experience: Head of Global Fund Accounting at The Vanguard Group, Inc.; Controller of each of the investment companies served by The Vanguard Group; Head of International Fund Services at The Vanguard Group (2008–2014).
Heidi Stam
Born 1956. Secretary Since July 2005. Principal Occupation(s) During the Past Five Years and Other Experience: Managing Director of The Vanguard Group, Inc.; General Counsel of The Vanguard Group; Secretary of The Vanguard Group and of each of the investment companies served by The Vanguard Group; Director and Senior Vice President of Vanguard Marketing Corporation.
Vanguard Senior Management Team
Mortimer J. Buckley
Kathleen C. Gubanich
Paul A. Heller
Martha G. King
John T. Marcante
Chris D. McIsaac
James M. Norris
Thomas M. Rampulla
Glenn W. Reed
Karin A. Risi
Chairman Emeritus and Senior Advisor
John J. Brennan
Chairman, 1996–2009
Chief Executive Officer and President, 1996–2008
Founder John C. Bogle
Chairman and Chief Executive Officer, 1974–1996
1 Mr. McNabb is considered an “interested person,” as defined in the Investment Company Act of 1940, because he is an officer of the Vanguard funds.
2 December 2002 for Vanguard Equity Income Fund, the Vanguard Municipal Bond Funds, and the Vanguard State Tax-Exempt Funds.
 |
| P.O. Box 2600 |
| Valley Forge, PA 19482-2600 |
Connect with Vanguard® > vanguard.com
| |
| Fund Information > 800-662-7447 | |
| Direct Investor Account Services > 800-662-2739 | |
| Institutional Investor Services > 800-523-1036 | |
| Text Telephone for People | |
| Who Are Deaf or Hard of Hearing> 800-749-7273 | |
| |
| This material may be used in conjunction | |
| with the offering of shares of any Vanguard | |
| fund only if preceded or accompanied by | |
| the fund’s current prospectus. | |
| |
| All comparative mutual fund data are from Lipper, a | |
| Thomson Reuters Company, or Morningstar, Inc., unless | |
| otherwise noted. | |
| |
| You can obtain a free copy of Vanguard’s proxy voting | |
| guidelines by visiting vanguard.com/proxyreporting or by | |
| calling Vanguard at 800-662-2739. The guidelines are | |
| also available from the SEC’s website, sec.gov. In | |
| addition, you may obtain a free report on how your fund | |
| voted the proxies for securities it owned during the 12 | |
| months ended June 30. To get the report, visit either | |
| vanguard.com/proxyreporting or sec.gov. | |
| |
| You can review and copy information about your fund at | |
| the SEC’s Public Reference Room in Washington, D.C. To | |
| find out more about this public service, call the SEC at | |
| 202-551-8090. Information about your fund is also | |
| available on the SEC’s website, and you can receive | |
| copies of this information, for a fee, by sending a | |
| request in either of two ways: via email addressed to | |
| publicinfo@sec.gov or via regular mail addressed to the | |
| Public Reference Section, Securities and Exchange | |
| Commission, Washington, DC 20549-1520. | |
| |
| | © 2016 The Vanguard Group, Inc. |
| | All rights reserved. |
| | Vanguard Marketing Corporation, Distributor. |
| |
| | Q03070 022016 |

Annual Report | December 31, 2015
Vanguard Total Stock Market Index Fund
Vanguard’s Principles for Investing Success
We want to give you the best chance of investment success. These principles, grounded in Vanguard’s research and experience, can put you on the right path.
Goals. Create clear, appropriate investment goals.
Balance. Develop a suitable asset allocation using broadly diversified funds. Cost. Minimize cost.
Discipline. Maintain perspective and long-term discipline.
A single theme unites these principles: Focus on the things you can control.
We believe there is no wiser course for any investor.
| |
| Contents | |
| Your Fund’s Total Returns. | 1 |
| Chairman’s Letter. | 2 |
| Fund Profile. | 9 |
| Performance Summary. | 11 |
| Financial Statements. | 13 |
| Your Fund’s After-Tax Returns. | 32 |
| About Your Fund’s Expenses. | 33 |
| Glossary. | 35 |
Please note: The opinions expressed in this report are just that—informed opinions. They should not be considered promises or advice. Also, please keep in mind that the information and opinions cover the period through the date on the front of this report. Of course, the risks of investing in your fund are spelled out in the prospectus.
See the Glossary for definitions of investment terms used in this report.
About the cover: Pictured is a sailing block on the Brilliant, a 1932 schooner docked in Mystic, Connecticut. A type of pulley, the sailing block helps coordinate the setting of the sails. At Vanguard, the intricate coordination of technology and people allows us to help millions of clients around the world reach their financial goals.
| |
| Your Fund’s Total Returns | |
| |
| |
| |
| |
| Fiscal Year Ended December 31, 2015 | |
| | Total |
| | Returns |
| Vanguard Total Stock Market Index Fund | |
| Investor Shares | 0.29% |
| ETF Shares | |
| Market Price | 0.37 |
| Net Asset Value | 0.40 |
| Admiral™ Shares | 0.39 |
| Institutional Shares | 0.42 |
| Institutional Plus Shares (Inception: 4/28/2015) | -3.28 |
| CRSP US Total Market Index | 0.40 |
| Multi-Cap Core Funds Average | -2.29 |
Multi-Cap Core Funds Average: Derived from data provided by Lipper, a Thomson Reuters Company.
Admiral Shares carry lower expenses and are available to investors who meet certain account-balance requirements. Institutional Shares and Institutional Plus Shares are available to certain institutional investors who meet specific administrative, service, and account-size criteria. The Vanguard ETF® Shares shown are traded on the NYSE Arca exchange and are available only through brokers. The table provides ETF returns based on both the NYSE Arca market price and the net asset value for a share. U.S. Pat. Nos. 6,879,964; 7,337,138; 7,720,749; 7,925,573; 8,090,646; and 8,417,623.
For the ETF Shares, the market price is determined by the midpoint of the bid-offer spread as of the closing time of the New York Stock Exchange (generally 4 p.m., Eastern time). The net asset value is also determined as of the NYSE closing time. For more information about how the ETF Shares' market prices have compared with their net asset value, visit vanguard.com, select your ETF, and then select the Price and Performance tab. The ETF premium/discount analysis there shows the percentages of days on which the ETF Shares' market price was above or below the NAV.
| | | | |
| Your Fund’s Performance at a Glance | | | | |
| December 31, 2014, Through December 31, 2015 | | | | |
| | | | Distributions Per Share |
| | Starting | Ending | | |
| | Share | Share | Income | Capital |
| | Price | Price | Dividends | Gains |
| Vanguard Total Stock Market Index Fund | | | | |
| Investor Shares | $51.58 | $50.78 | $0.947 | $0.000 |
| ETF Shares | 106.00 | 104.34 | 2.067 | 0.000 |
| Admiral Shares | 51.60 | 50.79 | 1.005 | 0.000 |
| Institutional Shares | 51.60 | 50.80 | 1.009 | 0.000 |
| Institutional Plus Shares | | | | |
| (Inception: 4/28/2015) | 100.00 | 95.26 | 1.444 | 0.000 |
1

Chairman’s Letter
Dear Shareholder,
Buffeted by various global economic and market challenges, U.S. stocks traced a roundabout route in 2015 before finishing slightly ahead of where they started. Over the 12-month period ended December 31, 2015, Vanguard Total Stock Market Index Fund’s Investor Shares returned 0.29%. The fund closely tracked the performance of its benchmark, the CRSP US Total Market Index, and surpassed the average return of its multi-cap core fund peers by about 2 percentage points.
Growth stocks outpaced their value counterparts, and large-capitalization stocks exceeded mid-caps and small-caps. Six of the market’s ten industry sectors posted positive results. Consumer and health care stocks were the top performers, while oil and gas and basic materials stocks noticeably lagged.
A broad stock market index fund can be a tax-efficient investment. If you hold the fund in a taxable account, you may wish to review the after-tax returns that appear later in this report.
Despite troubles, U.S. stocks eked out a seventh year of gains
U.S. stocks returned 0.48% for the 12 months. Although the broad market recorded its worst performance since 2008, it still posted gains for the seventh straight calendar year when dividends are factored into returns.
2
Stocks rose modestly over the first half of the year but slid in August and September as concerns mounted that China’s economic slowdown would spread globally. Falling oil and commodity prices also affected economies and markets across the world for better or worse. Central banks in Europe and Asia bolstered their stimulus efforts against weak growth and low inflation. And in December, the Federal Reserve ended months of uncertainty when it raised the target for short-term interest rates to 0.25%–0.5%.
International stocks returned about –5%, restrained by the U.S. dollar’s strength against many foreign currencies. Emerging markets fared the worst.
U.S. bonds ended the year with a slender advance
The broad U.S. taxable bond market gained 0.55% over the 12 months; income accounted for the modestly positive result. The yield of the 10-year Treasury note ended December at 2.30%, up from 2.19% a year earlier. (Bond prices and yields move in opposite directions.)
Investors focused on the Fed’s stance on short-term interest rates and alternately embraced or avoided safe-haven assets, depending on the stock market’s strength.
International bond markets (as measured by the Barclays Global Aggregate Index ex USD) returned –6.02%, reduced by the
| | | |
| Market Barometer | | | |
| |
| | | Average Annual Total Returns |
| | | Periods Ended December 31, 2015 |
| | One | Three | Five |
| | Year | Years | Years |
| Stocks | | | |
| Russell 1000 Index (Large-caps) | 0.92% | 15.01% | 12.44% |
| Russell 2000 Index (Small-caps) | -4.41 | 11.65 | 9.19 |
| Russell 3000 Index (Broad U.S. market) | 0.48 | 14.74 | 12.18 |
| FTSE All-World ex US Index (International) | -4.72 | 2.04 | 1.48 |
| |
| Bonds | | | |
| Barclays U.S. Aggregate Bond Index (Broad taxable market) | 0.55% | 1.44% | 3.25% |
| Barclays Municipal Bond Index (Broad tax-exempt market) | 3.30 | 3.16 | 5.35 |
| Citigroup Three-Month U.S. Treasury Bill Index | 0.03 | 0.02 | 0.04 |
| |
| CPI | | | |
| Consumer Price Index | 0.73% | 1.00% | 1.53% |
3
dollar’s strength against many foreign currencies. Without this currency effect, returns were modestly positive.
Although the Fed raised its target for short-term interest rates in mid-December, returns for money market funds and savings accounts remained limited by the 0%–0.25% levels in place for much of the past seven years.
Oil and gas stocks’ fall continued; consumer sectors were bright spots
Vanguard Total Stock Market Index Fund offers investors exposure to every segment of the U.S. equity market. Stocks of all sizes, styles, and sectors are represented. For this period, the fund’s overall performance was helped by its heavy exposure to large-cap stocks.
The retreat of oil and gas stocks, which returned about –22% over the period, had the largest impact on the fund’s overall results. Oil prices’ lengthy and sharp slide punished the sector, in part because of high production levels from some leading oil-producing countries and the concerns about China, the world’s largest oil importer. Natural gas prices also dropped, though not as dramatically. Some integrated oil and gas firms held up better than others, but most companies engaged in production and exploration and services and distribution suffered.
The basic materials sector, which returned –12%, was another of the broad market’s weakest as commodity prices fell along with those of oil. Metals and mining firms, which dominate the sector, posted the
| | | | | | |
| Expense Ratios | | | | | | |
| Your Fund Compared With Its Peer Group | | | | | | |
| |
| | | | | | | Peer |
| | Investor | ETF | Admiral | Institutional | Institutional | Group |
| | Shares | Shares | Shares | Shares | Plus Shares | Average |
| Total Stock Market Index Fund | 0.17% | 0.05% | 0.05% | 0.04% | 0.02% | 1.21% |
The fund expense ratios shown are from the prospectus dated April 28, 2015, and represent estimated costs for the current fiscal year. For the fiscal year ended December 31, 2015, the fund’s expense ratios were: 0.16% for Investor Shares, 0.05% for ETF Shares, 0.05% for Admiral Shares, 0.04% for Institutional Shares, and 0.02% for Institutional Plus Shares (annualized since inception). The peer-group expense ratio is derived from data provided by Lipper, a Thomson Reuters Company, and captures information through year-end 2014.
Peer group: Multi-Cap Core Funds.
4
poorest results, but chemical companies also struggled. The industrial and utilities sectors also declined, although not as severely as oil and gas and materials.
The investment environment wasn’t all grim. The U.S. economy mostly grew, propped up by shoppers’ overall confidence and willingness to spend. Among the market’s strongest sectors were consumer services and consumer goods. In consumer services, the internet retail area was especially productive; several home improvement retailers also excelled. In consumer goods, notable showings came from toy, tobacco, and beverage companies.
Health care stocks climbed nearly 7%, results that were a fraction better than those of consumer services and the best of the ten sectors. Merger-and-acquisition activity, vibrant drug pipelines, and favorable long-term demographic and economic trends lifted the sector, but there were stumbles related to controversy over high drug prices and lofty valuations of biotechnology stocks.
Technology returned almost 4%. As with health care, results paled compared with some robust recent periods but were still positive. Gains from internet and software firms were partially offset by poorer performance from computer hardware and semiconductor companies.
| |
| Total Returns | |
| Ten Years Ended December 31, 2015 | |
| | Average |
| | Annual Return |
| Total Stock Market Index Fund Investor Shares | 7.39% |
| Spliced Total Stock Market Index | 7.51 |
| Multi-Cap Core Funds Average | 5.81 |
For a benchmark description, see the Glossary.
Multi-Cap Core Funds Average: Derived from data provided by Lipper, a Thomson Reuters Company.
The figures shown represent past performance, which is not a guarantee of future results. (Current performance may be lower or higher than the performance data cited. For performance data current to the most recent month-end, visit our website at vanguard.com/performance.) Note, too, that both investment returns and principal value can fluctuate widely, so an investor’s shares, when sold, could be worth more or less than their original cost.
5
The financial sector, the fund’s largest, mirrored the broader market’s return with a result that was barely positive. Real estate investment trusts (REITs) and banks managed to produce small returns, while asset managers and life insurance companies declined.
Tight tracking is evident over the previous decade
Over the last ten years, the Total Stock Market Index Fund’s Investor Shares have produced an average annual return of 7.39%, in line with the benchmark and more than 1 percentage point higher than peer funds, many of which are actively managed.
First and foremost, the fund’s objective is to track the index closely, and its success in doing so is a testament to the expertise and experience of the fund’s advisor, Vanguard Equity Index Group.
This group of professionals uses well-honed portfolio construction and trading methodologies that have allowed Vanguard to provide effective index-tracking regardless of the market’s volatility or direction.
|
| Vanguard’s outlook for investors: Not bearish, but cautious |
| |
| In Vanguard’s recently published global economic and investment outlook, Global Chief |
| Economist Joseph Davis and his team discuss various market and economic events 2016 |
| may bring, along with challenges and opportunities for investors. |
| |
| Our forecast includes “frustratingly fragile” economic growth and more modest long-term |
| returns from the global stock and bond markets. The report cautions that for the decade ending |
| 2025, returns for a balanced portfolio are likely to be moderately below historical averages. |
| |
| Our simulations indicate that the average annualized returns of a 60% equity/40% bond |
| portfolio for the decade are most likely to be centered in the 3%–5% range after inflation, |
| below the actual average after-inflation return of 5.5% for the same portfolio since 1926. |
| |
| Even so, Vanguard’s steadfast belief in its principles for investing success—focusing on clear |
| goals, a suitable asset allocation, low costs, and long-term discipline—remains unchanged. |
| |
| For more information about our expectations and the probability of various outcomes, see |
| Vanguard’s Economic and Investment Outlook, available at vanguard.com/research. |
IMPORTANT: The projections or other information generated by the Vanguard Capital Markets Model® (VCMM) regarding the likelihood of various investment outcomes are hypothetical in nature, do not reflect actual investment results, and are not guarantees of future results. Distribution of return outcomes from VCMM, derived from 10,000 simulations for U.S. equity returns and fixed income returns. Simulations as of September 30, 2015. Results from the model may vary with each use and over time. For more information, please see page 7.
6
The fund has also benefited from its low costs, which help close the gap between the index’s results and yours.
To reach your long-term goals, be realistic and try to save more
Although there have been times when it felt as if stocks and bonds were riding a roller coaster, the markets have generally risen in recent years. The broad global stock market in particular has posted some impressive gains since its turnaround began in 2009.
But 2015 served as a reminder that markets aren’t always favorable. The U.S. stock and bond markets were barely positive, and international stocks and unhedged bonds finished in the red.
In Vanguard’s recently updated long-term look at the economy and markets, our global economists explain why they expect economic growth to remain “frustratingly fragile” and why their outlook for stock and bond markets is the most guarded since 2006. (For more details, see the box on page 6 and Vanguard’s Economic and Investment Outlook, available at vanguard. com/research.)
Given these muted expectations, what’s the best course of action? I’ve often encouraged shareholders to focus on the things they can control. That advice holds true today.
Consider saving more than you think you may need. That’s one way you can prepare for the volatility that may lie ahead,
IMPORTANT: The projections or other information generated by the Vanguard Capital Markets Model (VCMM) regarding the likelihood of various investment outcomes are hypothetical in nature, do not reflect actual investment results, and are not guarantees of future results. VCMM results will vary with each use and over time.
The VCMM projections are based on a statistical analysis of historical data. Future returns may behave differently from the historical patterns captured in the VCMM. More important, the VCMM may be underestimating extreme negative scenarios unobserved in the historical period on which the model estimation is based.
The VCMM is a proprietary financial simulation tool developed and maintained by Vanguard’s primary investment research and advice teams. The model forecasts distributions of future returns for a wide array of broad asset classes. Those asset classes include U.S. and international equity markets, several maturities of the U.S. Treasury and corporate fixed income markets, international fixed income markets, U.S. money markets, commodities, and certain alternative investment strategies. The theoretical and empirical foundation for the VCMM is that the returns of various asset classes reflect the compensation investors require for bearing different types of systematic risk (beta). At the core of the model are estimates of the dynamic statistical relationship between risk factors and asset returns, obtained from statistical analysis based on available monthly financial and economic data from as early as 1960. Using a system of estimated equations, the model then applies a Monte Carlo simulation method to project the estimated interrelationships among risk factors and asset classes as well as uncertainty and randomness over time. The model generates a large set of simulated outcomes for each asset class over several time horizons. Forecasts are obtained by computing measures of central tendency in these simulations. Results produced by the tool will vary with each use and over time.
7
particularly as markets adjust to changes in policies from the Fed and other central banks.
And, as always, investors would be well-served to follow Vanguard’s principles for investing success:
• Goals. Create clear, appropriate investment goals.
• Balance. Develop a suitable asset allocation using broadly diversified funds.
• Cost. Minimize cost.
• Discipline. Maintain perspective and long-term discipline.
As with saving, each of these principles is within your control, and focusing on them can keep you on the right path.
As always, thank you for investing with Vanguard.
Sincerely,

F. William McNabb III
Chairman and Chief Executive Officer
January 13, 2016
8
| | | | | |
| Total Stock Market Index Fund | | | |
| |
| |
| Fund Profile | | | | | |
| As of December 31, 2015 | | | | | |
| |
| Share-Class Characteristics | | | | | |
| | Investor | | Admiral | Institutional | Institutional |
| | Shares | ETF Shares | Shares | Shares | Plus Shares |
| Ticker Symbol | VTSMX | VTI | VTSAX | VITSX | VSMPX |
| Expense Ratio1 | 0.17% | 0.05% | 0.05% | 0.04% | 0.02% |
| 30-Day SEC Yield | 1.88% | 2.00% | 2.00% | 2.02% | 2.04% |
| | |
| Portfolio Characteristics | | |
| | | CRSP US |
| | | Total Market |
| | Fund | Index |
| Number of Stocks | 3,757 | 3,743 |
| Median Market Cap | $51.9B | $49.9B |
| Price/Earnings Ratio | 21.9x | 21.9x |
| Price/Book Ratio | 2.7x | 2.7x |
| Return on Equity | 17.4% | 17.2% |
| Earnings Growth | | |
| Rate | 9.4% | 9.4% |
| Dividend Yield | 2.1% | 2.1% |
| Foreign Holdings | 0.0% | 0.0% |
| Turnover Rate | 3% | — |
| Short-Term | | |
| Reserves | 0.1% | — |
Sector Diversification (% of equity exposure)
| | |
| | | CRSP US |
| | | Total Market |
| | Fund | Index |
| Basic Materials | 2.3% | 2.3% |
| Consumer Goods | 10.3 | 10.3 |
| Consumer Services | 14.0 | 14.0 |
| Financials | 19.5 | 19.5 |
| Health Care | 14.1 | 14.1 |
| Industrials | 12.3 | 12.3 |
| Oil & Gas | 6.0 | 6.0 |
| Technology | 16.2 | 16.2 |
| Telecommunications | 2.2 | 2.2 |
| Utilities | 3.1 | 3.1 |
| |
| Volatility Measures | |
| | Spliced Total |
| | Stock Market |
| | Index |
| R-Squared | 1.00 |
| Beta | 1.00 |
These measures show the degree and timing of the fund’s fluctuations compared with the index over 36 months.
Ten Largest Holdings (% of total net assets)
| | |
| Apple Inc. | Computer Hardware | 2.6% |
| Alphabet Inc. | Internet | 2.1 |
| Microsoft Corp. | Software | 1.9 |
| Exxon Mobil Corp. | Integrated Oil & Gas | 1.5 |
| General Electric Co. | Diversified Industrials | 1.3 |
| Johnson & Johnson | Pharmaceuticals | 1.3 |
| Amazon.com Inc. | Broadline Retailers | 1.2 |
| Berkshire Hathaway Inc. Reinsurance | 1.2 |
| Wells Fargo & Co. | Banks | 1.1 |
| JPMorgan Chase & Co. | Banks | 1.1 |
| Top Ten | | 15.3% |
The holdings listed exclude any temporary cash investments and equity index products.
1 The expense ratios shown are from the prospectus dated April 28, 2015, and represent estimated costs for the current fiscal year. For the fiscal year ended December 31, 2015, the expense ratios were 0.16% for Investor Shares, 0.05% for ETF Shares, 0.05% for Admiral Shares, 0.04% for Institutional Shares, and 0.02% for Institutional Plus Shares (annualized since inception).
9
Total Stock Market Index Fund
10
Total Stock Market Index Fund
Performance Summary
All of the returns in this report represent past performance, which is not a guarantee of future results that may be achieved by the fund. (Current performance may be lower or higher than the performance data cited. For performance data current to the most recent month-end, visit our website at vanguard.com/performance.) Note, too, that both investment returns and principal value can fluctuate widely, so an investor’s shares, when sold, could be worth more or less than their original cost. The returns shown do not reflect taxes that a shareholder would pay on fund distributions or on the sale of fund shares.
Cumulative Performance: December 31, 2005, Through December 31, 2015
Initial Investment of $10,000

| | | | | |
| | | Average Annual Total Returns | |
| | | Periods Ended December 31, 2015 | |
| | | | | | Final Value |
| | | One | Five | Ten | of a $10,000 |
| | | Year | Years | Years | Investment |
| | Total Stock Market Index Fund | | | | |
| | Investor Shares | 0.29% | 12.03% | 7.39% | $20,404 |
| •••••••• | Spliced Total Stock Market Index | 0.40 | 12.18 | 7.51 | 20,634 |
| – – – – | Multi-Cap Core Funds Average | -2.29 | 9.61 | 5.81 | 17,587 |
| For a benchmark description, see the Glossary. | | | | |
| Multi-Cap Core Funds Average: Derived from data provided by Lipper, a Thomson Reuters Company. | | |
| |
| | | | | | Final Value |
| | | One | Five | Ten | of a $10,000 |
| | | Year | Years | Years | Investment |
| Total Stock Market Index Fund | | | | |
| ETF Shares Net Asset Value | 0.40% | 12.16% | 7.51% | $20,631 |
| Spliced Total Stock Market Index | 0.40 | 12.18 | 7.51 | 20,634 |
| |
| | | | | | Final Value |
| | | One | Five | Ten | of a $10,000 |
| | | Year | Years | Years | Investment |
| Total Stock Market Index Fund Admiral | | | | |
| Shares | | 0.39% | 12.16% | 7.51% | $20,622 |
| Spliced Total Stock Market Index | 0.40 | 12.18 | 7.51 | 20,634 |
See Financial Highlights for dividend and capital gains information.
11
| | | | |
| Total Stock Market Index Fund | | | | |
| |
| |
| |
| | | Average Annual Total Returns | |
| | Periods Ended December 31, 2015 | |
| | | | | Final Value |
| | One | Five | Ten | of a $5,000,000 |
| | Year | Years | Years | Investment |
| Total Stock Market Index Fund Institutional | | | | |
| Shares | 0.42% | 12.17% | 7.52% | $10,326,742 |
| Spliced Total Stock Market Index | 0.40 | 12.18 | 7.51 | 10,317,193 |
| |
| |
| |
| | | | Since | Final Value |
| | | | Inception | of a $100,000,000 |
| | | | (4/28/2015) | Investment |
| Total Stock Market Index Fund Institutional | | | | |
| Plus Shares | | | -3.28% | $96,724,672 |
| CRSP US Total Market Index | | | -3.29 | 96,707,495 |
| Dow Jones U.S. Total Stock Market Float | | | | |
| Adjusted Index | | | -3.28 | 96,724,870 |
| "Since Inception" performance is calculated from the Institutional Plus Shares’ inception date for both the fund and its comparative standards. |
| | | |
| Cumulative Returns of ETF Shares: December 31, 2005, Through December 31, 2015 | |
| | One | Five | Ten |
| | Year | Years | Years |
| Total Stock Market Index Fund ETF Shares Market | | | |
| Price | 0.37% | 77.38% | 106.30% |
| Total Stock Market Index Fund ETF Shares Net | | | |
| Asset Value | 0.40 | 77.49 | 106.31 |
| Spliced Total Stock Market Index | 0.40 | 77.62 | 106.34 |
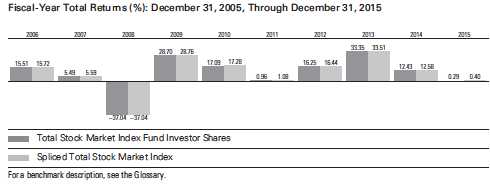
12
Total Stock Market Index Fund
Financial Statements
Statement of Net Assets—Investments Summary
As of December 31, 2015
This Statement summarizes the fund’s holdings by asset type. Details are reported for each of the fund’s 50 largest individual holdings and for investments that, in total for any issuer, represent more than 1% of the fund’s net assets. The total value of smaller holdings is reported as a single amount within each category.
The fund reports a complete list of its holdings in regulatory filings four times in each fiscal year, at the quarter-ends. For the second and fourth fiscal quarters, the complete listing of the fund’s holdings is available electronically on vanguard.com and on the Securities and Exchange Commission’s website (sec.gov), or you can have it mailed to you without charge by calling 800-662-7447. For the first and third fiscal quarters, the fund files the lists with the SEC on Form N-Q. Shareholders can look up the fund’s Forms N-Q on the SEC’s website. Forms N-Q may also be reviewed and copied at the SEC’s Public Reference Room (see the back cover of this report for further information).
| | | |
| | | Market | Percentage |
| | | Value• | of Net |
| | Shares | ($000) | Assets |
| Common Stocks | | | |
| Basic Materials † | | 9,158,407 | 2.3% |
| |
| Consumer Goods | | | |
| Procter & Gamble Co. | 49,897,085 | 3,962,328 | 1.0% |
| Coca-Cola Co. | 71,806,305 | 3,084,799 | 0.8% |
| PepsiCo Inc. | 26,732,123 | 2,671,074 | 0.6% |
| Philip Morris International Inc. | 28,417,610 | 2,498,192 | 0.6% |
| Altria Group Inc. | 35,954,691 | 2,092,923 | 0.5% |
| NIKE Inc. Class B | 24,746,368 | 1,546,648 | 0.4% |
| Consumer Goods—Other † | | 25,205,220 | 6.3% |
| | | 41,061,184 | 10.2% |
| Consumer Services | | | |
| * Amazon.com Inc. | 6,875,454 | 4,647,051 | 1.2% |
| Home Depot Inc. | 23,256,656 | 3,075,693 | 0.8% |
| Walt Disney Co. | 27,282,122 | 2,866,805 | 0.7% |
| Comcast Corp. Class A | 44,784,115 | 2,527,168 | 0.6% |
| McDonald’s Corp. | 16,838,583 | 1,989,310 | 0.5% |
| CVS Health Corp. | 20,301,420 | 1,984,870 | 0.5% |
| Wal-Mart Stores Inc. | 26,454,106 | 1,621,637 | 0.4% |
| Starbucks Corp. | 25,866,651 | 1,552,775 | 0.4% |
| Consumer Services—Other † | | 35,312,279 | 8.8% |
| | | 55,577,588 | 13.9% |
| Financials | | | |
| Wells Fargo & Co. | 84,407,813 | 4,588,409 | 1.2% |
| * Berkshire Hathaway Inc. Class B | 33,807,482 | 4,463,940 | 1.1% |
| JPMorgan Chase & Co. | 67,562,732 | 4,461,167 | 1.1% |
| Bank of America Corp. | 190,988,325 | 3,214,334 | 0.8% |
| Visa Inc. Class A | 35,691,364 | 2,767,865 | 0.7% |
| Citigroup Inc. | 51,916,315 | 2,686,669 | 0.7% |
| MasterCard Inc. Class A | 18,163,115 | 1,768,361 | 0.4% |
13
| | | | |
| Total Stock Market Index Fund | | | |
| |
| |
| |
| | | | Market | Percentage |
| | | | Value• | of Net |
| | | Shares | ($000) | Assets |
| * | Berkshire Hathaway Inc. Class A | 863 | 170,701 | 0.0% |
| | Financials—Other † | | 53,434,303 | 13.3% |
| | | | 77,555,749 | 19.3% |
| Health Care | | | |
| | Johnson & Johnson | 50,733,121 | 5,211,306 | 1.3% |
| | Pfizer Inc. | 113,180,468 | 3,653,465 | 0.9% |
| | Merck & Co. Inc. | 51,221,217 | 2,705,505 | 0.7% |
| | Gilead Sciences Inc. | 26,426,025 | 2,674,049 | 0.7% |
| * | Allergan plc | 7,225,025 | 2,257,820 | 0.6% |
| | Amgen Inc. | 13,901,042 | 2,256,556 | 0.6% |
| | Bristol-Myers Squibb Co. | 30,580,497 | 2,103,632 | 0.5% |
| | UnitedHealth Group Inc. | 17,475,043 | 2,055,764 | 0.5% |
| | Medtronic plc | 25,931,450 | 1,994,647 | 0.5% |
| * | Celgene Corp. | 14,402,865 | 1,724,887 | 0.4% |
| | AbbVie Inc. | 28,470,169 | 1,686,573 | 0.4% |
| | Eli Lilly & Co. | 18,279,233 | 1,540,208 | 0.4% |
| | Health Care—Other † | | 26,285,264 | 6.5% |
| | | | 56,149,676 | 14.0% |
| Industrials | | | |
| | General Electric Co. | 173,064,066 | 5,390,946 | 1.4% |
| | 3M Co. | 11,294,457 | 1,701,397 | 0.4% |
| | Boeing Co. | 11,679,686 | 1,688,766 | 0.4% |
| | Industrials—Other † | | 40,404,072 | 10.1% |
| | | | 49,185,181 | 12.3% |
| Oil & Gas | | | |
| | Exxon Mobil Corp. | 76,325,369 | 5,949,562 | 1.5% |
| | Chevron Corp. | 34,502,641 | 3,103,858 | 0.8% |
| | Schlumberger Ltd. | 23,113,905 | 1,612,195 | 0.4% |
| | Oil & Gas—Other † | | 13,240,179 | 3.3% |
| | | | 23,905,794 | 6.0% |
| |
| 1Other † | | 2,991 | 0.0% |
| |
| Technology | | | |
| | Apple Inc. | 97,115,836 | 10,222,413 | 2.6% |
| | Microsoft Corp. | 139,139,690 | 7,719,470 | 1.9% |
| * | Alphabet Inc. Class A | 5,349,364 | 4,161,859 | 1.0% |
| * | Facebook Inc. Class A | 39,548,793 | 4,139,177 | 1.0% |
| * | Alphabet Inc. | 5,376,206 | 4,079,895 | 1.0% |
| | Intel Corp. | 86,562,141 | 2,982,066 | 0.8% |
| | Cisco Systems Inc. | 93,085,371 | 2,527,733 | 0.6% |
| | International Business Machines Corp. | 16,011,036 | 2,203,439 | 0.6% |
| | Oracle Corp. | 58,669,027 | 2,143,180 | 0.5% |
| | Technology—Other † | | 24,300,738 | 6.1% |
| | | | 64,479,970 | 16.1% |
| Telecommunications | | | |
| | AT&T Inc. | 112,756,002 | 3,879,934 | 1.0% |
| | Verizon Communications Inc. | 74,579,172 | 3,447,049 | 0.9% |
| | Telecommunications—Other † | | 1,435,797 | 0.3% |
| | | | 8,762,780 | 2.2% |
14
| | | | |
| Total Stock Market Index Fund | | | | |
| |
| |
| |
| | | | Market | Percentage |
| | | | Value• | of Net |
| | | | ($000) | Assets |
| Utilities † | | | 12,266,244 | 3.1% |
| Total Common Stocks (Cost $285,446,454) | | | 398,105,564 | 99.4%2 |
| |
| | Coupon | Shares | | |
| Temporary Cash Investments | | | | |
| Money Market Fund | | | | |
| 3,4 Vanguard Market Liquidity Fund | 0.363% | 4,729,461,508 | 4,729,462 | 1.2% |
| |
| 5,6U.S. Government and Agency Obligations † | | | 155,372 | 0.0% |
| Total Temporary Cash Investments (Cost $4,884,822) | | 4,884,834 | 1.2%2 |
| 7Total Investments (Cost $290,331,276) | | | 402,990,398 | 100.6% |
| |
| | | | Amount | |
| | | | ($000) | |
| Other Assets and Liabilities | | | | |
| Other Assets | | | | |
| Investment in Vanguard | | | 35,094 | |
| Receivables for Investment Securities Sold | | | 3,884 | |
| Receivables for Accrued Income | | | 547,739 | |
| Receivables for Capital Shares Issued | | | 1,566,239 | |
| Other Assets | | | 65,945 | |
| Total Other Assets | | | 2,218,901 | 0.5% |
| Liabilities | | | | |
| Payables for Investment Securities Purchased | | | (2,290,037) | |
| Collateral for Securities on Loan | | | (1,834,498) | |
| Payables for Capital Shares Redeemed | | | (118,817) | |
| Payables to Vanguard | | | (211,279) | |
| Other Liabilities | | | (103,611) | |
| Total Liabilities | | | (4,558,242) | (1.1%) |
| Net Assets | | | 400,651,057 | 100.0% |
| |
| |
| At December 31, 2015, net assets consisted of: | | | | |
| | | | | Amount |
| | | | | ($000) |
| Paid-in Capital | | | | 289,350,157 |
| Overdistributed Net Investment Income | | | | (83,137) |
| Accumulated Net Realized Losses | | | | (1,300,679) |
| Unrealized Appreciation (Depreciation) | | | | |
| Investment Securities | | | | 112,659,122 |
| Futures Contracts | | | | 26,225 |
| Swap Contracts | | | | (631) |
| Net Assets | | | | 400,651,057 |
| |
| |
| Investor Shares—Net Assets | | | | |
| Applicable to 1,896,992,122 outstanding $.001 par value shares of | | | |
| beneficial interest (unlimited authorization) | | | | 96,322,638 |
| Net Asset Value Per Share—Investor Shares | | | | $50.78 |
15
| |
| Total Stock Market Index Fund | |
| |
| |
| |
| | Amount |
| | ($000) |
| ETF Shares—Net Assets | |
| Applicable to 550,446,327 outstanding $.001 par value shares of | |
| beneficial interest (unlimited authorization) | 57,433,884 |
| Net Asset Value Per Share—ETF Shares | $104.34 |
| |
| Admiral Shares—Net Assets | |
| Applicable to 2,487,891,207 outstanding $.001 par value shares of | |
| beneficial interest (unlimited authorization) | 126,363,349 |
| Net Asset Value Per Share—Admiral Shares | $50.79 |
| |
| Institutional Shares—Net Assets | |
| Applicable to 1,130,676,081 outstanding $.001 par value shares of | |
| beneficial interest (unlimited authorization) | 57,437,744 |
| Net Asset Value Per Share—Institutional Shares | $50.80 |
| |
| Institutional Plus Shares—Net Assets | |
| Applicable to 662,298,557 outstanding $.001 par value shares of | |
| beneficial interest (unlimited authorization) | 63,093,442 |
| Net Asset Value Per Share—Institutional Plus Shares | $95.26 |
• See Note A in Notes to Financial Statements.
* Non-income-producing security.
† Represents the aggregate value, by category, of securities that are not among the 50 largest holdings and, in total for any issuer, represent
1% or less of net assets.
1 “Other” represents securities that are not classified by the fund’s benchmark index.
2 The fund invests a portion of its cash reserves in equity markets through the use of index futures contracts and swap contracts. After giving effect to futures and swap investments, the fund’s effective common stock and temporary cash investment positions represent 100.0% and 0.6%, respectively, of net assets.
3 Affiliated money market fund available only to Vanguard funds and certain trusts and accounts managed by Vanguard. Rate shown is the 7-day yield.
4 Includes $1,834,498,000 of collateral received for securities on loan.
5 Securities with a value of $118,549,000 and cash of $31,198,000 have been segregated as initial margin for open futures contracts.
6 Securities with a value of $1,156,000 have been segregated as collateral for open over-the-counter swap contracts.
7 The total value of securities on loan is $1,713,056,000.
See accompanying Notes, which are an integral part of the Financial Statements.
16
| |
| Total Stock Market Index Fund | |
| |
| |
| Statement of Operations | |
| |
| |
| | Year Ended |
| | December 31, 2015 |
| | ($000) |
| Investment Income | |
| Income | |
| Dividends | 7,909,018 |
| Interest1 | 3,502 |
| Securities Lending | 95,010 |
| Total Income | 8,007,530 |
| Expenses | |
| The Vanguard Group—Note B | |
| Investment Advisory Services | 22,376 |
| Management and Administrative—Investor Shares | 148,542 |
| Management and Administrative—ETF Shares | 17,914 |
| Management and Administrative—Admiral Shares | 41,686 |
| Management and Administrative—Institutional Shares | 16,720 |
| Management and Administrative—Institutional Plus Shares | 4,372 |
| Marketing and Distribution—Investor Shares | 22,020 |
| Marketing and Distribution—ETF Shares | 5,330 |
| Marketing and Distribution—Admiral Shares | 11,237 |
| Marketing and Distribution—Institutional Shares | 7,494 |
| Marketing and Distribution—Institutional Plus Shares | 182 |
| Custodian Fees | 3,636 |
| Auditing Fees | 48 |
| Shareholders’ Reports—Investor Shares | 53 |
| Shareholders’ Reports—ETF Shares | 718 |
| Shareholders’ Reports—Admiral Shares | 269 |
| Shareholders’ Reports—Institutional Shares | 107 |
| Shareholders’ Reports—Institutional Plus Shares | — |
| Trustees’ Fees and Expenses | 268 |
| Total Expenses | 302,972 |
| Net Investment Income | 7,704,558 |
| Realized Net Gain (Loss) | |
| Investment Securities Sold | 12,605,126 |
| Futures Contracts | 225,238 |
| Swap Contracts | (16,047) |
| Realized Net Gain (Loss) | 12,814,317 |
| Change in Unrealized Appreciation (Depreciation) | |
| Investment Securities | (18,389,876) |
| Futures Contracts | (27,409) |
| Swap Contracts | (2,854) |
| Change in Unrealized Appreciation (Depreciation) | (18,420,139) |
| Net Increase (Decrease) in Net Assets Resulting from Operations | 2,098,736 |
| 1 Interest income from an affiliated company of the fund was $3,307,000. | |
| See accompanying Notes, which are an integral part of the Financial Statements. | |
17
| | |
| Total Stock Market Index Fund | | |
| |
| |
| Statement of Changes in Net Assets | | |
| |
| | Year Ended December 31, |
| | 2015 | 2014 |
| | ($000) | ($000) |
| Increase (Decrease) in Net Assets | | |
| Operations | | |
| Net Investment Income | 7,704,558 | 6,338,343 |
| Realized Net Gain (Loss) | 12,814,317 | 5,536,438 |
| Change in Unrealized Appreciation (Depreciation) | (18,420,139) | 29,566,230 |
| Net Increase (Decrease) in Net Assets Resulting from Operations | 2,098,736 | 41,441,011 |
| Distributions | | |
| Net Investment Income | | |
| Investor Shares | (2,011,483) | (1,960,851) |
| ETF Shares | (1,092,307) | (840,367) |
| Admiral Shares | (2,411,516) | (1,880,181) |
| Signal Shares | — | (121,148) |
| Institutional Shares | (1,465,290) | (1,532,803) |
| Institutional Plus Shares | (670,898) | — |
| Realized Capital Gain | | |
| Investor Shares | — | — |
| ETF Shares | — | — |
| Admiral Shares | — | — |
| Signal Shares | — | — |
| Institutional Shares | — | — |
| Institutional Plus Shares | — | — |
| Total Distributions | (7,651,494) | (6,335,350) |
| Capital Share Transactions | | |
| Investor Shares | (20,386,722) | 1,473,741 |
| ETF Shares | 7,518,595 | 7,232,036 |
| Admiral Shares | 10,860,724 | 20,691,802 |
| Signal Shares | — | (11,447,555) |
| Institutional Shares | (40,464,087) | 22,615,084 |
| Institutional Plus Shares | 65,672,415 | — |
| Net Increase (Decrease) from Capital Share Transactions | 23,200,925 | 40,565,108 |
| Total Increase (Decrease) | 17,648,167 | 75,670,769 |
| Net Assets | | |
| Beginning of Period | 383,002,890 | 307,332,121 |
| End of Period1 | 400,651,057 | 383,002,890 |
1 Net Assets—End of Period includes undistributed (overdistributed) net investment income of ($83,137,000) and ($120,172,000).
See accompanying Notes, which are an integral part of the Financial Statements.
18
| | | | | |
| Total Stock Market Index Fund | | | | | |
| |
| |
| Financial Highlights | | | | | |
| |
| |
| Investor Shares | | | | | |
| |
| For a Share Outstanding | | | Year Ended December 31, |
| Throughout Each Period | 2015 | 2014 | 2013 | 2012 | 2011 |
| Net Asset Value, Beginning of Period | $51.58 | $46.67 | $35.64 | $31.29 | $31.56 |
| Investment Operations | | | | | |
| Net Investment Income | . 954 | .854 | .757 | .720 | .565 |
| Net Realized and Unrealized Gain (Loss) | | | | | |
| on Investments | (. 807) | 4.907 | 11.038 | 4.350 | (.273) |
| Total from Investment Operations | .147 | 5.761 | 11.795 | 5.070 | .292 |
| Distributions | | | | | |
| Dividends from Net Investment Income | (.947) | (.851) | (.765) | (.720) | (.562) |
| Distributions from Realized Capital Gains | — | — | — | — | — |
| Total Distributions | (. 947) | (.851) | (.765) | (.720) | (.562) |
| Net Asset Value, End of Period | $50.78 | $51.58 | $46.67 | $35.64 | $31.29 |
| |
| Total Return1 | 0.29% | 12.43% | 33.35% | 16.25% | 0.96% |
| |
| Ratios/Supplemental Data | | | | | |
| Net Assets, End of Period (Millions) | $96,323 | $117,966 | $105,008 | $78,936 | $62,668 |
| Ratio of Total Expenses to Average Net Assets | 0.16% | 0.17% | 0.17% | 0.17% | 0.17% |
| Ratio of Net Investment Income to | | | | | |
| Average Net Assets | 1.85% | 1.77% | 1.84% | 2.11% | 1.79% |
| Portfolio Turnover Rate2 | 3% | 3% | 4% | 3% | 5% |
1 Total returns do not include account service fees that may have applied in the periods shown. Fund prospectuses provide information about any applicable account service fees.
2 Excludes the value of portfolio securities received or delivered as a result of in-kind purchases or redemptions of the fund’s capital shares, including ETF Creation Units.
See accompanying Notes, which are an integral part of the Financial Statements.
19
| | | | | |
| Total Stock Market Index Fund | | | | | |
| |
| |
| Financial Highlights | | | | | |
| |
| |
| ETF Shares | | | | | |
| |
| For a Share Outstanding | | | Year Ended December 31, |
| Throughout Each Period | 2015 | 2014 | 2013 | 2012 | 2011 |
| Net Asset Value, Beginning of Period | $106.00 | $95.91 | $73.24 | $64.29 | $64.86 |
| Investment Operations | | | | | |
| Net Investment Income | 2.082 | 1.874 | 1.657 | 1.564 | 1.238 |
| Net Realized and Unrealized Gain (Loss) | | | | | |
| on Investments | (1.675) | 10.085 | 22.686 | 8.949 | (.575) |
| Total from Investment Operations | . 407 | 11.959 | 24.343 | 10.513 | .663 |
| Distributions | | | | | |
| Dividends from Net Investment Income | (2.067) | (1.869) | (1.673) | (1.563) | (1.233) |
| Distributions from Realized Capital Gains | — | — | — | — | — |
| Total Distributions | (2.067) | (1.869) | (1.673) | (1.563) | (1.233) |
| Net Asset Value, End of Period | $104.34 | $106.00 | $95.91 | $73.24 | $64.29 |
| |
| Total Return | 0.40% | 12.56% | 33.51% | 16.41% | 1.06% |
| |
| Ratios/Supplemental Data | | | | | |
| Net Assets, End of Period (Millions) | $57,434 | $50,886 | $39,165 | $24,270 | $19,521 |
| Ratio of Total Expenses to Average Net Assets | 0.05% | 0.05% | 0.05% | 0.05% | 0.05% |
| Ratio of Net Investment Income to | | | | | |
| Average Net Assets | 1.96% | 1.89% | 1.96% | 2.23% | 1.91% |
| Portfolio Turnover Rate1 | 3% | 3% | 4% | 3% | 5% |
1 Excludes the value of portfolio securities received or delivered as a result of in-kind purchases or redemptions of the fund’s capital shares, including ETF Creation Units.
See accompanying Notes, which are an integral part of the Financial Statements.
20
| | | | | |
| Total Stock Market Index Fund | | | | | |
| |
| |
| Financial Highlights | | | | | |
| |
| |
| Admiral Shares | | | | | |
| |
| For a Share Outstanding | | | Year Ended December 31, |
| Throughout Each Period | 2015 | 2014 | 2013 | 2012 | 2011 |
| Net Asset Value, Beginning of Period | $51.60 | $46.69 | $35.65 | $31.30 | $31.57 |
| Investment Operations | | | | | |
| Net Investment Income | 1.013 | .912 | .807 | .761 | .602 |
| Net Realized and Unrealized Gain (Loss) | | | | | |
| on Investments | (. 818) | 4.908 | 11.047 | 4.350 | (.273) |
| Total from Investment Operations | .195 | 5.820 | 11.854 | 5.111 | .329 |
| Distributions | | | | | |
| Dividends from Net Investment Income | (1.005) | (.910) | (.814) | (.761) | (.599) |
| Distributions from Realized Capital Gains | — | — | — | — | — |
| Total Distributions | (1.005) | (.910) | (.814) | (.761) | (.599) |
| Net Asset Value, End of Period | $50.79 | $51.60 | $46.69 | $35.65 | $31.30 |
| |
| Total Return1 | 0.39% | 12.56% | 33.52% | 16.38% | 1.08% |
| |
| Ratios/Supplemental Data | | | | | |
| Net Assets, End of Period (Millions) | $126,363 | $117,476 | $86,541 | $59,771 | $49,496 |
| Ratio of Total Expenses to Average Net Assets | 0.05% | 0.05% | 0.05% | 0.05% | 0.05% |
| Ratio of Net Investment Income to | | | | | |
| Average Net Assets | 1.96% | 1.89% | 1.96% | 2.23% | 1.91% |
| Portfolio Turnover Rate2 | 3% | 3% | 4% | 3% | 5% |
1 Total returns do not include account service fees that may have applied in the periods shown. Fund prospectuses provide information about any applicable account service fees.
2 Excludes the value of portfolio securities received or delivered as a result of in-kind purchases or redemptions of the fund’s capital shares, including ETF Creation Units.
See accompanying Notes, which are an integral part of the Financial Statements.
21
| | | | | |
| Total Stock Market Index Fund | | | | | |
| |
| |
| Financial Highlights | | | | | |
| |
| |
| Institutional Shares | | | | | |
| |
| For a Share Outstanding | | | Year Ended December 31, |
| Throughout Each Period | 2015 | 2014 | 2013 | 2012 | 2011 |
| Net Asset Value, Beginning of Period | $51.60 | $46.69 | $35.66 | $31.30 | $31.57 |
| Investment Operations | | | | | |
| Net Investment Income | 1.017 | .915 | .808 | .763 | .603 |
| Net Realized and Unrealized Gain (Loss) | | | | | |
| on Investments | (. 808) | 4.908 | 11.038 | 4.359 | (.272) |
| Total from Investment Operations | .209 | 5.823 | 11.846 | 5.122 | .331 |
| Distributions | | | | | |
| Dividends from Net Investment Income | (1.009) | (.913) | (.816) | (.762) | (.601) |
| Distributions from Realized Capital Gains | — | — | — | — | — |
| Total Distributions | (1.009) | (.913) | (.816) | (.762) | (.601) |
| Net Asset Value, End of Period | $50.80 | $51.60 | $46.69 | $35.66 | $31.30 |
| |
| Total Return | 0.42% | 12.56% | 33.49% | 16.42% | 1.09% |
| |
| Ratios/Supplemental Data | | | | | |
| Net Assets, End of Period (Millions) | $57,438 | $96,674 | $65,738 | $39,367 | $29,467 |
| Ratio of Total Expenses to Average Net Assets | 0.04% | 0.04% | 0.04% | 0.04% | 0.04% |
| Ratio of Net Investment Income to | | | | | |
| Average Net Assets | 1.97% | 1.90% | 1.97% | 2.24% | 1.92% |
| Portfolio Turnover Rate1 | 3% | 3% | 4% | 3% | 5% |
1 Excludes the value of portfolio securities received or delivered as a result of in-kind purchases or redemptions of the fund’s capital shares, including ETF Creation Units.
See accompanying Notes, which are an integral part of the Financial Statements.
22
| |
| Total Stock Market Index Fund | |
| |
| |
| Financial Highlights | |
| |
| |
| Institutional Plus Shares | |
| | April 28, 20151 to |
| For a Share Outstanding Throughout the Period | December 31, 2015 |
| Net Asset Value, Beginning of Period | $100.00 |
| Investment Operations | |
| Net Investment Income | 1.335 |
| Net Realized and Unrealized Gain (Loss) on Investments | (4.631) |
| Total from Investment Operations | (3.296) |
| Distributions | |
| Dividends from Net Investment Income | (1.444) |
| Distributions from Realized Capital Gains | — |
| Total Distributions | (1.444) |
| Net Asset Value, End of Period | $95.26 |
| |
| Total Return | -3.28% |
| |
| Ratios/Supplemental Data | |
| Net Assets, End of Period (Millions) | $63,093 |
| Ratio of Total Expenses to Average Net Assets | 0.02%2 |
| Ratio of Net Investment Income to Average Net Assets | 1.99%2 |
| Portfolio Turnover Rate 3 | 3% |
| 1 | Inception. |
| 2 | Annualized. |
| 3 | Excludes the value of portfolio securities received or delivered as a result of in-kind purchases or redemptions of the fund’s capital shares, including ETF Creation Units. |
See accompanying Notes, which are an integral part of the Financial Statements.
23
Total Stock Market Index Fund
Notes to Financial Statements
Vanguard Total Stock Market Index Fund is registered under the Investment Company Act of 1940 as an open-end investment company, or mutual fund. The fund offers five classes of shares: Investor Shares, ETF Shares, Admiral Shares, Institutional Shares, and Institutional Plus Shares. Investor Shares are available to any investor who meets the fund’s minimum purchase requirements. ETF Shares are listed for trading on NYSE Arca; they can be purchased and sold through a broker. Admiral Shares, Institutional Shares, and Institutional Plus Shares are designed for investors who meet certain administrative, service, and account-size criteria. Prior to October 24, 2014, the fund offered Signal Shares. Effective October 24, 2014, the Signal Shares were converted to Admiral Shares.
A. The following significant accounting policies conform to generally accepted accounting principles for U.S. investment companies. The fund consistently follows such policies in preparing its financial statements.
1. Security Valuation: Securities are valued as of the close of trading on the New York Stock Exchange (generally 4 p.m., Eastern time) on the valuation date. Equity securities are valued at the latest quoted sales prices or official closing prices taken from the primary market in which each security trades; such securities not traded on the valuation date are valued at the mean of the latest quoted bid and asked prices. Securities for which market quotations are not readily available, or whose values have been materially affected by events occurring before the fund’s pricing time but after the close of the securities’ primary markets, are valued by methods deemed by the board of trustees to represent fair value. Investments in Vanguard Market Liquidity Fund are valued at that fund’s net asset value. Temporary cash investments acquired over 60 days to maturity are valued using the latest bid prices or using valuations based on a matrix system (which considers such factors as security prices, yields, maturities, and ratings), both as furnished by independent pricing services. Other temporary cash investments are valued at amortized cost, which approximates market value.
2. Futures Contracts: The fund uses index futures contracts to a limited extent, with the objectives of maintaining full exposure to the stock market, enhancing returns, maintaining liquidity, and minimizing transaction costs. The fund may purchase futures contracts to immediately invest incoming cash in the market, or sell futures in response to cash outflows, thereby simulating a fully invested position in the underlying index while maintaining a cash balance for liquidity. The fund may seek to enhance returns by using futures contracts instead of the underlying securities when futures are believed to be priced more attractively than the underlying securities. The primary risks associated with the use of futures contracts are imperfect correlation between changes in market values of stocks held by the fund and the prices of futures contracts, and the possibility of an illiquid market. Counterparty risk involving futures is mitigated because a regulated clearinghouse is the counterparty instead of the clearing broker. To further mitigate counterparty risk, the fund trades futures contracts on an exchange, monitors the financial strength of its clearing brokers and clearinghouse, and has entered into clearing agreements with its clearing brokers. The clearinghouse imposes initial margin requirements to secure the fund’s performance and requires daily settlement of variation margin representing changes in the market value of each contract.
Futures contracts are valued at their quoted daily settlement prices. The aggregate settlement values of the contracts are not recorded in the Statement of Net Assets. Fluctuations in the value of the contracts are recorded in the Statement of Net Assets as an asset (liability) and in the Statement of Operations as unrealized appreciation (depreciation) until the contracts are closed, when they are recorded as realized futures gains (losses).
24
Total Stock Market Index Fund
During the year ended December 31, 2015, the fund’s average investments in long and short futures contracts represented less than 1% and 0% of net assets, respectively, based on the average of aggregate settlement values at each quarter-end during the period.
3. Swap Contracts: The fund has entered into equity swap contracts to earn the total return on selected reference stocks in the fund’s target index. Under the terms of the swaps, the fund receives the total return on the referenced stock (i.e., receiving the increase or paying the decrease in value of the selected reference stock and receiving the equivalent of any dividends in respect of the selected referenced stock) over a specified period of time, applied to a notional amount that represents the value of a designated number of shares of the selected reference stock at the beginning of the equity swap contract. The fund also pays a floating rate that is based on short-term interest rates, applied to the notional amount. At the same time, the fund invests an amount approximating the notional amount of the swap in high-quality temporary cash investments.
The notional amounts of swap contracts are not recorded in the Statement of Net Assets. Swaps are valued daily based on market quotations received from independent pricing services or recognized dealers and the change in value is recorded in the Statement of Net Assets as an asset (liability) and in the Statement of Operations as unrealized appreciation (depreciation) until termination of the swap, at which time realized gain (loss) is recorded. A risk associated with all types of swaps is the possibility that a counterparty may default on its obligation to pay net amounts due to the fund. The fund’s maximum amount subject to counterparty risk is the unrealized appreciation on the swap contract. The fund mitigates its counterparty risk by entering into swaps only with a diverse group of prequalified counterparties, monitoring their financial strength, entering into master netting arrangements with its counterparties, and requiring its counterparties to transfer collateral as security for their performance. In the event of a counterparty’s default (including bankruptcy), the fund may terminate any swap contracts with that counterparty, determine the net amount owed by either party in accordance with its master netting arrangements, and sell or retain any collateral held up to the net amount owed to the fund under the master netting arrangements. The swap contracts contain provisions whereby a counterparty may terminate open contracts if the fund net assets decline below a certain level, triggering a payment by the fund if the fund is in a net liability position at the time of the termination. The payment amount would be reduced by any collateral the fund has pledged. Any securities pledged as collateral for open contracts are noted in the Statement of Net Assets. The value of collateral received or pledged is compared daily to the value of the swap contracts exposure with each counterparty, and any difference, if in excess of a specified minimum transfer amount, is adjusted and settled within two business days.
During the year ended December 31, 2015, the fund’s average amounts of investments in total return swaps represented less than 1% of net assets, based on the average of notional amounts at each quarter-end during the period.
4. Federal Income Taxes: The fund intends to continue to qualify as a regulated investment company and distribute all of its taxable income. Management has analyzed the fund’s tax positions taken for all open federal income tax years (December 31, 2012–2015), and has concluded that no provision for federal income tax is required in the fund’s financial statements.
5. Distributions: Distributions to shareholders are recorded on the ex-dividend date.
6. Securities Lending: To earn additional income, the fund lends its securities to qualified institutional borrowers. Security loans are subject to termination by the fund at any time and are required to be secured at all times by collateral in an amount at least equal to the market value of securities loaned.
25
Total Stock Market Index Fund
Daily market fluctuations could cause the value of loaned securities to be more or less than the value of the collateral received. When this occurs, the collateral is adjusted and settled on the next business day. The fund further mitigates its counterparty risk by entering into securities lending transactions only with a diverse group of prequalified counterparties, monitoring their financial strength, and entering into master securities lending agreements with its counterparties. The master securities lending agreements provide that, in the event of a counterparty’s default (including bankruptcy), the fund may terminate any loans with that borrower, determine the net amount owed, and sell or retain the collateral up to the net amount owed to the fund; however, such actions may be subject to legal proceedings. While collateral mitigates counterparty risk, in the absence of a default the fund may experience delays and costs in recovering the securities loaned. The fund invests cash collateral received in Vanguard Market Liquidity Fund, and records a liability in the Statement of Net Assets for the return of the collateral, during the period the securities are on loan. Securities lending income represents fees charged to borrowers plus income earned on invested cash collateral, less expenses associated with the loan.
7. Credit Facility: The fund and certain other funds managed by The Vanguard Group (“Vanguard”) participate in a $3 billion committed credit facility provided by a syndicate of lenders pursuant to a credit agreement that may be renewed annually; each fund is individually liable for its borrowings, if any, under the credit facility. Borrowings may be utilized for temporary and emergency purposes, and are subject to the fund’s regulatory and contractual borrowing restrictions. The participating funds are charged administrative fees and an annual commitment fee of 0.06% of the undrawn amount of the facility; these fees are allocated to the funds based on a method approved by the fund’s board of trustees and included in Management and Administrative expenses on the fund’s Statement of Operations. Any borrowings under this facility bear interest at a rate equal to the higher of the federal funds rate or LIBOR reference rate plus an agreed-upon spread.
The fund had no borrowings outstanding at December 31, 2015, or at any time during the period then ended.
8. Other: Dividend income is recorded on the ex-dividend date. Interest income includes income distributions received from Vanguard Market Liquidity Fund and is accrued daily. Premiums and discounts on debt securities purchased are amortized and accreted, respectively, to interest income over the lives of the respective securities. Security transactions are accounted for on the date securities are bought or sold. Costs used to determine realized gains (losses) on the sale of investment securities are those of the specific securities sold.
Each class of shares has equal rights as to assets and earnings, except that each class separately bears certain class-specific expenses related to maintenance of shareholder accounts (included in Management and Administrative expenses) and shareholder reporting. Marketing and distribution expenses are allocated to each class of shares based on a method approved by the board of trustees. Income, other non-class-specific expenses, and gains and losses on investments are allocated to each class of shares based on its relative net assets.
B. In accordance with the terms of a Funds’ Service Agreement (the “FSA”) between Vanguard and the fund, Vanguard furnishes to the fund investment advisory, corporate management, administrative, marketing, and distribution services at Vanguard’s cost of operations (as defined by the FSA). These costs of operations are allocated to the fund based on methods and guidelines approved by the board of trustees. Vanguard does not require reimbursement in the current period for certain costs of operations (such as deferred compensation/benefits and risk/insurance costs); the fund’s liability for these costs of operations is included in Payables to Vanguard on the Statement of Net Assets.
26
Total Stock Market Index Fund
Upon the request of Vanguard, the fund may invest up to 0.40% of its net assets as capital in Vanguard. At December 31, 2015, the fund had contributed to Vanguard capital in the amount of $35,094,000, representing 0.01% of the fund’s net assets and 14.04% of Vanguard’s capitalization. The fund’s trustees and officers are also directors and employees, respectively, of Vanguard.
C. Various inputs may be used to determine the value of the fund’s investments. These inputs are summarized in three broad levels for financial statement purposes. The inputs or methodologies used to value securities are not necessarily an indication of the risk associated with investing in those securities.
Level 1—Quoted prices in active markets for identical securities.
Level 2—Other significant observable inputs (including quoted prices for similar securities, interest rates, prepayment speeds, credit risk, etc.).
Level 3—Significant unobservable inputs (including the fund’s own assumptions used to determine the fair value of investments).
The following table summarizes the market value of the fund’s investments as of December 31, 2015, based on the inputs used to value them:
| | | |
| | Level 1 | Level 2 | Level 3 |
| Investments | ($000) | ($000) | ($000) |
| Common Stocks | 398,102,532 | 35 | 2,997 |
| Temporary Cash Investments | 4,729,462 | 155,372 | — |
| Futures Contracts—Assets1 | 5,311 | — | — |
| Futures Contracts—Liabilities1 | (33,683) | — | — |
| Swap Contracts—Assets | — | 388 | — |
| Swap Contracts—Liabilities | — | (1,019) | — |
| Total | 402,803,622 | 154,776 | 2,997 |
| 1 Represents variation margin on the last day of the reporting period. | | | |
D. At December 31, 2015, the aggregate settlement value of open futures contracts and the related unrealized appreciation (depreciation) were:
| | | | |
| | | | | ($000) |
| | | | Aggregate | |
| | | Number of | Settlement | Unrealized |
| | | Long (Short) | Value | Appreciation |
| Futures Contracts | Expiration | Contracts | Long (Short) | (Depreciation) |
| E-mini S&P 500 Index | March 2016 | 22,960 | 2,336,639 | 23,731 |
| E-mini Russell 2000 Index | March 2016 | 957 | 108,285 | 2,087 |
| E-mini S&P MidCap 400 Index | March 2016 | 240 | 33,444 | 407 |
| | | | | 26,225 |
Unrealized appreciation (depreciation) on open futures contracts is required to be treated as realized gain (loss) for tax purposes.
27
Total Stock Market Index Fund
At December 31, 2015, the fund had the following open total return swap contracts:
| | | | | |
| | | | | Floating | Unrealized |
| | | | Notional | Interest Rate | Appreciation |
| | Termination | | Amount | Received | (Depreciation) |
| Reference Entity | Date | Counterparty | ($000) | (Paid) | ($000) |
| Ambac Financial Group Inc. | 1/11/16 | GSBUSA | 3,252 | (0.693%) | (27) |
| Empire State Realty Trust Inc. | 2/17/16 | GSBUSA | 12,190 | (0.695%) | 388 |
| SLM Corp. | 3/21/16 | GSI | 28,910 | (0.802%) | (992) |
| | | | | | (631) |
| GSBUSA—Goldman Sachs Bank USA. | | | | | |
| GSI—Goldman Sachs International. | | | | | |
At December 31, 2015, the counterparty had deposited in segregated accounts securities with a value of $547,000 in connection with amounts due to the fund for open swap contracts.
E. Distributions are determined on a tax basis and may differ from net investment income and realized capital gains for financial reporting purposes. Differences may be permanent or temporary. Permanent differences are reclassified among capital accounts in the financial statements to reflect their tax character. Temporary differences arise when certain items of income, expense, gain, or loss are recognized in different periods for financial statement and tax purposes. These differences will reverse at some time in the future. Differences in classification may also result from the treatment of short-term gains as ordinary income for tax purposes.
Certain of the fund’s investments are in securities considered to be passive foreign investment companies, for which any unrealized appreciation and/or realized gains are required to be included in distributable net income for tax purposes. During the year ended December 31, 2015, the fund realized gains on the sale of passive foreign investment companies of $18,000, which have been included in current and prior periods’ taxable income; accordingly, such gains have been reclassified from accumulated net realized losses to overdistributed net investment income. Passive foreign investment companies held at December 31, 2015, had unrealized appreciation of $8,922,000, all of which has been distributed and is reflected in the balance of overdistributed net investment income.
During the year ended December 31, 2015, the fund realized $11,693,991,000 of net capital gains resulting from in-kind redemptions—in which shareholders exchanged fund shares for securities held by the fund rather than for cash. Because such gains are not taxable to the fund, and are not distributed to shareholders, they have been reclassified from accumulated net realized losses to paid-in capital.
Realized and unrealized gains (losses) on certain of the fund’s swap contracts are treated as ordinary income (loss) for tax purposes. Realized losses of $16,047,000 on swap contracts have been reclassified from accumulated net realized losses to overdistributed net investment income.
For tax purposes, at December 31, 2015, the fund had $118,094,000 of ordinary income available for distribution. The fund used capital loss carryforwards of $917,767,000 to offset taxable capital gains realized during the year ended December 31, 2015. At December 31, 2015, the fund had available capital losses totaling $1,270,736,000 to offset future net capital gains. Of this amount, $1,003,435,000 is subject to expiration on December 31, 2016. Capital losses of $267,301,000 realized beginning in fiscal 2011 may be carried forward indefinitely under the Regulated Investment Company Modernization Act of 2010, but must be used before any expiring loss carryforwards.
28
Total Stock Market Index Fund
At December 31, 2015, the cost of investment securities for tax purposes was $290,340,198,000. Net unrealized appreciation of investment securities for tax purposes was $112,650,200,000, consisting of unrealized gains of $129,321,634,000 on securities that had risen in value since their purchase and $16,671,434,000 in unrealized losses on securities that had fallen in value since their purchase.
F. During the year ended December 31, 2015, the fund purchased $55,913,069,000 of investment securities and sold $32,374,141,000 of investment securities, other than temporary cash investments. Purchases and sales include $16,876,036,000 and $18,635,547,000, respectively, in connection with in-kind purchases and redemptions of the fund’s capital shares.
| | | | |
| G. Capital share transactions for each class of shares were: | | | |
| | | | Year Ended December 31, |
| | | 2015 | | 2014 |
| | Amount | Shares | Amount | Shares |
| | ($000) | (000) | ($000) | (000) |
| Investor Shares | | | | |
| Issued | 9,615,095 | 187,612 | 13,269,562 | 278,821 |
| Issued in Lieu of Cash Distributions | 2,000,863 | 39,195 | 1,951,687 | 39,347 |
| Redeemed | (32,002,680) | (616,831) | (13,747,508) | (281,022) |
| Net Increase (Decrease)—Investor Shares | (20,386,722) | (390,024) | 1,473,741 | 37,146 |
| ETF Shares | | | | |
| Issued | 25,815,534 | 241,287 | 13,809,740 | 137,515 |
| Issued in Lieu of Cash Distributions | — | — | — | — |
| Redeemed | (18,296,939) | (170,900) | (6,577,704) | (65,800) |
| Net Increase (Decrease)—ETF Shares | 7,518,595 | 70,387 | 7,232,036 | 71,715 |
| Admiral Shares | | | | |
| Issued1 | 22,278,360 | 430,686 | 28,300,043 | 579,782 |
| Issued in Lieu of Cash Distributions | 2,101,249 | 41,298 | 1,654,483 | 33,282 |
| Redeemed | (13,518,885) | (260,874) | (9,262,724) | (189,917) |
| Net Increase (Decrease) —Admiral Shares | 10,860,724 | 211,110 | 20,691,802 | 423,147 |
| Signal Shares | | | | |
| Issued | — | — | 1,941,106 | 42,389 |
| Issued in Lieu of Cash Distributions | — | — | 105,979 | 2,263 |
| Redeemed1 | — | — | (13,494,640) | (286,099) |
| Net Increase (Decrease)—Signal Shares | — | — | (11,447,555) | (241,447) |
| Institutional Shares | | | | |
| Issued | 34,182,938 | 666,236 | 27,653,328 | 568,377 |
| Issued in Lieu of Cash Distributions | 1,369,736 | 26,567 | 1,457,656 | 29,311 |
| Redeemed | (76,016,761) | (1,435,499) | (6,495,900) | (132,169) |
| Net Increase (Decrease) —Institutional Shares | (40,464,087) | (742,696) | 22,615,084 | 465,519 |
29
| | | | |
| Total Stock Market Index Fund | | | | |
| |
| |
| |
| |
| | | | Year Ended December 31, |
| | | 2015 | | 2014 |
| | Amount | Shares | Amount | Shares |
| | ($000) | (000) | ($000) | (000) |
| Institutional Plus Shares2 | | | | |
| Issued | 70,375,821 | 710,136 | — | — |
| Issued in Lieu of Cash Distributions | 668,273 | 7,223 | — | — |
| Redeemed | (5,371,679) | (55,060) | — | — |
| Net Increase (Decrease) —Institutional Plus Shares | 65,672,415 | 662,299 | — | — |
1 Admiral Shares Issued and Signal Shares Redeemed include $9,780,011,000 from the conversion of Signal Shares to Admiral Shares during the 2014 fiscal year.
2 Inception was April 28, 2015, for Institutional Plus Shares.
H. Management has determined that no material events or transactions occurred subsequent to December 31, 2015, that would require recognition or disclosure in these financial statements.
30
Report of Independent Registered Public Accounting Firm
To the Board of Trustees of Vanguard Index Funds and the Shareholders of Vanguard Total Stock Market Index Fund: In our opinion, the accompanying statement of net assets—investments summary and the related statements of operations and of changes in net assets and the financial highlights present fairly, in all material respects, the financial position of Vanguard Total Stock Market Index Fund (constituting a separate portfolio of Vanguard Index Funds, hereafter referred to as the “Fund”) at December 31, 2015, the results of its operations for the year then ended, the changes in its net assets for each of the two years in the period then ended, and the financial highlights for each of the periods indicated, in conformity with accounting principles generally accepted in the United States of America. These financial statements and financial highlights (hereafter referred to as “financial statements”) are the responsibility of the Fund’s management. Our responsibility is to express an opinion on these financial statements based on our audits. We conducted our audits of these financial statements in accordance with the standards of the Public Company Accounting Oversight Board (United States). Those standards require that we plan and perform the audit to obtain reasonable assurance about whether the financial statements are free of material misstatement. An audit includes examining, on a test basis, evidence supporting the amounts and disclosures in the financial statements, assessing the accounting principles used and significant estimates made by management, and evaluating the overall financial statement presentation. We believe that our audits, which included confirmation of securities at December 31, 2015 by correspondence with the custodian and brokers, by agreement to the underlying ownership records of the transfer agent and the application of alternative auditing procedures where securities purchased had not been received, provide a reasonable basis for our opinion.
/s/PricewaterhouseCoopers LLP
Philadelphia, Pennsylvania
February 11, 2016
Special 2015 tax information (unaudited) for Vanguard Total Stock Market Index Fund
This information for the fiscal year ended December 31, 2015, is included pursuant to provisions of the Internal Revenue Code.
The fund distributed $7,651,494,000 of qualified dividend income to shareholders during the fiscal year.
For corporate shareholders, 90.5% of investment income (dividend income plus short-term gains, if any) qualifies for the dividends-received deduction.
31
Your Fund’s After-Tax Returns
This table presents returns for your fund both before and after taxes. The after-tax returns are shown in two ways: (1) assuming that an investor owned the fund during the entire period and paid taxes on the fund’s distributions, and (2) assuming that an investor paid taxes on the fund’s distributions and sold all shares at the end of each period.
Calculations are based on the highest individual federal income tax and capital gains tax rates in effect at the times of the distributions and the hypothetical sales. State and local taxes were not considered. After-tax returns reflect any qualified dividend income. (In the example, returns after the sale of fund shares may be higher than those assuming no sale. This occurs when the sale would have produced a capital loss. The calculation assumes that the investor received a tax deduction for the loss.) The table shows returns for Investor Shares only; returns for other share classes will differ. Please note that your actual after-tax returns will depend on your tax situation and may differ from those shown. Also note that if you own the fund in a tax-deferred account, such as an individual retirement account or a 401(k) plan, this information does not apply to you. Such accounts are not subject to current taxes.
Finally, keep in mind that a fund’s performance—whether before or after taxes—does not guarantee future results.
Average Annual Total Returns: Total Stock Market Index Fund Investor Shares
Periods Ended December 31, 2015
| | | |
| | One | Five | Ten |
| | Year | Years | Years |
| Returns Before Taxes | 0.29% | 12.03% | 7.39% |
| Returns After Taxes on Distributions | -0.15 | 11.61 | 7.04 |
| Returns After Taxes on Distributions and Sale of Fund Shares | 0.53 | 9.60 | 5.99 |
32
About Your Fund’s Expenses
As a shareholder of the fund, you incur ongoing costs, which include costs for portfolio management, administrative services, and shareholder reports (like this one), among others. Operating expenses, which are deducted from a fund’s gross income, directly reduce the investment return of the fund.
A fund’s expenses are expressed as a percentage of its average net assets. This figure is known as the expense ratio. The following examples are intended to help you understand the ongoing costs (in dollars) of investing in your fund and to compare these costs with those of other mutual funds. The examples are based on an investment of $1,000 made at the beginning of the period shown and held for the entire period.
The accompanying table illustrates your fund’s costs in two ways:
• Based on actual fund return. This section helps you to estimate the actual expenses that you paid over the period. The ”Ending Account Value“ shown is derived from the fund‘s actual return, and the third column shows the dollar amount that would have been paid by an investor who started with $1,000 in the fund. You may use the information here, together with the amount you invested, to estimate the expenses that you paid over the period.
To do so, simply divide your account value by $1,000 (for example, an $8,600 account value divided by $1,000 = 8.6), then multiply the result by the number given for your fund under the heading ”Expenses Paid During Period.“
• Based on hypothetical 5% yearly return. This section is intended to help you compare your fund‘s costs with those of other mutual funds. It assumes that the fund had a yearly return of 5% before expenses, but that the expense ratio is unchanged. In this case—because the return used is not the fund’s actual return—the results do not apply to your investment. The example is useful in making comparisons because the Securities and Exchange Commission requires all mutual funds to calculate expenses based on a 5% return. You can assess your fund’s costs by comparing this hypothetical example with the hypothetical examples that appear in shareholder reports of other funds.
Note that the expenses shown in the table are meant to highlight and help you compare ongoing costs only and do not reflect transaction costs incurred by the fund for buying and selling securities. Further, the expenses do not include any purchase, redemption, or account service fees described in the fund prospectus. If such fees were applied to your account, your costs would be higher. Your fund does not carry a “sales load.”
The calculations assume no shares were bought or sold during the period. Your actual costs may have been higher or lower, depending on the amount of your investment and the timing of any purchases or redemptions.
You can find more information about the fund’s expenses, including annual expense ratios, in the Financial Statements section of this report. For additional information on operating expenses and other shareholder costs, please refer to your fund’s current prospectus.
33
| | | |
| Six Months Ended December 31, 2015 | | | |
| | Beginning | Ending | Expenses |
| | Account Value | Account Value | Paid During |
| Total Stock Market Index Fund | 6/30/2015 | 12/31/2015 | Period |
| Based on Actual Fund Return | | | |
| Investor Shares | $1,000.00 | $984.80 | $0.85 |
| ETF Shares | 1,000.00 | 985.29 | 0.25 |
| Admiral Shares | 1,000.00 | 985.38 | 0.25 |
| Institutional Shares | 1,000.00 | 985.44 | 0.20 |
| Institutional Plus Shares | 1,000.00 | 985.43 | 0.10 |
| Based on Hypothetical 5% Yearly Return | | | |
| Investor Shares | $1,000.00 | $1,024.35 | $0.87 |
| ETF Shares | 1,000.00 | 1,024.95 | 0.26 |
| Admiral Shares | 1,000.00 | 1,024.95 | 0.26 |
| Institutional Shares | 1,000.00 | 1,025.00 | 0.20 |
| Institutional Plus Shares | 1,000.00 | 1,025.10 | 0.10 |
The calculations are based on expenses incurred in the most recent six-month period. The fund’s annualized six-month expense ratios for that period are 0.17% for Investor Shares, 0.05% for ETF Shares, 0.05% for Admiral Shares, 0.04% for Institutional Shares, and 0.02% for Institutional Plus Shares. The dollar amounts shown as “Expenses Paid” are equal to the annualized expense ratio multiplied by the average account value over the period, multiplied by the number of days in the most recent six-month period, then divided by the number of days in the most recent 12-month period (184/365).
34
Glossary
30-Day SEC Yield. A fund’s 30-day SEC yield is derived using a formula specified by the U.S. Securities and Exchange Commission. Under the formula, data related to the fund’s security holdings in the previous 30 days are used to calculate the fund’s hypothetical net income for that period, which is then annualized and divided by the fund’s estimated average net assets over the calculation period. For the purposes of this calculation, a security’s income is based on its current market yield to maturity (for bonds), its actual income (for asset-backed securities), or its projected dividend yield (for stocks). Because the SEC yield represents hypothetical annualized income, it will differ—at times significantly—from the fund’s actual experience. As a result, the fund’s income distributions may be higher or lower than implied by the SEC yield.
Beta. A measure of the magnitude of a fund’s past share-price fluctuations in relation to the ups and downs of a given market index. The index is assigned a beta of 1.00. Compared with a given index, a fund with a beta of 1.20 typically would have seen its share price rise or fall by 12% when the index rose or fell by 10%. For this report, beta is based on returns over the past 36 months for both the fund and the index. Note that a fund’s beta should be reviewed in conjunction with its R-squared (see definition). The lower the R-squared, the less correlation there is between the fund and the index, and the less reliable beta is as an indicator of volatility.
Dividend Yield. Dividend income earned by stocks, expressed as a percentage of the aggregate market value (or of net asset value, for a fund). The yield is determined by dividing the amount of the annual dividends by the aggregate value (or net asset value) at the end of the period. For a fund, the dividend yield is based solely on stock holdings and does not include any income produced by other investments.
Earnings Growth Rate. The average annual rate of growth in earnings over the past five years for the stocks now in a fund.
Equity Exposure. A measure that reflects a fund’s investments in stocks and stock futures. Any holdings in short-term reserves are excluded.
Expense Ratio. A fund’s total annual operating expenses expressed as a percentage of the fund’s average net assets. The expense ratio includes management and administrative expenses, but does not include the transaction costs of buying and selling portfolio securities.
Foreign Holdings. The percentage of a fund represented by securities or depositary receipts of companies based outside the United States.
Inception Date. The date on which the assets of a fund (or one of its share classes) are first invested in accordance with the fund’s investment objective. For funds with a subscription period, the inception date is the day after that period ends. Investment performance is measured from the inception date.
Median Market Cap. An indicator of the size of companies in which a fund invests; the midpoint of market capitalization (market price x shares outstanding) of a fund’s stocks, weighted by the proportion of the fund’s assets invested in each stock. Stocks representing half of the fund’s assets have market capitalizations above the median, and the rest are below it.
Price/Book Ratio. The share price of a stock divided by its net worth, or book value, per share. For a fund, the weighted average price/book ratio of the stocks it holds.
35
Price/Earnings Ratio. The ratio of a stock’s current price to its per-share earnings over the past year. For a fund, the weighted average P/E of the stocks it holds. P/E is an indicator of market expectations about corporate prospects; the higher the P/E, the greater the expectations for a company’s future growth.
R-Squared. A measure of how much of a fund’s past returns can be explained by the returns from the market in general, as measured by a given index. If a fund’s total returns were precisely synchronized with an index’s returns, its R-squared would be 1.00. If the fund’s returns bore no relationship to the index’s returns, its R-squared would be 0. For this report, R-squared is based on returns over the past 36 months for both the fund and the index.
Return on Equity. The annual average rate of return generated by a company during the past five years for each dollar of shareholder’s equity (net income divided by shareholder’s equity). For a fund, the weighted average return on equity for the companies whose stocks it holds.
Short-Term Reserves. The percentage of a fund invested in highly liquid, short-term securities that can be readily converted to cash.
Turnover Rate. An indication of the fund’s trading activity. Funds with high turnover rates incur higher transaction costs and may be more likely to distribute capital gains (which may be taxable to investors). The turnover rate excludes in-kind transactions, which have minimal impact on costs.
Benchmark Information
Spliced Total Stock Market Index: Dow Jones U.S. Total Stock Market Index (formerly known as the Dow Jones Wilshire 5000 Index) through April 22, 2005; MSCI US Broad Market Index through June 2, 2013; and CRSP US Total Market Index thereafter.
36
This page intentionally left blank.
This page intentionally left blank.
This page intentionally left blank.
The People Who Govern Your Fund
The trustees of your mutual fund are there to see that the fund is operated and managed in your best interests since, as a shareholder, you are a part owner of the fund. Your fund’s trustees also serve on the board of directors of The Vanguard Group, Inc., which is owned by the Vanguard funds and provides services to them on an at-cost basis.
A majority of Vanguard’s board members are independent, meaning that they have no affiliation with Vanguard or the funds they oversee, apart from the sizable personal investments they have made as private individuals. The independent board members have distinguished backgrounds in business, academia, and public service. Each of the trustees and executive officers oversees 194 Vanguard funds.
The following table provides information for each trustee and executive officer of the fund. More information about the trustees is in the Statement of Additional Information, which can be obtained, without charge, by contacting Vanguard at 800-662-7447, or online at vanguard.com.
InterestedTrustee1 F. William McNabb III
Born 1957. Trustee Since July 2009. Chairman of the Board. Principal Occupation(s) During the Past Five Years and Other Experience: Chairman of the Board of The Vanguard Group, Inc., and of each of the investment companies served by The Vanguard Group, since January 2010; Director of The Vanguard Group since 2008; Chief Executive Officer and President of The Vanguard Group, and of each of the investment companies served by The Vanguard Group, since 2008; Director of Vanguard Marketing Corporation; Managing Director of The Vanguard Group (1995–2008).
IndependentTrustees Emerson U. Fullwood
Born 1948. Trustee Since January 2008. Principal Occupation(s) During the Past Five Years and Other Experience: Executive Chief Staff and Marketing Officer for North America and Corporate Vice President (retired 2008) of Xerox Corporation (document management products and services); Executive in Residence and 2009–2010 Distinguished Minett Professor at the Rochester Institute of Technology; Director of SPX Corporation (multi-industry manufacturing), the United Way of Rochester, the University of Rochester Medical Center, Monroe Community College Foundation, and North Carolina A&T University.
Rajiv L. Gupta
Born 1945. Trustee Since December 2001.2 Principal Occupation(s) During the Past Five Years and Other Experience: Chairman and Chief Executive Officer (retired 2009) and President (2006–2008) of Rohm and Haas Co. (chemicals); Director of Tyco International PLC (diversified manufacturing and services), Hewlett-Packard Co. (electronic computer manufacturing), and Delphi Automotive PLC (automotive components); Senior Advisor at New Mountain Capital.
Amy Gutmann
Born 1949. Trustee Since June 2006. Principal Occupation(s) During the Past Five Years and Other Experience: President of the University of Pennsylvania; Christopher H. Browne Distinguished Professor of Political Science, School of Arts and Sciences, and Professor of Communication, Annenberg School for Communication, with secondary faculty appointments in the Department of Philosophy, School of Arts and Sciences, and at the Graduate School of Education, University of Pennsylvania; Trustee of the National Constitution Center; Chair of the Presidential Commission for the Study of Bioethical Issues.
JoAnn Heffernan Heisen
Born 1950. Trustee Since July 1998. Principal Occupation(s) During the Past Five Years and Other Experience: Corporate Vice President and Chief Global Diversity Officer (retired 2008) and Member of the Executive Committee (1997–2008) of Johnson & Johnson (pharmaceuticals/medical devices/consumer products); Director of Skytop Lodge Corporation (hotels) and the Robert Wood Johnson Foundation; Member of the Advisory Board of the Institute for Women’s Leadership at Rutgers University.
F. Joseph Loughrey
Born 1949. Trustee Since October 2009. Principal Occupation(s) During the Past Five Years and Other Experience: President and Chief Operating Officer (retired 2009) of Cummins Inc. (industrial machinery); Chairman of the Board of Hillenbrand, Inc. (specialized consumer services), and of Oxfam America; Director of SKF AB (industrial machinery), Hyster-Yale Materials Handling, Inc. (forklift trucks), the Lumina Foundation for Education, and the V Foundation for Cancer Research; Member of the Advisory Council for the College of Arts and Letters and of the Advisory Board to the Kellogg Institute for International Studies, both at the University of Notre Dame.
Mark Loughridge
Born 1953. Trustee Since March 2012. Principal Occupation(s) During the Past Five Years and Other Experience: Senior Vice President and Chief Financial Officer (retired 2013) at IBM (information technology services); Fiduciary Member of IBM’s Retirement Plan Committee (2004–2013); Director of the Dow Chemical Company; Member of the Council on Chicago Booth.
Scott C. Malpass
Born 1962. Trustee Since March 2012. Principal Occupation(s) During the Past Five Years and Other Experience: Chief Investment Officer and Vice President at the University of Notre Dame; Assistant Professor of Finance at the Mendoza College of Business at Notre Dame; Member of the Notre Dame 403(b) Investment Committee; Board Member of TIFF Advisory Services, Inc., and Catholic Investment Services, Inc. (investment advisors); Member of the Investment Advisory Committee of Major League Baseball.
André F. Perold
Born 1952. Trustee Since December 2004. Principal Occupation(s) During the Past Five Years and Other Experience: George Gund Professor of Finance and Banking, Emeritus at the Harvard Business School (retired 2011); Chief Investment Officer and Managing Partner of HighVista Strategies LLC (private investment firm); Director of Rand Merchant Bank; Overseer of the Museum of Fine Arts Boston.
Peter F. Volanakis
Born 1955. Trustee Since July 2009. Principal Occupation(s) During the Past Five Years and Other Experience: President and Chief Operating Officer (retired 2010) of Corning Incorporated (communications equipment); Trustee of Colby-Sawyer College; Member of the Advisory Board of the Norris Cotton Cancer Center and of the Advisory Board of the Parthenon Group (strategy consulting).
Executive Officers Glenn Booraem
Born 1967. Treasurer Since May 2015. Principal Occupation(s) During the Past Five Years and Other Experience: Principal of The Vanguard Group, Inc.; Treasurer of each of the investment companies served by The Vanguard Group; Controller of each of the investment companies served by The Vanguard Group (2010–2015); Assistant Controller of each of the investment companies served by The Vanguard Group (2001–2010).
Thomas J. Higgins
Born 1957. Chief Financial Officer Since September 2008. Principal Occupation(s) During the Past Five Years and Other Experience: Principal of The Vanguard Group, Inc.; Chief Financial Officer of each of the investment companies served by The Vanguard Group; Treasurer of each of the investment companies served by The Vanguard Group (1998–2008).
Peter Mahoney
Born 1974. Controller Since May 2015. Principal Occupation(s) During the Past Five Years and Other Experience: Head of Global Fund Accounting at The Vanguard Group, Inc.; Controller of each of the investment companies served by The Vanguard Group; Head of International Fund Services at The Vanguard Group (2008–2014).
Heidi Stam
Born 1956. Secretary Since July 2005. Principal Occupation(s) During the Past Five Years and Other Experience: Managing Director of The Vanguard Group, Inc.; General Counsel of The Vanguard Group; Secretary of The Vanguard Group and of each of the investment companies served by The Vanguard Group; Director and Senior Vice President of Vanguard Marketing Corporation.
Vanguard Senior Management Team
Mortimer J. Buckley
Kathleen C. Gubanich
Paul A. Heller
Martha G. King
John T. Marcante
Chris D. McIsaac
James M. Norris
Thomas M. Rampulla
Glenn W. Reed
Karin A. Risi
Chairman Emeritus and Senior Advisor John J. Brennan
Chairman, 1996–2009
Chief Executive Officer and President, 1996–2008
Founder John C. Bogle
Chairman and Chief Executive Officer, 1974–1996
1 Mr. McNabb is considered an “interested person,” as defined in the Investment Company Act of 1940, because he is an officer of the Vanguard funds.
2 December 2002 for Vanguard Equity Income Fund, the Vanguard Municipal Bond Funds, and the Vanguard State Tax-Exempt Funds.
 |
| P.O. Box 2600 |
| Valley Forge, PA 19482-2600 |
Connect with Vanguard® > vanguard.com
| |
| Fund Information > 800-662-7447 | |
| Direct Investor Account Services > 800-662-2739 | |
| Institutional Investor Services > 800-523-1036 | |
| Text Telephone for People | |
| Who Are Deaf or Hard of Hearing> 800-749-7273 | |
| |
| This material may be used in conjunction | |
| with the offering of shares of any Vanguard | |
| fund only if preceded or accompanied by | |
| the fund’s current prospectus. | |
| |
| All comparative mutual fund data are from Lipper, a | |
| Thomson Reuters Company, or Morningstar, Inc., unless | |
| otherwise noted. | |
| |
| You can obtain a free copy of Vanguard’s proxy voting | |
| guidelines by visiting vanguard.com/proxyreporting or by | |
| calling Vanguard at 800-662-2739. The guidelines are | |
| also available from the SEC’s website, sec.gov. In | |
| addition, you may obtain a free report on how your fund | |
| voted the proxies for securities it owned during the 12 | |
| months ended June 30. To get the report, visit either | |
| vanguard.com/proxyreporting or sec.gov. | |
| |
| You can review and copy information about your fund at | |
| the SEC’s Public Reference Room in Washington, D.C. To | |
| find out more about this public service, call the SEC at | |
| 202-551-8090. Information about your fund is also | |
| available on the SEC’s website, and you can receive | |
| copies of this information, for a fee, by sending a | |
| request in either of two ways: via email addressed to | |
| publicinfo@sec.gov or via regular mail addressed to the | |
| Public Reference Section, Securities and Exchange | |
| Commission, Washington, DC 20549-1520. | |
| |
| | © 2016 The Vanguard Group, Inc. |
| | All rights reserved. |
| | Vanguard Marketing Corporation, Distributor. |
| |
| | Q850 022016 |
Item 2: Code of Ethics. The Registrant has adopted a code of ethics that applies to the Registrant’s principal executive officer, principal financial officer, principal accounting officer or controller or persons performing similar functions. The Code of Ethics was amended during the reporting period covered by this report to make certain technical, non-material changes.
Item 3: Audit Committee Financial Expert. The following members of the Audit Committee have been determined by the Registrant’s Board of Trustees to be Audit Committee Financial Experts serving on its Audit Committee, and to be independent: Rajiv L. Gupta, Amy Gutmann, JoAnn Heffernan Heisen, F. Joseph Loughrey, Mark Loughridge, Scott C. Malpass, and André F. Perold.
Item 4: Principal Accountant Fees and Services.
(a) Audit Fees.
Audit Fees of the Registrant
Fiscal Year Ended December 31, 2015: $484,000 Fiscal Year Ended December 31, 2014: $454,000
Aggregate Audit Fees of Registered Investment Companies in the Vanguard Group.
Fiscal Year Ended December 31, 2015: $7,000,200
Fiscal Year Ended December 31, 2014: $6,605,127
Includes fees billed in connection with audits of the Registrant, other registered investment companies in the Vanguard complex, The Vanguard Group, Inc. and Vanguard Marketing Corporation.
(b) Audit-Related Fees.
Fiscal Year Ended December 31, 2015: $2,899,096
Fiscal Year Ended December 31, 2014: $2,176,479
Includes fees billed in connection with assurance and related services provided to the Registrant, other registered investment companies in the Vanguard complex, The Vanguard Group, Inc., and Vanguard Marketing Corporation.
(c) Tax Fees.
Fiscal Year Ended December 31, 2015: $353,389
Fiscal Year Ended December 31, 2014: $316,869
Includes fees billed in connection with tax compliance, planning, and advice services provided to the Registrant, other registered investment companies in the Vanguard complex, The Vanguard Group, Inc., and Vanguard Marketing Corporation.
(d) All Other Fees.
Fiscal Year Ended December 31, 2015: $202,313
Fiscal Year Ended December 31, 2014: $198,163
Includes fees billed for services related to tax reported information provided to the Registrant, other registered investment companies in the Vanguard complex, The Vanguard Group, Inc., and Vanguard Marketing Corporation.
(e) (1) Pre-Approval Policies. The policy of the Registrant’s Audit Committee is to consider and, if appropriate, approve before the principal accountant is engaged for such services, all specific audit and non-audit services provided to: the Registrant, other registered investment companies in the Vanguard complex, The Vanguard Group, Inc., and entities controlled by The Vanguard Group, Inc. that provide ongoing services to the Registrant. In making a determination, the Audit Committee considers whether the services are consistent with maintaining the principal accountant’s independence.
In the event of a contingency situation in which the principal accountant is needed to provide services in between scheduled Audit Committee meetings, the Chairman of the Audit Committee would be called on to consider and, if appropriate, pre-approve audit or permitted non-audit services in an amount sufficient to complete services through the next Audit Committee meeting, and to determine if such services would be consistent with maintaining the accountant’s independence. At the next scheduled Audit Committee meeting, services and fees would be presented to the Audit Committee for formal consideration, and, if appropriate, approval by the entire Audit Committee. The Audit Committee would again consider whether such services and fees are consistent with maintaining the principal accountant’s independence.
The Registrant’s Audit Committee is informed at least annually of all audit and non-audit services provided by the principal accountant to the Vanguard complex, whether such services are provided to: the Registrant, other registered investment companies in the Vanguard complex, The Vanguard Group, Inc., or other entities controlled by The Vanguard Group, Inc. that provide ongoing services to the Registrant.
(2) No percentage of the principal accountant’s fees or services were approved pursuant to the waiver provision of paragraph (c)(7)(i)(C) of Rule 2-01 of Regulation S-X.
(f) For the most recent fiscal year, over 50% of the hours worked under the principal accountant’s engagement were not performed by persons other than full-time, permanent employees of the principal accountant.
(g) Aggregate Non-Audit Fees.
Fiscal Year Ended December 31, 2015: $555,702
Fiscal Year Ended December 31, 2014: $515,032
Includes fees billed for non-audit services provided to the Registrant, other registered investment companies in the Vanguard complex, The Vanguard Group, Inc., and Vanguard Marketing Corporation.
(h) For the most recent fiscal year, the Audit Committee has determined that the provision of all non-audit services was consistent with maintaining the principal accountant’s independence.
Item 5: Audit Committee of Listed Registrants.
The Registrant is a listed issuer as defined in rule 10A-3 under the Securities Exchange Act of 1934 (“Exchange Act”). The Registrant has a separately-designated standing audit committee established in accordance with Section 3(a)(58)(A) of the Exchange Act. The Registrant’s audit committee members are: Emerson U. Fullwood, Rajiv L. Gupta, Amy Gutmann, JoAnn Heffernan Heisen, F. Joseph Loughrey, Mark Loughridge, Scott C. Malpass, André F. Perold, and Peter F. Volanakis.
Item 6: Investments.
| | | |
| Vanguard® Small-Cap Index Fund | | |
| Schedule of Investments | | |
| December 31, 2015 | | |
| |
| | | | Market |
| | | | Value |
| | | Shares | ($000) |
| |
| Common Stocks (99.5%)1 | | |
| Basic Materials (2.8%) | | |
| | RPM International Inc. | 2,657,503 | 117,090 |
| | Steel Dynamics Inc. | 4,594,835 | 82,110 |
| | NewMarket Corp. | 203,564 | 77,503 |
| | Olin Corp. | 3,299,175 | 56,944 |
| | Sensient Technologies Corp. | 904,170 | 56,800 |
| | PolyOne Corp. | 1,717,750 | 54,556 |
| | Compass Minerals International Inc. | 670,810 | 50,492 |
| | Royal Gold Inc. | 1,298,915 | 47,371 |
| | Domtar Corp. | 1,250,932 | 46,222 |
| | Cabot Corp. | 1,120,907 | 45,823 |
| | KapStone Paper and Packaging Corp. | 1,725,394 | 38,977 |
| | Balchem Corp. | 635,308 | 38,627 |
| | HB Fuller Co. | 1,020,033 | 37,201 |
| * | Chemtura Corp. | 1,337,069 | 36,462 |
| ^ | CONSOL Energy Inc. | 4,549,614 | 35,942 |
| | Commercial Metals Co. | 2,332,791 | 31,936 |
| | Minerals Technologies Inc. | 691,583 | 31,716 |
| * | Platform Specialty Products Corp. | 2,334,778 | 29,955 |
| | Carpenter Technology Corp. | 977,700 | 29,595 |
| * | Cambrex Corp. | 626,320 | 29,493 |
| | Kaiser Aluminum Corp. | 336,674 | 28,166 |
| | Worthington Industries Inc. | 895,199 | 26,981 |
| | Innospec Inc. | 462,782 | 25,134 |
| | Allegheny Technologies Inc. | 2,199,135 | 24,740 |
| ^ | United States Steel Corp. | 2,948,843 | 23,532 |
| | Huntsman Corp. | 2,067,002 | 23,502 |
| | Axiall Corp. | 1,421,051 | 21,884 |
| * | Stillwater Mining Co. | 2,427,503 | 20,804 |
| ^ | US Silica Holdings Inc. | 1,075,168 | 20,138 |
| | Stepan Co. | 404,687 | 20,109 |
| | Quaker Chemical Corp. | 254,615 | 19,671 |
| * | Ferro Corp. | 1,753,002 | 19,493 |
| | Chemours Co. | 3,632,675 | 19,471 |
| | Calgon Carbon Corp. | 1,050,768 | 18,126 |
| | A Schulman Inc. | 559,278 | 17,136 |
| | PH Glatfelter Co. | 870,650 | 16,055 |
| * | Clearwater Paper Corp. | 336,181 | 15,306 |
| | Hecla Mining Co. | 7,585,115 | 14,336 |
| | Globe Specialty Metals Inc. | 1,332,112 | 14,320 |
| | Deltic Timber Corp. | 228,426 | 13,447 |
| * | Univar Inc. | 692,279 | 11,776 |
| | Innophos Holdings Inc. | 375,216 | 10,874 |
| * | Kraton Performance Polymers Inc. | 607,413 | 10,089 |
| | Haynes International Inc. | 250,081 | 9,175 |
| * | Resolute Forest Products Inc. | 1,155,920 | 8,750 |
| | Rayonier Advanced Materials Inc. | 860,416 | 8,423 |
| | American Vanguard Corp. | 556,149 | 7,792 |
| *,^ | AK Steel Holding Corp. | 3,396,588 | 7,608 |
| * | Koppers Holdings Inc. | 392,645 | 7,166 |
| | Tredegar Corp. | 523,894 | 7,135 |
| * | Coeur Mining Inc. | 2,745,976 | 6,810 |
| | FutureFuel Corp. | 483,007 | 6,521 |
| | Tronox Ltd. Class A | 1,247,305 | 4,877 |
| * | Century Aluminum Co. | 960,323 | 4,245 |
| *,^ | Cliffs Natural Resources Inc. | 2,613,885 | 4,130 |
| * | Intrepid Potash Inc. | 1,145,312 | 3,379 |
| | Kronos Worldwide Inc. | 467,494 | 2,637 |
| | SunCoke Energy Inc. | 639,364 | 2,219 |
| *,^ | Peabody Energy Corp. | 202,672 | 1,556 |
| * | Fairmount Santrol Holdings Inc. | 643,514 | 1,512 |
| * | LSB Industries Inc. | 193,710 | 1,404 |
1
| | | |
| Vanguard® Small-Cap Index Fund | | |
| Schedule of Investments | | |
| December 31, 2015 | | |
| |
| | | | Market |
| | | | Value |
| | | Shares | ($000) |
| * | Cloud Peak Energy Inc. | 611,368 | 1,272 |
| *,^ | Horsehead Holding Corp. | 578,981 | 1,187 |
| * | NL Industries Inc. | 41,958 | 127 |
| * | Alpha Natural Resources Inc. | 864 | — |
| * | Hycroft Mining Corp. | 193 | — |
| | Rentech Inc. | 1 | — |
| | | | 1,507,830 |
| Consumer Goods (7.4%) | | |
| | Ingredion Inc. | 1,429,053 | 136,960 |
| * | Middleby Corp. | 1,144,917 | 123,502 |
| | Leggett & Platt Inc. | 2,582,474 | 108,515 |
| * | Toll Brothers Inc. | 3,168,367 | 105,507 |
| | Pinnacle Foods Inc. | 2,329,024 | 98,890 |
| * | Visteon Corp. | 816,789 | 93,522 |
| | Gentex Corp. | 5,791,891 | 92,728 |
| | Brunswick Corp. | 1,818,632 | 91,859 |
| | Goodyear Tire & Rubber Co. | 2,696,996 | 88,111 |
| | Carter's Inc. | 986,560 | 87,833 |
| * | Tempur Sealy International Inc. | 1,243,140 | 87,592 |
| * | Hain Celestial Group Inc. | 2,057,268 | 83,093 |
| * | Skechers U.S.A. Inc. Class A | 2,595,796 | 78,419 |
| | Flowers Foods Inc. | 3,607,247 | 77,520 |
| * | Post Holdings Inc. | 1,240,484 | 76,538 |
| *,^ | Herbalife Ltd. | 1,294,283 | 69,399 |
| * | WhiteWave Foods Co. Class A | 1,760,409 | 68,497 |
| | Pool Corp. | 809,222 | 65,369 |
| * | TreeHouse Foods Inc. | 818,604 | 64,228 |
| | CalAtlantic Group Inc. | 1,571,108 | 59,576 |
| | Scotts Miracle-Gro Co. Class A | 922,426 | 59,506 |
| * | Take-Two Interactive Software Inc. | 1,607,336 | 56,000 |
| * | Vista Outdoor Inc. | 1,240,289 | 55,205 |
| * | Helen of Troy Ltd. | 561,897 | 52,959 |
| | Thor Industries Inc. | 938,613 | 52,703 |
| * | Tenneco Inc. | 1,093,298 | 50,193 |
| | Spectrum Brands Holdings Inc. | 470,512 | 47,898 |
| | Tupperware Brands Corp. | 855,842 | 47,628 |
| * | Kate Spade & Co. | 2,541,723 | 45,166 |
| | Lancaster Colony Corp. | 381,231 | 44,017 |
| | Energizer Holdings Inc. | 1,255,018 | 42,746 |
| | Cooper Tire & Rubber Co. | 1,115,659 | 42,228 |
| | Dana Holding Corp. | 3,044,078 | 42,008 |
| ^ | Nu Skin Enterprises Inc. Class A | 1,082,519 | 41,017 |
| * | Zynga Inc. Class A | 15,148,140 | 40,597 |
| | B&G Foods Inc. | 1,154,012 | 40,413 |
| | Vector Group Ltd. | 1,708,635 | 40,307 |
| | Snyder's-Lance Inc. | 1,127,735 | 38,681 |
| * | TRI Pointe Group Inc. | 2,897,297 | 36,709 |
| * | Boston Beer Co. Inc. Class A | 180,590 | 36,463 |
| * | G-III Apparel Group Ltd. | 809,990 | 35,850 |
| | Avon Products Inc. | 8,788,152 | 35,592 |
| | J&J Snack Foods Corp. | 301,631 | 35,191 |
| | Herman Miller Inc. | 1,208,400 | 34,681 |
| * | Darling Ingredients Inc. | 3,278,815 | 34,493 |
| * | Gentherm Inc. | 727,635 | 34,490 |
| * | Steven Madden Ltd. | 1,121,042 | 33,878 |
| | Wolverine World Wide Inc. | 1,945,534 | 32,510 |
| | HNI Corp. | 879,451 | 31,713 |
| | Dean Foods Co. | 1,818,685 | 31,190 |
| *,^ | Fossil Group Inc. | 825,873 | 30,194 |
| * | Dorman Products Inc. | 635,860 | 30,184 |
| ^ | Sanderson Farms Inc. | 383,864 | 29,757 |
| *,^ | GoPro Inc. Class A | 1,615,138 | 29,089 |
| * | Deckers Outdoor Corp. | 611,387 | 28,857 |
| | Drew Industries Inc. | 461,991 | 28,131 |
2
| | | |
| Vanguard® Small-Cap Index Fund | | |
| Schedule of Investments | | |
| December 31, 2015 | | |
| |
| | | | Market |
| | | | Value |
| | | Shares | ($000) |
| | Columbia Sportswear Co. | 567,045 | 27,649 |
| * | American Axle & Manufacturing Holdings Inc. | 1,457,371 | 27,603 |
| | WD-40 Co. | 271,747 | 26,808 |
| ^ | Cal-Maine Foods Inc. | 573,149 | 26,560 |
| | Fresh Del Monte Produce Inc. | 675,996 | 26,283 |
| | Schweitzer-Mauduit International Inc. | 614,416 | 25,799 |
| * | Meritage Homes Corp. | 758,773 | 25,791 |
| | La-Z-Boy Inc. | 1,018,094 | 24,862 |
| | Steelcase Inc. Class A | 1,638,233 | 24,410 |
| | Universal Corp. | 434,254 | 24,353 |
| | Interface Inc. Class A | 1,261,438 | 24,144 |
| *,^ | Wayfair Inc. | 488,928 | 23,283 |
| * | Cooper-Standard Holding Inc. | 296,121 | 22,976 |
| * | Select Comfort Corp. | 1,008,113 | 21,584 |
| | KB Home | 1,741,331 | 21,471 |
| * | Diamond Foods Inc. | 537,786 | 20,732 |
| | MDC Holdings Inc. | 785,488 | 20,053 |
| * | iRobot Corp. | 549,723 | 19,460 |
| * | Tumi Holdings Inc. | 1,159,100 | 19,276 |
| | Oxford Industries Inc. | 299,706 | 19,127 |
| | Knoll Inc. | 930,989 | 17,503 |
| | Andersons Inc. | 533,482 | 16,874 |
| * | Seaboard Corp. | 5,780 | 16,732 |
| * | TiVo Inc. | 1,854,934 | 16,008 |
| | Coca-Cola Bottling Co. Consolidated | 84,823 | 15,481 |
| * | ACCO Brands Corp. | 2,170,075 | 15,473 |
| * | USANA Health Sciences Inc. | 115,809 | 14,795 |
| *,^ | Blue Buffalo Pet Products Inc. | 787,089 | 14,726 |
| * | Crocs Inc. | 1,424,032 | 14,582 |
| | Briggs & Stratton Corp. | 838,879 | 14,513 |
| | Ethan Allen Interiors Inc. | 513,576 | 14,288 |
| * | Boulder Brands Inc. | 1,172,015 | 12,869 |
| ^ | Tootsie Roll Industries Inc. | 381,563 | 12,054 |
| | Phibro Animal Health Corp. Class A | 360,129 | 10,851 |
| * | Taylor Morrison Home Corp. Class A | 663,248 | 10,612 |
| * | National Beverage Corp. | 232,485 | 10,564 |
| * | RealD Inc. | 919,508 | 9,701 |
| * | Blount International Inc. | 968,511 | 9,501 |
| * | Central Garden & Pet Co. Class A | 655,181 | 8,910 |
| * | Modine Manufacturing Co. | 967,394 | 8,755 |
| | National Presto Industries Inc. | 104,264 | 8,639 |
| | Superior Industries International Inc. | 454,245 | 8,367 |
| | Inter Parfums Inc. | 342,816 | 8,166 |
| | Movado Group Inc. | 314,811 | 8,094 |
| * | DTS Inc. | 346,917 | 7,833 |
| *,^ | Iconix Brand Group Inc. | 919,277 | 6,279 |
| * | Vera Bradley Inc. | 395,975 | 6,240 |
| * | Revlon Inc. Class A | 210,371 | 5,857 |
| * | Eastman Kodak Co. | 462,088 | 5,795 |
| | Metaldyne Performance Group Inc. | 261,067 | 4,788 |
| * | Federal-Mogul Holdings Corp. | 679,256 | 4,653 |
| *,^ | Elizabeth Arden Inc. | 419,286 | 4,151 |
| * | Amplify Snack Brands Inc. | 227,001 | 2,615 |
| * | Central Garden & Pet Co. | 165,944 | 2,243 |
| *,^ | Hovnanian Enterprises Inc. Class A | 1,183,093 | 2,141 |
| | Titan International Inc. | 430,347 | 1,695 |
| * | Vince Holding Corp. | 165,275 | 757 |
| | | | 4,011,231 |
| Consumer Services (13.0%) | | |
| * | JetBlue Airways Corp. | 6,292,913 | 142,534 |
| | Cablevision Systems Corp. Class A | 4,223,013 | 134,714 |
| | Domino's Pizza Inc. | 1,091,553 | 121,435 |
| | TEGNA Inc. | 4,428,457 | 113,014 |
| | KAR Auction Services Inc. | 2,747,499 | 101,740 |
3
| | | |
| Vanguard® Small-Cap Index Fund | | |
| Schedule of Investments | | |
| December 31, 2015 | | |
| |
| | | | Market |
| | | | Value |
| | | Shares | ($000) |
| * | ServiceMaster Global Holdings Inc. | 2,570,035 | 100,848 |
| | Service Corp. International | 3,729,111 | 97,031 |
| | Casey's General Stores Inc. | 778,830 | 93,810 |
| | Vail Resorts Inc. | 730,050 | 93,439 |
| * | Panera Bread Co. Class A | 475,406 | 92,600 |
| * | AMC Networks Inc. Class A | 1,216,500 | 90,848 |
| * | Sally Beauty Holdings Inc. | 3,034,298 | 84,627 |
| * | VCA Inc. | 1,530,261 | 84,164 |
| | Six Flags Entertainment Corp. | 1,514,950 | 83,231 |
| *,^ | Copart Inc. | 2,161,961 | 82,176 |
| * | Rite Aid Corp. | 10,452,405 | 81,947 |
| | Dunkin' Brands Group Inc. | 1,851,033 | 78,836 |
| | Dun & Bradstreet Corp. | 722,031 | 75,041 |
| * | Avis Budget Group Inc. | 2,004,288 | 72,736 |
| * | Sprouts Farmers Market Inc. | 2,733,578 | 72,686 |
| | Cinemark Holdings Inc. | 2,086,072 | 69,737 |
| * | Live Nation Entertainment Inc. | 2,830,260 | 69,540 |
| * | Madison Square Garden Co. Class A | 408,891 | 66,159 |
| * | Burlington Stores Inc. | 1,518,607 | 65,148 |
| | Dick's Sporting Goods Inc. | 1,801,122 | 63,670 |
| | Lions Gate Entertainment Corp. | 1,931,582 | 62,564 |
| | Sabre Corp. | 2,214,567 | 61,941 |
| * | Office Depot Inc. | 10,971,282 | 61,878 |
| * | Restoration Hardware Holdings Inc. | 766,382 | 60,889 |
| * | Buffalo Wild Wings Inc. | 380,816 | 60,797 |
| ^ | Cracker Barrel Old Country Store Inc. | 478,697 | 60,713 |
| *,^ | SolarCity Corp. | 1,176,813 | 60,041 |
| ^ | GameStop Corp. Class A | 2,109,216 | 59,142 |
| * | Starz | 1,744,566 | 58,443 |
| * | Houghton Mifflin Harcourt Co. | 2,647,595 | 57,665 |
| | Brinker International Inc. | 1,190,840 | 57,101 |
| * | Spirit Airlines Inc. | 1,430,429 | 57,003 |
| * | Bright Horizons Family Solutions Inc. | 847,357 | 56,603 |
| | CST Brands Inc. | 1,436,306 | 56,217 |
| | Jack in the Box Inc. | 715,691 | 54,901 |
| * | Pandora Media Inc. | 4,073,615 | 54,627 |
| | American Eagle Outfitters Inc. | 3,501,010 | 54,266 |
| | Tribune Media Co. Class A | 1,598,930 | 54,060 |
| * | Murphy USA Inc. | 888,391 | 53,961 |
| | GNC Holdings Inc. Class A | 1,645,402 | 51,040 |
| | Rollins Inc. | 1,957,969 | 50,711 |
| * | Beacon Roofing Supply Inc. | 1,177,796 | 48,502 |
| | Chemed Corp. | 319,097 | 47,801 |
| | Lithia Motors Inc. Class A | 448,037 | 47,792 |
| ^ | Wendy's Co. | 4,356,042 | 46,915 |
| | AMERCO | 117,082 | 45,603 |
| * | Cabela's Inc. | 965,877 | 45,135 |
| | Allegiant Travel Co. Class A | 268,099 | 44,995 |
| | Texas Roadhouse Inc. Class A | 1,256,521 | 44,946 |
| | Graham Holdings Co. Class B | 92,208 | 44,718 |
| | Sinclair Broadcast Group Inc. Class A | 1,369,349 | 44,559 |
| | John Wiley & Sons Inc. Class A | 976,731 | 43,982 |
| * | Urban Outfitters Inc. | 1,822,651 | 41,465 |
| | Cheesecake Factory Inc. | 891,974 | 41,129 |
| | Cable One Inc. | 93,228 | 40,429 |
| | Bloomin' Brands Inc. | 2,384,629 | 40,276 |
| | Monro Muffler Brake Inc. | 604,595 | 40,036 |
| | Churchill Downs Inc. | 279,779 | 39,586 |
| *,^ | JC Penney Co. Inc. | 5,775,550 | 38,465 |
| * | Yelp Inc. Class A | 1,327,940 | 38,245 |
| | Big Lots Inc. | 986,827 | 38,032 |
| | Gannett Co. Inc. | 2,322,908 | 37,840 |
| * | United Natural Foods Inc. | 960,277 | 37,797 |
| * | Grand Canyon Education Inc. | 938,292 | 37,644 |
4
| | | |
| Vanguard® Small-Cap Index Fund | | |
| Schedule of Investments | | |
| December 31, 2015 | | |
| |
| | | | Market |
| | | | Value |
| | | Shares | ($000) |
| * | DreamWorks Animation SKG Inc. Class A | 1,416,341 | 36,499 |
| * | Pinnacle Entertainment Inc. | 1,164,395 | 36,236 |
| * | SUPERVALU Inc. | 5,338,551 | 36,195 |
| | Abercrombie & Fitch Co. | 1,336,860 | 36,095 |
| | Core-Mark Holding Co. Inc. | 437,868 | 35,879 |
| | DSW Inc. Class A | 1,470,211 | 35,079 |
| | New York Times Co. Class A | 2,565,174 | 34,425 |
| * | Ascena Retail Group Inc. | 3,494,294 | 34,419 |
| * | WebMD Health Corp. | 708,702 | 34,230 |
| | Penske Automotive Group Inc. | 806,741 | 34,157 |
| | Nexstar Broadcasting Group Inc. Class A | 579,091 | 33,993 |
| | Hillenbrand Inc. | 1,141,531 | 33,824 |
| * | Five Below Inc. | 1,044,273 | 33,521 |
| | Dolby Laboratories Inc. Class A | 995,614 | 33,502 |
| | Matthews International Corp. Class A | 621,787 | 33,235 |
| | Meredith Corp. | 760,108 | 32,875 |
| | PriceSmart Inc. | 395,854 | 32,852 |
| | Aaron's Inc. | 1,461,488 | 32,723 |
| | Papa John's International Inc. | 582,494 | 32,544 |
| * | Michaels Cos. Inc. | 1,469,041 | 32,481 |
| | Group 1 Automotive Inc. | 424,460 | 32,132 |
| | HSN Inc. | 626,723 | 31,756 |
| | Choice Hotels International Inc. | 620,179 | 31,263 |
| * | Acxiom Corp. | 1,494,212 | 31,259 |
| | Time Inc. | 1,993,201 | 31,233 |
| * | Boyd Gaming Corp. | 1,567,237 | 31,141 |
| | Sotheby's | 1,197,448 | 30,846 |
| * | Asbury Automotive Group Inc. | 454,761 | 30,669 |
| | Sonic Corp. | 941,436 | 30,418 |
| ^ | Regal Entertainment Group Class A | 1,607,509 | 30,334 |
| | DeVry Education Group Inc. | 1,151,009 | 29,132 |
| * | Media General Inc. | 1,798,379 | 29,044 |
| *,^ | GrubHub Inc. | 1,195,315 | 28,927 |
| | Morningstar Inc. | 356,286 | 28,649 |
| | DineEquity Inc. | 333,826 | 28,265 |
| | Chico's FAS Inc. | 2,636,309 | 28,129 |
| * | Shutterfly Inc. | 629,511 | 28,051 |
| * | Express Inc. | 1,622,800 | 28,042 |
| * | Dave & Buster's Entertainment Inc. | 662,557 | 27,655 |
| * | comScore Inc. | 670,159 | 27,577 |
| | Dillard's Inc. Class A | 415,310 | 27,290 |
| | SeaWorld Entertainment Inc. | 1,364,409 | 26,865 |
| * | Diplomat Pharmacy Inc. | 768,304 | 26,291 |
| *,^ | Groupon Inc. Class A | 8,528,194 | 26,182 |
| * | Popeyes Louisiana Kitchen Inc. | 447,366 | 26,171 |
| * | Genesco Inc. | 449,781 | 25,561 |
| * | La Quinta Holdings Inc. | 1,806,337 | 24,584 |
| * | MSG Networks Inc. | 1,156,476 | 24,055 |
| * | Penn National Gaming Inc. | 1,455,112 | 23,311 |
| | Extended Stay America Inc. | 1,443,995 | 22,960 |
| | Marriott Vacations Worldwide Corp. | 401,849 | 22,885 |
| | Guess? Inc. | 1,209,642 | 22,838 |
| | ClubCorp Holdings Inc. | 1,240,128 | 22,657 |
| | Caleres Inc. | 838,011 | 22,475 |
| | Children's Place Inc. | 404,329 | 22,319 |
| | EW Scripps Co. Class A | 1,166,797 | 22,169 |
| *,^ | Diamond Resorts International Inc. | 856,197 | 21,842 |
| * | Fresh Market Inc. | 878,770 | 20,581 |
| * | Vitamin Shoppe Inc. | 592,433 | 19,373 |
| * | Pep Boys-Manny Moe & Jack | 1,028,608 | 18,937 |
| * | Constant Contact Inc. | 645,976 | 18,888 |
| * | Krispy Kreme Doughnuts Inc. | 1,252,352 | 18,873 |
| | Scholastic Corp. | 485,819 | 18,733 |
| | Cato Corp. Class A | 501,817 | 18,477 |
5
| | | |
| Vanguard® Small-Cap Index Fund | | |
| Schedule of Investments | | |
| December 31, 2015 | | |
| |
| | | | Market |
| | | | Value |
| | | Shares | ($000) |
| | National CineMedia Inc. | 1,171,972 | 18,412 |
| | SkyWest Inc. | 964,912 | 18,353 |
| * | Fiesta Restaurant Group Inc. | 539,166 | 18,116 |
| | International Speedway Corp. Class A | 536,303 | 18,084 |
| ^ | Buckle Inc. | 585,220 | 18,013 |
| * | Hawaiian Holdings Inc. | 501,009 | 17,701 |
| * | BJ's Restaurants Inc. | 401,248 | 17,442 |
| *,^ | Mattress Firm Holding Corp. | 388,510 | 17,339 |
| * | Belmond Ltd. Class A | 1,753,969 | 16,663 |
| | New Media Investment Group Inc. | 853,107 | 16,601 |
| | Finish Line Inc. Class A | 900,494 | 16,281 |
| * | Stamps.com Inc. | 148,048 | 16,228 |
| | Bob Evans Farms Inc. | 400,202 | 15,548 |
| | Rent-A-Center Inc. | 1,012,308 | 15,154 |
| * | Caesars Acquisition Co. Class A | 2,192,600 | 14,932 |
| * | Francesca's Holdings Corp. | 849,696 | 14,793 |
| * | Bankrate Inc. | 1,088,148 | 14,472 |
| * | Hibbett Sports Inc. | 474,224 | 14,341 |
| | Men's Wearhouse Inc. | 970,369 | 14,245 |
| | Sonic Automotive Inc. Class A | 622,378 | 14,165 |
| * | Apollo Education Group Inc. | 1,825,682 | 14,003 |
| * | Rush Enterprises Inc. Class A | 622,179 | 13,620 |
| *,^ | Weight Watchers International Inc. | 574,785 | 13,105 |
| * | Conn's Inc. | 545,005 | 12,791 |
| * | Strayer Education Inc. | 210,295 | 12,643 |
| | Interval Leisure Group Inc. | 807,825 | 12,610 |
| *,^ | Virgin America Inc. | 348,434 | 12,547 |
| | Fred's Inc. Class A | 708,976 | 11,606 |
| ^ | World Wrestling Entertainment Inc. Class A | 606,023 | 10,811 |
| * | Smart & Final Stores Inc. | 592,579 | 10,791 |
| | Capella Education Co. | 230,127 | 10,636 |
| | AMC Entertainment Holdings Inc. | 432,771 | 10,387 |
| *,^ | TrueCar Inc. | 1,074,257 | 10,248 |
| * | Regis Corp. | 717,482 | 10,152 |
| * | Tile Shop Holdings Inc. | 613,683 | 10,064 |
| | Barnes & Noble Inc. | 1,138,785 | 9,919 |
| * | FTD Cos. Inc. | 373,717 | 9,780 |
| *,^ | Etsy Inc. | 1,169,074 | 9,657 |
| | Weis Markets Inc. | 216,173 | 9,576 |
| * | Performance Food Group Co. | 406,735 | 9,412 |
| *,^ | Scientific Games Corp. Class A | 1,036,337 | 9,296 |
| * | Global Eagle Entertainment Inc. | 929,522 | 9,174 |
| *,^ | Caesars Entertainment Corp. | 1,162,393 | 9,171 |
| *,^ | Quotient Technology Inc. | 1,334,455 | 9,101 |
| *,^ | Lumber Liquidators Holdings Inc. | 515,731 | 8,953 |
| *,^ | Sears Holdings Corp. | 424,998 | 8,738 |
| | Pier 1 Imports Inc. | 1,684,145 | 8,572 |
| * | RetailMeNot Inc. | 834,166 | 8,275 |
| * | Angie's List Inc. | 881,981 | 8,247 |
| * | Blue Nile Inc. | 218,932 | 8,129 |
| * | Party City Holdco Inc. | 593,068 | 7,657 |
| *,^ | Lands' End Inc. | 318,465 | 7,465 |
| * | Barnes & Noble Education Inc. | 725,558 | 7,219 |
| * | Biglari Holdings Inc. | 20,682 | 6,739 |
| * | Ruby Tuesday Inc. | 1,179,192 | 6,497 |
| * | Potbelly Corp. | 482,074 | 5,645 |
| * | Zumiez Inc. | 371,871 | 5,623 |
| * | American Public Education Inc. | 298,672 | 5,558 |
| * | K12 Inc. | 613,819 | 5,402 |
| *,^ | El Pollo Loco Holdings Inc. | 422,920 | 5,342 |
| *,^ | Habit Restaurants Inc. Class A | 228,643 | 5,273 |
| | Speedway Motorsports Inc. | 249,029 | 5,160 |
| *,^ | Clean Energy Fuels Corp. | 1,361,808 | 4,903 |
| *,^ | Planet Fitness Inc. Class A | 282,238 | 4,411 |
6
| | | |
| Vanguard® Small-Cap Index Fund | | |
| Schedule of Investments | | |
| December 31, 2015 | | |
| |
| | | | Market |
| | | | Value |
| | | Shares | ($000) |
| * | Clear Channel Outdoor Holdings Inc. Class A | 696,620 | 3,894 |
| *,^ | Shake Shack Inc. Class A | 91,174 | 3,611 |
| *,^ | Wingstop Inc. | 143,444 | 3,272 |
| * | Rush Enterprises Inc. Class B | 146,991 | 3,219 |
| * | Ollie's Bargain Outlet Holdings Inc. | 176,551 | 3,003 |
| * | Bridgepoint Education Inc. | 368,739 | 2,806 |
| ^ | Stage Stores Inc. | 303,842 | 2,768 |
| *,^ | Container Store Group Inc. | 336,996 | 2,763 |
| *,^ | Noodles & Co. Class A | 250,953 | 2,432 |
| *,^ | Bojangles' Inc. | 143,936 | 2,284 |
| * | Ascent Capital Group Inc. Class A | 116,595 | 1,949 |
| * | J Alexander's Holdings Inc. | 76,193 | 832 |
| * | Liquidity Services Inc. | 32,112 | 209 |
| | Expedia Inc. | 18 | 2 |
| | | | 6,990,604 |
| Financials (26.5%) | | |
| * | Signature Bank | 954,765 | 146,432 |
| | Duke Realty Corp. | 6,896,207 | 144,958 |
| | Arthur J Gallagher & Co. | 3,528,332 | 144,450 |
| | Mid-America Apartment Communities Inc. | 1,505,674 | 136,730 |
| | Omega Healthcare Investors Inc. | 3,735,693 | 130,675 |
| | Regency Centers Corp. | 1,880,780 | 128,119 |
| | Apartment Investment & Management Co. | 3,124,434 | 125,071 |
| * | SVB Financial Group | 1,028,506 | 122,289 |
| * | Liberty Ventures Class A | 2,692,106 | 121,441 |
| | East West Bancorp Inc. | 2,874,261 | 119,454 |
| | Kilroy Realty Corp. | 1,841,999 | 116,562 |
| | WP Carey Inc. | 1,876,859 | 110,735 |
| | National Retail Properties Inc. | 2,722,518 | 109,037 |
| | CBOE Holdings Inc. | 1,647,074 | 106,895 |
| * | Forest City Enterprises Inc. Class A | 4,811,974 | 105,527 |
| | DDR Corp. | 6,148,087 | 103,534 |
| | Equity LifeStyle Properties Inc. | 1,515,805 | 101,059 |
| | American Financial Group Inc. | 1,395,753 | 100,606 |
| | CubeSmart | 3,273,384 | 100,231 |
| | RenaissanceRe Holdings Ltd. | 875,996 | 99,154 |
| | PacWest Bancorp | 2,280,372 | 98,284 |
| | Lamar Advertising Co. Class A | 1,637,632 | 98,225 |
| | StanCorp Financial Group Inc. | 845,879 | 96,329 |
| | BioMed Realty Trust Inc. | 4,065,194 | 96,304 |
| | American Campus Communities Inc. | 2,243,657 | 92,753 |
| | Starwood Property Trust Inc. | 4,509,876 | 92,723 |
| | Liberty Property Trust | 2,951,756 | 91,652 |
| | Taubman Centers Inc. | 1,143,064 | 87,696 |
| | Old Republic International Corp. | 4,699,809 | 87,557 |
| | Douglas Emmett Inc. | 2,785,145 | 86,841 |
| | Spirit Realty Capital Inc. | 8,375,415 | 83,922 |
| | Highwoods Properties Inc. | 1,906,016 | 83,102 |
| | Investors Bancorp Inc. | 6,558,333 | 81,586 |
| | Endurance Specialty Holdings Ltd. | 1,262,996 | 80,819 |
| | Synovus Financial Corp. | 2,479,091 | 80,273 |
| * | Howard Hughes Corp. | 703,401 | 79,597 |
| | Hospitality Properties Trust | 3,023,519 | 79,065 |
| | MarketAxess Holdings Inc. | 707,911 | 78,996 |
| | Bank of the Ozarks Inc. | 1,586,690 | 78,478 |
| | First American Financial Corp. | 2,172,846 | 78,005 |
| | Sovran Self Storage Inc. | 723,645 | 77,654 |
| | Weingarten Realty Investors | 2,228,906 | 77,076 |
| | First Niagara Financial Group Inc. | 7,088,997 | 76,916 |
| | Assured Guaranty Ltd. | 2,823,782 | 74,633 |
| | Brown & Brown Inc. | 2,253,368 | 72,333 |
| | Validus Holdings Ltd. | 1,555,145 | 71,988 |
| | Eaton Vance Corp. | 2,206,053 | 71,542 |
| | CNO Financial Group Inc. | 3,715,723 | 70,933 |
7
| | | |
| Vanguard® Small-Cap Index Fund | | |
| Schedule of Investments | | |
| December 31, 2015 | | |
| |
| | | | Market |
| | | | Value |
| | | Shares | ($000) |
| | BankUnited Inc. | 1,965,092 | 70,861 |
| * | Alleghany Corp. | 147,804 | 70,640 |
| | Senior Housing Properties Trust | 4,748,033 | 70,461 |
| | Commerce Bancshares Inc. | 1,655,385 | 70,420 |
| | Hanover Insurance Group Inc. | 864,685 | 70,333 |
| | Retail Properties of America Inc. | 4,743,954 | 70,068 |
| * | Equity Commonwealth | 2,526,264 | 70,053 |
| | Umpqua Holdings Corp. | 4,400,182 | 69,963 |
| | EPR Properties | 1,194,003 | 69,789 |
| * | Liberty Broadband Corp. | 1,334,527 | 69,209 |
| | Healthcare Trust of America Inc. Class A | 2,540,069 | 68,506 |
| | Webster Financial Corp. | 1,833,038 | 68,171 |
| | First Horizon National Corp. | 4,683,426 | 68,003 |
| | Sun Communities Inc. | 992,195 | 67,995 |
| | Cullen/Frost Bankers Inc. | 1,121,453 | 67,287 |
| ^ | Apple Hospitality REIT Inc. | 3,311,953 | 66,140 |
| * | Western Alliance Bancorp | 1,841,072 | 66,021 |
| | DCT Industrial Trust Inc. | 1,765,982 | 65,995 |
| | Gramercy Property Trust | 8,434,301 | 65,113 |
| | NorthStar Realty Finance Corp. | 3,778,198 | 64,343 |
| | Allied World Assurance Co. Holdings AG | 1,726,890 | 64,223 |
| | Post Properties Inc. | 1,082,210 | 64,024 |
| | Prosperity Bancshares Inc. | 1,330,249 | 63,666 |
| | Tanger Factory Outlet Centers Inc. | 1,916,418 | 62,667 |
| | Corrections Corp. of America | 2,343,821 | 62,088 |
| | FirstMerit Corp. | 3,314,325 | 61,812 |
| | White Mountains Insurance Group Ltd. | 84,975 | 61,761 |
| | PrivateBancorp Inc. | 1,501,538 | 61,593 |
| | Paramount Group Inc. | 3,392,848 | 61,411 |
| | Outfront Media Inc. | 2,750,722 | 60,048 |
| * | MGIC Investment Corp. | 6,791,164 | 59,966 |
| | Two Harbors Investment Corp. | 7,278,925 | 58,959 |
| | Aspen Insurance Holdings Ltd. | 1,215,351 | 58,701 |
| | Popular Inc. | 2,071,136 | 58,696 |
| | American Homes 4 Rent Class A | 3,512,051 | 58,511 |
| | Columbia Property Trust Inc. | 2,486,590 | 58,385 |
| | Healthcare Realty Trust Inc. | 2,012,226 | 56,986 |
| | LaSalle Hotel Properties | 2,257,998 | 56,811 |
| | Associated Banc-Corp | 3,005,743 | 56,358 |
| | New Residential Investment Corp. | 4,607,800 | 56,031 |
| * | Stifel Financial Corp. | 1,320,316 | 55,929 |
| *,^ | Zillow Group Inc. | 2,371,828 | 55,691 |
| | Radian Group Inc. | 4,136,233 | 55,384 |
| | Rayonier Inc. | 2,474,324 | 54,930 |
| | Medical Properties Trust Inc. | 4,755,336 | 54,734 |
| | Piedmont Office Realty Trust Inc. Class A | 2,896,736 | 54,690 |
| | Bank of Hawaii Corp. | 865,646 | 54,449 |
| | AmTrust Financial Services Inc. | 878,949 | 54,126 |
| | Federated Investors Inc. Class B | 1,873,304 | 53,670 |
| | Interactive Brokers Group Inc. | 1,210,526 | 52,779 |
| | Assurant Inc. | 655,269 | 52,775 |
| | Sunstone Hotel Investors Inc. | 4,170,587 | 52,091 |
| | Gaming and Leisure Properties Inc. | 1,850,509 | 51,444 |
| | RLJ Lodging Trust | 2,377,762 | 51,431 |
| | ProAssurance Corp. | 1,057,809 | 51,335 |
| | Chimera Investment Corp. | 3,763,582 | 51,335 |
| | Care Capital Properties Inc. | 1,679,161 | 51,332 |
| | RLI Corp. | 820,248 | 50,650 |
| | First Industrial Realty Trust Inc. | 2,204,216 | 48,779 |
| | MFA Financial Inc. | 7,373,524 | 48,665 |
| | United Bankshares Inc. | 1,315,541 | 48,662 |
| * | Blackhawk Network Holdings Inc. | 1,087,568 | 48,081 |
| | Home BancShares Inc. | 1,186,099 | 48,061 |
| | Cathay General Bancorp | 1,531,785 | 47,991 |
8
| | | |
| Vanguard® Small-Cap Index Fund | | |
| Schedule of Investments | | |
| December 31, 2015 | | |
| |
| | | | Market |
| | | | Value |
| | | Shares | ($000) |
| | Symetra Financial Corp. | 1,502,471 | 47,734 |
| | Brandywine Realty Trust | 3,487,673 | 47,642 |
| | Erie Indemnity Co. Class A | 497,554 | 47,586 |
| | Blackstone Mortgage Trust Inc. Class A | 1,762,642 | 47,168 |
| | CyrusOne Inc. | 1,252,659 | 46,912 |
| | Wintrust Financial Corp. | 962,681 | 46,709 |
| | FNB Corp. | 3,484,436 | 46,482 |
| | Urban Edge Properties | 1,976,367 | 46,346 |
| | Acadia Realty Trust | 1,389,094 | 46,048 |
| | Primerica Inc. | 962,660 | 45,466 |
| | MB Financial Inc. | 1,393,532 | 45,109 |
| * | Texas Capital Bancshares Inc. | 912,507 | 45,096 |
| | IBERIABANK Corp. | 818,738 | 45,088 |
| | Fulton Financial Corp. | 3,464,108 | 45,068 |
| | Waddell & Reed Financial Inc. Class A | 1,569,312 | 44,976 |
| | Ryman Hospitality Properties Inc. | 867,649 | 44,805 |
| | Communications Sales & Leasing Inc. | 2,397,251 | 44,805 |
| | Washington Federal Inc. | 1,870,697 | 44,579 |
| * | OneMain Holdings Inc. Class A | 1,070,715 | 44,478 |
| | NorthStar Asset Management Group Inc. | 3,662,823 | 44,467 |
| | Kennedy-Wilson Holdings Inc. | 1,822,268 | 43,880 |
| | TCF Financial Corp. | 3,073,301 | 43,395 |
| | Valley National Bancorp | 4,404,428 | 43,384 |
| | Kite Realty Group Trust | 1,658,528 | 43,006 |
| | GEO Group Inc. | 1,485,965 | 42,959 |
| | National Health Investors Inc. | 701,626 | 42,708 |
| | Hudson Pacific Properties Inc. | 1,514,804 | 42,627 |
| | Equity One Inc. | 1,546,497 | 41,987 |
| | CBL & Associates Properties Inc. | 3,393,629 | 41,979 |
| | Education Realty Trust Inc. | 1,102,012 | 41,744 |
| | Janus Capital Group Inc. | 2,941,913 | 41,452 |
| | DuPont Fabros Technology Inc. | 1,301,914 | 41,388 |
| * | Liberty TripAdvisor Holdings Inc. Class A | 1,359,354 | 41,243 |
| | Colony Capital Inc. Class A | 2,111,720 | 41,136 |
| | Corporate Office Properties Trust | 1,881,637 | 41,076 |
| | BancorpSouth Inc. | 1,683,952 | 40,398 |
| | Cousins Properties Inc. | 4,272,321 | 40,288 |
| | Pebblebrook Hotel Trust | 1,430,334 | 40,078 |
| | Sterling Bancorp | 2,464,393 | 39,972 |
| | Pinnacle Financial Partners Inc. | 772,106 | 39,655 |
| | WP Glimcher Inc. | 3,688,366 | 39,134 |
| | UMB Financial Corp. | 834,026 | 38,824 |
| | Hancock Holding Co. | 1,540,591 | 38,777 |
| | DiamondRock Hospitality Co. | 3,995,681 | 38,558 |
| | Glacier Bancorp Inc. | 1,448,007 | 38,416 |
| | Evercore Partners Inc. Class A | 708,138 | 38,289 |
| | Mack-Cali Realty Corp. | 1,619,264 | 37,810 |
| | First Financial Bankshares Inc. | 1,247,468 | 37,636 |
| * | Genworth Financial Inc. Class A | 10,038,186 | 37,442 |
| | Columbia Banking System Inc. | 1,149,073 | 37,356 |
| | First Citizens BancShares Inc. Class A | 144,287 | 37,251 |
| | Washington REIT | 1,375,412 | 37,219 |
| | New York REIT Inc. | 3,234,964 | 37,202 |
| | WisdomTree Investments Inc. | 2,367,826 | 37,128 |
| | American Equity Investment Life Holding Co. | 1,542,396 | 37,064 |
| | Selective Insurance Group Inc. | 1,095,438 | 36,785 |
| | BGC Partners Inc. Class A | 3,695,890 | 36,257 |
| | Retail Opportunity Investments Corp. | 1,990,382 | 35,628 |
| *,^ | Credit Acceptance Corp. | 166,195 | 35,569 |
| | QTS Realty Trust Inc. Class A | 782,720 | 35,308 |
| | National Penn Bancshares Inc. | 2,825,473 | 34,838 |
| | Financial Engines Inc. | 1,025,066 | 34,514 |
| | EastGroup Properties Inc. | 618,328 | 34,385 |
| ^ | LPL Financial Holdings Inc. | 803,574 | 34,272 |
9
| | | |
| Vanguard® Small-Cap Index Fund | | |
| Schedule of Investments | | |
| December 31, 2015 | | |
| |
| | | | Market |
| | | | Value |
| | | Shares | ($000) |
| | Xenia Hotels & Resorts Inc. | 2,222,392 | 34,069 |
| | South State Corp. | 463,452 | 33,345 |
| | PS Business Parks Inc. | 380,902 | 33,302 |
| * | PRA Group Inc. | 959,521 | 33,286 |
| | Community Bank System Inc. | 832,406 | 33,246 |
| | CVB Financial Corp. | 1,931,550 | 32,682 |
| | Alexander & Baldwin Inc. | 924,060 | 32,629 |
| | Monogram Residential Trust Inc. | 3,315,600 | 32,360 |
| | Great Western Bancorp Inc. | 1,114,382 | 32,339 |
| | EverBank Financial Corp. | 2,009,193 | 32,107 |
| | Argo Group International Holdings Ltd. | 535,295 | 32,032 |
| * | Enstar Group Ltd. | 209,161 | 31,383 |
| | LTC Properties Inc. | 717,991 | 30,974 |
| | Old National Bancorp | 2,279,531 | 30,910 |
| | Capitol Federal Financial Inc. | 2,456,684 | 30,856 |
| | Chesapeake Lodging Trust | 1,203,849 | 30,289 |
| * | Hilltop Holdings Inc. | 1,574,806 | 30,268 |
| | Lexington Realty Trust | 3,747,266 | 29,978 |
| | Trustmark Corp. | 1,295,148 | 29,840 |
| | STORE Capital Corp. | 1,275,309 | 29,587 |
| | American Assets Trust Inc. | 770,194 | 29,537 |
| | Invesco Mortgage Capital Inc. | 2,377,948 | 29,463 |
| | International Bancshares Corp. | 1,140,144 | 29,302 |
| | Astoria Financial Corp. | 1,830,504 | 29,013 |
| | Pennsylvania REIT | 1,326,132 | 29,003 |
| | First Midwest Bancorp Inc. | 1,573,363 | 28,997 |
| | Kemper Corp. | 765,129 | 28,501 |
| | Artisan Partners Asset Management Inc. Class A | 752,896 | 27,149 |
| ^ | Global Net Lease Inc. | 3,410,461 | 27,113 |
| | Empire State Realty Trust Inc. | 1,497,292 | 27,056 |
| | Horace Mann Educators Corp. | 810,179 | 26,882 |
| | Sabra Health Care REIT Inc. | 1,313,378 | 26,570 |
| | Ramco-Gershenson Properties Trust | 1,596,396 | 26,516 |
| * | HRG Group Inc. | 1,950,919 | 26,454 |
| | Parkway Properties Inc. | 1,684,046 | 26,322 |
| | Chemical Financial Corp. | 767,447 | 26,300 |
| | Mercury General Corp. | 556,513 | 25,917 |
| | BBCN Bancorp Inc. | 1,504,643 | 25,910 |
| | Northwest Bancshares Inc. | 1,923,506 | 25,756 |
| * | Liberty Broadband Corp. Class A | 494,396 | 25,536 |
| | Hatteras Financial Corp. | 1,941,301 | 25,528 |
| | STAG Industrial Inc. | 1,371,020 | 25,295 |
| * | SLM Corp. | 3,879,624 | 25,295 |
| | Banner Corp. | 550,278 | 25,236 |
| | Select Income REIT | 1,260,839 | 24,990 |
| * | FCB Financial Holdings Inc. Class A | 697,822 | 24,975 |
| *,^ | Zillow Group Inc. Class A | 957,765 | 24,940 |
| | Potlatch Corp. | 820,364 | 24,808 |
| * | Essent Group Ltd. | 1,119,466 | 24,505 |
| | BOK Financial Corp. | 404,265 | 24,171 |
| | Provident Financial Services Inc. | 1,192,122 | 24,021 |
| | Park National Corp. | 263,200 | 23,814 |
| | Independent Bank Corp. | 502,202 | 23,362 |
| | National General Holdings Corp. | 1,054,077 | 23,042 |
| | Talmer Bancorp Inc. Class A | 1,260,606 | 22,830 |
| | NBT Bancorp Inc. | 818,592 | 22,822 |
| | Westamerica Bancorporation | 487,598 | 22,795 |
| | PennyMac Mortgage Investment Trust | 1,468,334 | 22,407 |
| * | Beneficial Bancorp Inc. | 1,670,210 | 22,247 |
| | WesBanco Inc. | 738,208 | 22,161 |
| | TFS Financial Corp. | 1,175,924 | 22,143 |
| | CYS Investments Inc. | 3,081,470 | 21,971 |
| | LegacyTexas Financial Group Inc. | 864,128 | 21,620 |
| | Redwood Trust Inc. | 1,634,765 | 21,579 |
10
| | | |
| Vanguard® Small-Cap Index Fund | | |
| Schedule of Investments | | |
| December 31, 2015 | | |
| |
| | | | Market |
| | | | Value |
| | | Shares | ($000) |
| | Government Properties Income Trust | 1,344,949 | 21,344 |
| | First Financial Bancorp | 1,177,144 | 21,271 |
| | HFF Inc. Class A | 683,932 | 21,250 |
| *,^ | St. Joe Co. | 1,106,088 | 20,474 |
| | S&T Bancorp Inc. | 664,215 | 20,471 |
| * | First Cash Financial Services Inc. | 534,189 | 19,995 |
| * | Navigators Group Inc. | 231,235 | 19,838 |
| | Franklin Street Properties Corp. | 1,911,740 | 19,787 |
| | Virtus Investment Partners Inc. | 163,894 | 19,251 |
| * | iStar Inc. | 1,633,011 | 19,155 |
| ^ | Seritage Growth Properties Class A | 472,235 | 18,993 |
| | Hersha Hospitality Trust Class A | 870,714 | 18,947 |
| | FelCor Lodging Trust Inc. | 2,591,153 | 18,915 |
| * | MBIA Inc. | 2,893,592 | 18,750 |
| | NRG Yield Inc. | 1,260,110 | 18,599 |
| | Inland Real Estate Corp. | 1,716,433 | 18,229 |
| | Boston Private Financial Holdings Inc. | 1,595,388 | 18,092 |
| | Infinity Property & Casualty Corp. | 217,093 | 17,852 |
| | Investors Real Estate Trust | 2,521,639 | 17,525 |
| | Maiden Holdings Ltd. | 1,173,183 | 17,492 |
| | ARMOUR Residential REIT Inc. | 793,218 | 17,260 |
| | New Senior Investment Group Inc. | 1,739,199 | 17,149 |
| | Berkshire Hills Bancorp Inc. | 588,972 | 17,145 |
| * | FNFV Group | 1,525,782 | 17,135 |
| * | HealthEquity Inc. | 683,252 | 17,129 |
| | Capstead Mortgage Corp. | 1,925,376 | 16,828 |
| | Employers Holdings Inc. | 611,045 | 16,682 |
| | CoreSite Realty Corp. | 288,532 | 16,366 |
| | Starwood Waypoint Residential Trust | 722,501 | 16,357 |
| | First Commonwealth Financial Corp. | 1,785,559 | 16,195 |
| | Safety Insurance Group Inc. | 285,338 | 16,087 |
| * | Walker & Dunlop Inc. | 551,107 | 15,877 |
| | Alexander's Inc. | 40,933 | 15,723 |
| | Nelnet Inc. Class A | 465,111 | 15,614 |
| * | Third Point Reinsurance Ltd. | 1,154,373 | 15,480 |
| | Brookline Bancorp Inc. | 1,338,164 | 15,389 |
| * | KCG Holdings Inc. Class A | 1,239,646 | 15,260 |
| * | Eagle Bancorp Inc. | 298,457 | 15,063 |
| | Capital Bank Financial Corp. | 460,622 | 14,731 |
| | Cash America International Inc. | 480,619 | 14,395 |
| * | Green Dot Corp. Class A | 875,823 | 14,381 |
| | State Bank Financial Corp. | 682,459 | 14,352 |
| | American Capital Mortgage Investment Corp. | 1,028,025 | 14,351 |
| | Greenhill & Co. Inc. | 496,354 | 14,201 |
| | Tompkins Financial Corp. | 252,051 | 14,155 |
| * | Black Knight Financial Services Inc. Class A | 426,002 | 14,084 |
| | Altisource Residential Corp. | 1,091,232 | 13,542 |
| | United Fire Group Inc. | 351,816 | 13,478 |
| | First Potomac Realty Trust | 1,181,179 | 13,465 |
| | City Holding Co. | 292,487 | 13,349 |
| *,^ | Encore Capital Group Inc. | 455,695 | 13,252 |
| | Central Pacific Financial Corp. | 598,469 | 13,178 |
| | InfraREIT Inc. | 699,333 | 12,938 |
| | FBL Financial Group Inc. Class A | 199,132 | 12,673 |
| | Cohen & Steers Inc. | 410,167 | 12,502 |
| | Northfield Bancorp Inc. | 780,463 | 12,425 |
| | Oritani Financial Corp. | 750,165 | 12,378 |
| | National Bank Holdings Corp. Class A | 573,743 | 12,261 |
| * | Ocwen Financial Corp. | 1,748,213 | 12,185 |
| | Universal Health Realty Income Trust | 240,169 | 12,011 |
| | Saul Centers Inc. | 233,807 | 11,987 |
| *,^ | Nationstar Mortgage Holdings Inc. | 874,083 | 11,686 |
| * | Piper Jaffray Cos. | 288,159 | 11,642 |
| | Simmons First National Corp. Class A | 225,136 | 11,563 |
11
| | | |
| Vanguard® Small-Cap Index Fund | | |
| Schedule of Investments | | |
| December 31, 2015 | | |
| |
| | | | Market |
| | | | Value |
| | | Shares | ($000) |
| | Ashford Hospitality Trust Inc. | 1,820,830 | 11,489 |
| | National Western Life Group Inc. Class A | 44,709 | 11,264 |
| *,^ | BofI Holding Inc. | 534,545 | 11,252 |
| | Moelis & Co. Class A | 385,382 | 11,245 |
| | Virtu Financial Inc. Class A | 493,171 | 11,165 |
| * | Greenlight Capital Re Ltd. Class A | 589,478 | 11,029 |
| | Investment Technology Group Inc. | 647,635 | 11,023 |
| | Rouse Properties Inc. | 756,235 | 11,011 |
| | Silver Bay Realty Trust Corp. | 687,458 | 10,766 |
| | Dime Community Bancshares Inc. | 597,678 | 10,453 |
| | United Community Banks Inc. | 532,289 | 10,374 |
| *,^ | Walter Investment Management Corp. | 720,342 | 10,243 |
| | CareTrust REIT Inc. | 918,198 | 10,054 |
| * | Ambac Financial Group Inc. | 674,154 | 9,499 |
| | NRG Yield Inc. Class A | 660,869 | 9,193 |
| * | Flagstar Bancorp Inc. | 396,931 | 9,173 |
| | Anworth Mortgage Asset Corp. | 2,062,529 | 8,972 |
| * | Marcus & Millichap Inc. | 298,260 | 8,691 |
| | Getty Realty Corp. | 502,177 | 8,612 |
| | Urstadt Biddle Properties Inc. Class A | 446,607 | 8,593 |
| | Ladder Capital Corp. | 667,144 | 8,286 |
| | Resource Capital Corp. | 638,875 | 8,152 |
| | Ashford Hospitality Prime Inc. | 542,956 | 7,873 |
| * | First BanCorp | 2,353,019 | 7,647 |
| *,^ | Altisource Portfolio Solutions SA | 268,894 | 7,478 |
| | BancFirst Corp. | 125,136 | 7,335 |
| | AG Mortgage Investment Trust Inc. | 571,168 | 7,334 |
| *,^ | On Deck Capital Inc. | 699,770 | 7,208 |
| * | Forestar Group Inc. | 642,258 | 7,026 |
| ^ | OFG Bancorp | 882,333 | 6,459 |
| * | PennyMac Financial Services Inc. Class A | 393,125 | 6,038 |
| | Fidelity & Guaranty Life | 235,670 | 5,979 |
| | State Auto Financial Corp. | 289,268 | 5,956 |
| | OneBeacon Insurance Group Ltd. Class A | 447,735 | 5,556 |
| * | Tejon Ranch Co. | 289,843 | 5,550 |
| * | EZCORP Inc. Class A | 987,337 | 4,927 |
| | Newcastle Investment Corp. | 1,201,968 | 4,904 |
| | Houlihan Lokey Inc. | 185,996 | 4,875 |
| | Kearny Financial Corp. | 374,660 | 4,747 |
| *,^ | World Acceptance Corp. | 117,090 | 4,344 |
| * | MoneyGram International Inc. | 534,917 | 3,354 |
| * | NewStar Financial Inc. | 368,640 | 3,310 |
| * | Associated Capital Group Inc. Class A | 89,846 | 2,740 |
| | GAMCO Investors Inc. Class A | 88,111 | 2,735 |
| * | PICO Holdings Inc. | 230,015 | 2,374 |
| * | RMR Group Inc. Class A | 141,787 | 2,043 |
| * | Enova International Inc. | 214,764 | 1,420 |
| | Urstadt Biddle Properties Inc. | 60,433 | 1,076 |
| | NorthStar Realty Europe Corp. | 43,722 | 516 |
| * | Tejon Ranch Co. Warrants Exp. 08/31/2016 | 37,571 | — |
| | | | 14,276,717 |
| Health Care (11.2%) | | |
| * | Ionis Pharmaceuticals Inc. | 2,399,196 | 148,582 |
| * | United Therapeutics Corp. | 865,881 | 135,606 |
| * | MEDNAX Inc. | 1,878,371 | 134,604 |
| * | STERIS plc | 1,715,663 | 129,258 |
| * | DexCom Inc. | 1,542,565 | 126,336 |
| * | Sirona Dental Systems Inc. | 1,116,458 | 122,330 |
| * | Dyax Corp. | 2,938,682 | 110,553 |
| | Teleflex Inc. | 830,952 | 109,229 |
| * | Health Net Inc. | 1,466,645 | 100,407 |
| * | Neurocrine Biosciences Inc. | 1,721,687 | 97,396 |
| * | Align Technology Inc. | 1,349,641 | 88,874 |
| * | Seattle Genetics Inc. | 1,950,966 | 87,559 |
12
| | | |
| Vanguard® Small-Cap Index Fund | | |
| Schedule of Investments | | |
| December 31, 2015 | | |
| |
| | | | Market |
| | | | Value |
| | | Shares | ($000) |
| * | Anacor Pharmaceuticals Inc. | 749,125 | 84,629 |
| | West Pharmaceutical Services Inc. | 1,367,894 | 82,375 |
| * | Amsurg Corp. | 1,077,720 | 81,907 |
| * | Ultragenyx Pharmaceutical Inc. | 697,405 | 78,235 |
| * | Charles River Laboratories International Inc. | 931,640 | 74,895 |
| * | Centene Corp. | 1,131,403 | 74,458 |
| * | PAREXEL International Corp. | 1,064,536 | 72,516 |
| * | Acadia Healthcare Co. Inc. | 1,145,949 | 71,576 |
| * | ABIOMED Inc. | 764,275 | 68,999 |
| * | WellCare Health Plans Inc. | 881,288 | 68,926 |
| * | Brookdale Senior Living Inc. | 3,691,795 | 68,151 |
| * | Alere Inc. | 1,724,561 | 67,413 |
| | Bio-Techne Corp. | 743,630 | 66,927 |
| *,^ | OPKO Health Inc. | 6,543,850 | 65,766 |
| * | LifePoint Health Inc. | 870,321 | 63,882 |
| * | Team Health Holdings Inc. | 1,451,305 | 63,698 |
| * | Horizon Pharma plc | 2,866,207 | 62,111 |
| *,^ | Juno Therapeutics Inc. | 1,408,312 | 61,923 |
| | HealthSouth Corp. | 1,736,876 | 60,461 |
| * | Tenet Healthcare Corp. | 1,992,833 | 60,383 |
| *,^ | Myriad Genetics Inc. | 1,393,552 | 60,146 |
| * | Community Health Systems Inc. | 2,244,969 | 59,559 |
| * | Akorn Inc. | 1,594,526 | 59,492 |
| * | ACADIA Pharmaceuticals Inc. | 1,614,114 | 57,543 |
| * | Impax Laboratories Inc. | 1,339,430 | 57,274 |
| * | Bio-Rad Laboratories Inc. Class A | 410,880 | 56,973 |
| | Hill-Rom Holdings Inc. | 1,172,709 | 56,360 |
| * | Prestige Brands Holdings Inc. | 1,054,646 | 54,293 |
| * | Pacira Pharmaceuticals Inc. | 702,985 | 53,982 |
| * | Cepheid | 1,455,928 | 53,185 |
| * | NuVasive Inc. | 977,240 | 52,878 |
| * | Bruker Corp. | 2,171,996 | 52,714 |
| * | Molina Healthcare Inc. | 837,108 | 50,335 |
| * | Medicines Co. | 1,313,172 | 49,034 |
| * | Portola Pharmaceuticals Inc. | 944,526 | 48,596 |
| | Healthcare Services Group Inc. | 1,360,901 | 47,455 |
| *,^ | Kite Pharma Inc. | 761,246 | 46,908 |
| * | Catalent Inc. | 1,858,821 | 46,526 |
| * | Nektar Therapeutics | 2,672,663 | 45,034 |
| | Owens & Minor Inc. | 1,251,633 | 45,034 |
| * | Bluebird Bio Inc. | 696,200 | 44,710 |
| * | Wright Medical Group NV | 1,838,864 | 44,464 |
| * | Puma Biotechnology Inc. | 554,365 | 43,462 |
| * | Insulet Corp. | 1,133,073 | 42,841 |
| *,^ | Novavax Inc. | 5,102,914 | 42,813 |
| * | Ophthotech Corp. | 526,186 | 41,321 |
| | Cantel Medical Corp. | 662,490 | 41,167 |
| * | Neogen Corp. | 714,597 | 40,389 |
| * | Integra LifeSciences Holdings Corp. | 589,002 | 39,923 |
| * | Radius Health Inc. | 640,390 | 39,410 |
| * | Ligand Pharmaceuticals Inc. | 350,619 | 38,014 |
| * | Globus Medical Inc. | 1,365,814 | 37,997 |
| * | Masimo Corp. | 900,846 | 37,394 |
| * | Acorda Therapeutics Inc. | 864,573 | 36,986 |
| * | Agios Pharmaceuticals Inc. | 566,778 | 36,795 |
| * | Halozyme Therapeutics Inc. | 2,062,707 | 35,747 |
| * | VWR Corp. | 1,192,428 | 33,758 |
| * | Haemonetics Corp. | 1,009,677 | 32,552 |
| * | ICU Medical Inc. | 287,653 | 32,441 |
| * | Halyard Health Inc. | 940,699 | 31,429 |
| * | Magellan Health Inc. | 509,152 | 31,394 |
| *,^ | Intrexon Corp. | 1,040,885 | 31,383 |
| *,^ | Sarepta Therapeutics Inc. | 812,109 | 31,331 |
| * | Celldex Therapeutics Inc. | 1,989,840 | 31,201 |
13
| | | |
| Vanguard® Small-Cap Index Fund | | |
| Schedule of Investments | | |
| December 31, 2015 | | |
| |
| | | | Market |
| | | | Value |
| | | Shares | ($000) |
| * | Air Methods Corp. | 713,546 | 29,919 |
| * | FibroGen Inc. | 975,764 | 29,732 |
| * | Ironwood Pharmaceuticals Inc. Class A | 2,556,542 | 29,630 |
| * | TESARO Inc. | 565,121 | 29,567 |
| * | INC Research Holdings Inc. Class A | 591,812 | 28,709 |
| * | Emergent BioSolutions Inc. | 658,809 | 26,359 |
| *,^ | Exelixis Inc. | 4,539,683 | 25,604 |
| * | NxStage Medical Inc. | 1,150,079 | 25,198 |
| * | Sage Therapeutics Inc. | 430,682 | 25,109 |
| | Select Medical Holdings Corp. | 2,091,617 | 24,911 |
| | Abaxis Inc. | 435,240 | 24,234 |
| * | Achillion Pharmaceuticals Inc. | 2,199,862 | 23,736 |
| * | ImmunoGen Inc. | 1,747,686 | 23,716 |
| * | Intercept Pharmaceuticals Inc. | 158,571 | 23,683 |
| * | Clovis Oncology Inc. | 648,236 | 22,688 |
| * | Nevro Corp. | 335,839 | 22,672 |
| * | Amedisys Inc. | 569,952 | 22,410 |
| * | Surgical Care Affiliates Inc. | 555,179 | 22,102 |
| | CONMED Corp. | 500,939 | 22,066 |
| *,^ | Lannett Co. Inc. | 549,538 | 22,047 |
| * | Alder Biopharmaceuticals Inc. | 650,714 | 21,493 |
| * | ARIAD Pharmaceuticals Inc. | 3,413,522 | 21,334 |
| * | HMS Holdings Corp. | 1,712,185 | 21,128 |
| * | AMAG Pharmaceuticals Inc. | 693,485 | 20,936 |
| | Ensign Group Inc. | 924,606 | 20,924 |
| | Analogic Corp. | 250,867 | 20,722 |
| *,^ | Cempra Inc. | 663,465 | 20,654 |
| | Kindred Healthcare Inc. | 1,667,630 | 19,861 |
| * | PRA Health Sciences Inc. | 422,800 | 19,140 |
| * | PTC Therapeutics Inc. | 584,850 | 18,949 |
| * | Momenta Pharmaceuticals Inc. | 1,243,904 | 18,460 |
| *,^ | Exact Sciences Corp. | 1,927,784 | 17,793 |
| ^ | Theravance Inc. | 1,647,605 | 17,366 |
| * | HeartWare International Inc. | 342,103 | 17,242 |
| * | Luminex Corp. | 778,383 | 16,650 |
| *,^ | Insys Therapeutics Inc. | 576,981 | 16,519 |
| *,^ | Merrimack Pharmaceuticals Inc. | 2,077,312 | 16,411 |
| | Meridian Bioscience Inc. | 796,154 | 16,337 |
| *,^ | Spark Therapeutics Inc. | 346,972 | 15,721 |
| * | Merit Medical Systems Inc. | 841,306 | 15,640 |
| *,^ | Relypsa Inc. | 539,302 | 15,284 |
| * | Natus Medical Inc. | 310,923 | 14,940 |
| *,^ | Aduro Biotech Inc. | 501,276 | 14,106 |
| * | Orthofix International NV | 358,976 | 14,075 |
| *,^ | Adeptus Health Inc. Class A | 242,183 | 13,204 |
| * | LHC Group Inc. | 286,159 | 12,960 |
| *,^ | Endologix Inc. | 1,293,109 | 12,802 |
| * | Genomic Health Inc. | 358,882 | 12,633 |
| * | Quidel Corp. | 572,003 | 12,126 |
| | National HealthCare Corp. | 193,572 | 11,943 |
| | PDL BioPharma Inc. | 3,295,948 | 11,668 |
| *,^ | Synergy Pharmaceuticals Inc. | 2,029,761 | 11,509 |
| * | Amicus Therapeutics Inc. | 1,184,816 | 11,493 |
| * | Intra-Cellular Therapies Inc. Class A | 213,190 | 11,467 |
| * | HealthStream Inc. | 508,322 | 11,183 |
| *,^ | Lexicon Pharmaceuticals Inc. | 832,387 | 11,079 |
| * | Hanger Inc. | 673,433 | 11,078 |
| * | Depomed Inc. | 605,449 | 10,977 |
| * | Insmed Inc. | 586,320 | 10,642 |
| * | Acceleron Pharma Inc. | 215,690 | 10,517 |
| | Invacare Corp. | 599,912 | 10,432 |
| *,^ | Accuray Inc. | 1,507,834 | 10,178 |
| *,^ | ZIOPHARM Oncology Inc. | 1,167,489 | 9,702 |
| * | Arena Pharmaceuticals Inc. | 4,865,957 | 9,245 |
14
| | | |
| Vanguard® Small-Cap Index Fund | | |
| Schedule of Investments | | |
| December 31, 2015 | | |
| |
| | | | Market |
| | | | Value |
| | | Shares | ($000) |
| * | CorVel Corp. | 199,612 | 8,767 |
| *,^ | Theravance Biopharma Inc. | 527,133 | 8,640 |
| *,^ | Epizyme Inc. | 497,156 | 7,964 |
| *,^ | Keryx Biopharmaceuticals Inc. | 1,572,557 | 7,941 |
| * | Healthways Inc. | 610,054 | 7,851 |
| *,^ | MannKind Corp. | 5,398,502 | 7,828 |
| * | Sagent Pharmaceuticals Inc. | 491,168 | 7,814 |
| * | Infinity Pharmaceuticals Inc. | 989,393 | 7,767 |
| * | Chimerix Inc. | 836,843 | 7,490 |
| * | Spectrum Pharmaceuticals Inc. | 1,213,533 | 7,318 |
| | Universal American Corp. | 971,141 | 6,798 |
| * | Surgery Partners Inc. | 305,186 | 6,253 |
| * | Tetraphase Pharmaceuticals Inc. | 584,612 | 5,864 |
| *,^ | Global Blood Therapeutics Inc. | 181,214 | 5,859 |
| * | Aegerion Pharmaceuticals Inc. | 544,694 | 5,501 |
| *,^ | Seres Therapeutics Inc. | 155,962 | 5,473 |
| *,^ | NantKwest Inc. | 241,486 | 4,185 |
| * | Glaukos Corp. | 160,494 | 3,963 |
| * | Aimmune Therapeutics Inc. | 211,217 | 3,897 |
| *,^ | ConforMIS Inc. | 204,107 | 3,529 |
| *,^ | Teladoc Inc. | 192,473 | 3,457 |
| *,^ | Esperion Therapeutics Inc. | 147,098 | 3,274 |
| * | Natera Inc. | 248,641 | 2,685 |
| *,^ | Sequenom Inc. | 1,185,063 | 1,943 |
| * | Penumbra Inc. | 1,985 | 107 |
| | | | 6,046,991 |
| Industrials (18.5%) | | |
| * | Spirit AeroSystems Holdings Inc. Class A | 2,804,057 | 140,399 |
| | Waste Connections Inc. | 2,444,300 | 137,663 |
| | Valspar Corp. | 1,586,717 | 131,618 |
| * | CoStar Group Inc. | 616,467 | 127,418 |
| | Broadridge Financial Solutions Inc. | 2,368,590 | 127,264 |
| | Allegion plc | 1,915,715 | 126,284 |
| | Jack Henry & Associates Inc. | 1,596,638 | 124,634 |
| | Packaging Corp. of America | 1,951,971 | 123,072 |
| | PerkinElmer Inc. | 2,235,871 | 119,776 |
| * | HD Supply Holdings Inc. | 3,977,697 | 119,450 |
| | Huntington Ingalls Industries Inc. | 938,354 | 119,030 |
| | IDEX Corp. | 1,528,438 | 117,094 |
| | Carlisle Cos. Inc. | 1,298,388 | 115,154 |
| | AO Smith Corp. | 1,495,891 | 114,600 |
| | Lennox International Inc. | 854,926 | 106,780 |
| | Orbital ATK Inc. | 1,175,108 | 104,984 |
| * | Keysight Technologies Inc. | 3,384,957 | 95,896 |
| * | AECOM | 3,024,161 | 90,816 |
| | AptarGroup Inc. | 1,247,329 | 90,618 |
| | Hexcel Corp. | 1,887,535 | 87,676 |
| * | Berry Plastics Group Inc. | 2,396,875 | 86,719 |
| | Bemis Co. Inc. | 1,917,096 | 85,675 |
| | Global Payments Inc. | 1,302,771 | 84,042 |
| | Graphic Packaging Holding Co. | 6,544,630 | 83,968 |
| | Sonoco Products Co. | 2,016,185 | 82,402 |
| | Graco Inc. | 1,117,210 | 80,517 |
| | Jabil Circuit Inc. | 3,402,837 | 79,252 |
| | Toro Co. | 1,041,154 | 76,077 |
| * | Old Dominion Freight Line Inc. | 1,267,602 | 74,877 |
| * | Genpact Ltd. | 2,976,857 | 74,362 |
| | Trinity Industries Inc. | 3,054,177 | 73,361 |
| * | Euronet Worldwide Inc. | 1,002,486 | 72,610 |
| * | Zebra Technologies Corp. | 1,041,067 | 72,510 |
| | MDU Resources Group Inc. | 3,901,593 | 71,477 |
| | MAXIMUS Inc. | 1,252,768 | 70,468 |
| | Nordson Corp. | 1,084,469 | 69,569 |
| * | WEX Inc. | 772,137 | 68,257 |
15
| | | |
| Vanguard® Small-Cap Index Fund | | |
| Schedule of Investments | | |
| December 31, 2015 | | |
| |
| | | | Market |
| | | | Value |
| | | Shares | ($000) |
| | Booz Allen Hamilton Holding Corp. Class A | 2,196,541 | 67,763 |
| | Lincoln Electric Holdings Inc. | 1,303,906 | 67,660 |
| | Heartland Payment Systems Inc. | 698,202 | 66,204 |
| | National Instruments Corp. | 2,290,682 | 65,720 |
| | FEI Co. | 816,934 | 65,183 |
| | ITT Corp. | 1,789,528 | 64,996 |
| | Air Lease Corp. Class A | 1,929,540 | 64,601 |
| | RR Donnelley & Sons Co. | 4,172,787 | 61,423 |
| * | IPG Photonics Corp. | 686,017 | 61,165 |
| * | Genesee & Wyoming Inc. Class A | 1,137,591 | 61,077 |
| | BWX Technologies Inc. | 1,916,147 | 60,876 |
| | Ryder System Inc. | 1,068,179 | 60,705 |
| | Watsco Inc. | 514,149 | 60,222 |
| * | CoreLogic Inc. | 1,762,509 | 59,679 |
| | Oshkosh Corp. | 1,495,757 | 58,394 |
| | Eagle Materials Inc. | 950,647 | 57,448 |
| | EMCOR Group Inc. | 1,191,486 | 57,239 |
| * | Kirby Corp. | 1,079,915 | 56,825 |
| * | Teledyne Technologies Inc. | 637,839 | 56,576 |
| | Woodward Inc. | 1,137,456 | 56,486 |
| | Curtiss-Wright Corp. | 822,816 | 56,363 |
| * | Owens-Illinois Inc. | 3,215,844 | 56,020 |
| | MSC Industrial Direct Co. Inc. Class A | 967,047 | 54,416 |
| | Cognex Corp. | 1,604,625 | 54,188 |
| | World Fuel Services Corp. | 1,408,933 | 54,188 |
| | Deluxe Corp. | 979,763 | 53,436 |
| *,^ | XPO Logistics Inc. | 1,950,201 | 53,143 |
| | Regal Beloit Corp. | 888,880 | 52,017 |
| * | Louisiana-Pacific Corp. | 2,843,527 | 51,212 |
| | Landstar System Inc. | 859,549 | 50,413 |
| | EnerSys | 883,809 | 49,431 |
| | CLARCOR Inc. | 993,133 | 49,339 |
| | KBR Inc. | 2,871,519 | 48,586 |
| * | Esterline Technologies Corp. | 588,210 | 47,645 |
| | Littelfuse Inc. | 443,801 | 47,491 |
| | Valmont Industries Inc. | 435,596 | 46,182 |
| * | Universal Display Corp. | 843,658 | 45,929 |
| | Silgan Holdings Inc. | 841,399 | 45,200 |
| | Crane Co. | 924,570 | 44,231 |
| | Convergys Corp. | 1,747,188 | 43,488 |
| * | On Assignment Inc. | 956,169 | 42,980 |
| | Timken Co. | 1,486,946 | 42,512 |
| * | USG Corp. | 1,739,378 | 42,250 |
| * | Advisory Board Co. | 833,893 | 41,369 |
| * | Clean Harbors Inc. | 974,363 | 40,582 |
| | CEB Inc. | 658,700 | 40,438 |
| * | Moog Inc. Class A | 663,291 | 40,195 |
| | Belden Inc. | 835,557 | 39,839 |
| * | Generac Holdings Inc. | 1,337,031 | 39,803 |
| | Triumph Group Inc. | 995,597 | 39,575 |
| *,^ | Cimpress NV | 468,860 | 38,043 |
| | Donaldson Co. Inc. | 1,325,130 | 37,978 |
| | Terex Corp. | 2,051,665 | 37,915 |
| * | Armstrong World Industries Inc. | 826,371 | 37,790 |
| ^ | Manitowoc Co. Inc. | 2,446,872 | 37,560 |
| | Matson Inc. | 866,902 | 36,956 |
| * | WESCO International Inc. | 838,687 | 36,634 |
| | GATX Corp. | 843,965 | 35,911 |
| * | Masonite International Corp. | 581,427 | 35,601 |
| | Covanta Holding Corp. | 2,284,569 | 35,388 |
| | Barnes Group Inc. | 994,183 | 35,184 |
| * | Anixter International Inc. | 564,503 | 34,090 |
| * | Imperva Inc. | 536,345 | 33,956 |
| | Korn/Ferry International | 1,019,134 | 33,815 |
16
| | | |
| Vanguard® Small-Cap Index Fund | | |
| Schedule of Investments | | |
| December 31, 2015 | | |
| |
| | | | Market |
| | | | Value |
| | | Shares | ($000) |
| *,^ | Ambarella Inc. | 601,003 | 33,500 |
| * | OSI Systems Inc. | 372,902 | 33,062 |
| | Vishay Intertechnology Inc. | 2,733,382 | 32,937 |
| | AGCO Corp. | 723,425 | 32,836 |
| * | WageWorks Inc. | 723,585 | 32,829 |
| * | KLX Inc. | 1,064,969 | 32,790 |
| * | Coherent Inc. | 501,397 | 32,646 |
| * | Sanmina Corp. | 1,560,802 | 32,121 |
| | UniFirst Corp. | 307,924 | 32,086 |
| * | Greatbatch Inc. | 607,799 | 31,909 |
| | Mueller Industries Inc. | 1,148,607 | 31,127 |
| * | Quanta Services Inc. | 1,528,381 | 30,950 |
| | Kennametal Inc. | 1,602,837 | 30,775 |
| * | Rexnord Corp. | 1,697,751 | 30,763 |
| | Granite Construction Inc. | 713,820 | 30,630 |
| * | Cardtronics Inc. | 905,700 | 30,477 |
| | ABM Industries Inc. | 1,062,204 | 30,241 |
| * | Proto Labs Inc. | 474,648 | 30,230 |
| | Applied Industrial Technologies Inc. | 743,602 | 30,108 |
| | HEICO Corp. Class A | 603,946 | 29,714 |
| | Knight Transportation Inc. | 1,208,017 | 29,270 |
| * | FTI Consulting Inc. | 844,343 | 29,265 |
| * | RBC Bearings Inc. | 450,334 | 29,087 |
| | Tetra Tech Inc. | 1,116,207 | 29,044 |
| | John Bean Technologies Corp. | 580,017 | 28,902 |
| * | ExlService Holdings Inc. | 634,036 | 28,487 |
| | Brink's Co. | 985,623 | 28,445 |
| | HEICO Corp. | 518,092 | 28,164 |
| | Simpson Manufacturing Co. Inc. | 816,893 | 27,897 |
| | MSA Safety Inc. | 640,825 | 27,857 |
| | Watts Water Technologies Inc. Class A | 559,996 | 27,815 |
| | Mobile Mini Inc. | 891,276 | 27,745 |
| * | Huron Consulting Group Inc. | 462,781 | 27,489 |
| | Universal Forest Products Inc. | 400,736 | 27,398 |
| | AZZ Inc. | 493,030 | 27,398 |
| * | Itron Inc. | 754,050 | 27,282 |
| | Forward Air Corp. | 626,368 | 26,940 |
| | Mueller Water Products Inc. Class A | 3,070,035 | 26,402 |
| | Actuant Corp. Class A | 1,079,363 | 25,862 |
| | Aircastle Ltd. | 1,227,832 | 25,649 |
| *,^ | NeuStar Inc. Class A | 1,055,235 | 25,294 |
| | Apogee Enterprises Inc. | 579,014 | 25,193 |
| | Exponent Inc. | 496,523 | 24,801 |
| | Joy Global Inc. | 1,959,611 | 24,711 |
| *,^ | LifeLock Inc. | 1,690,620 | 24,260 |
| * | Swift Transportation Co. | 1,754,115 | 24,242 |
| | Essendant Inc. | 744,273 | 24,196 |
| | G&K Services Inc. Class A | 382,486 | 24,058 |
| * | Smith & Wesson Holding Corp. | 1,092,562 | 24,015 |
| *,^ | Knowles Corp. | 1,783,231 | 23,770 |
| * | Plexus Corp. | 678,432 | 23,691 |
| * | Sykes Enterprises Inc. | 765,981 | 23,577 |
| | Methode Electronics Inc. | 734,898 | 23,392 |
| * | Trex Co. Inc. | 614,439 | 23,373 |
| * | TopBuild Corp. | 750,107 | 23,081 |
| * | Hub Group Inc. Class A | 688,899 | 22,699 |
| * | Babcock & Wilcox Enterprises Inc. | 1,080,642 | 22,553 |
| | Sturm Ruger & Co. Inc. | 375,691 | 22,395 |
| * | MasTec Inc. | 1,288,116 | 22,387 |
| | Kaman Corp. | 546,243 | 22,292 |
| * | DigitalGlobe Inc. | 1,393,470 | 21,822 |
| * | TrueBlue Inc. | 846,227 | 21,799 |
| | Cubic Corp. | 456,103 | 21,551 |
| | Standex International Corp. | 257,459 | 21,408 |
17
| | |
| Vanguard® Small-Cap Index Fund | | |
| Schedule of Investments | | |
| December 31, 2015 | | |
| |
| | | Market |
| | | Value |
| | Shares | ($000) |
| * SPX FLOW Inc. | 763,964 | 21,322 |
| * Benchmark Electronics Inc. | 1,027,311 | 21,235 |
| Albany International Corp. | 580,718 | 21,225 |
| Franklin Electric Co. Inc. | 784,429 | 21,203 |
| Comfort Systems USA Inc. | 745,334 | 21,182 |
| * ExamWorks Group Inc. | 793,028 | 21,095 |
| * Atlas Air Worldwide Holdings Inc. | 502,839 | 20,787 |
| * II-VI Inc. | 1,104,460 | 20,499 |
| Brady Corp. Class A | 889,551 | 20,442 |
| EVERTEC Inc. | 1,212,027 | 20,289 |
| Werner Enterprises Inc. | 866,070 | 20,257 |
| Heartland Express Inc. | 1,186,629 | 20,196 |
| * TransUnion | 731,555 | 20,169 |
| * Colfax Corp. | 861,799 | 20,123 |
| Otter Tail Corp. | 755,317 | 20,114 |
| * Boise Cascade Co. | 786,850 | 20,088 |
| Tennant Co. | 355,084 | 19,977 |
| * Summit Materials Inc. Class A | 989,809 | 19,836 |
| * M/A-COM Technology Solutions Holdings Inc. | 478,663 | 19,573 |
| * PHH Corp. | 1,201,856 | 19,470 |
| EnPro Industries Inc. | 442,775 | 19,411 |
| MTS Systems Corp. | 300,060 | 19,027 |
| AAON Inc. | 816,313 | 18,955 |
| * Rogers Corp. | 356,999 | 18,410 |
| Primoris Services Corp. | 822,676 | 18,124 |
| ESCO Technologies Inc. | 498,424 | 18,013 |
| AAR Corp. | 675,212 | 17,751 |
| ^ Greenbrier Cos. Inc. | 540,394 | 17,628 |
| * TriMas Corp. | 911,616 | 17,002 |
| * Veeco Instruments Inc. | 818,615 | 16,831 |
| Insperity Inc. | 348,511 | 16,781 |
| * Inovalon Holdings Inc. Class A | 980,363 | 16,666 |
| Advanced Drainage Systems Inc. | 688,865 | 16,553 |
| * Paylocity Holding Corp. | 407,813 | 16,537 |
| * TriNet Group Inc. | 850,129 | 16,450 |
| Greif Inc. Class A | 530,458 | 16,343 |
| Badger Meter Inc. | 276,709 | 16,212 |
| * Wabash National Corp. | 1,337,289 | 15,820 |
| ^ Lindsay Corp. | 218,458 | 15,816 |
| * Meritor Inc. | 1,848,940 | 15,439 |
| * Navigant Consulting Inc. | 961,265 | 15,438 |
| Astec Industries Inc. | 368,767 | 15,009 |
| * AMN Healthcare Services Inc. | 478,277 | 14,851 |
| ManTech International Corp. Class A | 489,642 | 14,807 |
| Sun Hydraulics Corp. | 455,863 | 14,465 |
| Quanex Building Products Corp. | 679,210 | 14,162 |
| CIRCOR International Inc. | 331,163 | 13,959 |
| Encore Wire Corp. | 375,237 | 13,918 |
| Kforce Inc. | 528,867 | 13,370 |
| * Aegion Corp. Class A | 690,376 | 13,331 |
| * Tutor Perini Corp. | 788,960 | 13,207 |
| * Team Inc. | 411,416 | 13,149 |
| * Wesco Aircraft Holdings Inc. | 1,079,515 | 12,922 |
| Griffon Corp. | 719,081 | 12,800 |
| * Rofin-Sinar Technologies Inc. | 476,994 | 12,774 |
| * UTi Worldwide Inc. | 1,809,053 | 12,718 |
| Harsco Corp. | 1,608,023 | 12,671 |
| Altra Industrial Motion Corp. | 501,400 | 12,575 |
| ^ Outerwall Inc. | 343,895 | 12,566 |
| General Cable Corp. | 934,337 | 12,548 |
| * Continental Building Products Inc. | 714,550 | 12,476 |
| * Newport Corp. | 754,966 | 11,981 |
| * Headwaters Inc. | 704,345 | 11,882 |
| * Aerovironment Inc. | 402,320 | 11,856 |
18
| | | |
| Vanguard® Small-Cap Index Fund | | |
| Schedule of Investments | | |
| December 31, 2015 | | |
| |
| | | | Market |
| | | | Value |
| | | Shares | ($000) |
| | Raven Industries Inc. | 759,899 | 11,854 |
| | Resources Connection Inc. | 712,702 | 11,646 |
| * | Press Ganey Holdings Inc. | 366,257 | 11,555 |
| * | RPX Corp. | 1,046,028 | 11,506 |
| | Materion Corp. | 403,731 | 11,304 |
| | H&E Equipment Services Inc. | 636,543 | 11,127 |
| | McGrath RentCorp | 433,845 | 10,929 |
| * | Thermon Group Holdings Inc. | 645,865 | 10,928 |
| | TAL International Group Inc. | 667,657 | 10,616 |
| | ArcBest Corp. | 492,569 | 10,536 |
| * | Air Transport Services Group Inc. | 1,042,210 | 10,506 |
| * | FARO Technologies Inc. | 348,823 | 10,297 |
| | AVX Corp. | 842,508 | 10,228 |
| * | Monster Worldwide Inc. | 1,737,836 | 9,958 |
| | Gorman-Rupp Co. | 369,248 | 9,870 |
| | Kelly Services Inc. Class A | 587,679 | 9,491 |
| | TeleTech Holdings Inc. | 339,345 | 9,471 |
| * | TASER International Inc. | 540,276 | 9,341 |
| * | TTM Technologies Inc. | 1,393,605 | 9,072 |
| *,^ | Navistar International Corp. | 980,458 | 8,667 |
| * | Nortek Inc. | 195,713 | 8,537 |
| * | DHI Group Inc. | 870,097 | 7,979 |
| * | Builders FirstSource Inc. | 713,421 | 7,905 |
| | Hyster-Yale Materials Handling Inc. | 148,775 | 7,803 |
| ^ | American Railcar Industries Inc. | 158,102 | 7,317 |
| | Schnitzer Steel Industries Inc. | 504,971 | 7,256 |
| | SPX Corp. | 741,099 | 6,914 |
| * | Mistras Group Inc. | 346,123 | 6,608 |
| ^ | Textainer Group Holdings Ltd. | 456,402 | 6,440 |
| | Landauer Inc. | 192,004 | 6,321 |
| * | Bazaarvoice Inc. | 1,442,297 | 6,317 |
| | Greif Inc. Class B | 143,708 | 6,146 |
| * | Astronics Corp. | 147,965 | 6,024 |
| | American Science & Engineering Inc. | 143,343 | 5,932 |
| * | DXP Enterprises Inc. | 256,960 | 5,859 |
| | Park Electrochemical Corp. | 388,164 | 5,846 |
| * | Roadrunner Transportation Systems Inc. | 614,169 | 5,792 |
| * | InnerWorkings Inc. | 757,929 | 5,684 |
| | TimkenSteel Corp. | 669,394 | 5,610 |
| * | Multi Packaging Solutions International Ltd. | 306,999 | 5,326 |
| * | Ply Gem Holdings Inc. | 409,591 | 5,136 |
| | Quad/Graphics Inc. | 532,098 | 4,949 |
| * | Milacron Holdings Corp. | 332,823 | 4,164 |
| | Acacia Research Corp. | 965,019 | 4,140 |
| * | Evolent Health Inc. Class A | 249,664 | 3,023 |
| | Checkpoint Systems Inc. | 394,490 | 2,473 |
| * | CAI International Inc. | 161,741 | 1,630 |
| * | Astronics Corp. Class B | 25,198 | 1,024 |
| * | Overseas Shipholding Group Inc. Class B | 134,980 | 447 |
| * | Overseas Shipholding Group Inc. Class A | 13,479 | 38 |
| | | | 9,964,410 |
| Oil & Gas (3.4%) | | |
| * | Newfield Exploration Co. | 3,263,941 | 106,274 |
| * | First Solar Inc. | 1,511,845 | 99,767 |
| * | Diamondback Energy Inc. | 1,332,296 | 89,131 |
| | PBF Energy Inc. Class A | 1,949,665 | 71,767 |
| | Nabors Industries Ltd. | 6,250,992 | 53,196 |
| * | Gulfport Energy Corp. | 2,154,535 | 52,937 |
| ^ | Noble Corp. plc | 4,834,862 | 51,008 |
| | Western Refining Inc. | 1,398,661 | 49,820 |
| | QEP Resources Inc. | 3,517,901 | 47,140 |
| * | Dril-Quip Inc. | 763,501 | 45,222 |
| * | PDC Energy Inc. | 798,284 | 42,612 |
| | Rowan Cos. plc Class A | 2,484,408 | 42,111 |
19
| | | |
| Vanguard® Small-Cap Index Fund | | |
| Schedule of Investments | | |
| December 31, 2015 | | |
| |
| | | | Market |
| | | | Value |
| | | Shares | ($000) |
| | Patterson-UTI Energy Inc. | 2,783,049 | 41,968 |
| | Superior Energy Services Inc. | 3,000,338 | 40,415 |
| * | Whiting Petroleum Corp. | 4,054,855 | 38,278 |
| * | Cobalt International Energy Inc. | 7,013,496 | 37,873 |
| * | Parsley Energy Inc. Class A | 2,014,441 | 37,166 |
| | Ensco plc Class A | 2,352,502 | 36,205 |
| * | Memorial Resource Development Corp. | 2,053,659 | 33,167 |
| *,^ | SunPower Corp. Class A | 1,098,494 | 32,966 |
| * | Carrizo Oil & Gas Inc. | 1,101,515 | 32,583 |
| *,^ | NOW Inc. | 2,050,566 | 32,440 |
| * | WPX Energy Inc. | 5,553,389 | 31,876 |
| * | RSP Permian Inc. | 1,208,065 | 29,465 |
| * | Matador Resources Co. | 1,463,804 | 28,939 |
| * | Oil States International Inc. | 1,011,219 | 27,556 |
| | Targa Resources Corp. | 1,003,761 | 27,162 |
| *,^ | Southwestern Energy Co. | 3,810,230 | 27,091 |
| | SM Energy Co. | 1,371,955 | 26,973 |
| | Chesapeake Energy Corp. | 5,931,841 | 26,693 |
| ^ | Diamond Offshore Drilling Inc. | 1,243,110 | 26,230 |
| | Delek US Holdings Inc. | 1,052,446 | 25,890 |
| | SemGroup Corp. Class A | 874,516 | 25,238 |
| * | MRC Global Inc. | 1,954,050 | 25,207 |
| | Pattern Energy Group Inc. Class A | 1,124,408 | 23,511 |
| *,^ | Oasis Petroleum Inc. | 2,628,938 | 19,375 |
| *,^ | Laredo Petroleum Inc. | 2,371,685 | 18,950 |
| | Bristow Group Inc. | 665,541 | 17,237 |
| * | Rice Energy Inc. | 1,505,916 | 16,414 |
| * | SEACOR Holdings Inc. | 310,885 | 16,340 |
| * | McDermott International Inc. | 4,795,306 | 16,064 |
| | RPC Inc. | 1,308,112 | 15,632 |
| * | Forum Energy Technologies Inc. | 1,177,932 | 14,677 |
| | California Resources Corp. | 6,205,343 | 14,458 |
| ^ | Denbury Resources Inc. | 7,133,596 | 14,410 |
| | CVR Energy Inc. | 349,063 | 13,736 |
| ^ | Atwood Oceanics Inc. | 1,233,894 | 12,623 |
| * | Unit Corp. | 1,012,723 | 12,355 |
| *,^ | Flotek Industries Inc. | 1,021,209 | 11,683 |
| * | TETRA Technologies Inc. | 1,529,646 | 11,503 |
| * | Chart Industries Inc. | 614,048 | 11,028 |
| * | Exterran Corp. | 663,262 | 10,645 |
| * | Helix Energy Solutions Group Inc. | 1,914,355 | 10,069 |
| * | Archrock Inc. | 1,325,525 | 9,968 |
| | Alon USA Energy Inc. | 638,990 | 9,483 |
| * | Newpark Resources Inc. | 1,606,633 | 8,483 |
| | Green Plains Inc. | 347,504 | 7,958 |
| *,^ | Ultra Petroleum Corp. | 2,926,294 | 7,316 |
| | CARBO Ceramics Inc. | 396,356 | 6,817 |
| ^ | Tidewater Inc. | 941,594 | 6,553 |
| * | Hornbeck Offshore Services Inc. | 648,430 | 6,445 |
| | Tesco Corp. | 743,850 | 5,385 |
| *,^ | C&J Energy Services Ltd. | 1,089,050 | 5,184 |
| *,^ | Sanchez Energy Corp. | 1,116,207 | 4,811 |
| * | Stone Energy Corp. | 1,091,170 | 4,681 |
| * | Parker Drilling Co. | 2,343,065 | 4,264 |
| * | Bonanza Creek Energy Inc. | 798,031 | 4,206 |
| *,^ | Northern Oil and Gas Inc. | 1,051,719 | 4,060 |
| *,^ | Bill Barrett Corp. | 1,002,341 | 3,939 |
| * | Clayton Williams Energy Inc. | 121,902 | 3,605 |
| *,^ | EP Energy Corp. Class A | 749,075 | 3,281 |
| *,^ | Halcon Resources Corp. | 1,639,391 | 2,066 |
| *,^ | EXCO Resources Inc. | 1,523,140 | 1,889 |
| *,^ | Eclipse Resources Corp. | 896,145 | 1,631 |
| * | Jones Energy Inc. Class A | 365,336 | 1,407 |
| *,^ | SandRidge Energy Inc. | 5,789,959 | 1,158 |
20
| | | |
| Vanguard® Small-Cap Index Fund | | |
| Schedule of Investments | | |
| December 31, 2015 | | |
| |
| | | | Market |
| | | | Value |
| | | Shares | ($000) |
| *,^ | W&T Offshore Inc. | 341,934 | 790 |
| * | Pioneer Energy Services Corp. | 70,137 | 152 |
| *,^ | Gulfmark Offshore Inc. | 14,905 | 70 |
| | | | 1,838,678 |
| Other (0.0%)2 | | |
| * | Leap Wireless International Inc CVR | 938,827 | 2,366 |
| * | Clinical Data Contingent Value Rights | 297,875 | — |
| *,^ | Magnum Hunter Resources Corp. Warrants Expire 4/15/2016 | 241,907 | — |
| | | | 2,366 |
| Technology (12.1%) | | |
| | CDW Corp. | 3,024,983 | 127,170 |
| *,^ | athenahealth Inc. | 775,613 | 124,850 |
| * | Cadence Design Systems Inc. | 5,941,510 | 123,643 |
| | SS&C Technologies Holdings Inc. | 1,651,057 | 112,718 |
| * | Tyler Technologies Inc. | 610,211 | 106,372 |
| * | Ultimate Software Group Inc. | 543,828 | 106,324 |
| * | Manhattan Associates Inc. | 1,459,450 | 96,572 |
| | IAC/InterActiveCorp | 1,541,998 | 92,597 |
| * | Fortinet Inc. | 2,924,554 | 91,158 |
| | Ingram Micro Inc. | 2,989,047 | 90,807 |
| * | Guidewire Software Inc. | 1,418,472 | 85,335 |
| | Teradyne Inc. | 4,105,358 | 84,858 |
| | Pitney Bowes Inc. | 3,937,227 | 81,304 |
| | Leidos Holdings Inc. | 1,439,388 | 80,980 |
| * | ON Semiconductor Corp. | 8,243,193 | 80,783 |
| * | ARRIS Group Inc. | 2,637,366 | 80,624 |
| * | PTC Inc. | 2,288,463 | 79,250 |
| *,^ | NCR Corp. | 3,223,929 | 78,857 |
| * | Integrated Device Technology Inc. | 2,931,742 | 77,251 |
| | Brocade Communications Systems Inc. | 8,284,023 | 76,047 |
| | j2 Global Inc. | 921,105 | 75,825 |
| | CDK Global Inc. | 1,592,788 | 75,610 |
| | DST Systems Inc. | 656,554 | 74,887 |
| | Solera Holdings Inc. | 1,343,664 | 73,673 |
| * | SolarWinds Inc. | 1,219,639 | 71,837 |
| * | Cavium Inc. | 1,062,346 | 69,807 |
| | Atmel Corp. | 7,983,413 | 68,737 |
| * | EPAM Systems Inc. | 849,300 | 66,772 |
| * | CommScope Holding Co. Inc. | 2,478,001 | 64,155 |
| * | Aspen Technology Inc. | 1,665,203 | 62,878 |
| * | Microsemi Corp. | 1,927,066 | 62,803 |
| | Cypress Semiconductor Corp. | 6,340,767 | 62,203 |
| | Blackbaud Inc. | 937,733 | 61,759 |
| * | VeriFone Systems Inc. | 2,183,402 | 61,179 |
| * | Qlik Technologies Inc. | 1,864,976 | 59,045 |
| | Fair Isaac Corp. | 621,356 | 58,519 |
| * | Synaptics Inc. | 724,469 | 58,204 |
| * | Allscripts Healthcare Solutions Inc. | 3,779,236 | 58,125 |
| *,^ | Arista Networks Inc. | 745,105 | 57,999 |
| * | NetScout Systems Inc. | 1,883,003 | 57,808 |
| * | Ciena Corp. | 2,694,301 | 55,745 |
| * | Cree Inc. | 2,060,371 | 54,950 |
| | SYNNEX Corp. | 593,425 | 53,367 |
| * | ViaSat Inc. | 873,393 | 53,286 |
| * | Medidata Solutions Inc. | 1,046,994 | 51,606 |
| * | ACI Worldwide Inc. | 2,353,927 | 50,374 |
| * | Verint Systems Inc. | 1,239,297 | 50,266 |
| * | Infinera Corp. | 2,755,101 | 49,922 |
| * | Proofpoint Inc. | 767,810 | 49,915 |
| * | Tableau Software Inc. Class A | 522,856 | 49,264 |
| * | Fairchild Semiconductor International Inc. Class A | 2,257,234 | 46,747 |
| * | PMC-Sierra Inc. | 3,955,861 | 45,967 |
| | Computer Sciences Corp. | 1,381,192 | 45,137 |
| | Monolithic Power Systems Inc. | 707,920 | 45,102 |
21
| | | |
| Vanguard® Small-Cap Index Fund | | |
| Schedule of Investments | | |
| December 31, 2015 | | |
| |
| | | | Market |
| | | | Value |
| | | Shares | ($000) |
| * | CACI International Inc. Class A | 482,503 | 44,767 |
| * | Electronics For Imaging Inc. | 954,919 | 44,633 |
| * | Tech Data Corp. | 667,947 | 44,338 |
| | Mentor Graphics Corp. | 2,347,126 | 43,234 |
| * | Dycom Industries Inc. | 615,194 | 43,039 |
| | Lexmark International Inc. Class A | 1,243,156 | 40,340 |
| * | Veeva Systems Inc. Class A | 1,359,288 | 39,216 |
| * | Fleetmatics Group plc | 755,192 | 38,356 |
| * | Silicon Laboratories Inc. | 788,826 | 38,290 |
| | MKS Instruments Inc. | 1,060,007 | 38,160 |
| * | Cirrus Logic Inc. | 1,281,909 | 37,855 |
| * | Zendesk Inc. | 1,411,745 | 37,327 |
| * | Entegris Inc. | 2,797,862 | 37,128 |
| * | Demandware Inc. | 683,496 | 36,888 |
| *,^ | Advanced Micro Devices Inc. | 12,639,220 | 36,275 |
| | Science Applications International Corp. | 789,450 | 36,141 |
| | Diebold Inc. | 1,179,790 | 35,500 |
| * | EchoStar Corp. Class A | 901,519 | 35,258 |
| * | Teradata Corp. | 1,328,748 | 35,106 |
| * | OmniVision Technologies Inc. | 1,202,385 | 34,893 |
| * | MedAssets Inc. | 1,121,143 | 34,688 |
| | InterDigital Inc. | 704,798 | 34,563 |
| * | Ellie Mae Inc. | 567,397 | 34,174 |
| | Intersil Corp. Class A | 2,667,957 | 34,043 |
| * | Cornerstone OnDemand Inc. | 982,956 | 33,942 |
| * | MicroStrategy Inc. Class A | 188,383 | 33,775 |
| * | Polycom Inc. | 2,636,485 | 33,193 |
| * | LogMeIn Inc. | 476,445 | 31,970 |
| * | CommVault Systems Inc. | 811,648 | 31,938 |
| | Plantronics Inc. | 670,448 | 31,793 |
| * | Finisar Corp. | 2,147,210 | 31,220 |
| * | Syntel Inc. | 676,628 | 30,617 |
| *,^ | SunEdison Inc. | 6,011,516 | 30,599 |
| | Tessera Technologies Inc. | 1,015,868 | 30,486 |
| * | FireEye Inc. | 1,444,697 | 29,963 |
| * | Paycom Software Inc. | 775,406 | 29,179 |
| * | Rackspace Hosting Inc. | 1,144,647 | 28,983 |
| * | Viavi Solutions Inc. | 4,748,880 | 28,921 |
| | Cogent Communications Holdings Inc. | 809,450 | 28,080 |
| * | Rambus Inc. | 2,342,976 | 27,155 |
| * | HubSpot Inc. | 470,493 | 26,494 |
| * | Synchronoss Technologies Inc. | 746,351 | 26,294 |
| | Power Integrations Inc. | 537,629 | 26,145 |
| * | Rovi Corp. | 1,563,448 | 26,047 |
| * | NETGEAR Inc. | 595,855 | 24,972 |
| | NIC Inc. | 1,257,009 | 24,738 |
| * | Semtech Corp. | 1,299,671 | 24,590 |
| * | Progress Software Corp. | 949,798 | 22,795 |
| * | RealPage Inc. | 1,014,201 | 22,769 |
| * | Bottomline Technologies de Inc. | 762,816 | 22,679 |
| * | RingCentral Inc. Class A | 960,649 | 22,652 |
| * | Envestnet Inc. | 757,573 | 22,614 |
| | CSG Systems International Inc. | 623,941 | 22,449 |
| * | Advanced Energy Industries Inc. | 785,962 | 22,188 |
| | West Corp. | 1,002,464 | 21,623 |
| * | Marketo Inc. | 728,807 | 20,924 |
| * | Lumentum Holdings Inc. | 937,732 | 20,649 |
| * | Cvent Inc. | 584,427 | 20,402 |
| * | Cabot Microelectronics Corp. | 465,899 | 20,397 |
| * | QLogic Corp. | 1,669,092 | 20,363 |
| * | BroadSoft Inc. | 573,763 | 20,288 |
| * | Infoblox Inc. | 1,074,246 | 19,755 |
| * | Web.com Group Inc. | 981,206 | 19,634 |
| * | Inphi Corp. | 703,111 | 18,998 |
22
| | | |
| Vanguard® Small-Cap Index Fund | | |
| Schedule of Investments | | |
| December 31, 2015 | | |
| |
| | | | Market |
| | | | Value |
| | | Shares | ($000) |
| | Pegasystems Inc. | 690,724 | 18,995 |
| | Monotype Imaging Holdings Inc. | 801,445 | 18,946 |
| * | Ixia | 1,521,220 | 18,909 |
| * | Insight Enterprises Inc. | 745,093 | 18,717 |
| * | Super Micro Computer Inc. | 759,299 | 18,610 |
| *,^ | 3D Systems Corp. | 2,136,377 | 18,565 |
| *,^ | Gogo Inc. | 1,033,373 | 18,394 |
| * | Ruckus Wireless Inc. | 1,671,638 | 17,903 |
| | ADTRAN Inc. | 1,002,549 | 17,264 |
| * | ScanSource Inc. | 532,763 | 17,166 |
| ^ | Ebix Inc. | 519,579 | 17,037 |
| * | Diodes Inc. | 731,826 | 16,817 |
| * | GoDaddy Inc. Class A | 522,468 | 16,750 |
| | Quality Systems Inc. | 1,030,411 | 16,610 |
| *,^ | Ubiquiti Networks Inc. | 505,580 | 16,022 |
| * | InvenSense Inc. | 1,556,927 | 15,927 |
| * | New Relic Inc. | 433,581 | 15,795 |
| * | Lattice Semiconductor Corp. | 2,361,409 | 15,278 |
| | Brooks Automation Inc. | 1,287,440 | 13,750 |
| * | Endurance International Group Holdings Inc. | 1,231,292 | 13,458 |
| * | Gigamon Inc. | 504,602 | 13,407 |
| * | Cray Inc. | 389,329 | 12,634 |
| * | Mercury Systems Inc. | 656,580 | 12,055 |
| *,^ | Shutterstock Inc. | 361,612 | 11,695 |
| * | Amkor Technology Inc. | 1,906,332 | 11,591 |
| * | Xura Inc. | 452,597 | 11,125 |
| * | Unisys Corp. | 1,001,254 | 11,064 |
| * | Virtusa Corp. | 266,886 | 11,033 |
| * | Interactive Intelligence Group Inc. | 348,346 | 10,945 |
| | Computer Programs & Systems Inc. | 214,501 | 10,671 |
| * | FormFactor Inc. | 1,167,076 | 10,504 |
| * | Loral Space & Communications Inc. | 257,670 | 10,490 |
| * | Ultratech Inc. | 522,941 | 10,365 |
| *,^ | Hortonworks Inc. | 461,622 | 10,110 |
| * | CEVA Inc. | 406,688 | 9,500 |
| * | Nimble Storage Inc. | 1,028,266 | 9,460 |
| * | Applied Micro Circuits Corp. | 1,484,452 | 9,456 |
| *,^ | Box Inc. | 655,511 | 9,151 |
| * | Intralinks Holdings Inc. | 988,931 | 8,970 |
| *,^ | Pure Storage Inc. Class A | 569,884 | 8,873 |
| * | Actua Corp. | 738,635 | 8,457 |
| *,^ | Textura Corp. | 389,387 | 8,403 |
| *,^ | Benefitfocus Inc. | 230,689 | 8,395 |
| *,^ | 2U Inc. | 294,795 | 8,248 |
| * | Barracuda Networks Inc. | 427,610 | 7,988 |
| | Epiq Systems Inc. | 598,440 | 7,822 |
| * | Blucora Inc. | 782,062 | 7,664 |
| * | Harmonic Inc. | 1,770,284 | 7,205 |
| * | LivePerson Inc. | 1,035,011 | 6,986 |
| * | Sonus Networks Inc. | 945,357 | 6,740 |
| * | Calix Inc. | 833,697 | 6,561 |
| * | Tangoe Inc. | 748,200 | 6,277 |
| | Comtech Telecommunications Corp. | 307,078 | 6,169 |
| | Forrester Research Inc. | 197,598 | 5,628 |
| *,^ | OPOWER Inc. | 464,327 | 4,903 |
| * | Jive Software Inc. | 931,685 | 3,801 |
| *,^ | Castlight Health Inc. Class B | 759,616 | 3,244 |
| *,^ | Rapid7 Inc. | 206,795 | 3,129 |
| * | ChannelAdvisor Corp. | 215,112 | 2,979 |
| * | MobileIron Inc. | 790,047 | 2,852 |
| * | Systemax Inc. | 260,147 | 2,237 |
| * | Quantum Corp. | 2,373,939 | 2,208 |
| * | Match Group Inc. | 103,992 | 1,409 |
| * | Rocket Fuel Inc. | 236,414 | 825 |
23
| | | |
| Vanguard® Small-Cap Index Fund | | |
| Schedule of Investments | | |
| December 31, 2015 | | |
| |
| | | | Market |
| | | | Value |
| | | Shares | ($000) |
| * | Pendrell Corp. | 1,606,564 | 805 |
| * | Square Inc. | 5,940 | 78 |
| * | Piksel Inc. | 241 | — |
| | | | 6,512,483 |
| Telecommunications (0.3%) | | |
| | Telephone & Data Systems Inc. | 1,819,265 | 47,101 |
| * | Vonage Holdings Corp. | 3,649,558 | 20,949 |
| | Consolidated Communications Holdings Inc. | 964,117 | 20,198 |
| | Atlantic Tele-Network Inc. | 214,208 | 16,758 |
| | EarthLink Holdings Corp. | 2,080,532 | 15,458 |
| * | Cincinnati Bell Inc. | 4,216,379 | 15,179 |
| *,^ | Iridium Communications Inc. | 1,618,180 | 13,609 |
| ^ | Windstream Holdings Inc. | 2,085,774 | 13,432 |
| *,^ | Globalstar Inc. | 8,086,572 | 11,645 |
| * | United States Cellular Corp. | 257,754 | 10,519 |
| *,^ | Intelsat SA | 531,102 | 2,209 |
| | | | 187,057 |
| Utilities (4.3%) | | |
| | AGL Resources Inc. | 2,401,674 | 153,251 |
| | Atmos Energy Corp. | 2,027,541 | 127,816 |
| | TECO Energy Inc. | 4,698,471 | 125,214 |
| | ITC Holdings Corp. | 3,064,601 | 120,286 |
| | Westar Energy Inc. Class A | 2,823,125 | 119,729 |
| | UGI Corp. | 3,451,012 | 116,506 |
| | Aqua America Inc. | 3,523,968 | 105,014 |
| | Piedmont Natural Gas Co. Inc. | 1,582,079 | 90,210 |
| | Great Plains Energy Inc. | 3,083,290 | 84,205 |
| | Vectren Corp. | 1,652,575 | 70,102 |
| | IDACORP Inc. | 1,005,856 | 68,398 |
| | Questar Corp. | 3,495,956 | 68,101 |
| | Portland General Electric Co. | 1,774,917 | 64,554 |
| | Cleco Corp. | 1,209,316 | 63,138 |
| | WGL Holdings Inc. | 996,413 | 62,764 |
| | Hawaiian Electric Industries Inc. | 2,148,544 | 62,200 |
| | New Jersey Resources Corp. | 1,715,417 | 56,540 |
| | NorthWestern Corp. | 962,059 | 52,192 |
| | ONE Gas Inc. | 1,038,126 | 52,083 |
| | ALLETE Inc. | 974,583 | 49,538 |
| | Southwest Gas Corp. | 895,674 | 49,405 |
| | Laclede Group Inc. | 819,684 | 48,697 |
| | PNM Resources Inc. | 1,585,469 | 48,468 |
| | Black Hills Corp. | 1,002,199 | 46,532 |
| | Avista Corp. | 1,178,190 | 41,673 |
| | NRG Energy Inc. | 3,138,796 | 36,944 |
| | National Fuel Gas Co. | 803,286 | 34,341 |
| | South Jersey Industries Inc. | 1,383,274 | 32,535 |
| | MGE Energy Inc. | 699,727 | 32,467 |
| * | Dynegy Inc. | 2,399,712 | 32,156 |
| | El Paso Electric Co. | 815,967 | 31,415 |
| | American States Water Co. | 731,054 | 30,668 |
| | Northwest Natural Gas Co. | 551,753 | 27,924 |
| | Ormat Technologies Inc. | 691,555 | 25,221 |
| | Empire District Electric Co. | 878,516 | 24,660 |
| * | Avangrid Inc. | 616,557 | 23,676 |
| | California Water Service Group | 961,552 | 22,375 |
| | TerraForm Power Inc. Class A | 1,523,445 | 19,165 |
| * | Talen Energy Corp. | 1,676,289 | 10,443 |
| *,^ | Sunrun Inc. | 388,929 | 4,578 |
| * | Vivint Solar Inc. | 427,854 | 4,090 |
| | Atlantic Power Corp. | 1,098,563 | 2,164 |
| |
| | | | 2,341,438 |
| Total Common Stocks (Cost $45,856,081) | | 53,679,805 |
24
| | | | | |
| Vanguard® Small-Cap Index Fund | | | | |
| Schedule of Investments | | | | |
| December 31, 2015 | | | | |
| |
| | | | | | Market |
| | | | | | Value |
| | | Coupon | | Shares | ($000) |
| Temporary Cash Investments (2.2%)1 | | | | |
| Money Market Fund (2.2%) | | | | |
| 3,4 | Vanguard Market Liquidity Fund | 0.363% | | 1,171,603,570 | 1,171,604 |
| |
| |
| | | | | Face | |
| | | | Maturity | Amount | |
| | | | Date | ($000) | |
| U.S. Government and Agency Obligations (0.0%) | | | | |
| 5,6 | Federal Home Loan Bank Discount Notes | 0.331% | 4/13/16 | 620 | 619 |
| 5,6 | Federal Home Loan Bank Discount Notes | 0.391% | 5/27/16 | 1,000 | 998 |
| 5,6 | Federal Home Loan Bank Discount Notes | 0.572% | 6/22/16 | 5,000 | 4,987 |
| 6 | United States Treasury Bill | 0.536% | 6/9/16 | 1,000 | 998 |
| 6 | United States Treasury Note/Bond | 0.375% | 5/31/16 | 5,000 | 4,998 |
| |
| | | | | | 12,600 |
| |
| Total Temporary Cash Investments (Cost $1,184,205) | | | | 1,184,204 |
| |
| Total Investments (101.7%) (Cost $47,040,286) | | | | 54,864,009 |
| Other Assets and Liabilities—Net (-1.7%)4 | | | | (926,868) |
| Net Assets (100%) | | | | 53,937,141 |
* Non-income-producing security.
^ Includes partial security positions on loan to broker-dealers. The total value of securities on loan is $875,518,000.
1 The fund invests a portion of its cash reserves in equity markets through the use of index futures contracts and swap contracts. After giving effect to futures and swap investments, the fund's effective common stock and temporary cash investment positions represent 100.0% and 1.7%, respectively, of net assets.
2 “Other” represents securities that are not classified by the fund’s benchmark index.
3 Affiliated money market fund available only to Vanguard funds and certain trusts and accounts managed by Vanguard. Rate shown is the 7-day yield.
4 Includes $932,404,000 of collateral received for securities on loan.
5 The issuer operates under a congressional charter; its securities are generally neither guaranteed by the U.S. Treasury nor backed by the full faith and credit of the U.S. government.
6 Securities with a value of $9,886,000 have been segregated as initial margin for open futures contracts.
REIT—Real Estate Investment Trust.
25
| | | |
| Vanguard® Small-Cap Growth Index Fund | | |
| Schedule of Investments | | |
| December 31, 2015 | | |
| |
| | | | Market |
| | | | Value |
| | | Shares | ($000) |
| |
| Common Stocks (99.9%)1 | | |
| Basic Materials (1.5%) | | |
| | NewMarket Corp. | 125,079 | 47,621 |
| | Royal Gold Inc. | 801,555 | 29,233 |
| | KapStone Paper and Packaging Corp. | 1,063,596 | 24,027 |
| | Balchem Corp. | 386,649 | 23,508 |
| * | Platform Specialty Products Corp. | 1,423,640 | 18,265 |
| * | Cambrex Corp. | 387,258 | 18,236 |
| | US Silica Holdings Inc. | 654,174 | 12,253 |
| | Calgon Carbon Corp. | 630,936 | 10,884 |
| | Minerals Technologies Inc. | 213,128 | 9,774 |
| | Deltic Timber Corp. | 137,398 | 8,089 |
| * | Stillwater Mining Co. | 741,552 | 6,355 |
| * | Ferro Corp. | 534,850 | 5,948 |
| | American Vanguard Corp. | 343,356 | 4,810 |
| * | Globe Specialty Metals Inc. | 405,430 | 4,358 |
| * | Coeur Mining Inc. | 1,697,970 | 4,211 |
| * | Fairmount Santrol Holdings Inc. | 397,534 | 934 |
| *,^ | Horsehead Holding Corp. | 353,790 | 725 |
| * | LSB Industries Inc. | 59,196 | 429 |
| | | | 229,660 |
| Consumer Goods (8.2%) | | |
| * | Middleby Corp. | 703,886 | 75,928 |
| * | Toll Brothers Inc. | 1,948,209 | 64,875 |
| | Gentex Corp. | 3,559,142 | 56,982 |
| | Brunswick Corp. | 1,118,244 | 56,482 |
| | Carter's Inc. | 606,280 | 53,977 |
| * | Tempur Sealy International Inc. | 764,391 | 53,859 |
| * | Hain Celestial Group Inc. | 1,263,872 | 51,048 |
| * | Skechers U.S.A. Inc. Class A | 1,596,252 | 48,223 |
| | Flowers Foods Inc. | 2,214,037 | 47,580 |
| * | Post Holdings Inc. | 762,095 | 47,021 |
| * | WhiteWave Foods Co. Class A | 1,082,357 | 42,115 |
| | Pool Corp. | 496,876 | 40,138 |
| | CalAtlantic Group Inc. | 965,906 | 36,627 |
| * | Kate Spade & Co. | 1,566,755 | 27,841 |
| * | Zynga Inc. Class A | 9,310,770 | 24,953 |
| | B&G Foods Inc. | 712,145 | 24,939 |
| | Vector Group Ltd. | 1,052,692 | 24,833 |
| * | TRI Pointe Group Inc. | 1,786,171 | 22,631 |
| * | Boston Beer Co. Inc. Class A | 111,338 | 22,480 |
| * | G-III Apparel Group Ltd. | 499,362 | 22,102 |
| | J&J Snack Foods Corp. | 183,483 | 21,407 |
| * | Gentherm Inc. | 444,475 | 21,068 |
| * | Steven Madden Ltd. | 691,756 | 20,905 |
| * | Dorman Products Inc. | 392,478 | 18,631 |
| *,^ | GoPro Inc. Class A | 997,966 | 17,973 |
| * | Deckers Outdoor Corp. | 376,714 | 17,781 |
| * | Take-Two Interactive Software Inc. | 493,060 | 17,178 |
| | Drew Industries Inc. | 281,577 | 17,145 |
| | WD-40 Co. | 167,487 | 16,523 |
| * | Meritage Homes Corp. | 462,909 | 15,734 |
| | Interface Inc. Class A | 767,574 | 14,691 |
| *,^ | Wayfair Inc. | 300,811 | 14,325 |
| | Lancaster Colony Corp. | 117,695 | 13,589 |
| * | Select Comfort Corp. | 620,646 | 13,288 |
| * | Diamond Foods Inc. | 328,122 | 12,649 |
| | MDC Holdings Inc. | 479,268 | 12,236 |
| * | iRobot Corp. | 338,471 | 11,982 |
| * | Tumi Holdings Inc. | 707,036 | 11,758 |
| | Oxford Industries Inc. | 182,970 | 11,677 |
| | Wolverine World Wide Inc. | 599,841 | 10,023 |
| * | TiVo Inc. | 1,141,228 | 9,849 |
26
| | | |
| Vanguard® Small-Cap Growth Index Fund | | |
| Schedule of Investments | | |
| December 31, 2015 | | |
| |
| | | | Market |
| | | | Value |
| | | Shares | ($000) |
| | Coca-Cola Bottling Co. Consolidated | 52,293 | 9,544 |
| *,^ | Blue Buffalo Pet Products Inc. | 481,555 | 9,010 |
| * | USANA Health Sciences Inc. | 70,486 | 9,005 |
| | Columbia Sportswear Co. | 173,350 | 8,453 |
| * | Boulder Brands Inc. | 719,765 | 7,903 |
| | Phibro Animal Health Corp. Class A | 221,649 | 6,678 |
| * | National Beverage Corp. | 143,114 | 6,503 |
| * | RealD Inc. | 564,609 | 5,957 |
| * | DTS Inc. | 212,354 | 4,795 |
| * | Revlon Inc. Class A | 129,697 | 3,611 |
| | Metaldyne Performance Group Inc. | 160,332 | 2,940 |
| *,^ | Amplify Snack Brands Inc. | 140,717 | 1,621 |
| | | | 1,241,066 |
| Consumer Services (14.1%) | | |
| | Domino's Pizza Inc. | 671,241 | 74,676 |
| | Vail Resorts Inc. | 448,780 | 57,439 |
| * | Panera Bread Co. Class A | 292,116 | 56,898 |
| * | AMC Networks Inc. Class A | 748,216 | 55,877 |
| * | Sally Beauty Holdings Inc. | 1,864,731 | 52,007 |
| | Six Flags Entertainment Corp. | 930,861 | 51,141 |
| *,^ | Copart Inc. | 1,328,390 | 50,492 |
| | Dunkin' Brands Group Inc. | 1,137,454 | 48,444 |
| * | Sprouts Farmers Market Inc. | 1,679,094 | 44,647 |
| * | Live Nation Entertainment Inc. | 1,739,047 | 42,728 |
| * | Madison Square Garden Co. Class A | 251,155 | 40,637 |
| * | Burlington Stores Inc. | 933,171 | 40,033 |
| | Dick's Sporting Goods Inc. | 1,105,659 | 39,085 |
| | Lions Gate Entertainment Corp. | 1,186,926 | 38,445 |
| | Sabre Corp. | 1,363,356 | 38,133 |
| * | Buffalo Wild Wings Inc. | 233,828 | 37,331 |
| * | Restoration Hardware Holdings Inc. | 468,830 | 37,249 |
| *,^ | SolarCity Corp. | 718,815 | 36,674 |
| * | Spirit Airlines Inc. | 878,122 | 34,993 |
| * | Bright Horizons Family Solutions Inc. | 520,361 | 34,760 |
| | Jack in the Box Inc. | 439,675 | 33,727 |
| * | Pandora Media Inc. | 2,488,906 | 33,376 |
| | Rollins Inc. | 1,207,173 | 31,266 |
| * | ServiceMaster Global Holdings Inc. | 790,057 | 31,002 |
| * | Cabela's Inc. | 595,288 | 27,818 |
| | Allegiant Travel Co. Class A | 165,308 | 27,744 |
| | Texas Roadhouse Inc. Class A | 775,387 | 27,736 |
| * | Urban Outfitters Inc. | 1,118,357 | 25,443 |
| | Cheesecake Factory Inc. | 543,080 | 25,041 |
| | Monro Muffler Brake Inc. | 372,711 | 24,681 |
| | Churchill Downs Inc. | 172,654 | 24,429 |
| * | Yelp Inc. Class A | 809,983 | 23,327 |
| * | Grand Canyon Education Inc. | 578,260 | 23,200 |
| * | United Natural Foods Inc. | 585,186 | 23,033 |
| * | DreamWorks Animation SKG Inc. Class A | 862,508 | 22,227 |
| * | Pinnacle Entertainment Inc. | 709,659 | 22,085 |
| * | Ascena Retail Group Inc. | 2,155,009 | 21,227 |
| * | WebMD Health Corp. | 437,421 | 21,127 |
| | Nexstar Broadcasting Group Inc. Class A | 356,750 | 20,941 |
| * | Five Below Inc. | 635,251 | 20,392 |
| | Papa John's International Inc. | 359,456 | 20,083 |
| | PriceSmart Inc. | 240,585 | 19,966 |
| * | Michaels Cos. Inc. | 893,745 | 19,761 |
| | HSN Inc. | 386,742 | 19,596 |
| | Sotheby's | 737,627 | 19,001 |
| | Sonic Corp. | 579,964 | 18,739 |
| * | Media General Inc. | 1,097,852 | 17,730 |
| *,^ | GrubHub Inc. | 729,164 | 17,646 |
| | Morningstar Inc. | 216,963 | 17,446 |
| * | Shutterfly Inc. | 387,698 | 17,276 |
27
| | | |
| Vanguard® Small-Cap Growth Index Fund | | |
| Schedule of Investments | | |
| December 31, 2015 | | |
| |
| | | | Market |
| | | | Value |
| | | Shares | ($000) |
| * | Dave & Buster's Entertainment Inc. | 407,879 | 17,025 |
| * | comScore Inc. | 406,694 | 16,735 |
| * | Diplomat Pharmacy Inc. | 474,341 | 16,232 |
| * | Groupon Inc. Class A | 5,252,803 | 16,126 |
| * | Popeyes Louisiana Kitchen Inc. | 275,527 | 16,118 |
| | GNC Holdings Inc. Class A | 506,715 | 15,718 |
| * | La Quinta Holdings Inc. | 1,112,747 | 15,144 |
| * | Penn National Gaming Inc. | 886,544 | 14,202 |
| | Marriott Vacations Worldwide Corp. | 247,607 | 14,101 |
| | Extended Stay America Inc. | 878,569 | 13,969 |
| | ClubCorp Holdings Inc. | 753,833 | 13,773 |
| *,^ | Diamond Resorts International Inc. | 527,170 | 13,448 |
| | EW Scripps Co. Class A | 705,218 | 13,399 |
| * | Fresh Market Inc. | 536,122 | 12,556 |
| | Bloomin' Brands Inc. | 734,193 | 12,401 |
| * | Krispy Kreme Doughnuts Inc. | 771,180 | 11,622 |
| * | Constant Contact Inc. | 391,306 | 11,442 |
| | National CineMedia Inc. | 716,169 | 11,251 |
| * | Fiesta Restaurant Group Inc. | 328,920 | 11,052 |
| * | Hawaiian Holdings Inc. | 309,663 | 10,940 |
| * | BJ's Restaurants Inc. | 247,270 | 10,749 |
| | DSW Inc. Class A | 447,314 | 10,673 |
| *,^ | Mattress Firm Holding Corp. | 237,443 | 10,597 |
| * | Belmond Ltd. Class A | 1,066,066 | 10,128 |
| * | Stamps.com Inc. | 91,601 | 10,040 |
| | Choice Hotels International Inc. | 190,896 | 9,623 |
| * | Caesars Acquisition Co. Class A | 1,347,995 | 9,180 |
| * | Francesca's Holdings Corp. | 522,013 | 9,088 |
| * | MSG Networks Inc. | 425,658 | 8,854 |
| * | Hibbett Sports Inc. | 292,401 | 8,842 |
| | Chico's FAS Inc. | 811,200 | 8,655 |
| *,^ | Conn's Inc. | 335,327 | 7,870 |
| *,^ | Virgin America Inc. | 215,544 | 7,762 |
| | Interval Leisure Group Inc. | 495,501 | 7,735 |
| ^ | World Wrestling Entertainment Inc. Class A | 377,077 | 6,727 |
| | AMC Entertainment Holdings Inc. | 265,711 | 6,377 |
| *,^ | TrueCar Inc. | 660,280 | 6,299 |
| * | Tile Shop Holdings Inc. | 377,128 | 6,185 |
| *,^ | Etsy Inc. | 711,442 | 5,877 |
| * | Vitamin Shoppe Inc. | 179,046 | 5,855 |
| * | Global Eagle Entertainment Inc. | 576,855 | 5,694 |
| * | Scientific Games Corp. Class A | 633,230 | 5,680 |
| *,^ | Quotient Technology Inc. | 820,030 | 5,593 |
| *,^ | Lumber Liquidators Holdings Inc. | 318,358 | 5,527 |
| | New Media Investment Group Inc. | 262,563 | 5,109 |
| * | RetailMeNot Inc. | 513,456 | 5,093 |
| * | Angie's List Inc. | 540,096 | 5,050 |
| * | Blue Nile Inc. | 134,116 | 4,980 |
| * | Party City Holdco Inc. | 363,843 | 4,697 |
| * | Bankrate Inc. | 333,511 | 4,436 |
| * | Potbelly Corp. | 295,853 | 3,464 |
| * | El Pollo Loco Holdings Inc. | 259,047 | 3,272 |
| *,^ | Habit Restaurants Inc. Class A | 140,237 | 3,234 |
| *,^ | Clean Energy Fuels Corp. | 842,804 | 3,034 |
| * | Caesars Entertainment Corp. | 359,637 | 2,838 |
| *,^ | Planet Fitness Inc. Class A | 179,492 | 2,805 |
| *,^ | Shake Shack Inc. Class A | 55,680 | 2,205 |
| * | Biglari Holdings Inc. | 6,445 | 2,100 |
| * | Wingstop Inc. | 89,365 | 2,038 |
| * | Ollie's Bargain Outlet Holdings Inc. | 109,635 | 1,865 |
| * | Zumiez Inc. | 113,984 | 1,723 |
| *,^ | Container Store Group Inc. | 207,538 | 1,702 |
| *,^ | Noodles & Co. Class A | 159,872 | 1,549 |
| *,^ | Bojangles' Inc. | 89,601 | 1,422 |
28
| | | |
| Vanguard® Small-Cap Growth Index Fund | | |
| Schedule of Investments | | |
| December 31, 2015 | | |
| |
| | | | Market |
| | | | Value |
| | | Shares | ($000) |
| * | Ascent Capital Group Inc. Class A | 71,126 | 1,189 |
| | Expedia Inc. | 87 | 11 |
| * | Genesco Inc. | 112 | 6 |
| | | | 2,139,441 |
| Financials (21.4%) | | |
| * | Signature Bank | 586,914 | 90,015 |
| | Regency Centers Corp. | 1,156,126 | 78,755 |
| * | SVB Financial Group | 632,383 | 75,190 |
| | Kilroy Realty Corp. | 1,132,286 | 71,651 |
| | WP Carey Inc. | 1,153,626 | 68,064 |
| | CBOE Holdings Inc. | 1,012,409 | 65,705 |
| * | Forest City Enterprises Inc. Class A | 2,957,792 | 64,864 |
| | DDR Corp. | 3,780,036 | 63,656 |
| | Equity LifeStyle Properties Inc. | 931,528 | 62,105 |
| | CubeSmart | 2,012,363 | 61,619 |
| | Lamar Advertising Co. Class A | 1,006,598 | 60,376 |
| | American Campus Communities Inc. | 1,379,291 | 57,020 |
| | Douglas Emmett Inc. | 1,712,205 | 53,387 |
| | Investors Bancorp Inc. | 4,030,225 | 50,136 |
| * | Howard Hughes Corp. | 431,598 | 48,840 |
| | MarketAxess Holdings Inc. | 435,039 | 48,546 |
| | Sovran Self Storage Inc. | 444,067 | 47,653 |
| | Duke Realty Corp. | 2,119,593 | 44,554 |
| | Healthcare Trust of America Inc. Class A | 1,559,958 | 42,072 |
| | Mid-America Apartment Communities Inc. | 462,888 | 42,035 |
| | Sun Communities Inc. | 608,274 | 41,685 |
| * | Western Alliance Bancorp | 1,130,501 | 40,540 |
| | DCT Industrial Trust Inc. | 1,084,787 | 40,538 |
| | Omega Healthcare Investors Inc. | 1,148,638 | 40,179 |
| | Post Properties Inc. | 664,706 | 39,324 |
| | Tanger Factory Outlet Centers Inc. | 1,176,687 | 38,478 |
| | Paramount Group Inc. | 2,079,864 | 37,646 |
| * | Liberty Ventures Class A | 827,481 | 37,328 |
| | American Homes 4 Rent Class A | 2,164,969 | 36,068 |
| | Healthcare Realty Trust Inc. | 1,235,851 | 34,999 |
| * | Stifel Financial Corp. | 810,794 | 34,345 |
| *,^ | Zillow Group Inc. | 1,456,525 | 34,199 |
| | Medical Properties Trust Inc. | 2,919,971 | 33,609 |
| | Sunstone Hotel Investors Inc. | 2,560,363 | 31,979 |
| | RLJ Lodging Trust | 1,466,817 | 31,727 |
| | Care Capital Properties Inc. | 1,029,243 | 31,464 |
| | Gaming and Leisure Properties Inc. | 1,131,780 | 31,463 |
| | PacWest Bancorp | 701,272 | 30,225 |
| * | Blackhawk Network Holdings Inc. | 670,963 | 29,663 |
| | Home BancShares Inc. | 731,792 | 29,652 |
| | BioMed Realty Trust Inc. | 1,250,316 | 29,620 |
| | CyrusOne Inc. | 772,953 | 28,947 |
| | Urban Edge Properties | 1,219,256 | 28,592 |
| | Acadia Realty Trust | 847,310 | 28,088 |
| * | Texas Capital Bancshares Inc. | 563,085 | 27,828 |
| | Ryman Hospitality Properties Inc. | 535,371 | 27,647 |
| | Communications Sales & Leasing Inc. | 1,477,542 | 27,615 |
| | NorthStar Asset Management Group Inc. | 2,260,279 | 27,440 |
| * | OneMain Holdings Inc. Class A | 659,961 | 27,415 |
| | Kennedy-Wilson Holdings Inc. | 1,123,341 | 27,050 |
| | Kite Realty Group Trust | 1,022,122 | 26,504 |
| | Hudson Pacific Properties Inc. | 933,116 | 26,258 |
| | Equity One Inc. | 953,121 | 25,877 |
| | Spirit Realty Capital Inc. | 2,572,435 | 25,776 |
| | Education Realty Trust Inc. | 679,162 | 25,727 |
| * | Liberty TripAdvisor Holdings Inc. Class A | 837,717 | 25,416 |
| | Colony Capital Inc. Class A | 1,301,589 | 25,355 |
| | Cousins Properties Inc. | 2,633,325 | 24,832 |
| | Pebblebrook Hotel Trust | 881,563 | 24,701 |
29
| | | |
| Vanguard® Small-Cap Growth Index Fund | | |
| Schedule of Investments | | |
| December 31, 2015 | | |
| |
| | | | Market |
| | | | Value |
| | | Shares | ($000) |
| | Bank of the Ozarks Inc. | 487,209 | 24,097 |
| | Evercore Partners Inc. Class A | 436,536 | 23,603 |
| | WisdomTree Investments Inc. | 1,443,125 | 22,628 |
| | Retail Opportunity Investments Corp. | 1,220,584 | 21,848 |
| *,^ | Credit Acceptance Corp. | 101,119 | 21,641 |
| | QTS Realty Trust Inc. Class A | 476,343 | 21,488 |
| | Financial Engines Inc. | 632,063 | 21,282 |
| * | PRA Group Inc. | 591,711 | 20,526 |
| | PS Business Parks Inc. | 232,245 | 20,305 |
| | Alexander & Baldwin Inc. | 569,669 | 20,115 |
| * | Hilltop Holdings Inc. | 971,008 | 18,663 |
| | Outfront Media Inc. | 845,070 | 18,448 |
| | Chesapeake Lodging Trust | 732,763 | 18,436 |
| | LaSalle Hotel Properties | 692,918 | 17,434 |
| | Artisan Partners Asset Management Inc. Class A | 459,073 | 16,554 |
| | Sabra Health Care REIT Inc. | 799,022 | 16,164 |
| | Ramco-Gershenson Properties Trust | 970,951 | 16,127 |
| | Parkway Properties Inc. | 1,026,845 | 16,050 |
| | STAG Industrial Inc. | 836,274 | 15,429 |
| * | FCB Financial Holdings Inc. Class A | 430,397 | 15,404 |
| *,^ | Zillow Group Inc. Class A | 586,627 | 15,276 |
| * | Essent Group Ltd. | 681,582 | 14,920 |
| | Waddell & Reed Financial Inc. Class A | 483,298 | 13,851 |
| | TFS Financial Corp. | 710,508 | 13,379 |
| | LegacyTexas Financial Group Inc. | 525,413 | 13,146 |
| | HFF Inc. Class A | 417,344 | 12,967 |
| | Corporate Office Properties Trust | 579,612 | 12,653 |
| *,^ | St. Joe Co. | 679,866 | 12,584 |
| * | First Cash Financial Services Inc. | 323,714 | 12,117 |
| | Hersha Hospitality Trust Class A | 536,058 | 11,665 |
| | FelCor Lodging Trust Inc. | 1,588,480 | 11,596 |
| | NRG Yield Inc. | 772,627 | 11,404 |
| | Inland Real Estate Corp. | 1,052,177 | 11,174 |
| * | HealthEquity Inc. | 421,005 | 10,555 |
| | New Senior Investment Group Inc. | 1,066,279 | 10,513 |
| | CoreSite Realty Corp. | 178,481 | 10,123 |
| | Starwood Waypoint Residential Trust | 443,280 | 10,036 |
| | Monogram Residential Trust Inc. | 1,021,777 | 9,973 |
| | Alexander's Inc. | 25,107 | 9,644 |
| * | Third Point Reinsurance Ltd. | 711,764 | 9,545 |
| * | Eagle Bancorp Inc. | 184,745 | 9,324 |
| | Capital Bank Financial Corp. | 283,960 | 9,081 |
| | American Assets Trust Inc. | 236,572 | 9,073 |
| | Greenhill & Co. Inc. | 306,074 | 8,757 |
| * | Black Knight Financial Services Inc. Class A | 263,374 | 8,707 |
| * | Encore Capital Group Inc. | 279,351 | 8,123 |
| | InfraREIT Inc. | 427,890 | 7,916 |
| | Cohen & Steers Inc. | 252,154 | 7,686 |
| * | Ocwen Financial Corp. | 1,074,711 | 7,491 |
| *,^ | Nationstar Mortgage Holdings Inc. | 537,889 | 7,192 |
| | Simmons First National Corp. Class A | 138,639 | 7,120 |
| *,^ | BofI Holding Inc. | 328,271 | 6,910 |
| | Moelis & Co. Class A | 236,456 | 6,900 |
| | Silver Bay Realty Trust Corp. | 423,882 | 6,638 |
| | CareTrust REIT Inc. | 563,397 | 6,169 |
| | Virtus Investment Partners Inc. | 50,432 | 5,924 |
| ^ | Seritage Growth Properties Class A | 145,561 | 5,854 |
| | NRG Yield Inc. Class A | 406,377 | 5,653 |
| | Investors Real Estate Trust | 776,778 | 5,399 |
| * | Marcus & Millichap Inc. | 182,461 | 5,317 |
| | Employers Holdings Inc. | 187,212 | 5,111 |
| | Ladder Capital Corp. | 410,674 | 5,101 |
| * | Altisource Portfolio Solutions SA | 164,911 | 4,586 |
| *,^ | On Deck Capital Inc. | 430,871 | 4,438 |
30
| | | |
| Vanguard® Small-Cap Growth Index Fund | | |
| Schedule of Investments | | |
| December 31, 2015 | | |
| |
| | | | Market |
| | | | Value |
| | | Shares | ($000) |
| | Northfield Bancorp Inc. | 240,706 | 3,832 |
| | National Bank Holdings Corp. Class A | 175,784 | 3,756 |
| * | PennyMac Financial Services Inc. Class A | 241,993 | 3,717 |
| * | Tejon Ranch Co. | 178,578 | 3,420 |
| | Urstadt Biddle Properties Inc. Class A | 157,414 | 3,029 |
| | Kearny Financial Corp. | 228,247 | 2,892 |
| * | Forestar Group Inc. | 198,303 | 2,169 |
| * | NewStar Financial Inc. | 230,695 | 2,072 |
| * | Associated Capital Group Inc. Class A | 54,472 | 1,661 |
| | Houlihan Lokey Inc. | 56,972 | 1,493 |
| | GAMCO Investors Inc. Class A | 26,717 | 829 |
| * | PICO Holdings Inc. | 70,317 | 726 |
| | Extra Space Storage Inc. | 623 | 55 |
| * | E*TRADE Financial Corp. | 745 | 22 |
| * | Tejon Ranch Co. Warrants Exp. 08/31/2016 | 28,628 | — |
| | | | 3,229,548 |
| Health Care (17.2%) | | |
| * | Ionis Pharmaceuticals Inc. | 1,474,889 | 91,340 |
| * | United Therapeutics Corp. | 532,366 | 83,374 |
| * | MEDNAX Inc. | 1,154,603 | 82,739 |
| * | DexCom Inc. | 948,212 | 77,659 |
| * | Sirona Dental Systems Inc. | 686,306 | 75,199 |
| * | Dyax Corp. | 1,806,681 | 67,967 |
| * | Neurocrine Biosciences Inc. | 1,058,324 | 59,869 |
| * | Align Technology Inc. | 829,550 | 54,626 |
| * | Seattle Genetics Inc. | 1,198,733 | 53,799 |
| * | Anacor Pharmaceuticals Inc. | 460,621 | 52,036 |
| | West Pharmaceutical Services Inc. | 840,798 | 50,633 |
| * | Amsurg Corp. | 662,248 | 50,331 |
| * | Centene Corp. | 695,590 | 45,777 |
| * | PAREXEL International Corp. | 653,817 | 44,538 |
| * | Acadia Healthcare Co. Inc. | 704,325 | 43,992 |
| * | ABIOMED Inc. | 468,804 | 42,324 |
| * | Brookdale Senior Living Inc. | 2,269,995 | 41,904 |
| | Bio-Techne Corp. | 456,740 | 41,107 |
| *,^ | OPKO Health Inc. | 4,015,199 | 40,353 |
| * | STERIS plc | 526,634 | 39,677 |
| * | Team Health Holdings Inc. | 891,516 | 39,129 |
| * | Horizon Pharma plc | 1,759,474 | 38,128 |
| *,^ | Myriad Genetics Inc. | 856,689 | 36,975 |
| * | Akorn Inc. | 979,379 | 36,541 |
| * | ACADIA Pharmaceuticals Inc. | 991,424 | 35,344 |
| * | Impax Laboratories Inc. | 822,608 | 35,175 |
| * | Pacira Pharmaceuticals Inc. | 428,484 | 32,903 |
| * | NuVasive Inc. | 602,980 | 32,627 |
| * | Bruker Corp. | 1,340,087 | 32,524 |
| * | Cepheid | 888,591 | 32,460 |
| * | Medicines Co. | 809,373 | 30,222 |
| | Healthcare Services Group Inc. | 839,326 | 29,267 |
| * | Catalent Inc. | 1,147,102 | 28,712 |
| * | Nektar Therapeutics | 1,639,184 | 27,620 |
| * | Bluebird Bio Inc. | 428,164 | 27,497 |
| * | Wright Medical Group NV | 1,133,459 | 27,407 |
| * | Puma Biotechnology Inc. | 338,276 | 26,521 |
| * | Insulet Corp. | 698,405 | 26,407 |
| * | Novavax Inc. | 3,145,044 | 26,387 |
| | Cantel Medical Corp. | 408,303 | 25,372 |
| * | Neogen Corp. | 435,563 | 24,618 |
| * | Radius Health Inc. | 395,023 | 24,310 |
| * | Ligand Pharmaceuticals Inc. | 216,229 | 23,443 |
| * | Globus Medical Inc. | 831,506 | 23,132 |
| * | Masimo Corp. | 555,458 | 23,057 |
| * | Acorda Therapeutics Inc. | 529,609 | 22,657 |
| *,^ | Agios Pharmaceuticals Inc. | 346,398 | 22,488 |
31
| | | |
| Vanguard® Small-Cap Growth Index Fund | | |
| Schedule of Investments | | |
| December 31, 2015 | | |
| |
| | | | Market |
| | | | Value |
| | | Shares | ($000) |
| * | Halozyme Therapeutics Inc. | 1,256,958 | 21,783 |
| * | Haemonetics Corp. | 622,764 | 20,078 |
| * | ICU Medical Inc. | 176,359 | 19,890 |
| *,^ | Intrexon Corp. | 642,441 | 19,370 |
| * | Sarepta Therapeutics Inc. | 500,171 | 19,297 |
| *,^ | Juno Therapeutics Inc. | 431,998 | 18,995 |
| * | FibroGen Inc. | 602,485 | 18,358 |
| * | Air Methods Corp. | 433,662 | 18,183 |
| * | Ironwood Pharmaceuticals Inc. Class A | 1,559,947 | 18,080 |
| * | INC Research Holdings Inc. Class A | 360,779 | 17,501 |
| * | Emergent BioSolutions Inc. | 406,656 | 16,270 |
| *,^ | Exelixis Inc. | 2,785,323 | 15,709 |
| * | NxStage Medical Inc. | 704,279 | 15,431 |
| | Abaxis Inc. | 264,539 | 14,729 |
| * | Intercept Pharmaceuticals Inc. | 97,164 | 14,511 |
| * | ImmunoGen Inc. | 1,068,669 | 14,502 |
| * | Nevro Corp. | 205,996 | 13,907 |
| * | Amedisys Inc. | 350,964 | 13,800 |
| *,^ | Lannett Co. Inc. | 335,748 | 13,470 |
| * | Alder Biopharmaceuticals Inc. | 401,935 | 13,276 |
| * | ARIAD Pharmaceuticals Inc. | 2,087,695 | 13,048 |
| * | HMS Holdings Corp. | 1,054,019 | 13,007 |
| * | AMAG Pharmaceuticals Inc. | 425,365 | 12,842 |
| | Analogic Corp. | 152,220 | 12,573 |
| * | PRA Health Sciences Inc. | 258,359 | 11,696 |
| * | Momenta Pharmaceuticals Inc. | 763,966 | 11,337 |
| *,^ | Exact Sciences Corp. | 1,182,659 | 10,916 |
| ^ | Theravance Inc. | 1,011,313 | 10,659 |
| * | HeartWare International Inc. | 210,993 | 10,634 |
| * | Luminex Corp. | 476,916 | 10,201 |
| *,^ | Insys Therapeutics Inc. | 354,471 | 10,148 |
| *,^ | Merrimack Pharmaceuticals Inc. | 1,275,622 | 10,077 |
| | Meridian Bioscience Inc. | 486,171 | 9,976 |
| *,^ | Relypsa Inc. | 332,587 | 9,425 |
| * | Natus Medical Inc. | 192,323 | 9,241 |
| * | Orthofix International NV | 220,613 | 8,650 |
| *,^ | Adeptus Health Inc. Class A | 148,609 | 8,102 |
| * | Endologix Inc. | 794,301 | 7,864 |
| * | Genomic Health Inc. | 220,302 | 7,755 |
| * | Quidel Corp. | 351,933 | 7,461 |
| * | Achillion Pharmaceuticals Inc. | 668,531 | 7,213 |
| * | HealthStream Inc. | 311,851 | 6,861 |
| *,^ | Lexicon Pharmaceuticals Inc. | 511,958 | 6,814 |
| * | Depomed Inc. | 371,986 | 6,744 |
| * | Insmed Inc. | 359,319 | 6,522 |
| * | Acceleron Pharma Inc. | 132,256 | 6,449 |
| | Ensign Group Inc. | 283,578 | 6,417 |
| * | Accuray Inc. | 929,126 | 6,272 |
| *,^ | ZIOPHARM Oncology Inc. | 721,715 | 5,997 |
| *,^ | Arena Pharmaceuticals Inc. | 2,969,541 | 5,642 |
| * | CorVel Corp. | 121,763 | 5,348 |
| *,^ | Theravance Biopharma Inc. | 323,877 | 5,308 |
| *,^ | Epizyme Inc. | 306,950 | 4,917 |
| *,^ | MannKind Corp. | 3,369,476 | 4,886 |
| *,^ | Keryx Biopharmaceuticals Inc. | 963,141 | 4,864 |
| * | Merit Medical Systems Inc. | 259,474 | 4,824 |
| *,^ | Spark Therapeutics Inc. | 106,296 | 4,816 |
| * | Sagent Pharmaceuticals Inc. | 300,163 | 4,776 |
| * | Infinity Pharmaceuticals Inc. | 603,004 | 4,734 |
| * | Spectrum Pharmaceuticals Inc. | 751,076 | 4,529 |
| * | Surgery Partners Inc. | 186,733 | 3,826 |
| * | Tetraphase Pharmaceuticals Inc. | 356,801 | 3,579 |
| * | Aegerion Pharmaceuticals Inc. | 335,879 | 3,392 |
| *,^ | ConforMIS Inc. | 127,140 | 2,198 |
32
| | | |
| Vanguard® Small-Cap Growth Index Fund | | |
| Schedule of Investments | | |
| December 31, 2015 | | |
| |
| | | | Market |
| | | | Value |
| | | Shares | ($000) |
| * | Seres Therapeutics Inc. | 47,633 | 1,671 |
| * | Natera Inc. | 152,617 | 1,648 |
| * | Sequenom Inc. | 724,167 | 1,188 |
| * | Wright Medical Group Inc. CVR | 165,303 | 169 |
| * | Penumbra Inc. | 889 | 48 |
| | | | 2,604,571 |
| Industrials (17.0%) | | |
| | Waste Connections Inc. | 1,502,373 | 84,614 |
| * | CoStar Group Inc. | 378,933 | 78,322 |
| | Jack Henry & Associates Inc. | 981,424 | 76,610 |
| * | HD Supply Holdings Inc. | 2,445,238 | 73,430 |
| | AO Smith Corp. | 919,531 | 70,445 |
| | Lennox International Inc. | 525,532 | 65,639 |
| * | Keysight Technologies Inc. | 2,080,710 | 58,947 |
| | Hexcel Corp. | 1,160,078 | 53,886 |
| | Graco Inc. | 686,526 | 49,478 |
| | Toro Co. | 639,288 | 46,713 |
| * | Old Dominion Freight Line Inc. | 779,043 | 46,018 |
| * | Genpact Ltd. | 1,827,855 | 45,660 |
| * | Zebra Technologies Corp. | 639,807 | 44,563 |
| | MAXIMUS Inc. | 769,319 | 43,274 |
| | Nordson Corp. | 665,969 | 42,722 |
| * | WEX Inc. | 474,509 | 41,947 |
| | Heartland Payment Systems Inc. | 428,683 | 40,648 |
| | National Instruments Corp. | 1,405,525 | 40,325 |
| | FEI Co. | 501,421 | 40,008 |
| | Air Lease Corp. Class A | 1,185,210 | 39,681 |
| | Packaging Corp. of America | 600,311 | 37,850 |
| * | IPG Photonics Corp. | 421,252 | 37,559 |
| * | Genesee & Wyoming Inc. Class A | 698,862 | 37,522 |
| | Watsco Inc. | 315,833 | 36,994 |
| | Eagle Materials Inc. | 583,947 | 35,288 |
| | Woodward Inc. | 698,513 | 34,688 |
| | Cognex Corp. | 989,653 | 33,421 |
| *,^ | XPO Logistics Inc. | 1,197,978 | 32,645 |
| | Landstar System Inc. | 530,497 | 31,114 |
| * | Universal Display Corp. | 515,713 | 28,075 |
| * | On Assignment Inc. | 583,032 | 26,207 |
| * | USG Corp. | 1,071,990 | 26,039 |
| | Global Payments Inc. | 399,094 | 25,746 |
| * | Advisory Board Co. | 514,584 | 25,529 |
| * | Clean Harbors Inc. | 600,580 | 25,014 |
| | CEB Inc. | 406,044 | 24,927 |
| *,^ | Cimpress NV | 289,062 | 23,454 |
| | HEICO Corp. Class A | 468,268 | 23,039 |
| * | Euronet Worldwide Inc. | 307,691 | 22,286 |
| * | Masonite International Corp. | 354,151 | 21,685 |
| * | Imperva Inc. | 327,623 | 20,742 |
| *,^ | Ambarella Inc. | 369,241 | 20,581 |
| * | OSI Systems Inc. | 229,830 | 20,377 |
| * | WageWorks Inc. | 440,882 | 20,003 |
| | Mueller Industries Inc. | 701,528 | 19,011 |
| * | Cardtronics Inc. | 551,757 | 18,567 |
| * | Proto Labs Inc. | 289,285 | 18,425 |
| | Knight Transportation Inc. | 744,085 | 18,029 |
| * | RBC Bearings Inc. | 272,826 | 17,622 |
| * | ExlService Holdings Inc. | 385,472 | 17,319 |
| | Simpson Manufacturing Co. Inc. | 502,872 | 17,173 |
| * | Huron Consulting Group Inc. | 281,771 | 16,737 |
| | AZZ Inc. | 300,898 | 16,721 |
| | MSC Industrial Direct Co. Inc. Class A | 297,003 | 16,712 |
| | Forward Air Corp. | 380,685 | 16,373 |
| * | Louisiana-Pacific Corp. | 877,388 | 15,802 |
| | Apogee Enterprises Inc. | 357,376 | 15,549 |
33
| | | |
| Vanguard® Small-Cap Growth Index Fund | | |
| Schedule of Investments | | |
| December 31, 2015 | | |
| |
| | | | Market |
| | | | Value |
| | | Shares | ($000) |
| | CLARCOR Inc. | 305,837 | 15,194 |
| | Exponent Inc. | 299,961 | 14,983 |
| *,^ | LifeLock Inc. | 1,043,148 | 14,969 |
| * | Swift Transportation Co. | 1,073,428 | 14,835 |
| * | Smith & Wesson Holding Corp. | 667,055 | 14,662 |
| * | Trex Co. Inc. | 379,250 | 14,427 |
| | Methode Electronics Inc. | 447,953 | 14,258 |
| * | TopBuild Corp. | 461,840 | 14,211 |
| * | Hub Group Inc. Class A | 415,577 | 13,693 |
| | Sturm Ruger & Co. Inc. | 229,198 | 13,662 |
| * | DigitalGlobe Inc. | 857,852 | 13,434 |
| | Franklin Electric Co. Inc. | 482,884 | 13,052 |
| * | ExamWorks Group Inc. | 488,731 | 13,000 |
| * | II-VI Inc. | 674,359 | 12,516 |
| | Heartland Express Inc. | 730,456 | 12,432 |
| * | TransUnion | 446,794 | 12,318 |
| | Tennant Co. | 218,619 | 12,300 |
| * | Summit Materials Inc. Class A | 609,772 | 12,220 |
| * | M/A-COM Technology Solutions Holdings Inc. | 293,921 | 12,018 |
| | HEICO Corp. | 220,660 | 11,995 |
| | EnPro Industries Inc. | 269,182 | 11,801 |
| * | Armstrong World Industries Inc. | 255,336 | 11,677 |
| | AAON Inc. | 497,285 | 11,547 |
| * | Rogers Corp. | 220,021 | 11,346 |
| | Primoris Services Corp. | 506,835 | 11,166 |
| | Covanta Holding Corp. | 696,478 | 10,788 |
| * | Veeco Instruments Inc. | 502,592 | 10,333 |
| * | Inovalon Holdings Inc. Class A | 604,922 | 10,284 |
| | Advanced Drainage Systems Inc. | 424,708 | 10,206 |
| * | Paylocity Holding Corp. | 250,179 | 10,145 |
| * | TriNet Group Inc. | 515,463 | 9,974 |
| | Badger Meter Inc. | 169,111 | 9,908 |
| ^ | Lindsay Corp. | 131,662 | 9,532 |
| * | AMN Healthcare Services Inc. | 293,052 | 9,099 |
| | Sun Hydraulics Corp. | 278,936 | 8,851 |
| | Quanex Building Products Corp. | 417,031 | 8,695 |
| | Mobile Mini Inc. | 274,784 | 8,554 |
| | Mueller Water Products Inc. Class A | 940,345 | 8,087 |
| * | Team Inc. | 252,330 | 8,064 |
| * | Continental Building Products Inc. | 439,365 | 7,671 |
| * | Headwaters Inc. | 432,627 | 7,298 |
| * | Aerovironment Inc. | 244,970 | 7,219 |
| * | Press Ganey Holdings Inc. | 225,838 | 7,125 |
| | Raven Industries Inc. | 456,381 | 7,120 |
| * | RPX Corp. | 632,638 | 6,959 |
| * | Thermon Group Holdings Inc. | 396,788 | 6,714 |
| | Comfort Systems USA Inc. | 229,258 | 6,516 |
| | Albany International Corp. | 177,396 | 6,484 |
| * | FARO Technologies Inc. | 214,399 | 6,329 |
| | Gorman-Rupp Co. | 223,359 | 5,970 |
| * | TASER International Inc. | 331,305 | 5,728 |
| * | Builders FirstSource Inc. | 436,175 | 4,833 |
| * | Wabash National Corp. | 406,052 | 4,804 |
| ^ | American Railcar Industries Inc. | 97,627 | 4,518 |
| * | Mistras Group Inc. | 214,047 | 4,086 |
| | Griffon Corp. | 220,354 | 3,922 |
| * | Bazaarvoice Inc. | 884,679 | 3,875 |
| * | Astronics Corp. | 90,671 | 3,691 |
| * | Roadrunner Transportation Systems Inc. | 378,344 | 3,568 |
| * | InnerWorkings Inc. | 465,916 | 3,494 |
| | H&E Equipment Services Inc. | 194,707 | 3,403 |
| * | Multi Packaging Solutions International Ltd. | 188,883 | 3,277 |
| * | Ply Gem Holdings Inc. | 249,126 | 3,124 |
| * | Evolent Health Inc. Class A | 151,843 | 1,839 |
34
| | | |
| Vanguard® Small-Cap Growth Index Fund | | |
| Schedule of Investments | | |
| December 31, 2015 | | |
| |
| | | | Market |
| | | | Value |
| | | Shares | ($000) |
| | Acacia Research Corp. | 304,523 | 1,306 |
| * | Milacron Holdings Corp. | 102,705 | 1,285 |
| * | Astronics Corp. Class B | 15,426 | 627 |
| | Acuity Brands Inc. | 253 | 59 |
| | Fortune Brands Home & Security Inc. | 816 | 45 |
| * | Vantiv Inc. Class A | 836 | 40 |
| | Lincoln Electric Holdings Inc. | 330 | 17 |
| * | Coherent Inc. | 152 | 10 |
| | EVERTEC Inc. | 304 | 5 |
| | | | 2,570,952 |
| Oil & Gas (2.6%) | | |
| * | Diamondback Energy Inc. | 818,686 | 54,770 |
| * | Gulfport Energy Corp. | 1,328,808 | 32,649 |
| * | Dril-Quip Inc. | 470,536 | 27,870 |
| * | PDC Energy Inc. | 492,822 | 26,307 |
| | Patterson-UTI Energy Inc. | 1,718,185 | 25,910 |
| * | Cobalt International Energy Inc. | 4,323,103 | 23,345 |
| * | Parsley Energy Inc. Class A | 1,242,119 | 22,917 |
| * | Memorial Resource Development Corp. | 1,259,251 | 20,337 |
| *,^ | SunPower Corp. Class A | 670,453 | 20,120 |
| * | Carrizo Oil & Gas Inc. | 679,987 | 20,114 |
| * | RSP Permian Inc. | 741,738 | 18,091 |
| * | Matador Resources Co. | 891,867 | 17,632 |
| | Targa Resources Corp. | 618,465 | 16,735 |
| | Pattern Energy Group Inc. Class A | 686,327 | 14,351 |
| * | Rice Energy Inc. | 923,747 | 10,069 |
| | RPC Inc. | 802,069 | 9,585 |
| | SemGroup Corp. Class A | 269,298 | 7,772 |
| *,^ | Flotek Industries Inc. | 626,709 | 7,169 |
| *,^ | Laredo Petroleum Inc. | 724,509 | 5,789 |
| *,^ | C&J Energy Services Ltd. | 677,675 | 3,226 |
| *,^ | Sanchez Energy Corp. | 642,250 | 2,768 |
| * | Bonanza Creek Energy Inc. | 494,139 | 2,604 |
| * | Clayton Williams Energy Inc. | 75,437 | 2,231 |
| *,^ | Halcon Resources Corp. | 1,034,005 | 1,303 |
| *,^ | Northern Oil and Gas Inc. | 327,396 | 1,264 |
| * | Bill Barrett Corp. | 312,014 | 1,226 |
| *,^ | Eclipse Resources Corp. | 559,472 | 1,018 |
| * | Jones Energy Inc. Class A | 223,576 | 861 |
| *,^ | SandRidge Energy Inc. | 1,770,780 | 354 |
| | | | 398,387 |
| Other (0.0%)2 | | |
| * | Clinical Data Contingent Value Rights Exp. 4/14/2018 | 132,154 | — |
| *,^ | Magnum Hunter Resources Corp. Warrants Exp. 4/15/2016 | 185,509 | — |
| | | | — |
| Technology (16.9%) | | |
| * | athenahealth Inc. | 476,872 | 76,762 |
| * | Cadence Design Systems Inc. | 3,653,538 | 76,030 |
| | SS&C Technologies Holdings Inc. | 1,014,940 | 69,290 |
| * | Tyler Technologies Inc. | 375,038 | 65,377 |
| * | Ultimate Software Group Inc. | 334,322 | 65,363 |
| * | Manhattan Associates Inc. | 897,286 | 59,373 |
| | IAC/InterActiveCorp | 948,152 | 56,937 |
| * | Fortinet Inc. | 1,798,199 | 56,050 |
| * | Guidewire Software Inc. | 871,973 | 52,458 |
| * | PTC Inc. | 1,406,085 | 48,693 |
| * | Integrated Device Technology Inc. | 1,801,981 | 47,482 |
| | CDK Global Inc. | 978,728 | 46,460 |
| | Solera Holdings Inc. | 825,797 | 45,278 |
| * | SolarWinds Inc. | 749,124 | 44,123 |
| * | Cavium Inc. | 652,509 | 42,876 |
| | Atmel Corp. | 4,902,688 | 42,212 |
| * | EPAM Systems Inc. | 521,428 | 40,995 |
35
| | | |
| Vanguard® Small-Cap Growth Index Fund | | |
| Schedule of Investments | | |
| December 31, 2015 | | |
| |
| | | | Market |
| | | | Value |
| | | Shares | ($000) |
| * | Aspen Technology Inc. | 1,022,762 | 38,619 |
| | Blackbaud Inc. | 575,943 | 37,932 |
| * | Qlik Technologies Inc. | 1,142,143 | 36,160 |
| | Fair Isaac Corp. | 381,632 | 35,942 |
| * | Synaptics Inc. | 444,993 | 35,751 |
| * | Allscripts Healthcare Solutions Inc. | 2,320,739 | 35,693 |
| *,^ | Arista Networks Inc. | 457,466 | 35,609 |
| * | NetScout Systems Inc. | 1,156,257 | 35,497 |
| * | Ciena Corp. | 1,654,123 | 34,224 |
| * | Cree Inc. | 1,265,529 | 33,752 |
| * | ViaSat Inc. | 534,676 | 32,621 |
| * | Medidata Solutions Inc. | 645,847 | 31,834 |
| * | ACI Worldwide Inc. | 1,452,019 | 31,073 |
| * | Infinera Corp. | 1,699,382 | 30,793 |
| * | Proofpoint Inc. | 471,267 | 30,637 |
| * | Tableau Software Inc. Class A | 322,778 | 30,412 |
| | Monolithic Power Systems Inc. | 436,882 | 27,834 |
| * | Electronics For Imaging Inc. | 585,962 | 27,388 |
| * | Dycom Industries Inc. | 379,700 | 26,564 |
| * | Veeva Systems Inc. Class A | 837,958 | 24,175 |
| * | Silicon Laboratories Inc. | 484,468 | 23,516 |
| * | Fleetmatics Group plc | 459,825 | 23,355 |
| | j2 Global Inc. | 283,139 | 23,308 |
| * | Zendesk Inc. | 870,412 | 23,014 |
| * | Entegris Inc. | 1,723,133 | 22,866 |
| *,^ | Demandware Inc. | 416,143 | 22,459 |
| | InterDigital Inc. | 434,915 | 21,328 |
| * | Ellie Mae Inc. | 347,610 | 20,937 |
| * | Cornerstone OnDemand Inc. | 601,996 | 20,787 |
| * | MicroStrategy Inc. Class A | 114,440 | 20,518 |
| * | CommVault Systems Inc. | 500,701 | 19,703 |
| * | LogMeIn Inc. | 291,984 | 19,592 |
| | Plantronics Inc. | 413,009 | 19,585 |
| * | Finisar Corp. | 1,309,266 | 19,037 |
| | Tessera Technologies Inc. | 626,838 | 18,811 |
| *,^ | SunEdison Inc. | 3,692,208 | 18,793 |
| * | Syntel Inc. | 411,895 | 18,638 |
| * | FireEye Inc. | 886,260 | 18,381 |
| * | Rackspace Hosting Inc. | 702,473 | 17,787 |
| * | Paycom Software Inc. | 471,158 | 17,730 |
| | Cogent Communications Holdings Inc. | 499,504 | 17,328 |
| * | Rambus Inc. | 1,428,682 | 16,558 |
| * | HubSpot Inc. | 290,355 | 16,350 |
| * | Synchronoss Technologies Inc. | 459,852 | 16,201 |
| | Power Integrations Inc. | 331,775 | 16,134 |
| | NIC Inc. | 764,459 | 15,045 |
| * | PMC-Sierra Inc. | 1,220,594 | 14,183 |
| * | RealPage Inc. | 624,841 | 14,028 |
| * | Bottomline Technologies de Inc. | 469,676 | 13,963 |
| * | RingCentral Inc. Class A | 592,001 | 13,959 |
| * | Envestnet Inc. | 460,218 | 13,738 |
| * | Marketo Inc. | 451,167 | 12,953 |
| * | Lumentum Holdings Inc. | 578,157 | 12,731 |
| * | Cvent Inc. | 359,936 | 12,565 |
| * | BroadSoft Inc. | 353,371 | 12,495 |
| * | Infoblox Inc. | 659,203 | 12,123 |
| * | Web.com Group Inc. | 592,247 | 11,851 |
| * | Inphi Corp. | 433,775 | 11,721 |
| | Monotype Imaging Holdings Inc. | 490,250 | 11,590 |
| | Pegasystems Inc. | 421,422 | 11,589 |
| * | Super Micro Computer Inc. | 467,074 | 11,448 |
| *,^ | 3D Systems Corp. | 1,304,828 | 11,339 |
| *,^ | Gogo Inc. | 631,449 | 11,240 |
| * | Ruckus Wireless Inc. | 1,035,048 | 11,085 |
36
| | | |
| Vanguard® Small-Cap Growth Index Fund | | |
| Schedule of Investments | | |
| December 31, 2015 | | |
| |
| | | | Market |
| | | | Value |
| | | Shares | ($000) |
| * | Diodes Inc. | 448,731 | 10,312 |
| *,^ | GoDaddy Inc. Class A | 320,323 | 10,270 |
| *,^ | Ubiquiti Networks Inc. | 311,250 | 9,864 |
| * | InvenSense Inc. | 959,576 | 9,816 |
| * | New Relic Inc. | 266,568 | 9,711 |
| * | Lattice Semiconductor Corp. | 1,450,331 | 9,384 |
| * | Gigamon Inc. | 312,414 | 8,301 |
| *,^ | Endurance International Group Holdings Inc. | 756,382 | 8,267 |
| * | Cray Inc. | 236,840 | 7,685 |
| *,^ | Shutterstock Inc. | 222,346 | 7,191 |
| * | Xura Inc. | 278,220 | 6,839 |
| * | Virtusa Corp. | 164,719 | 6,809 |
| * | Interactive Intelligence Group Inc. | 213,635 | 6,712 |
| | Computer Programs & Systems Inc. | 131,405 | 6,537 |
| * | Loral Space & Communications Inc. | 158,374 | 6,447 |
| * | Hortonworks Inc. | 283,874 | 6,217 |
| * | Ultratech Inc. | 306,903 | 6,083 |
| * | CEVA Inc. | 250,144 | 5,843 |
| * | Nimble Storage Inc. | 633,322 | 5,827 |
| * | Applied Micro Circuits Corp. | 913,072 | 5,816 |
| * | Ixia | 465,186 | 5,782 |
| *,^ | Box Inc. | 404,262 | 5,644 |
| * | Intralinks Holdings Inc. | 608,134 | 5,516 |
| *,^ | Pure Storage Inc. Class A | 352,164 | 5,483 |
| * | Actua Corp. | 454,521 | 5,204 |
| * | Benefitfocus Inc. | 142,771 | 5,195 |
| *,^ | Textura Corp. | 239,242 | 5,163 |
| * | 2U Inc. | 182,161 | 5,097 |
| * | Barracuda Networks Inc. | 263,624 | 4,924 |
| * | LivePerson Inc. | 629,904 | 4,252 |
| * | Sonus Networks Inc. | 585,123 | 4,172 |
| * | Calix Inc. | 528,919 | 4,163 |
| * | Mercury Systems Inc. | 202,657 | 3,721 |
| | Forrester Research Inc. | 120,190 | 3,423 |
| *,^ | OPOWER Inc. | 285,116 | 3,011 |
| * | Jive Software Inc. | 602,017 | 2,456 |
| * | Harmonic Inc. | 546,546 | 2,224 |
| * | Castlight Health Inc. Class B | 461,567 | 1,971 |
| * | Tangoe Inc. | 228,709 | 1,919 |
| * | ChannelAdvisor Corp. | 129,965 | 1,800 |
| *,^ | MobileIron Inc. | 441,010 | 1,592 |
| * | Rapid7 Inc. | 63,403 | 959 |
| * | Match Group Inc. | 46,725 | 633 |
| * | Rocket Fuel Inc. | 144,503 | 504 |
| * | Pendrell Corp. | 490,761 | 246 |
| *,^ | Square Inc. | 2,670 | 35 |
| * | Viavi Solutions Inc. | 1,199 | 7 |
| | | | 2,559,658 |
| Telecommunications (0.2%) | | |
| * | Cincinnati Bell Inc. | 2,585,870 | 9,309 |
| *,^ | Globalstar Inc. | 4,987,201 | 7,182 |
| | Atlantic Tele-Network Inc. | 64,079 | 5,013 |
| | | | 21,504 |
| Utilities (0.8%) | | |
| | ITC Holdings Corp. | 1,883,629 | 73,932 |
| | Ormat Technologies Inc. | 421,182 | 15,361 |
| | TerraForm Power Inc. Class A | 934,114 | 11,751 |
| * | Dynegy Inc. | 739,509 | 9,909 |
| *,^ | Sunrun Inc. | 247,833 | 2,917 |
| * | Vivint Solar Inc. | 262,410 | 2,509 |
| |
| | | | 116,379 |
| Total Common Stocks (Cost $12,948,157) | | 15,111,166 |
37
| | | | | |
| Vanguard® Small-Cap Growth Index Fund | | | | |
| Schedule of Investments | | | | |
| December 31, 2015 | | | | |
| |
| | | | | | Market |
| | | | | | Value |
| | | Coupon | | Shares | ($000) |
| Temporary Cash Investments (2.7%)1 | | | | |
| Money Market Fund (2.7%) | | | | |
| 3,4 | Vanguard Market Liquidity Fund | 0.363% | | 408,781,607 | 408,782 |
| |
| |
| | | | | Face | |
| | | | Maturity | Amount | |
| | | | Date | ($000) | |
| U.S. Government and Agency Obligations (0.0%) | | | | |
| 5,6 | Federal Home Loan Bank Discount Notes | 0.466% | 3/7/16 | 1,700 | 1,699 |
| 6,7 | Freddie Mac Discount Notes | 0.220% | 3/30/16 | 1,500 | 1,498 |
| | | | | | 3,197 |
| Total Temporary Cash Investments (Cost $411,979) | | | | 411,979 |
| Total Investments (102.6%) (Cost $13,360,136) | | | | 15,523,145 |
| Other Assets and Liabilities—Net (-2.6%)4 | | | | (388,831) |
| Net Assets (100%) | | | | 15,134,314 |
* Non-income-producing security.
^ Includes partial security positions on loan to broker-dealers. The total value of securities on loan is $333,291,000.
1 The fund invests a portion of its cash reserves in equity markets through the use of index futures contracts. After giving effect to futures investments, the fund's effective common stock and temporary cash investment positions represent 100.1% and 2.5%, respectively, of net assets.
2 “Other” represents securities that are not classified by the fund’s benchmark index.
3 Affiliated money market fund available only to Vanguard funds and certain trusts and accounts managed by Vanguard. Rate shown is the 7-day yield.
4 Includes $353,007,000 of collateral received for securities on loan.
5 The issuer operates under a congressional charter; its securities are generally neither guaranteed by the U.S. Treasury nor backed by the full faith and credit of the U.S. government.
6 Securities with a value of $2,398,000 have been segregated as initial margin for open futures contracts.
7 The issuer was placed under federal conservatorship in September 2008; since that time, its daily operations have been managed by the Federal Housing Finance Agency and it receives capital from the U.S. Treasury, as needed to maintain a positive net worth, in exchange for senior preferred stock.
REIT—Real Estate Investment Trust.
38
| | | |
| Vanguard® Small-Cap Value Index Fund | | |
| Schedule of Investments | | |
| December 31, 2015 | | |
| |
| | | | Market |
| | | | Value |
| | | Shares | ($000) |
| |
| Common Stocks (99.8%)1 | | |
| Basic Materials (3.9%) | | |
| | RPM International Inc. | 1,499,582 | 66,072 |
| | Steel Dynamics Inc. | 2,591,995 | 46,319 |
| | Olin Corp. | 1,861,050 | 32,122 |
| | Sensient Technologies Corp. | 509,724 | 32,021 |
| | PolyOne Corp. | 972,527 | 30,887 |
| | Compass Minerals International Inc. | 379,864 | 28,592 |
| | Domtar Corp. | 708,413 | 26,176 |
| | Cabot Corp. | 634,675 | 25,946 |
| | HB Fuller Co. | 569,905 | 20,784 |
| * | Chemtura Corp. | 757,067 | 20,645 |
| ^ | CONSOL Energy Inc. | 2,581,621 | 20,395 |
| | Commercial Metals Co. | 1,311,444 | 17,954 |
| | Carpenter Technology Corp. | 553,522 | 16,755 |
| | Kaiser Aluminum Corp. | 190,190 | 15,911 |
| | Worthington Industries Inc. | 507,622 | 15,300 |
| | Innospec Inc. | 258,224 | 14,024 |
| | Allegheny Technologies Inc. | 1,232,476 | 13,865 |
| | Huntsman Corp. | 1,176,941 | 13,382 |
| ^ | United States Steel Corp. | 1,650,750 | 13,173 |
| | Axiall Corp. | 796,532 | 12,267 |
| | Stepan Co. | 226,149 | 11,237 |
| | Quaker Chemical Corp. | 142,291 | 10,993 |
| | Chemours Co. | 2,042,545 | 10,948 |
| | A Schulman Inc. | 313,247 | 9,598 |
| | PH Glatfelter Co. | 488,479 | 9,008 |
| | Minerals Technologies Inc. | 195,628 | 8,971 |
| * | Clearwater Paper Corp. | 190,116 | 8,656 |
| | Hecla Mining Co. | 4,257,511 | 8,047 |
| * | Univar Inc. | 388,626 | 6,611 |
| | Innophos Holdings Inc. | 206,016 | 5,970 |
| * | Stillwater Mining Co. | 682,774 | 5,851 |
| * | Kraton Performance Polymers Inc. | 344,471 | 5,722 |
| * | Ferro Corp. | 489,293 | 5,441 |
| | Haynes International Inc. | 139,700 | 5,126 |
| * | Resolute Forest Products Inc. | 651,584 | 4,932 |
| | Rayonier Advanced Materials Inc. | 481,165 | 4,711 |
| *,^ | AK Steel Holding Corp. | 1,896,580 | 4,248 |
| | Globe Specialty Metals Inc. | 372,370 | 4,003 |
| * | Koppers Holdings Inc. | 219,109 | 3,999 |
| | Tredegar Corp. | 293,409 | 3,996 |
| | FutureFuel Corp. | 269,839 | 3,643 |
| | Tronox Ltd. Class A | 688,019 | 2,690 |
| * | Century Aluminum Co. | 538,861 | 2,382 |
| *,^ | Cliffs Natural Resources Inc. | 1,469,863 | 2,322 |
| * | Intrepid Potash Inc. | 643,790 | 1,899 |
| | Kronos Worldwide Inc. | 261,235 | 1,473 |
| | SunCoke Energy Inc. | 359,339 | 1,247 |
| *,^ | Peabody Energy Corp. | 114,390 | 879 |
| * | Cloud Peak Energy Inc. | 343,474 | 714 |
| * | LSB Industries Inc. | 54,416 | 395 |
| * | NL Industries Inc. | 23,699 | 72 |
| * | Alpha Natural Resources Inc. | 721 | — |
| | | | 638,374 |
| Consumer Goods (6.8%) | | |
| | Ingredion Inc. | 806,420 | 77,287 |
| | Leggett & Platt Inc. | 1,457,257 | 61,234 |
| | Pinnacle Foods Inc. | 1,314,337 | 55,807 |
| * | Visteon Corp. | 460,149 | 52,687 |
| | Goodyear Tire & Rubber Co. | 1,515,526 | 49,512 |
| *,^ | Herbalife Ltd. | 730,092 | 39,147 |
| * | TreeHouse Foods Inc. | 461,415 | 36,203 |
39
| | | |
| Vanguard® Small-Cap Value Index Fund | | |
| Schedule of Investments | | |
| December 31, 2015 | | |
| |
| | | | Market |
| | | | Value |
| | | Shares | ($000) |
| | Scotts Miracle-Gro Co. Class A | 520,005 | 33,545 |
| * | Vista Outdoor Inc. | 702,267 | 31,258 |
| * | Helen of Troy Ltd. | 316,644 | 29,844 |
| | Thor Industries Inc. | 531,429 | 29,840 |
| * | Tenneco Inc. | 618,955 | 28,416 |
| | Spectrum Brands Holdings Inc. | 266,343 | 27,114 |
| | Tupperware Brands Corp. | 482,463 | 26,849 |
| | Energizer Holdings Inc. | 703,263 | 23,953 |
| | Cooper Tire & Rubber Co. | 631,741 | 23,911 |
| | Dana Holding Corp. | 1,723,336 | 23,782 |
| ^ | Nu Skin Enterprises Inc. Class A | 612,807 | 23,219 |
| | Snyder's-Lance Inc. | 638,445 | 21,899 |
| | Avon Products Inc. | 4,907,427 | 19,875 |
| * | Darling Ingredients Inc. | 1,856,636 | 19,532 |
| | Herman Miller Inc. | 674,767 | 19,366 |
| | HNI Corp. | 497,953 | 17,956 |
| | Dean Foods Co. | 1,029,552 | 17,657 |
| *,^ | Fossil Group Inc. | 461,580 | 16,875 |
| | Sanderson Farms Inc. | 214,633 | 16,638 |
| * | Take-Two Interactive Software Inc. | 453,648 | 15,805 |
| * | American Axle & Manufacturing Holdings Inc. | 815,292 | 15,442 |
| | Fresh Del Monte Produce Inc. | 383,381 | 14,906 |
| ^ | Cal-Maine Foods Inc. | 320,550 | 14,854 |
| | Schweitzer-Mauduit International Inc. | 343,922 | 14,441 |
| | La-Z-Boy Inc. | 566,461 | 13,833 |
| | Universal Corp. | 243,637 | 13,663 |
| | Steelcase Inc. Class A | 916,332 | 13,653 |
| * | Cooper-Standard Holding Inc. | 166,910 | 12,951 |
| | Lancaster Colony Corp. | 108,131 | 12,485 |
| | KB Home | 987,147 | 12,171 |
| | Knoll Inc. | 522,053 | 9,815 |
| * | Seaboard Corp. | 3,299 | 9,550 |
| | Andersons Inc. | 299,364 | 9,469 |
| | Wolverine World Wide Inc. | 551,573 | 9,217 |
| * | ACCO Brands Corp. | 1,197,520 | 8,538 |
| | Briggs & Stratton Corp. | 473,037 | 8,184 |
| * | Crocs Inc. | 787,934 | 8,068 |
| | Ethan Allen Interiors Inc. | 287,967 | 8,011 |
| | Columbia Sportswear Co. | 158,384 | 7,723 |
| ^ | Tootsie Roll Industries Inc. | 212,320 | 6,707 |
| * | Taylor Morrison Home Corp. Class A | 373,741 | 5,980 |
| * | Blount International Inc. | 541,591 | 5,313 |
| * | Central Garden & Pet Co. Class A | 366,690 | 4,987 |
| * | Modine Manufacturing Co. | 540,532 | 4,892 |
| | National Presto Industries Inc. | 58,344 | 4,834 |
| | Superior Industries International Inc. | 250,791 | 4,620 |
| | Inter Parfums Inc. | 191,386 | 4,559 |
| | Movado Group Inc. | 174,742 | 4,493 |
| * | Iconix Brand Group Inc. | 518,122 | 3,539 |
| * | Vera Bradley Inc. | 213,092 | 3,358 |
| * | Eastman Kodak Co. | 259,165 | 3,250 |
| * | Federal-Mogul Holdings Corp. | 381,058 | 2,610 |
| *,^ | Elizabeth Arden Inc. | 236,021 | 2,337 |
| * | Central Garden & Pet Co. | 93,559 | 1,265 |
| * | Hovnanian Enterprises Inc. Class A | 664,779 | 1,203 |
| | Titan International Inc. | 241,819 | 953 |
| * | Vince Holding Corp. | 94,707 | 434 |
| | | | 1,121,519 |
| Consumer Services (12.0%) | | |
| * | JetBlue Airways Corp. | 3,551,268 | 80,436 |
| | Cablevision Systems Corp. Class A | 2,383,196 | 76,024 |
| | TEGNA Inc. | 2,498,829 | 63,770 |
| | KAR Auction Services Inc. | 1,550,253 | 57,406 |
| | Service Corp. International | 2,104,201 | 54,751 |
40
| | | |
| Vanguard® Small-Cap Value Index Fund | | |
| Schedule of Investments | | |
| December 31, 2015 | | |
| |
| | | | Market |
| | | | Value |
| | | Shares | ($000) |
| | Casey's General Stores Inc. | 439,412 | 52,927 |
| * | VCA Inc. | 863,532 | 47,494 |
| * | Rite Aid Corp. | 5,896,515 | 46,229 |
| | Dun & Bradstreet Corp. | 407,281 | 42,329 |
| * | Avis Budget Group Inc. | 1,130,557 | 41,028 |
| | Cinemark Holdings Inc. | 1,175,953 | 39,312 |
| * | Office Depot Inc. | 6,185,147 | 34,884 |
| ^ | Cracker Barrel Old Country Store Inc. | 269,738 | 34,211 |
| ^ | GameStop Corp. Class A | 1,189,042 | 33,341 |
| * | Starz | 983,462 | 32,946 |
| * | Houghton Mifflin Harcourt Co. | 1,494,854 | 32,558 |
| | Brinker International Inc. | 671,252 | 32,187 |
| | CST Brands Inc. | 809,637 | 31,689 |
| | American Eagle Outfitters Inc. | 1,982,531 | 30,729 |
| | Tribune Media Co. Class A | 901,964 | 30,495 |
| * | Murphy USA Inc. | 500,773 | 30,417 |
| * | ServiceMaster Global Holdings Inc. | 724,993 | 28,449 |
| * | Beacon Roofing Supply Inc. | 663,946 | 27,341 |
| | Chemed Corp. | 180,738 | 27,075 |
| | Lithia Motors Inc. Class A | 253,690 | 27,061 |
| | Wendy's Co. | 2,466,067 | 26,560 |
| | AMERCO | 66,299 | 25,823 |
| | Graham Holdings Co. Class B | 52,222 | 25,326 |
| | Sinclair Broadcast Group Inc. Class A | 775,356 | 25,230 |
| | John Wiley & Sons Inc. Class A | 553,093 | 24,906 |
| | Cable One Inc. | 52,793 | 22,894 |
| *,^ | JC Penney Co. Inc. | 3,271,251 | 21,787 |
| | Big Lots Inc. | 558,616 | 21,529 |
| | Gannett Co. Inc. | 1,301,363 | 21,199 |
| | Abercrombie & Fitch Co. | 756,912 | 20,437 |
| * | SUPERVALU Inc. | 2,997,259 | 20,321 |
| | Core-Mark Holding Co. Inc. | 246,816 | 20,224 |
| | New York Times Co. Class A | 1,452,359 | 19,491 |
| | Penske Automotive Group Inc. | 456,831 | 19,342 |
| | Hillenbrand Inc. | 637,433 | 18,887 |
| | Matthews International Corp. Class A | 352,094 | 18,819 |
| | Dolby Laboratories Inc. Class A | 556,016 | 18,710 |
| | Meredith Corp. | 424,790 | 18,372 |
| | Aaron's Inc. | 818,049 | 18,316 |
| | Group 1 Automotive Inc. | 240,328 | 18,193 |
| | Time Inc. | 1,114,964 | 17,471 |
| * | Acxiom Corp. | 833,763 | 17,442 |
| * | Boyd Gaming Corp. | 876,001 | 17,406 |
| * | Asbury Automotive Group Inc. | 257,436 | 17,361 |
| ^ | Regal Entertainment Group Class A | 898,992 | 16,964 |
| | DeVry Education Group Inc. | 644,748 | 16,319 |
| | DineEquity Inc. | 189,027 | 16,005 |
| * | Express Inc. | 908,252 | 15,695 |
| | Dillard's Inc. Class A | 235,389 | 15,467 |
| | SeaWorld Entertainment Inc. | 758,632 | 14,937 |
| * | Genesco Inc. | 255,002 | 14,492 |
| | GNC Holdings Inc. Class A | 466,431 | 14,469 |
| | Guess? Inc. | 677,482 | 12,791 |
| | Children's Place Inc. | 229,255 | 12,655 |
| | Caleres Inc. | 468,632 | 12,569 |
| | Bloomin' Brands Inc. | 674,520 | 11,393 |
| * | Pep Boys-Manny Moe & Jack | 578,855 | 10,657 |
| | Scholastic Corp. | 274,111 | 10,570 |
| | SkyWest Inc. | 544,195 | 10,351 |
| | Cato Corp. Class A | 280,476 | 10,327 |
| | International Speedway Corp. Class A | 300,553 | 10,135 |
| ^ | Buckle Inc. | 327,617 | 10,084 |
| | DSW Inc. Class A | 411,467 | 9,818 |
| | Finish Line Inc. Class A | 504,691 | 9,125 |
41
| | | |
| Vanguard® Small-Cap Value Index Fund | | |
| Schedule of Investments | | |
| December 31, 2015 | | |
| |
| | | | Market |
| | | | Value |
| | | Shares | ($000) |
| | Choice Hotels International Inc. | 175,363 | 8,840 |
| | Bob Evans Farms Inc. | 226,627 | 8,804 |
| | Rent-A-Center Inc. | 567,578 | 8,497 |
| | Men's Wearhouse Inc. | 544,477 | 7,993 |
| | Chico's FAS Inc. | 745,148 | 7,951 |
| * | Apollo Education Group Inc. | 1,032,876 | 7,922 |
| | Sonic Automotive Inc. Class A | 340,391 | 7,747 |
| * | Rush Enterprises Inc. Class A | 340,950 | 7,463 |
| *,^ | Weight Watchers International Inc. | 323,123 | 7,367 |
| * | Strayer Education Inc. | 117,985 | 7,093 |
| * | MSG Networks Inc. | 327,036 | 6,802 |
| | Fred's Inc. Class A | 398,951 | 6,531 |
| * | Smart & Final Stores Inc. | 332,956 | 6,063 |
| | Capella Education Co. | 127,694 | 5,902 |
| * | Regis Corp. | 406,502 | 5,752 |
| | Barnes & Noble Inc. | 645,500 | 5,622 |
| * | FTD Cos. Inc. | 210,290 | 5,503 |
| | Weis Markets Inc. | 121,434 | 5,380 |
| * | Vitamin Shoppe Inc. | 164,139 | 5,367 |
| * | Performance Food Group Co. | 231,267 | 5,351 |
| *,^ | Sears Holdings Corp. | 239,399 | 4,922 |
| | Pier 1 Imports Inc. | 924,394 | 4,705 |
| | New Media Investment Group Inc. | 238,332 | 4,638 |
| *,^ | Lands' End Inc. | 179,570 | 4,209 |
| * | Bankrate Inc. | 306,732 | 4,080 |
| * | Barnes & Noble Education Inc. | 405,738 | 4,037 |
| * | Ruby Tuesday Inc. | 663,358 | 3,655 |
| * | K12 Inc. | 351,082 | 3,090 |
| * | American Public Education Inc. | 164,320 | 3,058 |
| | Speedway Motorsports Inc. | 141,752 | 2,937 |
| *,^ | Caesars Entertainment Corp. | 326,590 | 2,577 |
| * | Clear Channel Outdoor Holdings Inc. Class A | 393,833 | 2,202 |
| * | Rush Enterprises Inc. Class B | 90,983 | 1,993 |
| * | Biglari Holdings Inc. | 5,818 | 1,896 |
| * | Bridgepoint Education Inc. | 208,902 | 1,590 |
| * | Zumiez Inc. | 104,701 | 1,583 |
| | Stage Stores Inc. | 170,748 | 1,555 |
| * | J Alexander's Holdings Inc. | 43,141 | 471 |
| * | Liquidity Services Inc. | 17,848 | 116 |
| | | | 1,977,222 |
| Financials (31.1%) | | |
| | Arthur J Gallagher & Co. | 1,991,605 | 81,536 |
| | Apartment Investment & Management Co. | 1,763,178 | 70,580 |
| | East West Bancorp Inc. | 1,621,989 | 67,410 |
| | National Retail Properties Inc. | 1,534,721 | 61,466 |
| | American Financial Group Inc. | 787,643 | 56,773 |
| | RenaissanceRe Holdings Ltd. | 494,259 | 55,945 |
| | StanCorp Financial Group Inc. | 477,264 | 54,351 |
| | Starwood Property Trust Inc. | 2,545,031 | 52,326 |
| | Liberty Property Trust | 1,665,648 | 51,718 |
| | Taubman Centers Inc. | 644,959 | 49,481 |
| | Old Republic International Corp. | 2,652,204 | 49,411 |
| | Highwoods Properties Inc. | 1,074,490 | 46,848 |
| | Endurance Specialty Holdings Ltd. | 713,381 | 45,649 |
| | Synovus Financial Corp. | 1,398,448 | 45,282 |
| | Hospitality Properties Trust | 1,708,206 | 44,670 |
| | First American Financial Corp. | 1,225,730 | 44,004 |
| | Weingarten Realty Investors | 1,257,357 | 43,479 |
| | First Niagara Financial Group Inc. | 3,999,014 | 43,389 |
| | Assured Guaranty Ltd. | 1,592,983 | 42,103 |
| | Duke Realty Corp. | 1,945,815 | 40,901 |
| | Brown & Brown Inc. | 1,271,066 | 40,801 |
| | Validus Holdings Ltd. | 877,186 | 40,605 |
| | Eaton Vance Corp. | 1,244,378 | 40,355 |
42
| | |
| Vanguard® Small-Cap Value Index Fund | | |
| Schedule of Investments | | |
| December 31, 2015 | | |
| |
| | | Market |
| | | Value |
| | Shares | ($000) |
| CNO Financial Group Inc. | 2,096,103 | 40,015 |
| BankUnited Inc. | 1,108,532 | 39,974 |
| * Alleghany Corp. | 83,376 | 39,848 |
| Commerce Bancshares Inc. | 933,782 | 39,723 |
| Senior Housing Properties Trust | 2,676,730 | 39,723 |
| Hanover Insurance Group Inc. | 487,442 | 39,649 |
| Retail Properties of America Inc. | 2,674,409 | 39,501 |
| * Equity Commonwealth | 1,424,153 | 39,492 |
| Umpqua Holdings Corp. | 2,482,253 | 39,468 |
| EPR Properties | 673,472 | 39,364 |
| * Liberty Broadband Corp. | 756,718 | 39,243 |
| Mid-America Apartment Communities Inc. | 424,782 | 38,574 |
| Webster Financial Corp. | 1,033,358 | 38,431 |
| First Horizon National Corp. | 2,640,187 | 38,336 |
| Cullen/Frost Bankers Inc. | 632,149 | 37,929 |
| ^ Apple Hospitality REIT Inc. | 1,867,084 | 37,286 |
| Omega Healthcare Investors Inc. | 1,054,108 | 36,873 |
| Gramercy Property Trust | 4,737,237 | 36,571 |
| NorthStar Realty Finance Corp. | 2,129,958 | 36,273 |
| Allied World Assurance Co. Holdings AG | 973,490 | 36,204 |
| Prosperity Bancshares Inc. | 749,857 | 35,888 |
| Corrections Corp. of America | 1,321,287 | 35,001 |
| White Mountains Insurance Group Ltd. | 48,071 | 34,938 |
| FirstMerit Corp. | 1,868,353 | 34,845 |
| PrivateBancorp Inc. | 846,493 | 34,723 |
| * Liberty Ventures Class A | 759,553 | 34,263 |
| * MGIC Investment Corp. | 3,828,555 | 33,806 |
| Two Harbors Investment Corp. | 4,103,565 | 33,239 |
| Popular Inc. | 1,167,600 | 33,090 |
| Aspen Insurance Holdings Ltd. | 685,056 | 33,088 |
| Columbia Property Trust Inc. | 1,401,757 | 32,913 |
| Associated Banc-Corp | 1,694,440 | 31,771 |
| New Residential Investment Corp. | 2,597,678 | 31,588 |
| * SLM Corp. | 4,803,024 | 31,316 |
| Radian Group Inc. | 2,331,737 | 31,222 |
| Rayonier Inc. | 1,394,888 | 30,967 |
| Piedmont Office Realty Trust Inc. Class A | 1,640,083 | 30,965 |
| Bank of Hawaii Corp. | 487,931 | 30,691 |
| AmTrust Financial Services Inc. | 495,465 | 30,511 |
| Federated Investors Inc. Class B | 1,056,090 | 30,257 |
| Assurant Inc. | 370,971 | 29,878 |
| Interactive Brokers Group Inc. | 681,821 | 29,727 |
| ProAssurance Corp. | 599,003 | 29,070 |
| Chimera Investment Corp. | 2,130,444 | 29,059 |
| RLI Corp. | 464,483 | 28,682 |
| PacWest Bancorp | 643,515 | 27,736 |
| First Industrial Realty Trust Inc. | 1,248,255 | 27,624 |
| MFA Financial Inc. | 4,175,470 | 27,558 |
| United Bankshares Inc. | 744,977 | 27,557 |
| Cathay General Bancorp | 867,313 | 27,173 |
| BioMed Realty Trust Inc. | 1,146,996 | 27,172 |
| Erie Indemnity Co. Class A | 282,695 | 27,037 |
| Symetra Financial Corp. | 850,874 | 27,032 |
| Brandywine Realty Trust | 1,974,708 | 26,975 |
| Blackstone Mortgage Trust Inc. Class A | 998,090 | 26,709 |
| Wintrust Financial Corp. | 545,148 | 26,451 |
| FNB Corp. | 1,973,158 | 26,322 |
| Primerica Inc. | 545,063 | 25,743 |
| MB Financial Inc. | 789,060 | 25,542 |
| IBERIABANK Corp. | 463,655 | 25,533 |
| Fulton Financial Corp. | 1,961,597 | 25,520 |
| Washington Federal Inc. | 1,059,268 | 25,242 |
| Valley National Bancorp | 2,493,588 | 24,562 |
| GEO Group Inc. | 841,447 | 24,326 |
43
| | |
| Vanguard® Small-Cap Value Index Fund | | |
| Schedule of Investments | | |
| December 31, 2015 | | |
| |
| | | Market |
| | | Value |
| | Shares | ($000) |
| TCF Financial Corp. | 1,720,231 | 24,290 |
| National Health Investors Inc. | 398,223 | 24,240 |
| CBL & Associates Properties Inc. | 1,921,769 | 23,772 |
| Spirit Realty Capital Inc. | 2,363,204 | 23,679 |
| Janus Capital Group Inc. | 1,665,926 | 23,473 |
| DuPont Fabros Technology Inc. | 737,186 | 23,435 |
| BancorpSouth Inc. | 953,436 | 22,873 |
| Empire State Realty Trust Inc. | 1,255,113 | 22,680 |
| Sterling Bancorp | 1,389,247 | 22,534 |
| Pinnacle Financial Partners Inc. | 437,424 | 22,466 |
| WP Glimcher Inc. | 2,088,729 | 22,161 |
| Bank of the Ozarks Inc. | 447,662 | 22,141 |
| UMB Financial Corp. | 472,224 | 21,982 |
| Hancock Holding Co. | 872,350 | 21,957 |
| DiamondRock Hospitality Co. | 2,262,691 | 21,835 |
| Glacier Bancorp Inc. | 814,678 | 21,613 |
| First Financial Bankshares Inc. | 706,377 | 21,311 |
| Mack-Cali Realty Corp. | 905,944 | 21,154 |
| Columbia Banking System Inc. | 650,638 | 21,152 |
| New York REIT Inc. | 1,831,891 | 21,067 |
| American Equity Investment Life Holding Co. | 873,161 | 20,982 |
| * Genworth Financial Inc. Class A | 5,607,333 | 20,915 |
| First Citizens BancShares Inc. Class A | 80,621 | 20,814 |
| Washington REIT | 768,444 | 20,794 |
| Selective Insurance Group Inc. | 612,417 | 20,565 |
| BGC Partners Inc. Class A | 2,070,479 | 20,311 |
| National Penn Bancshares Inc. | 1,581,312 | 19,498 |
| ^ LPL Financial Holdings Inc. | 455,071 | 19,409 |
| EastGroup Properties Inc. | 347,135 | 19,304 |
| Xenia Hotels & Resorts Inc. | 1,258,600 | 19,294 |
| South State Corp. | 259,238 | 18,652 |
| Community Bank System Inc. | 465,399 | 18,588 |
| CVB Financial Corp. | 1,078,867 | 18,254 |
| Great Western Bancorp Inc. | 622,343 | 18,060 |
| EverBank Financial Corp. | 1,126,520 | 18,002 |
| Argo Group International Holdings Ltd. | 298,385 | 17,855 |
| * Enstar Group Ltd. | 118,128 | 17,724 |
| Old National Bancorp | 1,290,592 | 17,500 |
| Capitol Federal Financial Inc. | 1,392,795 | 17,494 |
| LTC Properties Inc. | 400,892 | 17,294 |
| Lexington Realty Trust | 2,124,633 | 16,997 |
| Outfront Media Inc. | 776,282 | 16,946 |
| Invesco Mortgage Capital Inc. | 1,348,091 | 16,703 |
| Trustmark Corp. | 724,314 | 16,688 |
| STORE Capital Corp. | 715,331 | 16,596 |
| International Bancshares Corp. | 636,736 | 16,364 |
| Astoria Financial Corp. | 1,023,693 | 16,226 |
| Pennsylvania REIT | 741,809 | 16,223 |
| First Midwest Bancorp Inc. | 879,707 | 16,213 |
| Kemper Corp. | 433,184 | 16,136 |
| LaSalle Hotel Properties | 637,253 | 16,033 |
| Horace Mann Educators Corp. | 459,359 | 15,242 |
| ^ Global Net Lease Inc. | 1,906,556 | 15,157 |
| * HRG Group Inc. | 1,112,556 | 15,086 |
| Chemical Financial Corp. | 430,401 | 14,750 |
| BBCN Bancorp Inc. | 852,988 | 14,688 |
| Northwest Bancshares Inc. | 1,091,130 | 14,610 |
| Mercury General Corp. | 311,340 | 14,499 |
| * Liberty Broadband Corp. Class A | 280,326 | 14,479 |
| Hatteras Financial Corp. | 1,092,123 | 14,361 |
| Select Income REIT | 706,109 | 13,995 |
| Potlatch Corp. | 459,070 | 13,882 |
| BOK Financial Corp. | 229,322 | 13,711 |
| Banner Corp. | 295,199 | 13,538 |
44
| | | |
| Vanguard® Small-Cap Value Index Fund | | |
| Schedule of Investments | | |
| December 31, 2015 | | |
| |
| | | | Market |
| | | | Value |
| | | Shares | ($000) |
| | Provident Financial Services Inc. | 667,975 | 13,460 |
| | Park National Corp. | 147,299 | 13,328 |
| | Independent Bank Corp. | 281,338 | 13,088 |
| | National General Holdings Corp. | 594,983 | 13,006 |
| | NBT Bancorp Inc. | 464,184 | 12,941 |
| | Talmer Bancorp Inc. Class A | 709,019 | 12,840 |
| | Westamerica Bancorporation | 273,718 | 12,796 |
| | Waddell & Reed Financial Inc. Class A | 444,041 | 12,726 |
| | PennyMac Mortgage Investment Trust | 832,507 | 12,704 |
| * | Beneficial Bancorp Inc. | 935,766 | 12,464 |
| | CYS Investments Inc. | 1,747,031 | 12,456 |
| | WesBanco Inc. | 412,909 | 12,396 |
| | Redwood Trust Inc. | 926,878 | 12,235 |
| | Government Properties Income Trust | 762,569 | 12,102 |
| | First Financial Bancorp | 660,954 | 11,943 |
| | Corporate Office Properties Trust | 533,469 | 11,646 |
| | S&T Bancorp Inc. | 373,262 | 11,504 |
| * | Navigators Group Inc. | 130,193 | 11,169 |
| | Franklin Street Properties Corp. | 1,074,187 | 11,118 |
| * | iStar Inc. | 909,254 | 10,666 |
| * | MBIA Inc. | 1,639,876 | 10,626 |
| | Boston Private Financial Holdings Inc. | 896,933 | 10,171 |
| | Infinity Property & Casualty Corp. | 120,408 | 9,901 |
| | Maiden Holdings Ltd. | 663,401 | 9,891 |
| | ARMOUR Residential REIT Inc. | 448,358 | 9,756 |
| | Berkshire Hills Bancorp Inc. | 331,287 | 9,644 |
| * | FNFV Group | 855,577 | 9,608 |
| | Capstead Mortgage Corp. | 1,078,266 | 9,424 |
| | Monogram Residential Trust Inc. | 937,701 | 9,152 |
| | Safety Insurance Group Inc. | 161,481 | 9,104 |
| | First Commonwealth Financial Corp. | 1,001,363 | 9,082 |
| * | Walker & Dunlop Inc. | 309,609 | 8,920 |
| | Nelnet Inc. Class A | 263,174 | 8,835 |
| * | KCG Holdings Inc. Class A | 702,838 | 8,652 |
| | Brookline Bancorp Inc. | 750,485 | 8,631 |
| | American Assets Trust Inc. | 216,943 | 8,320 |
| * | Green Dot Corp. Class A | 497,272 | 8,165 |
| | Cash America International Inc. | 271,711 | 8,138 |
| | State Bank Financial Corp. | 383,061 | 8,056 |
| | Tompkins Financial Corp. | 142,742 | 8,016 |
| | American Capital Mortgage Investment Corp. | 563,150 | 7,862 |
| | United Fire Group Inc. | 197,733 | 7,575 |
| | City Holding Co. | 163,697 | 7,471 |
| | Altisource Residential Corp. | 599,044 | 7,434 |
| | First Potomac Realty Trust | 651,222 | 7,424 |
| | Central Pacific Financial Corp. | 335,209 | 7,381 |
| | FBL Financial Group Inc. Class A | 111,599 | 7,102 |
| | Oritani Financial Corp. | 422,470 | 6,971 |
| | Universal Health Realty Income Trust | 135,088 | 6,756 |
| | Saul Centers Inc. | 131,334 | 6,734 |
| * | Piper Jaffray Cos. | 162,639 | 6,571 |
| | Ashford Hospitality Trust Inc. | 1,022,020 | 6,449 |
| | National Western Life Group Inc. Class A | 25,167 | 6,341 |
| | Virtu Financial Inc. Class A | 277,396 | 6,280 |
| | Rouse Properties Inc. | 425,650 | 6,197 |
| * | Greenlight Capital Re Ltd. Class A | 329,929 | 6,173 |
| | Investment Technology Group Inc. | 360,140 | 6,130 |
| | United Community Banks Inc. | 302,591 | 5,898 |
| | Dime Community Bancshares Inc. | 336,373 | 5,883 |
| *,^ | Walter Investment Management Corp. | 405,351 | 5,764 |
| | Virtus Investment Partners Inc. | 46,512 | 5,463 |
| * | Ambac Financial Group Inc. | 385,125 | 5,426 |
| ^ | Seritage Growth Properties Class A | 132,926 | 5,346 |
| * | Flagstar Bancorp Inc. | 221,686 | 5,123 |
45
| | | |
| Vanguard® Small-Cap Value Index Fund | | |
| Schedule of Investments | | |
| December 31, 2015 | | |
| |
| | | | Market |
| | | | Value |
| | | Shares | ($000) |
| | Investors Real Estate Trust | 704,570 | 4,897 |
| | Anworth Mortgage Asset Corp. | 1,123,645 | 4,888 |
| | Getty Realty Corp. | 281,349 | 4,825 |
| | Employers Holdings Inc. | 170,968 | 4,667 |
| | Ashford Hospitality Prime Inc. | 303,577 | 4,402 |
| | Resource Capital Corp. | 338,145 | 4,315 |
| * | First BanCorp | 1,327,466 | 4,314 |
| | BancFirst Corp. | 69,977 | 4,102 |
| | AG Mortgage Investment Trust Inc. | 318,925 | 4,095 |
| | OFG Bancorp | 494,467 | 3,620 |
| | Northfield Bancorp Inc. | 217,372 | 3,461 |
| | National Bank Holdings Corp. Class A | 161,656 | 3,455 |
| | Fidelity & Guaranty Life | 132,660 | 3,366 |
| | State Auto Financial Corp. | 162,343 | 3,343 |
| | OneBeacon Insurance Group Ltd. Class A | 251,728 | 3,124 |
| * | EZCORP Inc. Class A | 555,137 | 2,770 |
| | Newcastle Investment Corp. | 634,363 | 2,588 |
| * | World Acceptance Corp. | 65,282 | 2,422 |
| * | Forestar Group Inc. | 179,891 | 1,968 |
| | Urstadt Biddle Properties Inc. Class A | 99,624 | 1,917 |
| * | MoneyGram International Inc. | 299,849 | 1,880 |
| | Houlihan Lokey Inc. | 52,410 | 1,374 |
| * | RMR Group Inc. Class A | 76,007 | 1,095 |
| * | Enova International Inc. | 120,407 | 796 |
| | GAMCO Investors Inc. Class A | 24,533 | 762 |
| | Urstadt Biddle Properties Inc. | 42,332 | 754 |
| * | PICO Holdings Inc. | 64,550 | 666 |
| | NorthStar Realty Europe Corp. | 22,612 | 267 |
| | | | 5,109,686 |
| Health Care (6.2%) | | |
| | Teleflex Inc. | 468,883 | 61,635 |
| * | Health Net Inc. | 827,641 | 56,660 |
| * | Ultragenyx Pharmaceutical Inc. | 393,455 | 44,138 |
| * | Charles River Laboratories International Inc. | 525,449 | 42,241 |
| * | WellCare Health Plans Inc. | 497,130 | 38,880 |
| * | Alere Inc. | 972,203 | 38,003 |
| * | STERIS plc | 483,588 | 36,433 |
| * | LifePoint Health Inc. | 490,575 | 36,008 |
| | HealthSouth Corp. | 979,049 | 34,081 |
| * | Tenet Healthcare Corp. | 1,123,365 | 34,038 |
| * | Community Health Systems Inc. | 1,265,494 | 33,573 |
| * | Bio-Rad Laboratories Inc. Class A | 231,574 | 32,110 |
| | Hill-Rom Holdings Inc. | 661,069 | 31,771 |
| * | Prestige Brands Holdings Inc. | 594,491 | 30,604 |
| * | Molina Healthcare Inc. | 474,017 | 28,503 |
| * | Portola Pharmaceuticals Inc. | 534,848 | 27,518 |
| *,^ | Kite Pharma Inc. | 431,044 | 26,561 |
| | Owens & Minor Inc. | 708,810 | 25,503 |
| * | Ophthotech Corp. | 295,467 | 23,203 |
| * | Integra LifeSciences Holdings Corp. | 333,394 | 22,597 |
| * | VWR Corp. | 666,231 | 18,861 |
| * | Magellan Health Inc. | 288,138 | 17,767 |
| * | Halyard Health Inc. | 525,318 | 17,551 |
| *,^ | Juno Therapeutics Inc. | 397,425 | 17,475 |
| * | Celldex Therapeutics Inc. | 1,111,673 | 17,431 |
| * | TESARO Inc. | 316,725 | 16,571 |
| * | Sage Therapeutics Inc. | 244,354 | 14,246 |
| | Select Medical Holdings Corp. | 1,186,180 | 14,127 |
| * | Clovis Oncology Inc. | 367,631 | 12,867 |
| * | Surgical Care Affiliates Inc. | 312,728 | 12,450 |
| | CONMED Corp. | 281,434 | 12,397 |
| *,^ | Cempra Inc. | 372,166 | 11,585 |
| | Kindred Healthcare Inc. | 945,754 | 11,264 |
| * | PTC Therapeutics Inc. | 328,834 | 10,654 |
46
| | | |
| Vanguard® Small-Cap Value Index Fund | | |
| Schedule of Investments | | |
| December 31, 2015 | | |
| |
| | | | Market |
| | | | Value |
| | | Shares | ($000) |
| * | Aduro Biotech Inc. | 284,614 | 8,009 |
| * | LHC Group Inc. | 162,243 | 7,348 |
| | National HealthCare Corp. | 108,963 | 6,723 |
| * | Achillion Pharmaceuticals Inc. | 616,412 | 6,651 |
| *,^ | Synergy Pharmaceuticals Inc. | 1,152,882 | 6,537 |
| * | Intra-Cellular Therapies Inc. Class A | 121,288 | 6,524 |
| | PDL BioPharma Inc. | 1,842,867 | 6,524 |
| * | Amicus Therapeutics Inc. | 661,525 | 6,417 |
| * | Hanger Inc. | 377,791 | 6,215 |
| | Ensign Group Inc. | 260,617 | 5,898 |
| | Invacare Corp. | 337,428 | 5,868 |
| * | Healthways Inc. | 343,792 | 4,425 |
| *,^ | Spark Therapeutics Inc. | 97,516 | 4,418 |
| * | Merit Medical Systems Inc. | 235,651 | 4,381 |
| * | Chimerix Inc. | 466,891 | 4,179 |
| | Universal American Corp. | 543,654 | 3,806 |
| * | Global Blood Therapeutics Inc. | 102,500 | 3,314 |
| *,^ | NantKwest Inc. | 136,750 | 2,370 |
| * | Glaukos Corp. | 90,382 | 2,231 |
| * | Aimmune Therapeutics Inc. | 119,015 | 2,196 |
| *,^ | Teladoc Inc. | 108,280 | 1,945 |
| *,^ | Esperion Therapeutics Inc. | 82,461 | 1,836 |
| *,^ | Seres Therapeutics Inc. | 43,777 | 1,536 |
| * | Wright Medical Group Inc. CVR | 71,097 | 72 |
| * | Penumbra Inc. | 338 | 18 |
| | | | 1,018,747 |
| Industrials (19.8%) | | |
| * | Spirit AeroSystems Holdings Inc. Class A | 1,582,284 | 79,225 |
| | Valspar Corp. | 895,660 | 74,295 |
| | Broadridge Financial Solutions Inc. | 1,336,658 | 71,819 |
| | Allegion plc | 1,081,007 | 71,260 |
| | PerkinElmer Inc. | 1,261,656 | 67,587 |
| | Huntington Ingalls Industries Inc. | 529,492 | 67,166 |
| | IDEX Corp. | 862,440 | 66,072 |
| | Carlisle Cos. Inc. | 732,631 | 64,977 |
| | Orbital ATK Inc. | 663,022 | 59,234 |
| * | AECOM | 1,706,631 | 51,250 |
| | AptarGroup Inc. | 703,805 | 51,131 |
| * | Berry Plastics Group Inc. | 1,352,557 | 48,936 |
| | Bemis Co. Inc. | 1,081,738 | 48,343 |
| | Graphic Packaging Holding Co. | 3,693,240 | 47,384 |
| | Sonoco Products Co. | 1,137,663 | 46,496 |
| | Jabil Circuit Inc. | 1,920,071 | 44,718 |
| | Trinity Industries Inc. | 1,722,886 | 41,384 |
| | MDU Resources Group Inc. | 2,200,955 | 40,322 |
| | Booz Allen Hamilton Holding Corp. Class A | 1,238,261 | 38,200 |
| | Lincoln Electric Holdings Inc. | 735,070 | 38,143 |
| | ITT Corp. | 1,008,742 | 36,638 |
| | Packaging Corp. of America | 550,716 | 34,723 |
| | RR Donnelley & Sons Co. | 2,352,381 | 34,627 |
| | BWX Technologies Inc. | 1,080,209 | 34,318 |
| | Ryder System Inc. | 602,120 | 34,219 |
| * | CoreLogic Inc. | 993,511 | 33,640 |
| | Oshkosh Corp. | 843,226 | 32,920 |
| | EMCOR Group Inc. | 671,667 | 32,267 |
| * | Kirby Corp. | 608,765 | 32,033 |
| * | Teledyne Technologies Inc. | 359,471 | 31,885 |
| | Curtiss-Wright Corp. | 463,787 | 31,769 |
| * | Owens-Illinois Inc. | 1,812,874 | 31,580 |
| | World Fuel Services Corp. | 797,769 | 30,682 |
| | Deluxe Corp. | 554,753 | 30,256 |
| | Regal Beloit Corp. | 503,386 | 29,458 |
| | EnerSys | 500,342 | 27,984 |
| | KBR Inc. | 1,626,017 | 27,512 |
47
| | | |
| Vanguard® Small-Cap Value Index Fund | | |
| Schedule of Investments | | |
| December 31, 2015 | | |
| |
| | | | Market |
| | | | Value |
| | | Shares | ($000) |
| * | Esterline Technologies Corp. | 333,038 | 26,976 |
| | Littelfuse Inc. | 251,266 | 26,888 |
| | Valmont Industries Inc. | 246,628 | 26,148 |
| | Silgan Holdings Inc. | 476,454 | 25,595 |
| | Crane Co. | 523,578 | 25,048 |
| | Convergys Corp. | 989,422 | 24,627 |
| | Timken Co. | 841,892 | 24,070 |
| | Global Payments Inc. | 366,008 | 23,611 |
| * | Moog Inc. Class A | 375,508 | 22,756 |
| | Belden Inc. | 473,114 | 22,558 |
| *,^ | Generac Holdings Inc. | 756,998 | 22,536 |
| | Triumph Group Inc. | 555,856 | 22,095 |
| | Terex Corp. | 1,161,784 | 21,470 |
| | Donaldson Co. Inc. | 747,480 | 21,423 |
| ^ | Manitowoc Co. Inc. | 1,385,635 | 21,270 |
| | Matson Inc. | 490,812 | 20,923 |
| * | WESCO International Inc. | 474,892 | 20,743 |
| * | Euronet Worldwide Inc. | 282,670 | 20,474 |
| | GATX Corp. | 477,910 | 20,335 |
| | Barnes Group Inc. | 556,931 | 19,710 |
| | Korn/Ferry International | 577,046 | 19,146 |
| * | Anixter International Inc. | 315,825 | 19,073 |
| | AGCO Corp. | 409,616 | 18,592 |
| | Vishay Intertechnology Inc. | 1,526,421 | 18,393 |
| * | KLX Inc. | 594,472 | 18,304 |
| * | Coherent Inc. | 279,867 | 18,222 |
| * | Sanmina Corp. | 883,641 | 18,185 |
| * | Greatbatch Inc. | 344,348 | 18,078 |
| | UniFirst Corp. | 171,881 | 17,910 |
| * | Quanta Services Inc. | 862,652 | 17,469 |
| * | Rexnord Corp. | 962,758 | 17,445 |
| | Kennametal Inc. | 897,191 | 17,226 |
| | Granite Construction Inc. | 400,010 | 17,164 |
| | ABM Industries Inc. | 602,268 | 17,147 |
| | Applied Industrial Technologies Inc. | 421,629 | 17,072 |
| | Tetra Tech Inc. | 632,851 | 16,467 |
| * | FTI Consulting Inc. | 473,461 | 16,410 |
| | John Bean Technologies Corp. | 328,408 | 16,365 |
| | Brink's Co. | 551,848 | 15,926 |
| | Watts Water Technologies Inc. Class A | 317,514 | 15,771 |
| | MSA Safety Inc. | 358,245 | 15,573 |
| | Universal Forest Products Inc. | 227,253 | 15,537 |
| * | Itron Inc. | 427,723 | 15,475 |
| | MSC Industrial Direct Co. Inc. Class A | 272,496 | 15,333 |
| | Actuant Corp. Class A | 606,354 | 14,528 |
| * | Louisiana-Pacific Corp. | 806,126 | 14,518 |
| | Aircastle Ltd. | 687,181 | 14,355 |
| *,^ | NeuStar Inc. Class A | 598,328 | 14,342 |
| | CLARCOR Inc. | 280,986 | 13,959 |
| | Joy Global Inc. | 1,100,104 | 13,872 |
| | Essendant Inc. | 422,014 | 13,720 |
| | G&K Services Inc. Class A | 214,001 | 13,461 |
| * | Sykes Enterprises Inc. | 434,355 | 13,369 |
| *,^ | Knowles Corp. | 998,127 | 13,305 |
| * | Plexus Corp. | 377,226 | 13,173 |
| * | Babcock & Wilcox Enterprises Inc. | 605,075 | 12,628 |
| * | MasTec Inc. | 721,301 | 12,536 |
| | Kaman Corp. | 305,767 | 12,478 |
| | Cubic Corp. | 258,739 | 12,225 |
| * | TrueBlue Inc. | 473,656 | 12,201 |
| * | SPX FLOW Inc. | 436,636 | 12,187 |
| | Standex International Corp. | 144,172 | 11,988 |
| * | Benchmark Electronics Inc. | 570,282 | 11,788 |
| | Brady Corp. Class A | 504,337 | 11,590 |
48
| | | |
| Vanguard® Small-Cap Value Index Fund | | |
| Schedule of Investments | | |
| December 31, 2015 | | |
| |
| | | | Market |
| | | | Value |
| | | Shares | ($000) |
| | EVERTEC Inc. | 687,165 | 11,503 |
| * | Atlas Air Worldwide Holdings Inc. | 277,992 | 11,492 |
| * | Colfax Corp. | 490,787 | 11,460 |
| | Werner Enterprises Inc. | 486,882 | 11,388 |
| | Otter Tail Corp. | 426,025 | 11,345 |
| * | Boise Cascade Co. | 438,232 | 11,188 |
| * | PHH Corp. | 675,444 | 10,942 |
| * | Armstrong World Industries Inc. | 234,292 | 10,714 |
| | MTS Systems Corp. | 168,602 | 10,691 |
| | ESCO Technologies Inc. | 279,866 | 10,114 |
| | Greenbrier Cos. Inc. | 304,727 | 9,940 |
| | Greif Inc. Class A | 322,345 | 9,931 |
| | AAR Corp. | 376,379 | 9,895 |
| | Covanta Holding Corp. | 636,832 | 9,865 |
| * | TriMas Corp. | 509,573 | 9,504 |
| | Insperity Inc. | 192,752 | 9,281 |
| * | Meritor Inc. | 1,045,655 | 8,731 |
| * | Navigant Consulting Inc. | 535,673 | 8,603 |
| | Astec Industries Inc. | 207,040 | 8,427 |
| | ManTech International Corp. Class A | 274,355 | 8,297 |
| | Mobile Mini Inc. | 252,011 | 7,845 |
| | CIRCOR International Inc. | 185,621 | 7,824 |
| | Encore Wire Corp. | 209,466 | 7,769 |
| * | Aegion Corp. Class A | 387,749 | 7,487 |
| | Kforce Inc. | 293,272 | 7,414 |
| * | Tutor Perini Corp. | 442,172 | 7,402 |
| | Mueller Water Products Inc. Class A | 858,987 | 7,387 |
| * | Wesco Aircraft Holdings Inc. | 604,993 | 7,242 |
| * | Rofin-Sinar Technologies Inc. | 269,902 | 7,228 |
| * | UTi Worldwide Inc. | 1,015,582 | 7,140 |
| ^ | Outerwall Inc. | 194,603 | 7,111 |
| | Harsco Corp. | 902,240 | 7,110 |
| | General Cable Corp. | 523,191 | 7,026 |
| | Altra Industrial Motion Corp. | 278,393 | 6,982 |
| * | Newport Corp. | 412,949 | 6,554 |
| | Resources Connection Inc. | 397,520 | 6,495 |
| | Materion Corp. | 225,371 | 6,310 |
| | McGrath RentCorp | 245,997 | 6,197 |
| | Comfort Systems USA Inc. | 211,343 | 6,006 |
| | TAL International Group Inc. | 375,358 | 5,968 |
| | ArcBest Corp. | 278,357 | 5,954 |
| | Albany International Corp. | 162,263 | 5,931 |
| * | Air Transport Services Group Inc. | 581,064 | 5,857 |
| | AVX Corp. | 473,429 | 5,747 |
| * | Monster Worldwide Inc. | 978,794 | 5,609 |
| | Kelly Services Inc. Class A | 331,426 | 5,353 |
| | TeleTech Holdings Inc. | 191,210 | 5,337 |
| * | TTM Technologies Inc. | 778,911 | 5,071 |
| *,^ | Navistar International Corp. | 549,007 | 4,853 |
| * | Nortek Inc. | 109,541 | 4,778 |
| * | DHI Group Inc. | 502,124 | 4,605 |
| * | Wabash National Corp. | 372,999 | 4,413 |
| | Hyster-Yale Materials Handling Inc. | 83,279 | 4,368 |
| | Schnitzer Steel Industries Inc. | 280,880 | 4,036 |
| | SPX Corp. | 412,202 | 3,846 |
| ^ | Textainer Group Holdings Ltd. | 255,831 | 3,610 |
| | Griffon Corp. | 202,727 | 3,609 |
| | Landauer Inc. | 107,491 | 3,539 |
| * | DXP Enterprises Inc. | 146,027 | 3,329 |
| | Park Electrochemical Corp. | 215,976 | 3,253 |
| | American Science & Engineering Inc. | 76,363 | 3,160 |
| | H&E Equipment Services Inc. | 178,867 | 3,127 |
| | TimkenSteel Corp. | 347,217 | 2,910 |
| | Quad/Graphics Inc. | 299,282 | 2,783 |
49
| | | |
| Vanguard® Small-Cap Value Index Fund | | |
| Schedule of Investments | | |
| December 31, 2015 | | |
| |
| | | | Market |
| | | | Value |
| | | Shares | ($000) |
| | Checkpoint Systems Inc. | 221,606 | 1,389 |
| | Greif Inc. Class B | 29,650 | 1,268 |
| * | Milacron Holdings Corp. | 94,383 | 1,181 |
| | Acacia Research Corp. | 271,646 | 1,165 |
| * | CAI International Inc. | 90,770 | 915 |
| * | Overseas Shipholding Group Inc. Class B | 78,585 | 260 |
| * | Overseas Shipholding Group Inc. Class A | 7,860 | 22 |
| | | | 3,253,301 |
| Oil & Gas (4.1%) | | |
| * | Newfield Exploration Co. | 1,841,879 | 59,972 |
| * | First Solar Inc. | 853,156 | 56,300 |
| | PBF Energy Inc. Class A | 1,100,303 | 40,502 |
| | Nabors Industries Ltd. | 3,539,726 | 30,123 |
| ^ | Noble Corp. plc | 2,727,450 | 28,775 |
| | Western Refining Inc. | 791,950 | 28,209 |
| | QEP Resources Inc. | 1,992,056 | 26,694 |
| | Rowan Cos. plc Class A | 1,406,825 | 23,846 |
| | Superior Energy Services Inc. | 1,699,063 | 22,886 |
| * | Whiting Petroleum Corp. | 2,300,980 | 21,721 |
| | Ensco plc Class A | 1,327,039 | 20,423 |
| *,^ | NOW Inc. | 1,147,798 | 18,158 |
| * | WPX Energy Inc. | 3,106,569 | 17,832 |
| * | Oil States International Inc. | 573,386 | 15,625 |
| * | Southwestern Energy Co. | 2,169,536 | 15,425 |
| | Chesapeake Energy Corp. | 3,377,494 | 15,199 |
| | SM Energy Co. | 766,861 | 15,076 |
| ^ | Diamond Offshore Drilling Inc. | 696,546 | 14,697 |
| | Delek US Holdings Inc. | 596,710 | 14,679 |
| * | MRC Global Inc. | 1,095,775 | 14,135 |
| * | Oasis Petroleum Inc. | 1,491,500 | 10,992 |
| | Bristow Group Inc. | 373,591 | 9,676 |
| * | SEACOR Holdings Inc. | 175,825 | 9,241 |
| * | McDermott International Inc. | 2,689,639 | 9,010 |
| * | Forum Energy Technologies Inc. | 661,733 | 8,245 |
| | California Resources Corp. | 3,494,851 | 8,143 |
| ^ | Denbury Resources Inc. | 4,000,908 | 8,082 |
| | CVR Energy Inc. | 195,645 | 7,699 |
| | SemGroup Corp. Class A | 247,332 | 7,138 |
| | Atwood Oceanics Inc. | 691,917 | 7,078 |
| * | Unit Corp. | 567,988 | 6,929 |
| * | TETRA Technologies Inc. | 858,977 | 6,460 |
| * | Chart Industries Inc. | 344,190 | 6,182 |
| * | Exterran Corp. | 372,328 | 5,976 |
| * | Helix Energy Solutions Group Inc. | 1,078,072 | 5,671 |
| * | Archrock Inc. | 744,590 | 5,599 |
| | Alon USA Energy Inc. | 358,423 | 5,319 |
| *,^ | Laredo Petroleum Inc. | 663,555 | 5,302 |
| * | Newpark Resources Inc. | 897,320 | 4,738 |
| | Green Plains Inc. | 197,491 | 4,523 |
| *,^ | Ultra Petroleum Corp. | 1,634,288 | 4,086 |
| ^ | CARBO Ceramics Inc. | 222,094 | 3,820 |
| ^ | Tidewater Inc. | 527,166 | 3,669 |
| * | Hornbeck Offshore Services Inc. | 341,971 | 3,399 |
| | Tesco Corp. | 417,630 | 3,024 |
| * | Stone Energy Corp. | 611,303 | 2,622 |
| * | Parker Drilling Co. | 1,318,993 | 2,401 |
| *,^ | EP Energy Corp. Class A | 419,275 | 1,836 |
| *,^ | EXCO Resources Inc. | 954,322 | 1,183 |
| * | Bill Barrett Corp. | 281,569 | 1,107 |
| *,^ | Northern Oil and Gas Inc. | 283,823 | 1,096 |
| * | W&T Offshore Inc. | 195,458 | 452 |
| * | SandRidge Energy Inc. | 1,628,437 | 326 |
| * | Pioneer Energy Services Corp. | 38,800 | 84 |
| *,^ | Gulfmark Offshore Inc. | 8,020 | 37 |
50
| | | |
| Vanguard® Small-Cap Value Index Fund | | |
| Schedule of Investments | | |
| December 31, 2015 | | |
| |
| | | | Market |
| | | | Value |
| | | Shares | ($000) |
| * | Basic Energy Services Inc. | 132 | — |
| | | | 671,422 |
| Other (0.0%)2 | | |
| * | Leap Wireless International Inc CVR | 474,686 | 1,196 |
| * | Clinical Data Contingent Value Rights | 62,138 | — |
| | | | 1,196 |
| Technology (8.0%) | | |
| | CDW Corp. | 1,707,058 | 71,765 |
| | Ingram Micro Inc. | 1,687,225 | 51,258 |
| | Teradyne Inc. | 2,316,531 | 47,883 |
| | Pitney Bowes Inc. | 2,221,024 | 45,864 |
| | Leidos Holdings Inc. | 812,275 | 45,699 |
| * | ON Semiconductor Corp. | 4,651,848 | 45,588 |
| * | ARRIS Group Inc. | 1,487,720 | 45,480 |
| *,^ | NCR Corp. | 1,819,273 | 44,499 |
| | Brocade Communications Systems Inc. | 4,673,211 | 42,900 |
| | DST Systems Inc. | 370,522 | 42,262 |
| * | CommScope Holding Co. Inc. | 1,396,857 | 36,165 |
| * | Microsemi Corp. | 1,084,383 | 35,340 |
| | Cypress Semiconductor Corp. | 3,574,606 | 35,067 |
| * | VeriFone Systems Inc. | 1,230,851 | 34,488 |
| | SYNNEX Corp. | 334,512 | 30,083 |
| * | Verint Systems Inc. | 700,378 | 28,407 |
| * | Fairchild Semiconductor International Inc. Class A | 1,278,102 | 26,470 |
| | Computer Sciences Corp. | 782,082 | 25,558 |
| * | CACI International Inc. Class A | 273,214 | 25,349 |
| * | Tech Data Corp. | 378,229 | 25,107 |
| | Mentor Graphics Corp. | 1,321,345 | 24,339 |
| | Lexmark International Inc. Class A | 696,697 | 22,608 |
| | MKS Instruments Inc. | 600,270 | 21,610 |
| | j2 Global Inc. | 259,771 | 21,384 |
| * | Cirrus Logic Inc. | 717,866 | 21,199 |
| *,^ | Advanced Micro Devices Inc. | 7,125,452 | 20,450 |
| | Science Applications International Corp. | 440,943 | 20,186 |
| | Diebold Inc. | 659,138 | 19,833 |
| * | Teradata Corp. | 749,530 | 19,803 |
| * | EchoStar Corp. Class A | 506,119 | 19,794 |
| * | MedAssets Inc. | 634,724 | 19,638 |
| * | OmniVision Technologies Inc. | 671,590 | 19,490 |
| | Intersil Corp. Class A | 1,493,511 | 19,057 |
| * | Polycom Inc. | 1,492,775 | 18,794 |
| * | Viavi Solutions Inc. | 2,678,319 | 16,311 |
| * | Rovi Corp. | 886,045 | 14,762 |
| * | NETGEAR Inc. | 337,832 | 14,159 |
| * | Semtech Corp. | 736,834 | 13,941 |
| * | PMC-Sierra Inc. | 1,121,524 | 13,032 |
| * | Progress Software Corp. | 538,362 | 12,921 |
| | CSG Systems International Inc. | 350,568 | 12,613 |
| * | Advanced Energy Industries Inc. | 440,075 | 12,423 |
| | West Corp. | 563,611 | 12,157 |
| * | QLogic Corp. | 946,177 | 11,543 |
| * | Cabot Microelectronics Corp. | 262,293 | 11,483 |
| * | Insight Enterprises Inc. | 418,678 | 10,517 |
| * | ScanSource Inc. | 301,193 | 9,704 |
| | ADTRAN Inc. | 557,739 | 9,604 |
| | Quality Systems Inc. | 582,274 | 9,386 |
| | Ebix Inc. | 285,026 | 9,346 |
| | Brooks Automation Inc. | 723,624 | 7,728 |
| * | Amkor Technology Inc. | 1,069,759 | 6,504 |
| * | Unisys Corp. | 563,596 | 6,228 |
| * | FormFactor Inc. | 656,402 | 5,908 |
| * | Ixia | 429,292 | 5,336 |
| | Epiq Systems Inc. | 336,808 | 4,402 |
| * | Blucora Inc. | 437,009 | 4,283 |
51
| | | |
| Vanguard® Small-Cap Value Index Fund | | |
| Schedule of Investments | | |
| December 31, 2015 | | |
| |
| | | | Market |
| | | | Value |
| | | Shares | ($000) |
| | Comtech Telecommunications Corp. | 172,052 | 3,457 |
| * | Mercury Systems Inc. | 185,718 | 3,410 |
| * | Harmonic Inc. | 490,715 | 1,997 |
| * | Tangoe Inc. | 210,120 | 1,763 |
| * | Systemax Inc. | 148,816 | 1,280 |
| * | Quantum Corp. | 1,333,864 | 1,241 |
| *,^ | Rapid7 Inc. | 58,325 | 882 |
| * | Match Group Inc. | 17,719 | 240 |
| * | Pendrell Corp. | 451,321 | 226 |
| * | Square Inc. | 1,013 | 13 |
| | | | 1,322,217 |
| Telecommunications (0.5%) | | |
| | Telephone & Data Systems Inc. | 1,030,236 | 26,673 |
| * | Vonage Holdings Corp. | 2,048,682 | 11,759 |
| | Consolidated Communications Holdings Inc. | 541,528 | 11,345 |
| | EarthLink Holdings Corp. | 1,169,135 | 8,687 |
| *,^ | Iridium Communications Inc. | 908,900 | 7,644 |
| ^ | Windstream Holdings Inc. | 1,137,821 | 7,328 |
| * | United States Cellular Corp. | 144,551 | 5,899 |
| | Atlantic Tele-Network Inc. | 58,563 | 4,581 |
| *,^ | Intelsat SA | 296,972 | 1,235 |
| | | | 85,151 |
| Utilities (7.4%) | | |
| | AGL Resources Inc. | 1,355,241 | 86,478 |
| | Atmos Energy Corp. | 1,144,115 | 72,125 |
| | TECO Energy Inc. | 2,651,403 | 70,660 |
| | Westar Energy Inc. Class A | 1,593,085 | 67,563 |
| | UGI Corp. | 1,947,467 | 65,746 |
| | Aqua America Inc. | 1,988,654 | 59,262 |
| | Piedmont Natural Gas Co. Inc. | 892,699 | 50,902 |
| | Great Plains Energy Inc. | 1,739,967 | 47,518 |
| | Vectren Corp. | 932,133 | 39,541 |
| | IDACORP Inc. | 567,420 | 38,584 |
| | Questar Corp. | 1,970,812 | 38,391 |
| | Portland General Electric Co. | 1,000,598 | 36,392 |
| | Cleco Corp. | 681,739 | 35,594 |
| | WGL Holdings Inc. | 561,687 | 35,381 |
| | Hawaiian Electric Industries Inc. | 1,211,220 | 35,065 |
| | New Jersey Resources Corp. | 966,985 | 31,872 |
| | ONE Gas Inc. | 587,879 | 29,494 |
| | NorthWestern Corp. | 542,889 | 29,452 |
| | ALLETE Inc. | 551,884 | 28,052 |
| | Southwest Gas Corp. | 507,275 | 27,981 |
| | Laclede Group Inc. | 464,109 | 27,573 |
| | PNM Resources Inc. | 897,799 | 27,446 |
| | Black Hills Corp. | 567,521 | 26,350 |
| | Avista Corp. | 667,113 | 23,596 |
| | NRG Energy Inc. | 1,770,486 | 20,839 |
| | National Fuel Gas Co. | 453,100 | 19,370 |
| | South Jersey Industries Inc. | 780,977 | 18,368 |
| | MGE Energy Inc. | 390,729 | 18,130 |
| | El Paso Electric Co. | 455,557 | 17,539 |
| | American States Water Co. | 413,946 | 17,365 |
| | Northwest Natural Gas Co. | 308,489 | 15,613 |
| | Empire District Electric Co. | 494,227 | 13,873 |
| * | Avangrid Inc. | 348,570 | 13,385 |
| | California Water Service Group | 540,321 | 12,573 |
| * | Dynegy Inc. | 678,598 | 9,093 |
| * | Talen Energy Corp. | 942,732 | 5,873 |
| | Atlantic Power Corp. | 617,312 | 1,216 |
| |
| | | | 1,214,255 |
| Total Common Stocks (Cost $14,861,700) | | 16,413,090 |
52
| | | | | |
| Vanguard® Small-Cap Value Index Fund | | | | |
| Schedule of Investments | | | | |
| December 31, 2015 | | | | |
| |
| | | | | | Market |
| | | | | | Value |
| | | Coupon | | Shares | ($000) |
| Temporary Cash Investments (1.5%)1 | | | | |
| Money Market Fund (1.5%) | | | | |
| 3,4 | Vanguard Market Liquidity Fund | 0.363% | | 246,960,112 | 246,960 |
| |
| |
| | | | | Face | |
| | | | | Amount | |
| | | | Maturity Date | ($000) | |
| U.S. Government and Agency Obligations (0.0%) | | | | |
| 5,6 | Federal Home Loan Bank Discount Notes | 0.371% | 5/4/16 | 3,000 | 2,995 |
| 5,6 | Federal Home Loan Bank Discount Notes | 0.617% | 6/10/16 | 1,000 | 997 |
| | | | | | 3,992 |
| Total Temporary Cash Investments (Cost $250,953) | | | | 250,952 |
| Total Investments (101.3%) (Cost $15,112,653) | | | | 16,664,042 |
| Other Assets and Liabilities—Net (-1.3%)4 | | | | (211,572) |
| Net Assets (100%) | | | | 16,452,470 |
* Non-income-producing security.
^ Includes partial security positions on loan to broker-dealers. The total value of securities on loan is $150,673,000.
1 The fund invests a portion of its cash reserves in equity markets through the use of index futures contracts and swap contracts. After giving effect to futures and swap investments, the fund's effective common stock and temporary cash investment positions represent 100.0% and 1.3%, respectively, of net assets.
2 “Other” represents securities that are not classified by the fund’s benchmark index.
3 Affiliated money market fund available only to Vanguard funds and certain trusts and accounts managed by Vanguard. Rate shown is the 7-day yield.
4 Includes $160,934,000 of collateral received for securities on loan.
5 The issuer operates under a congressional charter; its securities are generally neither guaranteed by the U.S. Treasury nor backed by the full faith and credit of the U.S. government.
6 Securities with a value of $2,395,000 have been segregated as initial margin for open futures contracts.
REIT—Real Estate Investment Trust.
53
© 2016 The Vanguard Group, Inc. All rights reserved.
Vanguard Marketing Corporation, Distributor.
SNA480 022016
| | | |
| Vanguard® Extended Market Index Fund | | |
| Schedule of Investments | | |
| December 31, 2015 | | |
| |
| | | | Market |
| | | | Value |
| | | Shares | ($000) |
| |
| Common Stocks (99.9%)1 | | |
| Consumer Discretionary (15.4%) | | |
| * | Liberty Global plc | 6,928,207 | 282,463 |
| *,^ | Tesla Motors Inc. | 1,048,669 | 251,691 |
| | Las Vegas Sands Corp. | 3,808,202 | 166,952 |
| *,^ | Charter Communications Inc. Class A | 788,729 | 144,416 |
| * | DISH Network Corp. Class A | 2,334,721 | 133,499 |
| * | Jarden Corp. | 2,152,174 | 122,932 |
| * | Ulta Salon Cosmetics & Fragrance Inc. | 662,040 | 122,477 |
| | Hilton Worldwide Holdings Inc. | 5,444,994 | 116,523 |
| ^ | Autoliv Inc. | 909,284 | 113,451 |
| * | MGM Resorts International | 4,910,508 | 111,567 |
| * | Norwegian Cruise Line Holdings Ltd. | 1,654,377 | 96,947 |
| | Lear Corp. | 779,675 | 95,767 |
| * | LKQ Corp. | 3,152,502 | 93,409 |
| | Foot Locker Inc. | 1,431,746 | 93,192 |
| * | Sirius XM Holdings Inc. | 22,795,136 | 92,776 |
| * | Liberty Global plc Class A | 2,057,608 | 87,160 |
| * | Liberty Media Corp. | 2,059,157 | 78,413 |
| | Aramark | 2,345,527 | 75,643 |
| | Domino's Pizza Inc. | 570,948 | 63,518 |
| * | NVR Inc. | 38,457 | 63,185 |
| *,^ | lululemon athletica Inc. | 1,151,639 | 60,427 |
| * | Toll Brothers Inc. | 1,683,776 | 56,070 |
| * | ServiceMaster Global Holdings Inc. | 1,410,051 | 55,330 |
| | Polaris Industries Inc. | 628,997 | 54,062 |
| | Service Corp. International | 2,048,386 | 53,299 |
| | Williams-Sonoma Inc. | 871,538 | 50,907 |
| | Six Flags Entertainment Corp. | 891,162 | 48,960 |
| | Vail Resorts Inc. | 382,032 | 48,896 |
| | Gentex Corp. | 3,033,859 | 48,572 |
| * | Panera Bread Co. Class A | 247,362 | 48,181 |
| | Brunswick Corp. | 945,204 | 47,742 |
| | Carter's Inc. | 535,767 | 47,699 |
| * | AMC Networks Inc. Class A | 636,929 | 47,566 |
| * | Tempur Sealy International Inc. | 646,228 | 45,533 |
| * | Visteon Corp. | 390,662 | 44,731 |
| * | Sally Beauty Holdings Inc. | 1,584,405 | 44,189 |
| | Dunkin' Brands Group Inc. | 971,630 | 41,382 |
| * | Liberty Media Corp. Class A | 1,039,053 | 40,783 |
| * | Skechers U.S.A. Inc. Class A | 1,341,356 | 40,522 |
| * | Live Nation Entertainment Inc. | 1,519,881 | 37,343 |
| | Cinemark Holdings Inc. | 1,109,192 | 37,080 |
| | Pool Corp. | 442,075 | 35,711 |
| * | Liberty Broadband Corp. | 684,611 | 35,504 |
| * | Madison Square Garden Co. Class A | 214,398 | 34,690 |
| * | Burlington Stores Inc. | 792,448 | 33,996 |
| | Dick's Sporting Goods Inc. | 935,701 | 33,077 |
| | Lions Gate Entertainment Corp. | 1,012,675 | 32,801 |
| ^ | Cracker Barrel Old Country Store Inc. | 252,897 | 32,075 |
| * | Buffalo Wild Wings Inc. | 198,945 | 31,762 |
| | CST Brands Inc. | 786,759 | 30,794 |
| * | Restoration Hardware Holdings Inc. | 382,082 | 30,356 |
| | CalAtlantic Group Inc. | 796,436 | 30,201 |
| * | Bright Horizons Family Solutions Inc. | 451,045 | 30,130 |
| | Brinker International Inc. | 621,404 | 29,796 |
| | Tupperware Brands Corp. | 526,572 | 29,304 |
| * | Office Depot Inc. | 5,182,930 | 29,232 |
| * | Vista Outdoor Inc. | 655,639 | 29,183 |
| | Jack in the Box Inc. | 378,505 | 29,035 |
| * | Starz | 862,969 | 28,909 |
| | American Eagle Outfitters Inc. | 1,864,476 | 28,899 |
| | Tribune Media Co. Class A | 836,634 | 28,287 |
1
| | | |
| Vanguard® Extended Market Index Fund | | |
| Schedule of Investments | | |
| December 31, 2015 | | |
| |
| | | | Market |
| | | | Value |
| | | Shares | ($000) |
| * | Helen of Troy Ltd. | 295,849 | 27,884 |
| * | Tenneco Inc. | 601,741 | 27,626 |
| | GNC Holdings Inc. Class A | 873,273 | 27,089 |
| | Thor Industries Inc. | 479,881 | 26,945 |
| * | Houghton Mifflin Harcourt Co. | 1,204,804 | 26,241 |
| | Lithia Motors Inc. Class A | 244,173 | 26,046 |
| * | Murphy USA Inc. | 416,792 | 25,316 |
| | Wendy's Co. | 2,271,283 | 24,462 |
| * | Cabela's Inc. | 511,744 | 23,914 |
| | Texas Roadhouse Inc. Class A | 665,286 | 23,797 |
| | Sinclair Broadcast Group Inc. Class A | 725,232 | 23,599 |
| * | Kate Spade & Co. | 1,320,444 | 23,464 |
| | John Wiley & Sons Inc. Class A | 510,881 | 23,005 |
| | Graham Holdings Co. Class B | 46,885 | 22,738 |
| | Dana Holding Corp. | 1,642,441 | 22,666 |
| | Monro Muffler Brake Inc. | 336,613 | 22,291 |
| | Cheesecake Factory Inc. | 478,664 | 22,071 |
| | Bloomin' Brands Inc. | 1,279,650 | 21,613 |
| * | Liberty TripAdvisor Holdings Inc. Class A | 703,746 | 21,352 |
| *,^ | JC Penney Co. Inc. | 3,174,293 | 21,141 |
| | Cooper Tire & Rubber Co. | 546,669 | 20,691 |
| | Cable One Inc. | 47,189 | 20,464 |
| | Big Lots Inc. | 524,746 | 20,224 |
| | Core-Mark Holding Co. Inc. | 244,770 | 20,056 |
| * | Grand Canyon Education Inc. | 498,646 | 20,006 |
| * | Pinnacle Entertainment Inc. | 640,121 | 19,921 |
| | Gannett Co. Inc. | 1,203,521 | 19,605 |
| * | DreamWorks Animation SKG Inc. Class A | 756,628 | 19,498 |
| | Nexstar Broadcasting Group Inc. Class A | 330,196 | 19,383 |
| * | TRI Pointe Group Inc. | 1,519,311 | 19,250 |
| | Abercrombie & Fitch Co. | 711,515 | 19,211 |
| | Penske Automotive Group Inc. | 441,512 | 18,694 |
| | Choice Hotels International Inc. | 370,342 | 18,669 |
| | Churchill Downs Inc. | 131,324 | 18,581 |
| * | G-III Apparel Group Ltd. | 417,131 | 18,462 |
| * | Five Below Inc. | 574,780 | 18,450 |
| * | Asbury Automotive Group Inc. | 271,494 | 18,310 |
| | Wolverine World Wide Inc. | 1,084,747 | 18,126 |
| | Time Inc. | 1,155,482 | 18,106 |
| * | Gentherm Inc. | 379,501 | 17,988 |
| | Group 1 Automotive Inc. | 236,867 | 17,931 |
| | DSW Inc. Class A | 750,215 | 17,900 |
| * | Steven Madden Ltd. | 590,622 | 17,849 |
| * | Ascena Retail Group Inc. | 1,805,173 | 17,781 |
| | New York Times Co. Class A | 1,311,977 | 17,607 |
| * | Michaels Cos. Inc. | 791,120 | 17,492 |
| | HSN Inc. | 344,316 | 17,447 |
| | Papa John's International Inc. | 311,443 | 17,400 |
| | Sonic Corp. | 521,825 | 16,860 |
| | Meredith Corp. | 389,689 | 16,854 |
| * | Shutterfly Inc. | 375,539 | 16,734 |
| * | Boyd Gaming Corp. | 838,665 | 16,664 |
| | Marriott Vacations Worldwide Corp. | 291,133 | 16,580 |
| | Sotheby's | 638,856 | 16,457 |
| * | Media General Inc. | 1,004,643 | 16,225 |
| | Dillard's Inc. Class A | 246,653 | 16,208 |
| * | Deckers Outdoor Corp. | 332,455 | 15,692 |
| * | Hyatt Hotels Corp. Class A | 331,478 | 15,586 |
| | Drew Industries Inc. | 255,630 | 15,565 |
| | Chico's FAS Inc. | 1,452,956 | 15,503 |
| * | Dorman Products Inc. | 325,153 | 15,435 |
| | DeVry Education Group Inc. | 605,593 | 15,328 |
| | Aaron's Inc. | 683,393 | 15,301 |
| * | American Axle & Manufacturing Holdings Inc. | 800,167 | 15,155 |
2
| | | |
| Vanguard® Extended Market Index Fund | | |
| Schedule of Investments | | |
| December 31, 2015 | | |
| |
| | | | Market |
| | | | Value |
| | | Shares | ($000) |
| | DineEquity Inc. | 174,943 | 14,812 |
| *,^ | GoPro Inc. Class A | 810,549 | 14,598 |
| | Columbia Sportswear Co. | 297,171 | 14,490 |
| *,^ | Diamond Resorts International Inc. | 566,888 | 14,461 |
| * | Popeyes Louisiana Kitchen Inc. | 244,837 | 14,323 |
| | SeaWorld Entertainment Inc. | 718,103 | 14,139 |
| *,^ | Groupon Inc. Class A | 4,600,843 | 14,125 |
| * | Cooper-Standard Holding Inc. | 180,787 | 14,027 |
| * | Liberty Broadband Corp. Class A | 262,629 | 13,565 |
| * | MSG Networks Inc. | 642,963 | 13,374 |
| ^ | Regal Entertainment Group Class A | 700,123 | 13,211 |
| * | Express Inc. | 761,909 | 13,166 |
| * | Genesco Inc. | 230,756 | 13,114 |
| * | Meritage Homes Corp. | 385,241 | 13,094 |
| * | La Quinta Holdings Inc. | 954,526 | 12,991 |
| | La-Z-Boy Inc. | 528,178 | 12,898 |
| *,^ | LifeLock Inc. | 895,074 | 12,844 |
| | Guess? Inc. | 678,395 | 12,808 |
| * | TopBuild Corp. | 409,632 | 12,604 |
| * | Smith & Wesson Holding Corp. | 570,880 | 12,548 |
| | Caleres Inc. | 462,652 | 12,408 |
| | ClubCorp Holdings Inc. | 674,379 | 12,321 |
| * | Penn National Gaming Inc. | 761,239 | 12,195 |
| *,^ | Wayfair Inc. | 255,357 | 12,160 |
| | Children's Place Inc. | 217,858 | 12,026 |
| | Sturm Ruger & Co. Inc. | 199,779 | 11,909 |
| * | Select Comfort Corp. | 549,771 | 11,771 |
| | Extended Stay America Inc. | 712,078 | 11,322 |
| | KB Home | 915,783 | 11,292 |
| * | Dave & Buster's Entertainment Inc. | 269,887 | 11,265 |
| * | Gray Television Inc. | 689,997 | 11,247 |
| * | iRobot Corp. | 316,347 | 11,199 |
| * | Pep Boys-Manny Moe & Jack | 594,075 | 10,937 |
| *,^ | Sears Holdings Corp. | 531,136 | 10,920 |
| | EW Scripps Co. Class A | 562,006 | 10,678 |
| | MDC Holdings Inc. | 413,299 | 10,552 |
| | Scholastic Corp. | 272,134 | 10,494 |
| | National CineMedia Inc. | 662,305 | 10,405 |
| * | Krispy Kreme Doughnuts Inc. | 685,684 | 10,333 |
| * | Vitamin Shoppe Inc. | 314,378 | 10,280 |
| | Cato Corp. Class A | 275,995 | 10,162 |
| | Oxford Industries Inc. | 154,312 | 9,848 |
| | International Speedway Corp. Class A | 289,667 | 9,768 |
| * | Tumi Holdings Inc. | 584,975 | 9,728 |
| * | Fiesta Restaurant Group Inc. | 283,935 | 9,540 |
| * | BJ's Restaurants Inc. | 218,992 | 9,520 |
| *,^ | 2U Inc. | 337,879 | 9,454 |
| *,^ | Mattress Firm Holding Corp. | 211,501 | 9,439 |
| * | Red Robin Gourmet Burgers Inc. | 149,463 | 9,228 |
| ^ | Buckle Inc. | 299,784 | 9,227 |
| | Bob Evans Farms Inc. | 236,334 | 9,182 |
| | Callaway Golf Co. | 939,406 | 8,849 |
| | Finish Line Inc. Class A | 486,912 | 8,803 |
| * | Denny's Corp. | 894,841 | 8,796 |
| * | Belmond Ltd. Class A | 921,347 | 8,753 |
| * | Francesca's Holdings Corp. | 499,893 | 8,703 |
| * | Universal Electronics Inc. | 169,437 | 8,701 |
| | Standard Motor Products Inc. | 228,114 | 8,680 |
| | Ethan Allen Interiors Inc. | 306,037 | 8,514 |
| | Rent-A-Center Inc. | 560,923 | 8,397 |
| * | Crocs Inc. | 807,204 | 8,266 |
| * | Strayer Education Inc. | 136,460 | 8,204 |
| | New Media Investment Group Inc. | 419,929 | 8,172 |
| | Sonic Automotive Inc. Class A | 355,036 | 8,081 |
3
| | | |
| Vanguard® Extended Market Index Fund | | |
| Schedule of Investments | | |
| December 31, 2015 | | |
| |
| | | | Market |
| | | | Value |
| | | Shares | ($000) |
| * | Hibbett Sports Inc. | 260,750 | 7,885 |
| * | Apollo Education Group Inc. | 1,020,277 | 7,826 |
| | Nutrisystem Inc. | 354,189 | 7,665 |
| | Fred's Inc. Class A | 444,584 | 7,278 |
| | Men's Wearhouse Inc. | 484,448 | 7,112 |
| * | Regis Corp. | 483,400 | 6,840 |
| | Interval Leisure Group Inc. | 437,315 | 6,827 |
| ^ | Outerwall Inc. | 186,722 | 6,823 |
| * | Cavco Industries Inc. | 80,828 | 6,734 |
| * | Rentrak Corp. | 139,702 | 6,640 |
| ^ | World Wrestling Entertainment Inc. Class A | 368,234 | 6,569 |
| *,^ | Weight Watchers International Inc. | 286,871 | 6,541 |
| | Ruth's Hospitality Group Inc. | 402,027 | 6,400 |
| | Winnebago Industries Inc. | 320,303 | 6,374 |
| * | Motorcar Parts of America Inc. | 187,516 | 6,340 |
| | Tower International Inc. | 214,542 | 6,129 |
| *,^ | Conn's Inc. | 258,828 | 6,075 |
| | Capella Education Co. | 130,696 | 6,041 |
| * | Loral Space & Communications Inc. | 147,202 | 5,993 |
| * | Carmike Cinemas Inc. | 257,779 | 5,913 |
| * | Unifi Inc. | 209,444 | 5,896 |
| * | M/I Homes Inc. | 263,822 | 5,783 |
| | Barnes & Noble Inc. | 653,435 | 5,691 |
| * | FTD Cos. Inc. | 212,450 | 5,560 |
| *,^ | Zoe's Kitchen Inc. | 195,478 | 5,469 |
| * | Blue Nile Inc. | 144,056 | 5,349 |
| * | Global Eagle Entertainment Inc. | 541,478 | 5,344 |
| | PetMed Express Inc. | 310,912 | 5,329 |
| * | Taylor Morrison Home Corp. Class A | 331,645 | 5,306 |
| | Movado Group Inc. | 205,716 | 5,289 |
| * | Chuy's Holdings Inc. | 165,765 | 5,195 |
| | Libbey Inc. | 238,863 | 5,093 |
| | Superior Industries International Inc. | 273,970 | 5,047 |
| *,^ | Lumber Liquidators Holdings Inc. | 288,123 | 5,002 |
| | Entravision Communications Corp. Class A | 642,897 | 4,957 |
| *,^ | Scientific Games Corp. Class A | 545,819 | 4,896 |
| * | Nautilus Inc. | 292,299 | 4,887 |
| * | Tile Shop Holdings Inc. | 297,324 | 4,876 |
| * | Modine Manufacturing Co. | 536,547 | 4,856 |
| | Pier 1 Imports Inc. | 951,746 | 4,844 |
| * | MarineMax Inc. | 261,678 | 4,820 |
| | Haverty Furniture Cos. Inc. | 218,094 | 4,676 |
| | AMC Entertainment Holdings Inc. | 191,554 | 4,597 |
| | Speedway Motorsports Inc. | 205,565 | 4,259 |
| | Marcus Corp. | 218,569 | 4,146 |
| * | Installed Building Products Inc. | 165,768 | 4,116 |
| * | Carrols Restaurant Group Inc. | 338,916 | 3,979 |
| * | Beazer Homes USA Inc. | 341,304 | 3,922 |
| * | Ruby Tuesday Inc. | 709,690 | 3,910 |
| * | Del Frisco's Restaurant Group Inc. | 242,353 | 3,883 |
| * | Stoneridge Inc. | 261,465 | 3,870 |
| * | Biglari Holdings Inc. | 11,824 | 3,853 |
| * | American Public Education Inc. | 206,520 | 3,843 |
| * | Zumiez Inc. | 252,808 | 3,822 |
| * | Vera Bradley Inc. | 237,822 | 3,748 |
| | Shoe Carnival Inc. | 160,752 | 3,729 |
| *,^ | Chegg Inc. | 546,017 | 3,675 |
| * | WCI Communities Inc. | 162,680 | 3,625 |
| *,^ | Caesars Entertainment Corp. | 454,855 | 3,589 |
| *,^ | Lands' End Inc. | 152,193 | 3,567 |
| * | Barnes & Noble Education Inc. | 358,508 | 3,567 |
| | Citi Trends Inc. | 165,615 | 3,519 |
| * | Iconix Brand Group Inc. | 505,386 | 3,452 |
| | Stage Stores Inc. | 377,141 | 3,436 |
4
| | | |
| Vanguard® Extended Market Index Fund | | |
| Schedule of Investments | | |
| December 31, 2015 | | |
| |
| | | | Market |
| | | | Value |
| | | Shares | ($000) |
| *,^ | LGI Homes Inc. | 138,851 | 3,378 |
| | Carriage Services Inc. Class A | 137,006 | 3,302 |
| * | Isle of Capri Casinos Inc. | 230,614 | 3,212 |
| *,^ | Shake Shack Inc. Class A | 81,118 | 3,212 |
| | NACCO Industries Inc. Class A | 75,491 | 3,186 |
| * | ZAGG Inc. | 283,014 | 3,096 |
| * | Overstock.com Inc. | 249,188 | 3,060 |
| * | Del Taco Restaurants Inc. | 279,562 | 2,977 |
| * | Tuesday Morning Corp. | 457,595 | 2,974 |
| | Bassett Furniture Industries Inc. | 114,910 | 2,882 |
| | Strattec Security Corp. | 50,791 | 2,869 |
| | Hooker Furniture Corp. | 113,336 | 2,861 |
| * | William Lyon Homes Class A | 170,838 | 2,819 |
| * | Clear Channel Outdoor Holdings Inc. Class A | 499,424 | 2,792 |
| * | Eldorado Resorts Inc. | 250,820 | 2,759 |
| | Flexsteel Industries Inc. | 61,283 | 2,707 |
| * | Federal-Mogul Holdings Corp. | 393,266 | 2,694 |
| * | Party City Holdco Inc. | 206,285 | 2,663 |
| * | K12 Inc. | 301,426 | 2,653 |
| * | Career Education Corp. | 721,148 | 2,618 |
| | Arctic Cat Inc. | 158,070 | 2,589 |
| | Big 5 Sporting Goods Corp. | 256,616 | 2,564 |
| | Culp Inc. | 99,875 | 2,544 |
| * | Crown Media Holdings Inc. Class A | 451,377 | 2,532 |
| * | Sportsman's Warehouse Holdings Inc. | 190,493 | 2,457 |
| * | Potbelly Corp. | 207,592 | 2,431 |
| * | Fox Factory Holding Corp. | 145,956 | 2,413 |
| * | Hovnanian Enterprises Inc. Class A | 1,329,180 | 2,406 |
| *,^ | Jamba Inc. | 177,635 | 2,396 |
| *,^ | Habit Restaurants Inc. Class A | 103,781 | 2,393 |
| * | Ascent Capital Group Inc. Class A | 142,379 | 2,381 |
| * | Entercom Communications Corp. Class A | 211,055 | 2,370 |
| * | Monarch Casino & Resort Inc. | 104,067 | 2,364 |
| | Kirkland's Inc. | 157,426 | 2,283 |
| * | Perry Ellis International Inc. | 123,648 | 2,278 |
| *,^ | Sequential Brands Group Inc. | 286,451 | 2,266 |
| | Stein Mart Inc. | 334,535 | 2,251 |
| * | America's Car-Mart Inc. | 82,979 | 2,215 |
| | Saga Communications Inc. Class A | 57,517 | 2,212 |
| | CSS Industries Inc. | 77,572 | 2,202 |
| *,^ | Central European Media Enterprises Ltd. Class A | 801,840 | 2,157 |
| *,^ | JAKKS Pacific Inc. | 267,492 | 2,129 |
| | Journal Media Group Inc. | 174,974 | 2,103 |
| * | Destination XL Group Inc. | 379,420 | 2,094 |
| *,^ | El Pollo Loco Holdings Inc. | 164,181 | 2,074 |
| * | Malibu Boats Inc. Class A | 126,517 | 2,071 |
| | Marine Products Corp. | 334,277 | 2,019 |
| | Tribune Publishing Co. | 218,245 | 2,012 |
| | Collectors Universe Inc. | 125,188 | 1,940 |
| * | Horizon Global Corp. | 185,673 | 1,925 |
| * | Cherokee Inc. | 109,465 | 1,888 |
| *,^ | Noodles & Co. Class A | 194,458 | 1,884 |
| * | Green Brick Partners Inc. | 256,820 | 1,849 |
| * | 1-800-Flowers.com Inc. Class A | 250,834 | 1,826 |
| | Harte-Hanks Inc. | 557,078 | 1,805 |
| | Winmark Corp. | 18,623 | 1,732 |
| | Nathan's Famous Inc. | 32,872 | 1,695 |
| * | Reading International Inc. Class A | 127,505 | 1,672 |
| * | VOXX International Corp. Class A | 314,485 | 1,654 |
| * | Century Communities Inc. | 90,217 | 1,598 |
| * | Build-A-Bear Workshop Inc. | 127,806 | 1,564 |
| | Lifetime Brands Inc. | 116,707 | 1,548 |
| * | Kona Grill Inc. | 97,102 | 1,540 |
| * | Century Casinos Inc. | 195,924 | 1,524 |
5
| | | |
| Vanguard® Extended Market Index Fund | | |
| Schedule of Investments | | |
| December 31, 2015 | | |
| |
| | | | Market |
| | | | Value |
| | | Shares | ($000) |
| * | Morgans Hotel Group Co. | 451,956 | 1,523 |
| | Escalade Inc. | 114,872 | 1,522 |
| * | Bravo Brio Restaurant Group Inc. | 167,750 | 1,510 |
| * | Boot Barn Holdings Inc. | 118,521 | 1,457 |
| | Weyco Group Inc. | 54,378 | 1,455 |
| | Spartan Motors Inc. | 457,207 | 1,422 |
| * | Etsy Inc. | 170,033 | 1,404 |
| | A H Belo Corp. Class A | 278,158 | 1,391 |
| * | Gaiam Inc. Class A | 216,758 | 1,353 |
| | Destination Maternity Corp. | 153,546 | 1,339 |
| *,^ | Container Store Group Inc. | 161,668 | 1,326 |
| * | West Marine Inc. | 152,576 | 1,295 |
| * | Bridgepoint Education Inc. | 168,604 | 1,283 |
| * | Tandy Leather Factory Inc. | 173,075 | 1,270 |
| *,^ | Papa Murphy's Holdings Inc. | 112,636 | 1,268 |
| | Universal Technical Institute Inc. | 256,705 | 1,196 |
| * | Wingstop Inc. | 51,838 | 1,182 |
| * | Sizmek Inc. | 316,454 | 1,155 |
| | Metaldyne Performance Group Inc. | 61,460 | 1,127 |
| | Ark Restaurants Corp. | 47,616 | 1,100 |
| * | RCI Hospitality Holdings Inc. | 106,328 | 1,062 |
| * | Sears Hometown and Outlet Stores Inc. | 132,679 | 1,061 |
| * | Black Diamond Inc. | 239,870 | 1,060 |
| | Superior Uniform Group Inc. | 62,423 | 1,060 |
| * | Intrawest Resorts Holdings Inc. | 134,820 | 1,054 |
| | Rocky Brands Inc. | 90,339 | 1,044 |
| * | Red Lion Hotels Corp. | 145,962 | 1,023 |
| | Liberty Tax Inc. | 40,231 | 959 |
| * | Fuel Systems Solutions Inc. | 193,899 | 948 |
| * | Lee Enterprises Inc. | 557,132 | 936 |
| * | Ballantyne Strong Inc. | 193,171 | 881 |
| * | Bojangles' Inc. | 55,334 | 878 |
| * | Skullcandy Inc. | 183,013 | 866 |
| * | Luby's Inc. | 192,966 | 863 |
| * | Insignia Systems Inc. | 293,458 | 860 |
| * | Planet Fitness Inc. Class A | 54,825 | 857 |
| * | McClatchy Co. Class A | 679,292 | 822 |
| * | Systemax Inc. | 92,808 | 798 |
| * | Delta Apparel Inc. | 55,652 | 781 |
| * | EVINE Live Inc. | 437,247 | 778 |
| *,^ | ITT Educational Services Inc. | 205,776 | 768 |
| * | Dixie Group Inc. | 144,405 | 755 |
| * | Vince Holding Corp. | 162,753 | 745 |
| * | Golden Entertainment Inc. | 71,983 | 736 |
| * | Famous Dave's of America Inc. | 105,884 | 735 |
| * | Cambium Learning Group Inc. | 151,228 | 733 |
| * | Tilly's Inc. Class A | 108,203 | 717 |
| * | Trans World Entertainment Corp. | 197,775 | 708 |
| | Johnson Outdoors Inc. Class A | 31,073 | 680 |
| * | Lakeland Industries Inc. | 56,476 | 674 |
| * | Gaming Partners International Corp. | 75,048 | 666 |
| *,^ | hhgregg Inc. | 179,105 | 656 |
| * | New York & Co. Inc. | 261,408 | 599 |
| * | Christopher & Banks Corp. | 358,247 | 591 |
| | Dover Motorsports Inc. | 247,503 | 577 |
| * | Rave Restaurant Group Inc. | 88,227 | 564 |
| *,^ | Empire Resorts Inc. | 29,405 | 529 |
| * | Lincoln Educational Services Corp. | 259,118 | 516 |
| * | Radio One Inc. | 289,364 | 498 |
| * | Cumulus Media Inc. Class A | 1,441,116 | 476 |
| | Beasley Broadcast Group Inc. Class A | 131,564 | 472 |
| * | LeapFrog Enterprises Inc. | 646,848 | 459 |
| * | Ollie's Bargain Outlet Holdings Inc. | 24,321 | 414 |
| * | New Home Co. Inc. | 30,291 | 393 |
6
| | | |
| Vanguard® Extended Market Index Fund | | |
| Schedule of Investments | | |
| December 31, 2015 | | |
| |
| | | | Market |
| | | | Value |
| | | Shares | ($000) |
| * | Lindblad Expeditions Holdings Inc. | 35,262 | 392 |
| * | Full House Resorts Inc. | 227,501 | 380 |
| * | Daily Journal Corp. | 1,840 | 372 |
| *,^ | Gordmans Stores Inc. | 112,537 | 355 |
| * | Shiloh Industries Inc. | 66,237 | 347 |
| * | Hemisphere Media Group Inc. Class A | 23,006 | 339 |
| * | Townsquare Media Inc. Class A | 27,869 | 333 |
| *,^ | Fogo De Chao Inc. | 21,417 | 325 |
| * | Good Times Restaurants Inc. | 66,358 | 319 |
| * | Ignite Restaurant Group Inc. | 75,700 | 318 |
| * | Summer Infant Inc. | 135,595 | 302 |
| * | UCP Inc. | 41,726 | 300 |
| *,^ | Forward Industries Inc. | 193,183 | 282 |
| *,^ | Turtle Beach Corp. | 139,559 | 281 |
| | Town Sports International Holdings Inc. | 230,556 | 274 |
| *,^ | Vuzix Corp. | 33,860 | 257 |
| * | Emerson Radio Corp. | 249,112 | 247 |
| *,^ | Aeropostale Inc. | 869,165 | 243 |
| * | Dover Downs Gaming & Entertainment Inc. | 250,438 | 243 |
| | bebe stores inc | 425,432 | 240 |
| * | Spanish Broadcasting System Inc. | 73,134 | 237 |
| * | UQM Technologies Inc. | 353,941 | 235 |
| ^ | Bon-Ton Stores Inc. | 110,512 | 232 |
| * | Emmis Communications Corp. Class A | 353,643 | 226 |
| *,^ | ReachLocal Inc. | 131,459 | 217 |
| * | Stanley Furniture Co. Inc. | 77,487 | 216 |
| * | Charles & Colvard Ltd. | 184,730 | 207 |
| * | Skyline Corp. | 57,715 | 207 |
| | Salem Media Group Inc. Class A | 41,128 | 205 |
| * | MCBC Holdings Inc. | 14,749 | 202 |
| *,^ | Chanticleer Holdings Inc. | 198,489 | 198 |
| * | Quantum Fuel Systems Technologies Worldwide Inc. | 266,492 | 195 |
| *,^ | Cinedigm Corp. Class A | 740,576 | 194 |
| * | Fenix Parts Inc. | 25,135 | 171 |
| * | Perfumania Holdings Inc. | 66,167 | 159 |
| * | Cosi Inc. | 359,826 | 158 |
| * | CafePress Inc. | 40,283 | 155 |
| * | Nova Lifestyle Inc. | 80,959 | 146 |
| *,^ | Clean Diesel Technologies Inc. | 130,761 | 123 |
| * | US Auto Parts Network Inc. | 36,063 | 106 |
| * | Joe's Jeans Inc. | 636,795 | 105 |
| * | Pacific Sunwear of California Inc. | 425,744 | 102 |
| * | Sypris Solutions Inc. | 88,213 | 96 |
| *,^ | SFX Entertainment Inc. | 504,633 | 96 |
| | Educational Development Corp. | 7,617 | 84 |
| * | Nevada Gold & Casinos Inc. | 33,200 | 75 |
| | Peak Resorts Inc. | 10,374 | 62 |
| * | NTN Buzztime Inc. | 287,989 | 46 |
| * | CVSL Inc. | 37,930 | 38 |
| * | SPAR Group Inc. | 33,227 | 33 |
| | Flanigan's Enterprises Inc. | 1,352 | 30 |
| * | Appliance Recycling Centers of America Inc. | 24,098 | 26 |
| *,^ | Comstock Holding Cos. Inc. Class A | 17,945 | 26 |
| * | Diversified Restaurant Holdings Inc. | 10,100 | 23 |
| *,^ | Dex Media Inc. | 160,956 | 19 |
| * | J Alexander's Holdings Inc. | 1,508 | 16 |
| | AG&E Holdings Inc. | 32,460 | 16 |
| | AMCON Distributing Co. | 172 | 14 |
| * | Premier Exhibitions Inc. | 18,742 | 12 |
| * | Entertainment Gaming Asia Inc. | 5,940 | 11 |
| | Crown Crafts Inc. | 1,013 | 9 |
| * | Koss Corp. | 3,992 | 8 |
| * | P&F Industries Inc. Class A | 574 | 5 |
| | Unique Fabricating Inc. | 196 | 2 |
7
| | | |
| Vanguard® Extended Market Index Fund | | |
| Schedule of Investments | | |
| December 31, 2015 | | |
| |
| | | | Market |
| | | | Value |
| | | Shares | ($000) |
| | Canterbury Park Holding Corp. | 209 | 2 |
| * | DGSE Cos. Inc. | 1,051 | — |
| | Expedia Inc. | 1 | — |
| * | Here Media Inc. | 12,670 | — |
| * | Here Media Inc. | 12,670 | — |
| | | | 6,559,992 |
| Consumer Staples (3.2%) | | |
| | Bunge Ltd. | 1,486,309 | 101,485 |
| * | Rite Aid Corp. | 10,903,839 | 85,486 |
| * | WhiteWave Foods Co. Class A | 1,829,201 | 71,174 |
| | Ingredion Inc. | 742,160 | 71,129 |
| | Casey's General Stores Inc. | 409,499 | 49,324 |
| | Pinnacle Foods Inc. | 1,151,489 | 48,892 |
| * | Edgewell Personal Care Co. | 619,050 | 48,515 |
| * | Hain Celestial Group Inc. | 1,077,817 | 43,533 |
| | Flowers Foods Inc. | 1,946,904 | 41,839 |
| * | Sprouts Farmers Market Inc. | 1,505,319 | 40,027 |
| * | Post Holdings Inc. | 646,825 | 39,909 |
| *,^ | Herbalife Ltd. | 672,771 | 36,074 |
| * | TreeHouse Foods Inc. | 452,701 | 35,519 |
| | Spectrum Brands Holdings Inc. | 285,560 | 29,070 |
| | Lancaster Colony Corp. | 205,725 | 23,753 |
| ^ | Nu Skin Enterprises Inc. Class A | 597,133 | 22,625 |
| | Energizer Holdings Inc. | 656,703 | 22,367 |
| | Vector Group Ltd. | 919,457 | 21,690 |
| | B&G Foods Inc. | 612,942 | 21,465 |
| * | United Natural Foods Inc. | 529,691 | 20,849 |
| | Coty Inc. Class A | 797,779 | 20,447 |
| * | Boston Beer Co. Inc. Class A | 100,254 | 20,242 |
| * | SUPERVALU Inc. | 2,763,008 | 18,733 |
| | Snyder's-Lance Inc. | 545,682 | 18,717 |
| | Avon Products Inc. | 4,590,173 | 18,590 |
| * | Darling Ingredients Inc. | 1,744,259 | 18,350 |
| | J&J Snack Foods Corp. | 155,587 | 18,152 |
| * | HRG Group Inc. | 1,285,331 | 17,429 |
| | Dean Foods Co. | 981,842 | 16,839 |
| | PriceSmart Inc. | 202,790 | 16,830 |
| ^ | Sanderson Farms Inc. | 210,980 | 16,355 |
| ^ | Cal-Maine Foods Inc. | 321,280 | 14,888 |
| ^ | Pilgrim's Pride Corp. | 660,283 | 14,586 |
| | WD-40 Co. | 145,101 | 14,314 |
| | Fresh Del Monte Produce Inc. | 354,937 | 13,800 |
| | Universal Corp. | 237,813 | 13,337 |
| * | Fresh Market Inc. | 466,941 | 10,936 |
| * | Diamond Foods Inc. | 276,570 | 10,662 |
| | Coca-Cola Bottling Co. Consolidated | 52,485 | 9,579 |
| | Andersons Inc. | 282,353 | 8,931 |
| | SpartanNash Co. | 400,065 | 8,657 |
| * | Seaboard Corp. | 2,925 | 8,467 |
| * | USANA Health Sciences Inc. | 63,122 | 8,064 |
| | Calavo Growers Inc. | 160,375 | 7,858 |
| ^ | Tootsie Roll Industries Inc. | 239,265 | 7,558 |
| * | National Beverage Corp. | 157,834 | 7,172 |
| * | Boulder Brands Inc. | 643,159 | 7,062 |
| | Weis Markets Inc. | 145,888 | 6,463 |
| *,^ | Blue Buffalo Pet Products Inc. | 332,206 | 6,216 |
| | Ingles Markets Inc. Class A | 140,624 | 6,199 |
| * | Central Garden & Pet Co. Class A | 453,035 | 6,161 |
| | John B Sanfilippo & Son Inc. | 93,457 | 5,050 |
| * | Omega Protein Corp. | 221,722 | 4,922 |
| * | Smart & Final Stores Inc. | 269,214 | 4,902 |
| * | Revlon Inc. Class A | 170,550 | 4,748 |
| | Medifast Inc. | 155,066 | 4,711 |
| | Inter Parfums Inc. | 180,533 | 4,300 |
8
| | | |
| Vanguard® Extended Market Index Fund | | |
| Schedule of Investments | | |
| December 31, 2015 | | |
| |
| | | | Market |
| | | | Value |
| | | Shares | ($000) |
| | MGP Ingredients Inc. | 158,029 | 4,101 |
| * | Chefs' Warehouse Inc. | 187,127 | 3,121 |
| * | Landec Corp. | 242,919 | 2,874 |
| *,^ | Elizabeth Arden Inc. | 281,988 | 2,792 |
| * | Farmer Brothers Co. | 82,040 | 2,648 |
| * | Nutraceutical International Corp. | 95,946 | 2,477 |
| ^ | Natural Health Trends Corp. | 71,543 | 2,399 |
| | Orchids Paper Products Co. | 77,390 | 2,393 |
| * | Seneca Foods Corp. Class A | 81,481 | 2,361 |
| * | Performance Food Group Co. | 98,331 | 2,275 |
| * | Natural Grocers by Vitamin Cottage Inc. | 105,653 | 2,152 |
| | Oil-Dri Corp. of America | 55,590 | 2,047 |
| | Village Super Market Inc. Class A | 63,011 | 1,660 |
| | Alico Inc. | 39,161 | 1,515 |
| *,^ | Freshpet Inc. | 175,454 | 1,490 |
| * | Inventure Foods Inc. | 199,766 | 1,418 |
| * | Lifevantage Corp. | 143,306 | 1,364 |
| | Limoneira Co. | 91,059 | 1,360 |
| | Alliance One International Inc. | 110,179 | 1,264 |
| | Rocky Mountain Chocolate Factory Inc. | 112,209 | 1,206 |
| * | Natural Alternatives International Inc. | 115,777 | 1,197 |
| | United-Guardian Inc. | 57,249 | 1,096 |
| * | Lifeway Foods Inc. | 91,516 | 1,016 |
| * | Primo Water Corp. | 119,046 | 952 |
| | Liberator Medical Holdings Inc. | 278,147 | 929 |
| * | Craft Brew Alliance Inc. | 99,769 | 835 |
| *,^ | Synutra International Inc. | 161,071 | 759 |
| | Nature's Sunshine Products Inc. | 73,286 | 742 |
| * | S&W Seed Co. | 168,074 | 709 |
| *,^ | 22nd Century Group Inc. | 440,999 | 617 |
| * | Castle Brands Inc. | 478,778 | 589 |
| * | Female Health Co. | 263,926 | 383 |
| * | Amplify Snack Brands Inc. | 33,110 | 381 |
| * | Reed's Inc. | 45,608 | 245 |
| *,^ | DS Healthcare Group Inc. | 93,723 | 241 |
| * | Mannatech Inc. | 11,471 | 218 |
| *,^ | Fairway Group Holdings Corp. | 233,299 | 154 |
| * | Coffee Holding Co. Inc. | 22,521 | 87 |
| * | RiceBran Technologies | 20,529 | 39 |
| * | Reliv International Inc. | 45,472 | 28 |
| * | Crystal Rock Holdings Inc. | 42,584 | 25 |
| * | Tofutti Brands Inc. | 3,498 | 15 |
| ^ | Vapor Corp. | 15,708 | 9 |
| | Golden Enterprises Inc. | 1,541 | 7 |
| * | Ocean Bio-Chem Inc. | 1,200 | 3 |
| * | MYOS Corp. | 1,200 | 2 |
| | | | 1,349,147 |
| Energy (3.2%) | | |
| * | Concho Resources Inc. | 1,346,263 | 125,014 |
| * | Cheniere Energy Inc. | 2,460,812 | 91,665 |
| | HollyFrontier Corp. | 1,902,298 | 75,883 |
| * | Weatherford International plc | 8,069,195 | 67,701 |
| ^ | Core Laboratories NV | 440,899 | 47,943 |
| * | Diamondback Energy Inc. | 694,920 | 46,490 |
| | Oceaneering International Inc. | 1,021,849 | 38,340 |
| | PBF Energy Inc. Class A | 1,018,856 | 37,504 |
| | Energen Corp. | 822,522 | 33,715 |
| | World Fuel Services Corp. | 748,842 | 28,800 |
| * | Gulfport Energy Corp. | 1,129,664 | 27,756 |
| ^ | Noble Corp. plc | 2,502,808 | 26,405 |
| | Western Refining Inc. | 720,817 | 25,676 |
| | Nabors Industries Ltd. | 2,958,157 | 25,174 |
| * | Dril-Quip Inc. | 407,872 | 24,158 |
| | Patterson-UTI Energy Inc. | 1,534,951 | 23,147 |
9
| | | |
| Vanguard® Extended Market Index Fund | | |
| Schedule of Investments | | |
| December 31, 2015 | | |
| |
| | | | Market |
| | | | Value |
| | | Shares | ($000) |
| * | PDC Energy Inc. | 423,089 | 22,585 |
| | QEP Resources Inc. | 1,677,710 | 22,481 |
| | Rowan Cos. plc Class A | 1,289,448 | 21,856 |
| | Superior Energy Services Inc. | 1,589,118 | 21,405 |
| * | Whiting Petroleum Corp. | 2,118,573 | 19,999 |
| * | Continental Resources Inc. | 846,423 | 19,451 |
| * | Parsley Energy Inc. Class A | 1,024,372 | 18,900 |
| * | Cobalt International Energy Inc. | 3,483,544 | 18,811 |
| * | RSP Permian Inc. | 733,323 | 17,886 |
| *,^ | Antero Resources Corp. | 801,936 | 17,482 |
| * | Carrizo Oil & Gas Inc. | 562,699 | 16,645 |
| * | Matador Resources Co. | 831,291 | 16,435 |
| * | Memorial Resource Development Corp. | 962,611 | 15,546 |
| * | Oil States International Inc. | 545,400 | 14,862 |
| | Delek US Holdings Inc. | 577,644 | 14,210 |
| * | WPX Energy Inc. | 2,460,356 | 14,122 |
| | SM Energy Co. | 711,553 | 13,989 |
| | Targa Resources Corp. | 510,990 | 13,827 |
| | SemGroup Corp. Class A | 463,695 | 13,382 |
| *,^ | Laredo Petroleum Inc. | 1,328,831 | 10,617 |
| * | Oasis Petroleum Inc. | 1,439,414 | 10,608 |
| ^ | US Silica Holdings Inc. | 562,863 | 10,542 |
| | Bristow Group Inc. | 370,001 | 9,583 |
| * | SEACOR Holdings Inc. | 170,696 | 8,972 |
| * | Rice Energy Inc. | 818,584 | 8,923 |
| * | Synergy Resources Corp. | 1,025,549 | 8,738 |
| * | McDermott International Inc. | 2,532,803 | 8,485 |
| | Green Plains Inc. | 362,788 | 8,308 |
| * | Forum Energy Technologies Inc. | 658,943 | 8,210 |
| ^ | RPC Inc. | 660,122 | 7,888 |
| * | Kosmos Energy Ltd. | 1,500,166 | 7,801 |
| | California Resources Corp. | 3,270,933 | 7,621 |
| ^ | Denbury Resources Inc. | 3,737,513 | 7,550 |
| | CVR Energy Inc. | 178,194 | 7,012 |
| * | TETRA Technologies Inc. | 880,628 | 6,622 |
| | Frank's International NV | 373,403 | 6,232 |
| * | Unit Corp. | 502,678 | 6,133 |
| * | Callon Petroleum Co. | 728,869 | 6,079 |
| | Atwood Oceanics Inc. | 586,235 | 5,997 |
| * | Matrix Service Co. | 291,754 | 5,993 |
| * | Exterran Corp. | 367,483 | 5,898 |
| * | Archrock Inc. | 734,956 | 5,527 |
| * | Helix Energy Solutions Group Inc. | 1,044,279 | 5,493 |
| * | Par Pacific Holdings Inc. | 221,675 | 5,218 |
| * | Newpark Resources Inc. | 931,562 | 4,919 |
| | Alon USA Energy Inc. | 284,878 | 4,228 |
| *,^ | Ultra Petroleum Corp. | 1,626,578 | 4,066 |
| | CARBO Ceramics Inc. | 208,850 | 3,592 |
| | Tidewater Inc. | 500,141 | 3,481 |
| * | Hornbeck Offshore Services Inc. | 345,065 | 3,430 |
| * | Renewable Energy Group Inc. | 348,486 | 3,237 |
| * | REX American Resources Corp. | 51,991 | 2,811 |
| * | RigNet Inc. | 134,078 | 2,774 |
| *,^ | Clean Energy Fuels Corp. | 765,219 | 2,755 |
| * | Natural Gas Services Group Inc. | 121,258 | 2,704 |
| | Tesco Corp. | 366,469 | 2,653 |
| * | Stone Energy Corp. | 597,188 | 2,562 |
| | Panhandle Oil and Gas Inc. Class A | 154,770 | 2,501 |
| * | Parker Drilling Co. | 1,369,310 | 2,492 |
| *,^ | Sanchez Energy Corp. | 568,455 | 2,450 |
| *,^ | Northern Oil and Gas Inc. | 623,008 | 2,405 |
| * | C&J Energy Services Ltd. | 492,572 | 2,345 |
| *,^ | EXCO Resources Inc. | 1,885,269 | 2,338 |
| * | Era Group Inc. | 200,377 | 2,234 |
10
| | | |
| Vanguard® Extended Market Index Fund | | |
| Schedule of Investments | | |
| December 31, 2015 | | |
| |
| | | | Market |
| | | | Value |
| | | Shares | ($000) |
| * | Bonanza Creek Energy Inc. | 404,463 | 2,132 |
| * | Bill Barrett Corp. | 531,853 | 2,090 |
| * | Geospace Technologies Corp. | 145,420 | 2,046 |
| * | Clayton Williams Energy Inc. | 67,991 | 2,011 |
| | Gulf Island Fabrication Inc. | 180,215 | 1,885 |
| *,^ | Solazyme Inc. | 708,508 | 1,757 |
| *,^ | EP Energy Corp. Class A | 391,815 | 1,716 |
| * | Ring Energy Inc. | 223,032 | 1,572 |
| * | Pioneer Energy Services Corp. | 692,312 | 1,502 |
| * | Willbros Group Inc. | 557,607 | 1,500 |
| *,^ | Peabody Energy Corp. | 195,078 | 1,498 |
| * | Cloud Peak Energy Inc. | 660,178 | 1,373 |
| * | PHI Inc. | 75,566 | 1,342 |
| *,^ | Gulfmark Offshore Inc. | 281,127 | 1,313 |
| | Evolution Petroleum Corp. | 263,907 | 1,269 |
| * | Abraxas Petroleum Corp. | 1,172,436 | 1,243 |
| * | Pacific Ethanol Inc. | 235,105 | 1,124 |
| *,^ | Uranium Energy Corp. | 1,054,823 | 1,118 |
| * | Contango Oil & Gas Co. | 173,340 | 1,111 |
| *,^ | Halcon Resources Corp. | 856,224 | 1,079 |
| *,^ | Erin Energy Corp. | 329,920 | 1,056 |
| * | VAALCO Energy Inc. | 652,557 | 1,044 |
| *,^ | Westmoreland Coal Co. | 176,080 | 1,035 |
| * | Jones Energy Inc. Class A | 265,333 | 1,022 |
| *,^ | Basic Energy Services Inc. | 375,774 | 1,007 |
| ^ | Energy XXI Ltd. | 995,831 | 1,006 |
| * | Gastar Exploration Inc. | 722,740 | 947 |
| *,^ | W&T Offshore Inc. | 404,742 | 935 |
| *,^ | SandRidge Energy Inc. | 4,518,125 | 904 |
| *,^ | Comstock Resources Inc. | 475,511 | 889 |
| * | Fairmount Santrol Holdings Inc. | 357,866 | 841 |
| * | PHI Inc. NV | 50,975 | 837 |
| *,^ | Eclipse Resources Corp. | 458,576 | 835 |
| | Adams Resources & Energy Inc. | 21,160 | 813 |
| | Dawson Geophysical Co. | 221,507 | 766 |
| *,^ | Approach Resources Inc. | 396,646 | 730 |
| * | ION Geophysical Corp. | 1,436,070 | 722 |
| *,^ | Amyris Inc. | 434,918 | 705 |
| * | Key Energy Services Inc. | 1,442,017 | 695 |
| * | Resolute Energy Corp. | 759,669 | 661 |
| * | Isramco Inc. | 7,288 | 651 |
| * | Triangle Petroleum Corp. | 788,898 | 607 |
| ^ | Hallador Energy Co. | 122,829 | 560 |
| * | Synthesis Energy Systems Inc. | 573,619 | 550 |
| *,^ | Rex Energy Corp. | 515,216 | 541 |
| *,^ | Seventy Seven Energy Inc. | 444,900 | 467 |
| * | Gener8 Maritime Inc. | 48,692 | 460 |
| * | Zion Oil & Gas Inc. | 240,958 | 448 |
| * | Mitcham Industries Inc. | 148,174 | 446 |
| * | PetroQuest Energy Inc. | 707,482 | 354 |
| * | Aspen Aerogels Inc. | 41,193 | 250 |
| * | Independence Contract Drilling Inc. | 46,219 | 233 |
| *,^ | Penn Virginia Corp. | 764,561 | 230 |
| ^ | Arch Coal Inc. | 232,177 | 229 |
| * | TransAtlantic Petroleum Ltd. | 151,166 | 210 |
| * | Harvest Natural Resources Inc. | 486,103 | 207 |
| *,^ | Warren Resources Inc. | 937,106 | 197 |
| * | PrimeEnergy Corp. | 3,726 | 191 |
| *,^ | Profire Energy Inc. | 187,943 | 186 |
| *,^ | Vertex Energy Inc. | 145,816 | 160 |
| *,^ | Goodrich Petroleum Corp. | 513,142 | 137 |
| * | Uranium Resources Inc. | 239,942 | 125 |
| *,^ | Nuverra Environmental Solutions Inc. | 210,050 | 108 |
| * | Royale Energy Inc. | 292,749 | 105 |
11
| | | |
| Vanguard® Extended Market Index Fund | | |
| Schedule of Investments | | |
| December 31, 2015 | | |
| |
| | | | Market |
| | | | Value |
| | | Shares | ($000) |
| * | Midstates Petroleum Co. Inc. | 51,015 | 103 |
| *,^ | Gevo Inc. | 155,470 | 96 |
| * | Barnwell Industries Inc. | 48,034 | 90 |
| *,^ | CHC Group Ltd. | 12,715 | 83 |
| *,^ | Lucas Energy Inc. | 10,012 | 73 |
| * | Tengasco Inc. | 558,194 | 67 |
| *,^ | Emerald Oil Inc. | 58,461 | 66 |
| *,^ | Glori Energy Inc. | 176,160 | 63 |
| * | Earthstone Energy Inc. | 4,219 | 56 |
| * | Aemetis Inc. | 17,273 | 50 |
| * | US Energy Corp. Wyoming | 294,118 | 48 |
| * | Forbes Energy Services Ltd. | 143,916 | 42 |
| * | Magellan Petroleum Corp. | 49,825 | 27 |
| * | Enservco Corp. | 47,023 | 25 |
| * | FieldPoint Petroleum Corp. | 35,776 | 22 |
| * | ENGlobal Corp. | 21,344 | 21 |
| * | Lilis Energy Inc. | 103,154 | 21 |
| * | GreenHunter Resources Inc. | 195,206 | 21 |
| * | Dakota Plains Holdings Inc. | 73,177 | 18 |
| * | Torchlight Energy Resources Inc. | 14,471 | 15 |
| * | Ceres Inc. | 43,655 | 14 |
| * | PEDEVCO Corp. | 40,105 | 12 |
| * | Yuma Energy Inc. | 57,924 | 11 |
| * | Steel Excel Inc. | 685 | 10 |
| * | Centrus Energy Corp. Class A | 6,500 | 9 |
| * | Eco-Stim Energy Solutions Inc. | 1,481 | 5 |
| * | Superior Drilling Products Inc. | 4,028 | 4 |
| * | FX Energy Inc. | 3,000 | 3 |
| * | SAExploration Holdings Inc. | 678 | 1 |
| * | FieldPoint Petroleum Corp. Warrants Exp 03/23/2017 | 33,558 | 1 |
| | | | 1,386,132 |
| Financials (26.0%) | | |
| | Citizens Financial Group Inc. | 5,465,700 | 143,147 |
| * | Markel Corp. | 145,248 | 128,305 |
| | Digital Realty Trust Inc. | 1,528,874 | 115,613 |
| | Extra Space Storage Inc. | 1,290,277 | 113,815 |
| | Federal Realty Investment Trust | 726,289 | 106,111 |
| | UDR Inc. | 2,732,496 | 102,660 |
| | First Republic Bank | 1,493,455 | 98,658 |
| | TD Ameritrade Holding Corp. | 2,787,545 | 96,756 |
| | Willis Group Holdings plc | 1,872,619 | 90,953 |
| | Annaly Capital Management Inc. | 9,668,341 | 90,689 |
| * | Arch Capital Group Ltd. | 1,281,509 | 89,385 |
| | Voya Financial Inc. | 2,353,567 | 86,870 |
| * | Ally Financial Inc. | 4,583,952 | 85,445 |
| | New York Community Bancorp Inc. | 5,070,826 | 82,756 |
| | Everest Re Group Ltd. | 448,539 | 82,123 |
| * | Signature Bank | 526,138 | 80,694 |
| * | Alleghany Corp. | 162,793 | 77,804 |
| | SEI Investments Co. | 1,440,488 | 75,482 |
| | Arthur J Gallagher & Co. | 1,836,474 | 75,185 |
| | Duke Realty Corp. | 3,574,466 | 75,135 |
| | Jones Lang LaSalle Inc. | 466,197 | 74,526 |
| | Raymond James Financial Inc. | 1,285,499 | 74,520 |
| | VEREIT Inc. | 9,369,273 | 74,205 |
| | Mid-America Apartment Communities Inc. | 788,058 | 71,564 |
| | CIT Group Inc. | 1,793,256 | 71,192 |
| | MSCI Inc. Class A | 965,531 | 69,644 |
| | Camden Property Trust | 904,600 | 69,437 |
| | FactSet Research Systems Inc. | 426,771 | 69,380 |
| | Alexandria Real Estate Equities Inc. | 759,029 | 68,586 |
| | Regency Centers Corp. | 984,694 | 67,077 |
| | PartnerRe Ltd. | 478,445 | 66,858 |
| * | SVB Financial Group | 538,153 | 63,986 |
12
| | |
| Vanguard® Extended Market Index Fund | | |
| Schedule of Investments | | |
| December 31, 2015 | | |
| |
| | | Market |
| | | Value |
| | Shares | ($000) |
| East West Bancorp Inc. | 1,504,818 | 62,540 |
| Lazard Ltd. Class A | 1,356,570 | 61,059 |
| American Capital Agency Corp. | 3,520,791 | 61,051 |
| Kilroy Realty Corp. | 964,170 | 61,013 |
| Omega Healthcare Investors Inc. | 1,721,726 | 60,226 |
| WP Carey Inc. | 1,015,845 | 59,935 |
| Reinsurance Group of America Inc. Class A | 687,401 | 58,807 |
| National Retail Properties Inc. | 1,416,346 | 56,725 |
| Axis Capital Holdings Ltd. | 1,008,492 | 56,697 |
| WR Berkley Corp. | 1,031,700 | 56,486 |
| * Realogy Holdings Corp. | 1,535,359 | 56,302 |
| CBOE Holdings Inc. | 862,361 | 55,967 |
| Equity LifeStyle Properties Inc. | 838,166 | 55,881 |
| CubeSmart | 1,809,876 | 55,418 |
| American Financial Group Inc. | 748,838 | 53,976 |
| DDR Corp. | 3,175,800 | 53,480 |
| RenaissanceRe Holdings Ltd. | 458,569 | 51,905 |
| Lamar Advertising Co. Class A | 854,241 | 51,237 |
| PacWest Bancorp | 1,180,485 | 50,879 |
| Starwood Property Trust Inc. | 2,448,215 | 50,335 |
| StanCorp Financial Group Inc. | 441,468 | 50,274 |
| * Forest City Enterprises Inc. Class A | 2,267,833 | 49,734 |
| BioMed Realty Trust Inc. | 2,091,946 | 49,558 |
| American Campus Communities Inc. | 1,179,283 | 48,752 |
| Taubman Centers Inc. | 629,137 | 48,267 |
| Liberty Property Trust | 1,544,240 | 47,949 |
| Old Republic International Corp. | 2,541,111 | 47,341 |
| Investors Bancorp Inc. | 3,749,343 | 46,642 |
| Spirit Realty Capital Inc. | 4,618,525 | 46,278 |
| Brixmor Property Group Inc. | 1,775,466 | 45,843 |
| Douglas Emmett Inc. | 1,456,943 | 45,428 |
| Synovus Financial Corp. | 1,365,958 | 44,230 |
| MarketAxess Holdings Inc. | 389,439 | 43,458 |
| Highwoods Properties Inc. | 996,487 | 43,447 |
| White Mountains Insurance Group Ltd. | 59,351 | 43,137 |
| * Howard Hughes Corp. | 373,010 | 42,210 |
| Bank of the Ozarks Inc. | 848,235 | 41,954 |
| Weingarten Realty Investors | 1,199,953 | 41,494 |
| Hospitality Properties Trust | 1,584,987 | 41,447 |
| Sun Communities Inc. | 604,480 | 41,425 |
| Endurance Specialty Holdings Ltd. | 639,774 | 40,939 |
| First American Financial Corp. | 1,136,843 | 40,813 |
| Sovran Self Storage Inc. | 377,380 | 40,497 |
| First Niagara Financial Group Inc. | 3,726,192 | 40,429 |
| Validus Holdings Ltd. | 862,011 | 39,903 |
| Eaton Vance Corp. | 1,227,763 | 39,816 |
| BankUnited Inc. | 1,092,294 | 39,388 |
| Brown & Brown Inc. | 1,220,547 | 39,180 |
| Assured Guaranty Ltd. | 1,474,477 | 38,970 |
| CNO Financial Group Inc. | 1,989,085 | 37,972 |
| Hanover Insurance Group Inc. | 461,003 | 37,498 |
| Commerce Bancshares Inc. | 875,464 | 37,242 |
| Umpqua Holdings Corp. | 2,330,145 | 37,049 |
| Senior Housing Properties Trust | 2,480,258 | 36,807 |
| Retail Properties of America Inc. | 2,477,770 | 36,597 |
| * Equity Commonwealth | 1,318,112 | 36,551 |
| EPR Properties | 623,259 | 36,430 |
| ^ LPL Financial Holdings Inc. | 851,735 | 36,327 |
| First Horizon National Corp. | 2,495,183 | 36,230 |
| Healthcare Trust of America Inc. Class A | 1,328,527 | 35,830 |
| Webster Financial Corp. | 958,618 | 35,651 |
| Allied World Assurance Co. Holdings AG | 948,876 | 35,289 |
| Cullen/Frost Bankers Inc. | 580,839 | 34,850 |
| DCT Industrial Trust Inc. | 921,274 | 34,428 |
13
| | |
| Vanguard® Extended Market Index Fund | | |
| Schedule of Investments | | |
| December 31, 2015 | | |
| |
| | | Market |
| | | Value |
| | Shares | ($000) |
| Gramercy Property Trust | 4,441,480 | 34,288 |
| * Western Alliance Bancorp | 951,009 | 34,103 |
| PrivateBancorp Inc. | 823,371 | 33,775 |
| Post Properties Inc. | 569,478 | 33,690 |
| NorthStar Realty Finance Corp. | 1,970,933 | 33,565 |
| Prosperity Bancshares Inc. | 684,993 | 32,784 |
| Corrections Corp. of America | 1,236,555 | 32,756 |
| Tanger Factory Outlet Centers Inc. | 999,584 | 32,686 |
| FirstMerit Corp. | 1,752,042 | 32,676 |
| ^ Apple Hospitality REIT Inc. | 1,629,862 | 32,548 |
| Paramount Group Inc. | 1,745,485 | 31,593 |
| Symetra Financial Corp. | 993,007 | 31,548 |
| Outfront Media Inc. | 1,437,564 | 31,382 |
| * MGIC Investment Corp. | 3,542,894 | 31,284 |
| Two Harbors Investment Corp. | 3,860,223 | 31,268 |
| Popular Inc. | 1,093,722 | 30,996 |
| * Stifel Financial Corp. | 725,694 | 30,740 |
| Aspen Insurance Holdings Ltd. | 633,204 | 30,584 |
| Columbia Property Trust Inc. | 1,298,537 | 30,490 |
| Healthcare Realty Trust Inc. | 1,059,519 | 30,006 |
| LaSalle Hotel Properties | 1,188,890 | 29,912 |
| Piedmont Office Realty Trust Inc. Class A | 1,565,286 | 29,553 |
| Radian Group Inc. | 2,199,864 | 29,456 |
| New Residential Investment Corp. | 2,416,376 | 29,383 |
| Associated Banc-Corp | 1,565,792 | 29,359 |
| * SLM Corp. | 4,500,307 | 29,342 |
| Rayonier Inc. | 1,313,895 | 29,168 |
| RLJ Lodging Trust | 1,343,115 | 29,052 |
| Medical Properties Trust Inc. | 2,481,448 | 28,561 |
| Bank of Hawaii Corp. | 451,624 | 28,407 |
| Federated Investors Inc. Class B | 984,866 | 28,216 |
| Ryman Hospitality Properties Inc. | 535,948 | 27,676 |
| Sunstone Hotel Investors Inc. | 2,195,489 | 27,422 |
| ProAssurance Corp. | 555,492 | 26,958 |
| Chimera Investment Corp. | 1,975,172 | 26,941 |
| Care Capital Properties Inc. | 874,250 | 26,726 |
| Gaming and Leisure Properties Inc. | 961,304 | 26,724 |
| American Homes 4 Rent Class A | 1,603,155 | 26,709 |
| Interactive Brokers Group Inc. | 607,278 | 26,477 |
| AmTrust Financial Services Inc. | 422,255 | 26,002 |
| Blackstone Mortgage Trust Inc. Class A | 969,873 | 25,954 |
| First Industrial Realty Trust Inc. | 1,168,028 | 25,848 |
| MFA Financial Inc. | 3,913,702 | 25,830 |
| CyrusOne Inc. | 688,511 | 25,785 |
| Home BancShares Inc. | 634,561 | 25,712 |
| United Bankshares Inc. | 686,376 | 25,389 |
| TCF Financial Corp. | 1,783,884 | 25,188 |
| Brandywine Realty Trust | 1,828,599 | 24,979 |
| NorthStar Asset Management Group Inc. | 2,049,918 | 24,886 |
| Waddell & Reed Financial Inc. Class A | 864,692 | 24,782 |
| Cathay General Bancorp | 785,493 | 24,610 |
| FNB Corp. | 1,838,912 | 24,531 |
| RLI Corp. | 396,976 | 24,513 |
| Wintrust Financial Corp. | 501,975 | 24,356 |
| Acadia Realty Trust | 732,773 | 24,291 |
| Fulton Financial Corp. | 1,865,934 | 24,276 |
| Primerica Inc. | 513,333 | 24,245 |
| Erie Indemnity Co. Class A | 251,418 | 24,046 |
| * LendingClub Corp. | 2,165,397 | 23,928 |
| * Texas Capital Bancshares Inc. | 483,142 | 23,877 |
| Communications Sales & Leasing Inc. | 1,277,079 | 23,869 |
| First Citizens BancShares Inc. Class A | 92,358 | 23,844 |
| Washington Federal Inc. | 981,260 | 23,383 |
| MB Financial Inc. | 719,795 | 23,300 |
14
| | | |
| Vanguard® Extended Market Index Fund | | |
| Schedule of Investments | | |
| December 31, 2015 | | |
| |
| | | | Market |
| | | | Value |
| | | Shares | ($000) |
| | Kennedy-Wilson Holdings Inc. | 964,570 | 23,227 |
| | Colony Capital Inc. Class A | 1,186,504 | 23,113 |
| | Valley National Bancorp | 2,331,700 | 22,967 |
| *,^ | Credit Acceptance Corp. | 107,111 | 22,924 |
| | Kite Realty Group Trust | 883,299 | 22,904 |
| | Urban Edge Properties | 965,297 | 22,636 |
| | GEO Group Inc. | 779,108 | 22,524 |
| | Evercore Partners Inc. Class A | 410,340 | 22,187 |
| | DuPont Fabros Technology Inc. | 693,407 | 22,043 |
| | Empire State Realty Trust Inc. | 1,217,979 | 22,009 |
| | Janus Capital Group Inc. | 1,556,971 | 21,938 |
| | Education Realty Trust Inc. | 576,877 | 21,852 |
| | Corporate Office Properties Trust | 999,726 | 21,824 |
| | BancorpSouth Inc. | 907,223 | 21,764 |
| | Mack-Cali Realty Corp. | 931,807 | 21,758 |
| | National Health Investors Inc. | 356,022 | 21,671 |
| | Hudson Pacific Properties Inc. | 767,918 | 21,609 |
| | Glacier Bancorp Inc. | 805,399 | 21,367 |
| | Pebblebrook Hotel Trust | 759,281 | 21,275 |
| | Equity One Inc. | 771,880 | 20,957 |
| | First Financial Bankshares Inc. | 694,382 | 20,950 |
| | Sterling Bancorp | 1,285,521 | 20,851 |
| | Hancock Holding Co. | 823,223 | 20,721 |
| | American Equity Investment Life Holding Co. | 859,849 | 20,662 |
| | UMB Financial Corp. | 440,781 | 20,518 |
| | WP Glimcher Inc. | 1,933,697 | 20,517 |
| | Cousins Properties Inc. | 2,174,133 | 20,502 |
| | DiamondRock Hospitality Co. | 2,118,640 | 20,445 |
| | Selective Insurance Group Inc. | 604,321 | 20,293 |
| | IBERIABANK Corp. | 360,750 | 19,867 |
| * | OneMain Holdings Inc. Class A | 477,115 | 19,819 |
| | CBL & Associates Properties Inc. | 1,579,605 | 19,540 |
| | New York REIT Inc. | 1,694,725 | 19,489 |
| | Columbia Banking System Inc. | 597,543 | 19,426 |
| * | Genworth Financial Inc. Class A | 5,193,917 | 19,373 |
| | Washington REIT | 711,080 | 19,242 |
| | EastGroup Properties Inc. | 344,266 | 19,145 |
| | Retail Opportunity Investments Corp. | 1,063,314 | 19,033 |
| | Kemper Corp. | 504,676 | 18,799 |
| | Pinnacle Financial Partners Inc. | 364,486 | 18,720 |
| | WisdomTree Investments Inc. | 1,189,071 | 18,645 |
| | Financial Engines Inc. | 549,392 | 18,498 |
| | National Penn Bancshares Inc. | 1,482,824 | 18,283 |
| | CVB Financial Corp. | 1,080,516 | 18,282 |
| | Xenia Hotels & Resorts Inc. | 1,191,557 | 18,267 |
| | South State Corp. | 252,930 | 18,198 |
| | CoreSite Realty Corp. | 320,692 | 18,190 |
| | QTS Realty Trust Inc. Class A | 403,053 | 18,182 |
| | Lexington Realty Trust | 2,260,101 | 18,081 |
| | Community Bank System Inc. | 452,560 | 18,075 |
| | BGC Partners Inc. Class A | 1,842,095 | 18,071 |
| | Mercury General Corp. | 385,942 | 17,973 |
| | PS Business Parks Inc. | 204,891 | 17,914 |
| * | Enstar Group Ltd. | 119,099 | 17,870 |
| * | PRA Group Inc. | 510,561 | 17,711 |
| | Argo Group International Holdings Ltd. | 295,139 | 17,661 |
| * | Santander Consumer USA Holdings Inc. | 1,113,016 | 17,641 |
| | Alexander & Baldwin Inc. | 488,561 | 17,251 |
| | Monogram Residential Trust Inc. | 1,731,152 | 16,896 |
| | Capitol Federal Financial Inc. | 1,340,606 | 16,838 |
| | LTC Properties Inc. | 388,595 | 16,764 |
| * | Eagle Bancorp Inc. | 328,247 | 16,567 |
| | Trustmark Corp. | 713,889 | 16,448 |
| | American Assets Trust Inc. | 428,246 | 16,423 |
15
| | | |
| Vanguard® Extended Market Index Fund | | |
| Schedule of Investments | | |
| December 31, 2015 | | |
| |
| | | | Market |
| | | | Value |
| | | Shares | ($000) |
| | STORE Capital Corp. | 706,049 | 16,380 |
| | Old National Bancorp | 1,188,578 | 16,117 |
| | Invesco Mortgage Capital Inc. | 1,300,332 | 16,111 |
| | Pennsylvania REIT | 733,509 | 16,042 |
| | Morningstar Inc. | 199,285 | 16,025 |
| | Chesapeake Lodging Trust | 633,491 | 15,939 |
| * | Hilltop Holdings Inc. | 826,089 | 15,877 |
| | Great Western Bancorp Inc. | 545,239 | 15,823 |
| | First Midwest Bancorp Inc. | 835,501 | 15,398 |
| | International Bancshares Corp. | 594,789 | 15,286 |
| | Physicians Realty Trust | 903,442 | 15,232 |
| | Alexander's Inc. | 39,427 | 15,144 |
| | Simmons First National Corp. Class A | 292,799 | 15,038 |
| * | Essent Group Ltd. | 681,994 | 14,929 |
| | Astoria Financial Corp. | 940,607 | 14,909 |
| | Horace Mann Educators Corp. | 440,717 | 14,623 |
| | BBCN Bancorp Inc. | 848,771 | 14,616 |
| *,^ | St. Joe Co. | 789,139 | 14,607 |
| | Ramco-Gershenson Properties Trust | 858,670 | 14,263 |
| | Northwest Bancshares Inc. | 1,060,782 | 14,204 |
| ^ | Global Net Lease Inc. | 1,773,311 | 14,098 |
| | Parkway Properties Inc. | 892,173 | 13,945 |
| | Artisan Partners Asset Management Inc. Class A | 386,105 | 13,923 |
| | Renasant Corp. | 403,490 | 13,884 |
| | Chemical Financial Corp. | 404,603 | 13,866 |
| | BOK Financial Corp. | 231,284 | 13,828 |
| | Sabra Health Care REIT Inc. | 680,123 | 13,759 |
| | National General Holdings Corp. | 620,514 | 13,564 |
| | Independent Bank Corp. | 290,397 | 13,509 |
| | EverBank Financial Corp. | 844,391 | 13,493 |
| | Hatteras Financial Corp. | 1,023,613 | 13,461 |
| | Potlatch Corp. | 437,620 | 13,234 |
| | TFS Financial Corp. | 701,246 | 13,204 |
| | STAG Industrial Inc. | 705,064 | 13,008 |
| | Westamerica Bancorporation | 275,083 | 12,860 |
| | Select Income REIT | 646,616 | 12,816 |
| | NBT Bancorp Inc. | 454,410 | 12,669 |
| | Park National Corp. | 138,498 | 12,531 |
| *,^ | BofI Holding Inc. | 594,015 | 12,504 |
| | Talmer Bancorp Inc. Class A | 688,044 | 12,460 |
| | First Financial Bancorp | 685,396 | 12,385 |
| | Union Bankshares Corp. | 488,794 | 12,337 |
| | Provident Financial Services Inc. | 599,259 | 12,075 |
| | PennyMac Mortgage Investment Trust | 788,167 | 12,027 |
| | CYS Investments Inc. | 1,676,861 | 11,956 |
| | Redwood Trust Inc. | 896,015 | 11,827 |
| | Government Properties Income Trust | 742,908 | 11,790 |
| | United Community Banks Inc. | 602,545 | 11,744 |
| | Towne Bank | 558,723 | 11,661 |
| | S&T Bancorp Inc. | 377,151 | 11,624 |
| * | Beneficial Bancorp Inc. | 872,381 | 11,620 |
| | WesBanco Inc. | 380,625 | 11,426 |
| | LegacyTexas Financial Group Inc. | 455,245 | 11,390 |
| * | First Cash Financial Services Inc. | 300,277 | 11,239 |
| | Summit Hotel Properties Inc. | 940,184 | 11,235 |
| | HFF Inc. Class A | 355,496 | 11,045 |
| | First Merchants Corp. | 428,376 | 10,889 |
| | Hersha Hospitality Trust Class A | 498,852 | 10,855 |
| | Apollo Commercial Real Estate Finance Inc. | 620,189 | 10,686 |
| | CNA Financial Corp. | 301,879 | 10,611 |
| | Terreno Realty Corp. | 465,787 | 10,536 |
| | ServisFirst Bancshares Inc. | 220,965 | 10,502 |
| | AMERISAFE Inc. | 204,834 | 10,426 |
| | Infinity Property & Casualty Corp. | 126,003 | 10,361 |
16
| | |
| Vanguard® Extended Market Index Fund | | |
| Schedule of Investments | | |
| December 31, 2015 | | |
| |
| | | Market |
| | | Value |
| | Shares | ($000) |
| Franklin Street Properties Corp. | 997,517 | 10,324 |
| Banner Corp. | 224,462 | 10,294 |
| Wilshire Bancorp Inc. | 886,086 | 10,234 |
| Boston Private Financial Holdings Inc. | 899,412 | 10,199 |
| United Fire Group Inc. | 263,809 | 10,107 |
| BNC Bancorp | 395,790 | 10,045 |
| * iStar Inc. | 856,194 | 10,043 |
| Inland Real Estate Corp. | 944,992 | 10,036 |
| Capital Bank Financial Corp. | 310,073 | 9,916 |
| FelCor Lodging Trust Inc. | 1,351,274 | 9,864 |
| ARMOUR Residential REIT Inc. | 452,771 | 9,852 |
| * Navigators Group Inc. | 114,827 | 9,851 |
| Employers Holdings Inc. | 358,189 | 9,779 |
| First Commonwealth Financial Corp. | 1,070,343 | 9,708 |
| * MBIA Inc. | 1,486,061 | 9,630 |
| American National Insurance Co. | 94,042 | 9,618 |
| * Four Corners Property Trust Inc. | 397,933 | 9,614 |
| Investors Real Estate Trust | 1,380,102 | 9,592 |
| Brookline Bancorp Inc. | 822,021 | 9,453 |
| Lakeland Financial Corp. | 200,023 | 9,325 |
| Rexford Industrial Realty Inc. | 568,684 | 9,304 |
| Starwood Waypoint Residential Trust | 409,641 | 9,274 |
| Hanmi Financial Corp. | 389,857 | 9,247 |
| Berkshire Hills Bancorp Inc. | 317,516 | 9,243 |
| Ameris Bancorp | 268,898 | 9,140 |
| Cash America International Inc. | 304,389 | 9,116 |
| WSFS Financial Corp. | 281,342 | 9,104 |
| State Bank Financial Corp. | 429,809 | 9,039 |
| Maiden Holdings Ltd. | 601,708 | 8,971 |
| City Holding Co. | 196,013 | 8,946 |
| Safety Insurance Group Inc. | 158,356 | 8,928 |
| Capstead Mortgage Corp. | 1,014,015 | 8,863 |
| Northfield Bancorp Inc. | 550,902 | 8,770 |
| New Senior Investment Group Inc. | 887,323 | 8,749 |
| Stewart Information Services Corp. | 229,914 | 8,583 |
| * PHH Corp. | 529,238 | 8,574 |
| Chatham Lodging Trust | 416,953 | 8,539 |
| National Bank Holdings Corp. Class A | 395,563 | 8,453 |
| Virtus Investment Partners Inc. | 71,837 | 8,438 |
| * Customers Bancorp Inc. | 309,617 | 8,428 |
| Sandy Spring Bancorp Inc. | 311,603 | 8,401 |
| Greenhill & Co. Inc. | 290,676 | 8,316 |
| First Potomac Realty Trust | 727,896 | 8,298 |
| FBL Financial Group Inc. Class A | 130,237 | 8,288 |
| * Third Point Reinsurance Ltd. | 616,671 | 8,270 |
| Universal Health Realty Income Trust | 165,216 | 8,262 |
| * Ocwen Financial Corp. | 1,142,132 | 7,961 |
| Cardinal Financial Corp. | 349,632 | 7,954 |
| Oritani Financial Corp. | 481,684 | 7,948 |
| * KCG Holdings Inc. Class A | 644,892 | 7,939 |
| Flushing Financial Corp. | 361,248 | 7,817 |
| Saul Centers Inc. | 151,980 | 7,792 |
| * Walker & Dunlop Inc. | 269,679 | 7,769 |
| * Green Dot Corp. Class A | 469,173 | 7,704 |
| American Capital Mortgage Investment Corp. | 551,087 | 7,693 |
| Community Trust Bancorp Inc. | 219,157 | 7,662 |
| Altisource Residential Corp. | 615,576 | 7,639 |
| ^ Universal Insurance Holdings Inc. | 324,764 | 7,528 |
| NorthStar Realty Europe Corp. | 630,972 | 7,452 |
| * Encore Capital Group Inc. | 256,066 | 7,446 |
| CenterState Banks Inc. | 475,114 | 7,436 |
| ^ Seritage Growth Properties Class A | 183,344 | 7,374 |
| Tompkins Financial Corp. | 130,499 | 7,329 |
| Southside Bancshares Inc. | 303,353 | 7,287 |
17
| | | |
| Vanguard® Extended Market Index Fund | | |
| Schedule of Investments | | |
| December 31, 2015 | | |
| |
| | | | Market |
| | | | Value |
| | | Shares | ($000) |
| | Nelnet Inc. Class A | 215,940 | 7,249 |
| | United Financial Bancorp Inc. | 560,706 | 7,222 |
| * | LendingTree Inc. | 80,349 | 7,174 |
| | Central Pacific Financial Corp. | 318,863 | 7,021 |
| | TrustCo Bank Corp. NY | 1,141,320 | 7,008 |
| | Monmouth Real Estate Investment Corp. | 666,315 | 6,970 |
| * | Piper Jaffray Cos. | 172,340 | 6,963 |
| | Washington Trust Bancorp Inc. | 173,625 | 6,862 |
| | TriCo Bancshares | 249,352 | 6,842 |
| | National Western Life Group Inc. Class A | 27,006 | 6,804 |
| | Yadkin Financial Corp. | 265,826 | 6,691 |
| | Tier REIT Inc. | 447,253 | 6,597 |
| | Agree Realty Corp. | 193,804 | 6,587 |
| | Heritage Financial Corp. | 349,278 | 6,580 |
| | Stock Yards Bancorp Inc. | 173,469 | 6,555 |
| | Cohen & Steers Inc. | 210,348 | 6,411 |
| | Hannon Armstrong Sustainable Infrastructure Capital Inc. | 337,329 | 6,382 |
| | First Interstate BancSystem Inc. Class A | 218,189 | 6,343 |
| | Getty Realty Corp. | 369,166 | 6,331 |
| | Investment Technology Group Inc. | 370,576 | 6,307 |
| | American Residential Properties Inc. | 333,235 | 6,298 |
| | Urstadt Biddle Properties Inc. Class A | 326,977 | 6,291 |
| | Dime Community Bancshares Inc. | 359,052 | 6,280 |
| | Great Southern Bancorp Inc. | 138,487 | 6,268 |
| | Silver Bay Realty Trust Corp. | 399,834 | 6,261 |
| | Anworth Mortgage Asset Corp. | 1,409,610 | 6,132 |
| | BancFirst Corp. | 104,577 | 6,130 |
| | Meridian Bancorp Inc. | 433,142 | 6,107 |
| * | Greenlight Capital Re Ltd. Class A | 323,261 | 6,048 |
| | Cedar Realty Trust Inc. | 848,698 | 6,009 |
| * | First NBC Bank Holding Co. | 159,930 | 5,980 |
| | MainSource Financial Group Inc. | 259,393 | 5,935 |
| | Rouse Properties Inc. | 407,232 | 5,929 |
| | Ashford Hospitality Trust Inc. | 925,187 | 5,838 |
| *,^ | Walter Investment Management Corp. | 410,430 | 5,836 |
| * | INTL. FCStone Inc. | 174,406 | 5,836 |
| | Metro Bancorp Inc. | 183,399 | 5,755 |
| | German American Bancorp Inc. | 171,904 | 5,728 |
| | CoBiz Financial Inc. | 417,827 | 5,607 |
| | First Busey Corp. | 269,449 | 5,559 |
| ^ | New York Mortgage Trust Inc. | 1,041,480 | 5,551 |
| *,^ | Nationstar Mortgage Holdings Inc. | 413,393 | 5,527 |
| | Preferred Bank | 164,507 | 5,432 |
| | 1st Source Corp. | 175,527 | 5,419 |
| | Southwest Bancorp Inc. | 306,768 | 5,362 |
| | Heritage Insurance Holdings Inc. | 242,173 | 5,284 |
| | Suffolk Bancorp | 183,176 | 5,193 |
| | Bank Mutual Corp. | 662,943 | 5,171 |
| | First Financial Corp. | 151,621 | 5,151 |
| | Diamond Hill Investment Group Inc. | 27,163 | 5,134 |
| | RE/MAX Holdings Inc. Class A | 136,507 | 5,092 |
| | Fidelity Southern Corp. | 227,607 | 5,078 |
| * | Campus Crest Communities Inc. | 746,453 | 5,076 |
| | Univest Corp. of Pennsylvania | 240,881 | 5,025 |
| | Heartland Financial USA Inc. | 158,905 | 4,983 |
| * | Ambac Financial Group Inc. | 352,585 | 4,968 |
| | First Bancorp | 264,308 | 4,953 |
| * | Flagstar Bancorp Inc. | 214,277 | 4,952 |
| * | HomeStreet Inc. | 226,941 | 4,927 |
| | Financial Institutions Inc. | 171,438 | 4,800 |
| | Resource Capital Corp. | 375,439 | 4,791 |
| | Apollo Residential Mortgage Inc. | 398,060 | 4,757 |
| | Opus Bank | 128,656 | 4,756 |
| | Enterprise Financial Services Corp. | 165,880 | 4,703 |
18
| | | |
| Vanguard® Extended Market Index Fund | | |
| Schedule of Investments | | |
| December 31, 2015 | | |
| |
| | | | Market |
| | | | Value |
| | | Shares | ($000) |
| * | HomeTrust Bancshares Inc. | 231,695 | 4,692 |
| | Ladder Capital Corp. | 376,169 | 4,672 |
| | CareTrust REIT Inc. | 425,009 | 4,654 |
| | NewBridge Bancorp | 372,681 | 4,539 |
| | Mercantile Bank Corp. | 183,350 | 4,499 |
| | Bryn Mawr Bank Corp. | 155,526 | 4,467 |
| | Arrow Financial Corp. | 164,123 | 4,459 |
| | ConnectOne Bancorp Inc. | 238,297 | 4,454 |
| * | Forestar Group Inc. | 406,534 | 4,447 |
| * | Seacoast Banking Corp. of Florida | 296,855 | 4,447 |
| | Virtu Financial Inc. Class A | 196,391 | 4,446 |
| | Heritage Commerce Corp. | 371,678 | 4,445 |
| * | Pacific Premier Bancorp Inc. | 208,286 | 4,426 |
| | InfraREIT Inc. | 239,159 | 4,424 |
| | AG Mortgage Investment Trust Inc. | 339,600 | 4,360 |
| * | Ladenburg Thalmann Financial Services Inc. | 1,563,006 | 4,314 |
| | Park Sterling Corp. | 587,697 | 4,302 |
| | OceanFirst Financial Corp. | 213,563 | 4,278 |
| | Guaranty Bancorp | 257,616 | 4,261 |
| | Kearny Financial Corp. | 336,118 | 4,259 |
| * | Altisource Portfolio Solutions SA | 151,402 | 4,211 |
| | Republic Bancorp Inc. Class A | 159,303 | 4,207 |
| | West Bancorporation Inc. | 212,220 | 4,191 |
| ^ | Western Asset Mortgage Capital Corp. | 407,602 | 4,166 |
| * | Marcus & Millichap Inc. | 142,477 | 4,152 |
| | Moelis & Co. Class A | 141,798 | 4,138 |
| * | Safeguard Scientifics Inc. | 284,224 | 4,124 |
| | Federated National Holding Co. | 138,521 | 4,095 |
| | Banc of California Inc. | 279,259 | 4,083 |
| | Ashford Hospitality Prime Inc. | 279,756 | 4,056 |
| | Independent Bank Corp. | 264,059 | 4,022 |
| * | Cowen Group Inc. Class A | 1,046,365 | 4,008 |
| * | World Acceptance Corp. | 105,800 | 3,925 |
| | Lakeland Bancorp Inc. | 332,315 | 3,918 |
| * | First BanCorp | 1,193,629 | 3,879 |
| | OFG Bancorp | 526,096 | 3,851 |
| | CatchMark Timber Trust Inc. Class A | 338,036 | 3,823 |
| | State Auto Financial Corp. | 185,028 | 3,810 |
| *,^ | Citizens Inc.Class A | 511,212 | 3,798 |
| | First Connecticut Bancorp Inc. | 216,308 | 3,766 |
| | National Interstate Corp. | 139,048 | 3,713 |
| | Camden National Corp. | 83,425 | 3,678 |
| | Waterstone Financial Inc. | 260,103 | 3,667 |
| *,^ | On Deck Capital Inc. | 351,686 | 3,622 |
| | James River Group Holdings Ltd. | 107,287 | 3,598 |
| * | Tejon Ranch Co. | 184,667 | 3,536 |
| | Westwood Holdings Group Inc. | 66,417 | 3,460 |
| ^ | United Development Funding IV | 314,297 | 3,457 |
| | Federal Agricultural Mortgage Corp. | 109,325 | 3,451 |
| | One Liberty Properties Inc. | 160,611 | 3,447 |
| | Blue Hills Bancorp Inc. | 224,138 | 3,432 |
| | Ares Commercial Real Estate Corp. | 293,131 | 3,353 |
| | Dynex Capital Inc. | 524,348 | 3,330 |
| * | Global Indemnity plc | 114,110 | 3,311 |
| | Territorial Bancorp Inc. | 119,189 | 3,306 |
| | Whitestone REIT | 264,474 | 3,176 |
| | Westfield Financial Inc. | 377,754 | 3,173 |
| | Newcastle Investment Corp. | 776,490 | 3,168 |
| | OneBeacon Insurance Group Ltd. Class A | 255,223 | 3,167 |
| * | Sun Bancorp Inc. | 153,147 | 3,161 |
| | Peoples Bancorp Inc. | 167,597 | 3,158 |
| | First Financial Northwest Inc. | 225,749 | 3,151 |
| | Baldwin & Lyons Inc. | 130,817 | 3,144 |
| | United Community Financial Corp. | 529,932 | 3,127 |
19
| | |
| Vanguard® Extended Market Index Fund | | |
| Schedule of Investments | | |
| December 31, 2015 | | |
| |
| | | Market |
| | | Value |
| | Shares | ($000) |
| HCI Group Inc. | 89,455 | 3,118 |
| * PJT Partners Inc. | 109,622 | 3,101 |
| First Community Bancshares Inc. | 164,091 | 3,057 |
| * NMI Holdings Inc. Class A | 444,778 | 3,011 |
| * EZCORP Inc. Class A | 600,788 | 2,998 |
| Gladstone Commercial Corp. | 205,320 | 2,996 |
| * CommunityOne Bancorp | 220,764 | 2,974 |
| * FCB Financial Holdings Inc. Class A | 82,563 | 2,955 |
| Consolidated-Tomoka Land Co. | 56,039 | 2,954 |
| United Insurance Holdings Corp. | 172,395 | 2,948 |
| Capital City Bank Group Inc. | 190,415 | 2,923 |
| Citizens & Northern Corp. | 139,094 | 2,921 |
| First of Long Island Corp. | 96,390 | 2,892 |
| Fidelity & Guaranty Life | 113,244 | 2,873 |
| * NewStar Financial Inc. | 319,335 | 2,868 |
| * BSB Bancorp Inc. | 122,361 | 2,862 |
| * Phoenix Cos. Inc. | 77,220 | 2,860 |
| * Bancorp Inc. | 448,411 | 2,856 |
| Easterly Government Properties Inc. | 163,408 | 2,807 |
| Heritage Oaks Bancorp | 344,726 | 2,761 |
| * MBT Financial Corp. | 402,025 | 2,746 |
| * PICO Holdings Inc. | 265,256 | 2,737 |
| Arlington Asset Investment Corp. Class A | 205,662 | 2,721 |
| National Storage Affiliates Trust | 158,614 | 2,717 |
| Macatawa Bank Corp. | 447,963 | 2,710 |
| Arbor Realty Trust Inc. | 378,329 | 2,705 |
| Meta Financial Group Inc. | 58,517 | 2,688 |
| Oppenheimer Holdings Inc. Class A | 153,705 | 2,671 |
| * Southcoast Financial Corp. | 168,773 | 2,624 |
| BankFinancial Corp. | 206,881 | 2,613 |
| * PennyMac Financial Services Inc. Class A | 167,416 | 2,572 |
| Preferred Apartment Communities Inc. Class A | 195,879 | 2,562 |
| EMC Insurance Group Inc. | 100,682 | 2,547 |
| Orrstown Financial Services Inc. | 140,951 | 2,534 |
| First Defiance Financial Corp. | 67,055 | 2,533 |
| Unity Bancorp Inc. | 192,148 | 2,402 |
| Riverview Bancorp Inc. | 508,753 | 2,386 |
| National Bankshares Inc. | 67,122 | 2,386 |
| Independent Bank Group Inc. | 73,824 | 2,362 |
| Clifton Bancorp Inc. | 161,659 | 2,318 |
| RAIT Financial Trust | 852,075 | 2,301 |
| Northrim BanCorp Inc. | 85,450 | 2,273 |
| Calamos Asset Management Inc. Class A | 231,331 | 2,239 |
| Stonegate Bank | 67,736 | 2,226 |
| First Bancorp Inc. | 107,726 | 2,205 |
| * Pacific Mercantile Bancorp | 307,910 | 2,189 |
| * Hampton Roads Bankshares Inc. | 1,155,288 | 2,126 |
| UMH Properties Inc. | 209,404 | 2,119 |
| Pulaski Financial Corp. | 131,414 | 2,097 |
| GAMCO Investors Inc. Class A | 67,338 | 2,090 |
| CIM Commercial Trust Corp. | 130,978 | 2,079 |
| * eHealth Inc. | 206,361 | 2,060 |
| * Associated Capital Group Inc. Class A | 67,338 | 2,054 |
| MutualFirst Financial Inc. | 81,702 | 2,036 |
| * Cascade Bancorp | 333,300 | 2,023 |
| Bridge Bancorp Inc. | 66,002 | 2,008 |
| Cape Bancorp Inc. | 160,623 | 1,997 |
| * Anchor BanCorp Wisconsin Inc. | 45,282 | 1,971 |
| * TriState Capital Holdings Inc. | 140,010 | 1,959 |
| ^ Orchid Island Capital Inc. | 196,800 | 1,954 |
| CNB Financial Corp. | 106,341 | 1,917 |
| * Enova International Inc. | 289,680 | 1,915 |
| Armada Hoffler Properties Inc. | 181,642 | 1,904 |
| Century Bancorp Inc. Class A | 43,607 | 1,895 |
20
| | | |
| Vanguard® Extended Market Index Fund | | |
| Schedule of Investments | | |
| December 31, 2015 | | |
| |
| | | | Market |
| | | | Value |
| | | Shares | ($000) |
| | American National Bankshares Inc. | 73,944 | 1,894 |
| | GAIN Capital Holdings Inc. | 232,052 | 1,882 |
| | Pzena Investment Management Inc. Class A | 213,946 | 1,840 |
| * | Farmers Capital Bank Corp. | 67,548 | 1,831 |
| | Marlin Business Services Corp. | 112,199 | 1,802 |
| | Provident Financial Holdings Inc. | 94,700 | 1,789 |
| | Pacific Continental Corp. | 117,084 | 1,742 |
| | Peapack Gladstone Financial Corp. | 84,029 | 1,733 |
| * | CorEnergy Infrastructure Trust Inc. | 116,541 | 1,729 |
| | Timberland Bancorp Inc. | 139,099 | 1,726 |
| | State National Cos. Inc. | 175,936 | 1,726 |
| * | Republic First Bancorp Inc. | 395,623 | 1,713 |
| | Penns Woods Bancorp Inc. | 39,805 | 1,690 |
| | Donegal Group Inc. Class A | 119,962 | 1,689 |
| | Bank of Marin Bancorp | 31,494 | 1,682 |
| * | Security National Financial Corp. Class A | 256,689 | 1,681 |
| | Merchants Bancshares Inc. | 53,350 | 1,680 |
| | Fox Chase Bancorp Inc. | 82,425 | 1,672 |
| | First South Bancorp Inc. | 192,447 | 1,647 |
| | Bluerock Residential Growth REIT Inc. Class A | 138,482 | 1,641 |
| * | Regional Management Corp. | 105,284 | 1,629 |
| * | Kansas City Life Insurance Co. | 42,020 | 1,609 |
| * | Carolina Bank Holdings Inc. | 86,992 | 1,604 |
| | ESSA Bancorp Inc. | 112,996 | 1,546 |
| * | First United Corp. | 133,225 | 1,545 |
| | FBR & Co. | 77,640 | 1,545 |
| | NexPoint Residential Trust Inc. | 116,168 | 1,521 |
| * | FRP Holdings Inc. | 44,602 | 1,514 |
| * | AV Homes Inc. | 117,329 | 1,503 |
| | Peoples Financial Services Corp. | 38,587 | 1,469 |
| | Independence Realty Trust Inc. | 191,809 | 1,441 |
| * | First Foundation Inc. | 59,714 | 1,409 |
| | Old Line Bancshares Inc. | 79,406 | 1,395 |
| | Peoples Bancorp of North Carolina Inc. | 68,581 | 1,324 |
| | Bank of Commerce Holdings | 195,679 | 1,307 |
| * | Atlas Financial Holdings Inc. | 65,582 | 1,305 |
| *,^ | Impac Mortgage Holdings Inc. | 71,577 | 1,288 |
| * | Community Bankers Trust Corp. | 239,842 | 1,288 |
| | Crawford & Co. Class B | 240,263 | 1,276 |
| | Charter Financial Corp. | 94,140 | 1,244 |
| | Manning & Napier Inc. | 145,820 | 1,238 |
| | AmeriServ Financial Inc. | 386,789 | 1,238 |
| * | Asta Funding Inc. | 155,568 | 1,237 |
| * | Old Second Bancorp Inc. | 153,742 | 1,205 |
| | Sierra Bancorp | 68,057 | 1,201 |
| * | WMIH Corp. | 448,200 | 1,161 |
| * | Hallmark Financial Services Inc. | 94,961 | 1,110 |
| * | CU Bancorp | 43,652 | 1,107 |
| | JAVELIN Mortgage Investment Corp. | 174,246 | 1,093 |
| | Houlihan Lokey Inc. | 41,378 | 1,085 |
| * | United Security Bancshares | 201,047 | 1,074 |
| | Chicopee Bancorp Inc. | 61,771 | 1,071 |
| | Donegal Group Inc. Class B | 63,194 | 1,070 |
| * | RMR Group Inc. Class A | 72,737 | 1,048 |
| * | Emergent Capital Inc. | 283,877 | 1,048 |
| * | Nicholas Financial Inc. | 88,616 | 1,032 |
| * | Triumph Bancorp Inc. | 61,851 | 1,021 |
| | Ames National Corp. | 42,001 | 1,020 |
| | Horizon Bancorp | 36,141 | 1,011 |
| * | Consumer Portfolio Services Inc. | 190,034 | 986 |
| | Lake Sunapee Bank Group | 68,130 | 956 |
| | QCR Holdings Inc. | 38,688 | 940 |
| | Home Bancorp Inc. | 35,826 | 931 |
| | Live Oak Bancshares Inc. | 64,700 | 919 |
21
| | | |
| Vanguard® Extended Market Index Fund | | |
| Schedule of Investments | | |
| December 31, 2015 | | |
| |
| | | | Market |
| | | | Value |
| | | Shares | ($000) |
| ^ | FXCM Inc. Class A | 54,100 | 905 |
| | Hawthorn Bancshares Inc. | 57,262 | 900 |
| | Bar Harbor Bankshares | 25,700 | 885 |
| | Investors Title Co. | 9,138 | 885 |
| | Ocean Shore Holding Co. | 51,011 | 875 |
| | Summit Financial Group Inc. | 72,410 | 861 |
| | Ohio Valley Banc Corp. | 34,686 | 859 |
| * | Atlantic Coast Financial Corp. | 144,964 | 850 |
| | Independence Holding Co. | 56,687 | 785 |
| | Citizens Community Bancorp Inc. | 83,110 | 785 |
| * | American River Bankshares | 73,581 | 779 |
| * | Colony Bankcorp Inc. | 80,138 | 778 |
| * | ASB Bancorp Inc. | 29,456 | 757 |
| | C&F Financial Corp. | 19,025 | 742 |
| | MidWestOne Financial Group Inc. | 23,969 | 729 |
| | Shore Bancshares Inc. | 65,724 | 715 |
| | Middleburg Financial Corp. | 37,520 | 693 |
| | Urstadt Biddle Properties Inc. | 38,700 | 689 |
| | Oak Valley Bancorp | 66,347 | 686 |
| * | BBX Capital Corp. | 40,627 | 636 |
| | BCB Bancorp Inc. | 59,678 | 621 |
| | Prudential Bancorp Inc. | 40,939 | 621 |
| | First Business Financial Services Inc. | 24,349 | 609 |
| * | Ashford Inc. | 11,328 | 603 |
| * | 1st Constitution Bancorp | 45,232 | 582 |
| * | Stratus Properties Inc. | 27,859 | 580 |
| | HF Financial Corp. | 30,556 | 577 |
| * | Maui Land & Pineapple Co. Inc. | 105,022 | 573 |
| *,^ | Patriot National Inc. | 85,097 | 571 |
| | Monarch Financial Holdings Inc. | 31,076 | 559 |
| * | HMN Financial Inc. | 47,639 | 554 |
| | Guaranty Federal Bancshares Inc. | 36,149 | 551 |
| | Ellington Residential Mortgage REIT | 43,989 | 543 |
| | Sotherly Hotels Inc. | 87,539 | 539 |
| | Parke Bancorp Inc. | 43,170 | 539 |
| | Citizens Holding Co. | 22,634 | 539 |
| | Southern National Bancorp of Virginia Inc. | 40,333 | 527 |
| * | Green Bancorp Inc. | 50,218 | 526 |
| * | Bear State Financial Inc. | 48,278 | 523 |
| | Eastern Virginia Bankshares Inc. | 71,622 | 514 |
| | Farmland Partners Inc. | 46,558 | 511 |
| | Cherry Hill Mortgage Investment Corp. | 38,491 | 500 |
| * | Stonegate Mortgage Corp. | 91,569 | 499 |
| | MidSouth Bancorp Inc. | 54,604 | 496 |
| | Five Oaks Investment Corp. | 88,512 | 483 |
| | Norwood Financial Corp. | 16,771 | 482 |
| | ZAIS Financial Corp. | 31,668 | 478 |
| | City Office REIT Inc. | 38,325 | 467 |
| | Tiptree Financial Inc. Class A | 73,570 | 452 |
| | Central Valley Community Bancorp | 34,793 | 430 |
| * | Franklin Financial Network Inc. | 12,228 | 384 |
| * | C1 Financial Inc. | 15,690 | 380 |
| | Premier Financial Bancorp Inc. | 23,038 | 379 |
| | Access National Corp. | 18,439 | 377 |
| | Civista Bancshares Inc. | 29,098 | 373 |
| * | First Acceptance Corp. | 155,452 | 370 |
| | First Savings Financial Group Inc. | 9,746 | 355 |
| *,^ | Health Insurance Innovations Inc. Class A | 52,958 | 355 |
| | SB Financial Group Inc. | 31,319 | 349 |
| | Federal Agricultural Mortgage Corp. Class A | 12,788 | 339 |
| | Resource America Inc. Class A | 51,757 | 317 |
| | Enterprise Bancorp Inc. | 13,707 | 313 |
| | First Bancshares Inc. | 16,769 | 308 |
| * | First Marblehead Corp. | 72,565 | 306 |
22
| | | |
| Vanguard® Extended Market Index Fund | | |
| Schedule of Investments | | |
| December 31, 2015 | | |
| |
| | | | Market |
| | | | Value |
| | | Shares | ($000) |
| * | Xenith Bankshares Inc. | 40,283 | 300 |
| * | Atlanticus Holdings Corp. | 92,614 | 296 |
| * | Anchor Bancorp Inc. | 11,400 | 294 |
| | Codorus Valley Bancorp Inc. | 14,338 | 292 |
| | Cheviot Financial Corp. | 18,999 | 291 |
| | Gladstone Land Corp. | 32,643 | 282 |
| * | BRT Realty Trust | 44,049 | 279 |
| | Owens Realty Mortgage Inc. | 20,468 | 275 |
| | First Internet Bancorp | 9,481 | 272 |
| * | ZAIS Group Holdings Inc. | 29,300 | 271 |
| | Two River Bancorp | 26,479 | 263 |
| | Blue Capital Reinsurance Holdings Ltd. | 15,088 | 259 |
| | Silvercrest Asset Management Group Inc. Class A | 21,464 | 255 |
| | SI Financial Group Inc. | 18,630 | 254 |
| | Farmers National Banc Corp. | 28,837 | 248 |
| | US Global Investors Inc. Class A | 210,856 | 247 |
| * | Southern First Bancshares Inc. | 10,909 | 247 |
| | Union Bankshares Inc. | 8,739 | 244 |
| | Jernigan Capital Inc. | 16,082 | 240 |
| | Hingham Institution for Savings | 1,971 | 236 |
| | Georgetown Bancorp Inc. | 12,400 | 234 |
| | QC Holdings Inc. | 158,879 | 232 |
| | Old Point Financial Corp. | 12,862 | 221 |
| | United Bancshares Inc. | 11,489 | 209 |
| * | JG Wentworth Co. Class A | 115,081 | 207 |
| | First Clover Leaf Financial Corp. | 21,799 | 203 |
| * | Select Bancorp Inc. | 23,684 | 192 |
| | CB Financial Services Inc. | 8,114 | 186 |
| * | Royal Bancshares of Pennsylvania Inc. | 88,717 | 185 |
| * | First Northwest Bancorp | 12,610 | 178 |
| * | InterGroup Corp. | 6,400 | 163 |
| | Wolverine Bancorp Inc. | 5,954 | 159 |
| * | Central Federal Corp. | 119,516 | 158 |
| | IF Bancorp Inc. | 7,557 | 140 |
| | FS Bancorp Inc. | 5,340 | 138 |
| | LaPorte Bancorp Inc. | 8,278 | 126 |
| * | Jacksonville Bancorp Inc. | 6,686 | 125 |
| *,^ | RCS Capital Corp. Class A | 397,474 | 121 |
| * | Veritex Holdings Inc. | 7,237 | 117 |
| | Glen Burnie Bancorp | 9,147 | 114 |
| | Greene County Bancorp Inc. | 3,483 | 111 |
| | Your Community Bankshares Inc. | 3,511 | 111 |
| | Sussex Bancorp | 8,387 | 110 |
| * | Severn Bancorp Inc. | 19,055 | 110 |
| * | Naugatuck Valley Financial Corp. | 10,037 | 110 |
| * | Malvern Bancorp Inc. | 6,171 | 108 |
| | Southwest Georgia Financial Corp. | 6,935 | 108 |
| | Manhattan Bridge Capital Inc. | 24,275 | 107 |
| | United Community Bancorp | 7,174 | 107 |
| * | Magyar Bancorp Inc. | 10,365 | 103 |
| * | Hamilton Bancorp Inc. | 7,058 | 101 |
| | Bank of South Carolina Corp. | 5,642 | 92 |
| | United Bancorp Inc. | 9,360 | 90 |
| * | Entegra Financial Corp. | 3,814 | 73 |
| | Kentucky First Federal Bancorp | 7,514 | 72 |
| | Eagle Bancorp Montana Inc. | 5,462 | 68 |
| | Southern Missouri Bancorp Inc. | 2,800 | 67 |
| * | National Commerce Corp. | 2,367 | 59 |
| | Great Ajax Corp. | 4,800 | 58 |
| | MSB Financial Corp. | 4,500 | 57 |
| * | Peoples Financial Corp. | 6,186 | 56 |
| * | 1st Century Bancshares Inc. | 8,013 | 56 |
| * | Porter Bancorp Inc. | 36,051 | 51 |
| | River Valley Bancorp | 1,419 | 50 |
23
| | | |
| Vanguard® Extended Market Index Fund | | |
| Schedule of Investments | | |
| December 31, 2015 | | |
| |
| | | | Market |
| | | | Value |
| | | Shares | ($000) |
| | Oconee Federal Financial Corp. | 2,383 | 48 |
| | First Capital Bancorp Inc. | 8,327 | 46 |
| | People's Utah Bancorp | 2,672 | 46 |
| | A-Mark Precious Metals Inc. | 2,370 | 46 |
| | Salisbury Bancorp Inc. | 1,341 | 45 |
| * | 1347 Property Insurance Holdings Inc. | 5,528 | 42 |
| * | American Farmland Co. | 5,790 | 41 |
| * | Condor Hospitality Trust Inc. | 31,965 | 40 |
| | LCNB Corp. | 2,393 | 39 |
| | Carolina Financial Corp. | 2,000 | 36 |
| | Kingstone Cos. Inc. | 3,909 | 35 |
| | Ameriana Bancorp | 1,501 | 34 |
| * | Avenue Financial Holdings Inc. | 2,300 | 34 |
| | Community West Bancshares | 4,500 | 32 |
| | ACNB Corp. | 1,444 | 31 |
| | Chemung Financial Corp. | 1,110 | 31 |
| | Fauquier Bankshares Inc. | 1,931 | 30 |
| | Mackinac Financial Corp. | 2,400 | 28 |
| * | Atlantic Capital Bancshares Inc. | 1,857 | 28 |
| | Bankwell Financial Group Inc. | 1,389 | 28 |
| | Griffin Industrial Realty Inc. | 966 | 25 |
| * | Patriot National Bancorp Inc. | 1,479 | 23 |
| | Mid Penn Bancorp Inc. | 1,384 | 22 |
| | Baylake Corp. | 1,055 | 15 |
| | Northeast Bancorp | 1,300 | 14 |
| | First Capital Inc. | 511 | 13 |
| * | Village Bank and Trust Financial Corp. | 600 | 11 |
| | Landmark Bancorp Inc. | 420 | 11 |
| | Auburn National Bancorporation Inc. | 359 | 11 |
| | Fifth Street Asset Management Inc. | 3,100 | 10 |
| | Elmira Savings Bank | 431 | 8 |
| | Value Line Inc. | 586 | 8 |
| *,^ | Polonia Bancorp Inc. | 630 | 7 |
| | WashingtonFirst Bankshares Inc. | 305 | 7 |
| * | Conifer Holdings Inc. | 700 | 7 |
| | Summit State Bank | 400 | 5 |
| * | Provident Bancorp Inc. | 410 | 5 |
| | Atlantic American Corp. | 1,084 | 5 |
| * | Transcontinental Realty Investors Inc. | 400 | 4 |
| | Wheeler REIT Inc. | 2,100 | 4 |
| | CKX Lands Inc. | 399 | 4 |
| | Medley Management Inc. Class A | 600 | 3 |
| | Bancorp of New Jersey Inc. | 300 | 3 |
| | California First National Bancorp | 223 | 3 |
| | Lake Shore Bancorp Inc. | 200 | 3 |
| * | Broadway Financial Corp. | 1,800 | 2 |
| | Stewardship Financial Corp. | 400 | 2 |
| * | Siebert Financial Corp. | 1,836 | 2 |
| * | Allegiance Bancshares Inc. | 100 | 2 |
| | Investar Holding Corp. | 100 | 2 |
| | United Security Bancshares Inc. | 192 | 2 |
| * | Power REIT | 200 | 1 |
| | Institutional Financial Markets Inc. | 649 | 1 |
| * | American Realty Investors Inc. | 37 | — |
| * | Tejon Ranch Co. Warrants Exp. 08/31/2016 | 17,984 | — |
| | | | 11,076,081 |
| Health Care (13.5%) | | |
| * | Incyte Corp. | 1,767,077 | 191,640 |
| * | BioMarin Pharmaceutical Inc. | 1,688,086 | 176,844 |
| * | Alkermes plc | 1,572,046 | 124,789 |
| * | Hologic Inc. | 2,567,332 | 99,330 |
| * | Mettler-Toledo International Inc. | 285,485 | 96,817 |
| * | Jazz Pharmaceuticals plc | 643,232 | 90,413 |
| * | Medivation Inc. | 1,711,997 | 82,758 |
24
| | | |
| Vanguard® Extended Market Index Fund | | |
| Schedule of Investments | | |
| December 31, 2015 | | |
| |
| | | | Market |
| | | | Value |
| | | Shares | ($000) |
| * | Centene Corp. | 1,244,554 | 81,904 |
| | ResMed Inc. | 1,454,877 | 78,112 |
| * | Ionis Pharmaceuticals Inc. | 1,256,220 | 77,798 |
| * | United Therapeutics Corp. | 477,646 | 74,804 |
| * | Alnylam Pharmaceuticals Inc. | 771,766 | 72,654 |
| * | MEDNAX Inc. | 983,196 | 70,456 |
| * | IDEXX Laboratories Inc. | 956,773 | 69,768 |
| * | DexCom Inc. | 850,674 | 69,670 |
| * | Quintiles Transnational Holdings Inc. | 1,000,902 | 68,722 |
| | Cooper Cos. Inc. | 506,566 | 67,981 |
| * | STERIS plc | 898,167 | 67,668 |
| * | athenahealth Inc. | 405,893 | 65,337 |
| * | Sirona Dental Systems Inc. | 585,053 | 64,104 |
| * | Dyax Corp. | 1,538,864 | 57,892 |
| | Teleflex Inc. | 435,182 | 57,205 |
| * | Health Net Inc. | 809,238 | 55,400 |
| * | Anacor Pharmaceuticals Inc. | 462,447 | 52,243 |
| * | Envision Healthcare Holdings Inc. | 1,954,760 | 50,765 |
| * | Seattle Genetics Inc. | 1,123,212 | 50,410 |
| * | Align Technology Inc. | 756,263 | 49,800 |
| * | Neurocrine Biosciences Inc. | 832,259 | 47,081 |
| * | VCA Inc. | 842,802 | 46,354 |
| | West Pharmaceutical Services Inc. | 753,721 | 45,389 |
| * | Amsurg Corp. | 563,070 | 42,793 |
| * | Ultragenyx Pharmaceutical Inc. | 370,360 | 41,547 |
| * | IMS Health Holdings Inc. | 1,543,022 | 39,301 |
| * | Charles River Laboratories International Inc. | 486,478 | 39,108 |
| * | PAREXEL International Corp. | 551,198 | 37,548 |
| * | ABIOMED Inc. | 408,201 | 36,852 |
| * | WellCare Health Plans Inc. | 460,318 | 36,001 |
| * | Brookdale Senior Living Inc. | 1,926,056 | 35,555 |
| * | Acadia Healthcare Co. Inc. | 568,801 | 35,527 |
| * | Alere Inc. | 899,371 | 35,156 |
| | Bio-Techne Corp. | 387,664 | 34,890 |
| *,^ | OPKO Health Inc. | 3,343,151 | 33,599 |
| * | Team Health Holdings Inc. | 760,085 | 33,360 |
| * | LifePoint Health Inc. | 454,036 | 33,326 |
| | HealthSouth Corp. | 953,586 | 33,194 |
| * | Horizon Pharma plc | 1,513,826 | 32,805 |
| * | Community Health Systems Inc. | 1,233,493 | 32,725 |
| *,^ | Juno Therapeutics Inc. | 734,942 | 32,315 |
| *,^ | Myriad Genetics Inc. | 737,405 | 31,826 |
| * | Akorn Inc. | 837,556 | 31,249 |
| * | Allscripts Healthcare Solutions Inc. | 1,971,609 | 30,323 |
| * | Impax Laboratories Inc. | 704,467 | 30,123 |
| * | Bio-Rad Laboratories Inc. Class A | 216,750 | 30,055 |
| * | Portola Pharmaceuticals Inc. | 583,744 | 30,034 |
| * | ACADIA Pharmaceuticals Inc. | 839,503 | 29,928 |
| * | Pacira Pharmaceuticals Inc. | 386,691 | 29,694 |
| * | Medidata Solutions Inc. | 584,950 | 28,832 |
| | Hill-Rom Holdings Inc. | 591,094 | 28,408 |
| * | Prestige Brands Holdings Inc. | 550,886 | 28,360 |
| * | Bruker Corp. | 1,162,180 | 28,206 |
| * | NuVasive Inc. | 511,282 | 27,665 |
| * | Cepheid | 754,337 | 27,556 |
| *,^ | Kite Pharma Inc. | 438,853 | 27,042 |
| * | Medicines Co. | 723,999 | 27,034 |
| *,^ | Intercept Pharmaceuticals Inc. | 180,286 | 26,926 |
| | Chemed Corp. | 176,455 | 26,433 |
| * | LivaNova plc | 443,039 | 26,303 |
| * | Catalent Inc. | 1,027,647 | 25,722 |
| * | Molina Healthcare Inc. | 425,460 | 25,583 |
| * | Bluebird Bio Inc. | 382,382 | 24,557 |
| | Owens & Minor Inc. | 667,392 | 24,013 |
25
| | | |
| Vanguard® Extended Market Index Fund | | |
| Schedule of Investments | | |
| December 31, 2015 | | |
| |
| | | | Market |
| | | | Value |
| | | Shares | ($000) |
| * | Novavax Inc. | 2,834,835 | 23,784 |
| | Cantel Medical Corp. | 380,252 | 23,629 |
| * | Nektar Therapeutics | 1,400,482 | 23,598 |
| * | Ophthotech Corp. | 292,085 | 22,937 |
| * | Veeva Systems Inc. Class A | 788,154 | 22,738 |
| * | Prothena Corp. plc | 332,225 | 22,628 |
| * | Wright Medical Group NV | 934,305 | 22,592 |
| * | Insulet Corp. | 592,411 | 22,399 |
| * | Neogen Corp. | 394,791 | 22,314 |
| * | Radius Health Inc. | 360,008 | 22,155 |
| * | Globus Medical Inc. | 745,397 | 20,737 |
| * | Ligand Pharmaceuticals Inc. | 189,078 | 20,500 |
| * | Integra LifeSciences Holdings Corp. | 299,061 | 20,270 |
| * | Halozyme Therapeutics Inc. | 1,157,648 | 20,062 |
| * | Masimo Corp. | 482,474 | 20,028 |
| * | MedAssets Inc. | 633,355 | 19,596 |
| * | Acorda Therapeutics Inc. | 452,275 | 19,348 |
| * | Puma Biotechnology Inc. | 228,905 | 17,946 |
| *,^ | Agios Pharmaceuticals Inc. | 274,969 | 17,851 |
| * | Haemonetics Corp. | 527,704 | 17,013 |
| * | Natus Medical Inc. | 351,637 | 16,896 |
| * | ICU Medical Inc. | 149,444 | 16,854 |
| * | VWR Corp. | 594,543 | 16,832 |
| *,^ | Sarepta Therapeutics Inc. | 433,361 | 16,719 |
| * | Intra-Cellular Therapies Inc. Class A | 309,547 | 16,651 |
| * | Magellan Health Inc. | 266,740 | 16,447 |
| * | Halyard Health Inc. | 491,181 | 16,410 |
| * | Celldex Therapeutics Inc. | 1,043,706 | 16,365 |
| * | INC Research Holdings Inc. Class A | 335,012 | 16,251 |
| * | TESARO Inc. | 309,329 | 16,184 |
| * | Premier Inc. Class A | 452,774 | 15,969 |
| * | Air Methods Corp. | 379,553 | 15,915 |
| * | FibroGen Inc. | 521,480 | 15,890 |
| *,^ | Intrexon Corp. | 520,928 | 15,706 |
| * | AMN Healthcare Services Inc. | 502,619 | 15,606 |
| * | Cambrex Corp. | 326,326 | 15,367 |
| * | TherapeuticsMD Inc. | 1,475,678 | 15,303 |
| * | Ironwood Pharmaceuticals Inc. Class A | 1,317,578 | 15,271 |
| * | Acceleron Pharma Inc. | 312,069 | 15,216 |
| * | NxStage Medical Inc. | 627,115 | 13,740 |
| * | Greatbatch Inc. | 260,962 | 13,701 |
| * | Achillion Pharmaceuticals Inc. | 1,217,467 | 13,136 |
| | Select Medical Holdings Corp. | 1,080,056 | 12,863 |
| * | Emergent BioSolutions Inc. | 321,044 | 12,845 |
| * | Amicus Therapeutics Inc. | 1,307,134 | 12,679 |
| | Abaxis Inc. | 227,307 | 12,656 |
| * | Diplomat Pharmacy Inc. | 364,505 | 12,473 |
| * | ARIAD Pharmaceuticals Inc. | 1,990,739 | 12,442 |
| * | ImmunoGen Inc. | 914,211 | 12,406 |
| *,^ | Exelixis Inc. | 2,172,686 | 12,254 |
| * | Clovis Oncology Inc. | 346,783 | 12,137 |
| * | Omnicell Inc. | 382,984 | 11,903 |
| * | Insmed Inc. | 653,355 | 11,858 |
| | CONMED Corp. | 267,652 | 11,790 |
| *,^ | Lannett Co. Inc. | 287,516 | 11,535 |
| * | HMS Holdings Corp. | 934,633 | 11,533 |
| * | Depomed Inc. | 634,267 | 11,499 |
| * | Amedisys Inc. | 292,446 | 11,499 |
| *,^ | ZIOPHARM Oncology Inc. | 1,364,076 | 11,335 |
| *,^ | Cempra Inc. | 362,532 | 11,286 |
| * | PharMerica Corp. | 321,862 | 11,265 |
| * | Surgical Care Affiliates Inc. | 282,954 | 11,264 |
| | Ensign Group Inc. | 490,814 | 11,107 |
| * | Five Prime Therapeutics Inc. | 266,155 | 11,045 |
26
| | | |
| Vanguard® Extended Market Index Fund | | |
| Schedule of Investments | | |
| December 31, 2015 | | |
| |
| | | | Market |
| | | | Value |
| | | Shares | ($000) |
| | Analogic Corp. | 132,098 | 10,911 |
| * | ExamWorks Group Inc. | 408,779 | 10,874 |
| * | AMAG Pharmaceuticals Inc. | 357,766 | 10,801 |
| * | Cynosure Inc. Class A | 235,953 | 10,540 |
| | Kindred Healthcare Inc. | 883,989 | 10,528 |
| * | PTC Therapeutics Inc. | 322,567 | 10,451 |
| * | Dynavax Technologies Corp. | 431,185 | 10,417 |
| *,^ | MiMedx Group Inc. | 1,058,055 | 9,914 |
| * | MacroGenics Inc. | 318,001 | 9,848 |
| * | Repligen Corp. | 347,242 | 9,823 |
| * | Momenta Pharmaceuticals Inc. | 643,949 | 9,556 |
| | Meridian Bioscience Inc. | 463,649 | 9,514 |
| * | Zeltiq Aesthetics Inc. | 331,444 | 9,456 |
| * | PRA Health Sciences Inc. | 208,233 | 9,427 |
| * | Affymetrix Inc. | 934,018 | 9,424 |
| * | Exact Sciences Corp. | 1,014,927 | 9,368 |
| * | Nevro Corp. | 138,469 | 9,348 |
| ^ | Theravance Inc. | 873,035 | 9,202 |
| * | HealthEquity Inc. | 365,012 | 9,151 |
| * | Merrimack Pharmaceuticals Inc. | 1,135,747 | 8,972 |
| * | Alder Biopharmaceuticals Inc. | 270,039 | 8,919 |
| * | HeartWare International Inc. | 176,961 | 8,919 |
| * | Eagle Pharmaceuticals Inc. | 100,152 | 8,880 |
| * | Orthofix International NV | 223,501 | 8,763 |
| * | Merit Medical Systems Inc. | 470,979 | 8,756 |
| | US Physical Therapy Inc. | 161,108 | 8,648 |
| * | Luminex Corp. | 400,127 | 8,559 |
| *,^ | Heron Therapeutics Inc. | 318,144 | 8,494 |
| *,^ | Geron Corp. | 1,725,067 | 8,349 |
| *,^ | Pacific Biosciences of California Inc. | 634,234 | 8,328 |
| *,^ | Relypsa Inc. | 288,518 | 8,177 |
| | Quality Systems Inc. | 498,540 | 8,036 |
| | Aceto Corp. | 296,188 | 7,991 |
| * | BioCryst Pharmaceuticals Inc. | 768,280 | 7,929 |
| *,^ | NewLink Genetics Corp. | 215,331 | 7,836 |
| * | LHC Group Inc. | 170,144 | 7,706 |
| * | Genomic Health Inc. | 216,657 | 7,626 |
| | National HealthCare Corp. | 122,665 | 7,568 |
| * | Endologix Inc. | 716,844 | 7,097 |
| * | Quidel Corp. | 331,719 | 7,032 |
| *,^ | Lexicon Pharmaceuticals Inc. | 522,746 | 6,958 |
| * | Spectranetics Corp. | 450,880 | 6,790 |
| *,^ | Insys Therapeutics Inc. | 234,555 | 6,715 |
| * | Sangamo BioSciences Inc. | 733,831 | 6,700 |
| * | CorVel Corp. | 150,685 | 6,618 |
| * | Revance Therapeutics Inc. | 192,830 | 6,587 |
| * | Capital Senior Living Corp. | 314,812 | 6,567 |
| * | AtriCure Inc. | 288,729 | 6,479 |
| *,^ | Cerus Corp. | 1,017,278 | 6,429 |
| * | Sage Therapeutics Inc. | 110,206 | 6,425 |
| * | Aerie Pharmaceuticals Inc. | 263,294 | 6,411 |
| | Computer Programs & Systems Inc. | 127,106 | 6,324 |
| * | LDR Holding Corp. | 250,120 | 6,281 |
| * | Hanger Inc. | 381,513 | 6,276 |
| | Invacare Corp. | 358,712 | 6,238 |
| * | Vascular Solutions Inc. | 180,688 | 6,214 |
| * | Retrophin Inc. | 321,669 | 6,205 |
| * | Dermira Inc. | 177,817 | 6,154 |
| * | Providence Service Corp. | 129,265 | 6,065 |
| * | Inogen Inc. | 149,900 | 6,010 |
| | Atrion Corp. | 15,739 | 6,000 |
| *,^ | Spark Therapeutics Inc. | 131,338 | 5,951 |
| * | Triple-S Management Corp. Class B | 248,629 | 5,945 |
| *,^ | Omeros Corp. | 372,229 | 5,855 |
27
| | | |
| Vanguard® Extended Market Index Fund | | |
| Schedule of Investments | | |
| December 31, 2015 | | |
| |
| | | | Market |
| | | | Value |
| | | Shares | ($000) |
| * | Accuray Inc. | 865,643 | 5,843 |
| * | Anika Therapeutics Inc. | 152,237 | 5,809 |
| * | Array BioPharma Inc. | 1,368,457 | 5,775 |
| * | HealthStream Inc. | 260,932 | 5,741 |
| *,^ | Synergy Pharmaceuticals Inc. | 1,010,636 | 5,730 |
| *,^ | Keryx Biopharmaceuticals Inc. | 1,094,765 | 5,529 |
| *,^ | Accelerate Diagnostics Inc. | 254,286 | 5,465 |
| * | Cross Country Healthcare Inc. | 330,529 | 5,417 |
| *,^ | Albany Molecular Research Inc. | 264,182 | 5,244 |
| * | K2M Group Holdings Inc. | 261,850 | 5,169 |
| * | Xencor Inc. | 350,006 | 5,117 |
| * | Otonomy Inc. | 184,036 | 5,107 |
| * | Healthways Inc. | 389,360 | 5,011 |
| * | Mirati Therapeutics Inc. | 155,395 | 4,910 |
| * | Arena Pharmaceuticals Inc. | 2,581,636 | 4,905 |
| *,^ | Rockwell Medical Inc. | 476,715 | 4,882 |
| * | SciClone Pharmaceuticals Inc. | 525,769 | 4,837 |
| *,^ | Adeptus Health Inc. Class A | 87,241 | 4,756 |
| * | Amphastar Pharmaceuticals Inc. | 333,453 | 4,745 |
| * | Supernus Pharmaceuticals Inc. | 350,888 | 4,716 |
| * | Cardiovascular Systems Inc. | 311,560 | 4,711 |
| | Phibro Animal Health Corp. Class A | 156,302 | 4,709 |
| * | TG Therapeutics Inc. | 389,537 | 4,647 |
| *,^ | Inovio Pharmaceuticals Inc. | 691,197 | 4,645 |
| | CryoLife Inc. | 429,681 | 4,632 |
| * | Inovalon Holdings Inc. Class A | 271,414 | 4,614 |
| * | OraSure Technologies Inc. | 715,098 | 4,605 |
| * | Progenics Pharmaceuticals Inc. | 742,570 | 4,552 |
| * | Raptor Pharmaceutical Corp. | 871,258 | 4,531 |
| * | Sucampo Pharmaceuticals Inc. Class A | 260,060 | 4,496 |
| * | Intersect ENT Inc. | 198,552 | 4,467 |
| * | Atara Biotherapeutics Inc. | 168,510 | 4,450 |
| * | AngioDynamics Inc. | 362,600 | 4,402 |
| * | Theravance Biopharma Inc. | 268,511 | 4,401 |
| * | Cytokinetics Inc. | 415,366 | 4,345 |
| *,^ | Vanda Pharmaceuticals Inc. | 460,117 | 4,284 |
| * | Corcept Therapeutics Inc. | 856,849 | 4,267 |
| * | Enanta Pharmaceuticals Inc. | 127,727 | 4,218 |
| * | Civitas Solutions Inc. | 145,395 | 4,186 |
| * | Sagent Pharmaceuticals Inc. | 258,050 | 4,106 |
| *,^ | Arrowhead Research Corp. | 657,617 | 4,044 |
| *,^ | MannKind Corp. | 2,785,206 | 4,039 |
| * | Spectrum Pharmaceuticals Inc. | 661,827 | 3,991 |
| * | Infinity Pharmaceuticals Inc. | 506,729 | 3,978 |
| * | La Jolla Pharmaceutical Co. | 145,845 | 3,938 |
| * | Lion Biotechnologies Inc. | 506,732 | 3,912 |
| * | NeoGenomics Inc. | 495,750 | 3,902 |
| | Universal American Corp. | 554,950 | 3,885 |
| * | Chimerix Inc. | 432,520 | 3,871 |
| * | Epizyme Inc. | 240,727 | 3,856 |
| * | Tetraphase Pharmaceuticals Inc. | 383,359 | 3,845 |
| *,^ | ANI Pharmaceuticals Inc. | 84,092 | 3,795 |
| * | Heska Corp. | 97,281 | 3,763 |
| * | Rigel Pharmaceuticals Inc. | 1,230,854 | 3,729 |
| * | GenMark Diagnostics Inc. | 480,267 | 3,727 |
| * | Curis Inc. | 1,278,599 | 3,721 |
| *,^ | Teligent Inc. | 413,225 | 3,678 |
| | Landauer Inc. | 109,487 | 3,604 |
| * | XenoPort Inc. | 646,651 | 3,550 |
| * | Zogenix Inc. | 240,060 | 3,538 |
| * | BioTelemetry Inc. | 301,044 | 3,516 |
| *,^ | Immunomedics Inc. | 1,143,867 | 3,512 |
| *,^ | Idera Pharmaceuticals Inc. | 1,134,422 | 3,505 |
| * | Ignyta Inc. | 259,731 | 3,480 |
28
| | | |
| Vanguard® Extended Market Index Fund | | |
| Schedule of Investments | | |
| December 31, 2015 | | |
| |
| | | | Market |
| | | | Value |
| | | Shares | ($000) |
| * | Agenus Inc. | 757,448 | 3,439 |
| * | SurModics Inc. | 167,863 | 3,403 |
| *,^ | Esperion Therapeutics Inc. | 148,541 | 3,307 |
| * | OncoMed Pharmaceuticals Inc. | 145,846 | 3,287 |
| * | Vocera Communications Inc. | 268,872 | 3,280 |
| * | Fluidigm Corp. | 300,447 | 3,248 |
| * | Almost Family Inc. | 84,685 | 3,238 |
| * | Cara Therapeutics Inc. | 191,986 | 3,237 |
| * | Trevena Inc. | 305,385 | 3,207 |
| *,^ | Foundation Medicine Inc. | 150,272 | 3,165 |
| * | Aegerion Pharmaceuticals Inc. | 311,540 | 3,147 |
| * | Durect Corp. | 1,358,418 | 3,002 |
| *,^ | Advaxis Inc. | 297,758 | 2,995 |
| * | Karyopharm Therapeutics Inc. | 224,087 | 2,969 |
| * | Concert Pharmaceuticals Inc. | 155,929 | 2,958 |
| * | Adamas Pharmaceuticals Inc. | 101,613 | 2,878 |
| *,^ | Seres Therapeutics Inc. | 78,968 | 2,771 |
| | Simulations Plus Inc. | 277,893 | 2,754 |
| | LeMaitre Vascular Inc. | 159,217 | 2,747 |
| *,^ | Regulus Therapeutics Inc. | 305,731 | 2,666 |
| *,^ | Galena Biopharma Inc. | 1,811,515 | 2,663 |
| * | Coherus Biosciences Inc. | 115,135 | 2,644 |
| ^ | Osiris Therapeutics Inc. | 254,366 | 2,640 |
| * | Ocata Therapeutics Inc. | 312,607 | 2,632 |
| * | Akebia Therapeutics Inc. | 202,454 | 2,616 |
| * | Tandem Diabetes Care Inc. | 221,473 | 2,616 |
| * | RTI Surgical Inc. | 642,284 | 2,550 |
| *,^ | Vital Therapies Inc. | 221,036 | 2,546 |
| * | STAAR Surgical Co. | 351,989 | 2,513 |
| *,^ | Aduro Biotech Inc. | 87,190 | 2,454 |
| * | Sorrento Therapeutics Inc. | 279,351 | 2,433 |
| *,^ | Navidea Biopharmaceuticals Inc. | 1,823,629 | 2,425 |
| * | Peregrine Pharmaceuticals Inc. | 2,061,493 | 2,412 |
| * | ArQule Inc. | 1,110,309 | 2,409 |
| * | Versartis Inc. | 193,073 | 2,392 |
| * | Blueprint Medicines Corp. | 90,685 | 2,389 |
| *,^ | OvaScience Inc. | 241,336 | 2,358 |
| * | RadNet Inc. | 375,987 | 2,324 |
| * | Oncothyreon Inc. | 1,043,273 | 2,316 |
| *,^ | BioTime Inc. | 560,837 | 2,299 |
| * | Vitae Pharmaceuticals Inc. | 125,209 | 2,266 |
| *,^ | BioDelivery Sciences International Inc. | 470,020 | 2,251 |
| * | Cutera Inc. | 175,926 | 2,250 |
| * | Applied Genetic Technologies Corp. | 110,092 | 2,246 |
| *,^ | Organovo Holdings Inc. | 899,055 | 2,239 |
| * | BioSpecifics Technologies Corp. | 51,965 | 2,233 |
| * | Press Ganey Holdings Inc. | 70,501 | 2,224 |
| * | Flexion Therapeutics Inc. | 115,289 | 2,222 |
| * | POZEN Inc. | 311,906 | 2,130 |
| * | CTI BioPharma Corp. | 1,723,610 | 2,120 |
| *,^ | Orexigen Therapeutics Inc. | 1,225,651 | 2,108 |
| | Digirad Corp. | 363,653 | 2,106 |
| *,^ | Ohr Pharmaceutical Inc. | 342,831 | 2,105 |
| *,^ | Sequenom Inc. | 1,277,953 | 2,096 |
| *,^ | Antares Pharma Inc. | 1,727,130 | 2,090 |
| *,^ | InVivo Therapeutics Holdings Corp. | 289,416 | 2,084 |
| * | Catalyst Pharmaceuticals Inc. | 807,654 | 1,979 |
| * | Dicerna Pharmaceuticals Inc. | 165,030 | 1,959 |
| * | NanoString Technologies Inc. | 130,351 | 1,917 |
| * | Collegium Pharmaceutical Inc. | 69,611 | 1,914 |
| * | ChemoCentryx Inc. | 235,430 | 1,907 |
| * | Enzo Biochem Inc. | 421,863 | 1,898 |
| *,^ | Ampio Pharmaceuticals Inc. | 534,745 | 1,872 |
| *,^ | Synthetic Biologics Inc. | 814,977 | 1,866 |
29
| | | |
| Vanguard® Extended Market Index Fund | | |
| Schedule of Investments | | |
| December 31, 2015 | | |
| |
| | | | Market |
| | | | Value |
| | | Shares | ($000) |
| * | Anthera Pharmaceuticals Inc. | 399,174 | 1,852 |
| * | Pfenex Inc. | 146,912 | 1,819 |
| * | Glaukos Corp. | 71,850 | 1,774 |
| * | Harvard Bioscience Inc. | 509,391 | 1,768 |
| *,^ | ConforMIS Inc. | 102,128 | 1,766 |
| *,^ | Endocyte Inc. | 439,774 | 1,764 |
| * | SeaSpine Holdings Corp. | 101,857 | 1,750 |
| *,^ | Northwest Biotherapeutics Inc. | 546,665 | 1,749 |
| *,^ | Trovagene Inc. | 323,383 | 1,746 |
| * | Aratana Therapeutics Inc. | 311,724 | 1,739 |
| *,^ | CytRx Corp. | 637,015 | 1,688 |
| * | Immune Design Corp. | 82,718 | 1,661 |
| * | Lipocine Inc. | 128,433 | 1,661 |
| * | Medgenics Inc. | 275,562 | 1,659 |
| *,^ | XOMA Corp. | 1,241,756 | 1,652 |
| * | Bellicum Pharmaceuticals Inc. | 79,924 | 1,620 |
| *,^ | Corindus Vascular Robotics Inc. | 495,720 | 1,591 |
| * | FONAR Corp. | 92,103 | 1,590 |
| * | Loxo Oncology Inc. | 55,295 | 1,573 |
| * | Exactech Inc. | 86,670 | 1,573 |
| *,^ | NantKwest Inc. | 90,272 | 1,564 |
| * | Inotek Pharmaceuticals Corp. | 133,636 | 1,514 |
| *,^ | Calithera Biosciences Inc. | 197,436 | 1,512 |
| * | Imprivata Inc. | 133,728 | 1,511 |
| *,^ | AAC Holdings Inc. | 79,177 | 1,509 |
| * | Juniper Pharmaceuticals Inc. | 140,913 | 1,451 |
| | Utah Medical Products Inc. | 24,749 | 1,449 |
| * | AcelRx Pharmaceuticals Inc. | 376,181 | 1,448 |
| * | Five Star Quality Care Inc. | 450,870 | 1,434 |
| *,^ | Teladoc Inc. | 79,747 | 1,432 |
| * | Addus HomeCare Corp. | 61,382 | 1,429 |
| * | Fibrocell Science Inc. | 309,698 | 1,409 |
| * | Chiasma Inc. | 69,983 | 1,370 |
| * | Castlight Health Inc. Class B | 318,856 | 1,362 |
| * | Tonix Pharmaceuticals Holding Corp. | 176,060 | 1,350 |
| * | Surgery Partners Inc. | 65,671 | 1,346 |
| * | Avalanche Biotechnologies Inc. | 138,712 | 1,321 |
| *,^ | BioScrip Inc. | 717,015 | 1,255 |
| * | Zafgen Inc. | 199,091 | 1,252 |
| *,^ | Actinium Pharmaceuticals Inc. | 381,361 | 1,232 |
| | National Research Corp. Class A | 76,761 | 1,231 |
| * | pSivida Corp. | 249,864 | 1,204 |
| *,^ | Neuralstem Inc. | 1,160,119 | 1,195 |
| | Psychemedics Corp. | 117,352 | 1,190 |
| *,^ | VIVUS Inc. | 1,166,164 | 1,189 |
| * | IRIDEX Corp. | 127,499 | 1,184 |
| * | PharmAthene Inc. | 612,034 | 1,163 |
| * | TransEnterix Inc. | 460,706 | 1,143 |
| * | Genocea Biosciences Inc. | 216,666 | 1,142 |
| * | Evolent Health Inc. Class A | 93,077 | 1,127 |
| * | Pernix Therapeutics Holdings Inc. | 377,528 | 1,114 |
| *,^ | Fortress Biotech Inc. | 399,008 | 1,113 |
| * | Aquinox Pharmaceuticals Inc. | 88,891 | 1,109 |
| * | Ardelyx Inc. | 60,864 | 1,103 |
| *,^ | Athersys Inc. | 1,065,817 | 1,098 |
| * | Derma Sciences Inc. | 240,161 | 1,098 |
| *,^ | Egalet Corp. | 97,866 | 1,078 |
| * | Natera Inc. | 99,651 | 1,076 |
| * | Pain Therapeutics Inc. | 610,088 | 1,068 |
| * | Alliance HealthCare Services Inc. | 114,880 | 1,055 |
| * | Stemline Therapeutics Inc. | 161,219 | 1,017 |
| *,^ | Avinger Inc. | 44,546 | 1,012 |
| * | Anavex Life Sciences Corp. | 181,435 | 1,011 |
| * | T2 Biosystems Inc. | 91,127 | 997 |
30
| | | |
| Vanguard® Extended Market Index Fund | | |
| Schedule of Investments | | |
| December 31, 2015 | | |
| |
| | | | Market |
| | | | Value |
| | | Shares | ($000) |
| * | Sharps Compliance Corp. | 110,374 | 960 |
| *,^ | CytoSorbents Corp. | 160,414 | 894 |
| * | Corium International Inc. | 107,395 | 872 |
| * | Entellus Medical Inc. | 51,631 | 871 |
| *,^ | IsoRay Inc. | 928,351 | 870 |
| * | Ocular Therapeutix Inc. | 91,701 | 859 |
| *,^ | Cellular Biomedicine Group Inc. | 39,509 | 849 |
| *,^ | Second Sight Medical Products Inc. | 141,895 | 836 |
| * | Genesis Healthcare Inc. | 240,632 | 835 |
| * | Flex Pharma Inc. | 66,993 | 834 |
| *,^ | Trupanion Inc. | 84,945 | 829 |
| * | Veracyte Inc. | 114,403 | 824 |
| * | AVEO Pharmaceuticals Inc. | 635,517 | 801 |
| * | Global Blood Therapeutics Inc. | 24,600 | 795 |
| *,^ | CorMedix Inc. | 385,415 | 782 |
| *,^ | Alimera Sciences Inc. | 312,131 | 755 |
| * | Assembly Biosciences Inc. | 100,114 | 752 |
| * | Paratek Pharmaceuticals Inc. | 38,588 | 732 |
| * | Sunesis Pharmaceuticals Inc. | 811,095 | 728 |
| * | Icad Inc. | 138,291 | 715 |
| * | Verastem Inc. | 374,972 | 697 |
| * | Neos Therapeutics Inc. | 48,277 | 691 |
| * | Rexahn Pharmaceuticals Inc. | 1,884,164 | 684 |
| * | MediciNova Inc. | 187,175 | 664 |
| *,^ | Mast Therapeutics Inc. | 1,575,981 | 662 |
| * | MEI Pharma Inc. | 413,074 | 661 |
| *,^ | Unilife Corp. | 1,326,162 | 657 |
| * | KemPharm Inc. | 32,208 | 640 |
| *,^ | Tokai Pharmaceuticals Inc. | 71,529 | 624 |
| * | Nivalis Therapeutics Inc. | 80,035 | 619 |
| * | Symmetry Surgical Inc. | 66,623 | 613 |
| * | Celsion Corp. | 317,144 | 609 |
| *,^ | Palatin Technologies Inc. | 915,420 | 608 |
| *,^ | Brainstorm Cell Therapeutics Inc. | 208,416 | 596 |
| *,^ | Asterias Biotherapeutics Inc. | 138,698 | 545 |
| *,^ | NanoViricides Inc. | 457,015 | 539 |
| *,^ | Sunshine Heart Inc. | 395,025 | 533 |
| *,^ | Invitae Corp. | 63,925 | 525 |
| *,^ | Tenax Therapeutics Inc. | 158,300 | 519 |
| * | Achaogen Inc. | 90,200 | 518 |
| *,^ | Conatus Pharmaceuticals Inc. | 176,373 | 508 |
| * | Penumbra Inc. | 9,287 | 500 |
| * | Biota Pharmaceuticals Inc. | 254,062 | 493 |
| * | Bio-Path Holdings Inc. | 391,005 | 489 |
| *,^ | TearLab Corp. | 341,643 | 475 |
| * | Kindred Biosciences Inc. | 138,888 | 472 |
| | Enzon Pharmaceuticals Inc. | 682,511 | 466 |
| * | Agile Therapeutics Inc. | 47,682 | 465 |
| * | EPIRUS Biopharmaceuticals Inc. | 149,690 | 463 |
| * | vTv Therapeutics Inc. Class A | 66,860 | 455 |
| *,^ | Apricus Biosciences Inc. | 459,729 | 455 |
| *,^ | XBiotech Inc. | 41,557 | 452 |
| * | Synta Pharmaceuticals Corp. | 1,282,091 | 451 |
| *,^ | iBio Inc. | 778,558 | 436 |
| * | GlycoMimetics Inc. | 76,072 | 435 |
| * | Sientra Inc. | 72,468 | 429 |
| *,^ | Caladrius Biosciences Inc. | 393,516 | 425 |
| * | iRadimed Corp. | 15,080 | 423 |
| * | aTyr Pharma Inc. | 42,909 | 422 |
| * | Aimmune Therapeutics Inc. | 22,707 | 419 |
| *,^ | Biolase Inc. | 495,670 | 417 |
| * | AxoGen Inc. | 82,239 | 411 |
| * | Cumberland Pharmaceuticals Inc. | 77,570 | 408 |
| * | StemCells Inc. | 972,676 | 405 |
31
| | | |
| Vanguard® Extended Market Index Fund | | |
| Schedule of Investments | | |
| December 31, 2015 | | |
| |
| | | | Market |
| | | | Value |
| | | Shares | ($000) |
| * | Adamis Pharmaceuticals Corp. | 74,586 | 403 |
| * | EndoChoice Holdings Inc. | 48,132 | 402 |
| *,^ | Galectin Therapeutics Inc. | 234,672 | 385 |
| | AdCare Health Systems Inc. | 150,665 | 375 |
| * | Repros Therapeutics Inc. | 310,038 | 375 |
| *,^ | Abeona Therapeutics Inc. | 109,176 | 367 |
| * | BIND Therapeutics Inc. | 158,988 | 364 |
| * | Vical Inc. | 883,152 | 362 |
| * | Tobira Therapeutics Inc. | 36,016 | 362 |
| * | Celator Pharmaceuticals Inc. | 204,371 | 360 |
| * | OncoGenex Pharmaceuticals Inc. | 295,004 | 357 |
| * | Threshold Pharmaceuticals Inc. | 740,061 | 355 |
| *,^ | ContraVir Pharmaceuticals Inc. | 227,142 | 350 |
| * | Ocera Therapeutics Inc. | 110,736 | 346 |
| * | ImmunoCellular Therapeutics Ltd. | 961,553 | 342 |
| * | Recro Pharma Inc. | 37,150 | 334 |
| * | Bovie Medical Corp. | 157,578 | 331 |
| * | Retractable Technologies Inc. | 101,655 | 315 |
| * | Cancer Genetics Inc. | 94,652 | 312 |
| * | Harvard Apparatus Regenerative Technology Inc. | 141,248 | 308 |
| *,^ | CEL-SCI Corp. | 821,652 | 304 |
| * | Dipexium Pharmaceuticals Inc. | 26,819 | 300 |
| *,^ | Cytori Therapeutics Inc. | 1,609,366 | 299 |
| * | Tracon Pharmaceuticals Inc. | 32,321 | 299 |
| * | Cymabay Therapeutics Inc. | 170,279 | 288 |
| * | Catabasis Pharmaceuticals Inc. | 35,114 | 278 |
| * | Cogentix Medical Inc. | 213,016 | 275 |
| *,^ | Celladon Corp. | 185,094 | 272 |
| * | Marinus Pharmaceuticals Inc. | 35,297 | 270 |
| * | Vericel Corp. | 103,402 | 267 |
| * | Misonix Inc. | 27,669 | 260 |
| * | Fate Therapeutics Inc. | 77,037 | 260 |
| * | OXiGENE Inc. | 348,782 | 259 |
| * | GTx Inc. | 365,136 | 256 |
| * | ERBA Diagnostics Inc. | 164,869 | 229 |
| * | Acura Pharmaceuticals Inc. | 89,117 | 225 |
| * | Alphatec Holdings Inc. | 750,358 | 225 |
| * | Catalyst Biosciences Inc. | 71,358 | 223 |
| * | Cidara Therapeutics Inc. | 12,950 | 222 |
| * | Eleven Biotherapeutics Inc. | 72,856 | 219 |
| * | Cerulean Pharma Inc. | 76,512 | 214 |
| *,^ | Oculus Innovative Sciences Inc. | 182,967 | 210 |
| * | Discovery Laboratories Inc. | 960,920 | 206 |
| * | Galmed Pharmaceuticals Ltd. | 26,994 | 205 |
| * | GenVec Inc. | 110,294 | 203 |
| * | MGC Diagnostics Corp. | 30,659 | 202 |
| * | Minerva Neurosciences Inc. | 32,924 | 200 |
| * | Cyclacel Pharmaceuticals Inc. | 398,619 | 199 |
| * | Authentidate Holding Corp. | 279,777 | 199 |
| * | Connecture Inc. | 54,605 | 197 |
| * | Hemispherx Biopharma Inc. | 2,409,402 | 194 |
| * | REGENXBIO Inc. | 11,510 | 191 |
| * | Imprimis Pharmaceuticals Inc. | 25,691 | 178 |
| * | TriVascular Technologies Inc. | 26,762 | 178 |
| *,^ | RXi Pharmaceuticals Corp. | 463,106 | 177 |
| * | Proteon Therapeutics Inc. | 11,248 | 174 |
| * | Alliqua BioMedical Inc. | 77,483 | 166 |
| * | Lantheus Holdings Inc. | 48,876 | 165 |
| * | Opexa Therapeutics Inc. | 56,710 | 158 |
| *,^ | Cleveland BioLabs Inc. | 45,001 | 157 |
| * | TetraLogic Pharmaceuticals Corp. | 88,594 | 153 |
| * | CoLucid Pharmaceuticals Inc. | 17,602 | 147 |
| *,^ | Hansen Medical Inc. | 62,603 | 146 |
| * | Invuity Inc. | 16,479 | 145 |
32
| | | |
| Vanguard® Extended Market Index Fund | | |
| Schedule of Investments | | |
| December 31, 2015 | | |
| |
| | | | Market |
| | | | Value |
| | | Shares | ($000) |
| * | Carbylan Therapeutics Inc. | 39,132 | 142 |
| * | Bioanalytical Systems Inc. | 91,696 | 139 |
| * | CAS Medical Systems Inc. | 78,450 | 139 |
| * | Aethlon Medical Inc. | 20,410 | 139 |
| * | ARCA biopharma Inc. | 28,967 | 135 |
| * | Biodel Inc. | 372,790 | 128 |
| * | Stereotaxis Inc. | 167,566 | 125 |
| * | Oragenics Inc. | 82,900 | 124 |
| * | CASI Pharmaceuticals Inc. | 119,606 | 115 |
| * | Venaxis Inc. | 372,644 | 113 |
| * | Edge Therapeutics Inc. | 9,000 | 113 |
| *,^ | EnteroMedics Inc. | 854,615 | 111 |
| * | ProPhase Labs Inc. | 72,896 | 109 |
| * | Chembio Diagnostics Inc. | 19,255 | 103 |
| * | Onconova Therapeutics Inc. | 106,120 | 102 |
| * | Cardica Inc. | 627,032 | 97 |
| * | Echo Therapeutics Inc. | 64,674 | 92 |
| * | Alexza Pharmaceuticals Inc. | 128,704 | 90 |
| * | Amedica Corp. | 758,004 | 90 |
| * | Vermillion Inc. | 49,637 | 89 |
| *,^ | PhotoMedex Inc. | 189,675 | 85 |
| * | Argos Therapeutics Inc. | 36,230 | 84 |
| * | Presbia plc | 15,400 | 81 |
| * | Atossa Genetics Inc. | 248,935 | 80 |
| * | Corbus Pharmaceuticals Holdings Inc. | 46,770 | 77 |
| *,^ | Signal Genetics Inc. | 97,775 | 73 |
| *,^ | Neothetics Inc. | 51,648 | 72 |
| | Daxor Corp. | 8,705 | 66 |
| * | Escalon Medical Corp. | 59,011 | 66 |
| * | Zynerba Pharmaceuticals Inc. | 6,355 | 64 |
| * | OncoSec Medical Inc. | 26,262 | 62 |
| * | Aclaris Therapeutics Inc. | 2,300 | 62 |
| * | SCYNEXIS Inc. | 9,918 | 62 |
| * | InfuSystems Holdings Inc. | 20,115 | 61 |
| *,^ | Biocept Inc. | 42,110 | 58 |
| *,^ | NephroGenex Inc. | 36,035 | 58 |
| * | Evoke Pharma Inc. | 17,363 | 57 |
| * | SunLink Health Systems Inc. | 60,871 | 55 |
| * | Transgenomic Inc. | 51,199 | 55 |
| * | CareDx Inc. | 8,500 | 54 |
| *,^ | Wright Medical Group Inc. CVR Exp. 12/31/2049 | 52,493 | 54 |
| * | VirtualScopics Inc. | 16,180 | 51 |
| *,^ | Immune Pharmaceuticals Inc. | 69,649 | 51 |
| * | Interpace Diagnostics Group Inc. | 99,850 | 50 |
| *,^ | Capnia Inc. | 26,128 | 48 |
| * | CombiMatrix Corp. | 64,337 | 48 |
| *,^ | MELA Sciences Inc. | 39,564 | 44 |
| *,^ | BioLife Solutions Inc. | 19,755 | 43 |
| * | Titan Pharmaceuticals Inc. | 9,200 | 41 |
| *,^ | Nanosphere Inc. | 63,746 | 39 |
| * | InspireMD Inc. | 43,009 | 38 |
| * | Mirna Therapeutics Inc. | 5,500 | 34 |
| * | CytomX Therapeutics Inc. | 1,635 | 34 |
| * | HTG Molecular Diagnostics Inc. | 7,700 | 34 |
| * | NovaBay Pharmaceuticals Inc. | 16,403 | 33 |
| * | Delcath Systems Inc. | 66,129 | 32 |
| * | Hooper Holmes Inc. | 472,677 | 29 |
| * | Ligand Pharmaceuticals Inc. Rights | 395,811 | 29 |
| * | VBI Vaccines Inc. | 11,951 | 28 |
| * | Streamline Health Solutions Inc. | 19,960 | 28 |
| * | GlobeImmune Inc. | 6,900 | 27 |
| | AbbVie Inc. | 417 | 25 |
| * | AmpliPhi Biosciences Corp. | 5,343 | 21 |
| * | American CareSource Holdings Inc. | 51,566 | 21 |
33
| | | |
| Vanguard® Extended Market Index Fund | | |
| Schedule of Investments | | |
| December 31, 2015 | | |
| |
| | | | Market |
| | | | Value |
| | | Shares | ($000) |
| * | NeuroMetrix Inc. | 10,370 | 21 |
| * | Aldeyra Therapeutics Inc. | 2,500 | 17 |
| * | Provectus Biopharmaceuticals Inc. Class A | 40,559 | 16 |
| * | Heat Biologics Inc. | 5,900 | 14 |
| | Span-America Medical Systems Inc. | 705 | 14 |
| * | Ligand Pharmaceuticals Inc. Rights | 395,811 | 14 |
| * | Allied Healthcare Products Inc. | 11,721 | 13 |
| * | Ligand Pharmaceuticals Inc. Rights | 395,811 | 13 |
| * | Lpath Inc. Class A | 54,978 | 12 |
| * | Roka Bioscience Inc. | 8,872 | 11 |
| * | Cesca Therapeutics Inc. | 54,283 | 10 |
| * | ADMA Biologics Inc. | 1,200 | 10 |
| * | VolitionRX Ltd. | 2,051 | 9 |
| *,^ | WaferGen Bio-systems Inc. | 11,651 | 9 |
| * | Ritter Pharmaceuticals Inc. | 5,000 | 9 |
| * | Pulmatrix Inc. | 2,106 | 8 |
| | Diversicare Healthcare Services Inc. | 953 | 8 |
| * | MyoKardia Inc. | 500 | 7 |
| *,^ | Perseon Corp. | 29,310 | 7 |
| * | Arrhythmia Research Technology Inc. | 1,175 | 6 |
| * | EyeGate Pharmaceuticals Inc. | 2,125 | 6 |
| * | Electromed Inc. | 2,500 | 5 |
| | Kewaunee Scientific Corp. | 214 | 4 |
| * | Aradigm Corp. | 891 | 4 |
| * | Rennova Health Inc. | 2,430 | 3 |
| * | Viking Therapeutics Inc. | 600 | 2 |
| * | Zosano Pharma Corp. | 747 | 2 |
| * | Ligand Pharmaceuticals Inc. Rights | 395,811 | 1 |
| * | Kura Oncology Inc. | 100 | 1 |
| * | American Shared Hospital Services | 276 | 1 |
| * | Medical Transcription Billing Corp. | 288 | — |
| * | BioPharmX Corp. | 163 | — |
| * | Great Basin Scientific Inc. | 135 | — |
| *,^ | KaloBios Pharmaceuticals Inc. | 40,642 | — |
| | | | 5,734,609 |
| Industrials (12.9%) | | |
| * | TransDigm Group Inc. | 558,132 | 127,505 |
| | Acuity Brands Inc. | 454,111 | 106,171 |
| | Alaska Air Group Inc. | 1,314,899 | 105,863 |
| | Towers Watson & Co. Class A | 725,438 | 93,190 |
| | Fortune Brands Home & Security Inc. | 1,668,396 | 92,596 |
| * | IHS Inc. Class A | 713,853 | 84,542 |
| * | Sensata Technologies Holding NV | 1,776,617 | 81,831 |
| * | JetBlue Airways Corp. | 3,263,332 | 73,914 |
| | Waste Connections Inc. | 1,279,463 | 72,059 |
| | Wabtec Corp. | 1,000,294 | 71,141 |
| * | Spirit AeroSystems Holdings Inc. Class A | 1,305,427 | 65,363 |
| | ManpowerGroup Inc. | 764,796 | 64,465 |
| * | Middleby Corp. | 589,703 | 63,611 |
| | Huntington Ingalls Industries Inc. | 495,065 | 62,799 |
| | Carlisle Cos. Inc. | 679,321 | 60,249 |
| | AO Smith Corp. | 785,702 | 60,193 |
| | IDEX Corp. | 777,417 | 59,558 |
| * | Hertz Global Holdings Inc. | 4,062,929 | 57,815 |
| * | Hubbell Inc. Class B | 567,198 | 57,310 |
| * | HD Supply Holdings Inc. | 1,906,546 | 57,254 |
| | Owens Corning | 1,215,520 | 57,166 |
| * | WABCO Holdings Inc. | 545,033 | 55,735 |
| | Macquarie Infrastructure Corp. | 759,928 | 55,171 |
| | Orbital ATK Inc. | 614,882 | 54,934 |
| | KAR Auction Services Inc. | 1,428,217 | 52,887 |
| | Lennox International Inc. | 417,595 | 52,158 |
| * | AECOM | 1,580,982 | 47,477 |
| | B/E Aerospace Inc. | 1,094,753 | 46,385 |
34
| | | |
| Vanguard® Extended Market Index Fund | | |
| Schedule of Investments | | |
| December 31, 2015 | | |
| |
| | | | Market |
| | | | Value |
| | | Shares | ($000) |
| | Hexcel Corp. | 997,070 | 46,314 |
| | Allison Transmission Holdings Inc. | 1,780,361 | 46,094 |
| * | Old Dominion Freight Line Inc. | 712,120 | 42,065 |
| | Graco Inc. | 583,334 | 42,041 |
| | Toro Co. | 571,942 | 41,792 |
| *,^ | Copart Inc. | 1,050,841 | 39,942 |
| * | Avis Budget Group Inc. | 1,076,653 | 39,072 |
| ^ | Chicago Bridge & Iron Co. NV | 986,461 | 38,462 |
| | Trinity Industries Inc. | 1,585,777 | 38,090 |
| | Donaldson Co. Inc. | 1,296,680 | 37,163 |
| | Lincoln Electric Holdings Inc. | 701,745 | 36,414 |
| | BWX Technologies Inc. | 1,130,792 | 35,925 |
| | Nordson Corp. | 551,097 | 35,353 |
| | AGCO Corp. | 756,964 | 34,359 |
| | ITT Corp. | 937,562 | 34,052 |
| | Curtiss-Wright Corp. | 485,537 | 33,259 |
| | Air Lease Corp. Class A | 983,809 | 32,938 |
| * | Teledyne Technologies Inc. | 369,101 | 32,739 |
| | RR Donnelley & Sons Co. | 2,176,240 | 32,034 |
| *,^ | SolarCity Corp. | 623,272 | 31,799 |
| | EMCOR Group Inc. | 655,091 | 31,471 |
| | Watsco Inc. | 268,469 | 31,446 |
| * | Genesee & Wyoming Inc. Class A | 572,894 | 30,759 |
| | Oshkosh Corp. | 780,402 | 30,467 |
| * | Spirit Airlines Inc. | 756,613 | 30,151 |
| | Woodward Inc. | 591,970 | 29,397 |
| * | Kirby Corp. | 551,210 | 29,005 |
| | Deluxe Corp. | 526,984 | 28,742 |
| | MSC Industrial Direct Co. Inc. Class A | 503,825 | 28,350 |
| | Regal Beloit Corp. | 473,401 | 27,703 |
| | Healthcare Services Group Inc. | 759,058 | 26,468 |
| | Landstar System Inc. | 450,532 | 26,424 |
| | EnerSys | 470,802 | 26,332 |
| | CLARCOR Inc. | 522,595 | 25,963 |
| | KBR Inc. | 1,523,665 | 25,780 |
| | Valmont Industries Inc. | 242,418 | 25,701 |
| | Rollins Inc. | 988,089 | 25,592 |
| *,^ | XPO Logistics Inc. | 927,412 | 25,272 |
| | AMERCO | 64,298 | 25,044 |
| * | Esterline Technologies Corp. | 308,543 | 24,992 |
| | Crane Co. | 515,088 | 24,642 |
| * | Colfax Corp. | 1,047,781 | 24,466 |
| * | Dycom Industries Inc. | 334,603 | 23,409 |
| | Allegiant Travel Co. Class A | 138,605 | 23,262 |
| * | Clean Harbors Inc. | 554,708 | 23,104 |
| * | USG Corp. | 951,108 | 23,102 |
| * | Armstrong World Industries Inc. | 501,336 | 22,926 |
| * | Advisory Board Co. | 448,793 | 22,265 |
| * | On Assignment Inc. | 492,767 | 22,150 |
| | Timken Co. | 767,158 | 21,933 |
| | Covanta Holding Corp. | 1,412,193 | 21,875 |
| ^ | Manitowoc Co. Inc. | 1,414,089 | 21,706 |
| | CEB Inc. | 353,408 | 21,696 |
| * | Beacon Roofing Supply Inc. | 524,352 | 21,593 |
| * | Moog Inc. Class A | 351,076 | 21,275 |
| * | Generac Holdings Inc. | 700,962 | 20,868 |
| | Terex Corp. | 1,128,457 | 20,854 |
| | Triumph Group Inc. | 520,907 | 20,706 |
| | Hillenbrand Inc. | 672,165 | 19,916 |
| * | WESCO International Inc. | 447,505 | 19,547 |
| | Matson Inc. | 456,351 | 19,454 |
| | GATX Corp. | 450,816 | 19,182 |
| * | Rexnord Corp. | 1,046,456 | 18,962 |
| | Barnes Group Inc. | 532,461 | 18,844 |
35
| | |
| Vanguard® Extended Market Index Fund | | |
| Schedule of Investments | | |
| December 31, 2015 | | |
| |
| | | Market |
| | | Value |
| | Shares | ($000) |
| HEICO Corp. Class A | 373,236 | 18,363 |
| Matthews International Corp. Class A | 340,808 | 18,216 |
| Herman Miller Inc. | 630,456 | 18,094 |
| * Masonite International Corp. | 293,862 | 17,993 |
| * NOW Inc. | 1,135,154 | 17,958 |
| * Hawaiian Holdings Inc. | 502,947 | 17,769 |
| Korn/Ferry International | 534,005 | 17,718 |
| Granite Construction Inc. | 408,383 | 17,524 |
| * KLX Inc. | 557,678 | 17,171 |
| HNI Corp. | 472,379 | 17,034 |
| * WageWorks Inc. | 371,597 | 16,859 |
| Applied Industrial Technologies Inc. | 414,163 | 16,769 |
| Tetra Tech Inc. | 638,427 | 16,612 |
| UniFirst Corp. | 157,872 | 16,450 |
| Mueller Industries Inc. | 606,121 | 16,426 |
| ABM Industries Inc. | 571,614 | 16,274 |
| * RBC Bearings Inc. | 247,508 | 15,987 |
| Kennametal Inc. | 830,279 | 15,941 |
| Knight Transportation Inc. | 651,808 | 15,793 |
| * Proto Labs Inc. | 243,936 | 15,536 |
| * FTI Consulting Inc. | 441,711 | 15,310 |
| John Bean Technologies Corp. | 304,791 | 15,188 |
| Simpson Manufacturing Co. Inc. | 444,549 | 15,181 |
| AZZ Inc. | 273,123 | 15,177 |
| Mobile Mini Inc. | 487,443 | 15,174 |
| Actuant Corp. Class A | 630,332 | 15,103 |
| Brink's Co. | 515,166 | 14,868 |
| Watts Water Technologies Inc. Class A | 299,173 | 14,860 |
| Mueller Water Products Inc. Class A | 1,701,717 | 14,635 |
| * Huron Consulting Group Inc. | 244,681 | 14,534 |
| MSA Safety Inc. | 334,063 | 14,522 |
| Universal Forest Products Inc. | 212,012 | 14,495 |
| Steelcase Inc. Class A | 948,592 | 14,134 |
| Forward Air Corp. | 327,406 | 14,082 |
| Exponent Inc. | 278,719 | 13,922 |
| * MRC Global Inc. | 1,079,124 | 13,921 |
| Aircastle Ltd. | 661,345 | 13,816 |
| Apogee Enterprises Inc. | 309,198 | 13,453 |
| Interface Inc. Class A | 697,794 | 13,356 |
| G&K Services Inc. Class A | 212,057 | 13,338 |
| Essendant Inc. | 406,152 | 13,204 |
| * Swift Transportation Co. | 946,897 | 13,086 |
| * Trex Co. Inc. | 338,840 | 12,889 |
| Joy Global Inc. | 1,013,414 | 12,779 |
| * Hub Group Inc. Class A | 368,474 | 12,141 |
| * SPX FLOW Inc. | 433,808 | 12,108 |
| Kaman Corp. | 292,008 | 11,917 |
| * Babcock & Wilcox Enterprises Inc. | 568,045 | 11,855 |
| * MasTec Inc. | 674,493 | 11,723 |
| Brady Corp. Class A | 505,536 | 11,617 |
| * TrueBlue Inc. | 443,479 | 11,424 |
| Franklin Electric Co. Inc. | 420,788 | 11,374 |
| Standex International Corp. | 136,322 | 11,335 |
| West Corp. | 524,073 | 11,304 |
| * American Woodmark Corp. | 141,182 | 11,292 |
| Albany International Corp. | 306,522 | 11,203 |
| Tennant Co. | 196,689 | 11,066 |
| Comfort Systems USA Inc. | 388,298 | 11,035 |
| Werner Enterprises Inc. | 471,476 | 11,028 |
| Heartland Express Inc. | 645,287 | 10,983 |
| Cubic Corp. | 231,204 | 10,924 |
| * Atlas Air Worldwide Holdings Inc. | 264,244 | 10,924 |
| HEICO Corp. | 200,731 | 10,912 |
| * DigitalGlobe Inc. | 688,933 | 10,789 |
36
| | | |
| Vanguard® Extended Market Index Fund | | |
| Schedule of Investments | | |
| December 31, 2015 | | |
| |
| | | | Market |
| | | | Value |
| | | Shares | ($000) |
| | Federal Signal Corp. | 662,102 | 10,494 |
| * | Aerojet Rocketdyne Holdings Inc. | 665,229 | 10,417 |
| | AAON Inc. | 445,195 | 10,337 |
| | ESCO Technologies Inc. | 282,384 | 10,205 |
| | SkyWest Inc. | 528,547 | 10,053 |
| | EnPro Industries Inc. | 229,150 | 10,046 |
| * | TASER International Inc. | 565,441 | 9,776 |
| | Knoll Inc. | 517,097 | 9,721 |
| | Astec Industries Inc. | 237,640 | 9,672 |
| | AAR Corp. | 363,582 | 9,559 |
| | Insperity Inc. | 194,200 | 9,351 |
| | Primoris Services Corp. | 414,795 | 9,138 |
| ^ | Lindsay Corp. | 125,387 | 9,078 |
| | Greenbrier Cos. Inc. | 276,734 | 9,027 |
| * | TriMas Corp. | 479,848 | 8,949 |
| | Quanex Building Products Corp. | 426,533 | 8,893 |
| * | Navigant Consulting Inc. | 550,778 | 8,845 |
| | Griffon Corp. | 494,156 | 8,796 |
| * | Meritor Inc. | 1,041,992 | 8,701 |
| | Sun Hydraulics Corp. | 273,014 | 8,663 |
| * | Wabash National Corp. | 730,154 | 8,638 |
| * | Gibraltar Industries Inc. | 339,249 | 8,630 |
| | Advanced Drainage Systems Inc. | 354,264 | 8,513 |
| * | ACCO Brands Corp. | 1,191,169 | 8,493 |
| * | TransUnion | 306,615 | 8,453 |
| | US Ecology Inc. | 231,314 | 8,429 |
| | Briggs & Stratton Corp. | 473,833 | 8,197 |
| | Kforce Inc. | 322,448 | 8,151 |
| * | Aegion Corp. Class A | 419,229 | 8,095 |
| | Multi-Color Corp. | 134,336 | 8,035 |
| | CIRCOR International Inc. | 189,247 | 7,977 |
| | Resources Connection Inc. | 487,432 | 7,965 |
| * | Builders FirstSource Inc. | 718,558 | 7,962 |
| * | Astronics Corp. | 194,697 | 7,926 |
| * | ICF International Inc. | 222,557 | 7,914 |
| * | Lydall Inc. | 219,406 | 7,785 |
| | Encore Wire Corp. | 207,998 | 7,715 |
| * | Rush Enterprises Inc. Class A | 343,275 | 7,514 |
| | Altra Industrial Motion Corp. | 297,285 | 7,456 |
| * | Team Inc. | 227,223 | 7,262 |
| * | Wesco Aircraft Holdings Inc. | 604,879 | 7,240 |
| * | TriNet Group Inc. | 370,629 | 7,172 |
| | General Cable Corp. | 527,948 | 7,090 |
| | Viad Corp. | 246,270 | 6,952 |
| * | UTi Worldwide Inc. | 984,307 | 6,920 |
| * | Tutor Perini Corp. | 413,238 | 6,918 |
| | McGrath RentCorp | 271,020 | 6,827 |
| | Harsco Corp. | 846,967 | 6,674 |
| | Heidrick & Struggles International Inc. | 240,187 | 6,538 |
| | Hyster-Yale Materials Handling Inc. | 123,947 | 6,501 |
| * | Patrick Industries Inc. | 147,358 | 6,410 |
| | Raven Industries Inc. | 407,858 | 6,363 |
| * | Aerovironment Inc. | 212,635 | 6,266 |
| * | Navistar International Corp. | 706,384 | 6,244 |
| | Kadant Inc. | 153,219 | 6,222 |
| * | RPX Corp. | 563,406 | 6,197 |
| * | Air Transport Services Group Inc. | 613,276 | 6,182 |
| | Gorman-Rupp Co. | 231,141 | 6,178 |
| *,^ | Virgin America Inc. | 169,040 | 6,087 |
| * | Engility Holdings Inc. | 185,316 | 6,019 |
| * | Thermon Group Holdings Inc. | 350,837 | 5,936 |
| * | Saia Inc. | 266,510 | 5,930 |
| | H&E Equipment Services Inc. | 336,661 | 5,885 |
| * | Continental Building Products Inc. | 333,629 | 5,825 |
37
| | | |
| Vanguard® Extended Market Index Fund | | |
| Schedule of Investments | | |
| December 31, 2015 | | |
| |
| | | | Market |
| | | | Value |
| | | Shares | ($000) |
| * | Chart Industries Inc. | 323,695 | 5,814 |
| | Ennis Inc. | 300,848 | 5,791 |
| * | CBIZ Inc. | 583,601 | 5,754 |
| | TAL International Group Inc. | 353,717 | 5,624 |
| * | PGT Inc. | 492,635 | 5,611 |
| * | Blount International Inc. | 562,116 | 5,514 |
| | ArcBest Corp. | 255,356 | 5,462 |
| | National Presto Industries Inc. | 65,407 | 5,420 |
| | Kelly Services Inc. Class A | 328,931 | 5,312 |
| * | Nortek Inc. | 121,782 | 5,312 |
| | Marten Transport Ltd. | 300,092 | 5,312 |
| * | Echo Global Logistics Inc. | 257,646 | 5,253 |
| * | Univar Inc. | 304,729 | 5,183 |
| * | MYR Group Inc. | 247,860 | 5,108 |
| | Douglas Dynamics Inc. | 236,704 | 4,987 |
| | Alamo Group Inc. | 91,495 | 4,767 |
| | Columbus McKinnon Corp. | 245,263 | 4,635 |
| * | GP Strategies Corp. | 179,861 | 4,516 |
| ^ | American Railcar Industries Inc. | 96,690 | 4,475 |
| | American Science & Engineering Inc. | 107,328 | 4,441 |
| * | YRC Worldwide Inc. | 306,486 | 4,346 |
| * | CSW Industrials Inc. | 114,384 | 4,309 |
| | Global Brass & Copper Holdings Inc. | 200,762 | 4,276 |
| * | SP Plus Corp. | 177,863 | 4,251 |
| | NN Inc. | 262,960 | 4,192 |
| | SPX Corp. | 433,797 | 4,047 |
| | Argan Inc. | 118,180 | 3,829 |
| * | NCI Building Systems Inc. | 298,849 | 3,709 |
| | Insteel Industries Inc. | 175,023 | 3,661 |
| *,^ | Plug Power Inc. | 1,734,216 | 3,659 |
| | Barrett Business Services Inc. | 83,025 | 3,615 |
| | Park-Ohio Holdings Corp. | 95,267 | 3,504 |
| * | Mistras Group Inc. | 183,077 | 3,495 |
| | VSE Corp. | 53,937 | 3,354 |
| * | PowerSecure International Inc. | 222,229 | 3,345 |
| | Kimball International Inc. Class B | 340,616 | 3,328 |
| * | InnerWorkings Inc. | 424,417 | 3,183 |
| * | DXP Enterprises Inc. | 136,513 | 3,112 |
| * | Veritiv Corp. | 81,926 | 2,967 |
| | FreightCar America Inc. | 150,784 | 2,930 |
| * | USA Truck Inc. | 167,506 | 2,923 |
| * | Ply Gem Holdings Inc. | 232,594 | 2,917 |
| * | Roadrunner Transportation Systems Inc. | 303,055 | 2,858 |
| | LSI Industries Inc. | 232,474 | 2,834 |
| | Quad/Graphics Inc. | 303,899 | 2,826 |
| * | Vicor Corp. | 305,008 | 2,782 |
| | Allied Motion Technologies Inc. | 104,726 | 2,742 |
| *,^ | Energy Recovery Inc. | 383,983 | 2,715 |
| | Celadon Group Inc. | 270,356 | 2,674 |
| * | Kratos Defense & Security Solutions Inc. | 651,578 | 2,671 |
| | Powell Industries Inc. | 97,470 | 2,537 |
| * | Furmanite Corp. | 370,447 | 2,467 |
| * | Vectrus Inc. | 115,334 | 2,409 |
| * | Franklin Covey Co. | 143,389 | 2,400 |
| * | Great Lakes Dredge & Dock Corp. | 603,788 | 2,391 |
| * | BMC Stock Holdings Inc. | 141,101 | 2,363 |
| | Acacia Research Corp. | 544,972 | 2,338 |
| *,^ | KEYW Holding Corp. | 388,329 | 2,338 |
| | Titan International Inc. | 574,230 | 2,262 |
| | Miller Industries Inc. | 102,480 | 2,232 |
| * | Titan Machinery Inc. | 202,673 | 2,215 |
| * | CRA International Inc. | 118,025 | 2,201 |
| | CECO Environmental Corp. | 272,620 | 2,094 |
| * | Republic Airways Holdings Inc. | 526,345 | 2,069 |
38
| | | |
| Vanguard® Extended Market Index Fund | | |
| Schedule of Investments | | |
| December 31, 2015 | | |
| |
| | | | Market |
| | | | Value |
| | | Shares | ($000) |
| * | Covenant Transportation Group Inc. Class A | 106,522 | 2,012 |
| * | ARC Document Solutions Inc. | 445,109 | 1,967 |
| * | Casella Waste Systems Inc. Class A | 313,406 | 1,874 |
| * | Ducommun Inc. | 114,062 | 1,850 |
| * | PAM Transportation Services Inc. | 65,605 | 1,810 |
| | Graham Corp. | 103,873 | 1,747 |
| * | CAI International Inc. | 171,579 | 1,730 |
| * | Xerium Technologies Inc. | 145,509 | 1,724 |
| * | Lawson Products Inc. | 72,005 | 1,681 |
| * | Hill International Inc. | 414,793 | 1,609 |
| * | TRC Cos. Inc. | 172,829 | 1,599 |
| | LB Foster Co. Class A | 115,923 | 1,584 |
| *,^ | Sunrun Inc. | 133,585 | 1,572 |
| | Hurco Cos. Inc. | 56,018 | 1,488 |
| * | Willis Lease Finance Corp. | 73,463 | 1,477 |
| * | Northwest Pipe Co. | 127,939 | 1,432 |
| * | Sparton Corp. | 71,490 | 1,429 |
| * | Orion Marine Group Inc. | 323,995 | 1,351 |
| | CDI Corp. | 188,692 | 1,276 |
| * | Layne Christensen Co. | 233,087 | 1,226 |
| * | Astronics Corp. Class B | 29,866 | 1,214 |
| * | Sterling Construction Co. Inc. | 199,647 | 1,214 |
| * | Heritage-Crystal Clean Inc. | 113,102 | 1,199 |
| * | Accuride Corp. | 713,040 | 1,184 |
| * | Ameresco Inc. Class A | 186,000 | 1,163 |
| | Houston Wire & Cable Co. | 219,495 | 1,159 |
| | Preformed Line Products Co. | 26,926 | 1,134 |
| *,^ | FuelCell Energy Inc. | 222,957 | 1,106 |
| *,^ | ExOne Co. | 107,542 | 1,080 |
| * | Energy Focus Inc. | 77,380 | 1,064 |
| | Dynamic Materials Corp. | 151,775 | 1,061 |
| * | LMI Aerospace Inc. | 104,877 | 1,056 |
| | Universal Truckload Services Inc. | 74,276 | 1,043 |
| | Supreme Industries Inc. Class A | 146,823 | 1,006 |
| | Omega Flex Inc. | 30,020 | 991 |
| * | CPI Aerostructures Inc. | 99,919 | 972 |
| * | Milacron Holdings Corp. | 73,595 | 921 |
| * | NV5 Global Inc. | 40,710 | 895 |
| | Twin Disc Inc. | 84,090 | 885 |
| * | Commercial Vehicle Group Inc. | 318,458 | 879 |
| * | Pendrell Corp. | 1,729,616 | 867 |
| * | Hudson Technologies Inc. | 282,320 | 838 |
| | Hardinge Inc. | 89,855 | 837 |
| *,^ | Enphase Energy Inc. | 237,714 | 834 |
| *,^ | Power Solutions International Inc. | 45,675 | 834 |
| *,^ | Manitex International Inc. | 125,030 | 744 |
| * | Ultralife Corp. | 108,465 | 701 |
| *,^ | American Superconductor Corp. | 108,378 | 690 |
| *,^ | Intersections Inc. | 230,073 | 660 |
| | Eastern Co. | 35,072 | 658 |
| * | Integrated Electrical Services Inc. | 59,262 | 656 |
| * | Rush Enterprises Inc. Class B | 29,320 | 642 |
| * | Cenveo Inc. | 732,095 | 638 |
| * | Virco Manufacturing Corp. | 190,592 | 635 |
| | Global Power Equipment Group Inc. | 181,065 | 630 |
| * | Energous Corp. | 79,539 | 629 |
| * | NL Industries Inc. | 204,512 | 622 |
| * | Radiant Logistics Inc. | 173,691 | 596 |
| * | Willdan Group Inc. | 68,153 | 571 |
| * | Performant Financial Corp. | 316,222 | 566 |
| * | Gencor Industries Inc. | 44,410 | 502 |
| * | Arotech Corp. | 235,645 | 481 |
| | LS Starrett Co. Class A | 49,344 | 480 |
| * | Astrotech Corp. | 304,120 | 465 |
39
| | | |
| Vanguard® Extended Market Index Fund | | |
| Schedule of Investments | | |
| December 31, 2015 | | |
| |
| | | | Market |
| | | | Value |
| | | Shares | ($000) |
| | Ecology and Environment Inc. | 45,469 | 465 |
| * | Active Power Inc. | 351,001 | 456 |
| * | Taylor Devices Inc. | 27,595 | 455 |
| *,^ | MagneGas Corp. | 282,760 | 455 |
| * | SIFCO Industries Inc. | 47,767 | 454 |
| | Providence and Worcester Railroad Co. | 31,838 | 441 |
| * | Hudson Global Inc. | 150,031 | 438 |
| * | API Technologies Corp. | 308,861 | 426 |
| * | HC2 Holdings Inc. | 79,942 | 423 |
| * | Volt Information Sciences Inc. | 50,418 | 410 |
| * | MFRI Inc. | 62,526 | 409 |
| * | Key Technology Inc. | 39,089 | 405 |
| * | Orion Energy Systems Inc. | 185,144 | 402 |
| *,^ | Revolution Lighting Technologies Inc. | 482,451 | 384 |
| * | Breeze-Eastern Corp. | 18,163 | 360 |
| * | Innovative Solutions & Support Inc. | 128,429 | 354 |
| * | Patriot Transportation Holding Inc. | 13,987 | 325 |
| * | Neff Corp. Class A | 41,658 | 319 |
| * | Rand Logistics Inc. | 195,018 | 312 |
| | RCM Technologies Inc. | 53,936 | 297 |
| * | Fuel Tech Inc. | 154,534 | 292 |
| * | Transcat Inc. | 26,809 | 266 |
| * | Broadwind Energy Inc. | 127,345 | 265 |
| * | SL Industries Inc. | 8,023 | 256 |
| * | BlueLinx Holdings Inc. | 481,942 | 255 |
| *,^ | Capstone Turbine Corp. | 179,790 | 252 |
| * | Alpha Pro Tech Ltd. | 137,409 | 240 |
| * | Jewett-Cameron Trading Co. Ltd. | 23,964 | 240 |
| *,^ | Odyssey Marine Exploration Inc. | 888,995 | 240 |
| * | Perma-Fix Environmental Services | 61,835 | 231 |
| *,^ | Lightbridge Corp. | 190,041 | 192 |
| * | Mastech Holdings Inc. | 25,867 | 189 |
| * | Versar Inc. | 52,841 | 163 |
| | Servotronics Inc. | 19,902 | 163 |
| * | Air T Inc. | 6,332 | 155 |
| * | Jason Industries Inc. | 39,669 | 150 |
| * | Swisher Hygiene Inc. | 148,880 | 143 |
| * | General Finance Corp. | 35,346 | 141 |
| * | Genco Shipping & Trading Ltd. | 93,506 | 139 |
| * | Goldfield Corp. | 77,900 | 121 |
| * | Marathon Patent Group Inc. | 72,034 | 115 |
| * | AMREP Corp. | 22,243 | 97 |
| *,^ | EnSync Inc. | 234,876 | 89 |
| * | DLH Holdings Corp. | 19,425 | 81 |
| * | American Electric Technologies Inc. | 38,260 | 80 |
| * | ARC Group Worldwide Inc. | 47,642 | 79 |
| * | Blue Bird Corp. | 7,454 | 76 |
| * | Ideal Power Inc. | 9,203 | 74 |
| * | Erickson Inc. | 27,688 | 57 |
| * | Blue Earth Inc. | 98,397 | 49 |
| *,^ | Real Goods Solar Inc. Class A | 68,071 | 43 |
| | General Employment Enterprises Inc. | 6,780 | 40 |
| * | Lime Energy Co. | 12,704 | 38 |
| * | LiqTech International Inc. | 32,928 | 33 |
| *,^ | Spherix Inc. | 223,653 | 33 |
| | Chicago Rivet & Machine Co. | 951 | 22 |
| | Art's-Way Manufacturing Co. Inc. | 5,943 | 18 |
| * | Industrial Services of America Inc. | 13,535 | 18 |
| * | Pyxis Tankers Inc. | 13,677 | 17 |
| * | Tel-Instrument Electronics Corp. | 3,304 | 16 |
| * | Ocean Power Technologies Inc. | 7,027 | 15 |
| | Espey Manufacturing & Electronics Corp. | 566 | 15 |
| * | Continental Materials Corp. | 900 | 13 |
| | EnviroStar Inc. | 2,900 | 12 |
40
| | | |
| Vanguard® Extended Market Index Fund | | |
| Schedule of Investments | | |
| December 31, 2015 | | |
| |
| | | | Market |
| | | | Value |
| | | Shares | ($000) |
| * | Cemtrex Inc. | 3,300 | 8 |
| | Compx International Inc. | 679 | 8 |
| | Acme United Corp. | 409 | 7 |
| * | Micronet Enertec Technologies Inc. | 3,100 | 7 |
| * | Digital Power Corp. | 11,401 | 6 |
| * | Quest Resource Holding Corp. | 7,825 | 5 |
| * | Aqua Metals Inc. | 711 | 4 |
| | WSI Industries Inc. | 805 | 4 |
| *,^ | Axion Power International Inc. | 3,500 | 3 |
| * | CTPartners Executive Search Inc. | 83,162 | — |
| | | | 5,496,286 |
| Information Technology (16.7%) | | |
| * | LinkedIn Corp. Class A | 1,203,420 | 270,866 |
| * | Twitter Inc. | 6,190,671 | 143,252 |
| * | ServiceNow Inc. | 1,556,291 | 134,713 |
| * | Palo Alto Networks Inc. | 758,208 | 133,551 |
| * | FleetCor Technologies Inc. | 802,314 | 114,675 |
| | Maxim Integrated Products Inc. | 2,954,372 | 112,266 |
| * | Workday Inc. Class A | 1,158,547 | 92,313 |
| | Global Payments Inc. | 1,341,229 | 86,523 |
| * | ANSYS Inc. | 934,463 | 86,438 |
| | CDK Global Inc. | 1,668,726 | 79,214 |
| * | Splunk Inc. | 1,343,634 | 79,019 |
| * | Gartner Inc. | 865,866 | 78,534 |
| * | Vantiv Inc. Class A | 1,628,147 | 77,207 |
| * | Synopsys Inc. | 1,624,357 | 74,087 |
| * | CoStar Group Inc. | 339,763 | 70,226 |
| | Broadridge Financial Solutions Inc. | 1,231,117 | 66,148 |
| | CDW Corp. | 1,554,947 | 65,370 |
| * | Cadence Design Systems Inc. | 3,085,639 | 64,212 |
| | Jack Henry & Associates Inc. | 814,019 | 63,542 |
| * | Tyler Technologies Inc. | 339,442 | 59,172 |
| | Avnet Inc. | 1,380,246 | 59,130 |
| * | Ultimate Software Group Inc. | 299,594 | 58,574 |
| | SS&C Technologies Holdings Inc. | 839,998 | 57,347 |
| * | Trimble Navigation Ltd. | 2,615,877 | 56,111 |
| * | Arrow Electronics Inc. | 972,375 | 52,683 |
| * | Tableau Software Inc. Class A | 548,931 | 51,720 |
| * | Nuance Communications Inc. | 2,598,597 | 51,686 |
| * | Keysight Technologies Inc. | 1,777,085 | 50,345 |
| * | Manhattan Associates Inc. | 760,479 | 50,321 |
| | Ingram Micro Inc. | 1,607,335 | 48,831 |
| | IAC/InterActiveCorp | 807,474 | 48,489 |
| | Sabre Corp. | 1,728,699 | 48,352 |
| * | Fortinet Inc. | 1,525,947 | 47,564 |
| | Computer Sciences Corp. | 1,422,518 | 46,488 |
| *,^ | VMware Inc. Class A | 808,140 | 45,716 |
| | Jabil Circuit Inc. | 1,948,854 | 45,389 |
| * | Guidewire Software Inc. | 747,113 | 44,946 |
| | Teradyne Inc. | 2,144,716 | 44,331 |
| | Marvell Technology Group Ltd. | 4,908,196 | 43,290 |
| * | ARRIS Group Inc. | 1,399,586 | 42,785 |
| * | ON Semiconductor Corp. | 4,288,017 | 42,023 |
| * | PTC Inc. | 1,196,897 | 41,449 |
| * | Genpact Ltd. | 1,619,823 | 40,463 |
| | Brocade Communications Systems Inc. | 4,330,141 | 39,751 |
| | j2 Global Inc. | 482,506 | 39,720 |
| * | Integrated Device Technology Inc. | 1,501,544 | 39,566 |
| | DST Systems Inc. | 338,326 | 38,589 |
| | MAXIMUS Inc. | 682,535 | 38,393 |
| * | SolarWinds Inc. | 650,169 | 38,295 |
| * | Cavium Inc. | 580,656 | 38,155 |
| | Solera Holdings Inc. | 695,620 | 38,141 |
| * | Euronet Worldwide Inc. | 523,499 | 37,917 |
41
| | | |
| Vanguard® Extended Market Index Fund | | |
| Schedule of Investments | | |
| December 31, 2015 | | |
| |
| | | | Market |
| | | | Value |
| | | Shares | ($000) |
| * | Zebra Technologies Corp. | 541,498 | 37,715 |
| | Atmel Corp. | 4,371,563 | 37,639 |
| | Leidos Holdings Inc. | 668,492 | 37,609 |
| | Booz Allen Hamilton Holding Corp. Class A | 1,191,214 | 36,749 |
| | Heartland Payment Systems Inc. | 385,288 | 36,533 |
| * | WEX Inc. | 403,070 | 35,631 |
| | FEI Co. | 433,734 | 34,608 |
| * | EPAM Systems Inc. | 437,783 | 34,418 |
| | Cypress Semiconductor Corp. | 3,480,805 | 34,147 |
| * | CommScope Holding Co. Inc. | 1,318,529 | 34,137 |
| * | IPG Photonics Corp. | 379,841 | 33,867 |
| * | VeriFone Systems Inc. | 1,198,992 | 33,596 |
| * | Aspen Technology Inc. | 882,722 | 33,332 |
| * | NetSuite Inc. | 390,268 | 33,024 |
| *,^ | NCR Corp. | 1,334,765 | 32,648 |
| * | Microsemi Corp. | 995,057 | 32,429 |
| | Blackbaud Inc. | 488,882 | 32,198 |
| * | NetScout Systems Inc. | 1,041,552 | 31,976 |
| * | CoreLogic Inc. | 922,195 | 31,226 |
| * | Take-Two Interactive Software Inc. | 894,029 | 31,148 |
| * | FireEye Inc. | 1,496,057 | 31,028 |
| | Fair Isaac Corp. | 328,337 | 30,923 |
| * | Qlik Technologies Inc. | 970,073 | 30,713 |
| | National Instruments Corp. | 1,070,242 | 30,705 |
| | Cognex Corp. | 900,613 | 30,414 |
| * | Rackspace Hosting Inc. | 1,195,963 | 30,282 |
| * | Synaptics Inc. | 376,814 | 30,273 |
| * | First Data Corp. Class A | 1,868,080 | 29,927 |
| * | Cree Inc. | 1,091,070 | 29,099 |
| *,^ | Arista Networks Inc. | 368,898 | 28,715 |
| * | ViaSat Inc. | 464,150 | 28,318 |
| * | Pandora Media Inc. | 2,100,225 | 28,164 |
| * | Proofpoint Inc. | 421,938 | 27,430 |
| * | Ciena Corp. | 1,307,515 | 27,052 |
| | SYNNEX Corp. | 298,615 | 26,854 |
| * | Infinera Corp. | 1,468,021 | 26,601 |
| * | ACI Worldwide Inc. | 1,241,100 | 26,560 |
| * | Verint Systems Inc. | 648,453 | 26,301 |
| | Littelfuse Inc. | 238,759 | 25,550 |
| | Convergys Corp. | 1,024,955 | 25,511 |
| *,^ | Zillow Group Inc. | 1,080,856 | 25,378 |
| * | Blackhawk Network Holdings Inc. | 569,161 | 25,163 |
| * | Fairchild Semiconductor International Inc. Class A | 1,173,056 | 24,294 |
| * | Tech Data Corp. | 365,198 | 24,242 |
| | Monolithic Power Systems Inc. | 379,909 | 24,204 |
| * | Universal Display Corp. | 441,663 | 24,044 |
| * | PMC-Sierra Inc. | 2,048,793 | 23,807 |
| * | CACI International Inc. Class A | 255,431 | 23,699 |
| * | Electronics For Imaging Inc. | 494,934 | 23,133 |
| * | Zynga Inc. Class A | 8,327,401 | 22,317 |
| | Belden Inc. | 440,801 | 21,017 |
| | Lexmark International Inc. Class A | 646,664 | 20,984 |
| | Diebold Inc. | 684,233 | 20,589 |
| * | Silicon Laboratories Inc. | 419,078 | 20,342 |
| | MKS Instruments Inc. | 564,865 | 20,335 |
| * | Entegris Inc. | 1,481,838 | 19,664 |
| | Science Applications International Corp. | 429,453 | 19,660 |
| *,^ | GrubHub Inc. | 811,937 | 19,649 |
| * | Cirrus Logic Inc. | 665,134 | 19,641 |
| | Mentor Graphics Corp. | 1,042,780 | 19,208 |
| *,^ | Advanced Micro Devices Inc. | 6,670,076 | 19,143 |
| * | WebMD Health Corp. | 389,367 | 18,806 |
| * | Demandware Inc. | 348,353 | 18,801 |
| * | Ellie Mae Inc. | 310,627 | 18,709 |
42
| | | |
| Vanguard® Extended Market Index Fund | | |
| Schedule of Investments | | |
| December 31, 2015 | | |
| |
| | | | Market |
| | | | Value |
| | | Shares | ($000) |
| | InterDigital Inc. | 380,999 | 18,684 |
| * | EchoStar Corp. Class A | 461,497 | 18,049 |
| * | Imperva Inc. | 281,033 | 17,792 |
| | Intersil Corp. Class A | 1,393,522 | 17,781 |
| * | Cornerstone OnDemand Inc. | 512,434 | 17,694 |
| * | CommVault Systems Inc. | 449,124 | 17,673 |
| * | Anixter International Inc. | 292,298 | 17,652 |
| * | Polycom Inc. | 1,391,648 | 17,521 |
| * | LogMeIn Inc. | 260,049 | 17,449 |
| * | Sanmina Corp. | 846,480 | 17,421 |
| * | MicroStrategy Inc. Class A | 96,924 | 17,378 |
| * | Stamps.com Inc. | 158,139 | 17,334 |
| | Vishay Intertechnology Inc. | 1,435,838 | 17,302 |
| * | Acxiom Corp. | 826,346 | 17,287 |
| | Dolby Laboratories Inc. Class A | 510,551 | 17,180 |
| *,^ | SunPower Corp. Class A | 569,854 | 17,101 |
| * | OSI Systems Inc. | 191,733 | 16,999 |
| *,^ | SunEdison Inc. | 3,298,035 | 16,787 |
| | Plantronics Inc. | 351,490 | 16,668 |
| * | Yelp Inc. Class A | 572,915 | 16,500 |
| * | Coherent Inc. | 252,150 | 16,417 |
| * | Finisar Corp. | 1,100,562 | 16,002 |
| * | Cardtronics Inc. | 474,097 | 15,953 |
| *,^ | Fitbit Inc. Class A | 529,797 | 15,677 |
| * | OmniVision Technologies Inc. | 537,341 | 15,594 |
| * | ExlService Holdings Inc. | 341,548 | 15,346 |
| * | Syntel Inc. | 337,533 | 15,273 |
| | Power Integrations Inc. | 311,126 | 15,130 |
| * | Viavi Solutions Inc. | 2,472,252 | 15,056 |
| * | Zendesk Inc. | 568,765 | 15,038 |
| * | Rovi Corp. | 899,772 | 14,990 |
| | Tessera Technologies Inc. | 498,618 | 14,964 |
| * | Itron Inc. | 407,251 | 14,734 |
| * | Synchronoss Technologies Inc. | 412,592 | 14,536 |
| * | Paycom Software Inc. | 379,882 | 14,295 |
| * | Rambus Inc. | 1,226,089 | 14,210 |
| * | NETGEAR Inc. | 338,788 | 14,199 |
| * | Cray Inc. | 432,867 | 14,047 |
| | Travelport Worldwide Ltd. | 1,082,345 | 13,962 |
| * | RingCentral Inc. Class A | 588,573 | 13,879 |
| * | comScore Inc. | 337,030 | 13,869 |
| *,^ | NeuStar Inc. Class A | 568,093 | 13,617 |
| * | Semtech Corp. | 702,715 | 13,295 |
| | NIC Inc. | 657,125 | 12,932 |
| | Methode Electronics Inc. | 405,323 | 12,901 |
| * | Progress Software Corp. | 534,850 | 12,836 |
| * | Sykes Enterprises Inc. | 412,511 | 12,697 |
| * | RealPage Inc. | 562,520 | 12,629 |
| | CSG Systems International Inc. | 347,969 | 12,520 |
| *,^ | Knowles Corp. | 933,457 | 12,443 |
| * | Plexus Corp. | 355,509 | 12,414 |
| * | SPS Commerce Inc. | 175,399 | 12,315 |
| *,^ | Zillow Group Inc. Class A | 464,541 | 12,097 |
| * | Advanced Energy Industries Inc. | 425,407 | 12,009 |
| * | Bottomline Technologies de Inc. | 401,295 | 11,930 |
| * | Virtusa Corp. | 286,106 | 11,828 |
| | EVERTEC Inc. | 696,235 | 11,655 |
| * | Envestnet Inc. | 387,675 | 11,572 |
| * | Cabot Microelectronics Corp. | 262,109 | 11,475 |
| * | QLogic Corp. | 921,700 | 11,245 |
| * | Benchmark Electronics Inc. | 533,926 | 11,036 |
| * | Callidus Software Inc. | 592,168 | 10,997 |
| * | Lumentum Holdings Inc. | 498,083 | 10,968 |
| * | Marketo Inc. | 381,315 | 10,948 |
43
| | | |
| Vanguard® Extended Market Index Fund | | |
| Schedule of Investments | | |
| December 31, 2015 | | |
| |
| | | | Market |
| | | | Value |
| | | Shares | ($000) |
| * | Web.com Group Inc. | 546,899 | 10,943 |
| * | BroadSoft Inc. | 307,263 | 10,865 |
| | Pegasystems Inc. | 389,154 | 10,702 |
| * | Infoblox Inc. | 564,202 | 10,376 |
| * | II-VI Inc. | 551,141 | 10,229 |
| * | Rogers Corp. | 197,778 | 10,199 |
| * | Insight Enterprises Inc. | 401,871 | 10,095 |
| *,^ | Gogo Inc. | 566,399 | 10,082 |
| | Monotype Imaging Holdings Inc. | 425,802 | 10,066 |
| | MTS Systems Corp. | 158,049 | 10,022 |
| * | Constant Contact Inc. | 341,022 | 9,971 |
| | ADTRAN Inc. | 575,873 | 9,917 |
| * | Inphi Corp. | 364,166 | 9,840 |
| * | Ruckus Wireless Inc. | 906,020 | 9,703 |
| *,^ | 3D Systems Corp. | 1,110,981 | 9,654 |
| * | ScanSource Inc. | 297,946 | 9,600 |
| | Badger Meter Inc. | 163,193 | 9,561 |
| * | Kulicke & Soffa Industries Inc. | 816,337 | 9,527 |
| * | Super Micro Computer Inc. | 379,426 | 9,300 |
| * | Diodes Inc. | 399,100 | 9,171 |
| | Ebix Inc. | 274,835 | 9,012 |
| *,^ | Ubiquiti Networks Inc. | 280,670 | 8,894 |
| * | TiVo Inc. | 1,027,668 | 8,869 |
| * | Veeco Instruments Inc. | 426,693 | 8,773 |
| * | Rofin-Sinar Technologies Inc. | 326,385 | 8,741 |
| * | Cvent Inc. | 246,565 | 8,608 |
| * | Photronics Inc. | 687,854 | 8,564 |
| * | Paylocity Holding Corp. | 210,602 | 8,540 |
| | ManTech International Corp. Class A | 281,268 | 8,506 |
| * | Bankrate Inc. | 634,173 | 8,434 |
| * | InvenSense Inc. | 814,227 | 8,330 |
| | Brooks Automation Inc. | 773,141 | 8,257 |
| | EarthLink Holdings Corp. | 1,102,373 | 8,191 |
| * | Lattice Semiconductor Corp. | 1,265,507 | 8,188 |
| * | M/A-COM Technology Solutions Holdings Inc. | 198,979 | 8,136 |
| * | Ixia | 627,664 | 7,802 |
| * | GoDaddy Inc. Class A | 240,172 | 7,700 |
| | CTS Corp. | 433,908 | 7,654 |
| * | Qualys Inc. | 231,067 | 7,646 |
| * | CalAmp Corp. | 377,859 | 7,531 |
| * | Gigamon Inc. | 278,168 | 7,391 |
| * | MaxLinear Inc. | 500,104 | 7,367 |
| * | Amkor Technology Inc. | 1,207,819 | 7,344 |
| * | Fabrinet | 304,425 | 7,251 |
| * | Newport Corp. | 448,391 | 7,116 |
| * | New Relic Inc. | 195,304 | 7,115 |
| | AVX Corp. | 577,709 | 7,013 |
| * | Monster Worldwide Inc. | 1,193,769 | 6,840 |
| *,^ | Endurance International Group Holdings Inc. | 621,408 | 6,792 |
| * | PROS Holdings Inc. | 282,733 | 6,514 |
| * | Mercury Systems Inc. | 354,026 | 6,500 |
| | TeleTech Holdings Inc. | 232,385 | 6,486 |
| * | CEVA Inc. | 276,340 | 6,455 |
| * | Xura Inc. | 261,194 | 6,420 |
| * | Q2 Holdings Inc. | 243,180 | 6,413 |
| * | Perficient Inc. | 372,480 | 6,377 |
| * | Ultratech Inc. | 321,345 | 6,369 |
| *,^ | Shutterstock Inc. | 194,172 | 6,280 |
| * | FormFactor Inc. | 650,726 | 5,857 |
| * | Unisys Corp. | 529,033 | 5,846 |
| * | ShoreTel Inc. | 653,574 | 5,784 |
| * | Interactive Intelligence Group Inc. | 180,242 | 5,663 |
| * | Rudolph Technologies Inc. | 396,868 | 5,643 |
| * | XO Group Inc. | 349,372 | 5,611 |
44
| | | |
| Vanguard® Extended Market Index Fund | | |
| Schedule of Investments | | |
| December 31, 2015 | | |
| |
| | | | Market |
| | | | Value |
| | | Shares | ($000) |
| | Epiq Systems Inc. | 425,067 | 5,556 |
| * | ePlus Inc. | 58,448 | 5,451 |
| * | Silver Spring Networks Inc. | 376,099 | 5,420 |
| * | Applied Micro Circuits Corp. | 848,303 | 5,404 |
| * | FARO Technologies Inc. | 182,930 | 5,400 |
| * | HubSpot Inc. | 95,890 | 5,400 |
| *,^ | TrueCar Inc. | 562,316 | 5,364 |
| * | DHI Group Inc. | 577,455 | 5,295 |
| * | RealD Inc. | 499,223 | 5,267 |
| *,^ | VASCO Data Security International Inc. | 313,025 | 5,237 |
| | Cass Information Systems Inc. | 100,083 | 5,150 |
| * | Black Knight Financial Services Inc. Class A | 153,448 | 5,073 |
| *,^ | Hortonworks Inc. | 226,986 | 4,971 |
| *,^ | Eastman Kodak Co. | 396,360 | 4,970 |
| * | Actua Corp. | 432,938 | 4,957 |
| * | DTS Inc. | 215,414 | 4,864 |
| * | Harmonic Inc. | 1,193,464 | 4,857 |
| | IXYS Corp. | 381,836 | 4,823 |
| *,^ | Nimble Storage Inc. | 523,707 | 4,818 |
| * | GTT Communications Inc. | 272,473 | 4,648 |
| * | Blucora Inc. | 471,710 | 4,623 |
| *,^ | Box Inc. | 330,423 | 4,613 |
| | Forrester Research Inc. | 160,484 | 4,571 |
| * | Angie's List Inc. | 473,591 | 4,428 |
| *,^ | Quotient Technology Inc. | 646,668 | 4,410 |
| * | Benefitfocus Inc. | 121,039 | 4,405 |
| | Comtech Telecommunications Corp. | 216,864 | 4,357 |
| * | RetailMeNot Inc. | 431,071 | 4,276 |
| * | Extreme Networks Inc. | 1,048,039 | 4,276 |
| | Hackett Group Inc. | 265,781 | 4,271 |
| * | Barracuda Networks Inc. | 227,493 | 4,250 |
| *,^ | Oclaro Inc. | 1,192,789 | 4,151 |
| * | Textura Corp. | 190,196 | 4,104 |
| * | TTM Technologies Inc. | 624,106 | 4,063 |
| * | Internap Corp. | 634,044 | 4,058 |
| * | Immersion Corp. | 345,613 | 4,030 |
| | Daktronics Inc. | 457,269 | 3,987 |
| * | LivePerson Inc. | 579,173 | 3,909 |
| * | Exar Corp. | 634,930 | 3,892 |
| * | Intralinks Holdings Inc. | 426,524 | 3,869 |
| * | SciQuest Inc. | 296,949 | 3,851 |
| | Park Electrochemical Corp. | 247,813 | 3,732 |
| * | Sonus Networks Inc. | 523,199 | 3,730 |
| * | Nanometrics Inc. | 245,713 | 3,720 |
| * | ChannelAdvisor Corp. | 268,282 | 3,716 |
| * | Xcerra Corp. | 575,204 | 3,480 |
| * | Calix Inc. | 438,265 | 3,449 |
| *,^ | Digimarc Corp. | 94,229 | 3,440 |
| | Cohu Inc. | 284,646 | 3,436 |
| * | GSI Group Inc. | 252,226 | 3,435 |
| * | TeleCommunication Systems Inc. Class A | 680,886 | 3,384 |
| * | Everi Holdings Inc. | 770,598 | 3,383 |
| * | Rubicon Project Inc. | 205,265 | 3,377 |
| * | ServiceSource International Inc. | 725,645 | 3,345 |
| * | SunEdison Semiconductor Ltd. | 415,805 | 3,260 |
| * | Tangoe Inc. | 388,086 | 3,256 |
| | PC Connection Inc. | 142,628 | 3,229 |
| * | Multi-Fineline Electronix Inc. | 155,169 | 3,209 |
| * | DSP Group Inc. | 339,764 | 3,207 |
| | Checkpoint Systems Inc. | 509,266 | 3,193 |
| * | Pure Storage Inc. Class A | 203,282 | 3,165 |
| * | Digi International Inc. | 276,836 | 3,150 |
| * | PDF Solutions Inc. | 281,404 | 3,050 |
| * | Zix Corp. | 595,269 | 3,024 |
45
| | | |
| Vanguard® Extended Market Index Fund | | |
| Schedule of Investments | | |
| December 31, 2015 | | |
| |
| | | | Market |
| | | | Value |
| | | Shares | ($000) |
| * | Lionbridge Technologies Inc. | 615,633 | 3,023 |
| * | Agilysys Inc. | 291,836 | 2,915 |
| * | Axcelis Technologies Inc. | 1,091,741 | 2,828 |
| * | Bazaarvoice Inc. | 643,239 | 2,817 |
| | NVE Corp. | 49,967 | 2,807 |
| * | Ciber Inc. | 785,472 | 2,757 |
| | American Software Inc. Class A | 269,838 | 2,747 |
| * | Glu Mobile Inc. | 1,121,637 | 2,726 |
| * | Autobytel Inc. | 117,254 | 2,645 |
| * | Seachange International Inc. | 392,052 | 2,642 |
| * | NeoPhotonics Corp. | 239,202 | 2,598 |
| * | Kimball Electronics Inc. | 233,082 | 2,562 |
| | Mesa Laboratories Inc. | 25,604 | 2,548 |
| * | Quantum Corp. | 2,734,944 | 2,543 |
| * | Mattson Technology Inc. | 683,709 | 2,413 |
| * | Sigma Designs Inc. | 378,936 | 2,395 |
| | Reis Inc. | 99,435 | 2,360 |
| * | Maxwell Technologies Inc. | 327,404 | 2,338 |
| * | Varonis Systems Inc. | 123,930 | 2,330 |
| * | Silicon Graphics International Corp. | 389,652 | 2,299 |
| * | PFSweb Inc. | 165,875 | 2,135 |
| * | Brightcove Inc. | 341,161 | 2,115 |
| *,^ | TubeMogul Inc. | 154,435 | 2,100 |
| * | Alliance Fiber Optic Products Inc. | 134,049 | 2,032 |
| * | United Online Inc. | 169,047 | 1,993 |
| * | Kopin Corp. | 729,380 | 1,984 |
| *,^ | SolarEdge Technologies Inc. | 70,286 | 1,980 |
| * | Applied Optoelectronics Inc. | 114,052 | 1,957 |
| * | MoneyGram International Inc. | 310,106 | 1,944 |
| | Electro Rent Corp. | 207,592 | 1,910 |
| * | Electro Scientific Industries Inc. | 367,905 | 1,909 |
| | Black Box Corp. | 199,839 | 1,904 |
| * | Jive Software Inc. | 465,698 | 1,900 |
| * | Carbonite Inc. | 191,833 | 1,880 |
| * | Telenav Inc. | 330,079 | 1,878 |
| * | Liquidity Services Inc. | 288,231 | 1,873 |
| * | QuinStreet Inc. | 431,218 | 1,850 |
| * | Napco Security Technologies Inc. | 308,069 | 1,818 |
| * | Five9 Inc. | 208,458 | 1,814 |
| | QAD Inc. Class A | 87,271 | 1,791 |
| * | EMCORE Corp. | 281,202 | 1,724 |
| * | Workiva Inc. | 96,069 | 1,688 |
| * | Model N Inc. | 148,132 | 1,653 |
| * | MeetMe Inc. | 456,008 | 1,633 |
| | ModusLink Global Solutions Inc. | 657,261 | 1,630 |
| * | Vishay Precision Group Inc. | 142,820 | 1,617 |
| * | Avid Technology Inc. | 219,682 | 1,601 |
| * | A10 Networks Inc. | 242,678 | 1,592 |
| * | Ultra Clean Holdings Inc. | 310,345 | 1,589 |
| * | Cascade Microtech Inc. | 96,333 | 1,565 |
| | Bel Fuse Inc. Class B | 90,071 | 1,557 |
| *,^ | Park City Group Inc. | 128,710 | 1,533 |
| * | PRGX Global Inc. | 410,515 | 1,527 |
| *,^ | Clearfield Inc. | 111,583 | 1,496 |
| * | Mitek Systems Inc. | 357,566 | 1,470 |
| * | Higher One Holdings Inc. | 440,823 | 1,428 |
| * | KVH Industries Inc. | 150,001 | 1,413 |
| | Marchex Inc. Class B | 362,372 | 1,410 |
| *,^ | MicroVision Inc. | 487,370 | 1,394 |
| * | Covisint Corp. | 552,843 | 1,382 |
| * | Datalink Corp. | 196,499 | 1,336 |
| * | Alarm.com Holdings Inc. | 79,433 | 1,325 |
| *,^ | VirnetX Holding Corp. | 513,009 | 1,318 |
| * | Rosetta Stone Inc. | 195,257 | 1,306 |
46
| | | |
| Vanguard® Extended Market Index Fund | | |
| Schedule of Investments | | |
| December 31, 2015 | | |
| |
| | | | Market |
| | | | Value |
| | | Shares | ($000) |
| * | Guidance Software Inc. | 215,014 | 1,294 |
| * | PCM Inc. | 130,304 | 1,294 |
| * | Unwired Planet Inc. | 1,487,256 | 1,283 |
| *,^ | Research Frontiers Inc. | 243,678 | 1,270 |
| *,^ | OPOWER Inc. | 120,038 | 1,268 |
| * | AXT Inc. | 508,712 | 1,262 |
| * | RealNetworks Inc. | 295,070 | 1,254 |
| * | Limelight Networks Inc. | 832,075 | 1,215 |
| * | TechTarget Inc. | 150,918 | 1,212 |
| * | Intevac Inc. | 256,661 | 1,209 |
| * | EnerNOC Inc. | 304,754 | 1,173 |
| * | Kemet Corp. | 494,776 | 1,173 |
| * | BSQUARE Corp. | 190,833 | 1,162 |
| * | Hutchinson Technology Inc. | 321,727 | 1,155 |
| * | Key Tronic Corp. | 151,757 | 1,153 |
| | TransAct Technologies Inc. | 131,907 | 1,132 |
| | MOCON Inc. | 76,909 | 1,118 |
| | Information Services Group Inc. | 307,124 | 1,112 |
| | TESSCO Technologies Inc. | 56,935 | 1,109 |
| | Computer Task Group Inc. | 167,218 | 1,107 |
| *,^ | Neonode Inc. | 396,626 | 1,003 |
| * | USA Technologies Inc. | 322,567 | 994 |
| * | Planet Payment Inc. | 321,876 | 982 |
| | Astro-Med Inc. | 66,474 | 961 |
| * | Amtech Systems Inc. | 151,920 | 951 |
| * | Mattersight Corp. | 144,870 | 950 |
| * | Frequency Electronics Inc. | 87,892 | 933 |
| *,^ | MINDBODY Inc. Class A | 61,581 | 932 |
| *,^ | Rapid7 Inc. | 61,516 | 931 |
| * | GigOptix Inc. | 305,293 | 928 |
| * | FalconStor Software Inc. | 492,052 | 925 |
| * | Rightside Group Ltd. | 109,244 | 907 |
| * | Support.com Inc. | 894,229 | 903 |
| * | Rocket Fuel Inc. | 258,454 | 902 |
| | NCI Inc. Class A | 65,702 | 897 |
| * | Radisys Corp. | 319,102 | 884 |
| * | Alpha & Omega Semiconductor Ltd. | 95,926 | 882 |
| *,^ | CUI Global Inc. | 122,766 | 864 |
| *,^ | Aerohive Networks Inc. | 165,632 | 846 |
| * | Everyday Health Inc. | 136,568 | 822 |
| * | iPass Inc. | 769,307 | 769 |
| * | Aware Inc. | 233,234 | 760 |
| * | Match Group Inc. | 55,606 | 753 |
| * | Travelzoo Inc. | 89,897 | 752 |
| | Communications Systems Inc. | 95,107 | 739 |
| * | PAR Technology Corp. | 109,671 | 738 |
| * | Demand Media Inc. | 133,787 | 736 |
| *,^ | Violin Memory Inc. | 793,485 | 714 |
| * | Numerex Corp. Class A | 110,962 | 712 |
| * | MobileIron Inc. | 195,038 | 704 |
| * | Control4 Corp. | 96,529 | 702 |
| * | LoJack Corp. | 126,117 | 701 |
| * | Innodata Inc. | 244,930 | 698 |
| | Evolving Systems Inc. | 126,133 | 694 |
| | PC-Tel Inc. | 150,656 | 685 |
| * | Inuvo Inc. | 252,010 | 680 |
| * | Aviat Networks Inc. | 880,145 | 676 |
| | Richardson Electronics Ltd. | 115,483 | 655 |
| * | Care.com Inc. | 90,617 | 649 |
| *,^ | CVD Equipment Corp. | 64,075 | 646 |
| * | Marin Software Inc. | 178,659 | 640 |
| * | ID Systems Inc. | 137,003 | 630 |
| *,^ | QuickLogic Corp. | 553,745 | 626 |
| * | eGain Corp. | 141,680 | 608 |
47
| | | |
| Vanguard® Extended Market Index Fund | | |
| Schedule of Investments | | |
| December 31, 2015 | | |
| |
| | | | Market |
| | | | Value |
| | | Shares | ($000) |
| * | Amber Road Inc. | 116,684 | 594 |
| * | LRAD Corp. | 298,088 | 593 |
| * | ANADIGICS Inc. | 928,647 | 592 |
| * | YuMe Inc. | 164,675 | 578 |
| * | Datawatch Corp. | 96,335 | 576 |
| * | Novatel Wireless Inc. | 339,201 | 566 |
| * | Spark Networks Inc. | 146,920 | 566 |
| * | CyberOptics Corp. | 71,696 | 548 |
| | ClearOne Inc. | 42,405 | 548 |
| *,^ | Digital Turbine Inc. | 411,410 | 547 |
| * | MoSys Inc. | 494,335 | 539 |
| * | Pixelworks Inc. | 223,206 | 531 |
| *,^ | WidePoint Corp. | 750,111 | 521 |
| * | Apigee Corp. | 64,585 | 519 |
| * | Perceptron Inc. | 65,363 | 509 |
| * | Westell Technologies Inc. Class A | 398,465 | 502 |
| * | NetSol Technologies Inc. | 63,619 | 494 |
| * | GSE Systems Inc. | 200,594 | 481 |
| * | Edgewater Technology Inc. | 58,364 | 467 |
| * | GSI Technology Inc. | 125,379 | 466 |
| * | Data I/O Corp. | 181,910 | 458 |
| *,^ | ClearSign Combustion Corp. | 91,731 | 445 |
| | CSP Inc. | 63,690 | 442 |
| * | Tremor Video Inc. | 207,051 | 427 |
| | GlobalSCAPE Inc. | 105,926 | 419 |
| * | Onvia Inc. | 108,561 | 404 |
| * | Wireless Telecom Group Inc. | 233,098 | 401 |
| *,^ | Applied DNA Sciences Inc. | 121,866 | 395 |
| * | Imation Corp. | 278,995 | 382 |
| * | Appfolio Inc. | 26,150 | 382 |
| | TheStreet Inc. | 248,073 | 372 |
| | Concurrent Computer Corp. | 68,099 | 337 |
| * | Netlist Inc. | 375,120 | 330 |
| | Optical Cable Corp. | 112,873 | 322 |
| * | Rubicon Technology Inc. | 263,073 | 300 |
| * | IEC Electronics Corp. | 91,854 | 299 |
| *,^ | Infosonics Corp. | 188,332 | 298 |
| * | Exa Corp. | 25,489 | 296 |
| * | Zhone Technologies Inc. | 277,022 | 277 |
| *,^ | Vringo Inc. | 105,864 | 261 |
| | QAD Inc. Class B | 14,091 | 260 |
| * | Intermolecular Inc. | 109,827 | 255 |
| * | LightPath Technologies Inc. Class A | 87,538 | 248 |
| * | CPI Card Group Inc. | 22,841 | 243 |
| * | Qumu Corp. | 87,661 | 238 |
| *,^ | ParkerVision Inc. | 1,017,419 | 237 |
| * | BroadVision Inc. | 37,841 | 227 |
| * | Solar3D Inc. | 54,108 | 200 |
| *,^ | Voltari Corp. | 38,729 | 194 |
| * | Identiv Inc. | 96,311 | 192 |
| *,^ | Crossroads Systems Inc. | 178,804 | 191 |
| *,^ | Digital Ally Inc. | 29,747 | 188 |
| *,^ | InterCloud Systems Inc. | 187,116 | 187 |
| * | Echelon Corp. | 32,507 | 183 |
| * | LGL Group Inc. | 48,029 | 178 |
| * | StarTek Inc. | 48,825 | 175 |
| *,^ | Live Ventures Inc. | 116,522 | 170 |
| * | Lantronix Inc. | 140,583 | 159 |
| * | Synacor Inc. | 90,342 | 158 |
| * | Sonic Foundry Inc. | 29,857 | 157 |
| * | Smith Micro Software Inc. | 206,890 | 151 |
| * | Xactly Corp. | 17,020 | 145 |
| * | Image Sensing Systems Inc. | 37,600 | 137 |
| * | RELM Wireless Corp. | 33,447 | 132 |
48
| | | |
| Vanguard® Extended Market Index Fund | | |
| Schedule of Investments | | |
| December 31, 2015 | | |
| |
| | | | Market |
| | | | Value |
| | | Shares | ($000) |
| * | Luna Innovations Inc. | 117,791 | 127 |
| * | TSR Inc. | 27,043 | 127 |
| * | Remark Media Inc. | 24,304 | 126 |
| * | eMagin Corp. | 89,691 | 125 |
| * | Asure Software Inc. | 27,280 | 123 |
| * | MaxPoint Interactive Inc. | 61,378 | 105 |
| * | Prism Technologies Group Inc. | 101,239 | 101 |
| *,^ | Resonant Inc. | 35,400 | 94 |
| | RF Industries Ltd. | 20,988 | 92 |
| * | MRV Communications Inc. | 7,445 | 91 |
| * | Iteris Inc. | 40,217 | 86 |
| | Bel Fuse Inc. Class A | 5,719 | 83 |
| * | Wave Systems Corp. Class A | 52,361 | 73 |
| *,^ | Determine Inc. | 26,243 | 68 |
| *,^ | Uni-Pixel Inc. | 121,373 | 63 |
| * | Majesco Entertainment Co. | 59,583 | 62 |
| * | Document Security Systems Inc. | 357,332 | 61 |
| | Wayside Technology Group Inc. | 3,272 | 60 |
| *,^ | Viggle Inc. | 162,598 | 59 |
| * | inTEST Corp. | 12,602 | 53 |
| *,^ | Net Element Inc. | 267,714 | 50 |
| * | Xplore Technologies Corp. | 8,900 | 46 |
| * | Square Inc. | 3,177 | 42 |
| * | Intellicheck Mobilisa Inc. | 35,937 | 40 |
| *,^ | 6D Global Technologies Inc. | 12,565 | 36 |
| * | Upland Software Inc. | 4,979 | 35 |
| * | Sevcon Inc. | 3,344 | 35 |
| * | Bridgeline Digital Inc. | 28,875 | 33 |
| * | Network-1 Technologies Inc. | 14,338 | 30 |
| * | Ascent Solar Technologies Inc. | 204,392 | 30 |
| * | Giga-tronics Inc. | 18,200 | 29 |
| * | Speed Commerce Inc. | 468,340 | 28 |
| * | RMG Networks Holding Corp. | 34,785 | 26 |
| * | Vicon Industries Inc. | 12,700 | 22 |
| *,^ | NXT-ID Inc. | 92,774 | 22 |
| * | Majesco | 3,574 | 21 |
| * | SigmaTron International Inc. | 2,686 | 20 |
| * | ADDvantage Technologies Group Inc. | 10,200 | 18 |
| * | Sysorex Global Holdings Corp. | 29,496 | 17 |
| * | Finjan Holdings Inc. | 12,195 | 14 |
| * | Superconductor Technologies Inc. | 49,119 | 10 |
| * | Dataram Corp. | 14,239 | 9 |
| * | Adesto Technologies Corp. | 1,200 | 9 |
| * | IntriCon Corp. | 1,104 | 8 |
| *,^ | xG Technology Inc. | 32,087 | 7 |
| * | Qualstar Corp. | 9,220 | 7 |
| * | Aehr Test Systems | 3,200 | 6 |
| * | Code Rebel Corp. | 1,700 | 5 |
| *,^ | WPCS International Inc. | 2,914 | 4 |
| * | Technical Communications Corp. | 958 | 3 |
| * | Cartesian Inc. | 1,281 | 3 |
| | Inventergy Global Inc. | 1,496 | 2 |
| * | LGL Group Inc. Warrants Exp. 06/08/2018 | 238,900 | 2 |
| * | Professional Diversity Network Inc. | 3,750 | 2 |
| * | ARI Network Services Inc. | 400 | 2 |
| * | SITO Mobile Ltd. | 800 | 2 |
| * | MAM Software Group Inc. | 200 | 1 |
| * | Glowpoint Inc. | 1,550 | 1 |
| * | SharpSpring Inc. | 100 | — |
| * | Qorvo Inc. | 2 | — |
| * | Blonder Tongue Laboratories Inc. | 180 | — |
| * | Interphase Corp. | 15,787 | — |
| | | | 7,132,195 |
49
| | |
| Vanguard® Extended Market Index Fund | | |
| Schedule of Investments | | |
| December 31, 2015 | | |
| |
| | | Market |
| | | Value |
| | Shares | ($000) |
| Materials (4.4%) | | |
| Celanese Corp. Class A | 1,524,722 | 102,660 |
| * WR Grace & Co. | 735,221 | 73,221 |
| * Crown Holdings Inc. | 1,444,004 | 73,211 |
| Ashland Inc. | 644,172 | 66,156 |
| Albemarle Corp. | 1,170,338 | 65,551 |
| Packaging Corp. of America | 1,007,007 | 63,492 |
| Valspar Corp. | 761,085 | 63,132 |
| RPM International Inc. | 1,384,357 | 60,995 |
| AptarGroup Inc. | 659,634 | 47,922 |
| * Berry Plastics Group Inc. | 1,246,453 | 45,097 |
| Steel Dynamics Inc. | 2,495,442 | 44,594 |
| Bemis Co. Inc. | 993,299 | 44,391 |
| Reliance Steel & Aluminum Co. | 753,436 | 43,631 |
| Graphic Packaging Holding Co. | 3,398,961 | 43,609 |
| Sonoco Products Co. | 1,048,626 | 42,857 |
| NewMarket Corp. | 105,041 | 39,992 |
| * Axalta Coating Systems Ltd. | 1,444,285 | 38,490 |
| Eagle Materials Inc. | 522,713 | 31,588 |
| Scotts Miracle-Gro Co. Class A | 475,244 | 30,658 |
| Sensient Technologies Corp. | 476,006 | 29,903 |
| Olin Corp. | 1,721,522 | 29,713 |
| PolyOne Corp. | 916,630 | 29,112 |
| * Louisiana-Pacific Corp. | 1,505,186 | 27,108 |
| Cabot Corp. | 656,130 | 26,823 |
| Compass Minerals International Inc. | 350,775 | 26,403 |
| Royal Gold Inc. | 689,947 | 25,162 |
| Huntsman Corp. | 2,144,599 | 24,384 |
| Domtar Corp. | 653,708 | 24,155 |
| Silgan Holdings Inc. | 421,545 | 22,645 |
| Westlake Chemical Corp. | 409,734 | 22,257 |
| * Platform Specialty Products Corp. | 1,585,844 | 20,346 |
| KapStone Paper and Packaging Corp. | 896,673 | 20,256 |
| Balchem Corp. | 331,017 | 20,126 |
| HB Fuller Co. | 533,697 | 19,464 |
| * Chemtura Corp. | 710,614 | 19,378 |
| Minerals Technologies Inc. | 367,359 | 16,847 |
| Commercial Metals Co. | 1,223,487 | 16,750 |
| Carpenter Technology Corp. | 517,181 | 15,655 |
| Kaiser Aluminum Corp. | 183,881 | 15,383 |
| Worthington Industries Inc. | 497,223 | 14,986 |
| Innospec Inc. | 257,143 | 13,965 |
| Schweitzer-Mauduit International Inc. | 323,399 | 13,580 |
| * Headwaters Inc. | 780,132 | 13,161 |
| Allegheny Technologies Inc. | 1,144,439 | 12,875 |
| ^ United States Steel Corp. | 1,518,928 | 12,121 |
| Axiall Corp. | 743,433 | 11,449 |
| Neenah Paper Inc. | 178,441 | 11,140 |
| Greif Inc. Class A | 357,116 | 11,003 |
| * Stillwater Mining Co. | 1,283,079 | 10,996 |
| Quaker Chemical Corp. | 141,456 | 10,929 |
| * Boise Cascade Co. | 417,867 | 10,668 |
| Chemours Co. | 1,920,947 | 10,296 |
| * Ferro Corp. | 923,388 | 10,268 |
| Calgon Carbon Corp. | 566,039 | 9,764 |
| Stepan Co. | 194,353 | 9,657 |
| A Schulman Inc. | 313,436 | 9,604 |
| * Summit Materials Inc. Class A | 473,719 | 9,493 |
| PH Glatfelter Co. | 472,478 | 8,713 |
| * Clearwater Paper Corp. | 185,712 | 8,455 |
| * Resolute Forest Products Inc. | 1,018,575 | 7,711 |
| Hecla Mining Co. | 3,992,651 | 7,546 |
| Deltic Timber Corp. | 124,915 | 7,354 |
| Materion Corp. | 252,976 | 7,083 |
50
| | | |
| Vanguard® Extended Market Index Fund | | |
| Schedule of Investments | | |
| December 31, 2015 | | |
| |
| | | | Market |
| | | | Value |
| | | Shares | ($000) |
| * | US Concrete Inc. | 126,941 | 6,685 |
| *,^ | Flotek Industries Inc. | 543,446 | 6,217 |
| | Wausau Paper Corp. | 597,878 | 6,116 |
| | Innophos Holdings Inc. | 208,903 | 6,054 |
| * | Kraton Performance Polymers Inc. | 355,182 | 5,900 |
| | Haynes International Inc. | 144,715 | 5,310 |
| | Myers Industries Inc. | 351,515 | 4,682 |
| | Rayonier Advanced Materials Inc. | 460,211 | 4,505 |
| *,^ | AK Steel Holding Corp. | 1,875,261 | 4,201 |
| * | Koppers Holdings Inc. | 229,873 | 4,195 |
| | Schnitzer Steel Industries Inc. | 285,733 | 4,106 |
| | Mercer International Inc. | 443,455 | 4,013 |
| | American Vanguard Corp. | 286,253 | 4,010 |
| | Tredegar Corp. | 283,169 | 3,857 |
| | Hawkins Inc. | 105,456 | 3,772 |
| * | Globe Specialty Metals Inc. | 348,953 | 3,751 |
| * | Coeur Mining Inc. | 1,406,982 | 3,489 |
| * | AEP Industries Inc. | 43,696 | 3,371 |
| | TimkenSteel Corp. | 398,761 | 3,342 |
| | FutureFuel Corp. | 243,637 | 3,289 |
| * | OMNOVA Solutions Inc. | 532,734 | 3,266 |
| *,^ | Trinseo SA | 112,664 | 3,177 |
| ^ | McEwen Mining Inc. | 2,976,613 | 3,155 |
| | Tronox Ltd. Class A | 656,392 | 2,566 |
| * | Senomyx Inc. | 667,854 | 2,518 |
| *,^ | Cliffs Natural Resources Inc. | 1,582,758 | 2,501 |
| | SunCoke Energy Inc. | 710,114 | 2,464 |
| * | Century Aluminum Co. | 545,640 | 2,412 |
| * | Intrepid Potash Inc. | 598,537 | 1,766 |
| | Chase Corp. | 41,838 | 1,704 |
| | Olympic Steel Inc. | 146,279 | 1,694 |
| * | LSB Industries Inc. | 222,236 | 1,611 |
| * | Real Industry Inc. | 195,890 | 1,573 |
| * | Trecora Resources | 122,199 | 1,514 |
| | Kronos Worldwide Inc. | 263,388 | 1,486 |
| | KMG Chemicals Inc. | 63,139 | 1,453 |
| * | Handy & Harman Ltd. | 67,552 | 1,385 |
| * | Codexis Inc. | 293,031 | 1,240 |
| *,^ | Horsehead Holding Corp. | 588,623 | 1,207 |
| | Ampco-Pittsburgh Corp. | 114,987 | 1,180 |
| | United States Lime & Minerals Inc. | 19,617 | 1,078 |
| * | Core Molding Technologies Inc. | 76,744 | 985 |
| | Rentech Inc. | 263,645 | 928 |
| | Gold Resource Corp. | 543,812 | 903 |
| * | AgroFresh Solutions Inc. | 109,488 | 693 |
| * | Universal Stainless & Alloy Products Inc. | 73,807 | 686 |
| | Synalloy Corp. | 83,094 | 572 |
| * | UFP Technologies Inc. | 23,121 | 551 |
| *,^ | BioAmber Inc. | 76,333 | 472 |
| *,^ | A. M. Castle & Co. | 184,779 | 294 |
| *,^ | Ryerson Holding Corp. | 61,511 | 287 |
| * | TOR Minerals International Inc. | 59,129 | 267 |
| * | Solitario Exploration & Royalty Corp. | 381,460 | 188 |
| * | General Moly Inc. | 828,766 | 166 |
| * | Comstock Mining Inc. | 375,990 | 150 |
| *,^ | Marrone Bio Innovations Inc. | 111,158 | 122 |
| * | Tecnoglass Inc. | 5,849 | 80 |
| * | Mines Management Inc. | 201,878 | 77 |
| * | Paramount Gold Nevada Corp. | 61,524 | 64 |
| * | US Antimony Corp. | 181,971 | 52 |
| *,^ | Golden Minerals Co. | 176,026 | 35 |
| * | Pershing Gold Corp. | 6,555 | 23 |
| * | Metabolix Inc. | 8,216 | 13 |
| * | Northern Technologies International Corp. | 700 | 10 |
51
| | | |
| Vanguard® Extended Market Index Fund | | |
| Schedule of Investments | | |
| December 31, 2015 | | |
| |
| | | | Market |
| | | | Value |
| | | Shares | ($000) |
| * | Timberline Resources Corp. | 30,567 | 5 |
| | Friedman Industries Inc. | 763 | 4 |
| | | | 1,865,376 |
| Other (0.0%)2 | | |
| * | Leap Wireless International Inc CVR | 524,960 | 1,323 |
| * | Adolor Corp. Rights Exp. 07/01/2019 | 596,841 | 310 |
| * | Camco Financial Corp. Warrants Exp. 11/06/2017 | 45,300 | 295 |
| * | Chelsea Therapeutics International Ltd. CVR Exp. 12/31/2016 | 912,063 | 100 |
| * | Cubist Pharmaceuticals, Inc. CVR | 178,549 | 23 |
| * | Ambit Biosciences Corp. CVR Rights | 22,388 | 14 |
| * | Dara Biosciences Inc CVR Exp. 12/31/2018 | 15,573 | 1 |
| * | Clinical Data Contingent Value Rights | 131,308 | — |
| * | Gerber Scientific Inc. CVR | 161,151 | — |
| * | Trubion Pharmaceuticals Inc. CVR | 49,686 | — |
| * | Hooper Holmes Inc. Rights Exp. 1/18/2016 | 472,677 | — |
| * | Magnum Hunter Resources Corp. Warrants Exp. 04/15/2016 | 143,287 | — |
| *,^ | Biosante Pharmaceutical Inc CVR | 44,795 | — |
| * | CIL&D LLC | 36,800 | — |
| * | American Medical Alert Corp. | 17,992 | — |
| | | | 2,066 |
| Telecommunication Services (1.1%) | | |
| * | SBA Communications Corp. Class A | 1,306,319 | 137,255 |
| * | T-Mobile US Inc. | 2,871,050 | 112,315 |
| *,^ | Sprint Corp. | 8,274,877 | 29,955 |
| | Telephone & Data Systems Inc. | 981,781 | 25,418 |
| | Cogent Communications Holdings Inc. | 433,077 | 15,023 |
| * | Zayo Group Holdings Inc. | 440,553 | 11,714 |
| * | Vonage Holdings Corp. | 1,926,767 | 11,060 |
| | Consolidated Communications Holdings Inc. | 517,649 | 10,845 |
| * | 8x8 Inc. | 934,919 | 10,705 |
| | Shenandoah Telecommunications Co. | 246,940 | 10,631 |
| | Atlantic Tele-Network Inc. | 119,019 | 9,311 |
| * | Cincinnati Bell Inc. | 2,366,307 | 8,519 |
| * | General Communication Inc. Class A | 400,609 | 7,924 |
| * | United States Cellular Corp. | 169,632 | 6,923 |
| | Inteliquent Inc. | 385,244 | 6,846 |
| ^ | Windstream Holdings Inc. | 1,060,572 | 6,830 |
| * | Iridium Communications Inc. | 806,593 | 6,783 |
| * | inContact Inc. | 640,214 | 6,108 |
| | Spok Holdings Inc. | 319,092 | 5,846 |
| * | FairPoint Communications Inc. | 293,928 | 4,723 |
| * | NII Holdings Inc. | 892,862 | 4,509 |
| *,^ | Globalstar Inc. | 2,806,973 | 4,042 |
| * | ORBCOMM Inc. | 550,771 | 3,988 |
| *,^ | pdvWireless Inc. | 101,832 | 2,800 |
| * | Lumos Networks Corp. | 227,395 | 2,547 |
| | IDT Corp. Class B | 210,623 | 2,456 |
| * | Boingo Wireless Inc. | 289,972 | 1,920 |
| *,^ | Straight Path Communications Inc. Class B | 99,420 | 1,704 |
| * | NTELOS Holdings Corp. | 185,016 | 1,691 |
| * | Hawaiian Telcom Holdco Inc. | 61,757 | 1,535 |
| * | Alaska Communications Systems Group Inc. | 618,981 | 1,083 |
| *,^ | Intelsat SA | 253,025 | 1,053 |
| *,^ | Towerstream Corp. | 588,198 | 223 |
| * | Elephant Talk Communications Corp. | 687,554 | 186 |
| * | Ooma Inc. | 10,240 | 65 |
| *,^ | One Horizon Group Inc. | 54,077 | 63 |
| * | Fusion Telecommunications International Inc. | 2,252 | 7 |
| | | | 474,606 |
| Utilities (3.5%) | | |
| | American Water Works Co. Inc. | 1,870,754 | 111,778 |
| | Alliant Energy Corp. | 1,178,853 | 73,619 |
| | Atmos Energy Corp. | 1,060,901 | 66,879 |
52
| | | |
| Vanguard® Extended Market Index Fund | | |
| Schedule of Investments | | |
| December 31, 2015 | | |
| |
| | | | Market |
| | | | Value |
| | | Shares | ($000) |
| | Westar Energy Inc. Class A | 1,478,302 | 62,695 |
| | ITC Holdings Corp. | 1,593,806 | 62,557 |
| | UGI Corp. | 1,776,352 | 59,970 |
| | Aqua America Inc. | 1,844,400 | 54,963 |
| | OGE Energy Corp. | 2,086,509 | 54,854 |
| * | Calpine Corp. | 3,403,816 | 49,253 |
| | Piedmont Natural Gas Co. Inc. | 826,854 | 47,147 |
| | Great Plains Energy Inc. | 1,610,982 | 43,996 |
| | National Fuel Gas Co. | 883,533 | 37,771 |
| | MDU Resources Group Inc. | 2,054,361 | 37,636 |
| | Vectren Corp. | 866,008 | 36,736 |
| | IDACORP Inc. | 525,710 | 35,748 |
| | Questar Corp. | 1,832,905 | 35,705 |
| | Portland General Electric Co. | 925,684 | 33,667 |
| | Cleco Corp. | 638,440 | 33,333 |
| | WGL Holdings Inc. | 524,143 | 33,016 |
| | Hawaiian Electric Industries Inc. | 1,132,206 | 32,777 |
| | New Jersey Resources Corp. | 915,632 | 30,179 |
| | ONE Gas Inc. | 555,257 | 27,857 |
| | Southwest Gas Corp. | 497,191 | 27,425 |
| | NorthWestern Corp. | 501,231 | 27,192 |
| | Laclede Group Inc. | 451,763 | 26,839 |
| | PNM Resources Inc. | 841,742 | 25,732 |
| | Black Hills Corp. | 530,721 | 24,641 |
| | ALLETE Inc. | 482,759 | 24,539 |
| | Avista Corp. | 650,817 | 23,019 |
| | MGE Energy Inc. | 379,233 | 17,596 |
| | South Jersey Industries Inc. | 731,927 | 17,215 |
| | American States Water Co. | 390,121 | 16,366 |
| | El Paso Electric Co. | 420,002 | 16,170 |
| * | Dynegy Inc. | 1,153,831 | 15,461 |
| | Northwest Natural Gas Co. | 290,875 | 14,721 |
| | Empire District Electric Co. | 475,893 | 13,358 |
| | Ormat Technologies Inc. | 363,648 | 13,262 |
| | Pattern Energy Group Inc. Class A | 601,001 | 12,567 |
| | California Water Service Group | 525,509 | 12,229 |
| | Otter Tail Corp. | 414,281 | 11,032 |
| | Chesapeake Utilities Corp. | 179,004 | 10,158 |
| | TerraForm Power Inc. Class A | 776,682 | 9,771 |
| | NRG Yield Inc. | 643,549 | 9,499 |
| | Unitil Corp. | 165,050 | 5,922 |
| | SJW Corp. | 188,599 | 5,592 |
| | Middlesex Water Co. | 194,231 | 5,155 |
| | NRG Yield Inc. Class A | 359,211 | 4,997 |
| * | Talen Energy Corp. | 786,936 | 4,903 |
| | Connecticut Water Service Inc. | 106,899 | 4,063 |
| | York Water Co. | 128,896 | 3,215 |
| | TerraForm Global Inc. Class A | 485,668 | 2,715 |
| | Artesian Resources Corp. Class A | 88,712 | 2,457 |
| * | Vivint Solar Inc. | 229,253 | 2,192 |
| | Genie Energy Ltd. Class B | 195,523 | 2,180 |
| | Delta Natural Gas Co. Inc. | 76,795 | 1,612 |
| *,^ | Cadiz Inc. | 164,253 | 864 |
| * | Pure Cycle Corp. | 176,746 | 848 |
| | Spark Energy Inc. Class A | 20,494 | 425 |
| * | US Geothermal Inc. | 644,066 | 403 |
| | Gas Natural Inc. | 45,594 | 340 |
| * | American DG Energy Inc. | 65,246 | 22 |
| |
| | | | 1,478,833 |
| Total Common Stocks (Cost $35,640,073) | | 42,555,323 |
53
| | | | | |
| Vanguard® Extended Market Index Fund | | | | |
| Schedule of Investments | | | | |
| December 31, 2015 | | | | |
| |
| | | | | | Market |
| | | | | | Value |
| | | Coupon | | Shares | ($000) |
| Temporary Cash Investments (2.5%)1 | | | | |
| Money Market Fund (2.5%) | | | | |
| 3,4 | Vanguard Market Liquidity Fund | 0.363% | | 1,041,896,037 | 1,041,896 |
| |
| |
| | | | | Face | |
| | | | | Amount | |
| | | | Maturity Date | ($000) | |
| U.S. Government and Agency Obligations (0.0%) | | | | |
| 5,6 | Federal Home Loan Bank Discount Notes | 0.609% | 6/17/16 | 2,000 | 1,995 |
| 6,7 | Freddie Mac Discount Notes | 0.220% | 3/30/16 | 5,000 | 4,996 |
| 6,7 | Freddie Mac Discount Notes | 0.220% | 4/15/16 | 5,000 | 4,994 |
| |
| | | | | | 11,985 |
| |
| Total Temporary Cash Investments (Cost $1,053,884) | | | | 1,053,881 |
| Total Investments (102.4%) (Cost $36,693,957) | | | | 43,609,204 |
| Other Assets and Liabilities—Net (-2.4%)4 | | | | (1,005,884) |
| Net Assets (100%) | | | | 42,603,320 |
* Non-income-producing security.
^ Includes partial security positions on loan to broker-dealers. The total value of securities on loan is $837,297,000.
1 The fund invests a portion of its cash reserves in equity markets through the use of index futures contracts. After giving effect to futures investments, the fund's effective common stock and temporary cash investment positions represent 100.1% and 2.3%, respectively, of net assets.
2 “Other” represents securities that are not classified by the fund’s benchmark index.
3 Affiliated money market fund available only to Vanguard funds and certain trusts and accounts managed by Vanguard. Rate shown is the 7-day yield.
4 Includes $897,282,000 of collateral received for securities on loan.
5 The issuer operates under a congressional charter; its securities are generally neither guaranteed by the U.S. Treasury nor backed by the full faith and credit of the U.S. government.
6 Securities with a value of $7,390,000 have been segregated as initial margin for open futures contracts.
7 The issuer was placed under federal conservatorship in September 2008; since that time, its daily operations have been managed by the Federal Housing Finance Agency and it receives capital from the U.S. Treasury, as needed to maintain a positive net worth, in exchange for senior preferred stock.
REIT—Real Estate Investment Trust.
54
This page intentionally left blank.
55
© 2016 The Vanguard Group, Inc. All rights reserved.
Vanguard Marketing Corporation, Distributor.
SNA980 022016
| | |
| Vanguard® Total Stock Market Index Fund | | |
| Schedule of Investments | | |
| December 31, 2015 | | |
| |
| | | Market |
| | | Value |
| | Shares | ($000) |
| |
| Common Stocks (99.4%)1 | | |
| Basic Materials (2.3%) | | |
| Dow Chemical Co. | 21,244,888 | 1,093,687 |
| EI du Pont de Nemours & Co. | 16,068,993 | 1,070,195 |
| LyondellBasell Industries NV Class A | 6,594,731 | 573,082 |
| Ecolab Inc. | 4,876,503 | 557,774 |
| Praxair Inc. | 5,260,231 | 538,648 |
| PPG Industries Inc. | 4,945,385 | 488,703 |
| Air Products & Chemicals Inc. | 3,557,694 | 462,892 |
| International Paper Co. | 7,607,539 | 286,804 |
| Alcoa Inc. | 24,016,095 | 237,039 |
| Nucor Corp. | 5,868,560 | 236,503 |
| Celanese Corp. Class A | 2,758,833 | 185,752 |
| International Flavors & Fragrances Inc. | 1,463,479 | 175,091 |
| Newmont Mining Corp. | 9,691,000 | 174,341 |
| Eastman Chemical Co. | 2,581,855 | 174,301 |
| CF Industries Holdings Inc. | 4,270,226 | 174,268 |
| Airgas Inc. | 1,189,293 | 164,503 |
| Mosaic Co. | 5,834,327 | 160,969 |
| Freeport-McMoRan Inc. | 21,194,290 | 143,485 |
| * WR Grace & Co. | 1,298,145 | 129,282 |
| Ashland Inc. | 1,222,040 | 125,504 |
| Albemarle Corp. | 2,050,215 | 114,833 |
| RPM International Inc. | 2,424,634 | 106,829 |
| Avery Dennison Corp. | 1,672,637 | 104,807 |
| FMC Corp. | 2,439,152 | 95,444 |
| Steel Dynamics Inc. | 4,198,505 | 75,027 |
| Reliance Steel & Aluminum Co. | 1,265,220 | 73,269 |
| NewMarket Corp. | 190,115 | 72,382 |
| * Axalta Coating Systems Ltd. | 2,603,057 | 69,371 |
| Sensient Technologies Corp. | 843,329 | 52,978 |
| Olin Corp. | 3,016,297 | 52,061 |
| PolyOne Corp. | 1,594,973 | 50,656 |
| Compass Minerals International Inc. | 616,963 | 46,439 |
| Royal Gold Inc. | 1,198,792 | 43,720 |
| Huntsman Corp. | 3,808,925 | 43,307 |
| Domtar Corp. | 1,135,328 | 41,950 |
| Cabot Corp. | 1,022,798 | 41,812 |
| Westlake Chemical Corp. | 711,836 | 38,667 |
| KapStone Paper and Packaging Corp. | 1,577,003 | 35,624 |
| Balchem Corp. | 566,582 | 34,448 |
| * Chemtura Corp. | 1,235,279 | 33,686 |
| ^ CONSOL Energy Inc. | 4,181,788 | 33,036 |
| HB Fuller Co. | 885,817 | 32,306 |
| Minerals Technologies Inc. | 633,080 | 29,033 |
| Commercial Metals Co. | 2,100,061 | 28,750 |
| * Platform Specialty Products Corp. | 2,162,310 | 27,742 |
| Carpenter Technology Corp. | 895,258 | 27,099 |
| * Cambrex Corp. | 574,942 | 27,074 |
| Kaiser Aluminum Corp. | 305,018 | 25,518 |
| Worthington Industries Inc. | 830,634 | 25,035 |
| Allegheny Technologies Inc. | 1,993,314 | 22,425 |
| Innospec Inc. | 411,426 | 22,345 |
| ^ United States Steel Corp. | 2,664,319 | 21,261 |
| Axiall Corp. | 1,279,737 | 19,708 |
| * Stillwater Mining Co. | 2,189,665 | 18,765 |
| Neenah Paper Inc. | 299,096 | 18,673 |
| ^ US Silica Holdings Inc. | 979,076 | 18,338 |
| Chemours Co. | 3,310,036 | 17,742 |
| Stepan Co. | 357,047 | 17,742 |
| Quaker Chemical Corp. | 227,172 | 17,551 |
| * Ferro Corp. | 1,551,380 | 17,251 |
| Calgon Carbon Corp. | 943,025 | 16,267 |
1
| | | |
| Vanguard® Total Stock Market Index Fund | | |
| Schedule of Investments | | |
| December 31, 2015 | | |
| |
| | | | Market |
| | | | Value |
| | | Shares | ($000) |
| | A Schulman Inc. | 492,103 | 15,078 |
| * | Clearwater Paper Corp. | 327,381 | 14,906 |
| | PH Glatfelter Co. | 785,707 | 14,488 |
| | Aceto Corp. | 504,105 | 13,601 |
| | Hecla Mining Co. | 6,858,625 | 12,963 |
| | Globe Specialty Metals Inc. | 1,201,691 | 12,918 |
| | Deltic Timber Corp. | 202,255 | 11,907 |
| * | CSW Industrials Inc. | 284,057 | 10,700 |
| * | Univar Inc. | 621,690 | 10,575 |
| | Innophos Holdings Inc. | 338,261 | 9,803 |
| * | Resolute Forest Products Inc. | 1,185,835 | 8,977 |
| * | Kraton Performance Polymers Inc. | 509,037 | 8,455 |
| | Haynes International Inc. | 221,753 | 8,136 |
| | Wausau Paper Corp. | 776,889 | 7,948 |
| | Rayonier Advanced Materials Inc. | 775,831 | 7,595 |
| *,^ | AK Steel Holding Corp. | 3,072,188 | 6,882 |
| | American Vanguard Corp. | 484,761 | 6,792 |
| * | Koppers Holdings Inc. | 345,861 | 6,312 |
| | Tredegar Corp. | 458,923 | 6,251 |
| * | Coeur Mining Inc. | 2,460,580 | 6,102 |
| | FutureFuel Corp. | 414,559 | 5,597 |
| | Hawkins Inc. | 153,812 | 5,502 |
| * | Veritiv Corp. | 146,119 | 5,292 |
| * | OMNOVA Solutions Inc. | 758,640 | 4,650 |
| | Tronox Ltd. Class A | 1,132,443 | 4,428 |
| | Chase Corp. | 100,230 | 4,082 |
| | SunCoke Energy Inc. | 1,152,206 | 3,998 |
| * | Century Aluminum Co. | 861,083 | 3,806 |
| *,^ | AgroFresh Solutions Inc. | 598,300 | 3,787 |
| * | Real Industry Inc. | 466,580 | 3,747 |
| *,^ | Cliffs Natural Resources Inc. | 2,357,380 | 3,725 |
| | KMG Chemicals Inc. | 151,079 | 3,478 |
| * | Intrepid Potash Inc. | 1,033,295 | 3,048 |
| *,^ | Senomyx Inc. | 780,100 | 2,941 |
| | Kronos Worldwide Inc. | 461,593 | 2,603 |
| *,^ | Peabody Energy Corp. | 336,547 | 2,585 |
| * | LSB Industries Inc. | 340,485 | 2,469 |
| * | Cloud Peak Energy Inc. | 1,104,456 | 2,297 |
| *,^ | Horsehead Holding Corp. | 1,064,636 | 2,183 |
| | Olympic Steel Inc. | 171,066 | 1,981 |
| *,^ | Westmoreland Coal Co. | 335,642 | 1,974 |
| | Ampco-Pittsburgh Corp. | 179,902 | 1,846 |
| *,^ | Uranium Energy Corp. | 1,716,068 | 1,819 |
| | Rentech Inc. | 506,989 | 1,785 |
| * | Codexis Inc. | 415,606 | 1,758 |
| | Gold Resource Corp. | 839,595 | 1,394 |
| * | Fairmount Santrol Holdings Inc. | 586,854 | 1,379 |
| | Synalloy Corp. | 168,394 | 1,159 |
| *,^ | Ur-Energy Inc. | 1,772,000 | 1,152 |
| * | Universal Stainless & Alloy Products Inc. | 113,899 | 1,058 |
| | Hallador Energy Co. | 206,031 | 939 |
| * | Northern Technologies International Corp. | 62,556 | 868 |
| * | Ryerson Holding Corp. | 128,702 | 601 |
| | Friedman Industries Inc. | 86,825 | 479 |
| | United-Guardian Inc. | 22,924 | 439 |
| * | Comstock Mining Inc. | 1,090,693 | 436 |
| ^ | Arch Coal Inc. | 379,939 | 375 |
| *,^ | Marrone Bio Innovations Inc. | 288,282 | 317 |
| | Empire Resources Inc. | 78,065 | 290 |
| * | Dynasil Corp. of America | 158,073 | 283 |
| * | NL Industries Inc. | 92,843 | 282 |
| * | Solitario Exploration & Royalty Corp. | 537,224 | 265 |
| *,^ | Uranium Resources Inc. | 509,666 | 265 |
| * | General Moly Inc. | 1,063,551 | 213 |
2
| | | |
| Vanguard® Total Stock Market Index Fund | | |
| Schedule of Investments | | |
| December 31, 2015 | | |
| |
| | | | Market |
| | | | Value |
| | | Shares | ($000) |
| *,^ | Metabolix Inc. | 93,474 | 144 |
| *,^ | Golden Minerals Co. | 688,429 | 138 |
| *,^ | Uni-Pixel Inc. | 197,660 | 103 |
| * | Pershing Gold Corp. | 28,854 | 101 |
| * | Ikonics Corp. | 6,410 | 72 |
| * | Centrus Energy Corp. Class A | 33,592 | 44 |
| * | Paramount Gold Nevada Corp. | 26,153 | 27 |
| * | TOR Minerals International Inc. | 2,580 | 12 |
| * | Finjan Holdings Inc. | 6,800 | 8 |
| | | | 9,158,407 |
| Consumer Goods (10.2%) | | |
| | Procter & Gamble Co. | 49,897,085 | 3,962,328 |
| | Coca-Cola Co. | 71,806,305 | 3,084,799 |
| | PepsiCo Inc. | 26,732,123 | 2,671,074 |
| | Philip Morris International Inc. | 28,417,610 | 2,498,192 |
| | Altria Group Inc. | 35,954,691 | 2,092,923 |
| | NIKE Inc. Class B | 24,746,368 | 1,546,648 |
| | Mondelez International Inc. Class A | 27,712,845 | 1,242,644 |
| | Colgate-Palmolive Co. | 16,462,788 | 1,096,751 |
| | Ford Motor Co. | 71,467,623 | 1,006,979 |
| | General Motors Co. | 25,682,193 | 873,451 |
| | Kimberly-Clark Corp. | 6,645,576 | 845,982 |
| | Kraft Heinz Co. | 11,123,611 | 809,354 |
| | Monsanto Co. | 8,071,363 | 795,191 |
| | Reynolds American Inc. | 15,704,149 | 724,746 |
| | General Mills Inc. | 10,958,032 | 631,840 |
| | Johnson Controls Inc. | 11,889,966 | 469,535 |
| | Delphi Automotive plc | 5,144,804 | 441,064 |
| *,^ | Tesla Motors Inc. | 1,800,517 | 432,142 |
| | Constellation Brands Inc. Class A | 3,007,306 | 428,361 |
| * | Monster Beverage Corp. | 2,806,400 | 418,041 |
| | Archer-Daniels-Midland Co. | 10,955,349 | 401,842 |
| | VF Corp. | 6,248,523 | 388,971 |
| * | Electronic Arts Inc. | 5,409,251 | 371,724 |
| | Activision Blizzard Inc. | 9,373,775 | 362,859 |
| | Estee Lauder Cos. Inc. Class A | 4,085,375 | 359,758 |
| | ConAgra Foods Inc. | 7,920,205 | 333,916 |
| | Kellogg Co. | 4,528,893 | 327,303 |
| | Dr Pepper Snapple Group Inc. | 3,441,528 | 320,750 |
| | Clorox Co. | 2,358,820 | 299,169 |
| | Stanley Black & Decker Inc. | 2,774,816 | 296,156 |
| | Tyson Foods Inc. Class A | 5,435,322 | 289,866 |
| | Mead Johnson Nutrition Co. | 3,632,818 | 286,811 |
| | JM Smucker Co. | 2,189,300 | 270,028 |
| * | Under Armour Inc. Class A | 3,299,890 | 266,004 |
| | Molson Coors Brewing Co. Class B | 2,684,731 | 252,150 |
| | Hershey Co. | 2,575,588 | 229,923 |
| | Genuine Parts Co. | 2,630,170 | 225,905 |
| * | Jarden Corp. | 3,835,257 | 219,070 |
| * | Mohawk Industries Inc. | 1,151,349 | 218,054 |
| | Newell Rubbermaid Inc. | 4,899,356 | 215,964 |
| | Whirlpool Corp. | 1,441,251 | 211,677 |
| | Hanesbrands Inc. | 7,177,481 | 211,233 |
| | DR Horton Inc. | 6,418,579 | 205,587 |
| | Church & Dwight Co. Inc. | 2,387,876 | 202,683 |
| | Hormel Foods Corp. | 2,412,244 | 190,760 |
| | Brown-Forman Corp. Class B | 1,888,287 | 187,469 |
| | Keurig Green Mountain Inc. | 2,047,183 | 184,206 |
| | Coca-Cola Enterprises Inc. | 3,728,793 | 183,606 |
| | Snap-on Inc. | 1,058,390 | 181,440 |
| | Campbell Soup Co. | 3,391,016 | 178,198 |
| | Bunge Ltd. | 2,605,566 | 177,908 |
| | BorgWarner Inc. | 4,099,441 | 177,219 |
| | McCormick & Co. Inc. | 2,009,171 | 171,905 |
3
| | | |
| Vanguard® Total Stock Market Index Fund | | |
| Schedule of Investments | | |
| December 31, 2015 | | |
| |
| | | | Market |
| | | | Value |
| | | Shares | ($000) |
| | Lear Corp. | 1,386,460 | 170,299 |
| | Mattel Inc. | 6,217,702 | 168,935 |
| | Coach Inc. | 5,075,871 | 166,133 |
| | Goodyear Tire & Rubber Co. | 4,923,279 | 160,844 |
| | Harley-Davidson Inc. | 3,521,631 | 159,847 |
| | Lennar Corp. Class A | 3,173,754 | 155,228 |
| * | LKQ Corp. | 5,021,104 | 148,775 |
| | Hasbro Inc. | 2,059,669 | 138,739 |
| * | Michael Kors Holdings Ltd. | 3,211,315 | 128,645 |
| * | WhiteWave Foods Co. Class A | 3,222,132 | 125,373 |
| | Ingredion Inc. | 1,302,219 | 124,805 |
| | Harman International Industries Inc. | 1,306,055 | 123,043 |
| | Ralph Lauren Corp. Class A | 1,079,862 | 120,383 |
| * | Middleby Corp. | 1,047,909 | 113,038 |
| * | NVR Inc. | 67,744 | 111,303 |
| | PVH Corp. | 1,510,933 | 111,280 |
| | PulteGroup Inc. | 5,740,038 | 102,287 |
| | Leucadia National Corp. | 5,875,189 | 102,170 |
| * | WABCO Holdings Inc. | 996,139 | 101,865 |
| | Leggett & Platt Inc. | 2,365,249 | 99,388 |
| | Polaris Industries Inc. | 1,145,852 | 98,486 |
| * | Toll Brothers Inc. | 2,894,745 | 96,395 |
| *,^ | lululemon athletica Inc. | 1,793,627 | 94,112 |
| | Pinnacle Foods Inc. | 2,111,752 | 89,665 |
| * | Edgewell Personal Care Co. | 1,126,414 | 88,277 |
| * | Visteon Corp. | 743,256 | 85,103 |
| | Gentex Corp. | 5,278,677 | 84,512 |
| | Brunswick Corp. | 1,667,396 | 84,220 |
| * | Tempur Sealy International Inc. | 1,138,263 | 80,202 |
| | Carter's Inc. | 893,922 | 79,586 |
| * | Hain Celestial Group Inc. | 1,873,422 | 75,668 |
| * | Skechers U.S.A. Inc. Class A | 2,377,203 | 71,815 |
| | Flowers Foods Inc. | 3,287,021 | 70,638 |
| * | Post Holdings Inc. | 1,133,407 | 69,931 |
| *,^ | Herbalife Ltd. | 1,182,085 | 63,383 |
| | Pool Corp. | 734,587 | 59,340 |
| * | TreeHouse Foods Inc. | 742,828 | 58,282 |
| | CalAtlantic Group Inc. | 1,435,613 | 54,438 |
| | Scotts Miracle-Gro Co. Class A | 837,003 | 53,995 |
| * | Vista Outdoor Inc. | 1,146,659 | 51,038 |
| * | Take-Two Interactive Software Inc. | 1,453,057 | 50,624 |
| * | Helen of Troy Ltd. | 514,520 | 48,494 |
| | Thor Industries Inc. | 859,578 | 48,265 |
| * | Tenneco Inc. | 1,039,878 | 47,741 |
| | Spectrum Brands Holdings Inc. | 429,859 | 43,760 |
| | Tupperware Brands Corp. | 783,305 | 43,591 |
| * | Kate Spade & Co. | 2,334,856 | 41,490 |
| | Snyder's-Lance Inc. | 1,196,019 | 41,023 |
| | Dana Holding Corp. | 2,940,188 | 40,575 |
| | Lancaster Colony Corp. | 350,646 | 40,486 |
| | Cooper Tire & Rubber Co. | 1,040,367 | 39,378 |
| | Vector Group Ltd. | 1,650,625 | 38,938 |
| | Energizer Holdings Inc. | 1,128,100 | 38,423 |
| ^ | Nu Skin Enterprises Inc. Class A | 1,001,424 | 37,944 |
| | B&G Foods Inc. | 1,044,654 | 36,584 |
| * | Zynga Inc. Class A | 13,520,122 | 36,234 |
| * | Boston Beer Co. Inc. Class A | 167,208 | 33,761 |
| * | TRI Pointe Group Inc. | 2,617,214 | 33,160 |
| * | G-III Apparel Group Ltd. | 745,677 | 33,004 |
| | Avon Products Inc. | 7,975,667 | 32,301 |
| *,^ | Fitbit Inc. Class A | 1,080,525 | 31,973 |
| | J&J Snack Foods Corp. | 272,916 | 31,841 |
| * | Darling Ingredients Inc. | 2,971,041 | 31,255 |
| * | Gentherm Inc. | 652,626 | 30,934 |
4
| | | |
| Vanguard® Total Stock Market Index Fund | | |
| Schedule of Investments | | |
| December 31, 2015 | | |
| |
| | | | Market |
| | | | Value |
| | | Shares | ($000) |
| | Herman Miller Inc. | 1,076,322 | 30,890 |
| * | Steven Madden Ltd. | 1,020,655 | 30,844 |
| | Wolverine World Wide Inc. | 1,770,692 | 29,588 |
| | HNI Corp. | 805,937 | 29,062 |
| | Dean Foods Co. | 1,684,689 | 28,892 |
| *,^ | GoPro Inc. Class A | 1,520,089 | 27,377 |
| *,^ | Fossil Group Inc. | 744,182 | 27,207 |
| * | Deckers Outdoor Corp. | 575,754 | 27,176 |
| * | Dorman Products Inc. | 572,247 | 27,165 |
| | Sanderson Farms Inc. | 341,522 | 26,475 |
| ^ | Pilgrim's Pride Corp. | 1,169,464 | 25,833 |
| | Coty Inc. Class A | 997,909 | 25,576 |
| | Columbia Sportswear Co. | 516,818 | 25,200 |
| | Drew Industries Inc. | 412,790 | 25,135 |
| | Fresh Del Monte Produce Inc. | 637,764 | 24,796 |
| * | American Axle & Manufacturing Holdings Inc. | 1,298,670 | 24,597 |
| | WD-40 Co. | 248,130 | 24,478 |
| * | Meritage Homes Corp. | 718,810 | 24,432 |
| ^ | Cal-Maine Foods Inc. | 515,644 | 23,895 |
| | Schweitzer-Mauduit International Inc. | 547,797 | 23,002 |
| | La-Z-Boy Inc. | 913,849 | 22,316 |
| | Steelcase Inc. Class A | 1,449,511 | 21,598 |
| | Universal Corp. | 383,170 | 21,488 |
| *,^ | Wayfair Inc. | 449,123 | 21,387 |
| | Interface Inc. Class A | 1,116,972 | 21,379 |
| * | Cooper-Standard Holding Inc. | 264,830 | 20,548 |
| | KB Home | 1,629,309 | 20,089 |
| * | Select Comfort Corp. | 919,820 | 19,693 |
| * | Diamond Foods Inc. | 483,710 | 18,647 |
| * | iRobot Corp. | 491,183 | 17,388 |
| | MDC Holdings Inc. | 676,440 | 17,270 |
| * | Tumi Holdings Inc. | 1,028,668 | 17,107 |
| | Oxford Industries Inc. | 264,999 | 16,912 |
| | Knoll Inc. | 830,746 | 15,618 |
| | Callaway Golf Co. | 1,638,702 | 15,437 |
| | Andersons Inc. | 483,029 | 15,278 |
| * | TiVo Inc. | 1,756,844 | 15,162 |
| | Coca-Cola Bottling Co. Consolidated | 82,736 | 15,100 |
| * | Seaboard Corp. | 5,158 | 14,931 |
| * | ACCO Brands Corp. | 1,980,908 | 14,124 |
| | Calavo Growers Inc. | 284,544 | 13,943 |
| * | Crocs Inc. | 1,332,238 | 13,642 |
| * | Universal Electronics Inc. | 265,058 | 13,611 |
| *,^ | Blue Buffalo Pet Products Inc. | 717,174 | 13,418 |
| * | USANA Health Sciences Inc. | 104,879 | 13,398 |
| | Standard Motor Products Inc. | 348,854 | 13,274 |
| * | Cavco Industries Inc. | 157,454 | 13,117 |
| | Ethan Allen Interiors Inc. | 466,555 | 12,980 |
| | Briggs & Stratton Corp. | 747,396 | 12,930 |
| * | Boulder Brands Inc. | 1,051,290 | 11,543 |
| ^ | Tootsie Roll Industries Inc. | 362,276 | 11,444 |
| | Nutrisystem Inc. | 516,721 | 11,182 |
| * | Motorcar Parts of America Inc. | 327,259 | 11,065 |
| | Lennar Corp. Class B | 270,198 | 10,857 |
| | Tower International Inc. | 351,438 | 10,041 |
| * | WCI Communities Inc. | 424,199 | 9,451 |
| | Winnebago Industries Inc. | 474,301 | 9,439 |
| * | Taylor Morrison Home Corp. Class A | 586,912 | 9,391 |
| * | National Beverage Corp. | 205,420 | 9,334 |
| * | M/I Homes Inc. | 417,578 | 9,153 |
| | Phibro Animal Health Corp. Class A | 303,349 | 9,140 |
| * | Nautilus Inc. | 533,621 | 8,922 |
| * | RealD Inc. | 822,627 | 8,679 |
| * | Blount International Inc. | 865,771 | 8,493 |
5
| | | |
| Vanguard® Total Stock Market Index Fund | | |
| Schedule of Investments | | |
| December 31, 2015 | | |
| |
| | | | Market |
| | | | Value |
| | | Shares | ($000) |
| * | Omega Protein Corp. | 368,871 | 8,189 |
| * | Beazer Homes USA Inc. | 712,102 | 8,182 |
| | John B Sanfilippo & Son Inc. | 150,542 | 8,134 |
| | Movado Group Inc. | 310,748 | 7,989 |
| | Libbey Inc. | 369,370 | 7,875 |
| | National Presto Industries Inc. | 94,028 | 7,791 |
| * | Unifi Inc. | 276,404 | 7,781 |
| * | Modine Manufacturing Co. | 854,773 | 7,736 |
| | Superior Industries International Inc. | 419,432 | 7,726 |
| | Inter Parfums Inc. | 316,690 | 7,544 |
| * | DTS Inc. | 327,606 | 7,397 |
| *,^ | LGI Homes Inc. | 290,354 | 7,064 |
| * | William Lyon Homes Class A | 407,454 | 6,723 |
| * | Stoneridge Inc. | 440,144 | 6,514 |
| | Orchids Paper Products Co. | 206,129 | 6,373 |
| * | Central Garden & Pet Co. Class A | 450,283 | 6,124 |
| * | Revlon Inc. Class A | 217,362 | 6,051 |
| | Medifast Inc. | 197,637 | 6,004 |
| * | Fox Factory Holding Corp. | 343,326 | 5,675 |
| * | Century Communities Inc. | 319,982 | 5,667 |
| * | Vera Bradley Inc. | 357,670 | 5,637 |
| *,^ | Iconix Brand Group Inc. | 819,840 | 5,599 |
| * | ZAGG Inc. | 509,700 | 5,576 |
| *,^ | Eastman Kodak Co. | 441,782 | 5,540 |
| *,^ | Sequential Brands Group Inc. | 671,449 | 5,311 |
| | Flexsteel Industries Inc. | 115,074 | 5,084 |
| * | Malibu Boats Inc. Class A | 309,834 | 5,072 |
| | Kimball International Inc. Class B | 499,744 | 4,882 |
| | Bassett Furniture Industries Inc. | 189,727 | 4,758 |
| | MGP Ingredients Inc. | 183,270 | 4,756 |
| | Hooker Furniture Corp. | 185,294 | 4,677 |
| * | Glu Mobile Inc. | 1,880,352 | 4,569 |
| * | Primo Water Corp. | 565,387 | 4,523 |
| * | Central Garden & Pet Co. | 333,932 | 4,515 |
| | Culp Inc. | 168,561 | 4,293 |
| *,^ | Elizabeth Arden Inc. | 430,117 | 4,258 |
| | Metaldyne Performance Group Inc. | 224,564 | 4,118 |
| * | Federal-Mogul Holdings Corp. | 596,048 | 4,083 |
| *,^ | Jamba Inc. | 293,398 | 3,958 |
| * | Nutraceutical International Corp. | 151,045 | 3,900 |
| *,^ | Hovnanian Enterprises Inc. Class A | 2,124,056 | 3,845 |
| * | Perry Ellis International Inc. | 208,575 | 3,842 |
| | Arctic Cat Inc. | 225,505 | 3,694 |
| * | Lipocine Inc. | 275,528 | 3,563 |
| | Oil-Dri Corp. of America | 95,357 | 3,512 |
| | Strattec Security Corp. | 60,661 | 3,427 |
| *,^ | Amplify Snack Brands Inc. | 282,781 | 3,258 |
| *,^ | JAKKS Pacific Inc. | 401,411 | 3,195 |
| | Titan International Inc. | 795,454 | 3,134 |
| *,^ | Freshpet Inc. | 365,703 | 3,105 |
| * | Farmer Brothers Co. | 94,199 | 3,040 |
| | Superior Uniform Group Inc. | 178,068 | 3,024 |
| | Weyco Group Inc. | 112,378 | 3,007 |
| * | Seneca Foods Corp. Class A | 99,386 | 2,880 |
| * | New Home Co. Inc. | 219,031 | 2,839 |
| * | Cherokee Inc. | 159,726 | 2,755 |
| | A-Mark Precious Metals Inc. | 141,896 | 2,724 |
| ^ | Limoneira Co. | 179,488 | 2,682 |
| * | Inventure Foods Inc. | 340,141 | 2,415 |
| * | Lifevantage Corp. | 245,200 | 2,334 |
| * | Craft Brew Alliance Inc. | 269,268 | 2,254 |
| *,^ | Vuzix Corp. | 279,152 | 2,119 |
| * | Black Diamond Inc. | 465,414 | 2,057 |
| * | Castle Brands Inc. | 1,613,664 | 1,985 |
6
| | | |
| Vanguard® Total Stock Market Index Fund | | |
| Schedule of Investments | | |
| December 31, 2015 | | |
| |
| | | | Market |
| | | | Value |
| | | Shares | ($000) |
| | Lifetime Brands Inc. | 148,347 | 1,967 |
| | Escalade Inc. | 141,344 | 1,873 |
| | Alico Inc. | 47,911 | 1,854 |
| * | Fenix Parts Inc. | 272,016 | 1,847 |
| | Rocky Brands Inc. | 154,882 | 1,790 |
| * | Skullcandy Inc. | 368,189 | 1,742 |
| | Crown Crafts Inc. | 204,279 | 1,734 |
| * | Core Molding Technologies Inc. | 134,770 | 1,729 |
| | Alliance One International Inc. | 147,489 | 1,692 |
| * | MCBC Holdings Inc. | 119,686 | 1,640 |
| * | Dixie Group Inc. | 312,289 | 1,633 |
| | Nature's Sunshine Products Inc. | 160,581 | 1,625 |
| * | Fuel Systems Solutions Inc. | 326,103 | 1,595 |
| * | LoJack Corp. | 276,852 | 1,539 |
| | Johnson Outdoors Inc. Class A | 69,364 | 1,518 |
| * | Delta Apparel Inc. | 107,852 | 1,514 |
| * | Vince Holding Corp. | 328,510 | 1,505 |
| * | Lakeland Industries Inc. | 122,201 | 1,459 |
| * | Lifeway Foods Inc. | 95,840 | 1,064 |
| | Marine Products Corp. | 166,467 | 1,005 |
| | LS Starrett Co. Class A | 95,823 | 931 |
| * | LeapFrog Enterprises Inc. | 1,202,231 | 854 |
| * | Reed's Inc. | 148,219 | 794 |
| * | S&W Seed Co. | 179,327 | 757 |
| * | Shiloh Industries Inc. | 140,270 | 735 |
| | Rocky Mountain Chocolate Factory Inc. | 67,227 | 723 |
| * | US Auto Parts Network Inc. | 236,188 | 694 |
| * | Mannatech Inc. | 36,471 | 693 |
| | Kewaunee Scientific Corp. | 36,368 | 647 |
| * | Stanley Furniture Co. Inc. | 230,972 | 644 |
| * | Female Health Co. | 415,043 | 602 |
| * | Tandy Leather Factory Inc. | 77,119 | 566 |
| *,^ | DS Healthcare Group Inc. | 152,892 | 393 |
| * | Coffee Holding Co. Inc. | 96,178 | 370 |
| * | Summer Infant Inc. | 163,915 | 366 |
| | Acme United Corp. | 20,357 | 346 |
| *,^ | Quantum Fuel Systems Technologies Worldwide Inc. | 469,988 | 343 |
| *,^ | Nova Lifestyle Inc. | 171,576 | 309 |
| * | Alpha Pro Tech Ltd. | 169,806 | 297 |
| * | Charles & Colvard Ltd. | 233,777 | 262 |
| * | Skyline Corp. | 72,991 | 261 |
| * | RiceBran Technologies | 114,553 | 218 |
| *,^ | Clean Diesel Technologies Inc. | 229,646 | 216 |
| * | Natural Alternatives International Inc. | 20,875 | 216 |
| * | Emerson Radio Corp. | 183,685 | 182 |
| * | P&F Industries Inc. Class A | 16,709 | 148 |
| * | Tofutti Brands Inc. | 34,800 | 145 |
| * | Joe's Jeans Inc. | 839,567 | 138 |
| * | Cyanotech Corp. | 23,066 | 126 |
| * | Willamette Valley Vineyards Inc. | 15,015 | 106 |
| * | CCA Industries Inc. | 27,573 | 86 |
| | Unique Fabricating Inc. | 6,623 | 82 |
| | Compx International Inc. | 5,846 | 67 |
| * | CTI Industries Corp. | 11,946 | 60 |
| | Golden Enterprises Inc. | 9,731 | 47 |
| * | Hovnanian Enterprises Inc. Class B | 19,300 | 35 |
| * | Crystal Rock Holdings Inc. | 60,150 | 35 |
| * | Koss Corp. | 12,072 | 24 |
| * | Ocean Bio-Chem Inc. | 9,942 | 21 |
| * | Virco Manufacturing Corp. | 4,291 | 14 |
| *,^ | Comstock Holding Cos. Inc. Class A | 9,193 | 13 |
| * | Reliv International Inc. | 19,300 | 12 |
| | | | 41,061,184 |
7
| | | |
| Vanguard® Total Stock Market Index Fund | | |
| Schedule of Investments | | |
| December 31, 2015 | | |
| |
| | | | Market |
| | | | Value |
| | | Shares | ($000) |
| Consumer Services (13.9%) | | |
| * | Amazon.com Inc. | 6,875,454 | 4,647,051 |
| | Home Depot Inc. | 23,256,656 | 3,075,693 |
| | Walt Disney Co. | 27,282,122 | 2,866,805 |
| | Comcast Corp. Class A | 44,784,115 | 2,527,168 |
| | McDonald's Corp. | 16,838,583 | 1,989,310 |
| | CVS Health Corp. | 20,301,420 | 1,984,870 |
| | Wal-Mart Stores Inc. | 26,454,106 | 1,621,637 |
| | Starbucks Corp. | 25,866,651 | 1,552,775 |
| | Costco Wholesale Corp. | 8,020,055 | 1,295,239 |
| | Lowe's Cos. Inc. | 16,969,243 | 1,290,341 |
| | Walgreens Boots Alliance Inc. | 14,970,245 | 1,274,791 |
| * | Priceline Group Inc. | 912,678 | 1,163,619 |
| | Time Warner Cable Inc. | 5,188,549 | 962,943 |
| | Time Warner Inc. | 13,924,268 | 900,482 |
| * | Netflix Inc. | 7,444,052 | 851,451 |
| | TJX Cos. Inc. | 11,747,138 | 832,990 |
| | McKesson Corp. | 4,218,758 | 832,066 |
| | Target Corp. | 11,293,004 | 819,985 |
| | Twenty-First Century Fox Inc. Class A | 29,256,384 | 794,603 |
| | Delta Air Lines Inc. | 14,428,207 | 731,366 |
| | Kroger Co. | 16,943,388 | 708,742 |
| | Yum! Brands Inc. | 7,905,295 | 577,482 |
| * | eBay Inc. | 20,907,830 | 574,547 |
| | Cardinal Health Inc. | 6,029,168 | 538,224 |
| | Southwest Airlines Co. | 11,929,317 | 513,676 |
| | American Airlines Group Inc. | 11,565,030 | 489,779 |
| * | O'Reilly Automotive Inc. | 1,718,221 | 435,432 |
| | L Brands Inc. | 4,520,650 | 433,169 |
| * | AutoZone Inc. | 558,862 | 414,625 |
| | Carnival Corp. | 7,558,051 | 411,763 |
| | Ross Stores Inc. | 7,477,112 | 402,343 |
| * | United Continental Holdings Inc. | 7,002,326 | 401,233 |
| | Sysco Corp. | 9,370,317 | 384,183 |
| | AmerisourceBergen Corp. Class A | 3,621,555 | 375,591 |
| | Dollar General Corp. | 5,123,622 | 368,235 |
| | CBS Corp. Class B | 7,767,569 | 366,086 |
| | Omnicom Group Inc. | 4,424,308 | 334,743 |
| | Royal Caribbean Cruises Ltd. | 3,219,478 | 325,843 |
| | Las Vegas Sands Corp. | 7,312,983 | 320,601 |
| * | Dollar Tree Inc. | 4,086,172 | 315,534 |
| | Nielsen Holdings plc | 6,047,652 | 281,821 |
| * | Chipotle Mexican Grill Inc. Class A | 571,735 | 274,347 |
| | Expedia Inc. | 2,133,231 | 265,161 |
| | Viacom Inc. Class B | 6,225,579 | 256,245 |
| *,^ | Charter Communications Inc. Class A | 1,331,957 | 243,881 |
| * | DISH Network Corp. Class A | 3,907,584 | 223,436 |
| * | Liberty Interactive Corp. QVC Group Class A | 8,108,261 | 221,518 |
| | Starwood Hotels & Resorts Worldwide Inc. | 3,095,463 | 214,454 |
| | Hilton Worldwide Holdings Inc. | 9,947,654 | 212,880 |
| | Whole Foods Market Inc. | 6,286,158 | 210,586 |
| | Tractor Supply Co. | 2,459,083 | 210,252 |
| | Marriott International Inc. Class A | 3,120,620 | 209,206 |
| * | Ulta Salon Cosmetics & Fragrance Inc. | 1,111,290 | 205,589 |
| | Macy's Inc. | 5,764,318 | 201,636 |
| * | CarMax Inc. | 3,713,703 | 200,429 |
| | Advance Auto Parts Inc. | 1,275,543 | 191,982 |
| * | MGM Resorts International | 8,260,777 | 187,685 |
| | Alaska Air Group Inc. | 2,316,268 | 186,483 |
| | Signet Jewelers Ltd. | 1,458,833 | 180,443 |
| * | TripAdvisor Inc. | 2,045,878 | 174,411 |
| | Interpublic Group of Cos. Inc. | 7,395,519 | 172,168 |
| * | Norwegian Cruise Line Holdings Ltd. | 2,910,904 | 170,579 |
| | Kohl's Corp. | 3,551,310 | 169,149 |
8
| | | |
| Vanguard® Total Stock Market Index Fund | | |
| Schedule of Investments | | |
| December 31, 2015 | | |
| |
| | | | Market |
| | | | Value |
| | | Shares | ($000) |
| | H&R Block Inc. | 5,055,486 | 168,398 |
| | Foot Locker Inc. | 2,547,252 | 165,801 |
| | Best Buy Co. Inc. | 5,365,045 | 163,366 |
| * | Sirius XM Holdings Inc. | 38,404,725 | 156,307 |
| | Wyndham Worldwide Corp. | 2,126,612 | 154,498 |
| | Tiffany & Co. | 1,994,642 | 152,171 |
| * | Rite Aid Corp. | 19,171,449 | 150,304 |
| * | IHS Inc. Class A | 1,243,303 | 147,244 |
| * | Bed Bath & Beyond Inc. | 2,905,859 | 140,208 |
| | Aramark | 4,153,096 | 133,937 |
| | Darden Restaurants Inc. | 2,098,333 | 133,538 |
| * | Liberty Media Corp. | 3,438,982 | 130,956 |
| * | JetBlue Airways Corp. | 5,761,582 | 130,500 |
| | Nordstrom Inc. | 2,587,180 | 128,867 |
| | Cablevision Systems Corp. Class A | 3,868,448 | 123,403 |
| * | Discovery Communications Inc. | 4,804,425 | 121,168 |
| | News Corp. Class A | 8,732,731 | 116,669 |
| | FactSet Research Systems Inc. | 714,979 | 116,234 |
| | Staples Inc. | 11,791,679 | 111,667 |
| | Domino's Pizza Inc. | 992,705 | 110,438 |
| | TEGNA Inc. | 4,075,100 | 103,997 |
| | Wynn Resorts Ltd. | 1,496,394 | 103,535 |
| | Gap Inc. | 4,129,044 | 101,987 |
| * | Hertz Global Holdings Inc. | 6,926,163 | 98,559 |
| * | ServiceMaster Global Holdings Inc. | 2,443,090 | 95,867 |
| | KAR Auction Services Inc. | 2,541,628 | 94,116 |
| | Service Corp. International | 3,443,435 | 89,598 |
| | Williams-Sonoma Inc. | 1,490,276 | 87,047 |
| * | Panera Bread Co. Class A | 438,771 | 85,464 |
| * | AutoNation Inc. | 1,426,559 | 85,108 |
| | Casey's General Stores Inc. | 704,094 | 84,808 |
| | Vail Resorts Inc. | 657,913 | 84,206 |
| * | AMC Networks Inc. Class A | 1,106,998 | 82,671 |
| * | Sally Beauty Holdings Inc. | 2,830,851 | 78,952 |
| *,^ | Copart Inc. | 2,058,726 | 78,252 |
| * | VCA Inc. | 1,394,547 | 76,700 |
| | Scripps Networks Interactive Inc. Class A | 1,367,563 | 75,503 |
| | Six Flags Entertainment Corp. | 1,362,215 | 74,840 |
| | Dunkin' Brands Group Inc. | 1,717,957 | 73,168 |
| * | Discovery Communications Inc. Class A | 2,693,157 | 71,853 |
| * | Sprouts Farmers Market Inc. | 2,613,807 | 69,501 |
| | Dun & Bradstreet Corp. | 654,104 | 67,981 |
| * | Avis Budget Group Inc. | 1,823,283 | 66,167 |
| * | Liberty Media Corp. Class A | 1,662,441 | 65,251 |
| * | Live Nation Entertainment Inc. | 2,560,169 | 62,903 |
| | Cinemark Holdings Inc. | 1,878,899 | 62,812 |
| | Sabre Corp. | 2,177,388 | 60,902 |
| * | Madison Square Garden Co. Class A | 373,590 | 60,447 |
| * | Burlington Stores Inc. | 1,387,187 | 59,510 |
| | Dick's Sporting Goods Inc. | 1,642,137 | 58,050 |
| ^ | Lions Gate Entertainment Corp. | 1,755,077 | 56,847 |
| * | Office Depot Inc. | 10,027,091 | 56,553 |
| * | Restoration Hardware Holdings Inc. | 697,449 | 55,412 |
| * | Buffalo Wild Wings Inc. | 347,078 | 55,411 |
| *,^ | SolarCity Corp. | 1,071,388 | 54,662 |
| ^ | Cracker Barrel Old Country Store Inc. | 430,379 | 54,585 |
| ^ | GameStop Corp. Class A | 1,928,067 | 54,063 |
| * | Starz | 1,580,969 | 52,962 |
| | Brinker International Inc. | 1,095,603 | 52,534 |
| * | Spirit Airlines Inc. | 1,312,572 | 52,306 |
| * | Houghton Mifflin Harcourt Co. | 2,391,907 | 52,096 |
| | Jack in the Box Inc. | 670,466 | 51,431 |
| * | Bright Horizons Family Solutions Inc. | 769,105 | 51,376 |
| | CST Brands Inc. | 1,293,917 | 50,644 |
9
| | | |
| Vanguard® Total Stock Market Index Fund | | |
| Schedule of Investments | | |
| December 31, 2015 | | |
| |
| | | | Market |
| | | | Value |
| | | Shares | ($000) |
| * | Pandora Media Inc. | 3,702,919 | 49,656 |
| | American Eagle Outfitters Inc. | 3,189,492 | 49,437 |
| * | Murphy USA Inc. | 813,339 | 49,402 |
| | Tribune Media Co. Class A | 1,453,225 | 49,134 |
| | GNC Holdings Inc. Class A | 1,538,416 | 47,722 |
| | Rollins Inc. | 1,820,260 | 47,145 |
| | Wendy's Co. | 4,256,744 | 45,845 |
| * | Beacon Roofing Supply Inc. | 1,063,950 | 43,813 |
| | Chemed Corp. | 290,561 | 43,526 |
| | Lithia Motors Inc. Class A | 407,442 | 43,462 |
| | AMERCO | 110,638 | 43,093 |
| | John Wiley & Sons Inc. Class A | 944,630 | 42,537 |
| * | Cabela's Inc. | 887,947 | 41,494 |
| | Allegiant Travel Co. Class A | 246,090 | 41,301 |
| | Texas Roadhouse Inc. Class A | 1,127,948 | 40,347 |
| | Graham Holdings Co. Class B | 82,906 | 40,207 |
| | Sinclair Broadcast Group Inc. Class A | 1,233,497 | 40,138 |
| | Cable One Inc. | 91,501 | 39,680 |
| * | Urban Outfitters Inc. | 1,685,571 | 38,347 |
| | Cheesecake Factory Inc. | 790,149 | 36,434 |
| | Bloomin' Brands Inc. | 2,149,528 | 36,306 |
| | Monro Muffler Brake Inc. | 547,806 | 36,276 |
| | Big Lots Inc. | 933,892 | 35,992 |
| | Churchill Downs Inc. | 247,592 | 35,032 |
| *,^ | JC Penney Co. Inc. | 5,255,408 | 35,001 |
| * | Yelp Inc. Class A | 1,197,810 | 34,497 |
| | Gannett Co. Inc. | 2,093,294 | 34,100 |
| | Abercrombie & Fitch Co. | 1,260,481 | 34,033 |
| * | United Natural Foods Inc. | 864,252 | 34,017 |
| * | Grand Canyon Education Inc. | 837,830 | 33,614 |
| * | DreamWorks Animation SKG Inc. Class A | 1,271,703 | 32,772 |
| * | SUPERVALU Inc. | 4,823,871 | 32,706 |
| | Core-Mark Holding Co. Inc. | 395,934 | 32,443 |
| * | Hawaiian Holdings Inc. | 912,642 | 32,244 |
| * | Pinnacle Entertainment Inc. | 1,031,985 | 32,115 |
| | DSW Inc. Class A | 1,344,150 | 32,071 |
| | New York Times Co. Class A | 2,375,572 | 31,880 |
| * | Ascena Retail Group Inc. | 3,221,266 | 31,729 |
| | Choice Hotels International Inc. | 627,594 | 31,637 |
| | Penske Automotive Group Inc. | 741,574 | 31,398 |
| | Nexstar Broadcasting Group Inc. Class A | 529,717 | 31,094 |
| * | WebMD Health Corp. | 640,297 | 30,926 |
| | Matthews International Corp. Class A | 568,071 | 30,363 |
| | Hillenbrand Inc. | 1,020,672 | 30,243 |
| * | Five Below Inc. | 936,500 | 30,062 |
| | Dolby Laboratories Inc. Class A | 889,359 | 29,927 |
| | Papa John's International Inc. | 533,836 | 29,825 |
| * | Stamps.com Inc. | 271,658 | 29,776 |
| * | Asbury Automotive Group Inc. | 440,187 | 29,686 |
| | PriceSmart Inc. | 355,114 | 29,471 |
| | Aaron's Inc. | 1,316,032 | 29,466 |
| | Group 1 Automotive Inc. | 387,960 | 29,369 |
| * | Michaels Cos. Inc. | 1,325,237 | 29,301 |
| | Meredith Corp. | 674,205 | 29,159 |
| | HSN Inc. | 573,224 | 29,045 |
| | Sotheby's | 1,112,183 | 28,650 |
| | Sonic Corp. | 880,481 | 28,448 |
| * | Acxiom Corp. | 1,341,868 | 28,072 |
| | Time Inc. | 1,776,309 | 27,835 |
| * | Boyd Gaming Corp. | 1,393,204 | 27,683 |
| | Morningstar Inc. | 342,868 | 27,570 |
| | DeVry Education Group Inc. | 1,085,214 | 27,467 |
| * | Hyatt Hotels Corp. Class A | 581,431 | 27,339 |
| ^ | Regal Entertainment Group Class A | 1,419,269 | 26,782 |
10
| | | |
| Vanguard® Total Stock Market Index Fund | | |
| Schedule of Investments | | |
| December 31, 2015 | | |
| |
| | | | Market |
| | | | Value |
| | | Shares | ($000) |
| | Chico's FAS Inc. | 2,501,938 | 26,696 |
| | Dillard's Inc. Class A | 400,820 | 26,338 |
| * | Shutterfly Inc. | 589,763 | 26,280 |
| * | Media General Inc. | 1,627,165 | 26,279 |
| *,^ | GrubHub Inc. | 1,079,460 | 26,123 |
| * | Diplomat Pharmacy Inc. | 759,393 | 25,986 |
| *,^ | Groupon Inc. Class A | 8,346,095 | 25,623 |
| | DineEquity Inc. | 299,405 | 25,351 |
| * | Express Inc. | 1,461,835 | 25,260 |
| * | Dave & Buster's Entertainment Inc. | 602,895 | 25,165 |
| * | comScore Inc. | 607,442 | 24,996 |
| | SeaWorld Entertainment Inc. | 1,245,115 | 24,516 |
| * | Popeyes Louisiana Kitchen Inc. | 405,715 | 23,734 |
| * | Genesco Inc. | 411,435 | 23,382 |
| * | MSG Networks Inc. | 1,118,335 | 23,261 |
| * | La Quinta Holdings Inc. | 1,630,273 | 22,188 |
| | Marriott Vacations Worldwide Corp. | 372,098 | 21,191 |
| | Extended Stay America Inc. | 1,319,759 | 20,984 |
| * | Penn National Gaming Inc. | 1,281,690 | 20,533 |
| *,^ | Diamond Resorts International Inc. | 801,134 | 20,437 |
| | Guess? Inc. | 1,072,896 | 20,256 |
| | ClubCorp Holdings Inc. | 1,103,136 | 20,154 |
| | Children's Place Inc. | 362,271 | 19,997 |
| | Caleres Inc. | 742,620 | 19,917 |
| | EW Scripps Co. Class A | 1,036,248 | 19,689 |
| * | Four Corners Property Trust Inc. | 790,307 | 19,094 |
| | MDC Partners Inc. Class A | 870,531 | 18,908 |
| * | Fresh Market Inc. | 789,618 | 18,493 |
| * | Gray Television Inc. | 1,125,967 | 18,353 |
| * | Vitamin Shoppe Inc. | 537,492 | 17,576 |
| * | Krispy Kreme Doughnuts Inc. | 1,142,439 | 17,217 |
| | Cato Corp. Class A | 461,622 | 16,997 |
| * | Pep Boys-Manny Moe & Jack | 920,952 | 16,955 |
| * | Constant Contact Inc. | 577,886 | 16,897 |
| | Scholastic Corp. | 430,786 | 16,611 |
| | SkyWest Inc. | 867,321 | 16,496 |
| | National CineMedia Inc. | 1,034,070 | 16,245 |
| | International Speedway Corp. Class A | 481,639 | 16,241 |
| * | Fiesta Restaurant Group Inc. | 482,800 | 16,222 |
| ^ | Buckle Inc. | 525,887 | 16,187 |
| *,^ | Mattress Firm Holding Corp. | 355,356 | 15,860 |
| * | Red Robin Gourmet Burgers Inc. | 250,945 | 15,493 |
| | New Media Investment Group Inc. | 792,690 | 15,426 |
| * | BJ's Restaurants Inc. | 351,845 | 15,295 |
| | Finish Line Inc. Class A | 845,064 | 15,279 |
| | Bob Evans Farms Inc. | 390,830 | 15,184 |
| * | Belmond Ltd. Class A | 1,590,202 | 15,107 |
| * | Rush Enterprises Inc. Class A | 676,346 | 14,805 |
| * | Denny's Corp. | 1,501,625 | 14,761 |
| | SpartanNash Co. | 650,445 | 14,076 |
| * | Bankrate Inc. | 1,045,421 | 13,904 |
| | Rent-A-Center Inc. | 903,863 | 13,531 |
| | Sonic Automotive Inc. Class A | 586,768 | 13,355 |
| * | Hibbett Sports Inc. | 440,173 | 13,311 |
| * | Francesca's Holdings Corp. | 751,132 | 13,077 |
| * | Caesars Acquisition Co. Class A | 1,882,153 | 12,817 |
| | Men's Wearhouse Inc. | 872,305 | 12,805 |
| * | Apollo Education Group Inc. | 1,630,964 | 12,509 |
| *,^ | Weight Watchers International Inc. | 523,224 | 11,929 |
| *,^ | Conn's Inc. | 494,934 | 11,616 |
| *,^ | Virgin America Inc. | 318,317 | 11,463 |
| | Interval Leisure Group Inc. | 715,694 | 11,172 |
| * | Strayer Education Inc. | 183,426 | 11,028 |
| | Ingles Markets Inc. Class A | 246,180 | 10,852 |
11
| | | |
| Vanguard® Total Stock Market Index Fund | | |
| Schedule of Investments | | |
| December 31, 2015 | | |
| |
| | | | Market |
| | | | Value |
| | | Shares | ($000) |
| * | Providence Service Corp. | 229,033 | 10,746 |
| | Fred's Inc. Class A | 646,551 | 10,584 |
| * | Tile Shop Holdings Inc. | 614,875 | 10,084 |
| | Barnes & Noble Inc. | 1,154,605 | 10,057 |
| ^ | World Wrestling Entertainment Inc. Class A | 555,022 | 9,902 |
| *,^ | Zoe's Kitchen Inc. | 345,619 | 9,670 |
| * | Smart & Final Stores Inc. | 527,161 | 9,600 |
| | Ruth's Hospitality Group Inc. | 598,086 | 9,522 |
| * | SP Plus Corp. | 398,323 | 9,520 |
| | Weis Markets Inc. | 214,573 | 9,506 |
| * | Carmike Cinemas Inc. | 413,728 | 9,491 |
| * | Regis Corp. | 662,148 | 9,369 |
| *,^ | TrueCar Inc. | 972,813 | 9,281 |
| *,^ | Etsy Inc. | 1,113,853 | 9,200 |
| | AMC Entertainment Holdings Inc. | 382,444 | 9,179 |
| | Capella Education Co. | 198,166 | 9,159 |
| * | Chuy's Holdings Inc. | 289,515 | 9,073 |
| * | Rubicon Project Inc. | 546,753 | 8,994 |
| * | FTD Cos. Inc. | 342,200 | 8,955 |
| *,^ | Quotient Technology Inc. | 1,310,505 | 8,938 |
| *,^ | Scientific Games Corp. Class A | 948,640 | 8,509 |
| * | Performance Food Group Co. | 365,632 | 8,461 |
| * | MarineMax Inc. | 458,548 | 8,446 |
| *,^ | Caesars Entertainment Corp. | 1,055,446 | 8,327 |
| | Entravision Communications Corp. Class A | 1,079,873 | 8,326 |
| * | RetailMeNot Inc. | 824,172 | 8,176 |
| *,^ | Sears Holdings Corp. | 397,331 | 8,169 |
| *,^ | Lands' End Inc. | 346,701 | 8,127 |
| * | Global Eagle Entertainment Inc. | 819,922 | 8,093 |
| *,^ | Chegg Inc. | 1,200,723 | 8,081 |
| *,^ | Lumber Liquidators Holdings Inc. | 465,200 | 8,076 |
| | Pier 1 Imports Inc. | 1,555,636 | 7,918 |
| * | Blue Nile Inc. | 211,426 | 7,850 |
| * | Lindblad Expeditions Holdings Inc. | 701,800 | 7,797 |
| | Carriage Services Inc. Class A | 310,852 | 7,492 |
| * | Angie's List Inc. | 799,487 | 7,475 |
| | Haverty Furniture Cos. Inc. | 339,726 | 7,284 |
| | Twenty-First Century Fox Inc. | 264,459 | 7,201 |
| * | Carrols Restaurant Group Inc. | 586,984 | 6,891 |
| * | American Public Education Inc. | 363,048 | 6,756 |
| * | XO Group Inc. | 418,700 | 6,724 |
| * | Biglari Holdings Inc. | 20,452 | 6,664 |
| * | Del Frisco's Restaurant Group Inc. | 414,753 | 6,644 |
| * | J Alexander's Holdings Inc. | 603,199 | 6,587 |
| * | Party City Holdco Inc. | 505,683 | 6,528 |
| | Journal Media Group Inc. | 540,261 | 6,494 |
| * | Barnes & Noble Education Inc. | 649,286 | 6,460 |
| | Shoe Carnival Inc. | 271,103 | 6,290 |
| * | Chefs' Warehouse Inc. | 370,246 | 6,176 |
| * | Isle of Capri Casinos Inc. | 440,472 | 6,136 |
| * | Zumiez Inc. | 392,083 | 5,928 |
| | Marcus Corp. | 311,052 | 5,901 |
| | PetMed Express Inc. | 336,217 | 5,763 |
| | Citi Trends Inc. | 268,452 | 5,705 |
| * | Ruby Tuesday Inc. | 1,027,649 | 5,662 |
| * | Sportsman's Warehouse Holdings Inc. | 431,762 | 5,570 |
| | News Corp. Class B | 374,454 | 5,227 |
| * | Eldorado Resorts Inc. | 471,674 | 5,188 |
| * | Tuesday Morning Corp. | 795,858 | 5,173 |
| ^ | Stage Stores Inc. | 546,184 | 4,976 |
| * | Avid Technology Inc. | 681,928 | 4,971 |
| ^ | Natural Health Trends Corp. | 144,942 | 4,860 |
| * | K12 Inc. | 549,934 | 4,839 |
| *,^ | El Pollo Loco Holdings Inc. | 381,396 | 4,817 |
12
| | | |
| Vanguard® Total Stock Market Index Fund | | |
| Schedule of Investments | | |
| December 31, 2015 | | |
| |
| | | | Market |
| | | | Value |
| | | Shares | ($000) |
| * | Townsquare Media Inc. Class A | 400,835 | 4,794 |
| *,^ | Habit Restaurants Inc. Class A | 199,883 | 4,609 |
| | Speedway Motorsports Inc. | 219,771 | 4,554 |
| *,^ | Planet Fitness Inc. Class A | 290,732 | 4,544 |
| *,^ | Clean Energy Fuels Corp. | 1,261,153 | 4,540 |
| | Village Super Market Inc. Class A | 169,481 | 4,466 |
| * | Autobytel Inc. | 192,349 | 4,339 |
| | Tribune Publishing Co. | 468,895 | 4,323 |
| *,^ | Shake Shack Inc. Class A | 107,205 | 4,245 |
| * | Entercom Communications Corp. Class A | 375,390 | 4,216 |
| * | Potbelly Corp. | 355,650 | 4,165 |
| | Winmark Corp. | 44,738 | 4,161 |
| * | Career Education Corp. | 1,115,784 | 4,050 |
| *,^ | TubeMogul Inc. | 297,026 | 4,040 |
| | CSS Industries Inc. | 139,794 | 3,967 |
| | Kirkland's Inc. | 273,465 | 3,965 |
| * | Daily Journal Corp. | 19,399 | 3,919 |
| * | Monarch Casino & Resort Inc. | 171,291 | 3,892 |
| * | Clear Channel Outdoor Holdings Inc. Class A | 680,697 | 3,805 |
| * | Destination XL Group Inc. | 687,306 | 3,794 |
| * | Ascent Capital Group Inc. Class A | 223,581 | 3,738 |
| * | America's Car-Mart Inc. | 139,832 | 3,732 |
| * | 1-800-Flowers.com Inc. Class A | 505,922 | 3,683 |
| | Stein Mart Inc. | 544,971 | 3,668 |
| * | Republic Airways Holdings Inc. | 913,533 | 3,590 |
| * | Natural Grocers by Vitamin Cottage Inc. | 167,179 | 3,405 |
| * | Titan Machinery Inc. | 310,341 | 3,392 |
| * | Reading International Inc. Class A | 257,620 | 3,377 |
| * | Overstock.com Inc. | 274,766 | 3,374 |
| | Big 5 Sporting Goods Corp. | 329,666 | 3,293 |
| *,^ | Trupanion Inc. | 333,826 | 3,258 |
| * | Build-A-Bear Workshop Inc. | 251,847 | 3,083 |
| | Harte-Hanks Inc. | 914,956 | 2,964 |
| *,^ | Boot Barn Holdings Inc. | 237,746 | 2,922 |
| | Liberty Tax Inc. | 121,848 | 2,904 |
| *,^ | Wingstop Inc. | 126,131 | 2,877 |
| * | Century Casinos Inc. | 368,214 | 2,865 |
| * | Ollie's Bargain Outlet Holdings Inc. | 165,064 | 2,808 |
| * | Liquidity Services Inc. | 428,471 | 2,785 |
| * | Bravo Brio Restaurant Group Inc. | 306,073 | 2,755 |
| | Saga Communications Inc. Class A | 70,337 | 2,704 |
| | Nathan's Famous Inc. | 50,301 | 2,594 |
| *,^ | Container Store Group Inc. | 306,721 | 2,515 |
| * | Intrawest Resorts Holdings Inc. | 312,628 | 2,445 |
| * | RCI Hospitality Holdings Inc. | 238,848 | 2,386 |
| * | Kona Grill Inc. | 149,304 | 2,368 |
| *,^ | Bojangles' Inc. | 148,014 | 2,349 |
| * | QuinStreet Inc. | 543,218 | 2,330 |
| * | TechTarget Inc. | 283,276 | 2,275 |
| * | Bridgepoint Education Inc. | 294,656 | 2,242 |
| * | West Marine Inc. | 262,221 | 2,226 |
| | Destination Maternity Corp. | 246,070 | 2,146 |
| | Marchex Inc. Class B | 550,813 | 2,143 |
| *,^ | Papa Murphy's Holdings Inc. | 189,982 | 2,139 |
| *,^ | Noodles & Co. Class A | 207,783 | 2,013 |
| * | Everyday Health Inc. | 313,070 | 1,885 |
| * | Red Lion Hotels Corp. | 266,079 | 1,865 |
| * | Sears Hometown and Outlet Stores Inc. | 224,008 | 1,792 |
| * | PCM Inc. | 177,713 | 1,765 |
| | Collectors Universe Inc. | 113,601 | 1,761 |
| * | Gaiam Inc. Class A | 281,679 | 1,758 |
| | Liberator Medical Holdings Inc. | 519,440 | 1,735 |
| * | Tilly's Inc. Class A | 249,034 | 1,651 |
| | A H Belo Corp. Class A | 324,764 | 1,624 |
13
| | | |
| Vanguard® Total Stock Market Index Fund | | |
| Schedule of Investments | | |
| December 31, 2015 | | |
| |
| | | | Market |
| | | | Value |
| | | Shares | ($000) |
| * | Golden Entertainment Inc. | 158,464 | 1,621 |
| * | RealNetworks Inc. | 372,913 | 1,585 |
| * | Sizmek Inc. | 429,148 | 1,566 |
| *,^ | Gordmans Stores Inc. | 477,553 | 1,504 |
| * | Morgans Hotel Group Co. | 443,336 | 1,494 |
| * | Care.com Inc. | 202,548 | 1,450 |
| *,^ | ITT Educational Services Inc. | 384,143 | 1,433 |
| * | Spark Networks Inc. | 371,772 | 1,431 |
| * | Lee Enterprises Inc. | 846,548 | 1,422 |
| * | Luby's Inc. | 299,531 | 1,339 |
| *,^ | Fogo De Chao Inc. | 87,957 | 1,333 |
| * | Travelzoo Inc. | 157,028 | 1,314 |
| * | EVINE Live Inc. | 730,135 | 1,300 |
| * | McClatchy Co. Class A | 1,026,888 | 1,243 |
| * | Cambium Learning Group Inc. | 244,281 | 1,185 |
| | Wayside Technology Group Inc. | 60,780 | 1,115 |
| * | Christopher & Banks Corp. | 655,885 | 1,082 |
| *,^ | Empire Resorts Inc. | 54,664 | 984 |
| * | New York & Co. Inc. | 425,060 | 973 |
| *,^ | Digital Turbine Inc. | 699,068 | 930 |
| * | Radio One Inc. | 538,531 | 926 |
| * | Cumulus Media Inc. Class A | 2,759,359 | 911 |
| *,^ | Rave Restaurant Group Inc. | 139,116 | 889 |
| *,^ | hhgregg Inc. | 239,391 | 876 |
| * | Demand Media Inc. | 155,814 | 857 |
| | Salem Media Group Inc. Class A | 161,980 | 807 |
| * | Good Times Restaurants Inc. | 160,052 | 768 |
| * | YuMe Inc. | 218,763 | 768 |
| | TheStreet Inc. | 477,535 | 716 |
| * | Famous Dave's of America Inc. | 102,790 | 713 |
| | Peak Resorts Inc. | 115,009 | 691 |
| *,^ | YOU On Demand Holdings Inc. | 325,761 | 616 |
| * | Ignite Restaurant Group Inc. | 132,916 | 558 |
| *,^ | Remark Media Inc. | 105,624 | 547 |
| ^ | Bon-Ton Stores Inc. | 260,323 | 547 |
| * | CafePress Inc. | 132,674 | 509 |
| | Town Sports International Holdings Inc. | 423,943 | 504 |
| * | Gaming Partners International Corp. | 42,177 | 375 |
| | National American University Holdings Inc. | 175,287 | 366 |
| *,^ | Profire Energy Inc. | 365,619 | 362 |
| *,^ | Aeropostale Inc. | 1,268,354 | 355 |
| * | Diversified Restaurant Holdings Inc. | 148,684 | 335 |
| * | Dover Downs Gaming & Entertainment Inc. | 339,612 | 330 |
| | Ark Restaurants Corp. | 14,102 | 326 |
| | bebe stores inc | 566,914 | 320 |
| *,^ | ReachLocal Inc. | 193,721 | 320 |
| * | Emmis Communications Corp. Class A | 479,209 | 307 |
| * | MaxPoint Interactive Inc. | 172,345 | 295 |
| * | Insignia Systems Inc. | 95,048 | 278 |
| * | Full House Resorts Inc. | 160,784 | 268 |
| *,^ | Live Ventures Inc. | 171,799 | 251 |
| *,^ | Cosi Inc. | 542,509 | 239 |
| *,^ | Fairway Group Holdings Corp. | 340,880 | 225 |
| *,^ | Pacific Sunwear of California Inc. | 804,550 | 194 |
| | Educational Development Corp. | 17,310 | 192 |
| *,^ | SFX Entertainment Inc. | 960,564 | 183 |
| * | Spanish Broadcasting System Inc. | 51,140 | 166 |
| | Value Line Inc. | 9,438 | 127 |
| * | Nevada Gold & Casinos Inc. | 53,790 | 122 |
| | Flanigan's Enterprises Inc. | 5,074 | 111 |
| * | Interpace Diagnostics Group Inc. | 177,317 | 88 |
| | Beasley Broadcast Group Inc. Class A | 22,997 | 83 |
| *,^ | Viggle Inc. | 203,922 | 73 |
| * | NTN Buzztime Inc. | 354,386 | 57 |
14
| | | |
| Vanguard® Total Stock Market Index Fund | | |
| Schedule of Investments | | |
| December 31, 2015 | | |
| |
| | | | Market |
| | | | Value |
| | | Shares | ($000) |
| * | Trans World Entertainment Corp. | 15,785 | 56 |
| * | Perfumania Holdings Inc. | 23,034 | 56 |
| * | Speed Commerce Inc. | 811,944 | 49 |
| | Canterbury Park Holding Corp. | 4,200 | 43 |
| *,^ | Net Element Inc. | 174,274 | 33 |
| | Haverty Furniture Cos. Inc. Class A | 1,375 | 29 |
| * | SPAR Group Inc. | 19,446 | 19 |
| * | Premier Exhibitions Inc. | 10,767 | 7 |
| * | Universal Travel Group | 42,843 | 7 |
| * | ONE Group Hospitality Inc. | 300 | 1 |
| | | | 55,577,588 |
| Financials (19.3%) | | |
| | Wells Fargo & Co. | 84,407,813 | 4,588,409 |
| * | Berkshire Hathaway Inc. Class B | 33,807,482 | 4,463,940 |
| | JPMorgan Chase & Co. | 67,562,732 | 4,461,167 |
| | Bank of America Corp. | 190,988,325 | 3,214,334 |
| | Visa Inc. Class A | 35,691,364 | 2,767,865 |
| | Citigroup Inc. | 51,916,315 | 2,686,669 |
| | MasterCard Inc. Class A | 18,163,115 | 1,768,361 |
| | American International Group Inc. | 21,554,653 | 1,335,742 |
| | US Bancorp | 30,629,004 | 1,306,940 |
| | Goldman Sachs Group Inc. | 7,038,847 | 1,268,611 |
| | Simon Property Group Inc. | 5,678,931 | 1,104,211 |
| | American Express Co. | 15,344,266 | 1,067,194 |
| | PNC Financial Services Group Inc. | 9,327,346 | 888,989 |
| | Morgan Stanley | 26,624,644 | 846,930 |
| | MetLife Inc. | 16,319,273 | 786,752 |
| | Bank of New York Mellon Corp. | 19,048,505 | 785,179 |
| | American Tower Corporation | 7,775,241 | 753,810 |
| | Charles Schwab Corp. | 21,730,113 | 715,573 |
| | Capital One Financial Corp. | 9,750,033 | 703,757 |
| | Prudential Financial Inc. | 8,237,407 | 670,607 |
| | Public Storage | 2,699,851 | 668,753 |
| | BlackRock Inc. | 1,955,921 | 666,030 |
| | ACE Ltd. | 5,649,267 | 660,117 |
| | Travelers Cos. Inc. | 5,636,865 | 636,177 |
| | Intercontinental Exchange Inc. | 2,171,788 | 556,542 |
| | Chubb Corp. | 4,173,676 | 553,596 |
| | Equity Residential | 6,677,475 | 544,815 |
| | BB&T Corp. | 14,350,224 | 542,582 |
| | CME Group Inc. | 5,876,227 | 532,386 |
| | Marsh & McLennan Cos. Inc. | 9,592,538 | 531,906 |
| | Crown Castle International Corp. | 6,122,659 | 529,304 |
| | McGraw Hill Financial Inc. | 4,949,567 | 487,928 |
| | Aon plc | 5,063,107 | 466,869 |
| | State Street Corp. | 7,028,878 | 466,436 |
| * | Synchrony Financial | 15,271,249 | 464,399 |
| | AvalonBay Communities Inc. | 2,507,652 | 461,734 |
| | Allstate Corp. | 7,102,609 | 441,001 |
| | Welltower Inc. | 6,479,963 | 440,832 |
| | Aflac Inc. | 7,060,815 | 422,943 |
| | Discover Financial Services | 7,823,712 | 419,507 |
| | Prologis Inc. | 9,603,324 | 412,175 |
| | SunTrust Banks Inc. | 9,362,972 | 401,110 |
| | Boston Properties Inc. | 2,814,623 | 358,977 |
| | Ventas Inc. | 6,095,026 | 343,942 |
| | Ameriprise Financial Inc. | 3,218,587 | 342,522 |
| | Equinix Inc. | 1,128,474 | 341,251 |
| | Hartford Financial Services Group Inc. | 7,504,605 | 326,150 |
| | HCP Inc. | 8,509,350 | 325,398 |
| | Progressive Corp. | 10,170,495 | 323,422 |
| | M&T Bank Corp. | 2,640,138 | 319,932 |
| | T. Rowe Price Group Inc. | 4,391,615 | 313,957 |
| | Vornado Realty Trust | 3,107,420 | 310,618 |
15
| | |
| Vanguard® Total Stock Market Index Fund | | |
| Schedule of Investments | | |
| December 31, 2015 | | |
| |
| | | Market |
| | | Value |
| | Shares | ($000) |
| Moody's Corp. | 3,074,585 | 308,504 |
| Fifth Third Bancorp | 14,567,569 | 292,808 |
| Northern Trust Corp. | 4,018,936 | 289,725 |
| Essex Property Trust Inc. | 1,206,030 | 288,736 |
| Weyerhaeuser Co. | 9,366,028 | 280,794 |
| General Growth Properties Inc. | 9,697,301 | 263,864 |
| Invesco Ltd. | 7,756,414 | 259,685 |
| Citizens Financial Group Inc. | 9,663,091 | 253,076 |
| Franklin Resources Inc. | 6,739,244 | 248,139 |
| Principal Financial Group Inc. | 5,370,649 | 241,572 |
| Equifax Inc. | 2,163,684 | 240,969 |
| Realty Income Corp. | 4,555,343 | 235,192 |
| Macerich Co. | 2,898,245 | 233,859 |
| Regions Financial Corp. | 23,930,162 | 229,730 |
| Lincoln National Corp. | 4,538,453 | 228,103 |
| * Markel Corp. | 241,991 | 213,763 |
| XL Group plc Class A | 5,428,455 | 212,687 |
| Host Hotels & Resorts Inc. | 13,848,233 | 212,432 |
| Loews Corp. | 5,456,617 | 209,534 |
| SL Green Realty Corp. | 1,821,309 | 205,771 |
| Digital Realty Trust Inc. | 2,674,555 | 202,250 |
| KeyCorp | 15,303,016 | 201,847 |
| Kimco Realty Corp. | 7,158,715 | 189,420 |
| Extra Space Storage Inc. | 2,135,944 | 188,412 |
| Federal Realty Investment Trust | 1,264,518 | 184,746 |
| * CBRE Group Inc. Class A | 5,187,136 | 179,371 |
| UDR Inc. | 4,763,687 | 178,972 |
| First Republic Bank | 2,654,307 | 175,344 |
| * Berkshire Hathaway Inc. Class A | 863 | 170,701 |
| Cincinnati Financial Corp. | 2,819,235 | 166,814 |
| FNF Group | 4,808,563 | 166,713 |
| Western Union Co. | 9,214,336 | 165,029 |
| Annaly Capital Management Inc. | 17,207,649 | 161,408 |
| Huntington Bancshares Inc. | 14,593,506 | 161,404 |
| * E*TRADE Financial Corp. | 5,356,600 | 158,770 |
| * Affiliated Managers Group Inc. | 990,418 | 158,229 |
| TD Ameritrade Holding Corp. | 4,447,234 | 154,363 |
| Plum Creek Timber Co. Inc. | 3,181,368 | 151,815 |
| Voya Financial Inc. | 4,061,691 | 149,917 |
| Unum Group | 4,447,275 | 148,050 |
| * Arch Capital Group Ltd. | 2,116,904 | 147,654 |
| * Ally Financial Inc. | 7,871,203 | 146,719 |
| CIT Group Inc. | 3,678,621 | 146,041 |
| Willis Group Holdings plc | 2,963,830 | 143,953 |
| SEI Investments Co. | 2,703,471 | 141,662 |
| New York Community Bancorp Inc. | 8,407,049 | 137,203 |
| Raymond James Financial Inc. | 2,350,799 | 136,276 |
| Comerica Inc. | 3,242,703 | 135,642 |
| * Signature Bank | 874,396 | 134,106 |
| Duke Realty Corp. | 6,257,907 | 131,541 |
| Jones Lang LaSalle Inc. | 818,024 | 130,769 |
| * Alleghany Corp. | 273,210 | 130,575 |
| VEREIT Inc. | 16,438,100 | 130,190 |
| MSCI Inc. Class A | 1,750,826 | 126,287 |
| Arthur J Gallagher & Co. | 3,068,774 | 125,636 |
| Mid-America Apartment Communities Inc. | 1,369,728 | 124,385 |
| Torchmark Corp. | 2,166,173 | 123,818 |
| Nasdaq Inc. | 2,124,232 | 123,567 |
| Camden Property Trust | 1,569,378 | 120,465 |
| Alexandria Real Estate Equities Inc. | 1,314,401 | 118,769 |
| Omega Healthcare Investors Inc. | 3,390,467 | 118,599 |
| Regency Centers Corp. | 1,703,021 | 116,010 |
| Apartment Investment & Management Co. | 2,830,882 | 113,320 |
| * SVB Financial Group | 945,386 | 112,406 |
16
| | |
| Vanguard® Total Stock Market Index Fund | | |
| Schedule of Investments | | |
| December 31, 2015 | | |
| |
| | | Market |
| | | Value |
| | Shares | ($000) |
| PartnerRe Ltd. | 790,662 | 110,487 |
| Everest Re Group Ltd. | 599,507 | 109,764 |
| * Liberty Ventures Class A | 2,428,398 | 109,545 |
| East West Bancorp Inc. | 2,630,643 | 109,330 |
| American Capital Agency Corp. | 6,283,735 | 108,960 |
| Lazard Ltd. Class A | 2,374,198 | 106,863 |
| Kilroy Realty Corp. | 1,679,761 | 106,295 |
| WP Carey Inc. | 1,746,220 | 103,027 |
| Reinsurance Group of America Inc. Class A | 1,199,484 | 102,616 |
| Zions Bancorporation | 3,734,777 | 101,959 |
| * Realogy Holdings Corp. | 2,668,918 | 97,869 |
| National Retail Properties Inc. | 2,441,421 | 97,779 |
| Equity LifeStyle Properties Inc. | 1,458,280 | 97,224 |
| CBOE Holdings Inc. | 1,495,231 | 97,040 |
| Axis Capital Holdings Ltd. | 1,721,972 | 96,809 |
| Assurant Inc. | 1,192,040 | 96,007 |
| * Forest City Enterprises Inc. Class A | 4,313,147 | 94,587 |
| Iron Mountain Inc. | 3,466,104 | 93,619 |
| DDR Corp. | 5,517,375 | 92,913 |
| WR Berkley Corp. | 1,693,962 | 92,744 |
| RenaissanceRe Holdings Ltd. | 815,653 | 92,324 |
| CubeSmart | 3,001,374 | 91,902 |
| American Financial Group Inc. | 1,256,372 | 90,559 |
| Brixmor Property Group Inc. | 3,481,622 | 89,895 |
| Lamar Advertising Co. Class A | 1,495,323 | 89,689 |
| People's United Financial Inc. | 5,541,705 | 89,499 |
| BioMed Realty Trust Inc. | 3,729,096 | 88,342 |
| StanCorp Financial Group Inc. | 775,695 | 88,336 |
| PacWest Bancorp | 2,005,143 | 86,422 |
| American Campus Communities Inc. | 2,032,074 | 84,006 |
| Starwood Property Trust Inc. | 4,077,418 | 83,832 |
| Liberty Property Trust | 2,691,301 | 83,565 |
| Taubman Centers Inc. | 1,042,541 | 79,984 |
| Douglas Emmett Inc. | 2,534,116 | 79,014 |
| Old Republic International Corp. | 4,213,872 | 78,504 |
| Legg Mason Inc. | 1,980,989 | 77,714 |
| Navient Corp. | 6,679,125 | 76,476 |
| Spirit Realty Capital Inc. | 7,541,421 | 75,565 |
| Highwoods Properties Inc. | 1,708,607 | 74,495 |
| Investors Bancorp Inc. | 5,988,007 | 74,491 |
| Synovus Financial Corp. | 2,270,821 | 73,529 |
| Hospitality Properties Trust | 2,766,278 | 72,338 |
| * Howard Hughes Corp. | 635,988 | 71,968 |
| Endurance Specialty Holdings Ltd. | 1,123,662 | 71,903 |
| Sovran Self Storage Inc. | 668,428 | 71,729 |
| MarketAxess Holdings Inc. | 641,857 | 71,625 |
| Bank of the Ozarks Inc. | 1,445,722 | 71,505 |
| First American Financial Corp. | 1,965,556 | 70,563 |
| First Niagara Financial Group Inc. | 6,456,357 | 70,051 |
| Assured Guaranty Ltd. | 2,629,780 | 69,505 |
| * Liberty Broadband Corp. | 1,336,109 | 69,291 |
| Weingarten Realty Investors | 1,976,149 | 68,335 |
| Validus Holdings Ltd. | 1,447,879 | 67,022 |
| Brown & Brown Inc. | 2,075,537 | 66,625 |
| Commerce Bancshares Inc. | 1,553,228 | 66,074 |
| CNO Financial Group Inc. | 3,437,789 | 65,627 |
| Eaton Vance Corp. | 2,007,732 | 65,111 |
| * Equity Commonwealth | 2,333,859 | 64,718 |
| Hanover Insurance Group Inc. | 782,398 | 63,640 |
| BankUnited Inc. | 1,757,473 | 63,374 |
| Healthcare Trust of America Inc. Class A | 2,347,137 | 63,302 |
| Senior Housing Properties Trust | 4,250,640 | 63,080 |
| Retail Properties of America Inc. | 4,254,557 | 62,840 |
| Umpqua Holdings Corp. | 3,951,372 | 62,827 |
17
| | | |
| Vanguard® Total Stock Market Index Fund | | |
| Schedule of Investments | | |
| December 31, 2015 | | |
| |
| | | | Market |
| | | | Value |
| | | Shares | ($000) |
| | Sun Communities Inc. | 914,902 | 62,698 |
| ^ | LPL Financial Holdings Inc. | 1,469,530 | 62,675 |
| | EPR Properties | 1,057,409 | 61,806 |
| | Cullen/Frost Bankers Inc. | 1,024,487 | 61,469 |
| | Webster Financial Corp. | 1,644,378 | 61,154 |
| | First Horizon National Corp. | 4,190,960 | 60,853 |
| ^ | Apple Hospitality REIT Inc. | 3,009,824 | 60,106 |
| | American Homes 4 Rent Class A | 3,600,991 | 59,993 |
| | Post Properties Inc. | 1,007,205 | 59,586 |
| * | Western Alliance Bancorp | 1,660,212 | 59,535 |
| | NorthStar Realty Finance Corp. | 3,471,288 | 59,116 |
| | White Mountains Insurance Group Ltd. | 81,138 | 58,972 |
| | Gramercy Property Trust | 7,635,592 | 58,947 |
| | DCT Industrial Trust Inc. | 1,570,342 | 58,684 |
| | Prosperity Bancshares Inc. | 1,210,896 | 57,953 |
| | Allied World Assurance Co. Holdings AG | 1,558,057 | 57,944 |
| * | LendingClub Corp. | 5,176,452 | 57,200 |
| | Corrections Corp. of America | 2,122,576 | 56,227 |
| | Tanger Factory Outlet Centers Inc. | 1,717,704 | 56,169 |
| | FirstMerit Corp. | 2,983,730 | 55,647 |
| | PrivateBancorp Inc. | 1,352,027 | 55,460 |
| | Paramount Group Inc. | 3,051,852 | 55,239 |
| | Outfront Media Inc. | 2,499,228 | 54,558 |
| * | MGIC Investment Corp. | 6,172,238 | 54,501 |
| | Healthcare Realty Trust Inc. | 1,898,316 | 53,760 |
| | Aspen Insurance Holdings Ltd. | 1,104,963 | 53,370 |
| | Popular Inc. | 1,877,472 | 53,208 |
| | Two Harbors Investment Corp. | 6,543,829 | 53,005 |
| | Columbia Property Trust Inc. | 2,239,081 | 52,574 |
| | LaSalle Hotel Properties | 2,057,642 | 51,770 |
| | New Residential Investment Corp. | 4,201,966 | 51,096 |
| | Piedmont Office Realty Trust Inc. Class A | 2,704,712 | 51,065 |
| | Associated Banc-Corp | 2,708,342 | 50,781 |
| | Radian Group Inc. | 3,770,479 | 50,487 |
| *,^ | Zillow Group Inc. | 2,146,891 | 50,409 |
| * | Stifel Financial Corp. | 1,188,073 | 50,327 |
| | Rayonier Inc. | 2,250,470 | 49,960 |
| | Bank of Hawaii Corp. | 794,086 | 49,948 |
| | Chimera Investment Corp. | 3,659,848 | 49,920 |
| | RLJ Lodging Trust | 2,302,058 | 49,794 |
| | AmTrust Financial Services Inc. | 800,653 | 49,304 |
| | Medical Properties Trust Inc. | 4,282,836 | 49,295 |
| | ProAssurance Corp. | 1,006,289 | 48,835 |
| | Federated Investors Inc. Class B | 1,687,154 | 48,337 |
| | Interactive Brokers Group Inc. | 1,097,784 | 47,863 |
| | First Industrial Realty Trust Inc. | 2,135,878 | 47,267 |
| | Sunstone Hotel Investors Inc. | 3,772,793 | 47,122 |
| | Gaming and Leisure Properties Inc. | 1,673,646 | 46,527 |
| | Hudson Pacific Properties Inc. | 1,638,075 | 46,095 |
| | Care Capital Properties Inc. | 1,506,713 | 46,060 |
| | RLI Corp. | 728,080 | 44,959 |
| | Symetra Financial Corp. | 1,384,647 | 43,990 |
| | United Bankshares Inc. | 1,185,526 | 43,853 |
| | Cathay General Bancorp | 1,397,804 | 43,793 |
| | MFA Financial Inc. | 6,623,734 | 43,717 |
| * | Blackhawk Network Holdings Inc. | 983,041 | 43,460 |
| | Fulton Financial Corp. | 3,327,698 | 43,293 |
| | Brandywine Realty Trust | 3,161,752 | 43,190 |
| | Home BancShares Inc. | 1,064,105 | 43,118 |
| | CyrusOne Inc. | 1,131,429 | 42,372 |
| | MB Financial Inc. | 1,303,246 | 42,186 |
| | Wintrust Financial Corp. | 868,642 | 42,147 |
| | FNB Corp. | 3,157,534 | 42,122 |
| | Blackstone Mortgage Trust Inc. Class A | 1,569,024 | 41,987 |
18
| | | |
| Vanguard® Total Stock Market Index Fund | | |
| Schedule of Investments | | |
| December 31, 2015 | | |
| |
| | | | Market |
| | | | Value |
| | | Shares | ($000) |
| | Primerica Inc. | 887,951 | 41,938 |
| | Erie Indemnity Co. Class A | 438,369 | 41,926 |
| | Urban Edge Properties | 1,776,923 | 41,669 |
| * | OneMain Holdings Inc. Class A | 1,001,894 | 41,619 |
| | Washington Federal Inc. | 1,746,097 | 41,609 |
| | Waddell & Reed Financial Inc. Class A | 1,443,717 | 41,377 |
| | Communications Sales & Leasing Inc. | 2,207,642 | 41,261 |
| | Ryman Hospitality Properties Inc. | 798,953 | 41,258 |
| * | Texas Capital Bancshares Inc. | 832,548 | 41,145 |
| | IBERIABANK Corp. | 745,546 | 41,057 |
| | GEO Group Inc. | 1,412,184 | 40,826 |
| | NorthStar Asset Management Group Inc. | 3,362,748 | 40,824 |
| | Kennedy-Wilson Holdings Inc. | 1,689,949 | 40,694 |
| | Acadia Realty Trust | 1,209,235 | 40,086 |
| | National Health Investors Inc. | 655,949 | 39,928 |
| | Valley National Bancorp | 4,051,275 | 39,905 |
| | Corporate Office Properties Trust | 1,789,494 | 39,065 |
| | TCF Financial Corp. | 2,740,490 | 38,696 |
| | Kite Realty Group Trust | 1,476,098 | 38,275 |
| | Equity One Inc. | 1,405,962 | 38,172 |
| | CBL & Associates Properties Inc. | 3,071,332 | 37,992 |
| | Education Realty Trust Inc. | 997,518 | 37,786 |
| * | Liberty TripAdvisor Holdings Inc. Class A | 1,242,006 | 37,682 |
| | Janus Capital Group Inc. | 2,660,732 | 37,490 |
| | BancorpSouth Inc. | 1,556,640 | 37,344 |
| | Cousins Properties Inc. | 3,949,835 | 37,247 |
| | DuPont Fabros Technology Inc. | 1,170,751 | 37,218 |
| | Colony Capital Inc. Class A | 1,890,426 | 36,826 |
| | Pebblebrook Hotel Trust | 1,301,839 | 36,478 |
| | American Equity Investment Life Holding Co. | 1,515,182 | 36,410 |
| | Hancock Holding Co. | 1,439,756 | 36,239 |
| | WP Glimcher Inc. | 3,361,761 | 35,668 |
| | Sterling Bancorp | 2,172,249 | 35,234 |
| | UMB Financial Corp. | 753,370 | 35,069 |
| | Retail Opportunity Investments Corp. | 1,955,410 | 35,002 |
| | DiamondRock Hospitality Co. | 3,616,283 | 34,897 |
| | Glacier Bancorp Inc. | 1,304,754 | 34,615 |
| | First Financial Bankshares Inc. | 1,131,550 | 34,139 |
| | First Citizens BancShares Inc. Class A | 132,227 | 34,137 |
| * | Genworth Financial Inc. Class A | 9,129,259 | 34,052 |
| | Evercore Partners Inc. Class A | 627,763 | 33,943 |
| | WisdomTree Investments Inc. | 2,160,421 | 33,875 |
| | PS Business Parks Inc. | 381,900 | 33,390 |
| | BGC Partners Inc. Class A | 3,401,520 | 33,369 |
| | Pinnacle Financial Partners Inc. | 649,215 | 33,344 |
| | Columbia Banking System Inc. | 1,023,589 | 33,277 |
| | New York REIT Inc. | 2,884,148 | 33,168 |
| | Mack-Cali Realty Corp. | 1,419,063 | 33,135 |
| *,^ | Credit Acceptance Corp. | 154,647 | 33,098 |
| | Xenia Hotels & Resorts Inc. | 2,142,762 | 32,849 |
| | Selective Insurance Group Inc. | 972,729 | 32,664 |
| | Washington REIT | 1,205,285 | 32,615 |
| | Great Western Bancorp Inc. | 1,091,903 | 31,687 |
| | QTS Realty Trust Inc. Class A | 698,376 | 31,504 |
| | National Penn Bancshares Inc. | 2,551,281 | 31,457 |
| ^ | Financial Engines Inc. | 932,709 | 31,404 |
| * | PRA Group Inc. | 887,509 | 30,788 |
| * | Santander Consumer USA Holdings Inc. | 1,942,090 | 30,782 |
| | EastGroup Properties Inc. | 552,836 | 30,743 |
| | South State Corp. | 422,606 | 30,407 |
| | American Assets Trust Inc. | 784,081 | 30,070 |
| | CoreSite Realty Corp. | 530,065 | 30,065 |
| | Community Bank System Inc. | 749,291 | 29,927 |
| | Argo Group International Holdings Ltd. | 497,661 | 29,780 |
19
| | | |
| Vanguard® Total Stock Market Index Fund | | |
| Schedule of Investments | | |
| December 31, 2015 | | |
| |
| | | | Market |
| | | | Value |
| | | Shares | ($000) |
| | Monogram Residential Trust Inc. | 3,038,734 | 29,658 |
| | Capitol Federal Financial Inc. | 2,352,567 | 29,548 |
| | CVB Financial Corp. | 1,743,418 | 29,499 |
| | Old National Bancorp | 2,129,781 | 28,880 |
| | Alexander & Baldwin Inc. | 812,514 | 28,690 |
| | Physicians Realty Trust | 1,699,247 | 28,649 |
| | EverBank Financial Corp. | 1,782,662 | 28,487 |
| | LTC Properties Inc. | 639,822 | 27,602 |
| | Trustmark Corp. | 1,197,795 | 27,597 |
| * | Enstar Group Ltd. | 183,177 | 27,484 |
| * | Hilltop Holdings Inc. | 1,427,189 | 27,431 |
| | Kemper Corp. | 727,405 | 27,096 |
| | Chesapeake Lodging Trust | 1,071,913 | 26,969 |
| | Astoria Financial Corp. | 1,696,872 | 26,895 |
| | Invesco Mortgage Capital Inc. | 2,159,472 | 26,756 |
| * | Eagle Bancorp Inc. | 529,901 | 26,744 |
| | Lexington Realty Trust | 3,324,680 | 26,597 |
| | STORE Capital Corp. | 1,142,388 | 26,503 |
| | International Bancshares Corp. | 1,030,645 | 26,488 |
| | Pennsylvania REIT | 1,175,540 | 25,709 |
| | First Midwest Bancorp Inc. | 1,371,741 | 25,281 |
| ^ | Global Net Lease Inc. | 3,163,710 | 25,151 |
| | Simmons First National Corp. Class A | 486,544 | 24,989 |
| * | Liberty Broadband Corp. Class A | 481,375 | 24,863 |
| | Renasant Corp. | 718,297 | 24,717 |
| * | HRG Group Inc. | 1,787,229 | 24,235 |
| | Horace Mann Educators Corp. | 729,212 | 24,195 |
| | Artisan Partners Asset Management Inc. Class A | 670,533 | 24,179 |
| | BBCN Bancorp Inc. | 1,402,229 | 24,146 |
| | Ramco-Gershenson Properties Trust | 1,440,769 | 23,931 |
| | S&T Bancorp Inc. | 766,088 | 23,611 |
| | Sabra Health Care REIT Inc. | 1,164,566 | 23,559 |
| | Chemical Financial Corp. | 686,005 | 23,509 |
| | Select Income REIT | 1,183,897 | 23,465 |
| | Parkway Properties Inc. | 1,490,688 | 23,299 |
| * | FCB Financial Holdings Inc. Class A | 648,838 | 23,222 |
| | Mercury General Corp. | 496,975 | 23,144 |
| *,^ | Zillow Group Inc. Class A | 883,551 | 23,008 |
| | Banner Corp. | 494,322 | 22,670 |
| | BOK Financial Corp. | 374,993 | 22,421 |
| | Hatteras Financial Corp. | 1,690,199 | 22,226 |
| | TFS Financial Corp. | 1,177,068 | 22,164 |
| | STAG Industrial Inc. | 1,200,774 | 22,154 |
| | Potlatch Corp. | 732,507 | 22,151 |
| * | SLM Corp. | 3,388,804 | 22,095 |
| | Westamerica Bancorporation | 472,230 | 22,077 |
| | NBT Bancorp Inc. | 788,905 | 21,995 |
| * | Essent Group Ltd. | 1,003,565 | 21,968 |
| | National General Holdings Corp. | 986,409 | 21,563 |
| *,^ | St. Joe Co. | 1,163,187 | 21,531 |
| | Northwest Bancshares Inc. | 1,607,352 | 21,522 |
| | Independent Bank Corp. | 460,996 | 21,446 |
| | Empire State Realty Trust Inc. | 1,172,196 | 21,182 |
| | Talmer Bancorp Inc. Class A | 1,143,703 | 20,712 |
| | Provident Financial Services Inc. | 1,021,621 | 20,586 |
| *,^ | BofI Holding Inc. | 971,598 | 20,452 |
| | Park National Corp. | 225,414 | 20,395 |
| * | Beneficial Bancorp Inc. | 1,524,340 | 20,304 |
| | PennyMac Mortgage Investment Trust | 1,326,931 | 20,249 |
| | CYS Investments Inc. | 2,836,947 | 20,227 |
| | Rexford Industrial Realty Inc. | 1,229,149 | 20,109 |
| | Union Bankshares Corp. | 794,185 | 20,045 |
| | BNC Bancorp | 783,869 | 19,895 |
| | HFF Inc. Class A | 640,064 | 19,887 |
20
| | |
| Vanguard® Total Stock Market Index Fund | | |
| Schedule of Investments | | |
| December 31, 2015 | | |
| |
| | | Market |
| | | Value |
| | Shares | ($000) |
| Redwood Trust Inc. | 1,505,430 | 19,872 |
| LegacyTexas Financial Group Inc. | 781,767 | 19,560 |
| WesBanco Inc. | 651,318 | 19,553 |
| Government Properties Income Trust | 1,225,240 | 19,445 |
| First Financial Bancorp | 1,050,577 | 18,984 |
| ServisFirst Bancshares Inc. | 393,383 | 18,697 |
| * MBIA Inc. | 2,876,974 | 18,643 |
| United Community Banks Inc. | 949,540 | 18,507 |
| * iStar Inc. | 1,526,614 | 17,907 |
| * Navigators Group Inc. | 208,556 | 17,892 |
| Ameris Bancorp | 526,354 | 17,891 |
| Apollo Commercial Real Estate Finance Inc. | 1,035,716 | 17,845 |
| Virtus Investment Partners Inc. | 151,860 | 17,837 |
| First Merchants Corp. | 701,688 | 17,837 |
| Hersha Hospitality Trust Class A | 816,225 | 17,761 |
| Summit Hotel Properties Inc. | 1,471,930 | 17,590 |
| * First Cash Financial Services Inc. | 468,088 | 17,521 |
| ^ Seritage Growth Properties Class A | 435,524 | 17,517 |
| Franklin Street Properties Corp. | 1,680,734 | 17,396 |
| Terreno Realty Corp. | 765,536 | 17,316 |
| ARMOUR Residential REIT Inc. | 788,742 | 17,163 |
| FelCor Lodging Trust Inc. | 2,336,712 | 17,058 |
| AMERISAFE Inc. | 325,810 | 16,584 |
| NRG Yield Inc. | 1,112,519 | 16,421 |
| Inland Real Estate Corp. | 1,543,585 | 16,393 |
| * Third Point Reinsurance Ltd. | 1,215,752 | 16,303 |
| Boston Private Financial Holdings Inc. | 1,414,360 | 16,039 |
| WSFS Financial Corp. | 490,950 | 15,887 |
| Infinity Property & Casualty Corp. | 193,111 | 15,880 |
| * FNFV Group | 1,408,932 | 15,822 |
| Towne Bank | 755,258 | 15,762 |
| * HealthEquity Inc. | 618,548 | 15,507 |
| Investors Real Estate Trust | 2,230,165 | 15,500 |
| Berkshire Hills Bancorp Inc. | 526,767 | 15,334 |
| National Bank Holdings Corp. Class A | 714,297 | 15,265 |
| New Senior Investment Group Inc. | 1,544,545 | 15,229 |
| Capital Bank Financial Corp. | 471,736 | 15,086 |
| First Commonwealth Financial Corp. | 1,660,161 | 15,058 |
| Lakeland Financial Corp. | 322,561 | 15,038 |
| Cash America International Inc. | 493,420 | 14,778 |
| Capstead Mortgage Corp. | 1,690,254 | 14,773 |
| Wilshire Bancorp Inc. | 1,276,478 | 14,743 |
| Starwood Waypoint Residential Trust | 647,963 | 14,670 |
| Maiden Holdings Ltd. | 983,228 | 14,660 |
| Employers Holdings Inc. | 534,143 | 14,582 |
| Alexander's Inc. | 37,594 | 14,440 |
| Tompkins Financial Corp. | 255,689 | 14,359 |
| Tier REIT Inc. | 964,914 | 14,232 |
| Greenhill & Co. Inc. | 487,566 | 13,949 |
| Brookline Bancorp Inc. | 1,210,183 | 13,917 |
| Northfield Bancorp Inc. | 871,427 | 13,873 |
| * Walker & Dunlop Inc. | 481,438 | 13,870 |
| Safety Insurance Group Inc. | 244,721 | 13,797 |
| Chatham Lodging Trust | 664,523 | 13,609 |
| Stewart Information Services Corp. | 363,593 | 13,573 |
| ^ Universal Insurance Holdings Inc. | 575,264 | 13,335 |
| * KCG Holdings Inc. Class A | 1,081,622 | 13,315 |
| Hanmi Financial Corp. | 560,242 | 13,289 |
| Cardinal Financial Corp. | 580,539 | 13,207 |
| City Holding Co. | 287,914 | 13,140 |
| * Green Dot Corp. Class A | 795,882 | 13,068 |
| Nelnet Inc. Class A | 386,475 | 12,974 |
| Meridian Bancorp Inc. | 917,049 | 12,930 |
| State Bank Financial Corp. | 609,473 | 12,817 |
21
| | | |
| Vanguard® Total Stock Market Index Fund | | |
| Schedule of Investments | | |
| December 31, 2015 | | |
| |
| | | | Market |
| | | | Value |
| | | Shares | ($000) |
| | Agree Realty Corp. | 374,719 | 12,737 |
| * | Encore Capital Group Inc. | 434,664 | 12,640 |
| * | Black Knight Financial Services Inc. Class A | 380,691 | 12,586 |
| | CenterState Banks Inc. | 798,736 | 12,500 |
| * | Ocwen Financial Corp. | 1,782,861 | 12,427 |
| * | Pacific Premier Bancorp Inc. | 582,678 | 12,382 |
| | American Capital Mortgage Investment Corp. | 885,471 | 12,361 |
| | United Fire Group Inc. | 321,720 | 12,325 |
| | Universal Health Realty Income Trust | 246,177 | 12,311 |
| | InfraREIT Inc. | 660,598 | 12,221 |
| | Altisource Residential Corp. | 981,321 | 12,178 |
| * | LendingTree Inc. | 135,951 | 12,138 |
| | Hannon Armstrong Sustainable Infrastructure Capital Inc. | 640,771 | 12,123 |
| * | Customers Bancorp Inc. | 437,200 | 11,901 |
| | Central Pacific Financial Corp. | 535,959 | 11,802 |
| | FBL Financial Group Inc. Class A | 185,357 | 11,796 |
| | First Potomac Realty Trust | 1,028,979 | 11,730 |
| | Heartland Financial USA Inc. | 373,410 | 11,710 |
| | Sandy Spring Bancorp Inc. | 429,396 | 11,577 |
| | Oritani Financial Corp. | 697,676 | 11,512 |
| | MainSource Financial Group Inc. | 501,492 | 11,474 |
| | Saul Centers Inc. | 221,619 | 11,362 |
| | RE/MAX Holdings Inc. Class A | 303,045 | 11,304 |
| | United Financial Bancorp Inc. | 877,161 | 11,298 |
| * | Piper Jaffray Cos. | 276,583 | 11,174 |
| | Diamond Hill Investment Group Inc. | 58,828 | 11,118 |
| | First Interstate BancSystem Inc. Class A | 378,751 | 11,010 |
| | Heritage Commerce Corp. | 902,835 | 10,798 |
| | Cohen & Steers Inc. | 351,801 | 10,723 |
| | American Residential Properties Inc. | 564,193 | 10,663 |
| | Yadkin Financial Corp. | 421,795 | 10,617 |
| | Flushing Financial Corp. | 488,489 | 10,571 |
| | Opus Bank | 282,742 | 10,453 |
| | Ashford Hospitality Trust Inc. | 1,644,892 | 10,379 |
| *,^ | Nationstar Mortgage Holdings Inc. | 775,676 | 10,371 |
| | Community Trust Bancorp Inc. | 291,171 | 10,179 |
| ^ | New York Mortgage Trust Inc. | 1,898,075 | 10,117 |
| * | Greenlight Capital Re Ltd. Class A | 537,893 | 10,064 |
| | Southside Bancshares Inc. | 417,110 | 10,019 |
| | Urstadt Biddle Properties Inc. Class A | 520,127 | 10,007 |
| | Monmouth Real Estate Investment Corp. | 956,491 | 10,005 |
| | Virtu Financial Inc. Class A | 441,536 | 9,996 |
| | TriCo Bancshares | 363,998 | 9,988 |
| | TrustCo Bank Corp. NY | 1,626,538 | 9,987 |
| | Investment Technology Group Inc. | 581,600 | 9,899 |
| | Bridge Bancorp Inc. | 325,132 | 9,894 |
| | Silver Bay Realty Trust Corp. | 626,703 | 9,814 |
| | Cedar Realty Trust Inc. | 1,378,908 | 9,763 |
| | Rouse Properties Inc. | 666,348 | 9,702 |
| | 1st Source Corp. | 313,162 | 9,667 |
| | Anworth Mortgage Asset Corp. | 2,213,554 | 9,629 |
| | National Western Life Group Inc. Class A | 38,151 | 9,612 |
| | Moelis & Co. Class A | 323,629 | 9,443 |
| | Heritage Insurance Holdings Inc. | 431,372 | 9,413 |
| | Washington Trust Bancorp Inc. | 237,326 | 9,379 |
| | Heritage Financial Corp. | 494,525 | 9,317 |
| * | First NBC Bank Holding Co. | 247,857 | 9,267 |
| *,^ | Walter Investment Management Corp. | 649,993 | 9,243 |
| | Dime Community Bancshares Inc. | 519,929 | 9,094 |
| | ConnectOne Bancorp Inc. | 479,470 | 8,961 |
| | CareTrust REIT Inc. | 806,015 | 8,826 |
| * | INTL. FCStone Inc. | 263,037 | 8,801 |
| | Banc of California Inc. | 592,872 | 8,668 |
| | First Busey Corp. | 415,127 | 8,564 |
22
| | | |
| Vanguard® Total Stock Market Index Fund | | |
| Schedule of Investments | | |
| December 31, 2015 | | |
| |
| | | | Market |
| | | | Value |
| | | Shares | ($000) |
| | NRG Yield Inc. Class A | 610,679 | 8,495 |
| | Enterprise Financial Services Corp. | 299,296 | 8,485 |
| * | WMIH Corp. | 3,260,272 | 8,444 |
| * | Flagstar Bancorp Inc. | 358,569 | 8,287 |
| | Stock Yards Bancorp Inc. | 219,008 | 8,276 |
| | Getty Realty Corp. | 481,922 | 8,265 |
| | CoBiz Financial Inc. | 615,139 | 8,255 |
| * | HomeStreet Inc. | 380,015 | 8,250 |
| * | Campus Crest Communities Inc. | 1,210,310 | 8,230 |
| | CatchMark Timber Trust Inc. Class A | 707,004 | 7,996 |
| * | Ambac Financial Group Inc. | 564,694 | 7,957 |
| | Winthrop Realty Trust | 610,401 | 7,917 |
| * | Marcus & Millichap Inc. | 270,404 | 7,880 |
| | Great Southern Bancorp Inc. | 174,050 | 7,878 |
| | BancFirst Corp. | 132,554 | 7,770 |
| | James River Group Holdings Ltd. | 230,910 | 7,745 |
| | Bank Mutual Corp. | 965,348 | 7,530 |
| | NewBridge Bancorp | 617,261 | 7,518 |
| | Preferred Apartment Communities Inc. Class A | 571,338 | 7,473 |
| ^ | Western Asset Mortgage Capital Corp. | 729,446 | 7,455 |
| *,^ | On Deck Capital Inc. | 705,422 | 7,266 |
| | Resource Capital Corp. | 565,960 | 7,222 |
| | Camden National Corp. | 163,470 | 7,207 |
| | First Financial Corp. | 212,035 | 7,203 |
| | Ladder Capital Corp. | 570,565 | 7,086 |
| | Ashford Hospitality Prime Inc. | 480,898 | 6,973 |
| * | NMI Holdings Inc. Class A | 1,019,255 | 6,900 |
| | Westwood Holdings Group Inc. | 131,472 | 6,848 |
| *,^ | Altisource Portfolio Solutions SA | 245,969 | 6,840 |
| * | HomeTrust Bancshares Inc. | 337,097 | 6,826 |
| * | First Foundation Inc. | 288,580 | 6,808 |
| * | First BanCorp | 2,088,949 | 6,789 |
| | Apollo Residential Mortgage Inc. | 560,981 | 6,704 |
| | Bryn Mawr Bank Corp. | 232,630 | 6,681 |
| * | Del Taco Restaurants Inc. | 625,400 | 6,661 |
| * | CU Bancorp | 262,546 | 6,658 |
| | National Storage Affiliates Trust | 388,553 | 6,656 |
| | Stonegate Bank | 202,361 | 6,650 |
| | Waterstone Financial Inc. | 471,058 | 6,642 |
| | Preferred Bank | 200,420 | 6,618 |
| * | Cowen Group Inc. Class A | 1,723,132 | 6,600 |
| | Federated National Holding Co. | 222,595 | 6,580 |
| | Armada Hoffler Properties Inc. | 625,383 | 6,554 |
| * | Anchor BanCorp Wisconsin Inc. | 149,439 | 6,504 |
| | Metro Bancorp Inc. | 206,687 | 6,486 |
| | Fidelity Southern Corp. | 290,304 | 6,477 |
| | State National Cos. Inc. | 650,765 | 6,384 |
| * | Triumph Bancorp Inc. | 386,881 | 6,384 |
| * | Forestar Group Inc. | 583,496 | 6,383 |
| | Financial Institutions Inc. | 226,057 | 6,330 |
| * | Tejon Ranch Co. | 328,059 | 6,282 |
| * | Seacoast Banking Corp. of Florida | 416,525 | 6,240 |
| | Independent Bank Corp. | 406,582 | 6,192 |
| | AG Mortgage Investment Trust Inc. | 482,053 | 6,190 |
| ^ | United Development Funding IV | 553,167 | 6,085 |
| | Independence Realty Trust Inc. | 806,075 | 6,054 |
| | Blue Hills Bancorp Inc. | 392,810 | 6,014 |
| | United Community Financial Corp. | 1,013,343 | 5,979 |
| | Lakeland Bancorp Inc. | 506,287 | 5,969 |
| | German American Bancorp Inc. | 176,860 | 5,893 |
| | Southwest Bancorp Inc. | 335,700 | 5,868 |
| | Fidelity & Guaranty Life | 230,572 | 5,850 |
| | EMC Insurance Group Inc. | 231,197 | 5,849 |
| * | Atlantic Capital Bancshares Inc. | 390,443 | 5,849 |
23
| | | |
| Vanguard® Total Stock Market Index Fund | | |
| Schedule of Investments | | |
| December 31, 2015 | | |
| |
| | | | Market |
| | | | Value |
| | | Shares | ($000) |
| | West Bancorporation Inc. | 295,741 | 5,841 |
| | QCR Holdings Inc. | 239,488 | 5,817 |
| | OFG Bancorp | 783,644 | 5,736 |
| | One Liberty Properties Inc. | 265,789 | 5,704 |
| | Independent Bank Group Inc. | 177,410 | 5,677 |
| | Meta Financial Group Inc. | 123,306 | 5,663 |
| | Dynex Capital Inc. | 890,813 | 5,657 |
| | Peoples Bancorp Inc. | 297,170 | 5,599 |
| | HCI Group Inc. | 160,352 | 5,588 |
| | Mercantile Bank Corp. | 223,978 | 5,496 |
| | NexPoint Residential Trust Inc. | 418,055 | 5,472 |
| | Arlington Asset Investment Corp. Class A | 413,395 | 5,469 |
| | Whitestone REIT | 454,416 | 5,458 |
| | First Defiance Financial Corp. | 143,156 | 5,408 |
| | Kearny Financial Corp. | 424,483 | 5,378 |
| | Prudential Bancorp Inc. | 354,077 | 5,368 |
| | First Bancorp | 279,699 | 5,242 |
| * | Franklin Financial Network Inc. | 166,949 | 5,239 |
| | United Insurance Holdings Corp. | 306,171 | 5,236 |
| * | TriState Capital Holdings Inc. | 373,844 | 5,230 |
| * | PennyMac Financial Services Inc. Class A | 339,342 | 5,212 |
| | First of Long Island Corp. | 173,690 | 5,211 |
| | Arrow Financial Corp. | 190,991 | 5,189 |
| * | Green Bancorp Inc. | 493,130 | 5,168 |
| | Ares Commercial Real Estate Corp. | 449,212 | 5,139 |
| * | Safeguard Scientifics Inc. | 353,585 | 5,131 |
| | State Auto Financial Corp. | 246,676 | 5,079 |
| | First Connecticut Bancorp Inc. | 283,698 | 4,939 |
| | Univest Corp. of Pennsylvania | 236,037 | 4,924 |
| | Charter Financial Corp. | 371,930 | 4,913 |
| | Easterly Government Properties Inc. | 285,535 | 4,905 |
| * | Ladenburg Thalmann Financial Services Inc. | 1,773,604 | 4,895 |
| | OneBeacon Insurance Group Ltd. Class A | 388,427 | 4,820 |
| | Newcastle Investment Corp. | 1,159,643 | 4,731 |
| | Horizon Bancorp | 169,107 | 4,728 |
| | Gladstone Commercial Corp. | 323,934 | 4,726 |
| | Suffolk Bancorp | 164,229 | 4,656 |
| ^ | Peoples Financial Services Corp. | 121,669 | 4,633 |
| *,^ | Citizens Inc. Class A | 619,412 | 4,602 |
| | Consolidated-Tomoka Land Co. | 87,122 | 4,592 |
| | GAIN Capital Holdings Inc. | 565,801 | 4,589 |
| | First Community Bancshares Inc. | 245,292 | 4,570 |
| | RAIT Financial Trust | 1,686,759 | 4,554 |
| | UMH Properties Inc. | 446,383 | 4,517 |
| | Peapack Gladstone Financial Corp. | 216,221 | 4,458 |
| * | EZCORP Inc. Class A | 881,706 | 4,400 |
| | Park Sterling Corp. | 600,468 | 4,395 |
| | ZAIS Financial Corp. | 290,581 | 4,382 |
| * | World Acceptance Corp. | 117,751 | 4,369 |
| | Arbor Realty Trust Inc. | 605,587 | 4,330 |
| | Bank of Marin Bancorp | 80,364 | 4,291 |
| * | PICO Holdings Inc. | 414,379 | 4,276 |
| * | First Northwest Bancorp | 301,846 | 4,271 |
| | Houlihan Lokey Inc. | 161,454 | 4,232 |
| * | Bancorp Inc. | 648,583 | 4,131 |
| | Reis Inc. | 173,327 | 4,113 |
| | Federal Agricultural Mortgage Corp. | 129,190 | 4,079 |
| * | FRP Holdings Inc. | 119,852 | 4,068 |
| | OceanFirst Financial Corp. | 201,519 | 4,036 |
| | Cherry Hill Mortgage Investment Corp. | 301,492 | 3,919 |
| | Baldwin & Lyons Inc. | 161,081 | 3,871 |
| * | Phoenix Cos. Inc. | 104,501 | 3,871 |
| | Clifton Bancorp Inc. | 267,254 | 3,832 |
| | Tiptree Financial Inc. Class A | 622,227 | 3,820 |
24
| | | |
| Vanguard® Total Stock Market Index Fund | | |
| Schedule of Investments | | |
| December 31, 2015 | | |
| |
| | | | Market |
| | | | Value |
| | | Shares | ($000) |
| | Guaranty Bancorp | 230,124 | 3,806 |
| | Republic Bancorp Inc. Class A | 141,050 | 3,725 |
| ^ | Orchid Island Capital Inc. | 374,028 | 3,714 |
| | Territorial Bancorp Inc. | 132,776 | 3,683 |
| | Heritage Oaks Bancorp | 454,038 | 3,637 |
| | Bluerock Residential Growth REIT Inc. Class A | 303,137 | 3,592 |
| | Ellington Residential Mortgage REIT | 290,777 | 3,591 |
| | Pacific Continental Corp. | 240,884 | 3,584 |
| *,^ | CorEnergy Infrastructure Trust Inc. | 241,424 | 3,583 |
| | Investar Holding Corp. | 203,421 | 3,580 |
| * | Global Indemnity plc | 122,407 | 3,552 |
| | Westfield Financial Inc. | 415,733 | 3,492 |
| | ESSA Bancorp Inc. | 252,258 | 3,451 |
| * | MoneyGram International Inc. | 547,471 | 3,433 |
| | CNB Financial Corp. | 189,417 | 3,415 |
| * | NewStar Financial Inc. | 380,250 | 3,415 |
| | Citizens & Northern Corp. | 161,906 | 3,400 |
| | Southern National Bancorp of Virginia Inc. | 258,700 | 3,379 |
| * | National Commerce Corp. | 133,060 | 3,333 |
| * | Associated Capital Group Inc. Class A | 108,856 | 3,320 |
| * | Sun Bancorp Inc. | 160,401 | 3,311 |
| * | Cascade Bancorp | 545,291 | 3,310 |
| * | C1 Financial Inc. | 136,246 | 3,299 |
| | National Interstate Corp. | 122,886 | 3,281 |
| | City Office REIT Inc. | 267,545 | 3,259 |
| | National Bankshares Inc. | 91,093 | 3,237 |
| * | Old Second Bancorp Inc. | 412,781 | 3,236 |
| | Calamos Asset Management Inc. Class A | 330,422 | 3,198 |
| | Great Ajax Corp. | 262,672 | 3,184 |
| | BankFinancial Corp. | 249,742 | 3,154 |
| * | Southern First Bancshares Inc. | 137,887 | 3,116 |
| | Owens Realty Mortgage Inc. | 231,509 | 3,109 |
| * | Regional Management Corp. | 200,718 | 3,105 |
| * | Enova International Inc. | 468,830 | 3,099 |
| * | CommunityOne Bancorp | 225,141 | 3,033 |
| * | Farmers Capital Bank Corp. | 111,552 | 3,024 |
| * | eHealth Inc. | 295,368 | 2,948 |
| *,^ | CPI Card Group Inc. | 275,003 | 2,932 |
| | Macatawa Bank Corp. | 476,968 | 2,886 |
| | Sierra Bancorp | 162,405 | 2,866 |
| * | Atlas Financial Holdings Inc. | 143,307 | 2,852 |
| *,^ | Hemisphere Media Group Inc. Class A | 193,265 | 2,851 |
| * | BSB Bancorp Inc. | 120,857 | 2,827 |
| | Provident Financial Holdings Inc. | 149,165 | 2,818 |
| | Pzena Investment Management Inc. Class A | 325,258 | 2,797 |
| | First Financial Northwest Inc. | 199,551 | 2,786 |
| | MidWestOne Financial Group Inc. | 91,437 | 2,781 |
| | Fox Chase Bancorp Inc. | 136,431 | 2,768 |
| | Community Healthcare Trust Inc. | 149,247 | 2,751 |
| * | Entegra Financial Corp. | 144,122 | 2,747 |
| | Ames National Corp. | 112,988 | 2,744 |
| | First Bancorp Inc. | 131,912 | 2,700 |
| | Donegal Group Inc. Class A | 191,748 | 2,700 |
| *,^ | Ohr Pharmaceutical Inc. | 435,204 | 2,672 |
| | MidSouth Bancorp Inc. | 293,501 | 2,665 |
| | American National Bankshares Inc. | 103,500 | 2,651 |
| | Oppenheimer Holdings Inc. Class A | 151,744 | 2,637 |
| | Farmland Partners Inc. | 239,672 | 2,629 |
| | Manning & Napier Inc. | 301,038 | 2,556 |
| | Bar Harbor Bankshares | 74,164 | 2,553 |
| | First Business Financial Services Inc. | 100,666 | 2,518 |
| | FBR & Co. | 125,966 | 2,507 |
| ^ | JAVELIN Mortgage Investment Corp. | 399,722 | 2,506 |
| | Marlin Business Services Corp. | 155,534 | 2,498 |
25
| | | |
| Vanguard® Total Stock Market Index Fund | | |
| Schedule of Investments | | |
| December 31, 2015 | | |
| |
| | | | Market |
| | | | Value |
| | | Shares | ($000) |
| | Penns Woods Bancorp Inc. | 58,050 | 2,465 |
| | GAMCO Investors Inc. Class A | 78,746 | 2,444 |
| * | Kansas City Life Insurance Co. | 63,502 | 2,431 |
| | Capital City Bank Group Inc. | 153,843 | 2,361 |
| | Jernigan Capital Inc. | 157,394 | 2,353 |
| * | Republic First Bancorp Inc. | 534,080 | 2,313 |
| | Monarch Financial Holdings Inc. | 127,241 | 2,289 |
| | Northrim BanCorp Inc. | 85,717 | 2,280 |
| | Home Bancorp Inc. | 86,917 | 2,258 |
| | Cape Bancorp Inc. | 179,168 | 2,227 |
| * | Hallmark Financial Services Inc. | 184,502 | 2,157 |
| | Merchants Bancshares Inc. | 68,100 | 2,144 |
| | Hingham Institution for Savings | 17,894 | 2,144 |
| | C&F Financial Corp. | 54,712 | 2,134 |
| | Silvercrest Asset Management Group Inc. Class A | 176,868 | 2,103 |
| | Pulaski Financial Corp. | 128,630 | 2,053 |
| | County Bancorp Inc. | 100,841 | 2,046 |
| ^ | Wheeler REIT Inc. | 1,047,163 | 2,021 |
| | SI Financial Group Inc. | 147,248 | 2,010 |
| | Investors Title Co. | 20,745 | 2,008 |
| * | Malvern Bancorp Inc. | 113,788 | 1,998 |
| | Enterprise Bancorp Inc. | 86,568 | 1,978 |
| | MutualFirst Financial Inc. | 79,243 | 1,975 |
| | Central Valley Community Bancorp | 158,873 | 1,964 |
| *,^ | Impac Mortgage Holdings Inc. | 108,621 | 1,955 |
| * | American Farmland Co. | 277,601 | 1,954 |
| | Sotherly Hotels Inc. | 316,777 | 1,951 |
| * | AV Homes Inc. | 149,431 | 1,914 |
| | Century Bancorp Inc. Class A | 44,025 | 1,913 |
| * | Bear State Financial Inc. | 174,664 | 1,892 |
| | Old Line Bancshares Inc. | 105,897 | 1,861 |
| * | Consumer Portfolio Services Inc. | 358,404 | 1,860 |
| | Blue Capital Reinsurance Holdings Ltd. | 107,626 | 1,846 |
| * | RMR Group Inc. Class A | 127,910 | 1,843 |
| | HF Financial Corp. | 95,631 | 1,806 |
| * | Hampton Roads Bankshares Inc. | 974,850 | 1,794 |
| * | Steel Excel Inc. | 121,400 | 1,786 |
| | Access National Corp. | 85,934 | 1,758 |
| | First Internet Bancorp | 61,215 | 1,756 |
| * | Emergent Capital Inc. | 459,330 | 1,695 |
| | Resource America Inc. Class A | 275,524 | 1,689 |
| * | Veritex Holdings Inc. | 101,430 | 1,644 |
| | Ameriana Bancorp | 68,369 | 1,567 |
| | Middleburg Financial Corp. | 83,887 | 1,550 |
| ^ | FXCM Inc. Class A | 91,929 | 1,538 |
| *,^ | Stonegate Mortgage Corp. | 275,084 | 1,499 |
| * | ASB Bancorp Inc. | 58,307 | 1,499 |
| * | Asta Funding Inc. | 187,680 | 1,492 |
| * | Ashford Inc. | 27,884 | 1,485 |
| * | Southcoast Financial Corp. | 95,214 | 1,481 |
| | Five Oaks Investment Corp. | 271,157 | 1,481 |
| | Cheviot Financial Corp. | 96,189 | 1,475 |
| | Baylake Corp. | 100,569 | 1,469 |
| * | Jason Industries Inc. | 381,213 | 1,441 |
| | Independence Holding Co. | 103,421 | 1,432 |
| | Premier Financial Bancorp Inc. | 85,897 | 1,412 |
| | Chemung Financial Corp. | 47,686 | 1,319 |
| * | Howard Bancorp Inc. | 95,866 | 1,266 |
| * | Nicholas Financial Inc. | 107,564 | 1,253 |
| * | Westbury Bancorp Inc. | 69,724 | 1,238 |
| | Gladstone Land Corp. | 140,106 | 1,212 |
| | HopFed Bancorp Inc. | 95,055 | 1,140 |
| * | UCP Inc. | 156,732 | 1,128 |
| | Urstadt Biddle Properties Inc. | 63,312 | 1,127 |
26
| | | |
| Vanguard® Total Stock Market Index Fund | | |
| Schedule of Investments | | |
| December 31, 2015 | | |
| |
| | | | Market |
| | | | Value |
| | | Shares | ($000) |
| | FS Bancorp Inc. | 43,203 | 1,114 |
| * | American River Bankshares | 102,892 | 1,089 |
| * | Performant Financial Corp. | 607,474 | 1,087 |
| * | Atlantic Coast Financial Corp. | 182,552 | 1,070 |
| | Northeast Bancorp | 99,071 | 1,040 |
| * | Naugatuck Valley Financial Corp. | 94,777 | 1,038 |
| | Federal Agricultural Mortgage Corp. Class A | 38,986 | 1,033 |
| * | Maui Land & Pineapple Co. Inc. | 183,834 | 1,004 |
| *,^ | 22nd Century Group Inc. | 685,715 | 960 |
| * | Coastway Bancorp Inc. | 69,446 | 913 |
| | Timberland Bancorp Inc. | 73,350 | 910 |
| | Medley Management Inc. Class A | 159,760 | 909 |
| * | Connecture Inc. | 250,120 | 903 |
| | Eastern Virginia Bankshares Inc. | 125,374 | 900 |
| * | First Acceptance Corp. | 371,196 | 883 |
| | River Valley Bancorp | 23,724 | 841 |
| * | BRT Realty Trust | 131,617 | 834 |
| | AmeriServ Financial Inc. | 260,540 | 834 |
| | CB Financial Services Inc. | 36,136 | 828 |
| *,^ | Health Insurance Innovations Inc. Class A | 119,568 | 801 |
| * | Security National Financial Corp. Class A | 117,672 | 771 |
| * | First United Corp. | 66,348 | 770 |
| | Bankwell Financial Group Inc. | 38,361 | 761 |
| | First Capital Bancorp Inc. | 134,352 | 747 |
| * | Hamilton Bancorp Inc. | 51,930 | 741 |
| * | Carolina Bank Holdings Inc. | 38,934 | 718 |
| * | Avenue Financial Holdings Inc. | 47,482 | 697 |
| | Hennessy Advisors Inc. | 22,997 | 689 |
| | First Bancshares Inc. | 37,481 | 687 |
| * | 1347 Property Insurance Holdings Inc. | 86,788 | 664 |
| | Fifth Street Asset Management Inc. | 199,952 | 652 |
| * | First Bank | 82,347 | 544 |
| | Kingstone Cos. Inc. | 58,974 | 531 |
| *,^ | Jacksonville Bancorp Inc. | 28,010 | 525 |
| * | JG Wentworth Co. Class A | 291,315 | 524 |
| * | First Marblehead Corp. | 120,617 | 508 |
| | Ocean Shore Holding Co. | 29,568 | 507 |
| * | Allegiance Bancshares Inc. | 21,054 | 498 |
| | Chicopee Bancorp Inc. | 26,693 | 463 |
| | Salisbury Bancorp Inc. | 13,251 | 443 |
| | United Bancorp Inc. | 46,010 | 442 |
| | Community West Bancshares | 59,145 | 420 |
| | NorthStar Realty Europe Corp. | 34,903 | 412 |
| *,^ | Intersections Inc. | 137,800 | 395 |
| | Landmark Bancorp Inc. | 14,421 | 379 |
| * | Royal Bancshares of Pennsylvania Inc. | 180,890 | 378 |
| | California First National Bancorp | 28,965 | 377 |
| | United Community Bancorp | 24,354 | 364 |
| * | Atlanticus Holdings Corp. | 108,773 | 348 |
| | People's Utah Bancorp | 19,791 | 341 |
| *,^ | Altisource Asset Management Corp. | 19,195 | 329 |
| | Manhattan Bridge Capital Inc. | 71,654 | 317 |
| | Eagle Bancorp Montana Inc. | 25,338 | 313 |
| *,^ | RCS Capital Corp. Class A | 965,979 | 294 |
| | US Global Investors Inc. Class A | 231,835 | 271 |
| | First Savings Financial Group Inc. | 7,388 | 269 |
| | IF Bancorp Inc. | 13,647 | 252 |
| * | Provident Bancorp Inc. | 18,153 | 239 |
| | Pathfinder Bancorp Inc. | 14,872 | 192 |
| | Summit State Bank | 13,701 | 187 |
| | Parke Bancorp Inc. | 13,912 | 174 |
| * | InterGroup Corp. | 6,184 | 158 |
| | Institutional Financial Markets Inc. | 124,173 | 144 |
| | WVS Financial Corp. | 11,313 | 139 |
27
| | |
| Vanguard® Total Stock Market Index Fund | | |
| Schedule of Investments | | |
| December 31, 2015 | | |
| |
| | | Market |
| | | Value |
| | Shares | ($000) |
| QC Holdings Inc. | 83,632 | 122 |
| * National Holdings Corp. | 37,954 | 107 |
| * Conifer Holdings Inc. | 11,145 | 103 |
| * Income Opportunity Realty Investors Inc. | 12,550 | 93 |
| Unity Bancorp Inc. | 7,242 | 91 |
| * Polonia Bancorp Inc. | 7,462 | 86 |
| * Sunshine Bancorp Inc. | 5,288 | 80 |
| CIFC Corp. | 13,144 | 73 |
| Atlantic American Corp. | 11,780 | 59 |
| * CVSL Inc. | 51,533 | 51 |
| Two River Bancorp | 4,825 | 48 |
| Citizens First Corp. | 3,499 | 48 |
| United Bancshares Inc. | 2,200 | 40 |
| * RMG Networks Holding Corp. | 50,792 | 38 |
| * JW Mays Inc. | 600 | 35 |
| * Vestin Realty Mortgage II Inc. | 12,810 | 33 |
| * Anchor Bancorp Inc. | 1,000 | 26 |
| * Cordia Bancorp Inc. | 5,680 | 22 |
| Home Federal Bancorp Inc. | 980 | 22 |
| Sussex Bancorp | 1,550 | 20 |
| * ZAIS Group Holdings Inc. | 2,192 | 20 |
| Southwest Georgia Financial Corp. | 1,200 | 19 |
| * Melrose Bancorp Inc. | 1,100 | 17 |
| * Unico American Corp. | 1,200 | 12 |
| * ITUS Corp. | 3,555 | 11 |
| * Prism Technologies Group Inc. | 8,626 | 9 |
| * Tejon Ranch Co. Warrants Exp. 08/31/2016 | 33,339 | — |
| | | 77,555,749 |
| Health Care (14.0%) | | |
| Johnson & Johnson | 50,733,121 | 5,211,306 |
| Pfizer Inc. | 113,180,468 | 3,653,465 |
| Merck & Co. Inc. | 51,221,217 | 2,705,505 |
| Gilead Sciences Inc. | 26,426,025 | 2,674,049 |
| * Allergan plc | 7,225,025 | 2,257,820 |
| Amgen Inc. | 13,901,042 | 2,256,556 |
| Bristol-Myers Squibb Co. | 30,580,497 | 2,103,632 |
| UnitedHealth Group Inc. | 17,475,043 | 2,055,764 |
| Medtronic plc | 25,931,450 | 1,994,647 |
| * Celgene Corp. | 14,402,865 | 1,724,887 |
| AbbVie Inc. | 28,470,169 | 1,686,573 |
| Eli Lilly & Co. | 18,279,233 | 1,540,208 |
| * Biogen Inc. | 4,086,058 | 1,251,764 |
| Abbott Laboratories | 27,366,182 | 1,229,015 |
| * Express Scripts Holding Co. | 12,401,484 | 1,084,014 |
| Thermo Fisher Scientific Inc. | 7,329,041 | 1,039,624 |
| * Regeneron Pharmaceuticals Inc. | 1,403,975 | 762,176 |
| * Alexion Pharmaceuticals Inc. | 3,922,621 | 748,240 |
| Aetna Inc. | 6,390,085 | 690,896 |
| Cigna Corp. | 4,719,304 | 690,576 |
| Anthem Inc. | 4,780,138 | 666,542 |
| Becton Dickinson and Co. | 3,863,842 | 595,379 |
| * Vertex Pharmaceuticals Inc. | 4,503,682 | 566,698 |
| * Illumina Inc. | 2,684,211 | 515,221 |
| Stryker Corp. | 5,510,254 | 512,123 |
| Humana Inc. | 2,713,921 | 484,462 |
| * Boston Scientific Corp. | 24,644,073 | 454,437 |
| * HCA Holdings Inc. | 6,001,714 | 405,896 |
| Zoetis Inc. | 8,197,970 | 392,847 |
| * Mylan NV | 7,207,967 | 389,735 |
| Baxalta Inc. | 9,944,281 | 388,125 |
| Baxter International Inc. | 10,025,455 | 382,471 |
| * Intuitive Surgical Inc. | 684,797 | 374,009 |
| Perrigo Co. plc | 2,547,348 | 368,601 |
| * Incyte Corp. | 3,067,264 | 332,645 |
28
| | | |
| Vanguard® Total Stock Market Index Fund | | |
| Schedule of Investments | | |
| December 31, 2015 | | |
| |
| | | | Market |
| | | | Value |
| | | Shares | ($000) |
| | Zimmer Biomet Holdings Inc. | 3,173,511 | 325,570 |
| | St. Jude Medical Inc. | 5,179,864 | 319,960 |
| * | Edwards Lifesciences Corp. | 3,953,646 | 312,259 |
| * | BioMarin Pharmaceutical Inc. | 2,952,190 | 309,271 |
| | CR Bard Inc. | 1,352,479 | 256,214 |
| * | Endo International plc | 4,148,360 | 253,963 |
| * | Henry Schein Inc. | 1,517,597 | 240,069 |
| * | Laboratory Corp. of America Holdings | 1,847,630 | 228,441 |
| * | Alkermes plc | 2,743,461 | 217,776 |
| * | DaVita HealthCare Partners Inc. | 3,115,565 | 217,186 |
| | Universal Health Services Inc. Class B | 1,664,373 | 198,876 |
| * | Waters Corp. | 1,425,830 | 191,888 |
| | Quest Diagnostics Inc. | 2,613,472 | 185,922 |
| * | Hologic Inc. | 4,654,074 | 180,066 |
| * | Mallinckrodt plc | 2,133,085 | 159,192 |
| | DENTSPLY International Inc. | 2,559,080 | 155,720 |
| * | Jazz Pharmaceuticals plc | 1,081,606 | 152,031 |
| * | Medivation Inc. | 2,994,570 | 144,757 |
| * | Varian Medical Systems Inc. | 1,773,747 | 143,319 |
| | ResMed Inc. | 2,556,662 | 137,267 |
| * | Ionis Pharmaceuticals Inc. | 2,205,055 | 136,559 |
| * | Centene Corp. | 2,068,862 | 136,152 |
| * | Alnylam Pharmaceuticals Inc. | 1,326,002 | 124,830 |
| * | United Therapeutics Corp. | 791,549 | 123,964 |
| * | MEDNAX Inc. | 1,714,421 | 122,855 |
| * | IDEXX Laboratories Inc. | 1,664,159 | 121,350 |
| | Cooper Cos. Inc. | 890,131 | 119,456 |
| * | STERIS plc | 1,567,231 | 118,075 |
| * | DexCom Inc. | 1,414,422 | 115,841 |
| * | Sirona Dental Systems Inc. | 1,020,614 | 111,829 |
| * | Dyax Corp. | 2,693,690 | 101,337 |
| * | Quintiles Transnational Holdings Inc. | 1,462,539 | 100,418 |
| | Teleflex Inc. | 752,854 | 98,963 |
| * | Health Net Inc. | 1,327,842 | 90,904 |
| * | Neurocrine Biosciences Inc. | 1,587,190 | 89,787 |
| * | Envision Healthcare Holdings Inc. | 3,416,119 | 88,717 |
| * | Seattle Genetics Inc. | 1,841,442 | 82,644 |
| * | Align Technology Inc. | 1,233,804 | 81,246 |
| * | Anacor Pharmaceuticals Inc. | 690,780 | 78,037 |
| | West Pharmaceutical Services Inc. | 1,243,437 | 74,880 |
| * | Amsurg Corp. | 984,588 | 74,829 |
| | Patterson Cos. Inc. | 1,595,327 | 72,125 |
| * | Ultragenyx Pharmaceutical Inc. | 642,894 | 72,120 |
| * | Charles River Laboratories International Inc. | 847,564 | 68,136 |
| * | PAREXEL International Corp. | 994,409 | 67,739 |
| * | Acadia Healthcare Co. Inc. | 1,044,944 | 65,267 |
| * | ABIOMED Inc. | 706,357 | 63,770 |
| * | WellCare Health Plans Inc. | 803,356 | 62,830 |
| * | Brookdale Senior Living Inc. | 3,374,386 | 62,291 |
| * | Alere Inc. | 1,569,954 | 61,369 |
| | Bio-Techne Corp. | 678,367 | 61,053 |
| *,^ | OPKO Health Inc. | 6,016,612 | 60,467 |
| * | LifePoint Health Inc. | 798,405 | 58,603 |
| * | Team Health Holdings Inc. | 1,327,687 | 58,272 |
| * | Horizon Pharma plc | 2,634,163 | 57,082 |
| *,^ | Juno Therapeutics Inc. | 1,289,140 | 56,683 |
| * | Tenet Healthcare Corp. | 1,819,677 | 55,136 |
| *,^ | Myriad Genetics Inc. | 1,276,479 | 55,093 |
| * | Akorn Inc. | 1,458,115 | 54,402 |
| * | Community Health Systems Inc. | 2,049,124 | 54,363 |
| | HealthSouth Corp. | 1,558,883 | 54,265 |
| * | Impax Laboratories Inc. | 1,253,753 | 53,610 |
| * | ACADIA Pharmaceuticals Inc. | 1,482,360 | 52,846 |
| | Hill-Rom Holdings Inc. | 1,075,391 | 51,683 |
29
| | | |
| Vanguard® Total Stock Market Index Fund | | |
| Schedule of Investments | | |
| December 31, 2015 | | |
| |
| | | | Market |
| | | | Value |
| | | Shares | ($000) |
| * | Bio-Rad Laboratories Inc. Class A | 367,550 | 50,964 |
| * | Pacira Pharmaceuticals Inc. | 644,418 | 49,485 |
| * | Prestige Brands Holdings Inc. | 941,508 | 48,469 |
| * | Cepheid | 1,316,296 | 48,084 |
| * | NuVasive Inc. | 888,536 | 48,079 |
| * | Bruker Corp. | 1,977,764 | 48,000 |
| * | Molina Healthcare Inc. | 761,940 | 45,815 |
| * | Medicines Co. | 1,202,701 | 44,909 |
| * | Portola Pharmaceuticals Inc. | 858,683 | 44,179 |
| * | Intercept Pharmaceuticals Inc. | 291,012 | 43,463 |
| | Healthcare Services Group Inc. | 1,239,028 | 43,205 |
| *,^ | Kite Pharma Inc. | 698,567 | 43,046 |
| * | Catalent Inc. | 1,685,978 | 42,200 |
| * | Bluebird Bio Inc. | 643,668 | 41,336 |
| * | Nektar Therapeutics | 2,435,231 | 41,034 |
| | Owens & Minor Inc. | 1,135,780 | 40,865 |
| * | Wright Medical Group NV | 1,680,652 | 40,638 |
| * | Puma Biotechnology Inc. | 503,927 | 39,508 |
| * | Novavax Inc. | 4,689,152 | 39,342 |
| * | Insulet Corp. | 1,038,249 | 39,256 |
| * | Ophthotech Corp. | 483,976 | 38,007 |
| * | Integra LifeSciences Holdings Corp. | 557,711 | 37,802 |
| | Cantel Medical Corp. | 600,944 | 37,343 |
| * | Neogen Corp. | 645,099 | 36,461 |
| * | Radius Health Inc. | 592,098 | 36,438 |
| * | Masimo Corp. | 830,138 | 34,459 |
| * | Ligand Pharmaceuticals Inc. | 315,733 | 34,232 |
| * | Globus Medical Inc. | 1,227,034 | 34,136 |
| *,^ | Agios Pharmaceuticals Inc. | 519,987 | 33,758 |
| * | Acorda Therapeutics Inc. | 777,630 | 33,267 |
| * | Halozyme Therapeutics Inc. | 1,861,213 | 32,255 |
| * | Magellan Health Inc. | 489,241 | 30,167 |
| * | VWR Corp. | 1,064,485 | 30,136 |
| * | Haemonetics Corp. | 922,875 | 29,753 |
| *,^ | Intrexon Corp. | 974,595 | 29,384 |
| * | ICU Medical Inc. | 259,637 | 29,282 |
| *,^ | Sarepta Therapeutics Inc. | 741,967 | 28,625 |
| * | Celldex Therapeutics Inc. | 1,821,465 | 28,561 |
| * | Halyard Health Inc. | 847,531 | 28,316 |
| * | Intra-Cellular Therapies Inc. Class A | 517,090 | 27,814 |
| * | TESARO Inc. | 524,235 | 27,428 |
| * | FibroGen Inc. | 892,014 | 27,180 |
| * | Natus Medical Inc. | 563,072 | 27,056 |
| * | Air Methods Corp. | 642,839 | 26,954 |
| * | Ironwood Pharmaceuticals Inc. Class A | 2,266,013 | 26,263 |
| * | INC Research Holdings Inc. Class A | 533,095 | 25,860 |
| * | TherapeuticsMD Inc. | 2,435,219 | 25,253 |
| * | Emergent BioSolutions Inc. | 630,217 | 25,215 |
| * | Sage Therapeutics Inc. | 415,594 | 24,229 |
| *,^ | Exelixis Inc. | 4,118,507 | 23,228 |
| * | NxStage Medical Inc. | 1,034,902 | 22,675 |
| | Select Medical Holdings Corp. | 1,857,693 | 22,125 |
| | Abaxis Inc. | 390,511 | 21,744 |
| * | Clovis Oncology Inc. | 618,426 | 21,645 |
| * | ImmunoGen Inc. | 1,573,922 | 21,358 |
| * | Acceleron Pharma Inc. | 437,644 | 21,340 |
| * | Achillion Pharmaceuticals Inc. | 1,974,731 | 21,307 |
| * | Surgical Care Affiliates Inc. | 531,336 | 21,152 |
| * | Amedisys Inc. | 537,771 | 21,145 |
| * | Alder Biopharmaceuticals Inc. | 625,724 | 20,668 |
| * | Nevro Corp. | 305,728 | 20,640 |
| * | Amicus Therapeutics Inc. | 2,119,438 | 20,559 |
| * | Insmed Inc. | 1,130,354 | 20,516 |
| *,^ | Lannett Co. Inc. | 507,166 | 20,347 |
30
| | | |
| Vanguard® Total Stock Market Index Fund | | |
| Schedule of Investments | | |
| December 31, 2015 | | |
| |
| | | | Market |
| | | | Value |
| | | Shares | ($000) |
| * | Depomed Inc. | 1,121,912 | 20,340 |
| | CONMED Corp. | 448,618 | 19,762 |
| * | HMS Holdings Corp. | 1,579,406 | 19,490 |
| * | ARIAD Pharmaceuticals Inc. | 3,073,425 | 19,209 |
| * | Zeltiq Aesthetics Inc. | 671,256 | 19,151 |
| * | AMAG Pharmaceuticals Inc. | 626,116 | 18,902 |
| *,^ | Cempra Inc. | 607,177 | 18,901 |
| | Kindred Healthcare Inc. | 1,583,734 | 18,862 |
| * | Omnicell Inc. | 599,489 | 18,632 |
| * | PharMerica Corp. | 530,568 | 18,570 |
| | Ensign Group Inc. | 818,962 | 18,533 |
| *,^ | ZIOPHARM Oncology Inc. | 2,191,857 | 18,214 |
| | Analogic Corp. | 220,510 | 18,214 |
| * | Five Prime Therapeutics Inc. | 436,658 | 18,121 |
| * | PTC Therapeutics Inc. | 549,158 | 17,793 |
| *,^ | MiMedx Group Inc. | 1,883,199 | 17,646 |
| * | PRA Health Sciences Inc. | 385,804 | 17,465 |
| * | Dynavax Technologies Corp. | 716,498 | 17,311 |
| * | Momenta Pharmaceuticals Inc. | 1,161,671 | 17,239 |
| * | Cynosure Inc. Class A | 381,866 | 17,058 |
| * | MacroGenics Inc. | 533,323 | 16,517 |
| * | HeartWare International Inc. | 327,573 | 16,510 |
| *,^ | Exact Sciences Corp. | 1,746,174 | 16,117 |
| *,^ | Pacific Biosciences of California Inc. | 1,222,462 | 16,051 |
| * | Repligen Corp. | 563,887 | 15,952 |
| ^ | Theravance Inc. | 1,491,407 | 15,719 |
| *,^ | Eagle Pharmaceuticals Inc. | 172,434 | 15,290 |
| *,^ | Insys Therapeutics Inc. | 523,380 | 14,984 |
| *,^ | Heron Therapeutics Inc. | 557,671 | 14,890 |
| *,^ | Relypsa Inc. | 524,397 | 14,861 |
| *,^ | Merrimack Pharmaceuticals Inc. | 1,870,269 | 14,775 |
| * | Luminex Corp. | 689,348 | 14,745 |
| | Meridian Bioscience Inc. | 712,814 | 14,627 |
| * | NewLink Genetics Corp. | 400,395 | 14,570 |
| * | BioCryst Pharmaceuticals Inc. | 1,404,293 | 14,492 |
| *,^ | Spark Therapeutics Inc. | 315,240 | 14,284 |
| * | Affymetrix Inc. | 1,393,612 | 14,062 |
| * | Merit Medical Systems Inc. | 748,510 | 13,915 |
| *,^ | Geron Corp. | 2,839,865 | 13,745 |
| *,^ | Aduro Biotech Inc. | 471,946 | 13,281 |
| * | LHC Group Inc. | 284,019 | 12,863 |
| * | Inogen Inc. | 320,749 | 12,859 |
| * | Orthofix International NV | 318,405 | 12,485 |
| *,^ | Adeptus Health Inc. Class A | 218,967 | 11,938 |
| *,^ | Accelerate Diagnostics Inc. | 544,968 | 11,711 |
| * | Retrophin Inc. | 606,109 | 11,692 |
| * | Spectranetics Corp. | 772,782 | 11,638 |
| *,^ | Endologix Inc. | 1,152,584 | 11,411 |
| * | AtriCure Inc. | 505,275 | 11,338 |
| * | Sangamo BioSciences Inc. | 1,222,912 | 11,165 |
| | US Physical Therapy Inc. | 206,863 | 11,104 |
| * | Revance Therapeutics Inc. | 324,489 | 11,085 |
| * | Genomic Health Inc. | 314,161 | 11,058 |
| * | LDR Holding Corp. | 440,211 | 11,054 |
| * | Quidel Corp. | 520,616 | 11,037 |
| * | Supernus Pharmaceuticals Inc. | 815,185 | 10,956 |
| *,^ | Cerus Corp. | 1,730,614 | 10,937 |
| * | Array BioPharma Inc. | 2,550,098 | 10,761 |
| *,^ | Synergy Pharmaceuticals Inc. | 1,875,417 | 10,634 |
| * | HealthStream Inc. | 481,863 | 10,601 |
| * | Capital Senior Living Corp. | 497,461 | 10,377 |
| * | Aerie Pharmaceuticals Inc. | 422,430 | 10,286 |
| *,^ | Omeros Corp. | 652,315 | 10,261 |
| | PDL BioPharma Inc. | 2,896,267 | 10,253 |
31
| | | |
| Vanguard® Total Stock Market Index Fund | | |
| Schedule of Investments | | |
| December 31, 2015 | | |
| |
| | | | Market |
| | | | Value |
| | | Shares | ($000) |
| * | Dermira Inc. | 292,007 | 10,106 |
| | National HealthCare Corp. | 163,572 | 10,092 |
| *,^ | Lexicon Pharmaceuticals Inc. | 745,220 | 9,919 |
| * | Triple-S Management Corp. Class B | 414,116 | 9,901 |
| * | Vascular Solutions Inc. | 287,788 | 9,897 |
| * | Amphastar Pharmaceuticals Inc. | 695,030 | 9,890 |
| * | Hanger Inc. | 598,929 | 9,852 |
| * | Anika Therapeutics Inc. | 250,309 | 9,552 |
| | Invacare Corp. | 537,033 | 9,339 |
| | Atrion Corp. | 24,498 | 9,339 |
| * | CorVel Corp. | 211,601 | 9,294 |
| * | Mirati Therapeutics Inc. | 293,744 | 9,282 |
| * | Accuray Inc. | 1,358,816 | 9,172 |
| * | Blueprint Medicines Corp. | 340,865 | 8,978 |
| * | Enanta Pharmaceuticals Inc. | 270,949 | 8,947 |
| *,^ | Albany Molecular Research Inc. | 445,836 | 8,850 |
| * | K2M Group Holdings Inc. | 443,495 | 8,755 |
| * | Civitas Solutions Inc. | 301,189 | 8,671 |
| *,^ | Rockwell Medical Inc. | 839,802 | 8,600 |
| * | Bellicum Pharmaceuticals Inc. | 415,337 | 8,419 |
| * | Cardiovascular Systems Inc. | 555,733 | 8,403 |
| * | Arena Pharmaceuticals Inc. | 4,410,516 | 8,380 |
| * | Coherus Biosciences Inc. | 346,812 | 7,963 |
| * | Xencor Inc. | 536,520 | 7,844 |
| * | Otonomy Inc. | 277,261 | 7,694 |
| *,^ | Inovio Pharmaceuticals Inc. | 1,144,108 | 7,688 |
| * | Progenics Pharmaceuticals Inc. | 1,254,119 | 7,688 |
| * | Intersect ENT Inc. | 340,014 | 7,650 |
| *,^ | Theravance Biopharma Inc. | 460,010 | 7,540 |
| * | Atara Biotherapeutics Inc. | 285,353 | 7,536 |
| * | Raptor Pharmaceutical Corp. | 1,447,340 | 7,526 |
| * | SciClone Pharmaceuticals Inc. | 805,597 | 7,411 |
| *,^ | Keryx Biopharmaceuticals Inc. | 1,443,078 | 7,288 |
| * | TG Therapeutics Inc. | 610,297 | 7,281 |
| *,^ | MannKind Corp. | 5,017,167 | 7,275 |
| *,^ | Epizyme Inc. | 448,166 | 7,180 |
| *,^ | Spectrum Pharmaceuticals Inc. | 1,187,212 | 7,159 |
| * | Chimerix Inc. | 786,672 | 7,041 |
| * | Corcept Therapeutics Inc. | 1,405,492 | 6,999 |
| * | Healthways Inc. | 543,445 | 6,994 |
| | Universal American Corp. | 978,330 | 6,848 |
| * | Infinity Pharmaceuticals Inc. | 869,739 | 6,827 |
| *,^ | Vanda Pharmaceuticals Inc. | 729,027 | 6,787 |
| * | Surgery Partners Inc. | 328,645 | 6,734 |
| *,^ | Teligent Inc. | 756,216 | 6,730 |
| * | Trevena Inc. | 639,641 | 6,716 |
| *,^ | ANI Pharmaceuticals Inc. | 147,114 | 6,639 |
| *,^ | La Jolla Pharmaceutical Co. | 244,938 | 6,613 |
| * | NeoGenomics Inc. | 832,720 | 6,553 |
| * | Cytokinetics Inc. | 623,437 | 6,521 |
| * | Sagent Pharmaceuticals Inc. | 409,442 | 6,514 |
| *,^ | Arrowhead Research Corp. | 1,047,279 | 6,441 |
| * | Sucampo Pharmaceuticals Inc. Class A | 370,486 | 6,406 |
| * | OraSure Technologies Inc. | 979,501 | 6,308 |
| * | Ocata Therapeutics Inc. | 738,783 | 6,221 |
| * | Zogenix Inc. | 399,687 | 5,891 |
| * | Esperion Therapeutics Inc. | 260,312 | 5,795 |
| * | Curis Inc. | 1,980,613 | 5,764 |
| * | Cara Therapeutics Inc. | 341,738 | 5,762 |
| *,^ | Advaxis Inc. | 572,145 | 5,756 |
| * | XenoPort Inc. | 1,037,253 | 5,695 |
| * | Lion Biotechnologies Inc. | 736,490 | 5,686 |
| * | Agenus Inc. | 1,243,252 | 5,644 |
| * | AngioDynamics Inc. | 463,977 | 5,633 |
32
| | | |
| Vanguard® Total Stock Market Index Fund | | |
| Schedule of Investments | | |
| December 31, 2015 | | |
| |
| | | | Market |
| | | | Value |
| | | Shares | ($000) |
| *,^ | Seres Therapeutics Inc. | 160,462 | 5,631 |
| * | GenMark Diagnostics Inc. | 724,812 | 5,625 |
| * | Almost Family Inc. | 144,434 | 5,522 |
| * | Fluidigm Corp. | 508,444 | 5,496 |
| *,^ | Global Blood Therapeutics Inc. | 167,077 | 5,402 |
| *,^ | Idera Pharmaceuticals Inc. | 1,731,485 | 5,350 |
| * | Tetraphase Pharmaceuticals Inc. | 532,272 | 5,339 |
| * | BioTelemetry Inc. | 452,839 | 5,289 |
| * | Ignyta Inc. | 391,853 | 5,251 |
| *,^ | Regulus Therapeutics Inc. | 595,312 | 5,191 |
| * | Flexion Therapeutics Inc. | 265,035 | 5,107 |
| * | Concert Pharmaceuticals Inc. | 267,850 | 5,081 |
| *,^ | Avinger Inc. | 220,290 | 5,003 |
| | CryoLife Inc. | 459,695 | 4,955 |
| * | Paratek Pharmaceuticals Inc. | 260,630 | 4,944 |
| * | SurModics Inc. | 243,117 | 4,928 |
| * | Akebia Therapeutics Inc. | 379,515 | 4,903 |
| * | KemPharm Inc. | 245,552 | 4,877 |
| * | Aegerion Pharmaceuticals Inc. | 478,208 | 4,830 |
| *,^ | Immunomedics Inc. | 1,555,801 | 4,776 |
| *,^ | Foundation Medicine Inc. | 226,696 | 4,774 |
| * | Rigel Pharmaceuticals Inc. | 1,565,724 | 4,744 |
| *,^ | Vital Therapies Inc. | 406,446 | 4,682 |
| * | STAAR Surgical Co. | 654,148 | 4,671 |
| * | Adamas Pharmaceuticals Inc. | 159,159 | 4,507 |
| * | Vitae Pharmaceuticals Inc. | 246,418 | 4,460 |
| *,^ | Karyopharm Therapeutics Inc. | 334,828 | 4,436 |
| * | Loxo Oncology Inc. | 154,757 | 4,403 |
| * | Aimmune Therapeutics Inc. | 237,211 | 4,377 |
| * | OncoMed Pharmaceuticals Inc. | 186,062 | 4,194 |
| * | Durect Corp. | 1,878,561 | 4,152 |
| *,^ | NantKwest Inc. | 239,065 | 4,143 |
| *,^ | Galena Biopharma Inc. | 2,816,417 | 4,140 |
| * | Ardelyx Inc. | 225,130 | 4,079 |
| *,^ | Orexigen Therapeutics Inc. | 2,320,007 | 3,990 |
| *,^ | BioDelivery Sciences International Inc. | 829,997 | 3,976 |
| * | Oncothyreon Inc. | 1,783,153 | 3,959 |
| *,^ | Invitae Corp. | 478,321 | 3,927 |
| * | Versartis Inc. | 315,486 | 3,909 |
| *,^ | OvaScience Inc. | 397,215 | 3,881 |
| *,^ | Peregrine Pharmaceuticals Inc. | 3,311,554 | 3,875 |
| *,^ | ChemoCentryx Inc. | 473,107 | 3,832 |
| * | RTI Surgical Inc. | 959,917 | 3,811 |
| | LeMaitre Vascular Inc. | 220,830 | 3,809 |
| * | Sorrento Therapeutics Inc. | 432,002 | 3,763 |
| * | Pfenex Inc. | 302,966 | 3,751 |
| *,^ | Teladoc Inc. | 204,400 | 3,671 |
| *,^ | Organovo Holdings Inc. | 1,465,710 | 3,650 |
| * | Tandem Diabetes Care Inc. | 308,946 | 3,649 |
| *,^ | InVivo Therapeutics Holdings Corp. | 504,254 | 3,631 |
| * | RadNet Inc. | 587,256 | 3,629 |
| * | Glaukos Corp. | 146,622 | 3,620 |
| * | Immune Design Corp. | 179,204 | 3,598 |
| *,^ | CytomX Therapeutics Inc. | 172,307 | 3,596 |
| * | Heska Corp. | 92,855 | 3,592 |
| * | BioSpecifics Technologies Corp. | 83,460 | 3,586 |
| * | Inotek Pharmaceuticals Corp. | 310,399 | 3,517 |
| *,^ | Sequenom Inc. | 2,122,549 | 3,481 |
| * | Aclaris Therapeutics Inc. | 128,815 | 3,470 |
| * | Pernix Therapeutics Holdings Inc. | 1,175,001 | 3,466 |
| *,^ | CTI BioPharma Corp. | 2,813,037 | 3,460 |
| * | POZEN Inc. | 504,525 | 3,446 |
| *,^ | Synthetic Biologics Inc. | 1,501,112 | 3,438 |
| | Utah Medical Products Inc. | 58,208 | 3,407 |
33
| | | |
| Vanguard® Total Stock Market Index Fund | | |
| Schedule of Investments | | |
| December 31, 2015 | | |
| |
| | | | Market |
| | | | Value |
| | | Shares | ($000) |
| * | Applied Genetic Technologies Corp. | 166,190 | 3,390 |
| *,^ | T2 Biosystems Inc. | 307,270 | 3,362 |
| * | Collegium Pharmaceutical Inc. | 120,974 | 3,327 |
| * | Cutera Inc. | 256,696 | 3,283 |
| * | Avalanche Biotechnologies Inc. | 338,758 | 3,225 |
| * | Enzo Biochem Inc. | 710,691 | 3,198 |
| *,^ | ConforMIS Inc. | 184,488 | 3,190 |
| *,^ | BioTime Inc. | 773,439 | 3,171 |
| * | Aratana Therapeutics Inc. | 567,500 | 3,167 |
| *,^ | Navidea Biopharmaceuticals Inc. | 2,347,470 | 3,122 |
| *,^ | Northwest Biotherapeutics Inc. | 968,768 | 3,100 |
| *,^ | XBiotech Inc. | 283,224 | 3,079 |
| *,^ | AAC Holdings Inc. | 158,125 | 3,014 |
| ^ | Osiris Therapeutics Inc. | 288,347 | 2,993 |
| *,^ | Antares Pharma Inc. | 2,472,043 | 2,991 |
| * | NanoString Technologies Inc. | 201,894 | 2,970 |
| * | Catalyst Pharmaceuticals Inc. | 1,199,800 | 2,939 |
| *,^ | Ampio Pharmaceuticals Inc. | 839,379 | 2,938 |
| * | Exactech Inc. | 161,785 | 2,936 |
| * | SeaSpine Holdings Corp. | 168,394 | 2,893 |
| * | Dicerna Pharmaceuticals Inc. | 243,040 | 2,885 |
| * | Egalet Corp. | 258,605 | 2,850 |
| *,^ | Corindus Vascular Robotics Inc. | 869,217 | 2,790 |
| *,^ | REGENXBIO Inc. | 165,369 | 2,745 |
| * | Anthera Pharmaceuticals Inc. | 591,332 | 2,744 |
| *,^ | Nobilis Health Corp. | 966,224 | 2,725 |
| *,^ | Trovagene Inc. | 490,953 | 2,651 |
| * | Tobira Therapeutics Inc. | 263,795 | 2,651 |
| *,^ | XOMA Corp. | 1,983,120 | 2,638 |
| * | Harvard Bioscience Inc. | 756,857 | 2,626 |
| * | iRadimed Corp. | 93,477 | 2,620 |
| *,^ | CytRx Corp. | 974,643 | 2,583 |
| * | Ocular Therapeutix Inc. | 266,506 | 2,497 |
| *,^ | Tenax Therapeutics Inc. | 761,068 | 2,496 |
| * | Addus HomeCare Corp. | 106,130 | 2,471 |
| * | FONAR Corp. | 139,817 | 2,413 |
| * | Medgenics Inc. | 393,767 | 2,370 |
| * | Symmetry Surgical Inc. | 253,270 | 2,330 |
| | Digirad Corp. | 402,221 | 2,329 |
| * | Zafgen Inc. | 363,269 | 2,285 |
| * | Tonix Pharmaceuticals Holding Corp. | 296,420 | 2,274 |
| *,^ | Endocyte Inc. | 566,005 | 2,270 |
| * | Chiasma Inc. | 115,872 | 2,268 |
| *,^ | pSivida Corp. | 464,129 | 2,237 |
| *,^ | Natera Inc. | 199,033 | 2,150 |
| * | Five Star Quality Care Inc. | 663,749 | 2,111 |
| * | Assembly Biosciences Inc. | 280,974 | 2,110 |
| * | ArQule Inc. | 938,958 | 2,038 |
| *,^ | BioScrip Inc. | 1,163,038 | 2,035 |
| *,^ | Actinium Pharmaceuticals Inc. | 621,760 | 2,008 |
| *,^ | Fibrocell Science Inc. | 439,139 | 1,998 |
| * | Penumbra Inc. | 36,548 | 1,967 |
| * | AcelRx Pharmaceuticals Inc. | 505,369 | 1,946 |
| * | Sientra Inc. | 323,353 | 1,914 |
| * | Kura Oncology Inc. | 223,467 | 1,877 |
| * | Juniper Pharmaceuticals Inc. | 178,912 | 1,843 |
| *,^ | CytoSorbents Corp. | 328,449 | 1,829 |
| * | Entellus Medical Inc. | 108,082 | 1,822 |
| * | Corium International Inc. | 220,335 | 1,789 |
| *,^ | PharmAthene Inc. | 936,223 | 1,779 |
| *,^ | Cidara Therapeutics Inc. | 102,887 | 1,766 |
| * | Derma Sciences Inc. | 385,577 | 1,762 |
| *,^ | VIVUS Inc. | 1,700,568 | 1,735 |
| * | Proteon Therapeutics Inc. | 111,423 | 1,728 |
34
| | | |
| Vanguard® Total Stock Market Index Fund | | |
| Schedule of Investments | | |
| December 31, 2015 | | |
| |
| | | | Market |
| | | | Value |
| | | Shares | ($000) |
| * | Flex Pharma Inc. | 130,930 | 1,630 |
| * | Stemline Therapeutics Inc. | 257,682 | 1,626 |
| * | Genocea Biosciences Inc. | 296,791 | 1,564 |
| * | AxoGen Inc. | 309,020 | 1,545 |
| *,^ | Neuralstem Inc. | 1,460,535 | 1,504 |
| *,^ | ContraFect Corp. | 316,601 | 1,504 |
| * | Edge Therapeutics Inc. | 118,617 | 1,483 |
| *,^ | Fortress Biotech Inc. | 526,032 | 1,468 |
| *,^ | Bio-Path Holdings Inc. | 1,169,661 | 1,462 |
| * | Calithera Biosciences Inc. | 189,325 | 1,450 |
| * | Genesis Healthcare Inc. | 403,126 | 1,399 |
| *,^ | Athersys Inc. | 1,271,125 | 1,309 |
| * | Alliance HealthCare Services Inc. | 140,174 | 1,287 |
| *,^ | Tokai Pharmaceuticals Inc. | 145,408 | 1,268 |
| * | Anavex Life Sciences Corp. | 226,958 | 1,264 |
| * | Nivalis Therapeutics Inc. | 161,630 | 1,251 |
| * | Verastem Inc. | 657,912 | 1,224 |
| * | Dipexium Pharmaceuticals Inc. | 107,079 | 1,199 |
| * | AVEO Pharmaceuticals Inc. | 940,983 | 1,186 |
| *,^ | Abeona Therapeutics Inc. | 350,821 | 1,179 |
| *,^ | Provectus Biopharmaceuticals Inc. Class A | 2,998,219 | 1,169 |
| *,^ | Alimera Sciences Inc. | 480,433 | 1,163 |
| | Psychemedics Corp. | 113,707 | 1,153 |
| * | Pain Therapeutics Inc. | 648,731 | 1,135 |
| *,^ | CorMedix Inc. | 557,462 | 1,132 |
| * | Sunesis Pharmaceuticals Inc. | 1,253,164 | 1,125 |
| * | Fate Therapeutics Inc. | 328,006 | 1,105 |
| *,^ | Mast Therapeutics Inc. | 2,595,186 | 1,091 |
| * | Marinus Pharmaceuticals Inc. | 142,124 | 1,086 |
| * | aTyr Pharma Inc. | 108,007 | 1,062 |
| * | Tracon Pharmaceuticals Inc. | 111,895 | 1,034 |
| *,^ | Rexahn Pharmaceuticals Inc. | 2,845,469 | 1,033 |
| *,^ | Asterias Biotherapeutics Inc. | 260,159 | 1,022 |
| * | MediciNova Inc. | 286,212 | 1,016 |
| *,^ | Unilife Corp. | 2,046,607 | 1,013 |
| * | IRIDEX Corp. | 107,201 | 996 |
| * | Vericel Corp. | 381,091 | 983 |
| * | Adamis Pharmaceuticals Corp. | 175,999 | 950 |
| * | SCYNEXIS Inc. | 152,100 | 945 |
| * | Kindred Biosciences Inc. | 274,066 | 932 |
| * | InfuSystems Holdings Inc. | 303,633 | 926 |
| * | Veracyte Inc. | 127,777 | 920 |
| * | Achaogen Inc. | 157,672 | 905 |
| *,^ | NanoViricides Inc. | 765,867 | 904 |
| * | Neos Therapeutics Inc. | 62,411 | 894 |
| * | Cumberland Pharmaceuticals Inc. | 168,495 | 886 |
| | Span-America Medical Systems Inc. | 44,436 | 882 |
| * | Imprimis Pharmaceuticals Inc. | 126,879 | 879 |
| * | EndoChoice Holdings Inc. | 105,116 | 878 |
| * | OncoSec Medical Inc. | 370,200 | 877 |
| *,^ | Caladrius Biosciences Inc. | 803,356 | 868 |
| *,^ | IsoRay Inc. | 924,245 | 866 |
| * | Synta Pharmaceuticals Corp. | 2,453,522 | 864 |
| * | EPIRUS Biopharmaceuticals Inc. | 276,873 | 856 |
| * | Carbylan Therapeutics Inc. | 234,831 | 850 |
| * | Ocera Therapeutics Inc. | 264,414 | 825 |
| * | MEI Pharma Inc. | 506,940 | 811 |
| *,^ | ContraVir Pharmaceuticals Inc. | 498,249 | 767 |
| * | GlycoMimetics Inc. | 131,030 | 749 |
| | AdCare Health Systems Inc. | 298,748 | 744 |
| * | Alliqua BioMedical Inc. | 347,173 | 743 |
| * | StemCells Inc. | 1,769,454 | 737 |
| *,^ | Apricus Biosciences Inc. | 729,018 | 722 |
| * | Lantheus Holdings Inc. | 212,533 | 718 |
35
| | | |
| Vanguard® Total Stock Market Index Fund | | |
| Schedule of Investments | | |
| December 31, 2015 | | |
| |
| | | | Market |
| | | | Value |
| | | Shares | ($000) |
| * | CAS Medical Systems Inc. | 400,050 | 708 |
| * | Brainstorm Cell Therapeutics Inc. | 244,224 | 698 |
| * | Aldeyra Therapeutics Inc. | 101,870 | 691 |
| * | TriVascular Technologies Inc. | 101,441 | 675 |
| * | Chembio Diagnostics Inc. | 123,989 | 661 |
| *,^ | Biolase Inc. | 763,675 | 642 |
| *,^ | TearLab Corp. | 459,841 | 639 |
| * | vTv Therapeutics Inc. Class A | 93,692 | 638 |
| *,^ | Conatus Pharmaceuticals Inc. | 219,865 | 633 |
| * | Cancer Genetics Inc. | 191,189 | 631 |
| *,^ | Corbus Pharmaceuticals Holdings Inc. | 381,789 | 630 |
| * | Recro Pharma Inc. | 67,102 | 604 |
| * | Repros Therapeutics Inc. | 495,954 | 600 |
| *,^ | Second Sight Medical Products Inc. | 101,204 | 596 |
| * | Threshold Pharmaceuticals Inc. | 1,217,315 | 584 |
| * | Misonix Inc. | 62,103 | 583 |
| *,^ | Celator Pharmaceuticals Inc. | 322,916 | 568 |
| *,^ | Galectin Therapeutics Inc. | 345,606 | 567 |
| *,^ | Cerulean Pharma Inc. | 199,192 | 558 |
| * | MyoKardia Inc. | 37,810 | 554 |
| * | ImmunoCellular Therapeutics Ltd. | 1,547,621 | 550 |
| * | Retractable Technologies Inc. | 175,484 | 544 |
| *,^ | Mirna Therapeutics Inc. | 86,203 | 539 |
| *,^ | Catabasis Pharmaceuticals Inc. | 67,939 | 539 |
| * | Cymabay Therapeutics Inc. | 317,847 | 537 |
| * | Vical Inc. | 1,299,653 | 533 |
| *,^ | OncoGenex Pharmaceuticals Inc. | 437,026 | 529 |
| * | Catalyst Biosciences Inc. | 166,056 | 520 |
| *,^ | CEL-SCI Corp. | 1,376,786 | 509 |
| * | Agile Therapeutics Inc. | 52,123 | 509 |
| * | Zynerba Pharmaceuticals Inc. | 50,479 | 508 |
| * | Celsion Corp. | 262,411 | 504 |
| | Daxor Corp. | 66,468 | 502 |
| * | Bovie Medical Corp. | 235,448 | 494 |
| *,^ | Vermillion Inc. | 259,215 | 467 |
| * | CareDx Inc. | 68,515 | 438 |
| | Enzon Pharmaceuticals Inc. | 624,707 | 426 |
| * | Alphatec Holdings Inc. | 1,416,564 | 425 |
| * | Harvard Apparatus Regenerative Technology Inc. | 192,845 | 420 |
| * | BIND Therapeutics Inc. | 183,435 | 420 |
| *,^ | iBio Inc. | 683,611 | 383 |
| * | Eleven Biotherapeutics Inc. | 126,551 | 381 |
| * | Minerva Neurosciences Inc. | 61,586 | 374 |
| *,^ | Palatin Technologies Inc. | 562,490 | 373 |
| * | Cogentix Medical Inc. | 289,122 | 373 |
| *,^ | Cytori Therapeutics Inc. | 1,931,804 | 359 |
| *,^ | Celladon Corp. | 243,153 | 357 |
| *,^ | Sunshine Heart Inc. | 258,495 | 349 |
| * | Oragenics Inc. | 227,875 | 340 |
| *,^ | Hansen Medical Inc. | 143,205 | 334 |
| * | CoLucid Pharmaceuticals Inc. | 38,043 | 318 |
| * | Discovery Laboratories Inc. | 1,479,737 | 317 |
| *,^ | Sophiris Bio Inc. | 172,289 | 312 |
| * | MGC Diagnostics Corp. | 46,575 | 306 |
| * | Joint Corp. | 50,675 | 303 |
| * | Aethlon Medical Inc. | 44,092 | 299 |
| *,^ | GTx Inc. | 426,578 | 299 |
| *,^ | Alexza Pharmaceuticals Inc. | 425,033 | 298 |
| *,^ | Biocept Inc. | 215,365 | 297 |
| * | Wright Medical Group Inc. CVR Exp. 12/31/2049 | 288,011 | 294 |
| * | HTG Molecular Diagnostics Inc. | 65,650 | 286 |
| *,^ | Oculus Innovative Sciences Inc. | 246,641 | 284 |
| * | Invuity Inc. | 31,432 | 277 |
| * | Argos Therapeutics Inc. | 119,485 | 276 |
36
| | | |
| Vanguard® Total Stock Market Index Fund | | |
| Schedule of Investments | | |
| December 31, 2015 | | |
| |
| | | | Market |
| | | | Value |
| | | Shares | ($000) |
| | Diversicare Healthcare Services Inc. | 33,583 | 274 |
| * | Bellerophon Therapeutics Inc. | 87,474 | 259 |
| * | ARCA biopharma Inc. | 55,421 | 258 |
| *,^ | OXiGENE Inc. | 343,666 | 256 |
| * | AmpliPhi Biosciences Corp. | 62,000 | 247 |
| * | Opexa Therapeutics Inc. | 88,089 | 245 |
| * | Echo Therapeutics Inc. | 171,131 | 243 |
| * | Biodel Inc. | 698,555 | 239 |
| *,^ | EnteroMedics Inc. | 1,825,754 | 238 |
| * | Cyclacel Pharmaceuticals Inc. | 465,134 | 233 |
| * | CASI Pharmaceuticals Inc. | 241,336 | 232 |
| * | Hemispherx Biopharma Inc. | 2,858,987 | 230 |
| * | TetraLogic Pharmaceuticals Corp. | 126,006 | 218 |
| *,^ | Heat Biologics Inc. | 88,564 | 216 |
| * | Cardica Inc. | 1,355,279 | 210 |
| * | Zosano Pharma Corp. | 88,338 | 197 |
| *,^ | Stereotaxis Inc. | 261,780 | 195 |
| * | Onconova Therapeutics Inc. | 191,299 | 183 |
| *,^ | Neothetics Inc. | 124,418 | 173 |
| * | Acura Pharmaceuticals Inc. | 67,640 | 171 |
| * | ADMA Biologics Inc. | 20,635 | 167 |
| *,^ | Venaxis Inc. | 540,580 | 165 |
| *,^ | RXi Pharmaceuticals Corp. | 396,875 | 152 |
| *,^ | Amedica Corp. | 1,269,139 | 151 |
| * | Presbia plc | 27,300 | 144 |
| *,^ | Cleveland BioLabs Inc. | 40,540 | 141 |
| *,^ | PhotoMedex Inc. | 304,543 | 137 |
| * | Evoke Pharma Inc. | 39,971 | 132 |
| * | ERBA Diagnostics Inc. | 94,045 | 131 |
| * | GenVec Inc. | 61,174 | 113 |
| *,^ | NephroGenex Inc. | 64,091 | 103 |
| * | Bioanalytical Systems Inc. | 65,847 | 100 |
| * | Allied Healthcare Products Inc. | 87,500 | 97 |
| *,^ | BioLife Solutions Inc. | 44,586 | 97 |
| * | CombiMatrix Corp. | 129,015 | 95 |
| *,^ | Atossa Genetics Inc. | 295,017 | 94 |
| * | Ritter Pharmaceuticals Inc. | 55,031 | 94 |
| * | Dimension Therapeutics Inc. | 7,585 | 86 |
| * | ProPhase Labs Inc. | 56,433 | 85 |
| * | Cesca Therapeutics Inc. | 438,429 | 80 |
| * | Akers Biosciences Inc. | 60,354 | 73 |
| * | Pulmatrix Inc. | 17,594 | 69 |
| * | Arcadia Biosciences Inc. | 22,553 | 69 |
| * | Arrhythmia Research Technology Inc. | 12,440 | 68 |
| * | BioPharmX Corp. | 44,533 | 68 |
| *,^ | Viking Therapeutics Inc. | 18,275 | 62 |
| * | Titan Pharmaceuticals Inc. | 13,800 | 61 |
| * | Capricor Therapeutics Inc. | 19,771 | 61 |
| * | Transgenomic Inc. | 53,000 | 57 |
| * | ImmuCell Corp. | 7,633 | 56 |
| *,^ | Signal Genetics Inc. | 70,186 | 52 |
| * | NovaBay Pharmaceuticals Inc. | 21,037 | 43 |
| * | Immune Pharmaceuticals Inc. | 58,351 | 43 |
| * | USMD Holdings Inc. | 5,047 | 37 |
| * | Escalon Medical Corp. | 29,989 | 33 |
| * | EyeGate Pharmaceuticals Inc. | 10,728 | 29 |
| * | Milestone Scientific Inc. | 10,745 | 25 |
| * | Biota Pharmaceuticals Inc. | 11,900 | 23 |
| | Birner Dental Management Services Inc. | 1,710 | 19 |
| * | Hooper Holmes Inc. | 289,917 | 18 |
| * | Roka Bioscience Inc. | 13,614 | 17 |
| * | Electromed Inc. | 7,600 | 14 |
| * | Histogenics Corp. | 3,570 | 12 |
| * | Jaguar Animal Health Inc. | 4,425 | 10 |
37
| | |
| Vanguard® Total Stock Market Index Fund | | |
| Schedule of Investments | | |
| December 31, 2015 | | |
| |
| | | Market |
| | | Value |
| | Shares | ($000) |
| * GlobeImmune Inc. | 2,318 | 9 |
| * VBI Vaccines Inc. | 3,563 | 8 |
| * Semler Scientific Inc. | 3,107 | 8 |
| | | 56,149,676 |
| Industrials (12.3%) | | |
| General Electric Co. | 173,064,066 | 5,390,946 |
| 3M Co. | 11,294,457 | 1,701,397 |
| Boeing Co. | 11,679,686 | 1,688,766 |
| United Technologies Corp. | 15,458,459 | 1,485,094 |
| Honeywell International Inc. | 13,433,615 | 1,391,320 |
| United Parcel Service Inc. Class B | 12,777,393 | 1,229,569 |
| Union Pacific Corp. | 15,655,272 | 1,224,242 |
| Accenture plc Class A | 11,454,978 | 1,197,045 |
| Lockheed Martin Corp. | 4,792,721 | 1,040,739 |
| Danaher Corp. | 10,690,439 | 992,928 |
| * PayPal Holdings Inc. | 21,271,962 | 770,045 |
| FedEx Corp. | 4,917,667 | 732,683 |
| Caterpillar Inc. | 10,679,232 | 725,761 |
| Raytheon Co. | 5,519,771 | 687,377 |
| Automatic Data Processing Inc. | 8,093,836 | 685,710 |
| General Dynamics Corp. | 4,935,072 | 677,882 |
| Northrop Grumman Corp. | 3,343,433 | 631,274 |
| Emerson Electric Co. | 12,011,011 | 574,487 |
| Precision Castparts Corp. | 2,397,369 | 556,214 |
| Illinois Tool Works Inc. | 5,674,001 | 525,866 |
| * LinkedIn Corp. Class A | 2,116,216 | 476,318 |
| CSX Corp. | 17,839,897 | 462,945 |
| Norfolk Southern Corp. | 5,469,307 | 462,649 |
| TE Connectivity Ltd. | 7,153,566 | 462,192 |
| Eaton Corp. plc | 8,487,866 | 441,709 |
| Waste Management Inc. | 8,187,451 | 436,964 |
| Deere & Co. | 5,715,727 | 435,939 |
| * Fiserv Inc. | 4,239,123 | 387,710 |
| Sherwin-Williams Co. | 1,451,677 | 376,855 |
| Roper Technologies Inc. | 1,843,728 | 349,921 |
| Paychex Inc. | 5,927,109 | 313,485 |
| Fidelity National Information Services Inc. | 5,167,567 | 313,155 |
| PACCAR Inc. | 6,478,834 | 307,097 |
| Amphenol Corp. Class A | 5,653,897 | 295,303 |
| * Alliance Data Systems Corp. | 1,063,389 | 294,102 |
| Cummins Inc. | 3,258,552 | 286,785 |
| Ingersoll-Rand plc | 4,797,043 | 265,229 |
| Agilent Technologies Inc. | 6,086,197 | 254,464 |
| Rockwell Automation Inc. | 2,421,424 | 248,462 |
| Tyco International plc | 7,752,094 | 247,214 |
| Parker-Hannifin Corp. | 2,500,036 | 242,454 |
| AMETEK Inc. | 4,367,598 | 234,060 |
| Vulcan Materials Co. | 2,439,394 | 231,669 |
| * FleetCor Technologies Inc. | 1,601,789 | 228,944 |
| Rockwell Collins Inc. | 2,397,956 | 221,331 |
| WestRock Co. | 4,804,070 | 219,162 |
| WW Grainger Inc. | 1,061,668 | 215,083 |
| * Verisk Analytics Inc. Class A | 2,793,720 | 214,781 |
| * TransDigm Group Inc. | 933,194 | 213,188 |
| ^ Fastenal Co. | 5,036,266 | 205,580 |
| Republic Services Inc. Class A | 4,427,328 | 194,758 |
| Textron Inc. | 4,503,690 | 189,200 |
| Xerox Corp. | 17,782,304 | 189,026 |
| * Stericycle Inc. | 1,556,518 | 187,716 |
| Acuity Brands Inc. | 798,163 | 186,611 |
| Ball Corp. | 2,498,656 | 181,727 |
| Masco Corp. | 6,197,489 | 175,389 |
| Dover Corp. | 2,836,827 | 173,926 |
| * Mettler-Toledo International Inc. | 502,413 | 170,383 |
38
| | |
| Vanguard® Total Stock Market Index Fund | | |
| Schedule of Investments | | |
| December 31, 2015 | | |
| |
| | | Market |
| | | Value |
| | Shares | ($000) |
| Martin Marietta Materials Inc. | 1,212,033 | 165,539 |
| Sealed Air Corp. | 3,705,438 | 165,263 |
| Pentair plc | 3,301,849 | 163,541 |
| Towers Watson & Co. Class A | 1,269,303 | 163,055 |
| CH Robinson Worldwide Inc. | 2,623,718 | 162,723 |
| Fortune Brands Home & Security Inc. | 2,919,197 | 162,015 |
| L-3 Communications Holdings Inc. | 1,289,509 | 154,109 |
| Expeditors International of Washington Inc. | 3,408,168 | 153,708 |
| Global Payments Inc. | 2,374,674 | 153,190 |
| Total System Services Inc. | 3,017,924 | 150,293 |
| Kansas City Southern | 1,993,577 | 148,860 |
| Cintas Corp. | 1,588,914 | 144,671 |
| * Sensata Technologies Holding NV | 3,111,252 | 143,304 |
| * Vantiv Inc. Class A | 2,848,008 | 135,053 |
| * Crown Holdings Inc. | 2,552,837 | 129,429 |
| * Spirit AeroSystems Holdings Inc. Class A | 2,560,336 | 128,196 |
| Waste Connections Inc. | 2,237,772 | 126,031 |
| JB Hunt Transport Services Inc. | 1,709,018 | 125,374 |
| Fluor Corp. | 2,612,859 | 123,379 |
| * United Rentals Inc. | 1,700,490 | 123,354 |
| Valspar Corp. | 1,449,967 | 120,275 |
| Wabtec Corp. | 1,678,654 | 119,386 |
| Xylem Inc. | 3,266,730 | 119,236 |
| ManpowerGroup Inc. | 1,389,352 | 117,108 |
| * CoStar Group Inc. | 561,135 | 115,981 |
| Broadridge Financial Solutions Inc. | 2,146,663 | 115,340 |
| Allegion plc | 1,745,636 | 115,072 |
| Jack Henry & Associates Inc. | 1,469,157 | 114,682 |
| Packaging Corp. of America | 1,791,747 | 112,970 |
| PerkinElmer Inc. | 2,044,685 | 109,534 |
| Huntington Ingalls Industries Inc. | 862,194 | 109,369 |
| * HD Supply Holdings Inc. | 3,635,290 | 109,168 |
| Robert Half International Inc. | 2,308,431 | 108,819 |
| IDEX Corp. | 1,404,675 | 107,612 |
| Carlisle Cos. Inc. | 1,185,103 | 105,107 |
| AO Smith Corp. | 1,368,345 | 104,829 |
| Avnet Inc. | 2,416,634 | 103,529 |
| ADT Corp. | 3,053,402 | 100,701 |
| Flowserve Corp. | 2,383,915 | 100,315 |
| * Trimble Navigation Ltd. | 4,587,744 | 98,407 |
| Lennox International Inc. | 781,144 | 97,565 |
| * Hubbell Inc. Class B | 956,359 | 96,631 |
| Orbital ATK Inc. | 1,067,514 | 95,372 |
| Macquarie Infrastructure Corp. | 1,306,191 | 94,829 |
| Owens Corning | 2,013,894 | 94,713 |
| * Jacobs Engineering Group Inc. | 2,236,442 | 93,819 |
| * Arrow Electronics Inc. | 1,721,897 | 93,292 |
| * Keysight Technologies Inc. | 3,095,189 | 87,687 |
| AptarGroup Inc. | 1,139,779 | 82,805 |
| * AECOM | 2,751,121 | 82,616 |
| B/E Aerospace Inc. | 1,908,728 | 80,873 |
| Hexcel Corp. | 1,731,912 | 80,447 |
| * Berry Plastics Group Inc. | 2,196,231 | 79,460 |
| Bemis Co. Inc. | 1,756,725 | 78,508 |
| Graphic Packaging Holding Co. | 6,001,171 | 76,995 |
| Graco Inc. | 1,045,656 | 75,360 |
| Sonoco Products Co. | 1,839,977 | 75,200 |
| Allison Transmission Holdings Inc. | 2,880,208 | 74,569 |
| * Genpact Ltd. | 2,931,956 | 73,240 |
| Jabil Circuit Inc. | 3,137,809 | 73,080 |
| FLIR Systems Inc. | 2,557,467 | 71,788 |
| * Old Dominion Freight Line Inc. | 1,191,245 | 70,367 |
| Toro Co. | 958,946 | 70,070 |
| Donaldson Co. Inc. | 2,441,130 | 69,963 |
39
| | | |
| Vanguard® Total Stock Market Index Fund | | |
| Schedule of Investments | | |
| December 31, 2015 | | |
| |
| | | | Market |
| | | | Value |
| | | Shares | ($000) |
| ^ | Chicago Bridge & Iron Co. NV | 1,741,970 | 67,919 |
| | Trinity Industries Inc. | 2,789,499 | 67,004 |
| * | Zebra Technologies Corp. | 952,166 | 66,318 |
| * | Euronet Worldwide Inc. | 902,892 | 65,396 |
| | MDU Resources Group Inc. | 3,562,409 | 65,263 |
| | MAXIMUS Inc. | 1,151,681 | 64,782 |
| | Lincoln Electric Holdings Inc. | 1,230,838 | 63,868 |
| | Nordson Corp. | 992,461 | 63,666 |
| * | WEX Inc. | 699,794 | 61,862 |
| | Booz Allen Hamilton Holding Corp. Class A | 1,982,171 | 61,150 |
| | AGCO Corp. | 1,336,597 | 60,668 |
| | National Instruments Corp. | 2,100,070 | 60,251 |
| | Heartland Payment Systems Inc. | 632,944 | 60,016 |
| | FEI Co. | 748,595 | 59,730 |
| | ITT Corp. | 1,618,459 | 58,782 |
| | Air Lease Corp. Class A | 1,750,444 | 58,605 |
| * | Quanta Services Inc. | 2,851,912 | 57,751 |
| | BWX Technologies Inc. | 1,795,341 | 57,038 |
| * | IPG Photonics Corp. | 625,606 | 55,779 |
| * | Genesee & Wyoming Inc. Class A | 1,032,471 | 55,433 |
| | RR Donnelley & Sons Co. | 3,754,987 | 55,273 |
| | Oshkosh Corp. | 1,407,340 | 54,943 |
| | Ryder System Inc. | 964,228 | 54,797 |
| | Watsco Inc. | 466,547 | 54,647 |
| * | CoreLogic Inc. | 1,611,591 | 54,568 |
| | Curtiss-Wright Corp. | 769,169 | 52,688 |
| | Eagle Materials Inc. | 867,806 | 52,442 |
| * | First Data Corp. Class A | 3,261,243 | 52,245 |
| | EMCOR Group Inc. | 1,087,280 | 52,233 |
| * | Kirby Corp. | 985,950 | 51,881 |
| | Woodward Inc. | 1,041,024 | 51,697 |
| * | Teledyne Technologies Inc. | 576,959 | 51,176 |
| * | Owens-Illinois Inc. | 2,937,466 | 51,171 |
| | Cognex Corp. | 1,485,957 | 50,181 |
| | World Fuel Services Corp. | 1,292,893 | 49,725 |
| *,^ | XPO Logistics Inc. | 1,806,559 | 49,229 |
| | Deluxe Corp. | 901,436 | 49,164 |
| | MSC Industrial Direct Co. Inc. Class A | 868,136 | 48,850 |
| | EnerSys | 858,048 | 47,991 |
| | Landstar System Inc. | 815,349 | 47,820 |
| | Regal Beloit Corp. | 810,791 | 47,448 |
| * | Louisiana-Pacific Corp. | 2,575,815 | 46,390 |
| | CLARCOR Inc. | 903,749 | 44,898 |
| * | Esterline Technologies Corp. | 550,728 | 44,609 |
| | KBR Inc. | 2,618,865 | 44,311 |
| | Littelfuse Inc. | 403,853 | 43,216 |
| | Silgan Holdings Inc. | 784,913 | 42,166 |
| | Valmont Industries Inc. | 394,926 | 41,870 |
| * | Universal Display Corp. | 765,349 | 41,666 |
| | Convergys Corp. | 1,600,720 | 39,842 |
| | Crane Co. | 830,296 | 39,721 |
| | Timken Co. | 1,387,901 | 39,680 |
| | HEICO Corp. Class A | 790,372 | 38,886 |
| * | USG Corp. | 1,588,848 | 38,593 |
| * | On Assignment Inc. | 853,157 | 38,349 |
| * | Moog Inc. Class A | 630,640 | 38,217 |
| * | Advisory Board Co. | 768,054 | 38,103 |
| * | Clean Harbors Inc. | 900,357 | 37,500 |
| | CEB Inc. | 604,974 | 37,139 |
| * | Generac Holdings Inc. | 1,245,231 | 37,071 |
| * | Colfax Corp. | 1,578,917 | 36,868 |
| | Belden Inc. | 768,978 | 36,665 |
| *,^ | Cimpress NV | 439,544 | 35,665 |
| | Triumph Group Inc. | 895,711 | 35,605 |
40
| | | |
| Vanguard® Total Stock Market Index Fund | | |
| Schedule of Investments | | |
| December 31, 2015 | | |
| |
| | | | Market |
| | | | Value |
| | | Shares | ($000) |
| * | Armstrong World Industries Inc. | 767,641 | 35,104 |
| | Terex Corp. | 1,878,190 | 34,709 |
| ^ | Manitowoc Co. Inc. | 2,230,773 | 34,242 |
| * | WESCO International Inc. | 780,308 | 34,084 |
| | Matson Inc. | 792,404 | 33,780 |
| | GATX Corp. | 777,617 | 33,088 |
| | Covanta Holding Corp. | 2,047,952 | 31,723 |
| * | Masonite International Corp. | 515,519 | 31,565 |
| | Barnes Group Inc. | 877,979 | 31,072 |
| | Korn/Ferry International | 933,470 | 30,973 |
| * | Imperva Inc. | 486,540 | 30,803 |
| *,^ | Ambarella Inc. | 549,287 | 30,617 |
| * | Anixter International Inc. | 503,392 | 30,400 |
| * | Sanmina Corp. | 1,471,283 | 30,279 |
| * | Greatbatch Inc. | 573,063 | 30,086 |
| * | OSI Systems Inc. | 333,446 | 29,563 |
| * | WageWorks Inc. | 647,768 | 29,389 |
| * | KLX Inc. | 951,900 | 29,309 |
| * | Coherent Inc. | 446,312 | 29,059 |
| | Vishay Intertechnology Inc. | 2,400,947 | 28,931 |
| | UniFirst Corp. | 275,567 | 28,714 |
| | Kennametal Inc. | 1,452,861 | 27,895 |
| | Mueller Industries Inc. | 1,025,590 | 27,793 |
| | Granite Construction Inc. | 642,733 | 27,580 |
| | ABM Industries Inc. | 963,076 | 27,419 |
| | Knight Transportation Inc. | 1,129,953 | 27,379 |
| * | Cardtronics Inc. | 804,882 | 27,084 |
| * | Proto Labs Inc. | 423,276 | 26,958 |
| | Tetra Tech Inc. | 1,032,333 | 26,861 |
| * | AMN Healthcare Services Inc. | 862,855 | 26,792 |
| | Applied Industrial Technologies Inc. | 657,442 | 26,620 |
| * | Rexnord Corp. | 1,468,322 | 26,606 |
| * | FTI Consulting Inc. | 755,330 | 26,180 |
| * | RBC Bearings Inc. | 400,296 | 25,855 |
| | John Bean Technologies Corp. | 517,206 | 25,772 |
| | Mobile Mini Inc. | 822,669 | 25,610 |
| | Simpson Manufacturing Co. Inc. | 746,606 | 25,497 |
| | Brink's Co. | 881,134 | 25,430 |
| | Universal Forest Products Inc. | 371,281 | 25,384 |
| * | ExlService Holdings Inc. | 562,623 | 25,279 |
| | Watts Water Technologies Inc. Class A | 503,554 | 25,012 |
| | MSA Safety Inc. | 572,413 | 24,883 |
| * | Huron Consulting Group Inc. | 412,924 | 24,528 |
| | Actuant Corp. Class A | 1,021,502 | 24,475 |
| | AZZ Inc. | 437,262 | 24,299 |
| | Forward Air Corp. | 555,922 | 23,910 |
| *,^ | NeuStar Inc. Class A | 977,655 | 23,434 |
| | Apogee Enterprises Inc. | 538,354 | 23,424 |
| | Mueller Water Products Inc. Class A | 2,713,586 | 23,337 |
| * | Itron Inc. | 640,851 | 23,186 |
| | Aircastle Ltd. | 1,089,761 | 22,765 |
| | Essendant Inc. | 696,556 | 22,645 |
| | Exponent Inc. | 450,527 | 22,504 |
| *,^ | LifeLock Inc. | 1,550,901 | 22,255 |
| | Joy Global Inc. | 1,763,023 | 22,232 |
| * | Swift Transportation Co. | 1,576,503 | 21,787 |
| * | Trex Co. Inc. | 571,131 | 21,726 |
| * | Sykes Enterprises Inc. | 702,134 | 21,612 |
| * | Smith & Wesson Holding Corp. | 979,751 | 21,535 |
| | G&K Services Inc. Class A | 341,929 | 21,507 |
| *,^ | Knowles Corp. | 1,608,854 | 21,446 |
| * | Headwaters Inc. | 1,260,569 | 21,266 |
| * | TopBuild Corp. | 685,562 | 21,095 |
| | Methode Electronics Inc. | 661,360 | 21,051 |
41
| | |
| Vanguard® Total Stock Market Index Fund | | |
| Schedule of Investments | | |
| December 31, 2015 | | |
| |
| | | Market |
| | | Value |
| | Shares | ($000) |
| * Plexus Corp. | 600,906 | 20,984 |
| Kaman Corp. | 505,766 | 20,640 |
| * Hub Group Inc. Class A | 619,513 | 20,413 |
| * MasTec Inc. | 1,162,672 | 20,207 |
| Sturm Ruger & Co. Inc. | 337,941 | 20,145 |
| * Babcock & Wilcox Enterprises Inc. | 964,684 | 20,133 |
| Heartland Express Inc. | 1,180,769 | 20,097 |
| * DigitalGlobe Inc. | 1,280,677 | 20,055 |
| * American Woodmark Corp. | 249,520 | 19,957 |
| * Benchmark Electronics Inc. | 959,408 | 19,831 |
| Franklin Electric Co. Inc. | 732,112 | 19,789 |
| * SPX FLOW Inc. | 706,129 | 19,708 |
| * TrueBlue Inc. | 762,544 | 19,643 |
| Werner Enterprises Inc. | 830,940 | 19,436 |
| Albany International Corp. | 527,395 | 19,276 |
| * ExamWorks Group Inc. | 717,365 | 19,082 |
| Standex International Corp. | 229,236 | 19,061 |
| Comfort Systems USA Inc. | 669,558 | 19,029 |
| * TransUnion | 685,211 | 18,891 |
| Otter Tail Corp. | 708,591 | 18,870 |
| EVERTEC Inc. | 1,123,245 | 18,803 |
| Brady Corp. Class A | 817,987 | 18,797 |
| * Summit Materials Inc. Class A | 932,486 | 18,687 |
| EnPro Industries Inc. | 425,376 | 18,648 |
| Tennant Co. | 330,400 | 18,588 |
| * Atlas Air Worldwide Holdings Inc. | 448,179 | 18,528 |
| Cubic Corp. | 391,868 | 18,516 |
| * II-VI Inc. | 995,279 | 18,472 |
| * Boise Cascade Co. | 703,134 | 17,951 |
| * PHH Corp. | 1,105,468 | 17,909 |
| * M/A-COM Technology Solutions Holdings Inc. | 429,963 | 17,581 |
| Federal Signal Corp. | 1,087,208 | 17,232 |
| MTS Systems Corp. | 270,434 | 17,148 |
| * Rogers Corp. | 329,419 | 16,988 |
| * TASER International Inc. | 972,745 | 16,819 |
| Insperity Inc. | 346,305 | 16,675 |
| ESCO Technologies Inc. | 460,765 | 16,652 |
| AAON Inc. | 716,143 | 16,629 |
| Greif Inc. Class A | 536,920 | 16,543 |
| Greenbrier Cos. Inc. | 497,052 | 16,214 |
| AAR Corp. | 606,050 | 15,933 |
| * Inovalon Holdings Inc. Class A | 934,113 | 15,880 |
| Primoris Services Corp. | 714,659 | 15,744 |
| * Aerojet Rocketdyne Holdings Inc. | 977,422 | 15,306 |
| * TriMas Corp. | 807,610 | 15,062 |
| * Veeco Instruments Inc. | 726,222 | 14,931 |
| Advanced Drainage Systems Inc. | 619,265 | 14,881 |
| * Paylocity Holding Corp. | 365,859 | 14,836 |
| ^ Lindsay Corp. | 203,608 | 14,741 |
| * TriNet Group Inc. | 754,392 | 14,597 |
| * Meritor Inc. | 1,736,237 | 14,498 |
| Badger Meter Inc. | 247,350 | 14,492 |
| * US Concrete Inc. | 272,033 | 14,325 |
| * Wabash National Corp. | 1,209,344 | 14,307 |
| * Builders FirstSource Inc. | 1,289,951 | 14,293 |
| * Fabrinet | 599,777 | 14,287 |
| * Navigant Consulting Inc. | 881,448 | 14,156 |
| * Rofin-Sinar Technologies Inc. | 506,909 | 13,575 |
| US Ecology Inc. | 371,929 | 13,553 |
| Quanex Building Products Corp. | 649,003 | 13,532 |
| Griffon Corp. | 756,094 | 13,458 |
| Multi-Color Corp. | 223,505 | 13,368 |
| Astec Industries Inc. | 328,223 | 13,359 |
| ManTech International Corp. Class A | 440,570 | 13,323 |
42
| | | |
| Vanguard® Total Stock Market Index Fund | | |
| Schedule of Investments | | |
| December 31, 2015 | | |
| |
| | | | Market |
| | | | Value |
| | | Shares | ($000) |
| * | Gibraltar Industries Inc. | 523,531 | 13,319 |
| | Sun Hydraulics Corp. | 414,467 | 13,151 |
| | CIRCOR International Inc. | 310,455 | 13,086 |
| * | Continental Building Products Inc. | 746,326 | 13,031 |
| * | Aegion Corp. Class A | 664,260 | 12,827 |
| * | Astronics Corp. | 307,978 | 12,538 |
| | Encore Wire Corp. | 335,468 | 12,443 |
| * | Wesco Aircraft Holdings Inc. | 1,024,862 | 12,268 |
| | Kforce Inc. | 477,263 | 12,065 |
| ^ | Outerwall Inc. | 328,780 | 12,014 |
| * | ICF International Inc. | 335,143 | 11,918 |
| * | Tutor Perini Corp. | 710,442 | 11,893 |
| * | Team Inc. | 366,745 | 11,721 |
| * | UTi Worldwide Inc. | 1,645,862 | 11,570 |
| | McGrath RentCorp | 449,634 | 11,326 |
| | Harsco Corp. | 1,435,546 | 11,312 |
| * | Press Ganey Holdings Inc. | 357,985 | 11,294 |
| | Altra Industrial Motion Corp. | 448,660 | 11,252 |
| | General Cable Corp. | 837,486 | 11,247 |
| * | Newport Corp. | 679,726 | 10,787 |
| | Resources Connection Inc. | 657,303 | 10,740 |
| | Raven Industries Inc. | 683,380 | 10,661 |
| * | Aerovironment Inc. | 361,726 | 10,660 |
| * | Engility Holdings Inc. | 328,182 | 10,659 |
| | AVX Corp. | 869,075 | 10,551 |
| | Materion Corp. | 369,028 | 10,333 |
| | CTS Corp. | 584,495 | 10,311 |
| * | Lydall Inc. | 290,586 | 10,310 |
| * | RPX Corp. | 934,750 | 10,282 |
| * | Saia Inc. | 457,713 | 10,184 |
| * | Patrick Industries Inc. | 233,384 | 10,152 |
| | HEICO Corp. | 183,907 | 9,997 |
| * | Echo Global Logistics Inc. | 490,143 | 9,994 |
| | H&E Equipment Services Inc. | 571,321 | 9,987 |
| * | Cross Country Healthcare Inc. | 602,449 | 9,874 |
| | Viad Corp. | 348,308 | 9,833 |
| | Cass Information Systems Inc. | 186,902 | 9,618 |
| * | Thermon Group Holdings Inc. | 567,686 | 9,605 |
| | TAL International Group Inc. | 596,941 | 9,491 |
| | TeleTech Holdings Inc. | 338,986 | 9,461 |
| * | PGT Inc. | 830,316 | 9,457 |
| | ArcBest Corp. | 435,747 | 9,321 |
| * | Air Transport Services Group Inc. | 916,508 | 9,238 |
| * | FARO Technologies Inc. | 308,251 | 9,100 |
| * | Monster Worldwide Inc. | 1,548,420 | 8,872 |
| | Gorman-Rupp Co. | 323,580 | 8,649 |
| | Alamo Group Inc. | 165,456 | 8,620 |
| * | Installed Building Products Inc. | 345,338 | 8,575 |
| | Ennis Inc. | 444,926 | 8,565 |
| | Kelly Services Inc. Class A | 528,603 | 8,537 |
| | Heidrick & Struggles International Inc. | 309,538 | 8,426 |
| | Global Brass & Copper Holdings Inc. | 387,534 | 8,254 |
| * | CBIZ Inc. | 837,164 | 8,254 |
| *,^ | Navistar International Corp. | 910,776 | 8,051 |
| * | TTM Technologies Inc. | 1,231,743 | 8,019 |
| * | YRC Worldwide Inc. | 565,371 | 8,017 |
| | Douglas Dynamics Inc. | 378,881 | 7,983 |
| * | Rentrak Corp. | 164,848 | 7,835 |
| ^ | American Railcar Industries Inc. | 169,298 | 7,835 |
| | Marten Transport Ltd. | 439,231 | 7,774 |
| | Hyster-Yale Materials Handling Inc. | 146,599 | 7,689 |
| | Kadant Inc. | 188,546 | 7,657 |
| * | Nortek Inc. | 174,992 | 7,633 |
| * | MYR Group Inc. | 367,787 | 7,580 |
43
| | | |
| Vanguard® Total Stock Market Index Fund | | |
| Schedule of Investments | | |
| December 31, 2015 | | |
| |
| | | | Market |
| | | | Value |
| | | Shares | ($000) |
| | Argan Inc. | 230,647 | 7,473 |
| | NN Inc. | 454,172 | 7,240 |
| * | DHI Group Inc. | 762,782 | 6,995 |
| | Myers Industries Inc. | 508,799 | 6,777 |
| * | GSI Group Inc. | 492,032 | 6,701 |
| * | NCI Building Systems Inc. | 537,677 | 6,673 |
| * | DXP Enterprises Inc. | 282,162 | 6,433 |
| | Schnitzer Steel Industries Inc. | 447,002 | 6,423 |
| | Columbus McKinnon Corp. | 338,415 | 6,396 |
| | Insteel Industries Inc. | 297,269 | 6,219 |
| * | Kimball Electronics Inc. | 557,228 | 6,124 |
| | SPX Corp. | 655,166 | 6,113 |
| * | GP Strategies Corp. | 233,269 | 5,857 |
| | Park-Ohio Holdings Corp. | 157,875 | 5,807 |
| | American Science & Engineering Inc. | 140,124 | 5,798 |
| * | Mistras Group Inc. | 302,673 | 5,778 |
| ^ | Textainer Group Holdings Ltd. | 408,298 | 5,761 |
| * | PowerSecure International Inc. | 381,734 | 5,745 |
| | Landauer Inc. | 170,328 | 5,607 |
| | TimkenSteel Corp. | 659,866 | 5,530 |
| | Daktronics Inc. | 629,183 | 5,486 |
| * | Roadrunner Transportation Systems Inc. | 581,350 | 5,482 |
| * | AEP Industries Inc. | 68,682 | 5,299 |
| * | Bazaarvoice Inc. | 1,209,617 | 5,298 |
| | Park Electrochemical Corp. | 351,447 | 5,293 |
| | Barrett Business Services Inc. | 121,174 | 5,276 |
| * | Landec Corp. | 439,138 | 5,195 |
| * | Everi Holdings Inc. | 1,177,183 | 5,168 |
| | Mesa Laboratories Inc. | 50,766 | 5,051 |
| | Celadon Group Inc. | 501,560 | 4,960 |
| * | InnerWorkings Inc. | 661,185 | 4,959 |
| * | Lionbridge Technologies Inc. | 994,607 | 4,884 |
| * | Multi Packaging Solutions International Ltd. | 272,320 | 4,725 |
| | NVE Corp. | 83,161 | 4,672 |
| * | ServiceSource International Inc. | 1,013,396 | 4,672 |
| | LSI Industries Inc. | 376,911 | 4,595 |
| * | Ply Gem Holdings Inc. | 365,798 | 4,587 |
| | Quad/Graphics Inc. | 488,621 | 4,544 |
| | VSE Corp. | 72,692 | 4,520 |
| | Checkpoint Systems Inc. | 715,192 | 4,484 |
| *,^ | Energy Recovery Inc. | 626,168 | 4,427 |
| * | Furmanite Corp. | 643,065 | 4,283 |
| | Powell Industries Inc. | 164,271 | 4,276 |
| | FreightCar America Inc. | 219,111 | 4,257 |
| * | Covenant Transportation Group Inc. Class A | 224,480 | 4,240 |
| * | BMC Stock Holdings Inc. | 243,883 | 4,085 |
| * | Great Lakes Dredge & Dock Corp. | 1,021,756 | 4,046 |
| * | Milacron Holdings Corp. | 303,629 | 3,798 |
| * | Era Group Inc. | 340,079 | 3,792 |
| | CECO Environmental Corp. | 491,025 | 3,771 |
| | Acacia Research Corp. | 870,953 | 3,736 |
| * | Maxwell Technologies Inc. | 521,313 | 3,722 |
| * | Casella Waste Systems Inc. Class A | 611,602 | 3,657 |
| * | Multi-Fineline Electronix Inc. | 168,651 | 3,488 |
| | Miller Industries Inc. | 154,675 | 3,369 |
| * | Kratos Defense & Security Solutions Inc. | 819,552 | 3,360 |
| * | Horizon Global Corp. | 314,114 | 3,257 |
| * | Franklin Covey Co. | 189,805 | 3,177 |
| * | CAI International Inc. | 300,803 | 3,032 |
| | NACCO Industries Inc. Class A | 71,825 | 3,031 |
| * | CRA International Inc. | 160,733 | 2,998 |
| *,^ | MINDBODY Inc. Class A | 198,077 | 2,997 |
| | LB Foster Co. Class A | 219,290 | 2,996 |
| * | Ducommun Inc. | 183,802 | 2,981 |
44
| | | |
| Vanguard® Total Stock Market Index Fund | | |
| Schedule of Investments | | |
| December 31, 2015 | | |
| |
| | | | Market |
| | | | Value |
| | | Shares | ($000) |
| * | ARC Document Solutions Inc. | 672,458 | 2,972 |
| | Graham Corp. | 174,711 | 2,939 |
| | Bel Fuse Inc. Class B | 169,743 | 2,935 |
| * | Sparton Corp. | 145,783 | 2,914 |
| * | PFSweb Inc. | 223,840 | 2,881 |
| * | UFP Technologies Inc. | 120,128 | 2,861 |
| | Allied Motion Technologies Inc. | 108,637 | 2,844 |
| | Electro Rent Corp. | 304,296 | 2,800 |
| | Hurco Cos. Inc. | 103,360 | 2,745 |
| * | USA Truck Inc. | 157,251 | 2,744 |
| * | TRC Cos. Inc. | 291,232 | 2,694 |
| | Hardinge Inc. | 288,250 | 2,687 |
| * | Evolent Health Inc. Class A | 219,720 | 2,661 |
| * | Sharps Compliance Corp. | 305,221 | 2,655 |
| | Black Box Corp. | 271,577 | 2,588 |
| *,^ | CUI Global Inc. | 366,457 | 2,580 |
| * | Vicor Corp. | 272,529 | 2,485 |
| * | Heritage-Crystal Clean Inc. | 232,668 | 2,466 |
| * | Willis Lease Finance Corp. | 122,689 | 2,466 |
| * | Hill International Inc. | 616,720 | 2,393 |
| *,^ | Control4 Corp. | 329,066 | 2,392 |
| *,^ | MicroVision Inc. | 821,900 | 2,351 |
| * | Electro Scientific Industries Inc. | 452,298 | 2,347 |
| *,^ | Eagle Bulk Shipping Inc. | 654,989 | 2,306 |
| | Twin Disc Inc. | 213,122 | 2,242 |
| * | Lawson Products Inc. | 94,237 | 2,200 |
| | Universal Truckload Services Inc. | 155,946 | 2,189 |
| * | Vishay Precision Group Inc. | 187,891 | 2,127 |
| * | Xerium Technologies Inc. | 176,654 | 2,093 |
| * | Energy Focus Inc. | 150,203 | 2,065 |
| * | Orion Marine Group Inc. | 490,153 | 2,044 |
| * | Higher One Holdings Inc. | 618,084 | 2,003 |
| | Houston Wire & Cable Co. | 378,648 | 1,999 |
| *,^ | NV5 Global Inc. | 90,895 | 1,998 |
| * | Northwest Pipe Co. | 175,280 | 1,961 |
| * | EnerNOC Inc. | 504,744 | 1,943 |
| * | Intevac Inc. | 411,139 | 1,936 |
| * | Kemet Corp. | 800,263 | 1,897 |
| *,^ | Research Frontiers Inc. | 360,926 | 1,880 |
| * | Astronics Corp. Class B | 46,196 | 1,878 |
| | Eastern Co. | 96,910 | 1,817 |
| * | Ameresco Inc. Class A | 288,977 | 1,806 |
| * | Sterling Construction Co. Inc. | 296,187 | 1,801 |
| * | Layne Christensen Co. | 341,451 | 1,796 |
| *,^ | Energous Corp. | 226,093 | 1,788 |
| | National Research Corp. Class A | 109,976 | 1,764 |
| * | PRGX Global Inc. | 470,499 | 1,750 |
| * | Planet Payment Inc. | 568,961 | 1,735 |
| * | SL Industries Inc. | 54,078 | 1,724 |
| * | LMI Aerospace Inc. | 170,345 | 1,715 |
| | United States Lime & Minerals Inc. | 31,038 | 1,706 |
| | Supreme Industries Inc. Class A | 248,880 | 1,705 |
| * | PAM Transportation Services Inc. | 61,693 | 1,702 |
| | Dynamic Materials Corp. | 242,869 | 1,698 |
| | CDI Corp. | 246,500 | 1,666 |
| *,^ | Blue Bird Corp. | 161,939 | 1,642 |
| | Universal Technical Institute Inc. | 351,925 | 1,640 |
| | Spartan Motors Inc. | 527,159 | 1,639 |
| *,^ | Manitex International Inc. | 269,638 | 1,604 |
| *,^ | Power Solutions International Inc. | 87,093 | 1,589 |
| | ModusLink Global Solutions Inc. | 634,148 | 1,573 |
| *,^ | ExOne Co. | 153,900 | 1,545 |
| | Richardson Electronics Ltd. | 271,503 | 1,539 |
| | Information Services Group Inc. | 419,236 | 1,518 |
45
| | | |
| Vanguard® Total Stock Market Index Fund | | |
| Schedule of Investments | | |
| December 31, 2015 | | |
| |
| | | | Market |
| | | | Value |
| | | Shares | ($000) |
| * | Commercial Vehicle Group Inc. | 536,566 | 1,481 |
| | Omega Flex Inc. | 44,518 | 1,470 |
| * | Accuride Corp. | 867,885 | 1,441 |
| *,^ | Patriot National Inc. | 212,461 | 1,426 |
| * | Neff Corp. Class A | 185,510 | 1,421 |
| * | Hudson Global Inc. | 479,777 | 1,401 |
| *,^ | American Superconductor Corp. | 219,586 | 1,399 |
| * | Aspen Aerogels Inc. | 225,000 | 1,366 |
| * | Perceptron Inc. | 168,972 | 1,316 |
| * | Hudson Technologies Inc. | 436,201 | 1,296 |
| * | Mattersight Corp. | 196,394 | 1,288 |
| * | Napco Security Technologies Inc. | 215,491 | 1,271 |
| * | Willdan Group Inc. | 146,259 | 1,226 |
| * | CPI Aerostructures Inc. | 120,673 | 1,174 |
| | Crawford & Co. Class B | 219,434 | 1,165 |
| *,^ | Applied DNA Sciences Inc. | 351,468 | 1,139 |
| | Crawford & Co. Class A | 217,594 | 1,103 |
| *,^ | Synthesis Energy Systems Inc. | 1,117,647 | 1,072 |
| * | Ultralife Corp. | 165,009 | 1,066 |
| * | Radiant Logistics Inc. | 310,329 | 1,064 |
| | Global Power Equipment Group Inc. | 287,939 | 1,002 |
| * | Orion Energy Systems Inc. | 453,341 | 984 |
| | National Research Corp. Class B | 26,971 | 966 |
| * | Breeze-Eastern Corp. | 47,816 | 947 |
| * | Frequency Electronics Inc. | 88,389 | 939 |
| * | Iteris Inc. | 426,979 | 918 |
| * | Gencor Industries Inc. | 79,762 | 901 |
| * | CyberOptics Corp. | 116,386 | 890 |
| * | General Finance Corp. | 220,467 | 880 |
| *,^ | Cenveo Inc. | 994,568 | 867 |
| *,^ | ClearSign Combustion Corp. | 175,508 | 851 |
| * | Volt Information Sciences Inc. | 101,733 | 828 |
| | MOCON Inc. | 55,449 | 806 |
| | Espey Manufacturing & Electronics Corp. | 30,766 | 801 |
| * | Patriot Transportation Holding Inc. | 34,473 | 800 |
| * | Integrated Electrical Services Inc. | 70,864 | 784 |
| * | Ballantyne Strong Inc. | 163,571 | 746 |
| * | Key Technology Inc. | 67,425 | 699 |
| * | Arotech Corp. | 334,820 | 683 |
| * | Innovative Solutions & Support Inc. | 238,921 | 659 |
| * | Lincoln Educational Services Corp. | 330,578 | 658 |
| *,^ | Revolution Lighting Technologies Inc. | 820,317 | 652 |
| * | StarTek Inc. | 181,371 | 649 |
| * | Rand Logistics Inc. | 380,273 | 608 |
| *,^ | A. M. Castle & Co. | 370,719 | 589 |
| * | MFRI Inc. | 85,003 | 556 |
| * | Perma-Fix Environmental Services | 144,397 | 540 |
| *,^ | Rubicon Technology Inc. | 456,333 | 520 |
| | RF Industries Ltd. | 117,094 | 514 |
| * | Versar Inc. | 164,937 | 510 |
| | Air Industries Group | 63,766 | 505 |
| * | Goldfield Corp. | 322,941 | 501 |
| * | Air T Inc. | 19,270 | 472 |
| * | Fuel Tech Inc. | 249,091 | 471 |
| * | Broadwind Energy Inc. | 220,680 | 459 |
| *,^ | Digital Ally Inc. | 72,345 | 457 |
| *,^ | Capstone Turbine Corp. | 292,067 | 409 |
| *,^ | Turtle Beach Corp. | 191,477 | 385 |
| * | UQM Technologies Inc. | 574,458 | 382 |
| *,^ | Odyssey Marine Exploration Inc. | 1,346,953 | 364 |
| *,^ | Vertex Energy Inc. | 323,481 | 356 |
| * | Wireless Telecom Group Inc. | 205,351 | 353 |
| * | LightPath Technologies Inc. Class A | 122,799 | 348 |
| | AMCON Distributing Co. | 4,112 | 333 |
46
| | | |
| Vanguard® Total Stock Market Index Fund | | |
| Schedule of Investments | | |
| December 31, 2015 | | |
| |
| | | | Market |
| | | | Value |
| | | Shares | ($000) |
| * | Image Sensing Systems Inc. | 88,473 | 323 |
| * | Active Power Inc. | 244,883 | 318 |
| * | BlueLinx Holdings Inc. | 597,002 | 316 |
| * | Astrotech Corp. | 194,445 | 298 |
| * | eMagin Corp. | 211,710 | 294 |
| * | SIFCO Industries Inc. | 29,538 | 281 |
| * | Echelon Corp. | 49,428 | 279 |
| | Chicago Rivet & Machine Co. | 11,046 | 258 |
| * | IEC Electronics Corp. | 78,991 | 258 |
| * | Erickson Inc. | 123,800 | 255 |
| * | ENGlobal Corp. | 236,848 | 230 |
| * | Sevcon Inc. | 21,782 | 228 |
| * | SigmaTron International Inc. | 30,172 | 227 |
| *,^ | Lightbridge Corp. | 203,945 | 206 |
| * | Quest Resource Holding Corp. | 301,550 | 202 |
| * | DLH Holdings Corp. | 47,352 | 198 |
| | EnviroStar Inc. | 47,800 | 198 |
| * | API Technologies Corp. | 131,804 | 182 |
| * | AMREP Corp. | 41,386 | 180 |
| * | Asure Software Inc. | 38,646 | 174 |
| * | Swisher Hygiene Inc. | 175,315 | 169 |
| * | Onvia Inc. | 44,738 | 166 |
| * | Marathon Patent Group Inc. | 103,606 | 166 |
| *,^ | Nuverra Environmental Solutions Inc. | 304,361 | 156 |
| * | Sypris Solutions Inc. | 141,883 | 155 |
| | Bel Fuse Inc. Class A | 10,580 | 154 |
| * | American Electric Technologies Inc. | 72,950 | 152 |
| * | Luna Innovations Inc. | 127,530 | 138 |
| | Ecology and Environment Inc. | 13,280 | 136 |
| * | Aqua Metals Inc. | 21,121 | 113 |
| * | American DG Energy Inc. | 324,240 | 108 |
| * | Continental Materials Corp. | 7,139 | 107 |
| * | Overseas Shipholding Group Inc. Class B | 31,082 | 103 |
| * | Pioneer Power Solutions Inc. | 26,639 | 103 |
| * | Giga-tronics Inc. | 59,200 | 96 |
| * | Flextronics International Ltd. | 7,608 | 85 |
| * | Cartesian Inc. | 33,694 | 74 |
| * | Nortech Systems Inc. | 17,942 | 70 |
| * | Industrial Services of America Inc. | 48,993 | 64 |
| * | IntriCon Corp. | 7,964 | 60 |
| *,^ | Spherix Inc. | 391,700 | 57 |
| * | Vicon Industries Inc. | 29,860 | 53 |
| * | CryoPort Inc. | 23,613 | 48 |
| * | AeroCentury Corp. | 3,772 | 48 |
| *,^ | EnSync Inc. | 111,094 | 42 |
| * | Micronet Enertec Technologies Inc. | 19,850 | 42 |
| | Servotronics Inc. | 4,914 | 40 |
| * | Payment Data Systems Inc. | 18,232 | 36 |
| * | Document Security Systems Inc. | 203,373 | 35 |
| | WSI Industries Inc. | 6,300 | 27 |
| | Art's-Way Manufacturing Co. Inc. | 7,669 | 24 |
| * | Command Security Corp. | 9,727 | 22 |
| * | Tel-Instrument Electronics Corp. | 4,297 | 21 |
| * | Cemtrex Inc. | 3,752 | 9 |
| * | Overseas Shipholding Group Inc. Class A | 3,108 | 9 |
| * | Electro-Sensors Inc. | 1,300 | 5 |
| * | JetPay Corp. | 729 | 2 |
| * | CTPartners Executive Search Inc. | 100,659 | — |
| * | LGL GROUP INC WARRANTS EXP 6/8/18 | 3,000 | — |
| | | | 49,185,181 |
| Oil & Gas (6.0%) | | |
| | Exxon Mobil Corp. | 76,325,369 | 5,949,562 |
| | Chevron Corp. | 34,502,641 | 3,103,858 |
| | Schlumberger Ltd. | 23,113,905 | 1,612,195 |
47
| | | |
| Vanguard® Total Stock Market Index Fund | | |
| Schedule of Investments | | |
| December 31, 2015 | | |
| |
| | | | Market |
| | | | Value |
| | | Shares | ($000) |
| | ConocoPhillips | 22,627,022 | 1,056,456 |
| | Occidental Petroleum Corp. | 13,992,254 | 946,016 |
| | Phillips 66 | 8,796,856 | 719,583 |
| | EOG Resources Inc. | 10,073,065 | 713,072 |
| | Valero Energy Corp. | 8,823,174 | 623,887 |
| | Kinder Morgan Inc. | 34,771,661 | 518,793 |
| | Halliburton Co. | 14,885,384 | 506,698 |
| | Marathon Petroleum Corp. | 9,768,176 | 506,382 |
| | Anadarko Petroleum Corp. | 9,309,920 | 452,276 |
| | Baker Hughes Inc. | 7,984,167 | 368,469 |
| | Pioneer Natural Resources Co. | 2,736,272 | 343,074 |
| | Williams Cos. Inc. | 12,369,888 | 317,906 |
| | Apache Corp. | 6,921,511 | 307,800 |
| | Spectra Energy Corp. | 12,281,561 | 294,021 |
| | Noble Energy Inc. | 7,831,542 | 257,893 |
| | Tesoro Corp. | 2,206,936 | 232,545 |
| | National Oilwell Varco Inc. | 6,932,060 | 232,155 |
| | Devon Energy Corp. | 7,177,581 | 229,683 |
| | Hess Corp. | 4,700,097 | 227,861 |
| * | Cameron International Corp. | 3,495,783 | 220,933 |
| * | Concho Resources Inc. | 2,363,760 | 219,499 |
| | Marathon Oil Corp. | 12,425,514 | 156,437 |
| | Cimarex Energy Co. | 1,729,101 | 154,547 |
| | EQT Corp. | 2,787,052 | 145,289 |
| | Columbia Pipeline Group Inc. | 7,111,097 | 142,222 |
| * | Cheniere Energy Inc. | 3,690,142 | 137,458 |
| | HollyFrontier Corp. | 3,404,815 | 135,818 |
| | Cabot Oil & Gas Corp. | 7,570,104 | 133,915 |
| * | Weatherford International plc | 14,439,462 | 121,147 |
| * | FMC Technologies Inc. | 4,156,420 | 120,578 |
| *,^ | Antero Resources Corp. | 4,822,006 | 105,120 |
| | Helmerich & Payne Inc. | 1,854,137 | 99,289 |
| * | Newfield Exploration Co. | 2,982,622 | 97,114 |
| | OGE Energy Corp. | 3,611,158 | 94,937 |
| * | First Solar Inc. | 1,384,590 | 91,369 |
| ^ | Core Laboratories NV | 806,683 | 87,719 |
| * | Diamondback Energy Inc. | 1,214,789 | 81,269 |
| ^ | Transocean Ltd. | 6,399,313 | 79,223 |
| | Range Resources Corp. | 2,940,820 | 72,374 |
| | Murphy Oil Corp. | 2,994,876 | 67,235 |
| | Oceaneering International Inc. | 1,769,485 | 66,391 |
| | PBF Energy Inc. Class A | 1,786,061 | 65,745 |
| | Ensco plc Class A | 4,260,540 | 65,570 |
| | Energen Corp. | 1,429,900 | 58,612 |
| *,^ | Southwestern Energy Co. | 7,014,782 | 49,875 |
| ^ | Chesapeake Energy Corp. | 11,026,789 | 49,621 |
| | Nabors Industries Ltd. | 5,824,699 | 49,568 |
| * | Gulfport Energy Corp. | 1,983,369 | 48,731 |
| ^ | Noble Corp. plc | 4,373,005 | 46,135 |
| | Western Refining Inc. | 1,290,164 | 45,956 |
| | QEP Resources Inc. | 3,250,864 | 43,562 |
| * | Dril-Quip Inc. | 699,898 | 41,455 |
| *,^ | Continental Resources Inc. | 1,762,213 | 40,496 |
| * | PDC Energy Inc. | 725,813 | 38,744 |
| | Patterson-UTI Energy Inc. | 2,533,888 | 38,211 |
| | Rowan Cos. plc Class A | 2,236,457 | 37,908 |
| | Superior Energy Services Inc. | 2,741,631 | 36,930 |
| * | Whiting Petroleum Corp. | 3,828,139 | 36,138 |
| * | Cobalt International Energy Inc. | 6,406,433 | 34,595 |
| * | Parsley Energy Inc. Class A | 1,829,062 | 33,746 |
| * | Memorial Resource Development Corp. | 1,851,344 | 29,899 |
| *,^ | SunPower Corp. Class A | 996,290 | 29,899 |
| * | Carrizo Oil & Gas Inc. | 1,010,654 | 29,895 |
| * | WPX Energy Inc. | 5,181,267 | 29,740 |
48
| | | |
| Vanguard® Total Stock Market Index Fund | | |
| Schedule of Investments | | |
| December 31, 2015 | | |
| |
| | | | Market |
| | | | Value |
| | | Shares | ($000) |
| *,^ | NOW Inc. | 1,849,493 | 29,259 |
| * | RSP Permian Inc. | 1,133,441 | 27,645 |
| | Targa Resources Corp. | 975,578 | 26,399 |
| * | Matador Resources Co. | 1,329,527 | 26,285 |
| * | Oil States International Inc. | 929,312 | 25,324 |
| | SM Energy Co. | 1,271,596 | 25,000 |
| | Delek US Holdings Inc. | 993,431 | 24,438 |
| ^ | Diamond Offshore Drilling Inc. | 1,114,202 | 23,510 |
| | SemGroup Corp. Class A | 809,147 | 23,352 |
| * | MRC Global Inc. | 1,755,828 | 22,650 |
| | Pattern Energy Group Inc. Class A | 1,005,233 | 21,019 |
| *,^ | Oasis Petroleum Inc. | 2,492,849 | 18,372 |
| *,^ | Laredo Petroleum Inc. | 2,172,852 | 17,361 |
| * | SEACOR Holdings Inc. | 301,624 | 15,853 |
| | Bristow Group Inc. | 594,929 | 15,409 |
| ^ | RPC Inc. | 1,251,327 | 14,953 |
| * | Rice Energy Inc. | 1,361,790 | 14,843 |
| | Green Plains Inc. | 646,557 | 14,806 |
| * | McDermott International Inc. | 4,338,738 | 14,535 |
| * | Synergy Resources Corp. | 1,596,701 | 13,604 |
| * | Forum Energy Technologies Inc. | 1,078,558 | 13,439 |
| | California Resources Corp. | 5,754,154 | 13,407 |
| ^ | Denbury Resources Inc. | 6,555,179 | 13,241 |
| | CVR Energy Inc. | 330,545 | 13,007 |
| * | Callon Petroleum Co. | 1,404,994 | 11,718 |
| * | Unit Corp. | 918,989 | 11,212 |
| ^ | Atwood Oceanics Inc. | 1,085,138 | 11,101 |
| * | TETRA Technologies Inc. | 1,426,526 | 10,727 |
| *,^ | Flotek Industries Inc. | 918,901 | 10,512 |
| * | Chart Industries Inc. | 553,375 | 9,939 |
| * | Matrix Service Co. | 475,860 | 9,774 |
| * | Exterran Corp. | 591,589 | 9,495 |
| * | Par Pacific Holdings Inc. | 399,428 | 9,402 |
| * | Helix Energy Solutions Group Inc. | 1,728,399 | 9,091 |
| * | Archrock Inc. | 1,195,562 | 8,991 |
| | Alon USA Energy Inc. | 566,290 | 8,404 |
| * | Newpark Resources Inc. | 1,423,481 | 7,516 |
| *,^ | Plug Power Inc. | 3,245,462 | 6,848 |
| *,^ | Ultra Petroleum Corp. | 2,681,289 | 6,703 |
| * | REX American Resources Corp. | 122,176 | 6,606 |
| ^ | CARBO Ceramics Inc. | 360,993 | 6,209 |
| ^ | Tidewater Inc. | 848,681 | 5,907 |
| * | Hornbeck Offshore Services Inc. | 576,208 | 5,727 |
| * | Renewable Energy Group Inc. | 551,301 | 5,122 |
| *,^ | C&J Energy Services Ltd. | 1,059,628 | 5,044 |
| * | Natural Gas Services Group Inc. | 207,024 | 4,617 |
| | Tesco Corp. | 637,507 | 4,616 |
| * | Pacific Ethanol Inc. | 958,004 | 4,579 |
| * | Stone Energy Corp. | 1,009,385 | 4,330 |
| *,^ | Sanchez Energy Corp. | 988,338 | 4,260 |
| | Panhandle Oil and Gas Inc. Class A | 258,414 | 4,176 |
| * | Bonanza Creek Energy Inc. | 760,561 | 4,008 |
| *,^ | Northern Oil and Gas Inc. | 1,023,306 | 3,950 |
| * | Parker Drilling Co. | 2,131,049 | 3,878 |
| *,^ | EXCO Resources Inc. | 3,014,219 | 3,738 |
| *,^ | Bill Barrett Corp. | 925,753 | 3,638 |
| * | Trecora Resources | 272,819 | 3,380 |
| * | Green Brick Partners Inc. | 466,828 | 3,361 |
| * | Clayton Williams Energy Inc. | 111,863 | 3,308 |
| * | PHI Inc. | 199,995 | 3,282 |
| * | Ring Energy Inc. | 456,180 | 3,216 |
| *,^ | EP Energy Corp. Class A | 729,650 | 3,196 |
| * | Geospace Technologies Corp. | 220,904 | 3,108 |
| | Gulf Island Fabrication Inc. | 294,520 | 3,081 |
49
| | | |
| Vanguard® Total Stock Market Index Fund | | |
| Schedule of Investments | | |
| December 31, 2015 | | |
| |
| | | | Market |
| | | | Value |
| | | Shares | ($000) |
| *,^ | Solazyme Inc. | 1,146,264 | 2,843 |
| * | Willbros Group Inc. | 977,494 | 2,629 |
| * | Pioneer Energy Services Corp. | 1,157,343 | 2,511 |
| *,^ | FuelCell Energy Inc. | 423,635 | 2,101 |
| *,^ | SandRidge Energy Inc. | 10,461,259 | 2,092 |
| * | Abraxas Petroleum Corp. | 1,957,369 | 2,075 |
| *,^ | Gulfmark Offshore Inc. | 442,494 | 2,066 |
| *,^ | Basic Energy Services Inc. | 744,281 | 1,995 |
| * | Jones Energy Inc. Class A | 510,685 | 1,966 |
| *,^ | Enphase Energy Inc. | 552,239 | 1,938 |
| * | Gastar Exploration Inc. | 1,441,735 | 1,889 |
| *,^ | Halcon Resources Corp. | 1,459,991 | 1,840 |
| ^ | Energy XXI Ltd. | 1,810,190 | 1,828 |
| * | Contango Oil & Gas Co. | 283,542 | 1,817 |
| | Evolution Petroleum Corp. | 361,379 | 1,738 |
| * | VAALCO Energy Inc. | 1,083,761 | 1,734 |
| *,^ | Approach Resources Inc. | 849,924 | 1,564 |
| *,^ | Eclipse Resources Corp. | 825,126 | 1,502 |
| * | Key Energy Services Inc. | 3,039,165 | 1,465 |
| *,^ | W&T Offshore Inc. | 623,979 | 1,441 |
| *,^ | Comstock Resources Inc. | 760,452 | 1,422 |
| * | Independence Contract Drilling Inc. | 266,700 | 1,347 |
| | Dawson Geophysical Co. | 380,690 | 1,317 |
| *,^ | Triangle Petroleum Corp. | 1,666,236 | 1,283 |
| * | ION Geophysical Corp. | 2,531,976 | 1,274 |
| | Adams Resources & Energy Inc. | 32,683 | 1,255 |
| *,^ | Rex Energy Corp. | 1,112,967 | 1,169 |
| *,^ | Resolute Energy Corp. | 1,334,836 | 1,161 |
| *,^ | Seventy Seven Energy Inc. | 1,097,172 | 1,152 |
| * | Ideal Power Inc. | 124,302 | 994 |
| * | Zion Oil & Gas Inc. | 442,206 | 822 |
| * | Aemetis Inc. | 269,539 | 782 |
| *,^ | Amyris Inc. | 471,488 | 764 |
| *,^ | MagneGas Corp. | 426,306 | 686 |
| * | Mitcham Industries Inc. | 217,180 | 654 |
| * | PetroQuest Energy Inc. | 1,079,148 | 540 |
| *,^ | Penn Virginia Corp. | 1,260,560 | 379 |
| * | Dakota Plains Holdings Inc. | 1,276,479 | 317 |
| * | Harvest Natural Resources Inc. | 708,487 | 301 |
| * | Warren Resources Inc. | 1,371,765 | 288 |
| * | Eco-Stim Energy Solutions Inc. | 76,612 | 240 |
| *,^ | Goodrich Petroleum Corp. | 887,364 | 236 |
| * | PrimeEnergy Corp. | 4,540 | 233 |
| *,^ | Blue Earth Inc. | 399,346 | 200 |
| * | Enservco Corp. | 365,671 | 197 |
| *,^ | Torchlight Energy Resources Inc. | 189,285 | 191 |
| *,^ | Glori Energy Inc. | 472,092 | 168 |
| *,^ | Gevo Inc. | 220,570 | 137 |
| * | SAExploration Holdings Inc. | 65,685 | 131 |
| *,^ | Emerald Oil Inc. | 112,534 | 127 |
| *,^ | Midstates Petroleum Co. Inc. | 61,659 | 125 |
| * | Superior Drilling Products Inc. | 97,596 | 103 |
| * | Yuma Energy Inc. | 215,013 | 41 |
| * | PHI Inc. | 2,285 | 41 |
| * | Forbes Energy Services Ltd. | 85,788 | 25 |
| * | Tengasco Inc. | 177,040 | 21 |
| * | Royale Energy Inc. | 54,098 | 19 |
| * | US Energy Corp. Wyoming | 119,438 | 19 |
| * | GreenHunter Resources Inc. | 145,065 | 15 |
| * | FX Energy Inc. | 2,200 | 2 |
| * | Magellan Petroleum Corp. | 3,526 | 2 |
| | | | 23,905,794 |
| Other (0.0%)2 | | |
| * | Leap Wireless International Inc CVR | 872,848 | 2,200 |
50
| | | |
| Vanguard® Total Stock Market Index Fund | | |
| Schedule of Investments | | |
| December 31, 2015 | | |
| |
| | | | Market |
| | | | Value |
| | | Shares | ($000) |
| * | Adolor Corp. Rights Exp. 07/01/2019 | 592,629 | 308 |
| * | Chelsea Therapeutics International Ltd. CVR Exp. 12/31/2016 | 1,157,305 | 127 |
| * | Ambit Biosciences Corp. CVR Rights | 201,330 | 121 |
| * | NuPathe Inc. CVR | 158,681 | 95 |
| * | Omthera Pharmaceuticals Inc. CVR | 121,311 | 73 |
| *,^ | Cubist Pharmaceuticals, Inc. CVR | 511,822 | 67 |
| * | Clinical Data Contingent Value Rights | 216,285 | — |
| * | Gerber Scientific Inc. CVR | 388,581 | — |
| * | Hooper Holmes Inc. Rights Expire 1/18/2016 | 438,539 | — |
| *,^ | Biosante Pharmaceutical Inc CVR | 253,823 | — |
| *,^ | Magnum Hunter Resources Corp. Warrants Expire 4/15/2016 | 224,250 | — |
| * | Allen Organ Co. Escrow Shares | 11,462 | — |
| * | Trubion Pharmaceuticals Inc. CVR | 104 | — |
| | | | 2,991 |
| Technology (16.1%) | | |
| | Apple Inc. | 97,115,836 | 10,222,413 |
| | Microsoft Corp. | 139,139,690 | 7,719,470 |
| * | Alphabet Inc. Class A | 5,349,364 | 4,161,859 |
| * | Facebook Inc. Class A | 39,548,793 | 4,139,177 |
| * | Alphabet Inc. | 5,376,206 | 4,079,895 |
| | Intel Corp. | 86,562,141 | 2,982,066 |
| | Cisco Systems Inc. | 93,085,371 | 2,527,733 |
| | International Business Machines Corp. | 16,011,036 | 2,203,439 |
| | Oracle Corp. | 58,669,027 | 2,143,180 |
| | QUALCOMM Inc. | 27,557,132 | 1,377,443 |
| | Texas Instruments Inc. | 18,606,365 | 1,019,815 |
| | EMC Corp. | 35,567,422 | 913,371 |
| * | salesforce.com inc | 11,563,653 | 906,590 |
| * | Adobe Systems Inc. | 8,685,075 | 815,876 |
| | Avago Technologies Ltd. Class A | 4,806,244 | 697,626 |
| * | Cognizant Technology Solutions Corp. Class A | 11,145,023 | 668,924 |
| | Broadcom Corp. Class A | 10,284,313 | 594,639 |
| * | Yahoo! Inc. | 15,577,409 | 518,105 |
| | Hewlett Packard Enterprise Co. | 33,067,963 | 502,633 |
| | Intuit Inc. | 4,599,062 | 443,809 |
| | Applied Materials Inc. | 22,020,420 | 411,121 |
| | Corning Inc. | 21,708,526 | 396,832 |
| | HP Inc. | 33,073,760 | 391,593 |
| * | Cerner Corp. | 5,638,662 | 339,278 |
| | Analog Devices Inc. | 5,720,667 | 316,467 |
| | NVIDIA Corp. | 9,364,408 | 308,651 |
| * | Micron Technology Inc. | 19,908,420 | 281,903 |
| | SanDisk Corp. | 3,678,984 | 279,566 |
| * | Red Hat Inc. | 3,344,724 | 276,977 |
| | Skyworks Solutions Inc. | 3,503,365 | 269,164 |
| * | Palo Alto Networks Inc. | 1,494,118 | 263,174 |
| | Symantec Corp. | 12,353,471 | 259,423 |
| * | Autodesk Inc. | 4,142,950 | 252,430 |
| | Western Digital Corp. | 4,033,837 | 242,232 |
| * | ServiceNow Inc. | 2,761,518 | 239,037 |
| | Lam Research Corp. | 2,901,127 | 230,408 |
| | Xilinx Inc. | 4,711,384 | 221,294 |
| * | Twitter Inc. | 9,399,611 | 217,507 |
| | Motorola Solutions Inc. | 2,974,861 | 203,629 |
| * | Citrix Systems Inc. | 2,690,110 | 203,507 |
| | Seagate Technology plc | 5,478,189 | 200,830 |
| | KLA-Tencor Corp. | 2,858,754 | 198,255 |
| | Maxim Integrated Products Inc. | 5,204,057 | 197,754 |
| | Harris Corp. | 2,264,663 | 196,799 |
| | Linear Technology Corp. | 4,378,883 | 185,971 |
| | Juniper Networks Inc. | 6,703,289 | 185,011 |
| | CA Inc. | 5,993,480 | 171,174 |
| | Microchip Technology Inc. | 3,614,526 | 168,220 |
| * | Akamai Technologies Inc. | 3,095,358 | 162,909 |
51
| | | |
| Vanguard® Total Stock Market Index Fund | | |
| Schedule of Investments | | |
| December 31, 2015 | | |
| |
| | | | Market |
| | | | Value |
| | | Shares | ($000) |
| * | Workday Inc. Class A | 2,029,672 | 161,724 |
| *,^ | VeriSign Inc. | 1,742,586 | 152,232 |
| * | ANSYS Inc. | 1,630,438 | 150,816 |
| | NetApp Inc. | 5,412,603 | 143,596 |
| * | Splunk Inc. | 2,347,378 | 138,049 |
| | CDK Global Inc. | 2,904,745 | 137,888 |
| * | Qorvo Inc. | 2,590,682 | 131,866 |
| * | Synopsys Inc. | 2,843,363 | 129,686 |
| * | Gartner Inc. | 1,428,353 | 129,552 |
| * | F5 Networks Inc. | 1,299,123 | 125,963 |
| | CDW Corp. | 2,767,779 | 116,357 |
| *,^ | athenahealth Inc. | 710,271 | 114,332 |
| * | Cadence Design Systems Inc. | 5,435,073 | 113,104 |
| | SS&C Technologies Holdings Inc. | 1,500,371 | 102,430 |
| * | Tyler Technologies Inc. | 579,359 | 100,994 |
| * | Ultimate Software Group Inc. | 494,469 | 96,674 |
| * | Tableau Software Inc. Class A | 961,015 | 90,547 |
| * | Nuance Communications Inc. | 4,527,745 | 90,057 |
| * | Manhattan Associates Inc. | 1,326,854 | 87,798 |
| | IAC/InterActiveCorp | 1,399,567 | 84,044 |
| * | Fortinet Inc. | 2,677,187 | 83,448 |
| | Ingram Micro Inc. | 2,717,899 | 82,570 |
| | Computer Sciences Corp. | 2,508,024 | 81,962 |
| *,^ | VMware Inc. Class A | 1,437,405 | 81,314 |
| | Teradyne Inc. | 3,821,503 | 78,990 |
| | Garmin Ltd. | 2,089,801 | 77,678 |
| * | Guidewire Software Inc. | 1,282,607 | 77,162 |
| | Pitney Bowes Inc. | 3,621,558 | 74,785 |
| | CSRA Inc. | 2,486,624 | 74,599 |
| * | ON Semiconductor Corp. | 7,537,548 | 73,868 |
| | Leidos Holdings Inc. | 1,308,963 | 73,642 |
| * | ARRIS Group Inc. | 2,397,661 | 73,297 |
| *,^ | NCR Corp. | 2,950,891 | 72,179 |
| * | PTC Inc. | 2,072,092 | 71,757 |
| * | Integrated Device Technology Inc. | 2,674,964 | 70,485 |
| | Brocade Communications Systems Inc. | 7,541,976 | 69,235 |
| | j2 Global Inc. | 832,315 | 68,516 |
| | DST Systems Inc. | 598,037 | 68,212 |
| | Solera Holdings Inc. | 1,230,333 | 67,459 |
| | Marvell Technology Group Ltd. | 7,569,737 | 66,765 |
| * | SolarWinds Inc. | 1,132,070 | 66,679 |
| * | Teradata Corp. | 2,473,857 | 65,359 |
| * | Cavium Inc. | 969,601 | 63,712 |
| | Atmel Corp. | 7,302,255 | 62,872 |
| * | NetSuite Inc. | 732,385 | 61,974 |
| * | IMS Health Holdings Inc. | 2,385,869 | 60,768 |
| * | EPAM Systems Inc. | 767,817 | 60,366 |
| * | CommScope Holding Co. Inc. | 2,256,665 | 58,425 |
| * | Aspen Technology Inc. | 1,509,506 | 56,999 |
| * | Microsemi Corp. | 1,746,161 | 56,907 |
| | Cypress Semiconductor Corp. | 5,769,707 | 56,601 |
| | Blackbaud Inc. | 845,443 | 55,681 |
| * | VeriFone Systems Inc. | 1,970,603 | 55,216 |
| * | Rackspace Hosting Inc. | 2,172,648 | 55,011 |
| * | FireEye Inc. | 2,638,284 | 54,718 |
| * | NetScout Systems Inc. | 1,752,443 | 53,800 |
| * | Qlik Technologies Inc. | 1,691,139 | 53,541 |
| * | Synaptics Inc. | 661,767 | 53,166 |
| *,^ | Arista Networks Inc. | 680,862 | 52,998 |
| | Fair Isaac Corp. | 561,675 | 52,899 |
| * | Allscripts Healthcare Solutions Inc. | 3,412,655 | 52,487 |
| * | Ciena Corp. | 2,454,312 | 50,780 |
| *,^ | Cree Inc. | 1,887,457 | 50,338 |
| | SYNNEX Corp. | 535,801 | 48,185 |
52
| | | |
| Vanguard® Total Stock Market Index Fund | | |
| Schedule of Investments | | |
| December 31, 2015 | | |
| |
| | | | Market |
| | | | Value |
| | | Shares | ($000) |
| * | ViaSat Inc. | 787,028 | 48,017 |
| * | Medidata Solutions Inc. | 949,429 | 46,797 |
| * | Proofpoint Inc. | 712,356 | 46,310 |
| * | Verint Systems Inc. | 1,131,466 | 45,892 |
| * | ACI Worldwide Inc. | 2,128,339 | 45,546 |
| * | Infinera Corp. | 2,508,912 | 45,461 |
| * | Fairchild Semiconductor International Inc. Class A | 2,076,142 | 42,997 |
| * | Tech Data Corp. | 637,912 | 42,345 |
| * | PMC-Sierra Inc. | 3,642,316 | 42,324 |
| | Monolithic Power Systems Inc. | 642,283 | 40,920 |
| * | Dycom Industries Inc. | 583,304 | 40,808 |
| * | CACI International Inc. Class A | 434,853 | 40,346 |
| * | Electronics For Imaging Inc. | 858,837 | 40,142 |
| | Mentor Graphics Corp. | 2,114,010 | 38,940 |
| | Lexmark International Inc. Class A | 1,119,915 | 36,341 |
| * | Veeva Systems Inc. Class A | 1,247,561 | 35,992 |
| | MKS Instruments Inc. | 984,029 | 35,425 |
| * | Fleetmatics Group plc | 690,035 | 35,047 |
| * | Zendesk Inc. | 1,324,897 | 35,030 |
| * | Silicon Laboratories Inc. | 712,865 | 34,602 |
| * | Cirrus Logic Inc. | 1,161,250 | 34,292 |
| * | Entegris Inc. | 2,566,423 | 34,056 |
| * | Demandware Inc. | 614,699 | 33,175 |
| *,^ | Advanced Micro Devices Inc. | 11,515,748 | 33,050 |
| | Plantronics Inc. | 687,577 | 32,605 |
| * | OmniVision Technologies Inc. | 1,112,473 | 32,284 |
| | Science Applications International Corp. | 704,323 | 32,244 |
| | InterDigital Inc. | 654,244 | 32,084 |
| * | MedAssets Inc. | 1,027,553 | 31,792 |
| | Diebold Inc. | 1,055,000 | 31,745 |
| * | EchoStar Corp. Class A | 797,187 | 31,178 |
| * | Ellie Mae Inc. | 512,963 | 30,896 |
| * | Polycom Inc. | 2,412,144 | 30,369 |
| | Intersil Corp. Class A | 2,376,140 | 30,320 |
| * | Cornerstone OnDemand Inc. | 873,646 | 30,167 |
| * | MicroStrategy Inc. Class A | 167,543 | 30,039 |
| * | Syntel Inc. | 643,238 | 29,107 |
| * | CommVault Systems Inc. | 737,653 | 29,027 |
| * | LogMeIn Inc. | 424,548 | 28,487 |
| | Tessera Technologies Inc. | 941,504 | 28,255 |
| * | Finisar Corp. | 1,938,944 | 28,192 |
| *,^ | SunEdison Inc. | 5,507,584 | 28,034 |
| * | Premier Inc. Class A | 780,192 | 27,517 |
| * | Rovi Corp. | 1,586,555 | 26,432 |
| * | Paycom Software Inc. | 699,161 | 26,309 |
| * | Viavi Solutions Inc. | 4,249,778 | 25,881 |
| | Cogent Communications Holdings Inc. | 733,534 | 25,446 |
| * | Rambus Inc. | 2,126,980 | 24,652 |
| * | Synchronoss Technologies Inc. | 694,976 | 24,484 |
| * | HubSpot Inc. | 425,995 | 23,988 |
| | Power Integrations Inc. | 492,009 | 23,926 |
| * | NETGEAR Inc. | 549,122 | 23,014 |
| * | Cray Inc. | 702,918 | 22,810 |
| * | Semtech Corp. | 1,184,187 | 22,405 |
| | NIC Inc. | 1,120,521 | 22,052 |
| * | RingCentral Inc. Class A | 928,422 | 21,892 |
| * | Progress Software Corp. | 906,931 | 21,766 |
| * | Bottomline Technologies de Inc. | 703,324 | 20,910 |
| | CSG Systems International Inc. | 578,815 | 20,826 |
| * | SPS Commerce Inc. | 295,488 | 20,746 |
| * | RealPage Inc. | 921,678 | 20,692 |
| * | Envestnet Inc. | 674,175 | 20,124 |
| * | Advanced Energy Industries Inc. | 704,705 | 19,894 |
| * | Virtusa Corp. | 480,193 | 19,851 |
53
| | | |
| Vanguard® Total Stock Market Index Fund | | |
| Schedule of Investments | | |
| December 31, 2015 | | |
| |
| | | | Market |
| | | | Value |
| | | Shares | ($000) |
| * | Callidus Software Inc. | 1,063,637 | 19,752 |
| * | Marketo Inc. | 679,163 | 19,499 |
| | West Corp. | 896,242 | 19,332 |
| * | QLogic Corp. | 1,564,425 | 19,086 |
| * | Lumentum Holdings Inc. | 855,915 | 18,847 |
| * | Cabot Microelectronics Corp. | 424,479 | 18,584 |
| * | BroadSoft Inc. | 522,735 | 18,484 |
| * | Cvent Inc. | 526,639 | 18,385 |
| * | Insight Enterprises Inc. | 720,042 | 18,087 |
| * | Infoblox Inc. | 970,284 | 17,844 |
| * | Web.com Group Inc. | 877,550 | 17,560 |
| * | Ixia | 1,395,201 | 17,342 |
| * | Inphi Corp. | 634,214 | 17,136 |
| | Pegasystems Inc. | 620,935 | 17,076 |
| | Monotype Imaging Holdings Inc. | 719,105 | 17,000 |
| * | Super Micro Computer Inc. | 688,978 | 16,887 |
| *,^ | 3D Systems Corp. | 1,924,284 | 16,722 |
| * | ScanSource Inc. | 510,595 | 16,451 |
| | ADTRAN Inc. | 954,789 | 16,441 |
| *,^ | Gogo Inc. | 921,802 | 16,408 |
| | Quality Systems Inc. | 1,010,935 | 16,296 |
| * | Ruckus Wireless Inc. | 1,507,303 | 16,143 |
| *,^ | 2U Inc. | 555,486 | 15,543 |
| ^ | Ebix Inc. | 466,853 | 15,308 |
| * | Diodes Inc. | 661,708 | 15,206 |
| *,^ | Ubiquiti Networks Inc. | 476,876 | 15,112 |
| * | Qualys Inc. | 456,170 | 15,095 |
| * | Photronics Inc. | 1,211,663 | 15,085 |
| * | GoDaddy Inc. Class A | 467,980 | 15,003 |
| *,^ | InvenSense Inc. | 1,413,524 | 14,460 |
| * | New Relic Inc. | 390,766 | 14,236 |
| * | MaxLinear Inc. | 936,256 | 13,791 |
| * | Lattice Semiconductor Corp. | 2,110,572 | 13,655 |
| | Brooks Automation Inc. | 1,170,461 | 12,501 |
| * | CalAmp Corp. | 613,225 | 12,222 |
| *,^ | Endurance International Group Holdings Inc. | 1,111,830 | 12,152 |
| * | Gigamon Inc. | 455,998 | 12,116 |
| * | ePlus Inc. | 119,972 | 11,189 |
| * | Q2 Holdings Inc. | 412,695 | 10,883 |
| * | Amkor Technology Inc. | 1,782,906 | 10,840 |
| * | Mercury Systems Inc. | 584,371 | 10,729 |
| *,^ | Shutterstock Inc. | 325,794 | 10,536 |
| * | PROS Holdings Inc. | 448,338 | 10,330 |
| * | Perficient Inc. | 594,746 | 10,182 |
| | Inteliquent Inc. | 568,602 | 10,104 |
| * | ShoreTel Inc. | 1,140,629 | 10,095 |
| * | Unisys Corp. | 900,480 | 9,950 |
| * | Xura Inc. | 404,799 | 9,950 |
| * | Interactive Intelligence Group Inc. | 305,152 | 9,588 |
| * | Ultratech Inc. | 479,096 | 9,496 |
| | Computer Programs & Systems Inc. | 190,071 | 9,456 |
| * | FormFactor Inc. | 1,033,815 | 9,304 |
| * | Applied Micro Circuits Corp. | 1,457,148 | 9,282 |
| * | Workiva Inc. | 527,197 | 9,263 |
| * | Loral Space & Communications Inc. | 227,398 | 9,257 |
| * | Hortonworks Inc. | 419,054 | 9,177 |
| *,^ | Box Inc. | 634,933 | 8,864 |
| *,^ | VASCO Data Security International Inc. | 529,003 | 8,850 |
| * | CEVA Inc. | 366,543 | 8,562 |
| *,^ | Nimble Storage Inc. | 916,349 | 8,430 |
| * | Silver Spring Networks Inc. | 562,789 | 8,110 |
| *,^ | Pure Storage Inc. Class A | 513,031 | 7,988 |
| * | Rudolph Technologies Inc. | 558,224 | 7,938 |
| * | Intralinks Holdings Inc. | 870,585 | 7,896 |
54
| | | |
| Vanguard® Total Stock Market Index Fund | | |
| Schedule of Investments | | |
| December 31, 2015 | | |
| |
| | | | Market |
| | | | Value |
| | | Shares | ($000) |
| * | Barracuda Networks Inc. | 413,441 | 7,723 |
| * | Benefitfocus Inc. | 208,913 | 7,602 |
| * | Actua Corp. | 661,410 | 7,573 |
| *,^ | Textura Corp. | 333,307 | 7,193 |
| | Hackett Group Inc. | 431,780 | 6,939 |
| * | Extreme Networks Inc. | 1,689,857 | 6,895 |
| * | Blucora Inc. | 687,151 | 6,734 |
| | Epiq Systems Inc. | 514,386 | 6,723 |
| * | Vocera Communications Inc. | 536,914 | 6,550 |
| * | Harmonic Inc. | 1,599,675 | 6,511 |
| * | RigNet Inc. | 313,014 | 6,476 |
| * | LivePerson Inc. | 928,521 | 6,268 |
| * | Nanometrics Inc. | 407,597 | 6,171 |
| * | SciQuest Inc. | 473,915 | 6,147 |
| * | Internap Corp. | 939,175 | 6,011 |
| * | Calix Inc. | 755,657 | 5,947 |
| * | Sonus Networks Inc. | 832,833 | 5,938 |
| | Forrester Research Inc. | 207,949 | 5,922 |
| * | SunEdison Semiconductor Ltd. | 744,694 | 5,838 |
| * | Immersion Corp. | 499,192 | 5,821 |
| *,^ | Oclaro Inc. | 1,658,759 | 5,772 |
| * | Applied Optoelectronics Inc. | 336,095 | 5,767 |
| | IXYS Corp. | 453,563 | 5,729 |
| * | Xcerra Corp. | 946,419 | 5,726 |
| | Comtech Telecommunications Corp. | 275,755 | 5,540 |
| * | Tangoe Inc. | 659,336 | 5,532 |
| | American Software Inc. Class A | 540,785 | 5,505 |
| * | NeoPhotonics Corp. | 500,982 | 5,441 |
| * | ChannelAdvisor Corp. | 386,218 | 5,349 |
| * | Exar Corp. | 853,076 | 5,229 |
| * | Axcelis Technologies Inc. | 2,011,532 | 5,210 |
| *,^ | Digimarc Corp. | 142,568 | 5,205 |
| * | Model N Inc. | 464,520 | 5,184 |
| * | A10 Networks Inc. | 782,376 | 5,132 |
| | PC Connection Inc. | 223,682 | 5,064 |
| * | Zix Corp. | 996,774 | 5,064 |
| * | PDF Solutions Inc. | 459,304 | 4,979 |
| | Cohu Inc. | 410,635 | 4,956 |
| * | Mattson Technology Inc. | 1,300,214 | 4,590 |
| * | Digi International Inc. | 399,200 | 4,543 |
| * | TeleCommunication Systems Inc. Class A | 875,672 | 4,352 |
| *,^ | OPOWER Inc. | 409,059 | 4,320 |
| * | Boingo Wireless Inc. | 634,807 | 4,202 |
| * | Ciber Inc. | 1,138,523 | 3,996 |
| * | Quantum Corp. | 4,248,868 | 3,951 |
| * | Five9 Inc. | 448,649 | 3,903 |
| * | Vectrus Inc. | 185,703 | 3,879 |
| * | Sigma Designs Inc. | 601,318 | 3,800 |
| * | Seachange International Inc. | 554,590 | 3,738 |
| * | Alliance Fiber Optic Products Inc. | 237,539 | 3,601 |
| * | Silicon Graphics International Corp. | 610,070 | 3,599 |
| *,^ | KEYW Holding Corp. | 585,670 | 3,526 |
| * | DSP Group Inc. | 358,994 | 3,389 |
| * | Brightcove Inc. | 545,638 | 3,383 |
| * | United Online Inc. | 263,385 | 3,105 |
| * | Varonis Systems Inc. | 164,878 | 3,100 |
| * | Jive Software Inc. | 756,082 | 3,085 |
| * | Cascade Microtech Inc. | 187,531 | 3,047 |
| * | MeetMe Inc. | 830,996 | 2,975 |
| * | Carbonite Inc. | 299,765 | 2,938 |
| * | Agilysys Inc. | 292,386 | 2,921 |
| * | Imprivata Inc. | 257,394 | 2,909 |
| * | Alpha & Omega Semiconductor Ltd. | 314,662 | 2,892 |
| | QAD Inc. Class A | 140,881 | 2,891 |
55
| | | |
| Vanguard® Total Stock Market Index Fund | | |
| Schedule of Investments | | |
| December 31, 2015 | | |
| |
| | | | Market |
| | | | Value |
| | | Shares | ($000) |
| | Simulations Plus Inc. | 284,393 | 2,818 |
| *,^ | Castlight Health Inc. Class B | 651,468 | 2,782 |
| * | EMCORE Corp. | 449,964 | 2,758 |
| *,^ | MobileIron Inc. | 761,763 | 2,750 |
| * | Telenav Inc. | 483,246 | 2,750 |
| *,^ | Rapid7 Inc. | 179,469 | 2,715 |
| *,^ | Clearfield Inc. | 194,605 | 2,610 |
| * | VOXX International Corp. Class A | 482,434 | 2,538 |
| * | Ultra Clean Holdings Inc. | 490,321 | 2,510 |
| * | Kopin Corp. | 922,852 | 2,510 |
| * | Datalink Corp. | 345,986 | 2,353 |
| * | GigOptix Inc. | 765,068 | 2,326 |
| *,^ | USA Technologies Inc. | 744,357 | 2,293 |
| * | KVH Industries Inc. | 238,592 | 2,248 |
| * | Radisys Corp. | 806,798 | 2,235 |
| * | Exa Corp. | 191,587 | 2,224 |
| * | Mitek Systems Inc. | 536,293 | 2,204 |
| *,^ | TransEnterix Inc. | 852,369 | 2,114 |
| *,^ | VirnetX Holding Corp. | 815,266 | 2,095 |
| * | Rosetta Stone Inc. | 306,547 | 2,051 |
| * | Alarm.com Holdings Inc. | 120,300 | 2,007 |
| *,^ | Park City Group Inc. | 167,676 | 1,997 |
| * | Hutchinson Technology Inc. | 544,466 | 1,955 |
| | Computer Task Group Inc. | 281,333 | 1,862 |
| * | Neonode Inc. | 721,721 | 1,826 |
| | Preformed Line Products Co. | 43,037 | 1,812 |
| | NCI Inc. Class A | 132,403 | 1,807 |
| | TESSCO Technologies Inc. | 91,391 | 1,779 |
| * | Covisint Corp. | 707,709 | 1,769 |
| * | Guidance Software Inc. | 287,426 | 1,730 |
| * | BSQUARE Corp. | 279,967 | 1,705 |
| * | Systemax Inc. | 194,630 | 1,674 |
| * | Key Tronic Corp. | 219,212 | 1,666 |
| | TransAct Technologies Inc. | 192,208 | 1,649 |
| * | Unwired Planet Inc. | 1,896,706 | 1,637 |
| | PC-Tel Inc. | 357,424 | 1,626 |
| * | Amtech Systems Inc. | 246,648 | 1,544 |
| *,^ | Pixelworks Inc. | 644,421 | 1,534 |
| *,^ | Rightside Group Ltd. | 179,340 | 1,489 |
| * | Rocket Fuel Inc. | 425,137 | 1,484 |
| *,^ | Aerohive Networks Inc. | 283,110 | 1,447 |
| * | Edgewater Technology Inc. | 179,253 | 1,436 |
| * | AXT Inc. | 576,188 | 1,429 |
| * | Match Group Inc. | 99,094 | 1,343 |
| * | Marin Software Inc. | 364,803 | 1,306 |
| * | Limelight Networks Inc. | 893,306 | 1,304 |
| *,^ | Violin Memory Inc. | 1,420,191 | 1,278 |
| * | Xactly Corp. | 145,952 | 1,245 |
| * | NetSol Technologies Inc. | 156,023 | 1,211 |
| *,^ | Apigee Corp. | 147,783 | 1,187 |
| | Evolving Systems Inc. | 213,915 | 1,177 |
| * | GSI Technology Inc. | 316,241 | 1,176 |
| * | Numerex Corp. Class A | 182,247 | 1,170 |
| | Concurrent Computer Corp. | 233,786 | 1,157 |
| * | PAR Technology Corp. | 170,416 | 1,147 |
| * | Pendrell Corp. | 2,275,890 | 1,140 |
| * | QuickLogic Corp. | 1,008,202 | 1,139 |
| * | Amber Road Inc. | 219,870 | 1,119 |
| | ClearOne Inc. | 85,252 | 1,102 |
| * | Icad Inc. | 209,738 | 1,084 |
| * | Support.com Inc. | 1,053,784 | 1,064 |
| * | Aware Inc. | 323,417 | 1,054 |
| * | Appfolio Inc. | 70,210 | 1,025 |
| * | eGain Corp. | 227,199 | 975 |
56
| | | |
| Vanguard® Total Stock Market Index Fund | | |
| Schedule of Investments | | |
| December 31, 2015 | | |
| |
| | | | Market |
| | | | Value |
| | | Shares | ($000) |
| * | FalconStor Software Inc. | 517,449 | 973 |
| * | ARI Network Services Inc. | 212,114 | 955 |
| * | Inuvo Inc. | 346,977 | 937 |
| * | ID Systems Inc. | 202,190 | 930 |
| * | Datawatch Corp. | 153,785 | 920 |
| * | MRV Communications Inc. | 75,244 | 918 |
| * | MoSys Inc. | 842,033 | 918 |
| * | ANADIGICS Inc. | 1,404,456 | 895 |
| * | LRAD Corp. | 448,300 | 892 |
| * | Westell Technologies Inc. Class A | 696,943 | 878 |
| * | Ooma Inc. | 138,261 | 878 |
| * | iPass Inc. | 869,631 | 870 |
| * | WidePoint Corp. | 1,241,370 | 863 |
| * | Tremor Video Inc. | 412,155 | 849 |
| *,^ | Novatel Wireless Inc. | 507,221 | 847 |
| *,^ | CVD Equipment Corp. | 81,790 | 824 |
| * | Imation Corp. | 592,364 | 812 |
| * | Intermolecular Inc. | 349,185 | 810 |
| * | Aviat Networks Inc. | 980,603 | 753 |
| *,^ | Netlist Inc. | 768,374 | 676 |
| * | GSE Systems Inc. | 274,729 | 659 |
| * | Upland Software Inc. | 87,982 | 620 |
| *,^ | Solar3D Inc. | 166,567 | 616 |
| | GlobalSCAPE Inc. | 155,517 | 616 |
| | Communications Systems Inc. | 74,329 | 578 |
| * | RELM Wireless Corp. | 126,563 | 499 |
| | Astro-Med Inc. | 33,759 | 488 |
| | RCM Technologies Inc. | 82,170 | 452 |
| | QAD Inc. Class B | 22,665 | 418 |
| * | Zhone Technologies Inc. | 414,475 | 414 |
| * | Qumu Corp. | 152,829 | 414 |
| * | SITO Mobile Ltd. | 198,848 | 414 |
| * | Smith Micro Software Inc. | 492,957 | 359 |
| * | Xplore Technologies Corp. | 69,450 | 356 |
| * | Synacor Inc. | 201,945 | 353 |
| *,^ | ParkerVision Inc. | 1,494,998 | 348 |
| *,^ | Vringo Inc. | 139,890 | 346 |
| * | Identiv Inc. | 172,117 | 343 |
| * | inTEST Corp. | 75,035 | 317 |
| *,^ | InterCloud Systems Inc. | 312,215 | 312 |
| *,^ | Cinedigm Corp. Class A | 1,115,699 | 292 |
| * | Streamline Health Solutions Inc. | 203,637 | 287 |
| * | Xcel Brands Inc. | 37,448 | 281 |
| *,^ | Code Rebel Corp. | 93,478 | 251 |
| *,^ | Resonant Inc. | 90,940 | 241 |
| * | BroadVision Inc. | 38,059 | 228 |
| *,^ | Infosonics Corp. | 140,874 | 223 |
| *,^ | Crossroads Systems Inc. | 193,362 | 207 |
| * | Data I/O Corp. | 78,543 | 198 |
| * | ARC Group Worldwide Inc. | 109,790 | 181 |
| * | Aehr Test Systems | 93,715 | 176 |
| *,^ | Sysorex Global Holdings Corp. | 288,616 | 165 |
| * | Lantronix Inc. | 138,633 | 157 |
| *,^ | Determine Inc. | 51,869 | 134 |
| * | Innodata Inc. | 40,013 | 114 |
| * | Mastech Holdings Inc. | 15,394 | 113 |
| * | SharpSpring Inc. | 34,445 | 110 |
| * | Sonic Foundry Inc. | 17,328 | 91 |
| * | Square Inc. | 5,663 | 74 |
| | CSP Inc. | 9,402 | 65 |
| * | Fusion Telecommunications International Inc. | 18,890 | 62 |
| * | ADDvantage Technologies Group Inc. | 29,519 | 53 |
| * | Adesto Technologies Corp. | 4,336 | 33 |
| * | Qualstar Corp. | 34,975 | 27 |
57
| | | |
| Vanguard® Total Stock Market Index Fund | | |
| Schedule of Investments | | |
| December 31, 2015 | | |
| |
| | | | Market |
| | | | Value |
| | | Shares | ($000) |
| * | Trio-Tech International | 5,845 | 17 |
| *,^ | NXT-ID Inc. | 58,739 | 14 |
| * | Network-1 Technologies Inc. | 5,571 | 12 |
| * | Glowpoint Inc. | 12,965 | 6 |
| | | | 64,479,970 |
| Telecommunications (2.2%) | | |
| | AT&T Inc. | 112,756,002 | 3,879,934 |
| | Verizon Communications Inc. | 74,579,172 | 3,447,049 |
| * | Level 3 Communications Inc. | 5,206,950 | 283,050 |
| | CenturyLink Inc. | 10,139,308 | 255,105 |
| * | SBA Communications Corp. Class A | 2,313,847 | 243,116 |
| * | T-Mobile US Inc. | 5,221,831 | 204,278 |
| | Frontier Communications Corp. | 21,267,630 | 99,320 |
| | Telephone & Data Systems Inc. | 1,627,201 | 42,128 |
| *,^ | Sprint Corp. | 11,206,292 | 40,567 |
| * | Zayo Group Holdings Inc. | 955,765 | 25,414 |
| * | Vonage Holdings Corp. | 3,235,220 | 18,570 |
| | Consolidated Communications Holdings Inc. | 867,413 | 18,172 |
| | Shenandoah Telecommunications Co. | 411,045 | 17,696 |
| * | 8x8 Inc. | 1,511,741 | 17,309 |
| | Atlantic Tele-Network Inc. | 189,307 | 14,809 |
| | EarthLink Holdings Corp. | 1,860,082 | 13,820 |
| * | Cincinnati Bell Inc. | 3,733,228 | 13,440 |
| *,^ | Iridium Communications Inc. | 1,438,561 | 12,098 |
| ^ | Windstream Holdings Inc. | 1,859,107 | 11,973 |
| *,^ | Globalstar Inc. | 7,393,304 | 10,646 |
| * | General Communication Inc. Class A | 524,787 | 10,380 |
| * | inContact Inc. | 1,041,580 | 9,937 |
| * | United States Cellular Corp. | 241,433 | 9,853 |
| * | ORBCOMM Inc. | 1,133,391 | 8,206 |
| * | GTT Communications Inc. | 439,174 | 7,492 |
| *,^ | pdvWireless Inc. | 243,279 | 6,690 |
| | Spok Holdings Inc. | 364,056 | 6,670 |
| * | FairPoint Communications Inc. | 412,021 | 6,621 |
| * | Hawaiian Telcom Holdco Inc. | 263,722 | 6,556 |
| * | Lumos Networks Corp. | 378,513 | 4,239 |
| | IDT Corp. Class B | 321,337 | 3,747 |
| *,^ | Straight Path Communications Inc. Class B | 188,781 | 3,236 |
| * | NTELOS Holdings Corp. | 314,525 | 2,875 |
| * | HC2 Holdings Inc. | 508,327 | 2,689 |
| * | Alaska Communications Systems Group Inc. | 1,392,987 | 2,438 |
| *,^ | Intelsat SA | 468,301 | 1,948 |
| *,^ | Towerstream Corp. | 1,074,829 | 408 |
| * | Elephant Talk Communications Corp. | 1,050,107 | 284 |
| * | Otelco Inc. Class A | 2,454 | 17 |
| | | | 8,762,780 |
| Utilities (3.1%) | | |
| | Duke Energy Corp. | 12,603,601 | 899,771 |
| | NextEra Energy Inc. | 8,443,693 | 877,215 |
| | Southern Co. | 16,649,249 | 779,018 |
| | Dominion Resources Inc. | 10,938,569 | 739,885 |
| | American Electric Power Co. Inc. | 8,956,722 | 521,908 |
| | PG&E Corp. | 8,981,688 | 477,736 |
| | Exelon Corp. | 16,844,160 | 467,762 |
| | PPL Corp. | 12,225,291 | 417,249 |
| | Sempra Energy | 4,327,858 | 406,862 |
| | Public Service Enterprise Group Inc. | 9,268,707 | 358,606 |
| | Edison International | 5,958,127 | 352,781 |
| | Consolidated Edison Inc. | 5,355,641 | 344,207 |
| | Xcel Energy Inc. | 9,232,271 | 331,531 |
| | WEC Energy Group Inc. | 5,749,814 | 295,023 |
| | Eversource Energy | 5,746,858 | 293,492 |
| | DTE Energy Co. | 3,268,553 | 262,105 |
| | FirstEnergy Corp. | 7,718,752 | 244,916 |
58
| | | |
| Vanguard® Total Stock Market Index Fund | | |
| Schedule of Investments | | |
| December 31, 2015 | | |
| |
| | | | Market |
| | | | Value |
| | | Shares | ($000) |
| | Entergy Corp. | 3,243,610 | 221,733 |
| | American Water Works Co. Inc. | 3,250,599 | 194,223 |
| | Ameren Corp. | 4,412,017 | 190,731 |
| | CMS Energy Corp. | 5,039,753 | 181,834 |
| | SCANA Corp. | 2,328,983 | 140,880 |
| | AGL Resources Inc. | 2,204,679 | 140,681 |
| | CenterPoint Energy Inc. | 7,453,171 | 136,840 |
| | Pinnacle West Capital Corp. | 2,007,695 | 129,456 |
| | Alliant Energy Corp. | 2,060,709 | 128,691 |
| | Pepco Holdings Inc. | 4,641,785 | 120,733 |
| | AES Corp. | 12,330,308 | 118,001 |
| | TECO Energy Inc. | 4,312,866 | 114,938 |
| | Atmos Energy Corp. | 1,822,342 | 114,880 |
| | NiSource Inc. | 5,808,802 | 113,330 |
| | ITC Holdings Corp. | 2,860,092 | 112,259 |
| | Westar Energy Inc. Class A | 2,635,057 | 111,753 |
| | UGI Corp. | 3,131,957 | 105,735 |
| | Aqua America Inc. | 3,195,743 | 95,233 |
| | ONEOK Inc. | 3,830,310 | 94,455 |
| * | Calpine Corp. | 6,522,817 | 94,385 |
| | Piedmont Natural Gas Co. Inc. | 1,450,599 | 82,713 |
| | Great Plains Energy Inc. | 2,788,675 | 76,159 |
| | NRG Energy Inc. | 5,732,429 | 67,471 |
| | IDACORP Inc. | 946,939 | 64,392 |
| | Vectren Corp. | 1,513,404 | 64,199 |
| | National Fuel Gas Co. | 1,467,717 | 62,745 |
| | Questar Corp. | 3,166,544 | 61,684 |
| | Portland General Electric Co. | 1,668,262 | 60,675 |
| | Hawaiian Electric Industries Inc. | 2,005,544 | 58,060 |
| | Cleco Corp. | 1,111,108 | 58,011 |
| | WGL Holdings Inc. | 900,823 | 56,743 |
| | New Jersey Resources Corp. | 1,678,452 | 55,322 |
| | NorthWestern Corp. | 896,162 | 48,617 |
| | ONE Gas Inc. | 963,545 | 48,341 |
| | ALLETE Inc. | 924,126 | 46,973 |
| | PNM Resources Inc. | 1,513,557 | 46,269 |
| | Southwest Gas Corp. | 797,332 | 43,981 |
| * | Avangrid Inc. | 1,128,928 | 43,351 |
| | Laclede Group Inc. | 717,387 | 42,620 |
| | Black Hills Corp. | 908,502 | 42,182 |
| | Avista Corp. | 1,174,869 | 41,555 |
| | MGE Energy Inc. | 758,963 | 35,216 |
| | El Paso Electric Co. | 770,459 | 29,663 |
| * | Dynegy Inc. | 2,197,119 | 29,441 |
| | South Jersey Industries Inc. | 1,236,422 | 29,081 |
| | American States Water Co. | 681,607 | 28,593 |
| | Northwest Natural Gas Co. | 495,497 | 25,077 |
| | Empire District Electric Co. | 871,490 | 24,463 |
| | Ormat Technologies Inc. | 654,152 | 23,857 |
| | California Water Service Group | 857,185 | 19,947 |
| | TerraForm Power Inc. Class A | 1,400,411 | 17,617 |
| | Chesapeake Utilities Corp. | 269,108 | 15,272 |
| | Unitil Corp. | 323,015 | 11,590 |
| * | Talen Energy Corp. | 1,507,722 | 9,393 |
| | SJW Corp. | 301,436 | 8,938 |
| | Middlesex Water Co. | 329,705 | 8,750 |
| | Connecticut Water Service Inc. | 185,740 | 7,060 |
| | York Water Co. | 280,678 | 7,000 |
| *,^ | Sunrun Inc. | 410,894 | 4,836 |
| | Atlantic Power Corp. | 2,208,448 | 4,351 |
| | Artesian Resources Corp. Class A | 147,518 | 4,086 |
| | Delta Natural Gas Co. Inc. | 191,073 | 4,011 |
| * | Vivint Solar Inc. | 402,153 | 3,845 |
| | Genie Energy Ltd. Class B | 286,954 | 3,200 |
59
| | | | | |
| Vanguard® Total Stock Market Index Fund | | | | |
| Schedule of Investments | | | | |
| December 31, 2015 | | | | |
| |
| | | | | | Market |
| | | | | | Value |
| | | | | Shares | ($000) |
| * | Pure Cycle Corp. | | | 481,535 | 2,311 |
| | Gas Natural Inc. | | | 236,853 | 1,765 |
| *,^ | Cadiz Inc. | | | 305,837 | 1,609 |
| | Spark Energy Inc. Class A | | | 68,151 | 1,412 |
| * | US Geothermal Inc. | | | 1,534,806 | 959 |
| | | | | | 12,266,244 |
| Total Common Stocks (Cost $285,446,454) | | | | 398,105,564 |
| |
| |
| | | Coupon | | | |
| |
| Temporary Cash Investments (1.2%)1 | | | | |
| Money Market Fund (1.2%) | | | | |
| 3,4 | Vanguard Market Liquidity Fund | 0.363% | | 4,729,461,508 | 4,729,462 |
| |
| |
| | | | | Face | |
| | | | Maturity | Amount | |
| | | | Date | ($000) | |
| U.S. Government and Agency Obligations (0.0%) | | | | |
| 5 | Federal Home Loan Bank Discount Notes | 0.200% | 2/5/16 | 5,000 | 4,999 |
| 5,6,7 | Federal Home Loan Bank Discount Notes | 0.245% | 3/2/16 | 35,000 | 34,977 |
| 5,6 | Federal Home Loan Bank Discount Notes | 0.320%-0.466% | 3/7/16 | 13,500 | 13,490 |
| 5,6 | Federal Home Loan Bank Discount Notes | 0.501% | 5/3/16 | 500 | 499 |
| 5 | Federal Home Loan Bank Discount Notes | 0.391% | 5/27/16 | 600 | 599 |
| 5 | Federal Home Loan Bank Discount Notes | 0.571% | 6/9/16 | 30,000 | 29,927 |
| 6 | United States Treasury Bill | 0.386% | 5/26/16 | 10,000 | 9,984 |
| 6 | United States Treasury Bill | 0.536% | 6/9/16 | 51,000 | 50,900 |
| 6 | United States Treasury Note/Bond | 0.375% | 5/31/16 | 10,000 | 9,997 |
| | | | | | 155,372 |
| Total Temporary Cash Investments (Cost $4,884,822) | | | | 4,884,834 |
| |
| Total Investments (100.6%) (Cost $290,331,276) | | | | 402,990,398 |
| |
| Other Assets and Liabilities—Net (-0.6%)4 | | | | (2,339,341) |
| |
| Net Assets (100%) | | | | 400,651,057 |
* Non-income-producing security.
^ Includes partial security positions on loan to broker-dealers. The total value of securities on loan is $1,713,056,000.
1 The fund invests a portion of its cash reserves in equity markets through the use of index futures contracts and swap contracts. After giving effect to futures and swap investments, the fund's effective common stock and temporary cash investment positions represent 100.0% and 0.6%, respectively, of net assets.
2 “Other” represents securities that are not classified by the fund’s benchmark index.
3 Affiliated money market fund available only to Vanguard funds and certain trusts and accounts managed by Vanguard. Rate shown is the 7-day yield.
4 Includes $1,834,498,000 of collateral received for securities on loan.
5 The issuer operates under a congressional charter; its securities are generally neither guaranteed by the U.S. Treasury nor backed by the full faith and credit of the U.S. government.
6 Securities with a value of $118,549,000 and cash of $31,198,000 have been segregated as initial margin for open futures contracts.
7 Securities with a value of $1,156,000 have been segregated as collateral for open over-the-counter swap contracts.
REIT—Real Estate Investment Trust.
60
This page intentionally left blank.
© 2016 The Vanguard Group, Inc. All rights reserved.
Vanguard Marketing Corporation, Distributor.
SNA850 022016

Report of Independent Registered Public Accounting Firm
To the Board of Trustees of Vanguard Index Funds and the Shareholders of Vanguard Small-Cap Index Fund, Vanguard Small-Cap Growth Index Fund and Vanguard Small-Cap Value Index Fund:
In our opinion, the accompanying statements of net assets – investments summary and the related statements of operations and of changes in net assets and the financial highlights (included in Item 1 of this Form N-CSR) and the schedules of investments (included in Item 6 of this Form N-CSR) present fairly, in all material respects, the financial position of Vanguard Small-Cap Index Fund, Vanguard Small-Cap Growth Index Fund and Vanguard Small-Cap Value Index Fund (constituting separate portfolios of Vanguard Index Funds, hereafter referred to as the “Funds”) at December 31, 2015, the results of each of their operations for the year then ended, the changes in each of their net assets for each of the two years in the period then ended, and the financial highlights for each of the periods indicated, in conformity with accounting principles generally accepted in the United States of America. These financial statements, financial highlights, and schedules of investments (hereafter referred to as "financial statements") are the responsibility of the Funds’ management. Our responsibility is to express an opinion on these financial statements based on our audits. We conducted our audits of these financial statements in accordance with the standards of the Public Company Accounting Oversight Board (United States). Those standards require that we plan and perform the audit to obtain reasonable assurance about whether the financial statements are free of material misstatement. An audit includes examining, on a test basis, evidence supporting the amounts and disclosures in the financial statements, assessing the accounting principles used and significant estimates made by management, and evaluating the overall financial statement presentation. We believe that our audits, which included confirmation of securities at December 31, 2015 by correspondence with the custodians and brokers, by agreement to the underlying ownership records of the transfer agent and the application of alternative auditing procedures where securities purchased had not been received, provide a reasonable basis for our opinion.

PricewaterhouseCoopers LLP
February 16, 2016
PricewaterhouseCoopers LLP, Two Commerce Square, 2001 Market Street, Suite 1800, Philadelphia, PA 19103-7042
T: (267) 330-3000, F: (267) 330-3300, www.pwc.com/us

Report of Independent Registered Public Accounting Firm
To the Board of Trustees of Vanguard Index Funds and the Shareholders of Vanguard Extended Market Index Fund:
In our opinion, the accompanying statement of net assets investments summary and the related statements of operations and of changes in net assets and the financial highlights (included in Item 1 of this Form N-CSR) and the schedule of investments (included in Item 6 of this Form N-CSR) present fairly, in all material respects, the financial position of Vanguard Extended Market Index Fund (constituting a separate portfolio of Vanguard Index Funds, hereafter referred to as the "Fund") at December 31, 2015, the results of its operations for the year then ended, the changes in its net assets for each of the two years in the period then ended, and the financial highlights for each of the periods indicated, in conformity with accounting principles generally accepted in the United States of America. These financial statements, financial highlights, and schedule of investments (hereafter referred to as "financial statements") are the responsibility of the Fund's management. Our responsibility is to express an opinion on these financial statements based on our audits. We conducted our audits of these financial statements in accordance with the standards of the Public Company Accounting Oversight Board (United States). Those standards require that we plan and perform the audit to obtain reasonable assurance about whether the financial statements are free of material misstatement. An audit includes examining, on a test basis, evidence supporting the amounts and disclosures in the financial statements, assessing the accounting principles used and significant estimates made by management, and evaluating the overall financial statement presentation. We believe that our audits, which included confirmation of securities at December 31, 2015 by correspondence with the custodian and brokers, by agreement to the underlying ownership records of the transfer agent and the application of alternative auditing procedures where securities purchased had not been received, provide a reasonable basis for our opinion.

PricewaterhouseCoopers LLP
February 11, 2016
PricewaterhouseCoopers LLP, Two Commerce Square, 2001 Market Street, Suite 1800, Philadelphia, PA 19103-7042
T: (267) 330-3000, F: (267) 330-3300, www.pwc.com/us
Report of Independent Registered Public Accounting Firm
To the Board of Trustees of Vanguard Index Funds and the Shareholders of Vanguard Total Stock Market Index Fund:
In our opinion, the accompanying statement of net assets investments summary and the related statements of operations and of changes in net assets and the financial highlights (included in Item 1 of this Form N-CSR) and the schedule of investments (included in Item 6 of this Form N-CSR) present fairly, in all material respects, the financial position of Vanguard Total Stock Market Index Fund (constituting a separate portfolio of Vanguard Index Funds, hereafter referred to as the “Fund”) at December 31, 2015, the results of its operations for the year then ended, the changes in its net assets for each of the two years in the period then ended, and the financial highlights for each of the periods indicated, in conformity with accounting principles generally accepted in the United States of America. These financial statements, financial highlights, and schedule of investments (hereafter referred to as "financial statements") are the responsibility of the Fund's management. Our responsibility is to express an opinion on these financial statements based on our audits. We conducted our audits of these financial statements in accordance with the standards of the Public Company Accounting Oversight Board (United States). Those standards require that we plan and perform the audit to obtain reasonable assurance about whether the financial statements are free of material misstatement. An audit includes examining, on a test basis, evidence supporting the amounts and disclosures in the financial statements, assessing the accounting principles used and significant estimates made by management, and evaluating the overall financial statement presentation. We believe that our audits, which included confirmation of securities at December 31, 2015 by correspondence with the custodian and brokers, by agreement to the underlying ownership records of the transfer agent and the application of alternative auditing procedures where securities purchased had not been received, provide a reasonable basis for our opinion.

PricewaterhouseCoopers LLP
February 11, 2016
PricewaterhouseCoopers LLP, Two Commerce Square, 2001 Market Street, Suite 1800, Philadelphia, PA 19103-7042
T: (267) 330-3000, F: (267) 330-3300, www.pwc.com/us
Item 7: Disclosure of Proxy Voting Policies and Procedures for Closed-End Management Investment Companies.
Not Applicable.
Item 8: Portfolio Managers of Closed-End Management Investment Companies.
Not Applicable.
Item 9: Purchase of Equity Securities by Closed-End Management Investment Company and Affiliated Purchasers.
Not Applicable.
Item 10: Submission of Matters to a Vote of Security Holders.
Not Applicable.
Item 11: Controls and Procedures.
(a) Disclosure Controls and Procedures. The Principal Executive and Financial Officers concluded that the Registrant’s Disclosure Controls and Procedures are effective based on their evaluation of the Disclosure Controls and Procedures as of a date within 90 days of the filing date of this report.
(b) Internal Control Over Financial Reporting. There were no significant changes in Registrant’s Internal Control Over Financial Reporting or in other factors that could significantly affect this control subsequent to the date of the evaluation, including any corrective actions with regard to significant deficiencies and material weaknesses.
Item 12: Exhibits.
(a) Code of Ethics. (b) Certifications.
Pursuant to the requirements of the Securities Exchange Act of 1934 and the Investment Company Act of 1940, the registrant has duly caused this report to be signed on its behalf by the undersigned, thereunto duly authorized.
| |
| | VANGUARD INDEX FUNDS |
| |
| By: | /s/ F. WILLIAM MCNABB III* |
| | F. WILLIAM MCNABB III |
| | CHIEF EXECUTIVE OFFICER |
| |
| Date: February 18, 2016 |
Pursuant to the requirements of the Securities Exchange Act of 1934 and the Investment Company Act of 1940, this report has been signed below by the following persons on behalf of the registrant and in the capacities and on the dates indicated.
| |
| | VANGUARD INDEX FUNDS |
| |
| By: | /s/ F. WILLIAM MCNABB III* |
| | F. WILLIAM MCNABB III |
| | CHIEF EXECUTIVE OFFICER |
| |
| Date: February 18, 2016 |
| |
| | VANGUARD INDEX FUNDS |
| |
| By: | /s/ THOMAS J. HIGGINS* |
| | THOMAS J. HIGGINS |
| | CHIEF FINANCIAL OFFICER |
| |
| Date: February 18, 2016 |
* By: /s/ Heidi Stam
Heidi Stam, pursuant to a Power of Attorney filed on April 22, 2014 see file Number 2-17620, Incorporated by Reference.