UNITED STATES
SECURITIES AND EXCHANGE COMMISSION
Washington, D.C. 20549
FORM N-CSR
CERTIFIED SHAREHOLDER REPORT
OF
REGISTERED MANAGEMENT INVESTMENT COMPANIES
| | |
| Investment Company Act file number: | 811-02652 |
Name of Registrant: | Vanguard Index Funds |
Address of Registrant: | P.O. Box 2600 |
| | Valley Forge, PA 19482 |
Name and address of agent for service: | Anne E. Robinson, Esquire |
| | P.O. Box 876 |
| | Valley Forge, PA 19482 |
Registrant’s telephone number, including area code: (610) 669-1000 |
Date of fiscal year end: December 31 |
Date of reporting period: January 1, 2016 – December 31, 2016 |
Item 1: Reports to Shareholders |

Annual Report | December 31, 2016
Vanguard 500 Index Fund
A new format, unwavering commitment
As you begin reading this report, you’ll notice that we’ve made some improvements to the opening sections—based on feedback from you, our clients.
Page 1 starts with a new ”Your Fund’s Performance at a Glance,” a concise, handy summary of how your fund performed during the period.
In the renamed ”Chairman’s Perspective,” Bill McNabb will focus on enduring principles and investment insights.
We’ve modified some tables, and eliminated some redundancy, but we haven’t removed any information.
At Vanguard, we’re always looking for better ways to communicate and to help you make sound investment decisions. Thank you for entrusting your assets to us.
| |
| Contents | |
| Your Fund’s Performance at a Glance. | 1 |
| Chairman’s Perspective. | 3 |
| Fund Profile. | 7 |
| Performance Summary. | 9 |
| Financial Statements. | 11 |
| Your Fund’s After-Tax Returns. | 31 |
| About Your Fund’s Expenses. | 32 |
| Glossary. | 34 |
Please note: The opinions expressed in this report are just that—informed opinions. They should not be considered promises or advice.
Also, please keep in mind that the information and opinions cover the period through the date on the front of this report. Of course, the
risks of investing in your fund are spelled out in the prospectus.
See the Glossary for definitions of investment terms used in this report.
About the cover: No matter what language you speak, Vanguard has one consistent message and set of principles. Our primary
focus is on you, our clients. We conduct our business with integrity as a faithful steward of your assets. This message is shown
translated into seven languages, reflecting our expanding global presence.
Your Fund’s Performance at a Glance
• Vanguard 500 Index Fund returned about 12% for the fiscal year ended December 31, 2016. The fund closely tracked its target index, the Standard & Poor’s 500 Index, and exceeded the average return of its large-capitalization core fund peers.
• The fund offers investors exposure to 500 of the largest U.S. companies, which span many different industries and account for about three-fourths of the U.S. stock market’s value.
• The fund recorded positive returns in ten of the 11 market sectors, with seven posting double-digit gains.
• Information technology, the fund’s largest sector, was the top contributor; financials, energy, and industrials also added significantly to returns. Only health care stocks declined.
• Over the past ten years, the fund posted an average annual return of about 7%, in line with its benchmark and more than 1 percentage point higher than its peer-fund average.
| |
| Total Returns: Fiscal Year Ended December 31, 2016 | |
| | Total |
| | Returns |
| Vanguard 500 Index Fund | |
| Investor Shares | 11.82% |
| ETF Shares | |
| Market Price | 12.04 |
| Net Asset Value | 11.93 |
| Admiral™ Shares | 11.93 |
| Institutional Select Shares (Inception: 6/24/2016) | 11.12 |
| S&P 500 Index | 11.96 |
| Large-Cap Core Funds Average | 9.92 |
| Large-Cap Core Funds Average: Derived from data provided by Lipper, a Thomson Reuters Company. | |
Admiral Shares carry lower expenses and are available to investors who meet certain account-balance requirements. Institutional Select
Shares are available to certain institutional investors who meet specific administrative, service, and account-size criteria. The Vanguard ETF®
Shares shown are traded on the NYSE Arca exchange and are available only through brokers. The table provides ETF returns based on both
the NYSE Arca market price and the net asset value for a share. U.S. Pat. Nos. 6,879,964; 7,337,138; 7,720,749; 7,925,573; 8,090,646; and
8,417,623.
For the ETF Shares, the market price is determined by the midpoint of the bid-offer spread as of the closing time of the New York Stock
Exchange (generally 4 p.m., Eastern time). The net asset value is also determined as of the NYSE closing time. For more information about
how the ETF Shares' market prices have compared with their net asset value, visit vanguard.com, select your ETF, and then select the Price
and Performance tab. The ETF premium/discount analysis there shows the percentages of days on which the ETF Shares' market price was
above or below the NAV.
1
| |
| Total Returns: Ten Years Ended December 31, 2016 | |
| | Average |
| | Annual Return |
| 500 Index Fund Investor Shares | 6.82% |
| S&P 500 Index | 6.95 |
| Large-Cap Core Funds Average | 5.63 |
| Large-Cap Core Funds Average: Derived from data provided by Lipper, a Thomson Reuters Company. |
The figures shown represent past performance, which is not a guarantee of future results. (Current performance may be
lower or higher than the performance data cited. For performance data current to the most recent month-end, visit our
website at vanguard.com/performance.) Note, too, that both investment returns and principal value can fluctuate widely, so
an investor’s shares, when sold, could be worth more or less than their original cost.
| | | | | |
| Expense Ratios | | | | | |
| Your Fund Compared With Its Peer Group | | | | | |
| | Investor | ETF | Admiral | Institutional | Peer Group |
| | Shares | Shares | Shares | Select Shares | Average |
| 500 Index Fund | 0.16% | 0.05% | 0.05% | 0.01% | 1.11% |
The fund expense ratios shown are from the prospectus dated April 27, 2016, and represent estimated costs for the current fiscal year. For the
fiscal year ended December 31, 2016, the fund’s expense ratios were 0.14% for Investor Shares, 0.04% for ETF Shares, 0.04% for Admiral
Shares, and 0.01% for Institutional Select Shares (annualized since inception). The peer-group expense ratio is derived from data provided by
Lipper, a Thomson Reuters Company, and captures information through year-end 2015.
Peer group: Large-Cap Core Funds.
2
Chairman’s Perspective

Bill McNabb
Chairman and Chief Executive Officer
Dear Shareholder,
If you’re like most investors, a big question on your mind is: What’s in store for the markets and the economy in 2017?
At Vanguard, we’re just as curious about the immediate future. But our curiosity is tempered by our belief that forecasts should give a range of possible outcomes, not pinpoint predictions. After all, there are bound to be occurrences the experts won’t see coming.
What really matters for investors
In 2016, we saw two cases in point: The United Kingdom’s June vote to exit the European Union and the November election of Donald Trump as U.S. president. Both unexpected outcomes triggered swift market reactions. But despite some short-term volatility, the markets’ 12-month performance as of December 31, 2016, proved to be less dramatic. U.S. stocks posted healthy returns, and U.S. bonds provided returns close to their long-term averages. International stocks and bonds also advanced, although returns for U.S. investors were reduced by the strength of the U.S. dollar.
The surprises of 2016 remind us to be skeptical of overly precise short-term predictions about 2017. At the cusp of a new year, market prognosticators forecast where the Standard & Poor’s 500 Index or the yield on the 10-year Treasury note will end up in 12 months. Such predictions can be attention-getting. They can also be dead wrong.
3
Investors are better off taking note of long-term trends that stand to influence our economies and markets. We’re watching these trends closely, and we discuss our latest assessment in our 2017 economic and market outlook, which you can read at vanguard.com/research.
Our global economic outlook: Expect stabilization, not stagnation
One phenomenon in particular that we’re watching is the low-growth, low-interest-rate environment that has marked the global economy since the 2008–09 financial crisis. We don’t think this economic backdrop is simply the result of cyclically weak demand or long-term stagnation. Instead, certain structural forces are contributing: Falling technology costs are restraining the amounts businesses are spending on capital investment, an aging population is weighing on growth in the developed world, and the free movement of capital and products across the globe has restrained prices and wages.
In the near term, these forces will continue to dampen growth, inflation, and interest rates. They also make it unlikely that further monetary stimulus from central banks will do much to spur growth.
I realize this all may sound gloomy, but that’s not how we see it. We expect global growth to stabilize at more modest levels, not stagnate. The world isn’t headed for Japanese-style deflation, in which a widespread sustained drop in prices puts economic activity into hibernation.
| | | |
| Market Barometer | | | |
| | Average Annual Total Returns |
| | Periods Ended December 31, 2016 |
| | One | Three | Five |
| | Year | Years | Years |
| Stocks | | | |
| Russell 1000 Index (Large-caps) | 12.05% | 8.59% | 14.69% |
| Russell 2000 Index (Small-caps) | 21.31 | 6.74 | 14.46 |
| Russell 3000 Index (Broad U.S. market) | 12.74 | 8.43 | 14.67 |
| FTSE All-World ex US Index (International) | 4.80 | -1.16 | 5.52 |
| |
| Bonds | | | |
| Bloomberg Barclays U.S. Aggregate Bond Index | | | |
| (Broad taxable market) | 2.65% | 3.03% | 2.23% |
| Bloomberg Barclays Municipal Bond Index | | | |
| (Broad tax-exempt market) | 0.25 | 4.14 | 3.28 |
| Citigroup Three-Month U.S. Treasury Bill Index | 0.27 | 0.09 | 0.08 |
| |
| CPI | | | |
| Consumer Price Index | 2.07% | 1.18% | 1.36% |
4
In fact, we believe that global growth could pick up modestly over time. Our expectation is based on a potential rebound in productivity as new digital technologies are used more effectively. We also anticipate a slight recovery in the labor force as the baby boom generation finishes its transition to retirement, nudging up demand for workers.
Put expansion in perspective
Looking to the United States, the world’s largest economy remains firmly on a long-term-growth path of about 2% per year. That’s lower than the historical average of 3.25% since 1950. We see such growth at this level as fundamentally sound, rather than abnormally low. Our evaluation takes into account lower U.S. population growth and the reality that the economic expansion from the 1980s until the financial crisis was fueled by debt, distorting the numbers.
Turning to prices, we think that core U.S. inflation should modestly exceed 2% in 2017. That, in turn, will support further interest rate hikes by the Federal Reserve, similar to the one at the end of 2016.
We expect the Fed to raise rates in 2017 before taking an extended pause, and we see the federal funds rate staying below 2% through at least 2018.
Prepare for muted returns
And what about prospects for the markets? Vanguard’s outlook for global stocks and bonds remains the most guarded in ten years, given fairly high stock valuations
|
| Expect more modest returns, rely on time-tested principles |
| |
| In Vanguard’s economic and market outlook for 2017, Global Chief Economist Joseph Davis |
| and his team offer a projection of more modest returns from the global stock and bond |
| markets. They caution that, over the next decade, returns for a balanced portfolio are likely |
| to be moderately below long-run historical averages. |
| |
| The team’s simulations indicate that for the decade ending in 2026, the average annualized |
| return of a 60% stock/40% bond portfolio is likely to be centered in the 3%–5% range after |
| inflation. That’s below the actual average after-inflation return of 6% for the same portfolio |
| for the nine decades since 1926. |
| |
| Ultimately, our global market outlook points toward a somewhat more challenging environment, |
| yet one in which, over time, investors with an appropriate level of discipline, diversification, and |
| patience are likely to be rewarded with reasonable inflation-adjusted returns. |
| |
| For more information about our expectations and the probability of various outcomes, see 2017 |
| Economic and Market Outlook: Stabilization, Not Stagnation, available at vanguard.com/research. |
| |
| |
| IMPORTANT: The projections and other information generated by the Vanguard Capital Markets Model® (VCMM) |
| regarding the likelihood of various investment outcomes are hypothetical in nature, do not reflect actual investment |
| results, and are not guarantees of future results. Distribution of return outcomes from the VCMM are derived |
| from 10,000 simulations for each modeled asset class. Simulations as of September 30, 2016. Results from the |
| model may vary with each use and over time. For more information, see the note at the end of this letter. |
5
and the low-interest-rate environment. We don’t expect global bond yields to increase materially from year-end 2016 levels.
Our outlook for global equities is annualized returns of 5%–8% over the next decade. This outlook isn’t bearish, but is actually fairly positive when you take into account the current low-rate environment. (See the box titled Expect more modest returns, rely on time-tested principles for more.)
Focus on the four keys to investment success
Significant trends often happen gradually. Like shifting tides, they’re sometimes barely noticeable at first but ultimately can change the landscape entirely. Other times, apparent trends can end up receding before they have much of a long-term impact. Given the future’s inherent unpredictability, it’s not reasonable to expect a surefire block-buster revelation from any prognosticator or investment firm.
What to conclude, then? No matter what scenario plays out, we believe investors have the best chance for success if they stay focused on what they can control: their goals, asset allocation, and investment costs, along with the discipline to stick to a plan. As Tim Buckley, our chief investment officer, likes to say, this can be easy to say but harder to do, especially in times of uncertainty. Investors who can stay focused on those four keys will find themselves well-positioned to weather any market.
As always, thank you for investing with Vanguard.
Sincerely,

F. William McNabb III
Chairman and Chief Executive Officer
January 16, 2017
IMPORTANT: The projections and other information generated by the Vanguard Capital Markets Model regarding
the likelihood of various investment outcomes are hypothetical in nature, do not reflect actual investment results,
and are not guarantees of future results. VCMM results will vary with each use and over time.
The VCMM projections are based on a statistical analysis of historical data. Future returns may behave differently from the
historical patterns captured in the VCMM. More important, the VCMM may be underestimating extreme negative scenarios
unobserved in the historical period on which the model estimation is based.
The VCMM is a proprietary financial simulation tool developed and maintained by Vanguard’s Investment Strategy Group.
The model forecasts distributions of future returns for a wide array of broad asset classes. Those asset classes include U.S.
and international equity markets, several maturities of the U.S. Treasury and corporate fixed income markets, international
fixed income markets, U.S. money markets, commodities, and certain alternative investment strategies. The theoretical and
empirical foundation for the Vanguard Capital Markets Model is that the returns of various asset classes reflect the compensation
investors require for bearing different types of systematic risk (beta). At the core of the model are estimates of the dynamic
statistical relationship between risk factors and asset returns, obtained from statistical analysis based on available monthly
financial and economic data. Using a system of estimated equations, the model then applies a Monte Carlo simulation method
to project the estimated interrelationships among risk factors and asset classes as well as uncertainty and randomness over
time. The model generates a large set of simulated outcomes for each asset class over several time horizons. Forecasts are
obtained by computing measures of central tendency in these simulations. Results produced by the tool will vary with each
use and over time.
6
500 Index Fund
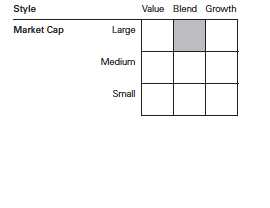
Fund Profile
As of December 31, 2016
| | | | |
| Share-Class Characteristics | | | | |
| | Investor | | Admiral | Institutional |
| | Shares | ETF Shares | Shares | Select Shares |
| Ticker Symbol | VFINX | VOO | VFIAX | VFFSX |
| Expense Ratio1 | 0.16% | 0.05% | 0.05% | 0.01% |
| 30-Day SEC Yield | 1.99% | 2.09% | 2.09% | 2.10% |
| | | |
| Portfolio Characteristics | | |
| | | | DJ |
| | | | U.S. |
| | | | Total |
| | | | Market |
| | | S&P 500 | FA |
| | Fund | Index | Index |
| Number of Stocks | 508 | 505 | 3,833 |
| Median Market Cap | $84.8B | $84.8B | $54.1B |
| Price/Earnings Ratio | 23.0x | 23.0x | 24.4x |
| Price/Book Ratio | 2.9x | 2.9x | 2.8x |
| Return on Equity | 17.7% | 17.4% | 16.5% |
| Earnings Growth Rate | 7.8% | 8.1% | 8.2% |
| Dividend Yield | 2.1% | 2.1% | 2.0% |
| Foreign Holdings | 0.0% | 0.0% | 0.0% |
| Turnover Rate | 4% | — | — |
| Short-Term Reserves | 0.0% | — | — |
| | | |
| Sector Diversification (% of equity exposure) |
| | | | DJ |
| | | | U.S. Total |
| | | S&P 500 | Market |
| | Fund | Index FA Index |
| Consumer | | | |
| Discretionary | 12.0% | 12.0% | 12.5% |
| Consumer Staples | 9.4 | 9.4 | 8.3 |
| Energy | 7.5 | 7.5 | 7.0 |
| Financials | 14.8 | 14.8 | 15.4 |
| Health Care | 13.6 | 13.6 | 13.0 |
| Industrials | 10.3 | 10.3 | 10.8 |
| Information | | | |
| Technology | 20.8 | 20.8 | 20.0 |
| Materials | 2.8 | 2.8 | 3.3 |
| Real Estate | 2.9 | 2.9 | 4.1 |
| Telecommunication | | | |
| Services | 2.7 | 2.7 | 2.4 |
| Utilities | 3.2 | 3.2 | 3.2 |
| | |
| Volatility Measures | | |
| | | DJ |
| | | U.S. Total |
| | S&P 500 | Market |
| | Index | FA Index |
| R-Squared | 1.00 | 0.99 |
| Beta | 1.00 | 0.97 |
| These measures show the degree and timing of the fund’s |
| fluctuations compared with the indexes over 36 months. |
| | |
| Ten Largest Holdings (% of total net assets) |
| Apple Inc. | Technology | |
| | Hardware, Storage & | |
| | Peripherals | 3.2% |
| Microsoft Corp. | Systems Software | 2.5 |
| Alphabet Inc. | Internet Software & | |
| | Services | 2.4 |
| Exxon Mobil Corp. | Integrated Oil & Gas | 1.9 |
| Johnson & Johnson | Pharmaceuticals | 1.6 |
| Berkshire Hathaway Inc. Multi-Sector Holdings | 1.6 |
| JPMorgan Chase & Co. | Diversified Banks | 1.6 |
| Amazon.com Inc. | Internet & Direct | |
| | Marketing Retail | 1.5 |
| General Electric Co. | Industrial | |
| | Conglomerates | 1.4 |
| Facebook Inc. | Internet Software & | |
| | Services | 1.4 |
| Top Ten | | 19.1% |
| The holdings listed exclude any temporary cash investments and equity index products. |
1 The expense ratios shown are from the prospectus dated April 27, 2016, and represent estimated costs for the current fiscal year. For the fiscal
year ended December 31, 2016, the expense ratios were 0.14% for Investor Shares, 0.04% for ETF Shares, 0.04% for Admiral Shares, and 0.01% for
Institutional Select Shares (annualized since inception).
7
500 Index Fund
Investment Focus
8
500 Index Fund
Performance Summary
All of the returns in this report represent past performance, which is not a guarantee of future results that may be achieved by the fund. (Current performance may be lower or higher than the performance data cited. For performance data current to the most recent month-end, visit our website at vanguard.com/performance.) Note, too, that both investment returns and principal value can fluctuate widely, so an investor’s shares, when sold, could be worth more or less than their original cost. The returns shown do not reflect taxes that a shareholder would pay on fund distributions or on the sale of fund shares.
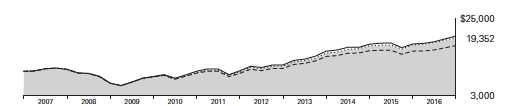
Cumulative Performance: December 31, 2006, Through December 31, 2016
Initial Investment of $10,000
| | | | | |
| | | Average Annual Total Returns | |
| | | Periods Ended December 31, 2016 | |
| | | | | | Final Value |
| | | One | Five | Ten | of a $10,000 |
| | | Year | Years | Years | Investment |
| | 500 Index Fund*Investor Shares | 11.82% | 14.49% | 6.82% | $19,352 |
| • • • • • • •• | S&P 500 Index | 11.96 | 14.66 | 6.95 | 19,572 |
| – – – – | Large-Cap Core Funds Average | 9.92 | 12.92 | 5.63 | 17,288 |
| | Dow Jones U.S. Total Stock Market | | | | |
| | Float Adjusted Index | 12.62 | 14.59 | 7.18 | 20,003 |
| Large-Cap Core Funds Average: Derived from data provided by Lipper, a Thomson Reuters Company. |
| | | | |
| | | | Since | Final Value |
| | One | Five | Inception | of a $10,000 |
| | Year | Years | (9/7/2010) | Investment |
| 500 Index Fund | | | | |
| ETF Shares Net Asset Value | 11.93% | 14.62% | 14.42% | $23,409 |
| S&P 500 Index | 11.96 | 14.66 | 14.45 | 23,457 |
| Dow Jones U.S. Total Stock Market Float | | | | |
| Adjusted Index | 12.62 | 14.59 | 14.43 | 23,431 |
| "Since Inception" performance is calculated from the ETF Shares’ inception date for both the fund and its comparative standards. |
See Financial Highlights for dividend and capital gains information.
9
500 Index Fund
| | | | |
| | Average Annual Total Returns | |
| | Periods Ended December 31, 2016 | |
| |
| | | | | Final Value |
| | One | Five | Ten | of a $10,000 |
| | Year | Years | Years | Investment |
| 500 Index Fund Admiral Shares | 11.93% | 14.62% | 6.94% | $19,560 |
| S&P 500 Index | 11.96 | 14.66 | 6.95 | 19,572 |
| Dow Jones U.S. Total Stock Market Float | | | | |
| Adjusted Index | 12.62 | 14.59 | 7.18 | 20,003 |
| | |
| | Since | Final Value |
| | Inception | of a $5,000,000,000 |
| | (6/24/2016) | Investment |
| 500 Index Fund Institutional Select Shares | 11.12% | $5,556,006,017 |
| S&P 500 Index | 11.11 | 5,555,696,904 |
| Dow Jones U.S. Total Stock Market Float | | |
| Adjusted Index | 11.96 | 5,598,236,534 |
| "Since Inception" performance is calculated from the Institutional Select Shares’ inception date for both the fund and its comparative standards. |
| | | |
| Cumulative Returns of ETF Shares: September 7, 2010, Through December 31, 2016 | |
| | | | Since |
| | One | Five | Inception |
| | Year | Years | (9/7/2010) |
| 500 Index Fund ETF Shares Market Price | 12.04% | 98.00% | 134.27% |
| 500 Index Fund ETF Shares Net Asset Value | 11.93 | 97.85 | 134.09 |
| S&P 500 Index | 11.96 | 98.18 | 134.57 |
| "Since Inception" performance is calculated from the ETF Shares’ inception date for both the fund and its comparative standards. |
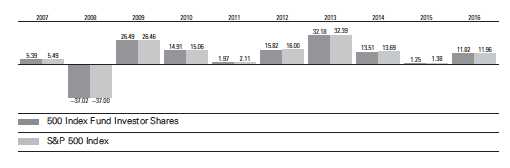
Fiscal-Year Total Returns (%): December 31, 2006, Through December 31, 2016
10
500 Index Fund
Financial Statements
Statement of Net Assets
As of December 31, 2016
The fund reports a complete list of its holdings in regulatory filings four times in each fiscal year, at the quarter-ends. For the second and fourth fiscal quarters, the lists appear in the fund’s semiannual and annual reports to shareholders. For the first and third fiscal quarters, the fund files the lists with the Securities and Exchange Commission on Form N-Q. Shareholders can look up the fund’s Forms N-Q on the SEC’s website at sec.gov. Forms N-Q may also be reviewed and copied at the SEC’s Public Reference Room (see the back cover of this report for further information).
| | | |
| | | | Market |
| | | | Value• |
| | | Shares | ($000) |
| Common Stocks (99.7%)1 | | |
| Consumer Discretionary (12.0%) | |
| * | Amazon.com Inc. | 5,765,107 | 4,323,081 |
| | Comcast Corp. Class A | 34,840,084 | 2,405,708 |
| | Home Depot Inc. | 17,806,958 | 2,387,557 |
| | Walt Disney Co. | 21,402,585 | 2,230,577 |
| | McDonald’s Corp. | 12,139,317 | 1,477,598 |
| | Starbucks Corp. | 21,274,817 | 1,181,178 |
| | Time Warner Inc. | 11,272,300 | 1,088,115 |
| * | Priceline Group Inc. | 721,340 | 1,057,528 |
| | NIKE Inc. Class B | 19,532,079 | 992,816 |
| * | Charter Communications | | |
| | Inc. Class A | 3,165,265 | 911,343 |
| | Lowe’s Cos. Inc. | 12,715,384 | 904,318 |
| * | Netflix Inc. | 6,273,236 | 776,627 |
| | TJX Cos. Inc. | 9,529,440 | 715,947 |
| | General Motors Co. | 20,277,393 | 706,464 |
| | Ford Motor Co. | 57,052,235 | 692,044 |
| | Target Corp. | 8,210,792 | 593,065 |
| | Twenty-First Century | | |
| | Fox Inc. Class A | 15,477,758 | 433,996 |
| | Marriott International | | |
| | Inc. Class A | 4,680,512 | 386,985 |
| * | O’Reilly Automotive Inc. | 1,380,817 | 384,433 |
| | Ross Stores Inc. | 5,797,198 | 380,296 |
| | CBS Corp. Class B | 5,729,867 | 364,534 |
| * | AutoZone Inc. | 421,883 | 333,199 |
| | Yum! Brands Inc. | 5,096,724 | 322,775 |
| | Carnival Corp. | 6,129,683 | 319,111 |
| | Newell Brands Inc. | 7,051,694 | 314,858 |
| | Omnicom Group Inc. | 3,448,101 | 293,468 |
| | Dollar General Corp. | 3,715,329 | 275,194 |
| | Delphi Automotive plc | 3,959,118 | 266,647 |
| * | Dollar Tree Inc. | 3,450,919 | 266,342 |
| | VF Corp. | 4,837,988 | 258,107 |
| | L Brands Inc. | 3,511,334 | 231,186 |
| * | Ulta Salon Cosmetics | | |
| | & Fragrance Inc. | 857,052 | 218,497 |
| | Genuine Parts Co. | 2,174,320 | 207,734 |
| | | |
| | Royal Caribbean Cruises | | |
| | Ltd. | 2,446,674 | 200,725 |
| | Expedia Inc. | 1,765,336 | 199,977 |
| | Whirlpool Corp. | 1,097,908 | 199,567 |
| | Twenty-First Century | | |
| | Fox Inc. | 7,120,145 | 194,024 |
| * | Mohawk Industries Inc. | 921,566 | 184,018 |
| | Advance Auto Parts Inc. | 1,076,626 | 182,079 |
| *,^ | CarMax Inc. | 2,782,273 | 179,150 |
| | Viacom Inc. Class B | 5,077,954 | 178,236 |
| | Best Buy Co. Inc. | 3,991,139 | 170,302 |
| | Macy’s Inc. | 4,468,275 | 160,009 |
| * | Chipotle Mexican Grill | | |
| | Inc. Class A | 423,207 | 159,684 |
| | Harley-Davidson Inc. | 2,583,966 | 150,749 |
| | Tractor Supply Co. | 1,918,269 | 145,424 |
| | Coach Inc. | 4,098,343 | 143,524 |
| | Foot Locker Inc. | 1,977,735 | 140,202 |
| | Mattel Inc. | 5,000,760 | 137,771 |
| * | LKQ Corp. | 4,494,477 | 137,756 |
| | Interpublic Group of | | |
| | Cos. Inc. | 5,803,542 | 135,861 |
| | DR Horton Inc. | 4,961,841 | 135,607 |
| | Darden Restaurants Inc. | 1,799,466 | 130,857 |
| | Hasbro Inc. | 1,641,684 | 127,707 |
| | Kohl’s Corp. | 2,579,446 | 127,373 |
| | Lennar Corp. Class A | 2,872,051 | 123,297 |
| | Tiffany & Co. | 1,564,314 | 121,125 |
| | Wyndham Worldwide | | |
| | Corp. | 1,575,324 | 120,307 |
| | Hanesbrands Inc. | 5,524,616 | 119,166 |
| | Goodyear Tire & Rubber | | |
| | Co. | 3,814,813 | 117,763 |
| | BorgWarner Inc. | 2,926,872 | 115,436 |
| | Harman International | | |
| | Industries Inc. | 1,019,015 | 113,274 |
| | PVH Corp. | 1,158,739 | 104,565 |
| * | Michael Kors Holdings | | |
| | Ltd. | 2,400,888 | 103,190 |
| ^ | Wynn Resorts Ltd. | 1,160,037 | 100,355 |
11
500 Index Fund
| | | |
| | | | Market |
| | | | Value• |
| | | Shares | ($000) |
| | Scripps Networks | | |
| | Interactive Inc. Class A | 1,391,838 | 99,335 |
| | Signet Jewelers Ltd. | 1,017,055 | 95,868 |
| | Leggett & Platt Inc. | 1,953,758 | 95,500 |
| | Bed Bath & Beyond Inc. | 2,222,332 | 90,316 |
| * | Discovery | | |
| | Communications Inc. | 3,220,933 | 86,257 |
| | Staples Inc. | 9,511,647 | 86,080 |
| | News Corp. Class A | 7,251,539 | 83,103 |
| ^ | Garmin Ltd. | 1,680,289 | 81,477 |
| ^ | Nordstrom Inc. | 1,698,211 | 81,395 |
| | PulteGroup Inc. | 4,351,078 | 79,973 |
| *,^ | Under Armour Inc. | | |
| | Class A | 2,685,229 | 78,006 |
| * | TripAdvisor Inc. | 1,670,509 | 77,461 |
| | Ralph Lauren Corp. | | |
| | Class A | 823,420 | 74,371 |
| ^ | Gap Inc. | 3,207,181 | 71,969 |
| ^ | H&R Block Inc. | 3,027,345 | 69,599 |
| * | Under Armour Inc. | 2,701,894 | 68,007 |
| | TEGNA Inc. | 3,130,614 | 66,964 |
| * | Discovery | | |
| | Communications Inc. | | |
| | Class A | 2,224,599 | 60,976 |
| * | AutoNation Inc. | 960,141 | 46,711 |
| * | Urban Outfitters Inc. | 1,291,676 | 36,787 |
| | News Corp. Class B | 147,500 | 1,740 |
| | | | 33,892,303 |
| Consumer Staples (9.3%) | | |
| | Procter & Gamble Co. | 39,117,176 | 3,288,972 |
| | Coca-Cola Co. | 56,741,562 | 2,352,505 |
| | PepsiCo Inc. | 20,964,669 | 2,193,533 |
| | Philip Morris | | |
| | International Inc. | 22,677,509 | 2,074,765 |
| | Altria Group Inc. | 28,508,817 | 1,927,766 |
| | Wal-Mart Stores Inc. | 22,012,467 | 1,521,502 |
| | CVS Health Corp. | 15,589,031 | 1,230,131 |
| | Walgreens Boots | | |
| | Alliance Inc. | 12,509,894 | 1,035,319 |
| | Costco Wholesale Corp. | 6,389,858 | 1,023,080 |
| | Mondelez International | | |
| | Inc. Class A | 22,576,082 | 1,000,798 |
| | Colgate-Palmolive Co. | 12,992,922 | 850,257 |
| | Kraft Heinz Co. | 8,719,035 | 761,346 |
| | Reynolds American Inc. | 12,088,378 | 677,433 |
| | Kimberly-Clark Corp. | 5,235,445 | 597,469 |
| | General Mills Inc. | 8,644,899 | 533,995 |
| | Kroger Co. | 13,801,819 | 476,301 |
| | Sysco Corp. | 7,355,462 | 407,272 |
| | Constellation Brands Inc. | | |
| | Class A | 2,597,862 | 398,278 |
| | Archer-Daniels-Midland | | |
| | Co. | 8,411,105 | 383,967 |
| | Kellogg Co. | 3,693,341 | 272,236 |
| * | Monster Beverage Corp. | 5,925,980 | 262,758 |
| | |
| Molson Coors Brewing | | |
| Co. Class B | 2,693,903 | 262,144 |
| Tyson Foods Inc. | | |
| Class A | 4,247,731 | 262,000 |
| Estee Lauder Cos. Inc. | | |
| Class A | 3,249,110 | 248,525 |
| Dr Pepper Snapple | | |
| Group Inc. | 2,685,436 | 243,489 |
| Conagra Brands Inc. | 6,078,816 | 240,417 |
| Clorox Co. | 1,882,036 | 225,882 |
| JM Smucker Co. | 1,702,110 | 217,972 |
| Hershey Co. | 2,038,976 | 210,891 |
| Mead Johnson Nutrition | | |
| Co. | 2,700,095 | 191,059 |
| Campbell Soup Co. | 2,832,335 | 171,271 |
| Church & Dwight Co. Inc. | 3,780,454 | 167,058 |
| McCormick & Co. Inc. | 1,674,705 | 156,300 |
| Whole Foods Market Inc. | 4,654,422 | 143,170 |
| Hormel Foods Corp. | 3,944,645 | 137,313 |
| Coty Inc. Class A | 6,873,139 | 125,847 |
| Brown-Forman Corp. | | |
| Class B | 2,666,137 | 119,763 |
| | | 26,392,784 |
| Energy (7.5%) | | |
| Exxon Mobil Corp. | 60,615,771 | 5,471,179 |
| Chevron Corp. | 27,595,116 | 3,247,945 |
| Schlumberger Ltd. | 20,337,952 | 1,707,371 |
| ConocoPhillips | 18,111,980 | 908,135 |
| EOG Resources Inc. | 8,426,617 | 851,931 |
| Occidental Petroleum | | |
| Corp. | 11,170,875 | 795,701 |
| Halliburton Co. | 12,636,421 | 683,504 |
| Kinder Morgan Inc. | 28,063,971 | 581,205 |
| Anadarko Petroleum | | |
| Corp. | 8,169,980 | 569,693 |
| Phillips 66 | 6,471,663 | 559,216 |
| Valero Energy Corp. | 6,617,021 | 452,075 |
| Pioneer Natural | | |
| Resources Co. | 2,481,005 | 446,755 |
| Spectra Energy Corp. | 10,254,802 | 421,370 |
| Baker Hughes Inc. | 6,180,297 | 401,534 |
| Marathon Petroleum | | |
| Corp. | 7,715,531 | 388,477 |
| Apache Corp. | 5,546,532 | 352,038 |
| Devon Energy Corp. | 7,653,925 | 349,555 |
| Williams Cos. Inc. | 9,987,844 | 311,021 |
| * Concho resources Inc. | 2,134,950 | 283,094 |
| Hess Corp. | 3,898,093 | 242,812 |
| Noble Energy Inc. | 6,266,497 | 238,503 |
| Marathon Oil Corp. | 12,384,437 | 214,375 |
| National Oilwell Varco | | |
| Inc. | 5,520,926 | 206,703 |
| Cimarex Energy Co. | 1,388,223 | 188,660 |
| ONEOK Inc. | 3,077,422 | 176,675 |
| EQT Corp. | 2,525,336 | 165,157 |
12
500 Index Fund
| | | |
| | | | Market |
| | | | Value• |
| | | Shares | ($000) |
| | Cabot Oil & Gas Corp. | 6,799,561 | 158,838 |
| | Tesoro Corp. | 1,708,493 | 149,408 |
| ^ | Helmerich & Payne Inc. | 1,581,364 | 122,398 |
| * | FMC Technologies Inc. | 3,299,327 | 117,225 |
| * | Newfield Exploration Co. | 2,883,209 | 116,770 |
| | Range Resources Corp. | 2,745,674 | 94,341 |
| *,^ | Transocean Ltd. | 5,691,335 | 83,890 |
| * | Southwestern Energy Co. | 7,171,951 | 77,601 |
| * | Chesapeake Energy | | |
| | Corp. | 10,893,345 | 76,471 |
| | Murphy Oil Corp. | 2,366,274 | 73,662 |
| | | | 21,285,288 |
| Financials (14.8%) | | |
| | JPMorgan Chase & Co. | 52,306,428 | 4,513,522 |
| * | Berkshire Hathaway Inc. | | |
| | Class B | 26,227,976 | 4,274,635 |
| | Wells Fargo & Co. | 66,073,771 | 3,641,325 |
| | Bank of America Corp. | 147,714,160 | 3,264,483 |
| | Citigroup Inc. | 41,656,820 | 2,475,665 |
| | Goldman Sachs Group | | |
| | Inc. | 5,405,851 | 1,294,431 |
| | US Bancorp | 23,354,646 | 1,199,728 |
| | American International | | |
| | Group Inc. | 14,263,674 | 931,561 |
| | Chubb Ltd. | 6,802,207 | 898,708 |
| | Morgan Stanley | 21,080,064 | 890,633 |
| | MetLife Inc. | 16,066,967 | 865,849 |
| | American Express Co. | 11,238,424 | 832,542 |
| | PNC Financial Services | | |
| | Group Inc. | 7,111,544 | 831,766 |
| | Bank of New York | | |
| | Mellon Corp. | 15,455,870 | 732,299 |
| | Charles Schwab Corp. | 17,634,462 | 696,032 |
| | BlackRock Inc. | 1,776,795 | 676,142 |
| | Prudential Financial Inc. | 6,285,682 | 654,088 |
| | Capital One Financial | | |
| | Corp. | 7,050,201 | 615,059 |
| | CME Group Inc. | 4,960,575 | 572,202 |
| | BB&T Corp. | 11,861,271 | 557,717 |
| | Marsh & McLennan | | |
| | Cos. Inc. | 7,536,898 | 509,419 |
| | Travelers Cos. Inc. | 4,152,293 | 508,324 |
| | Intercontinental | | |
| | Exchange Inc. | 8,707,445 | 491,274 |
| | Aon plc | 3,845,859 | 428,929 |
| | Synchrony Financial | 11,463,363 | 415,776 |
| | Discover Financial | | |
| | Services | 5,765,395 | 415,627 |
| | Aflac Inc. | 5,965,561 | 415,203 |
| | State Street Corp. | 5,300,271 | 411,937 |
| | S&P Global Inc. | 3,787,526 | 407,311 |
| | Allstate Corp. | 5,382,886 | 398,979 |
| | SunTrust Banks Inc. | 7,174,401 | 393,516 |
| | M&T Bank Corp. | 2,266,469 | 354,544 |
| | Progressive Corp. | 8,482,789 | 301,139 |
| | | |
| | Fifth Third Bancorp | 11,045,464 | 297,896 |
| | KeyCorp | 15,797,801 | 288,626 |
| | Northern Trust Corp. | 3,111,354 | 277,066 |
| | T. Rowe Price Group Inc. | 3,558,459 | 267,810 |
| | Citizens Financial Group | | |
| | Inc. | 7,482,596 | 266,605 |
| | Hartford Financial | | |
| | Services Group Inc. | 5,521,669 | 263,107 |
| | Regions Financial Corp. | 17,994,356 | 258,399 |
| | Ameriprise Financial Inc. | 2,310,295 | 256,304 |
| * | Berkshire Hathaway Inc. | | |
| | Class A | 1,034 | 252,421 |
| | Willis Towers Watson | | |
| | plc | 1,878,985 | 229,762 |
| | Moody’s Corp. | 2,431,600 | 229,227 |
| | Principal Financial | | |
| | Group Inc. | 3,910,971 | 226,289 |
| | Lincoln National Corp. | 3,341,134 | 221,417 |
| | Huntington Bancshares | | |
| | Inc. | 15,858,958 | 209,655 |
| | Franklin Resources Inc. | 5,071,951 | 200,748 |
| | Loews Corp. | 4,038,999 | 189,146 |
| | Invesco Ltd. | 5,971,648 | 181,180 |
| | Comerica Inc. | 2,518,133 | 171,510 |
| | Cincinnati Financial Corp. | 2,191,536 | 166,009 |
| | Unum Group | 3,393,098 | 149,059 |
| | XL Group Ltd. | 3,932,785 | 146,536 |
| * | E*TRADE Financial Corp. | 4,002,301 | 138,680 |
| | Arthur J Gallagher & Co. | 2,601,107 | 135,153 |
| | Zions Bancorporation | 2,977,954 | 128,171 |
| | Torchmark Corp. | 1,613,120 | 118,984 |
| * | Affiliated Managers | | |
| | Group Inc. | 801,367 | 116,439 |
| | Nasdaq Inc. | 1,666,294 | 111,842 |
| | Leucadia National Corp. | 4,736,312 | 110,119 |
| | People’s United | | |
| | Financial Inc. | 4,551,999 | 88,127 |
| | Assurant Inc. | 833,422 | 77,392 |
| | Navient Corp. | 4,429,667 | 72,779 |
| | | | 41,716,823 |
| Health Care (13.6%) | | |
| | Johnson & Johnson | 39,768,304 | 4,581,706 |
| | Pfizer Inc. | 88,706,323 | 2,881,181 |
| | Merck & Co. Inc. | 40,303,465 | 2,372,665 |
| | UnitedHealth Group Inc. | 13,913,539 | 2,226,723 |
| | Amgen Inc. | 10,874,522 | 1,589,964 |
| | AbbVie Inc. | 23,755,510 | 1,487,570 |
| | Medtronic plc | 20,070,973 | 1,429,655 |
| | Bristol-Myers Squibb | | |
| | Co. | 24,429,744 | 1,427,674 |
| | Gilead Sciences Inc. | 19,258,427 | 1,379,096 |
| * | Celgene Corp. | 11,331,851 | 1,311,662 |
| * | Allergan plc | 5,482,889 | 1,151,462 |
| | Eli Lilly & Co. | 14,200,872 | 1,044,474 |
| * | Biogen Inc. | 3,180,498 | 901,926 |
13
500 Index Fund
| | | |
| | | | Market |
| | | | Value• |
| | | Shares | ($000) |
| | Abbott Laboratories | 21,522,037 | 826,661 |
| | Thermo Fisher Scientific | | |
| | Inc. | 5,774,348 | 814,761 |
| | Danaher Corp. | 8,897,809 | 692,605 |
| | Aetna Inc. | 5,129,392 | 636,096 |
| * | Express Scripts Holding | | |
| | Co. | 9,013,666 | 620,050 |
| | Anthem Inc. | 3,850,850 | 553,637 |
| | Stryker Corp. | 4,543,175 | 544,318 |
| | Becton Dickinson and | | |
| | Co. | 3,103,652 | 513,810 |
| | Cigna Corp. | 3,753,018 | 500,615 |
| | McKesson Corp. | 3,304,862 | 464,168 |
| | Humana Inc. | 2,179,505 | 444,684 |
| * | Boston Scientific Corp. | 19,904,889 | 430,543 |
| * | Regeneron | | |
| | Pharmaceuticals Inc. | 1,105,094 | 405,669 |
| * | Alexion Pharmaceuticals | | |
| | Inc. | 3,278,092 | 401,075 |
| | Zoetis Inc. | 7,218,754 | 386,420 |
| * | Intuitive Surgical Inc. | 566,381 | 359,182 |
| | Cardinal Health Inc. | 4,678,630 | 336,721 |
| | St. Jude Medical Inc. | 4,176,563 | 334,919 |
| | Baxter International Inc. | 7,155,792 | 317,288 |
| * | HCA Holdings Inc. | 4,272,171 | 316,226 |
| | Zimmer Biomet | | |
| | Holdings Inc. | 2,928,007 | 302,170 |
| * | Edwards Lifesciences | | |
| | Corp. | 3,125,470 | 292,857 |
| * | Illumina Inc. | 2,147,364 | 274,948 |
| * | Vertex Pharmaceuticals | | |
| | Inc. | 3,625,773 | 267,111 |
| * | Mylan NV | 6,727,000 | 256,635 |
| | CR Bard Inc. | 1,074,811 | 241,467 |
| | Agilent Technologies Inc. | 4,741,767 | 216,035 |
| * | Cerner Corp. | 4,416,792 | 209,223 |
| | Dentsply Sirona Inc. | 3,374,958 | 194,836 |
| * | Laboratory Corp. of | | |
| | America Holdings | 1,505,669 | 193,298 |
| | AmerisourceBergen | | |
| | Corp. Class A | 2,445,181 | 191,189 |
| | Quest Diagnostics Inc. | 2,026,689 | 186,253 |
| * | Henry Schein Inc. | 1,176,636 | 178,507 |
| | Perrigo Co. plc | 2,095,853 | 174,438 |
| * | Hologic Inc. | 4,066,958 | 163,166 |
| * | Mettler-Toledo | | |
| | International Inc. | 383,582 | 160,552 |
| * | Waters Corp. | 1,177,855 | 158,292 |
| * | DaVita Inc. | 2,308,360 | 148,197 |
| * | Centene Corp. | 2,498,086 | 141,167 |
| | Universal Health | | |
| | Services Inc. Class B | 1,310,766 | 139,439 |
| | Cooper Cos. Inc. | 712,525 | 124,642 |
| * | Varian Medical Systems | | |
| | Inc. | 1,365,496 | 122,594 |
| | | |
| * | Envision Healthcare | | |
| | Corp. | 1,714,723 | 108,525 |
| | PerkinElmer Inc. | 1,601,363 | 83,511 |
| * | Mallinckrodt plc | 1,547,692 | 77,106 |
| | Patterson Cos. Inc. | 1,218,071 | 49,977 |
| * | Endo International plc | 2,899,645 | 47,757 |
| | | | 38,389,098 |
| Industrials (10.2%) | | |
| | General Electric Co. 129,315,198 | 4,086,360 |
| | 3M Co. | 8,792,077 | 1,570,001 |
| | Boeing Co. | 8,390,148 | 1,306,178 |
| | Honeywell International | | |
| | Inc. | 11,140,592 | 1,290,638 |
| | Union Pacific Corp. | 12,046,779 | 1,249,010 |
| | United Technologies | | |
| | Corp. | 11,193,925 | 1,227,078 |
| | United Parcel Service | | |
| | Inc. Class B | 10,076,997 | 1,155,227 |
| | Lockheed Martin Corp. | 3,683,076 | 920,548 |
| | Caterpillar Inc. | 8,552,550 | 793,163 |
| | General Dynamics Corp. | 4,184,346 | 722,469 |
| | FedEx Corp. | 3,574,071 | 665,492 |
| | Raytheon Co. | 4,292,446 | 609,527 |
| | Northrop Grumman Corp. | 2,576,587 | 599,263 |
| | Illinois Tool Works Inc. | 4,617,828 | 565,499 |
| | Johnson Controls | | |
| | International plc | 13,692,850 | 564,009 |
| | Delta Air Lines Inc. | 10,764,367 | 529,499 |
| | Emerson Electric Co. | 9,395,996 | 523,827 |
| | CSX Corp. | 13,692,064 | 491,956 |
| | Norfolk Southern Corp. | 4,267,649 | 461,205 |
| | Southwest Airlines Co. | 8,998,779 | 448,499 |
| | Eaton Corp. plc | 6,602,884 | 442,987 |
| | Deere & Co. | 4,228,548 | 435,710 |
| | Waste Management Inc. | 5,944,337 | 421,513 |
| | American Airlines Group | | |
| | Inc. | 7,573,882 | 353,625 |
| | PACCAR Inc. | 5,124,106 | 327,430 |
| | Cummins Inc. | 2,253,677 | 308,010 |
| * | United Continental | | |
| | Holdings Inc. | 4,220,651 | 307,601 |
| | Ingersoll-Rand plc | 3,776,318 | 283,375 |
| | Parker-Hannifin Corp. | 1,950,029 | 273,004 |
| | Roper Technologies Inc. | 1,482,747 | 271,461 |
| | Stanley Black & Decker | | |
| | Inc. | 2,202,746 | 252,633 |
| | Rockwell Automation | | |
| | Inc. | 1,874,474 | 251,929 |
| | Fortive Corp. | 4,396,974 | 235,810 |
| | Equifax Inc. | 1,750,852 | 207,003 |
| | Nielsen Holdings plc | 4,911,611 | 206,042 |
| | Fastenal Co. | 4,225,051 | 198,493 |
| | Republic Services Inc. | | |
| | Class A | 3,379,086 | 192,777 |
| | Textron Inc. | 3,949,895 | 191,807 |
14
500 Index Fund
| | | |
| | | | Market |
| | | | Value• |
| | | Shares | ($000) |
| ^ | WW Grainger Inc. | 801,123 | 186,061 |
| * | Verisk Analytics Inc. | | |
| | Class A | 2,276,349 | 184,771 |
| | TransDigm Group Inc. | 733,004 | 182,489 |
| | Rockwell Collins Inc. | 1,904,143 | 176,628 |
| | L-3 Communications | | |
| | Holdings Inc. | 1,129,461 | 171,802 |
| | Dover Corp. | 2,270,761 | 170,148 |
| | AMETEK Inc. | 3,383,012 | 164,414 |
| | Alaska Air Group Inc. | 1,801,998 | 159,891 |
| | Masco Corp. | 4,798,953 | 151,743 |
| | CH Robinson Worldwide | | |
| | Inc. | 2,070,060 | 151,653 |
| | Acuity Brands Inc. | 644,462 | 148,781 |
| | Cintas Corp. | 1,257,577 | 145,326 |
| | Snap-on Inc. | 848,127 | 145,259 |
| | Expeditors International | | |
| | of Washington Inc. | 2,636,685 | 139,639 |
| | Pentair plc | 2,444,577 | 137,067 |
| | Kansas City Southern | 1,572,617 | 133,437 |
| * | United Rentals Inc. | 1,231,067 | 129,976 |
| | Xylem Inc. | 2,622,032 | 129,843 |
| | JB Hunt Transport | | |
| | Services Inc. | 1,279,143 | 124,166 |
| | Fortune Brands Home & | | |
| | Security Inc. | 2,255,336 | 120,570 |
| | Arconic Inc. | 6,408,658 | 118,817 |
| | Fluor Corp. | 2,035,993 | 106,930 |
| * | Jacobs Engineering | | |
| | Group Inc. | 1,765,037 | 100,607 |
| * | Stericycle Inc. | 1,243,456 | 95,796 |
| | Robert Half International | | |
| | Inc. | 1,884,003 | 91,902 |
| | Flowserve Corp. | 1,907,078 | 91,635 |
| | Allegion plc | 1,402,331 | 89,749 |
| * | Quanta Services Inc. | 2,210,040 | 77,020 |
| | Dun & Bradstreet Corp. | 537,686 | 65,232 |
| | Ryder System Inc. | 781,093 | 58,145 |
| | Pitney Bowes Inc. | 2,715,696 | 41,251 |
| | | | 28,931,406 |
| Information Technology (20.7%) | |
| | Apple Inc. | 77,947,003 | 9,027,822 |
| | Microsoft Corp. | 113,658,975 | 7,062,769 |
| * | Facebook Inc. Class A | 34,217,885 | 3,936,768 |
| * | Alphabet Inc. Class A | 4,328,192 | 3,429,876 |
| * | Alphabet Inc. | 4,338,297 | 3,348,384 |
| | Intel Corp. | 69,273,914 | 2,512,565 |
| | Cisco Systems Inc. | 73,377,992 | 2,217,483 |
| | Visa Inc. Class A | 27,300,101 | 2,129,954 |
| | International Business | | |
| | Machines Corp. | 12,648,515 | 2,099,527 |
| | Oracle Corp. | 43,810,611 | 1,684,518 |
| | Mastercard Inc. Class A | 13,914,035 | 1,436,624 |
| | QUALCOMM Inc. | 21,588,941 | 1,407,599 |
| | Texas Instruments Inc. | 14,610,344 | 1,066,117 |
| | | |
| | Accenture plc Class A | 9,067,602 | 1,062,088 |
| | Broadcom Ltd. | 5,808,364 | 1,026,744 |
| | NVIDIA Corp. | 7,879,050 | 841,010 |
| * | Adobe Systems Inc. | 7,268,378 | 748,279 |
| | Automatic Data | | |
| | Processing Inc. | 6,595,184 | 677,853 |
| * | PayPal Holdings Inc. | 16,403,936 | 647,463 |
| * | salesforce.com Inc. | 9,331,322 | 638,822 |
| | Hewlett Packard | | |
| | Enterprise Co. | 24,353,360 | 563,537 |
| | Applied Materials Inc. | 15,800,456 | 509,881 |
| * | Cognizant Technology | | |
| | Solutions Corp. | | |
| | Class A | 8,868,730 | 496,915 |
| * | Yahoo! Inc. | 12,831,543 | 496,196 |
| * | eBay Inc. | 15,197,823 | 451,223 |
| | Intuit Inc. | 3,564,366 | 408,512 |
| | HP Inc. | 25,009,348 | 371,139 |
| | Fidelity National | | |
| | Information Services | | |
| | Inc. | 4,798,016 | 362,922 |
| | Activision Blizzard Inc. | 9,995,076 | 360,922 |
| | TE Connectivity Ltd. | 5,194,385 | 359,867 |
| * | Electronic Arts Inc. | 4,411,041 | 347,414 |
| | Corning Inc. | 13,904,879 | 337,471 |
| * | Fiserv Inc. | 3,172,936 | 337,220 |
| * | Micron Technology Inc. | 15,088,527 | 330,740 |
| | Analog Devices Inc. | 4,504,879 | 327,144 |
| | Amphenol Corp. | | |
| | Class A | 4,509,395 | 303,031 |
| | Paychex Inc. | 4,705,093 | 286,446 |
| | Western Digital Corp. | 4,173,011 | 283,556 |
| | Lam Research Corp. | 2,380,278 | 251,667 |
| | Xilinx Inc. | 3,691,149 | 222,835 |
| | Linear Technology Corp. | 3,513,526 | 219,068 |
| | Symantec Corp. | 9,113,146 | 217,713 |
| * | Autodesk Inc. | 2,862,906 | 211,884 |
| * | Citrix Systems Inc. | 2,279,915 | 203,619 |
| | Skyworks Solutions Inc. | 2,716,167 | 202,789 |
| | Microchip Technology | | |
| | Inc. | 3,157,837 | 202,575 |
| | Motorola Solutions Inc. | 2,425,986 | 201,090 |
| | Alliance Data Systems | | |
| | Corp. | 844,297 | 192,922 |
| | Harris Corp. | 1,816,886 | 186,176 |
| * | Red Hat Inc. | 2,625,321 | 182,985 |
| | KLA-Tencor Corp. | 2,285,398 | 179,815 |
| * | Akamai Technologies Inc. | 2,533,348 | 168,924 |
| | Seagate Technology plc | 4,305,291 | 164,333 |
| | Juniper Networks Inc. | 5,559,603 | 157,114 |
| | Global Payments Inc. | 2,246,618 | 155,938 |
| | Western Union Co. | 7,088,162 | 153,955 |
| | CA Inc. | 4,580,856 | 145,534 |
| | NetApp Inc. | 4,025,459 | 141,978 |
| * | F5 Networks Inc. | 954,662 | 138,159 |
15
500 Index Fund
| | | |
| | | | Market |
| | | | Value• |
| | | Shares | ($000) |
| | Total System Services | | |
| | Inc. | 2,418,150 | 118,562 |
| | Xerox Corp. | 12,448,304 | 108,674 |
| *,^ | VeriSign Inc. | 1,329,809 | 101,159 |
| * | Qorvo Inc. | 1,867,006 | 98,447 |
| | FLIR Systems Inc. | 1,989,943 | 72,016 |
| | CSRA Inc. | 2,125,949 | 67,690 |
| * | Teradata Corp. | 1,898,225 | 51,575 |
| *,^ | First Solar Inc. | 1,138,813 | 36,544 |
| * | Conduent Inc. | 8,261 | 123 |
| | | | 58,492,264 |
| Materials (2.8%) | | |
| | Dow Chemical Co. | 16,392,150 | 937,959 |
| | EI du Pont de Nemours | | |
| | & Co. | 12,707,932 | 932,762 |
| | Monsanto Co. | 6,402,371 | 673,593 |
| | Praxair Inc. | 4,171,759 | 488,888 |
| | Air Products & | | |
| | Chemicals Inc. | 3,177,563 | 456,997 |
| | Ecolab Inc. | 3,835,669 | 449,617 |
| | LyondellBasell Industries | | |
| | NV Class A | 4,884,888 | 419,026 |
| | PPG Industries Inc. | 3,859,049 | 365,684 |
| | International Paper Co. | 6,011,070 | 318,947 |
| | Sherwin-Williams Co. | 1,181,572 | 317,536 |
| | Nucor Corp. | 4,655,563 | 277,099 |
| | Newmont Mining Corp. | 7,758,431 | 264,330 |
| | Vulcan Materials Co. | 1,934,080 | 242,050 |
| * | Freeport-McMoRan Inc. | 18,312,598 | 241,543 |
| | Martin Marietta | | |
| | Materials Inc. | 927,722 | 205,518 |
| | Ball Corp. | 2,555,300 | 191,826 |
| | WestRock Co. | 3,670,651 | 186,359 |
| | Eastman Chemical Co. | 2,145,216 | 161,342 |
| | Mosaic Co. | 5,119,772 | 150,163 |
| | Albemarle Corp. | 1,644,225 | 141,535 |
| | International Flavors | | |
| | & Fragrances Inc. | 1,160,931 | 136,793 |
| | Sealed Air Corp. | 2,825,362 | 128,102 |
| | FMC Corp. | 1,956,125 | 110,638 |
| | CF Industries Holdings | | |
| | Inc. | 3,407,956 | 107,282 |
| | Avery Dennison Corp. | 1,301,132 | 91,366 |
| | | | 7,996,955 |
| Real Estate (2.9%) | | |
| | Simon Property Group | | |
| | Inc. | 4,593,416 | 816,112 |
| | American Tower | | |
| | Corporation | 6,222,629 | 657,607 |
| | Public Storage | 2,180,387 | 487,316 |
| | Crown Castle | | |
| | International Corp. | 5,271,245 | 457,386 |
| | Prologis Inc. | 7,727,213 | 407,920 |
| | Equinix Inc. | 1,043,457 | 372,942 |
| | | |
| | AvalonBay Communities | | |
| | Inc. | 2,007,410 | 355,613 |
| | Welltower Inc. | 5,299,391 | 354,688 |
| | Equity Residential | 5,345,183 | 344,016 |
| | Weyerhaeuser Co. | 10,935,051 | 329,036 |
| | Ventas Inc. | 5,176,298 | 323,622 |
| | Boston Properties Inc. | 2,247,867 | 282,737 |
| | Vornado Realty Trust | 2,513,993 | 262,385 |
| | Digital Realty Trust Inc. | 2,323,395 | 228,297 |
| | Essex Property Trust Inc. | 957,680 | 222,661 |
| | Realty Income Corp. | 3,780,173 | 217,284 |
| | General Growth | | |
| | Properties Inc. | 8,535,762 | 213,223 |
| | Host Hotels & Resorts | | |
| | Inc. | 10,815,220 | 203,759 |
| | HCP Inc. | 6,835,066 | 203,138 |
| | Mid-America Apartment | | |
| | Communities Inc. | 1,659,481 | 162,496 |
| | SL Green Realty Corp. | 1,481,091 | 159,291 |
| | Kimco Realty Corp. | 6,212,861 | 156,316 |
| | Federal Realty | | |
| | Investment Trust | 1,049,518 | 149,147 |
| | UDR Inc. | 3,906,653 | 142,515 |
| | Extra Space Storage Inc. | 1,838,889 | 142,036 |
| * | CBRE Group Inc. Class A | 4,388,303 | 138,188 |
| | Macerich Co. | 1,764,789 | 125,018 |
| | Iron Mountain Inc. | 3,581,296 | 116,320 |
| | Apartment Investment | | |
| | & Management Co. | 2,293,779 | 104,252 |
| * | Quality Care Properties | | |
| | Inc. | 2 | — |
| | | | 8,135,321 |
| Telecommunication Services (2.7%) | |
| | AT&T Inc. | 89,768,284 | 3,817,845 |
| | Verizon | | |
| | Communications Inc. | 59,591,701 | 3,181,005 |
| * | Level 3 | | |
| | Communications Inc. | 4,261,770 | 240,193 |
| | CenturyLink Inc. | 7,991,449 | 190,037 |
| ^ | Frontier | | |
| | Communications Corp. | 17,147,740 | 57,960 |
| | | | 7,487,040 |
| Utilities (3.2%) | | |
| | NextEra Energy Inc. | 6,830,494 | 815,971 |
| | Duke Energy Corp. | 10,070,787 | 781,695 |
| | Southern Co. | 14,325,610 | 704,677 |
| | Dominion Resources | | |
| | Inc. | 9,161,824 | 701,704 |
| | Exelon Corp. | 13,496,340 | 478,985 |
| | American Electric Power | | |
| | Co. Inc. | 7,187,936 | 452,552 |
| | PG&E Corp. | 7,391,813 | 449,200 |
| | Sempra Energy | 3,655,291 | 367,868 |
| | Edison International | 4,762,766 | 342,872 |
16
500 Index Fund
| | | |
| | | | Market |
| | | | Value• |
| | | Shares | ($000) |
| | PPL Corp. | 9,934,804 | 338,280 |
| | Consolidated Edison Inc. | 4,454,416 | 328,201 |
| | Public Service Enterprise | | |
| | Group Inc. | 7,395,114 | 324,498 |
| | Xcel Energy Inc. | 7,425,523 | 302,219 |
| | WEC Energy Group Inc. | 4,613,846 | 270,602 |
| | DTE Energy Co. | 2,623,030 | 258,395 |
| | Eversource Energy | 4,637,007 | 256,102 |
| | FirstEnergy Corp. | 6,223,575 | 192,744 |
| | Entergy Corp. | 2,618,588 | 192,388 |
| | American Water Works | | |
| | Co. Inc. | 2,602,074 | 188,286 |
| | Ameren Corp. | 3,546,917 | 186,071 |
| | CMS Energy Corp. | 4,078,895 | 169,764 |
| | CenterPoint Energy Inc. | 6,295,908 | 155,131 |
| | SCANA Corp. | 2,089,072 | 153,087 |
| | Pinnacle West Capital | | |
| | Corp. | 1,626,700 | 126,931 |
| | Alliant Energy Corp. | 3,324,743 | 125,975 |
| | AES Corp. | 9,636,007 | 111,970 |
| | NiSource Inc. | 4,717,983 | 104,456 |
| | NRG Energy Inc. | 4,610,893 | 56,530 |
| | | | 8,937,154 |
| Total Common Stocks | | |
| (Cost $183,198,782) | | 281,656,436 |
| Temporary Cash Investments (0.4%)1 | |
| Money Market Fund (0.4%) | | |
| 2,3 | Vanguard Market | | |
| | Liquidity Fund, 0.823% | 11,877,185 | 1,187,838 |
| |
| | | Face | |
| | | Amount | |
| | | ($000) |
| U.S. Government and Agency Obligations (0.0%) |
| 4,5 | Federal Home Loan | | |
| | Bank Discount Notes, | | |
| | 0.390%, 2/1/17 | 20,000 | 19,992 |
| 5 | United States Treasury Bill, | |
| | 0.287%–0.314%, 1/5/17 | 21,700 | 21,700 |
| 5 | United States Treasury Bill, | |
| | 0.360%, 1/12/17 | 5,000 | 4,999 |
| 5 | United States Treasury Bill, | |
| | 0.395%, 2/2/17 | 18,400 | 18,394 |
| | United States Treasury Bill, | |
| | 0.574%, 5/11/17 | 5,000 | 4,989 |
| | | | 70,074 |
| Total Temporary Cash Investments | |
| (Cost $1,257,834) | | 1,257,912 |
| Total Investments (100.1%) | | |
| (Cost $184,456,616) | | 282,914,348 |
| |
| | Amount |
| | ($000) |
| Other Assets and Liabilities (-0.1%) | |
| Other Assets | |
| Investment in Vanguard | 20,425 |
| Receivables for Investment Securities Sold 324,026 |
| Receivables for Accrued Income | 357,116 |
| Receivables for Capital Shares Issued | 214,160 |
| Other Assets | 1,742 |
| Total Other Assets | 917,469 |
| Liabilities | |
| Payables for Investment Securities | |
| Purchased | (146,313) |
| Collateral for Securities on Loan | (202,819) |
| Payables for Capital Shares Redeemed | (760,360) |
| Payables to Vanguard | (152,089) |
| Other Liabilities | (4,231) |
| Total Liabilities | (1,265,812) |
| Net Assets (100%) | 282,566,005 |
| |
| At December 31, 2016, net assets consisted of: |
| | Amount |
| | ($000) |
| Paid-in Capital | 185,039,327 |
| Overdistributed Net Investment Income | (86,968) |
| Accumulated Net Realized Losses | (835,353) |
| Unrealized Appreciation (Depreciation) | |
| Investment Securities | 98,457,732 |
| Futures Contracts | (8,733) |
| Net Assets | 282,566,005 |
| |
| |
| Investor Shares—Net Assets | |
| Applicable to 129,018,721 outstanding | |
| $.001 par value shares of beneficial | |
| interest (unlimited authorization) | 26,651,900 |
| Net Asset Value Per Share— | |
| Investor Shares | $206.57 |
| |
| |
| ETF Shares—Net Assets | |
| Applicable to 276,337,665 outstanding | |
| $.001 par value shares of beneficial | |
| interest (unlimited authorization) | 56,648,348 |
| Net Asset Value Per Share— | |
| ETF Shares | $205.00 |
17
500 Index Fund
| |
| | Amount |
| | ($000) |
| Admiral Shares—Net Assets | |
| Applicable to 878,703,399 outstanding | |
| $.001 par value shares of beneficial | |
| interest (unlimited authorization) | 181,512,810 |
| Net Asset Value Per Share— | |
| Admiral Shares | $206.57 |
| |
| |
| Institutional Select Shares—Net Assets |
| Applicable to 162,202,969 outstanding | |
| $.001 par value shares of beneficial | |
| interest (unlimited authorization) | 17,752,947 |
| Net Asset Value Per Share— | |
| Institutional Select Shares | $109.45 |
• See Note A in Notes to Financial Statements.
* Non-income-producing security.
^ Includes partial security positions on loan to broker-dealers. The total value of securities on loan is $195,363,000.
1 The fund invests a portion of its cash reserves in equity markets through the use of index futures contracts. After giving effect to futures
investments, the fund’s effective common stock and temporary cash investment positions represent 100.1% and 0.0%, respectively,
of net assets.
2 Affiliated money market fund available only to Vanguard funds and certain trusts and accounts managed by Vanguard. Rate shown is the
7-day yield.
3 Includes $202,819,000 of collateral received for securities on loan.
4 The issuer operates under a congressional charter; its securities are generally neither guaranteed by the U.S. Treasury nor backed by the
full faith and credit of the U.S. government.
5 Securities with a value of $45,648,000 have been segregated as initial margin for open futures contracts.
See accompanying Notes, which are an integral part of the Financial Statements.
18
500 Index Fund
Statement of Operations
| |
| | Year Ended |
| | December 31, 2016 |
| | ($000) |
| Investment Income | |
| Income | |
| Dividends | 5,377,984 |
| Interest1 | 5,688 |
| Securities Lending—Net | 10,115 |
| Total Income | 5,393,787 |
| Expenses | |
| The Vanguard Group—Note B | |
| Investment Advisory Services | 13,308 |
| Management and Administrative—Investor Shares | 29,108 |
| Management and Administrative—ETF Shares | 13,138 |
| Management and Administrative—Admiral Shares | 46,784 |
| Management and Administrative—Institutional Select Shares | 159 |
| Marketing and Distribution—Investor Shares | 5,250 |
| Marketing and Distribution—ETF Shares | 3,680 |
| Marketing and Distribution—Admiral Shares | 13,348 |
| Marketing and Distribution—Institutional Select Shares | 1 |
| Custodian Fees | 1,757 |
| Auditing Fees | 43 |
| Shareholders’ Reports—Investor Shares | 349 |
| Shareholders’ Reports—ETF Shares | 546 |
| Shareholders’ Reports—Admiral Shares | 582 |
| Shareholders’ Reports—Institutional Select Shares | — |
| Trustees’ Fees and Expenses | 185 |
| Total Expenses | 128,238 |
| Net Investment Income | 5,265,549 |
| Realized Net Gain (Loss) | |
| Investment Securities Sold1 | 6,545,645 |
| Futures Contracts | 143,999 |
| Realized Net Gain (Loss) | 6,689,644 |
| Change in Unrealized Appreciation (Depreciation) | |
| Investment Securities | 16,586,375 |
| Futures Contracts | (20,601) |
| Change in Unrealized Appreciation (Depreciation) | 16,565,774 |
| Net Increase (Decrease) in Net Assets Resulting from Operations | 28,520,967 |
| 1 Interest income and realized net gain (loss) from an affiliated company of the fund were $5,496,000 and $54,000, respectively. |
See accompanying Notes, which are an integral part of the Financial Statements.
19
500 Index Fund
Statement of Changes in Net Assets
| | |
| | Year Ended December 31, |
| | 2016 | 2015 |
| | ($000) | ($000) |
| Increase (Decrease) in Net Assets | | |
| Operations | | |
| Net Investment Income | 5,265,549 | 4,412,491 |
| Realized Net Gain (Loss) | 6,689,644 | 5,863,778 |
| Change in Unrealized Appreciation (Depreciation) | 16,565,774 | (7,366,726) |
| Net Increase (Decrease) in Net Assets Resulting from Operations | 28,520,967 | 2,909,543 |
| Distributions | | |
| Net Investment Income | | |
| Investor Shares | (530,428) | (534,841) |
| ETF Shares | (1,047,723) | (728,706) |
| Admiral Shares | (3,539,036) | (3,127,986) |
| Institutional Select Shares | (141,449) | — |
| Realized Capital Gain | | |
| Investor Shares | — | — |
| ETF Shares | — | — |
| Admiral Shares | — | — |
| Institutional Select Shares | — | — |
| Total Distributions | (5,258,636) | (4,391,533) |
| Capital Share Transactions | | |
| Investor Shares | (1,863,704) | (1,787,828) |
| ETF Shares | 11,566,096 | 13,021,182 |
| Admiral Shares | 13,258,093 | 10,808,168 |
| Institutional Select Shares | 17,071,485 | — |
| Net Increase (Decrease) from Capital Share Transactions | 40,031,970 | 22,041,522 |
| Total Increase (Decrease) | 63,294,301 | 20,559,532 |
| Net Assets | | |
| Beginning of Period | 219,271,704 | 198,712,172 |
| End of Period1 | 282,566,005 | 219,271,704 |
| 1 Net Assets—End of Period includes undistributed (overdistributed) net investment income of ($86,968,000) and ($93,881,000). |
See accompanying Notes, which are an integral part of the Financial Statements.
20
500 Index Fund
Financial Highlights
| | | | | |
| Investor Shares | | | | | |
| |
| For a Share Outstanding | Year Ended December 31, |
| Throughout Each Period | 2016 | 2015 | 2014 | 2013 | 2012 |
| Net Asset Value, Beginning of Period | $188.48 | $189.89 | $170.36 | $131.37 | $115.80 |
| Investment Operations | | | | | |
| Net Investment Income | 3.997 | 3.775 | 3.326 | 2.956 | 2.709 |
| Net Realized and Unrealized Gain (Loss) | | | | | |
| on Investments | 18.069 | (1.438) | 19.507 | 38.982 | 15.560 |
| Total from Investment Operations | 22.066 | 2.337 | 22.833 | 41.938 | 18.269 |
| Distributions | | | | | |
| Dividends from Net Investment Income | (3.976) | (3.747) | (3.303) | (2.948) | (2.699) |
| Distributions from Realized Capital Gains | — | — | — | — | — |
| Total Distributions | (3.976) | (3.747) | (3.303) | (2.948) | (2.699) |
| Net Asset Value, End of Period | $206.57 | $188.48 | $189.89 | $170.36 | $131.37 |
| |
| Total Return1 | 11.82% | 1.25% | 13.51% | 32.18% | 15.82% |
| |
| Ratios/Supplemental Data | | | | | |
| Net Assets, End of Period (Millions) | $26,652 | $26,092 | $28,040 | $27,758 | $24,821 |
| Ratio of Total Expenses to Average Net Assets | 0.14% | 0.16% | 0.17% | 0.17% | 0.17% |
| Ratio of Net Investment Income to | | | | | |
| Average Net Assets | 2.05% | 2.00% | 1.88% | 1.95% | 2.13% |
| Portfolio Turnover Rate2 | 4% | 3% | 3% | 3% | 3% |
1 Total returns do not include account service fees that may have applied in the periods shown. Fund prospectuses provide information about
any applicable account service fees.
2 Excludes the value of portfolio securities received or delivered as a result of in-kind purchases or redemptions of the fund’s capital shares,
including ETF Creation Units.
See accompanying Notes, which are an integral part of the Financial Statements.
21
500 Index Fund
Financial Highlights
| | | | | |
| ETF Shares | | | | | |
| |
| For a Share Outstanding | Year Ended December 31, |
| Throughout Each Period | 2016 | 2015 | 2014 | 20131 | 20121 |
| Net Asset Value, Beginning of Period | $187.05 | $188.45 | $169.07 | $130.38 | $114.92 |
| Investment Operations | | | | | |
| Net Investment Income | 4.155 | 3.958 | 3.518 | 3.117 | 2.846 |
| Net Realized and Unrealized Gain (Loss) | | | | | |
| on Investments | 17.933 | (1.427) | 19.352 | 38.681 | 15.450 |
| Total from Investment Operations | 22.088 | 2.531 | 22.870 | 41.798 | 18.296 |
| Distributions | | | | | |
| Dividends from Net Investment Income | (4.138) | (3.931) | (3.490) | (3.108) | (2.836) |
| Distributions from Realized Capital Gains | — | — | — | — | — |
| Total Distributions | (4.138) | (3.931) | (3.490) | (3.108) | (2.836) |
| Net Asset Value, End of Period | $205.00 | $187.05 | $188.45 | $169.07 | $130.38 |
| |
| Total Return | 11.93% | 1.35% | 13.63% | 32.33% | 15.98% |
| |
| Ratios/Supplemental Data | | | | | |
| Net Assets, End of Period (Millions) | $56,648 | $40,440 | $27,630 | $15,037 | $6,628 |
| Ratio of Total Expenses to Average Net Assets | 0.04% | 0.05% | 0.05% | 0.05% | 0.05% |
| Ratio of Net Investment Income to | | | | | |
| Average Net Assets | 2.15% | 2.11% | 2.00% | 2.07% | 2.25% |
| Portfolio Turnover Rate 2 | 4% | 3% | 3% | 3% | 3% |
1 Adjusted to reflect a 1-for-2 reverse share split as of the close of business on October 24, 2013.
2 Excludes the value of portfolio securities received or delivered as a result of in-kind purchases or redemptions of the fund’s capital shares,
including ETF Creation Units.
See accompanying Notes, which are an integral part of the Financial Statements.
22
500 Index Fund
Financial Highlights
| | | | | |
| Admiral Shares | | | | | |
| |
| For a Share Outstanding | Year Ended December 31, |
| Throughout Each Period | 2016 | 2015 | 2014 | 2013 | 2012 |
| Net Asset Value, Beginning of Period | $188.48 | $189.89 | $170.36 | $131.37 | $115.80 |
| Investment Operations | | | | | |
| Net Investment Income | 4.185 | 3.990 | 3.544 | 3.142 | 2.866 |
| Net Realized and Unrealized Gain (Loss) | | | | | |
| on Investments | 18.074 | (1.439) | 19.503 | 38.980 | 15.560 |
| Total from Investment Operations | 22.259 | 2.551 | 23.047 | 42.122 | 18.426 |
| Distributions | | | | | |
| Dividends from Net Investment Income | (4.169) | (3.961) | (3.517) | (3.132) | (2.856) |
| Distributions from Realized Capital Gains | — | — | — | — | — |
| Total Distributions | (4.169) | (3.961) | (3.517) | (3.132) | (2.856) |
| Net Asset Value, End of Period | $206.57 | $188.48 | $189.89 | $170.36 | $131.37 |
| |
| Total Return1 | 11.93% | 1.36% | 13.64% | 32.33% | 15.96% |
| |
| Ratios/Supplemental Data | | | | | |
| Net Assets, End of Period (Millions) | $181,513 | $152,740 | $143,043 | $82,357 | $59,749 |
| Ratio of Total Expenses to Average Net Assets | 0.04% | 0.05% | 0.05% | 0.05% | 0.05% |
| Ratio of Net Investment Income to | | | | | |
| Average Net Assets | 2.15% | 2.11% | 2.00% | 2.07% | 2.25% |
| Portfolio Turnover Rate 2 | 4% | 3% | 3% | 3% | 3% |
1 Total returns do not include account service fees that may have applied in the periods shown. Fund prospectuses provide information about
any applicable account service fees.
2 Excludes the value of portfolio securities received or delivered as a result of in-kind purchases or redemptions of the fund’s capital shares,
including ETF Creation Units.
See accompanying Notes, which are an integral part of the Financial Statements.
23
500 Index Fund
Financial Highlights
| |
| Institutional Select Shares | |
| | June 24, 20161 to |
| For a Share Outstanding Throughout the Period | December 31, 2016 |
| Net Asset Value, Beginning of Period | $99.57 |
| Investment Operations | |
| Net Investment Income | 1.200 |
| Net Realized and Unrealized Gain (Loss) on Investments | 9.859 |
| Total from Investment Operations | 11.059 |
| Distributions | |
| Dividends from Net Investment Income | (1.179) |
| Distributions from Realized Capital Gains | — |
| Total Distributions | (1.179) |
| Net Asset Value, End of Period | $109.45 |
| |
| Total Return | 11.12% |
| |
| Ratios/Supplemental Data | |
| Net Assets, End of Period (Millions) | $17,753 |
| Ratio of Total Expenses to Average Net Assets | 0.01%2 |
| Ratio of Net Investment Income to Average Net Assets | 2.26%2 |
| Portfolio Turnover Rate 3 | 4%4 |
1 Inception.
2 Annualized.
3 Excludes the value of portfolio securities received or delivered as a result of in-kind purchases or redemptions of the fund’s capital shares,
including ETF Creation Units.
4 Reflects the fund’s portfolio turnover for the fiscal year ended December 31, 2016.
See accompanying Notes, which are an integral part of the Financial Statements.
24
500 Index Fund
Notes to Financial Statements
Vanguard 500 Index Fund is registered under the Investment Company Act of 1940 as an open-end investment company, or mutual fund. The fund offers four classes of shares: Investor Shares, ETF Shares, Admiral Shares, and Institutional Select Shares. Investor Shares are available to any investor who meets the fund’s minimum purchase requirements. ETF Shares are listed for trading on NYSE Arca; they can be purchased and sold through a broker. Admiral Shares and Institutional Select Shares are designed for investors who meet certain administrative, service, and account-size criteria. Institutional Select Shares were issued on June 24, 2016.
A. The following significant accounting policies conform to generally accepted accounting principles for U.S. investment companies. The fund consistently follows such policies in preparing its financial statements.
1. Security Valuation: Securities are valued as of the close of trading on the New York Stock Exchange (generally 4 p.m., Eastern time) on the valuation date. Equity securities are valued at the latest quoted sales prices or official closing prices taken from the primary market in which each security trades; such securities not traded on the valuation date are valued at the mean of the latest quoted bid and asked prices. Securities for which market quotations are not readily available, or whose values have been materially affected by events occurring before the fund’s pricing time but after the close of the securities’ primary markets, are valued by methods deemed by the board of trustees to represent fair value. Investments in Vanguard Market Liquidity Fund are valued at that fund’s net asset value. Temporary cash investments are valued using the latest bid prices or using valuations based on a matrix system (which considers such factors as security prices, yields, maturities, and ratings), both as furnished by independent pricing services.
2. Futures Contracts: The fund uses index futures contracts to a limited extent, with the objectives of maintaining full exposure to the stock market, enhancing returns, maintaining liquidity, and minimizing transaction costs. The fund may purchase futures contracts to immediately invest incoming cash in the market, or sell futures in response to cash outflows, thereby simulating a fully invested position in the underlying index while maintaining a cash balance for liquidity. The fund may seek to enhance returns by using futures contracts instead of the underlying securities when futures are believed to be priced more attractively than the underlying securities. The primary risks associated with the use of futures contracts are imperfect correlation between changes in market values of stocks held by the fund and the prices of futures contracts, and the possibility of an illiquid market. Counterparty risk involving futures is mitigated because a regulated clearinghouse is the counterparty instead of the clearing broker. To further mitigate counterparty risk, the fund trades futures contracts on an exchange, monitors the financial strength of its clearing brokers and clearinghouse, and has entered into clearing agreements with its clearing brokers. The clearinghouse imposes initial margin requirements to secure the fund’s performance and requires daily settlement of variation margin representing changes in the market value of each contract.
Futures contracts are valued at their quoted daily settlement prices. The aggregate settlement values of the contracts are not recorded in the Statement of Net Assets. Fluctuations in the value of the contracts are recorded in the Statement of Net Assets as an asset (liability) and in the Statement of Operations as unrealized appreciation (depreciation) until the contracts are closed, when they are recorded as realized futures gains (losses).
During the year ended December 31, 2016, the fund’s average investments in long and short futures contracts represented less than 1% and 0% of net assets, respectively, based on the average of aggregate settlement values at each quarter-end during the period.
25
500 Index Fund
3. Federal Income Taxes: The fund intends to continue to qualify as a regulated investment company and distribute all of its taxable income. Management has analyzed the fund’s tax positions taken for all open federal income tax years (December 31, 2013–2016), and has concluded that no provision for federal income tax is required in the fund’s financial statements.
4. Distributions: Distributions to shareholders are recorded on the ex-dividend date.
5. Securities Lending: To earn additional income, the fund lends its securities to qualified institutional borrowers. Security loans are subject to termination by the fund at any time, and are required to be secured at all times by collateral in an amount at least equal to the market value of securities loaned. Daily market fluctuations could cause the value of loaned securities to be more or less than the value of the collateral received. When this occurs, the collateral is adjusted and settled on the next business day. The fund further mitigates its counterparty risk by entering into securities lending transactions only with a diverse group of prequalified counterparties, monitoring their financial strength, and entering into master securities lending agreements with its counterparties. The master securities lending agreements provide that, in the event of a counterparty’s default (including bankruptcy), the fund may terminate any loans with that borrower, determine the net amount owed, and sell or retain the collateral up to the net amount owed to the fund; however, such actions may be subject to legal proceedings. While collateral mitigates counterparty risk, in the absence of a default the fund may experience delays and costs in recovering the securities loaned. The fund invests cash collateral received in Vanguard Market Liquidity Fund, and records a liability in the Statement of Net Assets for the return of the collateral, during the period the securities are on loan. Securities lending income represents fees charged to borrowers plus income earned on invested cash collateral, less expenses associated with the loan. During the term of the loan, the fund is entitled to all distributions made on or in respect of the loaned securities.
6. Credit Facility: The fund and certain other funds managed by The Vanguard Group (“Vanguard”) participate in a $3.1 billion committed credit facility provided by a syndicate of lenders pursuant to a credit agreement that may be renewed annually; each fund is individually liable for its borrowings, if any, under the credit facility. Borrowings may be utilized for temporary and emergency purposes, and are subject to the fund’s regulatory and contractual borrowing restrictions. The participating funds are charged administrative fees and an annual commitment fee of 0.10% of the undrawn amount of the facility; these fees are allocated to the funds based on a method approved by the fund’s board of trustees and included in Management and Administrative expenses on the fund’s Statement of Operations. Any borrowings under this facility bear interest at a rate based upon the higher of the one-month London Interbank Offered Rate, federal funds effective rate, or overnight bank funding rate plus an agreed-upon spread.
The fund had no borrowings outstanding at December 31, 2016, or at any time during the period then ended.
7. Other: Dividend income is recorded on the ex-dividend date. Interest income includes income distributions received from Vanguard Market Liquidity Fund and is accrued daily. Premiums and discounts on debt securities purchased are amortized and accreted, respectively, to interest income over the lives of the respective securities. Security transactions are accounted for on the date securities are bought or sold. Costs used to determine realized gains (losses) on the sale of investment securities are those of the specific securities sold.
26
500 Index Fund
Each class of shares has equal rights as to assets and earnings, except that each class separately bears certain class-specific expenses related to maintenance of shareholder accounts (included in Management and Administrative expenses) and shareholder reporting. Marketing and distribution expenses are allocated to each class of shares based on a method approved by the board of trustees. Income, other non-class-specific expenses, and gains and losses on investments are allocated to each class of shares based on its relative net assets.
B. In accordance with the terms of a Funds’ Service Agreement (the “FSA”) between Vanguard and the fund, Vanguard furnishes to the fund investment advisory, corporate management, administrative, marketing, and distribution services at Vanguard’s cost of operations (as defined by the FSA). These costs of operations are allocated to the fund based on methods and guidelines approved by the board of trustees. Vanguard does not require reimbursement in the current period for certain costs of operations (such as deferred compensation/benefits and risk/insurance costs); the fund’s liability for these costs of operations is included in Payables to Vanguard on the Statement of Net Assets.
Upon the request of Vanguard, the fund may invest up to 0.40% of its net assets as capital in Vanguard. At December 31, 2016, the fund had contributed to Vanguard capital in the amount of $20,425,000, representing 0.01% of the fund’s net assets and 8.17% of Vanguard’s capitalization. The fund’s trustees and officers are also directors and employees, respectively, of Vanguard.
C. Various inputs may be used to determine the value of the fund’s investments. These inputs are summarized in three broad levels for financial statement purposes. The inputs or methodologies used to value securities are not necessarily an indication of the risk associated with investing in those securities.
Level 1—Quoted prices in active markets for identical securities.
Level 2—Other significant observable inputs (including quoted prices for similar securities, interest rates, prepayment speeds, credit risk, etc.).
Level 3—Significant unobservable inputs (including the fund’s own assumptions used to determine the fair value of investments).
The following table summarizes the market value of the fund’s investments as of December 31, 2016, based on the inputs used to value them:
| | | |
| | Level 1 | Level 2 | Level 3 |
| Investments | ($000) | ($000) | ($000) |
| Common Stocks | 281,656,436 | — | — |
| Temporary Cash Investments | 1,187,838 | 70,074 | — |
| Futures Contracts—Liabilities1 | (4,223) | — | — |
| Total | 282,840,051 | 70,074 | — |
| 1 Represents variation margin on the last day of the reporting period. |
27
500 Index Fund
D. At December 31, 2016, the aggregate settlement value of open futures contracts and the related unrealized appreciation (depreciation) were:
| | | | |
| | | | ($000) |
| | | | Aggregate | |
| | | Number of | Settlement | Unrealized |
| | | Long (Short) | Value | Appreciation |
| Futures Contracts | Expiration | Contracts | Long (Short) | (Depreciation) |
| E-mini S&P 500 Index | March 2017 | 9,490 | 1,061,077 | (8,733) |
Unrealized appreciation (depreciation) on open futures contracts is required to be treated as realized gain (loss) for tax purposes.
E. Distributions are determined on a tax basis and may differ from net investment income and realized capital gains for financial reporting purposes. Differences may be permanent or temporary. Permanent differences are reclassified among capital accounts in the financial statements to reflect their tax character. Temporary differences arise when certain items of income, expense, gain, or loss are recognized in different periods for financial statement and tax purposes. These differences will reverse at some time in the future. Differences in classification may also result from the treatment of short-term gains as ordinary income for tax purposes.
During the year ended December 31, 2016, the fund realized $6,081,373,000 of net capital gains resulting from in-kind redemptions—in which shareholders exchanged fund shares for securities held by the fund rather than for cash. Because such gains are not taxable to the fund, and are not distributed to shareholders, they have been reclassified from accumulated net realized losses to paid-in capital.
For tax purposes, at December 31, 2016, the fund had $57,455,000 of ordinary income available for distribution. The fund used capital loss carryforwards of $587,670,000 to offset taxable capital gains realized during the year ended December 31, 2016. At December 31, 2016, the fund had available capital losses totaling $840,474,000 that may be carried forward indefinitely to offset future net capital gains. Capital loss carryforwards of $1,763,970,000 expired on December 31, 2016; accordingly, such losses have been reclassified from accumulated net realized losses to paid-in capital.
At December 31, 2016, the cost of investment securities for tax purposes was $184,456,616,000. Net unrealized appreciation of investment securities for tax purposes was $98,457,732,000, consisting of unrealized gains of $102,245,916,000 on securities that had risen in value since their purchase and $3,788,184,000 in unrealized losses on securities that had fallen in value since their purchase.
F. During the year ended December 31, 2016, the fund purchased $59,104,325,000 of investment securities and sold $19,071,086,000 of investment securities, other than temporary cash investments. Purchases and sales include $35,983,194,000 and $9,053,787,000, respectively, in connection with in-kind purchases and redemptions of the fund’s capital shares.
28
500 Index Fund
G. Capital share transactions for each class of shares were:
| | | | |
| | Year Ended December 31, |
| | 2016 | 2015 |
| | Amount | Shares | Amount | Shares |
| | ($000) | (000) | ($000) | (000) |
| Investor Shares | | | | |
| Issued | 3,996,733 | 20,796 | 4,224,397 | 22,264 |
| Issued in Lieu of Cash Distributions | 502,725 | 2,544 | 508,696 | 2,701 |
| Redeemed | (6,363,162) | (32,754) | (6,520,921) | (34,197) |
| Net Increase (Decrease)—Investor Shares | (1,863,704) | (9,414) | (1,787,828) | (9,232) |
| ETF Shares | | | | |
| Issued | 20,791,085 | 108,961 | 20,357,295 | 109,061 |
| Issued in Lieu of Cash Distributions | — | — | — | — |
| Redeemed | (9,224,989) | (48,825) | (7,336,113) | (39,475) |
| Net Increase (Decrease) —ETF Shares | 11,566,096 | 60,136 | 13,021,182 | 69,586 |
| Admiral Shares | | | | |
| Issued | 30,149,922 | 155,773 | 25,665,048 | 135,111 |
| Issued in Lieu of Cash Distributions | 3,138,593 | 15,855 | 2,791,940 | 14,841 |
| Redeemed | (20,030,422) | (103,296) | (17,648,820) | (92,866) |
| Net Increase (Decrease) —Admiral Shares | 13,258,093 | 68,332 | 10,808,168 | 57,086 |
| Institutional Select Shares1 | | | | |
| Issued | 17,224,925 | 163,684 | — | — |
| Issued in Lieu of Cash Distributions | 141,449 | 1,293 | — | — |
| Redeemed | (294,889) | (2,774) | — | — |
| Net Increase (Decrease)—Institutional Select Shares | 17,071,485 | 162,203 | — | — |
| 1 Inception was June 24, 2016, for Institutional Select Shares. |
H. Management has determined that no material events or transactions occurred subsequent to December 31, 2016, that would require recognition or disclosure in these financial statements.
29
Report of Independent Registered
Public Accounting Firm
To the Board of Trustees of Vanguard Index Funds and the Shareholders of Vanguard 500 Index Fund:
In our opinion, the accompanying statement of net assets and the related statements of operations and of changes in net assets and the financial highlights present fairly, in all material respects, the financial position of Vanguard 500 Index Fund (constituting a separate portfolio of Vanguard Index Funds, hereafter referred to as the “Fund”) at December 31, 2016, the results of its operations for the year then ended, the changes in its net assets for each of the two years in the period then ended, and the financial highlights for each of the periods indicated, in conformity with accounting principles generally accepted in the United States of America. These financial statements and financial highlights (hereafter referred to as “financial statements”) are the responsibility of the Fund’s management. Our responsibility is to express an opinion on these financial statements based on our audits. We conducted our audits of these financial statements in accordance with the standards of the Public Company Accounting Oversight Board (United States). Those standards require that we plan and perform the audit to obtain reasonable assurance about whether the financial statements are free of material misstatement. An audit includes examining, on a test basis, evidence supporting the amounts and disclosures in the financial statements, assessing the accounting principles used and significant estimates made by management, and evaluating the overall financial statement presentation. We believe that our audits, which included confirmation of securities at December 31, 2016 by correspondence with the custodian and brokers and by agreement to the underlying ownership records of the transfer agent, provide a reasonable basis for our opinion.
/s/PricewaterhouseCoopers LLP
Philadelphia, Pennsylvania
February 13, 2017

Special 2016 tax information (unaudited) for Vanguard 500 Index Fund
This information for the fiscal year ended December 31, 2016, is included pursuant to provisions
of the Internal Revenue Code.
The fund distributed $5,258,636,000 of qualified dividend income to shareholders during the
fiscal year.
For corporate shareholders, 91.8% of investment income (dividend income plus short-term gains,
if any) qualifies for the dividends-received deduction.
30
Your Fund’s After-Tax Returns
This table presents returns for your fund both before and after taxes. The after-tax returns are shown in two ways: (1) assuming that an investor owned the fund during the entire period and paid taxes on the fund’s distributions, and (2) assuming that an investor paid taxes on the fund’s distributions and sold all shares at the end of each period.
Calculations are based on the highest individual federal income tax and capital gains tax rates in effect at the times of the distributions and the hypothetical sales. State and local taxes were not considered. After-tax returns reflect any qualified dividend income. (In the example, returns after the sale of fund shares may be higher than those assuming no sale. This occurs when the sale would have produced a capital loss. The calculation assumes that the investor received a tax deduction for the loss.)
The table shows returns for Investor Shares only; returns for other share classes will differ. Please note that your actual after-tax returns will depend on your tax situation and may differ from those shown. Also note that if you own the fund in a tax-deferred account, such as an individual retirement account or a 401(k) plan, this information does not apply to you. Such accounts are not subject to current taxes.
Finally, keep in mind that a fund’s performance—whether before or after taxes—does not guarantee future results.
| | | |
| Average Annual Total Returns: 500 Index Fund Investor Shares | | | |
| Periods Ended December 31, 2016 | | | |
| |
| | One | Five | Ten |
| | Year | Years | Years |
| Returns Before Taxes | 11.82% | 14.49% | 6.82% |
| Returns After Taxes on Distributions | 11.29 | 14.00 | 6.43 |
| Returns After Taxes on Distributions and Sale of Fund Shares | 7.09 | 11.62 | 5.47 |
31
About Your Fund’s Expenses
As a shareholder of the fund, you incur ongoing costs, which include costs for portfolio management, administrative services, and shareholder reports (like this one), among others. Operating expenses, which are deducted from a fund’s gross income, directly reduce the investment return of the fund.
A fund’s expenses are expressed as a percentage of its average net assets. This figure is known as the expense ratio. The following examples are intended to help you understand the ongoing costs (in dollars) of investing in your fund and to compare these costs with those of other mutual funds. The examples are based on an investment of $1,000 made at the beginning of the period shown and held for the entire period.
The accompanying table illustrates your fund’s costs in two ways:
• Based on actual fund return. This section helps you to estimate the actual expenses that you paid over the period. The ”Ending Account Value“ shown is derived from the fund‘s actual return, and the third column shows the dollar amount that would have been paid by an investor who started with $1,000 in the fund. You may use the information here, together with the amount you invested, to estimate the expenses that you paid over the period.
To do so, simply divide your account value by $1,000 (for example, an $8,600 account value divided by $1,000 = 8.6), then multiply the result by the number given for your fund under the heading ”Expenses Paid During Period.“
• Based on hypothetical 5% yearly return. This section is intended to help you compare your fund‘s costs with those of other mutual funds. It assumes that the fund had a yearly return of 5% before expenses, but that the expense ratio is unchanged. In this case—because the return used is not the fund’s actual return—the results do not apply to your investment. The example is useful in making comparisons because the Securities and Exchange Commission requires all mutual funds to calculate expenses based on a 5% return. You can assess your fund’s costs by comparing this hypothetical example with the hypothetical examples that appear in shareholder reports of other funds.
Note that the expenses shown in the table are meant to highlight and help you compare ongoing costs only and do not reflect transaction costs incurred by the fund for buying and selling securities. Further, the expenses do not include any purchase, redemption, or account service fees described in the fund prospectus. If such fees were applied to your account, your costs would be higher. Your fund does not carry a “sales load.”
The calculations assume no shares were bought or sold during the period. Your actual costs may have been higher or lower, depending on the amount of your investment and the timing of any purchases or redemptions.
You can find more information about the fund’s expenses, including annual expense ratios, in the Financial Statements section of this report. For additional information on operating expenses and other shareholder costs, please refer to your fund’s current prospectus.
32
| | | |
| Six Months Ended December 31, 2016 | | | |
| | Beginning | Ending | Expenses |
| | Account Value | Account Value | Paid During |
| 500 Index Fund | 6/30/2016 | 12/31/2016 | Period |
| Based on Actual Fund Return | | | |
| Investor Shares | $1,000.00 | $1,077.60 | $0.63 |
| ETF Shares | 1,000.00 | 1,078.20 | 0.21 |
| Admiral Shares | 1,000.00 | 1,078.12 | 0.21 |
| Institutional Select Shares | 1,000.00 | 1,078.28 | 0.05 |
| Based on Hypothetical 5% Yearly Return | | | |
| Investor Shares | $1,000.00 | $1,024.53 | $0.61 |
| ETF Shares | 1,000.00 | 1,024.94 | 0.20 |
| Admiral Shares | 1,000.00 | 1,024.94 | 0.20 |
| Institutional Select Shares | 1,000.00 | 1,025.09 | 0.05 |
The calculations are based on expenses incurred in the most recent six-month period. The fund’s annualized six-month expense ratios for that
period are 0.12% for Investor Shares, 0.04% for ETF Shares, 0.04% for Admiral Shares, and 0.01% for Institutional Select Shares. The dollar
amounts shown as “Expenses Paid” are equal to the annualized expense ratio multiplied by the average account value over the period,
multiplied by the number of days in the most recent six-month period, then divided by the number of days in the most recent 12-month period
(184/366).
33
Glossary
30-Day SEC Yield. A fund’s 30-day SEC yield is derived using a formula specified by the U.S. Securities and Exchange Commission. Under the formula, data related to the fund’s security holdings in the previous 30 days are used to calculate the fund’s hypothetical net income for that period, which is then annualized and divided by the fund’s estimated average net assets over the calculation period. For the purposes of this calculation, a security’s income is based on its current market yield to maturity (for bonds), its actual income (for asset-backed securities), or its projected dividend yield (for stocks). Because the SEC yield represents hypothetical annualized income, it will differ—at times significantly—from the fund’s actual experience. As a result, the fund’s income distributions may be higher or lower than implied by the SEC yield.
Beta. A measure of the magnitude of a fund’s past share-price fluctuations in relation to the ups and downs of a given market index. The index is assigned a beta of 1.00. Compared with a given index, a fund with a beta of 1.20 typically would have seen its share price rise or fall by 12% when the index rose or fell by 10%. For this report, beta is based on returns over the past 36 months for both the fund and the index. Note that a fund’s beta should be reviewed in conjunction with its R-squared (see definition). The lower the R-squared, the less correlation there is between the fund and the index, and the less reliable beta is as an indicator of volatility.
Dividend Yield. Dividend income earned by stocks, expressed as a percentage of the aggregate market value (or of net asset value, for a fund). The yield is determined by dividing the amount of the annual dividends by the aggregate value (or net asset value) at the end of the period. For a fund, the dividend yield is based solely on stock holdings and does not include any income produced by other investments.
Earnings Growth Rate. The average annual rate of growth in earnings over the past five years for the stocks now in a fund.
Equity Exposure. A measure that reflects a fund’s investments in stocks and stock futures. Any holdings in short-term reserves are excluded.
Expense Ratio. A fund’s total annual operating expenses expressed as a percentage of the fund’s average net assets. The expense ratio includes management and administrative expenses, but does not include the transaction costs of buying and selling portfolio securities.
Foreign Holdings. The percentage of a fund represented by securities or depositary receipts of companies based outside the United States.
Inception Date. The date on which the assets of a fund (or one of its share classes) are first invested in accordance with the fund’s investment objective. For funds with a subscription period, the inception date is the day after that period ends. Investment performance is measured from the inception date.
Median Market Cap. An indicator of the size of companies in which a fund invests; the midpoint of market capitalization (market price x shares outstanding) of a fund’s stocks, weighted by the proportion of the fund’s assets invested in each stock. Stocks representing half of the fund’s assets have market capitalizations above the median, and the rest are below it.
Price/Book Ratio. The share price of a stock divided by its net worth, or book value, per share. For a fund, the weighted average price/book ratio of the stocks it holds.
34
Price/Earnings Ratio. The ratio of a stock’s current price to its per-share earnings over the past year. For a fund, the weighted average P/E of the stocks it holds. P/E is an indicator of market expectations about corporate prospects; the higher the P/E, the greater the expectations for a company’s future growth.
R-Squared. A measure of how much of a fund’s past returns can be explained by the returns from the market in general, as measured by a given index. If a fund’s total returns were precisely synchronized with an index’s returns, its R-squared would be 1.00. If the fund’s returns bore no relationship to the index’s returns, its R-squared would be 0. For this report, R-squared is based on returns over the past 36 months for both the fund and the index.
Return on Equity. The annual average rate of return generated by a company during the past five years for each dollar of shareholder’s equity (net income divided by shareholder’s equity). For a fund, the weighted average return on equity for the companies whose stocks it holds.
Short-Term Reserves. The percentage of a fund invested in highly liquid, short-term securities that can be readily converted to cash.
Turnover Rate. An indication of the fund’s trading activity. Funds with high turnover rates incur higher transaction costs and may be more likely to distribute capital gains (which may be taxable to investors). The turnover rate excludes in-kind transactions, which have minimal impact on costs.
35
The People Who Govern Your Fund
The trustees of your mutual fund are there to see that the fund is operated and managed in your best interests since, as a shareholder, you are a part owner of the fund. Your fund’s trustees also serve on the board of directors of The Vanguard Group, Inc., which is owned by the Vanguard funds and provides services to them on an at-cost basis.
A majority of Vanguard’s board members are independent, meaning that they have no affiliation with Vanguard or the funds they oversee, apart from the sizable personal investments they have made as private individuals. The independent board members have distinguished backgrounds in business, academia, and public service. Each of the trustees and executive officers oversees 198 Vanguard funds.
The following table provides information for each trustee and executive officer of the fund. The mailing address of the trustees and officers is P.O. Box 876, Valley Forge, PA 19482. More information about the trustees is in the Statement of Additional Information, which can be obtained, without charge, by contacting Vanguard at 800-662-7447, or online at vanguard.com.
InterestedTrustee1
F. William McNabb III
Born 1957. Trustee Since July 2009. Chairman of the Board. Principal Occupation(s) During the Past Five Years and Other Experience: Chairman of the Board of The Vanguard Group, Inc., and of each of the investment companies served by The Vanguard Group, since January 2010; Director of The Vanguard Group since 2008; Chief Executive Officer and President of The Vanguard Group, and of each of the investment companies served by The Vanguard Group, since 2008; Director of Vanguard Marketing Corporation; Managing Director of The Vanguard Group (1995–2008).
IndependentTrustees
Emerson U. Fullwood
Born 1948. Trustee Since January 2008. Principal Occupation(s) During the Past Five Years and Other Experience: Executive Chief Staff and Marketing Officer for North America and Corporate Vice President (retired 2008) of Xerox Corporation (document management products and services); Executive in Residence and 2009–2010 Distinguished Minett Professor at the Rochester Institute of Technology; Lead Director of SPX FLOW, Inc. (multi-industry manufacturing); Director of the United Way of Rochester, the University of Rochester Medical Center, Monroe Community College Foundation, North Carolina A&T University, and Roberts Wesleyan College.
Rajiv L. Gupta
Born 1945. Trustee Since December 2001.2 Principal Occupation(s) During the Past Five Years and Other Experience: Chairman and Chief Executive Officer (retired 2009) and President (2006–2008) of Rohm and Haas Co. (chemicals); Director of Tyco International plc (diversified manufacturing and services), HP Inc. (printer and personal computer manufacturing), and Delphi Automotive plc (automotive components); Senior Advisor at New Mountain Capital.
Amy Gutmann
Born 1949. Trustee Since June 2006. Principal Occupation(s) During the Past Five Years and Other Experience: President of the University of Pennsylvania; Christopher H. Browne Distinguished Professor of Political Science, School of Arts and Sciences, and Professor of Communication, Annenberg School for Communication, with secondary faculty appointments in the Department of Philosophy, School of Arts and Sciences, and at the Graduate School of Education, University of Pennsylvania; Trustee of the National Constitution Center; Chair of the Presidential Commission for the Study of Bioethical Issues.
JoAnn Heffernan Heisen
Born 1950. Trustee Since July 1998. Principal Occupation(s) During the Past Five Years and Other Experience: Corporate Vice President and Chief Global Diversity Officer (retired 2008) and Member of the Executive Committee (1997–2008) of Johnson & Johnson (pharmaceuticals/medical devices/consumer products); Director of Skytop Lodge Corporation (hotels) and the Robert Wood Johnson Foundation; Member of the Advisory Board of the Institute for Women’s Leadership at Rutgers University.
F. Joseph Loughrey
Born 1949. Trustee Since October 2009. Principal Occupation(s) During the Past Five Years and Other Experience: President and Chief Operating Officer (retired 2009) of Cummins Inc. (industrial machinery); Chairman of the Board of Hillenbrand, Inc. (specialized consumer services), and of Oxfam America; Director of SKF AB (industrial machinery), Hyster-Yale Materials Handling, Inc. (forklift trucks), the Lumina Foundation for Education, and the V Foundation for Cancer Research; Member of the Advisory Council for the College of Arts and Letters and of the Advisory Board to the Kellogg Institute for International Studies, both at the University of Notre Dame.
Mark Loughridge
Born 1953. Trustee Since March 2012. Principal Occupation(s) During the Past Five Years and Other Experience: Senior Vice President and Chief Financial Officer (retired 2013) at IBM (information technology services); Fiduciary Member of IBM’s Retirement Plan Committee (2004–2013); Director of the Dow Chemical Company; Member of the Council on Chicago Booth.
Scott C. Malpass
Born 1962. Trustee Since March 2012. Principal Occupation(s) During the Past Five Years and Other Experience: Chief Investment Officer and Vice President at the University of Notre Dame; Assistant Professor of Finance at the Mendoza College of Business at Notre Dame; Member of the Notre Dame 403(b) Investment Committee, the Board of Advisors for Spruceview Capital Partners, and the Investment Advisory Committee of Major League Baseball; Board Member of TIFF Advisory Services, Inc., and Catholic Investment Services, Inc. (investment advisors).
André F. Perold
Born 1952. Trustee Since December 2004. Principal Occupation(s) During the Past Five Years and Other Experience: George Gund Professor of Finance and Banking, Emeritus at the Harvard Business School (retired 2011); Chief Investment Officer and Managing Partner of HighVista Strategies LLC (private investment firm); Director of Rand Merchant Bank; Overseer of the Museum of Fine Arts Boston.
Peter F. Volanakis
Born 1955. Trustee Since July 2009. Principal Occupation(s) During the Past Five Years and Other Experience: President and Chief Operating Officer (retired 2010) of Corning Incorporated (communications equipment); Chairman of the Board of Trustees of Colby-Sawyer College; Member of the Advisory Board of the Norris Cotton Cancer Center.
Executive Officers
Glenn Booraem
Born 1967. Treasurer Since May 2015. Principal Occupation(s) During the Past Five Years and Other Experience: Principal of The Vanguard Group, Inc.; Treasurer of each of the investment companies served by The Vanguard Group; Controller of each of the investment companies served by The Vanguard Group (2010–2015); Assistant Controller of each of the investment companies served by The Vanguard Group (2001–2010).
Thomas J. Higgins
Born 1957. Chief Financial Officer Since September 2008. Principal Occupation(s) During the Past Five Years and Other Experience: Principal of The Vanguard Group, Inc.; Chief Financial Officer of each of the investment companies served by The Vanguard Group; Treasurer of each of the investment companies served by The Vanguard Group (1998–2008).
Peter Mahoney
Born 1974. Controller Since May 2015. Principal Occupation(s) During the Past Five Years and Other Experience: Head of Global Fund Accounting at The Vanguard Group, Inc.; Controller of each of the investment companies served by The Vanguard Group; Head of International Fund Services at The Vanguard Group (2008–2014).
Anne E. Robinson
Born 1970. Secretary Since September 2016. Principal Occupation(s) During the Past Five Years and Other Experience: Managing Director of The Vanguard Group, Inc.; General Counsel of The Vanguard Group; Secretary of The Vanguard Group and of each of the investment companies served by The Vanguard Group; Director and Senior Vice President of Vanguard Marketing Corporation; Managing Director and General Counsel of Global Cards and Consumer Services at Citigroup (2014–2016); Counsel at American Express (2003–2014).
| |
| Vanguard Senior Management Team |
| Mortimer J. Buckley | Thomas M. Rampulla |
| Martha G. King | Glenn W. Reed |
| John T. Marcante | Karin A. Risi |
| Chris D. McIsaac | Michael Rollings |
| James M. Norris | |
| |
| Chairman Emeritus and Senior Advisor |
| John J. Brennan | |
| Chairman, 1996–2009 | |
| Chief Executive Officer and President, 1996–2008 |
| |
| Founder | |
| John C. Bogle | |
| Chairman and Chief Executive Officer, 1974–1996 |
1 Mr. McNabb is considered an “interested person,” as defined in the Investment Company Act of 1940, because he is an officer of the Vanguard funds.
2 December 2002 for Vanguard Equity Income Fund, the Vanguard Municipal Bond Funds, and the Vanguard State Tax-Exempt Funds.
|  |
| | P.O. Box 2600 |
| | Valley Forge, PA 19482-2600 |
| |
| |
| |
| Connect with Vanguard® > vanguard.com |
| |
| |
| |
| Fund Information > 800-662-7447 | The index is a product of S&P Dow Jones Indices LLC |
| Direct Investor Account Services > 800-662-2739 | (“SPDJI”), and has been licensed for use by Vanguard. |
| | Standard & Poor’s® and S&P® are registered |
| Institutional Investor Services > 800-523-1036 | trademarks of Standard & Poor’s Financial Services LLC |
| Text Telephone for People | (“S&P”); Dow Jones® is a registered trademark of Dow |
| Who Are Deaf or Hard of Hearing > 800-749-7273 | Jones Trademark Holdings LLC (“Dow Jones”); S&P® |
| | and S&P 500® are trademarks of S&P; and these |
| This material may be used in conjunction | trademarks have been licensed for use by SPDJI and |
| with the offering of shares of any Vanguard | sublicensed for certain purposes by Vanguard. |
| fund only if preceded or accompanied by | Vanguard product(s) are not sponsored, endorsed, sold |
| | or promoted by SPDJI, Dow Jones, S&P, or their |
| the fund’s current prospectus. | respective affiliates and none of such parties make any |
| All comparative mutual fund data are from Lipper, a | representation regarding the advisability of investing in |
| Thomson Reuters Company, or Morningstar, Inc., unless | such product(s) nor do they have any liability for any |
| otherwise noted. | errors, omissions, or interruptions of the index. |
| |
| You can obtain a free copy of Vanguard’s proxy voting | |
| guidelines by visiting vanguard.com/proxyreporting or by | |
| calling Vanguard at 800-662-2739. The guidelines are | |
| also available from the SEC’s website, sec.gov. In | |
| addition, you may obtain a free report on how your fund | |
| voted the proxies for securities it owned during the 12 | |
| months ended June 30. To get the report, visit either | |
| vanguard.com/proxyreporting or sec.gov. | |
| |
| You can review and copy information about your fund at | |
| the SEC’s Public Reference Room in Washington, D.C. To | |
| find out more about this public service, call the SEC at | |
| 202-551-8090. Information about your fund is also | |
| available on the SEC’s website, and you can receive | |
| copies of this information, for a fee, by sending a | |
| request in either of two ways: via email addressed to | |
| publicinfo@sec.gov or via regular mail addressed to the | |
| Public Reference Section, Securities and Exchange | |
| Commission, Washington, DC 20549-1520. | |
| |
| | © 2017 The Vanguard Group, Inc. |
| | All rights reserved. |
| | Vanguard Marketing Corporation, Distributor. |
| |
| | Q400 022017 |
Annual Report | December 31, 2016
Vanguard U.S. Stock Index Funds
Small-Capitalization Portfolios
Vanguard Small-Cap Index Fund
Vanguard Small-Cap Growth Index Fund
Vanguard Small-Cap Value Index Fund
A new format, unwavering commitment
As you begin reading this report, you’ll notice that we’ve made some improvements to the opening sections—based on feedback from you, our clients.
Page 1 starts with a new ”Your Fund’s Performance at a Glance,” a concise, handy summary of how your fund performed during the period.
In the renamed ”Chairman’s Perspective,” Bill McNabb will focus on enduring principles and investment insights.
We’ve modified some tables, and eliminated some redundancy, but we haven’t removed any information.
At Vanguard, we’re always looking for better ways to communicate and to help you make sound investment decisions. Thank you for entrusting your assets to us.
| |
| Contents | |
| Your Fund’s Performance at a Glance. | 1 |
| Chairman’s Perspective. | 4 |
| Small-Cap Index Fund. | 8 |
| Small-Cap Growth Index Fund. | 30 |
| Small-Cap Value Index Fund. | 49 |
| Your Fund’s After-Tax Returns. | 71 |
| About Your Fund’s Expenses. | 72 |
| Glossary. | 75 |
Please note: The opinions expressed in this report are just that—informed opinions. They should not be considered promises or advice.
Also, please keep in mind that the information and opinions cover the period through the date on the front of this report. Of course, the
risks of investing in your fund are spelled out in the prospectus.
See the Glossary for definitions of investment terms used in this report.
About the cover: No matter what language you speak, Vanguard has one consistent message and set of principles. Our primary
focus is on you, our clients. We conduct our business with integrity as a faithful steward of your assets. This message is shown
translated into seven languages, reflecting our expanding global presence.
Your Fund’s Performance at a Glance
• For the 12 months ended December 31, 2016, returns for the three Vanguard small-capitalization U.S. index funds ranged from nearly 25% for Vanguard Small-Cap Value Index Fund to about 11% for Vanguard Small-Cap Growth Index Fund. Vanguard Small-Cap Index Fund, which contains both growth and value stocks, returned about 18%.
• All three funds closely tracked their target indexes. The Small-Cap Index Fund and Small-Cap Value Index Fund trailed the average return of their peers, while the Small-Cap Growth Index Fund surpassed the average return of its peers.
• Small-cap stocks outperformed their large- and mid-cap counterparts, and value stocks outpaced growth stocks.
• Financial and industrial stocks were top contributors for all three funds. The basic materials sector recorded the highest returns for the funds, which saw negative results from health care.
• Over the past decade, the funds posted returns in line with their benchmark indexes and ahead of their peer averages.
| |
| Total Returns: Fiscal Year Ended December 31, 2016 | |
| | Total |
| | Returns |
| Vanguard Small-Cap Index Fund | |
| Investor Shares | 18.17% |
| ETF Shares | |
| Market Price | 18.35 |
| Net Asset Value | 18.31 |
| Admiral™ Shares | 18.30 |
| Institutional Shares | 18.32 |
| Institutional Plus Shares | 18.33 |
| CRSP US Small Cap Index | 18.26 |
| Small-Cap Core Funds Average | 20.61 |
| Small-Cap Core Funds Average: Derived from data provided by Lipper, a Thomson Reuters Company. | |
1
| |
| | Total |
| | Returns |
| Vanguard Small-Cap Growth Index Fund | |
| Investor Shares | 10.61% |
| ETF Shares | |
| Market Price | 10.79 |
| Net Asset Value | 10.74 |
| Admiral Shares | 10.73 |
| Institutional Shares | 10.74 |
| CRSP US Small Cap Growth Index | 10.62 |
| Small-Cap Growth Funds Average | 9.75 |
| Small-Cap Growth Funds Average: Derived from data provided by Lipper, a Thomson Reuters Company. | |
| |
| Vanguard Small-Cap Value Index Fund | |
| Investor Shares | 24.65% |
| ETF Shares | |
| Market Price | 24.80 |
| Net Asset Value | 24.80 |
| Admiral Shares | 24.78 |
| Institutional Shares | 24.80 |
| CRSP US Small Cap Value Index | 24.82 |
| Small-Cap Value Funds Average | 26.57 |
Small-Cap Value Funds Average: Derived from data provided by Lipper, a Thomson Reuters Company.
Admiral Shares carry lower expenses and are available to investors who meet certain account-balance requirements. Institutional Shares and
Institutional Plus Shares are available to certain institutional investors who meet specific administrative, service, and account-size criteria.
The Vanguard ETF® Shares shown are traded on the NYSE Arca exchange and are available only through brokers. The table provides ETF
returns based on both the NYSE Arca market price and the net asset value for a share. U.S. Pat. Nos. 6,879,964; 7,337,138; 7,720,749;
7,925,573; 8,090,646; and 8,417,623.
For the ETF Shares, the market price is determined by the midpoint of the bid-offer spread as of the closing time of the New York Stock
Exchange (generally 4 p.m., Eastern time). The net asset value is also determined as of the NYSE closing time. For more information about
how the ETF Shares' market prices have compared with their net asset value, visit vanguard.com, select your ETF, and then select the Price
and Performance tab. The ETF premium/discount analysis there shows the percentages of days on which the ETF Shares' market price was
above or below the NAV.
| |
| Total Returns: Ten Years Ended December 31, 2016 | |
| | Average |
| | Annual Return |
| Small-Cap Index Fund Investor Shares | 8.04% |
| Spliced Small-Cap Index | 8.10 |
| Small-Cap Core Funds Average | 6.33 |
| For a benchmark description, see the Glossary. | |
| Small-Cap Core Funds Average: Derived from data provided by Lipper, a Thomson Reuters Company. |
2
| |
| | Average |
| | Annual Return |
| Small-Cap Growth Index Fund Investor Shares | 8.09% |
| Spliced Small-Cap Growth Index | 8.11 |
| Small-Cap Growth Funds Average | 6.32 |
| For a benchmark description, see the Glossary. |
| Small-Cap Growth Funds Average: Derived from data provided by Lipper, a Thomson Reuters Company. |
| |
| Small-Cap Value Index Fund Investor Shares | 7.63% |
| Spliced Small-Cap Value Index | 7.76 |
| Small-Cap Value Funds Average | 6.61 |
| For a benchmark description, see the Glossary. |
| Small-Cap Value Funds Average: Derived from data provided by Lipper, a Thomson Reuters Company. |
The figures shown represent past performance, which is not a guarantee of future results. (Current performance may be lower or higher than the performance data cited. For performance data current to the most recent month-end, visit our website at vanguard.com/performance.) Note, too, that both investment returns and principal value can fluctuate widely, so an investor’s shares, when sold, could be worth more or less than their original cost.
| | | | | | |
| Expense Ratios | | | | | | |
| Your Fund Compared With Its Peer Group | | | | | |
| | Investor | ETF | Admiral | Institutional | Institutional | Peer Group |
| | Shares | Shares | Shares | Shares Plus Shares | Average |
| Small-Cap Index Fund | 0.20% | 0.08% | 0.08% | 0.07% | 0.05% | 1.25% |
| Small-Cap Growth Index Fund | 0.20 | 0.08 | 0.08 | 0.07 | — | 1.36 |
| Small-Cap Value Index Fund | 0.20 | 0.08 | 0.08 | 0.07 | — | 1.33 |
The fund expense ratios shown are from the prospectus dated April 27, 2016, and represent estimated costs for the current fiscal year. For the
fiscal year ended December 31, 2016, the funds’ expense ratios were: for the Small-Cap Index Fund, 0.18% for Investor Shares, 0.06% for ETF
Shares, 0.06% for Admiral Shares, 0.05% for Institutional Shares, and 0.04% for Institutional Plus Shares; for the Small-Cap Growth Index
Fund, 0.19% for Investor Shares, 0.07% for ETF Shares, 0.07% for Admiral Shares, and 0.06% for Institutional Shares; and for the Small-Cap
Value Index Fund, 0.19% for Investor Shares, 0.07% for ETF Shares, 0.07% for Admiral Shares, and 0.06% for Institutional Shares. The
peer-group expense ratios are derived from data provided by Lipper, a Thomson Reuters Company, and capture information through year-end
2015.
Peer groups: For the Small-Cap Index Fund, Small-Cap Core Funds; for the Small-Cap Growth Index Fund, Small-Cap Growth Funds; and for the
Small-Cap Value Index Fund, Small-Cap Value Funds.
3
Chairman’s Perspective

Bill McNabb
Chairman and Chief Executive Officer
Dear Shareholder,
If you’re like most investors, a big question on your mind is: What’s in store for the markets and the economy in 2017?
At Vanguard, we’re just as curious about the immediate future. But our curiosity is tempered by our belief that forecasts should give a range of possible outcomes, not pinpoint predictions. After all, there are bound to be occurrences the experts won’t see coming.
What really matters for investors
In 2016, we saw two cases in point: The United Kingdom’s June vote to exit the European Union and the November election of Donald Trump as U.S. president. Both unexpected outcomes triggered swift market reactions. But despite some short-term volatility, the markets’ 12-month performance as of December 31, 2016, proved to be less dramatic. U.S. stocks posted healthy returns, and U.S. bonds provided returns close to their long-term averages. International stocks and bonds also advanced, although returns for U.S. investors were reduced by the strength of the U.S. dollar.
The surprises of 2016 remind us to be skeptical of overly precise short-term predictions about 2017. At the cusp of a new year, market prognosticators forecast where the Standard & Poor’s 500 Index or the yield on the 10-year Treasury note will end up in 12 months. Such predictions can be attention-getting. They can also be dead wrong.
4
Investors are better off taking note of long-term trends that stand to influence our economies and markets. We’re watching these trends closely, and we discuss our latest assessment in our 2017 economic and market outlook, which you can read at vanguard.com/research.
Our global economic outlook: Expect stabilization, not stagnation
One phenomenon in particular that we’re watching is the low-growth, low-interest-rate environment that has marked the global economy since the 2008–09 financial crisis. We don’t think this economic backdrop is simply the result of cyclically weak demand or long-term stagnation. Instead, certain structural forces are contributing: Falling technology costs are restraining the amounts businesses are spending on capital investment, an aging population is weighing on growth in the developed world, and the free movement of capital and products across the globe has restrained prices and wages.
In the near term, these forces will continue to dampen growth, inflation, and interest rates. They also make it unlikely that further monetary stimulus from central banks will do much to spur growth.
I realize this all may sound gloomy, but that’s not how we see it. We expect global growth to stabilize at more modest levels, not stagnate. The world isn’t headed for Japanese-style deflation, in which a widespread sustained drop in prices puts economic activity into hibernation.
| | | |
| Market Barometer | | | |
| | Average Annual Total Returns |
| | Periods Ended December 31, 2016 |
| | One | Three | Five |
| | Year | Years | Years |
| Stocks | | | |
| Russell 1000 Index (Large-caps) | 12.05% | 8.59% | 14.69% |
| Russell 2000 Index (Small-caps) | 21.31 | 6.74 | 14.46 |
| Russell 3000 Index (Broad U.S. market) | 12.74 | 8.43 | 14.67 |
| FTSE All-World ex US Index (International) | 4.80 | -1.16 | 5.52 |
| |
| Bonds | | | |
| Bloomberg Barclays U.S. Aggregate Bond Index | | | |
| (Broad taxable market) | 2.65% | 3.03% | 2.23% |
| Bloomberg Barclays Municipal Bond Index | | | |
| (Broad tax-exempt market) | 0.25 | 4.14 | 3.28 |
| Citigroup Three-Month U.S. Treasury Bill Index | 0.27 | 0.09 | 0.08 |
| |
| CPI | | | |
| Consumer Price Index | 2.07% | 1.18% | 1.36% |
5
In fact, we believe that global growth could pick up modestly over time. Our expectation is based on a potential rebound in productivity as new digital technologies are used more effectively. We also anticipate a slight recovery in the labor force as the baby boom generation finishes its transition to retirement, nudging up demand for workers.
Put expansion in perspective
Looking to the United States, the world’s largest economy remains firmly on a long-term-growth path of about 2% per year. That’s lower than the historical average of 3.25% since 1950. We see such growth at this level as fundamentally sound, rather than abnormally low. Our evaluation takes into account lower U.S. population growth and the reality that the economic expansion from the 1980s until the financial crisis was fueled by debt, distorting the numbers.
Turning to prices, we think that core U.S. inflation should modestly exceed 2% in 2017. That, in turn, will support further interest rate hikes by the Federal Reserve, similar to the one at the end of 2016.
We expect the Fed to raise rates in 2017 before taking an extended pause, and we see the federal funds rate staying below 2% through at least 2018.
Prepare for muted returns
And what about prospects for the markets? Vanguard’s outlook for global stocks and bonds remains the most guarded in ten years, given fairly high stock valuations
|
| Expect more modest returns, rely on time-tested principles |
| |
| In Vanguard’s economic and market outlook for 2017, Global Chief Economist Joseph Davis |
| and his team offer a projection of more modest returns from the global stock and bond |
| markets. They caution that, over the next decade, returns for a balanced portfolio are likely |
| to be moderately below long-run historical averages. |
| |
| The team’s simulations indicate that for the decade ending in 2026, the average annualized |
| return of a 60% stock/40% bond portfolio is likely to be centered in the 3%–5% range after |
| inflation. That’s below the actual average after-inflation return of 6% for the same portfolio |
| for the nine decades since 1926. |
| |
| Ultimately, our global market outlook points toward a somewhat more challenging environment, |
| yet one in which, over time, investors with an appropriate level of discipline, diversification, and |
| patience are likely to be rewarded with reasonable inflation-adjusted returns. |
| |
| For more information about our expectations and the probability of various outcomes, see 2017 |
| Economic and Market Outlook: Stabilization, Not Stagnation, available at vanguard.com/research. |
| |
| |
| IMPORTANT: The projections and other information generated by the Vanguard Capital Markets Model® (VCMM) |
| regarding the likelihood of various investment outcomes are hypothetical in nature, do not reflect actual investment |
| results, and are not guarantees of future results. Distribution of return outcomes from the VCMM are derived |
| from 10,000 simulations for each modeled asset class. Simulations as of September 30, 2016. Results from the |
| model may vary with each use and over time. For more information, see the note at the end of this letter. |
6
and the low-interest-rate environment. We don’t expect global bond yields to increase materially from year-end 2016 levels.
Our outlook for global equities is annualized returns of 5%–8% over the next decade. This outlook isn’t bearish, but is actually fairly positive when you take into account the current low-rate environment. (See the box titled Expect more modest returns, rely on time-tested principles for more.)
Focus on the four keys to investment success
Significant trends often happen gradually. Like shifting tides, they’re sometimes barely noticeable at first but ultimately can change the landscape entirely. Other times, apparent trends can end up receding before they have much of a long-term impact. Given the future’s inherent unpredictability, it’s not reasonable to expect a surefire block-buster revelation from any prognosticator or investment firm.
What to conclude, then? No matter what scenario plays out, we believe investors have the best chance for success if they stay focused on what they can control: their goals, asset allocation, and investment costs, along with the discipline to stick to a plan. As Tim Buckley, our chief investment officer, likes to say, this can be easy to say but harder to do, especially in times of uncertainty. Investors who can stay focused on those four keys will find themselves well-positioned to weather any market.
As always, thank you for investing with Vanguard.
Sincerely,

F. William McNabb III
Chairman and Chief Executive Officer
January 16, 2017
IMPORTANT: The projections and other information generated by the Vanguard Capital Markets Model regarding
the likelihood of various investment outcomes are hypothetical in nature, do not reflect actual investment results,
and are not guarantees of future results. VCMM results will vary with each use and over time.
The VCMM projections are based on a statistical analysis of historical data. Future returns may behave differently from the
historical patterns captured in the VCMM. More important, the VCMM may be underestimating extreme negative scenarios
unobserved in the historical period on which the model estimation is based.
The VCMM is a proprietary financial simulation tool developed and maintained by Vanguard’s Investment Strategy Group.
The model forecasts distributions of future returns for a wide array of broad asset classes. Those asset classes include U.S.
and international equity markets, several maturities of the U.S. Treasury and corporate fixed income markets, international
fixed income markets, U.S. money markets, commodities, and certain alternative investment strategies. The theoretical and
empirical foundation for the Vanguard Capital Markets Model is that the returns of various asset classes reflect the compensation
investors require for bearing different types of systematic risk (beta). At the core of the model are estimates of the dynamic
statistical relationship between risk factors and asset returns, obtained from statistical analysis based on available monthly
financial and economic data. Using a system of estimated equations, the model then applies a Monte Carlo simulation method
to project the estimated interrelationships among risk factors and asset classes as well as uncertainty and randomness over
time. The model generates a large set of simulated outcomes for each asset class over several time horizons. Forecasts are
obtained by computing measures of central tendency in these simulations. Results produced by the tool will vary with each
use and over time.
7
Small-Cap Index Fund
Fund Profile
As of December 31, 2016
| | | | | |
| Share-Class Characteristics | | | | | |
| | Investor | | Admiral | Institutional | Institutional |
| | Shares | ETF Shares | Shares | Shares | Plus Shares |
| Ticker Symbol | NAESX | VB | VSMAX | VSCIX | VSCPX |
| Expense Ratio1 | 0.20% | 0.08% | 0.08% | 0.07% | 0.05% |
| 30-Day SEC Yield | 1.37% | 1.49% | 1.49% | 1.50% | 1.49% |
| | | |
| Portfolio Characteristics | | |
| | | | DJ |
| | | | U.S. |
| | | CRSP US | Total |
| | | Small Cap | Market |
| | Fund | Index FA Index |
| Number of Stocks | 1,438 | 1,430 | 3,833 |
| Median Market Cap | $3.5B | $3.5B | $54.1B |
| Price/Earnings Ratio | 31.5x | 31.7x | 24.4x |
| Price/Book Ratio | 2.4x | 2.5x | 2.8x |
| Return on Equity | 11.0% | 11.0% | 16.5% |
| Earnings Growth | | | |
| Rate | 9.7% | 9.7% | 8.2% |
| Dividend Yield | 1.5% | 1.5% | 2.0% |
| Foreign Holdings | 0.0% | 0.0% | 0.0% |
| Turnover Rate | 14% | — | — |
| Short-Term | | | |
| Reserves | 0.1% | — | — |
| | | |
| Sector Diversification (% of equity exposure) |
| | | | DJ |
| | | CRSP US U.S. | Total |
| | | Small Cap | Market |
| | Fund | Index FA Index |
| Basic Materials | 4.4% | 4.5% | 2.6% |
| Consumer Goods | 7.0 | 6.9 | 9.6 |
| Consumer Services | 12.0 | 11.9 | 13.1 |
| Financials | 27.3 | 27.4 | 20.8 |
| Health Care | 8.8 | 8.8 | 12.2 |
| Industrials | 19.8 | 19.8 | 12.9 |
| Oil & Gas | 5.4 | 5.3 | 6.9 |
| Technology | 11.4 | 11.5 | 16.4 |
| Telecommunications | 0.4 | 0.4 | 2.4 |
| Utilities | 3.5 | 3.5 | 3.1 |
| | |
| Volatility Measures | | |
| | | DJ |
| | CRSP US | U.S. Total |
| | Small Cap | Market |
| | Index | FA Index |
| R-Squared | 1.00 | 0.84 |
| Beta | 1.00 | 1.15 |
| These measures show the degree and timing of the fund’s |
| fluctuations compared with the indexes over 36 months. |
| | |
| Ten Largest Holdings (% of total net assets) |
| Targa Resources Corp. | Exploration & | |
| | Production | 0.3% |
| Diamondback Energy | Exploration & | |
| Inc. | Production | 0.3 |
| SVB Financial Group | Banks | 0.3 |
| Advanced Micro Devices | | |
| Inc. | Semiconductors | 0.3 |
| Huntington Ingalls | | |
| Industries Inc. | Defense | 0.3 |
| HD Supply Holdings Inc. | Industrial Suppliers | 0.3 |
| CDW Corp. | Computer Services | 0.3 |
| Steel Dynamics Inc. | Iron & Steel | 0.3 |
| Newfield Exploration Co. Exploration & | |
| | Production | 0.3 |
| Packaging Corp. of | Containers & | |
| America | Packaging | 0.3 |
| Top Ten | | 3.0% |
| The holdings listed exclude any temporary cash investments and equity index products. |
1 The expense ratios shown are from the prospectus dated April 27, 2016, and represent estimated costs for the current fiscal year. For the fiscal
year ended December 31, 2016, the expense ratios were 0.18% for Investor Shares, 0.06% for ETF Shares, 0.06% for Admiral Shares, 0.05% for
Institutional Shares, and 0.04% for Institutional Plus Shares.
8
Small-Cap Index Fund
Investment Focus
9
Small-Cap Index Fund
Performance Summary
All of the returns in this report represent past performance, which is not a guarantee of future results that may be achieved by the fund. (Current performance may be lower or higher than the performance data cited. For performance data current to the most recent month-end, visit our website at vanguard.com/performance.) Note, too, that both investment returns and principal value can fluctuate widely, so an investor’s shares, when sold, could be worth more or less than their original cost. The returns shown do not reflect taxes that a shareholder would pay on fund distributions or on the sale of fund shares.
Cumulative Performance: December 31, 2006, Through December 31, 2016
Initial Investment of $10,000
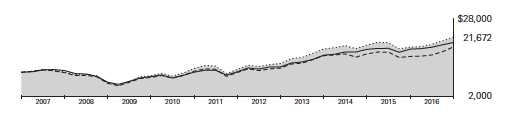
| | | | | |
| | | Average Annual Total Returns | |
| | | Periods Ended December 31, 2016 | |
| | | | | | Final Value |
| | | One | Five | Ten | of a $10,000 |
| | | Year | Years | Years | Investment |
| | Small-Cap Index Fund*Investor | | | | |
| | Shares | 18.17% | 14.68% | 8.04% | $21,672 |
| • • • • • • •• | Spliced Small-Cap Index | 18.26 | 14.81 | 8.10 | 21,797 |
| – – – – | Small-Cap Core Funds Average | 20.61 | 13.23 | 6.33 | 18,474 |
| | Dow Jones U.S. Total Stock Market | | | | |
| | Float Adjusted Index | 12.62 | 14.59 | 7.18 | 20,003 |
| For a benchmark description, see the Glossary. |
| Small-Cap Core Funds Average: Derived from data provided by Lipper, a Thomson Reuters Company. |
| | | | |
| | | | | Final Value |
| | One | Five | Ten | of a $10,000 |
| | Year | Years | Years | Investment |
| Small-Cap Index Fund | | | | |
| ETF Shares Net Asset Value | 18.31% | 14.83% | 8.18% | $21,958 |
| Spliced Small-Cap Index | 18.26 | 14.81 | 8.10 | 21,797 |
| Dow Jones U.S. Total Stock Market Float | | | | |
| Adjusted Index | 12.62 | 14.59 | 7.18 | 20,003 |
See Financial Highlights for dividend and capital gains information.
10
Small-Cap Index Fund
| | | | |
| | Average Annual Total Returns | |
| | Periods Ended December 31, 2016 | |
| |
| | | | | Final Value |
| | One | Five | Ten | of a $10,000 |
| | Year | Years | Years | Investment |
| Small-Cap Index Fund Admiral Shares | 18.30% | 14.83% | 8.18% | $21,951 |
| Spliced Small-Cap Index | 18.26 | 14.81 | 8.10 | 21,797 |
| Dow Jones U.S. Total Stock Market Float | | | | |
| Adjusted Index | 12.62 | 14.59 | 7.18 | 20,003 |
| | | | |
| | | | | Final Value |
| | One | Five | Ten | of a $5,000,000 |
| | Year | Years | Years | Investment |
| |
| Small-Cap Index Fund Institutional Shares | 18.32% | 14.85% | 8.21% | $11,007,326 |
| |
| Spliced Small-Cap Index | 18.26 | 14.81 | 8.10 | 10,898,613 |
| Dow Jones U.S. Total Stock Market Float | | | | |
| Adjusted Index | 12.62 | 14.59 | 7.18 | 10,001,613 |
| | | | |
| | | | Since | Final Value |
| | One | Five | Inception | of a $100,000,000 |
| | Year | Years | (12/17/2010) | Investment |
| Small-Cap Index Fund Institutional Plus Shares | 18.33% | 14.87% | 11.82% | $196,296,197 |
| Spliced Small-Cap Index | 18.26 | 14.81 | 11.75 | 195,571,781 |
| Dow Jones U.S. Total Stock Market Float | | | | |
| Adjusted Index | 12.62 | 14.59 | 12.35 | 202,055,560 |
| "Since Inception" performance is calculated from the Institutional Plus Shares’ inception date for both the fund and its comparative standards. |
| | | |
| Cumulative Returns of ETF Shares: December 31, 2006, Through December 31, 2016 | |
| | One | Five | Ten |
| | Year | Years | Years |
| Small-Cap Index Fund ETF Shares Market Price | 18.35% | 99.81% | 119.85% |
| Small-Cap Index Fund ETF Shares Net Asset Value | 18.31 | 99.66 | 119.58 |
| Spliced Small-Cap Index | 18.26 | 99.47 | 117.97 |
Small-Cap Index Fund
Fiscal-Year Total Returns (%): December 31, 2006, Through December 31, 2016
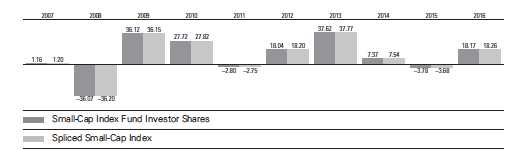
For a benchmark description, see the Glossary.
12
Small-Cap Index Fund
Financial Statements
Statement of Net Assets—Investments Summary
As of December 31, 2016
This Statement summarizes the fund’s holdings by asset type. Details are reported for each of the fund’s 50 largest individual holdings and for investments that, in total for any issuer, represent more than 1% of the fund’s net assets. The total value of smaller holdings is reported as a single amount within each category.
The fund reports a complete list of its holdings in regulatory filings four times in each fiscal year, at the quarter-ends. For the second and fourth fiscal quarters, the complete listing of the fund’s holdings is available electronically on vanguard.com and on the Securities and Exchange Commission’s website (sec.gov), or you can have it mailed to you without charge by calling 800-662-7447. For the first and third fiscal quarters, the fund files the lists with the SEC on Form N-Q. Shareholders can look up the fund’s Forms N-Q on the SEC’s website. Forms N-Q may also be reviewed and copied at the SEC’s Public Reference Room (see the back cover of this report for further information).
| | | |
| | | Market | Percentage |
| | | Value• | of Net |
| | Shares | ($000) | Assets |
| Common Stocks | | | |
| Basic Materials | | | |
| Steel Dynamics Inc. | 5,172,373 | 184,033 | 0.3% |
| RPM International Inc. | 2,979,292 | 160,375 | 0.2% |
| Basic Materials—Other † | | 2,702,696 | 4.0% |
| | | 3,047,104 | 4.5% |
| Consumer Goods | | | |
| * Middleby Corp. | 1,284,847 | 165,501 | 0.3% |
| Leggett & Platt Inc. | 2,985,163 | 145,915 | 0.2% |
| Pinnacle Foods Inc. | 2,636,651 | 140,929 | 0.2% |
| Consumer Goods—Other † | | 4,366,064 | 6.4% |
| | | 4,818,409 | 7.1% |
| Consumer Services | | | |
| Domino’s Pizza Inc. | 1,073,653 | 170,968 | 0.3% |
| * JetBlue Airways Corp. | 7,229,327 | 162,081 | 0.2% |
| Consumer Services—Other † | | 7,941,694 | 11.6% |
| | | 8,274,743 | 12.1% |
| Financials | | | |
| * SVB Financial Group | 1,163,177 | 199,671 | 0.3% |
| * Signature Bank | 1,158,473 | 174,003 | 0.3% |
| East West Bancorp Inc. | 3,219,268 | 163,635 | 0.3% |
| Regency Centers Corp. | 2,333,453 | 160,892 | 0.2% |
| Apartment Investment & Management Co. | 3,503,444 | 159,232 | 0.2% |
| Kilroy Realty Corp. | 2,060,506 | 150,870 | 0.2% |
| American Campus Communities Inc. | 2,949,888 | 146,816 | 0.2% |
| PacWest Bancorp | 2,685,941 | 146,223 | 0.2% |
| National Retail Properties Inc. | 3,285,437 | 145,216 | 0.2% |
| WP Carey Inc. | 2,373,468 | 140,248 | 0.2% |
| American Financial Group Inc. | 1,551,872 | 136,751 | 0.2% |
| ^ Omega Healthcare Investors Inc. | 4,357,707 | 136,222 | 0.2% |
| Financials—Other † | | 17,002,662 | 24.9% |
| | | 18,862,441 | 27.6% |
13
Small-Cap Index Fund
| | | | |
| | | | Market | Percentage |
| | | | Value• | of Net |
| | | Shares | ($000) | Assets |
| Health Care | | | |
| | Teleflex Inc. | 983,733 | 158,529 | 0.3% |
| * | Align Technology Inc. | 1,601,507 | 153,953 | 0.2% |
| * | MEDNAX Inc. | 2,090,946 | 139,382 | 0.2% |
| | West Pharmaceutical Services Inc. | 1,634,273 | 138,635 | 0.2% |
| | Health Care—Other † | | 5,478,953 | 8.0% |
| | | | 6,069,452 | 8.9% |
| Industrials | | | |
| | Huntington Ingalls Industries Inc. | 1,035,331 | 190,698 | 0.3% |
| * | HD Supply Holdings Inc. | 4,479,864 | 190,439 | 0.3% |
| | Packaging Corp. of America | 2,104,130 | 178,472 | 0.3% |
| | Broadridge Financial Solutions Inc. | 2,661,483 | 176,456 | 0.3% |
| | Valspar Corp. | 1,594,799 | 165,237 | 0.2% |
| | Carlisle Cos. Inc. | 1,440,397 | 158,861 | 0.2% |
| | Spirit AeroSystems Holdings Inc. Class A | 2,717,785 | 158,583 | 0.2% |
| | AO Smith Corp. | 3,298,266 | 156,173 | 0.2% |
| | Jack Henry & Associates Inc. | 1,744,053 | 154,837 | 0.2% |
| | IDEX Corp. | 1,702,620 | 153,338 | 0.2% |
| | Lennox International Inc. | 913,151 | 139,867 | 0.2% |
| * | Keysight Technologies Inc. | 3,795,217 | 138,791 | 0.2% |
| | Allegion plc | 2,144,070 | 137,220 | 0.2% |
| * | CoStar Group Inc. | 727,808 | 137,185 | 0.2% |
| | Industrials—Other † | | 11,464,594 | 16.8% |
| | | | 13,700,751 | 20.0% |
| Oil & Gas | | | |
| | Targa Resources Corp. | 3,836,161 | 215,094 | 0.3% |
| * | Diamondback Energy Inc. | 1,977,746 | 199,871 | 0.3% |
| * | Newfield Exploration Co. | 4,441,237 | 179,870 | 0.2% |
| *,^ | Chesapeake Energy Corp. | 19,816,394 | 139,111 | 0.2% |
| | Oil & Gas—Other † | | 2,987,546 | 4.4% |
| | | | 3,721,492 | 5.4% |
| |
| 1Other † | | 5,630 | 0.0% |
| |
| Technology | | | |
| * | Advanced Micro Devices Inc. | 17,593,301 | 199,508 | 0.3% |
| | CDW Corp. | 3,587,049 | 186,849 | 0.3% |
| | Leidos Holdings Inc. | 3,357,772 | 171,716 | 0.3% |
| * | Cadence Design Systems Inc. | 6,402,669 | 161,475 | 0.2% |
| * | CommScope Holding Co. Inc. | 4,306,966 | 160,219 | 0.2% |
| * | Microsemi Corp. | 2,560,185 | 138,173 | 0.2% |
| | Technology—Other † | | 6,900,435 | 10.1% |
| | | | 7,918,375 | 11.6% |
| |
| Telecommunications † | | 291,551 | 0.4% |
| |
| Utilities | | | |
| | Westar Energy Inc. Class A | 3,166,175 | 178,414 | 0.3% |
| | UGI Corp. | 3,866,213 | 178,155 | 0.3% |
| | Atmos Energy Corp. | 2,322,814 | 172,237 | 0.2% |
| | Utilities—Other † | | 1,930,401 | 2.8% |
| | | | 2,459,207 | 3.6% |
| Total Common Stocks (Cost $53,367,847) | | 69,169,155 | 101.2%2 |
14
| | | | |
| Small-Cap Index Fund | | | | |
| |
| |
| |
| | | | Market | Percentage |
| | | | Value• | of Net |
| | Coupon | Shares | ($000) | Assets |
| Temporary Cash Investments | | | | |
| Money Market Fund | | | | |
| 3,4 Vanguard Market Liquidity Fund | 0.823% | 10,945,278 | 1,094,637 | 0.0% |
| |
| 5,6U.S. Government and Agency Obligations † | | | 17,766 | 0.0% |
| Total Temporary Cash Investments (Cost $1,112,320) | | | 1,112,403 | 0.0%2 |
| Total Investments (Cost $54,480,167) | | | 70,281,558 | 101.2% |
| |
| | | | Amount | |
| | | | ($000) | |
| Other Assets and Liabilities | | | | |
| Other Assets | | | | |
| Investment in Vanguard | | | 5,075 | |
| Receivables for Investment Securities Sold | | | 195,062 | |
| Receivables for Accrued Income | | | 111,525 | |
| Receivables for Capital Shares Issued | | | 78,345 | |
| Other Assets5 | | | 1,830 | |
| Total Other Assets | | | 391,837 | 0.6% |
| Liabilities | | | | |
| Payables for Investment Securities Purchased | | | (19,842) | |
| Collateral for Securities on Loan | | | (734,518) | |
| Payables for Capital Shares Redeemed | | | (438,316) | |
| Payables to Vanguard | | | (34,940) | |
| Other Liabilities | | | (4,150) | |
| Total Liabilities | | | (1,231,766) | (1.8%) |
| Net Assets | | | 69,441,629 | 100.0% |
| |
| |
| At December 31, 2016, net assets consisted of: | | | | |
| | | | | Amount |
| | | | | ($000) |
| Paid-in Capital | | | | 56,118,572 |
| Overdistributed Net Investment Income | | | | (23,248) |
| Accumulated Net Realized Losses | | | | (2,449,384) |
| Unrealized Appreciation (Depreciation) | | | | |
| Investment Securities | | | | 15,801,391 |
| Futures Contracts | | | | (5,181) |
| Swap Contracts | | | | (521) |
| Net Assets | | | | 69,441,629 |
| |
| |
| Investor Shares—Net Assets | | | | |
| Applicable to 71,269,277 outstanding $.001 par value shares of | | | |
| beneficial interest (unlimited authorization) | | | | 4,400,726 |
| Net Asset Value Per Share—Investor Shares | | | | $61.75 |
15
| |
| Small-Cap Index Fund | |
| |
| |
| |
| | Amount |
| | ($000) |
| ETF Shares—Net Assets | |
| Applicable to 125,313,816 outstanding $.001 par value shares of | |
| beneficial interest (unlimited authorization) | 16,152,927 |
| Net Asset Value Per Share—ETF Shares | $128.90 |
| |
| Admiral Shares—Net Assets | |
| Applicable to 449,721,155 outstanding $.001 par value shares of | |
| beneficial interest (unlimited authorization) | 27,778,167 |
| Net Asset Value Per Share—Admiral Shares | $61.77 |
| |
| Institutional Shares—Net Assets | |
| Applicable to 210,958,628 outstanding $.001 par value shares of | |
| beneficial interest (unlimited authorization) | 13,029,882 |
| Net Asset Value Per Share—Institutional Shares | $61.77 |
| |
| Institutional Plus Shares—Net Assets | |
| Applicable to 45,322,224 outstanding $.001 par value shares of | |
| beneficial interest (unlimited authorization) | 8,079,927 |
| Net Asset Value Per Share—Institutional Plus Shares | $178.28 |
• See Note A in Notes to Financial Statements.
* Non-income-producing security.
^ Includes partial security positions on loan to broker-dealers. The total value of securities on loan is $689,588,000.
† Represents the aggregate value, by category, of securities that are not among the 50 largest holdings and, in total for any issuer, represent
1% or less of net assets.
1 “Other” represents securities that are not classified by the fund’s benchmark index.
2 The fund invests a portion of its cash reserves in equity markets through the use of index futures contracts and swap contracts. After giving
effect to futures and swap investments, the fund’s effective common stock and temporary cash investment positions represent 100.1% and
1.1%, respectively, of net assets.
3 Affiliated money market fund available only to Vanguard funds and certain trusts and accounts managed by Vanguard. Rate shown is the
7-day yield.
4 Includes $734,518,000 of collateral received for securities on loan.
5 Securities with a value of $15,290,000 and cash of $1,823,000, have been segregated as initial margin for open futures contracts.
6 Securities with a value of 1,572,000 have been segregated as collateral for open over-the-counter swap contracts.
See accompanying Notes, which are an integral part of the Financial Statements.
16
Small-Cap Index Fund
Statement of Operations
| |
| | Year Ended |
| | December 31, 2016 |
| | ($000) |
| Investment Income | |
| Income | |
| Dividends | 964,753 |
| Interest1 | 1,692 |
| Securities Lending—Net | 51,566 |
| Total Income | 1,018,011 |
| Expenses | |
| The Vanguard Group—Note B | |
| Investment Advisory Services | 4,715 |
| Management and Administrative—Investor Shares | 5,940 |
| Management and Administrative—ETF Shares | 4,909 |
| Management and Administrative—Admiral Shares | 8,947 |
| Management and Administrative—Institutional Shares | 3,926 |
| Management and Administrative—Institutional Plus Shares | 1,946 |
| Marketing and Distribution—Investor Shares | 875 |
| Marketing and Distribution—ETF Shares | 815 |
| Marketing and Distribution—Admiral Shares | 2,522 |
| Marketing and Distribution—Institutional Shares | 273 |
| Marketing and Distribution—Institutional Plus Shares | 98 |
| Custodian Fees | 1,422 |
| Auditing Fees | 44 |
| Shareholders’ Reports—Investor Shares | 89 |
| Shareholders’ Reports—ETF Shares | 663 |
| Shareholders’ Reports—Admiral Shares | 207 |
| Shareholders’ Reports—Institutional Shares | 155 |
| Shareholders’ Reports—Institutional Plus Shares | 71 |
| Trustees’ Fees and Expenses | 45 |
| Total Expenses | 37,662 |
| Net Investment Income | 980,349 |
| Realized Net Gain (Loss)1 | |
| Investment Securities Sold | 1,309,386 |
| Futures Contracts | 44,048 |
| Swap Contracts | 23,815 |
| Realized Net Gain (Loss) | 1,377,249 |
| Change in Unrealized Appreciation (Depreciation) | |
| Investment Securities | 7,977,668 |
| Futures Contracts | (7,312) |
| Swap Contracts | (1,829) |
| Change in Unrealized Appreciation (Depreciation) | 7,968,527 |
| Net Increase (Decrease) in Net Assets Resulting from Operations | 10,326,125 |
1 Interest income, and realized net gain (loss) from affiliated companies of the fund were $1,633,000 and $14,000, respectively.
See accompanying Notes, which are an integral part of the Financial Statements.
17
Small-Cap Index Fund
Statement of Changes in Net Assets
| | |
| | Year Ended December 31, |
| | 2016 | 2015 |
| | ($000) | ($000) |
| Increase (Decrease) in Net Assets | | |
| Operations | | |
| Net Investment Income | 980,349 | 790,370 |
| Realized Net Gain (Loss) | 1,377,249 | 2,704,498 |
| Change in Unrealized Appreciation (Depreciation) | 7,968,527 | (5,655,783) |
| Net Increase (Decrease) in Net Assets Resulting from Operations | 10,326,125 | (2,160,915) |
| Distributions | | |
| Net Investment Income | | |
| Investor Shares | (62,250) | (55,298) |
| ETF Shares | (227,380) | (164,546) |
| Admiral Shares | (399,294) | (309,236) |
| Institutional Shares | (189,498) | (148,089) |
| Institutional Plus Shares | (120,494) | (101,667) |
| Realized Capital Gain | | |
| Investor Shares | — | — |
| ETF Shares | — | — |
| Admiral Shares | — | — |
| Institutional Shares | — | — |
| Institutional Plus Shares | — | — |
| Total Distributions | (998,916) | (778,836) |
| Capital Share Transactions | | |
| Investor Shares | (288,011) | (344,117) |
| ETF Shares | 2,612,289 | 2,265,366 |
| Admiral Shares | 2,568,322 | 2,571,958 |
| Institutional Shares | 1,232,054 | 605,267 |
| Institutional Plus Shares | 52,625 | 1,305,476 |
| Net Increase (Decrease) from Capital Share Transactions | 6,177,279 | 6,403,950 |
| Total Increase (Decrease) | 15,504,488 | 3,464,199 |
| Net Assets | | |
| Beginning of Period | 53,937,141 | 50,472,942 |
| End of Period1 | 69,441,629 | 53,937,141 |
| 1 Net Assets—End of Period includes undistributed (overdistributed) net investment income of ($23,248,000) and ($28,872,000). |
See accompanying Notes, which are an integral part of the Financial Statements.
18
Small-Cap Index Fund
Financial Highlights
| | | | | |
| Investor Shares | | | | | |
| |
| For a Share Outstanding | Year Ended December 31, |
| Throughout Each Period | 2016 | 2015 | 2014 | 2013 | 2012 |
| Net Asset Value, Beginning of Period | $53.03 | $55.86 | $52.69 | $38.74 | $33.38 |
| Investment Operations | | | | | |
| Net Investment Income | . 843 | .727 | .730 | . 609 | . 659 |
| Net Realized and Unrealized Gain (Loss) | | | | | |
| on Investments | 8.734 | (2.840) | 3.148 | 13.958 | 5.363 |
| Total from Investment Operations | 9.577 | (2.113) | 3.878 | 14.567 | 6.022 |
| Distributions | | | | | |
| Dividends from Net Investment Income | (.857) | (.717) | (.708) | (.617) | (.662) |
| Distributions from Realized Capital Gains | — | — | — | — | — |
| Total Distributions | (.857) | (.717) | (.708) | (.617) | (.662) |
| Net Asset Value, End of Period | $61.75 | $53.03 | $55.86 | $52.69 | $38.74 |
| |
| Total Return1 | 18.17% | -3.78% | 7.37% | 37.62% | 18.04% |
| |
| Ratios/Supplemental Data | | | | | |
| Net Assets, End of Period (Millions) | $4,401 | $4,058 | $4,606 | $5,041 | $3,813 |
| Ratio of Total Expenses to Average Net Assets | 0.18% | 0.20% | 0.23% | 0.24% | 0.24% |
| Ratio of Net Investment Income to | | | | | |
| Average Net Assets | 1.55% | 1.33% | 1.40% | 1.39% | 1.82% |
| Portfolio Turnover Rate2 | 14% | 11% | 10% | 29% | 14% |
1 Total returns do not include account service fees that may have applied in the periods shown. Fund prospectuses provide information about
any applicable account service fees.
2 Excludes the value of portfolio securities received or delivered as a result of in-kind purchases or redemptions of the fund’s capital shares,
including ETF Creation Units.
|
| See accompanying Notes, which are an integral part of the Financial Statements. |
19
Small-Cap Index Fund
Financial Highlights
| | | | | |
| ETF Shares | | | | | |
| |
| For a Share Outstanding | Year Ended December 31, |
| Throughout Each Period | 2016 | 2015 | 2014 | 2013 | 2012 |
| Net Asset Value, Beginning of Period | $110.71 | $116.61 | $110.02 | $80.89 | $69.70 |
| Investment Operations | | | | | |
| Net Investment Income | 1.899 | 1.668 | 1.707 | 1.424 | 1.500 |
| Net Realized and Unrealized Gain (Loss) | | | | | |
| on Investments | 18.221 | (5.931) | 6.556 | 29.145 | 11.194 |
| Total from Investment Operations | 20.120 | (4.263) | 8.263 | 30.569 | 12.694 |
| Distributions | | | | | |
| Dividends from Net Investment Income | (1.930) | (1.637) | (1.673) | (1.439) | (1.504) |
| Distributions from Realized Capital Gains | — | — | — | — | — |
| Total Distributions | (1.930) | (1.637) | (1.673) | (1.439) | (1.504) |
| Net Asset Value, End of Period | $128.90 | $110.71 | $116.61 | $110.02 | $80.89 |
| |
| Total Return | 18.31% | -3.65% | 7.51% | 37.80% | 18.22% |
| |
| Ratios/Supplemental Data | | | | | |
| Net Assets, End of Period (Millions) | $16,153 | $11,478 | $9,833 | $8,217 | $4,691 |
| Ratio of Total Expenses to Average Net Assets | 0.06% | 0.08% | 0.09% | 0.09% | 0.10% |
| Ratio of Net Investment Income to | | | | | |
| Average Net Assets | 1.67% | 1.45% | 1.54% | 1.54% | 1.96% |
| Portfolio Turnover Rate1 | 14% | 11% | 10% | 29% | 14% |
1 Excludes the value of portfolio securities received or delivered as a result of in-kind purchases or redemptions of the fund’s capital shares,
including ETF Creation Units.
See accompanying Notes, which are an integral part of the Financial Statements.
20
Small-Cap Index Fund
Financial Highlights
| | | | | |
| Admiral Shares | | | | | |
| |
| For a Share Outstanding | Year Ended December 31, |
| Throughout Each Period | 2016 | 2015 | 2014 | 2013 | 2012 |
| Net Asset Value, Beginning of Period | $53.05 | $55.87 | $52.72 | $38.76 | $33.39 |
| Investment Operations | | | | | |
| Net Investment Income | . 910 | .797 | . 817 | . 681 | .717 |
| Net Realized and Unrealized Gain (Loss) | | | | | |
| on Investments | 8.733 | (2.833) | 3.133 | 13.968 | 5.372 |
| Total from Investment Operations | 9.643 | (2.036) | 3.950 | 14.649 | 6.089 |
| Distributions | | | | | |
| Dividends from Net Investment Income | (.923) | (.784) | (.800) | (.689) | (.719) |
| Distributions from Realized Capital Gains | — | — | — | — | — |
| Total Distributions | (.923) | (.784) | (.800) | (.689) | (.719) |
| Net Asset Value, End of Period | $61.77 | $53.05 | $55.87 | $52.72 | $38.76 |
| |
| Total Return1 | 18.30% | -3.64% | 7.50% | 37.81% | 18.24% |
| |
| Ratios/Supplemental Data | | | | | |
| Net Assets, End of Period (Millions) | $27,778 | $21,441 | $20,034 | $10,126 | $6,541 |
| Ratio of Total Expenses to Average Net Assets | 0.06% | 0.08% | 0.09% | 0.09% | 0.10% |
| Ratio of Net Investment Income to | | | | | |
| Average Net Assets | 1.67% | 1.45% | 1.54% | 1.54% | 1.96% |
| Portfolio Turnover Rate2 | 14% | 11% | 10% | 29% | 14% |
1 Total returns do not include account service fees that may have applied in the periods shown. Fund prospectuses provide information about
any applicable account service fees.
2 Excludes the value of portfolio securities received or delivered as a result of in-kind purchases or redemptions of the fund’s capital shares,
including ETF Creation Units.
See accompanying Notes, which are an integral part of the Financial Statements.
21
Small-Cap Index Fund
Financial Highlights
| | | | | |
| Institutional Shares | | | | | |
| |
| For a Share Outstanding | Year Ended December 31, |
| Throughout Each Period | 2016 | 2015 | 2014 | 2013 | 2012 |
| Net Asset Value, Beginning of Period | $53.05 | $55.87 | $52.71 | $38.76 | $33.39 |
| Investment Operations | | | | | |
| Net Investment Income | .915 | .803 | .821 | .686 | .724 |
| Net Realized and Unrealized Gain (Loss) | | | | | |
| on Investments | 8.734 | (2.834) | 3.144 | 13.957 | 5.372 |
| Total from Investment Operations | 9.649 | (2.031) | 3.965 | 14.643 | 6.096 |
| Distributions | | | | | |
| Dividends from Net Investment Income | (.929) | (.789) | (.805) | (.693) | (.726) |
| Distributions from Realized Capital Gains | — | — | — | — | — |
| Total Distributions | (.929) | (.789) | (.805) | (.693) | (.726) |
| Net Asset Value, End of Period | $61.77 | $53.05 | $55.87 | $52.71 | $38.76 |
| |
| Total Return | 18.32% | -3.63% | 7.53% | 37.80% | 18.26% |
| |
| Ratios/Supplemental Data | | | | | |
| Net Assets, End of Period (Millions) | $13,030 | $10,036 | $9,975 | $9,185 | $5,955 |
| Ratio of Total Expenses to Average Net Assets | 0.05% | 0.07% | 0.08% | 0.08% | 0.08% |
| Ratio of Net Investment Income to | | | | | |
| Average Net Assets | 1.68% | 1.46% | 1.55% | 1.55% | 1.98% |
| Portfolio Turnover Rate1 | 14% | 11% | 10% | 29% | 14% |
1 Excludes the value of portfolio securities received or delivered as a result of in-kind purchases or redemptions of the fund’s capital shares,
including ETF Creation Units.
See accompanying Notes, which are an integral part of the Financial Statements.
22
Small-Cap Index Fund
Financial Highlights
| | | | | |
| Institutional Plus Shares | | | | | |
| |
| For a Share Outstanding | Year Ended December 31, |
| Throughout Each Period | 2016 | 2015 | 2014 | 2013 | 2012 |
| Net Asset Value, Beginning of Period | $153.11 | $161.27 | $152.16 | $111.87 | $96.37 |
| Investment Operations | | | | | |
| Net Investment Income | 2.660 | 2.353 | 2.405 | 2.007 | 2.114 |
| Net Realized and Unrealized Gain (Loss) | | | | | |
| on Investments | 25.213 | (8.203) | 9.062 | 40.311 | 15.506 |
| Total from Investment Operations | 27.873 | (5.850) | 11.467 | 42.318 | 17.620 |
| Distributions | | | | | |
| Dividends from Net Investment Income | (2.703) | (2.310) | (2.357) | (2.028) | (2.120) |
| Distributions from Realized Capital Gains | — | — | — | — | — |
| Total Distributions | (2.703) | (2.310) | (2.357) | (2.028) | (2.120) |
| Net Asset Value, End of Period | $178.28 | $153.11 | $161.27 | $152.16 | $111.87 |
| |
| Total Return | 18.33% | -3.62% | 7.55% | 37.85% | 18.29% |
| |
| Ratios/Supplemental Data | | | | | |
| Net Assets, End of Period (Millions) | $8,080 | $6,925 | $6,024 | $4,323 | $2,435 |
| Ratio of Total Expenses to Average Net Assets | 0.04% | 0.05% | 0.06% | 0.06% | 0.06% |
| Ratio of Net Investment Income to | | | | | |
| Average Net Assets | 1.69% | 1.48% | 1.57% | 1.57% | 2.00% |
| Portfolio Turnover Rate1 | 14% | 11% | 10% | 29% | 14% |
| 1 Excludes the value of portfolio securities received or delivered as a result of in-kind purchases or redemptions of the fund’s capital shares, |
| including ETF Creation Units. |
See accompanying Notes, which are an integral part of the Financial Statements.
23
Small-Cap Index Fund
Notes to Financial Statements
Vanguard Small-Cap Index Fund is registered under the Investment Company Act of 1940 as an open-end investment company, or mutual fund. The fund offers five classes of shares: Investor Shares, ETF Shares, Admiral Shares, Institutional Shares, and Institutional Plus Shares. Investor Shares are available to any investor who meets the fund’s minimum purchase requirements. ETF Shares are listed for trading on NYSE Arca; they can be purchased and sold through a broker. Admiral Shares, Institutional Shares, and Institutional Plus Shares are designed for investors who meet certain administrative, service, and account-size criteria.
A. The following significant accounting policies conform to generally accepted accounting principles for U.S. investment companies. The fund consistently follows such policies in preparing its financial statements.
1. Security Valuation: Securities are valued as of the close of trading on the New York Stock Exchange (generally 4 p.m., Eastern time) on the valuation date. Equity securities are valued at the latest quoted sales prices or official closing prices taken from the primary market in which each security trades; such securities not traded on the valuation date are valued at the mean of the latest quoted bid and asked prices. Securities for which market quotations are not readily available, or whose values have been materially affected by events occurring before the fund’s pricing time but after the close of the securities’ primary markets, are valued by methods deemed by the board of trustees to represent fair value. Investments in Vanguard Market Liquidity Fund are valued at that fund’s net asset value. Temporary cash investments are valued using the latest bid prices or using valuations based on a matrix system (which considers such factors as security prices, yields, maturities, and ratings), both as furnished by independent pricing services.
2. Futures Contracts: The fund uses index futures contracts to a limited extent, with the objectives of maintaining full exposure to the stock market, enhancing returns, maintaining liquidity, and minimizing transaction costs. The fund may purchase futures contracts to immediately invest incoming cash in the market, or sell futures in response to cash outflows, thereby simulating a fully invested position in the underlying index while maintaining a cash balance for liquidity. The fund may seek to enhance returns by using futures contracts instead of the underlying securities when futures are believed to be priced more attractively than the underlying securities. The primary risks associated with the use of futures contracts are imperfect correlation between changes in market values of stocks held by the fund and the prices of futures contracts, and the possibility of an illiquid market. Counterparty risk involving futures is mitigated because a regulated clearinghouse is the counterparty instead of the clearing broker. To further mitigate counterparty risk, the fund trades futures contracts on an exchange, monitors the financial strength of its clearing brokers and clearinghouse, and has entered into clearing agreements with its clearing brokers. The clearinghouse imposes initial margin requirements to secure the fund’s performance and requires daily settlement of variation margin representing changes in the market value of each contract.
Futures contracts are valued at their quoted daily settlement prices. The aggregate settlement values of the contracts are not recorded in the Statement of Net Assets. Fluctuations in the value of the contracts are recorded in the Statement of Net Assets as an asset (liability) and in the Statement of Operations as unrealized appreciation (depreciation) until the contracts are closed, when they are recorded as realized futures gains (losses).
During the year ended December 31, 2016, the fund’s average investments in long and short futures contracts represented less than 1% and 0% of net assets, respectively, based on the average of aggregate settlement values at each quarter-end during the period.
24
Small-Cap Index Fund
3. Swap Contracts: The fund has entered into equity swap contracts to earn the total return on selected reference stocks in the fund’s target index. Under the terms of the swaps, the fund receives the total return on the referenced stock (i.e., receiving the increase or paying the decrease in value of the selected reference stock and receiving the equivalent of any dividends in respect of the selected referenced stock) over a specified period of time, applied to a notional amount that represents the value of a designated number of shares of the selected reference stock at the beginning of the equity swap contract. The fund also pays a floating rate that is based on short-term interest rates, applied to the notional amount. At the same time, the fund invests an amount approximating the notional amount of the swap in high-quality temporary cash investments.
The notional amounts of swap contracts are not recorded in the Statement of Net Assets. Swaps are valued daily based on market quotations received from independent pricing services or recognized dealers and the change in value is recorded in the Statement of Net Assets as an asset (liability) and in the Statement of Operations as unrealized appreciation (depreciation) until termination of the swap, at which time realized gain (loss) is recorded. A risk associated with all types of swaps is the possibility that a counterparty may default on its obligation to pay net amounts due to the fund. The fund’s maximum amount subject to counterparty risk is the unrealized appreciation on the swap contract. The fund mitigates its counterparty risk by entering into swaps only with a diverse group of prequalified counterparties, monitoring their financial strength, entering into master netting arrangements with its counterparties, and requiring its counterparties to transfer collateral as security for their performance. In the absence of a default, the collateral pledged or received by the fund cannot be repledged, resold or rehypothecated. In the event of a counterparty’s default (including bankruptcy), the fund may terminate any swap contracts with that counterparty, determine the net amount owed by either party in accordance with its master netting arrangements, and sell or retain any collateral held up to the net amount owed to the fund under the master netting arrangements. The swap contracts contain provisions whereby a counterparty may terminate open contracts if the fund net assets decline below a certain level, triggering a payment by the fund if the fund is in a net liability position at the time of the termination. The payment amount would be reduced by any collateral the fund has pledged. Any securities pledged as collateral for open contracts are noted in the Statement of Net Assets. The value of collateral received or pledged is compared daily to the value of the swap contracts exposure with each counterparty, and any difference, if in excess of a specified minimum transfer amount, is adjusted and settled within two business days.
During the year ended December 31, 2016, the fund’s average amounts of investments in total return swaps represented less than 1% of net assets, based on the average of notional amounts at each quarter-end during the period.
4. Federal Income Taxes: The fund intends to continue to qualify as a regulated investment company and distribute all of its taxable income. Management has analyzed the fund’s tax positions taken for all open federal income tax years (December 31, 2013–2016), and has concluded that no provision for federal income tax is required in the fund’s financial statements.
5. Distributions: Distributions to shareholders are recorded on the ex-dividend date.
6. Securities Lending: To earn additional income, the fund lends its securities to qualified institutional borrowers. Security loans are subject to termination by the fund at any time, and are required to be secured at all times by collateral in an amount at least equal to the market value of securities loaned. Daily market fluctuations could cause the value of loaned securities to be more or less than the value of the collateral received. When this occurs, the collateral is adjusted and settled on the next business day. The fund further mitigates its counterparty risk by entering into securities lending transactions
25
Small-Cap Index Fund
only with a diverse group of prequalified counterparties, monitoring their financial strength, and entering into master securities lending agreements with its counterparties. The master securities lending agreements provide that, in the event of a counterparty’s default (including bankruptcy), the fund may terminate any loans with that borrower, determine the net amount owed, and sell or retain the collateral up to the net amount owed to the fund; however, such actions may be subject to legal proceedings. While collateral mitigates counterparty risk, in the absence of a default the fund may experience delays and costs in recovering the securities loaned. The fund invests cash collateral received in Vanguard Market Liquidity Fund, and records a liability in the Statement of Net Assets for the return of the collateral, during the period the securities are on loan. Securities lending income represents fees charged to borrowers plus income earned on invested cash collateral, less expenses associated with the loan. During the term of the loan, the fund is entitled to all distributions made on or in respect of the loaned securities.
7. Credit Facility: The fund and certain other funds managed by The Vanguard Group (“Vanguard”) participate in a $3.1 billion committed credit facility provided by a syndicate of lenders pursuant to a credit agreement that may be renewed annually; each fund is individually liable for its borrowings, if any, under the credit facility. Borrowings may be utilized for temporary and emergency purposes, and are subject to the fund’s regulatory and contractual borrowing restrictions. The participating funds are charged administrative fees and an annual commitment fee of 0.10% of the undrawn amount of the facility; these fees are allocated to the funds based on a method approved by the fund’s board of trustees and included in Management and Administrative expenses on the fund’s Statement of Operations. Any borrowings under this facility bear interest at a rate based upon the higher of the one-month London Interbank Offered Rate, federal funds effective rate, or overnight bank funding rate plus an agreed-upon spread.
The fund had no borrowings outstanding at December 31, 2016, or at any time during the period then ended.
8. Other: Dividend income is recorded on the ex-dividend date. Interest income includes income distributions received from Vanguard Market Liquidity Fund and is accrued daily. Premiums and discounts on debt securities purchased are amortized and accreted, respectively, to interest income over the lives of the respective securities. Security transactions are accounted for on the date securities are bought or sold. Costs used to determine realized gains (losses) on the sale of investment securities are those of the specific securities sold.
Each class of shares has equal rights as to assets and earnings, except that each class separately bears certain class-specific expenses related to maintenance of shareholder accounts (included in Management and Administrative expenses) and shareholder reporting. Marketing and distribution expenses are allocated to each class of shares based on a method approved by the board of trustees. Income, other non-class-specific expenses, and gains and losses on investments are allocated to each class of shares based on its relative net assets.
B. In accordance with the terms of a Funds’ Service Agreement (the “FSA”) between Vanguard and the fund, Vanguard furnishes to the fund investment advisory, corporate management, administrative, marketing, and distribution services at Vanguard’s cost of operations (as defined by the FSA). These costs of operations are allocated to the fund based on methods and guidelines approved by the board of trustees. Vanguard does not require reimbursement in the current period for certain costs of operations (such as deferred compensation/benefits and risk/insurance costs); the fund’s liability for these costs of operations is included in Payables to Vanguard on the Statement of Net Assets.
26
Small-Cap Index Fund
Upon the request of Vanguard, the fund may invest up to 0.40% of its net assets as capital in Vanguard. At December 31, 2016, the fund had contributed to Vanguard capital in the amount of $5,075,000, representing 0.01% of the fund’s net assets and 2.03% of Vanguard’s capitalization. The fund’s trustees and officers are also directors and employees, respectively, of Vanguard.
C. Various inputs may be used to determine the value of the fund’s investments. These inputs are summarized in three broad levels for financial statement purposes. The inputs or methodologies used to value securities are not necessarily an indication of the risk associated with investing in those securities.
Level 1—Quoted prices in active markets for identical securities.
Level 2—Other significant observable inputs (including quoted prices for similar securities, interest rates, prepayment speeds, credit risk, etc.).
Level 3—Significant unobservable inputs (including the fund’s own assumptions used to determine the fair value of investments).
The following table summarizes the market value of the fund’s investments as of December 31, 2016, based on the inputs used to value them:
| | | |
| | Level 1 | Level 2 | Level 3 |
| Investments | ($000) | ($000) | ($000) |
| Common Stocks | 69,163,525 | — | 5,630 |
| Temporary Cash Investments | 1,094,637 | 17,766 | — |
| Futures Contracts—Liabilities1 | (1,574) | — | — |
| Swap Contracts—Assets | — | 801 | — |
| Swap Contracts—Liabilities | — | (1,322) | — |
| Total | 70,256,588 | 17,245 | 5,630 |
| 1 Represents variation margin on the last day of the reporting period. |
D. At December 31, 2016, the aggregate settlement value of open futures contracts and the related unrealized appreciation (depreciation) were:
| | | | |
| | | | ($000) |
| | | | Aggregate | |
| | | Number of | Settlement | Unrealized |
| | | Long (Short) | Value | Appreciation |
| Futures Contracts | Expiration | Contracts | Long (Short) | (Depreciation) |
| E-mini Russell 2000 Index | March 2017 | 2,108 | 143,017 | (2,699) |
| E-mini S&P Mid-Cap 400 Index | March 2017 | 856 | 142,019 | (2,482) |
| | | | | (5,181) |
Unrealized appreciation (depreciation) on open futures contracts is required to be treated as realized gain (loss) for tax purposes.
27
Small-Cap Index Fund
At December 31, 2016, the fund had the following open total return swap contracts:
| | | | | |
| | | | | Floating | Unrealized |
| | | | Notional | Interest Rate | Appreciation |
| | Termination | | Amount | Received | (Depreciation) |
| Reference Entity | Date | Counterparty | ($000) | (Paid) | ($000) |
| Ambac Financial Group Inc. | 1/6/17 | GSCM | 11,012 | (1.054%) | (1,322) |
| SLM Corp. | 2/21/17 | GSI | 33,089 | (1.149%) | 801 |
| | | | | | (521) |
| GSCM—Goldman Sachs Capital Management. |
| GSI—Goldman Sachs International. |
At December 31, 2016, the counterparty had deposited in segregated accounts securities with a value of $576,000 in connection with amounts due to the fund for open swap contracts.
E. Distributions are determined on a tax basis and may differ from net investment income and realized capital gains for financial reporting purposes. Differences may be permanent or temporary. Permanent differences are reclassified among capital accounts in the financial statements to reflect their tax character. Temporary differences arise when certain items of income, expense, gain, or loss are recognized in different periods for financial statement and tax purposes. These differences will reverse at some time in the future. Differences in classification may also result from the treatment of short-term gains as ordinary income for tax purposes.
During the year ended December 31, 2016, the fund realized $1,372,134,000 of net capital gains resulting from in-kind redemptions—in which shareholders exchanged fund shares for securities held by the fund rather than for cash. Because such gains are not taxable to the fund, and are not distributed to shareholders, they have been reclassified from accumulated net realized losses to paid-in capital.
Realized and unrealized gains (losses) on certain of the fund’s swap contracts are treated as ordinary income (loss) for tax purposes. Realized gains of $23,815,000 on swap contracts have been reclassified from accumulated net realized losses to overdistributed net investment income.
For tax purposes, at December 31, 2016, the fund had $17,043,000 of ordinary income available for distribution. At December 31, 2016, the fund had available capital losses totaling $2,454,536,000 to offset future net capital gains. Of this amount, $946,157,000 is subject to expiration dates; $342,008,000 may be used to offset future net capital gains through December 31, 2017, and $604,149,000 through December 31, 2018. Capital losses of $1,508,379,000 realized beginning in fiscal 2011 may be carried forward indefinitely under the Regulated Investment Company Modernization Act of 2010, but must be used before any expiring loss carryforwards.
At December 31, 2016, the cost of investment securities for tax purposes was $54,487,647,000. Net unrealized appreciation of investment securities for tax purposes was $15,793,911,000, consisting of unrealized gains of $19,284,318,000 on securities that had risen in value since their purchase and $3,490,407,000 in unrealized losses on securities that had fallen in value since their purchase.
F. During the year ended December 31, 2016, the fund purchased $17,786,079,000 of investment securities and sold $11,420,569,000 of investment securities, other than temporary cash investments. Purchases and sales include $5,563,402,000 and $3,032,246,000, respectively, in connection with in-kind purchases and redemptions of the fund’s capital shares.
28
Small-Cap Index Fund
G. Capital share transactions for each class of shares were:
| | | | |
| | Year Ended December 31, |
| | 2016 | 2015 |
| | Amount | Shares | Amount | Shares |
| | ($000) | (000) | ($000) | (000) |
| Investor Shares | | | | |
| Issued | 654,942 | 11,797 | 789,795 | 13,998 |
| Issued in Lieu of Cash Distributions | 59,371 | 1,025 | 52,866 | 995 |
| Redeemed | (1,002,324) | (18,063) | (1,186,778) | (20,951) |
| Net Increase (Decrease)—Investor Shares | (288,011) | (5,241) | (344,117) | (5,958) |
| ETF Shares | | | | |
| Issued | 5,724,040 | 48,032 | 8,612,974 | 73,729 |
| Issued in Lieu of Cash Distributions | — | — | — | — |
| Redeemed | (3,111,751) | (26,400) | (6,347,608) | (54,375) |
| Net Increase (Decrease) —ETF Shares | 2,612,289 | 21,632 | 2,265,366 | 19,354 |
| Admiral Shares | | | | |
| Issued | 5,993,757 | 107,648 | 5,433,397 | 96,234 |
| Issued in Lieu of Cash Distributions | 360,518 | 6,212 | 280,050 | 5,270 |
| Redeemed | (3,785,953) | (68,327) | (3,141,489) | (55,875) |
| Net Increase (Decrease)—Admiral Shares | 2,568,322 | 45,533 | 2,571,958 | 45,629 |
| Institutional Shares | | | | |
| Issued | 2,898,327 | 51,533 | 2,887,916 | 51,179 |
| Issued in Lieu of Cash Distributions | 180,076 | 3,099 | 139,432 | 2,624 |
| Redeemed | (1,846,349) | (32,869) | (2,422,081) | (43,144) |
| Net Increase (Decrease) —Institutional Shares | 1,232,054 | 21,763 | 605,267 | 10,659 |
| Institutional Plus Shares | | | | |
| Issued | 720,960 | 4,425 | 2,240,610 | 13,600 |
| Issued in Lieu of Cash Distributions | 117,213 | 701 | 97,241 | 634 |
| Redeemed | (785,548) | (5,029) | (1,032,375) | (6,361) |
| Net Increase (Decrease)—Institutional Plus Shares | 52,625 | 97 | 1,305,476 | 7,873 |
H. Management has determined that no material events or transactions occurred subsequent to December 31, 2016, that would require recognition or disclosure in these financial statements.
29
Small-Cap Growth Index Fund
Fund Profile
As of December 31, 2016
| | | | |
| Share-Class Characteristics | | | | |
| | Investor | | Admiral | Institutional |
| | Shares | ETF Shares | Shares | Shares |
| Ticker Symbol | VISGX | VBK | VSGAX | VSGIX |
| Expense Ratio1 | 0.20% | 0.08% | 0.08% | 0.07% |
| 30-Day SEC Yield | 0.84% | 0.95% | 0.95% | 0.96% |
| | | |
| Portfolio Characteristics | | |
| | | | DJ |
| | | CRSP US | U.S. |
| | | Small Cap | Total |
| | | Growth | Market |
| | Fund | Index FA | Index |
| Number of Stocks | 679 | 674 | 3,833 |
| Median Market Cap | $3.6B | $3.6B | $54.1B |
| Price/Earnings Ratio | 47.7x | 47.7x | 24.4x |
| Price/Book Ratio | 3.4x | 3.4x | 2.8x |
| Return on Equity | 11.6% | 11.6% | 16.5% |
| Earnings Growth | | | |
| Rate | 14.4% | 14.4% | 8.2% |
| Dividend Yield | 1.0% | 1.0% | 2.0% |
| Foreign Holdings | 0.0% | 0.0% | 0.0% |
| Turnover Rate | 27% | — | — |
| Short-Term | | | |
| Reserves | 0.2% | — | — |
| | | |
| Sector Diversification (% of equity exposure) |
| | | CRSP US | DJ |
| | | Small Cap U.S. | Total |
| | | Growth | Market |
| | Fund | Index FA | Index |
| Basic Materials | 2.5% | 2.5% | 2.6% |
| Consumer Goods | 7.7 | 7.7 | 9.6 |
| Consumer Services | 14.3 | 14.3 | 13.1 |
| Financials | 22.2 | 22.2 | 20.8 |
| Health Care | 13.1 | 13.1 | 12.2 |
| Industrials | 18.9 | 18.9 | 12.9 |
| Oil & Gas | 4.8 | 4.8 | 6.9 |
| Technology | 15.8 | 15.8 | 16.4 |
| Telecommunications | 0.3 | 0.3 | 2.4 |
| Utilities | 0.4 | 0.4 | 3.1 |
| | |
| Volatility Measures | | |
| | | DJ |
| | CRSP US | U.S. Total |
| | Small Cap | Market |
| | Growth Index | FA Index |
| R-Squared | 1.00 | 0.78 |
| Beta | 1.00 | 1.14 |
| These measures show the degree and timing of the fund’s |
| fluctuations compared with the indexes over 36 months. |
| | |
| Ten Largest Holdings (% of total net assets) |
| Diamondback Energy | Exploration & | |
| Inc. | Production | 0.7% |
| SVB Financial Group | Banks | 0.7 |
| HD Supply Holdings Inc. | Industrial Suppliers | 0.6 |
| Newfield Exploration Co. Exploration & | |
| | Production | 0.6 |
| Signature Bank | Banks | 0.6 |
| Domino's Pizza Inc. | Restaurants & Bars | 0.6 |
| Middleby Corp. | Durable Household | |
| | Products | 0.5 |
| Cadence Design | | |
| Systems Inc. | Software | 0.5 |
| Regency Centers Corp. | Retail REITs | 0.5 |
| AO Smith Corp. | Building Materials & | |
| | Fixtures | 0.5 |
| Top Ten | | 5.8% |
| The holdings listed exclude any temporary cash investments and equity index products. |
1 The expense ratios shown are from the prospectus dated April 27, 2016, and represent estimated costs for the current fiscal year. For the fiscal
year ended December 31, 2016, the expense ratios were 0.19% for Investor Shares, 0.07% for ETF Shares, 0.07% for Admiral Shares, and 0.06% for
Institutional Shares.
30
Small-Cap Growth Index Fund
Investment Focus
31
Small-Cap Growth Index Fund
Performance Summary
All of the returns in this report represent past performance, which is not a guarantee of future results that may be achieved by the fund. (Current performance may be lower or higher than the performance data cited. For performance data current to the most recent month-end, visit our website at vanguard.com/performance.) Note, too, that both investment returns and principal value can fluctuate widely, so an investor’s shares, when sold, could be worth more or less than their original cost. The returns shown do not reflect taxes that a shareholder would pay on fund distributions or on the sale of fund shares.
Cumulative Performance: December 31, 2006, Through December 31, 2016
Initial Investment of $10,000
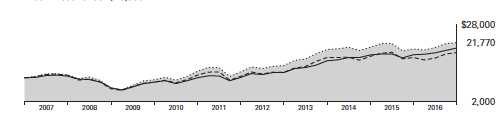
| | | | | |
| | | Average Annual Total Returns | |
| | | Periods Ended December 31, 2016 | |
| | | | | | Final Value |
| | | One | Five | Ten | of a $10,000 |
| | | Year | Years | Years | Investment |
| | Small-Cap Growth Index | | | | |
| | Fund*Investor Shares | 10.61% | 12.65% | 8.09% | $21,770 |
| • • • • • • •• | Spliced Small-Cap Growth Index | 10.62 | 12.68 | 8.11 | 21,812 |
| – – – – | Small-Cap Growth Funds Average | 9.75 | 12.02 | 6.32 | 18,462 |
| | Dow Jones U.S. Total Stock Market | | | | |
| | Float Adjusted Index | 12.62 | 14.59 | 7.18 | 20,003 |
| For a benchmark description, see the Glossary. |
| Small-Cap Growth Funds Average: Derived from data provided by Lipper, a Thomson Reuters Company. |
| | | | |
| | | | | Final Value |
| | One | Five | Ten | of a $10,000 |
| | Year | Years | Years | Investment |
| Small-Cap Growth Index Fund | | | | |
| ETF Shares Net Asset Value | 10.74% | 12.80% | 8.23% | $22,059 |
| Spliced Small-Cap Growth Index | 10.62 | 12.68 | 8.11 | 21,812 |
| Dow Jones U.S. Total Stock Market Float | | | | |
| Adjusted Index | 12.62 | 14.59 | 7.18 | 20,003 |
See Financial Highlights for dividend and capital gains information.
32
Small-Cap Growth Index Fund
| | | | |
| | Average Annual Total Returns | |
| | Periods Ended December 31, 2016 | |
| | | | Since | Final Value |
| | One | Five | Inception | of a $10,000 |
| | Year | Years | (9/27/2011) | Investment |
| Small-Cap Growth Index Fund Admiral Shares | 10.73% | 12.80% | 13.77% | $19,716 |
| Spliced Small-Cap Growth Index | 10.62 | 12.68 | 13.66 | 19,609 |
| Dow Jones U.S. Total Stock Market Float | | | | |
| Adjusted Index | 12.62 | 14.59 | 15.42 | 21,267 |
| "Since Inception" performance is calculated from the Admiral Shares’ inception date for both the fund and its comparative standards. |
| | | | |
| | | | | Final Value |
| | One | Five | Ten | of a $5,000,000 |
| | Year | Years | Years | Investment |
| Small-Cap Growth Index Fund Institutional | | | | |
| Shares | 10.74% | 12.80% | 8.26% | $11,056,087 |
| |
| Spliced Small-Cap Growth Index | 10.62 | 12.68 | 8.11 | 10,906,194 |
| Dow Jones U.S. Total Stock Market Float | | | | |
| Adjusted Index | 12.62 | 14.59 | 7.18 | 10,001,613 |
| | | |
| Cumulative Returns of ETF Shares: December 31, 2006, Through December 31, 2016 | |
| | One | Five | Ten |
| | Year | Years | Years |
| Small-Cap Growth Index Fund ETF Shares Market | | | |
| Price | 10.79% | 82.59% | 120.66% |
| Small-Cap Growth Index Fund ETF Shares Net | | | |
| Asset Value | 10.74 | 82.60 | 120.59 |
| Spliced Small-Cap Growth Index | 10.62 | 81.67 | 118.12 |
Fiscal-Year Total Returns (%): December 31, 2006, Through December 31, 2016

For a benchmark description, see the Glossary.
33
Small-Cap Growth Index Fund
Financial Statements
Statement of Net Assets—Investments Summary
As of December 31, 2016
This Statement summarizes the fund’s holdings by asset type. Details are reported for each of the fund’s 50 largest individual holdings and for investments that, in total for any issuer, represent more than 1% of the fund’s net assets. The total value of smaller holdings is reported as a single amount within each category.
The fund reports a complete list of its holdings in regulatory filings four times in each fiscal year, at the quarter-ends. For the second and fourth fiscal quarters, the complete listing of the fund’s holdings is available electronically on vanguard.com and on the Securities and Exchange Commission’s website (sec.gov), or you can have it mailed to you without charge by calling 800-662-7447. For the first and third fiscal quarters, the fund files the lists with the SEC on Form N-Q. Shareholders can look up the fund’s Forms N-Q on the SEC’s website. Forms N-Q may also be reviewed and copied at the SEC’s Public Reference Room (see the back cover of this report for further information).
| | | |
| | | Market | Percentage |
| | | Value• | of Net |
| | Shares | ($000) | Assets |
| Common Stocks | | | |
| Basic Materials † | | 426,686 | 2.5% |
| |
| Consumer Goods | | | |
| * Middleby Corp. | 715,816 | 92,204 | 0.5% |
| Gentex Corp. | 3,564,128 | 70,178 | 0.4% |
| * Post Holdings Inc. | 766,638 | 61,630 | 0.4% |
| Brunswick Corp. | 1,115,654 | 60,848 | 0.4% |
| Consumer Goods—Other † | | 1,008,756 | 6.0% |
| | | 1,293,616 | 7.7% |
| Consumer Services | | | |
| Domino’s Pizza Inc. | 598,103 | 95,242 | 0.6% |
| * Burlington Stores Inc. | 878,184 | 74,426 | 0.4% |
| Vail Resorts Inc. | 451,394 | 72,814 | 0.4% |
| * Copart Inc. | 1,210,822 | 67,092 | 0.4% |
| * VCA Inc. | 958,856 | 65,825 | 0.4% |
| Sabre Corp. | 2,440,107 | 60,881 | 0.4% |
| Dunkin’ Brands Group Inc. | 1,141,067 | 59,838 | 0.4% |
| Consumer Services—Other † | | 1,898,626 | 11.3% |
| | | 2,394,744 | 14.3% |
| Financials | | | |
| * SVB Financial Group | 647,935 | 111,225 | 0.7% |
| * Signature Bank | 645,424 | 96,943 | 0.6% |
| Regency Centers Corp. | 1,299,953 | 89,632 | 0.5% |
| Kilroy Realty Corp. | 1,147,806 | 84,042 | 0.5% |
| American Campus Communities Inc. | 1,643,335 | 81,789 | 0.5% |
| WP Carey Inc. | 1,322,139 | 78,125 | 0.5% |
| Bank of the Ozarks Inc. | 1,431,695 | 75,293 | 0.4% |
| CBOE Holdings Inc. | 1,011,182 | 74,716 | 0.4% |
| Gaming and Leisure Properties Inc. | 2,413,887 | 73,913 | 0.4% |
| Lamar Advertising Co. Class A | 1,028,933 | 69,185 | 0.4% |
| Equity LifeStyle Properties Inc. | 955,021 | 68,857 | 0.4% |
34
| | | | |
| Small-Cap Growth Index Fund | | | |
| |
| |
| |
| | | | Market | Percentage |
| | | | Value• | of Net |
| | | Shares | ($000) | Assets |
| | Douglas Emmett Inc. | 1,790,492 | 65,460 | 0.4% |
| | Spirit Realty Capital Inc. | 6,015,371 | 65,327 | 0.4% |
| | MarketAxess Holdings Inc. | 444,045 | 65,239 | 0.4% |
| | Sun Communities Inc. | 817,554 | 62,633 | 0.4% |
| | CubeSmart | 2,239,495 | 59,951 | 0.4% |
| | Financials—Other † | | 2,500,200 | 14.9% |
| | | | 3,722,530 | 22.2% |
| Health Care | | | |
| * | Align Technology Inc. | 892,143 | 85,762 | 0.5% |
| * | MEDNAX Inc. | 1,164,869 | 77,650 | 0.5% |
| | West Pharmaceutical Services Inc. | 910,382 | 77,228 | 0.4% |
| *,^ | Ionis Pharmaceuticals Inc. | 1,507,711 | 72,114 | 0.4% |
| * | DexCom Inc. | 1,051,451 | 62,772 | 0.4% |
| | Health Care—Other † | | 1,826,902 | 10.9% |
| | | | 2,202,428 | 13.1% |
| Industrials | | | |
| * | HD Supply Holdings Inc. | 2,495,741 | 106,094 | 0.6% |
| | AO Smith Corp. | 1,837,471 | 87,004 | 0.5% |
| | Jack Henry & Associates Inc. | 971,632 | 86,261 | 0.5% |
| | Lennox International Inc. | 508,661 | 77,912 | 0.5% |
| * | CoStar Group Inc. | 405,369 | 76,408 | 0.5% |
| * | Old Dominion Freight Line Inc. | 871,648 | 74,779 | 0.5% |
| * | Berry Plastics Group Inc. | 1,512,717 | 73,715 | 0.4% |
| | Toro Co. | 1,291,832 | 72,278 | 0.4% |
| | Nordson Corp. | 604,712 | 67,758 | 0.4% |
| | Cognex Corp. | 1,013,634 | 64,487 | 0.4% |
| | Industrials—Other † | | 2,383,281 | 14.2% |
| | | | 3,169,977 | 18.9% |
| Oil & Gas | | | |
| * | Diamondback Energy Inc. | 1,101,821 | 111,350 | 0.7% |
| * | Newfield Exploration Co. | 2,474,237 | 100,207 | 0.6% |
| * | Parsley Energy Inc. Class A | 2,010,705 | 70,857 | 0.4% |
| * | Southwestern Energy Co. | 6,163,309 | 66,687 | 0.4% |
| | Oil & Gas—Other † | | 462,806 | 2.7% |
| | | | 811,907 | 4.8% |
| |
| 1Other † | | 1,996 | 0.0% |
| |
| Technology | | | |
| * | Cadence Design Systems Inc. | 3,566,917 | 89,958 | 0.5% |
| * | PTC Inc. | 1,438,088 | 66,540 | 0.4% |
| * | Ultimate Software Group Inc. | 342,715 | 62,494 | 0.4% |
| | SS&C Technologies Holdings Inc. | 2,144,417 | 61,330 | 0.3% |
| | Technology—Other † | | 2,365,562 | 14.1% |
| | | | 2,645,884 | 15.7% |
| |
| Telecommunications † | | 42,793 | 0.3% |
| |
| Utilities † | | 58,162 | 0.3% |
| Total Common Stocks (Cost $13,465,023) | | 16,770,723 | 99.8%2 |
35
Small-Cap Growth Index Fund
| | | | |
| | | | Market | Percentage |
| | | | Value• | of Net |
| | Coupon | Shares | ($000) | Assets |
| Temporary Cash Investments | | | | |
| Money Market Fund | | | | |
| 3,4 Vanguard Market Liquidity Fund | 0.823% | 3,084,955 | 308,527 | 1.9% |
| |
| | | Face | | |
| | Maturity | Amount | | |
| | Date | ($000) | | |
| U.S. Government and Agency Obligations | | | |
| 5 United States Treasury Bill 0.287%–0.574% | 1/5/17–5/11/17 | 4,600 | 4,593 | 0.0% |
| Total Temporary Cash Investments (Cost $313,099) | | 313,120 | 1.9%2 |
| Total Investments (Cost $13,778,122) | | 17,083,843 | 101.7% |
| | |
| | Amount | |
| | ($000) | |
| Other Assets and Liabilities | | |
| Other Assets | | |
| Investment in Vanguard | 1,248 | |
| Receivables for Investment Securities Sold | 24,583 | |
| Receivables for Accrued Income | 20,622 | |
| Receivables for Capital Shares Issued | 19,478 | |
| Other Assets | 789 | |
| Total Other Assets | 66,720 | 0.4% |
| Liabilities | | |
| Payables for Investment Securities Purchased | (25,999) | |
| Collateral for Securities on Loan | (253,746) | |
| Payables for Capital Shares Redeemed | (65,753) | |
| Payables to Vanguard | (10,673) | |
| Other Liabilities | (288) | |
| Total Liabilities | (356,459) | (2.1%) |
| Net Assets | 16,794,104 | 100.0% |
| |
| At December 31, 2016, net assets consisted of: | |
| | Amount |
| | ($000) |
| Paid-in Capital | 14,958,571 |
| Overdistributed Net Investment Income | (7,786) |
| Accumulated Net Realized Losses | (1,462,188) |
| Unrealized Appreciation (Depreciation) | |
| Investment Securities | 3,305,721 |
| Futures Contracts | (214) |
| Net Assets | 16,794,104 |
| |
| |
| Investor Shares—Net Assets | |
| Applicable to 49,416,961 outstanding $.001 par value shares of | |
| beneficial interest (unlimited authorization) | 1,849,775 |
| Net Asset Value Per Share—Investor Shares | $37.43 |
36
| |
| Small-Cap Growth Index Fund | |
| |
| |
| |
| | Amount |
| | ($000) |
| ETF Shares—Net Assets | |
| Applicable to 40,036,602 outstanding $.001 par value shares of | |
| beneficial interest (unlimited authorization) | 5,327,546 |
| Net Asset Value Per Share—ETF Shares | $133.07 |
| |
| Admiral Shares—Net Assets | |
| Applicable to 142,079,830 outstanding $.001 par value shares of | |
| beneficial interest (unlimited authorization) | 6,648,043 |
| Net Asset Value Per Share—Admiral Shares | $46.79 |
| |
| Institutional Shares—Net Assets | |
| Applicable to 79,223,770 outstanding $.001 par value shares of | |
| beneficial interest (unlimited authorization) | 2,968,740 |
| Net Asset Value Per Share—Institutional Shares | $37.47 |
• See Note A in Notes to Financial Statements.
* Non-income-producing security.
^ Includes partial security positions on loan to broker-dealers. The total value of securities on loan is $237,110,000.
† Represents the aggregate value, by category, of securities that are not among the 50 largest holdings and, in total for any issuer, represent
1% or less of net assets.
1 “Other” represents securities that are not classified by the fund’s benchmark index.
2 The fund invests a portion of its cash reserves in equity markets through the use of index futures contracts. After giving effect to futures
investments, the fund’s effective common stock and temporary cash investment positions represent 100.0% and 1.7%, respectively, of
net assets.
3 Affiliated money market fund available only to Vanguard funds and certain trusts and accounts managed by Vanguard. Rate shown is the
7-day yield.
4 Includes $253,746,000 of collateral received for securities on loan.
5 Securities with a value of $2,338,000 have been segregated as initial margin for open futures contracts.
See accompanying Notes, which are an integral part of the Financial Statements.
37
Small-Cap Growth Index Fund
Statement of Operations
| |
| | Year Ended |
| | December 31, 2016 |
| | ($000) |
| Investment Income | |
| Income | |
| Dividends | 166,028 |
| Interest1 | 192 |
| Securities Lending—Net | 20,574 |
| Total Income | 186,794 |
| Expenses | |
| The Vanguard Group—Note B | |
| Investment Advisory Services | 2,029 |
| Management and Administrative—Investor Shares | 2,714 |
| Management and Administrative—ETF Shares | 2,028 |
| Management and Administrative—Admiral Shares | 2,582 |
| Management and Administrative—Institutional Shares | 1,149 |
| Marketing and Distribution—Investor Shares | 424 |
| Marketing and Distribution—ETF Shares | 274 |
| Marketing and Distribution—Admiral Shares | 657 |
| Marketing and Distribution—Institutional Shares | 69 |
| Custodian Fees | 317 |
| Auditing Fees | 43 |
| Shareholders’ Reports—Investor Shares | 41 |
| Shareholders’ Reports—ETF Shares | 169 |
| Shareholders’ Reports—Admiral Shares | 59 |
| Shareholders’ Reports—Institutional Shares | 48 |
| Trustees’ Fees and Expenses | 13 |
| Total Expenses | 12,616 |
| Net Investment Income | 174,178 |
| Realized Net Gain (Loss) | |
| Investment Securities Sold1 | 228,232 |
| Futures Contracts | 5,461 |
| Realized Net Gain (Loss) | 233,693 |
| Change in Unrealized Appreciation (Depreciation) | |
| Investment Securities | 1,142,712 |
| Futures Contracts | (890) |
| Change in Unrealized Appreciation (Depreciation) | 1,141,822 |
| Net Increase (Decrease) in Net Assets Resulting from Operations | 1,549,693 |
1 Interest income and realized net gain (loss) from an affiliated company of the fund were $181,000 and $8,000, respectively.
See accompanying Notes, which are an integral part of the Financial Statements.
38
Small-Cap Growth Index Fund
Statement of Changes in Net Assets
| | |
| | Year Ended December 31, |
| | 2016 | 2015 |
| | ($000) | ($000) |
| Increase (Decrease) in Net Assets | | |
| Operations | | |
| Net Investment Income | 174,178 | 151,158 |
| Realized Net Gain (Loss) | 233,693 | 1,020,447 |
| Change in Unrealized Appreciation (Depreciation) | 1,141,822 | (1,652,697) |
| Net Increase (Decrease) in Net Assets Resulting from Operations | 1,549,693 | (481,092) |
| Distributions | | |
| Net Investment Income | | |
| Investor Shares | (18,600) | (17,081) |
| ETF Shares | (54,924) | (42,821) |
| Admiral Shares | (70,685) | (56,786) |
| Institutional Shares | (33,048) | (31,997) |
| Realized Capital Gain | | |
| Investor Shares | — | — |
| ETF Shares | — | — |
| Admiral Shares | — | — |
| Institutional Shares | — | — |
| Total Distributions | (177,257) | (148,685) |
| Capital Share Transactions | | |
| Investor Shares | (296,130) | (276,043) |
| ETF Shares | 515,234 | 689,690 |
| Admiral Shares | 153,535 | 738,083 |
| Institutional Shares | (85,285) | (732,337) |
| Net Increase (Decrease) from Capital Share Transactions | 287,354 | 419,393 |
| Total Increase (Decrease) | 1,659,790 | (210,384) |
| Net Assets | | |
| Beginning of Period | 15,134,314 | 15,344,698 |
| End of Period1 | 16,794,104 | 15,134,314 |
| 1 Net Assets—End of Period includes undistributed (overdistributed) net investment income of ($7,786,000) and ($4,790,000). |
See accompanying Notes, which are an integral part of the Financial Statements.
39
Small-Cap Growth Index Fund
Financial Highlights
| | | | | |
| Investor Shares | | | | | |
| |
| For a Share Outstanding | Year Ended December 31, |
| Throughout Each Period | 2016 | 2015 | 2014 | 2013 | 2012 |
| Net Asset Value, Beginning of Period | $34.18 | $35.40 | $34.37 | $25.03 | $21.49 |
| Investment Operations | | | | | |
| Net Investment Income | .355 | .292 | .303 | .168 | .223 |
| Net Realized and Unrealized Gain (Loss) | | | | | |
| on Investments | 3.257 | (1.225) | 1.029 | 9.336 | 3.541 |
| Total from Investment Operations | 3.612 | (.933) | 1.332 | 9.504 | 3.764 |
| Distributions | | | | | |
| Dividends from Net Investment Income | (.362) | (.287) | (.302) | (.164) | (.224) |
| Distributions from Realized Capital Gains | — | — | — | — | — |
| Total Distributions | (.362) | (.287) | (.302) | (.164) | (.224) |
| Net Asset Value, End of Period | $37.43 | $34.18 | $35.40 | $34.37 | $25.03 |
| |
| Total Return1 | 10.61% | -2.64% | 3.88% | 37.98% | 17.52% |
| |
| Ratios/Supplemental Data | | | | | |
| Net Assets, End of Period (Millions) | $1,850 | $1,986 | $2,326 | $2,859 | $2,649 |
| Ratio of Total Expenses to Average Net Assets | 0.19% | 0.20% | 0.23% | 0.24% | 0.24% |
| Ratio of Net Investment Income to | | | | | |
| Average Net Assets | 1.03% | 0.82% | 0.87% | 0.63% | 0.97% |
| Portfolio Turnover Rate2 | 27% | 23% | 26% | 50% | 37% |
1 Total returns do not include account service fees that may have applied in the periods shown. Fund prospectuses provide information about
any applicable account service fees.
2 Excludes the value of portfolio securities received or delivered as a result of in-kind purchases or redemptions of the fund’s capital shares,
including ETF Creation Units.
See accompanying Notes, which are an integral part of the Financial Statements.
40
Small-Cap Growth Index Fund
Financial Highlights
| | | | | |
| ETF Shares | | | | | |
| |
| For a Share Outstanding | Year Ended December 31, |
| Throughout Each Period | 2016 | 2015 | 2014 | 2013 | 2012 |
| Net Asset Value, Beginning of Period | $121.53 | $125.88 | $122.23 | $89.03 | $76.45 |
| Investment Operations | | | | | |
| Net Investment Income | 1.416 | 1.202 | 1.277 | .802 | .925 |
| Net Realized and Unrealized Gain (Loss) | | | | | |
| on Investments | 11.563 | (4.362) | 3.643 | 33.188 | 12.578 |
| Total from Investment Operations | 12.979 | (3.160) | 4.920 | 33.990 | 13.503 |
| Distributions | | | | | |
| Dividends from Net Investment Income | (1.439) | (1.190) | (1.270) | (.790) | (.923) |
| Distributions from Realized Capital Gains | — | — | — | — | — |
| Total Distributions | (1.439) | (1.190) | (1.270) | (.790) | (.923) |
| Net Asset Value, End of Period | $133.07 | $121.53 | $125.88 | $122.23 | $89.03 |
| |
| Total Return | 10.74% | -2.51% | 4.02% | 38.18% | 17.67% |
| |
| Ratios/Supplemental Data | | | | | |
| Net Assets, End of Period (Millions) | $5,328 | $4,422 | $3,900 | $3,637 | $2,209 |
| Ratio of Total Expenses to Average Net Assets | 0.07% | 0.08% | 0.09% | 0.09% | 0.10% |
| Ratio of Net Investment Income to | | | | | |
| Average Net Assets | 1.15% | 0.94% | 1.01% | 0.78% | 1.11% |
| Portfolio Turnover Rate1 | 27% | 23% | 26% | 50% | 37% |
| 1 Excludes the value of portfolio securities received or delivered as a result of in-kind purchases or redemptions of the fund’s capital shares, |
| including ETF Creation Units. |
See accompanying Notes, which are an integral part of the Financial Statements.
41
Small-Cap Growth Index Fund
Financial Highlights
| | | | | |
| Admiral Shares | | | | | |
| |
| For a Share Outstanding | Year Ended December 31, |
| Throughout Each Period | 2016 | 2015 | 2014 | 2013 | 2012 |
| Net Asset Value, Beginning of Period | $42.73 | $44.26 | $42.98 | $31.30 | $26.88 |
| Investment Operations | | | | | |
| Net Investment Income | .496 | .421 | .449 | .284 | .326 |
| Net Realized and Unrealized Gain (Loss) | | | | | |
| on Investments | 4.069 | (1.534) | 1.277 | 11.676 | 4.420 |
| Total from Investment Operations | 4.565 | (1.113) | 1.726 | 11.960 | 4.746 |
| Distributions | | | | | |
| Dividends from Net Investment Income | (.505) | (.417) | (.446) | (.280) | (.326) |
| Distributions from Realized Capital Gains | — | — | — | — | — |
| Total Distributions | (.505) | (.417) | (.446) | (.280) | (.326) |
| Net Asset Value, End of Period | $46.79 | $42.73 | $44.26 | $42.98 | $31.30 |
| |
| Total Return1 | 10.73% | -2.52% | 4.02% | 38.22% | 17.66% |
| |
| Ratios/Supplemental Data | | | | | |
| Net Assets, End of Period (Millions) | $6,648 | $5,933 | $5,434 | $4,881 | $2,539 |
| Ratio of Total Expenses to Average Net Assets | 0.07% | 0.08% | 0.09% | 0.09% | 0.10% |
| Ratio of Net Investment Income to | | | | | |
| Average Net Assets | 1.15% | 0.94% | 1.01% | 0.78% | 1.11% |
| Portfolio Turnover Rate2 | 27% | 23% | 26% | 50% | 37% |
1 Total returns do not include account service fees that may have applied in the periods shown. Fund prospectuses provide information about
any applicable account service fees.
2 Excludes the value of portfolio securities received or delivered as a result of in-kind purchases or redemptions of the fund’s capital shares,
including ETF Creation Units.
See accompanying Notes, which are an integral part of the Financial Statements.
42
Small-Cap Growth Index Fund
Financial Highlights
| | | | | |
| Institutional Shares | | | | | |
| |
| For a Share Outstanding | Year Ended December 31, |
| Throughout Each Period | 2016 | 2015 | 2014 | 2013 | 2012 |
| Net Asset Value, Beginning of Period | $34.22 | $35.45 | $34.42 | $25.07 | $21.53 |
| Investment Operations | | | | | |
| Net Investment Income | .401 | .341 | .362 | .229 | .265 |
| Net Realized and Unrealized Gain (Loss) | | | | | |
| on Investments | 3.257 | (1.234) | 1.028 | 9.346 | 3.540 |
| Total from Investment Operations | 3.658 | (.893) | 1.390 | 9.575 | 3.805 |
| Distributions | | | | | |
| Dividends from Net Investment Income | (.408) | (.337) | (.360) | (.225) | (.265) |
| Distributions from Realized Capital Gains | — | — | — | — | — |
| Total Distributions | (.408) | (.337) | (.360) | (.225) | (.265) |
| Net Asset Value, End of Period | $37.47 | $34.22 | $35.45 | $34.42 | $25.07 |
| |
| Total Return | 10.74% | -2.52% | 4.04% | 38.20% | 17.68% |
| |
| Ratios/Supplemental Data | | | | | |
| Net Assets, End of Period (Millions) | $2,969 | $2,793 | $3,685 | $3,823 | $2,302 |
| Ratio of Total Expenses to Average Net Assets | 0.06% | 0.07% | 0.08% | 0.08% | 0.08% |
| Ratio of Net Investment Income to | | | | | |
| Average Net Assets | 1.16% | 0.95% | 1.02% | 0.79% | 1.13% |
| Portfolio Turnover Rate1 | 27% | 23% | 26% | 50% | 37% |
1 Excludes the value of portfolio securities received or delivered as a result of in-kind purchases or redemptions of the fund’s capital shares,
including ETF Creation Units.
See accompanying Notes, which are an integral part of the Financial Statements.
43
Small-Cap Growth Index Fund
Notes to Financial Statements
Vanguard Small-Cap Growth Index Fund is registered under the Investment Company Act of 1940 as an open-end investment company, or mutual fund. The fund offers four classes of shares: Investor Shares, ETF Shares, Admiral Shares, and Institutional Shares. Investor Shares are available to any investor who meets the fund’s minimum purchase requirements. ETF Shares are listed for trading on NYSE Arca; they can be purchased and sold through a broker. Admiral Shares and Institutional Shares are designed for investors who meet certain administrative, service, and account-size criteria.
A. The following significant accounting policies conform to generally accepted accounting principles for U.S. investment companies. The fund consistently follows such policies in preparing its financial statements.
1. Security Valuation: Securities are valued as of the close of trading on the New York Stock Exchange (generally 4 p.m., Eastern time) on the valuation date. Equity securities are valued at the latest quoted sales prices or official closing prices taken from the primary market in which each security trades; such securities not traded on the valuation date are valued at the mean of the latest quoted bid and asked prices. Securities for which market quotations are not readily available, or whose values have been materially affected by events occurring before the fund’s pricing time but after the close of the securities’ primary markets, are valued by methods deemed by the board of trustees to represent fair value. Investments in Vanguard Market Liquidity Fund are valued at that fund’s net asset value. Temporary cash investments are valued using the latest bid prices or using valuations based on a matrix system (which considers such factors as security prices, yields, maturities, and ratings), both as furnished by independent pricing services.
2. Futures Contracts: The fund uses index futures contracts to a limited extent, with the objectives of maintaining full exposure to the stock market, enhancing returns, maintaining liquidity, and minimizing transaction costs. The fund may purchase futures contracts to immediately invest incoming cash in the market, or sell futures in response to cash outflows, thereby simulating a fully invested position in the underlying index while maintaining a cash balance for liquidity. The fund may seek to enhance returns by using futures contracts instead of the underlying securities when futures are believed to be priced more attractively than the underlying securities. The primary risks associated with the use of futures contracts are imperfect correlation between changes in market values of stocks held by the fund and the prices of futures contracts, and the possibility of an illiquid market. Counterparty risk involving futures is mitigated because a regulated clearinghouse is the counterparty instead of the clearing broker. To further mitigate counterparty risk, the fund trades futures contracts on an exchange, monitors the financial strength of its clearing brokers and clearinghouse, and has entered into clearing agreements with its clearing brokers. The clearinghouse imposes initial margin requirements to secure the fund’s performance and requires daily settlement of variation margin representing changes in the market value of each contract.
Futures contracts are valued at their quoted daily settlement prices. The aggregate settlement values of the contracts are not recorded in the Statement of Net Assets. Fluctuations in the value of the contracts are recorded in the Statement of Net Assets as an asset (liability) and in the Statement of Operations as unrealized appreciation (depreciation) until the contracts are closed, when they are recorded as realized futures gains (losses).
During the year ended December 31, 2016, the fund’s average investments in long and short futures contracts represented less than 1% and 0% of net assets, respectively, based on the average of aggregate settlement values at each quarter-end during the period.
44
Small-Cap Growth Index Fund
3. Federal Income Taxes: The fund intends to continue to qualify as a regulated investment company and distribute all of its taxable income. Management has analyzed the fund’s tax positions taken for all open federal income tax years (December 31, 2013–2016), and has concluded that no provision for federal income tax is required in the fund’s financial statements.
4. Distributions: Distributions to shareholders are recorded on the ex-dividend date.
5. Securities Lending: To earn additional income, the fund lends its securities to qualified institutional borrowers. Security loans are subject to termination by the fund at any time, and are required to be secured at all times by collateral in an amount at least equal to the market value of securities loaned. Daily market fluctuations could cause the value of loaned securities to be more or less than the value of the collateral received. When this occurs, the collateral is adjusted and settled on the next business day. The fund further mitigates its counterparty risk by entering into securities lending transactions only with a diverse group of prequalified counterparties, monitoring their financial strength, and entering into master securities lending agreements with its counterparties. The master securities lending agreements provide that, in the event of a counterparty’s default (including bankruptcy), the fund may terminate any loans with that borrower, determine the net amount owed, and sell or retain the collateral up to the net amount owed to the fund; however, such actions may be subject to legal proceedings. While collateral mitigates counterparty risk, in the absence of a default the fund may experience delays and costs in recovering the securities loaned. The fund invests cash collateral received in Vanguard Market Liquidity Fund, and records a liability in the Statement of Net Assets for the return of the collateral, during the period the securities are on loan. Securities lending income represents fees charged to borrowers plus income earned on invested cash collateral, less expenses associated with the loan. During the term of the loan, the fund is entitled to all distributions made on or in respect of the loaned securities.
6. Credit Facility: The fund and certain other funds managed by The Vanguard Group (“Vanguard”) participate in a $3.1 billion committed credit facility provided by a syndicate of lenders pursuant to a credit agreement that may be renewed annually; each fund is individually liable for its borrowings, if any, under the credit facility. Borrowings may be utilized for temporary and emergency purposes, and are subject to the fund’s regulatory and contractual borrowing restrictions. The participating funds are charged administrative fees and an annual commitment fee of 0.10% of the undrawn amount of the facility; these fees are allocated to the funds based on a method approved by the fund’s board of trustees and included in Management and Administrative expenses on the fund’s Statement of Operations. Any borrowings under this facility bear interest at a rate based upon the higher of the one-month London Interbank Offered Rate, federal funds effective rate, or overnight bank funding rate plus an agreed-upon spread.
The fund had no borrowings outstanding at December 31, 2016, or at any time during the period then ended.
7. Other: Dividend income is recorded on the ex-dividend date. Interest income includes income distributions received from Vanguard Market Liquidity Fund and is accrued daily. Premiums and discounts on debt securities purchased are amortized and accreted, respectively, to interest income over the lives of the respective securities. Security transactions are accounted for on the date securities are bought or sold. Costs used to determine realized gains (losses) on the sale of investment securities are those of the specific securities sold.
45
Small-Cap Growth Index Fund
Each class of shares has equal rights as to assets and earnings, except that each class separately bears certain class-specific expenses related to maintenance of shareholder accounts (included in Management and Administrative expenses) and shareholder reporting. Marketing and distribution expenses are allocated to each class of shares based on a method approved by the board of trustees. Income, other non-class-specific expenses, and gains and losses on investments are allocated to each class of shares based on its relative net assets.
B. In accordance with the terms of a Funds’ Service Agreement (the “FSA”) between Vanguard and the fund, Vanguard furnishes to the fund investment advisory, corporate management, administrative, marketing, and distribution services at Vanguard’s cost of operations (as defined by the FSA). These costs of operations are allocated to the fund based on methods and guidelines approved by the board of trustees. Vanguard does not require reimbursement in the current period for certain costs of operations (such as deferred compensation/benefits and risk/insurance costs); the fund’s liability for these costs of operations is included in Payables to Vanguard on the Statement of Net Assets.
Upon the request of Vanguard, the fund may invest up to 0.40% of its net assets as capital in Vanguard. At December 31, 2016, the fund had contributed to Vanguard capital in the amount of $1,248,000, representing 0.01% of the fund’s net assets and 0.50% of Vanguard’s capitalization. The fund’s trustees and officers are also directors and employees, respectively, of Vanguard.
C. Various inputs may be used to determine the value of the fund’s investments. These inputs are summarized in three broad levels for financial statement purposes. The inputs or methodologies used to value securities are not necessarily an indication of the risk associated with investing in those securities.
Level 1—Quoted prices in active markets for identical securities.
Level 2—Other significant observable inputs (including quoted prices for similar securities, interest rates, prepayment speeds, credit risk, etc.).
Level 3—Significant unobservable inputs (including the fund’s own assumptions used to determine the fair value of investments).
The following table summarizes the market value of the fund’s investments as of December 31, 2016, based on the inputs used to value them:
| | | |
| | Level 1 | Level 2 | Level 3 |
| Investments | ($000) | ($000) | ($000) |
| Common Stocks | 16,768,727 | — | 1,996 |
| Temporary Cash Investments | 308,527 | 4,593 | — |
| Futures Contracts—Liabilities1 | (288) | — | — |
| Total | 17,076,966 | 4,593 | 1,996 |
| 1 Represents variation margin on the last day of the reporting period. |
46
Small-Cap Growth Index Fund
D. At December 31, 2016, the aggregate settlement value of open futures contracts and the related unrealized appreciation (depreciation) were:
| | | | |
| | | | ($000) |
| | | | Aggregate | |
| | | Number of | Settlement | Unrealized |
| | | Long (Short) | Value | Appreciation |
| Futures Contracts | Expiration | Contracts | Long (Short) | (Depreciation) |
| E-mini Russell 2000 Index | March 2017 | 450 | 30,530 | (214) |
Unrealized appreciation (depreciation) on open futures contracts is required to be treated as realized gain (loss) for tax purposes.
E. Distributions are determined on a tax basis and may differ from net investment income and realized capital gains for financial reporting purposes. Differences may be permanent or temporary. Permanent differences are reclassified among capital accounts in the financial statements to reflect their tax character. Temporary differences arise when certain items of income, expense, gain, or loss are recognized in different periods for financial statement and tax purposes. These differences will reverse at some time in the future. Differences in classification may also result from the treatment of short-term gains as ordinary income for tax purposes.
During the year ended December 31, 2016, the fund realized $515,782,000 of net capital gains resulting from in-kind redemptions—in which shareholders exchanged fund shares for securities held by the fund rather than for cash. Because such gains are not taxable to the fund, and are not distributed to shareholders, they have been reclassified from accumulated net realized losses to paid-in capital.
For tax purposes, at December 31, 2016, the fund had $2,213,000 of ordinary income available for distribution. At December 31, 2016, the fund had available capital losses totaling $1,462,399,000 to offset future net capital gains. Of this amount, $504,200,000 is subject to expiration dates; $243,082,000 may be used to offset future net capital gains through December 31, 2017, and $261,118,000 through December 31, 2018. Capital losses of $958,199,000 realized beginning in fiscal 2011 may be carried forward indefinitely under the Regulated Investment Company Modernization Act of 2010, but must be used before any expiring loss carryforwards.
At December 31, 2016, the cost of investment securities for tax purposes was $13,778,122,000. Net unrealized appreciation of investment securities for tax purposes was $3,305,721,000, consisting of unrealized gains of $4,335,756,000 on securities that had risen in value since their purchase and $1,030,035,000 in unrealized losses on securities that had fallen in value since their purchase.
F. During the year ended December 31, 2016, the fund purchased $5,852,140,000 of investment securities and sold $5,529,270,000 of investment securities, other than temporary cash investments. Purchases and sales include $1,720,019,000 and $1,386,204,000, respectively, in connection with in-kind purchases and redemptions of the fund’s capital shares.
47
Small-Cap Growth Index Fund
The fund purchased securities from and sold securities to other Vanguard funds or accounts managed by Vanguard or its affiliates, in accordance with procedures adopted by the board of trustees in compliance with Rule 17a-7 of the Investment Company Act of 1940. For the year ended December 31, 2016, such purchases and sales were $396,261,000 and $899,179,000, respectively; these amounts are included in the purchases and sales of investment securities noted above.
G. Capital share transactions for each class of shares were:
| | | | |
| | Year Ended December 31, |
| | 2016 | 2015 |
| | Amount | Shares | Amount | Shares |
| | ($000) | (000) | ($000) | (000) |
| Investor Shares | | | | |
| Issued | 292,382 | 8,461 | 445,273 | 12,230 |
| Issued in Lieu of Cash Distributions | 17,459 | 484 | 16,016 | 467 |
| Redeemed | (605,971) | (17,626) | (737,332) | (20,291) |
| Net Increase (Decrease)—Investor Shares | (296,130) | (8,681) | (276,043) | (7,594) |
| ETF Shares | | | | |
| Issued | 1,959,994 | 15,347 | 3,792,432 | 29,561 |
| Issued in Lieu of Cash Distributions | — | — | — | — |
| Redeemed | (1,444,760) | (11,700) | (3,102,742) | (24,150) |
| Net Increase (Decrease)—ETF Shares | 515,234 | 3,647 | 689,690 | 5,411 |
| Admiral Shares | | | | |
| Issued | 1,300,181 | 30,042 | 1,619,752 | 35,551 |
| Issued in Lieu of Cash Distributions | 65,555 | 1,452 | 52,365 | 1,221 |
| Redeemed | (1,212,201) | (28,261) | (934,034) | (20,690) |
| Net Increase (Decrease)—Admiral Shares | 153,535 | 3,233 | 738,083 | 16,082 |
| Institutional Shares | | | | |
| Issued | 679,966 | 19,542 | 617,232 | 16,815 |
| Issued in Lieu of Cash Distributions | 31,452 | 871 | 30,844 | 897 |
| Redeemed | (796,703) | (22,798) | (1,380,413) | (40,068) |
| Net Increase (Decrease)—Institutional Shares | (85,285) | (2,385) | (732,337) | (22,356) |
H. Management has determined that no material events or transactions occurred subsequent to December 31, 2016, that would require recognition or disclosure in these financial statements.
48
Small-Cap Value Index Fund
Fund Profile
As of December 31, 2016
| | | | |
| Share-Class Characteristics | | | | |
| | Investor | | Admiral | Institutional |
| | Shares | ETF Shares | Shares | Shares |
| Ticker Symbol | VISVX | VBR | VSIAX | VSIIX |
| Expense Ratio1 | 0.20% | 0.08% | 0.08% | 0.07% |
| 30-Day SEC Yield | 1.74% | 1.86% | 1.86% | 1.86% |
| | | |
| Portfolio Characteristics | | |
| | | | DJ |
| | | | U.S. |
| | | CRSP US | Total |
| | | Small Cap | Market |
| | Fund | Value Index | FA Index |
| Number of Stocks | 833 | 829 | 3,833 |
| Median Market Cap | $3.4B | $3.4B | $54.1B |
| Price/Earnings Ratio | 24.9x | 25.2x | 24.4x |
| Price/Book Ratio | 2.0x | 2.1x | 2.8x |
| Return on Equity | 10.7% | 10.7% | 16.5% |
| Earnings Growth | | | |
| Rate | 7.0% | 7.0% | 8.2% |
| Dividend Yield | 1.9% | 1.9% | 2.0% |
| Foreign Holdings | 0.0% | 0.0% | 0.0% |
| Turnover Rate | 18% | — | — |
| Short-Term | | | |
| Reserves | 0.2% | — | — |
| | | |
| Sector Diversification (% of equity exposure) |
| | | | DJ |
| | | CRSP US | U.S. Total |
| | | Small Cap | Market |
| | Fund | Value Index | FA Index |
| Basic Materials | 5.8% | 5.9% | 2.6% |
| Consumer Goods | 6.4 | 6.4 | 9.6 |
| Consumer Services | 10.2 | 10.1 | 13.1 |
| Financials | 31.2 | 31.3 | 20.8 |
| Health Care | 5.4 | 5.4 | 12.2 |
| Industrials | 20.5 | 20.5 | 12.9 |
| Oil & Gas | 5.8 | 5.8 | 6.9 |
| Technology | 8.1 | 8.1 | 16.4 |
| Telecommunications | 0.6 | 0.5 | 2.4 |
| Utilities | 6.0 | 6.0 | 3.1 |
| | |
| Volatility Measures | | |
| | | DJ |
| | CRSP US | U.S. Total |
| | Small Cap | Market |
| | Value Index | FA Index |
| R-Squared | 1.00 | 0.83 |
| Beta | 1.00 | 1.15 |
| These measures show the degree and timing of the fund’s |
| fluctuations compared with the indexes over 36 months. |
| | |
| Ten Largest Holdings (% of total net assets) |
| Targa Resources Corp. | Exploration & | |
| | Production | 0.6% |
| Huntington Ingalls | | |
| Industries Inc. | Defense | 0.5 |
| CDW Corp. | Computer Services | 0.5 |
| Steel Dynamics Inc. | Iron & Steel | 0.5 |
| Westar Energy Inc. | Conventional | |
| | Electricity | 0.5 |
| UGI Corp. | Gas Distribution | 0.5 |
| Broadridge Financial | Financial | |
| Solutions Inc. | Administration | 0.5 |
| Atmos Energy Corp. | Gas Distribution | 0.4 |
| Leidos Holdings Inc. | Computer Services | 0.4 |
| Valspar Corp. | Building Materials & | |
| | Fixtures | 0.4 |
| Top Ten | | 4.8% |
| The holdings listed exclude any temporary cash investments and equity index products. |
1 The expense ratios shown are from the prospectus dated April 27, 2016, and represent estimated costs for the current fiscal year. For the fiscal
year ended December 31, 2016, the expense ratios were 0.19% for Investor Shares, 0.07% for ETF Shares, 0.07% for Admiral Shares, and 0.06% for
Institutional Shares.
49
Small-Cap Value Index Fund
Investment Focus

50
Small-Cap Value Index Fund
Performance Summary
All of the returns in this report represent past performance, which is not a guarantee of future results that may be achieved by the fund. (Current performance may be lower or higher than the performance data cited. For performance data current to the most recent month-end, visit our website at vanguard.com/performance.) Note, too, that both investment returns and principal value can fluctuate widely, so an investor’s shares, when sold, could be worth more or less than their original cost. The returns shown do not reflect taxes that a shareholder would pay on fund distributions or on the sale of fund shares.
Cumulative Performance: December 31, 2006, Through December 31, 2016
Initial Investment of $10,000
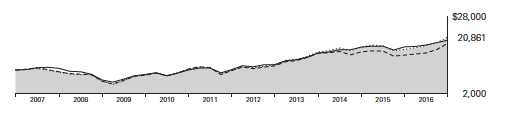
| | | | | |
| | | Average Annual Total Returns | |
| | | Periods Ended December 31, 2016 | |
| | | | | | Final Value |
| | | One | Five | Ten | of a $10,000 |
| | | Year | Years | Years | Investment |
| | Small-Cap Value Index Fund*Investor | | | | |
| | Shares | 24.65% | 16.21% | 7.63% | $20,861 |
| • • • • • • •• | Spliced Small-Cap Value Index | 24.82 | 16.41 | 7.76 | 21,110 |
| – – – – | Small-Cap Value Funds Average | 26.57 | 14.12 | 6.61 | 18,967 |
| | Dow Jones U.S. Total Stock Market | | | | |
| | Float Adjusted Index | 12.62 | 14.59 | 7.18 | 20,003 |
| For a benchmark description, see the Glossary. |
| Small-Cap Value Funds Average: Derived from data provided by Lipper, a Thomson Reuters Company. | | |
| | | | |
| | | | | Final Value |
| | One | Five | Ten | of a $10,000 |
| | Year | Years | Years | Investment |
| Small-Cap Value Index Fund | | | | |
| ETF Shares Net Asset Value | 24.80% | 16.37% | 7.77% | $21,130 |
| Spliced Small-Cap Value Index | 24.82 | 16.41 | 7.76 | 21,110 |
| Dow Jones U.S. Total Stock Market Float | | | | |
| Adjusted Index | 12.62 | 14.59 | 7.18 | 20,003 |
See Financial Highlights for dividend and capital gains information.
51
Small-Cap Value Index Fund
| | | | |
| | Average Annual Total Returns | |
| | Periods Ended December 31, 2016 | |
| | | | Since | Final Value |
| | One | Five | Inception | of a $10,000 |
| | Year | Years | (9/27/2011) | Investment |
| Small-Cap Value Index Fund Admiral Shares | 24.78% | 16.36% | 17.62% | $23,479 |
| Spliced Small-Cap Value Index | 24.82 | 16.41 | 17.66 | 23,530 |
| Dow Jones U.S. Total Stock Market Float | | | | |
| Adjusted Index | 12.62 | 14.59 | 15.42 | 21,267 |
| "Since Inception" performance is calculated from the Admiral Shares’ inception date for both the fund and its comparative standards. |
| | | | |
| | | | | Final Value |
| | One | Five | Ten | of a $5,000,000 |
| | Year | Years | Years | Investment |
| Small-Cap Value Index Fund Institutional | | | | |
| Shares | 24.80% | 16.37% | 7.80% | $10,595,759 |
| |
| Spliced Small-Cap Value Index | 24.82 | 16.41 | 7.76 | 10,555,139 |
| Dow Jones U.S. Total Stock Market Float | | | | |
| Adjusted Index | 12.62 | 14.59 | 7.18 | 10,001,613 |
| | | |
| Cumulative Returns of ETF Shares: December 31, 2006, Through December 31, 2016 | |
| | One | Five | Ten |
| | Year | Years | Years |
| Small-Cap Value Index Fund ETF Shares Market | | | |
| Price | 24.80% | 113.32% | 111.31% |
| Small-Cap Value Index Fund ETF Shares Net Asset | | | |
| Value | 24.80 | 113.36 | 111.30 |
| Spliced Small-Cap Value Index | 24.82 | 113.79 | 111.10 |
Fiscal-Year Total Returns (%): December 31, 2006, Through December 31, 2016
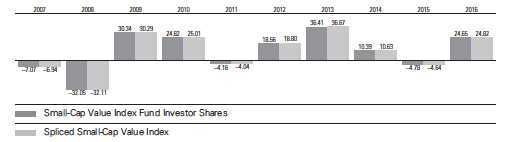
For a benchmark description, see the Glossary.
52
Small-Cap Value Index Fund
Financial Statements
Statement of Net Assets—Investments Summary
As of December 31, 2016
This Statement summarizes the fund’s holdings by asset type. Details are reported for each of the fund’s 50 largest individual holdings and for investments that, in total for any issuer, represent more than 1% of the fund’s net assets. The total value of smaller holdings is reported as a single amount within each category.
The fund reports a complete list of its holdings in regulatory filings four times in each fiscal year, at the quarter-ends. For the second and fourth fiscal quarters, the complete listing of the fund’s holdings is available electronically on vanguard.com and on the Securities and Exchange Commission’s website (sec.gov), or you can have it mailed to you without charge by calling 800-662-7447. For the first and third fiscal quarters, the fund files the lists with the SEC on Form N-Q. Shareholders can look up the fund’s Forms N-Q on the SEC’s website. Forms N-Q may also be reviewed and copied at the SEC’s Public Reference Room (see the back cover of this report for further information).
| | | |
| | | Market | Percentage |
| | | Value• | of Net |
| | Shares | ($000) | Assets |
| Common Stocks | | | |
| Basic Materials | | | |
| Steel Dynamics Inc. | 3,273,906 | 116,486 | 0.5% |
| RPM International Inc. | 1,883,985 | 101,415 | 0.4% |
| United States Steel Corp. | 2,437,803 | 80,472 | 0.3% |
| Basic Materials—Other † | | 1,143,776 | 4.6% |
| | | 1,442,149 | 5.8% |
| Consumer Goods | | | |
| Leggett & Platt Inc. | 1,889,439 | 92,356 | 0.4% |
| Pinnacle Foods Inc. | 1,669,008 | 89,209 | 0.4% |
| Consumer Goods—Other † | | 1,395,351 | 5.6% |
| | | 1,576,916 | 6.4% |
| Consumer Services | | | |
| * JetBlue Airways Corp. | 4,575,929 | 102,592 | 0.4% |
| KAR Auction Services Inc. | 1,953,027 | 83,238 | 0.3% |
| Service Corp. International | 2,555,223 | 72,568 | 0.3% |
| Consumer Services—Other † | | 2,250,843 | 9.1% |
| | | 2,509,241 | 10.1% |
| Financials | | | |
| East West Bancorp Inc. | 2,037,793 | 103,581 | 0.4% |
| Apartment Investment & Management Co. | 2,217,646 | 100,792 | 0.4% |
| National Retail Properties Inc. | 2,079,668 | 91,921 | 0.4% |
| American Financial Group Inc. | 981,277 | 86,470 | 0.4% |
| Endurance Specialty Holdings Ltd. | 907,915 | 83,891 | 0.3% |
| Liberty Property Trust | 2,077,892 | 82,077 | 0.3% |
| Starwood Property Trust Inc. | 3,624,289 | 79,553 | 0.3% |
| RenaissanceRe Holdings Ltd. | 581,802 | 79,253 | 0.3% |
| Hospitality Properties Trust | 2,322,133 | 73,705 | 0.3% |
| Highwoods Properties Inc. | 1,415,912 | 72,226 | 0.3% |
| Financials—Other † | | 6,841,273 | 27.7% |
| | | 7,694,742 | 31.1% |
53
Small-Cap Value Index Fund
| | | | |
| | | | Market | Percentage |
| | | | Value• | of Net |
| | | Shares | ($000) | Assets |
| Health Care | | | |
| | Teleflex Inc. | 622,683 | 100,345 | 0.4% |
| * | United Therapeutics Corp. | 599,606 | 86,001 | 0.4% |
| * | WellCare Health Plans Inc. | 626,154 | 85,833 | 0.3% |
| | Health Care—Other † | | 1,066,661 | 4.3% |
| | | | 1,338,840 | 5.4% |
| Industrials | | | |
| | Huntington Ingalls Industries Inc. | 655,405 | 120,719 | 0.5% |
| | Broadridge Financial Solutions Inc. | 1,682,336 | 111,539 | 0.5% |
| | Valspar Corp. | 1,009,314 | 104,575 | 0.4% |
| | Carlisle Cos. Inc. | 911,357 | 100,514 | 0.4% |
| | Spirit AeroSystems Holdings Inc. Class A | 1,721,192 | 100,432 | 0.4% |
| | IDEX Corp. | 1,076,709 | 96,968 | 0.4% |
| | Allegion plc | 1,357,270 | 86,865 | 0.4% |
| | PerkinElmer Inc. | 1,548,524 | 80,756 | 0.3% |
| | MDU Resources Group Inc. | 2,760,755 | 79,427 | 0.3% |
| * | AECOM | 2,176,210 | 79,127 | 0.3% |
| | Donaldson Co. Inc. | 1,875,041 | 78,902 | 0.3% |
| | Sonoco Products Co. | 1,409,577 | 74,285 | 0.3% |
| | Orbital ATK Inc. | 826,918 | 72,546 | 0.3% |
| | Industrials—Other † | | 3,870,573 | 15.6% |
| | | | 5,057,228 | 20.4% |
| Oil & Gas | | | |
| | Targa Resources Corp. | 2,428,085 | 136,143 | 0.5% |
| * | Chesapeake Energy Corp. | 12,543,429 | 88,055 | 0.4% |
| *,^ | Transocean Ltd. | 5,166,607 | 76,156 | 0.3% |
| | Oil & Gas—Other † | | 1,131,544 | 4.6% |
| | | | 1,431,898 | 5.8% |
| |
| 1Other † | | 1,196 | 0.0% |
| |
| Technology | | | |
| | CDW Corp. | 2,266,440 | 118,059 | 0.5% |
| | Leidos Holdings Inc. | 2,125,385 | 108,692 | 0.4% |
| * | CommScope Holding Co. Inc. | 2,726,235 | 101,416 | 0.4% |
| * | Microsemi Corp. | 1,620,672 | 87,468 | 0.4% |
| * | ARRIS International plc | 2,681,359 | 80,789 | 0.3% |
| * | ON Semiconductor Corp. | 5,894,210 | 75,210 | 0.3% |
| | CSRA Inc. | 2,310,260 | 73,559 | 0.3% |
| | Teradyne Inc. | 2,844,030 | 72,238 | 0.3% |
| | Technology—Other † | | 1,286,446 | 5.2% |
| | | | 2,003,877 | 8.1% |
| |
| Telecommunications † | | 135,284 | 0.6% |
| |
| Utilities | | | |
| | Westar Energy Inc. Class A | 2,004,082 | 112,930 | 0.5% |
| | UGI Corp. | 2,444,124 | 112,625 | 0.5% |
| | Atmos Energy Corp. | 1,469,135 | 108,936 | 0.4% |
| | Great Plains Energy Inc. | 3,043,373 | 83,236 | 0.3% |
| | Aqua America Inc. | 2,504,490 | 75,235 | 0.3% |
| | Utilities—Other † | | 995,659 | 4.0% |
| | | | 1,488,621 | 6.0% |
| Total Common Stocks (Cost $19,706,245) | | 24,679,992 | 99.7%2 |
54
| | | | |
| Small-Cap Value Index Fund | | | | |
| |
| |
| |
| | | | Market | Percentage |
| | | | Value• | of Net |
| Coupon | | Shares | ($000) | Assets |
| Temporary Cash Investments | | | | |
| Money Market Fund | | | | |
| 3,4 Vanguard Market Liquidity Fund | 0.823% | 2,835,641 | 283,592 | 1.2% |
| |
| | | Face | | |
| | Maturity | Amount | | |
| | Date | ($000) | | |
| U.S. Government and Agency Obligations | | | | |
| 5 United States Treasury Bill 0.487%–0.607% | 3/16/17–5/25/17 | 4,175 | 4,168 | 0.0% |
| Total Temporary Cash Investments (Cost $287,743) | | 287,760 | 1.2%2 |
| Total Investments (Cost $19,993,988) | | | 24,967,752 | 100.9% |
| |
| | | | Amount | |
| | | | ($000) | |
| Other Assets and Liabilities | | | | |
| Other Assets | | | | |
| Investment in Vanguard | | | 1,754 | |
| Receivables for Investment Securities Sold | | | 1,209 | |
| Receivables for Accrued Income | | | 46,638 | |
| Receivables for Capital Shares Issued | | | 35,955 | |
| Other Assets | | | 881 | |
| Total Other Assets | | | 86,437 | 0.3% |
| Liabilities | | | | |
| Payables for Investment Securities Purchased | | | (104,770) | |
| Collateral for Securities on Loan | | | (143,700) | |
| Payables for Capital Shares Redeemed | | | (41,714) | |
| Payables for Distributions | | | (1) | |
| Payables to Vanguard | | | (12,622) | |
| Other Liabilities | | | (1,066) | |
| Total Liabilities | | | (303,873) | (1.2%) |
| Net Assets | | | 24,750,316 | 100.0% |
| |
| |
| At December 31, 2016, net assets consisted of: | | | | |
| | | | | Amount |
| | | | | ($000) |
| Paid-in Capital | | | | 21,114,173 |
| Overdistributed Net Investment Income | | | | (7,768) |
| Accumulated Net Realized Losses | | | | (1,328,652) |
| Unrealized Appreciation (Depreciation) | | | | |
| Investment Securities | | | | 4,973,764 |
| Futures Contracts | | | | (970) |
| Swap Contracts | | | | (231) |
| Net Assets | | | | 24,750,316 |
| |
| |
| Investor Shares—Net Assets | | | | |
| Applicable to 81,284,001 outstanding $.001 par value shares of | | | |
| beneficial interest (unlimited authorization) | | | | 2,357,106 |
| Net Asset Value Per Share—Investor Shares | | | | $29.00 |
55
| |
| Small-Cap Value Index Fund | |
| |
| |
| |
| | Amount |
| | ($000) |
| ETF Shares—Net Assets | |
| Applicable to 83,032,469 outstanding $.001 par value shares of | |
| beneficial interest (unlimited authorization) | 10,042,425 |
| Net Asset Value Per Share—ETF Shares | $120.95 |
| |
| Admiral Shares—Net Assets | |
| Applicable to 182,205,430 outstanding $.001 par value shares of | |
| beneficial interest (unlimited authorization) | 9,469,088 |
| Net Asset Value Per Share—Admiral Shares | $51.97 |
| |
| Institutional Shares—Net Assets | |
| Applicable to 99,200,204 outstanding $.001 par value shares of | |
| beneficial interest (unlimited authorization) | 2,881,697 |
| Net Asset Value Per Share—Institutional Shares | $29.05 |
• See Note A in Notes to Financial Statements.
* Non-income-producing security.
^ Includes partial security positions on loan to broker-dealers. The total value of securities on loan is $137,393,000.
† Represents the aggregate value, by category, of securities that are not among the 50 largest holdings and, in total for any issuer, represent
1% or less of net assets.
1 “Other” represents securities that are not classified by the fund’s benchmark index.
2 The fund invests a portion of its cash reserves in equity markets through the use of index futures contracts and swap contracts. After giving
effect to futures and swap investments, the fund’s effective common stock and temporary cash investment positions represent 100.2% and
0.7%, respectively, of net assets.
3 Affiliated money market fund available only to Vanguard funds and certain trusts and accounts managed by Vanguard. Rate shown is the
7-day yield.
4 Includes $143,700,000 of collateral received for securities on loan.
5 Securities with a value of $4,168,000 have been segregated as initial margin for open futures contracts.
See accompanying Notes, which are an integral part of the Financial Statements.
56
Small-Cap Value Index Fund
Statement of Operations
| |
| | Year Ended |
| | December 31, 2016 |
| | ($000) |
| Investment Income | |
| Income | |
| Dividends | 404,887 |
| Interest1 | 432 |
| Securities Lending—Net | 9,671 |
| Total Income | 414,990 |
| Expenses | |
| The Vanguard Group—Note B | |
| Investment Advisory Services | 2,416 |
| Management and Administrative—Investor Shares | 2,943 |
| Management and Administrative—ETF Shares | 3,150 |
| Management and Administrative—Admiral Shares | 3,099 |
| Management and Administrative—Institutional Shares | 1,006 |
| Marketing and Distribution—Investor Shares | 477 |
| Marketing and Distribution—ETF Shares | 454 |
| Marketing and Distribution—Admiral Shares | 810 |
| Marketing and Distribution—Institutional Shares | 74 |
| Custodian Fees | 591 |
| Auditing Fees | 44 |
| Shareholders’ Reports—Investor Shares | 44 |
| Shareholders’ Reports—ETF Shares | 305 |
| Shareholders’ Reports—Admiral Shares | 68 |
| Shareholders’ Reports—Institutional Shares | 53 |
| Trustees’ Fees and Expenses | 16 |
| Total Expenses | 15,550 |
| Net Investment Income | 399,440 |
| Realized Net Gain (Loss) | |
| Investment Securities Sold1 | 687,072 |
| Futures Contracts | 7,140 |
| Swap Contracts | 11,583 |
| Realized Net Gain (Loss) | 705,795 |
| Change in Unrealized Appreciation (Depreciation) | |
| Investment Securities | 3,422,375 |
| Futures Contracts | (859) |
| Swap Contracts | (216) |
| Change in Unrealized Appreciation (Depreciation) | 3,421,300 |
| Net Increase (Decrease) in Net Assets Resulting from Operations | 4,526,535 |
| 1 Interest income and realized net gain (loss) from an affiliated company of the fund were $413,000 and $1,000, respectively. |
See accompanying Notes, which are an integral part of the Financial Statements.
57
Small-Cap Value Index Fund
Statement of Changes in Net Assets
| | |
| | Year Ended December 31, |
| | 2016 | 2015 |
| | ($000) | ($000) |
| Increase (Decrease) in Net Assets | | |
| Operations | | |
| Net Investment Income | 399,440 | 310,189 |
| Realized Net Gain (Loss) | 705,795 | 603,681 |
| Change in Unrealized Appreciation (Depreciation) | 3,421,300 | (1,747,453) |
| Net Increase (Decrease) in Net Assets Resulting from Operations | 4,526,535 | (833,583) |
| Distributions | | |
| Net Investment Income | | |
| Investor Shares | (38,162) | (37,107) |
| ETF Shares | (160,038) | (109,974) |
| Admiral Shares | (156,336) | (122,857) |
| Institutional Shares | (51,718) | (46,306) |
| Realized Capital Gain | | |
| Investor Shares | — | — |
| ETF Shares | — | — |
| Admiral Shares | — | — |
| Institutional Shares | — | — |
| Total Distributions | (406,254) | (316,244) |
| Capital Share Transactions | | |
| Investor Shares | (26,492) | (185,953) |
| ETF Shares | 2,792,764 | 1,201,693 |
| Admiral Shares | 1,391,975 | 1,133,431 |
| Institutional Shares | 19,318 | 585,111 |
| Net Increase (Decrease) from Capital Share Transactions | 4,177,565 | 2,734,282 |
| Total Increase (Decrease) | 8,297,846 | 1,584,455 |
| Net Assets | | |
| Beginning of Period | 16,452,470 | 14,868,015 |
| End of Period1 | 24,750,316 | 16,452,470 |
| 1 Net Assets—End of Period includes undistributed (overdistributed) net investment income of ($7,768,000) and ($12,759,000). |
See accompanying Notes, which are an integral part of the Financial Statements.
58
Small-Cap Value Index Fund
Financial Highlights
| | | | | |
| Investor Shares | | | | | |
| |
| For a Share Outstanding | Year Ended December 31, |
| Throughout Each Period | 2016 | 2015 | 2014 | 2013 | 2012 |
| Net Asset Value, Beginning of Period | $23.69 | $25.34 | $23.33 | $17.40 | $15.04 |
| Investment Operations | | | | | |
| Net Investment Income | .477 | .431 | .425 | .394 | .428 |
| Net Realized and Unrealized Gain (Loss) | | | | | |
| on Investments | 5.315 | (1.643) | 1.995 | 5.936 | 2.364 |
| Total from Investment Operations | 5.792 | (1.212) | 2.420 | 6.330 | 2.792 |
| Distributions | | | | | |
| Dividends from Net Investment Income | (.482) | (.438) | (.410) | (.400) | (.432) |
| Distributions from Realized Capital Gains | — | — | — | — | — |
| Total Distributions | (.482) | (.438) | (.410) | (.400) | (.432) |
| Net Asset Value, End of Period | $29.00 | $23.69 | $25.34 | $23.33 | $17.40 |
| |
| Total Return1 | 24.65% | -4.78% | 10.39% | 36.41% | 18.56% |
| |
| Ratios/Supplemental Data | | | | | |
| Net Assets, End of Period (Millions) | $2,357 | $1,972 | $2,293 | $2,375 | $2,001 |
| Ratio of Total Expenses to Average Net Assets | 0.19% | 0.20% | 0.23% | 0.24% | 0.24% |
| Ratio of Net Investment Income to | | | | | |
| Average Net Assets | 1.96% | 1.78% | 1.84% | 2.03% | 2.66% |
| Portfolio Turnover Rate2 | 18% | 16% | 12% | 47% | 25% |
1 Total returns do not include account service fees that may have applied in the periods shown. Fund prospectuses provide information about
any applicable account service fees.
2 Excludes the value of portfolio securities received or delivered as a result of in-kind purchases or redemptions of the fund’s capital shares,
including ETF Creation Units.
See accompanying Notes, which are an integral part of the Financial Statements.
59
Small-Cap Value Index Fund
Financial Highlights
| | | | | |
| ETF Shares | | | | | |
| |
| For a Share Outstanding | Year Ended December 31, |
| Throughout Each Period | 2016 | 2015 | 2014 | 2013 | 2012 |
| Net Asset Value, Beginning of Period | $98.81 | $105.71 | $97.32 | $72.60 | $62.73 |
| Investment Operations | | | | | |
| Net Investment Income | 2.119 | 1.933 | 1.933 | 1.796 | 1.896 |
| Net Realized and Unrealized Gain (Loss) | | | | | |
| on Investments | 22.159 | (6.870) | 8.326 | 24.742 | 9.877 |
| Total from Investment Operations | 24.278 | (4.937) | 10.259 | 26.538 | 11.773 |
| Distributions | | | | | |
| Dividends from Net Investment Income | (2.138) | (1.963) | (1.869) | (1.818) | (1.903) |
| Distributions from Realized Capital Gains | — | — | — | — | — |
| Total Distributions | (2.138) | (1.963) | (1.869) | (1.818) | (1.903) |
| Net Asset Value, End of Period | $120.95 | $98.81 | $105.71 | $97.32 | $72.60 |
| |
| Total Return | 24.80% | -4.67% | 10.55% | 36.57% | 18.78% |
| |
| Ratios/Supplemental Data | | | | | |
| Net Assets, End of Period (Millions) | $10,042 | $5,679 | $4,874 | $3,908 | $2,281 |
| Ratio of Total Expenses to Average Net Assets | 0.07% | 0.08% | 0.09% | 0.09% | 0.10% |
| Ratio of Net Investment Income to | | | | | |
| Average Net Assets | 2.08% | 1.90% | 1.98% | 2.18% | 2.80% |
| Portfolio Turnover Rate1 | 18% | 16% | 12% | 47% | 25% |
| 1 Excludes the value of portfolio securities received or delivered as a result of in-kind purchases or redemptions of the fund’s capital shares, |
| including ETF Creation Units. |
See accompanying Notes, which are an integral part of the Financial Statements.
60
Small-Cap Value Index Fund
Financial Highlights
| | | | | |
| Admiral Shares | | | | | |
| |
| For a Share Outstanding | Year Ended December 31, |
| Throughout Each Period | 2016 | 2015 | 2014 | 2013 | 2012 |
| Net Asset Value, Beginning of Period | $42.46 | $45.42 | $41.82 | $31.20 | $26.96 |
| Investment Operations | | | | | |
| Net Investment Income | .911 | .830 | .831 | .773 | .814 |
| Net Realized and Unrealized Gain (Loss) | | | | | |
| on Investments | 9.518 | (2.947) | 3.573 | 10.629 | 4.245 |
| Total from Investment Operations | 10.429 | (2.117) | 4.404 | 11.402 | 5.059 |
| Distributions | | | | | |
| Dividends from Net Investment Income | (.919) | (.843) | (.804) | (.782) | (.819) |
| Distributions from Realized Capital Gains | — | — | — | — | — |
| Total Distributions | (.919) | (.843) | (.804) | (.782) | (.819) |
| Net Asset Value, End of Period | $51.97 | $42.46 | $45.42 | $41.82 | $31.20 |
| |
| Total Return1 | 24.78% | -4.65% | 10.55% | 36.58% | 18.77% |
| |
| Ratios/Supplemental Data | | | | | |
| Net Assets, End of Period (Millions) | $9,469 | $6,467 | $5,775 | $4,371 | $2,563 |
| Ratio of Total Expenses to Average Net Assets | 0.07% | 0.08% | 0.09% | 0.09% | 0.10% |
| Ratio of Net Investment Income to | | | | | |
| Average Net Assets | 2.08% | 1.90% | 1.98% | 2.18% | 2.80% |
| Portfolio Turnover Rate2 | 18% | 16% | 12% | 47% | 25% |
1 Total returns do not include account service fees that may have applied in the periods shown. Fund prospectuses provide information about
any applicable account service fees.
2 Excludes the value of portfolio securities received or delivered as a result of in-kind purchases or redemptions of the fund’s capital shares,
including ETF Creation Units.
See accompanying Notes, which are an integral part of the Financial Statements.
61
Small-Cap Value Index Fund
Financial Highlights
| | | | | |
| Institutional Shares | | | | | |
| |
| For a Share Outstanding | Year Ended December 31, |
| Throughout Each Period | 2016 | 2015 | 2014 | 2013 | 2012 |
| Net Asset Value, Beginning of Period | $23.73 | $25.39 | $23.37 | $17.44 | $15.07 |
| Investment Operations | | | | | |
| Net Investment Income | .510 | .465 | .467 | .434 | .459 |
| Net Realized and Unrealized Gain (Loss) | | | | | |
| on Investments | 5.324 | (1.652) | 2.004 | 5.935 | 2.371 |
| Total from Investment Operations | 5.834 | (1.187) | 2.471 | 6.369 | 2.830 |
| Distributions | | | | | |
| Dividends from Net Investment Income | (.514) | (.473) | (.451) | (.439) | (.460) |
| Distributions from Realized Capital Gains | — | — | — | — | — |
| Total Distributions | (.514) | (.473) | (.451) | (.439) | (.460) |
| Net Asset Value, End of Period | $29.05 | $23.73 | $25.39 | $23.37 | $17.44 |
| |
| Total Return | 24.80% | -4.67% | 10.59% | 36.55% | 18.78% |
| |
| Ratios/Supplemental Data | | | | | |
| Net Assets, End of Period (Millions) | $2,882 | $2,334 | $1,927 | $1,699 | $979 |
| Ratio of Total Expenses to Average Net Assets | 0.06% | 0.07% | 0.08% | 0.08% | 0.08% |
| Ratio of Net Investment Income to | | | | | |
| Average Net Assets | 2.09% | 1.91% | 1.99% | 2.19% | 2.82% |
| Portfolio Turnover Rate1 | 18% | 16% | 12% | 47% | 25% |
1 Excludes the value of portfolio securities received or delivered as a result of in-kind purchases or redemptions of the fund’s capital shares,
including ETF Creation Units.
See accompanying Notes, which are an integral part of the Financial Statements.
62
Small-Cap Value Index Fund
Notes to Financial Statements
Vanguard Small-Cap Value Index Fund is registered under the Investment Company Act of 1940 as an open-end investment company, or mutual fund. The fund offers four classes of shares: Investor Shares, ETF Shares, Admiral Shares, and Institutional Shares. Investor Shares are available to any investor who meets the fund’s minimum purchase requirements. ETF Shares are listed for trading on NYSE Arca; they can be purchased and sold through a broker. Admiral Shares and Institutional Shares are designed for investors who meet certain administrative, service, and account-size criteria.
A. The following significant accounting policies conform to generally accepted accounting principles for U.S. investment companies. The fund consistently follows such policies in preparing its financial statements.
1. Security Valuation: Securities are valued as of the close of trading on the New York Stock Exchange (generally 4 p.m., Eastern time) on the valuation date. Equity securities are valued at the latest quoted sales prices or official closing prices taken from the primary market in which each security trades; such securities not traded on the valuation date are valued at the mean of the latest quoted bid and asked prices. Securities for which market quotations are not readily available, or whose values have been materially affected by events occurring before the fund’s pricing time but after the close of the securities’ primary markets, are valued by methods deemed by the board of trustees to represent fair value. Investments in Vanguard Market Liquidity Fund are valued at that fund’s net asset value. Temporary cash investments are valued using the latest bid prices or using valuations based on a matrix system (which considers such factors as security prices, yields, maturities, and ratings), both as furnished by independent pricing services.
2. Futures Contracts: The fund uses index futures contracts to a limited extent, with the objectives of maintaining full exposure to the stock market, enhancing returns, maintaining liquidity, and minimizing transaction costs. The fund may purchase futures contracts to immediately invest incoming cash in the market, or sell futures in response to cash outflows, thereby simulating a fully invested position in the underlying index while maintaining a cash balance for liquidity. The fund may seek to enhance returns by using futures contracts instead of the underlying securities when futures are believed to be priced more attractively than the underlying securities. The primary risks associated with the use of futures contracts are imperfect correlation between changes in market values of stocks held by the fund and the prices of futures contracts, and the possibility of an illiquid market. Counterparty risk involving futures is mitigated because a regulated clearinghouse is the counterparty instead of the clearing broker. To further mitigate counterparty risk, the fund trades futures contracts on an exchange, monitors the financial strength of its clearing brokers and clearinghouse, and has entered into clearing agreements with its clearing brokers. The clearinghouse imposes initial margin requirements to secure the fund’s performance and requires daily settlement of variation margin representing changes in the market value of each contract.
Futures contracts are valued at their quoted daily settlement prices. The aggregate settlement values of the contracts are not recorded in the Statement of Net Assets. Fluctuations in the value of the contracts are recorded in the Statement of Net Assets as an asset (liability) and in the Statement of Operations as unrealized appreciation (depreciation) until the contracts are closed, when they are recorded as realized futures gains (losses).
During the year ended December 31, 2016, the fund’s average investments in long and short futures contracts represented less than 1% and 0% of net assets, respectively, based on the average of aggregate settlement values at each quarter-end during the period.
63
Small-Cap Value Index Fund
3. Swap Contracts: The fund has entered into equity swap contracts to earn the total return on selected reference stocks in the fund’s target index. Under the terms of the swaps, the fund receives the total return on the referenced stock (i.e., receiving the increase or paying the decrease in value of the selected reference stock and receiving the equivalent of any dividends in respect of the selected referenced stock) over a specified period of time, applied to a notional amount that represents the value of a designated number of shares of the selected reference stock at the beginning of the equity swap contract. The fund also pays a floating rate that is based on short-term interest rates, applied to the notional amount. At the same time, the fund invests an amount approximating the notional amount of the swap in high-quality temporary cash investments.
The notional amounts of swap contracts are not recorded in the Statement of Net Assets. Swaps are valued daily based on market quotations received from independent pricing services or recognized dealers and the change in value is recorded in the Statement of Net Assets as an asset (liability) and in the Statement of Operations as unrealized appreciation (depreciation) until termination of the swap, at which time realized gain (loss) is recorded. A risk associated with all types of swaps is the possibility that a counterparty may default on its obligation to pay net amounts due to the fund. The fund’s maximum amount subject to counterparty risk is the unrealized appreciation on the swap contract. The fund mitigates its counterparty risk by entering into swaps only with a diverse group of prequalified counterparties, monitoring their financial strength, entering into master netting arrangements with its counterparties, and requiring its counterparties to transfer collateral as security for their performance. In the absence of a default, the collateral pledged or received by the fund cannot be repledged, resold or rehypothecated. In the event of a counterparty’s default (including bankruptcy), the fund may terminate any swap contracts with that counterparty, determine the net amount owed by either party in accordance with its master netting arrangements, and sell or retain any collateral held up to the net amount owed to the fund under the master netting arrangements. The swap contracts contain provisions whereby a counterparty may terminate open contracts if the fund net assets decline below a certain level, triggering a payment by the fund if the fund is in a net liability position at the time of the termination. The payment amount would be reduced by any collateral the fund has pledged. Any securities pledged as collateral for open contracts are noted in the Statement of Net Assets. The value of collateral received or pledged is compared daily to the value of the swap contracts exposure with each counterparty, and any difference, if in excess of a specified minimum transfer amount, is adjusted and settled within two business days.
During the year ended December 31, 2016, the fund’s average amounts of investments in total return swaps represented less than 1% of net assets, based on the average of notional amounts at each quarter-end during the period.
4. Federal Income Taxes: The fund intends to continue to qualify as a regulated investment company and distribute all of its taxable income. Management has analyzed the fund’s tax positions taken for all open federal income tax years (December 31, 2013–2016), and has concluded that no provision for federal income tax is required in the fund’s financial statements.
5. Distributions: Distributions to shareholders are recorded on the ex-dividend date.
6. Securities Lending: To earn additional income, the fund lends its securities to qualified institutional borrowers. Security loans are subject to termination by the fund at any time, and are required to be secured at all times by collateral in an amount at least equal to the market value of securities loaned. Daily market fluctuations could cause the value of loaned securities to be more or less than the value
64
Small-Cap Value Index Fund
of the collateral received. When this occurs, the collateral is adjusted and settled on the next business day. The fund further mitigates its counterparty risk by entering into securities lending transactions only with a diverse group of prequalified counterparties, monitoring their financial strength, and entering into master securities lending agreements with its counterparties. The master securities lending agreements provide that, in the event of a counterparty’s default (including bankruptcy), the fund may terminate any loans with that borrower, determine the net amount owed, and sell or retain the collateral up to the net amount owed to the fund; however, such actions may be subject to legal proceedings. While collateral mitigates counterparty risk, in the absence of a default the fund may experience delays and costs in recovering the securities loaned. The fund invests cash collateral received in Vanguard Market Liquidity Fund, and records a liability in the Statement of Net Assets for the return of the collateral, during the period the securities are on loan. Securities lending income represents fees charged to borrowers plus income earned on invested cash collateral, less expenses associated with the loan. During the term of the loan, the fund is entitled to all distributions made on or in respect of the loaned securities.
7. Credit Facility: The fund and certain other funds managed by The Vanguard Group (“Vanguard”) participate in a $3.1 billion committed credit facility provided by a syndicate of lenders pursuant to a credit agreement that may be renewed annually; each fund is individually liable for its borrowings, if any, under the credit facility. Borrowings may be utilized for temporary and emergency purposes, and are subject to the fund’s regulatory and contractual borrowing restrictions. The participating funds are charged administrative fees and an annual commitment fee of 0.10% of the undrawn amount of the facility; these fees are allocated to the funds based on a method approved by the fund’s board of trustees and included in Management and Administrative expenses on the fund’s Statement of Operations. Any borrowings under this facility bear interest at a rate based upon the higher of the one-month London Interbank Offered Rate, federal funds effective rate, or overnight bank funding rate plus an agreed-upon spread.
The fund had no borrowings outstanding at December 31, 2016, or at any time during the period then ended.
8. Other: Dividend income is recorded on the ex-dividend date. Interest income includes income distributions received from Vanguard Market Liquidity Fund and is accrued daily. Premiums and discounts on debt securities purchased are amortized and accreted, respectively, to interest income over the lives of the respective securities. Security transactions are accounted for on the date securities are bought or sold. Costs used to determine realized gains (losses) on the sale of investment securities are those of the specific securities sold.
Each class of shares has equal rights as to assets and earnings, except that each class separately bears certain class-specific expenses related to maintenance of shareholder accounts (included in Management and Administrative expenses) and shareholder reporting. Marketing and distribution expenses are allocated to each class of shares based on a method approved by the board of trustees. Income, other non-class-specific expenses, and gains and losses on investments are allocated to each class of shares based on its relative net assets.
B. In accordance with the terms of a Funds’ Service Agreement (the “FSA”) between Vanguard and the fund, Vanguard furnishes to the fund investment advisory, corporate management, administrative, marketing, and distribution services at Vanguard’s cost of operations (as defined by the FSA). These costs of operations are allocated to the fund based on methods and guidelines approved by the board
65
Small-Cap Value Index Fund
of trustees. Vanguard does not require reimbursement in the current period for certain costs of operations (such as deferred compensation/benefits and risk/insurance costs); the fund’s liability for these costs of operations is included in Payables to Vanguard on the Statement of Net Assets.
Upon the request of Vanguard, the fund may invest up to 0.40% of its net assets as capital in Vanguard. At December 31, 2016, the fund had contributed to Vanguard capital in the amount of $1,754,000, representing 0.01% of the fund’s net assets and 0.70% of Vanguard’s capitalization. The fund’s trustees and officers are also directors and employees, respectively, of Vanguard.
C. Various inputs may be used to determine the value of the fund’s investments. These inputs are summarized in three broad levels for financial statement purposes. The inputs or methodologies used to value securities are not necessarily an indication of the risk associated with investing in those securities.
Level 1—Quoted prices in active markets for identical securities.
Level 2—Other significant observable inputs (including quoted prices for similar securities, interest rates, prepayment speeds, credit risk, etc.).
Level 3—Significant unobservable inputs (including the fund’s own assumptions used to determine the fair value of investments).
The following table summarizes the market value of the fund’s investments as of December 31, 2016, based on the inputs used to value them:
| | | |
| | Level 1 | Level 2 | Level 3 |
| Investments | ($000) | ($000) | ($000) |
| Common Stocks | 24,678,796 | — | 1,196 |
| Temporary Cash Investments | 283,592 | 4,168 | — |
| Futures Contracts—Liabilities1 | (358) | — | — |
| Swap Contracts—Assets | — | 462 | — |
| Swap Contracts—Liabilities | — | (693) | — |
| Total | 24,962,030 | 3,937 | 1,196 |
| 1 Represents variation margin on the last day of the reporting period. |
D. At December 31, 2016, the aggregate settlement value of open futures contracts and the related unrealized appreciation (depreciation) were:
| | | | |
| | | | ($000) |
| | | | Aggregate | |
| | | Number of | Settlement | Unrealized |
| | | Long (Short) | Value | Appreciation |
| Futures Contracts | Expiration | Contracts | Long (Short) | (Depreciation) |
| E-mini Russell 2000 Index | March 2017 | 850 | 57,668 | (435) |
| E-mini S&P MidCap 400 Index | March 2017 | 168 | 27,873 | (535) |
| | | | | (970) |
Unrealized appreciation (depreciation) on open futures contracts is required to be treated as realized gain (loss) for tax purposes.
66
Small-Cap Value Index Fund
| | | | | |
| At December 31, 2016, the fund had the following open total return swap contracts: | |
| | | | | Floating | Unrealized |
| | | | Notional | Interest Rate | Appreciation |
| | Termination | | Amount | Received | (Depreciation) |
| Reference Entity | Date | Counterparty | ($000) | (Paid) | ($000) |
| Ambac Financial Group Inc. | 1/6/17 | GSCM | 5,774 | (1.054%) | (693) |
| SLM Corp | 2/21/17 | GSCM | 21,990 | (1.149%) | 462 |
| | | | | | (231) |
| GSCM—Goldman Sachs Capital Management. |
E. Distributions are determined on a tax basis and may differ from net investment income and realized capital gains for financial reporting purposes. Differences may be permanent or temporary. Permanent differences are reclassified among capital accounts in the financial statements to reflect their tax character. Temporary differences arise when certain items of income, expense, gain, or loss are recognized in different periods for financial statement and tax purposes. These differences will reverse at some time in the future. Differences in classification may also result from the treatment of short-term gains as ordinary income for tax purposes.
During the year ended December 31, 2016, the fund realized $792,428,000 of net capital gains resulting from in-kind redemptions—in which shareholders exchanged fund shares for securities held by the fund rather than for cash. Because such gains are not taxable to the fund, and are not distributed to shareholders, they have been reclassified from accumulated net realized losses to paid-in capital.
Realized and unrealized gains (losses) on certain of the fund’s swap contracts are treated as ordinary income (loss) for tax purposes. Realized gains of $11,582,000 on swap contracts have been reclassified from accumulated net realized losses to overdistributed net investment income.
For tax purposes, at December 31, 2016, the fund had $7,201,000 of ordinary income available for distribution. At December 31, 2016, the fund had available capital losses totaling $1,328,580,000 to offset future net capital gains. Of this amount, $876,582,000 is subject to expiration dates; $487,808,000 may be used to offset future net capital gains through December 31, 2017 and $388,774,000 through December 31, 2018. Capital losses of $451,998,000 realized beginning in fiscal 2011 may be carried forward indefinitely under the Regulated Investment Company Modernization Act of 2010, but must be used before any expiring loss carryforwards.
At December 31, 2016, the cost of investment securities for tax purposes was $19,998,467,000. Net unrealized appreciation of investment securities for tax purposes was $4,969,285,000, consisting of unrealized gains of $5,851,753,000 on securities that had risen in value since their purchase and $882,468,000 in unrealized losses on securities that had fallen in value since their purchase.
F. During the year ended December 31, 2016, the fund purchased $9,838,436,000 of investment securities and sold $5,619,346,000 of investment securities, other than temporary cash investments. Purchases and sales include $4,557,464,000 and $2,078,604,000, respectively, in connection with in-kind purchases and redemptions of the fund’s capital shares.
67
Small-Cap Value Index Fund
The fund purchased securities from and sold securities to other Vanguard funds or accounts managed by Vanguard or its affiliates, in accordance with procedures adopted by the board of trustees in compliance with Rule 17a-7 of the Investment Company Act of 1940. For the year ended December 31, 2016, such purchases and sales were $1,337,676,000 and $529,722,000, respectively; these amounts are included in the purchases and sales of investment securities noted above.
G. Capital share transactions for each class of shares were:
| | | | |
| | Year Ended December 31, |
| | 2016 | 2015 |
| | Amount | Shares | Amount | Shares |
| | ($000) | (000) | ($000) | (000) |
| Investor Shares | | | | |
| Issued | 532,293 | 20,585 | 553,081 | 21,859 |
| Issued in Lieu of Cash Distributions | 35,750 | 1,344 | 34,543 | 1,457 |
| Redeemed | (594,535) | (23,881) | (773,577) | (30,550) |
| Net Increase (Decrease)—Investor Shares | (26,492) | (1,952) | (185,953) | (7,234) |
| ETF Shares | | | | |
| Issued | 4,897,606 | 44,777 | 3,498,833 | 33,427 |
| Issued in Lieu of Cash Distributions | — | — | — | — |
| Redeemed | (2,104,842) | (19,225) | (2,297,140) | (22,050) |
| Net Increase (Decrease)—ETF Shares | 2,792,764 | 25,552 | 1,201,693 | 11,377 |
| Admiral Shares | | | | |
| Issued | 2,512,864 | 54,695 | 1,945,006 | 43,019 |
| Issued in Lieu of Cash Distributions | 140,487 | 2,939 | 110,002 | 2,591 |
| Redeemed | (1,261,376) | (27,751) | (921,577) | (20,420) |
| Net Increase (Decrease)—Admiral Shares | 1,391,975 | 29,883 | 1,133,431 | 25,190 |
| Institutional Shares | | | | |
| Issued | 800,851 | 31,696 | 1,034,933 | 40,325 |
| Issued in Lieu of Cash Distributions | 47,233 | 1,780 | 42,411 | 1,788 |
| Redeemed | (828,766) | (32,642) | (492,233) | (19,662) |
| Net Increase (Decrease)—Institutional Shares | 19,318 | 834 | 585,111 | 22,451 |
H. Management has determined that no material events or transactions occurred subsequent to December 31, 2016, that would require recognition or disclosure in these financial statements.
68
Report of Independent Registered
Public Accounting Firm
To the Board of Trustees of Vanguard Index Funds and the Shareholders of Vanguard Small-Cap Index Fund, Vanguard Small-Cap Growth Index Fund and Vanguard Small-Cap Value Index Fund: In our opinion, the accompanying statements of net assets—investments summary and the related statements of operations and of changes in net assets and the financial highlights present fairly, in all material respects, the financial position of Vanguard Small-Cap Index Fund, Vanguard Small-Cap Growth Index Fund and Vanguard Small-Cap Value Index Fund (constituting separate portfolios of Vanguard Index Funds, hereafter referred to as the “Funds”) at December 31, 2016, the results of each of their operations for the year then ended, the changes in each of their net assets for each of the two years in the period then ended, and the financial highlights for each of the five years in the period then ended, in conformity with accounting principles generally accepted in the United States of America. These financial statements and financial highlights (hereafter referred to as “financial statements”) are the responsibility of the Funds’ management. Our responsibility is to express an opinion on these financial statements based on our audits. We conducted our audits of these financial statements in accordance with the standards of the Public Company Accounting Oversight Board (United States). Those standards require that we plan and perform the audit to obtain reasonable assurance about whether the financial statements are free of material misstatement. An audit includes examining, on a test basis, evidence supporting the amounts and disclosures in the financial statements, assessing the accounting principles used and significant estimates made by management, and evaluating the overall financial statement presentation. We believe that our audits, which included confirmation of securities at December 31, 2016 by correspondence with the custodians and brokers and by agreement to the underlying ownership records of the transfer agent, provide a reasonable basis for our opinion.
/s/PricewaterhouseCoopers LLP
Philadelphia, Pennsylvania
February 17, 2017
69

Special 2016 tax information (unaudited) for Vanguard U.S. Stock Index Funds (Small-Capitalization Portfolios)
This information for the fiscal year ended December 31, 2016, is included pursuant to provisions of the Internal Revenue Code.
The funds distributed qualified dividend income to shareholders during the fiscal year as follows:
| |
| Fund | ($000) |
| Small-Cap Index Fund | 667,176 |
| Small-Cap Growth Index Fund | 89,603 |
| Small-Cap Value Index Fund | 304,041 |
For corporate shareholders, the percentage of investment income (dividend income plus short-term gains, if any) that qualifies for the dividends-received deduction is as follows:
| |
| Fund | Percentage |
| Small-Cap Index Fund | 64.3% |
| Small-Cap Growth Index Fund | 49.1 |
| Small-Cap Value Index Fund | 71.9 |
70
Your Fund’s After-Tax Returns
This table presents returns for your fund both before and after taxes. The after-tax returns are shown in two ways: (1) assuming that an investor owned the fund during the entire period and paid taxes on the fund’s distributions, and (2) assuming that an investor paid taxes on the fund’s distributions and sold all shares at the end of each period.
Calculations are based on the highest individual federal income tax and capital gains tax rates in effect at the times of the distributions and the hypothetical sales. State and local taxes were not considered. After-tax returns reflect any qualified dividend income. (In the example, returns after the sale of fund shares may be higher than those assuming no sale. This occurs when the sale would have produced a capital loss. The calculation assumes that the investor received a tax deduction for the loss.) The table shows returns for Investor Shares only; returns for other share classes will differ. Please note that your actual after-tax returns will depend on your tax situation and may differ from those shown. Also note that if you own the fund in a tax-deferred account, such as an individual retirement account or a 401(k) plan, this information does not apply to you. Such accounts are not subject to current taxes.
Finally, keep in mind that a fund’s performance—whether before or after taxes—does not guarantee future results.
| | | |
| Average Annual Total Returns: U.S. Stock Index Funds Small-Capitalization Portfolios | |
| Periods Ended December 31, 2016 | | | |
| |
| | One | Five | Ten |
| | Year | Years | Years |
| Small-Cap Index Fund Investor Shares | | | |
| Returns Before Taxes | 18.17% | 14.68% | 8.04% |
| Returns After Taxes on Distributions | 17.65 | 14.23 | 7.69 |
| Returns After Taxes on Distributions and Sale of Fund Shares | 10.48 | 11.70 | 6.44 |
| |
| | One | Five | Ten |
| | Year | Years | Years |
| Small-Cap Growth Index Fund Investor Shares | | | |
| Returns Before Taxes | 10.61% | 12.65% | 8.09% |
| Returns After Taxes on Distributions | 10.24 | 12.37 | 7.91 |
| Returns After Taxes on Distributions and Sale of Fund Shares | 6.10 | 10.05 | 6.55 |
| |
| | One | Five | Ten |
| | Year | Years | Years |
| Small-Cap Value Index Fund Investor Shares | | | |
| Returns Before Taxes | 24.65% | 16.21% | 7.63% |
| Returns After Taxes on Distributions | 24.00 | 15.62 | 7.12 |
| Returns After Taxes on Distributions and Sale of Fund Shares | 14.22 | 12.94 | 6.03 |
71
About Your Fund’s Expenses
As a shareholder of the fund, you incur ongoing costs, which include costs for portfolio management, administrative services, and shareholder reports (like this one), among others. Operating expenses, which are deducted from a fund’s gross income, directly reduce the investment return of the fund.
A fund’s expenses are expressed as a percentage of its average net assets. This figure is known as the expense ratio. The following examples are intended to help you understand the ongoing costs (in dollars) of investing in your fund and to compare these costs with those of other mutual funds. The examples are based on an investment of $1,000 made at the beginning of the period shown and held for the entire period.
The accompanying table illustrates your fund’s costs in two ways:
• Based on actual fund return. This section helps you to estimate the actual expenses that you paid over the period. The ”Ending Account Value“ shown is derived from the fund‘s actual return, and the third column shows the dollar amount that would have been paid by an investor who started with $1,000 in the fund. You may use the information here, together with the amount you invested, to estimate the expenses that you paid over the period.
To do so, simply divide your account value by $1,000 (for example, an $8,600 account value divided by $1,000 = 8.6), then multiply the result by the number given for your fund under the heading ”Expenses Paid During Period.“
• Based on hypothetical 5% yearly return. This section is intended to help you compare your fund‘s costs with those of other mutual funds. It assumes that the fund had a yearly return of 5% before expenses, but that the expense ratio is unchanged. In this case—because the return used is not the fund’s actual return—the results do not apply to your investment. The example is useful in making comparisons because the Securities and Exchange Commission requires all mutual funds to calculate expenses based on a 5% return. You can assess your fund’s costs by comparing this hypothetical example with the hypothetical examples that appear in shareholder reports of other funds.
Note that the expenses shown in the table are meant to highlight and help you compare ongoing costs only and do not reflect transaction costs incurred by the fund for buying and selling securities. Further, the expenses do not include any purchase, redemption, or account service fees described in the fund prospectus. If such fees were applied to your account, your costs would be higher. Your fund does not carry a “sales load.”
The calculations assume no shares were bought or sold during the period. Your actual costs may have been higher or lower, depending on the amount of your investment and the timing of any purchases or redemptions.
You can find more information about the fund’s expenses, including annual expense ratios, in the Financial Statements section of this report. For additional information on operating expenses and other shareholder costs, please refer to your fund’s current prospectus.
72
| | | |
| Six Months Ended December 31, 2016 | | | |
| | Beginning | Ending | Expenses |
| | Account Value | Account Value | Paid During |
| | 6/30/2016 | 12/31/2016 | Period |
| Based on Actual Fund Return | | | |
| Small-Cap Index Fund | | | |
| Investor Shares | $1,000.00 | $1,125.87 | $0.91 |
| ETF Shares | 1,000.00 | 1,126.47 | 0.27 |
| Admiral Shares | 1,000.00 | 1,126.50 | 0.27 |
| Institutional Shares | 1,000.00 | 1,126.55 | 0.21 |
| Institutional Plus Shares | 1,000.00 | 1,126.49 | 0.16 |
| Small-Cap Growth Index Fund | | | |
| Investor Shares | $1,000.00 | $1,081.17 | $0.94 |
| ETF Shares | 1,000.00 | 1,081.84 | 0.31 |
| Admiral Shares | 1,000.00 | 1,081.67 | 0.31 |
| Institutional Shares | 1,000.00 | 1,081.83 | 0.26 |
| Small-Cap Value Index Fund | | | |
| Investor Shares | $1,000.00 | $1,162.70 | $0.98 |
| ETF Shares | 1,000.00 | 1,163.26 | 0.33 |
| Admiral Shares | 1,000.00 | 1,163.21 | 0.33 |
| Institutional Shares | 1,000.00 | 1,163.13 | 0.29 |
73
| | | |
| Six Months Ended December 31, 2016 | | | |
| | Beginning | Ending | Expenses |
| | Account Value | Account Value | Paid During |
| | 6/30/2016 | 12/31/2016 | Period |
| Based on Hypothetical 5% Yearly Return | | | |
| Small-Cap Index Fund | | | |
| Investor Shares | $1,000.00 | $1,024.28 | $0.86 |
| ETF Shares | 1,000.00 | 1,024.89 | 0.25 |
| Admiral Shares | 1,000.00 | 1,024.89 | 0.25 |
| Institutional Shares | 1,000.00 | 1,024.94 | 0.20 |
| Institutional Plus Shares | 1,000.00 | 1,024.99 | 0.15 |
| Small-Cap Growth Index Fund | | | |
| Investor Shares | $1,000.00 | $1,024.23 | $0.92 |
| ETF Shares | 1,000.00 | 1,024.84 | 0.31 |
| Admiral Shares | 1,000.00 | 1,024.84 | 0.31 |
| Institutional Shares | 1,000.00 | 1,024.89 | 0.25 |
| Small-Cap Value Index Fund | | | |
| Investor Shares | $1,000.00 | $1,024.23 | $0.92 |
| ETF Shares | 1,000.00 | 1,024.84 | 0.31 |
| Admiral Shares | 1,000.00 | 1,024.84 | 0.31 |
| Institutional Shares | 1,000.00 | 1,024.87 | 0.27 |
The calculations are based on expenses incurred in the most recent six-month period. The funds’ annualized six-month expense ratios for that
period are: for the Small-Cap Index Fund, 0.17% for Investor Shares, 0.05% for ETF Shares, 0.05% for Admiral Shares, 0.04% for Institutional
Shares, and 0.03% for Institutional Plus Shares; for the Small-Cap Growth Index Fund, 0.18% for Investor Shares, 0.06% for ETF Shares,
0.06% for Admiral Shares, and 0.05% for Institutional Shares; and for the Small-Cap Value Index Fund, 0.18% for Investor Shares, 0.06% for
ETF Shares, 0.06% for Admiral Shares, and 0.05% for Institutional Shares. The dollar amounts shown as “Expenses Paid” are equal to the
annualized expense ratio multiplied by the average account value over the period, multiplied by the number of days in the most recent
six-month period, then divided by the number of days in the most recent 12-month period (184/366).
74
Glossary
30-Day SEC Yield. A fund’s 30-day SEC yield is derived using a formula specified by the U.S. Securities and Exchange Commission. Under the formula, data related to the fund’s security holdings in the previous 30 days are used to calculate the fund’s hypothetical net income for that period, which is then annualized and divided by the fund’s estimated average net assets over the calculation period. For the purposes of this calculation, a security’s income is based on its current market yield to maturity (for bonds), its actual income (for asset-backed securities), or its projected dividend yield (for stocks). Because the SEC yield represents hypothetical annualized income, it will differ—at times significantly—from the fund’s actual experience. As a result, the fund’s income distributions may be higher or lower than implied by the SEC yield.
Beta. A measure of the magnitude of a fund’s past share-price fluctuations in relation to the ups and downs of a given market index. The index is assigned a beta of 1.00. Compared with a given index, a fund with a beta of 1.20 typically would have seen its share price rise or fall by 12% when the index rose or fell by 10%. For this report, beta is based on returns over the past 36 months for both the fund and the index. Note that a fund’s beta should be reviewed in conjunction with its R-squared (see definition). The lower the R-squared, the less correlation there is between the fund and the index, and the less reliable beta is as an indicator of volatility.
Dividend Yield. Dividend income earned by stocks, expressed as a percentage of the aggregate market value (or of net asset value, for a fund). The yield is determined by dividing the amount of the annual dividends by the aggregate value (or net asset value) at the end of the period. For a fund, the dividend yield is based solely on stock holdings and does not include any income produced by other investments.
Earnings Growth Rate. The average annual rate of growth in earnings over the past five years for the stocks now in a fund.
Equity Exposure. A measure that reflects a fund’s investments in stocks and stock futures. Any holdings in short-term reserves are excluded.
Expense Ratio. A fund’s total annual operating expenses expressed as a percentage of the fund’s average net assets. The expense ratio includes management and administrative expenses, but does not include the transaction costs of buying and selling portfolio securities.
Foreign Holdings. The percentage of a fund represented by securities or depositary receipts of companies based outside the United States.
Inception Date. The date on which the assets of a fund (or one of its share classes) are first invested in accordance with the fund’s investment objective. For funds with a subscription period, the inception date is the day after that period ends. Investment performance is measured from the inception date.
Median Market Cap. An indicator of the size of companies in which a fund invests; the midpoint of market capitalization (market price x shares outstanding) of a fund’s stocks, weighted by the proportion of the fund’s assets invested in each stock. Stocks representing half of the fund’s assets have market capitalizations above the median, and the rest are below it.
Price/Book Ratio. The share price of a stock divided by its net worth, or book value, per share. For a fund, the weighted average price/book ratio of the stocks it holds.
75
Price/Earnings Ratio. The ratio of a stock’s current price to its per-share earnings over the past year. For a fund, the weighted average P/E of the stocks it holds. P/E is an indicator of market expectations about corporate prospects; the higher the P/E, the greater the expectations for a company’s future growth.
R-Squared. A measure of how much of a fund’s past returns can be explained by the returns from the market in general, as measured by a given index. If a fund’s total returns were precisely synchronized with an index’s returns, its R-squared would be 1.00. If the fund’s returns bore no relationship to the index’s returns, its R-squared would be 0. For this report, R-squared is based on returns over the past 36 months for both the fund and the index.
Return on Equity. The annual average rate of return generated by a company during the past five years for each dollar of shareholder’s equity (net income divided by shareholder’s equity). For a fund, the weighted average return on equity for the companies whose stocks it holds.
Short-Term Reserves. The percentage of a fund invested in highly liquid, short-term securities that can be readily converted to cash.
Turnover Rate. An indication of the fund’s trading activity. Funds with high turnover rates incur higher transaction costs and may be more likely to distribute capital gains (which may be taxable to investors). The turnover rate excludes in-kind transactions, which have minimal impact on costs.
Benchmark Information
Spliced Small-Cap Growth Index: S&P SmallCap 600 Growth Index (formerly known as the S&P SmallCap 600/Barra Growth Index) through May 16, 2003; MSCI US Small Cap Growth Index through April 16, 2013; CRSP US Small Cap Growth Index thereafter.
Spliced Small-Cap Index: Russell 2000 Index through May 16, 2003; MSCI US Small Cap 1750 Index through January 30, 2013; CRSP US Small Cap Index thereafter.
Spliced Small-Cap Value Index: S&P SmallCap 600 Value Index (formerly known as the S&P SmallCap 600/Barra Value Index) through May 16, 2003; MSCI US Small Cap Value Index through April 16, 2013; CRSP US Small Cap Value Index thereafter.
76
This page intentionally left blank.
This page intentionally left blank.
This page intentionally left blank.
The People Who Govern Your Fund
The trustees of your mutual fund are there to see that the fund is operated and managed in your best interests since, as a shareholder, you are a part owner of the fund. Your fund’s trustees also serve on the board of directors of The Vanguard Group, Inc., which is owned by the Vanguard funds and provides services to them on an at-cost basis.
A majority of Vanguard’s board members are independent, meaning that they have no affiliation with Vanguard or the funds they oversee, apart from the sizable personal investments they have made as private individuals. The independent board members have distinguished backgrounds in business, academia, and public service. Each of the trustees and executive officers oversees 198 Vanguard funds.
The following table provides information for each trustee and executive officer of the fund. The mailing address of the trustees and officers is P.O. Box 876, Valley Forge, PA 19482. More information about the trustees is in the Statement of Additional Information, which can be obtained, without charge, by contacting Vanguard at 800-662-7447, or online at vanguard.com.
InterestedTrustee1
F. William McNabb III
Born 1957. Trustee Since July 2009. Chairman of the Board. Principal Occupation(s) During the Past Five Years and Other Experience: Chairman of the Board of The Vanguard Group, Inc., and of each of the investment companies served by The Vanguard Group, since January 2010; Director of The Vanguard Group since 2008; Chief Executive Officer and President of The Vanguard Group, and of each of the investment companies served by The Vanguard Group, since 2008; Director of Vanguard Marketing Corporation; Managing Director of The Vanguard Group (1995–2008).
IndependentTrustees
Emerson U. Fullwood
Born 1948. Trustee Since January 2008. Principal Occupation(s) During the Past Five Years and Other Experience: Executive Chief Staff and Marketing Officer for North America and Corporate Vice President (retired 2008) of Xerox Corporation (document management products and services); Executive in Residence and 2009–2010 Distinguished Minett Professor at the Rochester Institute of Technology; Lead Director of SPX FLOW, Inc. (multi-industry manufacturing); Director of the United Way of Rochester, the University of Rochester Medical Center, Monroe Community College Foundation, North Carolina A&T University, and Roberts Wesleyan College.
Rajiv L. Gupta
Born 1945. Trustee Since December 2001.2 Principal Occupation(s) During the Past Five Years and Other Experience: Chairman and Chief Executive Officer (retired 2009) and President (2006–2008) of Rohm and Haas Co. (chemicals); Director of Tyco International plc (diversified manufacturing and services), HP Inc. (printer and personal computer manufacturing), and Delphi Automotive plc (automotive components); Senior Advisor at New Mountain Capital.
Amy Gutmann
Born 1949. Trustee Since June 2006. Principal Occupation(s) During the Past Five Years and Other Experience: President of the University of Pennsylvania; Christopher H. Browne Distinguished Professor of Political Science, School of Arts and Sciences, and Professor of Communication, Annenberg School for Communication, with secondary faculty appointments in the Department of Philosophy, School of Arts and Sciences, and at the Graduate School of Education, University of Pennsylvania; Trustee of the National Constitution Center; Chair of the Presidential Commission for the Study of Bioethical Issues.
JoAnn Heffernan Heisen
Born 1950. Trustee Since July 1998. Principal Occupation(s) During the Past Five Years and Other Experience: Corporate Vice President and Chief Global Diversity Officer (retired 2008) and Member of the Executive Committee (1997–2008) of Johnson & Johnson (pharmaceuticals/medical devices/consumer products); Director of Skytop Lodge Corporation (hotels) and the Robert Wood Johnson Foundation; Member of the Advisory Board of the Institute for Women’s Leadership at Rutgers University.
F. Joseph Loughrey
Born 1949. Trustee Since October 2009. Principal Occupation(s) During the Past Five Years and Other Experience: President and Chief Operating Officer (retired 2009) of Cummins Inc. (industrial machinery); Chairman of the Board of Hillenbrand, Inc. (specialized consumer services), and of Oxfam America; Director of SKF AB (industrial machinery), Hyster-Yale Materials Handling, Inc. (forklift trucks), the Lumina Foundation for Education, and the V Foundation for Cancer Research; Member of the Advisory Council for the College of Arts and Letters and of the Advisory Board to the Kellogg Institute for International Studies, both at the University of Notre Dame.
Mark Loughridge
Born 1953. Trustee Since March 2012. Principal Occupation(s) During the Past Five Years and Other Experience: Senior Vice President and Chief Financial Officer (retired 2013) at IBM (information technology services); Fiduciary Member of IBM’s Retirement Plan Committee (2004–2013); Director of the Dow Chemical Company; Member of the Council on Chicago Booth.
Scott C. Malpass
Born 1962. Trustee Since March 2012. Principal Occupation(s) During the Past Five Years and Other Experience: Chief Investment Officer and Vice President at the University of Notre Dame; Assistant Professor of Finance at the Mendoza College of Business at Notre Dame; Member of the Notre Dame 403(b) Investment Committee, the Board of Advisors for Spruceview Capital Partners, and the Investment Advisory Committee of Major League Baseball; Board Member of TIFF Advisory Services, Inc., and Catholic Investment Services, Inc. (investment advisors).
André F. Perold
Born 1952. Trustee Since December 2004. Principal Occupation(s) During the Past Five Years and Other Experience: George Gund Professor of Finance and Banking, Emeritus at the Harvard Business School (retired 2011); Chief Investment Officer and Managing Partner of HighVista Strategies LLC (private investment firm); Director of Rand Merchant Bank; Overseer of the Museum of Fine Arts Boston.
Peter F. Volanakis
Born 1955. Trustee Since July 2009. Principal Occupation(s) During the Past Five Years and Other Experience: President and Chief Operating Officer (retired 2010) of Corning Incorporated (communications equipment); Chairman of the Board of Trustees of Colby-Sawyer College; Member of the Advisory Board of the Norris Cotton Cancer Center.
Executive Officers
Glenn Booraem
Born 1967. Treasurer Since May 2015. Principal Occupation(s) During the Past Five Years and Other Experience: Principal of The Vanguard Group, Inc.; Treasurer of each of the investment companies served by The Vanguard Group; Controller of each of the investment companies served by The Vanguard Group (2010–2015); Assistant Controller of each of the investment companies served by The Vanguard Group (2001–2010).
Thomas J. Higgins
Born 1957. Chief Financial Officer Since September 2008. Principal Occupation(s) During the Past Five Years and Other Experience: Principal of The Vanguard Group, Inc.; Chief Financial Officer of each of the investment companies served by The Vanguard Group; Treasurer of each of the investment companies served by The Vanguard Group (1998–2008).
Peter Mahoney
Born 1974. Controller Since May 2015. Principal Occupation(s) During the Past Five Years and Other Experience: Head of Global Fund Accounting at The Vanguard Group, Inc.; Controller of each of the investment companies served by The Vanguard Group; Head of International Fund Services at The Vanguard Group (2008–2014).
Anne E. Robinson
Born 1970. Secretary Since September 2016. Principal Occupation(s) During the Past Five Years and Other Experience: Managing Director of The Vanguard Group, Inc.; General Counsel of The Vanguard Group; Secretary of The Vanguard Group and of each of the investment companies served by The Vanguard Group; Director and Senior Vice President of Vanguard Marketing Corporation; Managing Director and General Counsel of Global Cards and Consumer Services at Citigroup (2014–2016); Counsel at American Express (2003–2014).
| |
| Vanguard Senior Management Team |
| Mortimer J. Buckley | Thomas M. Rampulla |
| Martha G. King | Glenn W. Reed |
| John T. Marcante | Karin A. Risi |
| Chris D. McIsaac | Michael Rollings |
| James M. Norris | |
| |
| Chairman Emeritus and Senior Advisor |
| John J. Brennan | |
| Chairman, 1996–2009 | |
| Chief Executive Officer and President, 1996–2008 |
| |
| Founder | |
| John C. Bogle | |
| Chairman and Chief Executive Officer, 1974–1996 |
1 Mr. McNabb is considered an “interested person,” as defined in the Investment Company Act of 1940, because he is an officer of the Vanguard funds.
2 December 2002 for Vanguard Equity Income Fund, the Vanguard Municipal Bond Funds, and the Vanguard State Tax-Exempt Funds.
|  |
| | P.O. Box 2600 |
| | Valley Forge, PA 19482-2600 |
| |
| |
| |
| Connect with Vanguard® > vanguard.com |
| |
| |
| |
| Fund Information > 800-662-7447 | |
| Direct Investor Account Services > 800-662-2739 | |
| Institutional Investor Services > 800-523-1036 | |
| Text Telephone for People | |
| Who Are Deaf or Hard of Hearing > 800-749-7273 | |
| |
| This material may be used in conjunction | |
| with the offering of shares of any Vanguard | |
| fund only if preceded or accompanied by | |
| the fund’s current prospectus. | |
| |
| All comparative mutual fund data are from Lipper, a | |
| Thomson Reuters Company, or Morningstar, Inc., unless | |
| otherwise noted. | |
| |
| You can obtain a free copy of Vanguard’s proxy voting | |
| guidelines by visiting vanguard.com/proxyreporting or by | |
| calling Vanguard at 800-662-2739. The guidelines are | |
| also available from the SEC’s website, sec.gov. In | |
| addition, you may obtain a free report on how your fund | |
| voted the proxies for securities it owned during the 12 | |
| months ended June 30. To get the report, visit either | |
| vanguard.com/proxyreporting or sec.gov. | |
| |
| You can review and copy information about your fund at | |
| the SEC’s Public Reference Room in Washington, D.C. To | |
| find out more about this public service, call the SEC at | |
| 202-551-8090. Information about your fund is also | |
| available on the SEC’s website, and you can receive | |
| copies of this information, for a fee, by sending a | |
| request in either of two ways: via email addressed to | |
| publicinfo@sec.gov or via regular mail addressed to the | |
| Public Reference Section, Securities and Exchange | |
| Commission, Washington, DC 20549-1520. | |
| |
| | © 2017 The Vanguard Group, Inc. |
| | All rights reserved. |
| | Vanguard Marketing Corporation, Distributor. |
| |
| | Q480 022017 |

Annual Report | December 31, 2016
Vanguard U.S. Stock Index Funds
Mid-Capitalization Portfolios
Vanguard Extended Market Index Fund
Vanguard Mid-Cap Index Fund
Vanguard Mid-Cap Growth Index Fund
Vanguard Mid-Cap Value Index Fund
A new format, unwavering commitment
As you begin reading this report, you’ll notice that we’ve made some improvements to the opening sections—based on feedback from you, our clients.
Page 1 starts with a new ”Your Fund’s Performance at a Glance,” a concise, handy summary of how your fund performed during the period.
In the renamed ”Chairman’s Perspective,” Bill McNabb will focus on enduring principles and investment insights.
We’ve modified some tables, and eliminated some redundancy, but we haven’t removed any information.
At Vanguard, we’re always looking for better ways to communicate and to help you make sound investment decisions. Thank you for entrusting your assets to us.
| |
| Contents | |
| Your Fund’s Performance at a Glance. | 1 |
| Chairman’s Perspective. | 5 |
| Extended Market Index Fund. | 9 |
| Mid-Cap Index Fund. | 34 |
| Mid-Cap Growth Index Fund. | 57 |
| Mid-Cap Value Index Fund. | 74 |
| Your Fund’s After-Tax Returns. | 93 |
| About Your Fund’s Expenses. | 95 |
| Glossary. | 98 |
Please note: The opinions expressed in this report are just that—informed opinions. They should not be considered promises or advice.
Also, please keep in mind that the information and opinions cover the period through the date on the front of this report. Of course, the
risks of investing in your fund are spelled out in the prospectus.
See the Glossary for definitions of investment terms used in this report.
About the cover: No matter what language you speak, Vanguard has one consistent message and set of principles. Our primary
focus is on you, our clients. We conduct our business with integrity as a faithful steward of your assets. This message is shown
translated into seven languages, reflecting our expanding global presence.
Your Fund’s Performance at a Glance
• Returns for the 12 months ranged from about 15% for Vanguard Mid-Cap Value Index Fund to nearly 7% for Vanguard Mid-Cap Growth Index Fund. The Mid-Cap Index Fund, which contains both growth and value stocks, returned about 11%. Vanguard Extended Market Index Fund, which includes both small- and mid-capitalization holdings, finished with a return of about 16%.
• Each fund closely tracked its target index. The Extended Market Index Fund and Mid-Cap Growth Index Fund exceeded the average return of their peer funds, while the Mid-Cap Index Fund and the Mid-Cap Value Index Fund trailed the average return of their peers.
• Small-cap stocks outperformed large- and mid-caps, while value stocks outpaced growth.
• The financial sector was the top contributor for the Extended Market Index Fund, the Mid-Cap Index Fund, and the Mid-Cap Value Index Fund; industrials contributed the most to the Mid-Cap Growth Index Fund. Health care pulled down each fund’s returns.
| |
| Total Returns: Fiscal Year Ended December 31, 2016 | |
| | Total |
| | Returns |
| Vanguard Extended Market Index Fund | |
| Investor Shares | 15.99% |
| ETF Shares | |
| Market Price | 16.22 |
| Net Asset Value | 16.16 |
| Admiral™ Shares | 16.13 |
| Institutional Shares | 16.15 |
| Institutional Plus Shares | 16.18 |
| Institutional Select Shares (Inception: 6/27/2016) | 19.81 |
| S&P Completion Index | 15.95 |
| Mid-Cap Core Funds Average | 14.82 |
| Mid-Cap Core Funds Average: Derived from data provided by Lipper, a Thomson Reuters Company. |
1
| |
| | Total |
| | Returns |
| Vanguard Mid-Cap Index Fund | |
| Investor Shares | 11.07% |
| ETF Shares | |
| Market Price | 11.25 |
| Net Asset Value | 11.23 |
| Admiral Shares | 11.22 |
| Institutional Shares | 11.23 |
| Institutional Plus Shares | 11.24 |
| CRSP US Mid Cap Index | 11.25 |
| Mid-Cap Core Funds Average | 14.82 |
| Mid-Cap Core Funds Average: Derived from data provided by Lipper, a Thomson Reuters Company. | |
| |
| Vanguard Mid-Cap Growth Index Fund | |
| Investor Shares | 6.62% |
| ETF Shares | |
| Market Price | 6.79 |
| Net Asset Value | 6.75 |
| Admiral Shares | 6.75 |
| CRSP US Mid Cap Growth Index | 6.78 |
| Mid-Cap Growth Funds Average | 5.68 |
| Mid-Cap Growth Funds Average: Derived from data provided by Lipper, a Thomson Reuters Company. |
| |
| Vanguard Mid-Cap Value Index Fund | |
| Investor Shares | 15.11% |
| ETF Shares | |
| Market Price | 15.29 |
| Net Asset Value | 15.26 |
| Admiral Shares | 15.26 |
| CRSP US Mid Cap Value Index | 15.28 |
| Mid-Cap Value Funds Average | 18.26 |
| Mid-Cap Value Funds Average: Derived from data provided by Lipper, a Thomson Reuters Company. |
Admiral Shares carry lower expenses and are available to investors who meet certain account-balance requirements. Institutional Shares,
Institutional Plus Shares, and Institutional Select Shares are available to certain institutional investors who meet specific administrative,
service, and account-size criteria. The Vanguard ETF® Shares shown are traded on the NYSE Arca exchange and are available only through
brokers. The table provides ETF returns based on both the NYSE Arca market price and the net asset value for a share. U.S. Pat. Nos.
6,879,964; 7,337,138; 7,720,749; 7,925,573; 8,090,646; and 8,417,623.
For the ETF Shares, the market price is determined by the midpoint of the bid-offer spread as of the closing time of the New York Stock
Exchange (generally 4 p.m., Eastern time). The net asset value is also determined as of the NYSE closing time. For more information about
how the ETF Shares' market prices have compared with their net asset value, visit vanguard.com, select your ETF, and then select the Price
and Performance tab. The ETF premium/discount analysis there shows the percentages of days on which the ETF Shares' market price was
above or below the NAV.
2
| |
| Total Returns: Ten Years Ended December 31, 2016 | |
| | Average |
| | Annual Return |
| Extended Market Index Fund Investor Shares | 7.80% |
| S&P Completion Index | 7.84 |
| Mid-Cap Core Funds Average | 6.86 |
| Mid-Cap Core Funds Average: Derived from data provided by Lipper, a Thomson Reuters Company. |
| |
| Mid-Cap Index Fund Investor Shares | 7.52% |
| Spliced Mid-Cap Index | 7.70 |
| Mid-Cap Core Funds Average | 6.86 |
| For a benchmark description, see the Glossary. |
| Mid-Cap Core Funds Average: Derived from data provided by Lipper, a Thomson Reuters Company. |
| |
| Mid-Cap Growth Index Fund Investor Shares | 7.20% |
| Spliced Mid-Cap Growth Index | 7.38 |
| Mid-Cap Growth Funds Average | 6.42 |
| For a benchmark description, see the Glossary. | |
| Mid-Cap Growth Funds Average: Derived from data provided by Lipper, a Thomson Reuters Company. | |
| |
| Mid-Cap Value Index Fund Investor Shares | 7.53% |
| Spliced Mid-Cap Value Index | 7.72 |
| Mid-Cap Value Funds Average | 6.84 |
| For a benchmark description, see the Glossary. |
| Mid-Cap Value Funds Average: Derived from data provided by Lipper, a Thomson Reuters Company. |
The figures shown represent past performance, which is not a guarantee of future results. (Current performance may be
lower or higher than the performance data cited. For performance data current to the most recent month-end, visit our
website at vanguard.com/performance.) Note, too, that both investment returns and principal value can fluctuate widely, so
an investor’s shares, when sold, could be worth more or less than their original cost.
3
| | | | | | | |
| Expense Ratios | | | | | | | |
| Your Fund Compared With Its Peer Group | | | | | | |
| | Investor | ETF | Admiral | Institutional | Institutional | Institutional | Peer Group |
| | Shares | Shares | Shares | Shares | Plus Shares | Select Shares | Average |
| Extended Market Index | | | | | | | |
| Fund | 0.22% | 0.09% | 0.09% | 0.07% | 0.05% | 0.02% | 1.18% |
| Mid-Cap Index Fund | 0.20 | 0.08 | 0.08 | 0.07 | 0.05 | — | 1.18 |
| Mid-Cap Growth Index Fund | 0.20 | 0.08 | 0.08 | — | — | — | 1.31 |
| Mid-Cap Value Index Fund | 0.20 | 0.08 | 0.08 | — | — | — | 1.25 |
The fund expense ratios shown are from the prospectus dated April 27, 2016, and represent estimated costs for the current fiscal year. For the
fiscal year ended December 31, 2016, the funds’ expense ratios were: for the Extended Market Index Fund, 0.21% for Investor Shares, 0.08%
for ETF Shares, 0.08% for Admiral Shares, 0.06% for Institutional Shares, 0.05% for Institutional Plus Shares, and 0.02% for Institutional
Select Shares (annualized since inception); for the Mid-Cap Index Fund, 0.18% for Investor Shares, 0.06% for ETF Shares, 0.06% for Admiral
Shares, 0.05% for Institutional Shares, and 0.04% for Institutional Plus Shares; for the Mid-Cap Growth Index Fund, 0.19% for Investor Shares,
0.07% for ETF Shares, and 0.07% for Admiral Shares; and for the Mid-Cap Value Index Fund, 0.19% for Investor Shares, 0.07% for ETF Shares,
and 0.07% for Admiral Shares. The peer-group expense ratios are derived from data provided by Lipper, a Thomson Reuters Company, and
capture information through year-end 2015.
Peer groups: For the Extended Market and Mid-Cap Index Funds, Mid-Cap Core Funds; for the Mid-Cap Growth Index Fund, Mid-Cap Growth
Funds; for the Mid-Cap Value Index Fund, Mid-Cap Value Funds.
4
Chairman’s Perspective

Bill McNabb
Chairman and Chief Executive Officer
Dear Shareholder,
If you’re like most investors, a big question on your mind is: What’s in store for the markets and the economy in 2017?
At Vanguard, we’re just as curious about the immediate future. But our curiosity is tempered by our belief that forecasts should give a range of possible outcomes, not pinpoint predictions. After all, there are bound to be occurrences the experts won’t see coming.
What really matters for investors
In 2016, we saw two cases in point: The United Kingdom’s June vote to exit the European Union and the November election of Donald Trump as U.S. president. Both unexpected outcomes triggered swift market reactions. But despite some short-term volatility, the markets’ 12-month performance as of December 31, 2016, proved to be less dramatic. U.S. stocks posted healthy returns, and U.S. bonds provided returns close to their long-term averages. International stocks and bonds also advanced, although returns for U.S. investors were reduced by the strength of the U.S. dollar.
The surprises of 2016 remind us to be skeptical of overly precise short-term predictions about 2017. At the cusp of a new year, market prognosticators forecast where the Standard & Poor’s 500 Index or the yield on the 10-year Treasury note will end up in 12 months. Such predictions can be attention-getting. They can also be dead wrong.
5
Investors are better off taking note of long-term trends that stand to influence our economies and markets. We’re watching these trends closely, and we discuss our latest assessment in our 2017 economic and market outlook, which you can read at vanguard.com/research.
Our global economic outlook: Expect stabilization, not stagnation
One phenomenon in particular that we’re watching is the low-growth, low-interest-rate environment that has marked the global economy since the 2008–09 financial crisis. We don’t think this economic backdrop is simply the result of cyclically weak demand or long-term stagnation. Instead, certain structural forces are contributing: Falling technology costs are restraining the amounts businesses are spending on capital investment, an aging population is weighing on growth in the developed world, and the free movement of capital and products across the globe has restrained prices and wages.
In the near term, these forces will continue to dampen growth, inflation, and interest rates. They also make it unlikely that further monetary stimulus from central banks will do much to spur growth.
I realize this all may sound gloomy, but that’s not how we see it. We expect global growth to stabilize at more modest levels, not stagnate. The world isn’t headed for Japanese-style deflation, in which a widespread sustained drop in prices puts economic activity into hibernation.
| | | |
| Market Barometer | | | |
| | Average Annual Total Returns |
| | Periods Ended December 31, 2016 |
| | One | Three | Five |
| | Year | Years | Years |
| Stocks | | | |
| Russell 1000 Index (Large-caps) | 12.05% | 8.59% | 14.69% |
| Russell 2000 Index (Small-caps) | 21.31 | 6.74 | 14.46 |
| Russell 3000 Index (Broad U.S. market) | 12.74 | 8.43 | 14.67 |
| FTSE All-World ex US Index (International) | 4.80 | -1.16 | 5.52 |
| |
| Bonds | | | |
| Bloomberg Barclays U.S. Aggregate Bond Index | | | |
| (Broad taxable market) | 2.65% | 3.03% | 2.23% |
| Bloomberg Barclays Municipal Bond Index | | | |
| (Broad tax-exempt market) | 0.25 | 4.14 | 3.28 |
| Citigroup Three-Month U.S. Treasury Bill Index | 0.27 | 0.09 | 0.08 |
| |
| CPI | | | |
| Consumer Price Index | 2.07% | 1.18% | 1.36% |
6
In fact, we believe that global growth could pick up modestly over time. Our expectation is based on a potential rebound in productivity as new digital technologies are used more effectively. We also anticipate a slight recovery in the labor force as the baby boom generation finishes its transition to retirement, nudging up demand for workers.
Put expansion in perspective
Looking to the United States, the world’s largest economy remains firmly on a long-term-growth path of about 2% per year. That’s lower than the historical average of 3.25% since 1950. We see such growth at this level as fundamentally sound, rather than abnormally low. Our evaluation takes into account lower U.S. population growth and the reality that the economic expansion from the 1980s until the financial crisis was fueled by debt, distorting the numbers.
Turning to prices, we think that core U.S. inflation should modestly exceed 2% in 2017. That, in turn, will support further interest rate hikes by the Federal Reserve, similar to the one at the end of 2016.
We expect the Fed to raise rates in 2017 before taking an extended pause, and we see the federal funds rate staying below 2% through at least 2018.
Prepare for muted returns
And what about prospects for the markets? Vanguard’s outlook for global stocks and bonds remains the most guarded in ten years, given fairly high stock valuations
|
| Expect more modest returns, rely on time-tested principles |
| |
| In Vanguard’s economic and market outlook for 2017, Global Chief Economist Joseph Davis |
| and his team offer a projection of more modest returns from the global stock and bond |
| markets. They caution that, over the next decade, returns for a balanced portfolio are likely |
| to be moderately below long-run historical averages. |
| |
| The team’s simulations indicate that for the decade ending in 2026, the average annualized |
| return of a 60% stock/40% bond portfolio is likely to be centered in the 3%–5% range after |
| inflation. That’s below the actual average after-inflation return of 6% for the same portfolio |
| for the nine decades since 1926. |
| |
| Ultimately, our global market outlook points toward a somewhat more challenging environment, |
| yet one in which, over time, investors with an appropriate level of discipline, diversification, and |
| patience are likely to be rewarded with reasonable inflation-adjusted returns. |
| |
| For more information about our expectations and the probability of various outcomes, see 2017 |
| Economic and Market Outlook: Stabilization, Not Stagnation, available at vanguard.com/research. |
| |
| |
| IMPORTANT: The projections and other information generated by the Vanguard Capital Markets Model® (VCMM) |
| regarding the likelihood of various investment outcomes are hypothetical in nature, do not reflect actual investment |
| results, and are not guarantees of future results. Distribution of return outcomes from the VCMM are derived |
| from 10,000 simulations for each modeled asset class. Simulations as of September 30, 2016. Results from the |
| model may vary with each use and over time. For more information, see the note at the end of this letter. |
7
and the low-interest-rate environment. We don’t expect global bond yields to increase materially from year-end 2016 levels.
Our outlook for global equities is annualized returns of 5%–8% over the next decade. This outlook isn’t bearish, but is actually fairly positive when you take into account the current low-rate environment. (See the box titled Expect more modest returns, rely on time-tested principles for more.)
Focus on the four keys to investment success
Significant trends often happen gradually. Like shifting tides, they’re sometimes barely noticeable at first but ultimately can change the landscape entirely. Other times, apparent trends can end up receding before they have much of a long-term impact. Given the future’s inherent unpredictability, it’s not reasonable to expect a surefire block-buster revelation from any prognosticator or investment firm.
What to conclude, then? No matter what scenario plays out, we believe investors have the best chance for success if they stay focused on what they can control: their goals, asset allocation, and investment costs, along with the discipline to stick to a plan. As Tim Buckley, our chief investment officer, likes to say, this can be easy to say but harder to do, especially in times of uncertainty. Investors who can stay focused on those four keys will find themselves well-positioned to weather any market.
As always, thank you for investing with Vanguard.
Sincerely,

F. William McNabb III
Chairman and Chief Executive Officer
January 16, 2017
IMPORTANT: The projections and other information generated by the Vanguard Capital Markets Model regarding
the likelihood of various investment outcomes are hypothetical in nature, do not reflect actual investment results,
and are not guarantees of future results. VCMM results will vary with each use and over time.
The VCMM projections are based on a statistical analysis of historical data. Future returns may behave differently from the
historical patterns captured in the VCMM. More important, the VCMM may be underestimating extreme negative scenarios
unobserved in the historical period on which the model estimation is based.
The VCMM is a proprietary financial simulation tool developed and maintained by Vanguard’s Investment Strategy Group.
The model forecasts distributions of future returns for a wide array of broad asset classes. Those asset classes include U.S.
and international equity markets, several maturities of the U.S. Treasury and corporate fixed income markets, international
fixed income markets, U.S. money markets, commodities, and certain alternative investment strategies. The theoretical and
empirical foundation for the Vanguard Capital Markets Model is that the returns of various asset classes reflect the compensation
investors require for bearing different types of systematic risk (beta). At the core of the model are estimates of the dynamic
statistical relationship between risk factors and asset returns, obtained from statistical analysis based on available monthly
financial and economic data. Using a system of estimated equations, the model then applies a Monte Carlo simulation method
to project the estimated interrelationships among risk factors and asset classes as well as uncertainty and randomness over
time. The model generates a large set of simulated outcomes for each asset class over several time horizons. Forecasts are
obtained by computing measures of central tendency in these simulations. Results produced by the tool will vary with each
use and over time.
8
Extended Market Index Fund
Fund Profile
As of December 31, 2016
| | | | | | |
| Share-Class Characteristics | | | | | |
| | Investor | | Admiral | Institutional | Institutional | Institutional |
| | Shares | ETF Shares | Shares | Shares | Plus Shares | Select Shares |
| Ticker Symbol | VEXMX | VXF | VEXAX | VIEIX | VEMPX | VSEMX |
| Expense Ratio1 | 0.22% | 0.09% | 0.09% | 0.07% | 0.05% | 0.02% |
| 30-Day SEC Yield | 1.22% | 1.34% | 1.34% | 1.36% | 1.37% | 1.40% |
| | | |
| Portfolio Characteristics | | |
| | | | DJ |
| | | | U.S. |
| | | S&P | Total |
| | | Completion | Market |
| | Fund | Index | FA Index |
| Number of Stocks | 3,270 | 3,320 | 3,833 |
| Median Market Cap | $3.9B | $3.9B | $54.1B |
| Price/Earnings Ratio | 33.7x | 33.5x | 24.4x |
| Price/Book Ratio | 2.5x | 2.5x | 2.8x |
| Return on Equity | 11.2% | 11.2% | 16.5% |
| Earnings Growth Rate | 9.5% | 9.5% | 8.2% |
| Dividend Yield | 1.4% | 1.4% | 2.0% |
| Foreign Holdings | 0.0% | 0.0% | 0.0% |
| Turnover Rate | 12% | — | — |
| Short-Term Reserves | 0.0% | — | — |
| | | |
| Sector Diversification (% of equity exposure) |
| | | | DJ |
| | | S&P | U.S. Total |
| | | Completion | Market |
| | Fund | Index | FA Index |
| Consumer | | | |
| Discretionary | 14.3% | 14.3% | 12.5% |
| Consumer Staples | 3.5 | 3.5 | 8.3 |
| Energy | 4.5 | 4.5 | 7.0 |
| Financials | 17.9 | 17.9 | 15.4 |
| Health Care | 10.5 | 10.5 | 13.0 |
| Industrials | 13.5 | 13.5 | 10.8 |
| Information | | | |
| Technology | 16.5 | 16.5 | 20.0 |
| Materials | 5.6 | 5.6 | 3.3 |
| Real Estate | 9.3 | 9.3 | 4.1 |
| Telecommunication | | | |
| Services | 1.3 | 1.3 | 2.4 |
| Utilities | 3.1 | 3.1 | 3.2 |
| | |
| Volatility Measures | | |
| | | DJ |
| | S&P | U.S. Total |
| | Completion | Market |
| | Index | FA Index |
| R-Squared | 1.00 | 0.85 |
| Beta | 1.00 | 1.15 |
| These measures show the degree and timing of the fund’s |
| fluctuations compared with the indexes over 36 months. |
| | |
| Ten Largest Holdings (% of total net assets) |
| Liberty Global plc | Cable & Satellite | 0.6% |
| Tesla Motors Inc. | Automobile | |
| | Manufacturers | 0.6 |
| Las Vegas Sands Corp. | Casinos & Gaming | 0.5 |
| Incyte Corp. | Biotechnology | 0.4 |
| T-Mobile US Inc. | Wireless | |
| | Telecommunication | |
| | Services | 0.4 |
| Hilton Worldwide | Hotels, Resorts & | |
| Holdings Inc. | Cruise Lines | 0.4 |
| BioMarin Pharmaceutical | | |
| Inc. | Biotechnology | 0.3 |
| First Republic Bank | Regional Banks | 0.3 |
| MGM Resorts | | |
| International | Casinos & Gaming | 0.3 |
| FleetCor Technologies | Data Processing & | |
| Inc. | Outsourced Services | 0.3 |
| Top Ten | | 4.1% |
| The holdings listed exclude any temporary cash investments and equity index products. |
1 The expense ratios shown are from the prospectus dated April 27, 2016, and represent estimated costs for the current fiscal year. For the fiscal
year ended December 31, 2016, the expense ratios were 0.21% for Investor Shares, 0.08% for ETF Shares, 0.08% for Admiral Shares, 0.06% for
Institutional Shares, 0.05% for Institutional Plus Shares, and 0.02% for Institutional Select Shares (annualized since inception).
9
Extended Market Index Fund
Investment Focus
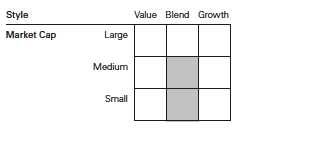
10
Extended Market Index Fund
Performance Summary
All of the returns in this report represent past performance, which is not a guarantee of future results that may be achieved by the fund. (Current performance may be lower or higher than the performance data cited. For performance data current to the most recent month-end, visit our website at vanguard.com/performance.) Note, too, that both investment returns and principal value can fluctuate widely, so an investor’s shares, when sold, could be worth more or less than their original cost. The returns shown do not reflect taxes that a shareholder would pay on fund distributions or on the sale of fund shares.
Cumulative Performance: December 31, 2006, Through December 31, 2016
Initial Investment of $10,000

| | | | | |
| | | Average Annual Total Returns | |
| | | Periods Ended December 31, 2016 | |
| | | | | | Final Value |
| | | One | Five | Ten | of a $10,000 |
| | | Year | Years | Years | Investment |
| | Extended Market Index | | | | |
| | Fund*Investor Shares | 15.99% | 14.50% | 7.80% | $21,198 |
| • • • • • • •• | S&P Completion Index | 15.95 | 14.55 | 7.84 | 21,266 |
| – – – – | Mid-Cap Core Funds Average | 14.82 | 13.11 | 6.86 | 19,413 |
| | Dow Jones U.S. Total Stock Market | | | | |
| | Float Adjusted Index | 12.62 | 14.59 | 7.18 | 20,003 |
| Mid-Cap Core Funds Average: Derived from data provided by Lipper, a Thomson Reuters Company. | | |
| | | | |
| | | | | Final Value |
| | One | Five | Ten | of a $10,000 |
| | Year | Years | Years | Investment |
| Extended Market Index Fund | | | | |
| ETF Shares Net Asset Value | 16.16% | 14.65% | 7.96% | $21,508 |
| S&P Completion Index | 15.95 | 14.55 | 7.84 | 21,266 |
| Dow Jones U.S. Total Stock Market Float | | | | |
| Adjusted Index | 12.62 | 14.59 | 7.18 | 20,003 |
See Financial Highlights for dividend and capital gains information.
11
Extended Market Index Fund
| | | | |
| | Average Annual Total Returns | |
| | Periods Ended December 31, 2016 | |
| |
| | | | �� | Final Value |
| | One | Five | Ten | of a $10,000 |
| | Year | Years | Years | Investment |
| Extended Market Index Fund Admiral Shares | 16.13% | 14.65% | 7.95% | $21,499 |
| S&P Completion Index | 15.95 | 14.55 | 7.84 | 21,266 |
| Dow Jones U.S. Total Stock Market Float | | | | |
| Adjusted Index | 12.62 | 14.59 | 7.18 | 20,003 |
| | | | |
| | | | | Final Value |
| | One | Five | Ten | of a $5,000,000 |
| | Year | Years | Years | Investment |
| Extended Market Index Fund Institutional | | | | |
| Shares | 16.15% | 14.67% | 7.99% | $10,780,445 |
| |
| S&P Completion Index | 15.95 | 14.55 | 7.84 | 10,633,158 |
| Dow Jones U.S. Total Stock Market Float | | | | |
| Adjusted Index | 12.62 | 14.59 | 7.18 | 10,001,613 |
| | | | |
| | | | Since | Final Value |
| | One | Five | Inception | of a $100,000,000 |
| | Year | Years | (1/14/2011) | Investment |
| Extended Market Index Fund Institutional Plus | | | | |
| Shares | 16.18% | 14.69% | 10.92% | $185,485,933 |
| S&P Completion Index | 15.95 | 14.55 | 10.77 | 172,095,091 |
| Dow Jones U.S. Total Stock Market Float | | | | |
| Adjusted Index | 12.62 | 14.59 | 11.76 | 193,985,975 |
| "Since Inception" performance is calculated from the Institutional Plus Shares’ inception date for both the fund and its comparative standards. |
| | |
| | Since | Final Value |
| | Inception | of a $3,000,000,000 |
| | (6/27/2016) | Investment |
| Extended Market Index Fund Institutional | | |
| Select Shares | 19.81% | $3,594,227,164 |
| S&P Completion Index | 19.67 | 3,590,071,426 |
| Dow Jones U.S. Total Stock Market Float | | |
| Adjusted Index | 14.29 | 3,428,739,233 |
| "Since Inception" performance is calculated from the Institutional Select Shares’ inception date for both the fund and its comparative |
| standards. |
12
Extended Market Index Fund
| | | |
| Cumulative Returns of ETF Shares: December 31, 2006, Through December 31, 2016 | |
| | One | Five | Ten |
| | Year | Years | Years |
| Extended Market Index Fund ETF Shares Market | | | |
| Price | 16.22% | 98.34% | 115.37% |
| Extended Market Index Fund ETF Shares Net Asset | | | |
| Value | 16.16 | 98.13 | 115.08 |
| S&P Completion Index | 15.95 | 97.27 | 112.66 |
Fiscal-Year Total Returns (%): December 31, 2006, Through December 31, 2016

13
Extended Market Index Fund
Financial Statements
Statement of Net Assets—Investments Summary
As of December 31, 2016
This Statement summarizes the fund’s holdings by asset type. Details are reported for each of the fund’s 50 largest individual holdings and for investments that, in total for any issuer, represent more than 1% of the fund’s net assets. The total value of smaller holdings is reported as a single amount within each category.
The fund reports a complete list of its holdings in regulatory filings four times in each fiscal year, at the quarter-ends. For the second and fourth fiscal quarters, the complete listing of the fund’s holdings is available electronically on vanguard.com and on the Securities and Exchange Commission’s website (sec.gov), or you can have it mailed to you without charge by calling 800-662-7447. For the first and third fiscal quarters, the fund files the lists with the SEC on Form N-Q. Shareholders can look up the fund’s Forms N-Q on the SEC’s website. Forms N-Q may also be reviewed and copied at the SEC’s Public Reference Room (see the back cover of this report for further information).
| | | | |
| | | | Market | Percentage |
| | | | Value• | of Net |
| | | Shares | ($000) | Assets |
| Common Stocks | | | |
| Consumer Discretionary | | | |
| *,^ | Tesla Motors Inc. | 1,472,713 | 314,704 | 0.6% |
| * | Liberty Global plc | 8,554,728 | 254,075 | 0.5% |
| | Las Vegas Sands Corp. | 4,351,681 | 232,423 | 0.5% |
| | Hilton Worldwide Holdings Inc. | 6,791,559 | 184,730 | 0.4% |
| * | MGM Resorts International | 5,721,290 | 164,945 | 0.3% |
| * | DISH Network Corp. Class A | 2,682,065 | 155,372 | 0.3% |
| | Autoliv Inc. | 1,046,657 | 118,429 | 0.2% |
| | Lear Corp. | 828,928 | 109,725 | 0.2% |
| * | Liberty Interactive Corp. QVC Group Class A | 5,241,520 | 104,726 | 0.2% |
| | Aramark | 2,900,704 | 103,613 | 0.2% |
| | Consumer Discretionary—Other † | | 5,626,984 | 10.9% |
| | | | 7,369,726 | 14.3% |
| Consumer Staples | | | |
| | Bunge Ltd. | 1,653,378 | 119,440 | 0.2% |
| * | WhiteWave Foods Co. Class A | 2,095,150 | 116,490 | 0.2% |
| | Ingredion Inc. | 856,925 | 107,081 | 0.2% |
| * | Rite Aid Corp. | 12,490,841 | 102,925 | 0.2% |
| | Consumer Staples—Other † | | 1,367,203 | 2.7% |
| | | | 1,813,139 | 3.5% |
| Energy | | | |
| | Targa Resources Corp. | 2,145,962 | 120,324 | 0.2% |
| * | Cheniere Energy Inc. | 2,781,722 | 115,247 | 0.2% |
| * | Diamondback Energy Inc. | 1,051,917 | 106,307 | 0.2% |
| | Energy—Other † | | 1,992,660 | 3.9% |
| | | | 2,334,538 | 4.5% |
14
| | | |
| Extended Market Index Fund | | | |
| |
| |
| |
| | | Market | Percentage |
| | | Value• | of Net |
| | Shares | ($000) | Assets |
| Financials | | | |
| First Republic Bank | 1,813,091 | 167,058 | 0.3% |
| * Markel Corp. | 164,771 | 149,035 | 0.3% |
| * Arch Capital Group Ltd. | 1,451,181 | 125,222 | 0.3% |
| TD Ameritrade Holding Corp. | 2,863,708 | 124,858 | 0.3% |
| Annaly Capital Management Inc. | 12,100,566 | 120,643 | 0.2% |
| * Alleghany Corp. | 181,391 | 110,308 | 0.2% |
| FNF Group | 3,218,879 | 109,313 | 0.2% |
| Ally Financial Inc. | 5,581,946 | 106,169 | 0.2% |
| * SVB Financial Group | 614,703 | 105,520 | 0.2% |
| Everest Re Group Ltd. | 486,028 | 105,176 | 0.2% |
| Raymond James Financial Inc. | 1,486,364 | 102,960 | 0.2% |
| Financials—Other † | | 7,883,341 | 15.3% |
| | | 9,209,603 | 17.9% |
| Health Care | | | |
| * Incyte Corp. | 2,075,367 | 208,097 | 0.4% |
| * BioMarin Pharmaceutical Inc. | 2,038,523 | 168,871 | 0.3% |
| * IDEXX Laboratories Inc. | 1,060,981 | 124,421 | 0.2% |
| * Quintiles IMS Holdings Inc. | 1,603,924 | 121,978 | 0.2% |
| ResMed Inc. | 1,669,434 | 103,588 | 0.2% |
| Health Care—Other † | | 4,665,618 | 9.1% |
| | | 5,392,573 | 10.4% |
| Industrials | | | |
| * IHS Markit Ltd. | 3,907,394 | 138,361 | 0.3% |
| Industrials—Other † | | 6,775,343 | 13.1% |
| | | 6,913,704 | 13.4% |
| Information Technology | | | |
| * FleetCor Technologies Inc. | 1,101,666 | 155,908 | 0.3% |
| * Dell Technologies Inc. Class V | 2,641,049 | 145,178 | 0.3% |
| * ServiceNow Inc. | 1,949,717 | 144,942 | 0.3% |
| * Palo Alto Networks Inc. | 1,090,519 | 136,369 | 0.3% |
| Maxim Integrated Products Inc. | 3,358,921 | 129,554 | 0.2% |
| * Twitter Inc. | 7,139,726 | 116,378 | 0.2% |
| * Vantiv Inc. Class A | 1,849,988 | 110,296 | 0.2% |
| CDK Global Inc. | 1,767,145 | 105,481 | 0.2% |
| * Synopsys Inc. | 1,779,828 | 104,761 | 0.2% |
| * Advanced Micro Devices Inc. | 9,029,459 | 102,394 | 0.2% |
| Information Technology—Other † | | 7,250,394 | 14.1% |
| | | 8,501,655 | 16.5% |
| Materials | | | |
| Celanese Corp. Class A | 1,692,049 | 133,232 | 0.2% |
| Steel Dynamics Inc. | 2,888,613 | 102,777 | 0.2% |
| Materials—Other † | | 2,629,467 | 5.1% |
| | | 2,865,476 | 5.5% |
| |
| 1Other † | | 5,047 | 0.0% |
| |
| Real Estate | | | |
| Duke Realty Corp. | 4,192,466 | 111,352 | 0.2% |
| Alexandria Real Estate Equities Inc. | 939,415 | 104,397 | 0.2% |
| Real Estate—Other † | | 4,560,771 | 8.9% |
| | | 4,776,520 | 9.3% |
15
| | | | | |
| Extended Market Index Fund | | | | |
| |
| |
| | | | | Market | Percentage |
| | | | | Value• | of Net |
| | | | Shares | ($000) | Assets |
| Telecommunication Services | | | | |
| * | T-Mobile US Inc. | | 3,417,052 | 196,515 | 0.4% |
| * | SBA Communications Corp. Class A | | 1,473,028 | 152,105 | 0.3% |
| | Telecommunication Services—Other † | | | 313,377 | 0.6% |
| | | | | 661,997 | 1.3% |
| |
| Utilities † | | | 1,580,655 | 3.1% |
| Total Common Stocks (Cost $41,077,071) | | | 51,424,633 | 99.7%2 |
| Convertible Bonds | | | | |
| Convertible Bonds—Other1 † | | | 335 | 0.0% |
| Total Convertible Bonds (Cost $0) | | | 335 | 0.0% |
| |
| | | Coupon | | | |
| Temporary Cash Investments | | | | |
| Money Market Fund | | | | |
| 3,4 Vanguard Market Liquidity Fund | 0.823% | 8,010,345 | 801,115 | 1.6% |
| |
| 5U.S. Government and Agency Obligations † | | | 10,815 | 0.0% |
| Total Temporary Cash Investments (Cost $811,879) | | | 811,930 | 1.6%2 |
| 6Total Investments (Cost $41,888,950) | | | 52,236,898 | 101.3% |
| |
| | | | | Amount | |
| | | | | ($000) | |
| Other Assets and Liabilities | | | | |
| Other Assets | | | | |
| Investment in Vanguard | | | 3,730 | |
| Receivables for Investment Securities Sold | | | 1,107 | |
| Receivables for Accrued Income | | | 71,917 | |
| Receivables for Capital Shares Issued | | | 476,863 | |
| Other Assets | | | 2,237 | |
| Total Other Assets | | | 555,854 | 1.1% |
| Liabilities | | | | |
| Payables for Investment Securities Purchased | | | (445,674) | |
| Collateral for Securities on Loan | | | (662,703) | |
| Payables for Capital Shares Redeemed | | | (104,159) | |
| Payables to Vanguard | | | (29,075) | |
| Other Liabilities | | | (1,670) | |
| Total Liabilities | | | (1,243,281) | (2.4%) |
| Net Assets | | | 51,549,471 | 100.0% |
16
| |
| Extended Market Index Fund | |
| |
| |
| At December 31, 2016, net assets consisted of: | |
| | Amount |
| | ($000) |
| Paid-in Capital | 41,808,874 |
| Overdistributed Net Investment Income | (18,874) |
| Accumulated Net Realized Losses | (584,911) |
| Unrealized Appreciation (Depreciation) | |
| Investment Securities | 10,347,948 |
| Futures Contracts | (2,904) |
| Swap Contracts | (662) |
| Net Assets | 51,549,471 |
| |
| Investor Shares—Net Assets | |
| Applicable to 27,781,604 outstanding $.001 par value shares of | |
| beneficial interest (unlimited authorization) | 2,021,414 |
| Net Asset Value Per Share—Investor Shares | $72.76 |
| |
| ETF Shares—Net Assets | |
| Applicable to 45,765,058 outstanding $.001 par value shares of | |
| beneficial interest (unlimited authorization) | 4,387,040 |
| Net Asset Value Per Share—ETF Shares | $95.86 |
| |
| Admiral Shares—Net Assets | |
| Applicable to 217,671,720 outstanding $.001 par value shares of | |
| beneficial interest (unlimited authorization) | 15,830,161 |
| Net Asset Value Per Share—Admiral Shares | $72.72 |
17
| |
| Extended Market Index Fund | |
| |
| |
| |
| | Amount |
| | ($000) |
| Institutional Shares—Net Assets | |
| Applicable to 145,126,357 outstanding $.001 par value shares of | |
| beneficial interest (unlimited authorization) | 10,553,902 |
| Net Asset Value Per Share—Institutional Shares | $72.72 |
| |
| Institutional Plus Shares—Net Assets | |
| Applicable to 75,389,827 outstanding $.001 par value shares of | |
| beneficial interest (unlimited authorization) | 13,529,850 |
| Net Asset Value Per Share—Institutional Plus Shares | $179.47 |
| |
| Institutional Select Shares—Net Assets | |
| Applicable to 44,732,619 outstanding $.001 par value shares of | |
| beneficial interest (unlimited authorization) | 5,227,104 |
| Net Asset Value Per Share—Institutional Select Shares | $116.85 |
• See Note A in Notes to Financial Statements.
* Non-income-producing security.
^ Includes partial security positions on loan to broker-dealers. The total value of securities on loan is $607,029,000.
† Represents the aggregate value, by category, of securities that are not among the 50 largest holdings and, in total for any issuer, represent
1% or less of net assets.
1 “Other” represents securities that are not classified by the fund’s benchmark index.
2 The fund invests a portion of its cash reserves in equity markets through the use of index futures contracts and swap contracts. After giving
effect to futures and swap investments, the fund’s effective common stock and temporary cash investment positions represent 100.0% and
1.3%, respectively, of net assets.
3 Affiliated money market fund available only to Vanguard funds and certain trusts and accounts managed by Vanguard. Rate shown is the
7-day yield.
4 Includes $662,703,000 of collateral received for securities on loan.
5 Securities with a value of $6,425,000 have been segregated as initial margin for open futures contracts.
6 Securities with a value of $797,000 have been segregated as collateral for open over-the-counter swap contracts.
See accompanying Notes, which are an integral part of the Financial Statements.
18
| |
| Extended Market Index Fund | |
| |
| |
| |
| Statement of Operations | |
| |
| |
| | Year Ended |
| | December 31, 2016 |
| | ($000) |
| Investment Income | |
| Income | |
| Dividends | 672,498 |
| Interest1 | 868 |
| Securities Lending—Net | 52,750 |
| Total Income | 726,116 |
| Expenses | |
| The Vanguard Group—Note B | |
| Investment Advisory Services | 4,306 |
| Management and Administrative—Investor Shares | 3,357 |
| Management and Administrative—ETF Shares | 2,153 |
| Management and Administrative—Admiral Shares | 7,948 |
| Management and Administrative—Institutional Shares | 3,976 |
| Management and Administrative—Institutional Plus Shares | 5,021 |
| Management and Administrative—Institutional Select Shares | 124 |
| Marketing and Distribution—Investor Shares | 413 |
| Marketing and Distribution—ETF Shares | 305 |
| Marketing and Distribution—Admiral Shares | 1,265 |
| Marketing and Distribution—Institutional Shares | 238 |
| Marketing and Distribution—Institutional Plus Shares | 212 |
| Marketing and Distribution—Institutional Select Shares | — |
| Custodian Fees | 1,126 |
| Auditing Fees | 56 |
| Shareholders’ Reports—Investor Shares | 64 |
| Shareholders’ Reports—ETF Shares | 139 |
| Shareholders’ Reports—Admiral Shares | 124 |
| Shareholders’ Reports—Institutional Shares | 140 |
| Shareholders’ Reports—Institutional Plus Shares | 143 |
| Shareholders’ Reports—Institutional Select Shares | — |
| Trustees’ Fees and Expenses | 35 |
| Total Expenses | 31,145 |
| Net Investment Income | 694,971 |
| Realized Net Gain (Loss) | |
| Investment Securities Sold1 | 2,901,190 |
| Futures Contracts | 36,115 |
| Swap Contracts | 2,334 |
| Realized Net Gain (Loss) | 2,939,639 |
| Change in Unrealized Appreciation (Depreciation) | |
| Investment Securities | 3,432,701 |
| Futures Contracts | (3,813) |
| Swap Contracts | (648) |
| Change in Unrealized Appreciation (Depreciation) | 3,428,240 |
| Net Increase (Decrease) in Net Assets Resulting from Operations | 7,062,850 |
| 1 Interest income and realized net gain (loss) from affiliated companies of the fund were $820,000 and $15,000, respectively. |
| See accompanying Notes, which are an integral part of the Financial Statements. |
19
| | |
| Extended Market Index Fund | | |
| |
| |
| Statement of Changes in Net Assets | | |
| |
| | Year Ended December 31, |
| | 2016 | 2015 |
| | ($000) | ($000) |
| Increase (Decrease) in Net Assets | | |
| Operations | | |
| Net Investment Income | 694,971 | 592,380 |
| Realized Net Gain (Loss) | 2,939,639 | 2,797,448 |
| Change in Unrealized Appreciation (Depreciation) | 3,428,240 | (4,928,685) |
| Net Increase (Decrease) in Net Assets Resulting from Operations | 7,062,850 | (1,538,857) |
| Distributions | | |
| Net Investment Income | | |
| Investor Shares | (27,910) | (25,453) |
| ETF Shares | (61,739) | (54,815) |
| Admiral Shares | (221,549) | (173,450) |
| Institutional Shares | (148,548) | (115,520) |
| Institutional Plus Shares | (222,007) | (203,574) |
| Institutional Select Shares | (37,670) | — |
| Realized Capital Gain | | |
| Investor Shares | — | — |
| ETF Shares | — | — |
| Admiral Shares | — | — |
| Institutional Shares | — | — |
| Institutional Plus Shares | — | — |
| Institutional Select Shares | — | — |
| Total Distributions | (719,423) | (572,812) |
| Capital Share Transactions | | |
| Investor Shares | (280,966) | (203,394) |
| ETF Shares | (446,181) | 822,145 |
| Admiral Shares | 730,849 | 929,458 |
| Institutional Shares | 629,816 | 467,816 |
| Institutional Plus Shares | (2,875,724) | 1,646,756 |
| Institutional Select Shares | 4,844,930 | — |
| Net Increase (Decrease) from Capital Share Transactions | 2,602,724 | 3,662,781 |
| Total Increase (Decrease) | 8,946,151 | 1,551,112 |
| Net Assets | | |
| Beginning of Period | 42,603,320 | 41,052,208 |
| End of Period1 | 51,549,471 | 42,603,320 |
| 1 Net Assets—End of Period includes undistributed (overdistributed) net investment income of ($18,874,000) and $2,759,000. |
See accompanying Notes, which are an integral part of the Financial Statements.
20
| | | | | |
| Extended Market Index Fund | | | | | |
| |
| |
| Financial Highlights | | | | | |
| |
| |
| Investor Shares | | | | | |
| |
| For a Share Outstanding | Year Ended December 31, |
| Throughout Each Period | 2016 | 2015 | 2014 | 2013 | 2012 |
| Net Asset Value, Beginning of Period | $63.61 | $66.63 | $62.76 | $45.86 | $39.34 |
| Investment Operations | | | | | |
| Net Investment Income | . 919 | .795 | .795 | . 602 | . 688 |
| Net Realized and Unrealized Gain (Loss) | | | | | |
| on Investments | 9.182 | (3.050) | 3.857 | 16.903 | 6.515 |
| Total from Investment Operations | 10.101 | (2.255) | 4.652 | 17.505 | 7.203 |
| Distributions | | | | | |
| Dividends from Net Investment Income | (. 951) | (.765) | (.782) | (. 605) | (. 683) |
| Distributions from Realized Capital Gains | — | — | — | — | — |
| Total Distributions | (. 951) | (.765) | (.782) | (. 605) | (. 683) |
| Net Asset Value, End of Period | $72.76 | $63.61 | $66.63 | $62.76 | $45.86 |
| |
| Total Return1 | 15.99% | -3.39% | 7.42% | 38.19% | 18.31% |
| |
| Ratios/Supplemental Data | | | | | |
| Net Assets, End of Period (Millions) | $2,021 | $2,040 | $2,341 | $2,749 | $2,857 |
| Ratio of Total Expenses to Average Net Assets | 0.21% | 0.22% | 0.23% | 0.24% | 0.24% |
| Ratio of Net Investment Income to | | | | | |
| Average Net Assets | 1.48% | 1.20% | 1.27% | 1.19% | 1.62% |
| Portfolio Turnover Rate2 | 12% | 6% | 9% | 11% | 12% |
1 Total returns do not include account service fees that may have applied in the periods shown. Fund prospectuses provide information about
any applicable account service fees.
2 Excludes the value of portfolio securities received or delivered as a result of in-kind purchases or redemptions of the fund’s capital shares,
including ETF Creation Units.
See accompanying Notes, which are an integral part of the Financial Statements.
21
| | | | | |
| Extended Market Index Fund | | | | | |
| |
| |
| Financial Highlights | | | | | |
| |
| |
| ETF Shares | | | | | |
| |
| For a Share Outstanding | Year Ended December 31, |
| Throughout Each Period | 2016 | 2015 | 2014 | 2013 | 2012 |
| Net Asset Value, Beginning of Period | $83.80 | $87.79 | $82.71 | $60.46 | $51.87 |
| Investment Operations | | | | | |
| Net Investment Income | 1.324 | 1.171 | 1.178 | .934 | 1.000 |
| Net Realized and Unrealized Gain (Loss) | | | | | |
| on Investments | 12.107 | (4.033) | 5.061 | 22.256 | 8.582 |
| Total from Investment Operations | 13.431 | (2.862) | 6.239 | 23.190 | 9.582 |
| Distributions | | | | | |
| Dividends from Net Investment Income | (1.371) | (1.128) | (1.159) | (.940) | (.992) |
| Distributions from Realized Capital Gains | — | — | — | — | — |
| Total Distributions | (1.371) | (1.128) | (1.159) | (.940) | (.992) |
| Net Asset Value, End of Period | $95.86 | $83.80 | $87.79 | $82.71 | $60.46 |
| |
| Total Return | 16.16% | -3.26% | 7.55% | 38.37% | 18.48% |
| |
| Ratios/Supplemental Data | | | | | |
| Net Assets, End of Period (Millions) | $4,387 | $4,272 | $3,659 | $3,105 | $1,477 |
| Ratio of Total Expenses to Average Net Assets | 0.08% | 0.09% | 0.10% | 0.10% | 0.10% |
| Ratio of Net Investment Income to | | | | | |
| Average Net Assets | 1.61% | 1.33% | 1.40% | 1.33% | 1.76% |
| Portfolio Turnover Rate1 | 12% | 6% | 9% | 11% | 12% |
1 Excludes the value of portfolio securities received or delivered as a result of in-kind purchases or redemptions of the fund’s capital shares,
including ETF Creation Units.
See accompanying Notes, which are an integral part of the Financial Statements.
22
| | | | | |
| Extended Market Index Fund | | | | | |
| |
| |
| Financial Highlights | | | | | |
| |
| |
| Admiral Shares | | | | | |
| |
| For a Share Outstanding | Year Ended December 31, |
| Throughout Each Period | 2016 | 2015 | 2014 | 2013 | 2012 |
| Net Asset Value, Beginning of Period | $63.58 | $66.61 | $62.75 | $45.87 | $39.35 |
| Investment Operations | | | | | |
| Net Investment Income | 1.005 | .887 | .895 | .706 | .758 |
| Net Realized and Unrealized Gain (Loss) | | | | | |
| on Investments | 9.175 | (3.061) | 3.845 | 16.884 | 6.513 |
| Total from Investment Operations | 10.180 | (2.174) | 4.740 | 17.590 | 7.271 |
| Distributions | | | | | |
| Dividends from Net Investment Income | (1.040) | (. 856) | (. 880) | (.710) | (.751) |
| Distributions from Realized Capital Gains | — | — | — | — | — |
| Total Distributions | (1.040) | (. 856) | (. 880) | (.710) | (.751) |
| Net Asset Value, End of Period | $72.72 | $63.58 | $66.61 | $62.75 | $45.87 |
| |
| Total Return1 | 16.13% | -3.27% | 7.56% | 38.37% | 18.48% |
| |
| Ratios/Supplemental Data | | | | | |
| Net Assets, End of Period (Millions) | $15,830 | $13,143 | $12,852 | $8,864 | $5,970 |
| Ratio of Total Expenses to Average Net Assets | 0.08% | 0.09% | 0.10% | 0.10% | 0.10% |
| Ratio of Net Investment Income to | | | | | |
| Average Net Assets | 1.61% | 1.33% | 1.40% | 1.33% | 1.76% |
| Portfolio Turnover Rate 2 | 12% | 6% | 9% | 11% | 12% |
1 Total returns do not include account service fees that may have applied in the periods shown. Fund prospectuses provide information about
any applicable account service fees.
2 Excludes the value of portfolio securities received or delivered as a result of in-kind purchases or redemptions of the fund’s capital shares,
including ETF Creation Units.
See accompanying Notes, which are an integral part of the Financial Statements.
23
| | | | | |
| Extended Market Index Fund | | | | | |
| |
| |
| Financial Highlights | | | | | |
| |
| |
| Institutional Shares | | | | | |
| |
| For a Share Outstanding | Year Ended December 31, |
| Throughout Each Period | 2016 | 2015 | 2014 | 2013 | 2012 |
| Net Asset Value, Beginning of Period | $63.58 | $66.60 | $62.75 | $45.86 | $39.34 |
| Investment Operations | | | | | |
| Net Investment Income | 1.018 | .899 | .908 | .715 | .764 |
| Net Realized and Unrealized Gain (Loss) | | | | | |
| on Investments | 9.175 | (3.050) | 3.833 | 16.895 | 6.514 |
| Total from Investment Operations | 10.193 | (2.151) | 4.741 | 17.610 | 7.278 |
| Distributions | | | | | |
| Dividends from Net Investment Income | (1.053) | (. 869) | (. 891) | (.720) | (.758) |
| Distributions from Realized Capital Gains | — | — | — | — | — |
| Total Distributions | (1.053) | (. 869) | (. 891) | (.720) | (.758) |
| Net Asset Value, End of Period | $72.72 | $63.58 | $66.60 | $62.75 | $45.86 |
| |
| Total Return | 16.15% | -3.24% | 7.56% | 38.42% | 18.50% |
| |
| Ratios/Supplemental Data | | | | | |
| Net Assets, End of Period (Millions) | $10,554 | $8,621 | $8,567 | $7,812 | $5,496 |
| Ratio of Total Expenses to Average Net Assets | 0.06% | 0.07% | 0.08% | 0.08% | 0.08% |
| Ratio of Net Investment Income to | | | | | |
| Average Net Assets | 1.63% | 1.35% | 1.42% | 1.35% | 1.78% |
| Portfolio Turnover Rate1 | 12% | 6% | 9% | 11% | 12% |
| 1 Excludes the value of portfolio securities received or delivered as a result of in-kind purchases or redemptions of the fund’s capital shares, |
| including ETF Creation Units. |
See accompanying Notes, which are an integral part of the Financial Statements.
24
| | | | | |
| Extended Market Index Fund | | | | | |
| |
| |
| Financial Highlights | | | | | |
| |
| |
| Institutional Plus Shares | | | | | |
| |
| For a Share Outstanding | Year Ended December 31, |
| Throughout Each Period | 2016 | 2015 | 2014 | 2013 | 2012 |
| Net Asset Value, Beginning of Period | $156.89 | $164.36 | $154.84 | $113.18 | $97.10 |
| Investment Operations | | | | | |
| Net Investment Income | 2.525 | 2.254 | 2.273 | 1.797 | 1.917 |
| Net Realized and Unrealized Gain (Loss) | | | | | |
| on Investments | 22.668 | (7.549) | 9.481 | 41.671 | 16.064 |
| Total from Investment Operations | 25.193 | (5.295) | 11.754 | 43.468 | 17.981 |
| Distributions | | | | | |
| Dividends from Net Investment Income | (2.613) | (2.175) | (2.234) | (1.808) | (1.901) |
| Distributions from Realized Capital Gains | — | — | — | — | — |
| Total Distributions | (2.613) | (2.175) | (2.234) | (1.808) | (1.901) |
| Net Asset Value, End of Period | $179.47 | $156.89 | $164.36 | $154.84 | $113.18 |
| |
| Total Return | 16.18% | -3.23% | 7.60% | 38.43% | 18.52% |
| |
| Ratios/Supplemental Data | | | | | |
| Net Assets, End of Period (Millions) | $13,530 | $14,526 | $13,634 | $11,347 | $5,477 |
| Ratio of Total Expenses to Average Net Assets | 0.05% | 0.05% | 0.06% | 0.06% | 0.06% |
| Ratio of Net Investment Income to | | | | | |
| Average Net Assets | 1.64% | 1.37% | 1.44% | 1.37% | 1.80% |
| Portfolio Turnover Rate1 | 12% | 6% | 9% | 11% | 12% |
| 1 Excludes the value of portfolio securities received or delivered as a result of in-kind purchases or redemptions of the fund’s capital shares, |
| including ETF Creation Units. |
See accompanying Notes, which are an integral part of the Financial Statements.
25
| |
| Extended Market Index Fund | |
| |
| |
| Financial Highlights | |
| |
| |
| Institutional Select Shares | |
| | June 27, 20161 to |
| For a Share Outstanding Throughout the Period | December 31, 2016 |
| Net Asset Value, Beginning of Period | $98.43 |
| Investment Operations | |
| Net Investment Income | 1.050 |
| Net Realized and Unrealized Gain (Loss) on Investments | 18.428 |
| Total from Investment Operations | 19.478 |
| Distributions | |
| Dividends from Net Investment Income | (1.058) |
| Distributions from Realized Capital Gains | — |
| Total Distributions | (1.058) |
| Net Asset Value, End of Period | $116.85 |
| |
| Total Return | 19.81% |
| |
| Ratios/Supplemental Data | |
| Net Assets, End of Period (Millions) | $5,227 |
| Ratio of Total Expenses to Average Net Assets | 0.02%2 |
| Ratio of Net Investment Income to Average Net Assets | 1.88%2 |
| Portfolio Turnover Rate 3 | 12%4 |
| 1 Inception. |
| 2 Annualized. |
| 3 Excludes the value of portfolio securities received or delivered as a result of in-kind purchases or redemptions of the fund’s capital shares, |
| including ETF Creation Units. |
| 4 Reflects the fund’s portfolio turnover for the fiscal year ended December 31, 2016. |
See accompanying Notes, which are an integral part of the Financial Statements.
26
Extended Market Index Fund
Notes to Financial Statements
Vanguard Extended Market Index Fund is registered under the Investment Company Act of 1940 as an open-end investment company, or mutual fund. The fund offers six classes of shares: Investor Shares, ETF Shares, Admiral Shares, Institutional Shares, Institutional Plus Shares, and Institutional Select Shares. Investor Shares are available to any investor who meets the fund’s minimum purchase requirements. ETF Shares are listed for trading on NYSE Arca; they can be purchased and sold through a broker. Admiral Shares, Institutional Shares, Institutional Plus Shares, and Institutional Select Shares are designed for investors who meet certain administrative, service, and account-size criteria. Institutional Select Shares were issued on June 27, 2016.
A. The following significant accounting policies conform to generally accepted accounting principles for U.S. investment companies. The fund consistently follows such policies in preparing its financial statements.
1. Security Valuation: Securities are valued as of the close of trading on the New York Stock Exchange (generally 4 p.m., Eastern time) on the valuation date. Equity securities are valued at the latest quoted sales prices or official closing prices taken from the primary market in which each security trades; such securities not traded on the valuation date are valued at the mean of the latest quoted bid and asked prices. Bonds and temporary cash investments are valued using the latest bid prices or using valuations based on a matrix system (which considers such factors as security prices, yields, maturities, and ratings), both as furnished by independent pricing services. Investments in Vanguard Market Liquidity Fund are valued at that fund’s net asset value. Securities for which market quotations are not readily available, or whose values have been materially affected by events occurring before the fund’s pricing time but after the close of the securities’ primary markets, are valued by methods deemed by the board of trustees to represent fair value.
2. Futures Contracts: The fund uses index futures contracts to a limited extent, with the objectives of maintaining full exposure to the stock market, enhancing returns, maintaining liquidity, and minimizing transaction costs. The fund may purchase futures contracts to immediately invest incoming cash in the market, or sell futures in response to cash outflows, thereby simulating a fully invested position in the underlying index while maintaining a cash balance for liquidity. The fund may seek to enhance returns by using futures contracts instead of the underlying securities when futures are believed to be priced more attractively than the underlying securities. The primary risks associated with the use of futures contracts are imperfect correlation between changes in market values of stocks held by the fund and the prices of futures contracts, and the possibility of an illiquid market. Counterparty risk involving futures is mitigated because a regulated clearinghouse is the counterparty instead of the clearing broker. To further mitigate counterparty risk, the fund trades futures contracts on an exchange, monitors the financial strength of its clearing brokers and clearinghouse, and has entered into clearing agreements with its clearing brokers. The clearinghouse imposes initial margin requirements to secure the fund’s performance and requires daily settlement of variation margin representing changes in the market value of each contract.
27
Extended Market Index Fund
Futures contracts are valued at their quoted daily settlement prices. The aggregate settlement values of the contracts are not recorded in the Statement of Net Assets. Fluctuations in the value of the contracts are recorded in the Statement of Net Assets as an asset (liability) and in the Statement of Operations as unrealized appreciation (depreciation) until the contracts are closed, when they are recorded as realized futures gains (losses).
During the year ended December 31, 2016, the fund’s average investments in long and short futures contracts represented less than 1% and 0% of net assets, respectively, based on the average of aggregate settlement values at each quarter-end during the period.
3. Swap Contracts: The fund has entered into equity swap contracts to earn the total return on selected reference stocks in the fund’s target index. Under the terms of the swaps, the fund receives the total return on the referenced stock (i.e., receiving the increase or paying the decrease in value of the selected reference stock and receiving the equivalent of any dividends in respect of the selected referenced stock) over a specified period of time, applied to a notional amount that represents the value of a designated number of shares of the selected reference stock at the beginning of the equity swap contract. The fund also pays a floating rate that is based on short-term interest rates, applied to the notional amount. At the same time, the fund invests an amount approximating the notional amount of the swap in high-quality temporary cash investments.
The notional amounts of swap contracts are not recorded in the Statement of Net Assets. Swaps are valued daily based on market quotations received from independent pricing services or recognized dealers and the change in value is recorded in the Statement of Net Assets as an asset (liability) and in the Statement of Operations as unrealized appreciation (depreciation) until termination of the swap, at which time realized gain (loss) is recorded. A risk associated with all types of swaps is the possibility that a counterparty may default on its obligation to pay net amounts due to the fund. The fund’s maximum amount subject to counterparty risk is the unrealized appreciation on the swap contract. The fund mitigates its counterparty risk by entering into swaps only with a diverse group of prequalified counterparties, monitoring their financial strength, entering into master netting arrangements with its counterparties, and requiring its counterparties to transfer collateral as security for their performance. In the absence of a default, the collateral pledged or received by the fund cannot be repledged, resold or rehypothecated. In the event of a counterparty’s default (including bankruptcy), the fund may terminate any swap contracts with that counterparty, determine the net amount owed by either party in accordance with its master netting arrangements, and sell or retain any collateral held up to the net amount owed to the fund under the master netting arrangements. The swap contracts contain provisions whereby a counterparty may terminate open contracts if the fund net assets decline below a certain level, triggering a payment by the fund if the fund is in a net liability position at the time of the termination. The payment amount would be reduced by any collateral the fund has pledged. Any securities pledged as collateral for open contracts are noted in the Statement of Net Assets. The value of collateral received or pledged is compared daily to the value of the swap contracts exposure with each counterparty, and any difference, if in excess of a specified minimum transfer amount, is adjusted and settled within two business days.
28
Extended Market Index Fund
During the year ended December 31, 2016, the fund’s average amounts of investments in total return swaps represented less than 1% of net assets, based on the average of notional amounts at each quarter-end during the period.
4. Federal Income Taxes: The fund intends to continue to qualify as a regulated investment company and distribute all of its taxable income. Management has analyzed the fund’s tax positions taken for all open federal income tax years (December 31, 2013–2016), and has concluded that no provision for federal income tax is required in the fund’s financial statements.
5. Distributions: Distributions to shareholders are recorded on the ex-dividend date.
6. Securities Lending: To earn additional income, the fund lends its securities to qualified institutional borrowers. Security loans are subject to termination by the fund at any time, and are required to be secured at all times by collateral in an amount at least equal to the market value of securities loaned. Daily market fluctuations could cause the value of loaned securities to be more or less than the value of the collateral received. When this occurs, the collateral is adjusted and settled on the next business day. The fund further mitigates its counterparty risk by entering into securities lending transactions only with a diverse group of prequalified counterparties, monitoring their financial strength, and entering into master securities lending agreements with its counterparties. The master securities lending agreements provide that, in the event of a counterparty’s default (including bankruptcy), the fund may terminate any loans with that borrower, determine the net amount owed, and sell or retain the collateral up to the net amount owed to the fund; however, such actions may be subject to legal proceedings. While collateral mitigates counterparty risk, in the absence of a default the fund may experience delays and costs in recovering the securities loaned. The fund invests cash collateral received in Vanguard Market Liquidity Fund, and records a liability in the Statement of Net Assets for the return of the collateral, during the period the securities are on loan. Securities lending income represents fees charged to borrowers plus income earned on invested cash collateral, less expenses associated with the loan. During the term of the loan, the fund is entitled to all distributions made on or in respect of the loaned securities.
7. Credit Facility: The fund and certain other funds managed by The Vanguard Group (“Vanguard”) participate in a $3.1 billion committed credit facility provided by a syndicate of lenders pursuant to a credit agreement that may be renewed annually; each fund is individually liable for its borrowings, if any, under the credit facility. Borrowings may be utilized for temporary and emergency purposes, and are subject to the fund’s regulatory and contractual borrowing restrictions. The participating funds are charged administrative fees and an annual commitment fee of 0.10% of the undrawn amount of the facility; these fees are allocated to the funds based on a method approved by the fund’s board of trustees and included in Management and Administrative expenses on the fund’s Statement of Operations. Any borrowings under this facility bear interest at a rate based upon the higher of the one-month London Interbank Offered Rate, federal funds effective rate, or overnight bank funding rate plus an agreed-upon spread.
The fund had no borrowings outstanding at December 31, 2016, or at any time during the period then ended.
29
Extended Market Index Fund
8. Other: Dividend income is recorded on the ex-dividend date. Interest income includes income distributions received from Vanguard Market Liquidity Fund and is accrued daily. Premiums and discounts on debt securities purchased are amortized and accreted, respectively, to interest income over the lives of the respective securities. Security transactions are accounted for on the date securities are bought or sold. Costs used to determine realized gains (losses) on the sale of investment securities are those of the specific securities sold.
Each class of shares has equal rights as to assets and earnings, except that each class separately bears certain class-specific expenses related to maintenance of shareholder accounts (included in Management and Administrative expenses) and shareholder reporting. Marketing and distribution expenses are allocated to each class of shares based on a method approved by the board of trustees. Income, other non-class-specific expenses, and gains and losses on investments are allocated to each class of shares based on its relative net assets.
B. In accordance with the terms of a Funds’ Service Agreement (the “FSA”) between Vanguard and the fund, Vanguard furnishes to the fund investment advisory, corporate management, administrative, marketing, and distribution services at Vanguard’s cost of operations (as defined by the FSA). These costs of operations are allocated to the fund based on methods and guidelines approved by the board of trustees. Vanguard does not require reimbursement in the current period for certain costs of operations (such as deferred compensation/benefits and risk/insurance costs); the fund’s liability for these costs of operations is included in Payables to Vanguard on the Statement of Net Assets.
Upon the request of Vanguard, the fund may invest up to 0.40% of its net assets as capital in Vanguard. At December 31, 2016, the fund had contributed to Vanguard capital in the amount of $3,730,000, representing 0.01% of the fund’s net assets and 1.49% of Vanguard’s capitalization. The fund’s trustees and officers are also directors and employees, respectively, of Vanguard.
C. Various inputs may be used to determine the value of the fund’s investments. These inputs are summarized in three broad levels for financial statement purposes. The inputs or methodologies used to value securities are not necessarily an indication of the risk associated with investing in those securities.
Level 1—Quoted prices in active markets for identical securities.
Level 2—Other significant observable inputs (including quoted prices for similar securities, interest rates, prepayment speeds, credit risk, etc.).
Level 3—Significant unobservable inputs (including the fund’s own assumptions used to determine the fair value of investments).
30
Extended Market Index Fund
The following table summarizes the market value of the fund’s investments as of December 31, 2016, based on the inputs used to value them:
| | | |
| | Level 1 | Level 2 | Level 3 |
| Investments | ($000) | ($000) | ($000) |
| Common Stocks | 51,419,508 | 375 | 4,750 |
| Convertible Bond | — | 335 | — |
| Temporary Cash Investments | 801,115 | 10,815 | — |
| Futures Contracts—Liabilities1 | (591) | — | — |
| Swap Contracts—Liabilities | — | (662) | — |
| Total | 52,220,032 | 10,863 | 4,750 |
| 1 Represents variation margin on the last day of the reporting period. |
D. At December 31, 2016, the aggregate settlement value of open futures contracts and the related unrealized appreciation (depreciation) were:
| | | | |
| | | | ($000) |
| | | | Aggregate | |
| | | Number of | Settlement | Unrealized |
| | | Long (Short) | Value | Appreciation |
| Futures Contracts | Expiration | Contracts | Long (Short) | (Depreciation) |
| E-mini Russell 2000 Index | March 2017 | 1,045 | 70,898 | (1,550) |
| E-mini S&P Mid-Cap 400 Index | March 2017 | 425 | 70,512 | (1,354) |
| | | | | (2,904) |
Unrealized appreciation (depreciation) on open futures contracts is required to be treated as realized gain (loss) for tax purposes.
At December 31, 2016, the fund had the following open total return swap contracts:
| | | | | |
| | | | | Floating | Unrealized |
| | | | Notional | Interest Rate | Appreciation |
| | Termination | | Amount | Received | (Depreciation) |
| Reference Entity | Date | Counterparty | ($000) | (Paid) | ($000) |
| Ambac Financial Group Inc. | 1/6/17 | GSCM | 5,519 | (1.054%) | (662) |
| GSCM—Goldman Sachs Capital Markets. |
31
Extended Market Index Fund
E. Distributions are determined on a tax basis and may differ from net investment income and realized capital gains for financial reporting purposes. Differences may be permanent or temporary. Permanent differences are reclassified among capital accounts in the financial statements to reflect their tax character. Temporary differences arise when certain items of income, expense, gain, or loss are recognized in different periods for financial statement and tax purposes. These differences will reverse at some time in the future. Differences in classification may also result from the treatment of short-term gains as ordinary income for tax purposes.
During the year ended December 31, 2016, the fund realized $2,995,349,000 of net capital gains resulting from in-kind redemptions—in which shareholders exchanged fund shares for securities held by the fund rather than for cash. Because such gains are not taxable to the fund, and are not distributed to shareholders, they have been reclassified from accumulated net realized losses to paid-in capital.
Realized and unrealized gains (losses) on certain of the fund’s swap contracts are treated as ordinary income (loss) for tax purposes. Realized losses of $2,334,000 on swap contracts have been reclassified from accumulated net realized losses to overdistributed net investment income.
For tax purposes, at December 31, 2016, the fund had $11,188,000 of ordinary income available for distribution. At December 31, 2016, the fund had available capital losses totaling $588,093,000 to offset future net capital gains. Of this amount, $74,162,000 is subject to expiration dates; $49,578,000 may be used to offset future net capital gains through December 31, 2017, and $24,584,000 through December 31, 2018. Capital losses of $513,931,000 realized beginning in fiscal 2011 may be carried forward indefinitely under the Regulated Investment Company Modernization Act of 2010, but must be used before any expiring loss carryforwards.
At December 31, 2016, the cost of investment securities for tax purposes was $41,893,487,000. Net unrealized appreciation of investment securities for tax purposes was $10,343,411,000, consisting of unrealized gains of $14,097,963,000 on securities that had risen in value since their purchase and $3,754,552,000 in unrealized losses on securities that had fallen in value since their purchase.
F. During the year ended December 31, 2016, the fund purchased $14,251,555,000 of investment securities and sold $11,617,641,000 of investment securities, other than temporary cash investments. Purchases and sales include $5,504,085,000 and $6,157,633,000, respectively, in connection with in-kind purchases and redemptions of the fund’s capital shares.
32
Extended Market Index Fund
G. Capital share transactions for each class of shares were:
| | | | |
| | Year Ended December 31, |
| | 2016 | 2015 |
| | Amount | Shares | Amount | Shares |
| | ($000) | (000) | ($000) | (000) |
| Investor Shares | | | | |
| Issued | 240,445 | 3,671 | 349,644 | 5,171 |
| Issued in Lieu of Cash Distributions | 27,214 | 400 | 24,858 | 386 |
| Redeemed | (548,625) | (8,365) | (577,896) | (8,608) |
| Net Increase (Decrease)—Investor Shares | (280,966) | (4,294) | (203,394) | (3,051) |
| ETF Shares | | | | |
| Issued | 5,678,987 | 66,185 | 6,474,730 | 72,703 |
| Issued in Lieu of Cash Distributions | — | — | — | — |
| Redeemed | (6,125,168) | (71,400) | (5,652,585) | (63,400) |
| Net Increase (Decrease)—ETF Shares | (446,181) | (5,215) | 822,145 | 9,303 |
| Admiral Shares | | | | |
| Issued | 2,497,284 | 38,224 | 2,647,376 | 39,234 |
| Issued in Lieu of Cash Distributions | 193,387 | 2,835 | 151,949 | 2,362 |
| Redeemed | (1,959,822) | (30,117) | (1,869,867) | (27,811) |
| Net Increase (Decrease)—Admiral Shares | 730,849 | 10,942 | 929,458 | 13,785 |
| Institutional Shares | | | | |
| Issued | 2,411,527 | 36,450 | 2,581,127 | 38,366 |
| Issued in Lieu of Cash Distributions | 140,018 | 2,051 | 108,833 | 1,692 |
| Redeemed | (1,921,729) | (28,981) | (2,222,144) | (33,075) |
| Net Increase (Decrease)—Institutional Shares | 629,816 | 9,520 | 467,816 | 6,983 |
| Institutional Plus Shares | | | | |
| Issued | 3,179,636 | 19,828 | 3,613,868 | 21,550 |
| Issued in Lieu of Cash Distributions | 218,549 | 1,310 | 203,574 | 1,283 |
| Redeemed | (6,273,909) | (38,337) | (2,170,686) | (13,196) |
| Net Increase (Decrease)—Institutional Plus Shares | (2,875,724) | (17,199) | 1,646,756 | 9,637 |
| Institutional Select Shares1 | | | | |
| Issued | 4,912,755 | 45,367 | — | — |
| Issued in Lieu of Cash Distributions | 37,670 | 325 | — | — |
| Redeemed | (105,495) | (959) | — | — |
| Net Increase (Decrease)—Institutional Select Shares | 4,844,930 | 44,733 | — | — |
| 1 Inception was June 27, 2016, for Institutional Select Shares. |
H. Management has determined that no material events or transactions occurred subsequent to December 31, 2016, that would require recognition or disclosure in these financial statements.
33
Mid-Cap Index Fund
Fund Profile
As of December 31, 2016
| | | | | |
| Share-Class Characteristics | | | | | |
| | Investor | | Admiral | Institutional | Institutional |
| | Shares | ETF Shares | Shares | Shares | Plus Shares |
| Ticker Symbol | VIMSX | VO | VIMAX | VMCIX | VMCPX |
| Expense Ratio1 | 0.20% | 0.08% | 0.08% | 0.07% | 0.05% |
| 30-Day SEC Yield | 1.42% | 1.54% | 1.54% | 1.55% | 1.54% |
| | | |
| Portfolio Characteristics | | |
| | | | DJ |
| | | | U.S. |
| | | CRSP US | Total |
| | | Mid Cap | Market |
| | Fund | Index | FA Index |
| Number of Stocks | 343 | 340 | 3,833 |
| Median Market Cap | $11.7B | $11.7B | $54.1B |
| Price/Earnings Ratio | 26.3x | 26.3x | 24.4x |
| Price/Book Ratio | 2.6x | 2.6x | 2.8x |
| Return on Equity | 15.0% | 14.8% | 16.5% |
| Earnings Growth Rate | 9.6% | 9.6% | 8.2% |
| Dividend Yield | 1.6% | 1.6% | 2.0% |
| Foreign Holdings | 0.0% | 0.0% | 0.0% |
| Turnover Rate | 15% | — | — |
| Short-Term Reserves | 0.2% | — | — |
| | | |
| Sector Diversification (% of equity exposure) |
| | | | DJ |
| | | CRSP US | U.S. Total |
| | | Mid Cap | Market |
| | Fund | Index | FA Index |
| Basic Materials | 4.3% | 4.3% | 2.6% |
| Consumer Goods | 13.4 | 13.4 | 9.6 |
| Consumer Services | 11.7 | 11.7 | 13.1 |
| Financials | 22.2 | 22.2 | 20.8 |
| Health Care | 7.9 | 7.9 | 12.2 |
| Industrials | 16.6 | 16.6 | 12.9 |
| Oil & Gas | 5.2 | 5.2 | 6.9 |
| Technology | 12.3 | 12.3 | 16.4 |
| Telecommunications | 1.1 | 1.1 | 2.4 |
| Utilities | 5.3 | 5.3 | 3.1 |
| | |
| Volatility Measures | | |
| | | DJ |
| | CRSP US | U.S. Total |
| | Mid Cap | Market |
| | Index | FA Index |
| R-Squared | 1.00 | 0.94 |
| Beta | 1.00 | 1.04 |
| These measures show the degree and timing of the fund’s |
| fluctuations compared with the indexes over 36 months. |
| | |
| Ten Largest Holdings (% of total net assets) |
| Equinix Inc. | Specialty REITs | 0.8% |
| Fiserv Inc. | Financial | |
| | Administration | 0.7 |
| Electronic Arts Inc. | Toys | 0.7 |
| M&T Bank Corp. | Banks | 0.7 |
| Newell Brands Inc. | Durable Household | |
| | Products | 0.7 |
| Amphenol Corp. | Electrical | |
| | Components & | |
| | Equipment | 0.6 |
| Edwards Lifesciences | | |
| Corp. | Medical Supplies | 0.6 |
| KeyCorp | Banks | 0.6 |
| Western Digital Corp. | Computer Hardware | 0.6 |
| Concho Resources Inc. | Exploration & | |
| | Production | 0.6 |
| Top Ten | | 6.6% |
| The holdings listed exclude any temporary cash investments and equity index products. |
1 The expense ratios shown are from the prospectus dated April 27, 2016, and represent estimated costs for the current fiscal year. For the fiscal
year ended December 31, 2016, the expense ratios were 0.18% for Investor Shares, 0.06% for ETF Shares, 0.06% for Admiral Shares, 0.05% for
Institutional Shares, and 0.04% for Institutional Plus Shares.
34
Mid-Cap Index Fund
Investment Focus
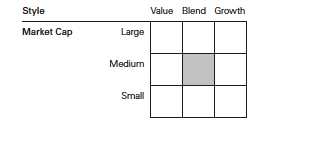
35
Mid-Cap Index Fund
Performance Summary
All of the returns in this report represent past performance, which is not a guarantee of future results that may be achieved by the fund. (Current performance may be lower or higher than the performance data cited. For performance data current to the most recent month-end, visit our website at vanguard.com/performance.) Note, too, that both investment returns and principal value can fluctuate widely, so an investor’s shares, when sold, could be worth more or less than their original cost. The returns shown do not reflect taxes that a shareholder would pay on fund distributions or on the sale of fund shares.
Cumulative Performance: December 31, 2006, Through December 31, 2016
Initial Investment of $10,000
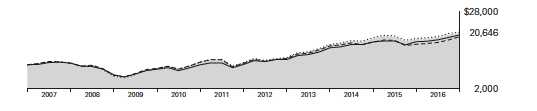
| | | | | |
| | | Average Annual Total Returns | |
| | | Periods Ended December 31, 2016 | |
| | | | | | Final Value |
| | | One | Five | Ten | of a $10,000 |
| | | Year | Years | Years | Investment |
| | Mid-Cap Index Fund*Investor Shares | 11.07% | 14.22% | 7.52% | $20,646 |
| • • • • • • •• | Spliced Mid-Cap Index | 11.25 | 14.42 | 7.70 | 20,995 |
| – – – – | Mid-Cap Core Funds Average | 14.82 | 13.11 | 6.86 | 19,413 |
| | Dow Jones U.S. Total Stock Market | | | | |
| | Float Adjusted Index | 12.62 | 14.59 | 7.18 | 20,003 |
| For a benchmark description, see the Glossary. |
| Mid-Cap Core Funds Average: Derived from data provided by Lipper, a Thomson Reuters Company. |
| | | | |
| | | | | Final Value |
| | One | Five | Ten | of a $10,000 |
| | Year | Years | Years | Investment |
| Mid-Cap Index Fund | | | | |
| ETF Shares Net Asset Value | 11.23% | 14.37% | 7.66% | $20,911 |
| Spliced Mid-Cap Index | 11.25 | 14.42 | 7.70 | 20,995 |
| Dow Jones U.S. Total Stock Market Float | | | | |
| Adjusted Index | 12.62 | 14.59 | 7.18 | 20,003 |
See Financial Highlights for dividend and capital gains information.
36
Mid-Cap Index Fund
| | | | |
| | Average Annual Total Returns | |
| | Periods Ended December 31, 2016 | |
| |
| | | | | Final Value |
| | One | Five | Ten | of a $10,000 |
| | Year | Years | Years | Investment |
| Mid-Cap Index Fund Admiral Shares | 11.22% | 14.37% | 7.66% | $20,922 |
| Spliced Mid-Cap Index | 11.25 | 14.42 | 7.70 | 20,995 |
| Dow Jones U.S. Total Stock Market Float | | | | |
| Adjusted Index | 12.62 | 14.59 | 7.18 | 20,003 |
| | | | |
| | | | | Final Value |
| | One | Five | Ten | of a $5,000,000 |
| | Year | Years | Years | Investment |
| |
| Mid-Cap Index Fund Institutional Shares | 11.23% | 14.38% | 7.69% | $10,484,888 |
| |
| Spliced Mid-Cap Index | 11.25 | 14.42 | 7.70 | 10,497,300 |
| Dow Jones U.S. Total Stock Market Float | | | | |
| Adjusted Index | 12.62 | 14.59 | 7.18 | 10,001,613 |
| | | | |
| | | | Since | Final Value |
| | One | Five | Inception | of a $100,000,000 |
| | Year | Years | (12/15/2010) | Investment |
| Mid-Cap Index Fund Institutional Plus Shares | 11.24% | 14.40% | 11.81% | $196,392,399 |
| Spliced Mid-Cap Index | 11.25 | 14.42 | 11.83 | 182,000,886 |
| Dow Jones U.S. Total Stock Market Float | | | | |
| Adjusted Index | 12.62 | 14.59 | 12.50 | 203,792,269 |
| "Since Inception" performance is calculated from the Institutional Plus Shares’ inception date for both the fund and its comparative standards. |
| | | |
| Cumulative Returns of ETF Shares: December 31, 2006, Through December 31, 2016 | |
| | One | Five | Ten |
| | Year | Years | Years |
| Mid-Cap Index Fund ETF Shares Market Price | 11.25% | 95.72% | 109.15% |
| Mid-Cap Index Fund ETF Shares Net Asset Value | 11.23 | 95.68 | 109.11 |
| Spliced Mid-Cap Index | 11.25 | 96.13 | 109.95 |
37
Mid-Cap Index Fund
Fiscal-Year Total Returns (%): December 31, 2006, Through December 31, 2016
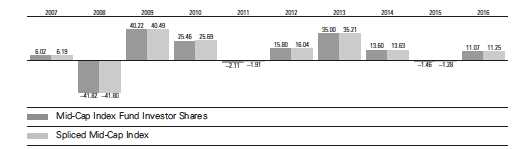
For a benchmark description, see the Glossary.
38
Mid-Cap Index Fund
Financial Statements
Statement of Net Assets
As of December 31, 2016
The fund reports a complete list of its holdings in regulatory filings four times in each fiscal year, at the quarter-ends. For the second and fourth fiscal quarters, the lists appear in the fund’s semiannual and annual reports to shareholders. For the first and third fiscal quarters, the fund files the lists with the Securities and Exchange Commission on Form N-Q. Shareholders can look up the fund’s Forms N-Q on the SEC’s website at sec.gov. Forms N-Q may also be reviewed and copied at the SEC’s Public Reference Room (see the back cover of this report for further information).
| | | |
| | | | Market |
| | | | Value• |
| | | Shares | ($000) |
| Common Stocks (99.9%)1 | | |
| Basic Materials (4.3%) | | |
| | Newmont Mining Corp. | 12,421,774 | 423,210 |
| * | Freeport-McMoRan Inc. | 28,672,012 | 378,184 |
| | Celanese Corp. Class A | 3,351,027 | 263,860 |
| | Eastman Chemical Co. | 3,261,244 | 245,278 |
| | Mosaic Co. | 8,195,823 | 240,383 |
| | Albemarle Corp. | 2,631,900 | 226,554 |
| | International Flavors & | | |
| | Fragrances Inc. | 1,672,547 | 197,076 |
| | Arconic Inc. | 10,259,877 | 190,218 |
| | FMC Corp. | 3,136,006 | 177,372 |
| | CF Industries Holdings | | |
| | Inc. | 5,462,389 | 171,956 |
| | Ashland Global Holdings | | |
| | Inc. | 1,456,892 | 159,224 |
| | Avery Dennison Corp. | 2,085,373 | 146,435 |
| * | Axalta Coating Systems | | |
| | Ltd. | 5,069,527 | 137,891 |
| | Reliance Steel & | | |
| | Aluminum Co. | 1,615,966 | 128,534 |
| | WR Grace & Co. | 1,642,280 | 111,084 |
| * | Alcoa Corp. | 2,138,624 | 60,053 |
| | Westlake Chemical Corp. | 907,054 | 50,786 |
| | | | 3,308,098 |
| Consumer Goods (13.3%) | | |
| * | Electronic Arts Inc. | 6,709,425 | 528,434 |
| | Newell Brands Inc. | 11,290,439 | 504,118 |
| | Conagra Brands Inc. | 10,245,488 | 405,209 |
| | Molson Coors Brewing | | |
| | Co. Class B | 4,086,773 | 397,684 |
| | Dr Pepper Snapple | | |
| | Group Inc. | 4,299,573 | 389,842 |
| | Clorox Co. | 3,013,022 | 361,623 |
| | JM Smucker Co. | 2,588,620 | 331,499 |
| | Whirlpool Corp. | 1,757,680 | 319,494 |
| | Genuine Parts Co. | 3,306,754 | 315,927 |
| * | Mohawk Industries Inc. | 1,475,303 | 294,589 |
| | Church & Dwight Co. Inc. | 6,051,773 | 267,428 |
| | | |
| | McCormick & Co. Inc. | 2,680,882 | 250,207 |
| | Harley-Davidson Inc. | 4,136,558 | 241,327 |
| | Bunge Ltd. | 3,263,385 | 235,747 |
| | Snap-on Inc. | 1,357,734 | 232,539 |
| | DR Horton Inc. | 8,450,461 | 230,951 |
| * | WhiteWave Foods Co. | | |
| | Class A | 4,147,177 | 230,583 |
| | Coach Inc. | 6,560,629 | 229,753 |
| | Mattel Inc. | 8,003,909 | 220,508 |
| | Lear Corp. | 1,642,749 | 217,451 |
| | Hormel Foods Corp. | 6,191,618 | 215,530 |
| | Delphi Automotive plc | 3,168,735 | 213,414 |
| | Tyson Foods Inc. Class A | 3,399,932 | 209,708 |
| * | LKQ Corp. | 6,835,835 | 209,518 |
| | Hasbro Inc. | 2,627,905 | 204,425 |
| | Lennar Corp. Class A | 4,735,125 | 203,279 |
| | BorgWarner Inc. | 4,980,361 | 196,426 |
| | Coty Inc. Class A | 10,491,843 | 192,106 |
| | Hanesbrands Inc. | 8,855,446 | 191,012 |
| | Harman International | | |
| | Industries Inc. | 1,633,161 | 181,542 |
| | Leucadia National Corp. | 7,592,186 | 176,518 |
| | PVH Corp. | 1,879,876 | 169,640 |
| * | Michael Kors Holdings | | |
| | Ltd. | 3,656,233 | 157,145 |
| * | Lululemon Athletica Inc. | 2,236,638 | 145,359 |
| * | NVR Inc. | 84,250 | 140,613 |
| * | WABCO Holdings Inc. | 1,226,729 | 130,217 |
| * | Lamb Weston Holdings | | |
| | Inc. | 3,420,769 | 129,476 |
| | PulteGroup Inc. | 6,977,527 | 128,247 |
| *,^ | Under Armour Inc. | | |
| | Class A | 4,307,028 | 125,119 |
| | Ralph Lauren Corp. | | |
| | Class A | 1,320,172 | 119,238 |
| ^ | Polaris Industries Inc. | 1,426,788 | 117,553 |
| * | Under Armour Inc. | 4,380,336 | 110,253 |
| | Ingredion Inc. | 848,193 | 105,990 |
| * | Edgewell Personal Care | | |
| | Co. | 1,356,951 | 99,044 |
39
Mid-Cap Index Fund
| | | |
| | | | Market |
| | | | Value• |
| | | Shares | ($000) |
| | Goodyear Tire & Rubber | | |
| | Co. | 3,058,281 | 94,409 |
| | Pilgrim’s Pride Corp. | 1,174,374 | 22,301 |
| | Lennar Corp. Class B | 82,620 | 2,850 |
| | | | 10,195,845 |
| Consumer Services (11.7%) | | |
| * | Dollar Tree Inc. | 5,242,120 | 404,587 |
| * | Ulta Salon Cosmetics & | | |
| | Fragrance Inc. | 1,386,664 | 353,516 |
| | Nielsen Holdings plc | 8,362,112 | 350,791 |
| | Royal Caribbean Cruises | | |
| | Ltd. | 4,017,429 | 329,590 |
| * | MGM Resorts | | |
| | International | 11,401,872 | 328,716 |
| | Expedia Inc. | 2,890,374 | 327,422 |
| | Ross Stores Inc. | 4,640,473 | 304,415 |
| * | CarMax Inc. | 4,454,014 | 286,794 |
| | Advance Auto Parts Inc. | 1,637,373 | 276,913 |
| | Best Buy Co. Inc. | 6,310,988 | 269,290 |
| | Macy’s Inc. | 7,218,560 | 258,497 |
| | Alaska Air Group Inc. | 2,884,676 | 255,957 |
| * | Chipotle Mexican Grill | | |
| | Inc. Class A | 677,433 | 255,609 |
| * | United Continental | | |
| | Holdings Inc. | 3,206,393 | 233,682 |
| | Tractor Supply Co. | 3,071,262 | 232,832 |
| | Whole Foods Market Inc. | 7,450,851 | 229,188 |
| ^ | Tiffany & Co. | 2,921,326 | 226,198 |
| | Foot Locker Inc. | 3,118,055 | 221,039 |
| | Interpublic Group of Cos. | | |
| | Inc. | 9,290,007 | 217,479 |
| | Darden Restaurants Inc. | 2,880,014 | 209,435 |
| | Kohl’s Corp. | 4,202,413 | 207,515 |
| | Aramark | 5,727,115 | 204,573 |
| * | Liberty Interactive Corp. | | |
| | QVC Group Class A | 9,740,200 | 194,609 |
| | Wyndham Worldwide | | |
| | Corp. | 2,525,274 | 192,855 |
| | Signet Jewelers Ltd. | 1,771,390 | 166,971 |
| | Wynn Resorts Ltd. | 1,907,221 | 164,994 |
| * | Norwegian Cruise Line | | |
| | Holdings Ltd. | 3,726,330 | 158,481 |
| | FactSet Research | | |
| | Systems Inc. | 935,797 | 152,937 |
| | AmerisourceBergen Corp. | | |
| | Class A | 1,934,200 | 151,235 |
| * | Liberty Media | | |
| | Corp-Liberty SiriusXM | | |
| | Class C | 4,176,650 | 141,672 |
| * | Discovery | | |
| | Communications Inc. | 5,224,175 | 139,903 |
| | Staples Inc. | 15,244,112 | 137,959 |
| | Bed Bath & Beyond Inc. | 3,385,468 | 137,585 |
| | Nordstrom Inc. | 2,845,071 | 136,364 |
| | Scripps Networks | | |
| | Interactive Inc. Class A | 1,897,453 | 135,421 |
| | | |
| | News Corp. Class A | 11,543,029 | 132,283 |
| * | TripAdvisor Inc. | 2,648,147 | 122,795 |
| | H&R Block Inc. | 5,132,638 | 117,999 |
| | Gap Inc. | 5,137,578 | 115,287 |
| * | Rite Aid Corp. | 12,325,538 | 101,563 |
| * | Discovery | | |
| | Communications Inc. | | |
| | Class A | 3,560,059 | 97,581 |
| | Williams-Sonoma Inc. | 1,866,751 | 90,332 |
| * | AutoNation Inc. | 1,657,584 | 80,642 |
| * | Liberty Media | | |
| | Corp-Liberty SiriusXM | | |
| | Class A | 2,038,908 | 70,383 |
| * | Hyatt Hotels Corp. | | |
| | Class A | 634,207 | 35,046 |
| | News Corp. Class B | 209,094 | 2,467 |
| | | | 8,961,402 |
| Financials (22.2%) | | |
| | Equinix Inc. | 1,670,643 | 597,104 |
| | M&T Bank Corp. | 3,265,918 | 510,887 |
| | KeyCorp | 25,293,324 | 462,109 |
| | Citizens Financial | | |
| | Group Inc. | 11,979,974 | 426,846 |
| | Hartford Financial | | |
| | Services Group Inc. | 8,840,482 | 421,249 |
| | Regions Financial Corp. | 28,809,561 | 413,705 |
| | Principal Financial | | |
| | Group Inc. | 6,732,703 | 389,554 |
| | Willis Towers Watson | | |
| | plc | 3,040,319 | 371,770 |
| | Digital Realty Trust Inc. | 3,718,255 | 365,356 |
| | Moody’s Corp. | 3,802,877 | 358,497 |
| | Essex Property Trust Inc. | 1,533,299 | 356,492 |
| | Lincoln National Corp. | 5,348,979 | 354,477 |
| | Realty Income Corp. | 6,051,980 | 347,868 |
| | Huntington Bancshares | | |
| | Inc. | 25,387,015 | 335,616 |
| | Equifax Inc. | 2,802,734 | 331,367 |
| | First Republic Bank | 3,594,244 | 331,174 |
| | Host Hotels & Resorts | | |
| | Inc. | 17,314,867 | 326,212 |
| * | IHS Markit Ltd. | 8,393,246 | 297,205 |
| | Invesco Ltd. | 9,560,517 | 290,066 |
| | AvalonBay Communities | | |
| | Inc. | 1,606,842 | 284,652 |
| * | Markel Corp. | 311,050 | 281,345 |
| | Cincinnati Financial Corp. | 3,662,648 | 277,446 |
| | Comerica Inc. | 4,031,185 | 274,564 |
| | Mid-America Apartment | | |
| | Communities Inc. | 2,655,447 | 260,021 |
| | SL Green Realty Corp. | 2,371,015 | 255,003 |
| * | Liberty Broadband Corp. | 3,401,278 | 251,933 |
| | Western Union Co. | 11,346,092 | 246,437 |
| | Federal Realty | | |
| | Investment Trust | 1,679,788 | 238,715 |
| | Unum Group | 5,431,725 | 238,616 |
40
Mid-Cap Index Fund
| | | |
| | | | Market |
| | | | Value• |
| | | Shares | ($000) |
| | Kimco Realty Corp. | 9,448,523 | 237,725 |
| | Annaly Capital | | |
| | Management Inc. | 23,842,324 | 237,708 |
| * | Arch Capital Group Ltd. | 2,727,508 | 235,357 |
| | XL Group Ltd. | 6,296,087 | 234,592 |
| | UDR Inc. | 6,253,586 | 228,131 |
| | Macerich Co. | 3,194,985 | 226,333 |
| * | E*TRADE Financial Corp. | 6,407,236 | 222,011 |
| | Duke Realty Corp. | 8,295,408 | 220,326 |
| | Extra Space Storage Inc. | 2,796,631 | 216,012 |
| * | CBRE Group Inc. Class A | 6,708,380 | 211,247 |
| | Raymond James | | |
| | Financial Inc. | 2,989,852 | 207,107 |
| | FNF Group | 6,091,804 | 206,878 |
| | Alexandria Real Estate | | |
| | Equities Inc. | 1,857,040 | 206,373 |
| | Zions Bancorporation | 4,773,080 | 205,433 |
| | CIT Group Inc. | 4,728,120 | 201,796 |
| | Ally Financial Inc. | 10,483,290 | 199,392 |
| | Torchmark Corp. | 2,641,175 | 194,813 |
| | VEREIT Inc. | 22,779,657 | 192,716 |
| | Iron Mountain Inc. | 5,864,051 | 190,464 |
| | Reinsurance Group of | | |
| | America Inc. Class A | 1,504,447 | 189,304 |
| * | Affiliated Managers | | |
| | Group Inc. | 1,281,711 | 186,233 |
| | Nasdaq Inc. | 2,709,621 | 181,870 |
| | Voya Financial Inc. | 4,560,163 | 178,850 |
| | Brixmor Property Group | | |
| | Inc. | 7,130,603 | 174,129 |
| | MSCI Inc. Class A | 2,200,813 | 173,380 |
| | New York Community | | |
| | Bancorp Inc. | 10,841,467 | 172,488 |
| | Camden Property Trust | 2,049,856 | 172,331 |
| | SEI Investments Co. | 3,374,252 | 166,553 |
| | Everest Re Group Ltd. | 756,976 | 163,810 |
| | WR Berkley Corp. | 2,133,223 | 141,881 |
| | People’s United Financial | | |
| | Inc. | 7,297,068 | 141,271 |
| | AGNC Investment Corp. | 7,757,751 | 140,648 |
| | Axis Capital Holdings Ltd. | 2,073,257 | 135,321 |
| | Lazard Ltd. Class A | 3,041,903 | 124,992 |
| | Arthur J Gallagher & Co. | 2,078,765 | 108,013 |
| | Jones Lang LaSalle Inc. | 1,059,219 | 107,023 |
| * | Alleghany Corp. | 171,599 | 104,353 |
| | Assurant Inc. | 668,504 | 62,077 |
| | Navient Corp. | 3,554,196 | 58,395 |
| * | Liberty Broadband Corp. | | |
| | Class A | 584,950 | 42,385 |
| | Athene Holding Ltd. | | |
| | Class A | 555,984 | 26,682 |
| * | Santander Consumer | | |
| | USA Holdings Inc. | 1,257,006 | 16,970 |
| | Realogy Holdings Corp. | 3,074 | 79 |
| | | | 16,939,738 |
| | | |
| Health Care (7.9%) | | |
| * | Edwards Lifesciences | | |
| | Corp. | 5,004,176 | 468,891 |
| | CR Bard Inc. | 1,720,772 | 386,589 |
| * | Incyte Corp. | 3,747,527 | 375,764 |
| * | BioMarin Pharmaceutical | | |
| | Inc. | 4,023,609 | 333,316 |
| | Dentsply Sirona Inc. | 5,403,181 | 311,926 |
| * | Laboratory Corp. of | | |
| | America Holdings | 2,410,444 | 309,453 |
| | Quest Diagnostics Inc. | 3,244,479 | 298,168 |
| * | Henry Schein Inc. | 1,883,575 | 285,757 |
| | Perrigo Co. plc | 3,185,704 | 265,146 |
| * | Quintiles IMS Holdings | | |
| | Inc. | 3,455,342 | 262,779 |
| * | Hologic Inc. | 6,510,577 | 261,204 |
| * | IDEXX Laboratories Inc. | 2,098,033 | 246,036 |
| * | Waters Corp. | 1,791,218 | 240,722 |
| * | DaVita Inc. | 3,695,399 | 237,245 |
| | Universal Health | | |
| | Services Inc. Class B | 2,098,247 | 223,211 |
| * | Centene Corp. | 3,798,841 | 214,672 |
| ^ | ResMed Inc. | 3,298,493 | 204,671 |
| | Cooper Cos. Inc. | 1,140,455 | 199,500 |
| * | Alkermes plc | 3,555,944 | 197,639 |
| * | Varian Medical | | |
| | Systems Inc. | 2,188,674 | 196,499 |
| * | Jazz Pharmaceuticals plc | 1,333,347 | 145,375 |
| * | Mallinckrodt plc | 2,524,218 | 125,757 |
| * | Envision Healthcare Corp. | 1,375,110 | 87,031 |
| | Seattle Genetics Inc. | 1,078,388 | 56,907 |
| | Patterson Cos. Inc. | 985,007 | 40,415 |
| * | Alnylam Pharmaceuticals | | |
| | Inc. | 853,170 | 31,943 |
| * | Endo International plc | 4,200 | 69 |
| | | | 6,006,685 |
| Industrials (16.6%) | | |
| * | Fiserv Inc. | 5,080,142 | 539,917 |
| | Amphenol Corp. Class A | 7,219,776 | 485,169 |
| | Roper Technologies Inc. | 2,373,880 | 434,610 |
| | Vulcan Materials Co. | 3,096,430 | 387,518 |
| | Martin Marietta | | |
| | Materials Inc. | 1,485,288 | 329,036 |
| | Waste Connections Inc. | 4,098,712 | 322,118 |
| | Fastenal Co. | 6,764,090 | 317,777 |
| * | FleetCor Technologies | | |
| | Inc. | 2,170,816 | 307,214 |
| | Ball Corp. | 4,090,868 | 307,101 |
| | WestRock Co. | 5,885,579 | 298,811 |
| | TransDigm Group Inc. | 1,186,022 | 295,272 |
| | Alliance Data Systems | | |
| | Corp. | 1,284,097 | 293,416 |
| * | Verisk Analytics Inc. | | |
| | Class A | 3,526,752 | 286,266 |
| | Rockwell Collins Inc. | 3,048,185 | 282,750 |
41
Mid-Cap Index Fund
| | | |
| | | | Market |
| | | | Value• |
| | | Shares | ($000) |
| | Textron Inc. | 5,691,003 | 276,355 |
| | WW Grainger Inc. | 1,184,921 | 275,198 |
| | Dover Corp. | 3,635,345 | 272,396 |
| | AMETEK Inc. | 5,415,758 | 263,206 |
| * | Mettler-Toledo | | |
| | International Inc. | 613,948 | 256,974 |
| | Global Payments Inc. | 3,596,593 | 249,640 |
| | L-3 Communications | | |
| | Holdings Inc. | 1,627,647 | 247,581 |
| | Masco Corp. | 7,682,682 | 242,926 |
| | CH Robinson Worldwide | | |
| | Inc. | 3,313,784 | 242,768 |
| | Acuity Brands Inc. | 1,031,594 | 238,154 |
| | Cintas Corp. | 1,964,418 | 227,008 |
| | Expeditors International | | |
| | of Washington Inc. | 4,220,829 | 223,535 |
| * | Vantiv Inc. Class A | 3,704,239 | 220,847 |
| | Pentair plc | 3,827,431 | 214,604 |
| | Kansas City Southern | 2,517,307 | 213,593 |
| * | United Rentals Inc. | 1,970,750 | 208,072 |
| | Xylem Inc. | 4,197,762 | 207,873 |
| | Sealed Air Corp. | 4,523,287 | 205,086 |
| | JB Hunt Transport | | |
| | Services Inc. | 2,099,979 | 203,845 |
| | Fortune Brands Home & | | |
| | Security Inc. | 3,615,461 | 193,283 |
| | Total System Services | | |
| | Inc. | 3,876,233 | 190,052 |
| * | Trimble Inc. | 5,863,177 | 176,775 |
| | Xerox Corp. | 20,190,467 | 176,263 |
| * | Crown Holdings Inc. | 3,275,674 | 172,202 |
| | Fluor Corp. | 3,262,767 | 171,361 |
| | Wabtec Corp. | 1,982,906 | 164,621 |
| * | Jacobs Engineering | | |
| | Group Inc. | 2,829,422 | 161,277 |
| * | Sensata Technologies | | |
| | Holding NV | 4,003,699 | 155,944 |
| * | Stericycle Inc. | 1,993,804 | 153,603 |
| | Hubbell Inc. Class B | 1,297,211 | 151,385 |
| * | Arrow Electronics Inc. | 2,099,338 | 149,683 |
| | Macquarie Infrastructure | | |
| | Corp. | 1,817,509 | 148,490 |
| | Flowserve Corp. | 3,056,949 | 146,886 |
| | B/E Aerospace Inc. | 2,375,394 | 142,975 |
| | Avnet Inc. | 2,990,841 | 142,394 |
| | Robert Half International | | |
| | Inc. | 2,869,358 | 139,967 |
| | ManpowerGroup Inc. | 1,571,453 | 139,655 |
| | Owens Corning | 2,655,620 | 136,924 |
| * | First Data Corp. Class A | 8,347,589 | 118,452 |
| | Allison Transmission | | |
| | Holdings Inc. | 3,479,390 | 117,221 |
| | FLIR Systems Inc. | 1,596,321 | 57,771 |
| | Fidelity National | | |
| | Information Services Inc. | 7,750 | 586 |
| | | | 12,684,406 |
| | | |
| Oil & Gas (5.2%) | | |
| * | Concho Resources Inc. | 3,416,999 | 453,094 |
| | Marathon Oil Corp. | 19,827,331 | 343,211 |
| | National Oilwell Varco | | |
| | Inc. | 8,838,900 | 330,928 |
| | Cimarex Energy Co. | 2,222,293 | 302,010 |
| | Devon Energy Corp. | 5,820,186 | 265,808 |
| | EQT Corp. | 4,042,736 | 264,395 |
| | Cabot Oil & Gas Corp. | 10,884,934 | 254,272 |
| | Tesoro Corp. | 2,734,989 | 239,175 |
| | Range Resources Corp. | 5,778,865 | 198,562 |
| * | Cheniere Energy Inc. | 4,679,861 | 193,887 |
| * | FMC Technologies Inc. | 5,288,406 | 187,897 |
| | Helmerich & Payne Inc. | 2,407,969 | 186,377 |
| | OGE Energy Corp. | 4,679,507 | 156,529 |
| | HollyFrontier Corp. | 4,137,797 | 135,554 |
| | Core Laboratories NV | 1,034,088 | 124,132 |
| * | Antero Resources Corp. | 5,137,074 | 121,492 |
| * | Energen Corp. | 1,137,714 | 65,612 |
| | Murphy Oil Corp. | 1,918,069 | 59,709 |
| *,^ | Weatherford | | |
| | International plc | 11,511,767 | 57,444 |
| * | Continental Resources | | |
| | Inc. | 1,098,008 | 56,591 |
| | | | 3,996,679 |
| Technology (12.3%) | | |
| | Western Digital Corp. | 6,679,093 | 453,844 |
| | Lam Research Corp. | 3,809,565 | 402,785 |
| * | Autodesk Inc. | 4,933,370 | 365,119 |
| | Xilinx Inc. | 5,909,574 | 356,761 |
| | Linear Technology Corp. | 5,625,100 | 350,725 |
| | Symantec Corp. | 14,585,143 | 348,439 |
| * | Cerner Corp. | 7,150,678 | 338,728 |
| | Skyworks Solutions Inc. | 4,348,505 | 324,659 |
| | Microchip Technology | | |
| | Inc. | 5,055,371 | 324,302 |
| | Motorola Solutions Inc. | 3,883,896 | 321,936 |
| * | Citrix Systems Inc. | 3,467,469 | 309,680 |
| | Harris Corp. | 2,908,290 | 298,013 |
| * | Red Hat Inc. | 4,202,870 | 292,940 |
| | KLA-Tencor Corp. | 3,658,115 | 287,821 |
| * | Dell Technologies Inc. | | |
| | Class V | 5,215,139 | 286,676 |
| * | ServiceNow Inc. | 3,689,225 | 274,257 |
| * | Micron Technology Inc. | 12,186,827 | 267,135 |
| | Seagate Technology plc | 6,892,235 | 263,077 |
| * | Akamai Technologies Inc. | 3,852,652 | 256,895 |
| | Maxim Integrated | | |
| | Products Inc. | 6,629,063 | 255,683 |
| * | Palo Alto Networks Inc. | 2,037,554 | 254,796 |
| | Juniper Networks Inc. | 8,454,808 | 238,933 |
| | NetApp Inc. | 6,520,987 | 229,995 |
| * | F5 Networks Inc. | 1,528,382 | 221,187 |
| * | Twitter Inc. | 13,382,950 | 218,142 |
| | CDK Global Inc. | 3,498,258 | 208,811 |
| * | Synopsys Inc. | 3,541,283 | 208,440 |
42
Mid-Cap Index Fund
| | | |
| | | | Market |
| | | | Value• |
| | | Shares | ($000) |
| * | Workday Inc. Class A | 2,852,692 | 188,534 |
| * | ANSYS Inc. | 2,027,380 | 187,512 |
| * | Gartner Inc. | 1,838,814 | 185,849 |
| * | Splunk Inc. | 3,145,795 | 160,907 |
| *,^ | VeriSign Inc. | 2,082,906 | 158,447 |
| * | Qorvo Inc. | 2,992,996 | 157,821 |
| | Marvell Technology | | |
| | Group Ltd. | 9,002,132 | 124,860 |
| | Garmin Ltd. | 2,429,675 | 117,815 |
| | Computer Sciences Corp. | 1,649,686 | 98,024 |
| * | Nuance Communications | | |
| | Inc. | 3,375,326 | 50,292 |
| * | Premier Inc. Class A | 1,176,248 | 35,711 |
| | | | 9,425,551 |
| Telecommunications (1.1%) | | |
| * | Level 3 Communications | | |
| | Inc. | 6,738,798 | 379,799 |
| * | SBA Communications | | |
| | Corp. Class A | 2,903,517 | 299,817 |
| * | Zayo Group Holdings Inc. | 3,409,616 | 112,040 |
| | Frontier Communications | | |
| | Corp. | 13,720,961 | 46,377 |
| | | | 838,033 |
| Utilities (5.3%) | | |
| | WEC Energy Group Inc. | 7,386,662 | 433,228 |
| | DTE Energy Co. | 4,199,428 | 413,686 |
| | Eversource Energy | 7,416,296 | 409,602 |
| | American Water Works | | |
| | Co. Inc. | 4,165,656 | 301,427 |
| | Ameren Corp. | 5,678,150 | 297,876 |
| | Entergy Corp. | 4,014,948 | 294,978 |
| | ONEOK Inc. | 4,926,638 | 282,838 |
| | CMS Energy Corp. | 6,550,241 | 272,621 |
| | CenterPoint Energy Inc. | 9,574,317 | 235,911 |
| | SCANA Corp. | 3,009,779 | 220,557 |
| | Pinnacle West Capital | | |
| | Corp. | 2,607,897 | 203,494 |
| | Alliant Energy Corp. | 5,330,375 | 201,968 |
| | AES Corp. | 15,445,017 | 179,471 |
| | NiSource Inc. | 7,562,350 | 167,430 |
| | Avangrid Inc. | 1,449,555 | 54,909 |
| * | Calpine Corp. | 4,200,214 | 48,009 |
| | | | 4,018,005 |
| Total Common Stocks | | |
| (Cost $60,178,443) | | 76,374,442 |
| Temporary Cash Investments (0.5%)1 | |
| Money Market Fund (0.5%) | | |
| 2,3 | Vanguard Market Liquidity | | |
| | Fund, 0.823% | 3,716,107 | 371,648 |
| | | |
| | | Face | Market |
| | | Amount | Value• |
| | | ($000) | ($000) |
| U.S. Government and Agency Obligations (0.0%) |
| 4,5 | Federal Home Loan | | |
| | Bank Discount Notes, | | |
| | 0.431%, 1/25/17 | 3,000 | 2,999 |
| 4,5 | Federal Home Loan | | |
| | Bank Discount Notes, | | |
| | 0.481%, 2/17/17 | 500 | 500 |
| 5 | United States Treasury Bill, | | |
| | 0.320%-0.328%, 1/26/17 | 3,000 | 2,999 |
| 5 | United States Treasury Bill, | | |
| | 0.355%, 2/9/17 | 1,000 | 999 |
| 5 | United States Treasury Bill, | | |
| | 0.501%, 3/16/17 | 200 | 200 |
| 5 | United States Treasury Bill, | | |
| | 0.454%, 4/20/17 | 800 | 799 |
| 5 | United States Treasury Bill | | |
| | 0.623%-0.652%, 5/18/17 | 3,500 | 3,492 |
| 5 | United States Treasury Bill, | | |
| | 0.607%, 5/25/17 | 300 | 299 |
| | | | 12,287 |
| Total Temporary Cash Investments | |
| (Cost $383,926) | | 383,935 |
| Total Investments (100.4%) | | |
| (Cost $60,562,369) | | 76,758,377 |
| |
| | | | Amount |
| | | | ($000) |
| Other Assets and Liabilities (-0.4%) | |
| Other Assets | | |
| Investment in Vanguard | | 5,697 |
| Receivables for Investment Securities Sold 103,172 |
| Receivables for Accrued Income | | 95,720 |
| Receivables for Capital Shares Issued | 85,724 |
| Other Assets 5 | | 7,963 |
| Total Other Assets | | 298,276 |
| Liabilities | | |
| Payables for Investment Securities | |
| Purchased | | (11,514) |
| Collateral for Securities on Loan | | (88,074) |
| Payables for Capital Shares Redeemed | (427,123) |
| Payables to Vanguard | | (37,783) |
| Other Liabilities | | (2,380) |
| Total Liabilities | | (566,874) |
| Net Assets (100%) | | 76,489,779 |
43
Mid-Cap Index Fund
| |
| At December 31, 2016, net assets consisted of: |
| | Amount |
| | ($000) |
| Paid-in Capital | 63,360,563 |
| Overdistributed Net Investment Income | (25,443) |
| Accumulated Net Realized Losses | (3,039,502) |
| Unrealized Appreciation (Depreciation) | |
| Investment Securities | 16,196,008 |
| Futures Contracts | (1,847) |
| Net Assets | 76,489,779 |
| |
| |
| Investor Shares—Net Assets | |
| Applicable to 115,192,247 outstanding | |
| $.001 par value shares of beneficial | |
| interest (unlimited authorization) | 4,137,690 |
| Net Asset Value Per Share— | |
| Investor Shares | $35.92 |
| |
| |
| ETF Shares—Net Assets | |
| Applicable to 125,761,484 outstanding | |
| $.001 par value shares of beneficial | |
| interest (unlimited authorization) | 16,543,668 |
| Net Asset Value Per Share— | |
| ETF Shares | $131.55 |
| |
| | Amount |
| | ($000) |
| Admiral Shares—Net Assets | |
| Applicable to 183,223,140 outstanding | |
| $.001 par value shares of beneficial | |
| interest (unlimited authorization) | 29,853,930 |
| Net Asset Value Per Share— | |
| Admiral Shares | $162.94 |
| |
| |
| Institutional Shares—Net Assets | |
| Applicable to 403,957,511 outstanding | |
| $.001 par value shares of beneficial | |
| interest (unlimited authorization) | 14,539,901 |
| Net Asset Value Per Share— | |
| Institutional Shares | $35.99 |
| |
| |
| Institutional Plus Shares—Net Assets | |
| Applicable to 64,302,964 outstanding | |
| $.001 par value shares of beneficial | |
| interest (unlimited authorization) | 11,414,590 |
| Net Asset Value Per Share— | |
| Institutional Plus Shares | $177.51 |
• See Note A in Notes to Financial Statements.
* Non-income-producing security.
^ Includes partial security positions on loan to broker-dealers. The total value of securities on loan is $86,266,000.
1 The fund invests a portion of its cash reserves in equity markets through the use of index futures contracts. After giving effect to futures
investments, the fund’s effective common stock and temporary cash investment positions represent 100.1% and 0.3%, respectively, of net
assets.
2 Affiliated money market fund available only to Vanguard funds and certain trusts and accounts managed by Vanguard. Rate shown is the
7-day yield.
3 Includes $88,074,000 of collateral received for securities on loan.
4 The issuer operates under a congressional charter; its securities are generally neither guaranteed by the U.S. Treasury nor backed by the full
faith and credit of the U.S. government.
5 Securities with a value of $9,314,000 and cash of $6,163,000 have been segregated as initial margin for open futures contracts.
See accompanying Notes, which are an integral part of the Financial Statements.
44
Mid-Cap Index Fund
Statement of Operations
| |
| | Year Ended |
| | December 31, 2016 |
| | ($000) |
| Investment Income | |
| Income | |
| Dividends | 1,098,336 |
| Interest1 | 908 |
| Securities Lending—Net | 9,486 |
| Total Income | 1,108,730 |
| Expenses | |
| The Vanguard Group—Note B | |
| Investment Advisory Services | 5,210 |
| Management and Administrative—Investor Shares | 5,902 |
| Management and Administrative—ETF Shares | 5,860 |
| Management and Administrative—Admiral Shares | 10,508 |
| Management and Administrative—Institutional Shares | 4,897 |
| Management and Administrative—Institutional Plus Shares | 3,226 |
| Marketing and Distribution—Investor Shares | 881 |
| Marketing and Distribution—ETF Shares | 987 |
| Marketing and Distribution—Admiral Shares | 2,924 |
| Marketing and Distribution—Institutional Shares | 343 |
| Marketing and Distribution—Institutional Plus Shares | 146 |
| Custodian Fees | 562 |
| Auditing Fees | 41 |
| Shareholders’ Reports—Investor Shares | 122 |
| Shareholders’ Reports—ETF Shares | 490 |
| Shareholders’ Reports—Admiral Shares | 299 |
| Shareholders’ Reports—Institutional Shares | 159 |
| Shareholders’ Reports—Institutional Plus Shares | 108 |
| Trustees’ Fees and Expenses | 52 |
| Total Expenses | 42,717 |
| Net Investment Income | 1,066,013 |
| Realized Net Gain (Loss) | |
| Investment Securities Sold1 | 1,555,025 |
| Futures Contracts | 26,482 |
| Realized Net Gain (Loss) | 1,581,507 |
| Change in Unrealized Appreciation (Depreciation) | |
| Investment Securities | 4,858,452 |
| Futures Contracts | (3,394) |
| Change in Unrealized Appreciation (Depreciation) | 4,855,058 |
| Net Increase (Decrease) in Net Assets Resulting from Operations | 7,502,578 |
| 1 Interest income and realized net gain (loss) from affiliated companies of the fund were $862,000 and $29,000, respectively. |
| See accompanying Notes, which are an integral part of the Financial Statements. |
45
Mid-Cap Index Fund
Statement of Changes in Net Assets
| | |
| | Year Ended December 31, |
| | 2016 | 2015 |
| | ($000) | ($000) |
| Increase (Decrease) in Net Assets | | |
| Operations | | |
| Net Investment Income | 1,066,013 | 953,963 |
| Realized Net Gain (Loss) | 1,581,507 | 2,973,439 |
| Change in Unrealized Appreciation (Depreciation) | 4,855,058 | (4,924,508) |
| Net Increase (Decrease) in Net Assets Resulting from Operations | 7,502,578 | (997,106) |
| Distributions | | |
| Net Investment Income | | |
| Investor Shares | (56,675) | (55,549) |
| ETF Shares | (229,269) | (185,676) |
| Admiral Shares | (419,571) | (357,030) |
| Institutional Shares | (205,760) | (177,330) |
| Institutional Plus Shares | (172,852) | (166,136) |
| Realized Capital Gain | | |
| Investor Shares | — | — |
| ETF Shares | — | — |
| Admiral Shares | — | — |
| Institutional Shares | — | — |
| Institutional Plus Shares | — | — |
| Total Distributions | (1,084,127) | (941,721) |
| Capital Share Transactions | | |
| Investor Shares | (369,214) | (363,862) |
| ETF Shares | 2,278,982 | 3,479,124 |
| Admiral Shares | 2,264,130 | 3,709,404 |
| Institutional Shares | 1,034,231 | 1,484,151 |
| Institutional Plus Shares | (860,619) | 426,054 |
| Net Increase (Decrease) from Capital Share Transactions | 4,347,510 | 8,734,871 |
| Total Increase (Decrease) | 10,765,961 | 6,796,044 |
| Net Assets | | |
| Beginning of Period | 65,723,818 | 58,927,774 |
| End of Period1 | 76,489,779 | 65,723,818 |
| 1 Net Assets—End of Period includes undistributed (overdistributed) net investment income of ($25,443,000) and ($7,594,000). |
See accompanying Notes, which are an integral part of the Financial Statements.
46
Mid-Cap Index Fund
Financial Highlights
| | | | | |
| Investor Shares | | | | | |
| |
| For a Share Outstanding | Year Ended December 31, |
| Throughout Each Period | 2016 | 2015 | 2014 | 2013 | 2012 |
| Net Asset Value, Beginning of Period | $32.79 | $33.72 | $30.02 | $22.47 | $19.65 |
| Investment Operations | | | | | |
| Net Investment Income | .472 | .444 | .387 | .299 | .286 |
| Net Realized and Unrealized Gain (Loss) | | | | | |
| on Investments | 3.138 | (.939) | 3.697 | 7.560 | 2.818 |
| Total from Investment Operations | 3.610 | (.495) | 4.084 | 7.859 | 3.104 |
| Distributions | | | | | |
| Dividends from Net Investment Income | (. 480) | (. 435) | (. 384) | (. 309) | (. 284) |
| Distributions from Realized Capital Gains | — | — | — | — | — |
| Total Distributions | (. 480) | (. 435) | (. 384) | (. 309) | (. 284) |
| Net Asset Value, End of Period | $35.92 | $32.79 | $33.72 | $30.02 | $22.47 |
| |
| Total Return1 | 11.07% | -1.46% | 13.60% | 35.00% | 15.80% |
| |
| Ratios/Supplemental Data | | | | | |
| Net Assets, End of Period (Millions) | $4,138 | $4,140 | $4,607 | $4,797 | $3,887 |
| Ratio of Total Expenses to Average Net Assets | 0.18% | 0.20% | 0.23% | 0.24% | 0.24% |
| Ratio of Net Investment Income to | | | | | |
| Average Net Assets | 1.42% | 1.35% | 1.30% | 1.16% | 1.36% |
| Portfolio Turnover Rate2 | 15% | 15% | 11% | 32% | 17% |
| 1 Total returns do not include account service fees that may have applied in the periods shown. Fund prospectuses provide information about |
| any applicable account service fees. |
| 2 Excludes the value of portfolio securities received or delivered as a result of in-kind purchases or redemptions of the fund’s capital shares, |
| including ETF Creation Units. |
See accompanying Notes, which are an integral part of the Financial Statements.
47
Mid-Cap Index Fund
Financial Highlights
| | | | | |
| ETF Shares | | | | | |
| |
| For a Share Outstanding | Year Ended December 31, |
| Throughout Each Period | 2016 | 2015 | 2014 | 2013 | 2012 |
| Net Asset Value, Beginning of Period | $120.07 | $123.50 | $109.96 | $82.33 | $71.99 |
| Investment Operations | | | | | |
| Net Investment Income | 1.877 | 1.793 | 1.609 | 1.255 | 1.173 |
| Net Realized and Unrealized Gain (Loss) | | | | | |
| on Investments | 11.510 | (3.457) | 13.524 | 27.668 | 10.329 |
| Total from Investment Operations | 13.387 | (1.664) | 15.133 | 28.923 | 11.502 |
| Distributions | | | | | |
| Dividends from Net Investment Income | (1.907) | (1.766) | (1.593) | (1.293) | (1.162) |
| Distributions from Realized Capital Gains | — | — | — | — | — |
| Total Distributions | (1.907) | (1.766) | (1.593) | (1.293) | (1.162) |
| Net Asset Value, End of Period | $131.55 | $120.07 | $123.50 | $109.96 | $82.33 |
| |
| Total Return | 11.23% | -1.34% | 13.76% | 35.15% | 15.98% |
| |
| Ratios/Supplemental Data | | | | | |
| Net Assets, End of Period (Millions) | $16,544 | $12,984 | $9,879 | $6,728 | $3,926 |
| Ratio of Total Expenses to Average Net Assets | 0.06% | 0.08% | 0.09% | 0.09% | 0.10% |
| Ratio of Net Investment Income to | | | | | |
| Average Net Assets | 1.54% | 1.47% | 1.44% | 1.31% | 1.50% |
| Portfolio Turnover Rate1 | 15% | 15% | 11% | 32% | 17% |
| 1 Excludes the value of portfolio securities received or delivered as a result of in-kind purchases or redemptions of the fund’s capital shares, |
| including ETF Creation Units. |
See accompanying Notes, which are an integral part of the Financial Statements.
48
Mid-Cap Index Fund
Financial Highlights
| | | | | |
| Admiral Shares | | | | | |
| |
| For a Share Outstanding | Year Ended December 31, |
| Throughout Each Period | 2016 | 2015 | 2014 | 2013 | 2012 |
| Net Asset Value, Beginning of Period | $148.72 | $152.97 | $136.19 | $101.97 | $89.15 |
| Investment Operations | | | | | |
| Net Investment Income | 2.325 | 2.214 | 1.987 | 1.550 | 1.450 |
| Net Realized and Unrealized Gain (Loss) | | | | | |
| on Investments | 14.257 | (4.284) | 16.759 | 34.269 | 12.808 |
| Total from Investment Operations | 16.582 | (2.070) | 18.746 | 35.819 | 14.258 |
| Distributions | | | | | |
| Dividends from Net Investment Income | (2.362) | (2.180) | (1.966) | (1.599) | (1.438) |
| Distributions from Realized Capital Gains | — | — | — | — | — |
| Total Distributions | (2.362) | (2.180) | (1.966) | (1.599) | (1.438) |
| Net Asset Value, End of Period | $162.94 | $148.72 | $152.97 | $136.19 | $101.97 |
| |
| Total Return1 | 11.22% | -1.34% | 13.76% | 35.15% | 15.99% |
| |
| Ratios/Supplemental Data | | | | | |
| Net Assets, End of Period (Millions) | $29,854 | $25,061 | $22,125 | $10,251 | $6,895 |
| Ratio of Total Expenses to Average Net Assets | 0.06% | 0.08% | 0.09% | 0.09% | 0.10% |
| Ratio of Net Investment Income to | | | | | |
| Average Net Assets | 1.54% | 1.47% | 1.44% | 1.31% | 1.50% |
| Portfolio Turnover Rate2 | 15% | 15% | 11% | 32% | 17% |
| 1 Total returns do not include account service fees that may have applied in the periods shown. Fund prospectuses provide information about |
| any applicable account service fees. |
| 2 Excludes the value of portfolio securities received or delivered as a result of in-kind purchases or redemptions of the fund’s capital shares, |
| including ETF Creation Units. |
See accompanying Notes, which are an integral part of the Financial Statements.
49
| | | | | |
| Mid-Cap Index Fund | | | | | |
| |
| |
| Financial Highlights | | | | | |
| |
| |
| Institutional Shares | | | | | |
| |
| For a Share Outstanding | Year Ended December 31, |
| Throughout Each Period | 2016 | 2015 | 2014 | 2013 | 2012 |
| Net Asset Value, Beginning of Period | $32.85 | $33.79 | $30.08 | $22.52 | $19.69 |
| Investment Operations | | | | | |
| Net Investment Income | . 516 | . 492 | . 442 | . 344 | . 325 |
| Net Realized and Unrealized Gain (Loss) | | | | | |
| on Investments | 3.148 | (.947) | 3.704 | 7.571 | 2.827 |
| Total from Investment Operations | 3.664 | (.455) | 4.146 | 7.915 | 3.152 |
| Distributions | | | | | |
| Dividends from Net Investment Income | (. 524) | (. 485) | (. 436) | (. 355) | (. 322) |
| Distributions from Realized Capital Gains | — | — | — | — | — |
| Total Distributions | (. 524) | (. 485) | (. 436) | (. 355) | (. 322) |
| Net Asset Value, End of Period | $35.99 | $32.85 | $33.79 | $30.08 | $22.52 |
| |
| Total Return | 11.23% | -1.33% | 13.78% | 35.17% | 16.01% |
| |
| Ratios/Supplemental Data | | | | | |
| Net Assets, End of Period (Millions) | $14,540 | $12,278 | $11,172 | $9,368 | $7,057 |
| Ratio of Total Expenses to Average Net Assets | 0.05% | 0.07% | 0.08% | 0.08% | 0.08% |
| Ratio of Net Investment Income to | | | | | |
| Average Net Assets | 1.55% | 1.48% | 1.45% | 1.32% | 1.52% |
| Portfolio Turnover Rate1 | 15% | 15% | 11% | 32% | 17% |
| 1 Excludes the value of portfolio securities received or delivered as a result of in-kind purchases or redemptions of the fund’s capital shares, |
| including ETF Creation Units. |
See accompanying Notes, which are an integral part of the Financial Statements.
50
Mid-Cap Index Fund
Financial Highlights
| | | | | |
| Institutional Plus Shares | | | | | |
| |
| For a Share Outstanding | Year Ended December 31, |
| Throughout Each Period | 2016 | 2015 | 2014 | 2013 | 2012 |
| Net Asset Value, Beginning of Period | $162.03 | $166.65 | $148.37 | $111.08 | $97.12 |
| Investment Operations | | | | | |
| Net Investment Income | 2.564 | 2.461 | 2.210 | 1.726 | 1.624 |
| Net Realized and Unrealized Gain (Loss) | | | | | |
| on Investments | 15.524 | (4.657) | 18.256 | 37.343 | 13.945 |
| Total from Investment Operations | 18.088 | (2.196) | 20.466 | 39.069 | 15.569 |
| Distributions | | | | | |
| Dividends from Net Investment Income | (2.608) | (2.424) | (2.186) | (1.779) | (1.609) |
| Distributions from Realized Capital Gains | — | — | — | — | — |
| Total Distributions | (2.608) | (2.424) | (2.186) | (1.779) | (1.609) |
| Net Asset Value, End of Period | $177.51 | $162.03 | $166.65 | $148.37 | $111.08 |
| |
| Total Return | 11.24% | -1.30% | 13.79% | 35.20% | 16.03% |
| |
| Ratios/Supplemental Data | | | | | |
| Net Assets, End of Period (Millions) | $11,415 | $11,260 | $11,144 | $8,468 | $5,428 |
| Ratio of Total Expenses to Average Net Assets | 0.04% | 0.05% | 0.06% | 0.06% | 0.06% |
| Ratio of Net Investment Income to | | | | | |
| Average Net Assets | 1.56% | 1.50% | 1.47% | 1.34% | 1.54% |
| Portfolio Turnover Rate1 | 15% | 15% | 11% | 32% | 17% |
| 1 Excludes the value of portfolio securities received or delivered as a result of in-kind purchases or redemptions of the fund’s capital shares, |
| including ETF Creation Units. |
See accompanying Notes, which are an integral part of the Financial Statements.
51
Mid-Cap Index Fund
Notes to Financial Statements
Vanguard Mid-Cap Index Fund is registered under the Investment Company Act of 1940 as an open-end investment company, or mutual fund. The fund offers five classes of shares: Investor Shares, ETF Shares, Admiral Shares, Institutional Shares, and Institutional Plus Shares. Investor Shares are available to any investor who meets the fund’s minimum purchase requirements. ETF Shares are listed for trading on NYSE Arca; they can be purchased and sold through a broker. Admiral Shares, Institutional Shares, and Institutional Plus Shares, are designed for investors who meet certain administrative, service, and account-size criteria.
A. The following significant accounting policies conform to generally accepted accounting principles for U.S. investment companies. The fund consistently follows such policies in preparing its financial statements.
1. Security Valuation: Securities are valued as of the close of trading on the New York Stock Exchange (generally 4 p.m., Eastern time) on the valuation date. Equity securities are valued at the latest quoted sales prices or official closing prices taken from the primary market in which each security trades; such securities not traded on the valuation date are valued at the mean of the latest quoted bid and asked prices. Securities for which market quotations are not readily available, or whose values have been materially affected by events occurring before the fund’s pricing time but after the close of the securities’ primary markets, are valued by methods deemed by the board of trustees to represent fair value. Investments in Vanguard Market Liquidity Fund are valued at that fund’s net asset value. Temporary cash investments are valued using the latest bid prices or using valuations based on a matrix system (which considers such factors as security prices, yields, maturities, and ratings), both as furnished by independent pricing services.
2. Futures Contracts: The fund uses index futures contracts to a limited extent, with the objectives of maintaining full exposure to the stock market, enhancing returns, maintaining liquidity, and minimizing transaction costs. The fund may purchase futures contracts to immediately invest incoming cash in the market, or sell futures in response to cash outflows, thereby simulating a fully invested position in the underlying index while maintaining a cash balance for liquidity. The fund may seek to enhance returns by using futures contracts instead of the underlying securities when futures are believed to be priced more attractively than the underlying securities. The primary risks associated with the use of futures contracts are imperfect correlation between changes in market values of stocks held by the fund and the prices of futures contracts, and the possibility of an illiquid market. Counterparty risk involving futures is mitigated because a regulated clearinghouse is the counterparty instead of the clearing broker. To further mitigate counterparty risk, the fund trades futures contracts on an exchange, monitors the financial strength of its clearing brokers and clearinghouse, and has entered into clearing agreements with its clearing brokers. The clearinghouse imposes initial margin requirements to secure the fund’s performance and requires daily settlement of variation margin representing changes in the market value of each contract.
Futures contracts are valued at their quoted daily settlement prices. The aggregate settlement values of the contracts are not recorded in the Statement of Net Assets. Fluctuations in the value of the contracts are recorded in the Statement of Net Assets as an asset (liability) and in the Statement of Operations as unrealized appreciation (depreciation) until the contracts are closed, when they are recorded as realized futures gains (losses).
During the year ended December 31, 2016, the fund’s average investments in long and short futures contracts represented less than 1% and 0% of net assets, respectively, based on the average of aggregate settlement values at each quarter-end during the period.
52
Mid-Cap Index Fund
3. Federal Income Taxes: The fund intends to continue to qualify as a regulated investment company and distribute all of its taxable income. Management has analyzed the fund’s tax positions taken for all open federal income tax years (December 31, 2013–2016), and has concluded that no provision for federal income tax is required in the fund’s financial statements.
4. Distributions: Distributions to shareholders are recorded on the ex-dividend date.
5. Securities Lending: To earn additional income, the fund lends its securities to qualified institutional borrowers. Security loans are subject to termination by the fund at any time, and are required to be secured at all times by collateral in an amount at least equal to the market value of securities loaned. Daily market fluctuations could cause the value of loaned securities to be more or less than the value of the collateral received. When this occurs, the collateral is adjusted and settled on the next business day. The fund further mitigates its counterparty risk by entering into securities lending transactions only with a diverse group of prequalified counterparties, monitoring their financial strength, and entering into master securities lending agreements with its counterparties. The master securities lending agreements provide that, in the event of a counterparty’s default (including bankruptcy), the fund may terminate any loans with that borrower, determine the net amount owed, and sell or retain the collateral up to the net amount owed to the fund; however, such actions may be subject to legal proceedings. While collateral mitigates counterparty risk, in the absence of a default the fund may experience delays and costs in recovering the securities loaned. The fund invests cash collateral received in Vanguard Market Liquidity Fund, and records a liability in the Statement of Net Assets for the return of the collateral, during the period the securities are on loan. Securities lending income represents fees charged to borrowers plus income earned on invested cash collateral, less expenses associated with the loan. During the term of the loan, the fund is entitled to all distributions made on or in respect of the loaned securities.
6. Credit Facility: The fund and certain other funds managed by The Vanguard Group (“Vanguard”) participate in a $3.1 billion committed credit facility provided by a syndicate of lenders pursuant to a credit agreement that may be renewed annually; each fund is individually liable for its borrowings, if any, under the credit facility. Borrowings may be utilized for temporary and emergency purposes, and are subject to the fund’s regulatory and contractual borrowing restrictions. The participating funds are charged administrative fees and an annual commitment fee of 0.10% of the undrawn amount of the facility; these fees are allocated to the funds based on a method approved by the fund’s board of trustees and included in Management and Administrative expenses on the fund’s Statement of Operations. Any borrowings under this facility bear interest at a rate based upon the higher of the one-month London Interbank Offered Rate, federal funds effective rate, or overnight bank funding rate plus an agreed-upon spread.
The fund had no borrowings outstanding at December 31, 2016, or at any time during the period then ended.
7. Other: Dividend income is recorded on the ex-dividend date. Interest income includes income distributions received from Vanguard Market Liquidity Fund and is accrued daily. Premiums and discounts on debt securities purchased are amortized and accreted, respectively, to interest income over the lives of the respective securities. Security transactions are accounted for on the date securities are bought or sold. Costs used to determine realized gains (losses) on the sale of investment securities are those of the specific securities sold.
53
Mid-Cap Index Fund
Each class of shares has equal rights as to assets and earnings, except that each class separately bears certain class-specific expenses related to maintenance of shareholder accounts (included in Management and Administrative expenses) and shareholder reporting. Marketing and distribution expenses are allocated to each class of shares based on a method approved by the board of trustees. Income, other non-class-specific expenses, and gains and losses on investments are allocated to each class of shares based on its relative net assets.
B. In accordance with the terms of a Funds’ Service Agreement (the “FSA”) between Vanguard and the fund, Vanguard furnishes to the fund investment advisory, corporate management, administrative, marketing, and distribution services at Vanguard’s cost of operations (as defined by the FSA). These costs of operations are allocated to the fund based on methods and guidelines approved by the board of trustees. Vanguard does not require reimbursement in the current period for certain costs of operations (such as deferred compensation/benefits and risk/insurance costs); the fund’s liability for these costs of operations is included in Payables to Vanguard on the Statement of Net Assets.
Upon the request of Vanguard, the fund may invest up to 0.40% of its net assets as capital in Vanguard. At December 31, 2016, the fund had contributed to Vanguard capital in the amount of $5,697,000, representing 0.01% of the fund’s net assets and 2.28% of Vanguard’s capitalization. The fund’s trustees and officers are also directors and employees, respectively, of Vanguard.
C. Various inputs may be used to determine the value of the fund’s investments. These inputs are summarized in three broad levels for financial statement purposes. The inputs or methodologies used to value securities are not necessarily an indication of the risk associated with investing in those securities.
Level 1—Quoted prices in active markets for identical securities.
Level 2—Other significant observable inputs (including quoted prices for similar securities, interest rates, prepayment speeds, credit risk, etc.).
Level 3—Significant unobservable inputs (including the fund’s own assumptions used to determine the fair value of investments).
The following table summarizes the market value of the fund’s investments as of December 31, 2016, based on the inputs used to value them:
| | | |
| | Level 1 | Level 2 | Level 3 |
| Investments | ($000) | ($000) | ($000) |
| Common Stocks | 76,374,442 | — | — |
| Temporary Cash Investments | 371,648 | 12,287 | — |
| Futures Contracts—Liabilities1 | (2,380) | — | — |
| Total | 76,743,710 | 12,287 | — |
| 1 Represents variation margin on the last day of the reporting period. |
54
Mid-Cap Index Fund
D. At December 31, 2016, the aggregate settlement value of open futures contracts and the related unrealized appreciation (depreciation) were:
| | | | |
| | | | ($000) |
| | | | Aggregate | |
| | | Number of | Settlement | Unrealized |
| | | Long (Short) | Value | Appreciation |
| Futures Contracts | Expiration | Contracts | Long (Short) | (Depreciation) |
| E-mini S&P Mid-Cap 400 Index | March 2017 | 510 | 84,614 | (1,625) |
| E-mini S&P 500 Index | March 2017 | 515 | 57,582 | (222) |
| | | | | (1,847) |
Unrealized appreciation (depreciation) on open futures contracts is required to be treated as realized gain (loss) for tax purposes.
E. Distributions are determined on a tax basis and may differ from net investment income and realized capital gains for financial reporting purposes. Differences may be permanent or temporary. Permanent differences are reclassified among capital accounts in the financial statements to reflect their tax character. Temporary differences arise when certain items of income, expense, gain, or loss are recognized in different periods for financial statement and tax purposes. These differences will reverse at some time in the future. Differences in classification may also result from the treatment of short-term gains as ordinary income for tax purposes.
During the year ended December 31, 2016, the fund realized $2,668,928,000 of net capital gains resulting from in-kind redemptions—in which shareholders exchanged fund shares for securities held by the fund rather than for cash. Because such gains are not taxable to the fund, and are not distributed to shareholders, they have been reclassified from accumulated net realized losses to paid-in capital.
For tax purposes, at December 31, 2016, the fund had $9,437,000 of ordinary income available for distribution. At December 31, 2016, the fund had available capital losses totaling $3,040,152,000 to offset future net capital gains. Of this amount, $294,968,000 is subject to expiration on December 31, 2018; Capital losses of $2,745,184,000 realized beginning in fiscal 2011 may be carried forward indefinitely under the Regulated Investment Company Modernization Act of 2010, but must be used before any expiring loss carryforwards.
At December 31, 2016, the cost of investment securities for tax purposes was $60,562,369,000. Net unrealized appreciation of investment securities for tax purposes was $16,196,008,000, consisting of unrealized gains of $18,039,752,000 on securities that had risen in value since their purchase and $1,843,744,000 in unrealized losses on securities that had fallen in value since their purchase.
F. During the year ended December 31, 2016, the fund purchased $20,625,448,000 of investment securities and sold $16,176,663,000 of investment securities, other than temporary cash investments. Purchases and sales include $7,576,319,000 and $5,733,361,000, respectively, in connection with in-kind purchases and redemptions of the fund’s capital shares.
The fund purchased securities from and sold securities to other Vanguard funds or accounts managed by Vanguard or its affiliates, in accordance with procedures adopted by the board of trustees in compliance with Rule 17a-7 of the Investment Company Act of 1940. For the year ended December 31, 2016, such purchases and sales were $755,146,000 and $1,955,471,000, respectively; these amounts are included in the purchases and sales of investment securities noted above.
55
Mid-Cap Index Fund
G. Capital share transactions for each class of shares were:
| | | | |
| | Year Ended December 31, |
| | 2016 | 2015 |
| | Amount | Shares | Amount | Shares |
| | ($000) | (000) | ($000) | (000) |
| Investor Shares | | | | |
| Issued | 616,167 | 18,330 | 860,039 | 25,140 |
| Issued in Lieu of Cash Distributions | 54,065 | 1,566 | 52,328 | 1,606 |
| Redeemed | (1,039,446) | (30,976) | (1,276,229) | (37,116) |
| Net Increase (Decrease)—Investor Shares | (369,214) | (11,080) | (363,862) | (10,370) |
| ETF Shares | | | | |
| Issued | 7,988,239 | 63,350 | 12,613,214 | 100,772 |
| Issued in Lieu of Cash Distributions | — | — | — | — |
| Redeemed | (5,709,257) | (45,725) | (9,134,090) | (72,625) |
| Net Increase (Decrease)—ETF Shares | 2,278,982 | 17,625 | 3,479,124 | 28,147 |
| Admiral Shares | | | | |
| Issued | 6,296,858 | 41,232 | 7,061,299 | 45,458 |
| Issued in Lieu of Cash Distributions | 374,691 | 2,389 | 319,756 | 2,164 |
| Redeemed | (4,407,419) | (28,904) | (3,671,651) | (23,756) |
| Net Increase (Decrease)—Admiral Shares | 2,264,130 | 14,717 | 3,709,404 | 23,866 |
| Institutional Shares | | | | |
| Issued | 3,101,714 | 91,389 | 3,536,524 | 102,942 |
| Issued in Lieu of Cash Distributions | 191,284 | 5,520 | 165,251 | 5,063 |
| Redeemed | (2,258,767) | (66,693) | (2,217,624) | (64,898) |
| Net Increase (Decrease)—Institutional Shares | 1,034,231 | 30,216 | 1,484,151 | 43,107 |
| Institutional Plus Shares | | | | |
| Issued | 804,938 | 4,863 | 1,723,360 | 10,254 |
| Issued in Lieu of Cash Distributions | 164,477 | 965 | 158,363 | 984 |
| Redeemed | (1,830,034) | (11,020) | (1,455,669) | (8,616) |
| Net Increase (Decrease)—Institutional Plus Shares | (860,619) | (5,192) | 426,054 | 2,622 |
H. Management has determined that no material events or transactions occurred subsequent to December 31, 2016, that would require recognition or disclosure in these financial statements.
56
Mid-Cap Growth Index Fund
Fund Profile
As of December 31, 2016
| | | |
| Share-Class Characteristics | | |
| |
| | Investor | ETF | Admiral |
| | Shares | Shares | Shares |
| Ticker Symbol | VMGIX | VOT | VMGMX |
| Expense Ratio1 | 0.20% | 0.08% | 0.08% |
| 30-Day SEC Yield | 0.69% | 0.80% | 0.80% |
| | | |
| Portfolio Characteristics | | |
| | | CRSP US | DJ |
| | | Mid Cap | U.S. Total |
| | | Growth | Market |
| | Fund | Index | FA Index |
| Number of Stocks | 156 | 151 | 3,833 |
| Median Market Cap | $12.5B | $12.5B | $54.1B |
| Price/Earnings Ratio | 31.8x | 31.8x | 24.4x |
| Price/Book Ratio | 4.3x | 4.3x | 2.8x |
| Return on Equity | 17.8% | 17.6% | 16.5% |
| Earnings Growth Rate | 15.0% | 15.0% | 8.2% |
| Dividend Yield | 0.9% | 0.9% | 2.0% |
| Foreign Holdings | 0.0% | 0.0% | 0.0% |
| Turnover Rate | 21% | — | — |
| Short-Term Reserves | 0.0% | — | — |
| | | |
| Sector Diversification (% of equity exposure) |
| | | CRSP US | DJ |
| | | Mid Cap | U.S. Total |
| | | Growth | Market |
| | Fund | Index | FA Index |
| Basic Materials | 0.4% | 0.4% | 2.6% |
| Consumer Goods | 10.4 | 10.4 | 9.6 |
| Consumer Services | 12.4 | 12.4 | 13.1 |
| Financials | 16.2 | 16.2 | 20.8 |
| Health Care | 12.1 | 12.1 | 12.2 |
| Industrials | 24.7 | 24.7 | 12.9 |
| Oil & Gas | 5.1 | 5.1 | 6.9 |
| Technology | 16.4 | 16.4 | 16.4 |
| Telecommunications | 2.3 | 2.3 | 2.4 |
| Utilities | 0.0 | 0.0 | 3.1 |
| | |
| Volatility Measures | | |
| | | DJ |
| | CRSP US | U.S. Total |
| | Mid Cap | Market |
| | Growth Index | FA Index |
| R-Squared | 1.00 | 0.89 |
| Beta | 1.00 | 1.07 |
| These measures show the degree and timing of the fund’s |
| fluctuations compared with the indexes over 36 months. |
| | |
| Ten Largest Holdings (% of total net assets) |
| Equinix Inc. | Specialty REITs | 1.7% |
| Fiserv Inc. | Financial | |
| | Administration | 1.6 |
| Electronic Arts Inc. | Toys | 1.5 |
Amphenol Corp. | Electrical Components & |
| | Equipment | 1.4 |
| Edwards Lifesciences | | |
| Corp. | Medical Supplies | 1.4 |
| Concho Resources Inc. | Exploration & | |
| | Production | 1.3 |
| Roper Technologies Inc. | Electronic Equipment | 1.3 |
| Dollar Tree Inc. | Specialty Retailers | 1.2 |
| Lam Research Corp. | Semiconductors | 1.2 |
| Vulcan Materials Co. | Building Materials & | |
| | Fixtures | 1.1 |
| Top Ten | | 13.7% |
| The holdings listed exclude any temporary cash investments and |
| equity index products. |
Investment Focus

1 The expense ratios shown are from the prospectus dated April 27, 2016, and represent estimated costs for the current fiscal year. For the fiscal
year ended December 31, 2016, the expense ratios were 0.19% for Investor Shares, 0.07% for ETF Shares, and 0.07% for Admiral Shares.
57
Mid-Cap Growth Index Fund
Performance Summary
All of the returns in this report represent past performance, which is not a guarantee of future results that may be achieved by the fund. (Current performance may be lower or higher than the performance data cited. For performance data current to the most recent month-end, visit our website at vanguard.com/performance.) Note, too, that both investment returns and principal value can fluctuate widely, so an investor’s shares, when sold, could be worth more or less than their original cost. The returns shown do not reflect taxes that a shareholder would pay on fund distributions or on the sale of fund shares.
Cumulative Performance: December 31, 2006, Through December 31, 2016
Initial Investment of $10,000
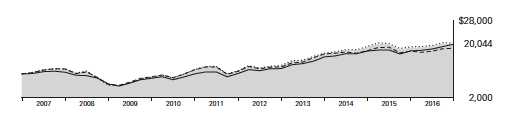
| | | | | |
| | | Average Annual Total Returns | |
| | | Periods Ended December 31, 2016 | |
| | | | | | Final Value |
| | | One | Five | Ten | of a $10,000 |
| | | Year | Years | Years | Investment |
| | Mid-Cap Growth Index Fund*Investor | | | | |
| | Shares | 6.62% | 12.81% | 7.20% | $20,044 |
| • • • • • • •• | Spliced Mid-Cap Growth Index | 6.78 | 12.98 | 7.38 | 20,381 |
| – – – – | Mid-Cap Growth Funds Average | 5.68 | 11.37 | 6.42 | 18,629 |
| | Dow Jones U.S. Total Stock Market | | | | |
| | Float Adjusted Index | 12.62 | 14.59 | 7.18 | 20,003 |
| For a benchmark description, see the Glossary. |
| Mid-Cap Growth Funds Average: Derived from data provided by Lipper, a Thomson Reuters Company. |
| | | | |
| | | | | Final Value |
| | One | Five | Ten | of a $10,000 |
| | Year | Years | Years | Investment |
| Mid-Cap Growth Index Fund | | | | |
| ETF Shares Net Asset Value | 6.75% | 12.96% | 7.35% | $20,320 |
| Spliced Mid-Cap Growth Index | 6.78 | 12.98 | 7.38 | 20,381 |
| Dow Jones U.S. Total Stock Market Float | | | | |
| Adjusted Index | 12.62 | 14.59 | 7.18 | 20,003 |
See Financial Highlights for dividend and capital gains information.
58
Mid-Cap Growth Index Fund
| | | | |
| | Average Annual Total Returns | |
| | Periods Ended December 31, 2016 | |
| | | | Since | Final Value |
| | One | Five | Inception | of a $10,000 |
| | Year | Years | (9/27/2011) | Investment |
| Mid-Cap Growth Index Fund Admiral Shares | 6.75% | 12.96% | 12.92% | $18,953 |
| Spliced Mid-Cap Growth Index | 6.78 | 12.98 | 12.96 | 18,981 |
| Dow Jones U.S. Total Stock Market Float | | | | |
| Adjusted Index | 12.62 | 14.59 | 15.42 | 21,267 |
| "Since Inception" performance is calculated from the Admiral Shares’ inception date for both the fund and its comparative standards. |
| | | |
| Cumulative Returns of ETF Shares: December 31, 2006, Through December 31, 2016 | |
| | One | Five | Ten |
| | Year | Years | Years |
| Mid-Cap Growth Index Fund ETF Shares Market | | | |
| Price | 6.79% | 84.02% | 103.12% |
| Mid-Cap Growth Index Fund ETF Shares Net Asset | | | |
| Value | 6.75 | 83.89 | 103.20 |
| Spliced Mid-Cap Growth Index | 6.78 | 84.10 | 103.81 |
Fiscal-Year Total Returns (%): December 31, 2006, Through December 31, 2016
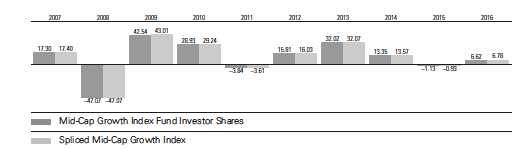
For a benchmark description, see the Glossary.
59
Mid-Cap Growth Index Fund
Financial Statements
Statement of Net Assets
As of December 31, 2016
The fund reports a complete list of its holdings in regulatory filings four times in each fiscal year, at the quarter-ends. For the second and fourth fiscal quarters, the lists appear in the fund’s semiannual and annual reports to shareholders. For the first and third fiscal quarters, the fund files the lists with the Securities and Exchange Commission on Form N-Q. Shareholders can look up the fund’s Forms N-Q on the SEC’s website at sec.gov. Forms N-Q may also be reviewed and copied at the SEC’s Public Reference Room (see the back cover of this report for further information).
| | | |
| | | | Market |
| | | | Value• |
| | | Shares | ($000) |
| Common Stocks (99.8%)1 | | |
| Basic Materials (0.4%) | | |
| * | Axalta Coating Systems | | |
| | Ltd. | 1,161,308 | 31,588 |
| |
| Consumer Goods (10.3%) | | |
| * | Electronic Arts Inc. | 1,539,872 | 121,280 |
| * | Mohawk Industries Inc. | 338,331 | 67,558 |
| | Church & Dwight Co. Inc. | 1,387,958 | 61,334 |
| | McCormick & Co. Inc. | 615,290 | 57,425 |
| | Snap-on Inc. | 311,888 | 53,417 |
| * | WhiteWave Foods Co. | | |
| | Class A | 952,739 | 52,972 |
| | Hormel Foods Corp. | 1,419,669 | 49,419 |
| * | LKQ Corp. | 1,567,484 | 48,043 |
| | Hanesbrands Inc. | 2,028,679 | 43,759 |
| | Harman International | | |
| | Industries Inc. | 374,537 | 41,634 |
| * | Michael Kors Holdings | | |
| | Ltd. | 838,577 | 36,042 |
| * | Lululemon Athletica Inc. | 511,923 | 33,270 |
| * | NVR Inc. | 19,331 | 32,263 |
| * | WABCO Holdings Inc. | 280,903 | 29,818 |
| *,^ | Under Armour Inc. Class A | 986,281 | 28,651 |
| ^ | Polaris Industries Inc. | 327,077 | 26,948 |
| * | Under Armour Inc. | 1,004,646 | 25,287 |
| | Lamb Weston Holdings | | |
| | Inc. | 391,753 | 14,828 |
| | | | 823,948 |
| Consumer Services (12.4%) | | |
| * | Dollar Tree Inc. | 1,203,446 | 92,882 |
| * | Ulta Salon Cosmetics & | | |
| | Fragrance Inc. | 318,031 | 81,079 |
| * | MGM Resorts | | |
| | International | 2,616,397 | 75,431 |
| | Expedia Inc. | 663,110 | 75,117 |
| | Ross Stores Inc. | 1,065,040 | 69,867 |
| * | CarMax Inc. | 1,021,485 | 65,773 |
| | Advance Auto Parts Inc. | 375,562 | 63,515 |
| | | |
| | Alaska Air Group Inc. | 662,099 | 58,748 |
| * | Chipotle Mexican Grill Inc. | | |
| | Class A | 155,458 | 58,657 |
| | Tractor Supply Co. | 705,540 | 53,487 |
| | Wyndham Worldwide Corp. 578,567 | 44,185 |
| | Signet Jewelers Ltd. | 406,278 | 38,296 |
| * | Norwegian Cruise Line | | |
| | Holdings Ltd. | 855,125 | 36,368 |
| | FactSet Research Systems | | |
| | Inc. | 214,275 | 35,019 |
| | Scripps Networks | | |
| | Interactive Inc. Class A | 434,546 | 31,014 |
| * | TripAdvisor Inc. | 606,588 | 28,128 |
| | Tiffany & Co. | 335,556 | 25,982 |
| * | Discovery Communications | | |
| | Inc. | 597,873 | 16,011 |
| * | Discovery Communications | | |
| | Inc. Class A | 408,618 | 11,200 |
| | Williams-Sonoma Inc. | 214,520 | 10,381 |
| * | AutoNation Inc. | 190,619 | 9,274 |
| * | Hyatt Hotels Corp. Class A | 145,859 | 8,060 |
| | Marriott International Inc. | | |
| | Class A | 257 | 21 |
| * | Liberty Interactive Corp. | | |
| | QVC Group Class A | 373 | 7 |
| | | | 988,502 |
| Financials (16.2%) | | |
| | Equinix Inc. | 383,372 | 137,021 |
| | Digital Realty Trust Inc. | 853,177 | 83,833 |
| | Moody’s Corp. | 872,256 | 82,228 |
| | Essex Property Trust Inc. | 351,671 | 81,764 |
| | Realty Income Corp. | 1,388,194 | 79,793 |
| | Equifax Inc. | 643,124 | 76,037 |
| * | IHS Markit Ltd. | 1,926,571 | 68,220 |
| | AvalonBay Communities | | |
| | Inc. | 368,568 | 65,292 |
| | Mid-America Apartment | | |
| | Communities Inc. | 609,802 | 59,712 |
| | Federal Realty Investment | | |
| | Trust | 385,167 | 54,736 |
60
Mid-Cap Growth Index Fund
| | | |
| | | | Market |
| | | | Value• |
| | | Shares | ($000) |
| * | E*TRADE Financial Corp. | 1,469,017 | 50,901 |
| | Extra Space Storage Inc. | 641,455 | 49,546 |
| * | CBRE Group Inc. Class A | 1,538,251 | 48,440 |
| | Alexandria Real Estate | | |
| | Equities Inc. | 426,827 | 47,433 |
| | VEREIT Inc. | 5,229,485 | 44,241 |
| * | Affiliated Managers | | |
| | Group Inc. | 294,234 | 42,752 |
| | Brixmor Property Group | | |
| | Inc. | 1,635,455 | 39,938 |
| | MSCI Inc. Class A | 505,880 | 39,853 |
| | SEI Investments Co. | 774,160 | 38,213 |
| | First Republic Bank | 412,903 | 38,045 |
| * | Liberty Broadband Corp. | 390,218 | 28,903 |
| | Arthur J Gallagher & Co. | 478,176 | 24,846 |
| * | Liberty Broadband Corp. | | |
| | Class A | 66,339 | 4,807 |
| | Realogy Holdings Corp. | 129 | 3 |
| | | | 1,286,557 |
| Health Care (12.1%) | | |
| * | Edwards Lifesciences | | |
| | Corp. | 1,148,650 | 107,628 |
| | CR Bard Inc. | 394,622 | 88,656 |
| * | Incyte Corp. | 859,480 | 86,180 |
| * | BioMarin Pharmaceutical | | |
| | Inc. | 923,259 | 76,483 |
| | Dentsply Sirona Inc. | 1,239,557 | 71,559 |
| * | Quintiles IMS Holdings | | |
| | Inc. | 792,807 | 60,293 |
| * | IDEXX Laboratories Inc. | 481,629 | 56,481 |
| * | Waters Corp. | 411,459 | 55,296 |
| * | DaVita Inc. | 848,769 | 54,491 |
| * | Centene Corp. | 871,095 | 49,225 |
| | ResMed Inc. | 756,647 | 46,950 |
| | Cooper Cos. Inc. | 261,600 | 45,762 |
| * | Alkermes plc | 815,665 | 45,335 |
| * | Varian Medical Systems | | |
| | Inc. | 501,335 | 45,010 |
| * | Jazz Pharmaceuticals plc | 305,324 | 33,289 |
| * | Envision Healthcare Corp. | 315,970 | 19,998 |
| * | Seattle Genetics Inc. | 246,785 | 13,023 |
| * | Alnylam Pharmaceuticals | | |
| | Inc. | 197,149 | 7,381 |
| | | | 963,040 |
| Industrials (24.6%) | | |
| * | Fiserv Inc. | 1,165,997 | 123,922 |
| | Amphenol Corp. Class A | 1,657,110 | 111,358 |
| | Roper Technologies Inc. | 544,468 | 99,681 |
| | Vulcan Materials Co. | 710,175 | 88,878 |
| | Martin Marietta Materials | | |
| | Inc. | 340,706 | 75,477 |
| | Waste Connections Inc. | 940,336 | 73,901 |
| | Fastenal Co. | 1,551,730 | 72,900 |
| * | FleetCor Technologies Inc. | 498,527 | 70,552 |
| | | |
| | TransDigm Group Inc. | 272,215 | 67,771 |
| | Alliance Data Systems | | |
| | Corp. | 294,733 | 67,346 |
| * | Verisk Analytics Inc. | | |
| | Class A | 808,824 | 65,652 |
| | WW Grainger Inc. | 271,751 | 63,114 |
| | AMETEK Inc. | 1,242,139 | 60,368 |
| * | Mettler-Toledo | | |
| | International Inc. | 140,893 | 58,972 |
| | Global Payments Inc. | 825,510 | 57,299 |
| | Masco Corp. | 1,764,287 | 55,787 |
| | CH Robinson Worldwide | | |
| | Inc. | 760,545 | 55,718 |
| | Acuity Brands Inc. | 236,777 | 54,662 |
| | Cintas Corp. | 450,564 | 52,067 |
| | Expeditors International of | | |
| | Washington Inc. | 969,554 | 51,348 |
| * | Vantiv Inc. Class A | 849,940 | 50,673 |
| | Kansas City Southern | 577,227 | 48,978 |
| | JB Hunt Transport | | |
| | Services Inc. | 481,755 | 46,764 |
| | Fortune Brands Home & | | |
| | Security Inc. | 828,281 | 44,280 |
| | Total System Services | | |
| | Inc. | 888,014 | 43,539 |
| * | Trimble Inc. | 1,346,509 | 40,597 |
| | Wabtec Corp. | 454,924 | 37,768 |
| * | Sensata Technologies | | |
| | Holding NV | 918,685 | 35,783 |
| * | Stericycle Inc. | 456,289 | 35,153 |
| | Macquarie Infrastructure | | |
| | Corp. | 417,139 | 34,080 |
| | B/E Aerospace Inc. | 545,115 | 32,810 |
| | Robert Half International | | |
| | Inc. | 656,882 | 32,043 |
| * | First Data Corp. Class A | 1,917,855 | 27,214 |
| * | United Rentals Inc. | 226,474 | 23,911 |
| | Pentair plc | 143 | 8 |
| | | | 1,960,374 |
| Oil & Gas (5.1%) | | |
| * | Concho Resources Inc. | 783,922 | 103,948 |
| | EQT Corp. | 927,170 | 60,637 |
| | Cabot Oil & Gas Corp. | 2,498,139 | 58,357 |
| | Range Resources Corp. | 1,326,476 | 45,578 |
| * | Cheniere Energy Inc. | 1,072,101 | 44,417 |
| | Cimarex Energy Co. | 254,682 | 34,611 |
| | Core Laboratories NV | 236,946 | 28,443 |
| * | Antero Resources Corp. | 1,179,744 | 27,901 |
| | | | 403,892 |
| Technology (16.4%) | | |
| | Lam Research Corp. | 873,958 | 92,404 |
| * | Autodesk Inc. | 1,131,447 | 83,738 |
| | Linear Technology Corp. | 1,290,384 | 80,455 |
| * | Cerner Corp. | 1,640,183 | 77,695 |
61
Mid-Cap Growth Index Fund
| | | |
| | | | Market |
| | | | Value• |
| | | Shares | ($000) |
| | Skyworks Solutions Inc. | 997,561 | 74,478 |
| | Microchip Technology Inc. 1,159,788 | | 74,400 |
| * | Citrix Systems Inc. | 795,852 | 71,077 |
| * | Red Hat Inc. | 964,659 | 67,237 |
| * | ServiceNow Inc. | 846,370 | 62,919 |
| * | Akamai Technologies Inc. | 884,178 | 58,957 |
| * | Palo Alto Networks Inc. | 468,000 | 58,523 |
| * | F5 Networks Inc. | 350,613 | 50,741 |
| * | Twitter Inc. | 3,072,198 | 50,077 |
| | CDK Global Inc. | 802,156 | 47,881 |
| * | Workday Inc. Class A | 655,085 | 43,295 |
| * | ANSYS Inc. | 464,570 | 42,968 |
| * | Gartner Inc. | 421,349 | 42,586 |
| | Xilinx Inc. | 678,316 | 40,950 |
| * | Splunk Inc. | 723,278 | 36,996 |
| *,^ | VeriSign Inc. | 477,955 | 36,358 |
| * | Qorvo Inc. | 686,798 | 36,215 |
| | KLA-Tencor Corp. | 419,283 | 32,989 |
| * | Micron Technology Inc. | 1,397,127 | 30,625 |
| * | Premier Inc. Class A | 270,359 | 8,208 |
| | NVIDIA Corp. | 447 | 48 |
| | | | 1,301,820 |
| Telecommunications (2.3%) | | |
| * | Level 3 Communications | | |
| | Inc. | 1,545,488 | 87,104 |
| * | SBA Communications | | |
| | Corp. Class A | 666,472 | 68,820 |
| * | Zayo Group Holdings Inc. | 783,855 | 25,757 |
| | | | 181,681 |
| Total Common Stocks | | |
| (Cost $7,067,543) | | 7,941,402 |
| Temporary Cash Investments (0.5%)1 | |
| Money Market Fund (0.5%) | | |
| 2,3 | Vanguard Market Liquidity | | |
| | Fund, 0.823% | 382,893 | 38,293 |
| | | | |
| | | Face | | Market |
| | | Amount | | Value• |
| | | ($000) | | ($000) |
| U.S. Government and Agency Obligations (0.0%) |
| 4 | United States Treasury Bill, | | | |
| | 0.478%, 2/9/17 | 100 | | 100 |
| 4 | United States Treasury Bill, | | | |
| | 0.557%, 4/27/17 | 400 | | 399 |
| 4 | United States Treasury Bill, | | | |
| | 0.564%, 5/4/17 | 700 | | 699 |
| | | | | 1,198 |
| Total Temporary Cash Investments | | |
| (Cost $39,490) | | | 39,491 |
| Total Investments (100.3%) | | | |
| (Cost $7,107,033) | | 7,980,893 |
| |
| | | | | Amount |
| | | | | ($000) |
| Other Assets and Liabilities (-0.3%) | | |
| Other Assets | | | |
| Investment in Vanguard | | | 589 |
| Receivables for Investment Securities Sold | 149 |
| Receivables for Accrued Income | | | 5,182 |
| Receivables for Capital Shares Issued | | 9,337 |
| Total Other Assets | | | 15,257 |
| Liabilities | | | |
| Payables for Investment Securities | | |
| | Purchased | | | (5,378) |
| Collateral for Securities on Loan | | | (19,174) |
| Payables for Capital Shares Redeemed | | (8,796) |
| Payables to Vanguard | | | (3,292) |
| Other Liabilities | | | (88) |
| Total Liabilities | | | (36,728) |
| Net Assets (100%) | | 7,959,422 |
62
Mid-Cap Growth Index Fund
| |
| At December 31, 2016, net assets consisted of: |
| | Amount |
| | ($000) |
| Paid-in Capital | 7,571,662 |
| Overdistributed Net Investment Income | (2,206) |
| Accumulated Net Realized Losses | (483,641) |
| Unrealized Appreciation (Depreciation) | |
| Investment Securities | 873,860 |
| Futures Contracts | (253) |
| Net Assets | 7,959,422 |
| |
| |
| Investor Shares—Net Assets | |
| Applicable to 11,084,513 outstanding | |
| $.001 par value shares of beneficial | |
| interest (unlimited authorization) | 460,279 |
| Net Asset Value Per Share— | |
| Investor Shares | $41.52 |
| |
| | Amount |
| | ($000) |
| ETF Shares—Net Assets | |
| Applicable to 33,863,013 outstanding | |
| $.001 par value shares of beneficial | |
| interest (unlimited authorization) | 3,575,811 |
| Net Asset Value Per Share— | |
| ETF Shares | $105.60 |
| |
| |
| Admiral Shares—Net Assets | |
| Applicable to 86,309,911 outstanding | |
| $.001 par value shares of beneficial | |
| interest (unlimited authorization) | 3,923,332 |
| Net Asset Value Per Share— | |
| Admiral Shares | $45.46 |
• See Note A in Notes to Financial Statements.
* Non-income-producing security.
^ Includes partial security positions on loan to broker-dealers. The total value of securities on loan is $18,756,000.
1 The fund invests a portion of its cash reserves in equity markets through the use of index futures contracts. After giving effect to futures
investments, the fund’s effective common stock and temporary cash investment positions represent 100.1% and 0.2%, respectively, of net
assets.
2 Affiliated money market fund available only to Vanguard funds and certain trusts and accounts managed by Vanguard. Rate shown is the
7-day yield.
3 Includes $19,174,000 of collateral received for securities on loan.
4 Securities with a value of $1,123,000 have been segregated as initial margin for open futures contracts.
See accompanying Notes, which are an integral part of the Financial Statements.
63
| |
| Mid-Cap Growth Index Fund | |
| |
| |
| Statement of Operations | |
| |
| | Year Ended |
| | December 31, 2016 |
| | ($000) |
| Investment Income | |
| Income | |
| Dividends | 67,032 |
| Interest1 | 126 |
| Securities Lending—Net | 1,095 |
| Total Income | 68,253 |
| Expenses | |
| The Vanguard Group—Note B | |
| Investment Advisory Services | 1,084 |
| Management and Administrative—Investor Shares | 680 |
| Management and Administrative—ETF Shares | 1,365 |
| Management and Administrative—Admiral Shares | 1,475 |
| Marketing and Distribution—Investor Shares | 130 |
| Marketing and Distribution—ETF Shares | 227 |
| Marketing and Distribution—Admiral Shares | 390 |
| Custodian Fees | 65 |
| Auditing Fees | 37 |
| Shareholders’ Reports—Investor Shares | 25 |
| Shareholders’ Reports—ETF Shares | 175 |
| Shareholders’ Reports—Admiral Shares | 61 |
| Trustees’ Fees and Expenses | 6 |
| Total Expenses | 5,720 |
| Net Investment Income | 62,533 |
| Realized Net Gain (Loss) | |
| Investment Securities Sold1 | 159,420 |
| Futures Contracts | 3,473 |
| Realized Net Gain (Loss) | 162,893 |
| Change in Unrealized Appreciation (Depreciation) | |
| Investment Securities | 259,442 |
| Futures Contracts | (288) |
| Change in Unrealized Appreciation (Depreciation) | 259,154 |
| Net Increase (Decrease) in Net Assets Resulting from Operations | 484,580 |
| 1 Interest income and realized net gain (loss) from an affiliated company of the fund were $121,000 and $2,000, respectively. |
See accompanying Notes, which are an integral part of the Financial Statements.
64
| | |
| Mid-Cap Growth Index Fund | | |
| |
| |
| Statement of Changes in Net Assets | | |
| |
| | Year Ended December 31, |
| | 2016 | 2015 |
| | ($000) | ($000) |
| Increase (Decrease) in Net Assets | | |
| Operations | | |
| Net Investment Income | 62,533 | 56,067 |
| Realized Net Gain (Loss) | 162,893 | 269,315 |
| Change in Unrealized Appreciation (Depreciation) | 259,154 | (475,467) |
| Net Increase (Decrease) in Net Assets Resulting from Operations | 484,580 | (150,085) |
| Distributions | | |
| Net Investment Income | | |
| Investor Shares | (3,384) | (3,858) |
| ETF Shares | (28,444) | (27,055) |
| Admiral Shares | (30,635) | (25,969) |
| Realized Capital Gain | | |
| Investor Shares | — | — |
| ETF Shares | — | — |
| Admiral Shares | — | — |
| Total Distributions | (62,463) | (56,882) |
| Capital Share Transactions | | |
| Investor Shares | (107,077) | (8,440) |
| ETF Shares | 91,799 | 683,080 |
| Admiral Shares | 389,750 | 1,153,268 |
| Net Increase (Decrease) from Capital Share Transactions | 374,472 | 1,827,908 |
| Total Increase (Decrease) | 796,589 | 1,620,941 |
| Net Assets | | |
| Beginning of Period | 7,162,833 | 5,541,892 |
| End of Period1 | 7,959,422 | 7,162,833 |
| 1 Net Assets—End of Period includes undistributed (overdistributed) net investment income of ($2,206,000) and ($2,276,000). |
See accompanying Notes, which are an integral part of the Financial Statements.
65
| | | | | |
| Mid-Cap Growth Index Fund | | | | | |
| |
| |
| Financial Highlights | | | | | |
| |
| |
| Investor Shares | | | | | |
| |
| For a Share Outstanding | Year Ended December 31, |
| Throughout Each Period | 2016 | 2015 | 2014 | 2013 | 2012 |
| Net Asset Value, Beginning of Period | $39.22 | $39.94 | $35.46 | $26.99 | $23.43 |
| Investment Operations | | | | | |
| Net Investment Income | .290 | .268 | .258 | .169 | .146 |
| Net Realized and Unrealized Gain (Loss) | | | | | |
| on Investments | 2.299 | (.719) | 4.476 | 8.470 | 3.559 |
| Total from Investment Operations | 2.589 | (.451) | 4.734 | 8.639 | 3.705 |
| Distributions | | | | | |
| Dividends from Net Investment Income | (. 289) | (. 269) | (. 254) | (.169) | (.145) |
| Distributions from Realized Capital Gains | — | — | — | — | — |
| Total Distributions | (. 289) | (. 269) | (. 254) | (.169) | (.145) |
| Net Asset Value, End of Period | $41.52 | $39.22 | $39.94 | $35.46 | $26.99 |
| |
| Total Return1 | 6.62% | -1.13% | 13.35% | 32.02% | 15.81% |
| |
| Ratios/Supplemental Data | | | | | |
| Net Assets, End of Period (Millions) | $460 | $542 | $562 | $595 | $483 |
| Ratio of Total Expenses to Average Net Assets | 0.19% | 0.20% | 0.23% | 0.24% | 0.24% |
| Ratio of Net Investment Income to | | | | | |
| Average Net Assets | 0.74% | 0.70% | 0.79% | 0.57% | 0.58% |
| Portfolio Turnover Rate2 | 21% | 23% | 17% | 64% | 38% |
| 1 Total returns do not include account service fees that may have applied in the periods shown. Fund prospectuses provide information about |
| any applicable account service fees. |
| 2 Excludes the value of portfolio securities received or delivered as a result of in-kind purchases or redemptions of the fund’s capital shares, |
| including ETF Creation Units. |
See accompanying Notes, which are an integral part of the Financial Statements.
66
Mid-Cap Growth Index Fund
Financial Highlights
| | | | | |
| ETF Shares | | | | | |
| |
| For a Share Outstanding | Year Ended December 31, |
| Throughout Each Period | 2016 | 2015 | 2014 | 2013 | 2012 |
| Net Asset Value, Beginning of Period | $99.75 | $101.57 | $90.20 | $68.64 | $59.61 |
| Investment Operations | | | | | |
| Net Investment Income | .863 | .805 | .816 | . 556 | . 474 |
| Net Realized and Unrealized Gain (Loss) | | | | | |
| on Investments | 5.848 | (1.815) | 11.359 | 21.558 | 9.029 |
| Total from Investment Operations | 6.711 | (1.010) | 12.175 | 22.114 | 9.503 |
| Distributions | | | | | |
| Dividends from Net Investment Income | (. 861) | (. 810) | (. 805) | (. 554) | (. 473) |
| Distributions from Realized Capital Gains | — | — | — | — | — |
| Total Distributions | (. 861) | (. 810) | (. 805) | (. 554) | (. 473) |
| Net Asset Value, End of Period | $105.60 | $99.75 | $101.57 | $90.20 | $68.64 |
| |
| Total Return | 6.75% | -1.00% | 13.49% | 32.23% | 15.94% |
| |
| Ratios/Supplemental Data | | | | | |
| Net Assets, End of Period (Millions) | $3,576 | $3,302 | $2,716 | $1,896 | $1,200 |
| Ratio of Total Expenses to Average Net Assets | 0.07% | 0.08% | 0.09% | 0.09% | 0.10% |
| Ratio of Net Investment Income to | | | | | |
| Average Net Assets | 0.86% | 0.82% | 0.93% | 0.72% | 0.72% |
| Portfolio Turnover Rate1 | 21% | 23% | 17% | 64% | 38% |
| 1 Excludes the value of portfolio securities received or delivered as a result of in-kind purchases or redemptions of the fund’s capital shares, |
| including ETF Creation Units. |
See accompanying Notes, which are an integral part of the Financial Statements.
67
| | | | | |
| Mid-Cap Growth Index Fund | | | | | |
| |
| |
| Financial Highlights | | | | | |
| |
| |
| Admiral Shares | | | | | |
| |
| For a Share Outstanding | Year Ended December 31, |
| Throughout Each Period | 2016 | 2015 | 2014 | 2013 | 2012 |
| Net Asset Value, Beginning of Period | $42.94 | $43.72 | $38.83 | $29.55 | $25.66 |
| Investment Operations | | | | | |
| Net Investment Income | .370 | .349 | .350 | .239 | .205 |
| Net Realized and Unrealized Gain (Loss) | | | | | |
| on Investments | 2.519 | (.777) | 4.886 | 9.279 | 3.889 |
| Total from Investment Operations | 2.889 | (.428) | 5.236 | 9.518 | 4.094 |
| Distributions | | | | | |
| Dividends from Net Investment Income | (. 369) | (. 352) | (. 346) | (. 238) | (. 204) |
| Distributions from Realized Capital Gains | — | — | — | — | — |
| Total Distributions | (. 369) | (. 352) | (. 346) | (. 238) | (. 204) |
| Net Asset Value, End of Period | $45.46 | $42.94 | $43.72 | $38.83 | $29.55 |
| |
| Total Return1 | 6.75% | -0.98% | 13.48% | 32.22% | 15.96% |
| |
| Ratios/Supplemental Data | | | | | |
| Net Assets, End of Period (Millions) | $3,923 | $3,319 | $2,264 | $1,566 | $913 |
| Ratio of Total Expenses to Average Net Assets | 0.07% | 0.08% | 0.09% | 0.09% | 0.10% |
| Ratio of Net Investment Income to | | | | | |
| Average Net Assets | 0.86% | 0.82% | 0.93% | 0.72% | 0.72% |
| Portfolio Turnover Rate 2 | 21% | 23% | 17% | 64% | 38% |
| 1 Total returns do not include account service fees that may have applied in the periods shown. Fund prospectuses provide information about |
| any applicable account service fees. |
| 2 Excludes the value of portfolio securities received or delivered as a result of in-kind purchases or redemptions of the fund’s capital shares, |
| including ETF Creation Units. |
See accompanying Notes, which are an integral part of the Financial Statements.
68
Mid-Cap Growth Index Fund
Notes to Financial Statements
Vanguard Mid-Cap Growth Index Fund is registered under the Investment Company Act of 1940 as an open-end investment company, or mutual fund. The fund offers three classes of shares: Investor Shares, ETF Shares, and Admiral Shares. Investor Shares are available to any investor who meets the fund’s minimum purchase requirements. ETF Shares are listed for trading on NYSE Arca; they can be purchased and sold through a broker. Admiral Shares are designed for investors who meet certain administrative, service, and account-size criteria.
A. The following significant accounting policies conform to generally accepted accounting principles for U.S. investment companies. The fund consistently follows such policies in preparing its financial statements.
1. Security Valuation: Securities are valued as of the close of trading on the New York Stock Exchange (generally 4 p.m., Eastern time) on the valuation date. Equity securities are valued at the latest quoted sales prices or official closing prices taken from the primary market in which each security trades; such securities not traded on the valuation date are valued at the mean of the latest quoted bid and asked prices. Securities for which market quotations are not readily available, or whose values have been materially affected by events occurring before the fund’s pricing time but after the close of the securities’ primary markets, are valued by methods deemed by the board of trustees to represent fair value. Investments in Vanguard Market Liquidity Fund are valued at that fund’s net asset value. Temporary cash investments are valued using the latest bid prices or using valuations based on a matrix system (which considers such factors as security prices, yields, maturities, and ratings), both as furnished by independent pricing services.
2. Futures Contracts: The fund uses index futures contracts to a limited extent, with the objectives of maintaining full exposure to the stock market, enhancing returns, maintaining liquidity, and minimizing transaction costs. The fund may purchase futures contracts to immediately invest incoming cash in the market, or sell futures in response to cash outflows, thereby simulating a fully invested position in the underlying index while maintaining a cash balance for liquidity. The fund may seek to enhance returns by using futures contracts instead of the underlying securities when futures are believed to be priced more attractively than the underlying securities. The primary risks associated with the use of futures contracts are imperfect correlation between changes in market values of stocks held by the fund and the prices of futures contracts, and the possibility of an illiquid market. Counterparty risk involving futures is mitigated because a regulated clearinghouse is the counterparty instead of the clearing broker. To further mitigate counterparty risk, the fund trades futures contracts on an exchange, monitors the financial strength of its clearing brokers and clearinghouse, and has entered into clearing agreements with its clearing brokers. The clearinghouse imposes initial margin requirements to secure the fund’s performance and requires daily settlement of variation margin representing changes in the market value of each contract.
Futures contracts are valued at their quoted daily settlement prices. The aggregate settlement values of the contracts are not recorded in the Statement of Net Assets. Fluctuations in the value of the contracts are recorded in the Statement of Net Assets as an asset (liability) and in the Statement of Operations as unrealized appreciation (depreciation) until the contracts are closed, when they are recorded as realized futures gains (losses).
During the year ended December 31, 2016, the fund’s average investments in long and short futures contracts represented less than 1% and 0% of net assets, respectively, based on the average of aggregate settlement values at each quarter-end during the period.
69
Mid-Cap Growth Index Fund
3. Federal Income Taxes: The fund intends to continue to qualify as a regulated investment company and distribute all of its taxable income. Management has analyzed the fund’s tax positions taken for all open federal income tax years (December 31, 2013–2016), and has concluded that no provision for federal income tax is required in the fund’s financial statements.
4. Distributions: Distributions to shareholders are recorded on the ex-dividend date.
5. Securities Lending: To earn additional income, the fund lends its securities to qualified institutional borrowers. Security loans are subject to termination by the fund at any time, and are required to be secured at all times by collateral in an amount at least equal to the market value of securities loaned. Daily market fluctuations could cause the value of loaned securities to be more or less than the value of the collateral received. When this occurs, the collateral is adjusted and settled on the next business day. The fund further mitigates its counterparty risk by entering into securities lending transactions only with a diverse group of prequalified counterparties, monitoring their financial strength, and entering into master securities lending agreements with its counterparties. The master securities lending agreements provide that, in the event of a counterparty’s default (including bankruptcy), the fund may terminate any loans with that borrower, determine the net amount owed, and sell or retain the collateral up to the net amount owed to the fund; however, such actions may be subject to legal proceedings. While collateral mitigates counterparty risk, in the absence of a default the fund may experience delays and costs in recovering the securities loaned. The fund invests cash collateral received in Vanguard Market Liquidity Fund, and records a liability in the Statement of Net Assets for the return of the collateral, during the period the securities are on loan. Securities lending income represents fees charged to borrowers plus income earned on invested cash collateral, less expenses associated with the loan. During the term of the loan, the fund is entitled to all distributions made on or in respect of the loaned securities.
6. Credit Facility: The fund and certain other funds managed by The Vanguard Group (“Vanguard”) participate in a $3.1 billion committed credit facility provided by a syndicate of lenders pursuant to a credit agreement that may be renewed annually; each fund is individually liable for its borrowings, if any, under the credit facility. Borrowings may be utilized for temporary and emergency purposes, and are subject to the fund’s regulatory and contractual borrowing restrictions. The participating funds are charged administrative fees and an annual commitment fee of 0.10% of the undrawn amount of the facility; these fees are allocated to the funds based on a method approved by the fund’s board of trustees and included in Management and Administrative expenses on the fund’s Statement of Operations. Any borrowings under this facility bear interest at a rate based upon the higher of the one-month London Interbank Offered Rate, federal funds effective rate, or overnight bank funding rate plus an agreed-upon spread.
The fund had no borrowings outstanding at December 31, 2016, or at any time during the period then ended.
7. Other: Dividend income is recorded on the ex-dividend date. Interest income includes income distributions received from Vanguard Market Liquidity Fund and is accrued daily. Premiums and discounts on debt securities purchased are amortized and accreted, respectively, to interest income over the lives of the respective securities. Security transactions are accounted for on the date securities are bought or sold. Costs used to determine realized gains (losses) on the sale of investment securities are those of the specific securities sold.
70
Mid-Cap Growth Index Fund
Each class of shares has equal rights as to assets and earnings, except that each class separately bears certain class-specific expenses related to maintenance of shareholder accounts (included in Management and Administrative expenses) and shareholder reporting. Marketing and distribution expenses are allocated to each class of shares based on a method approved by the board of trustees. Income, other non-class-specific expenses, and gains and losses on investments are allocated to each class of shares based on its relative net assets.
B. In accordance with the terms of a Funds’ Service Agreement (the “FSA”) between Vanguard and the fund, Vanguard furnishes to the fund investment advisory, corporate management, administrative, marketing, and distribution services at Vanguard’s cost of operations (as defined by the FSA). These costs of operations are allocated to the fund based on methods and guidelines approved by the board of trustees. Vanguard does not require reimbursement in the current period for certain costs of operations (such as deferred compensation/benefits and risk/insurance costs); the fund’s liability for these costs of operations is included in Payables to Vanguard on the Statement of Net Assets.
Upon the request of Vanguard, the fund may invest up to 0.40% of its net assets as capital in Vanguard. At December 31, 2016, the fund had contributed to Vanguard capital in the amount of $589,000, representing 0.01% of the fund’s net assets and 0.24% of Vanguard’s capitalization. The fund’s trustees and officers are also directors and employees, respectively, of Vanguard.
C. Various inputs may be used to determine the value of the fund’s investments. These inputs are summarized in three broad levels for financial statement purposes. The inputs or methodologies used to value securities are not necessarily an indication of the risk associated with investing in those securities.
Level 1—Quoted prices in active markets for identical securities.
Level 2—Other significant observable inputs (including quoted prices for similar securities, interest rates, prepayment speeds, credit risk, etc.).
Level 3—Significant unobservable inputs (including the fund’s own assumptions used to determine the fair value of investments).
The following table summarizes the market value of the fund’s investments as of December 31, 2016, based on the inputs used to value them:
| | | |
| | Level 1 | Level 2 | Level 3 |
| Investments | ($000) | ($000) | ($000) |
| Common Stocks | 7,941,402 | — | — |
| Temporary Cash Investments | 38,293 | 1,198 | — |
| Futures Contracts—Liabilities1 | (85) | — | — |
| Total | 7,979,610 | 1,198 | — |
| 1 Represents variation margin on the last day of the reporting period. |
71
Mid-Cap Growth Index Fund
D. At December 31, 2016, the aggregate settlement value of open futures contracts and the related unrealized appreciation (depreciation) were:
| | | | |
| | | | ($000) |
| | | | Aggregate | |
| | | Number of | Settlement | Unrealized |
| | | Long (Short) | Value | Appreciation |
| Futures Contracts | Expiration | Contracts | Long (Short) | (Depreciation) |
| E-mini S&P 500 Index | March 2017 | 122 | 13,641 | (113) |
| E-mini S&P Mid-Cap 400 Index | March 2017 | 44 | 7,300 | (140) |
| | | | | (253) |
Unrealized appreciation (depreciation) on open futures contracts is required to be treated as realized gain (loss) for tax purposes.
E. Distributions are determined on a tax basis and may differ from net investment income and realized capital gains for financial reporting purposes. Differences may be permanent or temporary. Permanent differences are reclassified among capital accounts in the financial statements to reflect their tax character. Temporary differences arise when certain items of income, expense, gain, or loss are recognized in different periods for financial statement and tax purposes. These differences will reverse at some time in the future. Differences in classification may also result from the treatment of short-term gains as ordinary income for tax purposes.
During the year ended December 31, 2016, the fund realized $286,582,000 of net capital gains resulting from in-kind redemptions—in which shareholders exchanged fund shares for securities held by the fund rather than for cash. Because such gains are not taxable to the fund, and are not distributed to shareholders, they have been reclassified from accumulated net realized losses to paid-in capital.
For tax purposes, at December 31, 2016, the fund had $782,000 of ordinary income available for distribution. At December 31, 2016, the fund had available capital losses totaling $483,894,000 to offset future net capital gains. Of this amount, $73,214,000 is subject to expiration on December 31, 2018. Capital losses of $410,680,000 realized beginning in fiscal 2011 may be carried forward indefinitely under the Regulated Investment Company Modernization Act of 2010, but must be used before any expiring loss carryforwards.
At December 31, 2016, the cost of investment securities for tax purposes was $7,107,033,000. Net unrealized appreciation of investment securities for tax purposes was $873,860,000, consisting of unrealized gains of $1,206,341,000 on securities that had risen in value since their purchase and $332,481,000 in unrealized losses on securities that had fallen in value since their purchase.
F. During the year ended December 31, 2016, the fund purchased $2,688,721,000 of investment securities and sold $2,300,322,000 of investment securities, other than temporary cash investments. Purchases and sales include $845,634,000 and $772,741,000, respectively, in connection with in-kind purchases and redemptions of the fund’s capital shares.
The fund purchased securities from and sold securities to other Vanguard funds or accounts managed by Vanguard or its affiliates, in accordance with procedures adopted by the board of trustees in compliance with Rule 17a-7 of the Investment Company Act of 1940. For the year ended December 31, 2016, such purchases and sales were $171,959,000 and $338,953,000, respectively; these amounts are included in the purchases and sales of investment securities noted above.
72
Mid-Cap Growth Index Fund
G. Capital share transactions for each class of shares were:
| | | | |
| | Year Ended December 31, |
| | 2016 | 2015 |
| | Amount | Shares | Amount | Shares |
| | ($000) | (000) | ($000) | (000) |
| Investor Shares | | | | |
| Issued | 113,566 | 2,863 | 238,852 | 5,803 |
| Issued in Lieu of Cash Distributions | 3,280 | 81 | 3,761 | 96 |
| Redeemed | (223,923) | (5,676) | (251,053) | (6,150) |
| Net Increase (Decrease)—Investor Shares | (107,077) | (2,732) | (8,440) | (251) |
| ETF Shares | | | | |
| Issued | 861,826 | 8,286 | 2,076,252 | 19,811 |
| Issued in Lieu of Cash Distributions | — | — | — | — |
| Redeemed | (770,027) | (7,525) | (1,393,172) | (13,450) |
| Net Increase (Decrease)—ETF Shares | 91,799 | 761 | 683,080 | 6,361 |
| Admiral Shares | | | | |
| Issued | 1,261,332 | 29,101 | 1,742,625 | 38,699 |
| Issued in Lieu of Cash Distributions | 28,189 | 633 | 23,858 | 555 |
| Redeemed | (899,771) | (20,724) | (613,215) | (13,738) |
| Net Increase (Decrease)—Admiral Shares | 389,750 | 9,010 | 1,153,268 | 25,516 |
H. Management has determined that no material events or transactions occurred subsequent to December 31, 2016, that would require recognition or disclosure in these financial statements.
73
Mid-Cap Value Index Fund
Fund Profile
As of December 31, 2016
| | | |
| Share-Class Characteristics | | |
| |
| | Investor | ETF | Admiral |
| | Shares | Shares | Shares |
| Ticker Symbol | VMVIX | VOE | VMVAX |
| Expense Ratio1 | 0.20% | 0.08% | 0.08% |
| 30-Day SEC Yield | 1.98% | 2.10% | 2.10% |
| | | |
| Portfolio Characteristics | | |
| | | CRSP US | DJ |
| | | Mid Cap | U.S. Total |
| | | Value | Market |
| | Fund | Index | FA Index |
| Number of Stocks | 208 | 203 | 3,833 |
| Median Market Cap | $11.2B | $11.2B | $54.1B |
| Price/Earnings Ratio | 22.9x | 22.8x | 24.4x |
| Price/Book Ratio | 2.0x | 2.0x | 2.8x |
| Return on Equity | 13.0% | 12.7% | 16.5% |
| Earnings Growth Rate | 5.4% | 5.3% | 8.2% |
| Dividend Yield | 2.2% | 2.2% | 2.0% |
| Foreign Holdings | 0.0% | 0.0% | 0.0% |
| Turnover Rate | 20% | — | — |
| Short-Term Reserves | 0.2% | — | — |
| | | |
| Sector Diversification (% of equity exposure) |
| | | CRSP US | DJ |
| | | Mid Cap | U.S. Total |
| | | Value | Market |
| | Fund | Index | FA Index |
| Basic Materials | 7.6% | 7.6% | 2.6% |
| Consumer Goods | 15.8 | 15.8 | 9.6 |
| Consumer Services | 11.1 | 11.1 | 13.1 |
| Financials | 27.1 | 27.1 | 20.8 |
| Health Care | 4.4 | 4.3 | 12.2 |
| Industrials | 9.9 | 9.9 | 12.9 |
| Oil & Gas | 5.4 | 5.4 | 6.9 |
| Technology | 9.0 | 9.0 | 16.4 |
| Telecommunications | 0.1 | 0.1 | 2.4 |
| Utilities | 9.6 | 9.7 | 3.1 |
| | |
| Volatility Measures | | |
| | CRSP US | DJ |
| | Mid Cap | U.S. Total |
| | Value | Market |
| | Index | FA Index |
| R-Squared | 1.00 | 0.95 |
| Beta | 1.00 | 1.00 |
| These measures show the degree and timing of the fund’s |
| fluctuations compared with the indexes over 36 months. |
| | |
| Ten Largest Holdings (% of total net assets) |
| M&T Bank Corp. | Banks | 1.2% |
| Newell Brands Inc. | Durable Household | |
| | Products | 1.2 |
| KeyCorp | Banks | 1.1 |
| Western Digital Corp. | Computer Hardware | 1.1 |
| WEC Energy Group Inc. | Multiutilities | 1.0 |
| Citizens Financial Group | | |
| Inc. | Banks | 1.0 |
| Newmont Mining Corp. | Gold Mining | 1.0 |
| Hartford Financial | | |
| Services Group Inc. | Full Line Insurance | 1.0 |
| Regions Financial Corp. | Banks | 1.0 |
| DTE Energy Co. | Conventional | |
| | Electricity | 1.0 |
| Top Ten | | 10.6% |
| The holdings listed exclude any temporary cash investments and |
| equity index products. |
Investment Focus
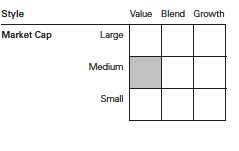
1 The expense ratios shown are from the prospectus dated April 27, 2016, and represent estimated costs for the current fiscal year. For the fiscal
year ended December 31, 2016, the expense ratios were 0.19% for Investor Shares, 0.07% for ETF Shares, and 0.07% for Admiral Shares.
74
Mid-Cap Value Index Fund
Performance Summary
All of the returns in this report represent past performance, which is not a guarantee of future results that may be achieved by the fund. (Current performance may be lower or higher than the performance data cited. For performance data current to the most recent month-end, visit our website at vanguard.com/performance.) Note, too, that both investment returns and principal value can fluctuate widely, so an investor’s shares, when sold, could be worth more or less than their original cost. The returns shown do not reflect taxes that a shareholder would pay on fund distributions or on the sale of fund shares.
Cumulative Performance: December 31, 2006, Through December 31, 2016
Initial Investment of $10,000
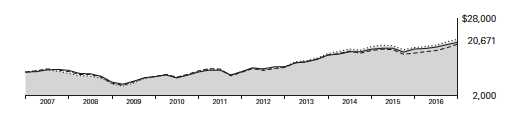
| | | | | |
| | | Average Annual Total Returns | |
| | | Periods Ended December 31, 2016 | |
| | | | | | Final Value |
| | | One | Five | Ten | of a $10,000 |
| | | Year | Years | Years | Investment |
| | Mid-Cap Value Index Fund*Investor | | | | |
| | Shares | 15.11% | 15.41% | 7.53% | $20,671 |
| • • • • • • •• | Spliced Mid-Cap Value Index | 15.28 | 15.62 | 7.72 | 21,037 |
| – – – – | Mid-Cap Value Funds Average | 18.26 | 14.33 | 6.84 | 19,377 |
| | Dow Jones U.S. Total Stock Market | | | | |
| | Float Adjusted Index | 12.62 | 14.59 | 7.18 | 20,003 |
| For a benchmark description, see the Glossary. |
| Mid-Cap Value Funds Average: Derived from data provided by Lipper, a Thomson Reuters Company. |
| | | | |
| | | | | Final Value |
| | One | Five | Ten | of a $10,000 |
| | Year | Years | Years | Investment |
| Mid-Cap Value Index Fund | | | | |
| ETF Shares Net Asset Value | 15.26% | 15.56% | 7.67% | $20,945 |
| Spliced Mid-Cap Value Index | 15.28 | 15.62 | 7.72 | 21,037 |
| Dow Jones U.S. Total Stock Market Float | | | | |
| Adjusted Index | 12.62 | 14.59 | 7.18 | 20,003 |
See Financial Highlights for dividend and capital gains information.
75
Mid-Cap Value Index Fund
| | | | |
| | Average Annual Total Returns | |
| | Periods Ended December 31, 2016 | |
| | | | Since | Final Value |
| | One | Five | Inception | of a $10,000 |
| | Year | Years | (9/27/2011) | Investment |
| Mid-Cap Value Index Fund Admiral Shares | 15.26% | 15.56% | 16.69% | $22,519 |
| Spliced Mid-Cap Value Index | 15.28 | 15.62 | 16.75 | 22,588 |
| Dow Jones U.S. Total Stock Market Float | | | | |
| Adjusted Index | 12.62 | 14.59 | 15.42 | 21,267 |
| "Since Inception" performance is calculated from the Admiral Shares’ inception date for both the fund and its comparative standards. |
| | | |
| Cumulative Returns of ETF Shares: December 31, 2006, Through December 31, 2016 | |
| | One | Five | Ten |
| | Year | Years | Years |
| Mid-Cap Value Index Fund ETF Shares Market Price | 15.29% | 106.05% | 109.38% |
| Mid-Cap Value Index Fund ETF Shares Net Asset | | | |
| Value | 15.26 | 106.07 | 109.45 |
| Spliced Mid-Cap Value Index | 15.28 | 106.66 | 110.37 |
Fiscal-Year Total Returns (%): December 31, 2006, Through December 31, 2016
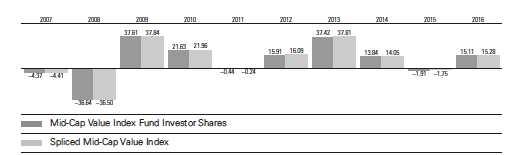
For a benchmark description, see the Glossary.
76
Mid-Cap Value Index Fund
Financial Statements
Statement of Net Assets
As of December 31, 2016
The fund reports a complete list of its holdings in regulatory filings four times in each fiscal year, at the quarter-ends. For the second and fourth fiscal quarters, the lists appear in the fund’s semiannual and annual reports to shareholders. For the first and third fiscal quarters, the fund files the lists with the Securities and Exchange Commission on Form N-Q. Shareholders can look up the fund’s Forms N-Q on the SEC’s website at sec.gov. Forms N-Q may also be reviewed and copied at the SEC’s Public Reference Room (see the back cover of this report for further information).
| | | |
| | | | Market |
| | | | Value• |
| | | Shares | ($000) |
| Common Stocks (99.8%)1 | | |
| Basic Materials (7.6%) | | |
| | Newmont Mining Corp. | 3,861,895 | 131,575 |
| * | Freeport-McMoRan Inc. | 8,917,309 | 117,619 |
| | Celanese Corp. Class A | 1,042,269 | 82,068 |
| | Eastman Chemical Co. | 1,014,872 | 76,328 |
| | Mosaic Co. | 2,549,525 | 74,778 |
| | Albemarle Corp. | 817,642 | 70,383 |
| | International Flavors & | | |
| | Fragrances Inc. | 519,635 | 61,229 |
| | Arconic Inc. | 3,187,836 | 59,102 |
| | FMC Corp. | 972,967 | 55,031 |
| | CF Industries Holdings | | |
| | Inc. | 1,696,464 | 53,405 |
| | Ashland Global Holdings | | |
| | Inc. | 452,468 | 49,450 |
| | Avery Dennison Corp. | 647,663 | 45,479 |
| | Reliance Steel & | | |
| | Aluminum Co. | 501,745 | 39,909 |
| | WR Grace & Co. | 509,727 | 34,478 |
| * | Alcoa Corp. | 663,589 | 18,634 |
| | Westlake Chemical Corp. | 281,113 | 15,739 |
| | | | 985,207 |
| Consumer Goods (15.8%) | | |
| | Newell Brands Inc. | 3,510,044 | 156,724 |
| | Conagra Brands Inc. | 3,185,398 | 125,983 |
| | Molson Coors Brewing | | |
| | Co. Class B | 1,270,689 | 123,651 |
| | Dr Pepper Snapple Group | | |
| | Inc. | 1,336,764 | 121,204 |
| | Clorox Co. | 936,785 | 112,433 |
| | JM Smucker Co. | 804,954 | 103,082 |
| | Whirlpool Corp. | 546,576 | 99,351 |
| | Genuine Parts Co. | 1,028,282 | 98,242 |
| | Harley-Davidson Inc. | 1,286,831 | 75,074 |
| | Bunge Ltd. | 1,013,861 | 73,241 |
| | DR Horton Inc. | 2,628,854 | 71,847 |
| | Coach Inc. | 2,038,110 | 71,375 |
| | Mattel Inc. | 2,486,473 | 68,502 |
| | | |
| | Lear Corp. | 510,378 | 67,559 |
| | Delphi Automotive plc | 984,523 | 66,308 |
| | Tyson Foods Inc. Class A | 1,056,274 | 65,151 |
| | Hasbro Inc. | 816,524 | 63,517 |
| | Lennar Corp. Class A | 1,428,475 | 61,324 |
| | BorgWarner Inc. | 1,548,324 | 61,066 |
| | Coty Inc. Class A | 3,255,275 | 59,604 |
| | Leucadia National Corp. | 2,355,626 | 54,768 |
| | PVH Corp. | 583,302 | 52,637 |
| | PulteGroup Inc. | 2,166,456 | 39,819 |
| | Ralph Lauren Corp. | | |
| | Class A | 410,199 | 37,049 |
| | Ingredion Inc. | 263,621 | 32,942 |
| * | Edgewell Personal Care | | |
| | Co. | 421,740 | 30,783 |
| | Goodyear Tire & Rubber | | |
| | Co. | 950,605 | 29,345 |
| * | Lamb Weston Holdings | | |
| | Inc. | 531,651 | 20,123 |
| ^ | Pilgrim’s Pride Corp. | 367,083 | 6,971 |
| | Lennar Corp. Class B | 68,681 | 2,370 |
| | | | 2,052,045 |
| Consumer Services (11.1%) | | |
| | Nielsen Holdings plc | 2,600,883 | 109,107 |
| | Royal Caribbean Cruises | | |
| | Ltd. | 1,249,130 | 102,479 |
| | Best Buy Co. Inc. | 1,962,642 | 83,746 |
| | Macy’s Inc. | 2,245,175 | 80,400 |
| * | United Continental | | |
| | Holdings Inc. | 996,139 | 72,599 |
| | Whole Foods Market Inc. | 2,317,891 | 71,298 |
| | Foot Locker Inc. | 968,696 | 68,671 |
| | Interpublic Group of | | |
| | Cos. Inc. | 2,886,018 | 67,562 |
| | Darden Restaurants Inc. | 894,813 | 65,071 |
| | Kohl’s Corp. | 1,305,725 | 64,477 |
| | Aramark | 1,779,436 | 63,561 |
| * | Liberty Interactive Corp. | | |
| | QVC Group Class A | 3,022,027 | 60,380 |
| | Wynn Resorts Ltd. | 591,788 | 51,195 |
77
Mid-Cap Value Index Fund
| | | |
| | | | Market |
| | | | Value• |
| | | Shares | ($000) |
| | AmerisourceBergen Corp. | | |
| | Class A | 600,703 | 46,969 |
| * | Liberty Media Corp-Liberty | | |
| | SiriusXM Class C | 1,297,152 | 43,999 |
| | Staples Inc. | 4,734,548 | 42,848 |
| | Bed Bath & Beyond Inc. | 1,050,717 | 42,701 |
| | Nordstrom Inc. | 883,574 | 42,350 |
| | News Corp. Class A | 3,450,904 | 39,547 |
| | H&R Block Inc. | 1,594,992 | 36,669 |
| | Gap Inc. | 1,595,860 | 35,811 |
| | Tiffany & Co. | 454,114 | 35,162 |
| * | Rite Aid Corp. | 3,829,311 | 31,553 |
| * | Liberty Media Corp- | | |
| | Liberty SiriusXM Class A | 632,208 | 21,824 |
| * | Discovery | | |
| | Communications Inc. | 810,073 | 21,694 |
| * | Discovery | | |
| | Communications Inc. | | |
| | Class A | 550,776 | 15,097 |
| | Williams-Sonoma Inc. | 290,172 | 14,041 |
| * | AutoNation Inc. | 257,879 | 12,546 |
| | News Corp. Class B | 198,909 | 2,347 |
| | | | 1,445,704 |
| Financials (27.1%) | | |
| | M&T Bank Corp. | 1,015,410 | 158,841 |
| | KeyCorp | 7,863,450 | 143,665 |
| | Citizens Financial Group | | |
| | Inc. | 3,724,575 | 132,707 |
| | Hartford Financial | | |
| | Services Group Inc. | 2,748,551 | 130,968 |
| | Regions Financial Corp. | 8,956,889 | 128,621 |
| | Principal Financial Group | | |
| | Inc. | 2,093,342 | 121,121 |
| | Willis Towers Watson plc | 945,329 | 115,595 |
| | Lincoln National Corp. | 1,663,133 | 110,216 |
| | Huntington Bancshares | | |
| | Inc. | 7,893,324 | 104,350 |
| | Host Hotels & Resorts | | |
| | Inc. | 5,383,610 | 101,427 |
| | Invesco Ltd. | 2,972,975 | 90,200 |
| * | Markel Corp. | 96,741 | 87,502 |
| | Cincinnati Financial Corp. | 1,139,134 | 86,289 |
| | Comerica Inc. | 1,253,780 | 85,395 |
| | SL Green Realty Corp. | 737,606 | 79,329 |
| | Western Union Co. | 3,529,235 | 76,655 |
| | Unum Group | 1,689,640 | 74,226 |
| | Kimco Realty Corp. | 2,939,335 | 73,954 |
| | Annaly Capital | | |
| | Management Inc. | 7,416,551 | 73,943 |
| * | Arch Capital Group Ltd. | 848,537 | 73,220 |
| | XL Group Ltd. | 1,958,604 | 72,978 |
| | UDR Inc. | 1,942,756 | 70,872 |
| | Macerich Co. | 992,578 | 70,314 |
| | Duke Realty Corp. | 2,578,409 | 68,483 |
| | | |
| | Raymond James | | |
| | Financial Inc. | 929,014 | 64,353 |
| | FNF Group | 1,892,756 | 64,278 |
| | Zions Bancorporation | 1,480,988 | 63,742 |
| | CIT Group Inc. | 1,468,961 | 62,695 |
| | Ally Financial Inc. | 3,257,066 | 61,949 |
| | Torchmark Corp. | 819,483 | 60,445 |
| | Iron Mountain Inc. | 1,819,440 | 59,095 |
| | Reinsurance Group of | | |
| | America Inc. Class A | 466,853 | 58,744 |
| | Nasdaq Inc. | 840,726 | 56,429 |
| | Voya Financial Inc. | 1,414,916 | 55,493 |
| | New York Community | | |
| | Bancorp Inc. | 3,363,838 | 53,519 |
| | Camden Property Trust | 636,036 | 53,472 |
| | First Republic Bank | 559,049 | 51,511 |
| | Everest Re Group Ltd. | 225,221 | 48,738 |
| | WR Berkley Corp. | 662,556 | 44,067 |
| | People’s United Financial | | |
| | Inc. | 2,266,259 | 43,875 |
| | AGNC Investment Corp. | 2,409,338 | 43,681 |
| | Axis Capital Holdings Ltd. | 643,698 | 42,014 |
| * | Liberty Broadband Corp. | 529,000 | 39,183 |
| | Lazard Ltd. Class A | 944,599 | 38,814 |
| | Jones Lang LaSalle Inc. | 328,395 | 33,181 |
| * | Alleghany Corp. | 53,317 | 32,423 |
| | Assurant Inc. | 207,393 | 19,258 |
| | Navient Corp. | 1,102,489 | 18,114 |
| * | Athene Holding Ltd. | | |
| | Class A | 172,009 | 8,255 |
| * | Liberty Broadband Corp. | | |
| | Class A | 90,867 | 6,584 |
| * | Santander Consumer USA | | |
| | Holdings Inc. | 388,246 | 5,241 |
| | Mid-America Apartment | | |
| | Communities Inc. | 546 | 53 |
| | | | 3,520,077 |
| Health Care (4.3%) | | |
| * | Laboratory Corp. of | | |
| | America Holdings | 749,529 | 96,225 |
| | Quest Diagnostics Inc. | 1,008,965 | 92,724 |
| * | Henry Schein Inc. | 585,852 | 88,880 |
| | Perrigo Co. plc | 991,436 | 82,517 |
| * | Hologic Inc. | 2,025,005 | 81,243 |
| | Universal Health | | |
| | Services Inc. Class B | 651,874 | 69,346 |
| * | Mallinckrodt plc | 784,244 | 39,071 |
| | Patterson Cos. Inc. | 305,305 | 12,527 |
| * | Endo International plc | 1,904 | 31 |
| | | | 562,564 |
| Industrials (9.9%) | | |
| | Ball Corp. | 1,272,077 | 95,495 |
| | WestRock Co. | 1,830,146 | 92,916 |
| | Rockwell Collins Inc. | 948,038 | 87,940 |
78
Mid-Cap Value Index Fund
| | | |
| | | | Market |
| | | | Value• |
| | | Shares | ($000) |
| | Textron Inc. | 1,769,844 | 85,944 |
| | Dover Corp. | 1,130,670 | 84,721 |
| | L-3 Communications | | |
| | Holdings Inc. | 505,389 | 76,875 |
| | Pentair plc | 1,189,079 | 66,672 |
| | Xylem Inc. | 1,304,127 | 64,580 |
| | Sealed Air Corp. | 1,405,365 | 63,719 |
| | Xerox Corp. | 6,264,370 | 54,688 |
| * | Crown Holdings Inc. | 1,016,312 | 53,428 |
| | Fluor Corp. | 1,012,315 | 53,167 |
| * | Jacobs Engineering | | |
| | Group Inc. | 877,846 | 50,037 |
| | Hubbell Inc. Class B | 402,927 | 47,022 |
| * | Arrow Electronics Inc. | 652,007 | 46,488 |
| | Flowserve Corp. | 949,424 | 45,620 |
| | Avnet Inc. | 928,933 | 44,226 |
| | ManpowerGroup Inc. | 488,107 | 43,378 |
| | Owens Corning | 824,828 | 42,528 |
| | Allison Transmission | | |
| | Holdings Inc. | 1,083,712 | 36,510 |
| * | United Rentals Inc. | 306,675 | 32,379 |
| | FLIR Systems Inc. | 495,248 | 17,923 |
| | Fidelity National | | |
| | Information Services Inc. | 6,164 | 466 |
| | | | 1,286,722 |
| Oil & Gas (5.3%) | | |
| | Marathon Oil Corp. | 6,164,684 | 106,711 |
| | National Oilwell Varco | | |
| | Inc. | 2,748,253 | 102,895 |
| | Devon Energy Corp. | 1,810,146 | 82,669 |
| | Tesoro Corp. | 850,843 | 74,406 |
| * | FMC Technologies Inc. | 1,640,833 | 58,299 |
| | Helmerich & Payne Inc. | 747,099 | 57,825 |
| | OGE Energy Corp. | 1,453,421 | 48,617 |
| | Cimarex Energy Co. | 345,592 | 46,966 |
| | HollyFrontier Corp. | 1,284,664 | 42,086 |
| * | Energen Corp. | 353,080 | 20,362 |
| | Murphy Oil Corp. | 594,942 | 18,520 |
| * | Weatherford | | |
| | International plc | 3,573,214 | 17,830 |
| *,^ | Continental Resources | | |
| | Inc. | 340,800 | 17,565 |
| | | | 694,751 |
| Other (0.0%)2 | | |
| * | Safeway Inc CVR | | |
| | (Casa Ley) Exp. 01/30/2018 | 1,233 | — |
| * | Safeway Inc CVR (PDC) | | |
| | Exp. 01/30/2017 | 1,233 | — |
| | | | — |
| Technology (9.0%) | | |
| | Western Digital Corp. | 2,077,237 | 141,148 |
| | Symantec Corp. | 4,536,241 | 108,371 |
| | Motorola Solutions Inc. | 1,207,696 | 100,106 |
| | Harris Corp. | 904,439 | 92,678 |
| | | |
| * | Dell Technologies Inc. | | |
| | Class V | 1,622,658 | 89,197 |
| | Seagate Technology plc | 2,143,571 | 81,820 |
| | Maxim Integrated | | |
| | Products Inc. | 2,061,811 | 79,524 |
| | Juniper Networks Inc. | 2,630,090 | 74,326 |
| | NetApp Inc. | 2,028,532 | 71,546 |
| * | Synopsys Inc. | 1,100,166 | 64,756 |
| | Xilinx Inc. | 917,884 | 55,413 |
| | KLA-Tencor Corp. | 568,855 | 44,758 |
| * | Micron Technology Inc. | 1,895,008 | 41,539 |
| | Marvell Technology | | |
| | Group Ltd. | 2,794,996 | 38,767 |
| | Garmin Ltd. | 754,591 | 36,590 |
| | Computer Sciences Corp. | 512,663 | 30,462 |
| * | Nuance Communications | | |
| | Inc. | 1,048,233 | 15,619 |
| | | | 1,166,620 |
| Telecommunications (0.1%) | | |
| | Frontier | | |
| | Communications Corp. | 4,278,171 | 14,460 |
| |
| Utilities (9.6%) | | |
| | WEC Energy Group Inc. | 2,296,561 | 134,693 |
| | DTE Energy Co. | 1,305,657 | 128,620 |
| | Eversource Energy | 2,305,803 | 127,350 |
| | American Water Works | | |
| | Co. Inc. | 1,295,321 | 93,729 |
| | Ameren Corp. | 1,765,726 | 92,630 |
| | Entergy Corp. | 1,249,545 | 91,804 |
| | ONEOK Inc. | 1,532,098 | 87,958 |
| | CMS Energy Corp. | 2,037,219 | 84,789 |
| | CenterPoint Energy Inc. | 2,978,388 | 73,387 |
| | SCANA Corp. | 935,041 | 68,520 |
| | Pinnacle West Capital | | |
| | Corp. | 809,218 | 63,143 |
| | Alliant Energy Corp. | 1,653,820 | 62,663 |
| | AES Corp. | 4,792,033 | 55,683 |
| | NiSource Inc. | 2,346,329 | 51,948 |
| | Avangrid Inc. | 449,885 | 17,042 |
| * | Calpine Corp. | 1,303,372 | 14,898 |
| | | | 1,248,857 |
| Total Common Stocks | | |
| (Cost $11,273,934) | | 12,977,007 |
| Temporary Cash Investments (0.5%)1 | |
| Money Market Fund (0.5%) | | |
| 3,4 | Vanguard Market Liquidity | | |
| | Fund, 0.823% | 605,297 | 60,536 |
79
Mid-Cap Value Index Fund
| | | |
| | Face | | Market |
| | Amount | | Value• |
| | ($000) | | ($000) |
| U.S. Government and Agency Obligations (0.0%) |
| 5 United States Treasury Bill, | | |
| 0.322%, 1/19/17 | 5,000 | | 4,999 |
| Total Temporary Cash Investments | | |
| (Cost $65,535) | | | 65,535 |
| Total Investments (100.3%) | | | |
| (Cost $11,339,469) | | 13,042,542 |
| |
| | | | Amount |
| | | | ($000) |
| Other Assets and Liabilities (-0.3%) | | |
| Other Assets | | | |
| Investment in Vanguard | | | 939 |
| Receivables for Investment Securities Sold | 880 |
| Receivables for Accrued Income | | 22,525 |
| Receivables for Capital Shares Issued | | 17,923 |
| Other Assets | | | 33 |
| Total Other Assets | | | 42,300 |
| Liabilities | | | |
| Payables for Investment Securities | | |
| Purchased | | | (34,954) |
| Collateral for Securities on Loan | | (18,480) |
| Payables for Capital Shares Redeemed | | (29,649) |
| Payables to Vanguard | | | (3,624) |
| Other Liabilities | | | (289) |
| Total Liabilities | | | (86,996) |
| Net Assets (100%) | | 12,997,846 |
| |
| At December 31, 2016, net assets consisted of: |
| | Amount |
| | ($000) |
| Paid-in Capital | 11,793,685 |
| Overdistributed Net Investment Income | (1,482) |
| Accumulated Net Realized Losses | (497,181) |
| Unrealized Appreciation (Depreciation) | |
| Investment Securities | 1,703,073 |
| Futures Contracts | (249) |
| Net Assets | 12,997,846 |
| |
| |
| Investor Shares—Net Assets | |
| Applicable to 17,410,843 outstanding | |
| $.001 par value shares of beneficial | |
| interest (unlimited authorization) | 665,717 |
| Net Asset Value Per Share— | |
| Investor Shares | $38.24 |
| |
| |
| ETF Shares—Net Assets | |
| Applicable to 65,722,578 outstanding | |
| $.001 par value shares of beneficial | |
| interest (unlimited authorization) | 6,382,813 |
| Net Asset Value Per Share— | |
| ETF Shares | $97.12 |
| |
| |
| Admiral Shares—Net Assets | |
| Applicable to 118,259,995 outstanding | |
| $.001 par value shares of beneficial | |
| interest (unlimited authorization) | 5,949,316 |
| Net Asset Value Per Share— | |
| Admiral Shares | $50.31 |
• See Note A in Notes to Financial Statements.
* Non-income-producing security.
^ Includes partial security positions on loan to broker-dealers. The total value of securities on loan is $17,814,000.
1 The fund invests a portion of its cash reserves in equity markets through the use of index futures contracts. After giving effect to futures
investments, the fund’s effective common stock and temporary cash investment positions represent 100.0% and 0.3%, respectively, of net
assets.
2 “Other” represents securities that are not classified by the fund’s benchmark index.
3 Affiliated money market fund available only to Vanguard funds and certain trusts and accounts managed by Vanguard. Rate shown is the
7-day yield.
4 Includes $18,480,000 of collateral received for securities on loan.
5 Securities with a value of $1,500,000 have been segregated as initial margin for open futures contracts.
CVR—Contingent Value Rights.
See accompanying Notes, which are an integral part of the Financial Statements.
80
| |
| Mid-Cap Value Index Fund | |
| |
| |
| Statement of Operations | |
| |
| | Year Ended |
| | December 31, 2016 |
| | ($000) |
| Investment Income | |
| Income | |
| Dividends | 230,182 |
| Interest1 | 192 |
| Securities Lending—Net | 1,002 |
| Total Income | 231,376 |
| Expenses | |
| The Vanguard Group—Note B | |
| Investment Advisory Services | 1,528 |
| Management and Administrative—Investor Shares | 861 |
| Management and Administrative—ETF Shares | 1,994 |
| Management and Administrative—Admiral Shares | 1,965 |
| Marketing and Distribution—Investor Shares | 164 |
| Marketing and Distribution—ETF Shares | 350 |
| Marketing and Distribution—Admiral Shares | 530 |
| Custodian Fees | 97 |
| Auditing Fees | 39 |
| Shareholders’ Reports—Investor Shares | 23 |
| Shareholders’ Reports—ETF Shares | 339 |
| Shareholders’ Reports—Admiral Shares | 75 |
| Trustees’ Fees and Expenses | 8 |
| Total Expenses | 7,973 |
| Net Investment Income | 223,403 |
| Realized Net Gain (Loss) | |
| Investment Securities Sold1 | 342,551 |
| Futures Contracts | 4,523 |
| Realized Net Gain (Loss) | 347,074 |
| Change in Unrealized Appreciation (Depreciation) | |
| Investment Securities | 992,542 |
| Futures Contracts | (438) |
| Change in Unrealized Appreciation (Depreciation) | 992,104 |
| Net Increase (Decrease) in Net Assets Resulting from Operations | 1,562,581 |
| 1 Interest income and realized net gain (loss) from an affiliated company of the fund were $184,000 and $2,000, respectively. |
See accompanying Notes, which are an integral part of the Financial Statements.
81
| | |
| Mid-Cap Value Index Fund | | |
| |
| |
| Statement of Changes in Net Assets | | |
| |
| | Year Ended December 31, |
| | 2016 | 2015 |
| | ($000) | ($000) |
| Increase (Decrease) in Net Assets | | |
| Operations | | |
| Net Investment Income | 223,403 | 171,890 |
| Realized Net Gain (Loss) | 347,074 | 289,945 |
| Change in Unrealized Appreciation (Depreciation) | 992,104 | (628,256) |
| Net Increase (Decrease) in Net Assets Resulting from Operations | 1,562,581 | (166,421) |
| Distributions | | |
| Net Investment Income | | |
| Investor Shares | (11,952) | (11,384) |
| ETF Shares | (112,242) | (84,188) |
| Admiral Shares | (103,729) | (73,446) |
| Realized Capital Gain | | |
| Investor Shares | — | — |
| ETF Shares | — | — |
| Admiral Shares | — | — |
| Total Distributions | (227,923) | (169,018) |
| Capital Share Transactions | | |
| Investor Shares | 3,843 | (17,234) |
| ETF Shares | 1,395,028 | 1,106,022 |
| Admiral Shares | 1,441,539 | 1,138,592 |
| Net Increase (Decrease) from Capital Share Transactions | 2,840,410 | 2,227,380 |
| Total Increase (Decrease) | 4,175,068 | 1,891,941 |
| Net Assets | | |
| Beginning of Period | 8,822,778 | 6,930,837 |
| End of Period1 | 12,997,846 | 8,822,778 |
| 1 Net Assets—End of Period includes undistributed (overdistributed) net investment income of ($1,482,000) and $2,955,000. |
See accompanying Notes, which are an integral part of the Financial Statements.
82
| | | | | |
| Mid-Cap Value Index Fund | | | | | |
| |
| |
| Financial Highlights | | | | | |
| |
| |
| Investor Shares | | | | | |
| |
| For a Share Outstanding | Year Ended December 31, |
| Throughout Each Period | 2016 | 2015 | 2014 | 2013 | 2012 |
| Net Asset Value, Beginning of Period | $33.86 | $35.19 | $31.38 | $23.16 | $20.34 |
| Investment Operations | | | | | |
| Net Investment Income | . 675 | . 658 | . 539 | . 441 | . 423 |
| Net Realized and Unrealized Gain (Loss) | | | | | |
| on Investments | 4.396 | (1.341) | 3.804 | 8.218 | 2.813 |
| Total from Investment Operations | 5.071 | (.683) | 4.343 | 8.659 | 3.236 |
| Distributions | | | | | |
| Dividends from Net Investment Income | (. 691) | (. 647) | (. 533) | (. 439) | (. 416) |
| Distributions from Realized Capital Gains | — | — | — | — | — |
| Total Distributions | (. 691) | (. 647) | (. 533) | (. 439) | (. 416) |
| Net Asset Value, End of Period | $38.24 | $33.86 | $35.19 | $31.38 | $23.16 |
| |
| Total Return1 | 15.11% | -1.91% | 13.84% | 37.42% | 15.91% |
| |
| Ratios/Supplemental Data | | | | | |
| Net Assets, End of Period (Millions) | $666 | $588 | $628 | $640 | $487 |
| Ratio of Total Expenses to Average Net Assets | 0.19% | 0.20% | 0.23% | 0.24% | 0.24% |
| Ratio of Net Investment Income to | | | | | |
| Average Net Assets | 2.02% | 2.01% | 1.86% | 1.80% | 2.21% |
| Portfolio Turnover Rate2 | 20% | 20% | 14% | 46% | 33% |
| 1 Total returns do not include account service fees that may have applied in the periods shown. Fund prospectuses provide information about |
| any applicable account service fees. |
| 2 Excludes the value of portfolio securities received or delivered as a result of in-kind purchases or redemptions of the fund’s capital shares, |
| including ETF Creation Units. |
See accompanying Notes, which are an integral part of the Financial Statements.
83
| | | | | |
| Mid-Cap Value Index Fund | | | | | |
| |
| |
| Financial Highlights | | | | | |
| |
| |
| ETF Shares | | | | | |
| |
| For a Share Outstanding | Year Ended December 31, |
| Throughout Each Period | 2016 | 2015 | 2014 | 2013 | 2012 |
| Net Asset Value, Beginning of Period | $85.99 | $89.39 | $79.73 | $58.82 | $51.67 |
| Investment Operations | | | | | |
| Net Investment Income | 1.822 | 1.785 | 1.504 | 1.232 | 1.156 |
| Net Realized and Unrealized Gain (Loss) | | | | | |
| on Investments | 11.170 | (3.427) | 9.647 | 20.901 | 7.130 |
| Total from Investment Operations | 12.992 | (1.642) | 11.151 | 22.133 | 8.286 |
| Distributions | | | | | |
| Dividends from Net Investment Income | (1.862) | (1.758) | (1.491) | (1.223) | (1.136) |
| Distributions from Realized Capital Gains | — | — | — | — | — |
| Total Distributions | (1.862) | (1.758) | (1.491) | (1.223) | (1.136) |
| Net Asset Value, End of Period | $97.12 | $85.99 | $89.39 | $79.73 | $58.82 |
| |
| Total Return | 15.26% | -1.80% | 13.98% | 37.65% | 16.04% |
| |
| Ratios/Supplemental Data | | | | | |
| Net Assets, End of Period (Millions) | $6,383 | $4,351 | $3,407 | $2,256 | $1,147 |
| Ratio of Total Expenses to Average Net Assets | 0.07% | 0.08% | 0.09% | 0.09% | 0.10% |
| Ratio of Net Investment Income to | | | | | |
| Average Net Assets | 2.14% | 2.13% | 2.00% | 1.95% | 2.35% |
| Portfolio Turnover Rate1 | 20% | 20% | 14% | 46% | 33% |
| 1 Excludes the value of portfolio securities received or delivered as a result of in-kind purchases or redemptions of the fund’s capital shares, |
| including ETF Creation Units. |
See accompanying Notes, which are an integral part of the Financial Statements.
84
| | | | | |
| Mid-Cap Value Index Fund | | | | | |
| |
| |
| Financial Highlights | | | | | |
| |
| |
| Admiral Shares | | | | | |
| |
| For a Share Outstanding | Year Ended December 31, |
| Throughout Each Period | 2016 | 2015 | 2014 | 2013 | 2012 |
| Net Asset Value, Beginning of Period | $44.54 | $46.30 | $41.30 | $30.47 | $26.77 |
| Investment Operations | | | | | |
| Net Investment Income | . 942 | . 924 | .780 | . 638 | . 598 |
| Net Realized and Unrealized Gain (Loss) | | | | | |
| on Investments | 5.791 | (1.775) | 4.994 | 10.826 | 3.692 |
| Total from Investment Operations | 6.733 | (.851) | 5.774 | 11.464 | 4.290 |
| Distributions | | | | | |
| Dividends from Net Investment Income | (. 963) | (. 909) | (.774) | (. 634) | (. 590) |
| Distributions from Realized Capital Gains | — | — | — | — | — |
| Total Distributions | (. 963) | (. 909) | (.774) | (. 634) | (. 590) |
| Net Asset Value, End of Period | $50.31 | $44.54 | $46.30 | $41.30 | $30.47 |
| |
| Total Return1 | 15.26% | -1.80% | 13.98% | 37.66% | 16.02% |
| |
| Ratios/Supplemental Data | | | | | |
| Net Assets, End of Period (Millions) | $5,949 | $3,884 | $2,896 | $1,753 | $724 |
| Ratio of Total Expenses to Average Net Assets | 0.07% | 0.08% | 0.09% | 0.09% | 0.10% |
| Ratio of Net Investment Income to | | | | | |
| Average Net Assets | 2.14% | 2.13% | 2.00% | 1.95% | 2.35% |
| Portfolio Turnover Rate2 | 20% | 20% | 14% | 46% | 33% |
| 1 Total returns do not include account service fees that may have applied in the periods shown. Fund prospectuses provide information about |
| any applicable account service fees. |
| 2 Excludes the value of portfolio securities received or delivered as a result of in-kind purchases or redemptions of the fund’s capital shares, |
| including ETF Creation Units. |
See accompanying Notes, which are an integral part of the Financial Statements.
85
Mid-Cap Value Index Fund
Notes to Financial Statements
Vanguard Mid-Cap Value Index Fund is registered under the Investment Company Act of 1940 as an open-end investment company, or mutual fund. The fund offers three classes of shares: Investor Shares, ETF Shares and Admiral Shares. Investor Shares are available to any investor who meets the fund’s minimum purchase requirements. ETF Shares are listed for trading on NYSE Arca; they can be purchased and sold through a broker. Admiral Shares are designed for investors who meet certain administrative, service, and account-size criteria.
A. The following significant accounting policies conform to generally accepted accounting principles for U.S. investment companies. The fund consistently follows such policies in preparing its financial statements.
1. Security Valuation: Securities are valued as of the close of trading on the New York Stock Exchange (generally 4 p.m., Eastern time) on the valuation date. Equity securities are valued at the latest quoted sales prices or official closing prices taken from the primary market in which each security trades; such securities not traded on the valuation date are valued at the mean of the latest quoted bid and asked prices. Securities for which market quotations are not readily available, or whose values have been materially affected by events occurring before the fund’s pricing time but after the close of the securities’ primary markets, are valued by methods deemed by the board of trustees to represent fair value. Investments in Vanguard Market Liquidity Fund are valued at that fund’s net asset value. Temporary cash investments are valued using the latest bid prices or using valuations based on a matrix system (which considers such factors as security prices, yields, maturities, and ratings), both as furnished by independent pricing services.
2. Futures Contracts: The fund uses index futures contracts to a limited extent, with the objectives of maintaining full exposure to the stock market, enhancing returns, maintaining liquidity, and minimizing transaction costs. The fund may purchase futures contracts to immediately invest incoming cash in the market, or sell futures in response to cash outflows, thereby simulating a fully invested position in the underlying index while maintaining a cash balance for liquidity. The fund may seek to enhance returns by using futures contracts instead of the underlying securities when futures are believed to be priced more attractively than the underlying securities. The primary risks associated with the use of futures contracts are imperfect correlation between changes in market values of stocks held by the fund and the prices of futures contracts, and the possibility of an illiquid market. Counterparty risk involving futures is mitigated because a regulated clearinghouse is the counterparty instead of the clearing broker. To further mitigate counterparty risk, the fund trades futures contracts on an exchange, monitors the financial strength of its clearing brokers and clearinghouse, and has entered into clearing agreements with its clearing brokers. The clearinghouse imposes initial margin requirements to secure the fund’s performance and requires daily settlement of variation margin representing changes in the market value of each contract.
Futures contracts are valued at their quoted daily settlement prices. The aggregate settlement values of the contracts are not recorded in the Statement of Net Assets. Fluctuations in the value of the contracts are recorded in the Statement of Net Assets as an asset (liability) and in the Statement of Operations as unrealized appreciation (depreciation) until the contracts are closed, when they are recorded as realized futures gains (losses).
During the year ended December 31, 2016, the fund’s average investments in long and short futures contracts represented less than 1% and 0% of net assets, respectively, based on the average of aggregate settlement values at each quarter-end during the period.
86
Mid-Cap Value Index Fund
3. Federal Income Taxes: The fund intends to continue to qualify as a regulated investment company and distribute all of its taxable income. Management has analyzed the fund’s tax positions taken for all open federal income tax years (December 31, 2013–2016), and has concluded that no provision for federal income tax is required in the fund’s financial statements.
4. Distributions: Distributions to shareholders are recorded on the ex-dividend date.
5. Securities Lending: To earn additional income, the fund lends its securities to qualified institutional borrowers. Security loans are subject to termination by the fund at any time, and are required to be secured at all times by collateral in an amount at least equal to the market value of securities loaned. Daily market fluctuations could cause the value of loaned securities to be more or less than the value of the collateral received. When this occurs, the collateral is adjusted and settled on the next business day. The fund further mitigates its counterparty risk by entering into securities lending transactions only with a diverse group of prequalified counterparties, monitoring their financial strength, and entering into master securities lending agreements with its counterparties. The master securities lending agreements provide that, in the event of a counterparty’s default (including bankruptcy), the fund may terminate any loans with that borrower, determine the net amount owed, and sell or retain the collateral up to the net amount owed to the fund; however, such actions may be subject to legal proceedings. While collateral mitigates counterparty risk, in the absence of a default the fund may experience delays and costs in recovering the securities loaned. The fund invests cash collateral received in Vanguard Market Liquidity Fund, and records a liability in the Statement of Net Assets for the return of the collateral, during the period the securities are on loan. Securities lending income represents fees charged to borrowers plus income earned on invested cash collateral, less expenses associated with the loan. During the term of the loan, the fund is entitled to all distributions made on or in respect of the loaned securities.
6. Credit Facility: The fund and certain other funds managed by The Vanguard Group (“Vanguard”) participate in a $3.1 billion committed credit facility provided by a syndicate of lenders pursuant to a credit agreement that may be renewed annually; each fund is individually liable for its borrowings, if any, under the credit facility. Borrowings may be utilized for temporary and emergency purposes, and are subject to the fund’s regulatory and contractual borrowing restrictions. The participating funds are charged administrative fees and an annual commitment fee of 0.10% of the undrawn amount of the facility; these fees are allocated to the funds based on a method approved by the fund’s board of trustees and included in Management and Administrative expenses on the fund’s Statement of Operations. Any borrowings under this facility bear interest at a rate based upon the higher of the one-month London Interbank Offered Rate, federal funds effective rate, or overnight bank funding rate plus an agreed-upon spread.
The fund had no borrowings outstanding at December 31, 2016, or at any time during the period then ended.
7. Other: Dividend income is recorded on the ex-dividend date. Interest income includes income distributions received from Vanguard Market Liquidity Fund and is accrued daily. Premiums and discounts on debt securities purchased are amortized and accreted, respectively, to interest income over the lives of the respective securities. Security transactions are accounted for on the date securities are bought or sold. Costs used to determine realized gains (losses) on the sale of investment securities are those of the specific securities sold.
87
Mid-Cap Value Index Fund
Each class of shares has equal rights as to assets and earnings, except that each class separately bears certain class-specific expenses related to maintenance of shareholder accounts (included in Management and Administrative expenses) and shareholder reporting. Marketing and distribution expenses are allocated to each class of shares based on a method approved by the board of trustees. Income, other non-class-specific expenses, and gains and losses on investments are allocated to each class of shares based on its relative net assets.
B. In accordance with the terms of a Funds’ Service Agreement (the “FSA”) between Vanguard and the fund, Vanguard furnishes to the fund investment advisory, corporate management, administrative, marketing, and distribution services at Vanguard’s cost of operations (as defined by the FSA). These costs of operations are allocated to the fund based on methods and guidelines approved by the board of trustees. Vanguard does not require reimbursement in the current period for certain costs of operations (such as deferred compensation/benefits and risk/insurance costs); the fund’s liability for these costs of operations is included in Payables to Vanguard on the Statement of Net Assets.
Upon the request of Vanguard, the fund may invest up to 0.40% of its net assets as capital in Vanguard. At December 31, 2016, the fund had contributed to Vanguard capital in the amount of $939,000, representing 0.01% of the fund’s net assets and 0.38% of Vanguard’s capitalization. The fund’s trustees and officers are also directors and employees, respectively, of Vanguard.
C. Various inputs may be used to determine the value of the fund’s investments. These inputs are summarized in three broad levels for financial statement purposes. The inputs or methodologies used to value securities are not necessarily an indication of the risk associated with investing in those securities.
Level 1—Quoted prices in active markets for identical securities.
Level 2—Other significant observable inputs (including quoted prices for similar securities, interest rates, prepayment speeds, credit risk, etc.).
Level 3—Significant unobservable inputs (including the fund’s own assumptions used to determine the fair value of investments).
The following table summarizes the market value of the fund’s investments as of December 31, 2016, based on the inputs used to value them:
| | | |
| | Level 1 | Level 2 | Level 3 |
| Investments | ($000) | ($000) | ($000) |
| Common Stocks | 12,977,007 | — | — |
| Temporary Cash Investments | 60,536 | 4,999 | — |
| Futures Contracts—Liabilities1 | (149) | — | — |
| Total | 13,037,394 | 4,999 | — |
| 1 Represents variation margin on the last day of the reporting period. |
88
Mid-Cap Value Index Fund
D. At December 31, 2016, the aggregate settlement value of open futures contracts and the related
unrealized appreciation (depreciation) were:
| | | | |
| | | | ($000) |
| | | | Aggregate | |
| | | Number of | Settlement | Unrealized |
| | | Long (Short) | Value | Appreciation |
| Futures Contracts | Expiration | Contracts | Long (Short) | (Depreciation) |
| E-mini S&P 500 Index | March 2017 | 140 | 15,653 | (118) |
| E-mini S&P MidCap 400 Index | March 2017 | 41 | 6,802 | (131) |
| | | | | (249) |
Unrealized appreciation (depreciation) on open futures contracts is required to be treated as realized gain (loss) for tax purposes.
E. Distributions are determined on a tax basis and may differ from net investment income and realized capital gains for financial reporting purposes. Differences may be permanent or temporary. Permanent differences are reclassified among capital accounts in the financial statements to reflect their tax character. Temporary differences arise when certain items of income, expense, gain, or loss are recognized in different periods for financial statement and tax purposes. These differences will reverse at some time in the future. Differences in classification may also result from the treatment of short-term gains as ordinary income for tax purposes.
During the year ended December 31, 2016, the fund realized $578,156,000 of net capital gains resulting from in-kind redemptions—in which shareholders exchanged fund shares for securities held by the fund rather than for cash. Because such gains are not taxable to the fund, and are not distributed to shareholders, they have been reclassified from accumulated net realized losses to paid-in capital.
For tax purposes, at December 31, 2016, the fund had $1,714,000 of ordinary income available for distribution. At December 31, 2016, the fund had available capital losses totaling $497,430,000 to offset future net capital gains. Of this amount, $4,037,000 is subject to expiration on December 31, 2018. Capital losses of $493,393,000 realized beginning in fiscal 2012 may be carried forward indefinitely under the Regulated Investment Company Modernization Act of 2010, but must be used before any expiring loss carryforwards.
At December 31, 2016, the cost of investment securities for tax purposes was $11,339,469,000. Net unrealized appreciation of investment securities for tax purposes was $1,703,073,000, consisting of unrealized gains of $2,002,207,000 on securities that had risen in value since their purchase and $299,134,000 in unrealized losses on securities that had fallen in value since their purchase.
F. During the year ended December 31, 2016, the fund purchased $6,520,750,000 of investment securities and sold $3,668,757,000 of investment securities, other than temporary cash investments. Purchases and sales include $2,609,330,000 and $1,527,892,000, respectively, in connection with in-kind purchases and redemptions of the fund’s capital shares.
The fund purchased securities from and sold securities to other Vanguard funds or accounts managed by Vanguard or its affiliates, in accordance with procedures adopted by the board of trustees in compliance with Rule 17a-7 of the Investment Company Act of 1940. For the year ended December 31, 2016, such purchases and sales were $397,678,000 and $552,730,000, respectively; these amounts are included in the purchases and sales of investment securities noted above.
89
Mid-Cap Value Index Fund
G. Capital share transactions for each class of shares were:
| | | | |
| | Year Ended December 31, |
| | 2016 | 2015 |
| | Amount | Shares | Amount | Shares |
| | ($000) | (000) | ($000) | (000) |
| Investor Shares | | | | |
| Issued | 264,163 | 7,498 | 252,836 | 7,160 |
| Issued in Lieu of Cash Distributions | 11,559 | 319 | 11,039 | 331 |
| Redeemed | (271,879) | (7,784) | (281,109) | (7,951) |
| Net Increase (Decrease)—Investor Shares | 3,843 | 33 | (17,234) | (460) |
| ETF Shares | | | | |
| Issued | 2,771,953 | 30,304 | 2,585,412 | 28,956 |
| Issued in Lieu of Cash Distributions | — | — | — | — |
| Redeemed | (1,376,925) | (15,175) | (1,479,390) | (16,475) |
| Net Increase (Decrease)—ETF Shares | 1,395,028 | 15,129 | 1,106,022 | 12,481 |
| Admiral Shares | | | | |
| Issued | 2,478,125 | 53,386 | 1,833,183 | 39,490 |
| Issued in Lieu of Cash Distributions | 92,986 | 1,947 | 65,747 | 1,498 |
| Redeemed | (1,129,572) | (24,259) | (760,338) | (16,347) |
| Net Increase (Decrease)—Admiral Shares | 1,441,539 | 31,074 | 1,138,592 | 24,641 |
H. Management has determined that no material events or transactions occurred subsequent to December 31, 2016, that would require recognition or disclosure in these financial statements.
90
Report of Independent Registered
Public Accounting Firm
To the Board of Trustees of Vanguard Index Funds and the Shareholders of Vanguard Extended Market Index Fund, Vanguard Mid-Cap Index Fund, Vanguard Mid-Cap Growth Index Fund and Vanguard Mid-Cap Value Index Fund:
In our opinion, the accompanying statements of net assets, statement of net assets—investments summary and the related statements of operations and of changes in net assets and the financial highlights present fairly, in all material respects, the financial position of Vanguard Extended Market Index Fund, Vanguard Mid-Cap Index Fund, Vanguard Mid-Cap Growth Index Fund and Vanguard Mid-Cap Value Index Fund (constituting separate portfolios of Vanguard Index Funds, hereafter referred to as the “Funds”) at December 31, 2016, the results of each of their operations for the year then ended, the changes in each of their net assets for each of the two years in the period then ended, and the financial highlights for each of the periods indicated, in conformity with accounting principles generally accepted in the United States of America. These financial statements and financial highlights (hereafter referred to as “financial statements”) are the responsibility of the Funds’ management. Our responsibility is to express an opinion on these financial statements based on our audits. We conducted our audits of these financial statements in accordance with the standards of the Public Company Accounting Oversight Board (United States). Those standards require that we plan and perform the audit to obtain reasonable assurance about whether the financial statements are free of material misstatement. An audit includes examining, on a test basis, evidence supporting the amounts and disclosures in the financial statements, assessing the accounting principles used and significant estimates made by management, and evaluating the overall financial statement presentation. We believe that our audits, which included confirmation of securities at December 31, 2016 by correspondence with the custodians and brokers and by agreement to the underlying ownership records of the transfer agent, provide a reasonable basis for our opinion.
/s/PricewaterhouseCoopers LLP
Philadelphia, Pennsylvania
February 13, 2017
91

Special 2016 tax information (unaudited) for Vanguard U.S. Stock Index Funds
(Mid-Capitalization Portfolios)
This information for the fiscal year ended December 31, 2016, is included pursuant to provisions of
the Internal Revenue Code.
The funds distributed qualified dividend income to shareholders during the fiscal year as follows:
| |
| Fund | ($000) |
| Extended Market Index Fund | 479,064 |
| Mid-Cap Index Fund | 959,343 |
| Mid-Cap Growth Index Fund | 48,396 |
| Mid-Cap Value Index Fund | 210,852 |
For corporate shareholders, the percentage of investment income (dividend income plus short-term gains, if any) that qualifies for the dividends-received deduction is as follows:
| |
| Fund | Percentage |
| Extended Market Index Fund | 63.0% |
| Mid-Cap Index Fund | 80.7 |
| Mid-Cap Growth Index Fund | 71.9 |
| Mid-Cap Value Index Fund | 83.2 |
92
Your Fund’s After-Tax Returns
This table presents returns for your fund both before and after taxes. The after-tax returns are shown in two ways: (1) assuming that an investor owned the fund during the entire period and paid taxes on the fund’s distributions, and (2) assuming that an investor paid taxes on the fund’s distributions and sold all shares at the end of each period.
Calculations are based on the highest individual federal income tax and capital gains tax rates in effect at the times of the distributions and the hypothetical sales. State and local taxes were not considered. After-tax returns reflect any qualified dividend income. (In the example, returns after the sale of fund shares may be higher than those assuming no sale. This occurs when the sale would have produced a capital loss. The calculation assumes that the investor received a tax deduction for the loss.)
The table shows returns for Investor Shares only; returns for other share classes will differ. Please note that your actual after-tax returns will depend on your tax situation and may differ from those shown. Also note that if you own the fund in a tax-deferred account, such as an individual retirement account or a 401(k) plan, this information does not apply to you. Such accounts are not subject to current taxes.
Finally, keep in mind that a fund’s performance—whether before or after taxes—does not guarantee future results.
| | | |
| Average Annual Total Returns: U.S. Stock Index Funds Mid-Capitalization Portfolios | |
| Periods Ended December 31, 2016 | | | |
| |
| | One | Five | Ten |
| | Year | Years | Years |
| Extended Market Index Fund Investor Shares | | | |
| Returns Before Taxes | 15.99% | 14.50% | 7.80% |
| Returns After Taxes on Distributions | 15.50 | 14.11 | 7.50 |
| Returns After Taxes on Distributions and Sale of Fund Shares | 9.23 | 11.57 | 6.26 |
| | | |
| | One | Five | Ten |
| | Year | Years | Years |
| Mid-Cap Index Fund Investor Shares | | | |
| Returns Before Taxes | 11.07% | 14.22% | 7.52% |
| Returns After Taxes on Distributions | 10.67 | 13.88 | 7.24 |
| Returns After Taxes on Distributions and Sale of Fund Shares | 6.51 | 11.39 | 6.06 |
| | | |
| | One | Five | Ten |
| | Year | Years | Years |
| Mid-Cap Growth Index Fund Investor Shares | | | |
| Returns Before Taxes | 6.62% | 12.81% | 7.20% |
| Returns After Taxes on Distributions | 6.41 | 12.64 | 7.09 |
| Returns After Taxes on Distributions and Sale of Fund Shares | 3.86 | 10.24 | 5.83 |
93
| | | |
| Average Annual Total Returns: U.S. Stock Index Funds Mid-Capitalization Portfolios | |
| Periods Ended December 31, 2016 | | | |
| |
| | One | Five | Ten |
| | Year | Years | Years |
| Mid-Cap Value Index Fund Investor Shares | | | |
| Returns Before Taxes | 15.11% | 15.41% | 7.53% |
| Returns After Taxes on Distributions | 14.56 | 14.94 | 7.11 |
| Returns After Taxes on Distributions and Sale of Fund Shares | 8.90 | 12.37 | 6.02 |
94
About Your Fund’s Expenses
As a shareholder of the fund, you incur ongoing costs, which include costs for portfolio management, administrative services, and shareholder reports (like this one), among others. Operating expenses, which are deducted from a fund’s gross income, directly reduce the investment return of the fund.
A fund’s expenses are expressed as a percentage of its average net assets. This figure is known as the expense ratio. The following examples are intended to help you understand the ongoing costs (in dollars) of investing in your fund and to compare these costs with those of other mutual funds. The examples are based on an investment of $1,000 made at the beginning of the period shown and held for the entire period.
The accompanying table illustrates your fund’s costs in two ways:
• Based on actual fund return. This section helps you to estimate the actual expenses that you paid over the period. The ”Ending Account Value“ shown is derived from the fund‘s actual return, and the third column shows the dollar amount that would have been paid by an investor who started with $1,000 in the fund. You may use the information here, together with the amount you invested, to estimate the expenses that you paid over the period.
To do so, simply divide your account value by $1,000 (for example, an $8,600 account value divided by $1,000 = 8.6), then multiply the result by the number given for your fund under the heading ”Expenses Paid During Period.“
• Based on hypothetical 5% yearly return. This section is intended to help you compare your fund‘s costs with those of other mutual funds. It assumes that the fund had a yearly return of 5% before expenses, but that the expense ratio is unchanged. In this case—because the return used is not the fund’s actual return—the results do not apply to your investment. The example is useful in making comparisons because the Securities and Exchange Commission requires all mutual funds to calculate expenses based on a 5% return. You can assess your fund’s costs by comparing this hypothetical example with the hypothetical examples that appear in shareholder reports of other funds.
Note that the expenses shown in the table are meant to highlight and help you compare ongoing costs only and do not reflect transaction costs incurred by the fund for buying and selling securities. Further, the expenses do not include any purchase, redemption, or account service fees described in the fund prospectus. If such fees were applied to your account, your costs would be higher. Your fund does not carry a “sales load.”
The calculations assume no shares were bought or sold during the period. Your actual costs may have been higher or lower, depending on the amount of your investment and the timing of any purchases or redemptions.
You can find more information about the fund’s expenses, including annual expense ratios, in the Financial Statements section of this report. For additional information on operating expenses and other shareholder costs, please refer to your fund’s current prospectus.
95
| | | |
| Six Months Ended December 31, 2016 | | | |
| | Beginning | Ending | Expenses |
| | Account Value | Account Value | Paid During |
| | 6/30/2016 | 12/31/2016 | Period |
| Based on Actual Fund Return | | | |
| Extended Market Index Fund | | | |
| Investor Shares | $1,000.00 | $1,132.16 | $1.07 |
| ETF Shares | 1,000.00 | 1,133.08 | 0.38 |
| Admiral Shares | 1,000.00 | 1,132.81 | 0.38 |
| Institutional Shares | 1,000.00 | 1,132.92 | 0.27 |
| Institutional Plus Shares | 1,000.00 | 1,133.04 | 0.27 |
| Institutional Select Shares | 1,000.00 | 1,133.15 | 0.11 |
| Mid-Cap Index Fund | | | |
| Investor Shares | $1,000.00 | $1,073.74 | $0.83 |
| ETF Shares | 1,000.00 | 1,074.34 | 0.26 |
| Admiral Shares | 1,000.00 | 1,074.37 | 0.26 |
| Institutional Shares | 1,000.00 | 1,074.30 | 0.21 |
| Institutional Plus Shares | 1,000.00 | 1,074.41 | 0.16 |
| Mid-Cap Growth Index Fund | | | |
| Investor Shares | $1,000.00 | $1,040.63 | $0.92 |
| ETF Shares | 1,000.00 | 1,041.49 | 0.31 |
| Admiral Shares | 1,000.00 | 1,041.59 | 0.31 |
| Mid-Cap Value Index Fund | | | |
| Investor Shares | $1,000.00 | $1,102.73 | $0.95 |
| ETF Shares | 1,000.00 | 1,103.37 | 0.32 |
| Admiral Shares | 1,000.00 | 1,103.30 | 0.32 |
96
| | | |
| Six Months Ended December 31, 2016 | | | |
| | Beginning | Ending | Expenses |
| | Account Value | Account Value | Paid During |
| | 6/30/2016 | 12/31/2016 | Period |
| Based on Hypothetical 5% Yearly Return | | | |
| Extended Market Index Fund | | | |
| Investor Shares | $1,000.00 | $1,024.13 | $1.02 |
| ETF Shares | 1,000.00 | 1,024.78 | 0.36 |
| Admiral Shares | 1,000.00 | 1,024.78 | 0.36 |
| Institutional Shares | 1,000.00 | 1,024.89 | 0.25 |
| Institutional Plus Shares | 1,000.00 | 1,024.89 | 0.25 |
| Institutional Select Shares | 1,000.00 | 1,025.04 | 0.10 |
| Mid-Cap Index Fund | | | |
| Investor Shares | $1,000.00 | $1,024.33 | $0.81 |
| ETF Shares | 1,000.00 | 1,024.89 | 0.25 |
| Admiral Shares | 1,000.00 | 1,024.89 | 0.25 |
| Institutional Shares | 1,000.00 | 1,024.94 | 0.20 |
| Institutional Plus Shares | 1,000.00 | 1,024.99 | 0.15 |
| Mid-Cap Growth Index Fund | | | |
| Investor Shares | $1,000.00 | $1,024.23 | $0.92 |
| ETF Shares | 1,000.00 | 1,024.84 | 0.31 |
| Admiral Shares | 1,000.00 | 1,024.84 | 0.31 |
| Mid-Cap Value Index Fund | | | |
| Investor Shares | $1,000.00 | $1,024.23 | $0.92 |
| ETF Shares | 1,000.00 | 1,024.84 | 0.31 |
| Admiral Shares | 1,000.00 | 1,024.84 | 0.31 |
The calculations are based on expenses incurred in the most recent six-month period. The funds’ annualized six-month expense ratios for that
period are: for the Extended Market Index Fund, 0.20% for Investor Shares, 0.07% for ETF Shares, 0.07% for Admiral Shares, 0.05% for
Institutional Shares, 0.05% for Institutional Plus Shares, and 0.02% for Institutional Select Shares (since inception); for the Mid-Cap Index
Fund, 0.16% for Investor Shares, 0.05% for ETF Shares, 0.05% for Admiral Shares, 0.04% for Institutional Shares, and 0.03% for Institutional
Plus Shares; for the Mid-Cap Growth Index Fund, 0.18% for Investor Shares, 0.06% for ETF Shares, and 0.06% for Admiral Shares; and for the
Mid-Cap Value Index Fund, 0.18% for Investor Shares, 0.06% for ETF Shares, and 0.06% for Admiral Shares. The dollar amounts shown as
“Expenses Paid” are equal to the annualized expense ratio multiplied by the average account value over the period, multiplied by the number
of days in the most recent six-month period, then divided by the number of days in the most recent 12-month period (184/366).
97
Glossary
30-Day SEC Yield. A fund’s 30-day SEC yield is derived using a formula specified by the U.S. Securities and Exchange Commission. Under the formula, data related to the fund’s security holdings in the previous 30 days are used to calculate the fund’s hypothetical net income for that period, which is then annualized and divided by the fund’s estimated average net assets over the calculation period. For the purposes of this calculation, a security’s income is based on its current market yield to maturity (for bonds), its actual income (for asset-backed securities), or its projected dividend yield (for stocks). Because the SEC yield represents hypothetical annualized income, it will differ—at times significantly—from the fund’s actual experience. As a result, the fund’s income distributions may be higher or lower than implied by the SEC yield.
Beta. A measure of the magnitude of a fund’s past share-price fluctuations in relation to the ups and downs of a given market index. The index is assigned a beta of 1.00. Compared with a given index, a fund with a beta of 1.20 typically would have seen its share price rise or fall by 12% when the index rose or fell by 10%. For this report, beta is based on returns over the past 36 months for both the fund and the index. Note that a fund’s beta should be reviewed in conjunction with its R-squared (see definition). The lower the R-squared, the less correlation there is between the fund and the index, and the less reliable beta is as an indicator of volatility.
Dividend Yield. Dividend income earned by stocks, expressed as a percentage of the aggregate market value (or of net asset value, for a fund). The yield is determined by dividing the amount of the annual dividends by the aggregate value (or net asset value) at the end of the period. For a fund, the dividend yield is based solely on stock holdings and does not include any income produced by other investments.
Earnings Growth Rate. The average annual rate of growth in earnings over the past five years for the stocks now in a fund.
Equity Exposure. A measure that reflects a fund’s investments in stocks and stock futures. Any holdings in short-term reserves are excluded.
Expense Ratio. A fund’s total annual operating expenses expressed as a percentage of the fund’s average net assets. The expense ratio includes management and administrative expenses, but does not include the transaction costs of buying and selling portfolio securities.
Foreign Holdings. The percentage of a fund represented by securities or depositary receipts of companies based outside the United States.
Inception Date. The date on which the assets of a fund (or one of its share classes) are first invested in accordance with the fund’s investment objective. For funds with a subscription period, the inception date is the day after that period ends. Investment performance is measured from the inception date.
Median Market Cap. An indicator of the size of companies in which a fund invests; the midpoint of market capitalization (market price x shares outstanding) of a fund’s stocks, weighted by the proportion of the fund’s assets invested in each stock. Stocks representing half of the fund’s assets have market capitalizations above the median, and the rest are below it.
Price/Book Ratio. The share price of a stock divided by its net worth, or book value, per share. For a fund, the weighted average price/book ratio of the stocks it holds.
98
Price/Earnings Ratio. The ratio of a stock’s current price to its per-share earnings over the past year. For a fund, the weighted average P/E of the stocks it holds. P/E is an indicator of market expectations about corporate prospects; the higher the P/E, the greater the expectations for a company’s future growth.
R-Squared. A measure of how much of a fund’s past returns can be explained by the returns from the market in general, as measured by a given index. If a fund’s total returns were precisely synchronized with an index’s returns, its R-squared would be 1.00. If the fund’s returns bore no relationship to the index’s returns, its R-squared would be 0. For this report, R-squared is based on returns over the past 36 months for both the fund and the index.
Return on Equity. The annual average rate of return generated by a company during the past five years for each dollar of shareholder’s equity (net income divided by shareholder’s equity). For a fund, the weighted average return on equity for the companies whose stocks it holds.
Short-Term Reserves. The percentage of a fund invested in highly liquid, short-term securities that can be readily converted to cash.
Turnover Rate. An indication of the fund’s trading activity. Funds with high turnover rates incur higher transaction costs and may be more likely to distribute capital gains (which may be taxable to investors). The turnover rate excludes in-kind transactions, which have minimal impact on costs.
Benchmark Information
Spliced Mid-Cap Growth Index: MSCI US Mid Cap Growth Index through April 16, 2013; CRSP US
Mid Cap Growth Index thereafter.
Spliced Mid-Cap Index: S&P MidCap 400 Index through May 16, 2003; MSCI US Mid Cap 450
Index through January 30, 2013; CRSP US Mid Cap Index thereafter.
Spliced Mid-Cap Value Index: MSCI US Mid Cap Value Index through April 16, 2013; CRSP US Mid
Cap Value Index thereafter.
99
This page intentionally left blank.
This page intentionally left blank.
This page intentionally left blank.
This page intentionally left blank.
The People Who Govern Your Fund
The trustees of your mutual fund are there to see that the fund is operated and managed in your best interests since, as a shareholder, you are a part owner of the fund. Your fund’s trustees also serve on the board of directors of The Vanguard Group, Inc., which is owned by the Vanguard funds and provides services to them on an at-cost basis.
A majority of Vanguard’s board members are independent, meaning that they have no affiliation with Vanguard or the funds they oversee, apart from the sizable personal investments they have made as private individuals. The independent board members have distinguished backgrounds in business, academia, and public service. Each of the trustees and executive officers oversees 198 Vanguard funds.
The following table provides information for each trustee and executive officer of the fund. The mailing address of the trustees and officers is P.O. Box 876, Valley Forge, PA 19482. More information about the trustees is in the Statement of Additional Information, which can be obtained, without charge, by contacting Vanguard at 800-662-7447, or online at vanguard.com.
InterestedTrustee1
F. William McNabb III
Born 1957. Trustee Since July 2009. Chairman of the Board. Principal Occupation(s) During the Past Five Years and Other Experience: Chairman of the Board of The Vanguard Group, Inc., and of each of the investment companies served by The Vanguard Group, since January 2010; Director of The Vanguard Group since 2008; Chief Executive Officer and President of The Vanguard Group, and of each of the investment companies served by The Vanguard Group, since 2008; Director of Vanguard Marketing Corporation; Managing Director of The Vanguard Group (1995–2008).
IndependentTrustees
Emerson U. Fullwood
Born 1948. Trustee Since January 2008. Principal Occupation(s) During the Past Five Years and Other Experience: Executive Chief Staff and Marketing Officer for North America and Corporate Vice President (retired 2008) of Xerox Corporation (document management products and services); Executive in Residence and 2009–2010 Distinguished Minett Professor at the Rochester Institute of Technology; Lead Director of SPX FLOW, Inc. (multi-industry manufacturing); Director of the United Way of Rochester, the University of Rochester Medical Center, Monroe Community College Foundation, North Carolina A&T University, and Roberts Wesleyan College.
Rajiv L. Gupta
Born 1945. Trustee Since December 2001.2 Principal Occupation(s) During the Past Five Years and Other Experience: Chairman and Chief Executive Officer (retired 2009) and President (2006–2008) of Rohm and Haas Co. (chemicals); Director of Tyco International plc (diversified manufacturing and services), HP Inc. (printer and personal computer manufacturing), and Delphi Automotive plc (automotive components); Senior Advisor at New Mountain Capital.
Amy Gutmann
Born 1949. Trustee Since June 2006. Principal Occupation(s) During the Past Five Years and Other Experience: President of the University of Pennsylvania; Christopher H. Browne Distinguished Professor of Political Science, School of Arts and Sciences, and Professor of Communication, Annenberg School for Communication, with secondary faculty appointments in the Department of Philosophy, School of Arts and Sciences, and at the Graduate School of Education, University of Pennsylvania; Trustee of the National Constitution Center; Chair of the Presidential Commission for the Study of Bioethical Issues.
JoAnn Heffernan Heisen
Born 1950. Trustee Since July 1998. Principal Occupation(s) During the Past Five Years and Other Experience: Corporate Vice President and Chief Global Diversity Officer (retired 2008) and Member of the Executive Committee (1997–2008) of Johnson & Johnson (pharmaceuticals/medical devices/consumer products); Director of Skytop Lodge Corporation (hotels) and the Robert Wood Johnson Foundation; Member of the Advisory Board of the Institute for Women’s Leadership at Rutgers University.
F. Joseph Loughrey
Born 1949. Trustee Since October 2009. Principal Occupation(s) During the Past Five Years and Other Experience: President and Chief Operating Officer (retired 2009) of Cummins Inc. (industrial machinery); Chairman of the Board of Hillenbrand, Inc. (specialized consumer services), and of Oxfam America; Director of SKF AB (industrial machinery), Hyster-Yale Materials Handling, Inc. (forklift trucks), the Lumina Foundation for Education, and the V Foundation for Cancer Research; Member of the Advisory Council for the College of Arts and Letters and of the Advisory Board to the Kellogg Institute for International Studies, both at the University of Notre Dame.
Mark Loughridge
Born 1953. Trustee Since March 2012. Principal Occupation(s) During the Past Five Years and Other Experience: Senior Vice President and Chief Financial Officer (retired 2013) at IBM (information technology services); Fiduciary Member of IBM’s Retirement Plan Committee (2004–2013); Director of the Dow Chemical Company; Member of the Council on Chicago Booth.
Scott C. Malpass
Born 1962. Trustee Since March 2012. Principal Occupation(s) During the Past Five Years and Other Experience: Chief Investment Officer and Vice President at the University of Notre Dame; Assistant Professor of Finance at the Mendoza College of Business at Notre Dame; Member of the Notre Dame 403(b) Investment Committee, the Board of Advisors for Spruceview Capital Partners, and the Investment Advisory Committee of Major League Baseball; Board Member of TIFF Advisory Services, Inc., and Catholic Investment Services, Inc. (investment advisors).
André F. Perold
Born 1952. Trustee Since December 2004. Principal Occupation(s) During the Past Five Years and Other Experience: George Gund Professor of Finance and Banking, Emeritus at the Harvard Business School (retired 2011); Chief Investment Officer and Managing Partner of HighVista Strategies LLC (private investment firm); Director of Rand Merchant Bank; Overseer of the Museum of Fine Arts Boston.
Peter F. Volanakis
Born 1955. Trustee Since July 2009. Principal Occupation(s) During the Past Five Years and Other Experience: President and Chief Operating Officer (retired 2010) of Corning Incorporated (communications equipment); Chairman of the Board of Trustees of Colby-Sawyer College; Member of the Advisory Board of the Norris Cotton Cancer Center.
Executive Officers
Glenn Booraem
Born 1967. Treasurer Since May 2015. Principal Occupation(s) During the Past Five Years and Other Experience: Principal of The Vanguard Group, Inc.; Treasurer of each of the investment companies served by The Vanguard Group; Controller of each of the investment companies served by The Vanguard Group (2010–2015); Assistant Controller of each of the investment companies served by The Vanguard Group (2001–2010).
Thomas J. Higgins
Born 1957. Chief Financial Officer Since September 2008. Principal Occupation(s) During the Past Five Years and Other Experience: Principal of The Vanguard Group, Inc.; Chief Financial Officer of each of the investment companies served by The Vanguard Group; Treasurer of each of the investment companies served by The Vanguard Group (1998–2008).
Peter Mahoney
Born 1974. Controller Since May 2015. Principal Occupation(s) During the Past Five Years and Other Experience: Head of Global Fund Accounting at The Vanguard Group, Inc.; Controller of each of the investment companies served by The Vanguard Group; Head of International Fund Services at The Vanguard Group (2008–2014).
Anne E. Robinson
Born 1970. Secretary Since September 2016. Principal Occupation(s) During the Past Five Years and Other Experience: Managing Director of The Vanguard Group, Inc.; General Counsel of The Vanguard Group; Secretary of The Vanguard Group and of each of the investment companies served by The Vanguard Group; Director and Senior Vice President of Vanguard Marketing Corporation; Managing Director and General Counsel of Global Cards and Consumer Services at Citigroup (2014–2016); Counsel at American Express (2003–2014).
| |
| Vanguard Senior Management Team |
| Mortimer J. Buckley | Thomas M. Rampulla |
| Martha G. King | Glenn W. Reed |
| John T. Marcante | Karin A. Risi |
| Chris D. McIsaac | Michael Rollings |
| James M. Norris | |
| |
| Chairman Emeritus and Senior Advisor |
| John J. Brennan | |
| Chairman, 1996–2009 | |
| Chief Executive Officer and President, 1996–2008 |
| |
| Founder | |
| John C. Bogle | |
| Chairman and Chief Executive Officer, 1974–1996 |
1 Mr. McNabb is considered an “interested person,” as defined in the Investment Company Act of 1940, because he is an officer of the Vanguard funds.
2 December 2002 for Vanguard Equity Income Fund, the Vanguard Municipal Bond Funds, and the Vanguard State Tax-Exempt Funds.
|  |
| | P.O. Box 2600 |
| | Valley Forge, PA 19482-2600 |
| |
| |
| |
| Connect with Vanguard® > vanguard.com |
| |
| |
| |
| Fund Information > 800-662-7447 | The index is a product of S&P Dow Jones Indices LLC |
| Direct Investor Account Services > 800-662-2739 | (“SPDJI”), and has been licensed for use by Vanguard. |
| | Standard & Poor’s® and S&P® are registered |
| Institutional Investor Services > 800-523-1036 | trademarks of Standard & Poor’s Financial Services LLC |
| Text Telephone for People | (“S&P”); Dow Jones® is a registered trademark of Dow |
| Who Are Deaf or Hard of Hearing > 800-749-7273 | Jones Trademark Holdings LLC (“Dow Jones”); S&P® |
| | and S&P 500® are trademarks of S&P; and these |
| This material may be used in conjunction | trademarks have been licensed for use by SPDJI and |
| with the offering of shares of any Vanguard | sublicensed for certain purposes by Vanguard. |
| fund only if preceded or accompanied by | Vanguard product(s) are not sponsored, endorsed, sold |
| | or promoted by SPDJI, Dow Jones, S&P, or their |
| the fund’s current prospectus. | respective affiliates and none of such parties make any |
| All comparative mutual fund data are from Lipper, a | representation regarding the advisability of investing in |
| Thomson Reuters Company, or Morningstar, Inc., unless | such product(s) nor do they have any liability for any |
| otherwise noted. | errors, omissions, or interruptions of the index. |
| |
| You can obtain a free copy of Vanguard’s proxy voting | |
| guidelines by visiting vanguard.com/proxyreporting or by | |
| calling Vanguard at 800-662-2739. The guidelines are | |
| also available from the SEC’s website, sec.gov. In | |
| addition, you may obtain a free report on how your fund | |
| voted the proxies for securities it owned during the 12 | |
| months ended June 30. To get the report, visit either | |
| vanguard.com/proxyreporting or sec.gov. | |
| |
| You can review and copy information about your fund at | |
| the SEC’s Public Reference Room in Washington, D.C. To | |
| find out more about this public service, call the SEC at | |
| 202-551-8090. Information about your fund is also | |
| available on the SEC’s website, and you can receive | |
| copies of this information, for a fee, by sending a | |
| request in either of two ways: via email addressed to | |
| publicinfo@sec.gov or via regular mail addressed to the | |
| Public Reference Section, Securities and Exchange | |
| Commission, Washington, DC 20549-1520. | |
| |
| | © 2017 The Vanguard Group, Inc. |
| | All rights reserved. |
| | Vanguard Marketing Corporation, Distributor. |
| |
| | Q980 022017 |
Annual Report | December 31, 2016
Vanguard U.S. Stock Index Funds
Large-Capitalization Portfolios
Vanguard Growth Index Fund
Vanguard Value Index Fund
Vanguard Large-Cap Index Fund
A new format, unwavering commitment
As you begin reading this report, you’ll notice that we’ve made some improvements to the opening sections—based on feedback from you, our clients.
Page 1 starts with a new ”Your Fund’s Performance at a Glance,” a concise, handy summary of how your fund performed during the period.
In the renamed ”Chairman’s Perspective,” Bill McNabb will focus on enduring principles and investment insights.
We’ve modified some tables, and eliminated some redundancy, but we haven’t removed any information.
At Vanguard, we’re always looking for better ways to communicate and to help you make sound investment decisions. Thank you for entrusting your assets to us.
| |
| Contents | |
| Your Fund’s Performance at a Glance. | 1 |
| Chairman’s Perspective. | 4 |
| Growth Index Fund. | 8 |
| Value Index Fund. | 29 |
| Large-Cap Index Fund. | 50 |
| Your Fund’s After-Tax Returns. | 76 |
| About Your Fund’s Expenses. | 77 |
| Glossary. | 80 |
Please note: The opinions expressed in this report are just that—informed opinions. They should not be considered promises or advice.
Also, please keep in mind that the information and opinions cover the period through the date on the front of this report. Of course, the
risks of investing in your fund are spelled out in the prospectus.
See the Glossary for definitions of investment terms used in this report.
About the cover: No matter what language you speak, Vanguard has one consistent message and set of principles. Our primary
focus is on you, our clients. We conduct our business with integrity as a faithful steward of your assets. This message is shown
translated into seven languages, reflecting our expanding global presence.
Your Fund’s Performance at a Glance
• Returns ranged from nearly 17% for Vanguard Value Index Fund to about 6% for Vanguard Growth Index Fund. Vanguard Large-Cap Index Fund, which contains both growth and value stocks, returned more than 11%.
• All three funds closely tracked their target indexes and surpassed the average returns of their peers.
• Small-capitalization stocks outperformed their large- and mid-cap counterparts, and value stocks outpaced growth.
• Financial stocks were the top contributors for the Large-Cap Index Fund and the Value Index Fund. Technology stocks added most to the Growth Index Fund. Oil and gas and industrial holdings were among the best performers for all three funds. The health care sector produced negative results for the Growth Index Fund and the Large-Cap Index Fund.
• Over the past decade, all three funds posted returns in line with their benchmark indexes and ahead of the average return of their peers.
| |
| Total Returns: Fiscal Year Ended December 31, 2016 | |
| | Total |
| | Returns |
| Vanguard Growth Index Fund | |
| Investor Shares | 5.99% |
| ETF Shares | |
| Market Price | 6.17 |
| Net Asset Value | 6.13 |
| Admiral™ Shares | 6.12 |
| Institutional Shares | 6.13 |
| CRSP US Large Cap Growth Index | 6.16 |
| Large-Cap Growth Funds Average | 1.94 |
| Large-Cap Growth Funds Average: Derived from data provided by Lipper, a Thomson Reuters Company. |
1
| |
| | Total |
| | Returns |
| Vanguard Value Index Fund | |
| Investor Shares | 16.75% |
| ETF Shares | |
| Market Price | 16.95 |
| Net Asset Value | 16.88 |
| Admiral Shares | 16.86 |
| Institutional Shares | 16.87 |
| CRSP US Large Cap Value Index | 16.93 |
| Large-Cap Value Funds Average | 14.65 |
| Large-Cap Value Funds Average: Derived from data provided by Lipper, a Thomson Reuters Company. |
| |
| Vanguard Large-Cap Index Fund | |
| Investor Shares | 11.50% |
| ETF Shares | |
| Market Price | 11.73 |
| Net Asset Value | 11.65 |
| Admiral Shares | 11.65 |
| Institutional Shares | 11.66 |
| CRSP US Large Cap Index | 11.75 |
| Large-Cap Core Funds Average | 9.92 |
| Large-Cap Core Funds Average: Derived from data provided by Lipper, a Thomson Reuters Company. |
Admiral Shares carry lower expenses and are available to investors who meet certain account-balance requirements. Institutional Shares are
available to certain institutional investors who meet specific administrative, service, and account-size criteria. The Vanguard ETF® Shares
shown are traded on the NYSE Arca exchange and are available only through brokers. The table provides ETF returns based on both the NYSE
Arca market price and the net asset value for a share. U.S. Pat. Nos. 6,879,964; 7,337,138; 7,720,749; 7,925,573; 8,090,646; and 8,417,623.
For the ETF Shares, the market price is determined by the midpoint of the bid-offer spread as of the closing time of the New York Stock
Exchange (generally 4 p.m., Eastern time). The net asset value is also determined as of the NYSE closing time. For more information about
how the ETF Shares' market prices have compared with their net asset value, visit vanguard.com, select your ETF, and then select the Price
and Performance tab. The ETF premium/discount analysis there shows the percentages of days on which the ETF Shares' market price was
above or below the NAV.
| |
| Total Returns: Ten Years Ended December 31, 2016 | |
| | Average |
| | Annual Return |
| Growth Index Fund Investor Shares | 7.99% |
| Spliced Growth Index | 8.20 |
| Large-Cap Growth Funds Average | 6.58 |
| For a benchmark description, see the Glossary. |
| Large-Cap Growth Funds Average: Derived from data provided by Lipper, a Thomson Reuters Company. |
2
| |
| | Average |
| | Annual Return |
| Value Index Fund Investor Shares | 5.85% |
| Spliced Value Index | 6.00 |
| Large-Cap Value Funds Average | 4.96 |
| For a benchmark description, see the Glossary. |
| Large-Cap Value Funds Average: Derived from data provided by Lipper, a Thomson Reuters Company. |
| |
| Large-Cap Index Fund Investor Shares | 6.95% |
| Spliced Large Cap Index | 7.14 |
| Large-Cap Core Funds Average | 5.63 |
| For a benchmark description, see the Glossary. |
| Large-Cap Core Funds Average: Derived from data provided by Lipper, a Thomson Reuters Company. |
The figures shown represent past performance, which is not a guarantee of future results. (Current performance may be
lower or higher than the performance data cited. For performance data current to the most recent month-end, visit our
website at vanguard.com/performance.) Note, too, that both investment returns and principal value can fluctuate widely, so
an investor’s shares, when sold, could be worth more or less than their original cost.
| | | | | |
| Expense Ratios | | | | | |
| Your Fund Compared With Its Peer Group | | | | | |
| | Investor | ETF | Admiral | Institutional | Peer Group |
| | Shares | Shares | Shares | Shares | Average |
| Growth Index Fund | 0.22% | 0.08% | 0.08% | 0.07% | 1.17% |
| Value Index Fund | 0.22 | 0.08 | 0.08 | 0.07 | 1.10 |
| Large-Cap Index Fund | 0.20 | 0.08 | 0.08 | 0.07 | 1.11 |
The fund expense ratios shown are from the prospectus dated April 27, 2016, and represent estimated costs for the current fiscal year. For the
fiscal year ended December 31, 2016, the funds’ expense ratios were: for the Growth Index Fund, 0.18% for Investor Shares, 0.06% for ETF
Shares, 0.06% for Admiral Shares, and 0.05% for Institutional Shares; for the Value Index Fund, 0.18% for Investor Shares, 0.06% for ETF
Shares, 0.06% for Admiral Shares, and 0.05% for Institutional Shares; and for the Large-Cap Index Fund, 0.18% for Investor Shares, 0.06% for
ETF Shares, 0.06% for Admiral Shares, and 0.05% for Institutional Shares. The peer-group expense ratios are derived from data provided by
Lipper, a Thomson Reuters Company, and capture information through year-end 2015.
Peer groups: For the Growth Index Fund, Large-Cap Growth Funds; for the Value Index Fund, Large-Cap Value Funds; and for the Large-Cap
Index Fund, Large-Cap Core Funds.
3
Chairman’s Perspective

Bill McNabb
Chairman and Chief Executive Officer
Dear Shareholder,
If you’re like most investors, a big question on your mind is: What’s in store for the markets and the economy in 2017?
At Vanguard, we’re just as curious about the immediate future. But our curiosity is tempered by our belief that forecasts should give a range of possible outcomes, not pinpoint predictions. After all, there are bound to be occurrences the experts won’t see coming.
What really matters for investors
In 2016, we saw two cases in point: The United Kingdom’s June vote to exit the European Union and the November election of Donald Trump as U.S. president. Both unexpected outcomes triggered swift market reactions. But despite some short-term volatility, the markets’ 12-month performance as of December 31, 2016, proved to be less dramatic. U.S. stocks posted healthy returns, and U.S. bonds provided returns close to their long-term averages. International stocks and bonds also advanced, although returns for U.S. investors were reduced by the strength of the U.S. dollar.
The surprises of 2016 remind us to be skeptical of overly precise short-term predictions about 2017. At the cusp of a new year, market prognosticators forecast where the Standard & Poor’s 500 Index or the yield on the 10-year Treasury note will end up in 12 months. Such predictions can be attention-getting. They can also be dead wrong.
4
Investors are better off taking note of long-term trends that stand to influence our economies and markets. We’re watching these trends closely, and we discuss our latest assessment in our 2017 economic and market outlook, which you can read at vanguard.com/research.
Our global economic outlook: Expect stabilization, not stagnation
One phenomenon in particular that we’re watching is the low-growth, low-interest-rate environment that has marked the global economy since the 2008–09 financial crisis. We don’t think this economic backdrop is simply the result of cyclically weak demand or long-term stagnation. Instead, certain structural forces are contributing: Falling technology costs are restraining the amounts businesses are spending on capital investment, an aging population is weighing on growth in the developed world, and the free movement of capital and products across the globe has restrained prices and wages.
In the near term, these forces will continue to dampen growth, inflation, and interest rates. They also make it unlikely that further monetary stimulus from central banks will do much to spur growth.
I realize this all may sound gloomy, but that’s not how we see it. We expect global growth to stabilize at more modest levels, not stagnate. The world isn’t headed for Japanese-style deflation, in which a widespread sustained drop in prices puts economic activity into hibernation.
| | | |
| Market Barometer | | | |
| | | Average Annual Total Returns |
| | | Periods Ended December 31, 2016 |
| | One | Three | Five |
| | Year | Years | Years |
| Stocks | | | |
| Russell 1000 Index (Large-caps) | 12.05% | 8.59% | 14.69% |
| Russell 2000 Index (Small-caps) | 21.31 | 6.74 | 14.46 |
| Russell 3000 Index (Broad U.S. market) | 12.74 | 8.43 | 14.67 |
| FTSE All-World ex US Index (International) | 4.80 | -1.16 | 5.52 |
| |
| Bonds | | | |
| Bloomberg Barclays U.S. Aggregate Bond Index | | | |
| (Broad taxable market) | 2.65% | 3.03% | 2.23% |
| Bloomberg Barclays Municipal Bond Index | | | |
| (Broad tax-exempt market) | 0.25 | 4.14 | 3.28 |
| Citigroup Three-Month U.S. Treasury Bill Index | 0.27 | 0.09 | 0.08 |
| |
| CPI | | | |
| Consumer Price Index | 2.07% | 1.18% | 1.36% |
5
In fact, we believe that global growth could pick up modestly over time. Our expectation is based on a potential rebound in productivity as new digital technologies are used more effectively. We also anticipate a slight recovery in the labor force as the baby boom generation finishes its transition to retirement, nudging up demand for workers.
Put expansion in perspective
Looking to the United States, the world’s largest economy remains firmly on a long-term-growth path of about 2% per year. That’s lower than the historical average of 3.25% since 1950. We see such growth at this level as fundamentally sound, rather than abnormally low. Our evaluation takes into account lower U.S. population growth and the reality that the economic expansion from the 1980s until the financial crisis was fueled by debt, distorting the numbers.
Turning to prices, we think that core U.S. inflation should modestly exceed 2% in 2017. That, in turn, will support further interest rate hikes by the Federal Reserve, similar to the one at the end of 2016.
We expect the Fed to raise rates in 2017 before taking an extended pause, and we see the federal funds rate staying below 2% through at least 2018.
Prepare for muted returns
And what about prospects for the markets? Vanguard’s outlook for global stocks and bonds remains the most guarded in ten years, given fairly high stock valuations
|
| Expect more modest returns, rely on time-tested principles |
| |
| In Vanguard’s economic and market outlook for 2017, Global Chief Economist Joseph Davis |
| and his team offer a projection of more modest returns from the global stock and bond |
| markets. They caution that, over the next decade, returns for a balanced portfolio are likely |
| to be moderately below long-run historical averages. |
| |
| The team’s simulations indicate that for the decade ending in 2026, the average annualized |
| return of a 60% stock/40% bond portfolio is likely to be centered in the 3%–5% range after |
| inflation. That’s below the actual average after-inflation return of 6% for the same portfolio |
| for the nine decades since 1926. |
| |
| Ultimately, our global market outlook points toward a somewhat more challenging environment, |
| yet one in which, over time, investors with an appropriate level of discipline, diversification, and |
| patience are likely to be rewarded with reasonable inflation-adjusted returns. |
| |
| For more information about our expectations and the probability of various outcomes, see 2017 |
| Economic and Market Outlook: Stabilization, Not Stagnation, available at vanguard.com/research. |
| |
| |
| IMPORTANT: The projections and other information generated by the Vanguard Capital Markets Model® (VCMM) |
| regarding the likelihood of various investment outcomes are hypothetical in nature, do not reflect actual investment |
| results, and are not guarantees of future results. Distribution of return outcomes from the VCMM are derived |
| from 10,000 simulations for each modeled asset class. Simulations as of September 30, 2016. Results from the |
| model may vary with each use and over time. For more information, see the note at the end of this letter. |
6
and the low-interest-rate environment. We don’t expect global bond yields to increase materially from year-end 2016 levels.
Our outlook for global equities is annualized returns of 5%–8% over the next decade. This outlook isn’t bearish, but is actually fairly positive when you take into account the current low-rate environment. (See the box titled Expect more modest returns, rely on time-tested principles for more.)
Focus on the four keys to investment success
Significant trends often happen gradually. Like shifting tides, they’re sometimes barely noticeable at first but ultimately can change the landscape entirely. Other times, apparent trends can end up receding before they have much of a long-term impact. Given the future’s inherent unpredictability, it’s not reasonable to expect a surefire block-buster revelation from any prognosticator or investment firm.
What to conclude, then? No matter what scenario plays out, we believe investors have the best chance for success if they stay focused on what they can control: their goals, asset allocation, and investment costs, along with the discipline to stick to a plan. As Tim Buckley, our chief investment officer, likes to say, this can be easy to say but harder to do, especially in times of uncertainty. Investors who can stay focused on those four keys will find themselves well-positioned to weather any market.
As always, thank you for investing with Vanguard.
Sincerely,

F. William McNabb III
Chairman and Chief Executive Officer
January 16, 2017
IMPORTANT: The projections and other information generated by the Vanguard Capital Markets Model regarding
the likelihood of various investment outcomes are hypothetical in nature, do not reflect actual investment results,
and are not guarantees of future results. VCMM results will vary with each use and over time.
The VCMM projections are based on a statistical analysis of historical data. Future returns may behave differently from the
historical patterns captured in the VCMM. More important, the VCMM may be underestimating extreme negative scenarios
unobserved in the historical period on which the model estimation is based.
The VCMM is a proprietary financial simulation tool developed and maintained by Vanguard’s Investment Strategy Group.
The model forecasts distributions of future returns for a wide array of broad asset classes. Those asset classes include U.S.
and international equity markets, several maturities of the U.S. Treasury and corporate fixed income markets, international
fixed income markets, U.S. money markets, commodities, and certain alternative investment strategies. The theoretical and
empirical foundation for the Vanguard Capital Markets Model is that the returns of various asset classes reflect the compensation
investors require for bearing different types of systematic risk (beta). At the core of the model are estimates of the dynamic
statistical relationship between risk factors and asset returns, obtained from statistical analysis based on available monthly
financial and economic data. Using a system of estimated equations, the model then applies a Monte Carlo simulation method
to project the estimated interrelationships among risk factors and asset classes as well as uncertainty and randomness over
time. The model generates a large set of simulated outcomes for each asset class over several time horizons. Forecasts are
obtained by computing measures of central tendency in these simulations. Results produced by the tool will vary with each
use and over time.
7
Growth Index Fund
Fund Profile
As of December 31, 2016
| | | | |
| Share-Class Characteristics | | | | |
| | Investor | | Admiral | Institutional |
| | Shares | ETF Shares | Shares | Shares |
| Ticker Symbol | VIGRX | VUG | VIGAX | VIGIX |
| Expense Ratio1 | 0.22% | 0.08% | 0.08% | 0.07% |
| 30-Day SEC Yield | 1.35% | 1.46% | 1.46% | 1.47% |
| | | |
| Portfolio Characteristics | | |
| | | | DJ |
| | | | U.S. |
| | | CRSP US | Total |
| | | Large Cap | Market |
| | | Growth | FA |
| | Fund | Index | Index |
| Number of Stocks | 323 | 317 | 3,833 |
| Median Market Cap | $70.3B | $70.3B | $54.1B |
| Price/Earnings Ratio | 27.1x | 27.1x | 24.4x |
| Price/Book Ratio | 4.7x | 4.7x | 2.8x |
| Return on Equity | 20.8% | 20.3% | 16.5% |
| Earnings Growth Rate | 15.2% | 15.9% | 8.2% |
| Dividend Yield | 1.5% | 1.5% | 2.0% |
| Foreign Holdings | 0.0% | 0.0% | 0.0% |
| Turnover Rate | 11% | — | — |
| Short-Term Reserves | 0.0% | — | — |
| | | |
| Sector Diversification (% of equity exposure) |
| | | CRSP US | DJ |
| | | Large Cap | U.S. Total |
| | | Growth | Market |
| | Fund | Index | FA Index |
| Basic Materials | 1.0% | 1.0% | 2.6% |
| Consumer Goods | 11.1 | 11.1 | 9.6 |
| Consumer Services | 21.4 | 21.4 | 13.1 |
| Financials | 12.3 | 12.3 | 20.8 |
| Health Care | 13.8 | 13.8 | 12.2 |
| Industrials | 11.8 | 11.8 | 12.9 |
| Oil & Gas | 3.9 | 3.9 | 6.9 |
| Technology | 24.1 | 24.2 | 16.4 |
| Telecommunications | 0.6 | 0.5 | 2.4 |
| Utilities | 0.0 | 0.0 | 3.1 |
| | |
| Volatility Measures | | |
| | | DJ |
| | CRSP US | U.S. Total |
| | Large Cap | Market |
| | Growth Index | FA Index |
| R-Squared | 1.00 | 0.93 |
| Beta | 1.00 | 1.03 |
| These measures show the degree and timing of the fund’s |
| fluctuations compared with the indexes over 36 months. |
| | |
| Ten Largest Holdings (% of total net assets) |
| Apple Inc. | Computer Hardware | 6.4% |
| Alphabet Inc. | Internet | 5.0 |
| Amazon.com Inc. | Broadline Retailers | 3.3 |
| Facebook Inc. | Internet | 2.9 |
| Comcast Corp. | Broadcasting & | |
| | Entertainment | 1.8 |
| Home Depot Inc. | Home Improvement | |
| | Retailers | 1.8 |
| Coca-Cola Co. | Soft Drinks | 1.8 |
| Walt Disney Co. | Broadcasting & | |
| | Entertainment | 1.6 |
| Visa Inc. | Consumer Finance | 1.6 |
| Philip Morris | | |
| International Inc. | Tobacco | 1.5 |
| Top Ten | | 27.7% |
| The holdings listed exclude any temporary cash investments and equity index products. |
1 The expense ratios shown are from the prospectus dated April 27, 2016, and represent estimated costs for the current fiscal year. For the fiscal
year ended December 31, 2016, the expense ratios were 0.18% for Investor Shares, 0.06% for ETF Shares, 0.06% for Admiral Shares, and 0.05% for
Institutional Shares.
8
Growth Index Fund
Investment Focus
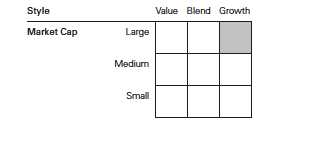
9
Growth Index Fund
Performance Summary
All of the returns in this report represent past performance, which is not a guarantee of future results that may be achieved by the fund. (Current performance may be lower or higher than the performance data cited. For performance data current to the most recent month-end, visit our website at vanguard.com/performance.) Note, too, that both investment returns and principal value can fluctuate widely, so an investor’s shares, when sold, could be worth more or less than their original cost. The returns shown do not reflect taxes that a shareholder would pay on fund distributions or on the sale of fund shares.
Cumulative Performance: December 31, 2006, Through December 31, 2016
Initial Investment of $10,000
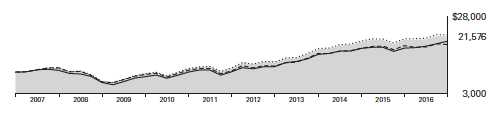
| | | | | |
| | | Average Annual Total Returns | |
| | | Periods Ended December 31, 2016 | |
| | | | | | Final Value |
| | | One | Five | Ten | of a $10,000 |
| | | Year | Years | Years | Investment |
| | Growth Index Fund*Investor Shares | 5.99% | 13.90% | 7.99% | $21,576 |
| • • • • • • •• | Spliced Growth Index | 6.16 | 14.13 | 8.20 | 22,001 |
| – – – – | Large-Cap Growth Funds Average | 1.94 | 12.72 | 6.58 | 18,905 |
| | Dow Jones U.S. Total Stock Market | | | | |
| | Float Adjusted Index | 12.62 | 14.59 | 7.18 | 20,003 |
| For a benchmark description, see the Glossary. |
| Large-Cap Growth Funds Average: Derived from data provided by Lipper, a Thomson Reuters Company. |
| | | | |
| | | | | Final Value |
| | One | Five | Ten | of a $10,000 |
| | Year | Years | Years | Investment |
| Growth Index Fund | | | | |
| ETF Shares Net Asset Value | 6.13% | 14.05% | 8.14% | $21,872 |
| Spliced Growth Index | 6.16 | 14.13 | 8.20 | 22,001 |
| Dow Jones U.S. Total Stock Market Float | | | | |
| Adjusted Index | 12.62 | 14.59 | 7.18 | 20,003 |
See Financial Highlights for dividend and capital gains information.
10
Growth Index Fund
| | | | |
| | Average Annual Total Returns | |
| | Periods Ended December 31, 2016 | |
| |
| | | | | Final Value |
| | One | Five | Ten | of a $10,000 |
| | Year | Years | Years | Investment |
| Growth Index Fund Admiral Shares | 6.12% | 14.05% | 8.14% | $21,871 |
| Spliced Growth Index | 6.16 | 14.13 | 8.20 | 22,001 |
| Dow Jones U.S. Total Stock Market Float | | | | |
| Adjusted Index | 12.62 | 14.59 | 7.18 | 20,003 |
| | | | |
| | | | | Final Value |
| | One | Five | Ten | of a $5,000,000 |
| | Year | Years | Years | Investment |
| |
| Growth Index Fund Institutional Shares | 6.13% | 14.06% | 8.17% | $10,962,979 |
| |
| Spliced Growth Index | 6.16 | 14.13 | 8.20 | 11,000,409 |
| Dow Jones U.S. Total Stock Market Float | | | | |
| Adjusted Index | 12.62 | 14.59 | 7.18 | 10,001,613 |
| | | |
| Cumulative Returns of ETF Shares: December 31, 2006, Through December 31, 2016 | |
| | One | Five | Ten |
| | Year | Years | Years |
| Growth Index Fund ETF Shares Market Price | 6.17% | 93.08% | 118.88% |
| Growth Index Fund ETF Shares Net Asset Value | 6.13 | 93.00 | 118.72 |
| Spliced Growth Index | 6.16 | 93.62 | 120.01 |
Fiscal-Year Total Returns (%): December 31, 2006, Through December 31, 2016
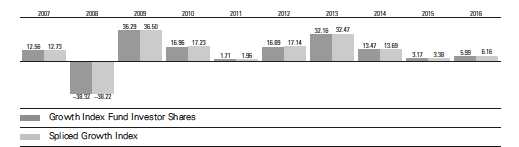
For a benchmark description, see the Glossary.
11
Growth Index Fund
Financial Statements
Statement of Net Assets
As of December 31, 2016
The fund reports a complete list of its holdings in regulatory filings four times in each fiscal year, at the quarter-ends. For the second and fourth fiscal quarters, the lists appear in the fund’s semiannual and annual reports to shareholders. For the first and third fiscal quarters, the fund files the lists with the Securities and Exchange Commission on Form N-Q. Shareholders can look up the fund’s Forms N-Q on the SEC’s website at sec.gov. Forms N-Q may also be reviewed and copied at the SEC’s Public Reference Room (see the back cover of this report for further information).
| | | |
| | | | Market |
| | | | Value• |
| | | Shares | ($000) |
| Common Stocks (99.8%)1 | | |
| Basic Materials (1.0%) | | |
| | Praxair Inc. | 1,691,293 | 198,202 |
| | Ecolab Inc. | 1,554,983 | 182,275 |
| | Newmont Mining Corp. | 1,572,817 | 53,586 |
| | International Flavors | | |
| | & Fragrances Inc. | 422,942 | 49,835 |
| * | Axalta Coating Systems | | |
| | Ltd. | 1,280,910 | 34,841 |
| | WR Grace & Co. | 417,397 | 28,233 |
| | | | 546,972 |
| Consumer Goods (11.0%) | | |
| | Coca-Cola Co. | 23,002,916 | 953,701 |
| | Philip Morris | | |
| | International Inc. | 9,193,431 | 841,107 |
| | NIKE Inc. Class B | 7,918,347 | 402,490 |
| | Altria Group Inc. | 5,778,723 | 390,757 |
| | Colgate-Palmolive Co. | 5,267,404 | 344,699 |
| | Kraft Heinz Co. | 3,606,864 | 314,951 |
| | Reynolds American Inc. | 5,069,561 | 284,098 |
| | Monsanto Co. | 2,596,710 | 273,200 |
| | Constellation Brands Inc. | | |
| | Class A | 1,000,570 | 153,397 |
| *,^ | Tesla Motors Inc. | 715,450 | 152,885 |
| | Activision Blizzard Inc. | 3,963,920 | 143,137 |
| * | Electronic Arts Inc. | 1,698,862 | 133,802 |
| | Newell Brands Inc. | 2,858,989 | 127,654 |
| * | Monster Beverage Corp. | 2,539,036 | 112,581 |
| | Estee Lauder Cos. Inc. | | |
| | Class A | 1,317,274 | 100,758 |
| | VF Corp. | 1,594,633 | 85,074 |
| | Hershey Co. | 808,748 | 83,649 |
| | Mead Johnson Nutrition | | |
| | Co. | 1,094,670 | 77,459 |
| * | Mohawk Industries Inc. | 373,711 | 74,623 |
| | Church & Dwight Co. Inc. | 1,532,564 | 67,724 |
| | McCormick & Co. Inc. | 679,526 | 63,420 |
| | Snap-on Inc. | 344,433 | 58,991 |
| * | WhiteWave Foods Co. | | |
| | Class A | 1,049,129 | 58,332 |
| | | |
| | Hormel Foods Corp. | 1,570,594 | 54,672 |
| * | LKQ Corp. | 1,729,536 | 53,010 |
| | Stanley Black & Decker | | |
| | Inc. | 446,027 | 51,155 |
| | BorgWarner Inc. | 1,260,027 | 49,696 |
| | Coty Inc. Class A | 2,653,497 | 48,586 |
| | Hanesbrands Inc. | 2,239,621 | 48,309 |
| | Brown-Forman Corp. | | |
| | Class B | 1,067,085 | 47,933 |
| | Harman International | | |
| | Industries Inc. | 413,281 | 45,940 |
| * | Michael Kors Holdings Ltd. 923,209 | 39,680 |
| * | Lululemon Athletica Inc. | 565,454 | 36,749 |
| * | NVR Inc. | 21,294 | 35,540 |
| * | WABCO Holdings Inc. | 309,560 | 32,860 |
| *,^ | Under Armour Inc. | | |
| | Class A | 1,086,726 | 31,569 |
| ^ | Polaris Industries Inc. | 361,263 | 29,764 |
| | DR Horton Inc. | 1,068,301 | 29,197 |
| * | Under Armour Inc. | 1,104,783 | 27,807 |
| | Lennar Corp. Class A | 609,021 | 26,145 |
| | Lamb Weston Holdings | | |
| | Inc. | 430,685 | 16,301 |
| | | | 6,003,402 |
| Consumer Services (21.4%) | | |
| * | Amazon.com Inc. | 2,393,482 | 1,794,800 |
| | Comcast Corp. Class A | 14,124,115 | 975,270 |
| | Home Depot Inc. | 7,218,888 | 967,909 |
| | Walt Disney Co. | 8,487,978 | 884,617 |
| | McDonald’s Corp. | 4,921,246 | 599,014 |
| | Starbucks Corp. | 8,193,558 | 454,906 |
| | Walgreens Boots | | |
| | Alliance Inc. | 5,456,683 | 451,595 |
| * | Priceline Group Inc. | 292,423 | 428,710 |
| | Costco Wholesale Corp. | 2,590,510 | 414,767 |
| | Lowe’s Cos. Inc. | 5,183,269 | 368,634 |
| * | Charter Communications | | |
| | Inc. Class A | 1,202,988 | 346,364 |
| * | Netflix Inc. | 2,416,001 | 299,101 |
| | TJX Cos. Inc. | 3,696,794 | 277,740 |
12
Growth Index Fund
| | | |
| | | | Market |
| | | | Value• |
| | | Shares | ($000) |
| | Time Warner Inc. | 2,170,708 | 209,539 |
| | Southwest Airlines Co. | 3,648,098 | 181,821 |
| | Twenty-First Century Fox | | |
| | Inc. Class A | 6,262,760 | 175,608 |
| * | O’Reilly Automotive Inc. | 559,791 | 155,851 |
| | Ross Stores Inc. | 2,350,243 | 154,176 |
| | Marriott International Inc. | | |
| | Class A | 1,734,420 | 143,402 |
| | CBS Corp. Class B | 2,248,771 | 143,067 |
| * | AutoZone Inc. | 171,040 | 135,086 |
| | Yum! Brands Inc. | 2,066,148 | 130,849 |
| | Dollar General Corp. | 1,669,654 | 123,671 |
| * | Dollar Tree Inc. | 1,327,288 | 102,440 |
| | Hilton Worldwide | | |
| | Holdings Inc. | 3,521,098 | 95,774 |
| | L Brands Inc. | 1,440,561 | 94,847 |
| * | Ulta Salon Cosmetics | | |
| | & Fragrance Inc. | 351,168 | 89,527 |
| | Nielsen Holdings plc | 2,118,194 | 88,858 |
| | Royal Caribbean Cruises | | |
| | Ltd. | 1,017,468 | 83,473 |
| * | MGM Resorts | | |
| | International | 2,888,731 | 83,282 |
| | Expedia Inc. | 731,400 | 82,853 |
| * | DISH Network Corp. | | |
| | Class A | 1,275,246 | 73,875 |
| * | CarMax Inc. | 1,128,418 | 72,659 |
| | Advance Auto Parts Inc. | 414,652 | 70,126 |
| * | Chipotle Mexican Grill Inc. | | |
| | Class A | 171,695 | 64,784 |
| | Alaska Air Group Inc. | 729,645 | 64,741 |
| | Twenty-First Century Fox | | |
| | Inc. | 2,366,764 | 64,494 |
| | Las Vegas Sands Corp. | 1,178,000 | 62,917 |
| | Tractor Supply Co. | 778,581 | 59,024 |
| | Carnival Corp. | 1,116,129 | 58,106 |
| | Foot Locker Inc. | 788,380 | 55,888 |
| | Wyndham Worldwide | | |
| | Corp. | 637,641 | 48,697 |
| ^ | Sirius XM Holdings Inc. | 9,991,396 | 44,462 |
| | Signet Jewelers Ltd. | 447,270 | 42,160 |
| | Wynn Resorts Ltd. | 483,127 | 41,795 |
| * | Norwegian Cruise Line | | |
| | Holdings Ltd. | 940,462 | 39,998 |
| | FactSet Research | | |
| | Systems Inc. | 236,220 | 38,605 |
| * | Discovery | | |
| | Communications Inc. | 1,319,008 | 35,323 |
| | Scripps Networks | | |
| | Interactive Inc. Class A | 480,061 | 34,262 |
| * | TripAdvisor Inc. | 668,446 | 30,996 |
| | Tiffany & Co. | 369,375 | 28,601 |
| * | Discovery | | |
| | Communications Inc. | | |
| | Class A | 900,425 | 24,681 |
| | | |
| | Williams-Sonoma Inc. | 236,180 | 11,429 |
| * | AutoNation Inc. | 209,715 | 10,203 |
| * | Hyatt Hotels Corp. | | |
| | Class A | 159,703 | 8,825 |
| | CBS Corp. Class A | 2,760 | 178 |
| | Whole Foods Market Inc. | 2,112 | 65 |
| * | Liberty Interactive Corp. | | |
| | QVC Group Class A | 2,816 | 56 |
| | H&R Block Inc. | 1,496 | 34 |
| | | | 11,624,535 |
| Financials (12.3%) | | |
| | Visa Inc. Class A | 11,067,347 | 863,474 |
| | Mastercard Inc. Class A | 5,704,123 | 588,951 |
| | Simon Property Group | | |
| | Inc. | 1,862,233 | 330,863 |
| | Charles Schwab Corp. | 7,070,409 | 279,069 |
| | American Tower | | |
| | Corporation | 2,522,733 | 266,602 |
| | BlackRock Inc. | 624,279 | 237,563 |
| | Marsh & McLennan Cos. | | |
| | Inc. | 3,055,451 | 206,518 |
| | Intercontinental | | |
| | Exchange Inc. | 3,530,055 | 199,166 |
| | Public Storage | 873,643 | 195,259 |
| | Crown Castle | | |
| | International Corp. | 2,137,052 | 185,432 |
| | Aon plc | 1,559,155 | 173,893 |
| | S&P Global Inc. | 1,535,485 | 165,126 |
| | Prologis Inc. | 3,111,656 | 164,264 |
| | Equinix Inc. | 423,006 | 151,187 |
| | AvalonBay Communities | | |
| | Inc. | 813,875 | 144,178 |
| | Welltower Inc. | 2,148,398 | 143,792 |
| | Weyerhaeuser Co. | 4,433,068 | 133,391 |
| | Ventas Inc. | 2,098,559 | 131,202 |
| | Boston Properties Inc. | 911,289 | 114,622 |
| | Vornado Realty Trust | 1,007,651 | 105,169 |
| | T. Rowe Price Group Inc. | 1,370,554 | 103,148 |
| | Digital Realty Trust Inc. | 941,860 | 92,547 |
| | General Growth | | |
| | Properties Inc. | 3,674,383 | 91,786 |
| | Moody’s Corp. | 962,966 | 90,779 |
| | Essex Property Trust Inc. | 388,291 | 90,278 |
| | Realty Income Corp. | 1,533,098 | 88,123 |
| | Equifax Inc. | 710,083 | 83,953 |
| | First Republic Bank | 910,466 | 83,890 |
| * | IHS Markit Ltd. | 2,123,543 | 75,195 |
| * | Markel Corp. | 78,751 | 71,230 |
| | Mid-America Apartment | | |
| | Communities Inc. | 672,826 | 65,883 |
| | SL Green Realty Corp. | 600,953 | 64,633 |
| | TD Ameritrade Holding | | |
| | Corp. | 1,404,663 | 61,243 |
| | Federal Realty Investment | |
| | Trust | 424,919 | 60,385 |
13
Growth Index Fund
| | | |
| | | | Market |
| | | | Value• |
| | | Shares | ($000) |
| | UDR Inc. | 1,583,119 | 57,752 |
| * | E*TRADE Financial Corp. | 1,623,351 | 56,249 |
| | Extra Space Storage Inc. | 708,247 | 54,705 |
| * | CBRE Group Inc. Class A | 1,696,331 | 53,417 |
| | Alexandria Real Estate | | |
| | Equities Inc. | 469,832 | 52,212 |
| | VEREIT Inc. | 5,763,591 | 48,760 |
| | Iron Mountain Inc. | 1,482,499 | 48,152 |
| * | Affiliated Managers | | |
| | Group Inc. | 324,397 | 47,135 |
| | Brixmor Property Group | | |
| | Inc. | 1,805,831 | 44,098 |
| | MSCI Inc. Class A | 556,876 | 43,871 |
| | SEI Investments Co. | 851,909 | 42,050 |
| | HCP Inc. | 1,388,516 | 41,267 |
| * | Liberty Broadband Corp. | 430,979 | 31,923 |
| | Kimco Realty Corp. | 1,194,483 | 30,053 |
| | Arthur J Gallagher & Co. | 528,096 | 27,440 |
| | Jones Lang LaSalle Inc. | 267,887 | 27,067 |
| | Raymond James Financial | | |
| | Inc. | 379,257 | 26,271 |
| | Camden Property Trust | 259,225 | 21,793 |
| * | Liberty Broadband Corp. | | |
| | Class A | 73,247 | 5,308 |
| | Macerich Co. | 924 | 65 |
| | Realogy Holdings Corp. | 968 | 25 |
| | | | 6,662,407 |
| Health Care (13.8%) | | |
| | Amgen Inc. | 4,408,508 | 644,568 |
| | AbbVie Inc. | 9,630,475 | 603,060 |
| | Medtronic plc | 8,189,434 | 583,333 |
| | Bristol-Myers Squibb Co. | 9,903,823 | 578,779 |
| | Gilead Sciences Inc. | 7,807,301 | 559,081 |
| * | Celgene Corp. | 4,593,920 | 531,746 |
| * | Allergan plc | 2,222,744 | 466,798 |
| * | Biogen Inc. | 1,289,358 | 365,636 |
| | Thermo Fisher Scientific | | |
| | Inc. | 2,341,003 | 330,316 |
| | Stryker Corp. | 1,775,217 | 212,689 |
| | Becton Dickinson and Co. | 1,258,243 | 208,302 |
| * | Boston Scientific Corp. | 8,067,653 | 174,503 |
| * | Regeneron | | |
| | Pharmaceuticals Inc. | 460,278 | 168,963 |
| | Zoetis Inc. | 2,926,478 | 156,654 |
| * | Alexion Pharmaceuticals | | |
| | Inc. | 1,262,548 | 154,473 |
| * | Intuitive Surgical Inc. | 229,621 | 145,619 |
| * | Edwards Lifesciences | | |
| | Corp. | 1,267,148 | 118,732 |
| * | Illumina Inc. | 870,613 | 111,473 |
| * | Vertex Pharmaceuticals | | |
| | Inc. | 1,468,847 | 108,210 |
| | CR Bard Inc. | 435,320 | 97,799 |
| * | Mylan NV | 2,537,147 | 96,792 |
| * | Incyte Corp. | 948,945 | 95,151 |
| | | |
| * | BioMarin Pharmaceutical | | |
| | Inc. | 1,019,214 | 84,432 |
| | Dentsply Sirona Inc. | 1,368,541 | 79,006 |
| * | Laboratory Corp. of | | |
| | America Holdings | 610,595 | 78,388 |
| * | Henry Schein Inc. | 477,158 | 72,390 |
| * | Quintiles IMS Holdings Inc. | 875,825 | 66,607 |
| * | IDEXX Laboratories Inc. | 530,662 | 62,231 |
| * | Waters Corp. | 453,968 | 61,009 |
| * | DaVita Inc. | 936,706 | 60,137 |
| * | Centene Corp. | 963,161 | 54,428 |
| | ResMed Inc. | 834,555 | 51,784 |
| | Cooper Cos. Inc. | 288,492 | 50,466 |
| * | Alkermes plc | 900,667 | 50,059 |
| * | Varian Medical Systems | | |
| | Inc. | 553,603 | 49,703 |
| * | Jazz Pharmaceuticals plc | 336,534 | 36,692 |
| * | Mallinckrodt plc | 637,782 | 31,774 |
| | Universal Health Services | | |
| | Inc. Class B | 267,319 | 28,437 |
| * | Envision Healthcare Corp. | 348,430 | 22,052 |
| | Seattle Genetics Inc. | 271,570 | 14,331 |
| * | Alnylam Pharmaceuticals | | |
| | Inc. | 216,164 | 8,093 |
| | Perrigo Co. plc | 924 | 77 |
| | | | 7,474,773 |
| Industrials (11.8%) | | |
| | 3M Co. | 3,564,327 | 636,482 |
| | Union Pacific Corp. | 4,883,730 | 506,345 |
| | United Parcel Service Inc. | | |
| | Class B | 4,085,186 | 468,326 |
| | Accenture plc Class A | 3,676,013 | 430,571 |
| | Danaher Corp. | 3,689,175 | 287,165 |
| | Boeing Co. | 1,737,273 | 270,459 |
| * | PayPal Holdings Inc. | 6,793,166 | 268,126 |
| | Automatic Data | | |
| | Processing Inc. | 2,539,994 | 261,061 |
| | Fidelity National | | |
| | Information Services Inc. | 1,945,655 | 147,169 |
| * | Fiserv Inc. | 1,286,320 | 136,710 |
| | FedEx Corp. | 708,434 | 131,910 |
| | Sherwin-Williams Co. | 467,994 | 125,769 |
| | Amphenol Corp. Class A | 1,828,094 | 122,848 |
| | Paychex Inc. | 1,928,864 | 117,429 |
| | Illinois Tool Works Inc. | 936,194 | 114,646 |
| | Roper Technologies Inc. | 600,891 | 110,011 |
| | Rockwell Automation Inc. | 759,936 | 102,135 |
| | Fortive Corp. | 1,844,108 | 98,900 |
| | Vulcan Materials Co. | 784,141 | 98,135 |
| | Agilent Technologies Inc. | 1,922,462 | 87,587 |
| | Martin Marietta Materials | | |
| | Inc. | 376,000 | 83,295 |
| | Waste Connections Inc. | 1,038,131 | 81,587 |
| | Fastenal Co. | 1,713,304 | 80,491 |
| * | FleetCor Technologies Inc. | 550,073 | 77,846 |
14
Growth Index Fund
| | | |
| | | | Market |
| | | | Value• |
| | | Shares | ($000) |
| | TransDigm Group Inc. | 300,473 | 74,806 |
| | Alliance Data Systems | | |
| | Corp. | 325,333 | 74,339 |
| * | Verisk Analytics Inc. | | |
| | Class A | 893,501 | 72,525 |
| | Textron Inc. | 1,441,184 | 69,984 |
| | WW Grainger Inc. | 300,213 | 69,724 |
| | AMETEK Inc. | 1,372,339 | 66,696 |
| * | Mettler-Toledo | | |
| | International Inc. | 155,578 | 65,119 |
| | Global Payments Inc. | 912,139 | 63,312 |
| | Masco Corp. | 1,947,130 | 61,568 |
| | CH Robinson Worldwide | | |
| | Inc. | 839,839 | 61,527 |
| | Acuity Brands Inc. | 260,897 | 60,231 |
| | Cintas Corp. | 496,748 | 57,404 |
| | Expeditors International | | |
| | of Washington Inc. | 1,070,051 | 56,670 |
| * | Vantiv Inc. Class A | 937,211 | 55,877 |
| | Kansas City Southern | 638,222 | 54,153 |
| | Sealed Air Corp. | 1,143,730 | 51,857 |
| | JB Hunt Transport | | |
| | Services Inc. | 532,515 | 51,691 |
| | Fortune Brands Home | | |
| | & Security Inc. | 912,830 | 48,800 |
| | Total System Services Inc. | 981,574 | 48,127 |
| * | Trimble Inc. | 1,483,122 | 44,716 |
| | Wabtec Corp. | 500,593 | 41,559 |
| * | Sensata Technologies | | |
| | Holding NV | 1,013,885 | 39,491 |
| * | Stericycle Inc. | 504,743 | 38,885 |
| | Hubbell Inc. Class B | 328,148 | 38,295 |
| | Macquarie Infrastructure | | |
| | Corp. | 459,979 | 37,580 |
| | B/E Aerospace Inc. | 601,061 | 36,178 |
| | Robert Half International | | |
| | Inc. | 724,428 | 35,338 |
| * | First Data Corp. Class A | 2,112,641 | 29,978 |
| * | United Rentals Inc. | 249,078 | 26,298 |
| | Owens Corning | 335,151 | 17,280 |
| | FLIR Systems Inc. | 408,083 | 14,769 |
| | Pentair plc | 1,100 | 62 |
| | | | 6,409,842 |
| Oil & Gas (3.9%) | | |
| | Schlumberger Ltd. | 4,122,562 | 346,089 |
| | EOG Resources Inc. | 3,416,199 | 345,378 |
| | Anadarko Petroleum Corp. | 3,312,088 | 230,952 |
| | Pioneer Natural | | |
| | Resources Co. | 1,005,789 | 181,112 |
| | Williams Cos. Inc. | 4,450,514 | 138,589 |
| | Halliburton Co. | 2,433,384 | 131,622 |
| | Kinder Morgan Inc. | 5,622,397 | 116,440 |
| * | Concho Resources Inc. | 865,503 | 114,766 |
| | Noble Energy Inc. | 2,547,501 | 96,958 |
| | Cimarex Energy Co. | 563,148 | 76,532 |
| | | |
| | EQT Corp. | 1,024,297 | 66,989 |
| | Cabot Oil & Gas Corp. | 2,759,232 | 64,455 |
| | Range Resources Corp. | 1,466,148 | 50,377 |
| * | Cheniere Energy Inc. | 1,181,688 | 48,957 |
| ^ | Core Laboratories NV | 261,297 | 31,366 |
| * | Antero Resources Corp. | 1,300,006 | 30,745 |
| * | Continental Resources Inc. | 554,292 | 28,568 |
| | | | 2,099,895 |
| Technology (24.1%) | | |
| | Apple Inc. | 30,019,537 | 3,476,863 |
| * | Facebook Inc. Class A | 13,871,831 | 1,595,954 |
| * | Alphabet Inc. Class A | 1,754,628 | 1,390,455 |
| * | Alphabet Inc. | 1,738,273 | 1,341,634 |
| | QUALCOMM Inc. | 8,752,103 | 570,637 |
| | Texas Instruments Inc. | 5,923,000 | 432,201 |
| | Broadcom Ltd. | 2,236,929 | 395,422 |
| | Oracle Corp. | 9,129,769 | 351,040 |
| | NVIDIA Corp. | 3,034,432 | 323,895 |
| * | Adobe Systems Inc. | 2,946,613 | 303,354 |
| * | salesforce.com Inc. | 3,922,290 | 268,520 |
| | Applied Materials Inc. | 6,405,482 | 206,705 |
| * | Cognizant Technology | | |
| | Solutions Corp. Class A | 3,595,441 | 201,453 |
| * | Yahoo! Inc. | 5,088,756 | 196,782 |
| | Intuit Inc. | 1,445,055 | 165,618 |
| * | Micron Technology Inc. | 6,172,261 | 135,296 |
| | Analog Devices Inc. | 1,826,293 | 132,625 |
| | Lam Research Corp. | 965,034 | 102,033 |
| * | Autodesk Inc. | 1,249,238 | 92,456 |
| | Xilinx Inc. | 1,496,463 | 90,342 |
| | Linear Technology Corp. | 1,424,370 | 88,809 |
| * | Cerner Corp. | 1,810,980 | 85,786 |
| | Skyworks Solutions Inc. | 1,101,323 | 82,225 |
| | Microchip Technology Inc. | 1,280,133 | 82,121 |
| * | Citrix Systems Inc. | 877,090 | 78,333 |
| * | Red Hat Inc. | 1,064,739 | 74,212 |
| | KLA-Tencor Corp. | 926,747 | 72,916 |
| * | ServiceNow Inc. | 935,137 | 69,518 |
| * | Akamai Technologies Inc. | 976,271 | 65,098 |
| | Maxim Integrated | | |
| | Products Inc. | 1,681,706 | 64,863 |
| * | Palo Alto Networks Inc. | 516,558 | 64,596 |
| * | F5 Networks Inc. | 386,442 | 55,926 |
| * | Twitter Inc. | 3,383,747 | 55,155 |
| | CDK Global Inc. | 884,496 | 52,796 |
| * | Workday Inc. Class A | 721,734 | 47,699 |
| * | ANSYS Inc. | 511,891 | 47,345 |
| * | Gartner Inc. | 464,749 | 46,972 |
| * | Splunk Inc. | 796,019 | 40,716 |
| *,^ | VeriSign Inc. | 525,903 | 40,005 |
| * | Qorvo Inc. | 757,650 | 39,951 |
| *,^ | VMware Inc. Class A | 396,209 | 31,194 |
| | Juniper Networks Inc. | 1,068,767 | 30,203 |
| * | Premier Inc. Class A | 296,341 | 8,997 |
| | | | 13,098,721 |
15
Growth Index Fund
| | | |
| | | | Market |
| | | | Value• |
| | | Shares | ($000) |
| Telecommunications (0.5%) | | |
| * | T-Mobile US Inc. | 1,709,913 | 98,337 |
| * | Level 3 Communications | | |
| | Inc. | 1,705,164 | 96,103 |
| * | SBA Communications | | |
| | Corp. Class A | 735,594 | 75,957 |
| * | Zayo Group Holdings Inc. | 862,768 | 28,351 |
| | | | 298,748 |
| Total Common Stocks | | |
| (Cost $36,344,615) | | 54,219,295 |
| Temporary Cash Investments (0.5%)1 | |
| Money Market Fund (0.5%) | | |
| 2,3 | Vanguard Market Liquidity | | |
| | Fund, 0.823% | 2,529 | 252,870 |
| |
| | | Face | |
| | | Amount | |
| | | ($000) | |
| U.S. Government and Agency Obligations (0.0%) |
| 4 | United States Treasury Bill, | | |
| | 0.360%, 1/12/17 | 500 | 500 |
| 4 | United States Treasury Bill, | | |
| | 0.487%–0.501%, 3/16/17 | 600 | 599 |
| 4 | United States Treasury Bill, | | |
| | 0.564%–0.591%, 5/4/17 | 1,850 | 1,846 |
| 4 | United States Treasury Bill, | | |
| | 0.587%–0.652%, 5/18/17 | 1,300 | 1,297 |
| 4 | United States Treasury Bill, | | |
| | 0.618%, 5/25/17 | 600 | 599 |
| | | | 4,841 |
| Total Temporary Cash Investments | |
| (Cost $257,705) | | 257,711 |
| Total Investments (100.3%) | | |
| (Cost $36,602,320) | | 54,477,006 |
| | |
| | | Amount |
| | | ($000) |
| Other Assets and Liabilities (-0.3%) | | |
| Other Assets | | |
| Investment in Vanguard | | 3,997 |
| Receivables for Investment Securities Sold | 99 |
| Receivables for Accrued Income | | 51,433 |
| Receivables for Capital Shares Issued | | 80,720 |
| Other Assets 4 | | 1,414 |
| Total Other Assets | | 137,663 |
| Liabilities | | |
| payables for investment securities | | |
| purchased | | (82,015) |
| Collateral for Securities on Loan | | (128,571) |
| Payables for Capital Shares Redeemed | | (42,357) |
| Payables to Vanguard | | (32,788) |
| Other Liabilities | | (503) |
| Total Liabilities | | (286,234) |
| Net Assets (100%) | 54,328,435 |
| |
| At December 31, 2016, net assets consisted of: |
| | Amount |
| | ($000) |
| Paid-in Capital | 37,792,663 |
| Overdistributed Net Investment Income | (22,202) |
| Accumulated Net Realized Losses | (1,315,452) |
| Unrealized Appreciation (Depreciation) | |
| Investment Securities | 17,874,686 |
| Futures Contracts | (1,260) |
| Net Assets | 54,328,435 |
| |
| |
| Investor Shares—Net Assets | |
| Applicable to 51,262,282 outstanding | |
| $.001 par value shares of beneficial | |
| interest (unlimited authorization) | 2,938,189 |
| Net Asset Value Per Share— | |
| Investor Shares | $57.32 |
| |
| |
| ETF Shares—Net Assets | |
| Applicable to 206,956,494 outstanding | |
| $.001 par value shares of beneficial | |
| interest (unlimited authorization) | 23,040,383 |
| Net Asset Value Per Share— | |
| ETF Shares | $111.33 |
16
Growth Index Fund
| |
| | Amount |
| | ($000) |
| Admiral Shares—Net Assets | |
| Applicable to 324,862,858 outstanding | |
| $.001 par value shares of beneficial | |
| interest (unlimited authorization) | 18,617,028 |
| Net Asset Value Per Share— | |
| Admiral Shares | $57.31 |
| |
| |
| Institutional Shares—Net Assets | |
| Applicable to 169,829,238 outstanding | |
| $.001 par value shares of beneficial | |
| interest (unlimited authorization) | 9,732,835 |
| Net Asset Value Per Share— | |
| Institutional Shares | $57.31 |
• See Note A in Notes to Financial Statements.
* Non-income-producing security.
^ Includes partial security positions on loan to broker-dealers. The total value of securities on loan is $121,462,000.
1 The fund invests a portion of its cash reserves in equity markets through the use of index futures contracts. After giving effect to futures
investments, the fund’s effective common stock and temporary cash investment positions represent 100.0% and 0.3%, respectively,
of net assets.
2 Affiliated money market fund available only to Vanguard funds and certain trusts and accounts managed by Vanguard. Rate shown is the
7-day yield.
3 Includes $128,571,000 of collateral received for securities on loan.
4 Securities with a value of $4,841,000 and cash of $575,000 have been segregated as initial margin for open futures contracts.
See accompanying Notes, which are an integral part of the Financial Statements.
17
| |
| Growth Index Fund | |
| |
| |
| Statement of Operations | |
| |
| | Year Ended |
| | December 31, 2016 |
| | ($000) |
| Investment Income | |
| Income | |
| Dividends | 752,119 |
| Interest1 | 327 |
| Securities Lending—Net | 4,328 |
| Total Income | 756,774 |
| Expenses | |
| The Vanguard Group—Note B | |
| Investment Advisory Services | 4,332 |
| Management and Administrative—Investor Shares | 4,340 |
| Management and Administrative—ETF Shares | 8,707 |
| Management and Administrative—Admiral Shares | 6,913 |
| Management and Administrative—Institutional Shares | 3,478 |
| Marketing and Distribution—Investor Shares | 595 |
| Marketing and Distribution—ETF Shares | 1,175 |
| Marketing and Distribution—Admiral Shares | 1,736 |
| Marketing and Distribution—Institutional Shares | 226 |
| Custodian Fees | 400 |
| Auditing Fees | 37 |
| Shareholders’ Reports—Investor Shares | 63 |
| Shareholders’ Reports—ETF Shares | 534 |
| Shareholders’ Reports—Admiral Shares | 130 |
| Shareholders’ Reports—Institutional Shares | 71 |
| Trustees’ Fees and Expenses | 38 |
| Total Expenses | 32,775 |
| Net Investment Income | 723,999 |
| Realized Net Gain (Loss) | |
| Investment Securities Sold1 | 1,078,326 |
| Futures Contracts | 6,845 |
| Realized Net Gain (Loss) | 1,085,171 |
| Change in Unrealized Appreciation (Depreciation) | |
| Investment Securities | 1,228,064 |
| Futures Contracts | (1,114) |
| Change in Unrealized Appreciation (Depreciation) | 1,226,950 |
| Net Increase (Decrease) in Net Assets Resulting from Operations | 3,036,120 |
1 Interest income and realized net gain (loss) from an affiliated company of the fund were $306,000 and $11,000, respectively.
See accompanying Notes, which are an integral part of the Financial Statements.
18
Growth Index Fund
Statement of Changes in Net Assets
| | |
| | Year Ended December 31, |
| | 2016 | 2015 |
| | ($000) | ($000) |
| Increase (Decrease) in Net Assets | | |
| Operations | | |
| Net Investment Income | 723,999 | 644,078 |
| Realized Net Gain (Loss) | 1,085,171 | 1,321,416 |
| Change in Unrealized Appreciation (Depreciation) | 1,226,950 | (488,041) |
| Net Increase (Decrease) in Net Assets Resulting from Operations | 3,036,120 | 1,477,453 |
| Distributions | | |
| Net Investment Income | | |
| Investor Shares | (38,216) | (36,400) |
| ETF Shares | (308,113) | (254,190) |
| Admiral Shares | (251,588) | (210,975) |
| Institutional Shares | (135,867) | (129,494) |
| Realized Capital Gain | | |
| Investor Shares | — | — |
| ETF Shares | — | — |
| Admiral Shares | — | — |
| Institutional Shares | — | — |
| Total Distributions | (733,784) | (631,059) |
| Capital Share Transactions | | |
| Investor Shares | (232,244) | (300,941) |
| ETF Shares | 1,406,111 | 3,020,841 |
| Admiral Shares | 1,031,953 | 1,591,285 |
| Institutional Shares | (80,462) | (318,776) |
| Net Increase (Decrease) from Capital Share Transactions | 2,125,358 | 3,992,409 |
| Total Increase (Decrease) | 4,427,694 | 4,838,803 |
| Net Assets | | |
| Beginning of Period | 49,900,741 | 45,061,938 |
| End of Period1 | 54,328,435 | 49,900,741 |
| 1 Net Assets—End of Period includes undistributed (overdistributed) net investment income of ($22,202,000) and ($12,559,000). |
|
| See accompanying Notes, which are an integral part of the Financial Statements. |
19
Growth Index Fund
Financial Highlights
| | | | | |
| Investor Shares | | | | | |
| |
| For a Share Outstanding | Year Ended December 31, |
| Throughout Each Period | 2016 | 2015 | 2014 | 2013 | 2012 |
| Net Asset Value, Beginning of Period | $54.78 | $53.71 | $47.87 | $36.65 | $31.79 |
| Investment Operations | | | | | |
| Net Investment Income | .720 | . 652 | .579 | .508 | .509 |
| Net Realized and Unrealized Gain (Loss) | | | | | |
| on Investments | 2.548 | 1.054 | 5.837 | 11.219 | 4.853 |
| Total from Investment Operations | 3.268 | 1.706 | 6.416 | 11.727 | 5.362 |
| Distributions | | | | | |
| Dividends from Net Investment Income | (.728) | (. 636) | (. 576) | (. 507) | (. 502) |
| Distributions from Realized Capital Gains | — | — | — | — | — |
| Total Distributions | (.728) | (. 636) | (. 576) | (. 507) | (. 502) |
| Net Asset Value, End of Period | $57.32 | $54.78 | $53.71 | $47.87 | $36.65 |
| |
| Total Return1 | 5.99% | 3.17% | 13.47% | 32.16% | 16.89% |
| |
| Ratios/Supplemental Data | | | | | |
| Net Assets, End of Period (Millions) | $2,938 | $3,038 | $3,270 | $3,630 | $3,105 |
| Ratio of Total Expenses to Average Net Assets | 0.18% | 0.22% | 0.23% | 0.24% | 0.24% |
| Ratio of Net Investment Income to | | | | | |
| Average Net Assets | 1.31% | 1.20% | 1.17% | 1.22% | 1.45% |
| Portfolio Turnover Rate2 | 11% | 9% | 9% | 32% | 21% |
1 Total returns do not include account service fees that may have applied in the periods shown. Fund prospectuses provide information about
any applicable account service fees.
2 Excludes the value of portfolio securities received or delivered as a result of in-kind purchases or redemptions of the fund’s capital shares,
including ETF Creation Units.
See accompanying Notes, which are an integral part of the Financial Statements.
20
Growth Index Fund
Financial Highlights
| | | | | |
| ETF Shares | | | | | |
| |
| For a Share Outstanding | Year Ended December 31, |
| Throughout Each Period | 2016 | 2015 | 2014 | 2013 | 2012 |
| Net Asset Value, Beginning of Period | $106.40 | $104.33 | $92.99 | $71.19 | $61.76 |
| Investment Operations | | | | | |
| Net Investment Income | 1.528 | 1.420 | 1.268 | 1.112 | 1.087 |
| Net Realized and Unrealized Gain (Loss) | | | | | |
| on Investments | 4.949 | 2.038 | 11.332 | 21.798 | 9.416 |
| Total from Investment Operations | 6.477 | 3.458 | 12.600 | 22.910 | 10.503 |
| Distributions | | | | | |
| Dividends from Net Investment Income | (1.547) | (1.388) | (1.260) | (1.110) | (1.073) |
| Distributions from Realized Capital Gains | — | — | — | — | — |
| Total Distributions | (1.547) | (1.388) | (1.260) | (1.110) | (1.073) |
| Net Asset Value, End of Period | $111.33 | $106.40 | $104.33 | $92.99 | $71.19 |
| |
| Total Return | 6.13% | 3.32% | 13.62% | 32.38% | 17.03% |
| |
| Ratios/Supplemental Data | | | | | |
| Net Assets, End of Period (Millions) | $23,040 | $20,706 | $17,340 | $13,265 | $8,467 |
| Ratio of Total Expenses to Average Net Assets | 0.06% | 0.08% | 0.09% | 0.09% | 0.10% |
| Ratio of Net Investment Income to | | | | | |
| Average Net Assets | 1.43% | 1.34% | 1.31% | 1.37% | 1.59% |
| Portfolio Turnover Rate1 | 11% | 9% | 9% | 32% | 21% |
| 1 Excludes the value of portfolio securities received or delivered as a result of in-kind purchases or redemptions of the fund’s capital shares, |
| including ETF Creation Units. |
See accompanying Notes, which are an integral part of the Financial Statements.
21
Growth Index Fund
Financial Highlights
| | | | | |
| Admiral Shares | | | | | |
| |
| For a Share Outstanding | Year Ended December 31, |
| Throughout Each Period | 2016 | 2015 | 2014 | 2013 | 2012 |
| Net Asset Value, Beginning of Period | $54.77 | $53.71 | $47.87 | $36.64 | $31.79 |
| Investment Operations | | | | | |
| Net Investment Income | .786 | .731 | . 653 | . 572 | . 560 |
| Net Realized and Unrealized Gain (Loss) | | | | | |
| on Investments | 2.550 | 1.044 | 5.836 | 11.229 | 4.842 |
| Total from Investment Operations | 3.336 | 1.775 | 6.489 | 11.801 | 5.402 |
| Distributions | | | | | |
| Dividends from Net Investment Income | (.796) | (.715) | (. 649) | (. 571) | (. 552) |
| Distributions from Realized Capital Gains | — | — | — | — | — |
| Total Distributions | (.796) | (.715) | (. 649) | (. 571) | (. 552) |
| Net Asset Value, End of Period | $57.31 | $54.77 | $53.71 | $47.87 | $36.64 |
| |
| Total Return1 | 6.12% | 3.30% | 13.63% | 32.40% | 17.01% |
| |
| Ratios/Supplemental Data | | | | | |
| Net Assets, End of Period (Millions) | $18,617 | $16,777 | $14,907 | $7,903 | $5,774 |
| Ratio of Total Expenses to Average Net Assets | 0.06% | 0.08% | 0.09% | 0.09% | 0.10% |
| Ratio of Net Investment Income to | | | | | |
| Average Net Assets | 1.43% | 1.34% | 1.31% | 1.37% | 1.59% |
| Portfolio Turnover Rate2 | 11% | 9% | 9% | 32% | 21% |
1 Total returns do not include account service fees that may have applied in the periods shown. Fund prospectuses provide information about
any applicable account service fees.
2 Excludes the value of portfolio securities received or delivered as a result of in-kind purchases or redemptions of the fund’s capital shares,
including ETF Creation Units.
See accompanying Notes, which are an integral part of the Financial Statements.
22
Growth Index Fund
Financial Highlights
| | | | | |
| Institutional Shares | | | | | |
| |
| For a Share Outstanding | Year Ended December 31, |
| Throughout Each Period | 2016 | 2015 | 2014 | 2013 | 2012 |
| Net Asset Value, Beginning of Period | $54.77 | $53.70 | $47.87 | $36.64 | $31.79 |
| Investment Operations | | | | | |
| Net Investment Income | .792 | .737 | . 657 | . 576 | . 567 |
| Net Realized and Unrealized Gain (Loss) | | | | | |
| on Investments | 2.549 | 1.053 | 5.826 | 11.229 | 4.842 |
| Total from Investment Operations | 3.341 | 1.790 | 6.483 | 11.805 | 5.409 |
| Distributions | | | | | |
| Dividends from Net Investment Income | (. 801) | (.720) | (. 653) | (. 575) | (. 559) |
| Distributions from Realized Capital Gains | — | — | — | — | — |
| Total Distributions | (. 801) | (.720) | (. 653) | (. 575) | (. 559) |
| Net Asset Value, End of Period | $57.31 | $54.77 | $53.70 | $47.87 | $36.64 |
| |
| Total Return | 6.13% | 3.33% | 13.62% | 32.41% | 17.04% |
| |
| Ratios/Supplemental Data | | | | | |
| Net Assets, End of Period (Millions) | $9,733 | $9,380 | $9,545 | $8,015 | $6,189 |
| Ratio of Total Expenses to Average Net Assets | 0.05% | 0.07% | 0.08% | 0.08% | 0.08% |
| Ratio of Net Investment Income to | | | | | |
| Average Net Assets | 1.44% | 1.35% | 1.32% | 1.38% | 1.61% |
| Portfolio Turnover Rate1 | 11% | 9% | 9% | 32% | 21% |
| 1 Excludes the value of portfolio securities received or delivered as a result of in-kind purchases or redemptions of the fund’s capital shares, |
| including ETF Creation Units. |
See accompanying Notes, which are an integral part of the Financial Statements.
23
Growth Index Fund
Notes to Financial Statements
Vanguard Growth Index Fund is registered under the Investment Company Act of 1940 as an open-end investment company, or mutual fund. The fund offers four classes of shares: Investor Shares, ETF Shares, Admiral Shares, and Institutional Shares. Investor Shares are available to any investor who meets the fund’s minimum purchase requirements. ETF Shares are listed for trading on NYSE Arca; they can be purchased and sold through a broker. Admiral Shares and Institutional Shares are designed for investors who meet certain administrative, service, and account-size criteria.
A. The following significant accounting policies conform to generally accepted accounting principles for U.S. investment companies. The fund consistently follows such policies in preparing its financial statements.
1. Security Valuation: Securities are valued as of the close of trading on the New York Stock Exchange (generally 4 p.m., Eastern time) on the valuation date. Equity securities are valued at the latest quoted sales prices or official closing prices taken from the primary market in which each security trades; such securities not traded on the valuation date are valued at the mean of the latest quoted bid and asked prices. Securities for which market quotations are not readily available, or whose values have been materially affected by events occurring before the fund’s pricing time but after the close of the securities’ primary markets, are valued by methods deemed by the board of trustees to represent fair value. Investments in Vanguard Market Liquidity Fund are valued at that fund’s net asset value. Temporary cash investments are valued using the latest bid prices or using valuations based on a matrix system (which considers such factors as security prices, yields, maturities, and ratings), both as furnished by independent pricing services.
2. Futures Contracts: The fund uses index futures contracts to a limited extent, with the objectives of maintaining full exposure to the stock market, enhancing returns, maintaining liquidity, and minimizing transaction costs. The fund may purchase futures contracts to immediately invest incoming cash in the market, or sell futures in response to cash outflows, thereby simulating a fully invested position in the underlying index while maintaining a cash balance for liquidity. The fund may seek to enhance returns by using futures contracts instead of the underlying securities when futures are believed to be priced more attractively than the underlying securities. The primary risks associated with the use of futures contracts are imperfect correlation between changes in market values of stocks held by the fund and the prices of futures contracts, and the possibility of an illiquid market. Counterparty risk involving futures is mitigated because a regulated clearinghouse is the counterparty instead of the clearing broker. To further mitigate counterparty risk, the fund trades futures contracts on an exchange, monitors the financial strength of its clearing brokers and clearinghouse, and has entered into clearing agreements with its clearing brokers. The clearinghouse imposes initial margin requirements to secure the fund’s performance and requires daily settlement of variation margin representing changes in the market value of each contract.
Futures contracts are valued at their quoted daily settlement prices. The aggregate settlement values of the contracts are not recorded in the Statement of Net Assets. Fluctuations in the value of the contracts are recorded in the Statement of Net Assets as an asset (liability) and in the Statement of Operations as unrealized appreciation (depreciation) until the contracts are closed, when they are recorded as realized futures gains (losses).
During the year ended December 31, 2016, the fund’s average investments in long and short futures contracts represented less than 1% and 0% of net assets, respectively, based on the average of aggregate settlement values at each quarter-end during the period.
24
Growth Index Fund
3. Federal Income Taxes: The fund intends to continue to qualify as a regulated investment company and distribute all of its taxable income. Management has analyzed the fund’s tax positions taken for all open federal income tax years (December 31, 2013–2016), and has concluded that no provision for federal income tax is required in the fund’s financial statements.
4. Distributions: Distributions to shareholders are recorded on the ex-dividend date.
5. Securities Lending: To earn additional income, the fund lends its securities to qualified institutional borrowers. Security loans are subject to termination by the fund at any time, and are required to be secured at all times by collateral in an amount at least equal to the market value of securities loaned. Daily market fluctuations could cause the value of loaned securities to be more or less than the value of the collateral received. When this occurs, the collateral is adjusted and settled on the next business day. The fund further mitigates its counterparty risk by entering into securities lending transactions only with a diverse group of prequalified counterparties, monitoring their financial strength, and entering into master securities lending agreements with its counterparties. The master securities lending agreements provide that, in the event of a counterparty’s default (including bankruptcy), the fund may terminate any loans with that borrower, determine the net amount owed, and sell or retain the collateral up to the net amount owed to the fund; however, such actions may be subject to legal proceedings. While collateral mitigates counterparty risk, in the absence of a default the fund may experience delays and costs in recovering the securities loaned. The fund invests cash collateral received in Vanguard Market Liquidity Fund, and records a liability in the Statement of Net Assets for the return of the collateral, during the period the securities are on loan. Securities lending income represents fees charged to borrowers plus income earned on invested cash collateral, less expenses associated with the loan. During the term of the loan, the fund is entitled to all distributions made on or in respect of the loaned securities.
6. Credit Facility: The fund and certain other funds managed by The Vanguard Group (“Vanguard”) participate in a $3.1 billion committed credit facility provided by a syndicate of lenders pursuant to a credit agreement that may be renewed annually; each fund is individually liable for its borrowings, if any, under the credit facility. Borrowings may be utilized for temporary and emergency purposes, and are subject to the fund’s regulatory and contractual borrowing restrictions. The participating funds are charged administrative fees and an annual commitment fee of 0.10% of the undrawn amount of the facility; these fees are allocated to the funds based on a method approved by the fund’s board of trustees and included in Management and Administrative expenses on the fund’s Statement of Operations. Any borrowings under this facility bear interest at a rate based upon the higher of the one-month London Interbank Offered Rate, federal funds effective rate, or overnight bank funding rate plus an agreed-upon spread.
The fund had no borrowings outstanding at December 31, 2016, or at any time during the period then ended.
7. Other: Dividend income is recorded on the ex-dividend date. Interest income includes income distributions received from Vanguard Market Liquidity Fund and is accrued daily. Premiums and discounts on debt securities purchased are amortized and accreted, respectively, to interest income over the lives of the respective securities. Security transactions are accounted for on the date securities are bought or sold. Costs used to determine realized gains (losses) on the sale of investment securities are those of the specific securities sold.
25
Growth Index Fund
Each class of shares has equal rights as to assets and earnings, except that each class separately bears certain class-specific expenses related to maintenance of shareholder accounts (included in Management and Administrative expenses) and shareholder reporting. Marketing and distribution expenses are allocated to each class of shares based on a method approved by the board of trustees. Income, other non-class-specific expenses, and gains and losses on investments are allocated to each class of shares based on its relative net assets.
B. In accordance with the terms of a Funds’ Service Agreement (the “FSA”) between Vanguard and the fund, Vanguard furnishes to the fund investment advisory, corporate management, administrative, marketing, and distribution services at Vanguard’s cost of operations (as defined by the FSA). These costs of operations are allocated to the fund based on methods and guidelines approved by the board of trustees. Vanguard does not require reimbursement in the current period for certain costs of operations (such as deferred compensation/benefits and risk/insurance costs); the fund’s liability for these costs of operations is included in Payables to Vanguard on the Statement of Net Assets.
Upon the request of Vanguard, the fund may invest up to 0.40% of its net assets as capital in Vanguard. At December 31, 2016, the fund had contributed to Vanguard capital in the amount of $3,997,000, representing 0.01% of the fund’s net assets and 1.60% of Vanguard’s capitalization. The fund’s trustees and officers are also directors and employees, respectively, of Vanguard.
C. Various inputs may be used to determine the value of the fund’s investments. These inputs are summarized in three broad levels for financial statement purposes. The inputs or methodologies used to value securities are not necessarily an indication of the risk associated with investing in those securities.
Level 1—Quoted prices in active markets for identical securities.
Level 2—Other significant observable inputs (including quoted prices for similar securities, interest rates, prepayment speeds, credit risk, etc.).
Level 3—Significant unobservable inputs (including the fund’s own assumptions used to determine the fair value of investments).
The following table summarizes the market value of the fund’s investments as of December 31, 2016, based on the inputs used to value them:
| | | |
| | Level 1 | Level 2 | Level 3 |
| Investments | ($000) | ($000) | ($000) |
| Common Stocks | 54,219,295 | — | — |
| Temporary Cash Investments | 252,870 | 4,841 | — |
| Futures Contracts—Liabilities1 | (503) | — | — |
| Total | 54,471,662 | 4,841 | — |
| 1 Represents variation margin on the last day of the reporting period. |
26
Growth Index Fund
D. At December 31, 2016, the aggregate settlement value of open futures contracts and the related unrealized appreciation (depreciation) were:
| | | | |
| | | | ($000) |
| | | | Aggregate | |
| | | Number of | Settlement | Unrealized |
| | | Long (Short) | Value | Appreciation |
| Futures Contracts | Expiration | Contracts | Long (Short) | (Depreciation) |
| E-mini S&P 500 Index | March 2017 | 1,130 | 126,345 | (1,260) |
Unrealized appreciation (depreciation) on open futures contracts is required to be treated as realized gain (loss) for tax purposes.
E. Distributions are determined on a tax basis and may differ from net investment income and realized capital gains for financial reporting purposes. Differences may be permanent or temporary. Permanent differences are reclassified among capital accounts in the financial statements to reflect their tax character. Temporary differences arise when certain items of income, expense, gain, or loss are recognized in different periods for financial statement and tax purposes. These differences will reverse at some time in the future. Differences in classification may also result from the treatment of short-term gains as ordinary income for tax purposes.
During the year ended December 31, 2016, the fund realized $1,361,993,000 of net capital gains resulting from in-kind redemptions—in which shareholders exchanged fund shares for securities held by the fund rather than for cash. Because such gains are not taxable to the fund, and are not distributed to shareholders, they have been reclassified from accumulated net realized losses to paid-in capital.
For tax purposes, at December 31, 2016, the fund had $6,891,000 of ordinary income available for distribution. At December 31, 2016, the fund had available capital losses totaling $1,314,208,000 to offset future net capital gains. Of this amount, $300,177,000 is subject to expiration on December 31, 2017. Capital losses of $1,014,031,000 realized beginning in fiscal 2011 may be carried forward indefinitely under the Regulated Investment Company Modernization Act of 2010, but must be used before any expiring loss carryforwards.
At December 31, 2016, the cost of investment securities for tax purposes was $36,602,320,000. Net unrealized appreciation of investment securities for tax purposes was $17,874,686,000, consisting of unrealized gains of $18,665,992,000 on securities that had risen in value since their purchase and $791,306,000 in unrealized losses on securities that had fallen in value since their purchase.
F. During the year ended December 31, 2016, the fund purchased $10,368,985,000 of investment securities and sold $8,295,074,000 of investment securities, other than temporary cash investments. Purchases and sales include $4,046,195,000 and $2,859,208,000, respectively, in connection with in-kind purchases and redemptions of the fund’s capital shares.
The fund purchased securities from and sold securities to other Vanguard funds or accounts managed by Vanguard or its affiliates, in accordance with procedures adopted by the board of trustees in compliance with Rule 17a-7 of the Investment Company Act of 1940. For the year ended December 31, 2016, such purchases and sales were $519,571,000 and $1,428,133,000, respectively; these amounts are included in the purchases and sales of investment securities noted above.
27
Growth Index Fund
G. Capital share transactions for each class of shares were:
| | | | |
| | Year Ended December 31, |
| | 2016 | 2015 |
| | Amount | Shares | Amount | Shares |
| | ($000) | (000) | ($000) | (000) |
| Investor Shares | | | | |
| Issued | 382,462 | 6,951 | 480,677 | 8,715 |
| Issued in Lieu of Cash Distributions | 35,730 | 634 | 34,042 | 615 |
| Redeemed | (650,436) | (11,787) | (815,660) | (14,748) |
| Net Increase (Decrease)—Investor Shares | (232,244) | (4,202) | (300,941) | (5,418) |
| ETF Shares | | | | |
| Issued | 4,308,390 | 39,724 | 6,718,956 | 62,729 |
| Issued in Lieu of Cash Distributions | — | — | — | — |
| Redeemed | (2,902,279) | (27,375) | (3,698,115) | (34,325) |
| Net Increase (Decrease)—ETF Shares | 1,406,111 | 12,349 | 3,020,841 | 28,404 |
| Admiral Shares | | | | |
| Issued | 3,639,459 | 65,786 | 3,735,301 | 67,661 |
| Issued in Lieu of Cash Distributions | 223,747 | 3,972 | 188,346 | 3,407 |
| Redeemed | (2,831,253) | (51,214) | (2,332,362) | (42,325) |
| Net Increase (Decrease)—Admiral Shares | 1,031,953 | 18,544 | 1,591,285 | 28,743 |
| Institutional Shares | | | | |
| Issued | 1,562,692 | 28,374 | 1,835,127 | 33,331 |
| Issued in Lieu of Cash Distributions | 126,330 | 2,244 | 120,650 | 2,183 |
| Redeemed | (1,769,484) | (32,055) | (2,274,553) | (41,972) |
| Net Increase (Decrease)—Institutional Shares | (80,462) | (1,437) | (318,776) | (6,458) |
H. Management has determined that no material events or transactions occurred subsequent to December 31, 2016, that would require recognition or disclosure in these financial statements.
28
Value Index Fund
Fund Profile
As of December 31, 2016
| | | | |
| Share-Class Characteristics | | | | |
| | Investor | | Admiral | Institutional |
| | Shares | ETF Shares | Shares | Shares |
| Ticker Symbol | VIVAX | VTV | VVIAX | VIVIX |
| Expense Ratio1 | 0.22% | 0.08% | 0.08% | 0.07% |
| 30-Day SEC Yield | 2.42% | 2.53% | 2.53% | 2.54% |
| | | |
| Portfolio Characteristics | | |
| | | | DJ |
| | | | U.S. |
| | | | Total |
| | | CRSP US | Market |
| | | Large Cap | FA |
| | Fund Value Index | Index |
| Number of Stocks | 327 | 322 | 3,833 |
| Median Market Cap | $88.3B | $88.3B | $54.1B |
| Price/Earnings Ratio | 21.0x | 21.0x | 24.4x |
| Price/Book Ratio | 2.2x | 2.2x | 2.8x |
| Return on Equity | 15.1% | 15.1% | 16.5% |
| Earnings Growth Rate | 2.0% | 2.0% | 8.2% |
| Dividend Yield | 2.6% | 2.6% | 2.0% |
| Foreign Holdings | 0.0% | 0.0% | 0.0% |
| Turnover Rate | 7% | — | — |
| Short-Term Reserves | -0.1% | — | — |
| | | |
| Sector Diversification (% of equity exposure) |
| | | | DJ |
| | | CRSP US | U.S. Total |
| | | Large Cap | Market |
| | Fund | Value Index | FA Index |
| Basic Materials | 3.4% | 3.4% | 2.6% |
| Consumer Goods | 9.2 | 9.2 | 9.6 |
| Consumer Services | 6.4 | 6.4 | 13.1 |
| Financials | 25.5 | 25.5 | 20.8 |
| Health Care | 11.8 | 11.8 | 12.2 |
| Industrials | 11.9 | 12.0 | 12.9 |
| Oil & Gas | 10.2 | 10.2 | 6.9 |
| Technology | 11.2 | 11.1 | 16.4 |
| Telecommunications | 4.6 | 4.6 | 2.4 |
| Utilities | 5.8 | 5.8 | 3.1 |
| | |
| Volatility Measures | | |
| | | DJ |
| | CRSP US | U.S. Total |
| | Large Cap | Market |
| | Value Index | FA Index |
| R-Squared | 1.00 | 0.93 |
| Beta | 1.00 | 0.92 |
| These measures show the degree and timing of the fund’s |
| fluctuations compared with the indexes over 36 months. |
| | |
| Ten Largest Holdings (% of total net assets) |
| Microsoft Corp. | Software | 4.2% |
| Exxon Mobil Corp. | Integrated Oil & Gas | 3.5 |
| Berkshire Hathaway Inc. Reinsurance | 2.9 |
| Johnson & Johnson | Pharmaceuticals | 2.9 |
| JPMorgan Chase & Co. | Banks | 2.9 |
| General Electric Co. | Diversified Industrials | 2.6 |
| AT&T Inc. | Fixed Line | |
| | Telecommunications | 2.4 |
| Wells Fargo & Co. | Banks | 2.3 |
| Procter & Gamble Co. | Nondurable | |
| | Household Products | 2.1 |
| Bank of America Corp. | Banks | 2.1 |
| Top Ten | | 27.9% |
| The holdings listed exclude any temporary cash investments and equity index products. |
1 The expense ratios shown are from the prospectus dated April 27, 2016, and represent estimated costs for the current fiscal year. For the fiscal year ended December 31, 2016, the expense ratios were 0.18% for Investor Shares, 0.06% for ETF Shares, 0.06% for Admiral Shares, and 0.05% for Institutional Shares.
29
Value Index Fund
Investment Focus
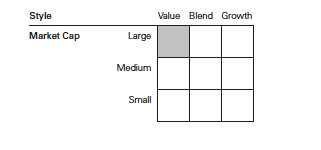
30
Value Index Fund
Performance Summary
All of the returns in this report represent past performance, which is not a guarantee of future results that may be achieved by the fund. (Current performance may be lower or higher than the performance data cited. For performance data current to the most recent month-end, visit our website at vanguard.com/performance.) Note, too, that both investment returns and principal value can fluctuate widely, so an investor’s shares, when sold, could be worth more or less than their original cost. The returns shown do not reflect taxes that a shareholder would pay on fund distributions or on the sale of fund shares.
Cumulative Performance: December 31, 2006, Through December 31, 2016
Initial Investment of $10,000
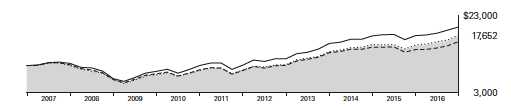
| | | | | |
| | | Average Annual Total Returns | |
| | | Periods Ended December 31, 2016 | |
| | | | | | Final Value |
| | | One | Five | Ten | of a $10,000 |
| | | Year | Years | Years | Investment |
| | Value Index Fund*Investor Shares | 16.75% | 14.82% | 5.85% | $17,652 |
| • • • • • • •• | Spliced Value Index | 16.93 | 15.04 | 6.00 | 17,914 |
| – – – – | Large-Cap Value Funds Average | 14.65 | 13.21 | 4.96 | 16,226 |
| | Dow Jones U.S. Total Stock Market | | | | |
| | Float Adjusted Index | 12.62 | 14.59 | 7.18 | 20,003 |
| For a benchmark description, see the Glossary. |
| Large-Cap Value Funds Average: Derived from data provided by Lipper, a Thomson Reuters Company. |
| | | | |
| | | | | Final Value |
| | One | Five | Ten | of a $10,000 |
| | Year | Years | Years | Investment |
| Value Index Fund | | | | |
| ETF Shares Net Asset Value | 16.88% | 14.98% | 5.99% | $17,887 |
| Spliced Value Index | 16.93 | 15.04 | 6.00 | 17,914 |
| Dow Jones U.S. Total Stock Market Float | | | | |
| Adjusted Index | 12.62 | 14.59 | 7.18 | 20,003 |
See Financial Highlights for dividend and capital gains information.
31
Value Index Fund
| | | | |
| | Average Annual Total Returns | |
| | Periods Ended December 31, 2016 | |
| |
| | | | | Final Value |
| | One | Five | Ten | of a $10,000 |
| | Year | Years | Years | Investment |
| Value Index Fund Admiral Shares | 16.86% | 14.98% | 5.98% | $17,881 |
| Spliced Value Index | 16.93 | 15.04 | 6.00 | 17,914 |
| Dow Jones U.S. Total Stock Market Float | | | | |
| Adjusted Index | 12.62 | 14.59 | 7.18 | 20,003 |
| | | | |
| | | | | Final Value |
| | One | Five | Ten | of a $5,000,000 |
| | Year | Years | Years | Investment |
| |
| Value Index Fund Institutional Shares | 16.87% | 14.99% | 6.01% | $8,963,184 |
| |
| Spliced Value Index | 16.93 | 15.04 | 6.00 | 8,956,769 |
| Dow Jones U.S. Total Stock Market Float | | | | |
| Adjusted Index | 12.62 | 14.59 | 7.18 | 10,001,613 |
| | | |
| Cumulative Returns of ETF Shares: December 31, 2006, Through December 31, 2016 | |
| | One | Five | Ten |
| | Year | Years | Years |
| Value Index Fund ETF Shares Market Price | 16.95% | 101.01% | 78.96% |
| Value Index Fund ETF Shares Net Asset Value | 16.88 | 100.93 | 78.87 |
| Spliced Value Index | 16.93 | 101.49 | 79.14 |
Fiscal-Year Total Returns (%): December 31, 2006, Through December 31, 2016
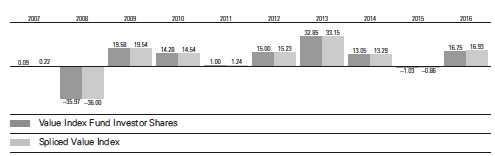
For a benchmark description, see the Glossary.
32
Value Index Fund
Financial Statements
Statement of Net Assets
As of December 31, 2016
The fund reports a complete list of its holdings in regulatory filings four times in each fiscal year, at the quarter-ends. For the second and fourth fiscal quarters, the lists appear in the fund’s semiannual and annual reports to shareholders. For the first and third fiscal quarters, the fund files the lists with the Securities and Exchange Commission on Form N-Q. Shareholders can look up the fund’s Forms N-Q on the SEC’s website at sec.gov. Forms N-Q may also be reviewed and copied at the SEC’s Public Reference Room (see the back cover of this report for further information).
| | | |
| | | | Market |
| | | | Value• |
| | | Shares | ($000) |
| Common Stocks (99.8%)1 | | |
| Basic Materials (3.4%) | | |
| | Dow Chemical Co. | 5,275,879 | 301,886 |
| | EI du Pont de Nemours | | |
| | & Co. | 4,088,059 | 300,064 |
| | Air Products & Chemicals | | |
| | Inc. | 1,023,671 | 147,224 |
| | LyondellBasell Industries | | |
| | NV Class A | 1,533,175 | 131,516 |
| | PPG Industries Inc. | 1,241,446 | 117,639 |
| | International Paper Co. | 1,933,585 | 102,596 |
| | Nucor Corp. | 1,497,590 | 89,137 |
| * | Freeport-McMoRan Inc. | 5,762,481 | 76,007 |
| | Celanese Corp. Class A | 673,337 | 53,019 |
| | Eastman Chemical Co. | 655,485 | 49,299 |
| | Mosaic Co. | 1,646,878 | 48,303 |
| | Albemarle Corp. | 530,600 | 45,674 |
| | Newmont Mining Corp. | 1,247,931 | 42,517 |
| | Arconic Inc. | 2,069,378 | 38,366 |
| | FMC Corp. | 632,825 | 35,793 |
| | CF Industries Holdings | | |
| | Inc. | 1,104,366 | 34,765 |
| | Ashland Global Holdings | | |
| | Inc. | 293,401 | 32,066 |
| | Avery Dennison Corp. | 420,504 | 29,528 |
| | Reliance Steel | | |
| | & Aluminum Co. | 326,481 | 25,968 |
| * | Alcoa Corp. | 428,778 | 12,040 |
| | Westlake Chemical Corp. | 181,719 | 10,174 |
| | | | 1,723,581 |
| Consumer Goods (9.2%) | | |
| | Procter & Gamble Co. | 12,589,284 | 1,058,507 |
| | PepsiCo Inc. | 6,747,248 | 705,965 |
| | Altria Group Inc. | 4,587,753 | 310,224 |
| | Mondelez International | | |
| | Inc. Class A | 6,902,898 | 306,005 |
| | Ford Motor Co. | 18,352,844 | 222,620 |
| | General Motors Co. | 6,094,927 | 212,347 |
| | Kimberly-Clark Corp. | 1,684,186 | 192,199 |
| | General Mills Inc. | 2,780,989 | 171,782 |
| | | |
| | Archer-Daniels-Midland | | |
| | Co. | 2,705,839 | 123,522 |
| | Delphi Automotive plc | 1,273,570 | 85,775 |
| | Kellogg Co. | 1,154,947 | 85,131 |
| | Tyson Foods Inc. Class A | 1,366,600 | 84,292 |
| | Conagra Brands Inc. | 2,058,517 | 81,414 |
| | Molson Coors Brewing | | |
| | Co. Class B | 821,117 | 79,903 |
| | Dr Pepper Snapple Group | | |
| | Inc. | 863,875 | 78,328 |
| | Clorox Co. | 605,416 | 72,662 |
| | JM Smucker Co. | 520,113 | 66,606 |
| | Whirlpool Corp. | 353,118 | 64,186 |
| | Genuine Parts Co. | 664,394 | 63,476 |
| | Campbell Soup Co. | 940,934 | 56,898 |
| | Harley-Davidson Inc. | 831,262 | 48,496 |
| | Bunge Ltd. | 658,870 | 47,597 |
| | Coach Inc. | 1,319,063 | 46,194 |
| | Mattel Inc. | 1,613,010 | 44,438 |
| | Lear Corp. | 330,105 | 43,696 |
| | Hasbro Inc. | 527,982 | 41,072 |
| | Stanley Black & Decker | | |
| | Inc. | 355,586 | 40,782 |
| | Leucadia National Corp. | 1,523,606 | 35,424 |
| | PVH Corp. | 377,232 | 34,041 |
| | PulteGroup Inc. | 1,399,939 | 25,731 |
| | Ralph Lauren Corp. | | |
| | Class A | 265,925 | 24,018 |
| | DR Horton Inc. | 849,050 | 23,204 |
| | Ingredion Inc. | 171,082 | 21,378 |
| | Lennar Corp. Class A | 482,521 | 20,715 |
| * | Edgewell Personal Care | | |
| | Co. | 272,352 | 19,879 |
| | Goodyear Tire & Rubber | | |
| | Co. | 618,224 | 19,085 |
| * | Lamb Weston Holdings | | |
| | Inc. | 344,420 | 13,036 |
| | Pilgrim’s Pride Corp. | 236,636 | 4,494 |
| | Lennar Corp. Class B | 1,431 | 49 |
| | | | 4,675,171 |
33
Value Index Fund
| | | |
| | | | Market |
| | | | Value• |
| | | Shares | ($000) |
| Consumer Services (6.4%) | | |
| | Wal-Mart Stores Inc. | 7,274,813 | 502,835 |
| | CVS Health Corp. | 5,017,175 | 395,905 |
| | Target Corp. | 2,641,569 | 190,801 |
| | Delta Air Lines Inc. | 3,521,550 | 173,225 |
| | Time Warner Inc. | 1,722,427 | 166,266 |
| | Kroger Co. | 4,439,937 | 153,222 |
| | McKesson Corp. | 1,063,144 | 149,319 |
| * | eBay Inc. | 4,994,186 | 148,277 |
| | Sysco Corp. | 2,314,960 | 128,179 |
| | Cardinal Health Inc. | 1,505,427 | 108,346 |
| | American Airlines Group | | |
| | Inc. | 2,315,348 | 108,104 |
| | Omnicom Group Inc. | 1,109,121 | 94,397 |
| * | United Continental | | |
| | Holdings Inc. | 1,288,585 | 93,912 |
| | AmerisourceBergen Corp. | | |
| | Class A | 776,595 | 60,722 |
| | Viacom Inc. Class B | 1,679,928 | 58,966 |
| | Best Buy Co. Inc. | 1,268,118 | 54,111 |
| | Macy’s Inc. | 1,450,495 | 51,942 |
| | Las Vegas Sands Corp. | 938,278 | 50,113 |
| | Carnival Corp. | 884,816 | 46,064 |
| | Whole Foods Market Inc. | 1,494,505 | 45,971 |
| | Interpublic Group of Cos. | | |
| | Inc. | 1,866,904 | 43,704 |
| | Darden Restaurants Inc. | 578,800 | 42,090 |
| | Kohl’s Corp. | 844,560 | 41,704 |
| | Aramark | 1,151,679 | 41,138 |
| * | Liberty Interactive Corp. | | |
| | QVC Group Class A | 1,951,125 | 38,984 |
| * | Liberty Media Corp-Liberty | |
| | SiriusXM Class C | 844,468 | 28,644 |
| | Staples Inc. | 3,072,558 | 27,807 |
| | Bed Bath & Beyond Inc. | 679,391 | 27,611 |
| ^ | Nordstrom Inc. | 573,643 | 27,495 |
| | News Corp. Class A | 2,356,739 | 27,008 |
| | H&R Block Inc. | 1,028,240 | 23,639 |
| | Gap Inc. | 1,033,990 | 23,203 |
| ^ | Tiffany & Co. | 293,600 | 22,733 |
| * | Rite Aid Corp. | 2,475,653 | 20,399 |
| * | Liberty Media Corp-Liberty | | |
| | SiriusXM Class A | 412,253 | 14,231 |
| | Williams-Sonoma Inc. | 186,655 | 9,032 |
| * | AutoNation Inc. | 165,699 | 8,061 |
| | News Corp. Class B | 12,704 | 150 |
| | | | 3,248,310 |
| Financials (25.4%) | | |
| * | Berkshire Hathaway Inc. | | |
| | Class B | 9,063,984 | 1,477,248 |
| | JPMorgan Chase & Co. | 16,834,079 | 1,452,613 |
| | Wells Fargo & Co. | 21,264,834 | 1,171,905 |
| | Bank of America Corp. | 47,539,525 | 1,050,623 |
| | Citigroup Inc. | 13,406,659 | 796,758 |
| | |
| Goldman Sachs Group | | |
| Inc. | 1,683,699 | 403,162 |
| US Bancorp | 7,596,459 | 390,230 |
| American International | | |
| Group Inc. | 4,832,189 | 315,590 |
| Morgan Stanley | 6,605,534 | 279,084 |
| Chubb Ltd. | 2,078,760 | 274,646 |
| American Express Co. | 3,658,418 | 271,016 |
| PNC Financial Services | | |
| Group Inc. | 2,287,825 | 267,584 |
| Bank of New York Mellon | | |
| Corp. | 4,723,626 | 223,805 |
| MetLife Inc. | 4,134,905 | 222,830 |
| Prudential Financial Inc. | 2,022,144 | 210,424 |
| Capital One Financial | | |
| Corp. | 2,268,491 | 197,903 |
| BB&T Corp. | 3,815,761 | 179,417 |
| CME Group Inc. | 1,515,913 | 174,861 |
| Travelers Cos. Inc. | 1,335,799 | 163,528 |
| Synchrony Financial | 3,881,130 | 140,769 |
| Discover Financial | | |
| Services | 1,854,644 | 133,701 |
| Aflac Inc. | 1,919,034 | 133,565 |
| Allstate Corp. | 1,731,723 | 128,355 |
| State Street Corp. | 1,632,483 | 126,877 |
| SunTrust Banks Inc. | 2,307,983 | 126,593 |
| Equity Residential | 1,719,402 | 110,661 |
| M&T Bank Corp. | 656,156 | 102,642 |
| Progressive Corp. | 2,731,087 | 96,954 |
| Fifth Third Bancorp | 3,553,345 | 95,834 |
| KeyCorp | 5,081,973 | 92,848 |
| Northern Trust Corp. | 1,011,490 | 90,073 |
| Citizens Financial Group | | |
| Inc. | 2,407,146 | 85,767 |
| Hartford Financial | | |
| Services Group Inc. | 1,776,431 | 84,647 |
| Regions Financial Corp. | 5,788,989 | 83,130 |
| Ameriprise Financial Inc. | 743,181 | 82,448 |
| Principal Financial Group | | |
| Inc. | 1,352,742 | 78,270 |
| Willis Towers Watson plc | 610,836 | 74,693 |
| Lincoln National Corp. | 1,074,798 | 71,227 |
| Huntington Bancshares | | |
| Inc. | 5,100,998 | 67,435 |
| Host Hotels & Resorts | | |
| Inc. | 3,479,076 | 65,546 |
| Franklin Resources Inc. | 1,604,829 | 63,519 |
| Loews Corp. | 1,346,804 | 63,071 |
| Invesco Ltd. | 1,921,155 | 58,288 |
| Cincinnati Financial Corp. | 738,878 | 55,970 |
| Comerica Inc. | 810,006 | 55,169 |
| Western Union Co. | 2,279,967 | 49,521 |
| Unum Group | 1,091,521 | 47,950 |
| Annaly Capital | | |
| Management Inc. | 4,790,821 | 47,764 |
34
Value Index Fund
| | | |
| | | | Market |
| | | | Value• |
| | | Shares | ($000) |
| * | Arch Capital Group Ltd. | 549,948 | 47,455 |
| | XL Group Ltd. | 1,265,270 | 47,144 |
| | Macerich Co. | 640,905 | 45,402 |
| | Duke Realty Corp. | 1,664,674 | 44,214 |
| | FNF Group | 1,229,590 | 41,757 |
| | Zions Bancorporation | 957,863 | 41,226 |
| | CIT Group Inc. | 950,142 | 40,552 |
| | Ally Financial Inc. | 2,106,925 | 40,074 |
| | Torchmark Corp. | 530,011 | 39,094 |
| | Reinsurance Group of | | |
| | America Inc. Class A | 303,036 | 38,131 |
| | Nasdaq Inc. | 546,796 | 36,701 |
| | Voya Financial Inc. | 915,210 | 35,894 |
| | New York Community | | |
| | Bancorp Inc. | 2,188,286 | 34,816 |
| | Everest Re Group Ltd. | 152,157 | 32,927 |
| | HCP Inc. | 1,103,887 | 32,807 |
| | WR Berkley Corp. | 428,098 | 28,473 |
| | People’s United Financial | | |
| | Inc. | 1,469,670 | 28,453 |
| | AGNC Investment Corp. | 1,564,395 | 28,362 |
| | Axis Capital Holdings Ltd. | 415,872 | 27,144 |
| * | Liberty Broadband Corp. | 343,470 | 25,441 |
| | Lazard Ltd. Class A | 613,804 | 25,221 |
| | Kimco Realty Corp. | 949,810 | 23,897 |
| * | Alleghany Corp. | 34,870 | 21,205 |
| | Raymond James Financial | | |
| | Inc. | 301,752 | 20,902 |
| | Camden Property Trust | 205,540 | 17,280 |
| | Assurant Inc. | 133,998 | 12,443 |
| | Navient Corp. | 712,690 | 11,709 |
| * | Athene Holding Ltd. | | |
| | Class A | 111,727 | 5,362 |
| * | Liberty Broadband Corp. | | |
| | Class A | 58,019 | 4,204 |
| * | Santander Consumer USA | |
| | Holdings Inc. | 257,469 | 3,476 |
| * | Berkshire Hathaway Inc. | | |
| | Class A | 14 | 3,418 |
| | First Republic Bank | 1,360 | 125 |
| | Mid-America Apartment | | |
| | Communities Inc. | 510 | 50 |
| | | | 12,921,873 |
| Health Care (11.8%) | | |
| | Johnson & Johnson | 12,798,909 | 1,474,562 |
| | Pfizer Inc. | 28,548,760 | 927,264 |
| | Merck & Co. Inc. | 12,971,119 | 763,610 |
| | UnitedHealth Group Inc. | 4,477,897 | 716,643 |
| | Eli Lilly & Co. | 4,674,213 | 343,788 |
| | Abbott Laboratories | 6,923,342 | 265,926 |
| | Aetna Inc. | 1,650,072 | 204,625 |
| * | Express Scripts Holding | | |
| | Co. | 2,899,899 | 199,484 |
| | Anthem Inc. | 1,238,697 | 178,087 |
| | Cigna Corp. | 1,207,240 | 161,034 |
| | | |
| | Humana Inc. | 701,071 | 143,039 |
| | St. Jude Medical Inc. | 1,346,423 | 107,970 |
| * | HCA Holdings Inc. | 1,409,941 | 104,364 |
| | Baxter International Inc. | 2,301,866 | 102,065 |
| | Zimmer Biomet Holdings | | |
| | Inc. | 941,705 | 97,184 |
| | Quest Diagnostics Inc. | 651,922 | 59,912 |
| | Perrigo Co. plc | 639,316 | 53,210 |
| * | Hologic Inc. | 1,311,896 | 52,633 |
| | Universal Health Services | | |
| | Inc. Class B | 210,820 | 22,427 |
| | Patterson Cos. Inc. | 198,662 | 8,151 |
| * | Endo International plc | 1,870 | 31 |
| | | | 5,986,009 |
| Industrials (11.8%) | | |
| | General Electric Co. | 41,618,125 | 1,315,133 |
| | Honeywell International | | |
| | Inc. | 3,585,471 | 415,377 |
| | United Technologies | | |
| | Corp. | 3,485,731 | 382,106 |
| | Lockheed Martin Corp. | 1,171,077 | 292,699 |
| | Caterpillar Inc. | 2,751,220 | 255,148 |
| | Boeing Co. | 1,378,583 | 214,618 |
| | General Dynamics Corp. | 1,217,100 | 210,144 |
| | Raytheon Co. | 1,380,870 | 196,084 |
| | Northrop Grumman Corp. | 828,913 | 192,789 |
| | Johnson Controls | | |
| | International plc | 4,404,821 | 181,435 |
| | Emerson Electric Co. | 3,022,528 | 168,506 |
| | CSX Corp. | 4,404,707 | 158,261 |
| | Norfolk Southern Corp. | 1,372,846 | 148,363 |
| | Waste Management Inc. | 2,078,454 | 147,383 |
| | Deere & Co. | 1,404,611 | 144,731 |
| | Eaton Corp. plc | 2,124,080 | 142,505 |
| | TE Connectivity Ltd. | 1,670,926 | 115,762 |
| | Cummins Inc. | 791,243 | 108,139 |
| | PACCAR Inc. | 1,648,346 | 105,329 |
| | FedEx Corp. | 562,321 | 104,704 |
| | Illinois Tool Works Inc. | 745,693 | 91,318 |
| | Ingersoll-Rand plc | 1,214,759 | 91,155 |
| | Parker-Hannifin Corp. | 627,274 | 87,818 |
| | Republic Services Inc. | | |
| | Class A | 1,119,014 | 63,840 |
| | Ball Corp. | 824,607 | 61,903 |
| | WestRock Co. | 1,182,662 | 60,044 |
| | Rockwell Collins Inc. | 613,878 | 56,943 |
| | Dover Corp. | 730,527 | 54,738 |
| | L-3 Communications | | |
| | Holdings Inc. | 326,981 | 49,737 |
| | Pentair plc | 767,656 | 43,042 |
| | Xylem Inc. | 847,601 | 41,973 |
| | Xerox Corp. | 4,076,603 | 35,589 |
| * | Crown Holdings Inc. | 659,706 | 34,681 |
| | Fluor Corp. | 658,185 | 34,568 |
35
Value Index Fund
| | | |
| | | | Market |
| | | | Value• |
| | | Shares | ($000) |
| * | Jacobs Engineering Group | |
| | Inc. | 567,779 | 32,363 |
| * | Arrow Electronics Inc. | 421,205 | 30,032 |
| | Flowserve Corp. | 614,959 | 29,549 |
| | Avnet Inc. | 602,280 | 28,675 |
| | ManpowerGroup Inc. | 315,380 | 28,028 |
| | Allison Transmission | | |
| | Holdings Inc. | 699,901 | 23,580 |
| * | United Rentals Inc. | 197,906 | 20,895 |
| | Owens Corning | 266,316 | 13,731 |
| | L3 Technologies Inc. | 165 | 25 |
| | | | 6,013,443 |
| Oil & Gas (10.2%) | | |
| | Exxon Mobil Corp. | 19,508,227 | 1,760,813 |
| | Chevron Corp. | 8,881,054 | 1,045,300 |
| | ConocoPhillips | 5,829,390 | 292,286 |
| | Schlumberger Ltd. | 3,271,296 | 274,625 |
| | Occidental Petroleum | | |
| | Corp. | 3,593,482 | 255,964 |
| | Phillips 66 | 2,081,796 | 179,888 |
| | Valero Energy Corp. | 2,128,678 | 145,431 |
| | Spectra Energy Corp. | 3,298,825 | 135,549 |
| | Baker Hughes Inc. | 1,988,198 | 129,173 |
| | Marathon Petroleum | | |
| | Corp. | 2,482,010 | 124,969 |
| | Apache Corp. | 1,784,143 | 113,239 |
| | Devon Energy Corp. | 2,339,081 | 106,826 |
| | Halliburton Co. | 1,938,260 | 104,840 |
| | Kinder Morgan Inc. | 4,461,418 | 92,396 |
| | Hess Corp. | 1,339,936 | 83,465 |
| | Marathon Oil Corp. | 3,983,918 | 68,962 |
| | National Oilwell Varco Inc. | 1,775,956 | 66,492 |
| | Tesoro Corp. | 549,606 | 48,063 |
| * | FMC Technologies Inc. | 1,066,398 | 37,889 |
| ^ | Helmerich & Payne Inc. | 485,293 | 37,562 |
| | OGE Energy Corp. | 945,876 | 31,639 |
| | HollyFrontier Corp. | 835,911 | 27,384 |
| * | Energen Corp. | 230,101 | 13,270 |
| | Murphy Oil Corp. | 388,177 | 12,084 |
| * | Weatherford International | | |
| | plc | 2,313,874 | 11,546 |
| | | | 5,199,655 |
| Other (0.0%)2 | | |
| * | Safeway Inc CVR (Casa | | |
| | Ley) Exp. 01/30/2018 | 376 | — |
| * | Safeway Inc CVR (PDC) | | |
| | Exp. 01/30/2017 | 376 | — |
| | | | — |
| Technology (11.2%) | | |
| | Microsoft Corp. | 34,750,423 | 2,159,391 |
| | Intel Corp. | 22,294,779 | 808,632 |
| | Cisco Systems Inc. | 23,615,589 | 713,663 |
| | International Business | | |
| | Machines Corp. | 4,026,055 | 668,285 |
| | | |
| | Oracle Corp. | 7,241,759 | 278,446 |
| | Hewlett Packard | | |
| | Enterprise Co. | 7,831,885 | 181,230 |
| | HP Inc. | 8,045,257 | 119,392 |
| | Corning Inc. | 4,474,654 | 108,600 |
| | Western Digital Corp. | 1,342,386 | 91,215 |
| | Symantec Corp. | 2,931,416 | 70,031 |
| | Motorola Solutions Inc. | 780,379 | 64,686 |
| | Harris Corp. | 584,375 | 59,881 |
| * | Dell Technologies Inc. | | |
| | Class V | 1,048,357 | 57,628 |
| | Seagate Technology plc | 1,385,004 | 52,866 |
| | CA Inc. | 1,473,586 | 46,816 |
| | NetApp Inc. | 1,310,348 | 46,216 |
| * | Synopsys Inc. | 711,626 | 41,886 |
| | Marvell Technology Group | | |
| | Ltd. | 1,806,331 | 25,054 |
| | Juniper Networks Inc. | 849,418 | 24,004 |
| | Garmin Ltd. | 491,217 | 23,819 |
| | Computer Sciences Corp. | 331,143 | 19,676 |
| * | Nuance Communications | | |
| | Inc. | 677,031 | 10,088 |
| | | | 5,671,505 |
| Telecommunications (4.6%) | | |
| | AT&T Inc. | 28,890,518 | 1,228,714 |
| | Verizon Communications | | |
| | Inc. | 19,178,675 | 1,023,758 |
| | CenturyLink Inc. | 2,580,994 | 61,376 |
| *,^ | Sprint Corp. | 2,812,822 | 23,684 |
| ^ | Frontier Communications | | |
| | Corp. | 2,768,749 | 9,358 |
| | | | 2,346,890 |
| Utilities (5.8%) | | |
| | NextEra Energy Inc. | 2,254,829 | 269,362 |
| | Duke Energy Corp. | 3,239,557 | 251,454 |
| | Southern Co. | 4,608,272 | 226,681 |
| | Dominion Resources Inc. | 2,947,243 | 225,729 |
| | Exelon Corp. | 4,334,119 | 153,818 |
| | American Electric Power | | |
| | Co. Inc. | 2,312,216 | 145,577 |
| | PG&E Corp. | 2,381,132 | 144,701 |
| | Sempra Energy | 1,175,872 | 118,340 |
| | Edison International | 1,532,097 | 110,296 |
| | PPL Corp. | 3,188,626 | 108,573 |
| | Consolidated Edison Inc. | 1,432,902 | 105,576 |
| | Public Service Enterprise | | |
| | Group Inc. | 2,378,934 | 104,388 |
| | Xcel Energy Inc. | 2,388,518 | 97,213 |
| | WEC Energy Group Inc. | 1,484,041 | 87,039 |
| | DTE Energy Co. | 843,788 | 83,122 |
| | Eversource Energy | 1,490,148 | 82,301 |
| | FirstEnergy Corp. | 2,001,992 | 62,002 |
| | Entergy Corp. | 842,358 | 61,888 |
36
Value Index Fund
| | | |
| | | | Market |
| | | | Value• |
| | | Shares | ($000) |
| | American Water Works | | |
| | Co. Inc. | 837,050 | 60,569 |
| | Ameren Corp. | 1,141,006 | 59,857 |
| | ONEOK Inc. | 989,975 | 56,834 |
| | CMS Energy Corp. | 1,321,270 | 54,991 |
| | CenterPoint Energy Inc. | 1,933,611 | 47,644 |
| | SCANA Corp. | 604,834 | 44,322 |
| | Pinnacle West Capital | | |
| | Corp. | 526,307 | 41,068 |
| | Alliant Energy Corp. | 1,072,929 | 40,653 |
| | AES Corp. | 3,116,436 | 36,213 |
| | NiSource Inc. | 1,525,188 | 33,768 |
| | Avangrid Inc. | 290,127 | 10,990 |
| * | Calpine Corp. | 847,554 | 9,687 |
| | | | 2,934,656 |
| Total Common Stocks | | |
| (Cost $40,583,971) | | 50,721,093 |
| Temporary Cash Investments (0.2%)1 | |
| Money Market Fund (0.2%) | | |
| 3,4 | Vanguard Market Liquidity | | |
| | Fund, 0.823% | 773,252 | 77,333 |
| | | |
| | | Face | |
| | | Amount | |
| | | ($000) | |
| U.S. Government and Agency Obligations (0.0%) |
| 5,6 | Federal Home Loan | | |
| | Bank Discount Notes, | | |
| | 0.390%, 2/1/17 | 600 | 600 |
| 6 | United States Treasury Bill, | | |
| | 0.487%, 3/16/17 | 400 | 399 |
| | United States Treasury Bill, | | |
| | 0.557%, 4/27/17 | 3,000 | 2,995 |
| 6 | United States Treasury Bill, | | |
| | 0.564%–0.587%, 5/4/17 | 600 | 599 |
| 6 | United States Treasury Bill, | | |
| | 0.587%–0.623%, 5/18/17 | 1,100 | 1,097 |
| 6 | United States Treasury Bill, | | |
| | 0.608%–0.618%, 5/25/17 | 2,100 | 2,095 |
| | | | 7,785 |
| Total Temporary Cash Investments | |
| (Cost $85,117) | | 85,118 |
| Total Investments (100.0%) | | |
| (Cost $40,669,088) | | 50,806,211 |
| | |
| | | Amount |
| | | ($000) |
| Other Assets and Liabilities (0.0%) | | |
| Other Assets | | |
| Investment in Vanguard | | 3,668 |
| Receivables for Investment Securities Sold | 681 |
| Receivables for Accrued Income | | 76,746 |
| Receivables for Capital Shares Issued | | 74,764 |
| Other Assets | | 206 |
| Total Other Assets | | 156,065 |
| Liabilities | | |
| Payables for Investment Securities | | |
| Purchased | | (14,062) |
| Collateral for Securities on Loan | | (22,409) |
| Payables for Capital Shares Redeemed | | (80,853) |
| Payables to Vanguard | | (23,158) |
| Other Liabilities | | (420) |
| Total Liabilities | | (140,902) |
| Net Assets (100%) | 50,821,374 |
| |
| At December 31, 2016, net assets consisted of: |
| | Amount |
| | ($000) |
| Paid-in Capital | 41,421,008 |
| Overdistributed Net Investment Income | (9,323) |
| Accumulated Net Realized Losses | (726,247) |
| Unrealized Appreciation (Depreciation) | |
| Investment Securities | 10,137,123 |
| Futures Contracts | (1,187) |
| Net Assets | 50,821,374 |
| |
| |
| Investor Shares—Net Assets | |
| Applicable to 43,801,014 outstanding | |
| $.001 par value shares of beneficial | |
| interest (unlimited authorization) | 1,587,158 |
| Net Asset Value Per Share— | |
| Investor Shares | $36.24 |
| |
| |
| ETF Shares—Net Assets | |
| Applicable to 292,087,991 outstanding | |
| $.001 par value shares of beneficial | |
| interest (unlimited authorization) | 27,126,412 |
| Net Asset Value Per Share— | |
| ETF Shares | $92.87 |
37
Value Index Fund
| |
| | Amount |
| | ($000) |
| Admiral Shares—Net Assets | |
| Applicable to 370,536,880 outstanding | |
| $.001 par value shares of beneficial | |
| interest (unlimited authorization) | 13,423,786 |
| Net Asset Value Per Share— | |
| Admiral Shares | $36.23 |
| |
| |
| Institutional Shares—Net Assets | |
| Applicable to 239,710,583 outstanding | |
| $.001 par value shares of beneficial | |
| interest (unlimited authorization) | 8,684,018 |
| Net Asset Value Per Share— | |
| Institutional Shares | $36.23 |
• See Note A in Notes to Financial Statements.
* Non-income-producing security.
^ Includes partial security positions on loan to broker-dealers. The total value of securities on loan is $21,223,000.
1 The fund invests a portion of its cash reserves in equity markets through the use of index futures contracts. After giving effect to futures
investments, the fund’s effective common stock and temporary cash investment positions represent 100.0% and 0.0%, respectively,
of net assets.
2 “Other” represents securities that are not classified by the fund’s benchmark index.
3 Affiliated money market fund available only to Vanguard funds and certain trusts and accounts managed by Vanguard. Rate shown is the
7-day yield.
4 Includes $22,409,000 of collateral received for securities on loan.
5 The issuer operates under a congressional charter; its securities are generally neither guaranteed by the U.S. Treasury nor backed by the
full faith and credit of the U.S. government.
6 Securities with a value of $4,591,000 have been segregated as initial margin for open futures contracts.
CVR—Contingent Value Rights.
See accompanying Notes, which are an integral part of the Financial Statements.
38
Value Index Fund
Statement of Operations
| |
| | Year Ended |
| | December 31, 2016 |
| | ($000) |
| Investment Income | |
| Income | |
| Dividends | 1,186,482 |
| Interest1 | 261 |
| Securities Lending—Net | 2,041 |
| Total Income | 1,188,784 |
| Expenses | |
| The Vanguard Group—Note B | |
| Investment Advisory Services | 4,275 |
| Management and Administrative—Investor Shares | 2,029 |
| Management and Administrative—ETF Shares | 8,754 |
| Management and Administrative—Admiral Shares | 4,249 |
| Management and Administrative—Institutional Shares | 2,691 |
| Marketing and Distribution—Investor Shares | 304 |
| Marketing and Distribution—ETF Shares | 1,317 |
| Marketing and Distribution—Admiral Shares | 1,158 |
| Marketing and Distribution—Institutional Shares | 181 |
| Custodian Fees | 431 |
| Auditing Fees | 37 |
| Shareholders’ Reports—Investor Shares | 62 |
| Shareholders’ Reports—ETF Shares | 488 |
| Shareholders’ Reports—Admiral Shares | 83 |
| Shareholders’ Reports—Institutional Shares | 75 |
| Trustees’ Fees and Expenses | 31 |
| Total Expenses | 26,165 |
| Net Investment Income | 1,162,619 |
| Realized Net Gain (Loss) | |
| Investment Securities Sold1 | 1,009,162 |
| Futures Contracts | 14,262 |
| Realized Net Gain (Loss) | 1,023,424 |
| Change in Unrealized Appreciation (Depreciation) | |
| Investment Securities | 4,806,487 |
| Futures Contracts | (1,116) |
| Change in Unrealized Appreciation (Depreciation) | 4,805,371 |
| Net Increase (Decrease) in Net Assets Resulting from Operations | 6,991,414 |
| 1 Interest income and realized net gain (loss) from an affiliated company of the fund were $244,000 and $6,000, respectively. |
See accompanying Notes, which are an integral part of the Financial Statements.
39
Value Index Fund
Statement of Changes in Net Assets
| | |
| | Year Ended December 31, |
| | 2016 | 2015 |
| | ($000) | ($000) |
| Increase (Decrease) in Net Assets | | |
| Operations | | |
| Net Investment Income | 1,162,619 | 963,281 |
| Realized Net Gain (Loss) | 1,023,424 | 1,001,536 |
| Change in Unrealized Appreciation (Depreciation) | 4,805,371 | (2,334,263) |
| Net Increase (Decrease) in Net Assets Resulting from Operations | 6,991,414 | (369,446) |
| Distributions | | |
| Net Investment Income | | |
| Investor Shares | (36,182) | (35,713) |
| ETF Shares | (607,079) | (471,450) |
| Admiral Shares | (309,973) | (258,590) |
| Institutional Shares | (206,990) | (198,037) |
| Realized Capital Gain | | |
| Investor Shares | — | — |
| ETF Shares | — | — |
| Admiral Shares | — | — |
| Institutional Shares | — | — |
| Total Distributions | (1,160,224) | (963,790) |
| Capital Share Transactions | | |
| Investor Shares | (872) | (143,297) |
| ETF Shares | 5,425,058 | 1,990,497 |
| Admiral Shares | 1,461,682 | 1,048,344 |
| Institutional Shares | 475,356 | (364,225) |
| Net Increase (Decrease) from Capital Share Transactions | 7,361,224 | 2,531,319 |
| Total Increase (Decrease) | 13,192,414 | 1,198,083 |
| Net Assets | | |
| Beginning of Period | 37,628,960 | 36,430,877 |
| End of Period1 | 50,821,374 | 37,628,960 |
| 1 Net Assets—End of Period includes undistributed (overdistributed) net investment income of ($9,323,000) and ($11,718,000). |
See accompanying Notes, which are an integral part of the Financial Statements.
40
Value Index Fund
Financial Highlights
| | | | | |
| Investor Shares | | | | | |
| |
| For a Share Outstanding | Year Ended December 31, |
| Throughout Each Period | 2016 | 2015 | 2014 | 2013 | 2012 |
| Net Asset Value, Beginning of Period | $31.82 | $32.95 | $29.78 | $22.93 | $20.47 |
| Investment Operations | | | | | |
| Net Investment Income | . 850 | .782 | . 691 | . 621 | . 595 |
| Net Realized and Unrealized Gain (Loss) | | | | | |
| on Investments | 4.415 | (1.130) | 3.164 | 6.847 | 2.458 |
| Total from Investment Operations | 5.265 | (.348) | 3.855 | 7.468 | 3.053 |
| Distributions | | | | | |
| Dividends from Net Investment Income | (. 845) | (.782) | (. 685) | (. 618) | (. 593) |
| Distributions from Realized Capital Gains | — | — | — | — | — |
| Total Distributions | (. 845) | (.782) | (. 685) | (. 618) | (. 593) |
| Net Asset Value, End of Period | $36.24 | $31.82 | $32.95 | $29.78 | $22.93 |
| |
| Total Return1 | 16.75% | -1.03% | 13.05% | 32.85% | 15.00% |
| |
| Ratios/Supplemental Data | | | | | |
| Net Assets, End of Period (Millions) | $1,587 | $1,397 | $1,593 | $1,731 | $1,482 |
| Ratio of Total Expenses to Average Net Assets | 0.18% | 0.22% | 0.23% | 0.24% | 0.24% |
| Ratio of Net Investment Income to | | | | | |
| Average Net Assets | 2.64% | 2.44% | 2.25% | 2.35% | 2.71% |
| Portfolio Turnover Rate 2 | 7% | 8% | 6% | 25% | 22% |
1 Total returns do not include account service fees that may have applied in the periods shown. Fund prospectuses provide information about
any applicable account service fees.
2 Excludes the value of portfolio securities received or delivered as a result of in-kind purchases or redemptions of the fund’s capital shares,
including ETF Creation Units.
See accompanying Notes, which are an integral part of the Financial Statements.
41
Value Index Fund
Financial Highlights
| | | | | |
| ETF Shares | | | | | |
| |
| For a Share Outstanding | Year Ended December 31, |
| Throughout Each Period | 2016 | 2015 | 2014 | 2013 | 2012 |
| Net Asset Value, Beginning of Period | $81.56 | $84.45 | $76.34 | $58.79 | $52.48 |
| Investment Operations | | | | | |
| Net Investment Income | 2.282 | 2.123 | 1.888 | 1.700 | 1.613 |
| Net Realized and Unrealized Gain (Loss) | | | | | |
| on Investments | 11.301 | (2.890) | 8.095 | 17.538 | 6.305 |
| Total from Investment Operations | 13.583 | (.767) | 9.983 | 19.238 | 7.918 |
| Distributions | | | | | |
| Dividends from Net Investment Income | (2.273) | (2.123) | (1.873) | (1.688) | (1.608) |
| Distributions from Realized Capital Gains | — | — | — | — | — |
| Total Distributions | (2.273) | (2.123) | (1.873) | (1.688) | (1.608) |
| Net Asset Value, End of Period | $92.87 | $81.56 | $84.45 | $76.34 | $58.79 |
| |
| Total Return | 16.88% | -0.89% | 13.19% | 33.03% | 15.19% |
| |
| Ratios/Supplemental Data | | | | | |
| Net Assets, End of Period (Millions) | $27,126 | $18,648 | $17,277 | $12,461 | $7,027 |
| Ratio of Total Expenses to Average Net Assets | 0.06% | 0.08% | 0.09% | 0.09% | 0.10% |
| Ratio of Net Investment Income to | | | | | |
| Average Net Assets | 2.76% | 2.58% | 2.39% | 2.50% | 2.85% |
| Portfolio Turnover Rate1 | 7% | 8% | 6% | 25% | 22% |
| 1 Excludes the value of portfolio securities received or delivered as a result of in-kind purchases or redemptions of the fund’s capital shares, |
| including ETF Creation Units. |
See accompanying Notes, which are an integral part of the Financial Statements.
42
Value Index Fund
Financial Highlights
| | | | | |
| Admiral Shares | | | | | |
| |
| For a Share Outstanding | Year Ended December 31, |
| Throughout Each Period | 2016 | 2015 | 2014 | 2013 | 2012 |
| Net Asset Value, Beginning of Period | $31.82 | $32.94 | $29.78 | $22.93 | $20.47 |
| Investment Operations | | | | | |
| Net Investment Income | . 890 | . 829 | .737 | . 663 | . 629 |
| Net Realized and Unrealized Gain (Loss) | | | | | |
| on Investments | 4.407 | (1.121) | 3.154 | 6.845 | 2.458 |
| Total from Investment Operations | 5.297 | (.292) | 3.891 | 7.508 | 3.087 |
| Distributions | | | | | |
| Dividends from Net Investment Income | (. 887) | (. 828) | (.731) | (. 658) | (. 627) |
| Distributions from Realized Capital Gains | — | — | — | — | — |
| Total Distributions | (. 887) | (. 828) | (.731) | (. 658) | (. 627) |
| Net Asset Value, End of Period | $36.23 | $31.82 | $32.94 | $29.78 | $22.93 |
| |
| Total Return1 | 16.86% | -0.86% | 13.18% | 33.05% | 15.18% |
| |
| Ratios/Supplemental Data | | | | | |
| Net Assets, End of Period (Millions) | $13,424 | $10,408 | $9,701 | $5,054 | $3,539 |
| Ratio of Total Expenses to Average Net Assets | 0.06% | 0.08% | 0.09% | 0.09% | 0.10% |
| Ratio of Net Investment Income to | | | | | |
| Average Net Assets | 2.76% | 2.58% | 2.39% | 2.50% | 2.85% |
| Portfolio Turnover Rate2 | 7% | 8% | 6% | 25% | 22% |
1 Total returns do not include account service fees that may have applied in the periods shown. Fund prospectuses provide information about
any applicable account service fees.
2 Excludes the value of portfolio securities received or delivered as a result of in-kind purchases or redemptions of the fund’s capital shares,
including ETF Creation Units.
See accompanying Notes, which are an integral part of the Financial Statements.
43
Value Index Fund
Financial Highlights
| | | | | |
| Institutional Shares | | | | | |
| |
| For a Share Outstanding | Year Ended December 31, |
| Throughout Each Period | 2016 | 2015 | 2014 | 2013 | 2012 |
| Net Asset Value, Beginning of Period | $31.82 | $32.94 | $29.78 | $22.93 | $20.47 |
| Investment Operations | | | | | |
| Net Investment Income | . 893 | . 831 | .739 | . 666 | . 633 |
| Net Realized and Unrealized Gain (Loss) | | | | | |
| on Investments | 4.407 | (1.120) | 3.154 | 6.846 | 2.458 |
| Total from Investment Operations | 5.300 | (.289) | 3.893 | 7.512 | 3.091 |
| Distributions | | | | | |
| Dividends from Net Investment Income | (. 890) | (. 831) | (.733) | (. 662) | (. 631) |
| Distributions from Realized Capital Gains | — | — | — | — | — |
| Total Distributions | (. 890) | (. 831) | (.733) | (. 662) | (. 631) |
| Net Asset Value, End of Period | $36.23 | $31.82 | $32.94 | $29.78 | $22.93 |
| |
| Total Return | 16.87% | -0.85% | 13.19% | 33.07% | 15.20% |
| |
| Ratios/Supplemental Data | | | | | |
| Net Assets, End of Period (Millions) | $8,684 | $7,176 | $7,860 | $6,431 | $4,369 |
| Ratio of Total Expenses to Average Net Assets | 0.05% | 0.07% | 0.08% | 0.08% | 0.08% |
| Ratio of Net Investment Income to | | | | | |
| Average Net Assets | 2.77% | 2.59% | 2.40% | 2.51% | 2.87% |
| Portfolio Turnover Rate1 | 7% | 8% | 6% | 25% | 22% |
| 1 Excludes the value of portfolio securities received or delivered as a result of in-kind purchases or redemptions of the fund’s capital shares, |
| including ETF Creation Units. |
See accompanying Notes, which are an integral part of the Financial Statements.
44
Value Index Fund
Notes to Financial Statements
Vanguard Value Index Fund is registered under the Investment Company Act of 1940 as an open-end investment company, or mutual fund. The fund offers four classes of shares: Investor Shares, ETF Shares, Admiral Shares, and Institutional Shares. Investor Shares are available to any investor who meets the fund’s minimum purchase requirements. ETF Shares are listed for trading on NYSE Arca; they can be purchased and sold through a broker. Admiral Shares and Institutional Shares are designed for investors who meet certain administrative, service, and account-size criteria.
A. The following significant accounting policies conform to generally accepted accounting principles for U.S. investment companies. The fund consistently follows such policies in preparing its financial statements.
1. Security Valuation: Securities are valued as of the close of trading on the New York Stock Exchange (generally 4 p.m., Eastern time) on the valuation date. Equity securities are valued at the latest quoted sales prices or official closing prices taken from the primary market in which each security trades; such securities not traded on the valuation date are valued at the mean of the latest quoted bid and asked prices. Securities for which market quotations are not readily available, or whose values have been materially affected by events occurring before the fund’s pricing time but after the close of the securities’ primary markets, are valued by methods deemed by the board of trustees to represent fair value. Investments in Vanguard Market Liquidity Fund are valued at that fund’s net asset value. Temporary cash investments are valued using the latest bid prices or using valuations based on a matrix system (which considers such factors as security prices, yields, maturities, and ratings), both as furnished by independent pricing services.
2. Futures Contracts: The fund uses index futures contracts to a limited extent, with the objectives of maintaining full exposure to the stock market, enhancing returns, maintaining liquidity, and minimizing transaction costs. The fund may purchase futures contracts to immediately invest incoming cash in the market, or sell futures in response to cash outflows, thereby simulating a fully invested position in the underlying index while maintaining a cash balance for liquidity. The fund may seek to enhance returns by using futures contracts instead of the underlying securities when futures are believed to be priced more attractively than the underlying securities. The primary risks associated with the use of futures contracts are imperfect correlation between changes in market values of stocks held by the fund and the prices of futures contracts, and the possibility of an illiquid market. Counterparty risk involving futures is mitigated because a regulated clearinghouse is the counterparty instead of the clearing broker. To further mitigate counterparty risk, the fund trades futures contracts on an exchange, monitors the financial strength of its clearing brokers and clearinghouse, and has entered into clearing agreements with its clearing brokers. The clearinghouse imposes initial margin requirements to secure the fund’s performance and requires daily settlement of variation margin representing changes in the market value of each contract.
Futures contracts are valued at their quoted daily settlement prices. The aggregate settlement values of the contracts are not recorded in the Statement of Net Assets. Fluctuations in the value of the contracts are recorded in the Statement of Net Assets as an asset (liability) and in the Statement of Operations as unrealized appreciation (depreciation) until the contracts are closed, when they are recorded as realized futures gains (losses).
During the year ended December 31, 2016, the fund’s average investments in long and short futures contracts represented less than 1% and 0% of net assets, respectively, based on the average of aggregate settlement values at each quarter-end during the period.
45
Value Index Fund
3. Federal Income Taxes: The fund intends to continue to qualify as a regulated investment company and distribute all of its taxable income. Management has analyzed the fund’s tax positions taken for all open federal income tax years (December 31, 2013–2016), and has concluded that no provision for federal income tax is required in the fund’s financial statements.
4. Distributions: Distributions to shareholders are recorded on the ex-dividend date.
5. Securities Lending: To earn additional income, the fund lends its securities to qualified institutional borrowers. Security loans are subject to termination by the fund at any time, and are required to be secured at all times by collateral in an amount at least equal to the market value of securities loaned. Daily market fluctuations could cause the value of loaned securities to be more or less than the value of the collateral received. When this occurs, the collateral is adjusted and settled on the next business day. The fund further mitigates its counterparty risk by entering into securities lending transactions only with a diverse group of prequalified counterparties, monitoring their financial strength, and entering into master securities lending agreements with its counterparties. The master securities lending agreements provide that, in the event of a counterparty’s default (including bankruptcy), the fund may terminate any loans with that borrower, determine the net amount owed, and sell or retain the collateral up to the net amount owed to the fund; however, such actions may be subject to legal proceedings. While collateral mitigates counterparty risk, in the absence of a default the fund may experience delays and costs in recovering the securities loaned. The fund invests cash collateral received in Vanguard Market Liquidity Fund, and records a liability in the Statement of Net Assets for the return of the collateral, during the period the securities are on loan. Securities lending income represents fees charged to borrowers plus income earned on invested cash collateral, less expenses associated with the loan. During the term of the loan, the fund is entitled to all distributions made on or in respect of the loaned securities.
6. Credit Facility: The fund and certain other funds managed by The Vanguard Group (“Vanguard”) participate in a $3.1 billion committed credit facility provided by a syndicate of lenders pursuant to a credit agreement that may be renewed annually; each fund is individually liable for its borrowings, if any, under the credit facility. Borrowings may be utilized for temporary and emergency purposes, and are subject to the fund’s regulatory and contractual borrowing restrictions. The participating funds are charged administrative fees and an annual commitment fee of 0.10% of the undrawn amount of the facility; these fees are allocated to the funds based on a method approved by the fund’s board of trustees and included in Management and Administrative expenses on the fund’s Statement of Operations. Any borrowings under this facility bear interest at a rate based upon the higher of the one-month London Interbank Offered Rate, federal funds effective rate, or overnight bank funding rate plus an agreed-upon spread.
The fund had no borrowings outstanding at December 31, 2016, or at any time during the period then ended.
7. Other: Dividend income is recorded on the ex-dividend date. Interest income includes income distributions received from Vanguard Market Liquidity Fund and is accrued daily. Premiums and discounts on debt securities purchased are amortized and accreted, respectively, to interest income over the lives of the respective securities. Security transactions are accounted for on the date securities are bought or sold. Costs used to determine realized gains (losses) on the sale of investment securities are those of the specific securities sold.
46
Value Index Fund
Each class of shares has equal rights as to assets and earnings, except that each class separately bears certain class-specific expenses related to maintenance of shareholder accounts (included in Management and Administrative expenses) and shareholder reporting. Marketing and distribution expenses are allocated to each class of shares based on a method approved by the board of trustees. Income, other non-class-specific expenses, and gains and losses on investments are allocated to each class of shares based on its relative net assets.
B. In accordance with the terms of a Funds’ Service Agreement (the “FSA”) between Vanguard and the fund, Vanguard furnishes to the fund investment advisory, corporate management, administrative, marketing, and distribution services at Vanguard’s cost of operations (as defined by the FSA). These costs of operations are allocated to the fund based on methods and guidelines approved by the board of trustees. Vanguard does not require reimbursement in the current period for certain costs of operations (such as deferred compensation/benefits and risk/insurance costs); the fund’s liability for these costs of operations is included in Payables to Vanguard on the Statement of Net Assets.
Upon the request of Vanguard, the fund may invest up to 0.40% of its net assets as capital in Vanguard. At December 31, 2016, the fund had contributed to Vanguard capital in the amount of $3,668,000, representing 0.01% of the fund’s net assets and 1.47% of Vanguard’s capitalization. The fund’s trustees and officers are also directors and employees, respectively, of Vanguard.
C. Various inputs may be used to determine the value of the fund’s investments. These inputs are summarized in three broad levels for financial statement purposes. The inputs or methodologies used to value securities are not necessarily an indication of the risk associated with investing in those securities.
Level 1—Quoted prices in active markets for identical securities.
Level 2—Other significant observable inputs (including quoted prices for similar securities, interest rates, prepayment speeds, credit risk, etc.).
Level 3—Significant unobservable inputs (including the fund’s own assumptions used to determine the fair value of investments).
The following table summarizes the market value of the fund’s investments as of December 31, 2016, based on the inputs used to value them:
| | | |
| | Level 1 | Level 2 | Level 3 |
| Investments | ($000) | ($000) | ($000) |
| Common Stocks | 50,721,093 | — | — |
| Temporary Cash Investments | 77,333 | 7,785 | — |
| Futures Contracts—Liabilities1 | (420) | — | — |
| Total | 50,798,006 | 7,785 | — |
| 1 Represents variation margin on the last day of the reporting period. |
47
Value Index Fund
D. At December 31, 2016, the aggregate settlement value of open futures contracts and the related unrealized appreciation (depreciation) were:
| | | | |
| | | | ($000) |
| | | | Aggregate | |
| | | Number of | Settlement | Unrealized |
| | | Long (Short) | Value | Appreciation |
| Futures Contracts | Expiration | Contracts | Long (Short) | (Depreciation) |
| E-mini S&P 500 Index | March 2017 | 945 | 105,660 | (1,187) |
Unrealized appreciation (depreciation) on open futures contracts is required to be treated as realized gain (loss) for tax purposes.
E. Distributions are determined on a tax basis and may differ from net investment income and realized capital gains for financial reporting purposes. Differences may be permanent or temporary. Permanent differences are reclassified among capital accounts in the financial statements to reflect their tax character. Temporary differences arise when certain items of income, expense, gain, or loss are recognized in different periods for financial statement and tax purposes. These differences will reverse at some time in the future. Differences in classification may also result from the treatment of short-term gains as ordinary income for tax purposes.
During the year ended December 31, 2016, the fund realized $1,144,327,000 of net capital gains resulting from in-kind redemptions—in which shareholders exchanged fund shares for securities held by the fund rather than for cash. Because such gains are not taxable to the fund, and are not distributed to shareholders, they have been reclassified from accumulated net realized losses to paid-in capital.
For tax purposes, at December 31, 2016, the fund had $12,784,000 of ordinary income available for distribution. At December 31, 2016, the fund had available capital losses totaling $727,435,000 to offset future net capital gains. Of this amount, $333,377,000 is subject to expiration on December 31, 2017. Capital losses of $394,058,000 realized beginning in fiscal 2011 may be carried forward indefinitely under the Regulated Investment Company Modernization Act of 2010, but must be used before any expiring loss carryforwards.
At December 31, 2016, the cost of investment securities for tax purposes was $40,669,088,000. Net unrealized appreciation of investment securities for tax purposes was $10,137,123,000, consisting of unrealized gains of $10,817,401,000 on securities that had risen in value since their purchase and $680,278,000 in unrealized losses on securities that had fallen in value since their purchase.
F. During the year ended December 31, 2016, the fund purchased $13,254,049,000 of investment securities and sold $5,945,162,000 of investment securities, other than temporary cash investments. Purchases and sales include $8,173,611,000 and $3,074,773,000, respectively, in connection with in-kind purchases and redemptions of the fund’s capital shares.
The fund purchased securities from and sold securities to other Vanguard funds or accounts managed by Vanguard or its affiliates, in accordance with procedures adopted by the board of trustees in compliance with Rule 17a-7 of the Investment Company Act of 1940. For the year ended December 31, 2016, such purchases and sales were $961,457,000 and $750,250,000, respectively; these amounts are included in the purchases and sales of investment securities noted above.
48
Value Index Fund
G. Capital share transactions for each class of shares were:
| | | | |
| | Year Ended December 31, |
| | 2016 | | 2015 |
| | Amount | Shares | Amount | Shares |
| | ($000) | (000) | ($000) | (000) |
| Investor Shares | | | | |
| Issued | 330,274 | 9,960 | 275,870 | 8,479 |
| Issued in Lieu of Cash Distributions | 32,849 | 966 | 32,444 | 1,019 |
| Redeemed | (363,995) | (11,030) | (451,611) | (13,942) |
| Net Increase (Decrease)—Investor Shares | (872) | (104) | (143,297) | (4,444) |
| ETF Shares | | | | |
| Issued | 8,556,798 | 100,574 | 5,278,259 | 64,091 |
| Issued in Lieu of Cash Distributions | — | — | — | — |
| Redeemed | (3,131,740) | (37,125) | (3,287,762) | (40,025) |
| Net Increase (Decrease)—ETF Shares | 5,425,058 | 63,449 | 1,990,497 | 24,066 |
| Admiral Shares | | | | |
| Issued | 3,065,991 | 92,197 | 2,416,764 | 74,734 |
| Issued in Lieu of Cash Distributions | 267,386 | 7,859 | 224,383 | 7,061 |
| Redeemed | (1,871,695) | (56,627) | (1,592,803) | (49,173) |
| Net Increase (Decrease)—Admiral Shares | 1,461,682 | 43,429 | 1,048,344 | 32,622 |
| Institutional Shares | | | | |
| Issued | 1,607,419 | 48,764 | 1,341,949 | 41,541 |
| Issued in Lieu of Cash Distributions | 195,936 | 5,764 | 187,885 | 5,907 |
| Redeemed | (1,327,999) | (40,362) | (1,894,059) | (60,499) |
| Net Increase (Decrease)—Institutional Shares | 475,356 | 14,166 | (364,225) | (13,051) |
H. Management has determined that no material events or transactions occurred subsequent to December 31, 2016, that would require recognition or disclosure in these financial statements.
49
Large-Cap Index Fund
Fund Profile
As of December 31, 2016
| | | | |
| Share-Class Characteristics | | | | |
| | Investor | | Admiral | Institutional |
| | Shares | ETF Shares | Shares | Shares |
| Ticker Symbol | VLACX | VV | VLCAX | VLISX |
| Expense Ratio1 | 0.20% | 0.08% | 0.08% | 0.07% |
| 30-Day SEC Yield | 1.91% | 2.03% | 2.03% | 2.04% |
| | | |
| Portfolio Characteristics | | |
| | | | DJ |
| | | | U.S. |
| | | | Total |
| | | CRSP US | Market |
| | | Large Cap | FA |
| | Fund | Index | Index |
| Number of Stocks | 611 | 609 | 3,833 |
| Median Market Cap | $75.9B | $75.9B | $54.1B |
| Price/Earnings Ratio | 23.5x | 23.5x | 24.4x |
| Price/Book Ratio | 2.9x | 2.9x | 2.8x |
| Return on Equity | 17.6% | 17.3% | 16.5% |
| Earnings Growth Rate | 7.8% | 8.1% | 8.2% |
| Dividend Yield | 2.1% | 2.1% | 2.0% |
| Foreign Holdings | 0.0% | 0.0% | 0.0% |
| Turnover Rate | 5% | — | — |
| Short-Term Reserves | -0.1% | — | — |
| | | |
| Sector Diversification (% of equity exposure) |
| | | | DJ |
| | | CRSP US | U.S. Total |
| | | Large Cap | Market |
| | Fund | Index | FA Index |
| Basic Materials | 2.3% | 2.3% | 2.6% |
| Consumer Goods | 10.1 | 10.1 | 9.6 |
| Consumer Services | 13.3 | 13.3 | 13.1 |
| Financials | 19.4 | 19.4 | 20.8 |
| Health Care | 12.7 | 12.7 | 12.2 |
| Industrials | 11.8 | 11.9 | 12.9 |
| Oil & Gas | 7.3 | 7.3 | 6.9 |
| Technology | 17.2 | 17.1 | 16.4 |
| Telecommunications | 2.8 | 2.8 | 2.4 |
| Utilities | 3.1 | 3.1 | 3.1 |
| | |
| Volatility Measures | | |
| | | DJ |
| | CRSP US | U.S. Total |
| | Large Cap | Market |
| | Index | FA Index |
| R-Squared | 1.00 | 0.99 |
| Beta | 1.00 | 0.97 |
| These measures show the degree and timing of the fund’s |
| fluctuations compared with the indexes over 36 months. |
| | |
| Ten Largest Holdings (% of total net assets) |
| Apple Inc. | Computer Hardware | 2.9% |
| Alphabet Inc. | Internet | 2.3 |
| Microsoft Corp. | Software | 2.3 |
| Exxon Mobil Corp. | Integrated Oil & Gas | 1.9 |
| Berkshire Hathaway Inc. Reinsurance | 1.6 |
| Johnson & Johnson | Pharmaceuticals | 1.6 |
| JPMorgan Chase & Co. | Banks | 1.5 |
| Amazon.com Inc. | Broadline Retailers | 1.5 |
| General Electric Co. | Diversified Industrials | 1.4 |
| Facebook Inc. | Internet | 1.3 |
| Top Ten | | 18.3% |
| The holdings listed exclude any temporary cash investments and equity index products. |
1 The expense ratios shown are from the prospectus dated April 27, 2016, and represent estimated costs for the current fiscal year. For the fiscal
year ended December 31, 2016, the expense ratios were 0.18% for Investor Shares, 0.06% for ETF Shares, 0.06% for Admiral Shares, and 0.05% for
Institutional Shares.
50
Large-Cap Index Fund
Investment Focus
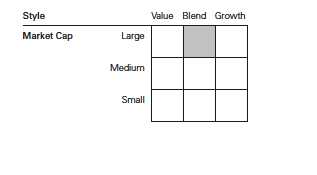
51
Large-Cap Index Fund
Performance Summary
All of the returns in this report represent past performance, which is not a guarantee of future results that may be achieved by the fund. (Current performance may be lower or higher than the performance data cited. For performance data current to the most recent month-end, visit our website at vanguard.com/performance.) Note, too, that both investment returns and principal value can fluctuate widely, so an investor’s shares, when sold, could be worth more or less than their original cost. The returns shown do not reflect taxes that a shareholder would pay on fund distributions or on the sale of fund shares.
Cumulative Performance: December 31, 2006, Through December 31, 2016
Initial Investment of $10,000
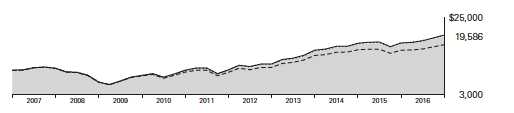
| | | | | |
| | | Average Annual Total Returns | |
| | | Periods Ended December 31, 2016 | |
| | | | | | Final Value |
| | | One | Five | Ten | of a $10,000 |
| | | Year | Years | Years | Investment |
| | Large-Cap Index Fund*Investor | | | | |
| | Shares | 11.50% | 14.37% | 6.95% | $19,586 |
| • • • • • • •• | Spliced Large Cap Index | 11.75 | 14.61 | 7.14 | 19,935 |
| – – – – | Large-Cap Core Funds Average | 9.92 | 12.92 | 5.63 | 17,288 |
| | Dow Jones U.S. Total Stock Market | | | | |
| | Float Adjusted Index | 12.62 | 14.59 | 7.18 | 20,003 |
| For a benchmark description, see the Glossary. |
| Large-Cap Core Funds Average: Derived from data provided by Lipper, a Thomson Reuters Company. |
| | | | |
| | | | | Final Value |
| | One | Five | Ten | of a $10,000 |
| | Year | Years | Years | Investment |
| Large-Cap Index Fund | | | | |
| ETF Shares Net Asset Value | 11.65% | 14.53% | 7.10% | $19,860 |
| Spliced Large Cap Index | 11.75 | 14.61 | 7.14 | 19,935 |
| Dow Jones U.S. Total Stock Market Float | | | | |
| Adjusted Index | 12.62 | 14.59 | 7.18 | 20,003 |
See Financial Highlights for dividend and capital gains information.
52
Large-Cap Index Fund
| | | | |
| | Average Annual Total Returns | |
| | Periods Ended December 31, 2016 | |
| |
| | | | | Final Value |
| | One | Five | Ten | of a $10,000 |
| | Year | Years | Years | Investment |
| Large-Cap Index Fund Admiral Shares | 11.65% | 14.52% | 7.09% | $19,846 |
| Spliced Large Cap Index | 11.75 | 14.61 | 7.14 | 19,935 |
| Dow Jones U.S. Total Stock Market Float | | | | |
| Adjusted Index | 12.62 | 14.59 | 7.18 | 20,003 |
| | | | |
| | | | | Final Value |
| | One | Five | Ten | of a $5,000,000 |
| | Year | Years | Years | Investment |
| |
| Large-Cap Index Fund Institutional Shares | 11.66% | 14.54% | 7.12% | $9,942,975 |
| |
| Spliced Large Cap Index | 11.75 | 14.61 | 7.14 | 9,967,345 |
| Dow Jones U.S. Total Stock Market Float | | | | |
| Adjusted Index | 12.62 | 14.59 | 7.18 | 10,001,613 |
| | | |
| Cumulative Returns of ETF Shares: December 31, 2006, Through December 31, 2016 | |
| | One | Five | Ten |
| | Year | Years | Years |
| Large-Cap Index Fund ETF Shares Market Price | 11.73% | 97.25% | 98.74% |
| Large-Cap Index Fund ETF Shares Net Asset Value | 11.65 | 97.03 | 98.60 |
| Spliced Large Cap Index | 11.75 | 97.72 | 99.35 |
Fiscal-Year Total Returns (%): December 31, 2006, Through December 31, 2016

For a benchmark description, see the Glossary.
53
Large-Cap Index Fund
Financial Statements
Statement of Net Assets
As of December 31, 2016
The fund reports a complete list of its holdings in regulatory filings four times in each fiscal year, at the quarter-ends. For the second and fourth fiscal quarters, the lists appear in the fund’s semiannual and annual reports to shareholders. For the first and third fiscal quarters, the fund files the lists with the Securities and Exchange Commission on Form N-Q. Shareholders can look up the fund’s Forms N-Q on the SEC’s website at sec.gov. Forms N-Q may also be reviewed and copied at the SEC’s Public Reference Room (see the back cover of this report for further information).
| | | |
| | | | Market |
| | | | Value• |
| | | Shares | ($000) |
| Common Stocks (99.8%)1 | | |
| Basic Materials (2.3%) | | |
| | Dow Chemical Co. | 782,959 | 44,801 |
| | EI du Pont de Nemours | | |
| | & Co. | 607,539 | 44,593 |
| | Praxair Inc. | 199,094 | 23,332 |
| | Air Products & Chemicals | | |
| | Inc. | 151,666 | 21,813 |
| | Ecolab Inc. | 183,082 | 21,461 |
| | LyondellBasell Industries | | |
| | NV Class A | 226,844 | 19,459 |
| | PPG Industries Inc. | 185,117 | 17,542 |
| | International Paper Co. | 285,789 | 15,164 |
| | Nucor Corp. | 221,011 | 13,155 |
| | Newmont Mining Corp. | 368,815 | 12,565 |
| * | Freeport-McMoRan Inc. | 852,992 | 11,251 |
| | Celanese Corp. Class A | 100,569 | 7,919 |
| | Eastman Chemical Co. | 97,044 | 7,299 |
| | Mosaic Co. | 243,433 | 7,140 |
| | Albemarle Corp. | 77,986 | 6,713 |
| | International Flavors & | | |
| | Fragrances Inc. | 49,720 | 5,858 |
| | Arconic Inc. | 304,179 | 5,639 |
| | FMC Corp. | 92,733 | 5,245 |
| | CF Industries Holdings Inc. | 162,235 | 5,107 |
| | Ashland Global Holdings | | |
| | Inc. | 43,119 | 4,712 |
| | Avery Dennison Corp. | 61,367 | 4,309 |
| * | Axalta Coating Systems | | |
| | Ltd. | 149,753 | 4,073 |
| | Reliance Steel & | | |
| | Aluminum Co. | 48,034 | 3,821 |
| | WR Grace & Co. | 49,136 | 3,323 |
| * | Alcoa Corp. | 63,597 | 1,786 |
| | Westlake Chemical Corp. | 26,574 | 1,488 |
| | | | 319,568 |
| | | |
| Consumer Goods (10.1%) | | |
| | Procter & Gamble Co. | 1,866,296 | 156,918 |
| | Coca-Cola Co. | 2,707,211 | 112,241 |
| | PepsiCo Inc. | 999,919 | 104,622 |
| | Philip Morris International | | |
| | Inc. | 1,081,979 | 98,990 |
| | Altria Group Inc. | 1,360,200 | 91,977 |
| | NIKE Inc. Class B | 931,976 | 47,372 |
| | Mondelez International | | |
| | Inc. Class A | 1,026,787 | 45,517 |
| | Colgate-Palmolive Co. | 619,469 | 40,538 |
| | Kraft Heinz Co. | 424,491 | 37,067 |
| | Reynolds American Inc. | 596,650 | 33,436 |
| | Ford Motor Co. | 2,722,090 | 33,019 |
| | Monsanto Co. | 305,615 | 32,154 |
| | General Motors Co. | 901,685 | 31,415 |
| | Kimberly-Clark Corp. | 249,978 | 28,527 |
| | General Mills Inc. | 411,502 | 25,418 |
| | Archer-Daniels-Midland Co. | 404,330 | 18,458 |
| | Constellation Brands Inc. | | |
| | Class A | 117,841 | 18,066 |
| *,^ | Tesla Motors Inc. | 83,910 | 17,931 |
| | Activision Blizzard Inc. | 466,626 | 16,850 |
| * | Electronic Arts Inc. | 199,975 | 15,750 |
| | Newell Brands Inc. | 335,138 | 14,964 |
| * | Monster Beverage Corp. | 297,972 | 13,212 |
| | Delphi Automotive plc | 189,641 | 12,772 |
| | Kellogg Co. | 170,541 | 12,571 |
| | Tyson Foods Inc. Class A | 202,222 | 12,473 |
| | Stanley Black & Decker Inc. 105,194 | 12,065 |
| | Conagra Brands Inc. | 304,419 | 12,040 |
| | Estee Lauder Cos. Inc. | | |
| | Class A | 155,105 | 11,864 |
| | Molson Coors Brewing Co. | | |
| | Class B | 121,081 | 11,782 |
| | Dr Pepper Snapple Group | | |
| | Inc. | 129,018 | 11,698 |
| | Clorox Co. | 89,810 | 10,779 |
54
Large-Cap Index Fund
| | | | |
| | | | | Market |
| | | | | Value• |
| | | | Shares | ($000) |
| | VF Corp. | | 187,139 | 9,984 |
| | Hershey Co. | | 95,218 | 9,848 |
| | JM Smucker Co. | | 76,678 | 9,819 |
| | Whirlpool Corp. | | 52,546 | 9,551 |
| | Genuine Parts Co. | | 98,059 | 9,369 |
| | Mead Johnson Nutrition Co. 128,471 | 9,091 |
| * | Mohawk Industries Inc. | | 43,849 | 8,756 |
| | Campbell Soup Co. | | 138,988 | 8,405 |
| | Church & Dwight Co. Inc. | | 180,460 | 7,975 |
| | McCormick & Co. Inc. | | 79,780 | 7,446 |
| | Harley-Davidson Inc. | | 124,128 | 7,242 |
| | Bunge Ltd. | | 96,816 | 6,994 |
| | Snap-on Inc. | | 40,308 | 6,904 |
| | DR Horton Inc. | | 251,902 | 6,884 |
| * | WhiteWave Foods Co. | | | |
| | Class A | | 123,317 | 6,856 |
| | Coach Inc. | | 194,199 | 6,801 |
| | Lear Corp. | | 49,783 | 6,590 |
| | Mattel Inc. | | 238,631 | 6,574 |
| | Hormel Foods Corp. | | 184,513 | 6,423 |
| * | LKQ Corp. | | 202,718 | 6,213 |
| | Hasbro Inc. | | 78,536 | 6,109 |
| | Lennar Corp. Class A | | 142,192 | 6,104 |
| | BorgWarner Inc. | | 148,315 | 5,850 |
| | Coty Inc. Class A | | 311,863 | 5,710 |
| | Hanesbrands Inc. | | 262,883 | 5,670 |
| | Brown-Forman Corp. | | | |
| | Class B | | 125,245 | 5,626 |
| | Harman International | | | |
| | Industries Inc. | | 48,346 | 5,374 |
| | Leucadia National Corp. | | 224,718 | 5,225 |
| | PVH Corp. | | 56,011 | 5,054 |
| * | Michael Kors Holdings Ltd. | | 111,855 | 4,808 |
| * | Lululemon Athletica Inc. | | 66,543 | 4,325 |
| * | NVR Inc. | | 2,555 | 4,264 |
| | PulteGroup Inc. | | 215,433 | 3,960 |
| * | WABCO Holdings Inc. | | 36,937 | 3,921 |
| * | Lamb Weston Holdings Inc. | 101,098 | 3,827 |
| *,^ | Under Armour Inc. Class A | | 127,276 | 3,697 |
| | Ralph Lauren Corp. Class A | | 39,014 | 3,524 |
| | Polaris Industries Inc. | | 42,406 | 3,494 |
| * | Under Armour Inc. | | 129,648 | 3,263 |
| | Ingredion Inc. | | 25,168 | 3,145 |
| * | Edgewell Personal Care Co. | 40,928 | 2,987 |
| | Goodyear Tire & Rubber Co. | 91,430 | 2,822 |
| | Pilgrim’s Pride Corp. | | 43,515 | 826 |
| | Lennar Corp. Class B | | 1,161 | 40 |
| | | | | 1,399,836 |
| Consumer Services (13.3%) | | | |
| * | Amazon.com Inc. | | 281,685 | 211,227 |
| | Comcast Corp. Class A | 1,662,272 | 114,780 |
| | Home Depot Inc. | | 849,649 | 113,921 |
| | Walt Disney Co. | | 998,978 | 104,113 |
| | Wal-Mart Stores Inc. | 1,078,645 | 74,556 |
| | | |
| | McDonald’s Corp. | 579,229 | 70,504 |
| | CVS Health Corp. | 743,780 | 58,692 |
| | Starbucks Corp. | 964,306 | 53,538 |
| | Walgreens Boots Alliance | | |
| | Inc. | 642,258 | 53,153 |
| * | Priceline Group Inc. | 34,415 | 50,454 |
| | Time Warner Inc. | 510,939 | 49,321 |
| | Costco Wholesale Corp. | 304,395 | 48,737 |
| | Lowe’s Cos. Inc. | 610,100 | 43,390 |
| * | Charter Communications | | |
| | Inc. Class A | 141,578 | 40,763 |
| * | Netflix Inc. | 284,414 | 35,210 |
| | TJX Cos. Inc. | 436,405 | 32,787 |
| | Target Corp. | 390,844 | 28,231 |
| | Delta Air Lines Inc. | 522,424 | 25,698 |
| | Kroger Co. | 659,394 | 22,756 |
| | McKesson Corp. | 157,712 | 22,151 |
| * | eBay Inc. | 745,275 | 22,127 |
| | Southwest Airlines Co. | 431,014 | 21,482 |
| | Twenty-First Century Fox | | |
| | Inc. Class A | 739,341 | 20,731 |
| | Sysco Corp. | 342,514 | 18,965 |
| * | O’Reilly Automotive Inc. | 65,745 | 18,304 |
| | Ross Stores Inc. | 277,712 | 18,218 |
| | Marriott International Inc. | | |
| | Class A | 204,324 | 16,893 |
| | CBS Corp. Class B | 261,521 | 16,638 |
| | Cardinal Health Inc. | 223,245 | 16,067 |
| * | AutoZone Inc. | 20,323 | 16,051 |
| | American Airlines Group | | |
| | Inc. | 342,498 | 15,991 |
| | Yum! Brands Inc. | 243,279 | 15,407 |
| | Las Vegas Sands Corp. | 276,138 | 14,749 |
| | Dollar General Corp. | 196,121 | 14,527 |
| | Omnicom Group Inc. | 164,387 | 13,991 |
| * | United Continental | | |
| | Holdings Inc. | 190,245 | 13,865 |
| | Carnival Corp. | 261,816 | 13,630 |
| * | Dollar Tree Inc. | 156,303 | 12,063 |
| | Hilton Worldwide Holdings | | |
| | Inc. | 411,968 | 11,206 |
| | L Brands Inc. | 169,910 | 11,187 |
| * | Ulta Salon Cosmetics & | | |
| | Fragrance Inc. | 41,209 | 10,506 |
| | Nielsen Holdings plc | 248,847 | 10,439 |
| * | MGM Resorts International | 340,034 | 9,803 |
| | Royal Caribbean Cruises | | |
| | Ltd. | 119,379 | 9,794 |
| | Expedia Inc. | 85,788 | 9,718 |
| | AmerisourceBergen Corp. | | |
| | Class A | 114,855 | 8,981 |
| | Viacom Inc. Class B | 247,018 | 8,670 |
| * | DISH Network Corp. | | |
| | Class A | 149,226 | 8,645 |
55
Large-Cap Index Fund
| | | |
| | | | Market |
| | | | Value• |
| | | Shares | ($000) |
| * | CarMax Inc. | 132,976 | 8,562 |
| | Advance Auto Parts Inc. | 48,599 | 8,219 |
| | Best Buy Co. Inc. | 190,293 | 8,120 |
| | Macy’s Inc. | 213,866 | 7,659 |
| * | Chipotle Mexican Grill Inc. | | |
| | Class A | 20,202 | 7,623 |
| | Alaska Air Group Inc. | 85,625 | 7,597 |
| | Twenty-First Century Fox | | |
| | Inc. | 277,121 | 7,552 |
| | Tractor Supply Co. | 93,066 | 7,055 |
| | Whole Foods Market Inc. | 220,707 | 6,789 |
| | Tiffany & Co. | 86,940 | 6,732 |
| | Foot Locker Inc. | 94,236 | 6,680 |
| | Interpublic Group of Cos. | | |
| | Inc. | 277,696 | 6,501 |
| | Kohl’s Corp. | 127,298 | 6,286 |
| | Darden Restaurants Inc. | 85,881 | 6,245 |
| | Aramark | 169,745 | 6,063 |
| * | Liberty Interactive Corp. | | |
| | QVC Group Class A | 295,304 | 5,900 |
| | Wyndham Worldwide Corp. | 76,567 | 5,847 |
| ^ | Sirius XM Holdings Inc. | 1,180,625 | 5,254 |
| | Signet Jewelers Ltd. | 54,028 | 5,093 |
| | Wynn Resorts Ltd. | 56,339 | 4,874 |
| * | Norwegian Cruise Line | | |
| | Holdings Ltd. | 110,716 | 4,709 |
| | FactSet Research Systems | | |
| | Inc. | 28,215 | 4,611 |
| * | Discovery Communications | | |
| | Inc. | 157,013 | 4,205 |
| * | Liberty Media Corp-Liberty | | |
| | SiriusXM Class C | 123,441 | 4,187 |
| | Bed Bath & Beyond Inc. | 101,705 | 4,133 |
| | Staples Inc. | 451,942 | 4,090 |
| | Nordstrom Inc. | 84,113 | 4,032 |
| | Scripps Networks | | |
| | Interactive Inc. Class A | 55,954 | 3,993 |
| | News Corp. Class A | 332,550 | 3,811 |
| * | TripAdvisor Inc. | 78,175 | 3,625 |
| | H&R Block Inc. | 153,460 | 3,528 |
| | Gap Inc. | 151,262 | 3,394 |
| * | Rite Aid Corp. | 362,572 | 2,988 |
| * | Discovery Communications | | |
| | Inc. Class A | 105,422 | 2,890 |
| | Williams-Sonoma Inc. | 55,550 | 2,688 |
| * | AutoNation Inc. | 49,965 | 2,431 |
| * | Liberty Media Corp-Liberty | | |
| | SiriusXM Class A | 60,824 | 2,100 |
| * | Hyatt Hotels Corp. Class A | 18,793 | 1,038 |
| | CBS Corp. Class A | 2,867 | 185 |
| | News Corp. Class B | 14,516 | 171 |
| | Viacom Inc. Class A | 985 | 38 |
| | | | 1,850,128 |
| | |
| Financials (19.4%) | | |
| * Berkshire Hathaway Inc. | | |
| Class B | 1,337,809 | 218,036 |
| JPMorgan Chase & Co. | 2,495,598 | 215,345 |
| Wells Fargo & Co. | 3,152,400 | 173,729 |
| Bank of America Corp. | 7,047,425 | 155,748 |
| Citigroup Inc. | 1,987,465 | 118,115 |
| Visa Inc. Class A | 1,302,543 | 101,624 |
| Mastercard Inc. Class A | 671,383 | 69,320 |
| Goldman Sachs Group Inc. | 249,597 | 59,766 |
| US Bancorp | 1,126,194 | 57,853 |
| American International | | |
| Group Inc. | 716,452 | 46,791 |
| Morgan Stanley | 979,713 | 41,393 |
| Chubb Ltd. | 308,342 | 40,738 |
| American Express Co. | 542,585 | 40,195 |
| PNC Financial Services | | |
| Group Inc. | 339,316 | 39,686 |
| Simon Property Group Inc. | 219,159 | 38,938 |
| Bank of New York Mellon | | |
| Corp. | 700,585 | 33,194 |
| MetLife Inc. | 613,328 | 33,052 |
| Charles Schwab Corp. | 832,210 | 32,847 |
| American Tower | | |
| Corporation | 296,970 | 31,384 |
| Prudential Financial Inc. | 299,959 | 31,214 |
| Capital One Financial Corp. | 335,631 | 29,280 |
| BlackRock Inc. | 73,444 | 27,948 |
| BB&T Corp. | 565,997 | 26,613 |
| CME Group Inc. | 224,846 | 25,936 |
| Marsh & McLennan Cos. | | |
| Inc. | 360,160 | 24,343 |
| Travelers Cos. Inc. | 197,649 | 24,196 |
| Intercontinental Exchange | | |
| Inc. | 414,589 | 23,391 |
| Public Storage | 102,827 | 22,982 |
| Crown Castle International | | |
| Corp. | 250,992 | 21,779 |
| Synchrony Financial | 574,578 | 20,840 |
| Aon plc | 184,612 | 20,590 |
| Aflac Inc. | 284,669 | 19,813 |
| Discover Financial Services | 274,444 | 19,785 |
| S&P Global Inc. | 180,278 | 19,387 |
| Prologis Inc. | 364,930 | 19,265 |
| Allstate Corp. | 258,102 | 19,130 |
| State Street Corp. | 243,975 | 18,962 |
| SunTrust Banks Inc. | 344,478 | 18,895 |
| Equinix Inc. | 49,787 | 17,794 |
| Welltower Inc. | 252,889 | 16,926 |
| AvalonBay Communities Inc. | 95,448 | 16,909 |
| Equity Residential | 254,105 | 16,354 |
| Weyerhaeuser Co. | 520,291 | 15,656 |
| Ventas Inc. | 246,986 | 15,442 |
| M&T Bank Corp. | 98,122 | 15,349 |
56
Large-Cap Index Fund
| | | |
| | | | Market |
| | | | Value• |
| | | Shares | ($000) |
| | Progressive Corp. | 404,634 | 14,364 |
| | Fifth Third Bancorp | 531,591 | 14,337 |
| | KeyCorp | 750,468 | 13,711 |
| | Boston Properties Inc. | 106,952 | 13,452 |
| | Northern Trust Corp. | 149,495 | 13,313 |
| | Citizens Financial Group Inc. | 360,958 | 12,861 |
| | Hartford Financial Services | | |
| | Group Inc. | 267,639 | 12,753 |
| | Regions Financial Corp. | 872,221 | 12,525 |
| | Ameriprise Financial Inc. | 111,922 | 12,417 |
| | T. Rowe Price Group Inc. | 164,120 | 12,352 |
| | Vornado Realty Trust | 118,021 | 12,318 |
| | Principal Financial Group Inc. | 199,687 | 11,554 |
| | Willis Towers Watson plc | 91,071 | 11,136 |
| | Digital Realty Trust Inc. | 110,651 | 10,873 |
| | General Growth Properties | | |
| | Inc. | 431,565 | 10,780 |
| | Lincoln National Corp. | 161,933 | 10,731 |
| | Moody’s Corp. | 113,419 | 10,692 |
| | Essex Property Trust Inc. | 45,501 | 10,579 |
| | Realty Income Corp. | 179,498 | 10,318 |
| | Huntington Bancshares Inc. | 752,267 | 9,945 |
| | First Republic Bank | 106,998 | 9,859 |
| | Equifax Inc. | 83,015 | 9,815 |
| | Host Hotels & Resorts Inc. | 516,739 | 9,735 |
| | HCP Inc. | 324,352 | 9,640 |
| | Franklin Resources Inc. | 240,416 | 9,516 |
| | Loews Corp. | 198,568 | 9,299 |
| * | IHS Markit Ltd. | 249,364 | 8,830 |
| | Invesco Ltd. | 285,262 | 8,655 |
| * | Markel Corp. | 9,229 | 8,348 |
| | Comerica Inc. | 120,845 | 8,231 |
| | Cincinnati Financial Corp. | 108,326 | 8,206 |
| | Mid-America Apartment | | |
| | Communities Inc. | 79,086 | 7,744 |
| | SL Green Realty Corp. | 70,769 | 7,611 |
| * | Liberty Broadband Corp. | 101,121 | 7,490 |
| | Western Union Co. | 339,709 | 7,378 |
| | Unum Group | 163,167 | 7,168 |
| | TD Ameritrade Holding | | |
| | Corp. | 164,184 | 7,158 |
| | XL Group Ltd. | 191,075 | 7,119 |
| | Kimco Realty Corp. | 281,683 | 7,087 |
| | Annaly Capital | | |
| | Management Inc. | 710,783 | 7,086 |
| | Federal Realty Investment | | |
| | Trust | 49,793 | 7,076 |
| * | Arch Capital Group Ltd. | 81,015 | 6,991 |
| | UDR Inc. | 185,209 | 6,756 |
| | Macerich Co. | 94,788 | 6,715 |
| * | E*TRADE Financial Corp. | 190,484 | 6,600 |
| | Duke Realty Corp. | 246,878 | 6,557 |
| | Extra Space Storage Inc. | 83,061 | 6,416 |
| * | CBRE Group Inc. Class A | 199,482 | 6,282 |
| | | |
| | Alexandria Real Estate | | |
| | Equities Inc. | 55,449 | 6,162 |
| | Zions Bancorporation | 142,833 | 6,148 |
| | FNF Group | 180,937 | 6,145 |
| | Raymond James Financial | | |
| | Inc. | 88,675 | 6,142 |
| | Ally Financial Inc. | 319,986 | 6,086 |
| | CIT Group Inc. | 139,961 | 5,974 |
| | Torchmark Corp. | 78,765 | 5,810 |
| | VEREIT Inc. | 671,824 | 5,684 |
| | Iron Mountain Inc. | 174,137 | 5,656 |
| | Reinsurance Group of | | |
| | America Inc. Class A | 44,412 | 5,588 |
| * | Affiliated Managers Group | | |
| | Inc. | 38,288 | 5,563 |
| | Voya Financial Inc. | 138,663 | 5,438 |
| | Nasdaq Inc. | 80,553 | 5,407 |
| | Brixmor Property Group Inc. | 212,168 | 5,181 |
| | MSCI Inc. Class A | 65,563 | 5,165 |
| | New York Community | | |
| | Bancorp Inc. | 320,992 | 5,107 |
| | Camden Property Trust | 60,480 | 5,085 |
| | SEI Investments Co. | 100,964 | 4,984 |
| | Everest Re Group Ltd. | 22,469 | 4,862 |
| | WR Berkley Corp. | 64,192 | 4,269 |
| | People’s United Financial | | |
| | Inc. | 216,612 | 4,194 |
| | AGNC Investment Corp. | 230,336 | 4,176 |
| | Axis Capital Holdings Ltd. | 62,944 | 4,108 |
| | Lazard Ltd. Class A | 90,509 | 3,719 |
| | Arthur J Gallagher & Co. | 61,900 | 3,216 |
| | Jones Lang LaSalle Inc. | 31,553 | 3,188 |
| * | Alleghany Corp. | 5,060 | 3,077 |
| | Assurant Inc. | 20,625 | 1,915 |
| | Navient Corp. | 108,502 | 1,783 |
| * | Berkshire Hathaway Inc. | | |
| | Class A | 6 | 1,465 |
| * | Liberty Broadband Corp. | | |
| | Class A | 17,121 | 1,241 |
| * | Athene Holding Ltd. Class A 16,565 | 795 |
| * | Santander Consumer USA | | |
| | Holdings Inc. | 36,683 | 495 |
| | Realogy Holdings Corp. | 9 | — |
| | | | 2,700,740 |
| Health Care (12.7%) | | |
| | Johnson & Johnson | 1,897,346 | 218,593 |
| | Pfizer Inc. | 4,232,182 | 137,461 |
| | Merck & Co. Inc. | 1,922,886 | 113,200 |
| | UnitedHealth Group Inc. | 663,822 | 106,238 |
| | Amgen Inc. | 518,853 | 75,862 |
| | AbbVie Inc. | 1,133,474 | 70,978 |
| | Medtronic plc | 963,880 | 68,657 |
| | Bristol-Myers Squibb Co. | 1,165,640 | 68,120 |
| | Gilead Sciences Inc. | 918,879 | 65,801 |
| * | Celgene Corp. | 540,662 | 62,582 |
57
Large-Cap Index Fund
| | | | |
| | | | | Market |
| | | | | Value• |
| | | | Shares | ($000) |
| * | Allergan plc | | 261,630 | 54,945 |
| | Eli Lilly & Co. | | 693,022 | 50,972 |
| * | Biogen Inc. | | 152,249 | 43,175 |
| | Abbott Laboratories | 1,026,848 | 39,441 |
| | Thermo Fisher Scientific | | |
| | Inc. | | 275,537 | 38,878 |
| | Aetna Inc. | | 244,814 | 30,359 |
| * | Express Scripts Holding Co. | 429,134 | 29,520 |
| | Anthem Inc. | | 183,789 | 26,423 |
| | Stryker Corp. | | 209,024 | 25,043 |
| | Becton Dickinson and Co. | 147,984 | 24,499 |
| | Cigna Corp. | | 179,135 | 23,895 |
| | Humana Inc. | | 103,990 | 21,217 |
| * | Boston Scientific Corp. | 949,798 | 20,544 |
| * | Regeneron | | | |
| | Pharmaceuticals Inc. | | 54,172 | 19,886 |
| | Zoetis Inc. | | 344,156 | 18,423 |
| * | Alexion Pharmaceuticals | | |
| | Inc. | | 148,068 | 18,116 |
| * | Intuitive Surgical Inc. | | 27,030 | 17,142 |
| | St. Jude Medical Inc. | | 199,303 | 15,982 |
| * | HCA Holdings Inc. | | 208,553 | 15,437 |
| | Baxter International Inc. | 340,225 | 15,086 |
| | Zimmer Biomet Holdings | | |
| | Inc. | | 139,459 | 14,392 |
| * | Edwards Lifesciences Corp. | 149,179 | 13,978 |
| * | Illumina Inc. | | 102,009 | 13,061 |
| * | Vertex Pharmaceuticals Inc. | 172,225 | 12,688 |
| | CR Bard Inc. | | 51,280 | 11,521 |
| * | Mylan NV | | 297,836 | 11,363 |
| * | Incyte Corp. | | 110,971 | 11,127 |
| * | BioMarin Pharmaceutical | | |
| | Inc. | | 119,730 | 9,918 |
| | Dentsply Sirona Inc. | | 162,016 | 9,353 |
| * | Laboratory Corp. of | | | |
| | America Holdings | | 71,905 | 9,231 |
| | Quest Diagnostics Inc. | 96,466 | 8,865 |
| * | Henry Schein Inc. | | 56,721 | 8,605 |
| | Perrigo Co. plc | | 94,317 | 7,850 |
| * | Quintiles IMS Holdings Inc. | 102,846 | 7,822 |
| * | Hologic Inc. | | 192,830 | 7,736 |
| * | IDEXX Laboratories Inc. | 62,306 | 7,307 |
| * | Waters Corp. | | 53,156 | 7,144 |
| * | DaVita Inc. | | 109,812 | 7,050 |
| | Universal Health Services | | |
| | Inc. Class B | | 62,619 | 6,661 |
| * | Centene Corp. | | 112,569 | 6,361 |
| | ResMed Inc. | | 97,801 | 6,069 |
| | Cooper Cos. Inc. | | 33,784 | 5,910 |
| * | Varian Medical Systems Inc. | 64,981 | 5,834 |
| * | Alkermes plc | | 104,826 | 5,826 |
| * | Jazz Pharmaceuticals plc | 40,114 | 4,374 |
| * | Mallinckrodt plc | | 74,438 | 3,709 |
| * | Envision Healthcare Corp. | 40,781 | 2,581 |
| * | Seattle Genetics Inc. | | 32,014 | 1,689 |
| | | |
| | Patterson Cos. Inc. | 29,227 | 1,199 |
| * | Alnylam Pharmaceuticals | | |
| | Inc. | 25,340 | 949 |
| * | Endo International plc | 13 | — |
| | | | 1,766,648 |
| Industrials (11.8%) | | |
| | General Electric Co. | 6,169,622 | 194,960 |
| | 3M Co. | 419,509 | 74,912 |
| | Boeing Co. | 408,956 | 63,666 |
| | Honeywell International Inc. | 531,554 | 61,581 |
| | Union Pacific Corp. | 574,794 | 59,595 |
| | United Technologies Corp. | 516,853 | 56,657 |
| | United Parcel Service Inc. | | |
| | Class B | 480,345 | 55,067 |
| | Accenture plc Class A | 432,622 | 50,673 |
| | Lockheed Martin Corp. | 173,690 | 43,412 |
| | Caterpillar Inc. | 408,126 | 37,850 |
| | Danaher Corp. | 434,214 | 33,799 |
| * | PayPal Holdings Inc. | 799,542 | 31,558 |
| | General Dynamics Corp. | 180,379 | 31,144 |
| | FedEx Corp. | 166,862 | 31,070 |
| | Automatic Data | | |
| | Processing Inc. | 298,283 | 30,658 |
| | Raytheon Co. | 205,106 | 29,125 |
| | Northrop Grumman Corp. | 122,674 | 28,531 |
| | Illinois Tool Works Inc. | 219,848 | 26,923 |
| | Johnson Controls | | |
| | International plc | 653,384 | 26,913 |
| | Emerson Electric Co. | 447,172 | 24,930 |
| | CSX Corp. | 657,377 | 23,620 |
| | Norfolk Southern Corp. | 203,974 | 22,043 |
| | Waste Management Inc. | 307,418 | 21,799 |
| | Deere & Co. | 208,358 | 21,469 |
| | Eaton Corp. plc | 315,940 | 21,196 |
| | Fidelity National | | |
| | Information Services Inc. | 228,938 | 17,317 |
| | TE Connectivity Ltd. | 247,152 | 17,123 |
| * | Fiserv Inc. | 152,777 | 16,237 |
| | Cummins Inc. | 117,277 | 16,028 |
| | PACCAR Inc. | 243,749 | 15,576 |
| | Sherwin-Williams Co. | 55,083 | 14,803 |
| | Amphenol Corp. Class A | 214,529 | 14,416 |
| | Paychex Inc. | 227,096 | 13,826 |
| | Ingersoll-Rand plc | 180,275 | 13,528 |
| | Parker-Hannifin Corp. | 93,462 | 13,085 |
| | Roper Technologies Inc. | 70,429 | 12,894 |
| | Rockwell Automation Inc. | 89,798 | 12,069 |
| | Fortive Corp. | 215,919 | 11,580 |
| | Vulcan Materials Co. | 92,333 | 11,555 |
| | Agilent Technologies Inc. | 226,216 | 10,306 |
| | Martin Marietta Materials | | |
| | Inc. | 43,974 | 9,742 |
| | Waste Connections Inc. | 121,714 | 9,565 |
58
Large-Cap Index Fund
| | | |
| | | | Market |
| | | | Value• |
| | | Shares | ($000) |
| | Republic Services Inc. | | |
| | Class A | 166,916 | 9,523 |
| | Fastenal Co. | 200,304 | 9,410 |
| * | FleetCor Technologies Inc. | 64,673 | 9,153 |
| | Ball Corp. | 121,241 | 9,102 |
| | WestRock Co. | 174,260 | 8,847 |
| | Alliance Data Systems Corp. | 38,529 | 8,804 |
| | TransDigm Group Inc. | 35,170 | 8,756 |
| * | Verisk Analytics Inc. | | |
| | Class A | 105,492 | 8,563 |
| | Rockwell Collins Inc. | 90,268 | 8,373 |
| | WW Grainger Inc. | 35,650 | 8,280 |
| | Textron Inc. | 169,687 | 8,240 |
| | Dover Corp. | 107,829 | 8,080 |
| | AMETEK Inc. | 161,831 | 7,865 |
| * | Mettler-Toledo International | | |
| | Inc. | 18,330 | 7,672 |
| | Global Payments Inc. | 106,574 | 7,397 |
| | L-3 Communications | | |
| | Holdings Inc. | 48,369 | 7,357 |
| | CH Robinson Worldwide Inc. | 99,310 | 7,275 |
| | Masco Corp. | 229,002 | 7,241 |
| | Acuity Brands Inc. | 30,761 | 7,101 |
| | Cintas Corp. | 58,637 | 6,776 |
| | Expeditors International of | | |
| | Washington Inc. | 125,335 | 6,638 |
| * | Vantiv Inc. Class A | 110,554 | 6,591 |
| | Kansas City Southern | 75,185 | 6,379 |
| | Pentair plc | 113,315 | 6,354 |
| * | United Rentals Inc. | 60,070 | 6,342 |
| | Sealed Air Corp. | 137,062 | 6,214 |
| | Xylem Inc. | 124,225 | 6,152 |
| | JB Hunt Transport | | |
| | Services Inc. | 62,674 | 6,084 |
| | Fortune Brands Home & | | |
| | Security Inc. | 106,463 | 5,691 |
| | Total System Services Inc. | 114,462 | 5,612 |
| | Xerox Corp. | 599,689 | 5,235 |
| * | Trimble Inc. | 173,042 | 5,217 |
| * | Crown Holdings Inc. | 96,670 | 5,082 |
| | Fluor Corp. | 96,329 | 5,059 |
| | Wabtec Corp. | 59,438 | 4,935 |
| * | Jacobs Engineering Group | | |
| | Inc. | 84,384 | 4,810 |
| * | Sensata Technologies | | |
| | Holding NV | 118,990 | 4,635 |
| * | Stericycle Inc. | 58,985 | 4,544 |
| * | Arrow Electronics Inc. | 63,220 | 4,508 |
| | Hubbell Inc. Class B | 38,435 | 4,485 |
| | Macquarie Infrastructure | | |
| | Corp. | 54,112 | 4,421 |
| | Flowserve Corp. | 90,759 | 4,361 |
| | B/E Aerospace Inc. | 70,942 | 4,270 |
| | ManpowerGroup Inc. | 47,579 | 4,228 |
| | Avnet Inc. | 88,345 | 4,206 |
| | | |
| | Robert Half International Inc. 85,936 | 4,192 |
| | Owens Corning | 79,701 | 4,109 |
| * | First Data Corp. Class A | 249,171 | 3,536 |
| | Allison Transmission | | |
| | Holdings Inc. | 103,914 | 3,501 |
| | FLIR Systems Inc. | 47,013 | 1,701 |
| | | | 1,645,708 |
| Oil & Gas (7.3%) | | |
| | Exxon Mobil Corp. | 2,891,963 | 261,029 |
| | Chevron Corp. | 1,316,626 | 154,967 |
| | Schlumberger Ltd. | 970,321 | 81,458 |
| | ConocoPhillips | 864,200 | 43,331 |
| | EOG Resources Inc. | 402,055 | 40,648 |
| | Occidental Petroleum Corp. | 532,985 | 37,965 |
| | Halliburton Co. | 572,854 | 30,986 |
| | Kinder Morgan Inc. | 1,323,457 | 27,409 |
| | Anadarko Petroleum Corp. | 389,019 | 27,126 |
| | Phillips 66 | 308,826 | 26,686 |
| | Valero Energy Corp. | 314,935 | 21,516 |
| | Pioneer Natural Resources | | |
| | Co. | 118,442 | 21,328 |
| | Spectra Energy Corp. | 489,289 | 20,105 |
| | Baker Hughes Inc. | 297,436 | 19,324 |
| | Marathon Petroleum Corp. | 367,672 | 18,512 |
| | Apache Corp. | 263,668 | 16,735 |
| | Williams Cos. Inc. | 521,610 | 16,243 |
| | Devon Energy Corp. | 345,886 | 15,797 |
| * | Concho Resources Inc. | 101,665 | 13,481 |
| | Hess Corp. | 198,126 | 12,341 |
| | Noble Energy Inc. | 298,227 | 11,351 |
| | Marathon Oil Corp. | 589,557 | 10,205 |
| | National Oilwell Varco Inc. | 262,617 | 9,832 |
| | Cimarex Energy Co. | 66,159 | 8,991 |
| | EQT Corp. | 119,795 | 7,835 |
| | Cabot Oil & Gas Corp. | 322,892 | 7,543 |
| | Tesoro Corp. | 82,540 | 7,218 |
| | Range Resources Corp. | 172,063 | 5,912 |
| * | Cheniere Energy Inc. | 138,650 | 5,744 |
| * | FMC Technologies Inc. | 156,887 | 5,574 |
| | Helmerich & Payne Inc. | 71,235 | 5,514 |
| | OGE Energy Corp. | 138,180 | 4,622 |
| | HollyFrontier Corp. | 122,257 | 4,005 |
| | Core Laboratories NV | 30,794 | 3,696 |
| * | Antero Resources Corp. | 152,951 | 3,617 |
| * | Continental Resources Inc. | 65,426 | 3,372 |
| * | Energen Corp. | 33,872 | 1,953 |
| | Murphy Oil Corp. | 57,204 | 1,781 |
| * | Weatherford International | | |
| | plc | 341,396 | 1,704 |
| | | | 1,017,456 |
| Technology (17.1%) | | |
| | Apple Inc. | 3,532,964 | 409,188 |
| | Microsoft Corp. | 5,151,536 | 320,116 |
| * | Facebook Inc. Class A | 1,632,548 | 187,825 |
59
Large-Cap Index Fund
| | | |
| | | | Market |
| | | | Value• |
| | | Shares | ($000) |
| * | Alphabet Inc. Class A | 206,494 | 163,636 |
| * | Alphabet Inc. Class C | 204,584 | 157,902 |
| | Intel Corp. | 3,305,104 | 119,876 |
| | Cisco Systems Inc. | 3,500,914 | 105,798 |
| | International Business | | |
| | Machines Corp. | 596,909 | 99,081 |
| | Oracle Corp. | 2,148,359 | 82,604 |
| | QUALCOMM Inc. | 1,030,026 | 67,158 |
| | Texas Instruments Inc. | 697,061 | 50,865 |
| | Broadcom Ltd. | 263,345 | 46,552 |
| | NVIDIA Corp. | 356,431 | 38,045 |
| * | Adobe Systems Inc. | 346,227 | 35,644 |
| * | salesforce.com Inc. | 460,633 | 31,535 |
| | Hewlett Packard | | |
| | Enterprise Co. | 1,161,690 | 26,882 |
| | Applied Materials Inc. | 753,955 | 24,330 |
| * | Cognizant Technology | | |
| | Solutions Corp. Class A | 423,163 | 23,710 |
| * | Yahoo! Inc. | 598,929 | 23,161 |
| | Intuit Inc. | 170,103 | 19,496 |
| | HP Inc. | 1,188,659 | 17,640 |
| | Corning Inc. | 661,935 | 16,065 |
| * | Micron Technology Inc. | 726,525 | 15,925 |
| | Analog Devices Inc. | 215,010 | 15,614 |
| | Western Digital Corp. | 199,204 | 13,536 |
| | Lam Research Corp. | 113,660 | 12,017 |
| * | Autodesk Inc. | 148,117 | 10,962 |
| | Xilinx Inc. | 176,417 | 10,650 |
| | Linear Technology Corp. | 166,735 | 10,396 |
| | Symantec Corp. | 434,871 | 10,389 |
| * | Cerner Corp. | 213,120 | 10,096 |
| | Skyworks Solutions Inc. | 130,369 | 9,733 |
| | Microchip Technology Inc. | 150,765 | 9,672 |
| | Motorola Solutions Inc. | 116,015 | 9,617 |
| * | Citrix Systems Inc. | 102,604 | 9,164 |
| | Harris Corp. | 86,581 | 8,872 |
| * | Red Hat Inc. | 125,980 | 8,781 |
| | KLA-Tencor Corp. | 109,038 | 8,579 |
| * | Dell Technologies Inc. | | |
| | Class V | 154,835 | 8,511 |
| * | ServiceNow Inc. | 109,997 | 8,177 |
| | Seagate Technology plc | 207,977 | 7,938 |
| * | Akamai Technologies Inc. | 115,298 | 7,688 |
| * | Palo Alto Networks Inc. | 60,774 | 7,600 |
| | Maxim Integrated | | |
| | Products Inc. | 196,428 | 7,576 |
| | Juniper Networks Inc. | 252,587 | 7,138 |
| | CA Inc. | 217,514 | 6,910 |
| | NetApp Inc. | 193,231 | 6,815 |
| * | F5 Networks Inc. | 46,150 | 6,679 |
| * | Twitter Inc. | 399,000 | 6,504 |
| | CDK Global Inc. | 104,508 | 6,238 |
| * | Synopsys Inc. | 104,865 | 6,172 |
| * | Workday Inc. Class A | 85,012 | 5,618 |
| | | |
| * | ANSYS Inc. | 60,466 | 5,593 |
| * | Gartner Inc. | 54,701 | 5,529 |
| * | Splunk Inc. | 93,889 | 4,802 |
| * | VeriSign Inc. | 62,732 | 4,772 |
| * | Qorvo Inc. | 89,160 | 4,701 |
| | Marvell Technology Group | | |
| | Ltd. | 283,594 | 3,933 |
| *,^ | VMware Inc. Class A | 46,547 | 3,665 |
| | Garmin Ltd. | 72,067 | 3,495 |
| | Computer Sciences Corp. | 49,012 | 2,912 |
| * | Nuance Communications | | |
| | Inc. | 95,758 | 1,427 |
| * | Premier Inc. Class A | 35,028 | 1,063 |
| | | | 2,382,568 |
| Telecommunications (2.7%) | | |
| | AT&T Inc. | 4,282,892 | 182,151 |
| | Verizon Communications | | |
| | Inc. | 2,843,170 | 151,768 |
| * | T-Mobile US Inc. | 201,247 | 11,574 |
| * | Level 3 Communications | | |
| | Inc. | 199,945 | 11,269 |
| | CenturyLink Inc. | 379,013 | 9,013 |
| * | SBA Communications | | |
| | Corp. Class A | 86,334 | 8,915 |
| * | Sprint Corp. | 413,198 | 3,479 |
| * | Zayo Group Holdings Inc. | 101,589 | 3,338 |
| ^ | Frontier Communications | | |
| | Corp. | 408,216 | 1,380 |
| | | | 382,887 |
| Utilities (3.1%) | | |
| | NextEra Energy Inc. | 334,298 | 39,935 |
| | Duke Energy Corp. | 480,499 | 37,296 |
| | Southern Co. | 683,544 | 33,624 |
| | Dominion Resources Inc. | 437,209 | 33,486 |
| | Exelon Corp. | 642,852 | 22,815 |
| | American Electric Power | | |
| | Co. Inc. | 342,975 | 21,594 |
| | PG&E Corp. | 352,679 | 21,432 |
| | Sempra Energy | 174,458 | 17,557 |
| | Edison International | 226,402 | 16,299 |
| | PPL Corp. | 471,189 | 16,044 |
| | Consolidated Edison Inc. | 211,550 | 15,587 |
| | Public Service Enterprise | | |
| | Group Inc. | 351,814 | 15,438 |
| | Xcel Energy Inc. | 354,336 | 14,421 |
| | WEC Energy Group Inc. | 219,473 | 12,872 |
| | DTE Energy Co. | 124,504 | 12,265 |
| | Eversource Energy | 220,220 | 12,163 |
| | FirstEnergy Corp. | 295,752 | 9,159 |
| | Entergy Corp. | 123,966 | 9,108 |
| | American Water Works | | |
| | Co. Inc. | 123,770 | 8,956 |
| | Ameren Corp. | 168,893 | 8,860 |
60
Large-Cap Index Fund
| | | |
| | | | Market |
| | | | Value• |
| | | Shares | ($000) |
| | ONEOK Inc. | 146,398 | 8,405 |
| | CMS Energy Corp. | 194,407 | 8,091 |
| | CenterPoint Energy Inc. | 284,066 | 6,999 |
| | SCANA Corp. | 89,407 | 6,552 |
| | Pinnacle West Capital Corp. | 77,273 | 6,030 |
| | Alliant Energy Corp. | 158,444 | 6,003 |
| | AES Corp. | 455,981 | 5,299 |
| | NiSource Inc. | 222,600 | 4,928 |
| | Avangrid Inc. | 42,671 | 1,616 |
| * | Calpine Corp. | 124,908 | 1,428 |
| | | | 434,262 |
| Total Common Stocks | | |
| (Cost $9,659,273) | | 13,899,801 |
| Temporary Cash Investments (0.2%)1 | |
| Money Market Fund (0.2%) | | |
| 2,3 | Vanguard Market Liquidity | | |
| | Fund, 0.823% | 228,927 | 22,895 |
| | | |
| | | Face | |
| | | Amount | |
| | | ($000) | |
| U.S. Government and Agency Obligations (0.0%) |
| | United States Treasury Bill, | | |
| | 0.287%, 1/5/17 | 2,000 | 2,000 |
| 4 | United States Treasury Bill, | | |
| | 0.337%, 1/12/17 | 500 | 500 |
| 4 | United States Treasury Bill, | | |
| | 0.501%, 3/16/17 | 350 | 349 |
| 4 | United States Treasury Bill, | | |
| | 0.587%, 5/18/17 | 400 | 399 |
| | | | 3,248 |
| Total Temporary Cash Investments | |
| (Cost $26,143) | | 26,143 |
| Total Investments (100.0%) | | |
| (Cost $9,685,416) | | 13,925,944 |
| | |
| | | Amount |
| | | ($000) |
| Other Assets and Liabilities (0.0%) | | |
| Other Assets | | |
| Investment in Vanguard | | 1,020 |
| Receivables for Investment Securities Sold | 90 |
| Receivables for Accrued Income | | 17,459 |
| Receivables for Capital Shares Issued | | 5,621 |
| Other Assets | | 157 |
| Total Other Assets | | 24,347 |
| Liabilities | | |
| Payables for Investment Securities | | |
| Purchased | | (184) |
| Collateral for Securities on Loan | | (10,272) |
| Payables for Capital Shares Redeemed | | (2,933) |
| Payables to Vanguard | | (6,105) |
| Other Liabilities | | (111) |
| Total Liabilities | | (19,605) |
| Net Assets (100%) | 13,930,686 |
| |
| At December 31, 2016, net assets consisted of: |
| | Amount |
| | ($000) |
| Paid-in Capital | 9,837,046 |
| Overdistributed Net Investment Income | (3,133) |
| Accumulated Net Realized Losses | (143,572) |
| Unrealized Appreciation (Depreciation) | |
| Investment Securities | 4,240,528 |
| Futures Contracts | (183) |
| Net Assets | 13,930,686 |
| |
| |
| Investor Shares—Net Assets | |
| Applicable to 9,692,556 outstanding | |
| $.001 par value shares of beneficial | |
| interest (unlimited authorization) | 400,427 |
| Net Asset Value Per Share— | |
| Investor Shares | $41.31 |
| |
| |
| ETF Shares—Net Assets | |
| Applicable to 82,800,158 outstanding | |
| $.001 par value shares of beneficial | |
| interest (unlimited authorization) | 8,468,323 |
| Net Asset Value Per Share— | |
| ETF Shares | $102.27 |
61
Large-Cap Index Fund
| |
| | Amount |
| | ($000) |
| Admiral Shares—Net Assets | |
| Applicable to 79,967,620 outstanding | |
| $.001 par value shares of beneficial | |
| interest (unlimited authorization) | 4,130,409 |
| Net Asset Value Per Share— | |
| Admiral Shares | $51.65 |
| |
| |
| Institutional Shares—Net Assets | |
| Applicable to 4,381,767 outstanding | |
| $.001 par value shares of beneficial | |
| interest (unlimited authorization) | 931,527 |
| Net Asset Value Per Share— | |
| Institutional Shares | $212.59 |
• See Note A in Notes to Financial Statements.
* Non-income-producing security.
^ Includes partial security positions on loan to broker-dealers. The total value of securities on loan is $9,831,000.
1 The fund invests a portion of its cash reserves in equity markets through the use of index futures contracts. After giving effect to futures
investments, the fund’s effective common stock and temporary cash investment positions represent 100.0% and 0.0%, respectively,
of net assets.
2 Affiliated money market fund available only to Vanguard funds and certain trusts and accounts managed by Vanguard. Rate shown is the
7-day yield.
3 Includes $10,272,000 of collateral received for securities on loan.
4 Securities with a value of $1,212,000 have been segregated as initial margin for open futures contracts.
See accompanying Notes, which are an integral part of the Financial Statements.
62
Large-Cap Index Fund
Statement of Operations
| |
| | Year Ended |
| | December 31, 2016 |
| | ($000) |
| Investment Income | |
| Income | |
| Dividends | 268,481 |
| Interest1 | 142 |
| Securities Lending—Net | 762 |
| Total Income | 269,385 |
| Expenses | |
| The Vanguard Group—Note B | |
| Investment Advisory Services | 1,746 |
| Management and Administrative—Investor Shares | 514 |
| Management and Administrative—ETF Shares | 2,671 |
| Management and Administrative—Admiral Shares | 1,178 |
| Management and Administrative—Institutional Shares | 259 |
| Marketing and Distribution—Investor Shares | 89 |
| Marketing and Distribution—ETF Shares | 375 |
| Marketing and Distribution—Admiral Shares | 405 |
| Marketing and Distribution—Institutional Shares | 16 |
| Custodian Fees | 250 |
| Auditing Fees | 38 |
| Shareholders’ Reports—Investor Shares | 8 |
| Shareholders’ Reports—ETF Shares | 129 |
| Shareholders’ Reports—Admiral Shares | 26 |
| Shareholders’ Reports—Institutional Shares | — |
| Trustees’ Fees and Expenses | 9 |
| Total Expenses | 7,713 |
| Net Investment Income | 261,672 |
| Realized Net Gain (Loss) | |
| Investment Securities Sold1 | 129,031 |
| Futures Contracts | 5,424 |
| Realized Net Gain (Loss) | 134,455 |
| Change in Unrealized Appreciation (Depreciation) | |
| Investment Securities | 1,017,399 |
| Futures Contracts | (558) |
| Change in Unrealized Appreciation (Depreciation) | 1,016,841 |
| Net Increase (Decrease) in Net Assets Resulting from Operations | 1,412,968 |
| 1 Interest income and realized net gain (loss) from an affiliated company of the fund were $134,000 and $2,000, respectively. |
See accompanying Notes, which are an integral part of the Financial Statements.
63
Large-Cap Index Fund
Statement of Changes in Net Assets
| | |
| | Year Ended December 31, |
| | 2016 | 2015 |
| | ($000) | ($000) |
| Increase (Decrease) in Net Assets | | |
| Operations | | |
| Net Investment Income | 261,672 | 209,879 |
| Realized Net Gain (Loss) | 134,455 | 177,762 |
| Change in Unrealized Appreciation (Depreciation) | 1,016,841 | (266,082) |
| Net Increase (Decrease) in Net Assets Resulting from Operations | 1,412,968 | 121,559 |
| Distributions | | |
| Net Investment Income | | |
| Investor Shares | (7,448) | (7,047) |
| ETF Shares | (158,127) | (118,790) |
| Admiral Shares | (79,259) | (65,966) |
| Institutional Shares | (17,725) | (16,266) |
| Realized Capital Gain | | |
| Investor Shares | — | — |
| ETF Shares | — | — |
| Admiral Shares | — | — |
| Institutional Shares | — | — |
| Total Distributions | (262,559) | (208,069) |
| Capital Share Transactions | | |
| Investor Shares | (7,876) | (21,473) |
| ETF Shares | 1,302,695 | 897,520 |
| Admiral Shares | 257,948 | 472,088 |
| Institutional Shares | 63,094 | (56,061) |
| Net Increase (Decrease) from Capital Share Transactions | 1,615,861 | 1,292,074 |
| Total Increase (Decrease) | 2,766,270 | 1,205,564 |
| Net Assets | | |
| Beginning of Period | 11,164,416 | 9,958,852 |
| End of Period1 | 13,930,686 | 11,164,416 |
| 1 Net Assets—End of Period includes undistributed (overdistributed) net investment income of ($3,133,000) and ($2,246,000). |
See accompanying Notes, which are an integral part of the Financial Statements.
64
Large-Cap Index Fund
Financial Highlights
| | | | | |
| Investor Shares | | | | | |
| |
| For a Share Outstanding | Year Ended December 31, |
| Throughout Each Period | 2016 | 2015 | 2014 | 2013 | 2012 |
| Net Asset Value, Beginning of Period | $37.78 | $38.12 | $34.24 | $26.32 | $23.16 |
| Investment Operations | | | | | |
| Net Investment Income | .768 | .702 | . 624 | . 556 | . 521 |
| Net Realized and Unrealized Gain (Loss) | | | | | |
| on Investments | 3.533 | (.348) | 3.879 | 7.921 | 3.159 |
| Total from Investment Operations | 4.301 | .354 | 4.503 | 8.477 | 3.680 |
| Distributions | | | | | |
| Dividends from Net Investment Income | (.771) | (. 694) | (. 623) | (. 557) | (. 520) |
| Distributions from Realized Capital Gains | — | — | — | — | — |
| Total Distributions | (.771) | (. 694) | (. 623) | (. 557) | (. 520) |
| Net Asset Value, End of Period | $41.31 | $37.78 | $38.12 | $34.24 | $26.32 |
| |
| Total Return1 | 11.50% | 0.93% | 13.24% | 32.45% | 15.94% |
| |
| Ratios/Supplemental Data | | | | | |
| Net Assets, End of Period (Millions) | $400 | $375 | $399 | $391 | $290 |
| Ratio of Total Expenses to Average Net Assets | 0.18% | 0.20% | 0.23% | 0.24% | 0.24% |
| Ratio of Net Investment Income to | | | | | |
| Average Net Assets | 2.02% | 1.86% | 1.76% | 1.82% | 2.08% |
| Portfolio Turnover Rate2 | 5% | 4% | 3% | 9% | 8% |
1 Total returns do not include account service fees that may have applied in the periods shown. Fund prospectuses provide information about
any applicable account service fees.
2 Excludes the value of portfolio securities received or delivered as a result of in-kind purchases or redemptions of the fund’s capital shares,
including ETF Creation Units.
See accompanying Notes, which are an integral part of the Financial Statements.
65
Large-Cap Index Fund
Financial Highlights
| | | | | |
| ETF Shares | | | | | |
| |
| For a Share Outstanding | Year Ended December 31, |
| Throughout Each Period | 2016 | 2015 | 2014 | 2013 | 2012 |
| Net Asset Value, Beginning of Period | $93.52 | $94.36 | $84.76 | $65.15 | $57.34 |
| Investment Operations | | | | | |
| Net Investment Income | 2.018 | 1.850 | 1.672 | 1.488 | 1.383 |
| Net Realized and Unrealized Gain (Loss) | | | | | |
| on Investments | 8.754 | (.859) | 9.599 | 19.610 | 7.807 |
| Total from Investment Operations | 10.772 | .991 | 11.271 | 21.098 | 9.190 |
| Distributions | | | | | |
| Dividends from Net Investment Income | (2.022) | (1.831) | (1.671) | (1.488) | (1.380) |
| Distributions from Realized Capital Gains | — | — | — | — | — |
| Total Distributions | (2.022) | (1.831) | (1.671) | (1.488) | (1.380) |
| Net Asset Value, End of Period | $102.27 | $93.52 | $94.36 | $84.76 | $65.15 |
| |
| Total Return | 11.65% | 1.07% | 13.39% | 32.65% | 16.09% |
| |
| Ratios/Supplemental Data | | | | | |
| Net Assets, End of Period (Millions) | $8,468 | $6,469 | $5,619 | $4,707 | $3,577 |
| Ratio of Total Expenses to Average Net Assets | 0.06% | 0.08% | 0.09% | 0.09% | 0.10% |
| Ratio of Net Investment Income to | | | | | |
| Average Net Assets | 2.14% | 1.98% | 1.90% | 1.97% | 2.22% |
| Portfolio Turnover Rate1 | 5% | 4% | 3% | 9% | 8% |
| 1 Excludes the value of portfolio securities received or delivered as a result of in-kind purchases or redemptions of the fund’s capital shares, |
| including ETF Creation Units. |
See accompanying Notes, which are an integral part of the Financial Statements.
66
Large-Cap Index Fund
Financial Highlights
| | | | | |
| Admiral Shares | | | | | |
| |
| For a Share Outstanding | Year Ended December 31, |
| Throughout Each Period | 2016 | 2015 | 2014 | 2013 | 2012 |
| Net Asset Value, Beginning of Period | $47.23 | $47.65 | $42.81 | $32.90 | $28.96 |
| Investment Operations | | | | | |
| Net Investment Income | 1.019 | .936 | .846 | .752 | .698 |
| Net Realized and Unrealized Gain (Loss) | | | | | |
| on Investments | 4.422 | (.430) | 4.839 | 9.909 | 3.939 |
| Total from Investment Operations | 5.441 | .506 | 5.685 | 10.661 | 4.637 |
| Distributions | | | | | |
| Dividends from Net Investment Income | (1.021) | (. 926) | (. 845) | (.751) | (. 697) |
| Distributions from Realized Capital Gains | — | — | — | — | — |
| Total Distributions | (1.021) | (. 926) | (. 845) | (.751) | (. 697) |
| Net Asset Value, End of Period | $51.65 | $47.23 | $47.65 | $42.81 | $32.90 |
| |
| Total Return1 | 11.65% | 1.07% | 13.38% | 32.66% | 16.06% |
| |
| Ratios/Supplemental Data | | | | | |
| Net Assets, End of Period (Millions) | $4,130 | $3,527 | $3,085 | $1,438 | $981 |
| Ratio of Total Expenses to Average Net Assets | 0.06% | 0.08% | 0.09% | 0.09% | 0.10% |
| Ratio of Net Investment Income to | | | | | |
| Average Net Assets | 2.14% | 1.98% | 1.90% | 1.97% | 2.22% |
| Portfolio Turnover Rate2 | 5% | 4% | 3% | 9% | 8% |
1 Total returns do not include account service fees that may have applied in the periods shown. Fund prospectuses provide information about
any applicable account service fees.
2 Excludes the value of portfolio securities received or delivered as a result of in-kind purchases or redemptions of the fund’s capital shares,
including ETF Creation Units.
See accompanying Notes, which are an integral part of the Financial Statements.
67
Large-Cap Index Fund
Financial Highlights
| | | | | |
| Institutional Shares | | | | | |
| |
| For a Share Outstanding | Year Ended December 31, |
| Throughout Each Period | 2016 | 2015 | 2014 | 2013 | 2012 |
| Net Asset Value, Beginning of Period | $194.40 | $196.14 | $176.18 | $135.42 | $119.18 |
| Investment Operations | | | | | |
| Net Investment Income | 4.215 | 3.865 | 3.492 | 3.105 | 2.903 |
| Net Realized and Unrealized Gain (Loss) | | | | | |
| on Investments | 18.199 | (1.781) | 19.957 | 40.761 | 16.234 |
| Total from Investment Operations | 22.414 | 2.084 | 23.449 | 43.866 | 19.137 |
| Distributions | | | | | |
| Dividends from Net Investment Income | (4.224) | (3.824) | (3.489) | (3.106) | (2.897) |
| Distributions from Realized Capital Gains | — | — | — | — | — |
| Total Distributions | (4.224) | (3.824) | (3.489) | (3.106) | (2.897) |
| Net Asset Value, End of Period | $212.59 | $194.40 | $196.14 | $176.18 | $135.42 |
| |
| Total Return | 11.66% | 1.07% | 13.41% | 32.65% | 16.11% |
| |
| Ratios/Supplemental Data | | | | | |
| Net Assets, End of Period (Millions) | $932 | $794 | $857 | $750 | $752 |
| Ratio of Total Expenses to Average Net Assets | 0.05% | 0.07% | 0.08% | 0.08% | 0.08% |
| Ratio of Net Investment Income to | | | | | |
| Average Net Assets | 2.15% | 1.99% | 1.91% | 1.98% | 2.24% |
| Portfolio Turnover Rate1 | 5% | 4% | 3% | 9% | 8% |
| 1 Excludes the value of portfolio securities received or delivered as a result of in-kind purchases or redemptions of the fund’s capital shares, |
| including ETF Creation Units. |
See accompanying Notes, which are an integral part of the Financial Statements.
68
Large-Cap Index Fund
Notes to Financial Statements
Vanguard Large-Cap Index Fund is registered under the Investment Company Act of 1940 as an open-end investment company, or mutual fund. The fund offers four classes of shares: Investor Shares, ETF Shares, Admiral Shares and Institutional Shares. Investor Shares are available to any investor who meets the fund’s minimum purchase requirements. ETF Shares are listed for trading on NYSE Arca; they can be purchased and sold through a broker. Admiral Shares and Institutional Shares are designed for investors who meet certain administrative, service, and account-size criteria.
A. The following significant accounting policies conform to generally accepted accounting principles for U.S. investment companies. The fund consistently follows such policies in preparing its financial statements.
1. Security Valuation: Securities are valued as of the close of trading on the New York Stock Exchange (generally 4 p.m., Eastern time) on the valuation date. Equity securities are valued at the latest quoted sales prices or official closing prices taken from the primary market in which each security trades; such securities not traded on the valuation date are valued at the mean of the latest quoted bid and asked prices. Securities for which market quotations are not readily available, or whose values have been materially affected by events occurring before the fund’s pricing time but after the close of the securities’ primary markets, are valued by methods deemed by the board of trustees to represent fair value. Investments in Vanguard Market Liquidity Fund are valued at that fund’s net asset value. Temporary cash investments are valued using the latest bid prices or using valuations based on a matrix system (which considers such factors as security prices, yields, maturities, and ratings), both as furnished by independent pricing services.
2. Futures Contracts: The fund uses index futures contracts to a limited extent, with the objectives of maintaining full exposure to the stock market, enhancing returns, maintaining liquidity, and minimizing transaction costs. The fund may purchase futures contracts to immediately invest incoming cash in the market, or sell futures in response to cash outflows, thereby simulating a fully invested position in the underlying index while maintaining a cash balance for liquidity. The fund may seek to enhance returns by using futures contracts instead of the underlying securities when futures are believed to be priced more attractively than the underlying securities. The primary risks associated with the use of futures contracts are imperfect correlation between changes in market values of stocks held by the fund and the prices of futures contracts, and the possibility of an illiquid market. Counterparty risk involving futures is mitigated because a regulated clearinghouse is the counterparty instead of the clearing broker. To further mitigate counterparty risk, the fund trades futures contracts on an exchange, monitors the financial strength of its clearing brokers and clearinghouse, and has entered into clearing agreements with its clearing brokers. The clearinghouse imposes initial margin requirements to secure the fund’s performance and requires daily settlement of variation margin representing changes in the market value of each contract.
Futures contracts are valued at their quoted daily settlement prices. The aggregate settlement values of the contracts are not recorded in the Statement of Net Assets. Fluctuations in the value of the contracts are recorded in the Statement of Net Assets as an asset (liability) and in the Statement of Operations as unrealized appreciation (depreciation) until the contracts are closed, when they are recorded as realized futures gains (losses).
During the year ended December 31, 2016, the fund’s average investments in long and short futures contracts represented less than 1% and 0% of net assets, respectively, based on the average of aggregate settlement values at each quarter-end during the period.
69
Large-Cap Index Fund
3. Federal Income Taxes: The fund intends to continue to qualify as a regulated investment company and distribute all of its taxable income. Management has analyzed the fund’s tax positions taken for all open federal income tax years (December 31, 2013–2016), and has concluded that no provision for federal income tax is required in the fund’s financial statements.
4. Distributions: Distributions to shareholders are recorded on the ex-dividend date.
5. Securities Lending: To earn additional income, the fund lends its securities to qualified institutional borrowers. Security loans are subject to termination by the fund at any time, and are required to be secured at all times by collateral in an amount at least equal to the market value of securities loaned. Daily market fluctuations could cause the value of loaned securities to be more or less than the value of the collateral received. When this occurs, the collateral is adjusted and settled on the next business day. The fund further mitigates its counterparty risk by entering into securities lending transactions only with a diverse group of prequalified counterparties, monitoring their financial strength, and entering into master securities lending agreements with its counterparties. The master securities lending agreements provide that, in the event of a counterparty’s default (including bankruptcy), the fund may terminate any loans with that borrower, determine the net amount owed, and sell or retain the collateral up to the net amount owed to the fund; however, such actions may be subject to legal proceedings. While collateral mitigates counterparty risk, in the absence of a default the fund may experience delays and costs in recovering the securities loaned. The fund invests cash collateral received in Vanguard Market Liquidity Fund, and records a liability in the Statement of Net Assets for the return of the collateral, during the period the securities are on loan. Securities lending income represents fees charged to borrowers plus income earned on invested cash collateral, less expenses associated with the loan. During the term of the loan, the fund is entitled to all distributions made on or in respect of the loaned securities.
6. Credit Facility: The fund and certain other funds managed by The Vanguard Group (“Vanguard”) participate in a $3.1 billion committed credit facility provided by a syndicate of lenders pursuant to a credit agreement that may be renewed annually; each fund is individually liable for its borrowings, if any, under the credit facility. Borrowings may be utilized for temporary and emergency purposes, and are subject to the fund’s regulatory and contractual borrowing restrictions. The participating funds are charged administrative fees and an annual commitment fee of 0.10% of the undrawn amount of the facility; these fees are allocated to the funds based on a method approved by the fund’s board of trustees and included in Management and Administrative expenses on the fund’s Statement of Operations. Any borrowings under this facility bear interest at a rate based upon the higher of the one-month London Interbank Offered Rate, federal funds effective rate, or overnight bank funding rate plus an agreed-upon spread.
The fund had no borrowings outstanding at December 31, 2016, or at any time during the period then ended.
7. Other: Dividend income is recorded on the ex-dividend date. Interest income includes income distributions received from Vanguard Market Liquidity Fund and is accrued daily. Premiums and discounts on debt securities purchased are amortized and accreted, respectively, to interest income over the lives of the respective securities. Security transactions are accounted for on the date securities are bought or sold. Costs used to determine realized gains (losses) on the sale of investment securities are those of the specific securities sold.
Each class of shares has equal rights as to assets and earnings, except that each class separately bears certain class-specific expenses related to maintenance of shareholder accounts (included in Management and Administrative expenses) and shareholder reporting. Marketing and distribution
70
Large-Cap Index Fund
expenses are allocated to each class of shares based on a method approved by the board of trustees. Income, other non-class-specific expenses, and gains and losses on investments are allocated to each class of shares based on its relative net assets.
B. In accordance with the terms of a Funds’ Service Agreement (the “FSA”) between Vanguard and the fund, Vanguard furnishes to the fund investment advisory, corporate management, administrative, marketing, and distribution services at Vanguard’s cost of operations (as defined by the FSA). These costs of operations are allocated to the fund based on methods and guidelines approved by the board of trustees. Vanguard does not require reimbursement in the current period for certain costs of operations (such as deferred compensation/benefits and risk/insurance costs); the fund’s liability for these costs of operations is included in Payables to Vanguard on the Statement of Net Assets.
Upon the request of Vanguard, the fund may invest up to 0.40% of its net assets as capital in Vanguard. At December 31, 2016, the fund had contributed to Vanguard capital in the amount of $1,020,000, representing 0.01% of the fund’s net assets and 0.41% of Vanguard’s capitalization. The fund’s trustees and officers are also directors and employees, respectively, of Vanguard.
C. Various inputs may be used to determine the value of the fund’s investments. These inputs are summarized in three broad levels for financial statement purposes. The inputs or methodologies used to value securities are not necessarily an indication of the risk associated with investing in those securities.
Level 1—Quoted prices in active markets for identical securities.
Level 2—Other significant observable inputs (including quoted prices for similar securities, interest rates, prepayment speeds, credit risk, etc.).
Level 3—Significant unobservable inputs (including the fund’s own assumptions used to determine the fair value of investments).
The following table summarizes the market value of the fund’s investments as of December 31, 2016, based on the inputs used to value them:
| | | |
| | Level 1 | Level 2 | Level 3 |
| Investments | ($000) | ($000) | ($000) |
| Common Stocks | 13,899,801 | — | — |
| Temporary Cash Investments | 22,895 | 3,248 | — |
| Futures Contracts—Liabilities1 | (111) | — | — |
| Total | 13,922,585 | 3,248 | — |
| 1 Represents variation margin on the last day of the reporting period. |
71
Large-Cap Index Fund
D. At December 31, 2016, the aggregate settlement value of open futures contracts and the related
unrealized appreciation (depreciation) were:
| | | | |
| | | | ($000) |
| | | | Aggregate | |
| | | Number of | Settlement | Unrealized |
| | | Long (Short) | Value | Appreciation |
| Futures Contracts | Expiration | Contracts | Long (Short) | (Depreciation) |
| E-mini S&P 500 Index | March 2017 | 250 | 27,953 | (183) |
Unrealized appreciation (depreciation) on open futures contracts is required to be treated as realized gain (loss) for tax purposes.
E. Distributions are determined on a tax basis and may differ from net investment income and realized capital gains for financial reporting purposes. Differences may be permanent or temporary. Permanent differences are reclassified among capital accounts in the financial statements to reflect their tax character. Temporary differences arise when certain items of income, expense, gain, or loss are recognized in different periods for financial statement and tax purposes. These differences will reverse at some time in the future. Differences in classification may also result from the treatment of short-term gains as ordinary income for tax purposes.
During the year ended December 31, 2016, the fund realized $199,956,000 of net capital gains resulting from in-kind redemptions—in which shareholders exchanged fund shares for securities held by the fund rather than for cash. Because such gains are not taxable to the fund, and are not distributed to shareholders, they have been reclassified from accumulated net realized losses to paid-in capital.
For tax purposes, at December 31, 2016, the fund had $2,677,000 of ordinary income available for distribution. At December 31, 2016, the fund had available capital losses totaling $143,755,000 to offset future net capital gains. Of this amount, $24,177,000 is subject to expiration on December 31, 2018. Capital losses of $119,578,000 realized beginning in fiscal 2012 may be carried forward indefinitely under the Regulated Investment Company Modernization Act of 2010, but must be used before any expiring loss carryforwards.
At December 31, 2016, the cost of investment securities for tax purposes was $9,685,416,000. Net unrealized appreciation of investment securities for tax purposes was $4,240,528,000, consisting of unrealized gains of $4,367,557,000 on securities that had risen in value since their purchase and $127,029,000 in unrealized losses on securities that had fallen in value since their purchase.
F. During the year ended December 31, 2016, the fund purchased $2,618,817,000 of investment securities and sold $990,163,000 of investment securities, other than temporary cash investments. Purchases and sales include $1,529,947,000 and $364,717,000, respectively, in connection with in-kind purchases and redemptions of the fund’s capital shares.
72
Large-Cap Index Fund
G. Capital share transactions for each class of shares were:
| | | | |
| | Year Ended December 31, |
| | 2016 | 2015 |
| | Amount | Shares | Amount | Shares |
| | ($000) | (000) | ($000) | (000) |
| Investor Shares | | | | |
| Issued | 101,335 | 2,631 | 98,843 | 2,587 |
| Issued in Lieu of Cash Distributions | 7,219 | 184 | 6,789 | 179 |
| Redeemed | (116,430) | (3,038) | (127,105) | (3,310) |
| Net Increase (Decrease)—Investor Shares | (7,876) | (223) | (21,473) | (544) |
| ETF Shares | | | | |
| Issued | 1,676,305 | 17,626 | 1,322,830 | 14,153 |
| Issued in Lieu of Cash Distributions | — | — | — | — |
| Redeemed | (373,610) | (4,000) | (425,310) | (4,525) |
| Net Increase (Decrease)—ETF Shares | 1,302,695 | 13,626 | 897,520 | 9,628 |
| Admiral Shares | | | | |
| Issued | 926,021 | 19,289 | 972,187 | 20,442 |
| Issued in Lieu of Cash Distributions | 65,902 | 1,340 | 54,837 | 1,157 |
| Redeemed | (733,975) | (15,332) | (554,936) | (11,655) |
| Net Increase (Decrease)—Admiral Shares | 257,948 | 5,297 | 472,088 | 9,944 |
| Institutional Shares | | | | |
| Issued | 182,420 | 894 | 82,055 | 414 |
| Issued in Lieu of Cash Distributions | 13,214 | 65 | 10,669 | 55 |
| Redeemed | (132,540) | (660) | (148,785) | (755) |
| Net Increase (Decrease)—Institutional Shares | 63,094 | 299 | (56,061) | (286) |
H. Management has determined that no material events or transactions occurred subsequent to
December 31, 2016, that would require recognition or disclosure in these financial statements.
73
Report of Independent Registered
Public Accounting Firm
To the Board of Trustees of Vanguard Index Funds and the Shareholders of Vanguard Growth Index Fund, Vanguard Value Index Fund and Vanguard Large-Cap Index Fund:
In our opinion, the accompanying statements of net assets and the related statements of operations and of changes in net assets and the financial highlights present fairly, in all material respects, the financial position of Vanguard Growth Index Fund, Vanguard Value Index Fund and Vanguard Large-Cap Index Fund (constituting separate portfolios of Vanguard Index Funds, hereafter referred to as the “Funds”) at December 31, 2016, the results of each of their operations for the year then ended, the changes in each of their net assets for each of the two years in the period then ended, and the financial highlights for each of the five years in the period then ended, in conformity with accounting principles generally accepted in the United States of America. These financial statements and financial highlights (hereafter referred to as “financial statements”) are the responsibility of the Funds’ management. Our responsibility is to express an opinion on these financial statements based on our audits. We conducted our audits of these financial statements in accordance with the standards of the Public Company Accounting Oversight Board (United States). Those standards require that we plan and perform the audit to obtain reasonable assurance about whether the financial statements are free of material misstatement. An audit includes examining, on a test basis, evidence supporting the amounts and disclosures in the financial statements, assessing the accounting principles used and significant estimates made by management, and evaluating the overall financial statement presentation. We believe that our audits, which included confirmation of securities at December 31, 2016 by correspondence with the custodians and brokers and by agreement to the underlying ownership records of the transfer agent, provide a reasonable basis for our opinion.
/s/PricewaterhouseCoopers LLP
Philadelphia, Pennsylvania
February 13, 2017
74

Special 2016 tax information (unaudited) for Vanguard U.S. Stock Index Funds
(Large-Capitalization Portfolios)
This information for the fiscal year ended December 31, 2016, is included pursuant to provisions of
the Internal Revenue Code.
The funds distributed qualified dividend income to shareholders during the fiscal year as follows:
| |
| Fund | ($000) |
| Growth Index Fund | 667,450 |
| Value Index Fund | 1,160,224 |
| Large-Cap Index Fund | 262,559 |
For corporate shareholders, the percentage of investment income (dividend income plus short-term gains, if any) that qualifies for the dividends-received deduction is as follows:
| |
| Fund | Percentage |
| Growth Index Fund | 84.4% |
| Value Index Fund | 94.6 |
| Large-Cap Index Fund | 100.0 |
75
Your Fund’s After-Tax Returns
This table presents returns for your fund both before and after taxes. The after-tax returns are shown in two ways: (1) assuming that an investor owned the fund during the entire period and paid taxes on the fund’s distributions, and (2) assuming that an investor paid taxes on the fund’s distributions and sold all shares at the end of each period.
Calculations are based on the highest individual federal income tax and capital gains tax rates in effect at the times of the distributions and the hypothetical sales. State and local taxes were not considered. After-tax returns reflect any qualified dividend income. (In the example, returns after the sale of fund shares may be higher than those assuming no sale. This occurs when the sale would have produced a capital loss. The calculation assumes that the investor received a tax deduction for the loss.)
The table shows returns for Investor Shares only; returns for other share classes will differ. Please note that your actual after-tax returns will depend on your tax situation and may differ from those shown. Also note that if you own the fund in a tax-deferred account, such as an individual retirement account or a 401(k) plan, this information does not apply to you. Such accounts are not subject to current taxes.
Finally, keep in mind that a fund’s performance—whether before or after taxes—does not guarantee future results.
| | | |
| Average Annual Total Returns: U.S. Stock Index Funds Large-Capitalization Portfolios | |
| Periods Ended December 31, 2016 | | | |
| |
| | One | Five | Ten |
| | Year | Years | Years |
| Growth Index Fund Investor Shares | | | |
| Returns Before Taxes | 5.99% | 13.90% | 7.99% |
| Returns After Taxes on Distributions | 5.65 | 13.58 | 7.76 |
| Returns After Taxes on Distributions and Sale of Fund Shares | 3.63 | 11.14 | 6.50 |
| |
| | One | Five | Ten |
| | Year | Years | Years |
| Value Index Fund Investor Shares | | | |
| Returns Before Taxes | 16.75% | 14.82% | 5.85% |
| Returns After Taxes on Distributions | 16.06 | 14.22 | 5.35 |
| Returns After Taxes on Distributions and Sale of Fund Shares | 9.98 | 11.87 | 4.63 |
| |
| | One | Five | Ten |
| | Year | Years | Years |
| Large-Cap Index Fund Investor Shares | | | |
| Returns Before Taxes | 11.50% | 14.37% | 6.95% |
| Returns After Taxes on Distributions | 10.99 | 13.91 | 6.59 |
| Returns After Taxes on Distributions and Sale of Fund Shares | 6.90 | 11.52 | 5.59 |
76
About Your Fund’s Expenses
As a shareholder of the fund, you incur ongoing costs, which include costs for portfolio management, administrative services, and shareholder reports (like this one), among others. Operating expenses, which are deducted from a fund’s gross income, directly reduce the investment return of the fund.
A fund’s expenses are expressed as a percentage of its average net assets. This figure is known as the expense ratio. The following examples are intended to help you understand the ongoing costs (in dollars) of investing in your fund and to compare these costs with those of other mutual funds. The examples are based on an investment of $1,000 made at the beginning of the period shown and held for the entire period.
The accompanying table illustrates your fund’s costs in two ways:
• Based on actual fund return. This section helps you to estimate the actual expenses that you paid over the period. The ”Ending Account Value“ shown is derived from the fund‘s actual return, and the third column shows the dollar amount that would have been paid by an investor who started with $1,000 in the fund. You may use the information here, together with the amount you invested, to estimate the expenses that you paid over the period.
To do so, simply divide your account value by $1,000 (for example, an $8,600 account value divided by $1,000 = 8.6), then multiply the result by the number given for your fund under the heading ”Expenses Paid During Period.“
• Based on hypothetical 5% yearly return. This section is intended to help you compare your fund‘s costs with those of other mutual funds. It assumes that the fund had a yearly return of 5% before expenses, but that the expense ratio is unchanged. In this case—because the return used is not the fund’s actual return—the results do not apply to your investment. The example is useful in making comparisons because the Securities and Exchange Commission requires all mutual funds to calculate expenses based on a 5% return. You can assess your fund’s costs by comparing this hypothetical example with the hypothetical examples that appear in shareholder reports of other funds.
Note that the expenses shown in the table are meant to highlight and help you compare ongoing costs only and do not reflect transaction costs incurred by the fund for buying and selling securities. Further, the expenses do not include any purchase, redemption, or account service fees described in the fund prospectus. If such fees were applied to your account, your costs would be higher. Your fund does not carry a “sales load.”
The calculations assume no shares were bought or sold during the period. Your actual costs may have been higher or lower, depending on the amount of your investment and the timing of any purchases or redemptions.
You can find more information about the fund’s expenses, including annual expense ratios, in the Financial Statements section of this report. For additional information on operating expenses and other shareholder costs, please refer to your fund’s current prospectus.
77
| | | |
| Six Months Ended December 31, 2016 | | | |
| | Beginning | Ending | Expenses |
| | Account Value | Account Value | Paid During |
| | 6/30/2016 | 12/31/2016 | Period |
| Based on Actual Fund Return | | | |
| Growth Index Fund | | | |
| Investor Shares | $1,000.00 | $1,046.41 | $0.77 |
| ETF Shares | 1,000.00 | 1,046.99 | 0.21 |
| Admiral Shares | 1,000.00 | 1,047.00 | 0.26 |
| Institutional Shares | 1,000.00 | 1,047.01 | 0.21 |
| Value Index Fund | | | |
| Investor Shares | $1,000.00 | $1,107.42 | $0.79 |
| ETF Shares | 1,000.00 | 1,107.99 | 0.26 |
| Admiral Shares | 1,000.00 | 1,107.74 | 0.26 |
| Institutional Shares | 1,000.00 | 1,108.13 | 0.21 |
| Large-Cap Index Fund | | | |
| Investor Shares | $1,000.00 | $1,078.39 | $0.84 |
| ETF Shares | 1,000.00 | 1,078.90 | 0.26 |
| Admiral Shares | 1,000.00 | 1,079.06 | 0.26 |
| Institutional Shares | 1,000.00 | 1,079.04 | 0.21 |
78
| | | |
| Six Months Ended December 31, 2016 | | | |
| | Beginning | Ending | Expenses |
| | Account Value | Account Value | Paid During |
| | 6/30/2016 | 12/31/2016 | Period |
| Based on Hypothetical 5% Yearly Return | | | |
| Growth Index Fund | | | |
| Investor Shares | $1,000.00 | $1,024.38 | $0.76 |
| ETF Shares | 1,000.00 | 1,024.94 | 0.20 |
| Admiral Shares | 1,000.00 | 1,024.89 | 0.25 |
| Institutional Shares | 1,000.00 | 1,024.94 | 0.20 |
| Value Index Fund | | | |
| Investor Shares | $1,000.00 | $1,024.38 | $0.76 |
| ETF Shares | 1,000.00 | 1,024.89 | 0.25 |
| Admiral Shares | 1,000.00 | 1,024.89 | 0.25 |
| Institutional Shares | 1,000.00 | 1,024.94 | 0.20 |
| Large-Cap Index Fund | | | |
| Investor Shares | $1,000.00 | $1,024.33 | $0.81 |
| ETF Shares | 1,000.00 | 1,024.89 | 0.25 |
| Admiral Shares | 1,000.00 | 1,024.89 | 0.25 |
| Institutional Shares | 1,000.00 | 1,024.94 | 0.20 |
The calculations are based on expenses incurred in the most recent six-month period. The funds’ annualized six-month expense ratios for that
period are: for the Growth Index Fund, 0.15% for Investor Shares, 0.04% for ETF Shares, 0.05% for Admiral Shares, and 0.04% for
Institutional Shares; for the Value Index Fund, 0.15% for Investor Shares, 0.05% for ETF Shares, 0.05% for Admiral Shares, and 0.04% for
Institutional Shares; and for the Large-Cap Index Fund, 0.16% for Investor Shares, 0.05% for ETF Shares, 0.05% for Admiral Shares, and
0.04% for Institutional Shares. The dollar amounts shown as “Expenses Paid” are equal to the annualized expense ratio multiplied by the
average account value over the period, multiplied by the number of days in the most recent six-month period, then divided by the number of
days in the most recent 12-month period (184/366).
79
Glossary
30-Day SEC Yield. A fund’s 30-day SEC yield is derived using a formula specified by the U.S. Securities and Exchange Commission. Under the formula, data related to the fund’s security holdings in the previous 30 days are used to calculate the fund’s hypothetical net income for that period, which is then annualized and divided by the fund’s estimated average net assets over the calculation period. For the purposes of this calculation, a security’s income is based on its current market yield to maturity (for bonds), its actual income (for asset-backed securities), or its projected dividend yield (for stocks). Because the SEC yield represents hypothetical annualized income, it will differ—at times significantly—from the fund’s actual experience. As a result, the fund’s income distributions may be higher or lower than implied by the SEC yield.
Beta. A measure of the magnitude of a fund’s past share-price fluctuations in relation to the ups and downs of a given market index. The index is assigned a beta of 1.00. Compared with a given index, a fund with a beta of 1.20 typically would have seen its share price rise or fall by 12% when the index rose or fell by 10%. For this report, beta is based on returns over the past 36 months for both the fund and the index. Note that a fund’s beta should be reviewed in conjunction with its R-squared (see definition). The lower the R-squared, the less correlation there is between the fund and the index, and the less reliable beta is as an indicator of volatility.
Dividend Yield. Dividend income earned by stocks, expressed as a percentage of the aggregate market value (or of net asset value, for a fund). The yield is determined by dividing the amount of the annual dividends by the aggregate value (or net asset value) at the end of the period. For a fund, the dividend yield is based solely on stock holdings and does not include any income produced by other investments.
Earnings Growth Rate. The average annual rate of growth in earnings over the past five years for the stocks now in a fund.
Equity Exposure. A measure that reflects a fund’s investments in stocks and stock futures. Any holdings in short-term reserves are excluded.
Expense Ratio. A fund’s total annual operating expenses expressed as a percentage of the fund’s average net assets. The expense ratio includes management and administrative expenses, but does not include the transaction costs of buying and selling portfolio securities.
Foreign Holdings. The percentage of a fund represented by securities or depositary receipts of companies based outside the United States.
Inception Date. The date on which the assets of a fund (or one of its share classes) are first invested in accordance with the fund’s investment objective. For funds with a subscription period, the inception date is the day after that period ends. Investment performance is measured from the inception date.
Median Market Cap. An indicator of the size of companies in which a fund invests; the midpoint of market capitalization (market price x shares outstanding) of a fund’s stocks, weighted by the proportion of the fund’s assets invested in each stock. Stocks representing half of the fund’s assets have market capitalizations above the median, and the rest are below it.
Price/Book Ratio. The share price of a stock divided by its net worth, or book value, per share. For a fund, the weighted average price/book ratio of the stocks it holds.
80
Price/Earnings Ratio. The ratio of a stock’s current price to its per-share earnings over the past year. For a fund, the weighted average P/E of the stocks it holds. P/E is an indicator of market expectations about corporate prospects; the higher the P/E, the greater the expectations for a company’s future growth.
R-Squared. A measure of how much of a fund’s past returns can be explained by the returns from the market in general, as measured by a given index. If a fund’s total returns were precisely synchronized with an index’s returns, its R-squared would be 1.00. If the fund’s returns bore no relationship to the index’s returns, its R-squared would be 0. For this report, R-squared is based on returns over the past 36 months for both the fund and the index.
Return on Equity. The annual average rate of return generated by a company during the past five years for each dollar of shareholder’s equity (net income divided by shareholder’s equity). For a fund, the weighted average return on equity for the companies whose stocks it holds.
Short-Term Reserves. The percentage of a fund invested in highly liquid, short-term securities that can be readily converted to cash.
Turnover Rate. An indication of the fund’s trading activity. Funds with high turnover rates incur higher transaction costs and may be more likely to distribute capital gains (which may be taxable to investors). The turnover rate excludes in-kind transactions, which have minimal impact on costs.
Benchmark Information
Spliced Growth Index: S&P 500 Growth Index (formerly known as the S&P 500/Barra Growth Index) through May 16, 2003; MSCI US Prime Market Growth Index through April 16, 2013; CRSP US Large Cap Growth Index thereafter.
Spliced Large Cap Index: MSCI US Prime Market 750 Index through January 30, 2013; CRSP US Large Cap Index thereafter.
Spliced Value Index: S&P 500 Value Index (formerly known as the S&P 500/Barra Value Index) through May 16, 2003; MSCI US Prime Market Value Index through April 16, 2013; CRSP US Large Cap Value Index thereafter.
81
This page intentionally left blank.
This page intentionally left blank.
This page intentionally left blank.
This page intentionally left blank.
This page intentionally left blank.
This page intentionally left blank.
The People Who Govern Your Fund
The trustees of your mutual fund are there to see that the fund is operated and managed in your best interests since, as a shareholder, you are a part owner of the fund. Your fund’s trustees also serve on the board of directors of The Vanguard Group, Inc., which is owned by the Vanguard funds and provides services to them on an at-cost basis.
A majority of Vanguard’s board members are independent, meaning that they have no affiliation with Vanguard or the funds they oversee, apart from the sizable personal investments they have made as private individuals. The independent board members have distinguished backgrounds in business, academia, and public service. Each of the trustees and executive officers oversees 198 Vanguard funds.
The following table provides information for each trustee and executive officer of the fund. The mailing address of the trustees and officers is P.O. Box 876, Valley Forge, PA 19482. More information about the trustees is in the Statement of Additional Information, which can be obtained, without charge, by contacting Vanguard at 800-662-7447, or online at vanguard.com.
InterestedTrustee1
F. William McNabb III
Born 1957. Trustee Since July 2009. Chairman of the Board. Principal Occupation(s) During the Past Five Years and Other Experience: Chairman of the Board of The Vanguard Group, Inc., and of each of the investment companies served by The Vanguard Group, since January 2010; Director of The Vanguard Group since 2008; Chief Executive Officer and President of The Vanguard Group, and of each of the investment companies served by The Vanguard Group, since 2008; Director of Vanguard Marketing Corporation; Managing Director of The Vanguard Group (1995–2008).
IndependentTrustees
Emerson U. Fullwood
Born 1948. Trustee Since January 2008. Principal Occupation(s) During the Past Five Years and Other Experience: Executive Chief Staff and Marketing Officer for North America and Corporate Vice President (retired 2008) of Xerox Corporation (document management products and services); Executive in Residence and 2009–2010 Distinguished Minett Professor at the Rochester Institute of Technology; Lead Director of SPX FLOW, Inc. (multi-industry manufacturing); Director of the United Way of Rochester, the University of Rochester Medical Center, Monroe Community College Foundation, North Carolina A&T University, and Roberts Wesleyan College.
Rajiv L. Gupta
Born 1945. Trustee Since December 2001.2 Principal Occupation(s) During the Past Five Years and Other Experience: Chairman and Chief Executive Officer (retired 2009) and President (2006–2008) of Rohm and Haas Co. (chemicals); Director of Tyco International plc (diversified manufacturing and services), HP Inc. (printer and personal computer manufacturing), and Delphi Automotive plc (automotive components); Senior Advisor at New Mountain Capital.
Amy Gutmann
Born 1949. Trustee Since June 2006. Principal Occupation(s) During the Past Five Years and Other Experience: President of the University of Pennsylvania; Christopher H. Browne Distinguished Professor of Political Science, School of Arts and Sciences, and Professor of Communication, Annenberg School for Communication, with secondary faculty appointments in the Department of Philosophy, School of Arts and Sciences, and at the Graduate School of Education, University of Pennsylvania; Trustee of the National Constitution Center; Chair of the Presidential Commission for the Study of Bioethical Issues.
JoAnn Heffernan Heisen
Born 1950. Trustee Since July 1998. Principal Occupation(s) During the Past Five Years and Other Experience: Corporate Vice President and Chief Global Diversity Officer (retired 2008) and Member of the Executive Committee (1997–2008) of Johnson & Johnson (pharmaceuticals/medical devices/consumer products); Director of Skytop Lodge Corporation (hotels) and the Robert Wood Johnson Foundation; Member of the Advisory Board of the Institute for Women’s Leadership at Rutgers University.
F. Joseph Loughrey
Born 1949. Trustee Since October 2009. Principal Occupation(s) During the Past Five Years and Other Experience: President and Chief Operating Officer (retired 2009) of Cummins Inc. (industrial machinery); Chairman of the Board of Hillenbrand, Inc. (specialized consumer services), and of Oxfam America; Director of SKF AB (industrial machinery), Hyster-Yale Materials Handling, Inc. (forklift trucks), the Lumina Foundation for Education, and the V Foundation for Cancer Research; Member of the Advisory Council for the College of Arts and Letters and of the Advisory Board to the Kellogg Institute for International Studies, both at the University of Notre Dame.
Mark Loughridge
Born 1953. Trustee Since March 2012. Principal Occupation(s) During the Past Five Years and Other Experience: Senior Vice President and Chief Financial Officer (retired 2013) at IBM (information technology services); Fiduciary Member of IBM’s Retirement Plan Committee (2004–2013); Director of the Dow Chemical Company; Member of the Council on Chicago Booth.
Scott C. Malpass
Born 1962. Trustee Since March 2012. Principal Occupation(s) During the Past Five Years and Other Experience: Chief Investment Officer and Vice President at the University of Notre Dame; Assistant Professor of Finance at the Mendoza College of Business at Notre Dame; Member of the Notre Dame 403(b) Investment Committee, the Board of Advisors for Spruceview Capital Partners, and the Investment Advisory Committee of Major League Baseball; Board Member of TIFF Advisory Services, Inc., and Catholic Investment Services, Inc. (investment advisors).
André F. Perold
Born 1952. Trustee Since December 2004. Principal Occupation(s) During the Past Five Years and Other Experience: George Gund Professor of Finance and Banking, Emeritus at the Harvard Business School (retired 2011); Chief Investment Officer and Managing Partner of HighVista Strategies LLC (private investment firm); Director of Rand Merchant Bank; Overseer of the Museum of Fine Arts Boston.
Peter F. Volanakis
Born 1955. Trustee Since July 2009. Principal Occupation(s) During the Past Five Years and Other Experience: President and Chief Operating Officer (retired 2010) of Corning Incorporated (communications equipment); Chairman of the Board of Trustees of Colby-Sawyer College; Member of the Advisory Board of the Norris Cotton Cancer Center.
Executive Officers
Glenn Booraem
Born 1967. Treasurer Since May 2015. Principal Occupation(s) During the Past Five Years and Other Experience: Principal of The Vanguard Group, Inc.; Treasurer of each of the investment companies served by The Vanguard Group; Controller of each of the investment companies served by The Vanguard Group (2010–2015); Assistant Controller of each of the investment companies served by The Vanguard Group (2001–2010).
Thomas J. Higgins
Born 1957. Chief Financial Officer Since September 2008. Principal Occupation(s) During the Past Five Years and Other Experience: Principal of The Vanguard Group, Inc.; Chief Financial Officer of each of the investment companies served by The Vanguard Group; Treasurer of each of the investment companies served by The Vanguard Group (1998–2008).
Peter Mahoney
Born 1974. Controller Since May 2015. Principal Occupation(s) During the Past Five Years and Other Experience: Head of Global Fund Accounting at The Vanguard Group, Inc.; Controller of each of the investment companies served by The Vanguard Group; Head of International Fund Services at The Vanguard Group (2008–2014).
Anne E. Robinson
Born 1970. Secretary Since September 2016. Principal Occupation(s) During the Past Five Years and Other Experience: Managing Director of The Vanguard Group, Inc.; General Counsel of The Vanguard Group; Secretary of The Vanguard Group and of each of the investment companies served by The Vanguard Group; Director and Senior Vice President of Vanguard Marketing Corporation; Managing Director and General Counsel of Global Cards and Consumer Services at Citigroup (2014–2016); Counsel at American Express (2003–2014).
| |
| Vanguard Senior Management Team |
| Mortimer J. Buckley | Thomas M. Rampulla |
| Martha G. King | Glenn W. Reed |
| John T. Marcante | Karin A. Risi |
| Chris D. McIsaac | Michael Rollings |
| James M. Norris | |
| |
| Chairman Emeritus and Senior Advisor |
| John J. Brennan | |
| Chairman, 1996–2009 | |
| Chief Executive Officer and President, 1996–2008 |
| |
| Founder | |
| John C. Bogle | |
| Chairman and Chief Executive Officer, 1974–1996 |
1 Mr. McNabb is considered an “interested person,” as defined in the Investment Company Act of 1940, because he is an officer of the Vanguard funds.
2 December 2002 for Vanguard Equity Income Fund, the Vanguard Municipal Bond Funds, and the Vanguard State Tax-Exempt Funds.
|  |
| | P.O. Box 2600 |
| | Valley Forge, PA 19482-2600 |
| |
| |
| |
| Connect with Vanguard® > vanguard.com |
| |
| |
| |
| Fund Information > 800-662-7447 | |
| Direct Investor Account Services > 800-662-2739 | |
| Institutional Investor Services > 800-523-1036 | |
| Text Telephone for People | |
| Who Are Deaf or Hard of Hearing > 800-749-7273 | |
| |
| This material may be used in conjunction | |
| with the offering of shares of any Vanguard | |
| fund only if preceded or accompanied by | |
| the fund’s current prospectus. | |
| |
| All comparative mutual fund data are from Lipper, a | |
| Thomson Reuters Company, or Morningstar, Inc., unless | |
| otherwise noted. | |
| |
| You can obtain a free copy of Vanguard’s proxy voting | |
| guidelines by visiting vanguard.com/proxyreporting or by | |
| calling Vanguard at 800-662-2739. The guidelines are | |
| also available from the SEC’s website, sec.gov. In | |
| addition, you may obtain a free report on how your fund | |
| voted the proxies for securities it owned during the 12 | |
| months ended June 30. To get the report, visit either | |
| vanguard.com/proxyreporting or sec.gov. | |
| |
| You can review and copy information about your fund at | |
| the SEC’s Public Reference Room in Washington, D.C. To | |
| find out more about this public service, call the SEC at | |
| 202-551-8090. Information about your fund is also | |
| available on the SEC’s website, and you can receive | |
| copies of this information, for a fee, by sending a | |
| request in either of two ways: via email addressed to | |
| publicinfo@sec.gov or via regular mail addressed to the | |
| Public Reference Section, Securities and Exchange | |
| Commission, Washington, DC 20549-1520. | |
| |
| | © 2017 The Vanguard Group, Inc. |
| | All rights reserved. |
| | Vanguard Marketing Corporation, Distributor. |
| |
| | Q03070 022017 |

Annual Report | December 31, 2016
Vanguard Total Stock Market Index Fund
A new format, unwavering commitment
As you begin reading this report, you’ll notice that we’ve made some improvements to the opening sections—based on feedback from you, our clients.
Page 1 starts with a new ”Your Fund’s Performance at a Glance,” a concise, handy summary of how your fund performed during the period.
In the renamed ”Chairman’s Perspective,” Bill McNabb will focus on enduring principles and investment insights.
We’ve modified some tables, and eliminated some redundancy, but we haven’t removed any information.
At Vanguard, we’re always looking for better ways to communicate and to help you make sound investment decisions. Thank you for entrusting your assets to us.
| |
| Contents | |
| Your Fund’s Performance at a Glance. | 1 |
| Chairman’s Perspective. | 3 |
| Fund Profile. | 7 |
| Performance Summary. | 9 |
| Financial Statements. | 12 |
| Your Fund’s After-Tax Returns. | 32 |
| About Your Fund’s Expenses. | 33 |
| Glossary. | 35 |
Please note: The opinions expressed in this report are just that—informed opinions. They should not be considered promises or advice.
Also, please keep in mind that the information and opinions cover the period through the date on the front of this report. Of course, the
risks of investing in your fund are spelled out in the prospectus.
See the Glossary for definitions of investment terms used in this report.
About the cover: No matter what language you speak, Vanguard has one consistent message and set of principles. Our primary
focus is on you, our clients. We conduct our business with integrity as a faithful steward of your assets. This message is shown
translated into seven languages, reflecting our expanding global presence.
Your Fund’s Performance at a Glance
• Vanguard Total Stock Market Index Fund returned well over 12% for the 12 months ended December 31, 2016. The fund closely tracked its target index, the CRSP US Total Market Index, and exceeded the average return of its multicapitalization core fund peers.
• The fund offers investors exposure to every segment, size, and style of the U.S. equity market.
• Small-cap stocks outperformed their large- and mid-cap counterparts, while value stocks outpaced growth.
• The fund recorded positive returns in nine of the ten market sectors. Returns surpassed 20% in four sectors and 10% in seven. The fund’s largest sector, financials, contributed most to the outcome. Only health care stocks declined.
• Over the past ten years, the fund posted an average annual return of about 7%, in line with its benchmark and more than 1 percentage point higher than its peer-fund average.
| |
| Total Returns: Fiscal Year Ended December 31, 2016 | |
| | Total |
| | Returns |
| Vanguard Total Stock Market Index Fund | |
| Investor Shares | 12.53% |
| ETF Shares | |
| Market Price | 12.74 |
| Net Asset Value | 12.68 |
| Admiral™ Shares | 12.66 |
| Institutional Shares | 12.67 |
| Institutional Plus Shares | 12.69 |
| Institutional Select Shares (Inception: 6/27/2016) | 14.24 |
| CRSP US Total Market Index | 12.68 |
| Multi-Cap Core Funds Average | 10.19 |
| Multi-Cap Core Funds Average: Derived from data provided by Lipper, a Thomson Reuters Company. |
Admiral Shares carry lower expenses and are available to investors who meet certain account-balance requirements. Institutional Shares,
Institutional Plus Shares, and Institutional Select Shares are available to certain institutional investors who meet specific administrative,
service, and account-size criteria. The Vanguard ETF® Shares shown are traded on the NYSE Arca exchange and are available only through
brokers. The table provides ETF returns based on both the NYSE Arca market price and the net asset value for a share. U.S. Pat. Nos.
6,879,964; 7,337,138; 7,720,749; 7,925,573; 8,090,646; and 8,417,623.
For the ETF Shares, the market price is determined by the midpoint of the bid-offer spread as of the closing time of the New York Stock
Exchange (generally 4 p.m., Eastern time). The net asset value is also determined as of the NYSE closing time. For more information about
how the ETF Shares' market prices have compared with their net asset value, visit vanguard.com, select your ETF, and then select the Price
and Performance tab. The ETF premium/discount analysis there shows the percentages of days on which the ETF Shares' market price was
above or below the NAV.
1
| |
| Total Returns: Ten Years Ended December 31, 2016 | |
| | Average |
| | Annual Return |
| Total Stock Market Index Fund Investor Shares | 7.11% |
| Spliced Total Stock Market Index | 7.23 |
| Multi-Cap Core Funds Average | 5.51 |
For a benchmark description, see the Glossary.
Multi-Cap Core Funds Average: Derived from data provided by Lipper, a Thomson Reuters Company.
The figures shown represent past performance, which is not a guarantee of future results. (Current performance may be lower or higher than the performance data cited. For performance data current to the most recent month-end, visit our website at vanguard.com/performance.) Note, too, that both investment returns and principal value can fluctuate widely, so an investor’s shares, when sold, could be worth more or less than their original cost.
| | | | | | |
| Expense Ratios | | | | | | |
| Your Fund Compared With Its Peer Group | | | | | | |
| | | | | | Institutional | |
| Investor | ETF | Admiral | Institutional | Institutional | Select | Peer Group |
| Shares | Shares | Shares | Shares | Plus Shares | Shares | Average |
| Total Stock Market Index Fund 0.16% | 0.05% | 0.05% | 0.04% | 0.02% | 0.01% | 1.17% |
The fund expense ratios shown are from the prospectus dated April 27, 2016, and represent estimated costs for the current fiscal year. For the
fiscal year ended December 31, 2016, the fund’s expense ratios were: 0.15% for Investor Shares, 0.04% for ETF Shares, 0.04% for Admiral
Shares, 0.03% for Institutional Shares, 0.02% for Institutional Plus Shares, and 0.01% for Institutional Select Shares (annualized since
inception). The peer-group expense ratio is derived from data provided by Lipper, a Thomson Reuters Company, and captures information
through year-end 2015.
Peer group: Multi-Cap Core Funds.
2
Chairman’s Perspective

Bill McNabb
Chairman and Chief Executive Officer
Dear Shareholder,
If you’re like most investors, a big question on your mind is: What’s in store for the markets and the economy in 2017?
At Vanguard, we’re just as curious about the immediate future. But our curiosity is tempered by our belief that forecasts should give a range of possible outcomes, not pinpoint predictions. After all, there are bound to be occurrences the experts won’t see coming.
What really matters for investors
In 2016, we saw two cases in point: The United Kingdom’s June vote to exit the European Union and the November election of Donald Trump as U.S. president. Both unexpected outcomes triggered swift market reactions. But despite some short-term volatility, the markets’ 12-month performance as of December 31, 2016, proved to be less dramatic. U.S. stocks posted healthy returns, and U.S. bonds provided returns close to their long-term averages. International stocks and bonds also advanced, although returns for U.S. investors were reduced by the strength of the U.S. dollar.
The surprises of 2016 remind us to be skeptical of overly precise short-term predictions about 2017. At the cusp of a new year, market prognosticators forecast where the Standard & Poor’s 500 Index or the yield on the 10-year Treasury note will end up in 12 months. Such predictions can be attention-getting. They can also be dead wrong.
3
Investors are better off taking note of long-term trends that stand to influence our economies and markets. We’re watching these trends closely, and we discuss our latest assessment in our 2017 economic and market outlook, which you can read at vanguard.com/research.
Our global economic outlook: Expect stabilization, not stagnation
One phenomenon in particular that we’re watching is the low-growth, low-interest-rate environment that has marked the global economy since the 2008–09 financial crisis. We don’t think this economic backdrop is simply the result of cyclically weak demand or long-term stagnation. Instead, certain structural forces are contributing: Falling technology costs are restraining the amounts businesses are spending on capital investment, an aging population is weighing on growth in the developed world, and the free movement of capital and products across the globe has restrained prices and wages.
In the near term, these forces will continue to dampen growth, inflation, and interest rates. They also make it unlikely that further monetary stimulus from central banks will do much to spur growth.
I realize this all may sound gloomy, but that’s not how we see it. We expect global growth to stabilize at more modest levels, not stagnate. The world isn’t headed for Japanese-style deflation, in which a widespread sustained drop in prices puts economic activity into hibernation.
| | | |
| Market Barometer | | | |
| | Average Annual Total Returns |
| | Periods Ended December 31, 2016 |
| | One | Three | Five |
| | Year | Years | Years |
| Stocks | | | |
| Russell 1000 Index (Large-caps) | 12.05% | 8.59% | 14.69% |
| Russell 2000 Index (Small-caps) | 21.31 | 6.74 | 14.46 |
| Russell 3000 Index (Broad U.S. market) | 12.74 | 8.43 | 14.67 |
| FTSE All-World ex US Index (International) | 4.80 | -1.16 | 5.52 |
| |
| Bonds | | | |
| Bloomberg Barclays U.S. Aggregate Bond Index | | | |
| (Broad taxable market) | 2.65% | 3.03% | 2.23% |
| Bloomberg Barclays Municipal Bond Index | | | |
| (Broad tax-exempt market) | 0.25 | 4.14 | 3.28 |
| Citigroup Three-Month U.S. Treasury Bill Index | 0.27 | 0.09 | 0.08 |
| |
| CPI | | | |
| Consumer Price Index | 2.07% | 1.18% | 1.36% |
4
In fact, we believe that global growth could pick up modestly over time. Our expectation is based on a potential rebound in productivity as new digital technologies are used more effectively. We also anticipate a slight recovery in the labor force as the baby boom generation finishes its transition to retirement, nudging up demand for workers.
Put expansion in perspective
Looking to the United States, the world’s largest economy remains firmly on a long-term-growth path of about 2% per year. That’s lower than the historical average of 3.25% since 1950. We see such growth at this level as fundamentally sound, rather than abnormally low. Our evaluation takes into account lower U.S. population growth and the reality that the economic expansion from the 1980s until the financial crisis was fueled by debt, distorting the numbers.
Turning to prices, we think that core U.S. inflation should modestly exceed 2% in 2017. That, in turn, will support further interest rate hikes by the Federal Reserve, similar to the one at the end of 2016.
We expect the Fed to raise rates in 2017 before taking an extended pause, and we see the federal funds rate staying below 2% through at least 2018.
Prepare for muted returns
And what about prospects for the markets? Vanguard’s outlook for global stocks and bonds remains the most guarded in ten years, given fairly high stock valuations
|
| Expect more modest returns, rely on time-tested principles |
| |
| In Vanguard’s economic and market outlook for 2017, Global Chief Economist Joseph Davis |
| and his team offer a projection of more modest returns from the global stock and bond |
| markets. They caution that, over the next decade, returns for a balanced portfolio are likely |
| to be moderately below long-run historical averages. |
| |
| The team’s simulations indicate that for the decade ending in 2026, the average annualized |
| return of a 60% stock/40% bond portfolio is likely to be centered in the 3%–5% range after |
| inflation. That’s below the actual average after-inflation return of 6% for the same portfolio |
| for the nine decades since 1926. |
| |
| Ultimately, our global market outlook points toward a somewhat more challenging environment, |
| yet one in which, over time, investors with an appropriate level of discipline, diversification, and |
| patience are likely to be rewarded with reasonable inflation-adjusted returns. |
| |
| For more information about our expectations and the probability of various outcomes, see 2017 |
| Economic and Market Outlook: Stabilization, Not Stagnation, available at vanguard.com/research. |
| |
| |
| IMPORTANT: The projections and other information generated by the Vanguard Capital Markets Model® (VCMM) |
| regarding the likelihood of various investment outcomes are hypothetical in nature, do not reflect actual investment |
| results, and are not guarantees of future results. Distribution of return outcomes from the VCMM are derived |
| from 10,000 simulations for each modeled asset class. Simulations as of September 30, 2016. Results from the |
| model may vary with each use and over time. For more information, see the note at the end of this letter. |
5
and the low-interest-rate environment. We don’t expect global bond yields to increase materially from year-end 2016 levels.
Our outlook for global equities is annualized returns of 5%–8% over the next decade. This outlook isn’t bearish, but is actually fairly positive when you take into account the current low-rate environment. (See the box titled Expect more modest returns, rely on time-tested principles for more.)
Focus on the four keys to investment success
Significant trends often happen gradually. Like shifting tides, they’re sometimes barely noticeable at first but ultimately can change the landscape entirely. Other times, apparent trends can end up receding before they have much of a long-term impact. Given the future’s inherent unpredictability, it’s not reasonable to expect a surefire block-buster revelation from any prognosticator or investment firm.
What to conclude, then? No matter what scenario plays out, we believe investors have the best chance for success if they stay focused on what they can control: their goals, asset allocation, and investment costs, along with the discipline to stick to a plan. As Tim Buckley, our chief investment officer, likes to say, this can be easy to say but harder to do, especially in times of uncertainty. Investors who can stay focused on those four keys will find themselves well-positioned to weather any market.
As always, thank you for investing with Vanguard.
Sincerely,

F. William McNabb III
Chairman and Chief Executive Officer
January 16, 2017
IMPORTANT: The projections and other information generated by the Vanguard Capital Markets Model regarding
the likelihood of various investment outcomes are hypothetical in nature, do not reflect actual investment results,
and are not guarantees of future results. VCMM results will vary with each use and over time.
The VCMM projections are based on a statistical analysis of historical data. Future returns may behave differently from the
historical patterns captured in the VCMM. More important, the VCMM may be underestimating extreme negative scenarios
unobserved in the historical period on which the model estimation is based.
The VCMM is a proprietary financial simulation tool developed and maintained by Vanguard’s Investment Strategy Group.
The model forecasts distributions of future returns for a wide array of broad asset classes. Those asset classes include U.S.
and international equity markets, several maturities of the U.S. Treasury and corporate fixed income markets, international
fixed income markets, U.S. money markets, commodities, and certain alternative investment strategies. The theoretical and
empirical foundation for the Vanguard Capital Markets Model is that the returns of various asset classes reflect the compensation
investors require for bearing different types of systematic risk (beta). At the core of the model are estimates of the dynamic
statistical relationship between risk factors and asset returns, obtained from statistical analysis based on available monthly
financial and economic data. Using a system of estimated equations, the model then applies a Monte Carlo simulation method
to project the estimated interrelationships among risk factors and asset classes as well as uncertainty and randomness over
time. The model generates a large set of simulated outcomes for each asset class over several time horizons. Forecasts are
obtained by computing measures of central tendency in these simulations. Results produced by the tool will vary with each
use and over time.
6
Total Stock Market Index Fund
Fund Profile
As of December 31, 2016
| | | | | | |
| Share-Class Characteristics | | | | | | |
| | | | | | | Institutional |
| | Investor | | Admiral | Institutional | Institutional | Select |
| | Shares | ETF Shares | Shares | Shares | Plus Shares | Shares |
| Ticker Symbol | VTSMX | VTI | VTSAX | VITSX | VSMPX | VSTSX |
| Expense Ratio1 | 0.16% | 0.05% | 0.05% | 0.04% | 0.02% | 0.01% |
| 30-Day SEC Yield | 1.83% | 1.96% | 1.96% | 1.97% | 1.96% | 1.97% |
| | |
| Portfolio Characteristics | | |
| | | CRSP US |
| | | Total Market |
| | Fund | Index |
| Number of Stocks | 3,592 | 3,589 |
| Median Market Cap | $54.1B | $54.1B |
| Price/Earnings Ratio | 24.4x | 24.4x |
| Price/Book Ratio | 2.8x | 2.8x |
| Return on Equity | 16.7% | 16.4% |
| Earnings Growth Rate | 8.0% | 8.3% |
| Dividend Yield | 2.0% | 2.0% |
| Foreign Holdings | 0.0% | 0.0% |
| Turnover Rate | 4% | — |
| Short-Term Reserves | -0.1% | — |
| | |
| Sector Diversification (% of equity exposure) |
| | | CRSP US |
| | | Total Market |
| | Fund | Index |
| Basic Materials | 2.6% | 2.6% |
| Consumer Goods | 9.6 | 9.6 |
| Consumer Services | 13.0 | 13.0 |
| Financials | 20.7 | 20.7 |
| Health Care | 12.3 | 12.3 |
| Industrials | 12.9 | 12.9 |
| Oil & Gas | 7.0 | 7.0 |
| Technology | 16.3 | 16.3 |
| Telecommunications | 2.4 | 2.4 |
| Utilities | 3.2 | 3.2 |
| |
| Volatility Measures | |
| | CRSP US |
| | Total Market |
| | Index |
| R-Squared | 1.00 |
| Beta | 1.00 |
| These measures show the degree and timing of the fund’s |
| fluctuations compared with the index over 36 months. |
| | |
| Ten Largest Holdings (% of total net assets) |
| Apple Inc. | Computer Hardware | 2.5% |
| Alphabet Inc. | Internet | 2.0 |
| Microsoft Corp. | Software | 2.0 |
| Exxon Mobil Corp. | Integrated Oil & Gas | 1.6 |
| Berkshire Hathaway Inc. Reinsurance | 1.3 |
| Johnson & Johnson | Pharmaceuticals | 1.3 |
| JPMorgan Chase & Co. | Banks | 1.3 |
| Amazon.com Inc. | Broadline Retailers | 1.3 |
| General Electric Co. | Diversified Industrials | 1.2 |
| Facebook Inc. | Internet | 1.1 |
| Top Ten | | 15.6% |
| The holdings listed exclude any temporary cash investments and equity index products. |
1 The expense ratios shown are from the prospectus dated April 27, 2016, and represent estimated costs for the current fiscal year. For the fiscal
year ended December 31, 2016, the expense ratios were 0.15% for Investor Shares, 0.04% for ETF Shares, 0.04% for Admiral Shares, 0.03% for
Institutional Shares, 0.02% for Institutional Plus Shares, and 0.01% for Institutional Select Shares (annualized since inception).
7
Total Stock Market Index Fund
Investment Focus
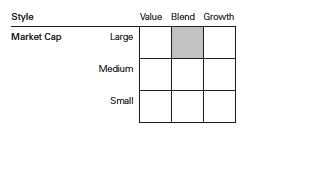
8
Total Stock Market Index Fund
Performance Summary
All of the returns in this report represent past performance, which is not a guarantee of future results that may be achieved by the fund. (Current performance may be lower or higher than the performance data cited. For performance data current to the most recent month-end, visit our website at vanguard.com/performance.) Note, too, that both investment returns and principal value can fluctuate widely, so an investor’s shares, when sold, could be worth more or less than their original cost. The returns shown do not reflect taxes that a shareholder would pay on fund distributions or on the sale of fund shares.
Cumulative Performance: December 31, 2006, Through December 31, 2016
Initial Investment of $10,000
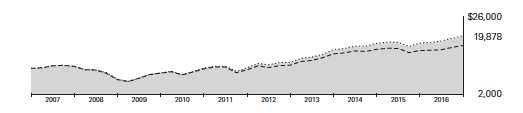
| | | | | |
| | | Average Annual Total Returns | |
| | | Periods Ended December 31, 2016 | |
| | | | | | Final Value |
| | | One | Five | Ten | of a $10,000 |
| | | Year | Years | Years | Investment |
| | Total Stock Market Index Fund | | | | |
| | Investor Shares | 12.53% | 14.49% | 7.11% | $19,878 |
| • • • • • • •• | Spliced Total Stock Market Index | 12.68 | 14.64 | 7.23 | 20,093 |
| – – – – | Multi-Cap Core Funds Average | 10.19 | 12.37 | 5.51 | 17,098 |
| For a benchmark description, see the Glossary. |
| Multi-Cap Core Funds Average: Derived from data provided by Lipper, a Thomson Reuters Company. |
| | | | |
| | | | | Final Value |
| | One | Five | Ten | of a $10,000 |
| | Year | Years | Years | Investment |
| Total Stock Market Index Fund | | | | |
| ETF Shares Net Asset Value | 12.68% | 14.63% | 7.23% | $20,098 |
| Spliced Total Stock Market Index | 12.68 | 14.64 | 7.23 | 20,093 |
| | | | |
| | | | | Final Value |
| | One | Five | Ten | of a $10,000 |
| | Year | Years | Years | Investment |
| Total Stock Market Index Fund Admiral | | | | |
| Shares | 12.66% | 14.62% | 7.23% | $20,094 |
| Spliced Total Stock Market Index | 12.68 | 14.64 | 7.23 | 20,093 |
See Financial Highlights for dividend and capital gains information.
9
Total Stock Market Index Fund
| | | | |
| | Average Annual Total Returns | |
| | Periods Ended December 31, 2016 | |
| |
| | | | | Final Value |
| | One | Five | Ten | of a $5,000,000 |
| | Year | Years | Years | Investment |
| Total Stock Market Index Fund Institutional | | | | |
| Shares | 12.67% | 14.63% | 7.24% | $10,057,417 |
| |
| Spliced Total Stock Market Index | 12.68 | 14.64 | 7.23 | 10,046,266 |
| | | |
| | | Since | Final Value |
| | One | Inception | of a $100,000,000 |
| | Year | (4/28/2015) | Investment |
| Total Stock Market Index Fund Institutional | | | |
| Plus Shares | 12.69% | 5.27% | $108,998,825 |
| CRSP US Total Market Index | 12.68 | 5.25 | 108,966,545 |
| Dow Jones U.S. Total Stock Market Float | | | |
| Adjusted Index | 12.62 | 5.23 | 108,930,952 |
| "Since Inception" performance is calculated from the Institutional Plus Shares’ inception date for both the fund and its comparative standards. |
| | |
| | Since | Final Value |
| | Inception | of a $5,000,000,000 |
| | (6/27/2016) | Investment |
| Total Stock Market Index Fund Institutional | | |
| Select Shares | 14.24% | $5,712,244,860 |
| CRSP US Total Market Index | 14.23 | 5,711,363,041 |
| Dow Jones U.S. Total Stock Market Float | | |
| Adjusted Index | 14.29 | 5,714,565,389 |
| "Since Inception" performance is calculated from the Institutional Select Shares’ inception date for both the fund and its comparative |
| standard. | | |
| | | |
| Cumulative Returns of ETF Shares: December 31, 2006, Through December 31, 2016 | |
| | One | Five | Ten |
| | Year | Years | Years |
| Total Stock Market Index Fund ETF Shares Market | | | |
| Price | 12.74% | 98.01% | 101.03% |
| Total Stock Market Index Fund ETF Shares Net | | | |
| Asset Value | 12.68 | 97.89 | 100.98 |
| Spliced Total Stock Market Index | 12.68 | 98.00 | 100.93 |
10
Total Stock Market Index Fund
Fiscal-Year Total Returns (%): December 31, 2006, Through December 31, 2016

For a benchmark description, see the Glossary.
11
Total Stock Market Index Fund
Financial Statements
Statement of Net Assets—Investments Summary
As of December 31, 2016
This Statement summarizes the fund’s holdings by asset type. Details are reported for each of the fund’s 50 largest individual holdings and for investments that, in total for any issuer, represent more than 1% of the fund’s net assets. The total value of smaller holdings is reported as a single amount within each category.
The fund reports a complete list of its holdings in regulatory filings four times in each fiscal year, at the quarter-ends. For the second and fourth fiscal quarters, the complete listing of the fund’s holdings is available electronically on vanguard.com and on the Securities and Exchange Commission’s website (sec.gov), or you can have it mailed to you without charge by calling 800-662-7447. For the first and third fiscal quarters, the fund files the lists with the SEC on Form N-Q. Shareholders can look up the fund’s Forms N-Q on the SEC’s website. Forms N-Q may also be reviewed and copied at the SEC’s Public Reference Room (see the back cover of this report for further information).
| | | |
| | | Market | Percentage |
| | | Value• | of Net |
| | Shares | ($000) | Assets |
| Common Stocks | | | |
| Basic Materials † | | 12,812,037 | 2.6% |
| |
| Consumer Goods | | | |
| Procter & Gamble Co. | 56,683,460 | 4,765,945 | 0.9% |
| Coca-Cola Co. | 82,265,445 | 3,410,725 | 0.7% |
| PepsiCo Inc. | 30,407,160 | 3,181,501 | 0.6% |
| Philip Morris International Inc. | 32,864,233 | 3,006,749 | 0.6% |
| Altria Group Inc. | 41,374,314 | 2,797,731 | 0.6% |
| Consumer Goods—Other † | | 30,486,358 | 6.1% |
| | | 47,649,009 | 9.5% |
| Consumer Services | | | |
| * Amazon.com Inc. | 8,558,557 | 6,417,805 | 1.3% |
| Comcast Corp. Class A | 50,479,761 | 3,485,628 | 0.7% |
| Home Depot Inc. | 25,791,280 | 3,458,095 | 0.7% |
| Walt Disney Co. | 30,329,375 | 3,160,927 | 0.6% |
| Wal-Mart Stores Inc. | 32,757,385 | 2,264,190 | 0.5% |
| McDonald’s Corp. | 17,591,525 | 2,141,240 | 0.4% |
| CVS Health Corp. | 22,588,149 | 1,782,431 | 0.4% |
| Consumer Services—Other † | | 41,961,112 | 8.4% |
| | | 64,671,428 | 13.0% |
| Financials | | | |
| JPMorgan Chase & Co. | 75,817,317 | 6,542,276 | 1.3% |
| * Berkshire Hathaway Inc. Class B | 39,400,223 | 6,421,448 | 1.3% |
| Wells Fargo & Co. | 95,774,705 | 5,278,144 | 1.1% |
| Bank of America Corp. | 214,199,154 | 4,733,801 | 1.0% |
| Citigroup Inc. | 60,190,801 | 3,577,139 | 0.7% |
| Visa Inc. Class A | 39,581,531 | 3,088,151 | 0.6% |
| Mastercard Inc. Class A | 20,405,276 | 2,106,845 | 0.4% |
| Goldman Sachs Group Inc. | 7,584,395 | 1,816,083 | 0.4% |
| * Berkshire Hathaway Inc. Class A | 978 | 238,750 | 0.0% |
| Financials—Other † | | 68,809,781 | 13.8% |
| | | 102,612,418 | 20.6% |
12
| | | | |
| Total Stock Market Index Fund | | | |
| |
| |
| |
| | | | Market | Percentage |
| | | | Value• | of Net |
| | | Shares | ($000) | Assets |
| Health Care | | | |
| | Johnson & Johnson | 57,656,000 | 6,642,548 | 1.3% |
| | Pfizer Inc. | 128,584,313 | 4,176,419 | 0.8% |
| | Merck & Co. Inc. | 58,449,208 | 3,440,905 | 0.7% |
| | UnitedHealth Group Inc. | 20,169,939 | 3,227,997 | 0.7% |
| | Amgen Inc. | 15,786,623 | 2,308,162 | 0.5% |
| | AbbVie Inc. | 34,453,691 | 2,157,490 | 0.4% |
| | Medtronic plc | 29,348,359 | 2,090,484 | 0.4% |
| | Bristol-Myers Squibb Co. | 35,417,036 | 2,069,772 | 0.4% |
| | Gilead Sciences Inc. | 27,919,852 | 1,999,341 | 0.4% |
| * | Celgene Corp. | 16,423,272 | 1,900,994 | 0.4% |
| | Health Care—Other † | | 30,956,248 | 6.2% |
| | | | 60,970,360 | 12.2% |
| Industrials | | | |
| | General Electric Co. | 187,373,784 | 5,921,012 | 1.2% |
| | 3M Co. | 12,749,834 | 2,276,738 | 0.4% |
| | Boeing Co. | 12,421,412 | 1,933,765 | 0.4% |
| | Honeywell International Inc. | 16,134,074 | 1,869,132 | 0.4% |
| | Union Pacific Corp. | 17,448,454 | 1,809,056 | 0.4% |
| | Industrials—Other † | | 50,437,694 | 10.1% |
| | | | 64,247,397 | 12.9% |
| Oil & Gas | | | |
| | Exxon Mobil Corp. | 87,889,990 | 7,932,951 | 1.6% |
| | Chevron Corp. | 40,008,346 | 4,708,982 | 1.0% |
| | Schlumberger Ltd. | 29,469,666 | 2,473,978 | 0.5% |
| | Oil & Gas—Other † | | 19,660,210 | 3.9% |
| | | | 34,776,121 | 7.0% |
| 1Other | | | |
| * | Leap Wireless International Inc. CVR | 872,848 | 2,200 | 0.0% |
| | Other—Other † | | 6,464 | 0.0% |
| | | | 8,664 | 0.0% |
| Technology | | | |
| | Apple Inc. | 107,359,335 | 12,434,358 | 2.5% |
| | Microsoft Corp. | 156,550,284 | 9,728,035 | 2.0% |
| * | Facebook Inc. Class A | 49,598,883 | 5,706,351 | 1.1% |
| * | Alphabet Inc. Class A | 6,319,126 | 5,007,591 | 1.0% |
| * | Alphabet Inc. Class C | 6,168,588 | 4,761,040 | 1.0% |
| | Intel Corp. | 100,431,928 | 3,642,666 | 0.7% |
| | Cisco Systems Inc. | 106,408,771 | 3,215,673 | 0.7% |
| | International Business Machines Corp. | 18,123,544 | 3,008,327 | 0.6% |
| | Oracle Corp. | 65,315,224 | 2,511,370 | 0.5% |
| | QUALCOMM Inc. | 31,299,189 | 2,040,707 | 0.4% |
| | Technology—Other † | | 28,618,772 | 5.7% |
| | | | 80,674,890 | 16.2% |
| Telecommunications | | | |
| | AT&T Inc. | 130,162,950 | 5,535,830 | 1.1% |
| | Verizon Communications Inc. | 86,383,145 | 4,611,132 | 0.9% |
| | Telecommunications—Other † | | 1,897,349 | 0.4% |
| | | | 12,044,311 | 2.4% |
| |
| Utilities † | | 15,680,773 | 3.1% |
| Total Common Stocks (Cost $341,328,447) | | 496,147,408 | 99.5%2 |
13
| | | | |
| Total Stock Market Index Fund | | | | |
| |
| |
| |
| | | | Market | Percentage |
| | | | Value• | of Net |
| | | Shares | ($000) | Assets |
| Convertible Bonds | | | | |
| Convertible Bonds—Other1 † | | | 424 | 0.0% |
| Total Convertible Bonds (Cost $0) | | | 424 | 0.0% |
| |
| | Coupon | | | |
| Temporary Cash Investments | | | | |
| Money Market Fund | | | | |
| 3,4 Vanguard Market Liquidity Fund | 0.823% | 32,961,150 | 3,296,445 | 0.7% |
| |
| 5,6U.S. Government and Agency Obligations † | | | 101,495 | 0.0% |
| Total Temporary Cash Investments (Cost $3,397,810) | | | 3,397,940 | 0.7%2 |
| 7Total Investments (Cost $344,726,257) | | | 499,545,772 | 100.2% |
| |
| | | | Amount | |
| | | | ($000) | |
| Other Assets and Liabilities | | | | |
| Other Assets | | | | |
| Investment in Vanguard | | | 36,779 | |
| Receivables for Investment Securities Sold | | | 82,440 | |
| Receivables for Accrued Income | | | 646,428 | |
| Receivables for Capital Shares Issued | | | 945,632 | |
| Other Assets | | | 18,556 | |
| Total Other Assets | | | 1,729,835 | 0.4% |
| Liabilities | | | | |
| Payables for Investment Securities Purchased | | | (34,246) | |
| Collateral for Securities on Loan | | | (1,635,086) | |
| Payables for Capital Shares Redeemed | | | (924,771) | |
| Payables to Vanguard | | | (219,349) | |
| Other Liabilities | | | (10,223) | |
| Total Liabilities | | | (2,823,675) | (0.6%) |
| Net Assets | | | 498,451,932 | 100.0% |
| |
| |
| At December 31, 2016, net assets consisted of: | | | | |
| | | | | Amount |
| | | | | ($000) |
| Paid-in Capital | | | | 344,186,084 |
| Overdistributed Net Investment Income | | | | (85,889) |
| Accumulated Net Realized Gains | | | | (447,121) |
| Unrealized Appreciation (Depreciation) | | | | |
| Investment Securities | | | | 154,819,515 |
| Futures Contracts | | | | (20,158) |
| Swap Contracts | | | | (499) |
| Net Assets | | | | 498,451,932 |
14
Total Stock Market Index Fund
| |
| | Amount |
| | ($000) |
| Investor Shares—Net Assets | |
| Applicable to 1,853,895,846 outstanding $.001 par value shares of | |
| beneficial interest (unlimited authorization) | 103,932,248 |
| Net Asset Value Per Share—Investor Shares | $56.06 |
| |
| ETF Shares—Net Assets | |
| Applicable to 606,640,639 outstanding $.001 par value shares of | |
| beneficial interest (unlimited authorization) | 69,888,585 |
| Net Asset Value Per Share—ETF Shares | $115.21 |
| |
| Admiral Shares—Net Assets | |
| Applicable to 2,703,472,409 outstanding $.001 par value shares of | |
| beneficial interest (unlimited authorization) | 151,612,481 |
| Net Asset Value Per Share—Admiral Shares | $56.08 |
| |
| Institutional Shares—Net Assets | |
| Applicable to 1,416,356,578 outstanding $.001 par value shares of | |
| beneficial interest (unlimited authorization) | 79,442,669 |
| Net Asset Value Per Share—Institutional Shares | $56.09 |
| |
| Institutional Plus Shares—Net Assets | |
| Applicable to 808,393,630 outstanding $.001 par value shares of | |
| beneficial interest (unlimited authorization) | 85,030,555 |
| Net Asset Value Per Share—Institutional Plus Shares | $105.18 |
| |
| Institutional Select Shares—Net Assets | |
| Applicable to 77,425,599 outstanding $.001 par value shares of | |
| beneficial interest (unlimited authorization) | 8,545,394 |
| Net Asset Value Per Share—Institutional Select Shares | $110.37 |
• See Note A in Notes to Financial Statements.
* Non-income-producing security.
† Represents the aggregate value, by category, of securities that are not among the 50 largest holdings and, in total for any issuer, represent
1% or less of net assets.
1 “Other” represents securities that are not classified by the fund’s benchmark index.
2 The fund invests a portion of its cash reserves in equity markets through the use of index futures contracts and swap contracts. After giving
effect to futures and swap investments, the fund’s effective common stock and temporary cash investment positions represent 100.0% and
0.2%, respectively, of net assets.
3 Affiliated money market fund available only to Vanguard funds and certain trusts and accounts managed by Vanguard. Rate shown is the
7-day yield.
4 Includes $1,635,086,000 of collateral received for securities on loan.
5 Securities with a value of $92,987,000 have been segregated as initial margin for open futures contracts.
6 Securities with a value of $1,501,000 have been segregated as collateral for open over-the-counter swap contracts.
7 The total value of securities on loan is $1,517,319,000.
CVR—Contingent Value Rights.
See accompanying Notes, which are an integral part of the Financial Statements.
15
Total Stock Market Index Fund
Statement of Operations
| |
| | Year Ended |
| | December 31, 2016 |
| | ($000) |
| Investment Income | |
| Income | |
| Dividends | 9,226,677 |
| Interest1 | 12,010 |
| Securities Lending—Net | 106,116 |
| Total Income | 9,344,803 |
| Expenses | |
| The Vanguard Group—Note B | |
| Investment Advisory Services | 22,563 |
| Management and Administrative—Investor Shares | 123,186 |
| Management and Administrative—ETF Shares | 18,321 |
| Management and Administrative—Admiral Shares | 40,675 |
| Management and Administrative—Institutional Shares | 16,945 |
| Management and Administrative—Institutional Plus Shares | 9,367 |
| Management and Administrative—Institutional Select Shares | 66 |
| Marketing and Distribution—Investor Shares | 18,235 |
| Marketing and Distribution—ETF Shares | 3,749 |
| Marketing and Distribution—Admiral Shares | 9,833 |
| Marketing and Distribution—Institutional Shares | 2,248 |
| Marketing and Distribution—Institutional Plus Shares | 961 |
| Marketing and Distribution—Institutional Select Shares | — |
| Custodian Fees | 3,617 |
| Auditing Fees | 46 |
| Shareholders’ Reports—Investor Shares | 217 |
| Shareholders’ Reports—ETF Shares | 807 |
| Shareholders’ Reports—Admiral Shares | 255 |
| Shareholders’ Reports—Institutional Shares | 48 |
| Shareholders’ Reports—Institutional Plus Shares | 7 |
| Shareholders’ Reports—Institutional Select Shares | — |
| Trustees’ Fees and Expenses | 235 |
| Total Expenses | 271,381 |
| Net Investment Income | 9,073,422 |
| Realized Net Gain (Loss) | |
| Investment Securities Sold1 | 3,736,834 |
| Futures Contracts | 256,746 |
| Swap Contracts | 20,576 |
| Realized Net Gain (Loss) | 4,014,156 |
| Change in Unrealized Appreciation (Depreciation) | |
| Investment Securities | 42,160,393 |
| Futures Contracts | (46,383) |
| Swap Contracts | 132 |
| Change in Unrealized Appreciation (Depreciation) | 42,114,142 |
| Net Increase (Decrease) in Net Assets Resulting from Operations | 55,201,720 |
| 1 Interest income and realized net gain (loss) from an affiliated company of the fund were $11,485,000 and $203,000, respectively. |
| See accompanying Notes, which are an integral part of the Financial Statements. |
16
Total Stock Market Index Fund
Statement of Changes in Net Assets
| | |
| | Year Ended December 31, |
| | 2016 | 2015 |
| | ($000) | ($000) |
| Increase (Decrease) in Net Assets | | |
| Operations | | |
| Net Investment Income | 9,073,422 | 7,704,558 |
| Realized Net Gain (Loss) | 4,014,156 | 12,814,317 |
| Change in Unrealized Appreciation (Depreciation) | 42,114,142 | (18,420,139) |
| Net Increase (Decrease) in Net Assets Resulting from Operations | 55,201,720 | 2,098,736 |
| Distributions | | |
| Net Investment Income | | |
| Investor Shares | (1,930,782) | (2,011,483) |
| ETF Shares | (1,282,510) | (1,092,307) |
| Admiral Shares | (2,820,690) | (2,411,516) |
| Institutional Shares | (1,428,815) | (1,465,290) |
| Institutional Plus Shares | (1,567,690) | (670,898) |
| Institutional Select Shares | (66,263) | — |
| Realized Capital Gain | | |
| Investor Shares | — | — |
| ETF Shares | — | — |
| Admiral Shares | — | — |
| Institutional Shares | — | — |
| Institutional Plus Shares | — | — |
| Institutional Select Shares | — | — |
| Total Distributions | (9,096,750) | (7,651,494) |
| Capital Share Transactions | | |
| Investor Shares | (2,633,123) | (20,386,722) |
| ETF Shares | 6,156,065 | 7,518,595 |
| Admiral Shares | 11,172,716 | 10,860,724 |
| Institutional Shares | 14,683,001 | (40,464,087) |
| Institutional Plus Shares | 13,965,811 | 65,672,415 |
| Institutional Select Shares | 8,351,435 | — |
| Net Increase (Decrease) from Capital Share Transactions | 51,695,905 | 23,200,925 |
| Total Increase (Decrease) | 97,800,875 | 17,648,167 |
| Net Assets | | |
| Beginning of Period | 400,651,057 | 383,002,890 |
| End of Period1 | 498,451,932 | 400,651,057 |
| 1 Net Assets—End of Period includes undistributed (overdistributed) net investment income of ($85,889,000) and ($83,137,000). |
See accompanying Notes, which are an integral part of the Financial Statements.
17
Total Stock Market Index Fund
Financial Highlights
| | | | | |
| Investor Shares | | | | | |
| |
| For a Share Outstanding | Year Ended December 31, |
| Throughout Each Period | 2016 | 2015 | 2014 | 2013 | 2012 |
| Net Asset Value, Beginning of Period | $50.78 | $51.58 | $46.67 | $35.64 | $31.29 |
| Investment Operations | | | | | |
| Net Investment Income | 1.022 | .954 | .854 | .757 | .720 |
| Net Realized and Unrealized Gain (Loss) | | | | | |
| on Investments | 5.282 | (.807) | 4.907 | 11.038 | 4.350 |
| Total from Investment Operations | 6.304 | .147 | 5.761 | 11.795 | 5.070 |
| Distributions | | | | | |
| Dividends from Net Investment Income | (1.024) | (. 947) | (. 851) | (.765) | (.720) |
| Distributions from Realized Capital Gains | — | — | — | — | — |
| Total Distributions | (1.024) | (. 947) | (. 851) | (.765) | (.720) |
| Net Asset Value, End of Period | $56.06 | $50.78 | $51.58 | $46.67 | $35.64 |
| |
| Total Return1 | 12.53% | 0.29% | 12.43% | 33.35% | 16.25% |
| |
| Ratios/Supplemental Data | | | | | |
| Net Assets, End of Period (Millions) | $103,932 | $96,323 | $117,966 | $105,008 | $78,936 |
| Ratio of Total Expenses to Average Net Assets | 0.15% | 0.16% | 0.17% | 0.17% | 0.17% |
| Ratio of Net Investment Income to | | | | | |
| Average Net Assets | 1.98% | 1.85% | 1.77% | 1.84% | 2.11% |
| Portfolio Turnover Rate2 | 4% | 3% | 3% | 4% | 3% |
1 Total returns do not include account service fees that may have applied in the periods shown. Fund prospectuses provide information about
any applicable account service fees.
2 Excludes the value of portfolio securities received or delivered as a result of in-kind purchases or redemptions of the fund’s capital shares,
including ETF Creation Units.
See accompanying Notes, which are an integral part of the Financial Statements.
18
Total Stock Market Index Fund
Financial Highlights
| | | | | |
| ETF Shares | | | | | |
| |
| For a Share Outstanding | Year Ended December 31, |
| Throughout Each Period | 2016 | 2015 | 2014 | 2013 | 2012 |
| Net Asset Value, Beginning of Period | $104.34 | $106.00 | $95.91 | $73.24 | $64.29 |
| Investment Operations | | | | | |
| Net Investment Income | 2.214 | 2.082 | 1.874 | 1.657 | 1.564 |
| Net Realized and Unrealized Gain (Loss) | | | | | |
| on Investments | 10.871 | (1.675) | 10.085 | 22.686 | 8.949 |
| Total from Investment Operations | 13.085 | .407 | 11.959 | 24.343 | 10.513 |
| Distributions | | | | | |
| Dividends from Net Investment Income | (2.215) | (2.067) | (1.869) | (1.673) | (1.563) |
| Distributions from Realized Capital Gains | — | — | — | — | — |
| Total Distributions | (2.215) | (2.067) | (1.869) | (1.673) | (1.563) |
| Net Asset Value, End of Period | $115.21 | $104.34 | $106.00 | $95.91 | $73.24 |
| |
| Total Return | 12.68% | 0.40% | 12.56% | 33.51% | 16.41% |
| |
| Ratios/Supplemental Data | | | | | |
| Net Assets, End of Period (Millions) | $69,889 | $57,434 | $50,886 | $39,165 | $24,270 |
| Ratio of Total Expenses to Average Net Assets | 0.04% | 0.05% | 0.05% | 0.05% | 0.05% |
| Ratio of Net Investment Income to | | | | | |
| Average Net Assets | 2.09% | 1.96% | 1.89% | 1.96% | 2.23% |
| Portfolio Turnover Rate1 | 4% | 3% | 3% | 4% | 3% |
1 Excludes the value of portfolio securities received or delivered as a result of in-kind purchases or redemptions of the fund’s capital shares,
including ETF Creation Units.
See accompanying Notes, which are an integral part of the Financial Statements.
19
Total Stock Market Index Fund
Financial Highlights
| | | | | |
| Admiral Shares | | | | | |
| |
| For a Share Outstanding | Year Ended December 31, |
| Throughout Each Period | 2016 | 2015 | 2014 | 2013 | 2012 |
| Net Asset Value, Beginning of Period | $50.79 | $51.60 | $46.69 | $35.65 | $31.30 |
| Investment Operations | | | | | |
| Net Investment Income | 1.077 | 1.013 | .912 | .807 | .761 |
| Net Realized and Unrealized Gain (Loss) | | | | | |
| on Investments | 5.291 | (.818) | 4.908 | 11.047 | 4.350 |
| Total from Investment Operations | 6.368 | .195 | 5.820 | 11.854 | 5.111 |
| Distributions | | | | | |
| Dividends from Net Investment Income | (1.078) | (1.005) | (.910) | (.814) | (.761) |
| Distributions from Realized Capital Gains | — | — | — | — | — |
| Total Distributions | (1.078) | (1.005) | (.910) | (.814) | (.761) |
| Net Asset Value, End of Period | $56.08 | $50.79 | $51.60 | $46.69 | $35.65 |
| |
| Total Return1 | 12.66% | 0.39% | 12.56% | 33.52% | 16.38% |
| |
| Ratios/Supplemental Data | | | | | |
| Net Assets, End of Period (Millions) | $151,612 | $126,363 | $117,476 | $86,541 | $59,771 |
| Ratio of Total Expenses to Average Net Assets | 0.04% | 0.05% | 0.05% | 0.05% | 0.05% |
| Ratio of Net Investment Income to | | | | | |
| Average Net Assets | 2.09% | 1.96% | 1.89% | 1.96% | 2.23% |
| Portfolio Turnover Rate2 | 4% | 3% | 3% | 4% | 3% |
1 Total returns do not include account service fees that may have applied in the periods shown. Fund prospectuses provide information about
any applicable account service fees.
2 Excludes the value of portfolio securities received or delivered as a result of in-kind purchases or redemptions of the fund’s capital shares,
including ETF Creation Units.
See accompanying Notes, which are an integral part of the Financial Statements.
20
Total Stock Market Index Fund
Financial Highlights
| | | | | |
| Institutional Shares | | | | | |
| |
| For a Share Outstanding | Year Ended December 31, |
| Throughout Each Period | 2016 | 2015 | 2014 | 2013 | 2012 |
| Net Asset Value, Beginning of Period | $50.80 | $51.60 | $46.69 | $35.66 | $31.30 |
| Investment Operations | | | | | |
| Net Investment Income | 1.082 | 1.017 | .915 | .808 | .763 |
| Net Realized and Unrealized Gain (Loss) | | | | | |
| on Investments | 5.291 | (.808) | 4.908 | 11.038 | 4.359 |
| Total from Investment Operations | 6.373 | .209 | 5.823 | 11.846 | 5.122 |
| Distributions | | | | | |
| Dividends from Net Investment Income | (1.083) | (1.009) | (.913) | (.816) | (.762) |
| Distributions from Realized Capital Gains | — | — | — | — | — |
| Total Distributions | (1.083) | (1.009) | (.913) | (.816) | (.762) |
| Net Asset Value, End of Period | $56.09 | $50.80 | $51.60 | $46.69 | $35.66 |
| |
| Total Return | 12.67% | 0.42% | 12.56% | 33.49% | 16.42% |
| |
| Ratios/Supplemental Data | | | | | |
| Net Assets, End of Period (Millions) | $79,443 | $57,438 | $96,674 | $65,738 | $39,367 |
| Ratio of Total Expenses to Average Net Assets | 0.03% | 0.04% | 0.04% | 0.04% | 0.04% |
| Ratio of Net Investment Income to | | | | | |
| Average Net Assets | 2.10% | 1.97% | 1.90% | 1.97% | 2.24% |
| Portfolio Turnover Rate1 | 4% | 3% | 3% | 4% | 3% |
| 1 Excludes the value of portfolio securities received or delivered as a result of in-kind purchases or redemptions of the fund’s capital shares, |
| including ETF Creation Units. |
See accompanying Notes, which are an integral part of the Financial Statements.
21
Total Stock Market Index Fund
Financial Highlights
| | |
| Institutional Plus Shares | | |
| | Year | April 28, |
| | Ended | 20151 to |
| | Dec. 31, | Dec. 31, |
| For a Share Outstanding Throughout Each Period | 2016 | 2015 |
| Net Asset Value, Beginning of Period | $95.26 | $100.00 |
| Investment Operations | | |
| Net Investment Income | 2.042 | 1.335 |
| Net Realized and Unrealized Gain (Loss) on Investments | 9.924 | (4.631) |
| Total from Investment Operations | 11.966 | (3.296) |
| Distributions | | |
| Dividends from Net Investment Income | (2.046) | (1.444) |
| Distributions from Realized Capital Gains | — | — |
| Total Distributions | (2.046) | (1.444) |
| Net Asset Value, End of Period | $105.18 | $95.26 |
| |
| Total Return | 12.69% | -3.28% |
| |
| Ratios/Supplemental Data | | |
| Net Assets, End of Period (Millions) | $85,031 | $63,093 |
| Ratio of Total Expenses to Average Net Assets | 0.02% | 0.02%2 |
| Ratio of Net Investment Income to Average Net Assets | 2.11% | 1.99%2 |
| Portfolio Turnover Rate 3 | 4% | 3%4 |
1 Inception.
2 Annualized.
3 Excludes the value of portfolio securities received or delivered as a result of in-kind purchases or redemptions of the fund’s capital shares,
including ETF Creation Units.
4 Reflects the fund’s portfolio turnover for the fiscal year ended December 31, 2015.
See accompanying Notes, which are an integral part of the Financial Statements.
22
Total Stock Market Index Fund
Financial Highlights
| |
| Institutional Select Shares | |
| | June 27, 20161 to |
| For a Share Outstanding Throughout the Period | December 31, 2016 |
| Net Asset Value, Beginning of Period | $97.70 |
| Investment Operations | |
| Net Investment Income | 1.181 |
| Net Realized and Unrealized Gain (Loss) on Investments | 12.718 |
| Total from Investment Operations | 13.899 |
| Distributions | |
| Dividends from Net Investment Income | (1.229) |
| Distributions from Realized Capital Gains | — |
| Total Distributions | (1.229) |
| Net Asset Value, End of Period | $110.37 |
| |
| Total Return | 14.24% |
| |
| Ratios/Supplemental Data | |
| Net Assets, End of Period (Millions) | $8,545 |
| Ratio of Total Expenses to Average Net Assets | 0.01%2 |
| Ratio of Net Investment Income to Average Net Assets | 2.15%2 |
| Portfolio Turnover Rate 3 | 4%4 |
1 Inception.
2 Annualized.
3 Excludes the value of portfolio securities received or delivered as a result of in-kind purchases or redemptions of the fund’s capital shares,
including ETF Creation Units.
4 Reflects the fund’s portfolio turnover for the fiscal year ended December 31, 2016.
See accompanying Notes, which are an integral part of the Financial Statements.
23
Total Stock Market Index Fund
Notes to Financial Statements
Vanguard Total Stock Market Index Fund is registered under the Investment Company Act of 1940 as an open-end investment company, or mutual fund. The fund offers six classes of shares: Investor Shares, ETF Shares, Admiral Shares, Institutional Shares, Institutional Plus Shares, and Institutional Select Shares. Investor Shares are available to any investor who meets the fund’s minimum purchase requirements. ETF Shares are listed for trading on NYSE Arca; they can be purchased and sold through a broker. Admiral Shares, Institutional Shares, Institutional Plus Shares, and Institutional Select Shares are designed for investors who meet certain administrative, service, and account-size criteria. Institutional Select Shares were issued on June 27, 2016.
A. The following significant accounting policies conform to generally accepted accounting principles for U.S. investment companies. The fund consistently follows such policies in preparing its financial statements.
1. Security Valuation: Securities are valued as of the close of trading on the New York Stock Exchange (generally 4 p.m., Eastern time) on the valuation date. Equity securities are valued at the latest quoted sales prices or official closing prices taken from the primary market in which each security trades; such securities not traded on the valuation date are valued at the mean of the latest quoted bid and asked prices. Bonds and temporary cash investments are valued using the latest bid prices or using valuations based on a matrix system (which considers such factors as security prices, yields, maturities, and ratings), both as furnished by independent pricing services. Investments in Vanguard Market Liquidity Fund are valued at that fund’s net asset value. Securities for which market quotations are not readily available, or whose values have been materially affected by events occurring before the fund’s pricing time but after the close of the securities’ primary markets, are valued by methods deemed by the board of trustees to represent fair value.
2. Futures Contracts: The fund uses index futures contracts to a limited extent, with the objectives of maintaining full exposure to the stock market, enhancing returns, maintaining liquidity, and minimizing transaction costs. The fund may purchase futures contracts to immediately invest incoming cash in the market, or sell futures in response to cash outflows, thereby simulating a fully invested position in the underlying index while maintaining a cash balance for liquidity. The fund may seek to enhance returns by using futures contracts instead of the underlying securities when futures are believed to be priced more attractively than the underlying securities. The primary risks associated with the use of futures contracts are imperfect correlation between changes in market values of stocks held by the fund and the prices of futures contracts, and the possibility of an illiquid market. Counterparty risk involving futures is mitigated because a regulated clearinghouse is the counterparty instead of the clearing broker. To further mitigate counterparty risk, the fund trades futures contracts on an exchange, monitors the financial strength of its clearing brokers and clearinghouse, and has entered into clearing agreements with its clearing brokers. The clearinghouse imposes initial margin requirements to secure the fund’s performance and requires daily settlement of variation margin representing changes in the market value of each contract.
Futures contracts are valued at their quoted daily settlement prices. The aggregate settlement values of the contracts are not recorded in the Statement of Net Assets. Fluctuations in the value of the contracts are recorded in the Statement of Net Assets as an asset (liability) and in the Statement of Operations as unrealized appreciation (depreciation) until the contracts are closed, when they are recorded as realized futures gains (losses).
24
Total Stock Market Index Fund
During the year ended December 31, 2016, the fund’s average investments in long and short futures contracts represented less than 1% and 0% of net assets, respectively, based on the average of aggregate settlement values at each quarter-end during the period.
3. Swap Contracts: The fund has entered into equity swap contracts to earn the total return on selected reference stocks in the fund’s target index. Under the terms of the swaps, the fund receives the total return on the referenced stock (i.e., receiving the increase or paying the decrease in value of the selected reference stock and receiving the equivalent of any dividends in respect of the selected referenced stock) over a specified period of time, applied to a notional amount that represents the value of a designated number of shares of the selected reference stock at the beginning of the equity swap contract. The fund also pays a floating rate that is based on short-term interest rates, applied to the notional amount. At the same time, the fund invests an amount approximating the notional amount of the swap in high-quality temporary cash investments.
The notional amounts of swap contracts are not recorded in the Statement of Net Assets. Swaps are valued daily based on market quotations received from independent pricing services or recognized dealers and the change in value is recorded in the Statement of Net Assets as an asset (liability) and in the Statement of Operations as unrealized appreciation (depreciation) until termination of the swap, at which time realized gain (loss) is recorded. A risk associated with all types of swaps is the possibility that a counterparty may default on its obligation to pay net amounts due to the fund. The fund’s maximum amount subject to counterparty risk is the unrealized appreciation on the swap contract. The fund mitigates its counterparty risk by entering into swaps only with a diverse group of prequalified counterparties, monitoring their financial strength, entering into master netting arrangements with its counterparties, and requiring its counterparties to transfer collateral as security for their performance. In the absence of a default, the collateral pledged or received by the fund cannot be repledged, resold or rehypothecated. In the event of a counterparty’s default (including bankruptcy), the fund may terminate any swap contracts with that counterparty, determine the net amount owed by either party in accordance with its master netting arrangements, and sell or retain any collateral held up to the net amount owed to the fund under the master netting arrangements. The swap contracts contain provisions whereby a counterparty may terminate open contracts if the fund net assets decline below a certain level, triggering a payment by the fund if the fund is in a net liability position at the time of the termination. The payment amount would be reduced by any collateral the fund has pledged. Any securities pledged as collateral for open contracts are noted in the Statement of Net Assets. The value of collateral received or pledged is compared daily to the value of the swap contracts exposure with each counterparty, and any difference, if in excess of a specified minimum transfer amount, is adjusted and settled within two business days.
During the year ended December 31, 2016, the fund’s average amounts of investments in total return swaps represented less than 1% of net assets, based on the average of notional amounts at each quarter-end during the period.
4. Federal Income Taxes: The fund intends to continue to qualify as a regulated investment company and distribute all of its taxable income. Management has analyzed the fund’s tax positions taken for all open federal income tax years (December 31, 2013–2016), and has concluded that no provision for federal income tax is required in the fund’s financial statements.
25
Total Stock Market Index Fund
5. Distributions: Distributions to shareholders are recorded on the ex-dividend date.
6. Securities Lending: To earn additional income, the fund lends its securities to qualified institutional borrowers. Security loans are subject to termination by the fund at any time, and are required to be secured at all times by collateral in an amount at least equal to the market value of securities loaned. Daily market fluctuations could cause the value of loaned securities to be more or less than the value of the collateral received. When this occurs, the collateral is adjusted and settled on the next business day. The fund further mitigates its counterparty risk by entering into securities lending transactions only with a diverse group of prequalified counterparties, monitoring their financial strength, and entering into master securities lending agreements with its counterparties. The master securities lending agreements provide that, in the event of a counterparty’s default (including bankruptcy), the fund may terminate any loans with that borrower, determine the net amount owed, and sell or retain the collateral up to the net amount owed to the fund; however, such actions may be subject to legal proceedings. While collateral mitigates counterparty risk, in the absence of a default the fund may experience delays and costs in recovering the securities loaned. The fund invests cash collateral received in Vanguard Market Liquidity Fund, and records a liability in the Statement of Net Assets for the return of the collateral, during the period the securities are on loan. Securities lending income represents fees charged to borrowers plus income earned on invested cash collateral, less expenses associated with the loan. During the term of the loan, the fund is entitled to all distributions made on or in respect of the loaned securities.
7. Credit Facility: The fund and certain other funds managed by The Vanguard Group (“Vanguard”) participate in a $3.1 billion committed credit facility provided by a syndicate of lenders pursuant to a credit agreement that may be renewed annually; each fund is individually liable for its borrowings, if any, under the credit facility. Borrowings may be utilized for temporary and emergency purposes, and are subject to the fund’s regulatory and contractual borrowing restrictions. The participating funds are charged administrative fees and an annual commitment fee of 0.10% of the undrawn amount of the facility; these fees are allocated to the funds based on a method approved by the fund’s board of trustees and included in Management and Administrative expenses on the fund’s Statement of Operations. Any borrowings under this facility bear interest at a rate based upon the higher of the one-month London Interbank Offered Rate, federal funds effective rate, or overnight bank funding rate plus an agreed-upon spread.
The fund had no borrowings outstanding at December 31, 2016. The fund made one borrowing in the amount of $1,000,000 to test the operational readiness of the credit facility process. The borrowing was outstanding for one business day at an annualized interest rate of 1.34%, and the related interest expense is recorded in the Statement of Operations.
8. Other: Dividend income is recorded on the ex-dividend date. Interest income includes income distributions received from Vanguard Market Liquidity Fund and is accrued daily. Premiums and discounts on debt securities purchased are amortized and accreted, respectively, to interest income over the lives of the respective securities. Security transactions are accounted for on the date securities are bought or sold. Costs used to determine realized gains (losses) on the sale of investment securities are those of the specific securities sold.
26
Total Stock Market Index Fund
Each class of shares has equal rights as to assets and earnings, except that each class separately bears certain class-specific expenses related to maintenance of shareholder accounts (included in Management and Administrative expenses) and shareholder reporting. Marketing and distribution expenses are allocated to each class of shares based on a method approved by the board of trustees. Income, other non-class-specific expenses, and gains and losses on investments are allocated to each class of shares based on its relative net assets.
B. In accordance with the terms of a Funds’ Service Agreement (the “FSA”) between Vanguard and the fund, Vanguard furnishes to the fund investment advisory, corporate management, administrative, marketing, and distribution services at Vanguard’s cost of operations (as defined by the FSA). These costs of operations are allocated to the fund based on methods and guidelines approved by the board of trustees. Vanguard does not require reimbursement in the current period for certain costs of operations (such as deferred compensation/benefits and risk/insurance costs); the fund’s liability for these costs of operations is included in Payables to Vanguard on the Statement of Net Assets.
Upon the request of Vanguard, the fund may invest up to 0.40% of its net assets as capital in Vanguard. At December 31, 2016, the fund had contributed to Vanguard capital in the amount of $36,779,000, representing 0.01% of the fund’s net assets and 14.71% of Vanguard’s capitalization. The fund’s trustees and officers are also directors and employees, respectively, of Vanguard.
C. Various inputs may be used to determine the value of the fund’s investments. These inputs are summarized in three broad levels for financial statement purposes. The inputs or methodologies used to value securities are not necessarily an indication of the risk associated with investing in those securities.
Level 1—Quoted prices in active markets for identical securities.
Level 2—Other significant observable inputs (including quoted prices for similar securities, interest rates, prepayment speeds, credit risk, etc.).
Level 3—Significant unobservable inputs (including the fund’s own assumptions used to determine the fair value of investments).
The following table summarizes the market value of the fund’s investments as of December 31, 2016, based on the inputs used to value them:
| | | |
| | Level 1 | Level 2 | Level 3 |
| Investments | ($000) | ($000) | ($000) |
| Common Stocks | 496,134,014 | 59 | 13,335 |
| Convertible Bonds | — | 424 | — |
| Temporary Cash Investments | 3,296,445 | 101,495 | — |
| Futures Contracts—Liabilities1 | (8,626) | — | — |
| Swap Contracts—Assets | — | 761 | — |
| Swap Contracts—Liabilities | — | (1,260) | — |
| Total | 499,421,833 | 101,479 | 13,335 |
| 1 Represents variation margin on the last day of the reporting period. |
27
Total Stock Market Index Fund
D. At December 31, 2016, the aggregate settlement value of open futures contracts and the related unrealized appreciation (depreciation) were:
| | | | |
| | | | ($000) |
| | | | Aggregate | |
| | | Number of | Settlement | Unrealized |
| | | Long (Short) | Value | Appreciation |
| Futures Contracts | Expiration | Contracts | Long (Short) | (Depreciation) |
| E-mini S&P 500 Index | March 2017 | 18,689 | 2,089,617 | (16,572) |
| E-mini Russell 2000 Index | March 2017 | 1,914 | 129,855 | (2,825) |
| E-mini S&P Mid-Cap 400 Index | March 2017 | 240 | 39,818 | (761) |
| | | | | (20,158) |
Unrealized appreciation (depreciation) on open futures contracts is required to be treated as realized gain (loss) for tax purposes.
At December 31, 2016, the fund had the following open total return swap contracts:
| | | | | |
| | | | | Floating | Unrealized |
| | | | Notional | Interest Rate | Appreciation |
| | Termination | | Amount | Received | (Depreciation) |
| Reference Entity | Date | Counterparty | ($000) | (Paid) | ($000) |
| Ambac Financial Group Inc. | 1/6/17 | GSCM | 10,501 | (1.054%) | (1,260) |
| SLM Corp. | 2/21/17 | GSI | 36,200 | (1.149%) | 761 |
| | | | | | (499) |
| GSCM—Goldman Sachs Capital Management. |
| GSI—Goldman Sachs International. |
At December 31, 2016, the counterparty had deposited in segregated accounts securities with a value of $615,000 in connection with amounts due to the fund for open swap contracts.
E. Distributions are determined on a tax basis and may differ from net investment income and realized capital gains for financial reporting purposes. Differences may be permanent or temporary. Permanent differences are reclassified among capital accounts in the financial statements to reflect their tax character. Temporary differences arise when certain items of income, expense, gain, or loss are recognized in different periods for financial statement and tax purposes. These differences will reverse at some time in the future. Differences in classification may also result from the treatment of short-term gains as ordinary income for tax purposes.
During the year ended December 31, 2016, the fund realized $3,628,320,000 of net capital gains resulting from in-kind redemptions—in which shareholders exchanged fund shares for securities held by the fund rather than for cash. Because such gains are not taxable to the fund, and are not distributed to shareholders, they have been reclassified from accumulated net realized losses to paid-in capital.
Realized and unrealized gains (losses) on certain of the fund’s swap contracts are treated as ordinary income (loss) for tax purposes. Realized gains of $20,576,000 on swap contracts have been reclassified from accumulated net realized losses to overdistributed net investment income.
28
Total Stock Market Index Fund
For tax purposes, at December 31, 2016, the fund had $127,295,000 of ordinary income available for distribution. The fund used capital loss carryforwards of $318,876,000 to offset taxable capital gains realized during the year ended December 31, 2016. Capital loss carryforwards of $488,298,000 expired on December 31, 2016; accordingly, such losses have been reclassified from accumulated net realized losses to paid-in capital. The fund realized losses of $463,562,000 during the period from November 1, 2016, through December 31, 2016, which are deferred and will be treated as realized for tax purposes in fiscal 2017. The fund will use these capital losses to offset net taxable capital gains, if any, realized during the year ending December 31, 2017.
At December 31, 2016, the cost of investment securities for tax purposes was $344,735,592,000. Net unrealized appreciation of investment securities for tax purposes was $154,810,180,000, consisting of unrealized gains of $166,042,941,000 on securities that had risen in value since their purchase and $11,232,761,000 in unrealized losses on securities that had fallen in value since their purchase.
F. During the year ended December 31, 2016, the fund purchased $76,882,731,000 of investment securities and sold $24,431,366,000 of investment securities, other than temporary cash investments. Purchases and sales include $20,773,929,000 and $6,379,309,000, respectively, in connection with in-kind purchases and redemptions of the fund’s capital shares.
G. Capital share transactions for each class of shares were:
| | | | |
| | Year Ended December 31, |
| | 2016 | 2015 |
| | Amount | Shares | Amount | Shares |
| | ($000) | (000) | ($000) | (000) |
| Investor Shares | | | | |
| Issued | 11,360,219 | 224,105 | 9,615,095 | 187,612 |
| Issued in Lieu of Cash Distributions | 1,919,404 | 36,018 | 2,000,863 | 39,195 |
| Redeemed | (15,912,746) | (303,219) | (32,002,680) | (616,831) |
| Net Increase (Decrease)—Investor Shares | (2,633,123) | (43,096) | (20,386,722) | (390,024) |
| ETF Shares | | | | |
| Issued | 12,651,306 | 117,794 | 25,815,534 | 241,287 |
| Issued in Lieu of Cash Distributions | — | — | — | — |
| Redeemed | (6,495,241) | (61,600) | (18,296,939) | (170,900) |
| Net Increase (Decrease)—ETF Shares | 6,156,065 | 56,194 | 7,518,595 | 70,387 |
| Admiral Shares | | | | |
| Issued | 23,021,975 | 443,481 | 22,278,360 | 430,686 |
| Issued in Lieu of Cash Distributions | 2,437,517 | 45,667 | 2,101,249 | 41,298 |
| Redeemed | (14,286,776) | (273,567) | (13,518,885) | (260,874) |
| Net Increase (Decrease)—Admiral Shares | 11,172,716 | 215,581 | 10,860,724 | 211,110 |
| Institutional Shares | | | | |
| Issued | 23,023,849 | 445,440 | 34,182,938 | 666,236 |
| Issued in Lieu of Cash Distributions | 1,314,828 | 24,590 | 1,369,736 | 26,567 |
| Redeemed | (9,655,676) | (184,350) | (76,016,761) | (1,435,499) |
| Net Increase (Decrease)—Institutional Shares | 14,683,001 | 285,680 | (40,464,087) | (742,696) |
29
Total Stock Market Index Fund
| | | | |
| | Year Ended December 31, |
| | 2016 | 2015 |
| | Amount | Shares | Amount | Shares |
| | ($000) | (000) | ($000) | (000) |
| Institutional Plus Shares1 | | | | |
| Issued | 17,424,884 | 181,141 | 70,375,821 | 710,136 |
| Issued in Lieu of Cash Distributions | 1,561,503 | 15,576 | 668,273 | 7,223 |
| Redeemed | (5,020,576) | (50,622) | (5,371,679) | (55,060) |
| Net Increase (Decrease)—Institutional Plus Shares | 13,965,811 | 146,095 | 65,672,415 | 662,299 |
| Institutional Select Shares2 | | | | |
| Issued | 8,412,782 | 78,011 | — | — |
| Issued in Lieu of Cash Distributions | 66,262 | 600 | — | — |
| Redeemed | (127,609) | (1,185) | — | — |
| Net Increase (Decrease)—Institutional Select Shares | 8,351,435 | 77,426 | — | — |
1 Inception was April 28, 2015, for Institutional Plus Shares.
2 Inception was June 27, 2016, for Institutional Select Shares.
H. Management has determined that no material events or transactions occurred subsequent to December 31, 2016, that would require recognition or disclosure in these financial statements.
30
Report of Independent Registered
Public Accounting Firm
To the Board of Trustees of Vanguard Index Funds and the Shareholders of Vanguard Total Stock Market Index Fund:
In our opinion, the accompanying statement of net assets–investments summary and the related statements of operations and of changes in net assets and the financial highlights present fairly, in all material respects, the financial position of Vanguard Total Stock Market Index Fund (constituting a separate portfolio of Vanguard Index Funds, hereafter referred to as the “Fund”) at December 31, 2016, the results of its operations for the year then ended, the changes in its net assets for each of the two years in the period then ended, and the financial highlights for each of the periods indicated, in conformity with accounting principles generally accepted in the United States of America. These financial statements and financial highlights (hereafter referred to as “financial statements”) are the responsibility of the Fund’s management. Our responsibility is to express an opinion on these financial statements based on our audits. We conducted our audits of these financial statements in accordance with the standards of the Public Company Accounting Oversight Board (United States). Those standards require that we plan and perform the audit to obtain reasonable assurance about whether the financial statements are free of material misstatement. An audit includes examining, on a test basis, evidence supporting the amounts and disclosures in the financial statements, assessing the accounting principles used and significant estimates made by management, and evaluating the overall financial statement presentation. We believe that our audits, which included confirmation of securities at December 31, 2016 by correspondence with the custodian and brokers and by agreement to the underlying ownership records of the transfer agent, provide a reasonable basis for our opinion.
/s/PricewaterhouseCoopers LLP
Philadelphia, Pennsylvania
February 13, 2017

Special 2016 tax information (unaudited) for Vanguard Total Stock Market Index Fund
This information for the fiscal year ended December 31, 2016, is included pursuant to provisions
of the Internal Revenue Code.
The fund distributed $8,437,234,000 of qualified dividend income to shareholders during the
fiscal year.
For corporate shareholders, 87.7% of investment income (dividend income plus short-term gains,
if any) qualifies for the dividends-received deduction.
31
Your Fund’s After-Tax Returns
This table presents returns for your fund both before and after taxes. The after-tax returns are shown in two ways: (1) assuming that an investor owned the fund during the entire period and paid taxes on the fund’s distributions, and (2) assuming that an investor paid taxes on the fund’s distributions and sold all shares at the end of each period.
Calculations are based on the highest individual federal income tax and capital gains tax rates in effect at the times of the distributions and the hypothetical sales. State and local taxes were not considered. After-tax returns reflect any qualified dividend income. (In the example, returns after the sale of fund shares may be higher than those assuming no sale. This occurs when the sale would have produced a capital loss. The calculation assumes that the investor received a tax deduction for the loss.)
The table shows returns for Investor Shares only; returns for other share classes will differ. Please note that your actual after-tax returns will depend on your tax situation and may differ from those shown. Also note that if you own the fund in a tax-deferred account, such as an individual retirement account or a 401(k) plan, this information does not apply to you. Such accounts are not subject to current taxes.
Finally, keep in mind that a fund’s performance—whether before or after taxes—does not guarantee future results.
| | | |
| Average Annual Total Returns: Total Stock Market Index Fund Investor Shares | | |
| Periods Ended December 31, 2016 | | | |
| |
| | One | Five | Ten |
| | Year | Years | Years |
| Returns Before Taxes | 12.53% | 14.49% | 7.11% |
| Returns After Taxes on Distributions | 11.99 | 14.01 | 6.73 |
| Returns After Taxes on Distributions and Sale of Fund Shares | 7.45 | 11.61 | 5.72 |
32
About Your Fund’s Expenses
As a shareholder of the fund, you incur ongoing costs, which include costs for portfolio management, administrative services, and shareholder reports (like this one), among others. Operating expenses, which are deducted from a fund’s gross income, directly reduce the investment return of the fund.
A fund’s expenses are expressed as a percentage of its average net assets. This figure is known as the expense ratio. The following examples are intended to help you understand the ongoing costs (in dollars) of investing in your fund and to compare these costs with those of other mutual funds. The examples are based on an investment of $1,000 made at the beginning of the period shown and held for the entire period.
The accompanying table illustrates your fund’s costs in two ways:
• Based on actual fund return. This section helps you to estimate the actual expenses that you paid over the period. The ”Ending Account Value“ shown is derived from the fund‘s actual return, and the third column shows the dollar amount that would have been paid by an investor who started with $1,000 in the fund. You may use the information here, together with the amount you invested, to estimate the expenses that you paid over the period.
To do so, simply divide your account value by $1,000 (for example, an $8,600 account value divided by $1,000 = 8.6), then multiply the result by the number given for your fund under the heading ”Expenses Paid During Period.“
• Based on hypothetical 5% yearly return. This section is intended to help you compare your fund‘s costs with those of other mutual funds. It assumes that the fund had a yearly return of 5% before expenses, but that the expense ratio is unchanged. In this case—because the return used is not the fund’s actual return—the results do not apply to your investment. The example is useful in making comparisons because the Securities and Exchange Commission requires all mutual funds to calculate expenses based on a 5% return. You can assess your fund’s costs by comparing this hypothetical example with the hypothetical examples that appear in shareholder reports of other funds.
Note that the expenses shown in the table are meant to highlight and help you compare ongoing costs only and do not reflect transaction costs incurred by the fund for buying and selling securities. Further, the expenses do not include any purchase, redemption, or account service fees described in the fund prospectus. If such fees were applied to your account, your costs would be higher. Your fund does not carry a “sales load.”
The calculations assume no shares were bought or sold during the period. Your actual costs may have been higher or lower, depending on the amount of your investment and the timing of any purchases or redemptions.
You can find more information about the fund’s expenses, including annual expense ratios, in the Financial Statements section of this report. For additional information on operating expenses and other shareholder costs, please refer to your fund’s current prospectus.
33
| | | |
| Six Months Ended December 31, 2016 | | | |
| | Beginning | Ending | Expenses |
| | Account Value | Account Value | Paid During |
| Total Stock Market Index Fund | 6/30/2016 | 12/31/2016 | Period |
| Based on Actual Fund Return | | | |
| Investor Shares | $1,000.00 | $1,086.38 | $0.79 |
| ETF Shares | 1,000.00 | 1,087.16 | 0.21 |
| Admiral Shares | 1,000.00 | 1,086.93 | 0.21 |
| Institutional Shares | 1,000.00 | 1,087.16 | 0.16 |
| Institutional Plus Shares | 1,000.00 | 1,087.11 | 0.10 |
| Institutional Select Shares | 1,000.00 | 1,087.15 | 0.05 |
| Based on Hypothetical 5% Yearly Return | | | |
| Investor Shares | $1,000.00 | $1,024.38 | $0.76 |
| ETF Shares | 1,000.00 | 1,024.94 | 0.20 |
| Admiral Shares | 1,000.00 | 1,024.94 | 0.20 |
| Institutional Shares | 1,000.00 | 1,024.99 | 0.15 |
| Institutional Plus Shares | 1,000.00 | 1,025.04 | 0.10 |
| Institutional Select Shares | 1,000.00 | 1,025.09 | 0.05 |
The calculations are based on expenses incurred in the most recent six-month period. The fund’s annualized six-month expense ratios for that
period are 0.15% for Investor Shares, 0.04% for ETF Shares, 0.04% for Admiral Shares, 0.03% for Institutional Shares, 0.02% for Institutional
Plus Shares, and 0.01% for Institutional Select Shares. The dollar amounts shown as “Expenses Paid” are equal to the annualized expense
ratio multiplied by the average account value over the period, multiplied by the number of days in the most recent six-month period, then
divided by the number of days in the most recent 12-month period (184/366).
34
Glossary
30-Day SEC Yield. A fund’s 30-day SEC yield is derived using a formula specified by the U.S. Securities and Exchange Commission. Under the formula, data related to the fund’s security holdings in the previous 30 days are used to calculate the fund’s hypothetical net income for that period, which is then annualized and divided by the fund’s estimated average net assets over the calculation period. For the purposes of this calculation, a security’s income is based on its current market yield to maturity (for bonds), its actual income (for asset-backed securities), or its projected dividend yield (for stocks). Because the SEC yield represents hypothetical annualized income, it will differ—at times significantly—from the fund’s actual experience. As a result, the fund’s income distributions may be higher or lower than implied by the SEC yield.
Beta. A measure of the magnitude of a fund’s past share-price fluctuations in relation to the ups and downs of a given market index. The index is assigned a beta of 1.00. Compared with a given index, a fund with a beta of 1.20 typically would have seen its share price rise or fall by 12% when the index rose or fell by 10%. For this report, beta is based on returns over the past 36 months for both the fund and the index. Note that a fund’s beta should be reviewed in conjunction with its R-squared (see definition). The lower the R-squared, the less correlation there is between the fund and the index, and the less reliable beta is as an indicator of volatility.
Dividend Yield. Dividend income earned by stocks, expressed as a percentage of the aggregate market value (or of net asset value, for a fund). The yield is determined by dividing the amount of the annual dividends by the aggregate value (or net asset value) at the end of the period. For a fund, the dividend yield is based solely on stock holdings and does not include any income produced by other investments.
Earnings Growth Rate. The average annual rate of growth in earnings over the past five years for the stocks now in a fund.
Equity Exposure. A measure that reflects a fund’s investments in stocks and stock futures. Any holdings in short-term reserves are excluded.
Expense Ratio. A fund’s total annual operating expenses expressed as a percentage of the fund’s average net assets. The expense ratio includes management and administrative expenses, but does not include the transaction costs of buying and selling portfolio securities.
Foreign Holdings. The percentage of a fund represented by securities or depositary receipts of companies based outside the United States.
Inception Date. The date on which the assets of a fund (or one of its share classes) are first invested in accordance with the fund’s investment objective. For funds with a subscription period, the inception date is the day after that period ends. Investment performance is measured from the inception date.
Median Market Cap. An indicator of the size of companies in which a fund invests; the midpoint of market capitalization (market price x shares outstanding) of a fund’s stocks, weighted by the proportion of the fund’s assets invested in each stock. Stocks representing half of the fund’s assets have market capitalizations above the median, and the rest are below it.
Price/Book Ratio. The share price of a stock divided by its net worth, or book value, per share. For a fund, the weighted average price/book ratio of the stocks it holds.
35
Price/Earnings Ratio. The ratio of a stock’s current price to its per-share earnings over the past year. For a fund, the weighted average P/E of the stocks it holds. P/E is an indicator of market expectations about corporate prospects; the higher the P/E, the greater the expectations for a company’s future growth.
R-Squared. A measure of how much of a fund’s past returns can be explained by the returns from the market in general, as measured by a given index. If a fund’s total returns were precisely synchronized with an index’s returns, its R-squared would be 1.00. If the fund’s returns bore no relationship to the index’s returns, its R-squared would be 0. For this report, R-squared is based on returns over the past 36 months for both the fund and the index.
Return on Equity. The annual average rate of return generated by a company during the past five years for each dollar of shareholder’s equity (net income divided by shareholder’s equity). For a fund, the weighted average return on equity for the companies whose stocks it holds.
Short-Term Reserves. The percentage of a fund invested in highly liquid, short-term securities that can be readily converted to cash.
Turnover Rate. An indication of the fund’s trading activity. Funds with high turnover rates incur higher transaction costs and may be more likely to distribute capital gains (which may be taxable to investors). The turnover rate excludes in-kind transactions, which have minimal impact on costs.
Benchmark Information
Spliced Total Stock Market Index: Dow Jones U.S. Total Stock Market Index (formerly known as the Dow Jones Wilshire 5000 Index) through April 22, 2005; MSCI US Broad Market Index through June 2, 2013; and CRSP US Total Market Index thereafter.
36
This page intentionally left blank.
This page intentionally left blank.
This page intentionally left blank.
The People Who Govern Your Fund
The trustees of your mutual fund are there to see that the fund is operated and managed in your best interests since, as a shareholder, you are a part owner of the fund. Your fund’s trustees also serve on the board of directors of The Vanguard Group, Inc., which is owned by the Vanguard funds and provides services to them on an at-cost basis.
A majority of Vanguard’s board members are independent, meaning that they have no affiliation with Vanguard or the funds they oversee, apart from the sizable personal investments they have made as private individuals. The independent board members have distinguished backgrounds in business, academia, and public service. Each of the trustees and executive officers oversees 198 Vanguard funds.
The following table provides information for each trustee and executive officer of the fund. The mailing address of the trustees and officers is P.O. Box 876, Valley Forge, PA 19482. More information about the trustees is in the Statement of Additional Information, which can be obtained, without charge, by contacting Vanguard at 800-662-7447, or online at vanguard.com.
InterestedTrustee1
F. William McNabb III
Born 1957. Trustee Since July 2009. Chairman of the Board. Principal Occupation(s) During the Past Five Years and Other Experience: Chairman of the Board of The Vanguard Group, Inc., and of each of the investment companies served by The Vanguard Group, since January 2010; Director of The Vanguard Group since 2008; Chief Executive Officer and President of The Vanguard Group, and of each of the investment companies served by The Vanguard Group, since 2008; Director of Vanguard Marketing Corporation; Managing Director of The Vanguard Group (1995–2008).
IndependentTrustees
Emerson U. Fullwood
Born 1948. Trustee Since January 2008. Principal Occupation(s) During the Past Five Years and Other Experience: Executive Chief Staff and Marketing Officer for North America and Corporate Vice President (retired 2008) of Xerox Corporation (document management products and services); Executive in Residence and 2009–2010 Distinguished Minett Professor at the Rochester Institute of Technology; Lead Director of SPX FLOW, Inc. (multi-industry manufacturing); Director of the United Way of Rochester, the University of Rochester Medical Center, Monroe Community College Foundation, North Carolina A&T University, and Roberts Wesleyan College.
Rajiv L. Gupta
Born 1945. Trustee Since December 2001.2 Principal Occupation(s) During the Past Five Years and Other Experience: Chairman and Chief Executive Officer (retired 2009) and President (2006–2008) of Rohm and Haas Co. (chemicals); Director of Tyco International plc (diversified manufacturing and services), HP Inc. (printer and personal computer manufacturing), and Delphi Automotive plc (automotive components); Senior Advisor at New Mountain Capital.
Amy Gutmann
Born 1949. Trustee Since June 2006. Principal Occupation(s) During the Past Five Years and Other Experience: President of the University of Pennsylvania; Christopher H. Browne Distinguished Professor of Political Science, School of Arts and Sciences, and Professor of Communication, Annenberg School for Communication, with secondary faculty appointments in the Department of Philosophy, School of Arts and Sciences, and at the Graduate School of Education, University of Pennsylvania; Trustee of the National Constitution Center; Chair of the Presidential Commission for the Study of Bioethical Issues.
JoAnn Heffernan Heisen
Born 1950. Trustee Since July 1998. Principal Occupation(s) During the Past Five Years and Other Experience: Corporate Vice President and Chief Global Diversity Officer (retired 2008) and Member of the Executive Committee (1997–2008) of Johnson & Johnson (pharmaceuticals/medical devices/consumer products); Director of Skytop Lodge Corporation (hotels) and the Robert Wood Johnson Foundation; Member of the Advisory Board of the Institute for Women’s Leadership at Rutgers University.
F. Joseph Loughrey
Born 1949. Trustee Since October 2009. Principal Occupation(s) During the Past Five Years and Other Experience: President and Chief Operating Officer (retired 2009) of Cummins Inc. (industrial machinery); Chairman of the Board of Hillenbrand, Inc. (specialized consumer services), and of Oxfam America; Director of SKF AB (industrial machinery), Hyster-Yale Materials Handling, Inc. (forklift trucks), the Lumina Foundation for Education, and the V Foundation for Cancer Research; Member of the Advisory Council for the College of Arts and Letters and of the Advisory Board to the Kellogg Institute for International Studies, both at the University of Notre Dame.
Mark Loughridge
Born 1953. Trustee Since March 2012. Principal Occupation(s) During the Past Five Years and Other Experience: Senior Vice President and Chief Financial Officer (retired 2013) at IBM (information technology services); Fiduciary Member of IBM’s Retirement Plan Committee (2004–2013); Director of the Dow Chemical Company; Member of the Council on Chicago Booth.
Scott C. Malpass
Born 1962. Trustee Since March 2012. Principal Occupation(s) During the Past Five Years and Other Experience: Chief Investment Officer and Vice President at the University of Notre Dame; Assistant Professor of Finance at the Mendoza College of Business at Notre Dame; Member of the Notre Dame 403(b) Investment Committee, the Board of Advisors for Spruceview Capital Partners, and the Investment Advisory Committee of Major League Baseball; Board Member of TIFF Advisory Services, Inc., and Catholic Investment Services, Inc. (investment advisors).
André F. Perold
Born 1952. Trustee Since December 2004. Principal Occupation(s) During the Past Five Years and Other Experience: George Gund Professor of Finance and Banking, Emeritus at the Harvard Business School (retired 2011); Chief Investment Officer and Managing Partner of HighVista Strategies LLC (private investment firm); Director of Rand Merchant Bank; Overseer of the Museum of Fine Arts Boston.
Peter F. Volanakis
Born 1955. Trustee Since July 2009. Principal Occupation(s) During the Past Five Years and Other Experience: President and Chief Operating Officer (retired 2010) of Corning Incorporated (communications equipment); Chairman of the Board of Trustees of Colby-Sawyer College; Member of the Advisory Board of the Norris Cotton Cancer Center.
Executive Officers
Glenn Booraem
Born 1967. Treasurer Since May 2015. Principal Occupation(s) During the Past Five Years and Other Experience: Principal of The Vanguard Group, Inc.; Treasurer of each of the investment companies served by The Vanguard Group; Controller of each of the investment companies served by The Vanguard Group (2010–2015); Assistant Controller of each of the investment companies served by The Vanguard Group (2001–2010).
Thomas J. Higgins
Born 1957. Chief Financial Officer Since September 2008. Principal Occupation(s) During the Past Five Years and Other Experience: Principal of The Vanguard Group, Inc.; Chief Financial Officer of each of the investment companies served by The Vanguard Group; Treasurer of each of the investment companies served by The Vanguard Group (1998–2008).
Peter Mahoney
Born 1974. Controller Since May 2015. Principal Occupation(s) During the Past Five Years and Other Experience: Head of Global Fund Accounting at The Vanguard Group, Inc.; Controller of each of the investment companies served by The Vanguard Group; Head of International Fund Services at The Vanguard Group (2008–2014).
Anne E. Robinson
Born 1970. Secretary Since September 2016. Principal Occupation(s) During the Past Five Years and Other Experience: Managing Director of The Vanguard Group, Inc.; General Counsel of The Vanguard Group; Secretary of The Vanguard Group and of each of the investment companies served by The Vanguard Group; Director and Senior Vice President of Vanguard Marketing Corporation; Managing Director and General Counsel of Global Cards and Consumer Services at Citigroup (2014–2016); Counsel at American Express (2003–2014).
| |
| Vanguard Senior Management Team |
| Mortimer J. Buckley | Thomas M. Rampulla |
| Martha G. King | Glenn W. Reed |
| John T. Marcante | Karin A. Risi |
| Chris D. McIsaac | Michael Rollings |
| James M. Norris | |
| |
| Chairman Emeritus and Senior Advisor |
| John J. Brennan | |
| Chairman, 1996–2009 | |
| Chief Executive Officer and President, 1996–2008 |
| |
| Founder | |
| John C. Bogle | |
| Chairman and Chief Executive Officer, 1974–1996 |
1 Mr. McNabb is considered an “interested person,” as defined in the Investment Company Act of 1940, because he is an officer of the Vanguard funds.
2 December 2002 for Vanguard Equity Income Fund, the Vanguard Municipal Bond Funds, and the Vanguard State Tax-Exempt Funds.
|  |
| | P.O. Box 2600 |
| | Valley Forge, PA 19482-2600 |
| |
| |
| |
| Connect with Vanguard® > vanguard.com |
| |
| |
| |
| Fund Information > 800-662-7447 | |
| Direct Investor Account Services > 800-662-2739 | |
| Institutional Investor Services > 800-523-1036 | |
| Text Telephone for People | |
| Who Are Deaf or Hard of Hearing > 800-749-7273 | |
| |
| This material may be used in conjunction | |
| with the offering of shares of any Vanguard | |
| fund only if preceded or accompanied by | |
| the fund’s current prospectus. | |
| |
| All comparative mutual fund data are from Lipper, a | |
| Thomson Reuters Company, or Morningstar, Inc., unless | |
| otherwise noted. | |
| |
| You can obtain a free copy of Vanguard’s proxy voting | |
| guidelines by visiting vanguard.com/proxyreporting or by | |
| calling Vanguard at 800-662-2739. The guidelines are | |
| also available from the SEC’s website, sec.gov. In | |
| addition, you may obtain a free report on how your fund | |
| voted the proxies for securities it owned during the 12 | |
| months ended June 30. To get the report, visit either | |
| vanguard.com/proxyreporting or sec.gov. | |
| |
| You can review and copy information about your fund at | |
| the SEC’s Public Reference Room in Washington, D.C. To | |
| find out more about this public service, call the SEC at | |
| 202-551-8090. Information about your fund is also | |
| available on the SEC’s website, and you can receive | |
| copies of this information, for a fee, by sending a | |
| request in either of two ways: via email addressed to | |
| publicinfo@sec.gov or via regular mail addressed to the | |
| Public Reference Section, Securities and Exchange | |
| Commission, Washington, DC 20549-1520. | |
| |
| | © 2017 The Vanguard Group, Inc. |
| | All rights reserved. |
| | Vanguard Marketing Corporation, Distributor. |
| |
| | Q850 022017 |
Item 2: Code of Ethics. The Registrant has adopted a code of ethics that applies to the Registrant’s principal executive officer, principal financial officer, principal accounting officer or controller or persons performing similar functions. The Code of Ethics was amended during the reporting period covered by this report to make certain technical, non-material changes.
Item 3: Audit Committee Financial Expert. All members of the Audit Committee have been determined by the Registrant’s Board of Trustees to be Audit Committee Financial Experts and to be independent: Rajiv L. Gupta, JoAnn Heffernan Heisen, F. Joseph Loughrey, Mark Loughridge, and Peter F. Volanakis.
Item 4: Principal Accountant Fees and Services.
(a) Audit Fees.
Audit Fees of the Registrant
Fiscal Year Ended December 31, 2016: $505,000
Fiscal Year Ended December 31, 2015: $484,000
Aggregate Audit Fees of Registered Investment Companies in the Vanguard Group.
Fiscal Year Ended December 31, 2016: $9,629,849
Fiscal Year Ended December 31, 2015: $7,000,200
Includes fees billed in connection with audits of the Registrant, other registered investment companies in the Vanguard complex, The Vanguard Group, Inc. and Vanguard Marketing Corporation.
(b) Audit-Related Fees.
Fiscal Year Ended December 31, 2016: $2,717,627
Fiscal Year Ended December 31, 2015: $2,899,096
Includes fees billed in connection with assurance and related services provided to the Registrant, other registered investment companies in the Vanguard complex, The Vanguard Group, Inc., and Vanguard Marketing Corporation.
(c) Tax Fees.
Fiscal Year Ended December 31, 2016: $254,050
Fiscal Year Ended December 31, 2015: $353,389
Includes fees billed in connection with tax compliance, planning, and advice services provided to the Registrant, other registered investment companies in the Vanguard complex, The Vanguard Group, Inc., and Vanguard Marketing Corporation.
(d) All Other Fees.
Fiscal Year Ended December 31, 2016: $214,225
Fiscal Year Ended December 31, 2015: $202,313
Includes fees billed for services related to tax reported information provided to the Registrant, other registered investment companies in the Vanguard complex, The Vanguard Group, Inc., and Vanguard Marketing Corporation.
(e) (1) Pre-Approval Policies. The policy of the Registrant’s Audit Committee is to consider and, if appropriate, approve before the principal accountant is engaged for such services, all specific audit and non-audit services provided to: the Registrant, other registered investment companies in the Vanguard complex, The Vanguard Group, Inc., and entities controlled by The Vanguard Group, Inc. that provide ongoing services to the Registrant. In making a determination, the Audit Committee considers whether the services are consistent with maintaining the principal accountant’s independence.
In the event of a contingency situation in which the principal accountant is needed to provide services in between scheduled Audit Committee meetings, the Chairman of the Audit Committee would be called on to consider and, if appropriate, pre-approve audit or permitted non-audit services in an amount sufficient to complete services through the next Audit Committee meeting, and to determine if such services would be consistent with maintaining the accountant’s independence. At the next scheduled Audit Committee meeting, services and fees would be presented to the Audit Committee for formal consideration, and, if appropriate, approval by the entire Audit Committee. The Audit Committee would again consider whether such services and fees are consistent with maintaining the principal accountant’s independence.
The Registrant’s Audit Committee is informed at least annually of all audit and non-audit services provided by the principal accountant to the Vanguard complex, whether such services are provided to: the Registrant, other registered investment companies in the Vanguard complex, The Vanguard Group, Inc., or other entities controlled by The Vanguard Group, Inc. that provide ongoing services to the Registrant.
(2) No percentage of the principal accountant’s fees or services were approved pursuant to the waiver provision of paragraph (c)(7)(i)(C) of Rule 2-01 of Regulation S-X.
(f) For the most recent fiscal year, over 50% of the hours worked under the principal accountant’s engagement were not performed by persons other than full-time, permanent employees of the principal accountant.
(g) Aggregate Non-Audit Fees.
Fiscal Year Ended December 31, 2016: $468,275
Fiscal Year Ended December 31, 2015: $555,702
Includes fees billed for non-audit services provided to the Registrant, other registered investment companies in the Vanguard complex, The Vanguard Group, Inc., and Vanguard Marketing Corporation.
(h) For the most recent fiscal year, the Audit Committee has determined that the provision of all non-audit services was consistent with maintaining the principal accountant’s independence.
Item 5: Audit Committee of Listed Registrants.
The Registrant is a listed issuer as defined in rule 10A-3 under the Securities Exchange Act of 1934 (“Exchange Act”). The Registrant has a separately-designated standing audit committee established in accordance with Section 3(a)(58)(A) of the Exchange Act. The Registrant’s audit committee members are: Rajiv L. Gupta, JoAnn Heffernan Heisen, F. Joseph Loughrey, Mark Loughridge, and Peter F. Volanakis.
Item 6: Investments.
| | | |
| Vanguard® Small-Cap Index Fund | | |
| Schedule of Investments | | |
| December 31, 2016 | | |
| |
| | | | Market |
| | | | Value |
| | | Shares | ($000) |
| |
| Common Stocks (101.2%)1 | | |
| Basic Materials (4.5%) | | |
| | Steel Dynamics Inc. | 5,172,373 | 184,033 |
| | RPM International Inc. | 2,979,292 | 160,375 |
| | United States Steel Corp. | 3,860,984 | 127,451 |
| | US Silica Holdings Inc. | 1,778,374 | 100,798 |
| | Scotts Miracle-Gro Co. Class A | 1,015,057 | 96,989 |
| | Olin Corp. | 3,690,675 | 94,518 |
| | Royal Gold Inc. | 1,458,544 | 92,399 |
| | NewMarket Corp. | 211,797 | 89,768 |
| | Chemours Co. | 4,060,568 | 89,698 |
| | Huntsman Corp. | 4,520,719 | 86,255 |
| | Sensient Technologies Corp. | 995,280 | 78,209 |
| * | AK Steel Holding Corp. | 6,990,072 | 71,369 |
| * | Versum Materials Inc. | 2,417,908 | 67,871 |
| | CONSOL Energy Inc. | 3,586,538 | 65,383 |
| | Cabot Corp. | 1,252,716 | 63,312 |
| | Minerals Technologies Inc. | 780,366 | 60,283 |
| | PolyOne Corp. | 1,871,458 | 59,961 |
| | Balchem Corp. | 709,027 | 59,502 |
| | Compass Minerals International Inc. | 754,434 | 59,110 |
| * | Alcoa Corp. | 2,037,355 | 57,209 |
| | Commercial Metals Co. | 2,574,790 | 56,079 |
| | Domtar Corp. | 1,397,595 | 54,548 |
| | HB Fuller Co. | 1,124,461 | 54,323 |
| * | Univar Inc. | 1,855,567 | 52,642 |
| * | Ingevity Corp. | 940,516 | 51,597 |
| | Worthington Industries Inc. | 992,598 | 47,089 |
| * | Chemtura Corp. | 1,406,381 | 46,692 |
| | Hecla Mining Co. | 8,849,473 | 46,371 |
| * | Stillwater Mining Co. | 2,703,895 | 43,560 |
| | KapStone Paper and Packaging Corp. | 1,942,068 | 42,823 |
| * | Platform Specialty Products Corp. | 4,363,995 | 42,811 |
| * | GCP Applied Technologies Inc. | 1,586,552 | 42,440 |
| *,^ | Fairmount Santrol Holdings Inc. | 3,482,407 | 41,058 |
| *,^ | Cliffs Natural Resources Inc. | 4,632,927 | 38,963 |
| ^ | Allegheny Technologies Inc. | 2,432,563 | 38,751 |
| * | Cambrex Corp. | 717,910 | 38,731 |
| * | Coeur Mining Inc. | 4,198,089 | 38,161 |
| | Carpenter Technology Corp. | 1,041,013 | 37,653 |
| | Stepan Co. | 450,255 | 36,687 |
| * | Arch Coal Inc. Class A | 466,091 | 36,378 |
| | Quaker Chemical Corp. | 283,466 | 36,267 |
| | Innospec Inc. | 508,745 | 34,849 |
| | Kaiser Aluminum Corp. | 379,933 | 29,517 |
| * | Ferro Corp. | 1,873,092 | 26,841 |
| * | Clearwater Paper Corp. | 373,398 | 24,476 |
| | PH Glatfelter Co. | 980,067 | 23,414 |
| | Innophos Holdings Inc. | 415,868 | 21,733 |
| | A Schulman Inc. | 627,822 | 21,001 |
| * | Kraton Corp. | 692,560 | 19,724 |
| | Calgon Carbon Corp. | 1,145,060 | 19,466 |
| | Deltic Timber Corp. | 245,710 | 18,937 |
| * | Koppers Holdings Inc. | 442,815 | 17,845 |
| | Tredegar Corp. | 629,679 | 15,112 |
| | Rayonier Advanced Materials Inc. | 973,418 | 15,049 |
| | Tronox Ltd. Class A | 1,387,203 | 14,302 |
| | Haynes International Inc. | 281,793 | 12,114 |
| | American Vanguard Corp. | 596,471 | 11,422 |
| * | Century Aluminum Co. | 1,068,189 | 9,144 |
| * | Resolute Forest Products Inc. | 1,323,374 | 7,080 |
| | FutureFuel Corp. | 508,004 | 7,061 |
| * | SunCoke Energy Inc. | 463,024 | 5,251 |
1
| | | |
| Vanguard® Small-Cap Index Fund | | |
| Schedule of Investments | | |
| December 31, 2016 | | |
| |
| | | | Market |
| | | | Value |
| | | Shares | ($000) |
| | Kronos Worldwide Inc. | 389,378 | 4,649 |
| | | | 3,047,104 |
| Consumer Goods (7.1%) | | |
| * | Middleby Corp. | 1,284,847 | 165,501 |
| | Leggett & Platt Inc. | 2,985,163 | 145,915 |
| | Pinnacle Foods Inc. | 2,636,651 | 140,929 |
| | Gentex Corp. | 6,398,064 | 125,978 |
| | Thor Industries Inc. | 1,115,552 | 111,611 |
| * | Post Holdings Inc. | 1,376,370 | 110,646 |
| | Brunswick Corp. | 2,002,859 | 109,236 |
| * | Toll Brothers Inc. | 3,295,888 | 102,173 |
| | Ingredion Inc. | 808,349 | 101,011 |
| * | Take-Two Interactive Software Inc. | 1,932,913 | 95,273 |
| | Pool Corp. | 876,959 | 91,502 |
| * | TreeHouse Foods Inc. | 1,266,775 | 91,448 |
| | Carter's Inc. | 1,047,319 | 90,478 |
| * | Hain Celestial Group Inc. | 2,310,105 | 90,163 |
| | Goodyear Tire & Rubber Co. | 2,914,708 | 89,977 |
| | Flowers Foods Inc. | 4,172,949 | 83,334 |
| *,^ | Tempur Sealy International Inc. | 1,098,987 | 75,039 |
| * | Skechers U.S.A. Inc. Class A | 2,977,368 | 73,184 |
| * | Tenneco Inc. | 1,167,573 | 72,938 |
| *,^ | Herbalife Ltd. | 1,454,479 | 70,019 |
| | Snyder's-Lance Inc. | 1,719,626 | 65,930 |
| | B&G Foods Inc. | 1,482,689 | 64,942 |
| | Spectrum Brands Holdings Inc. | 530,662 | 64,916 |
| | Energizer Holdings Inc. | 1,378,598 | 61,499 |
| | Visteon Corp. | 759,504 | 61,019 |
| | Dana Inc. | 3,211,726 | 60,959 |
| | Lancaster Colony Corp. | 428,772 | 60,624 |
| * | Manitowoc Foodservice Inc. | 3,099,449 | 59,912 |
| | Drew Industries Inc. | 524,686 | 56,535 |
| | HNI Corp. | 994,482 | 55,611 |
| | Nu Skin Enterprises Inc. Class A | 1,155,133 | 55,192 |
| * | Dorman Products Inc. | 734,312 | 53,649 |
| * | Kate Spade & Co. | 2,861,379 | 53,422 |
| | CalAtlantic Group Inc. | 1,555,025 | 52,886 |
| * | Helen of Troy Ltd. | 622,438 | 52,565 |
| * | Avon Products Inc. | 9,770,695 | 49,244 |
| | Vector Group Ltd. | 2,141,213 | 48,691 |
| * | Vista Outdoor Inc. | 1,313,344 | 48,462 |
| | Tupperware Brands Corp. | 903,260 | 47,530 |
| *,^ | Blue Buffalo Pet Products Inc. | 1,974,819 | 47,475 |
| * | Darling Ingredients Inc. | 3,675,998 | 47,457 |
| | Cooper Tire & Rubber Co. | 1,194,023 | 46,388 |
| | Wolverine World Wide Inc. | 2,093,110 | 45,944 |
| | Herman Miller Inc. | 1,339,975 | 45,827 |
| | Fresh Del Monte Produce Inc. | 751,960 | 45,591 |
| | J&J Snack Foods Corp. | 333,753 | 44,533 |
| | Dean Foods Co. | 2,020,949 | 44,016 |
| * | Steven Madden Ltd. | 1,218,430 | 43,559 |
| * | Zynga Inc. Class A | 16,447,920 | 42,271 |
| * | Cooper-Standard Holdings Inc. | 394,273 | 40,760 |
| | Sanderson Farms Inc. | 428,555 | 40,387 |
| * | Deckers Outdoor Corp. | 716,521 | 39,688 |
| * | TRI Pointe Group Inc. | 3,217,152 | 36,933 |
| | Columbia Sportswear Co. | 623,449 | 36,347 |
| | WD-40 Co. | 300,691 | 35,151 |
| | La-Z-Boy Inc. | 1,097,981 | 34,092 |
| * | US Foods Holding Corp. | 1,231,565 | 33,843 |
| * | iRobot Corp. | 575,591 | 33,643 |
| * | American Axle & Manufacturing Holdings Inc. | 1,714,778 | 33,095 |
| * | Boston Beer Co. Inc. Class A | 194,793 | 33,086 |
| * | ACCO Brands Corp. | 2,412,071 | 31,478 |
2
| | | |
| Vanguard® Small-Cap Index Fund | | |
| Schedule of Investments | | |
| December 31, 2016 | | |
| |
| | | | Market |
| | | | Value |
| | | Shares | ($000) |
| | Schweitzer-Mauduit International Inc. | 688,171 | 31,332 |
| | Steelcase Inc. Class A | 1,746,993 | 31,271 |
| | Universal Corp. | 486,103 | 30,989 |
| * | Meritage Homes Corp. | 854,317 | 29,730 |
| | Knoll Inc. | 1,050,799 | 29,349 |
| ^ | Cal-Maine Foods Inc. | 637,467 | 28,160 |
| * | Gentherm Inc. | 821,141 | 27,796 |
| *,^ | Wayfair Inc. | 775,032 | 27,165 |
| | Interface Inc. Class A | 1,458,328 | 27,052 |
| | KB Home | 1,703,755 | 26,936 |
| * | G-III Apparel Group Ltd. | 868,467 | 25,672 |
| | Andersons Inc. | 573,029 | 25,614 |
| | MDC Holdings Inc. | 926,215 | 23,767 |
| *,^ | Fitbit Inc. Class A | 3,229,235 | 23,638 |
| * | Fossil Group Inc. | 913,533 | 23,624 |
| * | Central Garden & Pet Co. Class A | 754,246 | 23,306 |
| * | Select Comfort Corp. | 1,006,194 | 22,760 |
| * | Seaboard Corp. | 5,262 | 20,795 |
| | Ethan Allen Interiors Inc. | 560,057 | 20,638 |
| | Oxford Industries Inc. | 338,492 | 20,354 |
| | Briggs & Stratton Corp. | 908,154 | 20,216 |
| | Coca-Cola Bottling Co. Consolidated | 104,919 | 18,765 |
| *,^ | GoPro Inc. Class A | 1,859,951 | 16,200 |
| ^ | Tootsie Roll Industries Inc. | 386,684 | 15,371 |
| * | Modine Manufacturing Co. | 1,019,080 | 15,184 |
| * | USANA Health Sciences Inc. | 244,705 | 14,976 |
| ^ | Valvoline Inc. | 684,101 | 14,708 |
| | Superior Industries International Inc. | 516,393 | 13,607 |
| | National Beverage Corp. | 260,753 | 13,319 |
| | AdvancePierre Foods Holdings Inc. | 431,687 | 12,856 |
| | Inter Parfums Inc. | 385,603 | 12,629 |
| | National Presto Industries Inc. | 118,145 | 12,571 |
| * | Taylor Morrison Home Corp. Class A | 650,480 | 12,528 |
| | Phibro Animal Health Corp. Class A | 417,891 | 12,244 |
| * | Crocs Inc. | 1,570,360 | 10,773 |
| * | Iconix Brand Group Inc. | 1,079,716 | 10,085 |
| | Movado Group Inc. | 349,426 | 10,046 |
| * | Acushnet Holdings Corp. | 495,697 | 9,770 |
| * | Eastman Kodak Co. | 522,213 | 8,094 |
| * | Federal-Mogul Holdings Corp. | 761,862 | 7,855 |
| * | Central Garden & Pet Co. | 231,489 | 7,660 |
| * | elf Beauty Inc. | 252,329 | 7,302 |
| * | Revlon Inc. Class A | 238,371 | 6,949 |
| | Metaldyne Performance Group Inc. | 302,169 | 6,935 |
| *,^ | Amplify Snack Brands Inc. | 681,652 | 6,005 |
| | Titan International Inc. | 484,275 | 5,429 |
| * | Vera Bradley Inc. | 415,162 | 4,866 |
| * | Tesla Motors Inc. | 53 | 11 |
| | | | 4,818,409 |
| Consumer Services (12.1%) | | |
| | Domino's Pizza Inc. | 1,073,653 | 170,968 |
| * | JetBlue Airways Corp. | 7,229,327 | 162,081 |
| * | Burlington Stores Inc. | 1,576,450 | 133,604 |
| | KAR Auction Services Inc. | 3,085,242 | 131,493 |
| | Vail Resorts Inc. | 810,299 | 130,709 |
| * | Copart Inc. | 2,173,558 | 120,437 |
| * | VCA Inc. | 1,721,300 | 118,167 |
| | Service Corp. International | 4,041,102 | 114,767 |
| * | ServiceMaster Global Holdings Inc. | 3,009,262 | 113,359 |
| | Sabre Corp. | 4,380,427 | 109,292 |
| | Dunkin' Brands Group Inc. | 2,048,524 | 107,425 |
| | Casey's General Stores Inc. | 874,839 | 104,001 |
| | TEGNA Inc. | 4,788,117 | 102,418 |
| * | Panera Bread Co. Class A | 487,548 | 99,991 |
3
| | | |
| Vanguard® Small-Cap Index Fund | | |
| Schedule of Investments | | |
| December 31, 2016 | | |
| |
| | | | Market |
| | | | Value |
| | | Shares | ($000) |
| | Dun & Bradstreet Corp. | 821,406 | 99,653 |
| | Dick's Sporting Goods Inc. | 1,865,489 | 99,057 |
| | Six Flags Entertainment Corp. | 1,644,555 | 98,607 |
| * | Rite Aid Corp. | 11,747,703 | 96,801 |
| ^ | Cracker Barrel Old Country Store Inc. | 536,797 | 89,634 |
| | Cinemark Holdings Inc. | 2,335,299 | 89,582 |
| * | Spirit Airlines Inc. | 1,547,971 | 89,566 |
| * | Sally Beauty Holdings Inc. | 3,218,052 | 85,021 |
| | CST Brands Inc. | 1,690,255 | 81,386 |
| | Jack in the Box Inc. | 722,042 | 80,609 |
| * | Live Nation Entertainment Inc. | 2,952,859 | 78,546 |
| * | Madison Square Garden Co. Class A | 434,050 | 74,444 |
| | Rollins Inc. | 2,190,962 | 74,011 |
| * | GrubHub Inc. | 1,911,362 | 71,905 |
| * | Cabela's Inc. | 1,227,039 | 71,843 |
| * | Bright Horizons Family Solutions Inc. | 997,651 | 69,856 |
| * | AMC Networks Inc. Class A | 1,316,012 | 68,880 |
| | Texas Roadhouse Inc. Class A | 1,417,312 | 68,371 |
| * | Avis Budget Group Inc. | 1,766,378 | 64,791 |
| * | Hawaiian Holdings Inc. | 1,133,320 | 64,599 |
| * | Pandora Media Inc. | 4,950,082 | 64,549 |
| | Cable One Inc. | 102,044 | 63,444 |
| * | Buffalo Wild Wings Inc. | 406,396 | 62,748 |
| * | Grand Canyon Education Inc. | 1,057,004 | 61,782 |
| * | Beacon Roofing Supply Inc. | 1,337,643 | 61,625 |
| * | Yelp Inc. Class A | 1,576,781 | 60,123 |
| | GameStop Corp. Class A | 2,322,002 | 58,654 |
| | Wendy's Co. | 4,304,794 | 58,201 |
| | Tribune Media Co. Class A | 1,659,091 | 58,035 |
| * | Lions Gate Entertainment Corp. Class B | 2,352,661 | 57,734 |
| * | Sprouts Farmers Market Inc. | 3,019,441 | 57,128 |
| | Cheesecake Factory Inc. | 953,232 | 57,080 |
| | John Wiley & Sons Inc. Class A | 1,025,418 | 55,885 |
| | American Eagle Outfitters Inc. | 3,653,079 | 55,417 |
| | Chemed Corp. | 344,101 | 55,197 |
| | Brinker International Inc. | 1,108,843 | 54,921 |
| | Dolby Laboratories Inc. Class A | 1,210,888 | 54,720 |
| *,^ | JC Penney Co. Inc. | 6,528,337 | 54,250 |
| * | United Natural Foods Inc. | 1,127,693 | 53,813 |
| | Office Depot Inc. | 11,799,373 | 53,333 |
| * | Dave & Buster's Entertainment Inc. | 939,390 | 52,888 |
| | Papa John's International Inc. | 617,782 | 52,870 |
| | Matthews International Corp. Class A | 682,110 | 52,420 |
| | Meredith Corp. | 877,124 | 51,882 |
| | Aaron's Inc. | 1,594,882 | 51,020 |
| * | Michaels Cos. Inc. | 2,493,247 | 50,987 |
| * | Murphy USA Inc. | 818,802 | 50,332 |
| | Big Lots Inc. | 994,081 | 49,913 |
| | Allegiant Travel Co. Class A | 296,572 | 49,350 |
| | Regal Entertainment Group Class A | 2,377,641 | 48,979 |
| * | Five Below Inc. | 1,225,355 | 48,965 |
| | Hillenbrand Inc. | 1,267,344 | 48,603 |
| | AMERCO | 131,342 | 48,543 |
| | Sinclair Broadcast Group Inc. Class A | 1,445,106 | 48,194 |
| | Lithia Motors Inc. Class A | 496,674 | 48,093 |
| * | Urban Outfitters Inc. | 1,687,204 | 48,052 |
| * | Liberty Expedia Holdings Inc. Class A | 1,208,016 | 47,922 |
| | Graham Holdings Co. Class B | 93,441 | 47,837 |
| * | Media General Inc. | 2,454,628 | 46,221 |
| | ILG Inc. | 2,534,463 | 46,051 |
| | PriceSmart Inc. | 543,074 | 45,347 |
| | Churchill Downs Inc. | 296,682 | 44,636 |
| * | Acxiom Corp. | 1,643,514 | 44,046 |
| | Bloomin' Brands Inc. | 2,353,795 | 42,439 |
4
| | | |
| Vanguard® Small-Cap Index Fund | | |
| Schedule of Investments | | |
| December 31, 2016 | | |
| |
| | | | Market |
| | | | Value |
| | | Shares | ($000) |
| | Core-Mark Holding Co. Inc. | 979,140 | 42,172 |
| | Choice Hotels International Inc. | 751,586 | 42,126 |
| ^ | Nexstar Broadcasting Group Inc. Class A | 651,401 | 41,234 |
| | SkyWest Inc. | 1,103,405 | 40,219 |
| * | Sotheby's | 1,005,494 | 40,079 |
| *,^ | WebMD Health Corp. | 806,058 | 39,956 |
| | Penske Automotive Group Inc. | 761,004 | 39,450 |
| | Chico's FAS Inc. | 2,741,235 | 39,446 |
| * | Stamps.com Inc. | 342,725 | 39,293 |
| | Extended Stay America Inc. | 2,430,381 | 39,251 |
| | Monro Muffler Brake Inc. | 685,202 | 39,194 |
| | Children's Place Inc. | 382,705 | 38,634 |
| | Marriott Vacations Worldwide Corp. | 452,140 | 38,364 |
| | New York Times Co. Class A | 2,863,483 | 38,084 |
| * | Shutterfly Inc. | 720,163 | 36,138 |
| | Time Inc. | 1,990,986 | 35,539 |
| * | Boyd Gaming Corp. | 1,760,092 | 35,501 |
| | Group 1 Automotive Inc. | 453,416 | 35,339 |
| | DeVry Education Group Inc. | 1,118,972 | 34,912 |
| * | Caesars Acquisition Co. Class A | 2,482,258 | 33,510 |
| | DSW Inc. Class A | 1,414,103 | 32,029 |
| *,^ | Groupon Inc. Class A | 9,566,526 | 31,761 |
| | Red Rock Resorts Inc. Class A | 1,363,263 | 31,614 |
| * | Liberty Media Corp-Liberty Media | 1,006,289 | 31,527 |
| *,^ | Ollie's Bargain Outlet Holdings Inc. | 1,080,194 | 30,731 |
| * | comScore Inc. | 949,205 | 29,976 |
| * | Houghton Mifflin Harcourt Co. | 2,757,577 | 29,920 |
| | Caleres Inc. | 910,581 | 29,885 |
| * | MSG Networks Inc. | 1,382,385 | 29,721 |
| | DineEquity Inc. | 383,793 | 29,552 |
| *,^ | Lions Gate Entertainment Corp. Class A | 1,082,671 | 29,124 |
| | Morningstar Inc. | 388,891 | 28,607 |
| | SeaWorld Entertainment Inc. | 1,490,049 | 28,207 |
| * | Popeyes Louisiana Kitchen Inc. | 462,844 | 27,993 |
| * | SUPERVALU Inc. | 5,966,112 | 27,862 |
| | Tailored Brands Inc. | 1,087,393 | 27,783 |
| * | Asbury Automotive Group Inc. | 448,946 | 27,700 |
| * | Genesco Inc. | 437,559 | 27,172 |
| *,^ | RH | 874,620 | 26,851 |
| * | Rush Enterprises Inc. Class A | 838,039 | 26,733 |
| | Scholastic Corp. | 552,435 | 26,235 |
| * | La Quinta Holdings Inc. | 1,833,375 | 26,052 |
| * | Belmond Ltd. Class A | 1,948,731 | 26,016 |
| * | Hertz Global Holdings Inc. | 1,204,896 | 25,978 |
| * | Etsy Inc. | 2,187,985 | 25,774 |
| * | Ascena Retail Group Inc. | 4,129,812 | 25,564 |
| | Gannett Co. Inc. | 2,617,211 | 25,413 |
| | Dillard's Inc. Class A | 404,722 | 25,372 |
| * | Performance Food Group Co. | 1,042,341 | 25,016 |
| * | EW Scripps Co. Class A | 1,267,860 | 24,508 |
| | HSN Inc. | 702,426 | 24,093 |
| | Bob Evans Farms Inc. | 441,470 | 23,491 |
| * | Penn National Gaming Inc. | 1,684,070 | 23,223 |
| * | Liberty TripAdvisor Holdings Inc. Class A | 1,538,296 | 23,151 |
| | Sonic Corp. | 868,817 | 23,032 |
| | Capella Education Co. | 259,881 | 22,818 |
| | Planet Fitness Inc. Class A | 1,088,708 | 21,883 |
| | AMC Entertainment Holdings Inc. | 648,419 | 21,819 |
| * | Apollo Education Group Inc. | 2,199,700 | 21,777 |
| * | Herc Holdings Inc. | 537,502 | 21,586 |
| | International Speedway Corp. Class A | 577,635 | 21,257 |
| | National CineMedia Inc. | 1,410,769 | 20,781 |
| | Weis Markets Inc. | 302,589 | 20,225 |
| | ClubCorp Holdings Inc. | 1,399,148 | 20,078 |
5
| | | |
| Vanguard® Small-Cap Index Fund | | |
| Schedule of Investments | | |
| December 31, 2016 | | |
| |
| | | | Market |
| | | | Value |
| | | Shares | ($000) |
| ^ | Wingstop Inc. | 643,228 | 19,033 |
| * | Hibbett Sports Inc. | 491,029 | 18,315 |
| * | Strayer Education Inc. | 225,821 | 18,208 |
| | Abercrombie & Fitch Co. | 1,510,938 | 18,131 |
| * | Express Inc. | 1,663,422 | 17,898 |
| | New Media Investment Group Inc. | 1,112,312 | 17,786 |
| * | BJ's Restaurants Inc. | 441,521 | 17,352 |
| * | Pinnacle Entertainment Inc. | 1,180,782 | 17,121 |
| | Finish Line Inc. Class A | 905,876 | 17,040 |
| | GNC Holdings Inc. Class A | 1,527,439 | 16,863 |
| * | Scientific Games Corp. Class A | 1,173,843 | 16,434 |
| * | Fiesta Restaurant Group Inc. | 540,511 | 16,134 |
| | Cato Corp. Class A | 532,372 | 16,014 |
| | Guess? Inc. | 1,318,904 | 15,959 |
| *,^ | Shake Shack Inc. Class A | 445,184 | 15,933 |
| *,^ | Quotient Technology Inc. | 1,478,583 | 15,895 |
| * | SiteOne Landscape Supply Inc. | 441,505 | 15,333 |
| * | Liberty Media Corp-Liberty Media Class A | 488,032 | 15,300 |
| * | Francesca's Holdings Corp. | 846,848 | 15,269 |
| | Buckle Inc. | 651,400 | 14,852 |
| ^ | Fred's Inc. Class A | 794,823 | 14,752 |
| * | Tile Shop Holdings Inc. | 751,673 | 14,695 |
| *,^ | TrueCar Inc. | 1,153,453 | 14,418 |
| | World Wrestling Entertainment Inc. Class A | 775,234 | 14,264 |
| | Pier 1 Imports Inc. | 1,670,033 | 14,262 |
| | Barnes & Noble Inc. | 1,236,147 | 13,783 |
| * | K12 Inc. | 774,623 | 13,293 |
| | Sonic Automotive Inc. Class A | 560,044 | 12,825 |
| * | Vitamin Shoppe Inc. | 539,945 | 12,824 |
| | Rent-A-Center Inc. | 1,129,941 | 12,712 |
| *,^ | Diplomat Pharmacy Inc. | 978,278 | 12,326 |
| * | Regis Corp. | 779,807 | 11,323 |
| *,^ | Caesars Entertainment Corp. | 1,323,462 | 11,249 |
| * | Bankrate Inc. | 1,016,224 | 11,229 |
| * | Biglari Holdings Inc. | 20,760 | 9,824 |
| | Blue Nile Inc. | 236,447 | 9,607 |
| *,^ | Party City Holdco Inc. | 671,887 | 9,541 |
| *,^ | Lumber Liquidators Holdings Inc. | 580,635 | 9,139 |
| * | FTD Cos. Inc. | 369,696 | 8,814 |
| *,^ | Zumiez Inc. | 390,302 | 8,528 |
| * | American Public Education Inc. | 344,925 | 8,468 |
| * | Barnes & Noble Education Inc. | 725,144 | 8,317 |
| * | Smart & Final Stores Inc. | 567,765 | 8,005 |
| * | RetailMeNot Inc. | 830,106 | 7,720 |
| * | Clean Energy Fuels Corp. | 2,604,051 | 7,448 |
| *,^ | Weight Watchers International Inc. | 646,338 | 7,401 |
| * | Global Eagle Entertainment Inc. | 1,137,616 | 7,349 |
| * | Potbelly Corp. | 565,839 | 7,299 |
| * | Angie's List Inc. | 858,558 | 7,066 |
| * | Habit Restaurants Inc. Class A | 407,812 | 7,035 |
| * | Bojangles' Inc. | 368,761 | 6,877 |
| | Speedway Motorsports Inc. | 276,943 | 6,001 |
| *,^ | El Pollo Loco Holdings Inc. | 475,916 | 5,854 |
| * | Rush Enterprises Inc. Class B | 146,991 | 4,538 |
| *,^ | Sears Holdings Corp. | 481,657 | 4,475 |
| *,^ | Lands' End Inc. | 286,899 | 4,347 |
| * | Bridgepoint Education Inc. | 421,793 | 4,273 |
| | Clear Channel Outdoor Holdings Inc. Class A | 789,044 | 3,985 |
| * | Trade Desk Inc. Class A | 119,684 | 3,312 |
| * | Conn's Inc. | 178,748 | 2,261 |
| | | | 8,274,743 |
| Financials (27.6%) | | |
| * | SVB Financial Group | 1,163,177 | 199,671 |
| * | Signature Bank | 1,158,473 | 174,003 |
6
| | |
| Vanguard® Small-Cap Index Fund | | |
| Schedule of Investments | | |
| December 31, 2016 | | |
| |
| | | Market |
| | | Value |
| | Shares | ($000) |
| East West Bancorp Inc. | 3,219,268 | 163,635 |
| Regency Centers Corp. | 2,333,453 | 160,892 |
| Apartment Investment & Management Co. | 3,503,444 | 159,232 |
| Kilroy Realty Corp. | 2,060,506 | 150,870 |
| American Campus Communities Inc. | 2,949,888 | 146,816 |
| PacWest Bancorp | 2,685,941 | 146,223 |
| National Retail Properties Inc. | 3,285,437 | 145,216 |
| WP Carey Inc. | 2,373,468 | 140,248 |
| American Financial Group Inc. | 1,551,872 | 136,751 |
| ^ Omega Healthcare Investors Inc. | 4,357,707 | 136,222 |
| Bank of the Ozarks Inc. | 2,570,092 | 135,161 |
| CBOE Holdings Inc. | 1,815,136 | 134,120 |
| Endurance Specialty Holdings Ltd. | 1,434,179 | 132,518 |
| Gaming and Leisure Properties Inc. | 4,276,670 | 130,952 |
| Liberty Property Trust | 3,282,547 | 129,661 |
| Starwood Property Trust Inc. | 5,725,434 | 125,673 |
| RenaissanceRe Holdings Ltd. | 918,989 | 125,185 |
| Lamar Advertising Co. Class A | 1,846,982 | 124,191 |
| Equity LifeStyle Properties Inc. | 1,714,402 | 123,608 |
| Douglas Emmett Inc. | 3,214,534 | 117,523 |
| Spirit Realty Capital Inc. | 10,798,504 | 117,272 |
| MarketAxess Holdings Inc. | 797,247 | 117,132 |
| Hospitality Properties Trust | 3,668,318 | 116,432 |
| Highwoods Properties Inc. | 2,237,632 | 114,142 |
| Sun Communities Inc. | 1,467,631 | 112,435 |
| Forest City Realty Trust Inc. Class A | 5,394,149 | 112,414 |
| Brown & Brown Inc. | 2,504,737 | 112,362 |
| Cullen/Frost Bankers Inc. | 1,265,322 | 111,639 |
| Commerce Bancshares Inc. | 1,925,098 | 111,290 |
| Webster Financial Corp. | 2,048,320 | 111,183 |
| Assured Guaranty Ltd. | 2,911,338 | 109,961 |
| CubeSmart | 4,020,404 | 107,626 |
| Synovus Financial Corp. | 2,594,443 | 106,580 |
| DDR Corp. | 6,952,277 | 106,161 |
| Old Republic International Corp. | 5,570,890 | 105,847 |
| Prosperity Bancshares Inc. | 1,474,039 | 105,807 |
| First Horizon National Corp. | 5,208,357 | 104,219 |
| Arthur J Gallagher & Co. | 1,986,819 | 103,235 |
| * Western Alliance Bancorp | 2,111,619 | 102,857 |
| EPR Properties | 1,420,847 | 101,974 |
| Popular Inc. | 2,317,462 | 101,551 |
| Senior Housing Properties Trust | 5,304,627 | 100,417 |
| American Homes 4 Rent Class A | 4,779,169 | 100,267 |
| Eaton Vance Corp. | 2,391,035 | 100,137 |
| * Alleghany Corp. | 163,543 | 99,454 |
| Allied World Assurance Co. Holdings AG | 1,845,620 | 99,128 |
| DCT Industrial Trust Inc. | 2,032,725 | 97,327 |
| Weingarten Realty Investors | 2,716,856 | 97,236 |
| Hudson Pacific Properties Inc. | 2,754,188 | 95,791 |
| Taubman Centers Inc. | 1,282,000 | 94,778 |
| Validus Holdings Ltd. | 1,683,609 | 92,615 |
| Umpqua Holdings Corp. | 4,917,485 | 92,350 |
| Healthcare Trust of America Inc. Class A | 3,164,913 | 92,131 |
| PrivateBancorp Inc. | 1,690,404 | 91,603 |
| Apple Hospitality REIT Inc. | 4,584,268 | 91,594 |
| Investors Bancorp Inc. | 6,561,491 | 91,533 |
| * Howard Hughes Corp. | 800,864 | 91,379 |
| First American Financial Corp. | 2,452,409 | 89,832 |
| Life Storage Inc. | 1,036,009 | 88,330 |
| New Residential Investment Corp. | 5,599,977 | 88,032 |
| Medical Properties Trust Inc. | 7,151,434 | 87,963 |
| BankUnited Inc. | 2,325,559 | 87,650 |
| Gramercy Property Trust | 9,456,770 | 86,813 |
| Hanover Insurance Group Inc. | 950,208 | 86,478 |
7
| | | |
| Vanguard® Small-Cap Index Fund | | |
| Schedule of Investments | | |
| December 31, 2016 | | |
| |
| | | | Market |
| | | | Value |
| | | Shares | ($000) |
| | Radian Group Inc. | 4,788,327 | 86,094 |
| | STORE Capital Corp. | 3,481,179 | 86,020 |
| * | Texas Capital Bancshares Inc. | 1,094,430 | 85,803 |
| | Chemical Financial Corp. | 1,575,378 | 85,338 |
| * | Equity Commonwealth | 2,803,252 | 84,770 |
| | Bank of Hawaii Corp. | 953,321 | 84,550 |
| | Realogy Holdings Corp. | 3,282,657 | 84,463 |
| | Communications Sales & Leasing Inc. | 3,304,928 | 83,978 |
| | Wintrust Financial Corp. | 1,156,046 | 83,894 |
| | MB Financial Inc. | 1,773,019 | 83,740 |
| *,^ | Zillow Group Inc. | 2,295,743 | 83,726 |
| | Associated Banc-Corp | 3,360,061 | 82,994 |
| | IBERIABANK Corp. | 987,004 | 82,662 |
| | Retail Properties of America Inc. | 5,300,842 | 81,262 |
| | Hancock Holding Co. | 1,855,049 | 79,953 |
| | United Bankshares Inc. | 1,716,490 | 79,388 |
| | CyrusOne Inc. | 1,771,937 | 79,259 |
| | Healthcare Realty Trust Inc. | 2,587,646 | 78,457 |
| * | MGIC Investment Corp. | 7,607,364 | 77,519 |
| | LaSalle Hotel Properties | 2,525,300 | 76,946 |
| | Tanger Factory Outlet Centers Inc. | 2,147,811 | 76,849 |
| | Outfront Media Inc. | 3,084,312 | 76,707 |
| | FNB Corp. | 4,699,687 | 75,336 |
| | CNO Financial Group Inc. | 3,880,369 | 74,309 |
| | DuPont Fabros Technology Inc. | 1,690,623 | 74,269 |
| | Aspen Insurance Holdings Ltd. | 1,346,257 | 74,044 |
| | Home BancShares Inc. | 2,665,956 | 74,034 |
| | Sunstone Hotel Investors Inc. | 4,834,859 | 73,732 |
| | First Industrial Realty Trust Inc. | 2,613,742 | 73,315 |
| | Rayonier Inc. | 2,747,027 | 73,071 |
| | Fulton Financial Corp. | 3,869,345 | 72,744 |
| | UMB Financial Corp. | 941,921 | 72,641 |
| | Primerica Inc. | 1,024,008 | 70,810 |
| * | Stifel Financial Corp. | 1,405,491 | 70,204 |
| | Empire State Realty Trust Inc. | 3,448,476 | 69,625 |
| | Education Realty Trust Inc. | 1,631,790 | 69,025 |
| | Washington Federal Inc. | 1,989,296 | 68,332 |
| | White Mountains Insurance Group Ltd. | 81,549 | 68,179 |
| | Pinnacle Financial Partners Inc. | 980,024 | 67,916 |
| | Piedmont Office Realty Trust Inc. Class A | 3,244,901 | 67,851 |
| | Chimera Investment Corp. | 3,982,527 | 67,783 |
| | Two Harbors Investment Corp. | 7,773,077 | 67,781 |
| | TCF Financial Corp. | 3,440,221 | 67,394 |
| | Cousins Properties Inc. | 7,906,158 | 67,281 |
| | ProAssurance Corp. | 1,189,917 | 66,873 |
| | Sterling Bancorp | 2,855,518 | 66,819 |
| * | Liberty Ventures Class A | 1,811,963 | 66,807 |
| | Corporate Office Properties Trust | 2,116,116 | 66,065 |
| | Equity One Inc. | 2,106,692 | 64,654 |
| | RLJ Lodging Trust | 2,636,910 | 64,578 |
| | Brandywine Realty Trust | 3,911,090 | 64,572 |
| | Erie Indemnity Co. Class A | 571,043 | 64,214 |
| | CoreCivic Inc. | 2,625,045 | 64,209 |
| | Cathay General Bancorp | 1,674,549 | 63,683 |
| ^ | First Financial Bankshares Inc. | 1,402,239 | 63,381 |
| | MFA Financial Inc. | 8,303,656 | 63,357 |
| | Paramount Group Inc. | 3,952,882 | 63,207 |
| | LPL Financial Holdings Inc. | 1,794,361 | 63,179 |
| | Valley National Bancorp | 5,399,743 | 62,853 |
| | Hope Bancorp Inc. | 2,869,738 | 62,819 |
| * | SLM Corp. | 5,695,812 | 62,768 |
| | National Health Investors Inc. | 845,333 | 62,698 |
| | Glacier Bancorp Inc. | 1,708,872 | 61,912 |
| | Community Bank System Inc. | 991,795 | 61,283 |
8
| | | |
| Vanguard® Small-Cap Index Fund | | |
| Schedule of Investments | | |
| December 31, 2016 | | |
| |
| | | | Market |
| | | | Value |
| | | Shares | ($000) |
| | Urban Edge Properties | 2,227,508 | 61,279 |
| | NorthStar Realty Finance Corp. | 4,036,404 | 61,152 |
| | First Citizens BancShares Inc. Class A | 172,103 | 61,097 |
| | Ryman Hospitality Properties Inc. | 968,084 | 60,999 |
| | Legg Mason Inc. | 2,029,962 | 60,716 |
| | GEO Group Inc. | 1,675,062 | 60,185 |
| | CoreSite Realty Corp. | 756,908 | 60,076 |
| | Blackstone Mortgage Trust Inc. Class A | 1,992,283 | 59,908 |
| | NorthStar Asset Management Group Inc. | 4,008,352 | 59,805 |
| | Columbia Property Trust Inc. | 2,758,003 | 59,573 |
| | Assurant Inc. | 636,497 | 59,105 |
| | Acadia Realty Trust | 1,808,527 | 59,103 |
| | RLI Corp. | 932,293 | 58,856 |
| | BancorpSouth Inc. | 1,882,188 | 58,442 |
| | Federated Investors Inc. Class B | 2,054,241 | 58,094 |
| | Columbia Banking System Inc. | 1,296,318 | 57,919 |
| | Physicians Realty Trust | 3,034,209 | 57,529 |
| | Great Western Bancorp Inc. | 1,310,646 | 57,131 |
| | American National Insurance Co. | 452,152 | 56,343 |
| | Selective Insurance Group Inc. | 1,292,810 | 55,655 |
| | Navient Corp. | 3,384,175 | 55,602 |
| | Old National Bancorp | 3,014,375 | 54,711 |
| | Washington REIT | 1,669,062 | 54,562 |
| | Interactive Brokers Group Inc. | 1,442,167 | 52,654 |
| | CVB Financial Corp. | 2,294,013 | 52,602 |
| | Mack-Cali Realty Corp. | 1,802,589 | 52,311 |
| | DiamondRock Hospitality Co. | 4,473,532 | 51,580 |
| | Retail Opportunity Investments Corp. | 2,440,770 | 51,573 |
| | EastGroup Properties Inc. | 698,054 | 51,544 |
| | Trustmark Corp. | 1,434,710 | 51,147 |
| | International Bancshares Corp. | 1,252,932 | 51,120 |
| | Evercore Partners Inc. Class A | 738,642 | 50,745 |
| * | Essent Group Ltd. | 1,559,349 | 50,476 |
| | BGC Partners Inc. Class A | 4,904,773 | 50,176 |
| | PS Business Parks Inc. | 423,893 | 49,392 |
| | Hilltop Holdings Inc. | 1,650,432 | 49,183 |
| | Colony Starwood Homes | 1,699,770 | 48,970 |
| | Colony Capital Inc. Class A | 2,405,505 | 48,711 |
| | FirstCash Inc. | 1,029,074 | 48,366 |
| | Pebblebrook Hotel Trust | 1,609,234 | 47,875 |
| | Care Capital Properties Inc. | 1,874,948 | 46,874 |
| | Alexander & Baldwin Inc. | 1,039,960 | 46,663 |
| * | Blackhawk Network Holdings Inc. | 1,236,725 | 46,594 |
| | Xenia Hotels & Resorts Inc. | 2,387,206 | 46,360 |
| | EverBank Financial Corp. | 2,381,203 | 46,314 |
| | First Midwest Bancorp Inc. | 1,816,149 | 45,821 |
| | Lexington Realty Trust | 4,235,810 | 45,747 |
| | Capitol Federal Financial Inc. | 2,760,477 | 45,437 |
| | South State Corp. | 513,767 | 44,903 |
| | United Community Banks Inc. | 1,503,337 | 44,529 |
| | QTS Realty Trust Inc. Class A | 888,058 | 44,092 |
| | CBL & Associates Properties Inc. | 3,814,228 | 43,864 |
| | Kite Realty Group Trust | 1,865,742 | 43,808 |
| | Janus Capital Group Inc. | 3,262,482 | 43,293 |
| | Financial Engines Inc. | 1,175,191 | 43,188 |
| | Washington Prime Group Inc. | 4,139,040 | 43,087 |
| * | HealthEquity Inc. | 1,047,662 | 42,451 |
| * | Genworth Financial Inc. Class A | 11,129,726 | 42,404 |
| | American Equity Investment Life Holding Co. | 1,868,305 | 42,112 |
| | Argo Group International Holdings Ltd. | 635,751 | 41,896 |
| *,^ | Zillow Group Inc. Class A | 1,147,099 | 41,812 |
| | AmTrust Financial Services Inc. | 1,523,085 | 41,702 |
| | Kennedy-Wilson Holdings Inc. | 2,029,552 | 41,606 |
| *,^ | LendingClub Corp. | 7,924,224 | 41,602 |
9
| | | |
| Vanguard® Small-Cap Index Fund | | |
| Schedule of Investments | | |
| December 31, 2016 | | |
| |
| | | | Market |
| | | | Value |
| | | Shares | ($000) |
| * | Eagle Bancorp Inc. | 675,914 | 41,197 |
| | LTC Properties Inc. | 875,855 | 41,148 |
| | NBT Bancorp Inc. | 973,103 | 40,754 |
| | WesBanco Inc. | 938,113 | 40,395 |
| | Monogram Residential Trust Inc. | 3,725,768 | 40,313 |
| | STAG Industrial Inc. | 1,688,009 | 40,293 |
| | Banner Corp. | 709,115 | 39,576 |
| *,^ | Credit Acceptance Corp. | 181,596 | 39,499 |
| * | Enstar Group Ltd. | 199,281 | 39,398 |
| | Independent Bank Corp. | 558,524 | 39,348 |
| | LegacyTexas Financial Group Inc. | 911,223 | 39,237 |
| * | FCB Financial Holdings Inc. Class A | 822,510 | 39,234 |
| | Northwest Bancshares Inc. | 2,149,883 | 38,762 |
| | HRG Group Inc. | 2,483,106 | 38,637 |
| * | PRA Group Inc. | 983,196 | 38,443 |
| | Horace Mann Educators Corp. | 897,847 | 38,428 |
| | Kemper Corp. | 863,978 | 38,274 |
| | Provident Financial Services Inc. | 1,342,958 | 38,006 |
| | Astoria Financial Corp. | 2,036,633 | 37,983 |
| | Potlatch Corp. | 904,858 | 37,687 |
| | New York REIT Inc. | 3,703,936 | 37,484 |
| | Mercury General Corp. | 621,849 | 37,442 |
| | American Assets Trust Inc. | 868,858 | 37,430 |
| | First Financial Bancorp | 1,314,410 | 37,395 |
| | Simmons First National Corp. Class A | 593,564 | 36,890 |
| | BOK Financial Corp. | 441,511 | 36,663 |
| | Invesco Mortgage Capital Inc. | 2,492,017 | 36,383 |
| | Select Income REIT | 1,407,697 | 35,474 |
| | Park National Corp. | 293,836 | 35,160 |
| | Chesapeake Lodging Trust | 1,342,185 | 34,709 |
| | Waddell & Reed Financial Inc. Class A | 1,761,065 | 34,358 |
| ^ | Westamerica Bancorporation | 544,575 | 34,270 |
| | Sabra Health Care REIT Inc. | 1,384,455 | 33,808 |
| * | Quality Care Properties Inc. | 2,100,091 | 32,551 |
| | Navigators Group Inc. | 276,301 | 32,534 |
| * | MBIA Inc. | 2,890,519 | 30,929 |
| | Tompkins Financial Corp. | 322,547 | 30,494 |
| ^ | Government Properties Income Trust | 1,589,459 | 30,303 |
| | Global Net Lease Inc. | 3,814,535 | 29,868 |
| | Ramco-Gershenson Properties Trust | 1,785,261 | 29,600 |
| | Franklin Street Properties Corp. | 2,279,144 | 29,538 |
| | S&T Bancorp Inc. | 750,523 | 29,300 |
| | Boston Private Financial Holdings Inc. | 1,763,543 | 29,187 |
| ^ | WisdomTree Investments Inc. | 2,590,486 | 28,858 |
| | First Commonwealth Financial Corp. | 2,003,208 | 28,405 |
| | Pennsylvania REIT | 1,488,623 | 28,224 |
| | Beneficial Bancorp Inc. | 1,525,790 | 28,075 |
| | Kearny Financial Corp. | 1,779,305 | 27,668 |
| | Employers Holdings Inc. | 680,692 | 26,955 |
| | National General Holdings Corp. | 1,075,311 | 26,872 |
| | Maiden Holdings Ltd. | 1,538,579 | 26,848 |
| * | OneMain Holdings Inc. Class A | 1,206,408 | 26,710 |
| | Artisan Partners Asset Management Inc. Class A | 897,471 | 26,700 |
| | CYS Investments Inc. | 3,401,856 | 26,296 |
| | Redwood Trust Inc. | 1,711,862 | 26,037 |
| | Brookline Bancorp Inc. | 1,516,064 | 24,863 |
| | HFF Inc. Class A | 817,029 | 24,715 |
| | Berkshire Hills Bancorp Inc. | 667,768 | 24,607 |
| | Nelnet Inc. Class A | 479,665 | 24,343 |
| | TFS Financial Corp. | 1,266,071 | 24,106 |
| | Safety Insurance Group Inc. | 323,485 | 23,841 |
| | FelCor Lodging Trust Inc. | 2,949,003 | 23,622 |
| * | Piper Jaffray Cos. | 320,891 | 23,265 |
| | Capital Bank Financial Corp. | 592,576 | 23,259 |
10
| | | |
| Vanguard® Small-Cap Index Fund | | |
| Schedule of Investments | | |
| December 31, 2016 | | |
| |
| | | | Market |
| | | | Value |
| | | Shares | ($000) |
| | PennyMac Mortgage Investment Trust | 1,415,025 | 23,164 |
| | United Fire Group Inc. | 459,743 | 22,606 |
| * | Green Dot Corp. Class A | 955,176 | 22,494 |
| | NRG Yield Inc. | 1,410,839 | 22,291 |
| | Capstead Mortgage Corp. | 2,156,313 | 21,973 |
| | CareTrust REIT Inc. | 1,426,269 | 21,850 |
| | City Holding Co. | 320,850 | 21,689 |
| | State Bank Financial Corp. | 789,186 | 21,198 |
| | Infinity Property & Casualty Corp. | 237,869 | 20,909 |
| * | Parkway Inc. | 937,350 | 20,856 |
| * | St. Joe Co. | 1,097,595 | 20,854 |
| | Central Pacific Financial Corp. | 662,472 | 20,815 |
| ^ | Seritage Growth Properties Class A | 486,659 | 20,785 |
| | Ladder Capital Corp. Class A | 1,513,368 | 20,763 |
| | Towne Bank | 623,829 | 20,742 |
| *,^ | Black Knight Financial Services Inc. Class A | 544,334 | 20,576 |
| * | FNFV Group | 1,440,098 | 19,729 |
| | Alexander's Inc. | 46,000 | 19,636 |
| | Investors Real Estate Trust | 2,733,653 | 19,491 |
| * | Walker & Dunlop Inc. | 624,372 | 19,480 |
| * | First BanCorp | 2,915,730 | 19,273 |
| | Hersha Hospitality Trust Class A | 887,671 | 19,085 |
| | Renasant Corp. | 445,969 | 18,829 |
| * | iStar Inc. | 1,521,129 | 18,816 |
| | ServisFirst Bancshares Inc. | 498,625 | 18,669 |
| | Northfield Bancorp Inc. | 924,459 | 18,461 |
| *,^ | BofI Holding Inc. | 636,065 | 18,160 |
| * | KCG Holdings Inc. Class A | 1,364,829 | 18,084 |
| | Universal Health Realty Income Trust | 275,047 | 18,040 |
| | New Senior Investment Group Inc. | 1,840,538 | 18,019 |
| | ARMOUR Residential REIT Inc. | 820,891 | 17,805 |
| | Saul Centers Inc. | 265,354 | 17,675 |
| | National Bank Holdings Corp. Class A | 550,814 | 17,565 |
| | FBL Financial Group Inc. Class A | 224,058 | 17,510 |
| | BancFirst Corp. | 176,031 | 16,380 |
| | First Hawaiian Inc. | 468,753 | 16,322 |
| | Oritani Financial Corp. | 869,253 | 16,298 |
| * | Santander Consumer USA Holdings Inc. | 1,200,325 | 16,204 |
| | MTGE Investment Corp. | 1,032,035 | 16,203 |
| | Yadkin Financial Corp. | 472,379 | 16,184 |
| | BNC Bancorp | 495,569 | 15,809 |
| | National Western Life Group Inc. Class A | 50,627 | 15,735 |
| | Moelis & Co. Class A | 461,717 | 15,652 |
| | Cohen & Steers Inc. | 465,072 | 15,626 |
| * | Greenlight Capital Re Ltd. Class A | 665,519 | 15,174 |
| * | Third Point Reinsurance Ltd. | 1,306,541 | 15,091 |
| *,^ | Encore Capital Group Inc. | 516,933 | 14,810 |
| | Virtus Investment Partners Inc. | 124,930 | 14,748 |
| | Urstadt Biddle Properties Inc. Class A | 609,562 | 14,697 |
| | Getty Realty Corp. | 572,827 | 14,601 |
| | Greenhill & Co. Inc. | 522,466 | 14,472 |
| | Ashford Hospitality Trust Inc. | 1,835,284 | 14,242 |
| | InfraREIT Inc. | 788,207 | 14,117 |
| | Investment Technology Group Inc. | 702,748 | 13,872 |
| | Dime Community Bancshares Inc. | 684,465 | 13,758 |
| | First Potomac Realty Trust | 1,246,091 | 13,670 |
| | OFG Bancorp | 990,413 | 12,974 |
| * | Ambac Financial Group Inc. | 576,373 | 12,968 |
| | Silver Bay Realty Trust Corp. | 718,920 | 12,322 |
| | Altisource Residential Corp. | 1,095,089 | 12,090 |
| * | Flagstar Bancorp Inc. | 445,004 | 11,988 |
| | NRG Yield Inc. Class A | 778,438 | 11,957 |
| * | Nationstar Mortgage Holdings Inc. | 656,825 | 11,862 |
| * | Ocwen Financial Corp. | 2,076,996 | 11,195 |
11
| | | |
| Vanguard® Small-Cap Index Fund | | |
| Schedule of Investments | | |
| December 31, 2016 | | |
| |
| | | | Market |
| | | | Value |
| | | Shares | ($000) |
| | Anworth Mortgage Asset Corp. | 2,152,724 | 11,130 |
| | AG Mortgage Investment Trust Inc. | 623,270 | 10,664 |
| | Virtu Financial Inc. Class A | 614,975 | 9,809 |
| * | Forestar Group Inc. | 723,834 | 9,627 |
| | First Interstate BancSystem Inc. Class A | 218,077 | 9,279 |
| * | Marcus & Millichap Inc. | 340,561 | 9,100 |
| | State Auto Financial Corp. | 329,956 | 8,846 |
| | Houlihan Lokey Inc. | 283,338 | 8,817 |
| * | Tejon Ranch Co. | 327,463 | 8,327 |
| * | PennyMac Financial Services Inc. Class A | 449,404 | 7,483 |
| | OneBeacon Insurance Group Ltd. Class A | 454,070 | 7,288 |
| *,^ | Altisource Portfolio Solutions SA | 271,899 | 7,230 |
| * | MoneyGram International Inc. | 599,371 | 7,079 |
| | Ashford Hospitality Prime Inc. | 516,457 | 7,050 |
| * | World Acceptance Corp. | 99,400 | 6,389 |
| ^ | Fidelity & Guaranty Life | 266,580 | 6,318 |
| | RMR Group Inc. Class A | 150,793 | 5,956 |
| * | EZCORP Inc. Class A | 546,272 | 5,818 |
| * | NewStar Financial Inc. | 592,135 | 5,477 |
| * | Drive Shack Inc. | 1,356,539 | 5,101 |
| * | On Deck Capital Inc. | 876,479 | 4,058 |
| | Associated Capital Group Inc. Class A | 99,788 | 3,278 |
| | GAMCO Investors Inc. Class A | 99,938 | 3,087 |
| | Resource Capital Corp. | 329,980 | 2,749 |
| | Urstadt Biddle Properties Inc. | 60,433 | 1,184 |
| | Newcastle Investment Corp. | | — |
| | | | 18,862,441 |
| Health Care (8.9%) | | |
| | Teleflex Inc. | 983,733 | 158,529 |
| * | Align Technology Inc. | 1,601,507 | 153,953 |
| * | MEDNAX Inc. | 2,090,946 | 139,382 |
| | West Pharmaceutical Services Inc. | 1,634,273 | 138,635 |
| * | United Therapeutics Corp. | 947,135 | 135,848 |
| * | WellCare Health Plans Inc. | 989,039 | 135,577 |
| *,^ | Ionis Pharmaceuticals Inc. | 2,706,593 | 129,456 |
| | STERIS plc | 1,902,525 | 128,211 |
| * | DexCom Inc. | 1,887,474 | 112,682 |
| *,^ | TESARO Inc. | 834,904 | 112,278 |
| * | ABIOMED Inc. | 920,284 | 103,698 |
| * | Exelixis Inc. | 6,396,860 | 95,377 |
| | Bio-Techne Corp. | 833,462 | 85,705 |
| * | Bio-Rad Laboratories Inc. Class A | 463,439 | 84,476 |
| * | Envision Healthcare Corp. | 1,310,432 | 82,937 |
| * | Charles River Laboratories International Inc. | 1,056,900 | 80,525 |
| | HealthSouth Corp. | 1,904,916 | 78,559 |
| * | PAREXEL International Corp. | 1,189,443 | 78,170 |
| * | NuVasive Inc. | 1,125,763 | 75,831 |
| * | Alere Inc. | 1,942,798 | 75,711 |
| * | Neurocrine Biosciences Inc. | 1,939,904 | 75,074 |
| | Hill-Rom Holdings Inc. | 1,322,661 | 74,254 |
| * | Endo International plc | 4,479,392 | 73,776 |
| * | Catalent Inc. | 2,649,991 | 71,444 |
| *,^ | OPKO Health Inc. | 7,492,215 | 69,678 |
| * | Masimo Corp. | 1,000,166 | 67,411 |
| * | Team Health Holdings Inc. | 1,496,543 | 65,025 |
| *,^ | ACADIA Pharmaceuticals Inc. | 2,163,608 | 62,398 |
| * | Prestige Brands Holdings Inc. | 1,181,990 | 61,582 |
| | Healthcare Services Group Inc. | 1,540,592 | 60,345 |
| * | INC Research Holdings Inc. Class A | 1,137,390 | 59,827 |
| | Cantel Medical Corp. | 745,257 | 58,689 |
| * | Horizon Pharma plc | 3,600,993 | 58,264 |
| * | Ultragenyx Pharmaceutical Inc. | 821,198 | 57,738 |
| * | Integra LifeSciences Holdings Corp. | 667,896 | 57,299 |
| *,^ | Bluebird Bio Inc. | 906,423 | 55,926 |
12
| | | |
| Vanguard® Small-Cap Index Fund | | |
| Schedule of Investments | | |
| December 31, 2016 | | |
| |
| | | | Market |
| | | | Value |
| | | Shares | ($000) |
| *,^ | Seattle Genetics Inc. | 1,029,069 | 54,304 |
| * | Wright Medical Group NV | 2,306,913 | 53,013 |
| * | Neogen Corp. | 800,320 | 52,821 |
| *,^ | Acadia Healthcare Co. Inc. | 1,563,109 | 51,739 |
| * | Molina Healthcare Inc. | 951,646 | 51,636 |
| * | Brookdale Senior Living Inc. | 4,154,874 | 51,604 |
| * | Medicines Co. | 1,501,830 | 50,972 |
| * | LifePoint Health Inc. | 896,678 | 50,931 |
| | Bruker Corp. | 2,328,408 | 49,316 |
| * | PRA Health Sciences Inc. | 891,338 | 49,131 |
| *,^ | ARIAD Pharmaceuticals Inc. | 3,903,001 | 48,553 |
| | Owens & Minor Inc. | 1,373,602 | 48,474 |
| * | ICU Medical Inc. | 328,649 | 48,426 |
| * | Insulet Corp. | 1,282,438 | 48,322 |
| * | VWR Corp. | 1,909,451 | 47,794 |
| * | Haemonetics Corp. | 1,158,346 | 46,566 |
| * | Ironwood Pharmaceuticals Inc. Class A | 2,928,886 | 44,783 |
| * | Akorn Inc. | 1,957,848 | 42,740 |
| * | Ligand Pharmaceuticals Inc. | 420,046 | 42,681 |
| * | Nektar Therapeutics Class A | 3,421,617 | 41,983 |
| *,^ | Kite Pharma Inc. | 891,024 | 39,954 |
| *,^ | Nevro Corp. | 545,951 | 39,669 |
| *,^ | Intercept Pharmaceuticals Inc. | 360,111 | 39,126 |
| * | Magellan Health Inc. | 519,060 | 39,059 |
| | Patterson Cos. Inc. | 940,045 | 38,570 |
| * | Halyard Health Inc. | 1,042,317 | 38,545 |
| * | NxStage Medical Inc. | 1,456,402 | 38,172 |
| * | Globus Medical Inc. | 1,525,855 | 37,856 |
| *,^ | Penumbra Inc. | 566,774 | 36,160 |
| * | Sage Therapeutics Inc. | 708,075 | 36,154 |
| * | HMS Holdings Corp. | 1,904,915 | 34,593 |
| *,^ | Juno Therapeutics Inc. | 1,773,147 | 33,424 |
| *,^ | Radius Health Inc. | 866,512 | 32,953 |
| *,^ | Clovis Oncology Inc. | 732,374 | 32,532 |
| *,^ | Exact Sciences Corp. | 2,416,933 | 32,290 |
| *,^ | Sarepta Therapeutics Inc. | 1,158,189 | 31,769 |
| * | Select Medical Holdings Corp. | 2,365,652 | 31,345 |
| * | Agios Pharmaceuticals Inc. | 750,134 | 31,303 |
| * | Alnylam Pharmaceuticals Inc. | 813,286 | 30,449 |
| * | Surgical Care Affiliates Inc. | 634,113 | 29,340 |
| *,^ | Intrexon Corp. | 1,191,490 | 28,953 |
| * | Portola Pharmaceuticals Inc. | 1,262,566 | 28,332 |
| *,^ | Theravance Biopharma Inc. | 871,578 | 27,786 |
| * | AMAG Pharmaceuticals Inc. | 763,903 | 26,584 |
| * | Tenet Healthcare Corp. | 1,779,942 | 26,414 |
| * | Spark Therapeutics Inc. | 515,382 | 25,718 |
| * | Pacira Pharmaceuticals Inc. | 793,434 | 25,628 |
| | Abaxis Inc. | 483,114 | 25,494 |
| * | Myriad Genetics Inc. | 1,527,903 | 25,470 |
| * | Emergent BioSolutions Inc. | 768,686 | 25,244 |
| * | Merit Medical Systems Inc. | 952,063 | 25,230 |
| | CONMED Corp. | 565,050 | 24,958 |
| *,^ | Halozyme Therapeutics Inc. | 2,473,272 | 24,436 |
| * | FibroGen Inc. | 1,134,785 | 24,284 |
| | Ensign Group Inc. | 1,079,647 | 23,979 |
| * | Amedisys Inc. | 562,274 | 23,970 |
| * | Air Methods Corp. | 731,383 | 23,295 |
| * | Synergy Pharmaceuticals Inc. | 3,817,638 | 23,249 |
| | Analogic Corp. | 278,956 | 23,139 |
| * | Momenta Pharmaceuticals Inc. | 1,506,643 | 22,675 |
| * | Impax Laboratories Inc. | 1,653,901 | 21,914 |
| * | Puma Biotechnology Inc. | 697,172 | 21,403 |
| *,^ | Alder Biopharmaceuticals Inc. | 955,537 | 19,875 |
| * | Acorda Therapeutics Inc. | 1,035,781 | 19,473 |
13
| | | |
| Vanguard® Small-Cap Index Fund | | |
| Schedule of Investments | | |
| December 31, 2016 | | |
| |
| | | | Market |
| | | | Value |
| | | Shares | ($000) |
| *,^ | Innoviva Inc. | 1,699,769 | 18,188 |
| * | Luminex Corp. | 880,673 | 17,816 |
| * | Zeltiq Aesthetics Inc. | 401,170 | 17,459 |
| * | Healthways Inc. | 734,281 | 16,705 |
| * | LHC Group Inc. | 346,524 | 15,836 |
| | Meridian Bioscience Inc. | 892,947 | 15,805 |
| | National HealthCare Corp. | 206,068 | 15,618 |
| *,^ | Lannett Co. Inc. | 705,833 | 15,564 |
| * | Glaukos Corp. | 449,498 | 15,418 |
| * | Five Prime Therapeutics Inc. | 301,267 | 15,096 |
| *,^ | Avexis Inc. | 310,074 | 14,800 |
| | Kindred Healthcare Inc. | 1,827,023 | 14,342 |
| * | HealthStream Inc. | 571,398 | 14,314 |
| * | Orthofix International NV | 378,109 | 13,680 |
| *,^ | Community Health Systems Inc. | 2,411,845 | 13,482 |
| *,^ | Lexicon Pharmaceuticals Inc. | 934,371 | 12,922 |
| * | Quidel Corp. | 585,606 | 12,544 |
| * | Depomed Inc. | 687,495 | 12,389 |
| * | Natus Medical Inc. | 352,927 | 12,282 |
| * | Genomic Health Inc. | 414,998 | 12,197 |
| *,^ | Merrimack Pharmaceuticals Inc. | 2,750,969 | 11,224 |
| * | Epizyme Inc. | 912,830 | 11,045 |
| * | Intra-Cellular Therapies Inc. Class A | 725,613 | 10,950 |
| * | Achillion Pharmaceuticals Inc. | 2,624,010 | 10,837 |
| *,^ | Keryx Biopharmaceuticals Inc. | 1,786,296 | 10,468 |
| *,^ | TherapeuticsMD Inc. | 1,755,938 | 10,132 |
| *,^ | Endologix Inc. | 1,767,272 | 10,109 |
| * | Universal American Corp. | 1,011,460 | 10,064 |
| * | Aimmune Therapeutics Inc. | 473,213 | 9,677 |
| *,^ | Teladoc Inc. | 572,548 | 9,447 |
| * | Insmed Inc. | 700,648 | 9,270 |
| | Invacare Corp. | 678,352 | 8,853 |
| * | Acceleron Pharma Inc. | 337,177 | 8,605 |
| * | Celldex Therapeutics Inc. | 2,293,291 | 8,118 |
| * | CorVel Corp. | 221,327 | 8,101 |
| * | Accuray Inc. | 1,754,962 | 8,073 |
| | PDL BioPharma Inc. | 3,759,849 | 7,971 |
| * | Amicus Therapeutics Inc. | 1,588,428 | 7,894 |
| *,^ | Global Blood Therapeutics Inc. | 541,639 | 7,827 |
| * | Arena Pharmaceuticals Inc. | 5,469,230 | 7,766 |
| *,^ | Novavax Inc. | 6,082,684 | 7,664 |
| *,^ | Aduro Biotech Inc. | 668,576 | 7,622 |
| * | Novocure Ltd. | 964,748 | 7,573 |
| *,^ | ZIOPHARM Oncology Inc. | 1,329,062 | 7,110 |
| * | Surgery Partners Inc. | 439,064 | 6,959 |
| * | Natera Inc. | 581,808 | 6,813 |
| *,^ | Editas Medicine Inc. | 411,147 | 6,673 |
| * | Medpace Holdings Inc. | 181,609 | 6,551 |
| * | Spectrum Pharmaceuticals Inc. | 1,462,445 | 6,479 |
| *,^ | ConforMIS Inc. | 768,898 | 6,228 |
| *,^ | Insys Therapeutics Inc. | 641,361 | 5,901 |
| * | American Renal Associates Holdings Inc. | 241,310 | 5,135 |
| * | Seres Therapeutics Inc. | 437,210 | 4,328 |
| * | PTC Therapeutics Inc. | 369,068 | 4,027 |
| *,^ | Intellia Therapeutics Inc. | 281,185 | 3,686 |
| * | Ophthotech Corp. | 726,101 | 3,507 |
| *,^ | NantKwest Inc. | 563,859 | 3,225 |
| *,^ | Cempra Inc. | 1,044,219 | 2,924 |
| *,^ | MannKind Corp. | 3,477,124 | 2,214 |
| *,^ | Adeptus Health Inc. Class A | 146,638 | 1,120 |
| | | | 6,069,452 |
| Industrials (20.0%) | | |
| | Huntington Ingalls Industries Inc. | 1,035,331 | 190,698 |
| * | HD Supply Holdings Inc. | 4,479,864 | 190,439 |
14
| | |
| Vanguard® Small-Cap Index Fund | | |
| Schedule of Investments | | |
| December 31, 2016 | | |
| |
| | | Market |
| | | Value |
| | Shares | ($000) |
| Packaging Corp. of America | 2,104,130 | 178,472 |
| Broadridge Financial Solutions Inc. | 2,661,483 | 176,456 |
| Valspar Corp. | 1,594,799 | 165,237 |
| Carlisle Cos. Inc. | 1,440,397 | 158,861 |
| Spirit AeroSystems Holdings Inc. Class A | 2,717,785 | 158,583 |
| AO Smith Corp. | 3,298,266 | 156,173 |
| Jack Henry & Associates Inc. | 1,744,053 | 154,837 |
| IDEX Corp. | 1,702,620 | 153,338 |
| Lennox International Inc. | 913,151 | 139,867 |
| * Keysight Technologies Inc. | 3,795,217 | 138,791 |
| Allegion plc | 2,144,070 | 137,220 |
| * CoStar Group Inc. | 727,808 | 137,185 |
| * Old Dominion Freight Line Inc. | 1,564,823 | 134,246 |
| * Berry Plastics Group Inc. | 2,715,462 | 132,324 |
| Toro Co. | 2,319,017 | 129,749 |
| PerkinElmer Inc. | 2,446,242 | 127,572 |
| MDU Resources Group Inc. | 4,361,280 | 125,474 |
| * AECOM | 3,437,809 | 124,999 |
| Donaldson Co. Inc. | 2,962,710 | 124,671 |
| Nordson Corp. | 1,085,577 | 121,639 |
| Sonoco Products Co. | 2,229,674 | 117,504 |
| Cognex Corp. | 1,817,332 | 115,619 |
| Orbital ATK Inc. | 1,307,550 | 114,711 |
| Booz Allen Hamilton Holding Corp. Class A | 3,162,424 | 114,069 |
| * Quanta Services Inc. | 3,230,746 | 112,591 |
| Oshkosh Corp. | 1,662,887 | 107,439 |
| * XPO Logistics Inc. | 2,475,738 | 106,853 |
| Hexcel Corp. | 2,049,079 | 105,405 |
| Graco Inc. | 1,243,457 | 103,319 |
| AptarGroup Inc. | 1,399,932 | 102,825 |
| Lincoln Electric Holdings Inc. | 1,327,003 | 101,741 |
| Eagle Materials Inc. | 1,022,986 | 100,795 |
| Bemis Co. Inc. | 2,092,638 | 100,070 |
| * Zebra Technologies Corp. | 1,119,789 | 96,033 |
| * WEX Inc. | 858,839 | 95,846 |
| EMCOR Group Inc. | 1,354,289 | 95,829 |
| * Genesee & Wyoming Inc. Class A | 1,368,825 | 95,010 |
| Trinity Industries Inc. | 3,400,036 | 94,385 |
| MSC Industrial Direct Co. Inc. Class A | 996,956 | 92,109 |
| CLARCOR Inc. | 1,088,857 | 89,798 |
| Ryder System Inc. | 1,193,990 | 88,881 |
| Graphic Packaging Holding Co. | 7,091,753 | 88,505 |
| AGCO Corp. | 1,523,520 | 88,151 |
| Curtiss-Wright Corp. | 888,855 | 87,428 |
| * Teledyne Technologies Inc. | 703,412 | 86,520 |
| Woodward Inc. | 1,238,497 | 85,518 |
| Watsco Inc. | 575,985 | 85,315 |
| Jabil Circuit Inc. | 3,522,547 | 83,379 |
| MAXIMUS Inc. | 1,446,526 | 80,702 |
| Crane Co. | 1,113,323 | 80,293 |
| * Euronet Worldwide Inc. | 1,107,466 | 80,214 |
| National Instruments Corp. | 2,592,162 | 79,890 |
| Landstar System Inc. | 932,843 | 79,572 |
| BWX Technologies Inc. | 1,994,303 | 79,174 |
| Deluxe Corp. | 1,085,140 | 77,707 |
| * Genpact Ltd. | 3,138,770 | 76,398 |
| Littelfuse Inc. | 503,102 | 76,356 |
| * IPG Photonics Corp. | 772,098 | 76,214 |
| * Kirby Corp. | 1,142,485 | 75,975 |
| ITT Inc. | 1,969,606 | 75,968 |
| EnerSys | 969,812 | 75,742 |
| Air Lease Corp. Class A | 2,181,703 | 74,898 |
| * Coherent Inc. | 543,120 | 74,617 |
| World Fuel Services Corp. | 1,573,430 | 72,236 |
15
| | | |
| Vanguard® Small-Cap Index Fund | | |
| Schedule of Investments | | |
| December 31, 2016 | | |
| |
| | | | Market |
| | | | Value |
| | | Shares | ($000) |
| * | WESCO International Inc. | 1,084,303 | 72,160 |
| * | CoreLogic Inc. | 1,930,837 | 71,113 |
| | Chicago Bridge & Iron Co. NV | 2,234,959 | 70,960 |
| | Terex Corp. | 2,246,190 | 70,822 |
| | Belden Inc. | 941,109 | 70,367 |
| | Regal Beloit Corp. | 999,761 | 69,233 |
| * | Colfax Corp. | 1,917,412 | 68,893 |
| | Valmont Industries Inc. | 478,069 | 67,360 |
| * | Clean Harbors Inc. | 1,155,756 | 64,318 |
| * | TransUnion | 2,042,789 | 63,183 |
| * | Owens-Illinois Inc. | 3,628,011 | 63,164 |
| | Timken Co. | 1,563,880 | 62,086 |
| | Joy Global Inc. | 2,192,021 | 61,377 |
| * | Louisiana-Pacific Corp. | 3,176,010 | 60,122 |
| * | Sanmina Corp. | 1,639,494 | 60,087 |
| * | WageWorks Inc. | 818,237 | 59,322 |
| * | Esterline Technologies Corp. | 660,772 | 58,941 |
| * | Generac Holdings Inc. | 1,425,500 | 58,075 |
| * | USG Corp. | 1,957,276 | 56,526 |
| * | MasTec Inc. | 1,471,786 | 56,296 |
| | Kennametal Inc. | 1,784,967 | 55,798 |
| * | Cardtronics plc Class A | 1,011,597 | 55,203 |
| | FLIR Systems Inc. | 1,519,949 | 55,007 |
| | Tetra Tech Inc. | 1,274,234 | 54,983 |
| | GATX Corp. | 891,006 | 54,868 |
| | Barnes Group Inc. | 1,142,636 | 54,184 |
| * | Itron Inc. | 854,336 | 53,695 |
| | KBR Inc. | 3,185,898 | 53,173 |
| | John Bean Technologies Corp. | 618,491 | 53,159 |
| *,^ | Universal Display Corp. | 943,929 | 53,143 |
| * | KLX Inc. | 1,176,556 | 53,074 |
| | Mueller Industries Inc. | 1,283,194 | 51,276 |
| * | Anixter International Inc. | 627,449 | 50,855 |
| * | Summit Materials Inc. Class A | 2,080,220 | 49,488 |
| | UniFirst Corp. | 344,423 | 49,476 |
| | MSA Safety Inc. | 713,556 | 49,471 |
| | Applied Industrial Technologies Inc. | 827,530 | 49,155 |
| | Granite Construction Inc. | 884,366 | 48,640 |
| * | Cimpress NV | 530,096 | 48,562 |
| | Vishay Intertechnology Inc. | 2,989,045 | 48,423 |
| | ABM Industries Inc. | 1,182,838 | 48,307 |
| | Silgan Holdings Inc. | 943,262 | 48,276 |
| | Knight Transportation Inc. | 1,429,810 | 47,255 |
| * | Moog Inc. Class A | 717,812 | 47,146 |
| | Convergys Corp. | 1,916,786 | 47,076 |
| * | On Assignment Inc. | 1,063,938 | 46,983 |
| * | RBC Bearings Inc. | 503,893 | 46,766 |
| | HEICO Corp. Class A | 684,701 | 46,491 |
| | Mueller Water Products Inc. Class A | 3,431,276 | 45,670 |
| * | LifeLock Inc. | 1,899,248 | 45,430 |
| * | Rexnord Corp. | 2,294,811 | 44,955 |
| | HEICO Corp. | 577,201 | 44,531 |
| * | Masonite International Corp. | 669,733 | 44,068 |
| | Universal Forest Products Inc. | 431,275 | 44,068 |
| | CEB Inc. | 719,683 | 43,613 |
| * | FTI Consulting Inc. | 951,365 | 42,888 |
| | G&K Services Inc. Class A | 442,961 | 42,724 |
| * | Swift Transportation Co. | 1,752,999 | 42,703 |
| * | Trex Co. Inc. | 656,375 | 42,271 |
| | Brink's Co. | 1,004,295 | 41,427 |
| * | AMN Healthcare Services Inc. | 1,072,974 | 41,256 |
| | Covanta Holding Corp. | 2,629,538 | 41,021 |
| * | NeuStar Inc. Class A | 1,218,620 | 40,702 |
| * | Plexus Corp. | 753,082 | 40,697 |
16
| | | |
| Vanguard® Small-Cap Index Fund | | |
| Schedule of Investments | | |
| December 31, 2016 | | |
| |
| | | | Market |
| | | | Value |
| | | Shares | ($000) |
| | Watts Water Technologies Inc. Class A | 621,921 | 40,549 |
| * | DigitalGlobe Inc. | 1,389,450 | 39,808 |
| | Simpson Manufacturing Co. Inc. | 902,595 | 39,489 |
| * | Armstrong World Industries Inc. | 924,324 | 38,637 |
| | Brady Corp. Class A | 1,004,533 | 37,720 |
| *,^ | Ambarella Inc. | 693,726 | 37,551 |
| | AZZ Inc. | 585,589 | 37,419 |
| * | Headwaters Inc. | 1,572,168 | 36,977 |
| * | ExlService Holdings Inc. | 716,538 | 36,142 |
| | Otter Tail Corp. | 878,791 | 35,855 |
| * | II-VI Inc. | 1,182,665 | 35,066 |
| | Apogee Enterprises Inc. | 646,895 | 34,648 |
| | Franklin Electric Co. Inc. | 884,226 | 34,396 |
| * | Navistar International Corp. | 1,093,560 | 34,305 |
| | Korn/Ferry International | 1,163,702 | 34,248 |
| | Matson Inc. | 956,689 | 33,857 |
| * | Benchmark Electronics Inc. | 1,101,317 | 33,590 |
| * | Knowles Corp. | 1,994,947 | 33,336 |
| * | MACOM Technology Solutions Holdings Inc. | 718,996 | 33,275 |
| | Exponent Inc. | 542,965 | 32,741 |
| | Methode Electronics Inc. | 788,851 | 32,619 |
| | Actuant Corp. Class A | 1,256,929 | 32,617 |
| | Forward Air Corp. | 684,155 | 32,415 |
| | EnPro Industries Inc. | 476,972 | 32,129 |
| | ESCO Technologies Inc. | 550,782 | 31,202 |
| * | OSI Systems Inc. | 405,478 | 30,865 |
| * | Rogers Corp. | 401,329 | 30,826 |
| * | Hub Group Inc. Class A | 704,231 | 30,810 |
| | Mobile Mini Inc. | 1,002,391 | 30,322 |
| * | TopBuild Corp. | 849,521 | 30,243 |
| | Albany International Corp. | 650,998 | 30,141 |
| | Kaman Corp. | 611,158 | 29,904 |
| * | Advisory Board Co. | 896,574 | 29,811 |
| | Astec Industries Inc. | 441,265 | 29,768 |
| | AAON Inc. | 883,542 | 29,201 |
| * | SPX FLOW Inc. | 894,954 | 28,692 |
| | Insperity Inc. | 403,848 | 28,653 |
| | Tennant Co. | 396,190 | 28,209 |
| | Triumph Group Inc. | 1,051,117 | 27,855 |
| * | Atlas Air Worldwide Holdings Inc. | 530,610 | 27,671 |
| | Comfort Systems USA Inc. | 830,959 | 27,671 |
| * | Proto Labs Inc. | 535,939 | 27,520 |
| * | Navigant Consulting Inc. | 1,050,994 | 27,515 |
| | Greif Inc. Class A | 526,923 | 27,036 |
| * | Veeco Instruments Inc. | 916,155 | 26,706 |
| *,^ | Smith & Wesson Holding Corp. | 1,257,440 | 26,507 |
| | Cubic Corp. | 547,317 | 26,244 |
| | Werner Enterprises Inc. | 967,993 | 26,087 |
| * | TTM Technologies Inc. | 1,912,616 | 26,069 |
| | Aircastle Ltd. | 1,244,221 | 25,942 |
| | RR Donnelley & Sons Co. | 1,560,043 | 25,460 |
| * | Imperva Inc. | 659,983 | 25,343 |
| | Standex International Corp. | 287,603 | 25,266 |
| * | Sykes Enterprises Inc. | 873,640 | 25,213 |
| | Greenbrier Cos. Inc. | 601,738 | 25,002 |
| * | Huron Consulting Group Inc. | 490,036 | 24,820 |
| * | Tutor Perini Corp. | 884,517 | 24,766 |
| | EVERTEC Inc. | 1,390,599 | 24,683 |
| * | Team Inc. | 628,519 | 24,669 |
| | Harsco Corp. | 1,805,273 | 24,552 |
| * | Meritor Inc. | 1,946,802 | 24,179 |
| * | TriMas Corp. | 1,026,954 | 24,133 |
| | CIRCOR International Inc. | 370,083 | 24,011 |
| | AAR Corp. | 725,016 | 23,962 |
17
| | | |
| Vanguard® Small-Cap Index Fund | | |
| Schedule of Investments | | |
| December 31, 2016 | | |
| |
| | | | Market |
| | | | Value |
| | | Shares | ($000) |
| | ManTech International Corp. Class A | 565,804 | 23,905 |
| * | TriNet Group Inc. | 922,222 | 23,627 |
| * | TrueBlue Inc. | 956,250 | 23,572 |
| | Badger Meter Inc. | 624,615 | 23,080 |
| ^ | Sturm Ruger & Co. Inc. | 424,934 | 22,394 |
| * | Wabash National Corp. | 1,385,418 | 21,917 |
| | Primoris Services Corp. | 937,062 | 21,346 |
| | MTS Systems Corp. | 376,057 | 21,322 |
| * | Continental Building Products Inc. | 909,859 | 21,018 |
| | Heartland Express Inc. | 1,028,593 | 20,942 |
| | Sun Hydraulics Corp. | 516,327 | 20,638 |
| | Raven Industries Inc. | 815,660 | 20,555 |
| | Altra Industrial Motion Corp. | 553,985 | 20,442 |
| * | Integer Holdings Corp. | 693,791 | 20,432 |
| * | SPX Corp. | 846,982 | 20,090 |
| | General Cable Corp. | 1,052,151 | 20,043 |
| | McGrath RentCorp | 507,353 | 19,883 |
| | Griffon Corp. | 754,365 | 19,764 |
| * | Boise Cascade Co. | 870,223 | 19,580 |
| | Encore Wire Corp. | 445,075 | 19,294 |
| * | Wesco Aircraft Holdings Inc. | 1,225,778 | 18,325 |
| * | Air Transport Services Group Inc. | 1,146,870 | 18,304 |
| * | PHH Corp. | 1,202,441 | 18,229 |
| * | Babcock & Wilcox Enterprises Inc. | 1,087,204 | 18,037 |
| | Materion Corp. | 449,722 | 17,809 |
| | Quad/Graphics Inc. | 660,033 | 17,742 |
| | Essendant Inc. | 838,483 | 17,524 |
| | LSC Communications Inc. | 589,005 | 17,482 |
| * | Paylocity Holding Corp. | 573,315 | 17,205 |
| * | Aegion Corp. Class A | 720,484 | 17,075 |
| | Lindsay Corp. | 226,117 | 16,871 |
| * | Manitowoc Co. Inc. | 2,789,079 | 16,679 |
| | H&E Equipment Services Inc. | 716,485 | 16,658 |
| | Advanced Drainage Systems Inc. | 798,425 | 16,448 |
| | Quanex Building Products Corp. | 769,718 | 15,625 |
| | Kelly Services Inc. Class A | 664,715 | 15,235 |
| | Resources Connection Inc. | 778,106 | 14,979 |
| | AVX Corp. | 944,279 | 14,759 |
| | Schnitzer Steel Industries Inc. | 569,100 | 14,626 |
| | Triton International Ltd. | 913,583 | 14,435 |
| | ArcBest Corp. | 520,072 | 14,380 |
| * | TASER International Inc. | 582,099 | 14,110 |
| * | Thermon Group Holdings Inc. | 728,822 | 13,913 |
| *,^ | Inovalon Holdings Inc. Class A | 1,337,965 | 13,781 |
| * | FARO Technologies Inc. | 374,751 | 13,491 |
| * | Donnelley Financial Solutions Inc. | 583,488 | 13,409 |
| * | Aerovironment Inc. | 474,594 | 12,733 |
| | Kforce Inc. | 545,056 | 12,591 |
| * | GMS Inc. | 411,141 | 12,038 |
| | Gorman-Rupp Co. | 382,191 | 11,829 |
| * | TimkenSteel Corp. | 744,040 | 11,518 |
| * | RPX Corp. | 1,056,446 | 11,410 |
| * | Milacron Holdings Corp. | 607,773 | 11,323 |
| | Hyster-Yale Materials Handling Inc. | 168,694 | 10,758 |
| * | Armstrong Flooring Inc. | 532,990 | 10,612 |
| * | Evolent Health Inc. Class A | 704,348 | 10,424 |
| * | Cotiviti Holdings Inc. | 302,202 | 10,396 |
| * | InnerWorkings Inc. | 1,052,898 | 10,371 |
| * | Builders FirstSource Inc. | 941,797 | 10,332 |
| * | Mistras Group Inc. | 391,037 | 10,042 |
| * | Atkore International Group Inc. | 419,559 | 10,032 |
| * | Multi Packaging Solutions International Ltd. | 697,867 | 9,952 |
| | Greif Inc. Class B | 146,152 | 9,873 |
| | Landauer Inc. | 203,687 | 9,797 |
18
| | | |
| Vanguard® Small-Cap Index Fund | | |
| Schedule of Investments | | |
| December 31, 2016 | | |
| |
| | | | Market |
| | | | Value |
| | | Shares | ($000) |
| | TeleTech Holdings Inc. | 318,724 | 9,721 |
| * | Forterra Inc. | 427,750 | 9,265 |
| | Park Electrochemical Corp. | 433,807 | 8,090 |
| * | Bazaarvoice Inc. | 1,659,896 | 8,050 |
| * | Advanced Disposal Services Inc. | 357,769 | 7,950 |
| | American Railcar Industries Inc. | 174,649 | 7,910 |
| * | Ply Gem Holdings Inc. | 462,925 | 7,523 |
| * | Roadrunner Transportation Systems Inc. | 697,056 | 7,242 |
| * | DHI Group Inc. | 1,068,466 | 6,678 |
| * | Astronics Corp. | 161,780 | 5,475 |
| * | International Seaways Inc. | 222,912 | 3,130 |
| * | Overseas Shipholding Group Inc. Class A | 665,719 | 2,550 |
| * | Astronics Corp. Class B | 56,563 | 1,906 |
| | Textainer Group Holdings Ltd. | 72,502 | 540 |
| | | | 13,700,751 |
| Oil & Gas (5.4%) | | |
| | Targa Resources Corp. | 3,836,161 | 215,094 |
| * | Diamondback Energy Inc. | 1,977,746 | 199,871 |
| * | Newfield Exploration Co. | 4,441,237 | 179,870 |
| *,^ | Chesapeake Energy Corp. | 19,816,394 | 139,111 |
| * | Parsley Energy Inc. Class A | 3,609,407 | 127,196 |
| *,^ | Transocean Ltd. | 8,161,762 | 120,304 |
| * | Southwestern Energy Co. | 11,063,995 | 119,712 |
| * | WPX Energy Inc. | 7,692,209 | 112,075 |
| * | RSP Permian Inc. | 2,267,757 | 101,187 |
| | Nabors Industries Ltd. | 6,012,795 | 98,610 |
| * | QEP Resources Inc. | 5,349,530 | 98,485 |
| * | PDC Energy Inc. | 1,256,431 | 91,192 |
| | Patterson-UTI Energy Inc. | 3,142,010 | 84,583 |
| * | Oasis Petroleum Inc. | 5,278,267 | 79,913 |
| * | Rice Energy Inc. | 3,619,273 | 77,271 |
| *,^ | Whiting Petroleum Corp. | 6,349,709 | 76,324 |
| * | Gulfport Energy Corp. | 3,454,270 | 74,750 |
| | SM Energy Co. | 2,152,011 | 74,201 |
| * | Callon Petroleum Co. | 4,489,392 | 69,002 |
| | Western Refining Inc. | 1,815,899 | 68,732 |
| | PBF Energy Inc. Class A | 2,418,228 | 67,420 |
| | Ensco plc Class A | 6,767,393 | 65,779 |
| * | Energen Corp. | 1,083,865 | 62,506 |
| | Oceaneering International Inc. | 2,189,880 | 61,777 |
| | SemGroup Corp. Class A | 1,476,055 | 61,625 |
| | Superior Energy Services Inc. | 3,388,526 | 57,198 |
| | Murphy Oil Corp. | 1,826,497 | 56,859 |
| *,^ | First Solar Inc. | 1,740,329 | 55,847 |
| * | Weatherford International plc | 10,953,188 | 54,656 |
| * | Rowan Cos. plc Class A | 2,801,159 | 52,914 |
| * | Carrizo Oil & Gas Inc. | 1,381,652 | 51,605 |
| * | Matador Resources Co. | 1,999,153 | 51,498 |
| * | Dril-Quip Inc. | 839,210 | 50,395 |
| * | NOW Inc. | 2,280,049 | 46,673 |
| * | Laredo Petroleum Inc. | 3,241,427 | 45,834 |
| * | Oil States International Inc. | 1,147,285 | 44,744 |
| * | MRC Global Inc. | 2,021,772 | 40,961 |
| * | McDermott International Inc. | 5,394,723 | 39,867 |
| * | Denbury Resources Inc. | 8,897,225 | 32,742 |
| * | Forum Energy Technologies Inc. | 1,487,891 | 32,734 |
| | Noble Corp. plc | 5,431,918 | 32,157 |
| * | Unit Corp. | 1,156,444 | 31,074 |
| *,^ | Centennial Resource Development Inc. Class A | 1,532,549 | 30,222 |
| | Delek US Holdings Inc. | 1,246,726 | 30,009 |
| | Pattern Energy Group Inc. Class A | 1,559,541 | 29,616 |
| * | SEACOR Holdings Inc. | 351,560 | 25,059 |
| * | Chart Industries Inc. | 688,434 | 24,797 |
| *,^ | Diamond Offshore Drilling Inc. | 1,378,367 | 24,397 |
19
| | | |
| Vanguard® Small-Cap Index Fund | | |
| Schedule of Investments | | |
| December 31, 2016 | | |
| |
| | | | Market |
| | | | Value |
| | | Shares | ($000) |
| ^ | RPC Inc. | 1,214,346 | 24,056 |
| * | Helix Energy Solutions Group Inc. | 2,422,794 | 21,369 |
| | Archrock Inc. | 1,490,647 | 19,677 |
| ^ | Atwood Oceanics Inc. | 1,374,773 | 18,051 |
| * | Exterran Corp. | 710,702 | 16,986 |
| *,^ | Extraction Oil & Gas Inc. | 818,409 | 16,401 |
| * | Newpark Resources Inc. | 1,802,997 | 13,522 |
| * | TETRA Technologies Inc. | 2,375,285 | 11,924 |
| *,^ | Clayton Williams Energy Inc. | 97,684 | 11,650 |
| *,^ | Flotek Industries Inc. | 1,213,819 | 11,398 |
| | Green Plains Inc. | 409,027 | 11,391 |
| | Bristow Group Inc. | 509,371 | 10,432 |
| | CVR Energy Inc. | 387,788 | 9,846 |
| * | Cobalt International Energy Inc. | 7,948,157 | 9,697 |
| | Alon USA Energy Inc. | 726,161 | 8,264 |
| *,^ | SunPower Corp. Class A | 1,246,811 | 8,241 |
| * | Tesco Corp. | 994,494 | 8,205 |
| *,^ | Sanchez Energy Corp. | 635,818 | 5,741 |
| *,^ | EP Energy Corp. Class A | 861,955 | 5,646 |
| * | Bill Barrett Corp. | 790,041 | 5,522 |
| * | CARBO Ceramics Inc. | 255,471 | 2,672 |
| * | Eclipse Resources Corp. | 881,409 | 2,353 |
| | | | 3,721,492 |
| Other (0.0%)2 | | |
| * | Dyax Corp. CVR Exp. 12/31/2019 | 2,940,655 | 3,264 |
| * | Leap Wireless International Inc. CVR | 938,827 | 2,366 |
| * | Clinical Data CVR | 297,875 | — |
| | | | 5,630 |
| Technology (11.6%) | | |
| * | Advanced Micro Devices Inc. | 17,593,301 | 199,508 |
| | CDW Corp. | 3,587,049 | 186,849 |
| | Leidos Holdings Inc. | 3,357,772 | 171,716 |
| * | Cadence Design Systems Inc. | 6,402,669 | 161,475 |
| * | CommScope Holding Co. Inc. | 4,306,966 | 160,219 |
| * | Microsemi Corp. | 2,560,185 | 138,173 |
| * | ARRIS International plc | 4,235,786 | 127,624 |
| * | PTC Inc. | 2,581,540 | 119,448 |
| * | ON Semiconductor Corp. | 9,311,257 | 118,812 |
| | CSRA Inc. | 3,649,475 | 116,199 |
| | Teradyne Inc. | 4,493,528 | 114,136 |
| * | NCR Corp. | 2,771,286 | 112,403 |
| | Brocade Communications Systems Inc. | 8,984,278 | 112,214 |
| * | Ultimate Software Group Inc. | 615,157 | 112,174 |
| | SS&C Technologies Holdings Inc. | 3,849,663 | 110,100 |
| * | IAC/InterActiveCorp | 1,641,252 | 106,337 |
| * | Tyler Technologies Inc. | 736,081 | 105,090 |
| * | Fortinet Inc. | 3,284,504 | 98,929 |
| * | Aspen Technology Inc. | 1,724,566 | 94,299 |
| | Computer Sciences Corp. | 1,572,242 | 93,423 |
| * | athenahealth Inc. | 881,151 | 92,671 |
| * | Arista Networks Inc. | 940,687 | 91,030 |
| | Mentor Graphics Corp. | 2,415,186 | 89,096 |
| * | Cavium Inc. | 1,421,396 | 88,752 |
| * | Veeva Systems Inc. Class A | 2,146,968 | 87,382 |
| * | Manhattan Associates Inc. | 1,589,687 | 84,301 |
| | j2 Global Inc. | 1,019,441 | 83,390 |
| | Fair Isaac Corp. | 690,932 | 82,373 |
| * | Guidewire Software Inc. | 1,641,420 | 80,971 |
| | SYNNEX Corp. | 666,150 | 80,617 |
| * | Cirrus Logic Inc. | 1,422,668 | 80,438 |
| * | Teradata Corp. | 2,900,762 | 78,814 |
| * | ViaSat Inc. | 1,187,626 | 78,645 |
| | Cypress Semiconductor Corp. | 6,845,540 | 78,313 |
| | DST Systems Inc. | 714,217 | 76,528 |
20
| | | |
| Vanguard® Small-Cap Index Fund | | |
| Schedule of Investments | | |
| December 31, 2016 | | |
| |
| | | | Market |
| | | | Value |
| | | Shares | ($000) |
| * | Ciena Corp. | 3,111,590 | 75,954 |
| * | Finisar Corp. | 2,461,724 | 74,516 |
| | MKS Instruments Inc. | 1,196,732 | 71,086 |
| | InterDigital Inc. | 766,322 | 70,004 |
| * | EPAM Systems Inc. | 1,084,152 | 69,722 |
| | Intersil Corp. Class A | 3,056,686 | 68,164 |
| | Blackbaud Inc. | 1,062,549 | 68,003 |
| * | CACI International Inc. Class A | 544,932 | 67,735 |
| * | Integrated Device Technology Inc. | 2,847,853 | 67,095 |
| | Monolithic Power Systems Inc. | 818,825 | 67,086 |
| | Science Applications International Corp. | 789,943 | 66,987 |
| * | Tech Data Corp. | 787,147 | 66,656 |
| * | Proofpoint Inc. | 901,375 | 63,682 |
| | Pitney Bowes Inc. | 4,152,460 | 63,076 |
| * | NetScout Systems Inc. | 1,942,605 | 61,192 |
| * | Medidata Solutions Inc. | 1,222,620 | 60,728 |
| * | Ellie Mae Inc. | 711,988 | 59,579 |
| *,^ | Cree Inc. | 2,226,421 | 58,755 |
| * | Silicon Laboratories Inc. | 885,620 | 57,565 |
| * | Entegris Inc. | 3,159,159 | 56,549 |
| * | Tableau Software Inc. Class A | 1,289,652 | 54,359 |
| * | Dycom Industries Inc. | 667,544 | 53,597 |
| * | TiVo Corp. | 2,536,531 | 53,014 |
| | LogMeIn Inc. | 540,625 | 52,197 |
| * | Verint Systems Inc. | 1,409,933 | 49,700 |
| * | Advanced Energy Industries Inc. | 886,280 | 48,524 |
| * | Square Inc. | 3,527,983 | 48,086 |
| * | Tessera Holding Corp. | 1,084,915 | 47,953 |
| * | Nuance Communications Inc. | 3,213,466 | 47,881 |
| * | Cornerstone OnDemand Inc. | 1,129,225 | 47,778 |
| * | ACI Worldwide Inc. | 2,619,300 | 47,540 |
| * | CommVault Systems Inc. | 912,660 | 46,911 |
| * | Lumentum Holdings Inc. | 1,209,295 | 46,739 |
| * | Semtech Corp. | 1,468,281 | 46,324 |
| * | Electronics For Imaging Inc. | 1,044,328 | 45,804 |
| *,^ | Paycom Software Inc. | 1,006,660 | 45,793 |
| * | VeriFone Systems Inc. | 2,478,065 | 43,936 |
| * | Allscripts Healthcare Solutions Inc. | 4,133,518 | 42,203 |
| | Power Integrations Inc. | 620,300 | 42,087 |
| * | Viavi Solutions Inc. | 5,139,266 | 42,039 |
| * | Synaptics Inc. | 779,464 | 41,764 |
| * | MicroStrategy Inc. Class A | 209,831 | 41,421 |
| | Plantronics Inc. | 749,553 | 41,046 |
| * | FireEye Inc. | 3,438,710 | 40,921 |
| * | Zendesk Inc. | 1,916,008 | 40,619 |
| * | GoDaddy Inc. Class A | 1,132,279 | 39,573 |
| * | NETGEAR Inc. | 701,750 | 38,140 |
| | Diebold Nixdorf Inc. | 1,510,234 | 37,982 |
| | Cogent Communications Holdings Inc. | 914,175 | 37,801 |
| * | RealPage Inc. | 1,257,920 | 37,738 |
| * | EchoStar Corp. Class A | 731,307 | 37,582 |
| * | Inphi Corp. | 829,665 | 37,020 |
| * | Synchronoss Technologies Inc. | 912,268 | 34,940 |
| * | Rambus Inc. | 2,482,867 | 34,189 |
| * | HubSpot Inc. | 715,590 | 33,633 |
| | NIC Inc. | 1,399,737 | 33,454 |
| | Progress Software Corp. | 1,039,698 | 33,198 |
| * | Gigamon Inc. | 727,997 | 33,160 |
| | CSG Systems International Inc. | 684,734 | 33,141 |
| | Cabot Microelectronics Corp. | 523,624 | 33,077 |
| * | Insight Enterprises Inc. | 800,222 | 32,361 |
| * | Envestnet Inc. | 915,852 | 32,284 |
| *,^ | Ubiquiti Networks Inc. | 551,091 | 31,853 |
| *,^ | 3D Systems Corp. | 2,383,801 | 31,681 |
21
| | | |
| Vanguard® Small-Cap Index Fund | | |
| Schedule of Investments | | |
| December 31, 2016 | | |
| |
| | | | Market |
| | | | Value |
| | | Shares | ($000) |
| ^ | Ebix Inc. | 510,772 | 29,140 |
| *,^ | 2U Inc. | 945,821 | 28,517 |
| | Pegasystems Inc. | 771,800 | 27,785 |
| | West Corp. | 1,121,456 | 27,767 |
| * | BroadSoft Inc. | 673,105 | 27,766 |
| * | Infinera Corp. | 3,228,444 | 27,410 |
| * | Ixia | 1,650,340 | 26,571 |
| * | Mercury Systems Inc. | 870,683 | 26,312 |
| * | RingCentral Inc. Class A | 1,221,425 | 25,161 |
| | Brooks Automation Inc. | 1,464,386 | 24,997 |
| | ADTRAN Inc. | 1,088,570 | 24,330 |
| * | InvenSense Inc. | 1,888,621 | 24,155 |
| * | Super Micro Computer Inc. | 857,118 | 24,042 |
| * | Web.com Group Inc. | 1,084,242 | 22,932 |
| * | ScanSource Inc. | 561,577 | 22,660 |
| * | Bottomline Technologies de Inc. | 859,802 | 21,512 |
| * | New Relic Inc. | 756,535 | 21,372 |
| * | Diodes Inc. | 823,421 | 21,137 |
| * | Shutterstock Inc. | 431,678 | 20,513 |
| * | Amkor Technology Inc. | 1,857,732 | 19,599 |
| * | Cray Inc. | 914,956 | 18,940 |
| * | Lattice Semiconductor Corp. | 2,570,199 | 18,917 |
| | Monotype Imaging Holdings Inc. | 926,803 | 18,397 |
| *,^ | Acacia Communications Inc. | 292,413 | 18,057 |
| * | FormFactor Inc. | 1,589,374 | 17,801 |
| *,^ | Unisys Corp. | 1,122,338 | 16,779 |
| *,^ | Match Group Inc. | 947,494 | 16,202 |
| * | CEVA Inc. | 473,168 | 15,875 |
| * | Quality Systems Inc. | 1,182,616 | 15,551 |
| *,^ | Twilio Inc. Class A | 537,829 | 15,516 |
| * | Barracuda Networks Inc. | 703,385 | 15,074 |
| | Syntel Inc. | 753,881 | 14,919 |
| * | Intralinks Holdings Inc. | 1,097,866 | 14,843 |
| *,^ | Pure Storage Inc. Class A | 1,290,032 | 14,590 |
| * | Applied Micro Circuits Corp. | 1,740,020 | 14,355 |
| * | Ultratech Inc. | 576,237 | 13,818 |
| * | Endurance International Group Holdings Inc. | 1,436,021 | 13,355 |
| * | Box Inc. | 901,384 | 12,493 |
| * | Blucora Inc. | 843,753 | 12,445 |
| * | Loral Space & Communications Inc. | 290,148 | 11,911 |
| *,^ | Gogo Inc. | 1,252,249 | 11,546 |
| * | Nimble Storage Inc. | 1,433,732 | 11,355 |
| * | Actua Corp. | 797,680 | 11,168 |
| *,^ | Nutanix Inc. | 381,397 | 10,130 |
| * | Benefitfocus Inc. | 334,795 | 9,943 |
| * | CommerceHub Inc. | 640,229 | 9,623 |
| | Forrester Research Inc. | 223,523 | 9,600 |
| * | LivePerson Inc. | 1,181,299 | 8,919 |
| * | Virtusa Corp. | 303,278 | 7,618 |
| * | Calix Inc. | 944,328 | 7,271 |
| ^ | Computer Programs & Systems Inc. | 285,747 | 6,744 |
| * | Sonus Networks Inc. | 1,057,912 | 6,665 |
| *,^ | Hortonworks Inc. | 798,715 | 6,637 |
| * | Jive Software Inc. | 1,402,328 | 6,100 |
| * | Tangoe Inc. | 763,098 | 6,013 |
| * | Rapid7 Inc. | 377,542 | 4,595 |
| * | CommerceHub Inc. Class A | 303,703 | 4,559 |
| * | Harmonic Inc. | 866,212 | 4,331 |
| * | Blackline Inc. | 154,948 | 4,281 |
| * | Coupa Software Inc. | 160,938 | 4,025 |
| * | ChannelAdvisor Corp. | 261,164 | 3,748 |
| * | Castlight Health Inc. Class B | 632,841 | 3,133 |
| | Comtech Telecommunications Corp. | 249,860 | 2,961 |
| | Systemax Inc. | 298,650 | 2,619 |
22
| | | |
| Vanguard® Small-Cap Index Fund | | |
| Schedule of Investments | | |
| December 31, 2016 | | |
| |
| | | | Market |
| | | | Value |
| | | Shares | ($000) |
| * | SecureWorks Corp. Class A | 186,425 | 1,974 |
| * | MobileIron Inc. | 446,779 | 1,675 |
| * | Piksel Inc. | 241 | — |
| | | | 7,918,375 |
| Telecommunications (0.4%) | | |
| | Telephone & Data Systems Inc. | 2,065,119 | 59,620 |
| | Frontier Communications Corp. | 13,097,506 | 44,270 |
| | Consolidated Communications Holdings Inc. | 1,079,074 | 28,973 |
| * | Vonage Holdings Corp. | 4,137,149 | 28,339 |
| | Cincinnati Bell Inc. | 949,214 | 21,215 |
| | ATN International Inc. | 237,437 | 19,026 |
| *,^ | Iridium Communications Inc. | 1,833,196 | 17,599 |
| | Windstream Holdings Inc. | 2,160,052 | 15,833 |
| *,^ | Globalstar Inc. | 9,567,596 | 15,117 |
| | Shenandoah Telecommunications Co. | 525,504 | 14,346 |
| | EarthLink Holdings Corp. | 2,377,570 | 13,410 |
| * | United States Cellular Corp. | 290,802 | 12,714 |
| *,^ | Intelsat SA | 408,040 | 1,089 |
| | | | 291,551 |
| Utilities (3.6%) | | |
| | Westar Energy Inc. Class A | 3,166,175 | 178,414 |
| | UGI Corp. | 3,866,213 | 178,155 |
| | Atmos Energy Corp. | 2,322,814 | 172,237 |
| | Great Plains Energy Inc. | 4,807,693 | 131,490 |
| | Aqua America Inc. | 3,960,584 | 118,976 |
| | National Fuel Gas Co. | 1,806,686 | 102,331 |
| | Vectren Corp. | 1,850,488 | 96,503 |
| | IDACORP Inc. | 1,125,822 | 90,685 |
| | WGL Holdings Inc. | 1,142,990 | 87,187 |
| | NRG Energy Inc. | 7,044,193 | 86,362 |
| | Portland General Electric Co. | 1,985,792 | 86,044 |
| | Hawaiian Electric Industries Inc. | 2,423,467 | 80,144 |
| | ONE Gas Inc. | 1,168,062 | 74,709 |
| | Southwest Gas Corp. | 955,333 | 73,198 |
| | Black Hills Corp. | 1,186,780 | 72,797 |
| | ALLETE Inc. | 1,104,467 | 70,896 |
| | New Jersey Resources Corp. | 1,922,389 | 68,245 |
| | Spire Inc. | 968,510 | 62,517 |
| | NorthWestern Corp. | 1,079,217 | 61,375 |
| | PNM Resources Inc. | 1,778,752 | 61,011 |
| | South Jersey Industries Inc. | 1,774,763 | 59,792 |
| | Avista Corp. | 1,435,827 | 57,419 |
| | MGE Energy Inc. | 774,162 | 50,553 |
| | Ormat Technologies Inc. | 886,678 | 47,544 |
| * | Calpine Corp. | 4,017,366 | 45,918 |
| | El Paso Electric Co. | 904,868 | 42,076 |
| | Northwest Natural Gas Co. | 635,120 | 37,980 |
| | American States Water Co. | 824,137 | 37,548 |
| | California Water Service Group | 1,071,170 | 36,313 |
| | Empire District Electric Co. | 993,709 | 33,875 |
| * | TerraForm Power Inc. Class A | 1,947,218 | 24,944 |
| * | Dynegy Inc. | 2,619,244 | 22,159 |
| *,^ | Sunrun Inc. | 1,622,396 | 8,615 |
| *,^ | Vivint Solar Inc. | 468,860 | 1,195 |
| |
| | | | 2,459,207 |
| Total Common Stocks (Cost $53,367,847) | | 69,169,155 |
23
| | | | | |
| Vanguard® Small-Cap Index Fund | | | | |
| Schedule of Investments | | | | |
| December 31, 2016 | | | | |
| |
| | | | | | Market |
| | | | | | Value |
| | | Coupon | | Shares | ($000) |
| Temporary Cash Investments (0.0%)1 | | | | |
| Money Market Fund (0.0%) | | | | |
| 3,4 | Vanguard Market Liquidity Fund | 0.823% | | 10,945,278 | 1,094,637 |
| |
| |
| | | | | Face | |
| | | | Maturity | Amount | |
| | | | Date | ($000) | |
| U.S. Government and Agency Obligations (0.0%) | | | | |
| | United States Treasury Bill | 0.290% | 1/5/17 | 500 | 500 |
| 5 | United States Treasury Bill | 0.487% | 3/16/17 | 1,300 | 1,299 |
| 5 | United States Treasury Bill | 0.564% | 5/4/17 | 11,000 | 10,979 |
| 5 | United States Treasury Bill | 0.652% | 5/18/17 | 2,000 | 1,995 |
| 5,6 | United States Treasury Bill | 0.608% | 5/25/17 | 3,000 | 2,993 |
| |
| | | | | | 17,766 |
| |
| Total Temporary Cash Investments (Cost $1,112,320) | | | | 1,112,403 |
| |
| Total Investments (101.2%) (Cost $54,480,167) | | | | 70,281,558 |
| Other Assets and Liabilities—Net (-1.2%)4,5 | | | | (839,929) |
| |
| Net Assets (100%) | | | | 69,441,629 |
* Non-income-producing security.
^ Includes partial security positions on loan to broker-dealers. The total value of securities on loan is $689,588,000.
1 The fund invests a portion of its cash reserves in equity markets through the use of index futures contracts and swap contracts. After giving
effect to futures and swap investments, the fund's effective common stock and temporary cash investment positions represent 100.1% and
1.1%, respectively, of net assets.
2 “Other” represents securities that are not classified by the fund’s benchmark index.
3 Affiliated money market fund available only to Vanguard funds and certain trusts and accounts managed by Vanguard. Rate shown is the 7-day
yield.
4 Includes $734,518,000 of collateral received for securities on loan.
5 Securities with a value of $15,290,000 and cash of $1,823,000 have been segregated as initial margin for recently closed futures contracts.
6 Securities with a value of 1,572,000 have been segregated as collateral for open over-the-counter swap contracts.
CVR—Contingent Value Rights.
REIT—Real Estate Investment Trust.
24
| | | |
| Vanguard® Small-Cap Growth Index Fund | | |
| Schedule of Investments | | |
| December 31, 2016 | | |
| |
| | | | Market |
| | | | Value |
| | | Shares | ($000) |
| |
| Common Stocks (99.8%)1 | | |
| Basic Materials (2.5%) | | |
| | US Silica Holdings Inc. | 990,591 | 56,147 |
| | Royal Gold Inc. | 812,407 | 51,466 |
| | NewMarket Corp. | 118,089 | 50,051 |
| | Balchem Corp. | 394,919 | 33,142 |
| * | Stillwater Mining Co. | 1,508,800 | 24,307 |
| | KapStone Paper and Packaging Corp. | 1,083,562 | 23,893 |
| * | Platform Specialty Products Corp. | 2,425,633 | 23,795 |
| * | Fairmount Santrol Holdings Inc. | 1,944,748 | 22,929 |
| * | Cambrex Corp. | 400,806 | 21,623 |
| * | Coeur Mining Inc. | 2,344,301 | 21,310 |
| * | Versum Materials Inc. | 675,282 | 18,955 |
| | Minerals Technologies Inc. | 217,997 | 16,840 |
| * | Ingevity Corp. | 261,781 | 14,361 |
| | Hecla Mining Co. | 2,459,211 | 12,886 |
| | Calgon Carbon Corp. | 628,336 | 10,682 |
| | Deltic Timber Corp. | 135,788 | 10,465 |
| * | Ferro Corp. | 523,015 | 7,495 |
| | American Vanguard Corp. | 331,036 | 6,339 |
| | | | 426,686 |
| Consumer Goods (7.7%) | | |
| * | Middleby Corp. | 715,816 | 92,204 |
| | Gentex Corp. | 3,564,128 | 70,178 |
| * | Post Holdings Inc. | 766,638 | 61,630 |
| | Brunswick Corp. | 1,115,654 | 60,848 |
| * | Toll Brothers Inc. | 1,835,908 | 56,913 |
| * | Take-Two Interactive Software Inc. | 1,076,627 | 53,067 |
| | Pool Corp. | 488,499 | 50,970 |
| * | TreeHouse Foods Inc. | 705,671 | 50,942 |
| | Carter's Inc. | 583,319 | 50,393 |
| * | Hain Celestial Group Inc. | 1,286,725 | 50,221 |
| *,^ | Tempur Sealy International Inc. | 612,837 | 41,845 |
| * | Skechers U.S.A. Inc. Class A | 1,660,162 | 40,807 |
| | B&G Foods Inc. | 826,669 | 36,208 |
| * | Manitowoc Foodservice Inc. | 1,722,528 | 33,296 |
| | Drew Industries Inc. | 291,222 | 31,379 |
| * | Dorman Products Inc. | 408,895 | 29,874 |
| * | Kate Spade & Co. | 1,596,958 | 29,815 |
| | CalAtlantic Group Inc. | 867,045 | 29,488 |
| | Vector Group Ltd. | 1,192,939 | 27,127 |
| * | Blue Buffalo Pet Products Inc. | 1,101,459 | 26,479 |
| | J&J Snack Foods Corp. | 185,877 | 24,802 |
| * | Steven Madden Ltd. | 679,204 | 24,282 |
| * | Zynga Inc. Class A | 9,173,905 | 23,577 |
| * | TRI Pointe Group Inc. | 1,796,008 | 20,618 |
| | WD-40 Co. | 167,931 | 19,631 |
| * | iRobot Corp. | 321,495 | 18,791 |
| *,^ | Boston Beer Co. Inc. Class A | 108,499 | 18,429 |
| | Lancaster Colony Corp. | 119,507 | 16,897 |
| * | Meritage Homes Corp. | 472,584 | 16,446 |
| * | Gentherm Inc. | 453,917 | 15,365 |
| *,^ | Wayfair Inc. | 431,742 | 15,133 |
| | Interface Inc. Class A | 806,735 | 14,965 |
| *,^ | Fitbit Inc. Class A | 1,800,654 | 13,181 |
| | MDC Holdings Inc. | 511,149 | 13,116 |
| * | Select Comfort Corp. | 561,033 | 12,691 |
| | Oxford Industries Inc. | 187,237 | 11,259 |
| * | Deckers Outdoor Corp. | 199,119 | 11,029 |
| | Coca-Cola Bottling Co. Consolidated | 57,608 | 10,303 |
| | Columbia Sportswear Co. | 173,167 | 10,096 |
| *,^ | GoPro Inc. Class A | 1,042,638 | 9,081 |
| * | USANA Health Sciences Inc. | 137,312 | 8,403 |
25
| | | |
| Vanguard® Small-Cap Growth Index Fund | | |
| Schedule of Investments | | |
| December 31, 2016 | | |
| |
| | | | Market |
| | | | Value |
| | | Shares | ($000) |
| ^ | National Beverage Corp. | 145,798 | 7,447 |
| | AdvancePierre Foods Holdings Inc. | 239,845 | 7,143 |
| * | G-III Apparel Group Ltd. | 241,388 | 7,135 |
| * | Acushnet Holdings Corp. | 275,829 | 5,437 |
| * | elf Beauty Inc. | 140,351 | 4,062 |
| * | Revlon Inc. Class A | 132,740 | 3,869 |
| | Phibro Animal Health Corp. Class A | 116,702 | 3,419 |
| *,^ | Amplify Snack Brands Inc. | 376,082 | 3,313 |
| * | Tesla Motors Inc. | 55 | 12 |
| | | | 1,293,616 |
| Consumer Services (14.3%) | | |
| | Domino's Pizza Inc. | 598,103 | 95,242 |
| * | Burlington Stores Inc. | 878,184 | 74,426 |
| | Vail Resorts Inc. | 451,394 | 72,814 |
| * | Copart Inc. | 1,210,822 | 67,092 |
| * | VCA Inc. | 958,856 | 65,825 |
| | Sabre Corp. | 2,440,107 | 60,881 |
| | Dunkin' Brands Group Inc. | 1,141,067 | 59,838 |
| | Casey's General Stores Inc. | 487,288 | 57,929 |
| * | Panera Bread Co. Class A | 271,585 | 55,699 |
| | Dick's Sporting Goods Inc. | 1,039,058 | 55,174 |
| | Six Flags Entertainment Corp. | 916,086 | 54,929 |
| * | Sally Beauty Holdings Inc. | 1,792,469 | 47,357 |
| | Jack in the Box Inc. | 402,693 | 44,957 |
| * | Live Nation Entertainment Inc. | 1,647,486 | 43,823 |
| * | Madison Square Garden Co. Class A | 242,045 | 41,513 |
| | Rollins Inc. | 1,220,667 | 41,234 |
| * | GrubHub Inc. | 1,065,736 | 40,093 |
| * | Cabela's Inc. | 682,194 | 39,942 |
| * | Bright Horizons Family Solutions Inc. | 554,992 | 38,861 |
| * | AMC Networks Inc. Class A | 733,905 | 38,413 |
| | Texas Roadhouse Inc. Class A | 790,343 | 38,126 |
| * | Hawaiian Holdings Inc. | 631,960 | 36,022 |
| * | Pandora Media Inc. | 2,760,025 | 35,991 |
| * | Buffalo Wild Wings Inc. | 226,675 | 34,999 |
| * | Grand Canyon Education Inc. | 589,767 | 34,472 |
| * | Yelp Inc. Class A | 879,270 | 33,527 |
| * | Lions Gate Entertainment Corp. Class B | 1,306,924 | 32,072 |
| * | Sprouts Farmers Market Inc. | 1,683,560 | 31,853 |
| | Cheesecake Factory Inc. | 531,529 | 31,828 |
| * | ServiceMaster Global Holdings Inc. | 838,997 | 31,605 |
| * | Dave & Buster's Entertainment Inc. | 523,959 | 29,499 |
| | Papa John's International Inc. | 344,560 | 29,487 |
| * | Michaels Cos. Inc. | 1,388,993 | 28,405 |
| | Allegiant Travel Co. Class A | 164,827 | 27,427 |
| * | Five Below Inc. | 683,493 | 27,312 |
| * | Urban Outfitters Inc. | 940,879 | 26,796 |
| * | Liberty Expedia Holdings Inc. Class A | 673,124 | 26,703 |
| * | Media General Inc. | 1,368,134 | 25,762 |
| | PriceSmart Inc. | 302,601 | 25,267 |
| * | Spirit Airlines Inc. | 431,923 | 24,991 |
| | Churchill Downs Inc. | 165,540 | 24,906 |
| | Choice Hotels International Inc. | 419,445 | 23,510 |
| | Nexstar Broadcasting Group Inc. Class A | 363,598 | 23,016 |
| *,^ | WebMD Health Corp. | 451,921 | 22,402 |
| * | Sotheby's | 561,148 | 22,367 |
| *,^ | Stamps.com Inc. | 191,272 | 21,929 |
| | Monro Muffler Brake Inc. | 382,543 | 21,881 |
| | Marriott Vacations Worldwide Corp. | 252,425 | 21,418 |
| * | Shutterfly Inc. | 402,182 | 20,181 |
| * | Groupon Inc. Class A | 5,343,651 | 17,741 |
| | Red Rock Resorts Inc. Class A | 759,209 | 17,606 |
| * | Liberty Media Corp-Liberty Media | 553,553 | 17,343 |
| *,^ | Ollie's Bargain Outlet Holdings Inc. | 600,675 | 17,089 |
26
| | | |
| Vanguard® Small-Cap Growth Index Fund | | |
| Schedule of Investments | | |
| December 31, 2016 | | |
| |
| | | | Market |
| | | | Value |
| | | Shares | ($000) |
| * | comScore Inc. | 529,129 | 16,710 |
| * | Lions Gate Entertainment Corp. Class A | 602,160 | 16,198 |
| | Morningstar Inc. | 213,997 | 15,742 |
| * | Popeyes Louisiana Kitchen Inc. | 257,584 | 15,579 |
| *,^ | RH | 483,194 | 14,834 |
| * | Etsy Inc. | 1,220,858 | 14,382 |
| * | Belmond Ltd. Class A | 1,074,647 | 14,347 |
| * | Ascena Retail Group Inc. | 2,310,722 | 14,303 |
| | Sonic Corp. | 482,723 | 12,797 |
| | ILG Inc. | 704,288 | 12,797 |
| * | Liberty TripAdvisor Holdings Inc. Class A | 849,147 | 12,780 |
| | Planet Fitness Inc. Class A | 603,948 | 12,139 |
| | AMC Entertainment Holdings Inc. | 360,370 | 12,126 |
| | National CineMedia Inc. | 774,400 | 11,407 |
| | ClubCorp Holdings Inc. | 772,879 | 11,091 |
| | Wingstop Inc. | 356,690 | 10,554 |
| * | Hibbett Sports Inc. | 272,797 | 10,175 |
| * | BJ's Restaurants Inc. | 245,322 | 9,641 |
| * | Pinnacle Entertainment Inc. | 656,106 | 9,514 |
| * | Caesars Acquisition Co. Class A | 686,436 | 9,267 |
| * | Scientific Games Corp. Class A | 652,012 | 9,128 |
| * | Fiesta Restaurant Group Inc. | 300,304 | 8,964 |
| * | Shake Shack Inc. Class A | 247,508 | 8,858 |
| * | Quotient Technology Inc. | 819,278 | 8,807 |
| * | Liberty Media Corp-Liberty Media Class A | 272,096 | 8,530 |
| * | SiteOne Landscape Supply Inc. | 245,303 | 8,519 |
| * | Francesca's Holdings Corp. | 470,550 | 8,484 |
| * | Tile Shop Holdings Inc. | 421,247 | 8,235 |
| *,^ | TrueCar Inc. | 643,326 | 8,042 |
| ^ | World Wrestling Entertainment Inc. Class A | 429,538 | 7,904 |
| * | Diplomat Pharmacy Inc. | 542,596 | 6,837 |
| * | EW Scripps Co. Class A | 352,231 | 6,809 |
| * | Penn National Gaming Inc. | 466,564 | 6,434 |
| | Blue Nile Inc. | 131,546 | 5,345 |
| *,^ | Lumber Liquidators Holdings Inc. | 323,017 | 5,084 |
| | New Media Investment Group Inc. | 312,379 | 4,995 |
| * | Global Eagle Entertainment Inc. | 646,311 | 4,175 |
| * | Potbelly Corp. | 318,148 | 4,104 |
| * | Clean Energy Fuels Corp. | 1,429,433 | 4,088 |
| * | Angie's List Inc. | 486,415 | 4,003 |
| * | Habit Restaurants Inc. Class A | 227,835 | 3,930 |
| * | Bojangles' Inc. | 207,610 | 3,872 |
| *,^ | El Pollo Loco Holdings Inc. | 266,740 | 3,281 |
| *,^ | Caesars Entertainment Corp. | 371,063 | 3,154 |
| * | Biglari Holdings Inc. | 5,768 | 2,729 |
| *,^ | Party City Holdco Inc. | 185,435 | 2,633 |
| * | Trade Desk Inc. Class A | 66,576 | 1,842 |
| | | | 2,394,744 |
| Financials (22.2%) | | |
| * | SVB Financial Group | 647,935 | 111,225 |
| * | Signature Bank | 645,424 | 96,943 |
| | Regency Centers Corp. | 1,299,953 | 89,632 |
| | Kilroy Realty Corp. | 1,147,806 | 84,042 |
| | American Campus Communities Inc. | 1,643,335 | 81,789 |
| | WP Carey Inc. | 1,322,139 | 78,125 |
| | Bank of the Ozarks Inc. | 1,431,695 | 75,293 |
| | CBOE Holdings Inc. | 1,011,182 | 74,716 |
| | Gaming and Leisure Properties Inc. | 2,413,887 | 73,913 |
| | Lamar Advertising Co. Class A | 1,028,933 | 69,185 |
| | Equity LifeStyle Properties Inc. | 955,021 | 68,857 |
| | Douglas Emmett Inc. | 1,790,492 | 65,460 |
| | Spirit Realty Capital Inc. | 6,015,371 | 65,327 |
| | MarketAxess Holdings Inc. | 444,045 | 65,239 |
| | Sun Communities Inc. | 817,554 | 62,633 |
27
| | | |
| Vanguard® Small-Cap Growth Index Fund | | |
| Schedule of Investments | | |
| December 31, 2016 | | |
| |
| | | | Market |
| | | | Value |
| | | Shares | ($000) |
| | CubeSmart | 2,239,495 | 59,951 |
| | DDR Corp. | 3,872,625 | 59,135 |
| * | Western Alliance Bancorp | 1,176,270 | 57,296 |
| | American Homes 4 Rent Class A | 2,662,108 | 55,851 |
| | DCT Industrial Trust Inc. | 1,132,216 | 54,210 |
| | Hudson Pacific Properties Inc. | 1,534,148 | 53,358 |
| | Healthcare Trust of America Inc. Class A | 1,762,913 | 51,318 |
| | Investors Bancorp Inc. | 3,661,016 | 51,071 |
| * | Howard Hughes Corp. | 446,675 | 50,966 |
| | Life Storage Inc. | 577,069 | 49,201 |
| | Medical Properties Trust Inc. | 3,983,387 | 48,996 |
| | Gramercy Property Trust | 5,263,951 | 48,323 |
| | STORE Capital Corp. | 1,938,991 | 47,912 |
| * | Texas Capital Bancshares Inc. | 609,591 | 47,792 |
| | Communications Sales & Leasing Inc. | 1,840,902 | 46,777 |
| *,^ | Zillow Group Inc. | 1,278,820 | 46,639 |
| | CyrusOne Inc. | 988,055 | 44,196 |
| | Healthcare Realty Trust Inc. | 1,441,252 | 43,699 |
| | Tanger Factory Outlet Centers Inc. | 1,194,809 | 42,750 |
| | Home BancShares Inc. | 1,487,122 | 41,297 |
| | PacWest Bancorp | 748,863 | 40,768 |
| | Education Realty Trust Inc. | 910,878 | 38,530 |
| | Omega Healthcare Investors Inc. | 1,214,854 | 37,976 |
| | Cousins Properties Inc. | 4,412,845 | 37,553 |
| * | Liberty Ventures Class A | 1,010,316 | 37,250 |
| | Equity One Inc. | 1,174,656 | 36,050 |
| | Paramount Group Inc. | 2,202,841 | 35,223 |
| | Urban Edge Properties | 1,242,552 | 34,183 |
| | Ryman Hospitality Properties Inc. | 540,167 | 34,036 |
| | CoreSite Realty Corp. | 422,067 | 33,499 |
| | NorthStar Asset Management Group Inc. | 2,233,882 | 33,330 |
| | Acadia Realty Trust | 1,005,576 | 32,862 |
| | Physicians Realty Trust | 1,689,549 | 32,034 |
| | Forest City Realty Trust Inc. Class A | 1,503,819 | 31,340 |
| | Retail Opportunity Investments Corp. | 1,362,299 | 28,785 |
| | Evercore Partners Inc. Class A | 411,965 | 28,302 |
| * | Essent Group Ltd. | 869,720 | 28,153 |
| | PS Business Parks Inc. | 236,519 | 27,559 |
| | Hilltop Holdings Inc. | 921,242 | 27,453 |
| | Colony Starwood Homes | 948,091 | 27,314 |
| | FirstCash Inc. | 573,505 | 26,955 |
| | Pebblebrook Hotel Trust | 897,260 | 26,693 |
| | Alexander & Baldwin Inc. | 579,557 | 26,005 |
| * | Blackhawk Network Holdings Inc. | 688,890 | 25,954 |
| | QTS Realty Trust Inc. Class A | 494,874 | 24,570 |
| | Kite Realty Group Trust | 1,040,104 | 24,422 |
| | Financial Engines Inc. | 654,527 | 24,054 |
| * | HealthEquity Inc. | 584,690 | 23,692 |
| *,^ | Zillow Group Inc. Class A | 640,209 | 23,336 |
| * | LendingClub Corp. | 4,423,029 | 23,221 |
| | Kennedy-Wilson Holdings Inc. | 1,130,146 | 23,168 |
| * | Eagle Bancorp Inc. | 377,325 | 22,998 |
| | STAG Industrial Inc. | 942,411 | 22,495 |
| *,^ | Credit Acceptance Corp. | 101,364 | 22,048 |
| * | FCB Financial Holdings Inc. Class A | 457,184 | 21,808 |
| | LegacyTexas Financial Group Inc. | 506,275 | 21,800 |
| | Outfront Media Inc. | 860,496 | 21,401 |
| | Simmons First National Corp. Class A | 331,789 | 20,621 |
| | Pinnacle Financial Partners Inc. | 273,608 | 18,961 |
| | Sabra Health Care REIT Inc. | 771,725 | 18,846 |
| | Corporate Office Properties Trust | 590,967 | 18,450 |
| | Ramco-Gershenson Properties Trust | 986,113 | 16,350 |
| | WisdomTree Investments Inc. | 1,447,266 | 16,123 |
| | Kearny Financial Corp. | 992,655 | 15,436 |
28
| | | |
| Vanguard® Small-Cap Growth Index Fund | | |
| Schedule of Investments | | |
| December 31, 2016 | | |
| |
| | | | Market |
| | | | Value |
| | | Shares | ($000) |
| | Colony Capital Inc. Class A | 673,186 | 13,632 |
| | HFF Inc. Class A | 449,002 | 13,582 |
| | TFS Financial Corp. | 703,565 | 13,396 |
| | FelCor Lodging Trust Inc. | 1,624,412 | 13,012 |
| | Capital Bank Financial Corp. | 327,666 | 12,861 |
| | NRG Yield Inc. | 779,066 | 12,309 |
| | CareTrust REIT Inc. | 789,021 | 12,088 |
| | Washington Prime Group Inc. | 1,149,635 | 11,968 |
| | Towne Bank | 347,035 | 11,539 |
| * | Parkway Inc. | 517,969 | 11,525 |
| * | St. Joe Co. | 599,617 | 11,393 |
| *,^ | Black Knight Financial Services Inc. Class A | 300,062 | 11,342 |
| | Monogram Residential Trust Inc. | 1,035,163 | 11,200 |
| | Alexander's Inc. | 25,334 | 10,814 |
| | ServisFirst Bancshares Inc. | 277,381 | 10,385 |
| | American Assets Trust Inc. | 240,704 | 10,370 |
| *,^ | BofI Holding Inc. | 353,504 | 10,093 |
| | New Senior Investment Group Inc. | 1,019,135 | 9,977 |
| | National Bank Holdings Corp. Class A | 306,118 | 9,762 |
| | Chesapeake Lodging Trust | 373,038 | 9,647 |
| | Yadkin Financial Corp. | 262,862 | 9,006 |
| | Urstadt Biddle Properties Inc. Class A | 368,074 | 8,874 |
| | BNC Bancorp | 275,702 | 8,795 |
| | Moelis & Co. Class A | 258,539 | 8,764 |
| | Cohen & Steers Inc. | 260,218 | 8,743 |
| * | Third Point Reinsurance Ltd. | 726,145 | 8,387 |
| | Greenhill & Co. Inc. | 290,294 | 8,041 |
| | InfraREIT Inc. | 441,335 | 7,904 |
| * | OneMain Holdings Inc. Class A | 334,536 | 7,407 |
| | Silver Bay Realty Trust Corp. | 401,213 | 6,877 |
| | Altisource Residential Corp. | 601,681 | 6,643 |
| | NRG Yield Inc. Class A | 429,175 | 6,592 |
| * | Ocwen Financial Corp. | 1,154,032 | 6,220 |
| | Northfield Bancorp Inc. | 259,048 | 5,173 |
| * | Marcus & Millichap Inc. | 190,677 | 5,095 |
| * | Tejon Ranch Co. | 182,478 | 4,640 |
| * | PennyMac Financial Services Inc. Class A | 252,304 | 4,201 |
| *,^ | Nationstar Mortgage Holdings Inc. | 181,511 | 3,278 |
| * | NewStar Financial Inc. | 329,180 | 3,045 |
| | Houlihan Lokey Inc. | 76,858 | 2,392 |
| * | On Deck Capital Inc. | 491,283 | 2,275 |
| *,^ | Altisource Portfolio Solutions SA | 76,126 | 2,024 |
| | RMR Group Inc. Class A | 40,769 | 1,610 |
| | Associated Capital Group Inc. Class A | 28,146 | 925 |
| | | | 3,722,530 |
| Health Care (13.1%) | | |
| * | Align Technology Inc. | 892,143 | 85,762 |
| * | MEDNAX Inc. | 1,164,869 | 77,650 |
| | West Pharmaceutical Services Inc. | 910,382 | 77,228 |
| *,^ | Ionis Pharmaceuticals Inc. | 1,507,711 | 72,114 |
| * | DexCom Inc. | 1,051,451 | 62,772 |
| * | ABIOMED Inc. | 512,603 | 57,760 |
| * | Exelixis Inc. | 3,563,163 | 53,127 |
| | Bio-Techne Corp. | 464,858 | 47,801 |
| * | PAREXEL International Corp. | 663,315 | 43,593 |
| * | NuVasive Inc. | 626,916 | 42,229 |
| * | Neurocrine Biosciences Inc. | 1,081,575 | 41,857 |
| * | Catalent Inc. | 1,476,066 | 39,795 |
| *,^ | OPKO Health Inc. | 4,172,034 | 38,800 |
| * | Masimo Corp. | 555,977 | 37,473 |
| * | Team Health Holdings Inc. | 834,465 | 36,258 |
| | STERIS plc | 530,493 | 35,750 |
| *,^ | ACADIA Pharmaceuticals Inc. | 1,206,399 | 34,793 |
| | Healthcare Services Group Inc. | 857,547 | 33,590 |
29
| | | |
| Vanguard® Small-Cap Growth Index Fund | | |
| Schedule of Investments | | |
| December 31, 2016 | | |
| |
| | | | Market |
| | | | Value |
| | | Shares | ($000) |
| * | INC Research Holdings Inc. Class A | 633,937 | 33,345 |
| | Cantel Medical Corp. | 415,979 | 32,758 |
| * | Horizon Pharma plc | 2,007,854 | 32,487 |
| * | Ultragenyx Pharmaceutical Inc. | 457,898 | 32,195 |
| * | TESARO Inc. | 232,802 | 31,307 |
| * | Bluebird Bio Inc. | 505,466 | 31,187 |
| * | Seattle Genetics Inc. | 572,879 | 30,231 |
| * | Wright Medical Group NV | 1,288,257 | 29,604 |
| * | Neogen Corp. | 446,277 | 29,454 |
| *,^ | Acadia Healthcare Co. Inc. | 871,660 | 28,852 |
| * | Medicines Co. | 837,422 | 28,422 |
| | Bruker Corp. | 1,296,032 | 27,450 |
| * | PRA Health Sciences Inc. | 497,215 | 27,407 |
| *,^ | ARIAD Pharmaceuticals Inc. | 2,177,065 | 27,083 |
| * | Insulet Corp. | 715,284 | 26,952 |
| * | ICU Medical Inc. | 182,686 | 26,919 |
| * | Ironwood Pharmaceuticals Inc. Class A | 1,631,829 | 24,951 |
| * | Akorn Inc. | 1,092,667 | 23,853 |
| *,^ | Ligand Pharmaceuticals Inc. | 234,375 | 23,815 |
| * | Nektar Therapeutics Class A | 1,901,329 | 23,329 |
| *,^ | Nevro Corp. | 304,883 | 22,153 |
| *,^ | Intercept Pharmaceuticals Inc. | 201,050 | 21,844 |
| * | NxStage Medical Inc. | 807,706 | 21,170 |
| * | Globus Medical Inc. | 852,183 | 21,143 |
| *,^ | Penumbra Inc. | 315,741 | 20,144 |
| * | HMS Holdings Corp. | 1,056,013 | 19,177 |
| *,^ | Radius Health Inc. | 483,472 | 18,386 |
| * | Exact Sciences Corp. | 1,347,699 | 18,005 |
| * | Sarepta Therapeutics Inc. | 645,803 | 17,714 |
| *,^ | Agios Pharmaceuticals Inc. | 417,771 | 17,434 |
| * | Alnylam Pharmaceuticals Inc. | 454,828 | 17,029 |
| *,^ | Intrexon Corp. | 666,119 | 16,187 |
| *,^ | Theravance Biopharma Inc. | 484,235 | 15,437 |
| * | AMAG Pharmaceuticals Inc. | 427,441 | 14,875 |
| * | Pacira Pharmaceuticals Inc. | 444,083 | 14,344 |
| * | Emergent BioSolutions Inc. | 428,632 | 14,076 |
| | Abaxis Inc. | 265,921 | 14,033 |
| *,^ | Halozyme Therapeutics Inc. | 1,375,643 | 13,591 |
| * | FibroGen Inc. | 627,044 | 13,419 |
| * | Amedisys Inc. | 313,274 | 13,355 |
| * | Haemonetics Corp. | 322,466 | 12,963 |
| * | Air Methods Corp. | 406,402 | 12,944 |
| | Analogic Corp. | 153,849 | 12,762 |
| * | Momenta Pharmaceuticals Inc. | 837,357 | 12,602 |
| * | Puma Biotechnology Inc. | 388,836 | 11,937 |
| *,^ | Alder Biopharmaceuticals Inc. | 530,545 | 11,035 |
| * | Acorda Therapeutics Inc. | 572,226 | 10,758 |
| *,^ | Innoviva Inc. | 944,513 | 10,106 |
| * | Luminex Corp. | 493,946 | 9,993 |
| * | Zeltiq Aesthetics Inc. | 223,171 | 9,712 |
| *,^ | Juno Therapeutics Inc. | 492,662 | 9,287 |
| | Meridian Bioscience Inc. | 496,166 | 8,782 |
| *,^ | Lannett Co. Inc. | 390,507 | 8,611 |
| * | Glaukos Corp. | 249,831 | 8,569 |
| * | Five Prime Therapeutics Inc. | 167,595 | 8,398 |
| * | Avexis Inc. | 172,878 | 8,251 |
| * | HealthStream Inc. | 319,156 | 7,995 |
| * | Orthofix International NV | 210,117 | 7,602 |
| * | Spark Therapeutics Inc. | 143,228 | 7,147 |
| *,^ | Lexicon Pharmaceuticals Inc. | 516,409 | 7,142 |
| * | Quidel Corp. | 328,065 | 7,027 |
| * | Merit Medical Systems Inc. | 264,774 | 7,017 |
| * | Depomed Inc. | 382,101 | 6,885 |
| * | Genomic Health Inc. | 230,899 | 6,786 |
30
| | | |
| Vanguard® Small-Cap Growth Index Fund | | |
| Schedule of Investments | | |
| December 31, 2016 | | |
| |
| | | | Market |
| | | | Value |
| | | Shares | ($000) |
| * | Natus Medical Inc. | 193,913 | 6,748 |
| | Ensign Group Inc. | 301,944 | 6,706 |
| *,^ | Merrimack Pharmaceuticals Inc. | 1,528,093 | 6,235 |
| * | Epizyme Inc. | 514,090 | 6,220 |
| * | Achillion Pharmaceuticals Inc. | 1,472,362 | 6,081 |
| * | Impax Laboratories Inc. | 458,600 | 6,076 |
| *,^ | Keryx Biopharmaceuticals Inc. | 1,007,266 | 5,903 |
| *,^ | TherapeuticsMD Inc. | 975,528 | 5,629 |
| * | Endologix Inc. | 977,522 | 5,591 |
| * | Insmed Inc. | 393,439 | 5,205 |
| *,^ | Teladoc Inc. | 314,225 | 5,185 |
| * | Acceleron Pharma Inc. | 188,690 | 4,815 |
| * | Healthways Inc. | 203,942 | 4,640 |
| * | CorVel Corp. | 124,082 | 4,541 |
| * | Accuray Inc. | 976,404 | 4,491 |
| * | Amicus Therapeutics Inc. | 882,978 | 4,388 |
| * | Arena Pharmaceuticals Inc. | 3,087,143 | 4,384 |
| *,^ | Aduro Biotech Inc. | 379,412 | 4,325 |
| *,^ | Novavax Inc. | 3,416,088 | 4,304 |
| * | Novocure Ltd. | 546,568 | 4,291 |
| *,^ | ZIOPHARM Oncology Inc. | 745,938 | 3,991 |
| * | Surgery Partners Inc. | 244,978 | 3,883 |
| * | Natera Inc. | 328,543 | 3,847 |
| *,^ | Editas Medicine Inc. | 229,478 | 3,724 |
| * | Medpace Holdings Inc. | 101,026 | 3,644 |
| * | Spectrum Pharmaceuticals Inc. | 806,278 | 3,572 |
| *,^ | ConforMIS Inc. | 425,761 | 3,449 |
| *,^ | Insys Therapeutics Inc. | 361,846 | 3,329 |
| * | American Renal Associates Holdings Inc. | 134,102 | 2,854 |
| * | Seres Therapeutics Inc. | 250,428 | 2,479 |
| * | Intellia Therapeutics Inc. | 156,345 | 2,050 |
| *,^ | MannKind Corp. | 1,930,123 | 1,229 |
| *,^ | Adeptus Health Inc. Class A | 81,319 | 621 |
| * | Wright Medical Group Inc. CVR | 165,303 | 218 |
| | | | 2,202,428 |
| Industrials (18.9%) | | |
| * | HD Supply Holdings Inc. | 2,495,741 | 106,094 |
| | AO Smith Corp. | 1,837,471 | 87,004 |
| | Jack Henry & Associates Inc. | 971,632 | 86,261 |
| | Lennox International Inc. | 508,661 | 77,912 |
| * | CoStar Group Inc. | 405,369 | 76,408 |
| * | Old Dominion Freight Line Inc. | 871,648 | 74,779 |
| * | Berry Plastics Group Inc. | 1,512,717 | 73,715 |
| | Toro Co. | 1,291,832 | 72,278 |
| | Nordson Corp. | 604,712 | 67,758 |
| | Cognex Corp. | 1,013,634 | 64,487 |
| * | XPO Logistics Inc. | 1,379,086 | 59,521 |
| | Hexcel Corp. | 1,141,294 | 58,708 |
| | Graco Inc. | 693,650 | 57,635 |
| | Eagle Materials Inc. | 569,863 | 56,149 |
| * | Zebra Technologies Corp. | 623,721 | 53,490 |
| * | WEX Inc. | 478,361 | 53,385 |
| * | Genesee & Wyoming Inc. Class A | 762,454 | 52,922 |
| | Packaging Corp. of America | 586,020 | 49,706 |
| | Woodward Inc. | 690,582 | 47,685 |
| | Watsco Inc. | 321,330 | 47,595 |
| | MAXIMUS Inc. | 807,086 | 45,027 |
| * | Euronet Worldwide Inc. | 616,840 | 44,678 |
| | National Instruments Corp. | 1,445,888 | 44,562 |
| | Landstar System Inc. | 520,177 | 44,371 |
| * | Genpact Ltd. | 1,750,225 | 42,600 |
| | Littelfuse Inc. | 280,608 | 42,588 |
| * | IPG Photonics Corp. | 429,349 | 42,381 |
| | Air Lease Corp. Class A | 1,215,149 | 41,716 |
31
| | | |
| Vanguard® Small-Cap Growth Index Fund | | |
| Schedule of Investments | | |
| December 31, 2016 | | |
| |
| | | | Market |
| | | | Value |
| | | Shares | ($000) |
| * | Coherent Inc. | 302,684 | 41,584 |
| * | Keysight Technologies Inc. | 1,056,790 | 38,647 |
| * | Clean Harbors Inc. | 643,846 | 35,830 |
| * | TransUnion | 1,137,699 | 35,189 |
| | HEICO Corp. Class A | 510,368 | 34,654 |
| * | WageWorks Inc. | 455,608 | 33,032 |
| *,^ | USG Corp. | 1,091,383 | 31,519 |
| * | Cardtronics plc Class A | 563,703 | 30,761 |
| | FLIR Systems Inc. | 847,440 | 30,669 |
| * | Itron Inc. | 476,415 | 29,943 |
| | John Bean Technologies Corp. | 345,072 | 29,659 |
| * | Universal Display Corp. | 526,386 | 29,636 |
| | Mueller Industries Inc. | 713,737 | 28,521 |
| * | Summit Materials Inc. Class A | 1,160,285 | 27,603 |
| *,^ | Cimpress NV | 295,364 | 27,058 |
| | Knight Transportation Inc. | 797,594 | 26,360 |
| * | On Assignment Inc. | 592,712 | 26,174 |
| * | RBC Bearings Inc. | 280,713 | 26,053 |
| | Mueller Water Products Inc. Class A | 1,912,474 | 25,455 |
| * | LifeLock Inc. | 1,058,183 | 25,312 |
| | CLARCOR Inc. | 303,797 | 25,054 |
| * | Masonite International Corp. | 373,371 | 24,568 |
| | CEB Inc. | 401,249 | 24,316 |
| * | Trex Co. Inc. | 365,964 | 23,568 |
| * | AMN Healthcare Services Inc. | 598,820 | 23,025 |
| | Covanta Holding Corp. | 1,462,945 | 22,822 |
| | Simpson Manufacturing Co. Inc. | 503,831 | 22,043 |
| *,^ | Ambarella Inc. | 387,379 | 20,969 |
| | AZZ Inc. | 324,370 | 20,727 |
| * | Headwaters Inc. | 878,498 | 20,662 |
| * | ExlService Holdings Inc. | 396,945 | 20,022 |
| * | II-VI Inc. | 660,279 | 19,577 |
| | Apogee Enterprises Inc. | 360,571 | 19,312 |
| | Franklin Electric Co. Inc. | 491,041 | 19,102 |
| * | MACOM Technology Solutions Holdings Inc. | 401,601 | 18,586 |
| | Exponent Inc. | 302,443 | 18,237 |
| | Methode Electronics Inc. | 437,190 | 18,078 |
| | Forward Air Corp. | 380,813 | 18,043 |
| * | OSI Systems Inc. | 225,457 | 17,162 |
| * | Rogers Corp. | 223,213 | 17,145 |
| * | Hub Group Inc. Class A | 391,881 | 17,145 |
| * | TopBuild Corp. | 472,797 | 16,832 |
| * | Louisiana-Pacific Corp. | 887,725 | 16,805 |
| * | Advisory Board Co. | 501,308 | 16,668 |
| | AAON Inc. | 491,343 | 16,239 |
| | Tennant Co. | 218,957 | 15,590 |
| * | Proto Labs Inc. | 296,298 | 15,215 |
| | HEICO Corp. | 193,282 | 14,912 |
| *,^ | Smith & Wesson Holding Corp. | 702,996 | 14,819 |
| * | Veeco Instruments Inc. | 504,907 | 14,718 |
| * | Imperva Inc. | 369,357 | 14,183 |
| * | Team Inc. | 347,703 | 13,647 |
| * | TriNet Group Inc. | 512,443 | 13,129 |
| | Badger Meter Inc. | 343,155 | 12,680 |
| | Primoris Services Corp. | 514,055 | 11,710 |
| | Heartland Express Inc. | 568,399 | 11,573 |
| * | Continental Building Products Inc. | 496,272 | 11,464 |
| | Sun Hydraulics Corp. | 284,064 | 11,354 |
| | Raven Industries Inc. | 448,699 | 11,307 |
| * | DigitalGlobe Inc. | 385,985 | 11,058 |
| * | Armstrong World Industries Inc. | 256,746 | 10,732 |
| * | Paylocity Holding Corp. | 318,623 | 9,562 |
| | Lindsay Corp. | 125,289 | 9,348 |
| | Advanced Drainage Systems Inc. | 447,910 | 9,227 |
32
| | | |
| Vanguard® Small-Cap Growth Index Fund | | |
| Schedule of Investments | | |
| December 31, 2016 | | |
| |
| | | | Market |
| | | | Value |
| | | Shares | ($000) |
| | EnPro Industries Inc. | 132,456 | 8,922 |
| | Quanex Building Products Corp. | 430,439 | 8,738 |
| | Mobile Mini Inc. | 275,886 | 8,346 |
| | Albany International Corp. | 179,264 | 8,300 |
| * | TASER International Inc. | 324,504 | 7,866 |
| * | Thermon Group Holdings Inc. | 406,101 | 7,752 |
| | Comfort Systems USA Inc. | 230,809 | 7,686 |
| *,^ | Inovalon Holdings Inc. Class A | 743,407 | 7,657 |
| * | FARO Technologies Inc. | 206,842 | 7,446 |
| * | Aerovironment Inc. | 261,157 | 7,007 |
| | Gorman-Rupp Co. | 213,461 | 6,607 |
| | Sturm Ruger & Co. Inc. | 117,727 | 6,204 |
| * | Evolent Health Inc. Class A | 391,472 | 5,794 |
| * | InnerWorkings Inc. | 583,182 | 5,744 |
| * | Builders FirstSource Inc. | 518,219 | 5,685 |
| * | Mistras Group Inc. | 217,340 | 5,581 |
| * | Multi Packaging Solutions International Ltd. | 388,682 | 5,543 |
| | Griffon Corp. | 209,547 | 5,490 |
| * | Bazaarvoice Inc. | 939,219 | 4,555 |
| * | Ply Gem Holdings Inc. | 257,584 | 4,186 |
| * | Advanced Disposal Services Inc. | 182,985 | 4,066 |
| * | Donnelley Financial Solutions Inc. | 161,760 | 3,717 |
| * | Armstrong Flooring Inc. | 150,378 | 2,994 |
| * | Astronics Corp. | 88,187 | 2,984 |
| * | Roadrunner Transportation Systems Inc. | 190,394 | 1,978 |
| * | Astronics Corp. Class B | 33,227 | 1,120 |
| | | | 3,169,977 |
| Oil & Gas (4.8%) | | |
| * | Diamondback Energy Inc. | 1,101,821 | 111,350 |
| * | Newfield Exploration Co. | 2,474,237 | 100,207 |
| * | Parsley Energy Inc. Class A | 2,010,705 | 70,857 |
| * | Southwestern Energy Co. | 6,163,309 | 66,687 |
| * | RSP Permian Inc. | 1,263,249 | 56,366 |
| * | PDC Energy Inc. | 699,882 | 50,797 |
| | Patterson-UTI Energy Inc. | 1,750,110 | 47,113 |
| * | Rice Energy Inc. | 2,017,988 | 43,084 |
| * | Gulfport Energy Corp. | 1,923,174 | 41,617 |
| * | Callon Petroleum Co. | 2,503,223 | 38,475 |
| * | Carrizo Oil & Gas Inc. | 770,439 | 28,776 |
| * | Matador Resources Co. | 1,114,793 | 28,717 |
| | SM Energy Co. | 600,810 | 20,716 |
| | Pattern Energy Group Inc. Class A | 869,838 | 16,518 |
| * | SEACOR Holdings Inc. | 193,866 | 13,819 |
| ^ | RPC Inc. | 674,836 | 13,368 |
| * | Laredo Petroleum Inc. | 900,619 | 12,735 |
| * | Extraction Oil & Gas Inc. | 455,329 | 9,125 |
| * | Centennial Resource Development Inc.Class A | 423,587 | 8,353 |
| * | Newpark Resources Inc. | 997,980 | 7,485 |
| *,^ | Clayton Williams Energy Inc. | 54,301 | 6,476 |
| *,^ | Flotek Industries Inc. | 669,963 | 6,291 |
| * | Cobalt International Energy Inc. | 4,436,161 | 5,412 |
| * | Sanchez Energy Corp. | 349,251 | 3,154 |
| * | Bill Barrett Corp. | 444,596 | 3,108 |
| * | Eclipse Resources Corp. | 487,291 | 1,301 |
| | | | 811,907 |
| Other (0.0%)2 | | |
| * | Dyax Corp. | 1,798,309 | 1,996 |
| * | Clinical Data Contingent Value Rights | 132,154 | — |
| | | | 1,996 |
| Technology (15.7%) | | |
| * | Cadence Design Systems Inc. | 3,566,917 | 89,958 |
| * | PTC Inc. | 1,438,088 | 66,540 |
| * | Ultimate Software Group Inc. | 342,715 | 62,494 |
33
| | | |
| Vanguard® Small-Cap Growth Index Fund | | |
| Schedule of Investments | | |
| December 31, 2016 | | |
| |
| | | | Market |
| | | | Value |
| | | Shares | ($000) |
| | SS&C Technologies Holdings Inc. | 2,144,417 | 61,330 |
| * | IAC/InterActiveCorp | 914,293 | 59,237 |
| * | Tyler Technologies Inc. | 410,061 | 58,544 |
| * | Advanced Micro Devices Inc. | 4,900,063 | 55,567 |
| * | Fortinet Inc. | 1,829,578 | 55,107 |
| * | Aspen Technology Inc. | 960,603 | 52,526 |
| * | athenahealth Inc. | 490,752 | 51,612 |
| * | Arista Networks Inc. | 523,925 | 50,700 |
| * | Cavium Inc. | 791,759 | 49,437 |
| * | Veeva Systems Inc. Class A | 1,195,932 | 48,674 |
| * | Manhattan Associates Inc. | 885,486 | 46,957 |
| | j2 Global Inc. | 567,671 | 46,435 |
| | Fair Isaac Corp. | 385,418 | 45,950 |
| * | Guidewire Software Inc. | 914,209 | 45,098 |
| * | ViaSat Inc. | 662,300 | 43,857 |
| * | Ciena Corp. | 1,734,997 | 42,351 |
| * | Finisar Corp. | 1,372,562 | 41,547 |
| | MKS Instruments Inc. | 666,507 | 39,591 |
| | InterDigital Inc. | 426,895 | 38,997 |
| * | EPAM Systems Inc. | 604,109 | 38,850 |
| | Blackbaud Inc. | 592,456 | 37,917 |
| * | Integrated Device Technology Inc. | 1,585,516 | 37,355 |
| | Monolithic Power Systems Inc. | 455,218 | 37,296 |
| *,^ | Proofpoint Inc. | 502,649 | 35,512 |
| * | NetScout Systems Inc. | 1,081,842 | 34,078 |
| * | Medidata Solutions Inc. | 681,480 | 33,849 |
| * | Ellie Mae Inc. | 397,475 | 33,261 |
| * | Silicon Laboratories Inc. | 494,105 | 32,117 |
| * | Entegris Inc. | 1,759,658 | 31,498 |
| * | Tableau Software Inc. Class A | 719,146 | 30,312 |
| * | Dycom Industries Inc. | 372,201 | 29,884 |
| | LogMeIn Inc. | 301,515 | 29,111 |
| * | Advanced Energy Industries Inc. | 493,848 | 27,038 |
| * | Square Inc. | 1,967,438 | 26,816 |
| * | Tessera Holding Corp. | 604,135 | 26,703 |
| * | Cornerstone OnDemand Inc. | 629,969 | 26,654 |
| * | ACI Worldwide Inc. | 1,460,726 | 26,512 |
| * | CommVault Systems Inc. | 507,739 | 26,098 |
| * | Lumentum Holdings Inc. | 674,144 | 26,056 |
| *,^ | Paycom Software Inc. | 561,615 | 25,548 |
| * | Electronics For Imaging Inc. | 581,822 | 25,519 |
| * | Allscripts Healthcare Solutions Inc. | 2,305,774 | 23,542 |
| | Power Integrations Inc. | 344,289 | 23,360 |
| * | Synaptics Inc. | 434,911 | 23,303 |
| * | MicroStrategy Inc. Class A | 117,095 | 23,115 |
| * | FireEye Inc. | 1,918,594 | 22,831 |
| | Plantronics Inc. | 414,933 | 22,722 |
| * | Zendesk Inc. | 1,066,793 | 22,616 |
| * | Cirrus Logic Inc. | 396,808 | 22,436 |
| * | GoDaddy Inc. Class A | 632,395 | 22,102 |
| | Cogent Communications Holdings Inc. | 510,425 | 21,106 |
| * | RealPage Inc. | 702,489 | 21,075 |
| * | Inphi Corp. | 462,541 | 20,639 |
| * | Synchronoss Technologies Inc. | 508,706 | 19,483 |
| * | Rambus Inc. | 1,377,789 | 18,972 |
| * | HubSpot Inc. | 399,779 | 18,790 |
| | NIC Inc. | 781,782 | 18,685 |
| * | Gigamon Inc. | 405,489 | 18,470 |
| * | Envestnet Inc. | 509,580 | 17,963 |
| *,^ | Ubiquiti Networks Inc. | 306,989 | 17,744 |
| *,^ | 3D Systems Corp. | 1,331,372 | 17,694 |
| * | 2U Inc. | 527,415 | 15,902 |
| * | BroadSoft Inc. | 375,253 | 15,479 |
| | Pegasystems Inc. | 427,374 | 15,385 |
34
| | | |
| Vanguard® Small-Cap Growth Index Fund | | |
| Schedule of Investments | | |
| December 31, 2016 | | |
| |
| | | | Market |
| | | | Value |
| | | Shares | ($000) |
| * | Infinera Corp. | 1,801,687 | 15,296 |
| * | Mercury Systems Inc. | 484,864 | 14,653 |
| * | RingCentral Inc. Class A | 677,795 | 13,963 |
| * | InvenSense Inc. | 1,049,594 | 13,424 |
| | ADTRAN Inc. | 600,594 | 13,423 |
| * | Super Micro Computer Inc. | 476,337 | 13,361 |
| * | Bottomline Technologies de Inc. | 477,819 | 11,955 |
| * | New Relic Inc. | 420,492 | 11,879 |
| * | Diodes Inc. | 455,073 | 11,682 |
| *,^ | Shutterstock Inc. | 239,704 | 11,391 |
| * | Lattice Semiconductor Corp. | 1,428,322 | 10,512 |
| * | Cray Inc. | 505,620 | 10,466 |
| | Monotype Imaging Holdings Inc. | 521,384 | 10,349 |
| *,^ | Acacia Communications Inc. | 162,582 | 10,039 |
| * | CEVA Inc. | 265,800 | 8,918 |
| *,^ | Twilio Inc. Class A | 298,947 | 8,625 |
| * | Intralinks Holdings Inc. | 616,562 | 8,336 |
| * | Barracuda Networks Inc. | 387,032 | 8,294 |
| | Syntel Inc. | 417,383 | 8,260 |
| *,^ | Pure Storage Inc. Class A | 718,979 | 8,132 |
| * | Applied Micro Circuits Corp. | 966,146 | 7,971 |
| * | Ultratech Inc. | 321,077 | 7,699 |
| * | Endurance International Group Holdings Inc. | 800,680 | 7,446 |
| * | Ixia | 458,722 | 7,385 |
| * | Box Inc. | 500,994 | 6,944 |
| * | Loral Space & Communications Inc. | 161,557 | 6,632 |
| *,^ | Gogo Inc. | 695,724 | 6,415 |
| * | Nimble Storage Inc. | 801,639 | 6,349 |
| * | Actua Corp. | 449,510 | 6,293 |
| *,^ | Nutanix Inc. | 212,175 | 5,635 |
| * | Benefitfocus Inc. | 186,154 | 5,529 |
| * | CommerceHub Inc. | 361,999 | 5,441 |
| | Forrester Research Inc. | 125,973 | 5,411 |
| * | FormFactor Inc. | 450,037 | 5,040 |
| * | LivePerson Inc. | 658,325 | 4,970 |
| * | Virtusa Corp. | 170,271 | 4,277 |
| * | Calix Inc. | 523,207 | 4,029 |
| *,^ | Hortonworks Inc. | 450,904 | 3,747 |
| * | Jive Software Inc. | 783,317 | 3,407 |
| * | Rapid7 Inc. | 210,859 | 2,566 |
| * | CommerceHub Inc. Class A | 169,357 | 2,542 |
| * | Blackline Inc. | 86,202 | 2,382 |
| * | ChannelAdvisor Corp. | 147,520 | 2,117 |
| ^ | Computer Programs & Systems Inc. | 79,760 | 1,882 |
| * | Sonus Networks Inc. | 291,536 | 1,837 |
| * | Castlight Health Inc. Class B | 357,701 | 1,771 |
| * | Harmonic Inc. | 242,204 | 1,211 |
| * | SecureWorks Corp. Class A | 99,326 | 1,052 |
| * | MobileIron Inc. | 276,938 | 1,039 |
| | | | 2,645,884 |
| Telecommunications (0.3%) | | |
| | Cincinnati Bell Inc. | 521,513 | 11,656 |
| | ATN International Inc. | 130,173 | 10,431 |
| *,^ | Globalstar Inc. | 5,365,959 | 8,478 |
| | Shenandoah Telecommunications Co. | 288,311 | 7,871 |
| | Windstream Holdings Inc. | 594,462 | 4,357 |
| | | | 42,793 |
| Utilities (0.3%) | | |
| | Ormat Technologies Inc. | 494,261 | 26,503 |
| * | TerraForm Power Inc. Class A | 1,078,541 | 13,816 |
| * | Dynegy Inc. | 1,455,586 | 12,314 |
| *,^ | Sunrun Inc. | 907,355 | 4,818 |
35
| | | | | |
| Vanguard® Small-Cap Growth Index Fund | | | | |
| Schedule of Investments | | | | |
| December 31, 2016 | | | | |
| |
| | | | | | Market |
| | | | | | Value |
| | | | | Shares | ($000) |
| *,^ | Vivint Solar Inc. | | | 278,910 | 711 |
| | | | | | 58,162 |
| Total Common Stocks (Cost $13,465,023) | | | | 16,770,723 |
| |
| |
| | | Coupon | | | |
| Temporary Cash Investments (1.9%)1 | | | | |
| Money Market Fund (1.9%) | | | | |
| 3,4 | Vanguard Market Liquidity Fund | 0.823% | | 3,084,955 | 308,527 |
| |
| | | | | Face | |
| | | | Maturity | Amount | |
| | | | Date | ($000) | |
| U.S. Government and Agency Obligations (0.0%) | | | | |
| 5 | United States Treasury Bill | 0.287%-0.290% | 1/5/17 | 1,000 | 1,000 |
| 5 | United States Treasury Bill | 0.487% | 3/16/17 | 600 | 599 |
| 5 | United States Treasury Bill | 0.564% | 5/4/17 | 1,000 | 998 |
| | United States Treasury Bill | 0.574% | 5/11/17 | 2,000 | 1,996 |
| | | | | | 4,593 |
| Total Temporary Cash Investments (Cost $313,099) | | | | 313,120 |
| Total Investments (101.7%) (Cost $13,778,122) | | | | 17,083,843 |
| Other Assets and Liabilities—Net (-1.7%)4 | | | | (289,739) |
| Net Assets (100%) | | | | 16,794,104 |
* Non-income-producing security.
^ Includes partial security positions on loan to broker-dealers. The total value of securities on loan is $237,110,000.
1 The fund invests a portion of its cash reserves in equity markets through the use of index futures contracts. After giving effect to futures
investments, the fund's effective common stock and temporary cash investment positions represent 100.0% and 1.7%, respectively, of net
assets.
2 “Other” represents securities that are not classified by the fund’s benchmark index.
3 Affiliated money market fund available only to Vanguard funds and certain trusts and accounts managed by Vanguard. Rate shown is the 7-day
yield.
4 Includes $253,746,000 of collateral received for securities on loan.
5 Securities with a value of $2,338,000 have been segregated as initial margin for open futures contracts.
CVR—Contingent Value Rights.
REIT—Real Estate Investment Trust.
36
| | | |
| Vanguard® Small-Cap Value Index Fund | | |
| Schedule of Investments | | |
| December 31, 2016 | | |
| |
| | | | Market |
| | | | Value |
| | | Shares | ($000) |
| |
| Common Stocks (99.7%)1 | | |
| Basic Materials (5.8%) | | |
| | Steel Dynamics Inc. | 3,273,906 | 116,486 |
| | RPM International Inc. | 1,883,985 | 101,415 |
| | United States Steel Corp. | 2,437,803 | 80,472 |
| | Scotts Miracle-Gro Co. Class A | 642,753 | 61,415 |
| | Olin Corp. | 2,336,722 | 59,843 |
| | Chemours Co. | 2,571,104 | 56,796 |
| | Huntsman Corp. | 2,862,862 | 54,623 |
| | Sensient Technologies Corp. | 628,748 | 49,407 |
| * | AK Steel Holding Corp. | 4,425,838 | 45,188 |
| | CONSOL Energy Inc. | 2,270,957 | 41,400 |
| | Cabot Corp. | 792,210 | 40,038 |
| | PolyOne Corp. | 1,183,095 | 37,906 |
| ^ | Compass Minerals International Inc. | 477,386 | 37,403 |
| * | Alcoa Corp. | 1,288,092 | 36,170 |
| | Commercial Metals Co. | 1,627,964 | 35,457 |
| | Domtar Corp. | 884,280 | 34,513 |
| | HB Fuller Co. | 710,834 | 34,340 |
| * | Univar Inc. | 1,171,710 | 33,241 |
| | Worthington Industries Inc. | 628,655 | 29,823 |
| * | Chemtura Corp. | 890,270 | 29,557 |
| * | GCP Applied Technologies Inc. | 1,002,873 | 26,827 |
| *,^ | Cliffs Natural Resources Inc. | 2,927,173 | 24,618 |
| ^ | Allegheny Technologies Inc. | 1,536,719 | 24,480 |
| | Carpenter Technology Corp. | 658,382 | 23,814 |
| | Stepan Co. | 284,428 | 23,175 |
| * | Arch Coal Inc. Class A | 294,890 | 23,016 |
| | Quaker Chemical Corp. | 177,624 | 22,725 |
| | Innospec Inc. | 321,847 | 22,047 |
| * | Versum Materials Inc. | 764,202 | 21,451 |
| | Minerals Technologies Inc. | 246,377 | 19,033 |
| | Kaiser Aluminum Corp. | 240,262 | 18,666 |
| * | Ingevity Corp. | 296,616 | 16,272 |
| * | Clearwater Paper Corp. | 235,782 | 15,456 |
| | PH Glatfelter Co. | 614,178 | 14,673 |
| | Hecla Mining Co. | 2,797,494 | 14,659 |
| | Innophos Holdings Inc. | 260,139 | 13,595 |
| | A Schulman Inc. | 395,179 | 13,219 |
| * | Kraton Corp. | 436,279 | 12,425 |
| * | Koppers Holdings Inc. | 279,446 | 11,262 |
| | Tredegar Corp. | 398,500 | 9,564 |
| | Rayonier Advanced Materials Inc. | 616,290 | 9,528 |
| | Tronox Ltd. Class A | 880,881 | 9,082 |
| * | Ferro Corp. | 595,447 | 8,533 |
| | Haynes International Inc. | 177,792 | 7,643 |
| * | Century Aluminum Co. | 685,675 | 5,869 |
| * | Resolute Forest Products Inc. | 830,140 | 4,441 |
| | FutureFuel Corp. | 311,487 | 4,330 |
| * | SunCoke Energy Inc. | 290,372 | 3,293 |
| | Kronos Worldwide Inc. | 247,944 | 2,960 |
| | | | 1,442,149 |
| Consumer Goods (6.4%) | | |
| | Leggett & Platt Inc. | 1,889,439 | 92,356 |
| | Pinnacle Foods Inc. | 1,669,008 | 89,209 |
| | Thor Industries Inc. | 706,285 | 70,664 |
| | Ingredion Inc. | 511,808 | 63,956 |
| | Goodyear Tire & Rubber Co. | 1,845,731 | 56,978 |
| | Flowers Foods Inc. | 2,637,844 | 52,678 |
| * | Tenneco Inc. | 738,874 | 46,157 |
| *,^ | Herbalife Ltd. | 921,050 | 44,339 |
| | Snyder's-Lance Inc. | 1,085,496 | 41,618 |
| | Spectrum Brands Holdings Inc. | 335,501 | 41,042 |
37
| | | |
| Vanguard® Small-Cap Value Index Fund | | |
| Schedule of Investments | | |
| December 31, 2016 | | |
| |
| | | | Market |
| | | | Value |
| | | Shares | ($000) |
| | Energizer Holdings Inc. | 873,008 | 38,945 |
| | Dana Inc. | 2,033,730 | 38,600 |
| | Visteon Corp. | 480,276 | 38,585 |
| | HNI Corp. | 628,526 | 35,147 |
| | Nu Skin Enterprises Inc. Class A | 731,586 | 34,955 |
| * | Helen of Troy Ltd. | 393,840 | 33,260 |
| * | Avon Products Inc. | 6,186,648 | 31,181 |
| * | Vista Outdoor Inc. | 830,912 | 30,661 |
| | Tupperware Brands Corp. | 571,833 | 30,090 |
| * | Darling Ingredients Inc. | 2,322,035 | 29,978 |
| | Cooper Tire & Rubber Co. | 754,889 | 29,327 |
| | Wolverine World Wide Inc. | 1,324,050 | 29,063 |
| | Herman Miller Inc. | 846,199 | 28,940 |
| | Fresh Del Monte Produce Inc. | 475,694 | 28,841 |
| | Dean Foods Co. | 1,280,024 | 27,879 |
| * | Cooper-Standard Holdings Inc. | 249,390 | 25,782 |
| | Sanderson Farms Inc. | 270,771 | 25,518 |
| | La-Z-Boy Inc. | 693,175 | 21,523 |
| * | US Foods Holding Corp. | 779,441 | 21,419 |
| * | American Axle & Manufacturing Holdings Inc. | 1,080,989 | 20,863 |
| | Steelcase Inc. Class A | 1,105,399 | 19,787 |
| * | ACCO Brands Corp. | 1,510,977 | 19,718 |
| | Schweitzer-Mauduit International Inc. | 431,047 | 19,626 |
| | Universal Corp. | 305,433 | 19,471 |
| | Lancaster Colony Corp. | 135,510 | 19,160 |
| | Knoll Inc. | 657,243 | 18,357 |
| ^ | Cal-Maine Foods Inc. | 401,857 | 17,752 |
| | KB Home | 1,080,164 | 17,077 |
| | Andersons Inc. | 357,449 | 15,978 |
| * | Fossil Group Inc. | 576,088 | 14,898 |
| * | Central Garden & Pet Co. Class A | 472,214 | 14,591 |
| * | Seaboard Corp. | 3,311 | 13,085 |
| | Ethan Allen Interiors Inc. | 351,131 | 12,939 |
| | Briggs & Stratton Corp. | 574,220 | 12,782 |
| * | Deckers Outdoor Corp. | 226,166 | 12,527 |
| | Columbia Sportswear Co. | 197,148 | 11,494 |
| * | Modine Manufacturing Co. | 647,296 | 9,645 |
| ^ | Tootsie Roll Industries Inc. | 240,512 | 9,560 |
| ^ | Valvoline Inc. | 433,593 | 9,322 |
| | Superior Industries International Inc. | 326,540 | 8,604 |
| * | G-III Apparel Group Ltd. | 274,732 | 8,121 |
| | Inter Parfums Inc. | 243,123 | 7,962 |
| * | Taylor Morrison Home Corp. Class A | 411,082 | 7,917 |
| | National Presto Industries Inc. | 74,258 | 7,901 |
| * | Crocs Inc. | 993,953 | 6,819 |
| * | Iconix Brand Group Inc. | 679,014 | 6,342 |
| | Movado Group Inc. | 220,411 | 6,337 |
| * | Eastman Kodak Co. | 330,217 | 5,118 |
| *,^ | Federal-Mogul Holdings Corp. | 481,392 | 4,963 |
| *,^ | Central Garden & Pet Co. | 145,854 | 4,826 |
| | Metaldyne Performance Group Inc. | 186,634 | 4,283 |
| | Phibro Animal Health Corp. Class A | 131,596 | 3,856 |
| | Titan International Inc. | 308,261 | 3,456 |
| * | Vera Bradley Inc. | 263,499 | 3,088 |
| | | | 1,576,916 |
| Consumer Services (10.1%) | | |
| * | JetBlue Airways Corp. | 4,575,929 | 102,592 |
| | KAR Auction Services Inc. | 1,953,027 | 83,238 |
| | Service Corp. International | 2,555,223 | 72,568 |
| | TEGNA Inc. | 3,031,142 | 64,836 |
| | Dun & Bradstreet Corp. | 519,310 | 63,003 |
| * | Rite Aid Corp. | 7,437,474 | 61,285 |
| | Cinemark Holdings Inc. | 1,478,798 | 56,727 |
| ^ | Cracker Barrel Old Country Store Inc. | 339,401 | 56,673 |
38
| | | |
| Vanguard® Small-Cap Value Index Fund | | |
| Schedule of Investments | | |
| December 31, 2016 | | |
| |
| | | | Market |
| | | | Value |
| | | Shares | ($000) |
| | CST Brands Inc. | 1,068,638 | 51,455 |
| * | Avis Budget Group Inc. | 1,118,513 | 41,027 |
| | Cable One Inc. | 64,505 | 40,105 |
| * | Beacon Roofing Supply Inc. | 847,041 | 39,023 |
| | GameStop Corp. Class A | 1,468,051 | 37,083 |
| | Wendy's Co. | 2,721,586 | 36,796 |
| | Tribune Media Co. Class A | 1,050,123 | 36,733 |
| * | ServiceMaster Global Holdings Inc. | 951,386 | 35,839 |
| | John Wiley & Sons Inc. Class A | 648,399 | 35,338 |
| | American Eagle Outfitters Inc. | 2,309,649 | 35,037 |
| | Chemed Corp. | 217,678 | 34,918 |
| | Brinker International Inc. | 701,095 | 34,725 |
| | Dolby Laboratories Inc. Class A | 766,276 | 34,628 |
| *,^ | JC Penney Co. Inc. | 4,127,569 | 34,300 |
| * | United Natural Foods Inc. | 713,079 | 34,028 |
| | Office Depot Inc. | 7,460,281 | 33,720 |
| | Matthews International Corp. Class A | 431,213 | 33,139 |
| | Meredith Corp. | 554,566 | 32,803 |
| | Aaron's Inc. | 1,008,415 | 32,259 |
| * | Murphy USA Inc. | 517,801 | 31,829 |
| | Big Lots Inc. | 629,592 | 31,612 |
| | Regal Entertainment Group Class A | 1,505,708 | 31,018 |
| | Hillenbrand Inc. | 801,326 | 30,731 |
| | AMERCO | 83,141 | 30,728 |
| | Sinclair Broadcast Group Inc. Class A | 915,141 | 30,520 |
| | Lithia Motors Inc. Class A | 314,517 | 30,455 |
| | Graham Holdings Co. Class B | 59,052 | 30,232 |
| * | Spirit Airlines Inc. | 488,837 | 28,284 |
| * | Acxiom Corp. | 1,039,292 | 27,853 |
| | Bloomin' Brands Inc. | 1,487,141 | 26,813 |
| | Core-Mark Holding Co. Inc. | 619,068 | 26,663 |
| | SkyWest Inc. | 694,222 | 25,304 |
| | Penske Automotive Group Inc. | 480,651 | 24,917 |
| | Chico's FAS Inc. | 1,731,280 | 24,913 |
| | Extended Stay America Inc. | 1,532,596 | 24,751 |
| | Children's Place Inc. | 241,821 | 24,412 |
| | New York Times Co. Class A | 1,810,342 | 24,078 |
| | Time Inc. | 1,259,329 | 22,479 |
| * | Boyd Gaming Corp. | 1,112,190 | 22,433 |
| | Group 1 Automotive Inc. | 286,546 | 22,333 |
| | DeVry Education Group Inc. | 707,657 | 22,079 |
| | DSW Inc. Class A | 894,700 | 20,265 |
| | Caleres Inc. | 575,037 | 18,873 |
| * | Houghton Mifflin Harcourt Co. | 1,736,152 | 18,837 |
| | DineEquity Inc. | 242,581 | 18,679 |
| * | MSG Networks Inc. | 867,932 | 18,661 |
| | SeaWorld Entertainment Inc. | 944,133 | 17,872 |
| | Tailored Brands Inc. | 689,199 | 17,609 |
| * | SUPERVALU Inc. | 3,754,337 | 17,533 |
| * | Asbury Automotive Group Inc. | 281,435 | 17,365 |
| * | Genesco Inc. | 277,127 | 17,210 |
| | Scholastic Corp. | 347,864 | 16,520 |
| * | Hertz Global Holdings Inc. | 759,531 | 16,375 |
| * | La Quinta Holdings Inc. | 1,151,533 | 16,363 |
| | Dillard's Inc. Class A | 256,843 | 16,101 |
| | Gannett Co. Inc. | 1,641,946 | 15,943 |
| * | Performance Food Group Co. | 655,320 | 15,728 |
| | HSN Inc. | 440,911 | 15,123 |
| | Bob Evans Farms Inc. | 279,052 | 14,848 |
| | ILG Inc. | 800,460 | 14,544 |
| | Capella Education Co. | 161,618 | 14,190 |
| * | Apollo Education Group Inc. | 1,388,908 | 13,750 |
| * | Herc Holdings Inc. | 340,094 | 13,658 |
| * | Rush Enterprises Inc. Class A | 427,804 | 13,647 |
39
| | | |
| Vanguard® Small-Cap Value Index Fund | | |
| Schedule of Investments | | |
| December 31, 2016 | | |
| |
| | | | Market |
| | | | Value |
| | | Shares | ($000) |
| | International Speedway Corp. Class A | 365,140 | 13,437 |
| | Weis Markets Inc. | 191,512 | 12,801 |
| | Abercrombie & Fitch Co. | 955,296 | 11,464 |
| * | Strayer Education Inc. | 142,124 | 11,459 |
| * | Express Inc. | 1,048,493 | 11,282 |
| | Finish Line Inc. Class A | 572,895 | 10,776 |
| | GNC Holdings Inc. Class A | 966,581 | 10,671 |
| * | Caesars Acquisition Co. Class A | 782,045 | 10,558 |
| | Cato Corp. Class A | 335,861 | 10,103 |
| | Guess? Inc. | 833,139 | 10,081 |
| ^ | Fred's Inc. Class A | 506,392 | 9,399 |
| | Buckle Inc. | 411,625 | 9,385 |
| | Pier 1 Imports Inc. | 1,058,008 | 9,035 |
| | Barnes & Noble Inc. | 770,088 | 8,586 |
| * | K12 Inc. | 487,836 | 8,371 |
| | Rent-A-Center Inc. | 717,862 | 8,076 |
| * | Vitamin Shoppe Inc. | 334,919 | 7,954 |
| | Sonic Automotive Inc. Class A | 346,485 | 7,935 |
| * | EW Scripps Co. Class A | 407,278 | 7,873 |
| * | Penn National Gaming Inc. | 529,309 | 7,299 |
| * | Regis Corp. | 492,603 | 7,153 |
| * | Bankrate Inc. | 644,677 | 7,124 |
| | New Media Investment Group Inc. | 355,997 | 5,692 |
| * | FTD Cos. Inc. | 234,423 | 5,589 |
| * | American Public Education Inc. | 218,119 | 5,355 |
| *,^ | Zumiez Inc. | 243,180 | 5,313 |
| * | Barnes & Noble Education Inc. | 459,471 | 5,270 |
| * | Smart & Final Stores Inc. | 355,760 | 5,016 |
| * | RetailMeNot Inc. | 518,155 | 4,819 |
| *,^ | Weight Watchers International Inc. | 410,377 | 4,699 |
| | Speedway Motorsports Inc. | 175,898 | 3,812 |
| *,^ | Caesars Entertainment Corp. | 424,225 | 3,606 |
| * | Biglari Holdings Inc. | 6,510 | 3,081 |
| * | Party City Holdco Inc. | 208,818 | 2,965 |
| * | Rush Enterprises Inc. Class B | 94,530 | 2,918 |
| *,^ | Sears Holdings Corp. | 309,694 | 2,877 |
| *,^ | Lands' End Inc. | 182,144 | 2,759 |
| * | Bridgepoint Education Inc. | 264,318 | 2,678 |
| | Clear Channel Outdoor Holdings Inc. Class A | 513,441 | 2,593 |
| * | Conn's Inc. | 108,119 | 1,368 |
| | | | 2,509,241 |
| Financials (31.1%) | | |
| | East West Bancorp Inc. | 2,037,793 | 103,581 |
| | Apartment Investment & Management Co. | 2,217,646 | 100,792 |
| | National Retail Properties Inc. | 2,079,668 | 91,921 |
| | American Financial Group Inc. | 981,277 | 86,470 |
| | Endurance Specialty Holdings Ltd. | 907,915 | 83,891 |
| | Liberty Property Trust | 2,077,892 | 82,077 |
| | Starwood Property Trust Inc. | 3,624,289 | 79,553 |
| | RenaissanceRe Holdings Ltd. | 581,802 | 79,253 |
| | Hospitality Properties Trust | 2,322,133 | 73,705 |
| | Highwoods Properties Inc. | 1,415,912 | 72,226 |
| | Brown & Brown Inc. | 1,583,617 | 71,041 |
| | Cullen/Frost Bankers Inc. | 801,110 | 70,682 |
| | Commerce Bancshares Inc. | 1,218,816 | 70,460 |
| | Webster Financial Corp. | 1,296,803 | 70,390 |
| | Assured Guaranty Ltd. | 1,842,628 | 69,596 |
| | Synovus Financial Corp. | 1,641,273 | 67,423 |
| | Old Republic International Corp. | 3,526,639 | 67,006 |
| | Prosperity Bancshares Inc. | 932,517 | 66,936 |
| | First Horizon National Corp. | 3,297,221 | 65,977 |
| | Arthur J Gallagher & Co. | 1,257,855 | 65,358 |
| | EPR Properties | 898,499 | 64,485 |
| | Popular Inc. | 1,467,169 | 64,291 |
40
| | |
| Vanguard® Small-Cap Value Index Fund | | |
| Schedule of Investments | | |
| December 31, 2016 | | |
| |
| | | Market |
| | | Value |
| | Shares | ($000) |
| Senior Housing Properties Trust | 3,358,370 | 63,574 |
| Eaton Vance Corp. | 1,513,748 | 63,396 |
| * Alleghany Corp. | 103,492 | 62,936 |
| Allied World Assurance Co. Holdings AG | 1,167,215 | 62,691 |
| Weingarten Realty Investors | 1,719,777 | 61,551 |
| Taubman Centers Inc. | 811,472 | 59,992 |
| Validus Holdings Ltd. | 1,065,941 | 58,637 |
| Umpqua Holdings Corp. | 3,113,610 | 58,474 |
| Apple Hospitality REIT Inc. | 2,904,772 | 58,037 |
| PrivateBancorp Inc. | 1,070,481 | 58,009 |
| First American Financial Corp. | 1,553,012 | 56,887 |
| New Residential Investment Corp. | 3,546,185 | 55,746 |
| BankUnited Inc. | 1,470,710 | 55,431 |
| Hanover Insurance Group Inc. | 601,230 | 54,718 |
| Radian Group Inc. | 3,032,329 | 54,521 |
| Chemical Financial Corp. | 996,147 | 53,961 |
| * Equity Commonwealth | 1,771,971 | 53,584 |
| Realogy Holdings Corp. | 2,078,889 | 53,490 |
| Bank of Hawaii Corp. | 602,842 | 53,466 |
| Wintrust Financial Corp. | 730,792 | 53,034 |
| MB Financial Inc. | 1,122,380 | 53,010 |
| Associated Banc-Corp | 2,124,011 | 52,463 |
| IBERIABANK Corp. | 623,952 | 52,256 |
| Retail Properties of America Inc. | 3,350,754 | 51,367 |
| Hancock Holding Co. | 1,173,841 | 50,593 |
| United Bankshares Inc. | 1,083,366 | 50,106 |
| * MGIC Investment Corp. | 4,816,451 | 49,080 |
| LaSalle Hotel Properties | 1,596,425 | 48,643 |
| FNB Corp. | 2,974,619 | 47,683 |
| CNO Financial Group Inc. | 2,449,405 | 46,906 |
| DuPont Fabros Technology Inc. | 1,066,930 | 46,870 |
| Aspen Insurance Holdings Ltd. | 849,770 | 46,737 |
| Sunstone Hotel Investors Inc. | 3,061,265 | 46,684 |
| First Industrial Realty Trust Inc. | 1,652,086 | 46,341 |
| PacWest Bancorp | 850,332 | 46,292 |
| Rayonier Inc. | 1,735,180 | 46,156 |
| Fulton Financial Corp. | 2,446,437 | 45,993 |
| UMB Financial Corp. | 595,132 | 45,897 |
| Primerica Inc. | 647,076 | 44,745 |
| * Stifel Financial Corp. | 888,669 | 44,389 |
| Empire State Realty Trust Inc. | 2,173,288 | 43,879 |
| Washington Federal Inc. | 1,257,499 | 43,195 |
| White Mountains Insurance Group Ltd. | 51,608 | 43,147 |
| Omega Healthcare Investors Inc. | 1,379,607 | 43,127 |
| Chimera Investment Corp. | 2,521,708 | 42,919 |
| Piedmont Office Realty Trust Inc. Class A | 2,050,722 | 42,881 |
| Two Harbors Investment Corp. | 4,908,295 | 42,800 |
| TCF Financial Corp. | 2,175,631 | 42,621 |
| * SLM Corp. | 3,855,184 | 42,484 |
| Sterling Bancorp | 1,806,768 | 42,278 |
| ProAssurance Corp. | 751,865 | 42,255 |
| RLJ Lodging Trust | 1,668,713 | 40,867 |
| Brandywine Realty Trust | 2,473,794 | 40,842 |
| CoreCivic Inc. | 1,662,189 | 40,657 |
| Erie Indemnity Co. Class A | 360,454 | 40,533 |
| Cathay General Bancorp | 1,057,526 | 40,218 |
| ^ First Financial Bankshares Inc. | 886,040 | 40,049 |
| MFA Financial Inc. | 5,240,171 | 39,983 |
| LPL Financial Holdings Inc. | 1,134,678 | 39,952 |
| Valley National Bancorp | 3,418,701 | 39,794 |
| Hope Bancorp Inc. | 1,812,833 | 39,683 |
| National Health Investors Inc. | 534,428 | 39,639 |
| Glacier Bancorp Inc. | 1,080,573 | 39,149 |
| Community Bank System Inc. | 626,922 | 38,738 |
41
| | |
| Vanguard® Small-Cap Value Index Fund | | |
| Schedule of Investments | | |
| December 31, 2016 | | |
| |
| | | Market |
| | | Value |
| | Shares | ($000) |
| NorthStar Realty Finance Corp. | 2,554,871 | 38,706 |
| First Citizens BancShares Inc. Class A | 108,741 | 38,603 |
| Legg Mason Inc. | 1,283,450 | 38,388 |
| GEO Group Inc. | 1,059,068 | 38,052 |
| Blackstone Mortgage Trust Inc. Class A | 1,261,322 | 37,928 |
| Columbia Property Trust Inc. | 1,743,412 | 37,658 |
| Assurant Inc. | 402,528 | 37,379 |
| RLI Corp. | 588,975 | 37,182 |
| BancorpSouth Inc. | 1,190,858 | 36,976 |
| Federated Investors Inc. Class B | 1,298,809 | 36,730 |
| Columbia Banking System Inc. | 819,452 | 36,613 |
| Great Western Bancorp Inc. | 828,154 | 36,099 |
| Forest City Realty Trust Inc. Class A | 1,705,274 | 35,538 |
| American National Insurance Co. | 285,065 | 35,522 |
| Navient Corp. | 2,139,696 | 35,155 |
| Selective Insurance Group Inc. | 816,337 | 35,143 |
| Old National Bancorp | 1,905,870 | 34,592 |
| Washington REIT | 1,052,574 | 34,409 |
| Interactive Brokers Group Inc. | 911,959 | 33,296 |
| CVB Financial Corp. | 1,450,595 | 33,262 |
| Mack-Cali Realty Corp. | 1,139,950 | 33,081 |
| DiamondRock Hospitality Co. | 2,832,949 | 32,664 |
| EastGroup Properties Inc. | 441,127 | 32,573 |
| Trustmark Corp. | 907,242 | 32,343 |
| International Bancshares Corp. | 791,408 | 32,289 |
| BGC Partners Inc. Class A | 3,101,442 | 31,728 |
| Care Capital Properties Inc. | 1,184,072 | 29,602 |
| Xenia Hotels & Resorts Inc. | 1,510,162 | 29,327 |
| EverBank Financial Corp. | 1,503,737 | 29,248 |
| First Midwest Bancorp Inc. | 1,147,035 | 28,940 |
| Lexington Realty Trust | 2,677,352 | 28,915 |
| Capitol Federal Financial Inc. | 1,745,523 | 28,731 |
| South State Corp. | 324,811 | 28,388 |
| United Community Banks Inc. | 949,476 | 28,123 |
| CBL & Associates Properties Inc. | 2,412,739 | 27,747 |
| Janus Capital Group Inc. | 2,062,975 | 27,376 |
| * Genworth Financial Inc. Class A | 7,028,534 | 26,779 |
| American Equity Investment Life Holding Co. | 1,180,730 | 26,614 |
| Argo Group International Holdings Ltd. | 402,051 | 26,495 |
| AmTrust Financial Services Inc. | 963,886 | 26,391 |
| LTC Properties Inc. | 553,935 | 26,024 |
| NBT Bancorp Inc. | 608,642 | 25,490 |
| WesBanco Inc. | 588,663 | 25,348 |
| Banner Corp. | 448,526 | 25,032 |
| * Enstar Group Ltd. | 126,196 | 24,949 |
| Independent Bank Corp. | 353,123 | 24,878 |
| Northwest Bancshares Inc. | 1,359,007 | 24,503 |
| * PRA Group Inc. | 621,942 | 24,318 |
| Horace Mann Educators Corp. | 567,485 | 24,288 |
| HRG Group Inc. | 1,558,842 | 24,256 |
| Outfront Media Inc. | 973,718 | 24,216 |
| Astoria Financial Corp. | 1,288,089 | 24,023 |
| Kemper Corp. | 541,517 | 23,989 |
| Provident Financial Services Inc. | 842,841 | 23,852 |
| Potlatch Corp. | 571,502 | 23,803 |
| New York REIT Inc. | 2,342,530 | 23,706 |
| First Financial Bancorp | 830,820 | 23,637 |
| Mercury General Corp. | 390,414 | 23,507 |
| BOK Financial Corp. | 279,083 | 23,175 |
| Invesco Mortgage Capital Inc. | 1,573,609 | 22,975 |
| Select Income REIT | 882,411 | 22,237 |
| Park National Corp. | 183,978 | 22,015 |
| Waddell & Reed Financial Inc. Class A | 1,111,253 | 21,681 |
| ^ Westamerica Bancorporation | 344,062 | 21,652 |
42
| | |
| Vanguard® Small-Cap Value Index Fund | | |
| Schedule of Investments | | |
| December 31, 2016 | | |
| |
| | | Market |
| | | Value |
| | Shares | ($000) |
| Pinnacle Financial Partners Inc. | 309,723 | 21,464 |
| Corporate Office Properties Trust | 670,420 | 20,931 |
| Navigators Group Inc. | 174,835 | 20,587 |
| * Quality Care Properties Inc. | 1,322,427 | 20,498 |
| * MBIA Inc. | 1,819,951 | 19,473 |
| Government Properties Income Trust | 1,005,102 | 19,162 |
| Tompkins Financial Corp. | 201,949 | 19,092 |
| Global Net Lease Inc. | 2,400,861 | 18,799 |
| Franklin Street Properties Corp. | 1,439,881 | 18,661 |
| Boston Private Financial Holdings Inc. | 1,115,251 | 18,457 |
| S&T Bancorp Inc. | 467,587 | 18,255 |
| First Commonwealth Financial Corp. | 1,256,176 | 17,813 |
| Beneficial Bancorp Inc. | 965,360 | 17,763 |
| Pennsylvania REIT | 932,602 | 17,682 |
| Employers Holdings Inc. | 430,462 | 17,046 |
| Maiden Holdings Ltd. | 973,643 | 16,990 |
| National General Holdings Corp. | 675,808 | 16,888 |
| Artisan Partners Asset Management Inc. Class A | 565,246 | 16,816 |
| CYS Investments Inc. | 2,132,492 | 16,484 |
| Redwood Trust Inc. | 1,082,878 | 16,471 |
| Brookline Bancorp Inc. | 946,947 | 15,530 |
| Berkshire Hills Bancorp Inc. | 418,058 | 15,405 |
| Colony Capital Inc. Class A | 758,658 | 15,363 |
| Nelnet Inc. Class A | 302,459 | 15,350 |
| Safety Insurance Group Inc. | 203,419 | 14,992 |
| * Piper Jaffray Cos. | 202,418 | 14,675 |
| PennyMac Mortgage Investment Trust | 892,706 | 14,614 |
| * Green Dot Corp. Class A | 603,028 | 14,201 |
| United Fire Group Inc. | 285,985 | 14,062 |
| Capstead Mortgage Corp. | 1,353,704 | 13,794 |
| City Holding Co. | 201,590 | 13,627 |
| Washington Prime Group Inc. | 1,298,168 | 13,514 |
| State Bank Financial Corp. | 495,360 | 13,305 |
| Infinity Property & Casualty Corp. | 148,489 | 13,052 |
| Ladder Capital Corp. Class A | 948,809 | 13,018 |
| Central Pacific Financial Corp. | 413,189 | 12,982 |
| Monogram Residential Trust Inc. | 1,173,580 | 12,698 |
| Investors Real Estate Trust | 1,732,837 | 12,355 |
| * FNFV Group | 894,636 | 12,257 |
| * Walker & Dunlop Inc. | 390,904 | 12,196 |
| * First BanCorp | 1,838,433 | 12,152 |
| Hersha Hospitality Trust Class A | 560,343 | 12,047 |
| Renasant Corp. | 281,986 | 11,905 |
| American Assets Trust Inc. | 273,608 | 11,787 |
| * iStar Inc. | 951,070 | 11,765 |
| Universal Health Realty Income Trust | 174,178 | 11,424 |
| * KCG Holdings Inc. Class A | 851,103 | 11,277 |
| ^ ARMOUR Residential REIT Inc. | 516,725 | 11,208 |
| Saul Centers Inc. | 165,994 | 11,057 |
| FBL Financial Group Inc. Class A | 140,656 | 10,992 |
| Chesapeake Lodging Trust | 423,910 | 10,962 |
| First Hawaiian Inc. | 298,202 | 10,383 |
| BancFirst Corp. | 111,379 | 10,364 |
| * Santander Consumer USA Holdings Inc. | 765,726 | 10,337 |
| Oritani Financial Corp. | 547,205 | 10,260 |
| MTGE Investment Corp. | 652,135 | 10,239 |
| National Western Life Group Inc. Class A | 31,847 | 9,898 |
| * Greenlight Capital Re Ltd. Class A | 420,485 | 9,587 |
| Virtus Investment Partners Inc. | 79,022 | 9,329 |
| * Encore Capital Group Inc. | 325,110 | 9,314 |
| Getty Realty Corp. | 360,329 | 9,185 |
| * Ambac Financial Group Inc. | 404,497 | 9,101 |
| Ashford Hospitality Trust Inc. | 1,165,537 | 9,045 |
| Investment Technology Group Inc. | 438,066 | 8,647 |
43
| | | |
| Vanguard® Small-Cap Value Index Fund | | |
| Schedule of Investments | | |
| December 31, 2016 | | |
| |
| | | | Market |
| | | | Value |
| | | Shares | ($000) |
| | First Potomac Realty Trust | 786,943 | 8,633 |
| | Dime Community Bancshares Inc. | 425,308 | 8,549 |
| * | OneMain Holdings Inc. Class A | 381,273 | 8,441 |
| | OFG Bancorp | 626,623 | 8,209 |
| * | Flagstar Bancorp Inc. | 282,986 | 7,624 |
| | Anworth Mortgage Asset Corp. | 1,366,461 | 7,065 |
| | AG Mortgage Investment Trust Inc. | 396,408 | 6,783 |
| ^ | Seritage Growth Properties Class A | 146,034 | 6,237 |
| | Virtu Financial Inc. Class A | 388,914 | 6,203 |
| * | Forestar Group Inc. | 455,848 | 6,063 |
| | First Interstate BancSystem Inc. Class A | 137,824 | 5,864 |
| | Northfield Bancorp Inc. | 292,927 | 5,850 |
| | State Auto Financial Corp. | 207,719 | 5,569 |
| | OneBeacon Insurance Group Ltd. Class A | 284,562 | 4,567 |
| | Ashford Hospitality Prime Inc. | 329,584 | 4,499 |
| * | MoneyGram International Inc. | 379,095 | 4,477 |
| * | World Acceptance Corp. | 62,707 | 4,031 |
| ^ | Fidelity & Guaranty Life | 168,607 | 3,996 |
| * | Nationstar Mortgage Holdings Inc. | 204,451 | 3,692 |
| * | EZCORP Inc. Class A | 343,595 | 3,659 |
| * | Drive Shack Inc. | 856,051 | 3,219 |
| | Houlihan Lokey Inc. | 87,842 | 2,734 |
| * | Altisource Portfolio Solutions SA | 85,771 | 2,281 |
| | GAMCO Investors Inc. Class A | 65,783 | 2,032 |
| | RMR Group Inc. Class A | 47,332 | 1,870 |
| | Resource Capital Corp. | 206,738 | 1,722 |
| | Associated Capital Group Inc. Class A | 30,360 | 997 |
| | | | 7,694,742 |
| Health Care (5.4%) | | |
| | Teleflex Inc. | 622,683 | 100,345 |
| * | United Therapeutics Corp. | 599,606 | 86,001 |
| * | WellCare Health Plans Inc. | 626,154 | 85,833 |
| * | Bio-Rad Laboratories Inc. Class A | 293,022 | 53,412 |
| * | Envision Healthcare Corp. | 828,381 | 52,428 |
| * | Charles River Laboratories International Inc. | 669,434 | 51,004 |
| | HealthSouth Corp. | 1,204,216 | 49,662 |
| * | Alere Inc. | 1,228,200 | 47,863 |
| | Hill-Rom Holdings Inc. | 835,998 | 46,933 |
| * | Endo International plc | 2,836,188 | 46,712 |
| | STERIS plc | 602,446 | 40,599 |
| * | Prestige Brands Holdings Inc. | 748,195 | 38,981 |
| *,^ | Integra LifeSciences Holdings Corp. | 422,449 | 36,242 |
| *,^ | TESARO Inc. | 264,358 | 35,551 |
| * | Molina Healthcare Inc. | 602,728 | 32,704 |
| * | Brookdale Senior Living Inc. | 2,631,303 | 32,681 |
| * | LifePoint Health Inc. | 567,248 | 32,220 |
| | Owens & Minor Inc. | 868,239 | 30,640 |
| * | VWR Corp. | 1,207,300 | 30,219 |
| *,^ | Kite Pharma Inc. | 562,770 | 25,235 |
| * | Magellan Health Inc. | 328,177 | 24,695 |
| * | Halyard Health Inc. | 659,156 | 24,376 |
| | Patterson Cos. Inc. | 593,634 | 24,357 |
| * | Sage Therapeutics Inc. | 446,687 | 22,808 |
| *,^ | Clovis Oncology Inc. | 464,064 | 20,614 |
| * | Select Medical Holdings Corp. | 1,481,175 | 19,625 |
| * | Surgical Care Affiliates Inc. | 399,331 | 18,477 |
| * | Portola Pharmaceuticals Inc. | 799,437 | 17,939 |
| * | Tenet Healthcare Corp. | 1,129,070 | 16,755 |
| * | Myriad Genetics Inc. | 966,865 | 16,118 |
| | CONMED Corp. | 353,992 | 15,636 |
| * | Synergy Pharmaceuticals Inc. | 2,428,216 | 14,788 |
| * | Haemonetics Corp. | 365,638 | 14,699 |
| *,^ | Juno Therapeutics Inc. | 560,816 | 10,571 |
| * | LHC Group Inc. | 220,089 | 10,058 |
44
| | | |
| Vanguard® Small-Cap Value Index Fund | | |
| Schedule of Investments | | |
| December 31, 2016 | | |
| |
| | | | Market |
| | | | Value |
| | | Shares | ($000) |
| | National HealthCare Corp. | 128,320 | 9,725 |
| | Kindred Healthcare Inc. | 1,155,667 | 9,072 |
| * | Community Health Systems Inc. | 1,540,839 | 8,613 |
| * | Spark Therapeutics Inc. | 164,865 | 8,227 |
| * | Merit Medical Systems Inc. | 300,133 | 7,953 |
| | Ensign Group Inc. | 342,549 | 7,608 |
| * | Intra-Cellular Therapies Inc. Class A | 462,531 | 6,980 |
| * | Impax Laboratories Inc. | 522,214 | 6,919 |
| * | Universal American Corp. | 638,728 | 6,355 |
| * | Aimmune Therapeutics Inc. | 296,568 | 6,065 |
| | Invacare Corp. | 430,579 | 5,619 |
| * | Healthways Inc. | 230,339 | 5,240 |
| *,^ | Celldex Therapeutics Inc. | 1,427,600 | 5,054 |
| | PDL BioPharma Inc. | 2,369,745 | 5,024 |
| *,^ | Global Blood Therapeutics Inc. | 339,496 | 4,906 |
| * | PTC Therapeutics Inc. | 233,649 | 2,549 |
| *,^ | Ophthotech Corp. | 457,883 | 2,212 |
| *,^ | NantKwest Inc. | 348,298 | 1,992 |
| *,^ | Cempra Inc. | 661,524 | 1,852 |
| * | Wright Medical Group Inc. CVR Expires 12/31/2049 | 71,097 | 94 |
| | | | 1,338,840 |
| Industrials (20.4%) | | |
| | Huntington Ingalls Industries Inc. | 655,405 | 120,719 |
| | Broadridge Financial Solutions Inc. | 1,682,336 | 111,539 |
| | Valspar Corp. | 1,009,314 | 104,575 |
| | Carlisle Cos. Inc. | 911,357 | 100,514 |
| | Spirit AeroSystems Holdings Inc. Class A | 1,721,192 | 100,432 |
| | IDEX Corp. | 1,076,709 | 96,968 |
| | Allegion plc | 1,357,270 | 86,865 |
| | PerkinElmer Inc. | 1,548,524 | 80,756 |
| | MDU Resources Group Inc. | 2,760,755 | 79,427 |
| * | AECOM | 2,176,210 | 79,127 |
| | Donaldson Co. Inc. | 1,875,041 | 78,902 |
| | Sonoco Products Co. | 1,409,577 | 74,285 |
| | Orbital ATK Inc. | 826,918 | 72,546 |
| | Booz Allen Hamilton Holding Corp. Class A | 2,001,940 | 72,210 |
| * | Quanta Services Inc. | 2,045,252 | 71,277 |
| | Oshkosh Corp. | 1,052,698 | 68,015 |
| | AptarGroup Inc. | 885,799 | 65,062 |
| | Lincoln Electric Holdings Inc. | 838,979 | 64,325 |
| | Bemis Co. Inc. | 1,324,660 | 63,345 |
| | EMCOR Group Inc. | 857,555 | 60,681 |
| | Trinity Industries Inc. | 2,152,695 | 59,759 |
| | MSC Industrial Direct Co. Inc. Class A | 631,327 | 58,328 |
| | Packaging Corp. of America | 666,261 | 56,512 |
| | Ryder System Inc. | 756,163 | 56,289 |
| | Graphic Packaging Holding Co. | 4,490,706 | 56,044 |
| | AGCO Corp. | 964,872 | 55,827 |
| | Curtiss-Wright Corp. | 562,500 | 55,327 |
| * | Teledyne Technologies Inc. | 443,921 | 54,602 |
| | Jabil Circuit Inc. | 2,226,704 | 52,706 |
| | Crane Co. | 704,147 | 50,783 |
| | BWX Technologies Inc. | 1,260,724 | 50,051 |
| | Deluxe Corp. | 686,120 | 49,133 |
| * | Kirby Corp. | 723,105 | 48,086 |
| | ITT Inc. | 1,245,138 | 48,025 |
| | EnerSys | 612,867 | 47,865 |
| * | WESCO International Inc. | 686,590 | 45,693 |
| | World Fuel Services Corp. | 994,719 | 45,668 |
| | Chicago Bridge & Iron Co. NV | 1,415,176 | 44,932 |
| * | CoreLogic Inc. | 1,219,825 | 44,926 |
| | Terex Corp. | 1,422,496 | 44,851 |
| | Belden Inc. | 595,446 | 44,521 |
| * | Keysight Technologies Inc. | 1,200,212 | 43,892 |
45
| | |
| Vanguard® Small-Cap Value Index Fund | | |
| Schedule of Investments | | |
| December 31, 2016 | | |
| |
| | | Market |
| | | Value |
| | Shares | ($000) |
| Regal Beloit Corp. | 631,710 | 43,746 |
| * Colfax Corp. | 1,213,345 | 43,595 |
| Valmont Industries Inc. | 301,964 | 42,547 |
| * Owens-Illinois Inc. | 2,293,450 | 39,929 |
| Timken Co. | 990,134 | 39,308 |
| Joy Global Inc. | 1,387,644 | 38,854 |
| * Sanmina Corp. | 1,036,088 | 37,973 |
| * Esterline Technologies Corp. | 417,401 | 37,232 |
| * Generac Holdings Inc. | 901,223 | 36,716 |
| * MasTec Inc. | 932,250 | 35,659 |
| Kennametal Inc. | 1,130,417 | 35,337 |
| Tetra Tech Inc. | 805,356 | 34,751 |
| GATX Corp. | 563,341 | 34,691 |
| Barnes Group Inc. | 721,127 | 34,196 |
| KBR Inc. | 2,014,425 | 33,621 |
| * KLX Inc. | 743,919 | 33,558 |
| * Anixter International Inc. | 396,771 | 32,158 |
| UniFirst Corp. | 217,996 | 31,315 |
| MSA Safety Inc. | 450,803 | 31,254 |
| Applied Industrial Technologies Inc. | 523,359 | 31,088 |
| Granite Construction Inc. | 559,862 | 30,792 |
| Vishay Intertechnology Inc. | 1,890,010 | 30,618 |
| ABM Industries Inc. | 748,242 | 30,558 |
| Silgan Holdings Inc. | 596,086 | 30,508 |
| * Moog Inc. Class A | 454,207 | 29,832 |
| Convergys Corp. | 1,212,310 | 29,774 |
| * Rexnord Corp. | 1,451,243 | 28,430 |
| CLARCOR Inc. | 343,832 | 28,356 |
| Universal Forest Products Inc. | 272,801 | 27,875 |
| * FTI Consulting Inc. | 598,398 | 26,976 |
| * Swift Transportation Co. | 1,107,116 | 26,969 |
| G&K Services Inc. Class A | 278,644 | 26,875 |
| Brink's Co. | 633,898 | 26,148 |
| * NeuStar Inc. Class A | 769,994 | 25,718 |
| Watts Water Technologies Inc. Class A | 393,528 | 25,658 |
| * Plexus Corp. | 473,135 | 25,568 |
| Brady Corp. Class A | 634,863 | 23,839 |
| Otter Tail Corp. | 554,095 | 22,607 |
| * Navistar International Corp. | 691,943 | 21,706 |
| Korn/Ferry International | 734,938 | 21,629 |
| Matson Inc. | 605,159 | 21,417 |
| * Benchmark Electronics Inc. | 690,287 | 21,054 |
| * Knowles Corp. | 1,252,841 | 20,935 |
| Actuant Corp. Class A | 791,038 | 20,527 |
| Greif Inc. Class A | 392,034 | 20,115 |
| ESCO Technologies Inc. | 344,948 | 19,541 |
| * Louisiana-Pacific Corp. | 1,005,503 | 19,034 |
| Kaman Corp. | 382,610 | 18,721 |
| Astec Industries Inc. | 276,687 | 18,665 |
| Insperity Inc. | 255,549 | 18,131 |
| * SPX FLOW Inc. | 560,669 | 17,975 |
| Triumph Group Inc. | 664,986 | 17,622 |
| * Atlas Air Worldwide Holdings Inc. | 335,675 | 17,505 |
| * Navigant Consulting Inc. | 664,644 | 17,400 |
| Cubic Corp. | 344,501 | 16,519 |
| Werner Enterprises Inc. | 612,504 | 16,507 |
| * TTM Technologies Inc. | 1,207,917 | 16,464 |
| Aircastle Ltd. | 775,075 | 16,160 |
| RR Donnelley & Sons Co. | 986,494 | 16,100 |
| Greenbrier Cos. Inc. | 381,275 | 15,842 |
| Standex International Corp. | 179,508 | 15,770 |
| * Sykes Enterprises Inc. | 543,606 | 15,688 |
| EVERTEC Inc. | 880,014 | 15,620 |
| * Huron Consulting Group Inc. | 306,935 | 15,546 |
46
| | |
| Vanguard® Small-Cap Value Index Fund | | |
| Schedule of Investments | | |
| December 31, 2016 | | |
| |
| | | Market |
| | | Value |
| | Shares | ($000) |
| * Tutor Perini Corp. | 554,356 | 15,522 |
| Harsco Corp. | 1,129,231 | 15,358 |
| * Meritor Inc. | 1,222,099 | 15,178 |
| ManTech International Corp. Class A | 357,879 | 15,120 |
| * TriMas Corp. | 643,111 | 15,113 |
| AAR Corp. | 457,131 | 15,108 |
| CIRCOR International Inc. | 232,020 | 15,053 |
| * TrueBlue Inc. | 599,424 | 14,776 |
| * Wabash National Corp. | 877,436 | 13,881 |
| MTS Systems Corp. | 235,065 | 13,328 |
| * Integer Holdings Corp. | 434,658 | 12,801 |
| Altra Industrial Motion Corp. | 346,161 | 12,773 |
| * SPX Corp. | 532,463 | 12,630 |
| McGrath RentCorp | 321,247 | 12,590 |
| General Cable Corp. | 660,441 | 12,581 |
| * DigitalGlobe Inc. | 438,957 | 12,576 |
| * Boise Cascade Co. | 547,183 | 12,312 |
| * Armstrong World Industries Inc. | 291,171 | 12,171 |
| Encore Wire Corp. | 277,694 | 12,038 |
| * PHH Corp. | 756,675 | 11,471 |
| * Wesco Aircraft Holdings Inc. | 766,894 | 11,465 |
| * Air Transport Services Group Inc. | 714,029 | 11,396 |
| * Babcock & Wilcox Enterprises Inc. | 686,294 | 11,386 |
| Quad/Graphics Inc. | 416,493 | 11,195 |
| Materion Corp. | 281,369 | 11,142 |
| LSC Communications Inc. | 371,657 | 11,031 |
| Essendant Inc. | 520,197 | 10,872 |
| * Aegion Corp. Class A | 454,150 | 10,763 |
| * Manitowoc Co. Inc. | 1,776,882 | 10,626 |
| H&E Equipment Services Inc. | 451,948 | 10,508 |
| EnPro Industries Inc. | 150,173 | 10,116 |
| Kelly Services Inc. Class A | 420,183 | 9,631 |
| Mobile Mini Inc. | 316,422 | 9,572 |
| Resources Connection Inc. | 491,562 | 9,463 |
| Albany International Corp. | 203,905 | 9,441 |
| AVX Corp. | 597,115 | 9,333 |
| Schnitzer Steel Industries Inc. | 360,090 | 9,254 |
| Triton International Ltd. | 575,311 | 9,090 |
| ArcBest Corp. | 324,523 | 8,973 |
| Comfort Systems USA Inc. | 262,002 | 8,725 |
| Kforce Inc. | 345,953 | 7,991 |
| * GMS Inc. | 260,052 | 7,614 |
| * TimkenSteel Corp. | 473,701 | 7,333 |
| * RPX Corp. | 669,384 | 7,229 |
| * Milacron Holdings Corp. | 383,470 | 7,144 |
| Sturm Ruger & Co. Inc. | 134,547 | 7,091 |
| Hyster-Yale Materials Handling Inc. | 106,639 | 6,800 |
| * Cotiviti Holdings Inc. | 192,466 | 6,621 |
| * Atkore International Group Inc. | 264,603 | 6,327 |
| Griffon Corp. | 238,684 | 6,254 |
| Landauer Inc. | 128,640 | 6,188 |
| TeleTech Holdings Inc. | 196,702 | 5,999 |
| * Forterra Inc. | 270,802 | 5,866 |
| Park Electrochemical Corp. | 275,149 | 5,132 |
| ^ American Railcar Industries Inc. | 111,162 | 5,035 |
| * DHI Group Inc. | 679,601 | 4,247 |
| * Donnelley Financial Solutions Inc. | 182,805 | 4,201 |
| * Armstrong Flooring Inc. | 168,786 | 3,361 |
| * Roadrunner Transportation Systems Inc. | 213,649 | 2,220 |
| Greif Inc. Class B | 30,947 | 2,090 |
| * International Seaways Inc. | 140,388 | 1,971 |
| * Overseas Shipholding Group Inc. Class A | 417,045 | 1,597 |
| ^ Textainer Group Holdings Ltd. | 45,993 | 343 |
| | | 5,057,228 |
47
| | | |
| Vanguard® Small-Cap Value Index Fund | | |
| Schedule of Investments | | |
| December 31, 2016 | | |
| |
| | | | Market |
| | | | Value |
| | | Shares | ($000) |
| Oil & Gas (5.8%) | | |
| | Targa Resources Corp. | 2,428,085 | 136,143 |
| * | Chesapeake Energy Corp. | 12,543,429 | 88,055 |
| *,^ | Transocean Ltd. | 5,166,607 | 76,156 |
| * | WPX Energy Inc. | 4,869,465 | 70,948 |
| | Nabors Industries Ltd. | 3,806,674 | 62,429 |
| * | QEP Resources Inc. | 3,386,639 | 62,348 |
| * | Oasis Petroleum Inc. | 3,336,492 | 50,515 |
| * | Whiting Petroleum Corp. | 4,013,850 | 48,247 |
| | Western Refining Inc. | 1,149,822 | 43,521 |
| | PBF Energy Inc. Class A | 1,529,188 | 42,634 |
| | Ensco plc Class A | 4,284,998 | 41,650 |
| * | Energen Corp. | 686,342 | 39,581 |
| | Oceaneering International Inc. | 1,386,684 | 39,118 |
| | SemGroup Corp. Class A | 934,763 | 39,026 |
| | Superior Energy Services Inc. | 2,142,461 | 36,165 |
| | Murphy Oil Corp. | 1,154,841 | 35,950 |
| *,^ | First Solar Inc. | 1,100,362 | 35,311 |
| * | Weatherford International plc | 6,925,304 | 34,557 |
| * | Rowan Cos. plc Class A | 1,771,117 | 33,456 |
| * | Dril-Quip Inc. | 530,699 | 31,868 |
| * | NOW Inc. | 1,441,871 | 29,515 |
| * | Oil States International Inc. | 726,569 | 28,336 |
| * | MRC Global Inc. | 1,278,590 | 25,904 |
| * | McDermott International Inc. | 3,404,108 | 25,156 |
| | SM Energy Co. | 680,033 | 23,448 |
| * | Denbury Resources Inc. | 5,627,810 | 20,710 |
| * | Forum Energy Technologies Inc. | 938,950 | 20,657 |
| | Noble Corp. plc | 3,435,844 | 20,340 |
| * | Unit Corp. | 727,247 | 19,541 |
| | Delek US Holdings Inc. | 787,985 | 18,967 |
| * | Chart Industries Inc. | 430,731 | 15,515 |
| *,^ | Diamond Offshore Drilling Inc. | 869,022 | 15,382 |
| * | Laredo Petroleum Inc. | 1,022,713 | 14,461 |
| * | Helix Energy Solutions Group Inc. | 1,529,198 | 13,488 |
| | Archrock Inc. | 935,149 | 12,344 |
| ^ | Atwood Oceanics Inc. | 869,167 | 11,412 |
| * | Exterran Corp. | 450,310 | 10,762 |
| * | Centennial Resource Development Inc. Class A | 482,534 | 9,516 |
| * | TETRA Technologies Inc. | 1,515,908 | 7,610 |
| | Green Plains Inc. | 260,433 | 7,253 |
| | Bristow Group Inc. | 326,248 | 6,682 |
| | CVR Energy Inc. | 249,151 | 6,326 |
| *,^ | SunPower Corp. Class A | 796,873 | 5,267 |
| | Alon USA Energy Inc. | 461,306 | 5,250 |
| * | Tesco Corp. | 628,525 | 5,185 |
| *,^ | EP Energy Corp. Class A | 537,230 | 3,519 |
| * | CARBO Ceramics Inc. | 160,055 | 1,674 |
| | | | 1,431,898 |
| Other (0.0%)2 | | |
| * | Leap Wireless International Inc. CVR | 474,686 | 1,196 |
| * | Clinical Data Contingent Value Rights | 62,138 | — |
| | | | 1,196 |
| Technology (8.1%) | | |
| | CDW Corp. | 2,266,440 | 118,059 |
| | Leidos Holdings Inc. | 2,125,385 | 108,692 |
| * | CommScope Holding Co. Inc. | 2,726,235 | 101,416 |
| * | Microsemi Corp. | 1,620,672 | 87,468 |
| * | ARRIS International plc | 2,681,359 | 80,789 |
| * | ON Semiconductor Corp. | 5,894,210 | 75,210 |
| | CSRA Inc. | 2,310,260 | 73,559 |
| | Teradyne Inc. | 2,844,030 | 72,238 |
| * | NCR Corp. | 1,752,215 | 71,070 |
| | Brocade Communications Systems Inc. | 5,687,328 | 71,035 |
48
| | | |
| Vanguard® Small-Cap Value Index Fund | | |
| Schedule of Investments | | |
| December 31, 2016 | | |
| |
| | | | Market |
| | | | Value |
| | | Shares | ($000) |
| * | Advanced Micro Devices Inc. | 5,568,816 | 63,150 |
| | Computer Sciences Corp. | 995,528 | 59,154 |
| | Mentor Graphics Corp. | 1,529,462 | 56,422 |
| | SYNNEX Corp. | 421,177 | 50,971 |
| * | Teradata Corp. | 1,833,750 | 49,823 |
| | Cypress Semiconductor Corp. | 4,327,456 | 49,506 |
| | DST Systems Inc. | 451,582 | 48,387 |
| | Intersil Corp. Class A | 1,933,258 | 43,112 |
| * | CACI International Inc. Class A | 344,299 | 42,796 |
| | Science Applications International Corp. | 500,259 | 42,422 |
| * | Tech Data Corp. | 497,920 | 42,164 |
| | Pitney Bowes Inc. | 2,623,341 | 39,849 |
| * | Cree Inc. | 1,409,791 | 37,204 |
| * | TiVo Corp. | 1,602,214 | 33,486 |
| * | Verint Systems Inc. | 890,571 | 31,393 |
| * | Nuance Communications Inc. | 2,035,108 | 30,323 |
| * | Semtech Corp. | 926,126 | 29,219 |
| * | VeriFone Systems Inc. | 1,569,862 | 27,834 |
| * | Viavi Solutions Inc. | 3,248,951 | 26,576 |
| * | Cirrus Logic Inc. | 449,320 | 25,405 |
| * | NETGEAR Inc. | 444,072 | 24,135 |
| | Diebold Nixdorf Inc. | 954,368 | 24,002 |
| * | EchoStar Corp. Class A | 458,611 | 23,568 |
| | CSG Systems International Inc. | 432,755 | 20,945 |
| | Cabot Microelectronics Corp. | 330,167 | 20,857 |
| | Progress Software Corp. | 651,003 | 20,787 |
| * | Insight Enterprises Inc. | 500,823 | 20,253 |
| ^ | Ebix Inc. | 320,155 | 18,265 |
| | West Corp. | 704,725 | 17,449 |
| | Brooks Automation Inc. | 918,586 | 15,680 |
| * | Web.com Group Inc. | 684,908 | 14,486 |
| * | ScanSource Inc. | 354,978 | 14,323 |
| * | Amkor Technology Inc. | 1,175,438 | 12,401 |
| *,^ | Unisys Corp. | 713,616 | 10,669 |
| *,^ | Match Group Inc. | 596,688 | 10,203 |
| * | Quality Systems Inc. | 745,092 | 9,798 |
| * | Ixia | 523,220 | 8,424 |
| * | Blucora Inc. | 532,939 | 7,861 |
| * | FormFactor Inc. | 501,470 | 5,617 |
| * | Tangoe Inc. | 477,939 | 3,766 |
| * | Coupa Software Inc. | 100,925 | 2,524 |
| | Computer Programs & Systems Inc. | 88,915 | 2,098 |
| * | Sonus Networks Inc. | 328,291 | 2,068 |
| | Comtech Telecommunications Corp. | 156,501 | 1,855 |
| | Systemax Inc. | 191,649 | 1,681 |
| * | Harmonic Inc. | 286,018 | 1,430 |
| | | | 2,003,877 |
| Telecommunications (0.6%) | | |
| | Telephone & Data Systems Inc. | 1,305,330 | 37,685 |
| | Frontier Communications Corp. | 8,295,647 | 28,039 |
| | Consolidated Communications Holdings Inc. | 679,163 | 18,235 |
| * | Vonage Holdings Corp. | 2,616,018 | 17,920 |
| *,^ | Iridium Communications Inc. | 1,159,126 | 11,128 |
| | EarthLink Holdings Corp. | 1,501,022 | 8,466 |
| * | United States Cellular Corp. | 184,603 | 8,071 |
| | Windstream Holdings Inc. | 688,756 | 5,048 |
| *,^ | Intelsat SA | 259,250 | 692 |
| | | | 135,284 |
| Utilities (6.0%) | | |
| | Westar Energy Inc. Class A | 2,004,082 | 112,930 |
| | UGI Corp. | 2,444,124 | 112,625 |
| | Atmos Energy Corp. | 1,469,135 | 108,936 |
| | Great Plains Energy Inc. | 3,043,373 | 83,236 |
| | Aqua America Inc. | 2,504,490 | 75,235 |
49
| | | | | |
| Vanguard® Small-Cap Value Index Fund | | | | |
| Schedule of Investments | | | | |
| December 31, 2016 | | | | |
| |
| | | | | | Market |
| | | | | | Value |
| | | | | Shares | ($000) |
| | National Fuel Gas Co. | | | 1,143,308 | 64,757 |
| | Vectren Corp. | | | 1,170,517 | 61,043 |
| | IDACORP Inc. | | | 711,570 | 57,317 |
| | WGL Holdings Inc. | | | 723,841 | 55,215 |
| | NRG Energy Inc. | | | 4,460,646 | 54,688 |
| | Portland General Electric Co. | | | 1,255,606 | 54,406 |
| | Hawaiian Electric Industries Inc. | | | 1,532,064 | 50,665 |
| | ONE Gas Inc. | | | 737,200 | 47,151 |
| | Southwest Gas Corp. | | | 603,234 | 46,220 |
| | Black Hills Corp. | | | 750,430 | 46,031 |
| | ALLETE Inc. | | | 698,272 | 44,822 |
| | New Jersey Resources Corp. | | | 1,215,539 | 43,152 |
| | Spire Inc. | | | 612,097 | 39,511 |
| | NorthWestern Corp. | | | 682,299 | 38,802 |
| | PNM Resources Inc. | | | 1,125,771 | 38,614 |
| | South Jersey Industries Inc. | | | 1,121,670 | 37,789 |
| | Avista Corp. | | | 905,637 | 36,217 |
| | MGE Energy Inc. | | | 489,713 | 31,978 |
| * | Calpine Corp. | | | 2,536,248 | 28,989 |
| | El Paso Electric Co. | | | 571,615 | 26,580 |
| | Northwest Natural Gas Co. | | | 401,553 | 24,013 |
| | American States Water Co. | | | 516,575 | 23,535 |
| | California Water Service Group | | | 677,399 | 22,964 |
| | Empire District Electric Co. | | | 621,892 | 21,200 |
| |
| | | | | | 1,488,621 |
| |
| Total Common Stocks (Cost $19,706,245) | | | | 24,679,992 |
| |
| |
| |
| | | Coupon | | Shares | |
| |
| Temporary Cash Investments (1.2%)1 | | | | |
| Money Market Fund (1.2%) | | | | |
| 3,4 | Vanguard Market Liquidity Fund | 0.823% | | 2,835,641 | 283,592 |
| |
| |
| | | | | Face | |
| | | | Maturity | Amount | |
| | | | Date | ($000) | |
| U.S. Government and Agency Obligations (0.0%) | | | | |
| 5 | United States Treasury Bill | 0.487%-0.501% | 3/16/17 | 1,275 | 1,274 |
| 5 | United States Treasury Bill | 0.564% | 5/4/17 | 2,000 | 1,996 |
| 5 | United States Treasury Bill | 0.597%-0.607% | 5/25/17 | 900 | 898 |
| |
| | | | | | 4,168 |
| |
| Total Temporary Cash Investments (Cost $287,743) | | | | 287,760 |
| |
| Total Investments (100.9%) (Cost $19,993,988) | | | | 24,967,752 |
| Other Assets and Liabilities—Net (-0.9%)4 | | | | (217,436) |
| |
| Net Assets (100%) | | | | 24,750,316 |
* Non-income-producing security.
^ Includes partial security positions on loan to broker-dealers. The total value of securities on loan is $137,393,000.
1 The fund invests a portion of its cash reserves in equity markets through the use of index futures contracts and swap contracts. After giving
effect to futures and swap investments, the fund's effective common stock and temporary cash investment positions represent 100.2% and
0.7%, respectively, of net assets.
2 “Other” represents securities that are not classified by the fund’s benchmark index.
3 Affiliated money market fund available only to Vanguard funds and certain trusts and accounts managed by Vanguard. Rate shown is the 7-day
yield.
4 Includes $143,700,000 of collateral received for securities on loan.
5 Securities with a value of $4,168,000 have been segregated as initial margin for open futures contracts.
50
Vanguard® Small-Cap Value Index Fund
Schedule of Investments
December 31, 2016
CVR—Contingent Value Rights.
REIT—Real Estate Investment Trust.
51
© 2017 The Vanguard Group, Inc.
All rights reserved.
Vanguard Marketing Corporation, Distributor.
SNA480 022017
| | | |
| Vanguard® Extended Market Index Fund | | |
| Schedule of Investments | | |
| December 31, 2016 | | |
| |
| | | | Market |
| | | | Value |
| | | Shares | ($000) |
| |
| Common Stocks (99.7%)1 | | |
| Consumer Discretionary (14.3%) | | |
| ^,* | Tesla Motors Inc. | 1,472,713 | 314,704 |
| * | Liberty Global plc | 8,554,728 | 254,075 |
| | Las Vegas Sands Corp. | 4,351,681 | 232,423 |
| | Hilton Worldwide Holdings Inc. | 6,791,559 | 184,730 |
| * | MGM Resorts International | 5,721,290 | 164,945 |
| * | DISH Network Corp. Class A | 2,682,065 | 155,372 |
| | Autoliv Inc. | 1,046,657 | 118,429 |
| | Lear Corp. | 828,928 | 109,725 |
| * | Liberty Interactive Corp. QVC Group Class A | 5,241,520 | 104,726 |
| | Aramark | 2,900,704 | 103,613 |
| ^ | Sirius XM Holdings Inc. | 20,546,781 | 91,433 |
| | Domino's Pizza Inc. | 572,211 | 91,119 |
| * | Norwegian Cruise Line Holdings Ltd. | 1,939,295 | 82,478 |
| * | Lululemon Athletica Inc. | 1,267,837 | 82,397 |
| | Vail Resorts Inc. | 472,318 | 76,190 |
| * | Burlington Stores Inc. | 838,084 | 71,028 |
| * | Liberty Media Corp-Liberty SiriusXM Class C | 2,060,949 | 69,907 |
| * | NVR Inc. | 41,705 | 69,606 |
| | Gentex Corp. | 3,371,890 | 66,393 |
| * | Adient plc | 1,111,867 | 65,155 |
| | Service Corp. International | 2,253,138 | 63,989 |
| * | Liberty Global plc Class A | 2,057,608 | 62,942 |
| | Six Flags Entertainment Corp. | 1,020,934 | 61,215 |
| * | ServiceMaster Global Holdings Inc. | 1,595,255 | 60,093 |
| ^ | Polaris Industries Inc. | 706,792 | 58,233 |
| | Brunswick Corp. | 1,059,149 | 57,766 |
| | Dunkin' Brands Group Inc. | 1,083,156 | 56,801 |
| | Thor Industries Inc. | 565,531 | 56,581 |
| * | Liberty Broadband Corp. | 753,779 | 55,832 |
| | Dick's Sporting Goods Inc. | 1,044,233 | 55,449 |
| * | Toll Brothers Inc. | 1,759,642 | 54,549 |
| * | Panera Bread Co. Class A | 259,231 | 53,166 |
| | Carter's Inc. | 586,362 | 50,656 |
| | Pool Corp. | 484,246 | 50,526 |
| | Cinemark Holdings Inc. | 1,242,319 | 47,655 |
| ^ | Cracker Barrel Old Country Store Inc. | 283,620 | 47,359 |
| | Williams-Sonoma Inc. | 965,435 | 46,717 |
| * | Sally Beauty Holdings Inc. | 1,715,599 | 45,326 |
| | CST Brands Inc. | 893,412 | 43,018 |
| | Jack in the Box Inc. | 380,494 | 42,478 |
| * | Live Nation Entertainment Inc. | 1,567,272 | 41,689 |
| * | Tenneco Inc. | 656,463 | 41,009 |
| ^,* | Tempur Sealy International Inc. | 598,059 | 40,835 |
| * | Skechers U.S.A. Inc. Class A | 1,584,130 | 38,938 |
| * | AMC Networks Inc. Class A | 703,549 | 36,824 |
| | Texas Roadhouse Inc. Class A | 752,421 | 36,297 |
| * | Liberty Media Corp-Liberty SiriusXM Class A | 1,049,381 | 36,225 |
| * | Bright Horizons Family Solutions Inc. | 514,852 | 36,050 |
| * | Cabela's Inc. | 608,177 | 35,609 |
| * | Liberty Ventures Class A | 961,938 | 35,467 |
| | Cable One Inc. | 55,103 | 34,259 |
| * | Buffalo Wild Wings Inc. | 216,765 | 33,469 |
| * | Lions Gate Entertainment Corp. Class B | 1,337,494 | 32,822 |
| * | Grand Canyon Education Inc. | 556,629 | 32,535 |
| | Visteon Corp. | 401,585 | 32,263 |
| | Dana Inc. | 1,696,280 | 32,195 |
| | Wendy's Co. | 2,349,823 | 31,770 |
| | Tupperware Brands Corp. | 598,338 | 31,485 |
| | Cheesecake Factory Inc. | 520,571 | 31,172 |
| | Drew Industries Inc. | 284,343 | 30,638 |
| | American Eagle Outfitters Inc. | 2,018,725 | 30,624 |
| |
| |
| |
| |
| 1 |
| | | |
| Vanguard® Extended Market Index Fund | | |
| Schedule of Investments | | |
| December 31, 2016 | | |
| |
| | | | Market |
| | | | Value |
| | | Shares | ($000) |
| | GameStop Corp. Class A | 1,206,337 | 30,472 |
| | Tribune Media Co. Class A | 863,838 | 30,217 |
| ^,* | JC Penney Co. Inc. | 3,635,017 | 30,207 |
| * | Madison Square Garden Co. Class A | 174,828 | 29,985 |
| | CalAtlantic Group Inc. | 870,798 | 29,616 |
| | John Wiley & Sons Inc. Class A | 542,817 | 29,584 |
| | Brinker International Inc. | 584,442 | 28,947 |
| | Office Depot Inc. | 6,324,138 | 28,585 |
| * | Liberty Global PLC LiLAC | 1,343,608 | 28,444 |
| | Graham Holdings Co. Class B | 55,529 | 28,428 |
| * | Kate Spade & Co. | 1,515,113 | 28,287 |
| * | Michaels Cos. Inc. | 1,373,582 | 28,090 |
| * | Helen of Troy Ltd. | 332,149 | 28,050 |
| | Papa John's International Inc. | 314,784 | 26,939 |
| | Lithia Motors Inc. Class A | 277,284 | 26,849 |
| * | Murphy USA Inc. | 433,865 | 26,670 |
| * | Dorman Products Inc. | 358,704 | 26,207 |
| * | Vista Outdoor Inc. | 706,931 | 26,086 |
| * | Five Below Inc. | 646,410 | 25,831 |
| | Big Lots Inc. | 514,338 | 25,825 |
| | Regal Entertainment Group Class A | 1,239,882 | 25,542 |
| | Wolverine World Wide Inc. | 1,161,026 | 25,485 |
| * | Liberty Expedia Holdings Inc. Class A | 636,834 | 25,263 |
| | Meredith Corp. | 425,782 | 25,185 |
| * | Liberty Broadband Corp. Class A | 346,862 | 25,134 |
| * | Hyatt Hotels Corp. Class A | 453,375 | 25,054 |
| * | Dave & Buster's Entertainment Inc. | 441,254 | 24,843 |
| | Cooper Tire & Rubber Co. | 637,682 | 24,774 |
| | Aaron's Inc. | 759,667 | 24,302 |
| | Choice Hotels International Inc. | 432,337 | 24,233 |
| | Marriott Vacations Worldwide Corp. | 284,785 | 24,164 |
| | Sinclair Broadcast Group Inc. Class A | 724,392 | 24,158 |
| | Core-Mark Holding Co. Inc. | 546,093 | 23,520 |
| * | LifeLock Inc. | 976,225 | 23,351 |
| * | Steven Madden Ltd. | 648,467 | 23,183 |
| | Penske Automotive Group Inc. | 445,387 | 23,089 |
| ^ | Nexstar Broadcasting Group Inc. Class A | 358,305 | 22,681 |
| | ILG Inc. | 1,242,315 | 22,573 |
| * | Media General Inc. | 1,195,298 | 22,507 |
| * | Sotheby's | 559,409 | 22,298 |
| | Bloomin' Brands Inc. | 1,234,074 | 22,250 |
| | Monro Muffler Brake Inc. | 386,202 | 22,091 |
| | Churchill Downs Inc. | 146,786 | 22,084 |
| | Chico's FAS Inc. | 1,527,973 | 21,988 |
| | Children's Place Inc. | 212,754 | 21,478 |
| * | Cooper-Standard Holdings Inc. | 207,693 | 21,471 |
| | Extended Stay America Inc. | 1,327,738 | 21,443 |
| | Time Inc. | 1,184,995 | 21,152 |
| | DeVry Education Group Inc. | 670,926 | 20,933 |
| * | Deckers Outdoor Corp. | 377,480 | 20,909 |
| | DSW Inc. Class A | 903,046 | 20,454 |
| * | Shutterfly Inc. | 400,908 | 20,118 |
| * | TRI Pointe Group Inc. | 1,707,011 | 19,597 |
| | New York Times Co. Class A | 1,468,472 | 19,531 |
| * | Boyd Gaming Corp. | 963,683 | 19,438 |
| | Dillard's Inc. Class A | 306,854 | 19,237 |
| * | iRobot Corp. | 321,862 | 18,813 |
| | Columbia Sportswear Co. | 321,070 | 18,718 |
| | La-Z-Boy Inc. | 587,562 | 18,244 |
| | Group 1 Automotive Inc. | 233,555 | 18,203 |
| * | American Axle & Manufacturing Holdings Inc. | 900,298 | 17,376 |
| | Caleres Inc. | 515,683 | 16,925 |
| * | Lions Gate Entertainment Corp. Class A | 626,873 | 16,863 |
| * | TopBuild Corp. | 455,030 | 16,199 |
2
| | | |
| Vanguard® Extended Market Index Fund | | |
| Schedule of Investments | | |
| December 31, 2016 | | |
| |
| | | | Market |
| | | | Value |
| | | Shares | ($000) |
| * | Liberty Media Corp-Liberty Media | 516,239 | 16,174 |
| ^,* | Ollie's Bargain Outlet Holdings Inc. | 559,960 | 15,931 |
| * | Groupon Inc. Class A | 4,730,870 | 15,707 |
| * | MSG Networks Inc. | 730,020 | 15,695 |
| | DineEquity Inc. | 201,476 | 15,514 |
| * | Meritage Homes Corp. | 442,308 | 15,392 |
| * | Liberty Global PLC LiLAC Class A | 694,289 | 15,247 |
| * | G-III Apparel Group Ltd. | 514,382 | 15,205 |
| | Scholastic Corp. | 318,200 | 15,111 |
| * | Popeyes Louisiana Kitchen Inc. | 249,852 | 15,111 |
| | KB Home | 955,563 | 15,107 |
| * | Genesco Inc. | 242,598 | 15,065 |
| | SeaWorld Entertainment Inc. | 781,405 | 14,792 |
| | Tailored Brands Inc. | 576,833 | 14,738 |
| | Sonic Corp. | 553,810 | 14,682 |
| * | Gentherm Inc. | 430,023 | 14,556 |
| * | Asbury Automotive Group Inc. | 230,244 | 14,206 |
| * | La Quinta Holdings Inc. | 983,786 | 13,980 |
| ^,* | Smith & Wesson Holding Corp. | 661,190 | 13,938 |
| * | Belmond Ltd. Class A | 1,027,943 | 13,723 |
| ^,* | Restoration Hardware Holdings Inc. | 441,774 | 13,562 |
| * | Etsy Inc. | 1,131,459 | 13,329 |
| | Gannett Co. Inc. | 1,371,745 | 13,320 |
| * | Houghton Mifflin Harcourt Co. | 1,205,500 | 13,080 |
| * | Liberty TripAdvisor Holdings Inc. Class A | 866,030 | 13,034 |
| | HSN Inc. | 378,581 | 12,985 |
| * | EW Scripps Co. Class A | 666,379 | 12,881 |
| | Standard Motor Products Inc. | 241,587 | 12,857 |
| * | Fossil Group Inc. | 491,315 | 12,705 |
| | Bob Evans Farms Inc. | 238,492 | 12,690 |
| ^,* | Wayfair Inc. | 356,216 | 12,485 |
| | MDC Holdings Inc. | 484,804 | 12,440 |
| * | Ascena Retail Group Inc. | 2,004,748 | 12,409 |
| * | Penn National Gaming Inc. | 884,061 | 12,191 |
| * | Select Comfort Corp. | 535,489 | 12,113 |
| * | Apollo Education Group Inc. | 1,222,369 | 12,101 |
| | Capella Education Co. | 137,828 | 12,101 |
| | Callaway Golf Co. | 1,101,886 | 12,077 |
| ^ | Sturm Ruger & Co. Inc. | 227,235 | 11,975 |
| | AMC Entertainment Holdings Inc. | 354,992 | 11,946 |
| | Nutrisystem Inc. | 343,839 | 11,914 |
| * | Denny's Corp. | 921,931 | 11,828 |
| | Planet Fitness Inc. Class A | 588,427 | 11,827 |
| | International Speedway Corp. Class A | 315,836 | 11,623 |
| | Ethan Allen Interiors Inc. | 304,425 | 11,218 |
| * | Universal Electronics Inc. | 173,269 | 11,185 |
| | National CineMedia Inc. | 749,830 | 11,045 |
| | ClubCorp Holdings Inc. | 767,840 | 11,019 |
| | Oxford Industries Inc. | 178,155 | 10,712 |
| * | Pinnacle Entertainment Inc. | 712,924 | 10,337 |
| ^,* | GoPro Inc. Class A | 1,165,821 | 10,154 |
| * | Cavco Industries Inc. | 100,753 | 10,060 |
| * | Liberty Media Corp-Liberty Braves Class C | 486,055 | 10,008 |
| | Winnebago Industries Inc. | 315,829 | 9,996 |
| * | Strayer Education Inc. | 123,404 | 9,950 |
| * | Express Inc. | 924,554 | 9,948 |
| | Wingstop Inc. | 335,480 | 9,927 |
| * | Hibbett Sports Inc. | 264,442 | 9,864 |
| | New Media Investment Group Inc. | 614,905 | 9,832 |
| * | Installed Building Products Inc. | 237,848 | 9,823 |
| | Abercrombie & Fitch Co. | 796,557 | 9,559 |
| * | Fiesta Restaurant Group Inc. | 319,625 | 9,541 |
| | Cato Corp. Class A | 309,549 | 9,311 |
| * | BJ's Restaurants Inc. | 236,152 | 9,281 |
3
| | | |
| Vanguard® Extended Market Index Fund | | |
| Schedule of Investments | | |
| December 31, 2016 | | |
| |
| | | | Market |
| | | | Value |
| | | Shares | ($000) |
| * | Fox Factory Holding Corp. | 333,967 | 9,268 |
| | Finish Line Inc. Class A | 485,650 | 9,135 |
| | GNC Holdings Inc. Class A | 811,058 | 8,954 |
| * | Red Robin Gourmet Burgers Inc. | 158,093 | 8,916 |
| | Guess? Inc. | 734,000 | 8,881 |
| * | Gray Television Inc. | 801,633 | 8,698 |
| * | Scientific Games Corp. Class A | 602,201 | 8,431 |
| * | Modine Manufacturing Co. | 564,705 | 8,414 |
| ^ | Fred's Inc. Class A | 450,511 | 8,362 |
| * | Liberty Media Corp-Liberty Media Class A | 264,387 | 8,289 |
| | World Wrestling Entertainment Inc. Class A | 444,949 | 8,187 |
| * | Francesca's Holdings Corp. | 448,010 | 8,078 |
| | Pier 1 Imports Inc. | 944,822 | 8,069 |
| | Red Rock Resorts Inc. Class A | 343,777 | 7,972 |
| | Marcus Corp. | 250,726 | 7,898 |
| * | Career Education Corp. | 762,977 | 7,698 |
| * | Tile Shop Holdings Inc. | 391,248 | 7,649 |
| | Buckle Inc. | 333,991 | 7,615 |
| | Sonic Automotive Inc. Class A | 330,793 | 7,575 |
| ^,* | Shake Shack Inc. Class A | 207,062 | 7,411 |
| * | M/I Homes Inc. | 293,721 | 7,396 |
| * | Isle of Capri Casinos Inc. | 295,832 | 7,304 |
| | Superior Industries International Inc. | 275,292 | 7,254 |
| | Barnes & Noble Inc. | 647,279 | 7,217 |
| | Tower International Inc. | 253,255 | 7,180 |
| * | Taylor Morrison Home Corp. Class A | 371,588 | 7,157 |
| | Rent-A-Center Inc. | 631,887 | 7,109 |
| * | K12 Inc. | 411,199 | 7,056 |
| * | Nautilus Inc. | 368,757 | 6,822 |
| * | Vitamin Shoppe Inc. | 286,086 | 6,795 |
| * | Chuy's Holdings Inc. | 207,583 | 6,736 |
| | Ruth's Hospitality Group Inc. | 365,592 | 6,690 |
| * | Loral Space & Communications Inc. | 162,054 | 6,652 |
| * | Carrols Restaurant Group Inc. | 420,864 | 6,418 |
| * | Regis Corp. | 429,367 | 6,234 |
| ^ | PetMed Express Inc. | 267,836 | 6,179 |
| * | Iconix Brand Group Inc. | 648,310 | 6,055 |
| * | WCI Communities Inc. | 258,202 | 6,055 |
| * | Biglari Holdings Inc. | 12,793 | 6,054 |
| * | Motorcar Parts of America Inc. | 222,262 | 5,983 |
| * | Crocs Inc. | 871,283 | 5,977 |
| ^,* | LGI Homes Inc. | 207,790 | 5,970 |
| * | Unifi Inc. | 181,578 | 5,925 |
| ^,* | Caesars Entertainment Corp. | 689,416 | 5,860 |
| | Movado Group Inc. | 200,677 | 5,769 |
| | Haverty Furniture Cos. Inc. | 240,718 | 5,705 |
| | Blue Nile Inc. | 140,190 | 5,696 |
| * | MarineMax Inc. | 294,110 | 5,691 |
| * | Stoneridge Inc. | 319,360 | 5,649 |
| * | Del Taco Restaurants Inc. | 393,644 | 5,558 |
| | Entravision Communications Corp. Class A | 792,717 | 5,549 |
| ^,* | Zoe's Kitchen Inc. | 230,079 | 5,520 |
| ^,* | Sears Holdings Corp. | 586,588 | 5,449 |
| | Hooker Furniture Corp. | 141,654 | 5,376 |
| * | Horizon Global Corp. | 223,659 | 5,368 |
| * | FTD Cos. Inc. | 224,463 | 5,351 |
| ^ | Camping World Holdings Inc. Class A | 163,643 | 5,333 |
| * | Barnes & Noble Education Inc. | 460,316 | 5,280 |
| * | William Lyon Homes Class A | 275,413 | 5,241 |
| | Libbey Inc. | 268,936 | 5,234 |
| | NACCO Industries Inc. Class A | 56,878 | 5,150 |
| ^,* | Chegg Inc. | 695,969 | 5,136 |
| ^,* | Lumber Liquidators Holdings Inc. | 324,347 | 5,105 |
| | Carriage Services Inc. Class A | 175,279 | 5,020 |
4
| | | |
| Vanguard® Extended Market Index Fund | | |
| Schedule of Investments | | |
| December 31, 2016 | | |
| |
| | | | Market |
| | | | Value |
| | | Shares | ($000) |
| * | Del Frisco's Restaurant Group Inc. | 290,638 | 4,941 |
| * | Beazer Homes USA Inc. | 370,885 | 4,933 |
| | Flexsteel Industries Inc. | 78,656 | 4,851 |
| * | American Public Education Inc. | 192,354 | 4,722 |
| | Culp Inc. | 126,218 | 4,689 |
| | Entercom Communications Corp. Class A | 305,544 | 4,675 |
| * | Zumiez Inc. | 211,341 | 4,618 |
| | Shoe Carnival Inc. | 170,829 | 4,609 |
| * | Acushnet Holdings Corp. | 230,200 | 4,537 |
| * | Eldorado Resorts Inc. | 261,108 | 4,426 |
| * | Federal-Mogul Holdings Corp. | 414,839 | 4,277 |
| * | America's Car-Mart Inc. | 96,795 | 4,235 |
| * | Global Eagle Entertainment Inc. | 640,060 | 4,135 |
| * | Malibu Boats Inc. Class A | 215,890 | 4,119 |
| * | Potbelly Corp. | 318,021 | 4,102 |
| * | Century Communities Inc. | 191,492 | 4,021 |
| | Bassett Furniture Industries Inc. | 131,900 | 4,010 |
| * | Party City Holdco Inc. | 282,134 | 4,006 |
| * | 1-800-Flowers.com Inc. Class A | 373,811 | 4,000 |
| | Spartan Motors Inc. | 427,400 | 3,953 |
| * | Monarch Casino & Resort Inc. | 153,194 | 3,949 |
| * | tronc Inc. | 281,612 | 3,906 |
| * | Overstock.com Inc. | 214,846 | 3,760 |
| * | Hovnanian Enterprises Inc. Class A | 1,370,470 | 3,741 |
| | Big 5 Sporting Goods Corp. | 213,072 | 3,697 |
| ^,* | Weight Watchers International Inc. | 321,864 | 3,685 |
| * | Bojangles' Inc. | 191,582 | 3,573 |
| ^,* | Conn's Inc. | 281,394 | 3,560 |
| * | Perry Ellis International Inc. | 142,870 | 3,559 |
| * | Habit Restaurants Inc. Class A | 205,685 | 3,548 |
| | Metaldyne Performance Group Inc. | 151,974 | 3,488 |
| | Citi Trends Inc. | 184,113 | 3,469 |
| * | Sportsman's Warehouse Holdings Inc. | 345,751 | 3,247 |
| | Speedway Motorsports Inc. | 147,341 | 3,193 |
| * | El Pollo Loco Holdings Inc. | 258,327 | 3,177 |
| * | Reading International Inc. Class A | 180,241 | 2,992 |
| * | Kirkland's Inc. | 190,978 | 2,962 |
| | Saga Communications Inc. Class A | 58,636 | 2,949 |
| * | Daily Journal Corp. | 12,078 | 2,920 |
| * | Vera Bradley Inc. | 247,811 | 2,904 |
| * | Tuesday Morning Corp. | 530,728 | 2,866 |
| | Winmark Corp. | 22,687 | 2,862 |
| | CSS Industries Inc. | 105,277 | 2,850 |
| ^,* | Intrawest Resorts Holdings Inc. | 159,313 | 2,844 |
| * | Green Brick Partners Inc. | 267,713 | 2,691 |
| ^,* | Duluth Holdings Inc. | 104,776 | 2,661 |
| | Johnson Outdoors Inc. Class A | 66,950 | 2,657 |
| * | Nathan's Famous Inc. | 40,915 | 2,655 |
| ^,* | Lands' End Inc. | 170,875 | 2,589 |
| * | Build-A-Bear Workshop Inc. | 185,761 | 2,554 |
| ^,* | Sequential Brands Group Inc. | 543,408 | 2,543 |
| * | Ruby Tuesday Inc. | 786,460 | 2,540 |
| | Lifetime Brands Inc. | 142,164 | 2,523 |
| | Collectors Universe Inc. | 118,079 | 2,507 |
| * | Arctic Cat Inc. | 162,615 | 2,442 |
| ^,* | Central European Media Enterprises Ltd. Class A | 942,438 | 2,403 |
| * | Lindblad Expeditions Holdings Inc. | 251,912 | 2,381 |
| * | Century Casinos Inc. | 284,323 | 2,340 |
| * | Ascent Capital Group Inc. Class A | 142,885 | 2,323 |
| * | ZAGG Inc. | 325,656 | 2,312 |
| * | West Marine Inc. | 214,093 | 2,242 |
| ^,* | Jamba Inc. | 215,696 | 2,222 |
| | RCI Hospitality Holdings Inc. | 128,640 | 2,200 |
| * | Bridgepoint Education Inc. | 214,984 | 2,178 |
5
| | | |
| Vanguard® Extended Market Index Fund | | |
| Schedule of Investments | | |
| December 31, 2016 | | |
| |
| | | | Market |
| | | | Value |
| | | Shares | ($000) |
| | MCBC Holdings Inc. | 149,036 | 2,173 |
| | Strattec Security Corp. | 50,484 | 2,035 |
| | Stein Mart Inc. | 367,975 | 2,017 |
| | Weyco Group Inc. | 63,778 | 1,996 |
| | Clear Channel Outdoor Holdings Inc. Class A | 384,030 | 1,939 |
| * | Destination XL Group Inc. | 454,965 | 1,934 |
| * | Boot Barn Holdings Inc. | 149,730 | 1,875 |
| * | Tilly's Inc. Class A | 140,079 | 1,848 |
| * | Lee Enterprises Inc. | 635,237 | 1,842 |
| | A H Belo Corp. Class A | 282,493 | 1,794 |
| * | At Home Group Inc. | 119,699 | 1,751 |
| * | Gaia Inc. Class A | 200,361 | 1,733 |
| * | Black Diamond Inc. | 313,639 | 1,678 |
| | Escalade Inc. | 125,228 | 1,653 |
| * | New Home Co. Inc. | 139,708 | 1,636 |
| * | Ballantyne Strong Inc. | 201,989 | 1,616 |
| | Superior Uniform Group Inc. | 81,406 | 1,597 |
| * | Red Lion Hotels Corp. | 190,952 | 1,594 |
| * | Delta Apparel Inc. | 74,204 | 1,538 |
| * | Kona Grill Inc. | 121,230 | 1,521 |
| * | VOXX International Corp. Class A | 318,758 | 1,498 |
| * | J Alexander's Holdings Inc. | 137,490 | 1,478 |
| * | Cherokee Inc. | 134,890 | 1,416 |
| | Stage Stores Inc. | 320,386 | 1,400 |
| ^,* | Container Store Group Inc. | 207,399 | 1,317 |
| | Golden Entertainment Inc. | 107,853 | 1,306 |
| | Marine Products Corp. | 92,735 | 1,286 |
| | Liberty Tax Inc. | 95,280 | 1,277 |
| ^,* | Vuzix Corp. | 183,020 | 1,245 |
| * | Skyline Corp. | 80,480 | 1,244 |
| ^,* | JAKKS Pacific Inc. | 240,874 | 1,241 |
| ^,* | Noodles & Co. Class A | 285,581 | 1,171 |
| * | Fogo De Chao Inc. | 78,965 | 1,133 |
| | Rocky Brands Inc. | 96,054 | 1,109 |
| * | Christopher & Banks Corp. | 467,863 | 1,095 |
| ^,* | Vince Holding Corp. | 258,122 | 1,045 |
| * | Townsquare Media Inc. Class A | 97,637 | 1,016 |
| ^,* | Hemisphere Media Group Inc. Class A | 89,972 | 1,008 |
| | Ark Restaurants Corp. | 38,576 | 935 |
| | Harte-Hanks Inc. | 609,151 | 920 |
| | Destination Maternity Corp. | 171,292 | 886 |
| * | Lakeland Industries Inc. | 84,712 | 881 |
| * | Radio One Inc. | 297,981 | 864 |
| | McClatchy Co. Class A | 64,295 | 847 |
| ^,* | Empire Resorts Inc. | 37,144 | 845 |
| * | Luby's Inc. | 194,885 | 834 |
| * | EVINE Live Inc. | 553,547 | 830 |
| * | Cambium Learning Group Inc. | 165,737 | 827 |
| | Universal Technical Institute Inc. | 272,998 | 794 |
| | Beasley Broadcast Group Inc. Class A | 126,614 | 785 |
| ^,* | Workhorse Group Inc. | 104,819 | 740 |
| * | UCP Inc. | 60,007 | 723 |
| * | New York & Co. Inc. | 315,759 | 717 |
| * | Bravo Brio Restaurant Group Inc. | 187,850 | 714 |
| * | Sears Hometown and Outlet Stores Inc. | 150,354 | 707 |
| * | Insignia Systems Inc. | 289,292 | 691 |
| * | Liberty Media Corp-Liberty Braves Class A | 32,743 | 671 |
| * | Papa Murphy's Holdings Inc. | 156,898 | 662 |
| * | Full House Resorts Inc. | 273,501 | 656 |
| * | Tandy Leather Factory Inc. | 80,953 | 656 |
| * | Trans World Entertainment Corp. | 197,775 | 653 |
| * | Town Sports International Holdings Inc. | 245,271 | 613 |
| | Dover Motorsports Inc. | 247,503 | 569 |
| ^ | Live Ventures Inc. | 23,628 | 568 |
6
| | | |
| Vanguard® Extended Market Index Fund | | |
| Schedule of Investments | | |
| December 31, 2016 | | |
| |
| | | | Market |
| | | | Value |
| | | Shares | ($000) |
| * | Shiloh Industries Inc. | 81,305 | 562 |
| * | Famous Dave's of America Inc. | 109,130 | 540 |
| * | Dixie Group Inc. | 150,034 | 540 |
| * | Lincoln Educational Services Corp. | 280,689 | 539 |
| | Salem Media Group Inc. Class A | 79,573 | 497 |
| * | US Auto Parts Network Inc. | 136,786 | 482 |
| ^,* | Nova Lifestyle Inc. | 207,042 | 400 |
| | Gaming Partners International Corp. | 27,841 | 329 |
| | LCI Industries | 2,900 | 313 |
| | Emmis Communications Corp. Class A | 88,410 | 290 |
| | Crown Crafts Inc. | 36,945 | 286 |
| * | Turtle Beach Corp. | 215,648 | 283 |
| * | Summer Infant Inc. | 135,595 | 277 |
| ^,* | Good Times Restaurants Inc. | 85,232 | 269 |
| * | Peak Resorts Inc. | 48,068 | 267 |
| * | RH | 8,600 | 264 |
| ^,* | hhgregg Inc. | 180,715 | 258 |
| * | Dover Downs Gaming & Entertainment Inc. | 250,438 | 258 |
| * | Cumulus Media Inc. Class A | 244,557 | 249 |
| * | Fenix Parts Inc. | 86,421 | 244 |
| * | Emerson Radio Corp. | 222,590 | 234 |
| ^,* | bebe stores inc | 44,443 | 226 |
| * | Spanish Broadcasting System Inc. | 73,034 | 223 |
| ^,* | Forward Industries Inc. | 169,003 | 208 |
| | AMCON Distributing Co. | 1,764 | 203 |
| * | Charles & Colvard Ltd. | 184,730 | 203 |
| * | Rave Restaurant Group Inc. | 105,122 | 198 |
| * | Bon-Ton Stores Inc. | 134,140 | 197 |
| | Educational Development Corp. | 19,341 | 192 |
| * | UQM Technologies Inc. | 353,941 | 152 |
| * | Cinedigm Corp. Class A | 82,517 | 119 |
| * | CafePress Inc. | 40,283 | 118 |
| | Stanley Furniture Co. Inc. | 127,129 | 114 |
| * | Perfumania Holdings Inc. | 66,167 | 101 |
| ^,* | Clean Diesel Technologies Inc. | 39,074 | 84 |
| ^,* | Chanticleer Holdings Inc. | 198,489 | 81 |
| * | NTN Buzztime Inc. | 9,187 | 78 |
| * | Sypris Solutions Inc. | 88,213 | 78 |
| * | Gordmans Stores Inc. | 112,537 | 77 |
| | Unique Fabricating Inc. | 4,247 | 62 |
| * | Nevada Gold & Casinos Inc. | 33,200 | 61 |
| * | Differential Brands Group Inc. | 25,619 | 60 |
| ^,* | Ignite Restaurant Group Inc. | 86,700 | 47 |
| * | JRjr33 Inc. | 50,630 | 38 |
| * | RLJ Entertainment Inc. | 21,254 | 34 |
| | Flanigan's Enterprises Inc. | 1,352 | 34 |
| * | SPAR Group Inc. | 33,227 | 33 |
| * | Comstock Holding Cos. Inc. Class A | 17,945 | 32 |
| * | ONE Group Hospitality Inc. | 13,997 | 31 |
| * | Appliance Recycling Centers of America Inc. | 24,098 | 27 |
| * | Diversified Restaurant Holdings Inc. | 10,100 | 14 |
| * | Koss Corp. | 3,992 | 9 |
| * | Entertainment Gaming Asia Inc. | 5,940 | 8 |
| * | Hilton Worldwide Holdings Inc. | 98 | 5 |
| | P&F Industries Inc. Class A | 574 | 5 |
| * | Xcel Brands Inc. | 577 | 3 |
| | Canterbury Park Holding Corp. | 209 | 2 |
| * | Here Media Inc. | 12,670 | — |
| | | | 7,369,726 |
| Consumer Staples (3.5%) | | |
| | Bunge Ltd. | 1,653,378 | 119,440 |
7
| | | |
| Vanguard® Extended Market Index Fund | | |
| Schedule of Investments | | |
| December 31, 2016 | | |
| |
| | | | Market |
| | | | Value |
| | | Shares | ($000) |
| * | WhiteWave Foods Co. Class A | 2,095,150 | 116,490 |
| | Ingredion Inc. | 856,925 | 107,081 |
| * | Rite Aid Corp. | 12,490,841 | 102,925 |
| | Pinnacle Foods Inc. | 1,400,815 | 74,874 |
| * | Lamb Weston Holdings Inc. | 1,641,935 | 62,147 |
| * | Post Holdings Inc. | 768,698 | 61,796 |
| | Casey's General Stores Inc. | 463,157 | 55,060 |
| * | Edgewell Personal Care Co. | 685,536 | 50,037 |
| * | TreeHouse Foods Inc. | 673,144 | 48,594 |
| * | Hain Celestial Group Inc. | 1,227,803 | 47,921 |
| | Flowers Foods Inc. | 2,166,877 | 43,273 |
| ^,* | Herbalife Ltd. | 827,962 | 39,858 |
| | Snyder's-Lance Inc. | 1,002,946 | 38,453 |
| | Spectrum Brands Holdings Inc. | 289,563 | 35,422 |
| | B&G Foods Inc. | 787,618 | 34,498 |
| | Energizer Holdings Inc. | 734,108 | 32,749 |
| | Lancaster Colony Corp. | 231,558 | 32,740 |
| * | Sprouts Farmers Market Inc. | 1,628,612 | 30,813 |
| | Nu Skin Enterprises Inc. Class A | 612,825 | 29,281 |
| * | United Natural Foods Inc. | 597,840 | 28,529 |
| * | Blue Buffalo Pet Products Inc. | 1,125,249 | 27,051 |
| | Vector Group Ltd. | 1,189,473 | 27,049 |
| * | Avon Products Inc. | 5,207,291 | 26,245 |
| * | HRG Group Inc. | 1,634,610 | 25,435 |
| * | Darling Ingredients Inc. | 1,933,826 | 24,966 |
| | Fresh Del Monte Produce Inc. | 394,426 | 23,914 |
| | J&J Snack Foods Corp. | 178,451 | 23,811 |
| | Dean Foods Co. | 1,069,012 | 23,283 |
| | PriceSmart Inc. | 272,277 | 22,735 |
| | Sanderson Farms Inc. | 235,347 | 22,179 |
| | WD-40 Co. | 170,627 | 19,946 |
| * | Boston Beer Co. Inc. Class A | 107,369 | 18,237 |
| | SpartanNash Co. | 438,912 | 17,355 |
| | Universal Corp. | 266,707 | 17,003 |
| ^ | Cal-Maine Foods Inc. | 353,429 | 15,613 |
| * | US Foods Holding Corp. | 553,828 | 15,219 |
| * | SUPERVALU Inc. | 3,135,600 | 14,643 |
| * | Central Garden & Pet Co. Class A | 455,384 | 14,071 |
| | Andersons Inc. | 311,795 | 13,937 |
| * | Performance Food Group Co. | 547,739 | 13,146 |
| | Pilgrim's Pride Corp. | 692,135 | 13,144 |
| * | Seaboard Corp. | 3,273 | 12,935 |
| | Weis Markets Inc. | 192,169 | 12,845 |
| | Calavo Growers Inc. | 182,223 | 11,188 |
| | Coca-Cola Bottling Co. Consolidated | 55,277 | 9,886 |
| ^ | Tootsie Roll Industries Inc. | 217,625 | 8,651 |
| | Ingles Markets Inc. Class A | 169,402 | 8,148 |
| * | USANA Health Sciences Inc. | 123,567 | 7,562 |
| | National Beverage Corp. | 142,642 | 7,286 |
| | John B Sanfilippo & Son Inc. | 101,576 | 7,150 |
| | MGP Ingredients Inc. | 142,882 | 7,141 |
| * | Omega Protein Corp. | 276,084 | 6,916 |
| | AdvancePierre Foods Holdings Inc. | 230,458 | 6,863 |
| | Inter Parfums Inc. | 209,240 | 6,853 |
| | Medifast Inc. | 139,076 | 5,790 |
| * | Hostess Brands Inc. | 443,500 | 5,765 |
| * | Smart & Final Stores Inc. | 345,815 | 4,876 |
| * | Landec Corp. | 333,842 | 4,607 |
| * | Revlon Inc. Class A | 151,994 | 4,431 |
| * | Farmer Brothers Co. | 113,938 | 4,182 |
| | Nutraceutical International Corp. | 107,236 | 3,748 |
| * | elf Beauty Inc. | 125,483 | 3,631 |
| * | Chefs' Warehouse Inc. | 227,304 | 3,591 |
| * | Seneca Foods Corp. Class A | 88,044 | 3,526 |
8
| | | |
| Vanguard® Extended Market Index Fund | | |
| Schedule of Investments | | |
| December 31, 2016 | | |
| |
| | | | Market |
| | Value |
| | | Shares | ($000) |
| * | Primo Water Corp. | 287,129 | 3,526 |
| | Village Super Market Inc. Class A | 104,352 | 3,224 |
| ^ | Orchids Paper Products Co. | 121,562 | 3,182 |
| ^,* | Amplify Snack Brands Inc. | 343,737 | 3,028 |
| | Limoneira Co. | 130,413 | 2,805 |
| * | Freshpet Inc. | 241,630 | 2,453 |
| | Oil-Dri Corp. of America | 62,564 | 2,391 |
| * | Inventure Foods Inc. | 238,991 | 2,354 |
| * | Alliance One International Inc. | 113,772 | 2,184 |
| ^ | Natural Health Trends Corp. | 79,602 | 1,978 |
| * | Craft Brew Alliance Inc. | 104,766 | 1,771 |
| * | Natural Grocers by Vitamin Cottage Inc. | 125,610 | 1,493 |
| | Nature's Sunshine Products Inc. | 85,400 | 1,281 |
| * | Lifevantage Corp. | 156,198 | 1,273 |
| * | Turning Point Brands Inc. | 98,539 | 1,207 |
| * | Synutra International Inc. | 221,114 | 1,183 |
| | Alico Inc. | 43,158 | 1,172 |
| * | Central Garden & Pet Co. | 32,715 | 1,083 |
| * | Lifeway Foods Inc. | 86,690 | 998 |
| | Rocky Mountain Chocolate Factory Inc. | 95,531 | 973 |
| ^,* | 22nd Century Group Inc. | 878,906 | 958 |
| * | S&W Seed Co. | 198,796 | 914 |
| | United-Guardian Inc. | 57,249 | 887 |
| * | Natural Alternatives International Inc. | 70,591 | 798 |
| * | Castle Brands Inc. | 518,754 | 394 |
| * | Female Health Co. | 275,830 | 251 |
| * | Reed's Inc. | 57,535 | 236 |
| | Mannatech Inc. | 11,471 | 233 |
| * | Coffee Holding Co. Inc. | 33,360 | 155 |
| ^,* | DS Healthcare Group Inc. | 104,494 | 69 |
| | Ocean Bio-Chem Inc. | 11,030 | 41 |
| * | Crystal Rock Holdings Inc. | 42,584 | 35 |
| | Reliv International Inc. | 6,495 | 30 |
| * | RiceBran Technologies | 20,529 | 21 |
| * | Long Island Iced Tea Corp. | 4,041 | 17 |
| * | Arcadia Biosciences Inc. | 6,213 | 6 |
| * | MYOS RENS Technology Inc. | 1,200 | 1 |
| | | | 1,813,139 |
| Energy (4.5%) | | |
| | Targa Resources Corp. | 2,145,962 | 120,324 |
| * | Cheniere Energy Inc. | 2,781,722 | 115,247 |
| * | Diamondback Energy Inc. | 1,051,917 | 106,307 |
| | HollyFrontier Corp. | 2,089,735 | 68,460 |
| * | Energen Corp. | 1,150,419 | 66,345 |
| * | Parsley Energy Inc. Class A | 1,833,720 | 64,620 |
| | Core Laboratories NV | 522,801 | 62,757 |
| * | WPX Energy Inc. | 4,093,438 | 59,641 |
| ^,* | Weatherford International plc | 11,660,924 | 58,188 |
| | Nabors Industries Ltd. | 3,359,168 | 55,090 |
| * | Continental Resources Inc. | 1,022,614 | 52,706 |
| * | QEP Resources Inc. | 2,847,288 | 52,419 |
| * | RSP Permian Inc. | 1,082,612 | 48,306 |
| * | PDC Energy Inc. | 662,229 | 48,065 |
| | US Silica Holdings Inc. | 847,173 | 48,018 |
| | Patterson-UTI Energy Inc. | 1,748,084 | 47,058 |
| * | Oasis Petroleum Inc. | 2,804,163 | 42,455 |
| * | Antero Resources Corp. | 1,721,541 | 40,714 |
| * | Rice Energy Inc. | 1,900,590 | 40,578 |
| * | Whiting Petroleum Corp. | 3,372,450 | 40,537 |
| * | Gulfport Energy Corp. | 1,836,180 | 39,735 |
| | SM Energy Co. | 1,145,552 | 39,499 |
| | World Fuel Services Corp. | 833,643 | 38,273 |
| | CONSOL Energy Inc. | 2,096,516 | 38,219 |
| * | Callon Petroleum Co. | 2,378,500 | 36,558 |
9
| | | |
| Vanguard® Extended Market Index Fund | | |
| Schedule of Investments | | |
| December 31, 2016 | | |
| |
| | | | Market |
| | | | Value |
| | | Shares | ($000) |
| | PBF Energy Inc. Class A | 1,296,049 | 36,134 |
| | Western Refining Inc. | 940,293 | 35,590 |
| | Ensco plc Class A | 3,590,564 | 34,900 |
| | Oceaneering International Inc. | 1,162,844 | 32,804 |
| | Superior Energy Services Inc. | 1,799,960 | 30,383 |
| * | Matador Resources Co. | 1,091,402 | 28,115 |
| * | Rowan Cos. plc Class A | 1,485,662 | 28,064 |
| * | Carrizo Oil & Gas Inc. | 724,338 | 27,054 |
| * | Dril-Quip Inc. | 445,493 | 26,752 |
| | SemGroup Corp. Class A | 630,560 | 26,326 |
| * | Oil States International Inc. | 608,086 | 23,715 |
| * | Laredo Petroleum Inc. | 1,674,433 | 23,676 |
| * | Arch Coal Inc. Class A | 291,203 | 22,728 |
| ^,* | Synergy Resources Corp. | 2,378,231 | 21,190 |
| * | Fairmount Santrol Holdings Inc. | 1,788,605 | 21,088 |
| * | McDermott International Inc. | 2,849,188 | 21,055 |
| * | Forum Energy Technologies Inc. | 843,556 | 18,558 |
| * | Denbury Resources Inc. | 4,721,425 | 17,375 |
| | Noble Corp. plc | 2,880,842 | 17,055 |
| * | Unit Corp. | 609,371 | 16,374 |
| | Delek US Holdings Inc. | 650,086 | 15,648 |
| ^ | RPC Inc. | 701,350 | 13,894 |
| * | SEACOR Holdings Inc. | 190,894 | 13,607 |
| * | Diamond Offshore Drilling Inc. | 767,173 | 13,579 |
| * | Kosmos Energy Ltd. | 1,887,753 | 13,233 |
| * | Centennial Resource Development Inc. Class A | 612,013 | 12,069 |
| * | Helix Energy Solutions Group Inc. | 1,344,706 | 11,860 |
| | Green Plains Inc. | 420,046 | 11,698 |
| | Archrock Inc. | 817,016 | 10,785 |
| ^ | California Resources Corp. | 488,022 | 10,390 |
| ^,* | Clayton Williams Energy Inc. | 83,324 | 9,937 |
| * | Extraction Oil & Gas Inc. | 468,536 | 9,389 |
| ^ | Atwood Oceanics Inc. | 705,116 | 9,258 |
| * | Exterran Corp. | 365,654 | 8,739 |
| ^,* | Resolute Energy Corp. | 204,622 | 8,428 |
| | Bristow Group Inc. | 376,858 | 7,718 |
| * | Newpark Resources Inc. | 1,024,237 | 7,682 |
| * | Matrix Service Co. | 317,532 | 7,208 |
| ^ | Frank's International NV | 581,125 | 7,154 |
| * | REX American Resources Corp. | 69,090 | 6,823 |
| * | TETRA Technologies Inc. | 1,343,293 | 6,743 |
| * | Ring Energy Inc. | 496,296 | 6,447 |
| ^,* | Bill Barrett Corp. | 892,077 | 6,236 |
| * | Pioneer Energy Services Corp. | 895,829 | 6,136 |
| * | Sanchez Energy Corp. | 676,454 | 6,108 |
| * | Par Pacific Holdings Inc. | 381,079 | 5,541 |
| * | SandRidge Energy Inc. | 230,795 | 5,435 |
| * | Cobalt International Energy Inc. | 3,993,400 | 4,872 |
| | CVR Energy Inc. | 189,333 | 4,807 |
| * | Natural Gas Services Group Inc. | 148,538 | 4,775 |
| * | Tesco Corp. | 568,819 | 4,693 |
| | Panhandle Oil and Gas Inc. Class A | 197,075 | 4,641 |
| | Alon USA Energy Inc. | 389,875 | 4,437 |
| * | Gener8 Maritime Inc. | 972,153 | 4,355 |
| * | Pacific Ethanol Inc. | 436,386 | 4,146 |
| * | Cloud Peak Energy Inc. | 732,830 | 4,111 |
| * | Parker Drilling Co. | 1,555,328 | 4,044 |
| ^,* | Renewable Energy Group Inc. | 412,660 | 4,003 |
| * | Era Group Inc. | 229,597 | 3,896 |
| * | Abraxas Petroleum Corp. | 1,428,776 | 3,672 |
| * | Westmoreland Coal Co. | 207,356 | 3,664 |
| * | RigNet Inc. | 157,822 | 3,654 |
| | Evolution Petroleum Corp. | 361,634 | 3,616 |
| * | Halcon Resources Corp. | 364,100 | 3,401 |
10
| | | |
| Vanguard® Extended Market Index Fund | | |
| Schedule of Investments | | |
| December 31, 2016 | | |
| |
| | | | Market |
| | | | Value |
| | | Shares | ($000) |
| * | Geospace Technologies Corp. | 166,717 | 3,394 |
| ^,* | EP Energy Corp. Class A | 510,110 | 3,341 |
| * | Clean Energy Fuels Corp. | 1,155,578 | 3,305 |
| ^,* | Jones Energy Inc. Class A | 631,798 | 3,159 |
| * | Eclipse Resources Corp. | 1,040,820 | 2,779 |
| ^,* | Hornbeck Offshore Services Inc. | 377,446 | 2,725 |
| * | CARBO Ceramics Inc. | 255,868 | 2,676 |
| * | Contango Oil & Gas Co. | 267,869 | 2,502 |
| * | Independence Contract Drilling Inc. | 351,910 | 2,358 |
| | Gulf Island Fabrication Inc. | 196,614 | 2,340 |
| | Hallador Energy Co. | 245,032 | 2,227 |
| * | International Seaways Inc. | 152,401 | 2,140 |
| * | Smart Sand Inc. | 128,996 | 2,135 |
| * | Gastar Exploration Inc. | 1,314,278 | 2,037 |
| ^,* | EXCO Resources Inc. | 2,262,793 | 1,977 |
| ^,* | Tidewater Inc. | 579,552 | 1,976 |
| * | Willbros Group Inc. | 603,497 | 1,955 |
| * | Dawson Geophysical Co. | 241,879 | 1,945 |
| * | Overseas Shipholding Group Inc. Class A | 456,031 | 1,747 |
| ^,* | Northern Oil and Gas Inc. | 612,549 | 1,685 |
| ^,* | Uranium Energy Corp. | 1,418,170 | 1,588 |
| ^,* | Approach Resources Inc. | 444,345 | 1,489 |
| ^,* | W&T Offshore Inc. | 498,175 | 1,380 |
| * | PHI Inc. | 75,566 | 1,292 |
| ^ | Comstock Resources Inc. | 125,310 | 1,234 |
| ^,* | Earthstone Energy Inc. | 86,910 | 1,194 |
| * | Mammoth Energy Services Inc. | 73,989 | 1,125 |
| * | Lonestar Resources US Inc. Class A | 123,947 | 1,058 |
| * | Isramco Inc. | 7,789 | 968 |
| | Adams Resources & Energy Inc. | 23,684 | 939 |
| * | PHI Inc. NV | 45,104 | 813 |
| * | Harvest Natural Resources Inc. | 122,575 | 758 |
| * | VAALCO Energy Inc. | 726,471 | 756 |
| * | Amyris Inc. | 1,016,480 | 742 |
| ^,* | Magellan Petroleum Corp. | 64,375 | 724 |
| * | ION Geophysical Corp. | 119,801 | 719 |
| * | Synthesis Energy Systems Inc. | 639,776 | 640 |
| * | PetroQuest Energy Inc. | 191,143 | 633 |
| * | Mitcham Industries Inc. | 148,174 | 615 |
| * | Aspen Aerogels Inc. | 142,979 | 590 |
| * | Gulfmark Offshore Inc. | 316,042 | 553 |
| ^,* | Bonanza Creek Energy Inc. | 512,901 | 523 |
| ^,* | Erin Energy Corp. | 166,172 | 507 |
| * | Centrus Energy Corp. Class A | 78,775 | 503 |
| ^,* | Rex Energy Corp. | 958,737 | 452 |
| * | Zion Oil & Gas Inc. | 240,958 | 330 |
| ^,* | Gevo Inc. | 1,767,344 | 306 |
| * | Profire Energy Inc. | 187,943 | 259 |
| ^,* | Torchlight Energy Resources Inc. | 216,867 | 256 |
| * | PrimeEnergy Corp. | 3,726 | 201 |
| * | Vertex Energy Inc. | 151,434 | 198 |
| * | TransAtlantic Petroleum Ltd. | 175,749 | 195 |
| ^,* | Uranium Resources Inc. | 140,869 | 193 |
| ^,* | Triangle Petroleum Corp. | 813,997 | 192 |
| * | SAExploration Holdings Inc. | 16,500 | 120 |
| | US Energy Corp. Wyoming | 67,365 | 86 |
| * | Barnwell Industries Inc. | 48,034 | 79 |
| ^,* | Lucas Energy Inc. | 57,978 | 72 |
| * | ENGlobal Corp. | 26,244 | 63 |
| ^,* | New Concept Energy Inc. | 24,244 | 52 |
| ^,* | Tengasco Inc. | 55,819 | 38 |
| * | Enservco Corp. | 47,023 | 26 |
| * | FieldPoint Petroleum Corp. | 35,776 | 26 |
| * | Aemetis Inc. | 17,273 | 24 |
11
| | | |
| Vanguard® Extended Market Index Fund | | |
| Schedule of Investments | | |
| December 31, 2016 | | |
| |
| | | | Market |
| | | | Value |
| | | Shares | ($000) |
| * | Yuma Energy Inc. | 2,896 | 10 |
| ^,* | Superior Drilling Products Inc. | 6,778 | 9 |
| | Tengasco Inc. Rights Exp. 02/02/2017 | 55,820 | 9 |
| * | PEDEVCO Corp. | 40,105 | 5 |
| ^,* | EnerJex Resources Inc. | 5,531 | 2 |
| * | Eco-Stim Energy Solutions Inc. | 1,481 | 1 |
| * | FieldPoint Petroleum Corp. Warrants Exp. 03/23/2017 | 33,558 | 1 |
| | Range Resources Corp. | 1 | — |
| | | | 2,334,538 |
| Financials (17.9%) | | |
| | First Republic Bank | 1,813,091 | 167,058 |
| * | Markel Corp. | 164,771 | 149,035 |
| * | Arch Capital Group Ltd. | 1,451,181 | 125,222 |
| | TD Ameritrade Holding Corp. | 2,863,708 | 124,858 |
| | Annaly Capital Management Inc. | 12,100,566 | 120,643 |
| * | Alleghany Corp. | 181,391 | 110,308 |
| | FNF Group | 3,218,879 | 109,313 |
| | Ally Financial Inc. | 5,581,946 | 106,169 |
| * | SVB Financial Group | 614,703 | 105,520 |
| | Everest Re Group Ltd. | 486,028 | 105,176 |
| | Raymond James Financial Inc. | 1,486,364 | 102,960 |
| | CIT Group Inc. | 2,383,450 | 101,726 |
| * | Signature Bank | 636,066 | 95,537 |
| | Reinsurance Group of America Inc. Class A | 758,028 | 95,383 |
| | New York Community Bancorp Inc. | 5,780,204 | 91,963 |
| | Voya Financial Inc. | 2,295,055 | 90,012 |
| | MSCI Inc. Class A | 1,115,879 | 87,909 |
| | East West Bancorp Inc. | 1,692,935 | 86,052 |
| | SEI Investments Co. | 1,593,457 | 78,653 |
| | FactSet Research Systems Inc. | 472,044 | 77,146 |
| | PacWest Bancorp | 1,401,159 | 76,279 |
| | WR Berkley Corp. | 1,144,960 | 76,151 |
| | American Financial Group Inc. | 854,318 | 75,283 |
| | AGNC Investment Corp. | 3,930,414 | 71,258 |
| | CBOE Holdings Inc. | 956,051 | 70,643 |
| | Endurance Specialty Holdings Ltd. | 759,305 | 70,160 |
| | Axis Capital Holdings Ltd. | 1,041,170 | 67,957 |
| | Starwood Property Trust Inc. | 3,036,260 | 66,646 |
| | RenaissanceRe Holdings Ltd. | 480,787 | 65,493 |
| | MarketAxess Holdings Inc. | 443,164 | 65,110 |
| | Lazard Ltd. Class A | 1,541,107 | 63,324 |
| | Commerce Bancshares Inc. | 1,043,591 | 60,330 |
| | Brown & Brown Inc. | 1,341,004 | 60,157 |
| | Webster Financial Corp. | 1,078,126 | 58,521 |
| | Synovus Financial Corp. | 1,423,074 | 58,460 |
| | Assured Guaranty Ltd. | 1,534,015 | 57,940 |
| | Cullen/Frost Bankers Inc. | 656,511 | 57,924 |
| | Prosperity Bancshares Inc. | 805,249 | 57,801 |
| | Bank of the Ozarks Inc. | 1,075,317 | 56,551 |
| | Allied World Assurance Co. Holdings AG | 1,041,901 | 55,961 |
| | Eaton Vance Corp. | 1,326,938 | 55,572 |
| * | SLM Corp. | 5,019,292 | 55,313 |
| | Old Republic International Corp. | 2,874,650 | 54,618 |
| | First Horizon National Corp. | 2,702,649 | 54,080 |
| * | Western Alliance Bancorp | 1,105,228 | 53,836 |
| | Popular Inc. | 1,222,117 | 53,553 |
| | Validus Holdings Ltd. | 938,627 | 51,634 |
| | Investors Bancorp Inc. | 3,673,403 | 51,244 |
| | PrivateBancorp Inc. | 939,306 | 50,901 |
| | Umpqua Holdings Corp. | 2,593,223 | 48,701 |
| | First American Financial Corp. | 1,298,115 | 47,550 |
| | New Residential Investment Corp. | 2,963,736 | 46,590 |
| | BankUnited Inc. | 1,217,421 | 45,885 |
| | Radian Group Inc. | 2,536,524 | 45,607 |
12
| | | |
| Vanguard® Extended Market Index Fund | | |
| Schedule of Investments | | |
| December 31, 2016 | | |
| |
| | | | Market |
| | | | Value |
| | | Shares | ($000) |
| | White Mountains Insurance Group Ltd. | 54,499 | 45,564 |
| | Hanover Insurance Group Inc. | 499,534 | 45,463 |
| | Bank of Hawaii Corp. | 511,202 | 45,339 |
| | Chemical Financial Corp. | 830,388 | 44,982 |
| * | Texas Capital Bancshares Inc. | 569,984 | 44,687 |
| | IBERIABANK Corp. | 526,199 | 44,069 |
| | United Bankshares Inc. | 950,959 | 43,982 |
| | Wintrust Financial Corp. | 600,824 | 43,602 |
| | Associated Banc-Corp | 1,763,480 | 43,558 |
| | Hancock Holding Co. | 978,463 | 42,172 |
| * | MGIC Investment Corp. | 4,016,381 | 40,927 |
| | Home BancShares Inc. | 1,450,709 | 40,286 |
| | FNB Corp. | 2,476,383 | 39,696 |
| | CNO Financial Group Inc. | 2,059,983 | 39,449 |
| | MB Financial Inc. | 833,172 | 39,351 |
| | UMB Financial Corp. | 508,453 | 39,212 |
| | TCF Financial Corp. | 1,981,564 | 38,819 |
| | Aspen Insurance Holdings Ltd. | 704,618 | 38,754 |
| * | Stifel Financial Corp. | 775,606 | 38,742 |
| | Fulton Financial Corp. | 2,030,634 | 38,176 |
| | First Citizens BancShares Inc. Class A | 105,814 | 37,564 |
| | Primerica Inc. | 540,362 | 37,366 |
| | Chimera Investment Corp. | 2,127,698 | 36,213 |
| | Washington Federal Inc. | 1,052,618 | 36,157 |
| | Two Harbors Investment Corp. | 4,135,498 | 36,062 |
| | Sterling Bancorp | 1,535,878 | 35,940 |
| | First Financial Bankshares Inc. | 787,103 | 35,577 |
| | Pinnacle Financial Partners Inc. | 513,025 | 35,553 |
| | Valley National Bancorp | 3,017,673 | 35,126 |
| | ProAssurance Corp. | 620,987 | 34,899 |
| | AmTrust Financial Services Inc. | 1,270,013 | 34,773 |
| | Community Bank System Inc. | 543,444 | 33,579 |
| | MFA Financial Inc. | 4,397,728 | 33,555 |
| | NorthStar Asset Management Group Inc. | 2,246,186 | 33,513 |
| | Cathay General Bancorp | 878,103 | 33,394 |
| | Blackstone Mortgage Trust Inc. Class A | 1,104,403 | 33,209 |
| | LPL Financial Holdings Inc. | 942,630 | 33,190 |
| | Hope Bancorp Inc. | 1,506,954 | 32,987 |
| | Glacier Bancorp Inc. | 898,578 | 32,555 |
| ^,* | Credit Acceptance Corp. | 149,327 | 32,480 |
| | Legg Mason Inc. | 1,063,102 | 31,797 |
| | Evercore Partners Inc. Class A | 455,123 | 31,267 |
| | BancorpSouth Inc. | 996,128 | 30,930 |
| | Federated Investors Inc. Class B | 1,090,284 | 30,833 |
| | Columbia Banking System Inc. | 689,851 | 30,823 |
| | Great Western Bancorp Inc. | 684,547 | 29,839 |
| | Selective Insurance Group Inc. | 677,014 | 29,145 |
| | Old National Bancorp | 1,595,365 | 28,956 |
| | Interactive Brokers Group Inc. | 784,895 | 28,657 |
| | RLI Corp. | 448,226 | 28,297 |
| * | Essent Group Ltd. | 872,195 | 28,233 |
| | Hilltop Holdings Inc. | 942,366 | 28,083 |
| | Trustmark Corp. | 783,582 | 27,935 |
| | International Bancshares Corp. | 683,339 | 27,880 |
| | Colony Capital Inc. Class A | 1,360,528 | 27,551 |
| | CVB Financial Corp. | 1,181,695 | 27,096 |
| | FirstCash Inc. | 573,362 | 26,948 |
| | Mercury General Corp. | 436,534 | 26,284 |
| | BGC Partners Inc. Class A | 2,561,893 | 26,208 |
| | South State Corp. | 296,411 | 25,906 |
| | EverBank Financial Corp. | 1,320,684 | 25,687 |
| | Erie Indemnity Co. Class A | 228,297 | 25,672 |
| | Capitol Federal Financial Inc. | 1,530,398 | 25,190 |
| * | Enstar Group Ltd. | 127,407 | 25,188 |
13
| | | |
| Vanguard® Extended Market Index Fund | | |
| Schedule of Investments | | |
| December 31, 2016 | | |
| |
| | | | Market |
| | | | Value |
| | | Shares | ($000) |
| | Kemper Corp. | 568,252 | 25,174 |
| | First Midwest Bancorp Inc. | 965,516 | 24,360 |
| | United Community Banks Inc. | 818,337 | 24,239 |
| | American Equity Investment Life Holding Co. | 1,033,686 | 23,299 |
| | Argo Group International Holdings Ltd. | 353,476 | 23,294 |
| | Financial Engines Inc. | 627,301 | 23,053 |
| | Independent Bank Corp. | 323,708 | 22,805 |
| * | Genworth Financial Inc. Class A | 5,944,888 | 22,650 |
| | Towne Bank | 675,367 | 22,456 |
| | Janus Capital Group Inc. | 1,679,293 | 22,284 |
| | Simmons First National Corp. Class A | 357,180 | 22,199 |
| | Northwest Bancshares Inc. | 1,215,659 | 21,918 |
| * | FCB Financial Holdings Inc. Class A | 456,463 | 21,773 |
| * | Eagle Bancorp Inc. | 356,015 | 21,699 |
| | Yadkin Financial Corp. | 629,591 | 21,570 |
| | First Financial Bancorp | 757,871 | 21,561 |
| | WesBanco Inc. | 497,246 | 21,411 |
| * | PRA Group Inc. | 546,224 | 21,357 |
| | BOK Financial Corp. | 257,176 | 21,356 |
| | Renasant Corp. | 499,803 | 21,102 |
| | LegacyTexas Financial Group Inc. | 485,705 | 20,914 |
| | NBT Bancorp Inc. | 493,459 | 20,666 |
| | Provident Financial Services Inc. | 724,747 | 20,510 |
| | Horace Mann Educators Corp. | 476,222 | 20,382 |
| | Astoria Financial Corp. | 1,073,685 | 20,024 |
| * | LendingClub Corp. | 3,798,682 | 19,943 |
| | ServisFirst Bancshares Inc. | 522,242 | 19,553 |
| | Union Bankshares Corp. | 546,775 | 19,542 |
| | First Merchants Corp. | 518,510 | 19,522 |
| ^ | Westamerica Bancorporation | 309,331 | 19,466 |
| ^,* | BofI Holding Inc. | 679,877 | 19,411 |
| | Invesco Mortgage Capital Inc. | 1,318,949 | 19,257 |
| | Park National Corp. | 159,344 | 19,067 |
| | BNC Bancorp | 594,562 | 18,967 |
| | Waddell & Reed Financial Inc. Class A | 966,867 | 18,864 |
| | Ameris Bancorp | 423,288 | 18,455 |
| | National General Holdings Corp. | 729,693 | 18,235 |
| * | Santander Consumer USA Holdings Inc. | 1,321,561 | 17,841 |
| | Beneficial Bancorp Inc. | 952,818 | 17,532 |
| | Banner Corp. | 312,870 | 17,461 |
| | Kearny Financial Corp. | 1,104,812 | 17,180 |
| | S&T Bancorp Inc. | 433,580 | 16,927 |
| | Morningstar Inc. | 228,554 | 16,812 |
| | Boston Private Financial Holdings Inc. | 994,340 | 16,456 |
| * | MBIA Inc. | 1,491,712 | 15,961 |
| | Navigators Group Inc. | 133,487 | 15,718 |
| | Apollo Commercial Real Estate Finance Inc. | 927,094 | 15,408 |
| | WSFS Financial Corp. | 330,906 | 15,338 |
| | Brookline Bancorp Inc. | 918,513 | 15,064 |
| | CenterState Banks Inc. | 595,579 | 14,991 |
| | Employers Holdings Inc. | 378,167 | 14,975 |
| | Maiden Holdings Ltd. | 858,010 | 14,972 |
| ^ | WisdomTree Investments Inc. | 1,340,741 | 14,936 |
| | Lakeland Financial Corp. | 313,339 | 14,840 |
| | First Commonwealth Financial Corp. | 1,042,647 | 14,785 |
| | Berkshire Hills Bancorp Inc. | 400,253 | 14,749 |
| | Tompkins Financial Corp. | 154,669 | 14,622 |
| | CYS Investments Inc. | 1,843,281 | 14,249 |
| | CNA Financial Corp. | 341,852 | 14,187 |
| | AMERISAFE Inc. | 226,590 | 14,128 |
| | Redwood Trust Inc. | 917,705 | 13,958 |
| | Artisan Partners Asset Management Inc. Class A | 466,114 | 13,867 |
| | Hanmi Financial Corp. | 395,738 | 13,811 |
| * | OneMain Holdings Inc. Class A | 622,255 | 13,777 |
14
| | |
| Vanguard® Extended Market Index Fund | | |
| Schedule of Investments | | |
| December 31, 2016 | | |
| |
| | | Market |
| | | Value |
| | Shares | ($000) |
| TFS Financial Corp. | 711,789 | 13,552 |
| Capital Bank Financial Corp. | 341,258 | 13,394 |
| Cardinal Financial Corp. | 406,217 | 13,320 |
| PennyMac Mortgage Investment Trust | 803,143 | 13,147 |
| First Busey Corp. | 424,993 | 13,081 |
| United Fire Group Inc. | 261,444 | 12,855 |
| * Green Dot Corp. Class A | 545,864 | 12,855 |
| Stewart Information Services Corp. | 274,854 | 12,665 |
| Sandy Spring Bancorp Inc. | 315,703 | 12,625 |
| Safety Insurance Group Inc. | 171,284 | 12,624 |
| Heartland Financial USA Inc. | 260,282 | 12,494 |
| Stock Yards Bancorp Inc. | 265,787 | 12,479 |
| American National Insurance Co. | 98,928 | 12,327 |
| Central Pacific Financial Corp. | 391,760 | 12,309 |
| City Holding Co. | 181,033 | 12,238 |
| Meridian Bancorp Inc. | 642,411 | 12,142 |
| State Bank Financial Corp. | 450,266 | 12,094 |
| United Financial Bancorp Inc. | 664,864 | 12,074 |
| Infinity Property & Casualty Corp. | 137,225 | 12,062 |
| * Piper Jaffray Cos. | 164,837 | 11,951 |
| * Customers Bancorp Inc. | 328,684 | 11,773 |
| Capstead Mortgage Corp. | 1,150,597 | 11,725 |
| Nelnet Inc. Class A | 230,949 | 11,721 |
| Bats Global Markets Inc. | 349,603 | 11,715 |
| Southside Bancshares Inc. | 309,135 | 11,645 |
| * Pacific Premier Bancorp Inc. | 328,263 | 11,604 |
| Northfield Bancorp Inc. | 558,621 | 11,156 |
| TrustCo Bank Corp. NY | 1,274,793 | 11,154 |
| * FNFV Group | 801,994 | 10,987 |
| Universal Insurance Holdings Inc. | 383,610 | 10,895 |
| Enterprise Financial Services Corp. | 253,065 | 10,882 |
| Washington Trust Bancorp Inc. | 190,720 | 10,690 |
| Meta Financial Group Inc. | 103,477 | 10,648 |
| 1st Source Corp. | 236,946 | 10,582 |
| OceanFirst Financial Corp. | 351,213 | 10,547 |
| National Bank Holdings Corp. Class A | 330,453 | 10,538 |
| Univest Corp. of Pennsylvania | 340,884 | 10,533 |
| * Walker & Dunlop Inc. | 336,592 | 10,502 |
| Flushing Financial Corp. | 356,373 | 10,474 |
| Heritage Financial Corp. | 406,066 | 10,456 |
| MainSource Financial Group Inc. | 302,299 | 10,399 |
| First Interstate BancSystem Inc. Class A | 240,582 | 10,237 |
| * First BanCorp (New York Shares) | 1,539,344 | 10,175 |
| German American Bancorp Inc. | 191,835 | 10,092 |
| Banc of California Inc. | 580,587 | 10,073 |
| Hannon Armstrong Sustainable Infrastructure Capital Inc. | 529,414 | 10,054 |
| FBL Financial Group Inc. Class A | 126,086 | 9,854 |
| * PHH Corp. | 641,357 | 9,723 |
| ARMOUR Residential REIT Inc. | 443,525 | 9,620 |
| BancFirst Corp. | 103,242 | 9,607 |
| Oritani Financial Corp. | 508,784 | 9,540 |
| Bryn Mawr Bank Corp. | 222,438 | 9,376 |
| Lakeland Bancorp Inc. | 479,889 | 9,358 |
| First Hawaiian Inc. | 268,515 | 9,350 |
| * MTGE Investment Corp. | 583,144 | 9,155 |
| National Western Life Group Inc. Class A | 29,274 | 9,098 |
| ConnectOne Bancorp Inc. | 347,816 | 9,026 |
| Community Trust Bancorp Inc. | 181,058 | 8,980 |
| TriCo Bancshares | 262,735 | 8,980 |
| Greenhill & Co. Inc. | 320,073 | 8,866 |
| * HomeStreet Inc. | 277,533 | 8,770 |
| Preferred Bank | 165,206 | 8,660 |
| * LendingTree Inc. | 85,093 | 8,624 |
| Ladder Capital Corp. Class A | 626,178 | 8,591 |
15
| | | |
| Vanguard® Extended Market Index Fund | | |
| Schedule of Investments | | |
| December 31, 2016 | | |
| |
| | | | Market |
| | | | Value |
| | | Shares | ($000) |
| | Great Southern Bancorp Inc. | 154,598 | 8,449 |
| | Bridge Bancorp Inc. | 222,367 | 8,428 |
| | New York Mortgage Trust Inc. | 1,273,991 | 8,408 |
| * | Seacoast Banking Corp. of Florida | 380,194 | 8,387 |
| | Cohen & Steers Inc. | 249,563 | 8,385 |
| | James River Group Holdings Ltd. | 201,154 | 8,358 |
| | Dime Community Bancshares Inc. | 411,785 | 8,277 |
| * | Greenlight Capital Re Ltd. Class A | 362,462 | 8,264 |
| | CoBiz Financial Inc. | 485,616 | 8,202 |
| * | Third Point Reinsurance Ltd. | 706,222 | 8,157 |
| | Independent Bank Group Inc. | 129,519 | 8,082 |
| | Mercantile Bank Corp. | 214,105 | 8,072 |
| | Virtus Investment Partners Inc. | 68,203 | 8,051 |
| | Camden National Corp. | 180,726 | 8,033 |
| * | Encore Capital Group Inc. | 279,957 | 8,021 |
| | Peoples Bancorp Inc. | 245,031 | 7,954 |
| | Diamond Hill Investment Group Inc. | 37,250 | 7,837 |
| * | KCG Holdings Inc. Class A | 591,044 | 7,831 |
| | First Financial Corp. | 147,493 | 7,788 |
| | Arrow Financial Corp. | 190,840 | 7,729 |
| | First of Long Island Corp. | 265,751 | 7,587 |
| * | INTL. FCStone Inc. | 191,289 | 7,575 |
| | Investment Technology Group Inc. | 382,352 | 7,548 |
| | Park Sterling Corp. | 693,428 | 7,482 |
| * | HarborOne Bancorp Inc. | 385,394 | 7,454 |
| | Virtu Financial Inc. Class A | 463,322 | 7,390 |
| | OFG Bancorp | 556,653 | 7,292 |
| * | Donnelley Financial Solutions Inc. | 315,024 | 7,239 |
| | First Bancorp | 266,726 | 7,239 |
| | Moelis & Co. Class A | 211,976 | 7,186 |
| * | Flagstar Bancorp Inc. | 266,264 | 7,173 |
| | QCR Holdings Inc. | 164,716 | 7,132 |
| | Blue Hills Bancorp Inc. | 376,981 | 7,068 |
| ^,* | Nationstar Mortgage Holdings Inc. | 390,036 | 7,044 |
| | Altisource Residential Corp. | 637,781 | 7,041 |
| | Horizon Bancorp | 250,615 | 7,017 |
| * | NMI Holdings Inc. Class A | 650,661 | 6,930 |
| | Financial Institutions Inc. | 200,570 | 6,860 |
| | Independent Bank Corp. | 313,302 | 6,799 |
| | Waterstone Financial Inc. | 361,546 | 6,652 |
| * | Ocwen Financial Corp. | 1,229,190 | 6,625 |
| * | Ambac Financial Group Inc. | 290,401 | 6,534 |
| | Opus Bank | 216,781 | 6,514 |
| | Fidelity Southern Corp. | 273,459 | 6,473 |
| * | HomeTrust Bancshares Inc. | 249,643 | 6,466 |
| | Federal Agricultural Mortgage Corp. | 112,831 | 6,462 |
| * | EZCORP Inc. Class A | 606,639 | 6,461 |
| | Southwest Bancorp Inc. | 222,441 | 6,451 |
| | Anworth Mortgage Asset Corp. | 1,247,419 | 6,449 |
| | Bank Mutual Corp. | 671,353 | 6,344 |
| | Suffolk Bancorp | 147,355 | 6,310 |
| * | TriState Capital Holdings Inc. | 280,421 | 6,197 |
| | AG Mortgage Investment Trust Inc. | 358,165 | 6,128 |
| | Stonegate Bank | 146,694 | 6,122 |
| * | CU Bancorp | 168,786 | 6,043 |
| * | Franklin Financial Network Inc. | 144,087 | 6,030 |
| | First Community Bancshares Inc. | 197,708 | 5,959 |
| | PJT Partners Inc. | 190,786 | 5,891 |
| | Guaranty Bancorp | 240,238 | 5,814 |
| | West Bancorporation Inc. | 231,991 | 5,730 |
| | First Defiance Financial Corp. | 112,578 | 5,712 |
| | State Auto Financial Corp. | 213,024 | 5,711 |
| | Westwood Holdings Group Inc. | 94,746 | 5,684 |
| | People's Utah Bancorp | 211,657 | 5,683 |
16
| | | |
| Vanguard® Extended Market Index Fund | | |
| Schedule of Investments | | |
| December 31, 2016 | | |
| |
| | | | Market |
| | | | Value |
| | | Shares | ($000) |
| | United Community Financial Corp. | 622,305 | 5,563 |
| | State National Cos. Inc. | 399,074 | 5,531 |
| ^,* | Citizens Inc. Class A | 546,004 | 5,362 |
| | Pacific Continental Corp. | 245,300 | 5,360 |
| | Live Oak Bancshares Inc. | 284,120 | 5,256 |
| | Heritage Commerce Corp. | 363,460 | 5,245 |
| | Peapack Gladstone Financial Corp. | 167,805 | 5,182 |
| | Western Asset Mortgage Capital Corp. | 512,006 | 5,156 |
| * | Bancorp Inc. | 653,921 | 5,140 |
| | OneBeacon Insurance Group Ltd. Class A | 317,423 | 5,095 |
| | Ares Commercial Real Estate Corp. | 368,606 | 5,061 |
| * | Allegiance Bancshares Inc. | 135,427 | 4,896 |
| | Heritage Insurance Holdings Inc. | 310,386 | 4,864 |
| | Republic Bancorp Inc. Class A | 121,974 | 4,823 |
| | First Connecticut Bancorp Inc. | 211,033 | 4,780 |
| * | Triumph Bancorp Inc. | 182,251 | 4,766 |
| * | Cowen Group Inc. Class A | 303,784 | 4,709 |
| * | Global Indemnity Ltd. | 122,401 | 4,677 |
| | Clifton Bancorp Inc. | 276,081 | 4,671 |
| | Houlihan Lokey Inc. | 149,863 | 4,664 |
| | Territorial Bancorp Inc. | 142,008 | 4,664 |
| * | First Foundation Inc. | 159,315 | 4,540 |
| | Citizens & Northern Corp. | 171,466 | 4,492 |
| | Dynex Capital Inc. | 650,800 | 4,438 |
| * | World Acceptance Corp. | 68,734 | 4,418 |
| * | PICO Holdings Inc. | 289,977 | 4,393 |
| * | National Commerce Corp. | 117,485 | 4,365 |
| | Carolina Financial Corp. | 140,863 | 4,337 |
| * | Nicolet Bankshares Inc. | 87,343 | 4,165 |
| | Sun Bancorp Inc. | 159,720 | 4,153 |
| | Kinsale Capital Group Inc. | 120,621 | 4,102 |
| | HCI Group Inc. | 103,398 | 4,082 |
| * | PennyMac Financial Services Inc. Class A | 244,026 | 4,063 |
| | Macatawa Bank Corp. | 386,064 | 4,019 |
| * | Republic First Bancorp Inc. | 480,436 | 4,012 |
| * | Safeguard Scientifics Inc. | 296,508 | 3,988 |
| | Arbor Realty Trust Inc. | 531,417 | 3,964 |
| | Arlington Asset Investment Corp. Class A | 266,617 | 3,951 |
| | Western New England Bancorp Inc. | 420,971 | 3,936 |
| * | Enova International Inc. | 312,302 | 3,919 |
| | Merchants Bancshares Inc. | 72,278 | 3,917 |
| | Farmers National Banc Corp. | 275,813 | 3,917 |
| | MBT Financial Corp. | 344,856 | 3,914 |
| * | WMIH Corp. | 2,511,617 | 3,893 |
| * | Green Bancorp Inc. | 256,078 | 3,892 |
| | First Bancorp Inc. | 117,592 | 3,892 |
| ^ | Fidelity & Guaranty Life | 163,005 | 3,863 |
| * | BSB Bancorp Inc. | 130,710 | 3,784 |
| | Baldwin & Lyons Inc. | 150,131 | 3,783 |
| | BankFinancial Corp. | 253,411 | 3,756 |
| | Heritage Oaks Bancorp | 302,047 | 3,724 |
| * | Ladenburg Thalmann Financial Services Inc. | 1,521,677 | 3,713 |
| | Bank of Marin Bancorp | 50,916 | 3,551 |
| ^ | Xenith Bankshares Inc. | 124,980 | 3,524 |
| | CNB Financial Corp. | 131,724 | 3,522 |
| | Farmers Capital Bank Corp. | 82,443 | 3,467 |
| | EMC Insurance Group Inc. | 114,838 | 3,446 |
| * | Cascade Bancorp | 421,570 | 3,423 |
| | Crawford & Co. Class B | 262,423 | 3,296 |
| | MidWestOne Financial Group Inc. | 87,390 | 3,286 |
| | United Insurance Holdings Corp. | 215,250 | 3,259 |
| | SI Financial Group Inc. | 210,747 | 3,246 |
| | Resource Capital Corp. | 386,414 | 3,219 |
| * | Regional Management Corp. | 121,910 | 3,204 |
17
| | | |
| Vanguard® Extended Market Index Fund | | |
| Schedule of Investments | | |
| December 31, 2016 | | |
| |
| | | | Market |
| | | | Value |
| | | Shares | ($000) |
| | National Bankshares Inc. | 73,268 | 3,184 |
| * | Drive Shack Inc. | 829,816 | 3,120 |
| | First Mid-Illinois Bancshares Inc. | 90,250 | 3,069 |
| | Oppenheimer Holdings Inc. Class A | 163,926 | 3,049 |
| | WashingtonFirst Bankshares Inc. | 104,585 | 3,032 |
| ^,* | Trupanion Inc. | 195,216 | 3,030 |
| | Sierra Bancorp | 113,632 | 3,021 |
| ^ | Orchid Island Capital Inc. | 275,495 | 2,984 |
| | American National Bankshares Inc. | 85,717 | 2,983 |
| | Northrim BanCorp Inc. | 93,713 | 2,961 |
| * | Atlantic Capital Bancshares Inc. | 154,881 | 2,943 |
| | ACNB Corp. | 93,329 | 2,917 |
| | MutualFirst Financial Inc. | 87,982 | 2,912 |
| | Enterprise Bancorp Inc. | 76,901 | 2,888 |
| | Southern Missouri Bancorp Inc. | 80,044 | 2,832 |
| | Ames National Corp. | 85,614 | 2,825 |
| * | NewStar Financial Inc. | 301,018 | 2,784 |
| | Bar Harbor Bankshares | 58,688 | 2,778 |
| | Century Bancorp Inc. Class A | 45,936 | 2,756 |
| | Old Second Bancorp Inc. | 248,545 | 2,746 |
| | Capital City Bank Group Inc. | 132,658 | 2,717 |
| | Peoples Financial Services Corp. | 55,754 | 2,715 |
| | Federated National Holding Co. | 144,203 | 2,695 |
| | Orrstown Financial Services Inc. | 117,749 | 2,638 |
| | Marlin Business Services Corp. | 121,639 | 2,542 |
| | Great Ajax Corp. | 191,207 | 2,537 |
| | Southern National Bancorp of Virginia Inc. | 149,899 | 2,449 |
| | Associated Capital Group Inc. Class A | 73,706 | 2,421 |
| * | Atlas Financial Holdings Inc. | 133,425 | 2,408 |
| | Calamos Asset Management Inc. Class A | 279,016 | 2,386 |
| | Pzena Investment Management Inc. Class A | 211,996 | 2,355 |
| * | On Deck Capital Inc. | 495,263 | 2,293 |
| | Bankwell Financial Group Inc. | 70,443 | 2,289 |
| * | Carolina Bank Holdings Inc. | 88,354 | 2,282 |
| | Penns Woods Bancorp Inc. | 45,088 | 2,277 |
| | LCNB Corp. | 97,431 | 2,265 |
| | Old Line Bancshares Inc. | 94,452 | 2,265 |
| | Summit Financial Group Inc. | 82,197 | 2,263 |
| * | Impac Mortgage Holdings Inc. | 160,151 | 2,245 |
| | Charter Financial Corp. | 134,272 | 2,238 |
| | Provident Financial Holdings Inc. | 107,492 | 2,174 |
| | Donegal Group Inc. Class A | 123,354 | 2,156 |
| | GAMCO Investors Inc. Class A | 69,440 | 2,145 |
| ^,* | Walter Investment Management Corp. | 449,674 | 2,136 |
| | First South Bancorp Inc. | 178,412 | 2,132 |
| * | First United Corp. | 133,225 | 2,125 |
| | Codorus Valley Bancorp Inc. | 74,088 | 2,119 |
| * | eHealth Inc. | 195,289 | 2,080 |
| | First Internet Bancorp | 63,127 | 2,020 |
| | ESSA Bancorp Inc. | 128,313 | 2,017 |
| | GAIN Capital Holdings Inc. | 306,420 | 2,016 |
| | Owens Realty Mortgage Inc. | 105,335 | 1,951 |
| | Lake Sunapee Bank Group | 81,775 | 1,929 |
| ^ | Access National Corp. | 69,268 | 1,923 |
| ^,* | Centrue Financial Corp. | 87,563 | 1,919 |
| | County Bancorp Inc. | 71,103 | 1,918 |
| | Bank of Commerce Holdings | 199,715 | 1,897 |
| * | First Community Financial Partners Inc. | 160,616 | 1,879 |
| | Hingham Institution for Savings | 9,487 | 1,867 |
| | Investors Title Co. | 11,774 | 1,862 |
| * | Pacific Mercantile Bancorp | 251,882 | 1,839 |
| | Middleburg Financial Corp. | 52,378 | 1,820 |
| * | Community Bankers Trust Corp. | 242,448 | 1,758 |
| * | Commerce Union Bancshares Inc. | 79,351 | 1,725 |
18
| | | |
| Vanguard® Extended Market Index Fund | | |
| Schedule of Investments | | |
| December 31, 2016 | | |
| |
| | | | Market |
| | | | Value |
| | | Shares | ($000) |
| | B. Riley Financial Inc. | 93,392 | 1,723 |
| | Peoples Bancorp of North Carolina Inc. | 68,581 | 1,719 |
| | First Financial Northwest Inc. | 86,263 | 1,703 |
| * | Veritex Holdings Inc. | 62,434 | 1,668 |
| | Home Bancorp Inc. | 43,065 | 1,663 |
| * | United Security Bancshares | 209,208 | 1,621 |
| | Shore Bancshares Inc. | 106,117 | 1,618 |
| * | Security National Financial Corp. Class A | 247,845 | 1,611 |
| | Tiptree Financial Inc. Class A | 259,253 | 1,594 |
| | Riverview Bancorp Inc. | 227,106 | 1,590 |
| | CIM Commercial Trust Corp. | 101,821 | 1,573 |
| * | Hallmark Financial Services Inc. | 129,322 | 1,504 |
| * | Asta Funding Inc. | 150,605 | 1,476 |
| ^,* | First NBC Bank Holding Co. | 198,931 | 1,452 |
| | First Community Corp. | 80,047 | 1,445 |
| | Central Valley Community Bancorp | 72,126 | 1,440 |
| | AmeriServ Financial Inc. | 386,789 | 1,431 |
| | Manning & Napier Inc. | 189,207 | 1,429 |
| * | Health Insurance Innovations Inc. Class A | 79,878 | 1,426 |
| | Independence Holding Co. | 67,781 | 1,325 |
| * | First Northwest Bancorp | 84,574 | 1,319 |
| | Hennessy Advisors Inc. | 41,306 | 1,311 |
| | Cherry Hill Mortgage Investment Corp. | 71,582 | 1,302 |
| | C&F Financial Corp. | 24,390 | 1,216 |
| * | Consumer Portfolio Services Inc. | 234,927 | 1,203 |
| | Northeast Bancorp | 88,486 | 1,159 |
| * | Nicholas Financial Inc. | 96,574 | 1,148 |
| | FBR & Co. | 88,283 | 1,148 |
| * | American River Bankshares | 75,440 | 1,140 |
| | Ellington Residential Mortgage REIT | 86,979 | 1,132 |
| | Unity Bancorp Inc. | 69,710 | 1,094 |
| | Donegal Group Inc. Class B | 63,194 | 1,087 |
| | Citizens Community Bancorp Inc. | 85,830 | 1,067 |
| | Timberland Bancorp Inc. | 51,504 | 1,064 |
| * | Colony Bankcorp Inc. | 80,138 | 1,058 |
| | Hawthorn Bancshares Inc. | 59,552 | 1,051 |
| | First Business Financial Services Inc. | 42,323 | 1,004 |
| | 1st Constitution Bancorp | 53,634 | 1,003 |
| | MidSouth Bancorp Inc. | 73,626 | 1,001 |
| * | Atlantic Coast Financial Corp. | 146,729 | 998 |
| | Chemung Financial Corp. | 27,067 | 984 |
| * | Southern First Bancshares Inc. | 27,324 | 984 |
| * | FB Financial Corp. | 37,732 | 979 |
| * | ASB Bancorp Inc. | 33,297 | 974 |
| | Parke Bancorp Inc. | 47,785 | 963 |
| | Ohio Valley Banc Corp. | 34,686 | 943 |
| | Eastern Virginia Bankshares Inc. | 84,892 | 887 |
| | Prudential Bancorp Inc. | 50,954 | 872 |
| | Five Oaks Investment Corp. | 171,105 | 850 |
| | Oak Valley Bancorp | 66,347 | 835 |
| * | HMN Financial Inc. | 47,639 | 834 |
| * | Sutherland Asset Management Corp. | 61,640 | 829 |
| | Civista Bancshares Inc. | 41,578 | 808 |
| | Premier Financial Bancorp Inc. | 39,684 | 798 |
| | Blue Capital Reinsurance Holdings Ltd. | 42,421 | 783 |
| | BCB Bancorp Inc. | 59,678 | 776 |
| | Guaranty Federal Bancshares Inc. | 36,591 | 775 |
| | Federal Agricultural Mortgage Corp. Class A | 12,586 | 768 |
| | Midland States Bancorp Inc. | 21,185 | 766 |
| ^,* | Stonegate Mortgage Corp. | 120,268 | 718 |
| | Bear State Financial Inc. | 69,876 | 709 |
| | Crawford & Co. Class A | 71,720 | 679 |
| | A-Mark Precious Metals Inc. | 33,035 | 644 |
| ^,* | Patriot National Inc. | 127,849 | 595 |
19
| | | |
| Vanguard® Extended Market Index Fund | | |
| Schedule of Investments | | |
| December 31, 2016 | | |
| |
| | | | Market |
| | | | Value |
| | | Shares | ($000) |
| ^ | Union Bankshares Inc. | 13,077 | 594 |
| * | Provident Bancorp Inc. | 32,975 | 590 |
| | Citizens Holding Co. | 22,634 | 585 |
| * | Entegra Financial Corp. | 28,080 | 578 |
| * | Howard Bancorp Inc. | 36,926 | 558 |
| | Norwood Financial Corp. | 16,771 | 556 |
| * | Equity Bancshares Inc. Class A | 16,282 | 548 |
| * | Ashford Inc. | 11,847 | 523 |
| | Fifth Street Asset Management Inc. | 77,630 | 520 |
| | SB Financial Group Inc. | 32,056 | 515 |
| ^ | Investar Holding Corp. | 26,569 | 496 |
| | First Bancshares Inc. | 17,269 | 475 |
| ^,* | FXCM Inc. Class A | 66,297 | 467 |
| | First Savings Financial Group Inc. | 9,746 | 465 |
| * | Emergent Capital Inc. | 377,679 | 457 |
| | Silvercrest Asset Management Group Inc. Class A | 33,627 | 442 |
| | Community Financial Corp. | 14,853 | 412 |
| | Two River Bancorp | 27,551 | 411 |
| | Georgetown Bancorp Inc. | 15,051 | 389 |
| | Manhattan Bridge Capital Inc. | 48,881 | 372 |
| * | Royal Bancshares of Pennsylvania Inc. | 88,717 | 368 |
| * | Anchor Bancorp Inc. | 13,377 | 364 |
| | Old Point Financial Corp. | 12,862 | 322 |
| | Medley Management Inc. Class A | 31,311 | 310 |
| | Evans Bancorp Inc. | 9,719 | 307 |
| | US Global Investors Inc. Class A | 210,856 | 287 |
| * | Select Bancorp Inc. | 28,302 | 279 |
| * | Atlanticus Holdings Corp. | 92,614 | 264 |
| | United Bancshares Inc. | 11,489 | 253 |
| | CB Financial Services Inc. | 9,734 | 252 |
| | Eagle Bancorp Montana Inc. | 11,839 | 250 |
| * | Malvern Bancorp Inc. | 11,498 | 243 |
| | FS Bancorp Inc. | 6,051 | 218 |
| * | TheStreet Inc. | 248,073 | 211 |
| * | Central Federal Corp. | 119,516 | 209 |
| * | SmartFinancial Inc. | 9,835 | 195 |
| * | Wolverine Bancorp Inc. | 5,954 | 188 |
| ^ | Greene County Bancorp Inc. | 7,840 | 180 |
| * | Conifer Holdings Inc. | 21,788 | 178 |
| | Sussex Bancorp | 8,387 | 175 |
| | Kingstone Cos. Inc. | 12,529 | 172 |
| * | First Acceptance Corp. | 155,452 | 162 |
| * | Capstar Financial Holdings Inc. | 6,983 | 153 |
| * | Severn Bancorp Inc. | 19,055 | 151 |
| | IF Bancorp Inc. | 7,557 | 140 |
| | Southwest Georgia Financial Corp. | 6,935 | 137 |
| | United Bancorp Inc. | 9,360 | 126 |
| * | Magyar Bancorp Inc. | 10,365 | 124 |
| | United Community Bancorp | 7,174 | 120 |
| | Bank of South Carolina Corp. | 5,642 | 118 |
| | Glen Burnie Bancorp | 9,147 | 105 |
| * | Paragon Commercial Corp. | 2,373 | 104 |
| * | Hamilton Bancorp Inc. | 7,058 | 101 |
| * | Peoples Financial Corp. | 6,186 | 100 |
| * | MSB Financial Corp. | 6,276 | 92 |
| * | Porter Bancorp Inc. | 7,410 | 91 |
| | Plumas Bancorp | 4,771 | 91 |
| | Salisbury Bancorp Inc. | 1,844 | 69 |
| | Kentucky First Federal Bancorp | 7,514 | 68 |
| ^,* | ZAIS Group Holdings Inc. | 43,042 | 63 |
| * | Randolph Bancorp Inc. | 3,912 | 63 |
| * | First Bank | 5,370 | 62 |
| | HopFed Bancorp Inc. | 4,622 | 62 |
| | DNB Financial Corp. | 2,013 | 57 |
20
| | | |
| Vanguard® Extended Market Index Fund | | |
| Schedule of Investments | | |
| December 31, 2016 | | |
| |
| | | | Market |
| | | | Value |
| | | Shares | ($000) |
| | First Capital Inc. | 1,612 | 53 |
| | Oconee Federal Financial Corp. | 2,383 | 52 |
| | PB Bancorp Inc. | 5,101 | 51 |
| | Mackinac Financial Corp. | 3,236 | 44 |
| * | 1347 Property Insurance Holdings Inc. | 5,528 | 43 |
| | Community West Bancshares | 4,500 | 42 |
| | Mid Penn Bancorp Inc. | 1,384 | 33 |
| | Fauquier Bankshares Inc. | 1,931 | 32 |
| | Bancorp of New Jersey Inc. | 2,245 | 30 |
| * | Sunshine Bancorp Inc. | 1,537 | 26 |
| * | National Holdings Corp. | 7,908 | 21 |
| * | Patriot National Bancorp Inc. | 1,479 | 21 |
| * | Village Bank and Trust Financial Corp. | 600 | 16 |
| | Landmark Bancorp Inc. | 541 | 15 |
| * | Bay Bancorp Inc. | 2,297 | 15 |
| | Value Line Inc. | 586 | 11 |
| | Auburn National Bancorporation Inc. | 359 | 11 |
| | California First National Bancorp | 703 | 11 |
| | Elmira Savings Bank | 431 | 9 |
| | Wellesley Bank | 300 | 8 |
| | Summit State Bank | 400 | 6 |
| | Siebert Financial Corp. | 1,836 | 5 |
| * | Coastway Bancorp Inc. | 300 | 5 |
| | Atlantic American Corp. | 1,084 | 4 |
| | Stewardship Financial Corp. | 400 | 4 |
| | Lake Shore Bancorp Inc. | 200 | 3 |
| * | Broadway Financial Corp. | 1,800 | 3 |
| | Sound Financial Bancorp Inc. | 100 | 3 |
| | First US Bancshares Inc. | 192 | 2 |
| | Institutional Financial Markets Inc. | 649 | 1 |
| | Newcastle Investment Corp. | | — |
| | | | 9,209,603 |
| Health Care (10.4%) | | |
| * | Incyte Corp. | 2,075,367 | 208,097 |
| * | BioMarin Pharmaceutical Inc. | 2,038,523 | 168,871 |
| * | IDEXX Laboratories Inc. | 1,060,981 | 124,421 |
| * | Quintiles IMS Holdings Inc. | 1,603,924 | 121,978 |
| | ResMed Inc. | 1,669,434 | 103,588 |
| * | Alkermes plc | 1,800,120 | 100,051 |
| * | Align Technology Inc. | 886,707 | 85,239 |
| | Teleflex Inc. | 523,102 | 84,298 |
| * | Jazz Pharmaceuticals plc | 710,508 | 77,467 |
| | West Pharmaceutical Services Inc. | 868,164 | 73,646 |
| * | MEDNAX Inc. | 1,093,351 | 72,883 |
| * | United Therapeutics Corp. | 503,459 | 72,211 |
| * | WellCare Health Plans Inc. | 524,107 | 71,845 |
| * | Ionis Pharmaceuticals Inc. | 1,440,363 | 68,893 |
| | STERIS plc | 1,012,694 | 68,245 |
| * | VCA Inc. | 954,550 | 65,530 |
| * | Seattle Genetics Inc. | 1,145,190 | 60,432 |
| * | DexCom Inc. | 1,004,705 | 59,981 |
| ^,* | TESARO Inc. | 406,561 | 54,674 |
| * | ABIOMED Inc. | 477,669 | 53,824 |
| * | athenahealth Inc. | 468,819 | 49,306 |
| * | Veeva Systems Inc. Class A | 1,197,755 | 48,749 |
| | Bio-Techne Corp. | 441,814 | 45,432 |
| * | Bio-Rad Laboratories Inc. Class A | 245,766 | 44,798 |
| | HealthSouth Corp. | 1,066,754 | 43,993 |
| * | Charles River Laboratories International Inc. | 554,322 | 42,234 |
| * | PAREXEL International Corp. | 628,840 | 41,327 |
| * | Alere Inc. | 1,034,458 | 40,313 |
| ^,* | OPKO Health Inc. | 4,311,849 | 40,100 |
| * | Exelixis Inc. | 2,685,606 | 40,042 |
| * | NuVasive Inc. | 594,056 | 40,016 |
21
| | | |
| Vanguard® Extended Market Index Fund | | |
| Schedule of Investments | | |
| December 31, 2016 | | |
| |
| | | | Market |
| | | | Value |
| | | Shares | ($000) |
| | Hill-Rom Holdings Inc. | 711,580 | 39,948 |
| * | Neurocrine Biosciences Inc. | 1,027,046 | 39,747 |
| * | Catalent Inc. | 1,466,060 | 39,525 |
| * | Team Health Holdings Inc. | 883,182 | 38,374 |
| * | Masimo Corp. | 519,424 | 35,009 |
| | Cantel Medical Corp. | 432,841 | 34,086 |
| * | INC Research Holdings Inc. Class A | 639,263 | 33,625 |
| * | Prestige Brands Holdings Inc. | 637,933 | 33,236 |
| ^,* | ACADIA Pharmaceuticals Inc. | 1,120,444 | 32,314 |
| * | Medidata Solutions Inc. | 643,154 | 31,945 |
| * | Alnylam Pharmaceuticals Inc. | 844,056 | 31,601 |
| * | Ultragenyx Pharmaceutical Inc. | 445,812 | 31,345 |
| * | Horizon Pharma plc | 1,913,047 | 30,953 |
| | Chemed Corp. | 191,771 | 30,762 |
| * | Integra LifeSciences Holdings Corp. | 353,200 | 30,301 |
| * | Acadia Healthcare Co. Inc. | 907,316 | 30,032 |
| * | Bluebird Bio Inc. | 481,570 | 29,713 |
| * | Neogen Corp. | 448,283 | 29,587 |
| * | ARIAD Pharmaceuticals Inc. | 2,299,445 | 28,605 |
| * | Wright Medical Group NV | 1,219,967 | 28,035 |
| * | Medicines Co. | 825,700 | 28,024 |
| * | Molina Healthcare Inc. | 505,779 | 27,444 |
| * | Brookdale Senior Living Inc. | 2,203,123 | 27,363 |
| * | LifePoint Health Inc. | 475,136 | 26,988 |
| | Bruker Corp. | 1,266,329 | 26,821 |
| | Owens & Minor Inc. | 745,729 | 26,317 |
| * | ICU Medical Inc. | 174,761 | 25,751 |
| * | Insulet Corp. | 678,659 | 25,572 |
| * | VWR Corp. | 1,016,734 | 25,449 |
| * | PRA Health Sciences Inc. | 456,113 | 25,141 |
| * | Haemonetics Corp. | 609,448 | 24,500 |
| * | Ironwood Pharmaceuticals Inc. Class A | 1,547,252 | 23,657 |
| ^,* | Kite Pharma Inc. | 526,691 | 23,617 |
| * | LivaNova plc | 521,998 | 23,474 |
| * | Ligand Pharmaceuticals Inc. | 225,694 | 22,933 |
| * | Akorn Inc. | 1,046,537 | 22,846 |
| ^,* | Intercept Pharmaceuticals Inc. | 208,731 | 22,679 |
| * | Allscripts Healthcare Solutions Inc. | 2,206,194 | 22,525 |
| * | Nektar Therapeutics Class A | 1,813,253 | 22,249 |
| * | AMN Healthcare Services Inc. | 571,287 | 21,966 |
| * | Globus Medical Inc. | 851,929 | 21,136 |
| * | Halyard Health Inc. | 563,134 | 20,825 |
| * | HealthEquity Inc. | 505,926 | 20,500 |
| * | Magellan Health Inc. | 271,567 | 20,435 |
| * | Cambrex Corp. | 378,414 | 20,415 |
| * | Clovis Oncology Inc. | 456,715 | 20,287 |
| ^,* | Prothena Corp. plc | 406,264 | 19,984 |
| * | Nevro Corp. | 267,660 | 19,448 |
| * | Penumbra Inc. | 303,582 | 19,369 |
| * | Sage Therapeutics Inc. | 369,802 | 18,882 |
| * | NxStage Medical Inc. | 707,225 | 18,536 |
| * | Zeltiq Aesthetics Inc. | 425,705 | 18,527 |
| * | HMS Holdings Corp. | 1,006,695 | 18,282 |
| * | Premier Inc. Class A | 591,918 | 17,971 |
| * | Array BioPharma Inc. | 1,995,661 | 17,542 |
| ^,* | Intrexon Corp. | 718,940 | 17,470 |
| ^,* | Exact Sciences Corp. | 1,286,119 | 17,183 |
| ^,* | Juno Therapeutics Inc. | 903,126 | 17,024 |
| * | Five Prime Therapeutics Inc. | 337,908 | 16,933 |
| * | Radius Health Inc. | 440,292 | 16,744 |
| * | Select Medical Holdings Corp. | 1,253,720 | 16,612 |
| * | Sarepta Therapeutics Inc. | 596,324 | 16,357 |
| ^,* | Agios Pharmaceuticals Inc. | 388,923 | 16,230 |
| * | Surgical Care Affiliates Inc. | 328,587 | 15,204 |
22
| | | |
| Vanguard® Extended Market Index Fund | | |
| Schedule of Investments | | |
| December 31, 2016 | | |
| |
| | | | Market |
| | | | Value |
| | | Shares | ($000) |
| * | Aerie Pharmaceuticals Inc. | 397,616 | 15,050 |
| * | Portola Pharmaceuticals Inc. | 668,052 | 14,991 |
| * | Supernus Pharmaceuticals Inc. | 583,315 | 14,729 |
| * | Omnicell Inc. | 431,615 | 14,632 |
| * | Pacira Pharmaceuticals Inc. | 446,364 | 14,418 |
| ^,* | Theravance Biopharma Inc. | 449,455 | 14,329 |
| * | Amedisys Inc. | 332,524 | 14,175 |
| * | Tenet Healthcare Corp. | 947,228 | 14,057 |
| * | AMAG Pharmaceuticals Inc. | 403,238 | 14,033 |
| | Abaxis Inc. | 265,305 | 14,000 |
| * | Merit Medical Systems Inc. | 527,718 | 13,985 |
| * | Myriad Genetics Inc. | 815,825 | 13,600 |
| * | Natus Medical Inc. | 389,294 | 13,547 |
| * | Emergent BioSolutions Inc. | 407,073 | 13,368 |
| * | FibroGen Inc. | 620,115 | 13,270 |
| | CONMED Corp. | 298,263 | 13,174 |
| ^,* | Halozyme Therapeutics Inc. | 1,328,781 | 13,128 |
| * | Depomed Inc. | 727,497 | 13,109 |
| * | Spark Therapeutics Inc. | 261,971 | 13,072 |
| * | Cynosure Inc. Class A | 285,339 | 13,011 |
| * | Synergy Pharmaceuticals Inc. | 2,129,493 | 12,969 |
| * | Air Methods Corp. | 402,296 | 12,813 |
| * | Inogen Inc. | 189,027 | 12,697 |
| * | Spectranetics Corp. | 514,306 | 12,600 |
| | Analogic Corp. | 151,322 | 12,552 |
| | Ensign Group Inc. | 561,406 | 12,469 |
| * | Repligen Corp. | 400,919 | 12,356 |
| * | Impax Laboratories Inc. | 884,632 | 11,721 |
| * | Vascular Solutions Inc. | 204,525 | 11,474 |
| * | Xencor Inc. | 435,344 | 11,458 |
| * | Momenta Pharmaceuticals Inc. | 758,137 | 11,410 |
| ^,* | TherapeuticsMD Inc. | 1,906,185 | 10,999 |
| * | Alder Biopharmaceuticals Inc. | 521,993 | 10,857 |
| | US Physical Therapy Inc. | 154,149 | 10,821 |
| ^,* | MiMedx Group Inc. | 1,198,491 | 10,619 |
| * | Acorda Therapeutics Inc. | 548,765 | 10,317 |
| * | Avexis Inc. | 215,860 | 10,303 |
| ^,* | Innoviva Inc. | 960,960 | 10,282 |
| * | Puma Biotechnology Inc. | 332,690 | 10,214 |
| * | Coherus Biosciences Inc. | 351,402 | 9,892 |
| * | Insmed Inc. | 735,131 | 9,726 |
| * | Acceleron Pharma Inc. | 380,176 | 9,702 |
| * | Integer Holdings Corp. | 324,246 | 9,549 |
| * | Luminex Corp. | 467,518 | 9,458 |
| * | Dermira Inc. | 309,281 | 9,380 |
| * | Cardiovascular Systems Inc. | 386,602 | 9,360 |
| | National HealthCare Corp. | 122,639 | 9,295 |
| | Meridian Bioscience Inc. | 524,862 | 9,290 |
| * | PharMerica Corp. | 364,056 | 9,156 |
| * | Healthways Inc. | 393,247 | 8,946 |
| | Atrion Corp. | 17,536 | 8,894 |
| * | Anika Therapeutics Inc. | 177,146 | 8,673 |
| * | Vanda Pharmaceuticals Inc. | 528,679 | 8,432 |
| * | Amicus Therapeutics Inc. | 1,680,305 | 8,351 |
| * | LHC Group Inc. | 178,970 | 8,179 |
| ^,* | Inovalon Holdings Inc. Class A | 782,878 | 8,064 |
| * | Orthofix International NV | 217,918 | 7,884 |
| * | Amphastar Pharmaceuticals Inc. | 427,704 | 7,878 |
| * | Blueprint Medicines Corp. | 278,274 | 7,806 |
| | Kindred Healthcare Inc. | 990,468 | 7,775 |
| * | Retrophin Inc. | 410,604 | 7,773 |
| | Aceto Corp. | 349,220 | 7,672 |
| ^,* | Lannett Co. Inc. | 347,781 | 7,669 |
| * | HealthStream Inc. | 304,562 | 7,629 |
23
| | | |
| Vanguard® Extended Market Index Fund | | |
| Schedule of Investments | | |
| December 31, 2016 | | |
| |
| | | | Market |
| | | | Value |
| | | Shares | ($000) |
| * | K2M Group Holdings Inc. | 379,032 | 7,596 |
| ^,* | ZIOPHARM Oncology Inc. | 1,418,821 | 7,591 |
| * | Lexicon Pharmaceuticals Inc. | 546,687 | 7,561 |
| * | MacroGenics Inc. | 369,580 | 7,554 |
| * | Community Health Systems Inc. | 1,349,519 | 7,544 |
| * | Quidel Corp. | 351,387 | 7,527 |
| * | BioTelemetry Inc. | 333,319 | 7,450 |
| ^,* | Eagle Pharmaceuticals Inc. | 93,693 | 7,434 |
| ^,* | Progenics Pharmaceuticals Inc. | 850,241 | 7,346 |
| ^,* | AtriCure Inc. | 374,072 | 7,321 |
| ^,* | Keryx Biopharmaceuticals Inc. | 1,247,303 | 7,309 |
| * | Quality Systems Inc. | 551,316 | 7,250 |
| * | Corcept Therapeutics Inc. | 975,180 | 7,080 |
| * | GenMark Diagnostics Inc. | 560,306 | 6,858 |
| * | Genomic Health Inc. | 229,488 | 6,745 |
| * | SciClone Pharmaceuticals Inc. | 610,601 | 6,594 |
| | Phibro Animal Health Corp. Class A | 223,651 | 6,553 |
| * | Universal American Corp. | 656,669 | 6,534 |
| * | CryoLife Inc. | 339,295 | 6,497 |
| * | Diplomat Pharmacy Inc. | 506,832 | 6,386 |
| * | AngioDynamics Inc. | 376,248 | 6,347 |
| * | Cross Country Healthcare Inc. | 394,767 | 6,162 |
| * | Triple-S Management Corp. Class B | 296,489 | 6,137 |
| * | Intra-Cellular Therapies Inc. Class A | 401,462 | 6,058 |
| ^,* | Merrimack Pharmaceuticals Inc. | 1,452,113 | 5,925 |
| ^,* | Accelerate Diagnostics Inc. | 284,753 | 5,909 |
| * | OraSure Technologies Inc. | 664,812 | 5,837 |
| * | Epizyme Inc. | 481,761 | 5,829 |
| * | Heska Corp. | 81,036 | 5,802 |
| * | Vocera Communications Inc. | 313,107 | 5,789 |
| * | Achillion Pharmaceuticals Inc. | 1,393,881 | 5,757 |
| ^,* | Cytokinetics Inc. | 473,645 | 5,755 |
| * | ANI Pharmaceuticals Inc. | 94,880 | 5,752 |
| * | BioCryst Pharmaceuticals Inc. | 900,846 | 5,702 |
| ^,* | Inovio Pharmaceuticals Inc. | 809,715 | 5,619 |
| * | Providence Service Corp. | 147,475 | 5,611 |
| | Landauer Inc. | 116,422 | 5,600 |
| * | Endologix Inc. | 971,966 | 5,560 |
| ^,* | Enanta Pharmaceuticals Inc. | 161,814 | 5,421 |
| * | Aimmune Therapeutics Inc. | 262,478 | 5,368 |
| ^,* | Cerus Corp. | 1,232,878 | 5,363 |
| * | Flexion Therapeutics Inc. | 281,259 | 5,350 |
| * | Capital Senior Living Corp. | 333,162 | 5,347 |
| * | NeoGenomics Inc. | 610,310 | 5,230 |
| * | Cotiviti Holdings Inc. | 150,307 | 5,171 |
| ^,* | Heron Therapeutics Inc. | 389,160 | 5,098 |
| * | Revance Therapeutics Inc. | 243,925 | 5,049 |
| * | Almost Family Inc. | 112,964 | 4,982 |
| * | Otonomy Inc. | 309,584 | 4,922 |
| | Invacare Corp. | 376,107 | 4,908 |
| ^,* | Omeros Corp. | 478,627 | 4,748 |
| * | Medpace Holdings Inc. | 131,501 | 4,743 |
| * | Accuray Inc. | 1,026,644 | 4,723 |
| ^,* | Albany Molecular Research Inc. | 251,338 | 4,715 |
| * | CorVel Corp. | 126,557 | 4,632 |
| * | Glaukos Corp. | 134,074 | 4,599 |
| * | Surmodics Inc. | 177,013 | 4,496 |
| * | PTC Therapeutics Inc. | 408,297 | 4,455 |
| * | Loxo Oncology Inc. | 137,893 | 4,428 |
| * | REGENXBIO Inc. | 236,652 | 4,390 |
| * | Curis Inc. | 1,416,991 | 4,364 |
| * | Akebia Therapeutics Inc. | 413,024 | 4,300 |
| * | Lion Biotechnologies Inc. | 616,701 | 4,286 |
| ^,* | Celldex Therapeutics Inc. | 1,193,439 | 4,225 |
24
| | | |
| Vanguard® Extended Market Index Fund | | |
| Schedule of Investments | | |
| December 31, 2016 | | |
| |
| | | | Market |
| | | | Value |
| | | Shares | ($000) |
| ^,* | Immunomedics Inc. | 1,146,562 | 4,208 |
| | PDL BioPharma Inc. | 1,978,926 | 4,195 |
| * | Aclaris Therapeutics Inc. | 154,067 | 4,181 |
| * | Arena Pharmaceuticals Inc. | 2,942,249 | 4,178 |
| * | Versartis Inc. | 280,377 | 4,178 |
| * | Civitas Solutions Inc. | 208,385 | 4,147 |
| ^,* | Aduro Biotech Inc. | 358,022 | 4,081 |
| * | Antares Pharma Inc. | 1,751,246 | 4,080 |
| ^,* | Novavax Inc. | 3,222,303 | 4,060 |
| ^,* | Aquinox Pharmaceuticals Inc. | 242,501 | 4,004 |
| ^,* | Geron Corp. | 1,928,805 | 3,993 |
| ^,* | Sucampo Pharmaceuticals Inc. Class A | 292,356 | 3,961 |
| | LeMaitre Vascular Inc. | 154,829 | 3,923 |
| * | Teladoc Inc. | 236,845 | 3,908 |
| * | STAAR Surgical Co. | 352,431 | 3,824 |
| ^,* | Organovo Holdings Inc. | 1,111,926 | 3,769 |
| ^,* | CoLucid Pharmaceuticals Inc. | 102,982 | 3,749 |
| * | Spectrum Pharmaceuticals Inc. | 841,888 | 3,730 |
| ^,* | ConforMIS Inc. | 457,586 | 3,706 |
| * | Achaogen Inc. | 284,322 | 3,702 |
| ^,* | Rockwell Medical Inc. | 560,033 | 3,668 |
| * | Natera Inc. | 310,818 | 3,640 |
| * | Intersect ENT Inc. | 300,645 | 3,638 |
| * | Agenus Inc. | 871,099 | 3,589 |
| ^,* | Teligent Inc. | 541,828 | 3,581 |
| * | Zogenix Inc. | 292,342 | 3,552 |
| * | Surgery Partners Inc. | 222,893 | 3,533 |
| * | NanoString Technologies Inc. | 158,216 | 3,528 |
| * | Enzo Biochem Inc. | 507,662 | 3,523 |
| * | Atara Biotherapeutics Inc. | 246,459 | 3,500 |
| * | Exactech Inc. | 127,296 | 3,475 |
| ^,* | Global Blood Therapeutics Inc. | 237,919 | 3,438 |
| ^,* | Collegium Pharmaceutical Inc. | 219,349 | 3,415 |
| * | Pacific Biosciences of California Inc. | 887,919 | 3,374 |
| * | Paratek Pharmaceuticals Inc. | 217,316 | 3,347 |
| * | Edge Therapeutics Inc. | 260,509 | 3,256 |
| * | Ardelyx Inc. | 223,966 | 3,180 |
| * | BioSpecifics Technologies Corp. | 57,022 | 3,176 |
| ^,* | Adamas Pharmaceuticals Inc. | 187,393 | 3,167 |
| * | Evolent Health Inc. Class A | 213,439 | 3,159 |
| * | CytomX Therapeutics Inc. | 283,077 | 3,111 |
| * | Cutera Inc. | 178,977 | 3,105 |
| ^,* | Bellicum Pharmaceuticals Inc. | 227,236 | 3,095 |
| * | Addus HomeCare Corp. | 88,003 | 3,085 |
| ^ | Computer Programs & Systems Inc. | 128,496 | 3,033 |
| ^,* | Advaxis Inc. | 422,405 | 3,024 |
| * | Rigel Pharmaceuticals Inc. | 1,250,561 | 2,976 |
| * | La Jolla Pharmaceutical Co. | 168,956 | 2,962 |
| * | American Renal Associates Holdings Inc. | 138,612 | 2,950 |
| * | AxoGen Inc. | 326,113 | 2,935 |
| ^,* | Editas Medicine Inc. | 178,039 | 2,890 |
| ^,* | BioTime Inc. | 782,976 | 2,827 |
| * | Foundation Medicine Inc. | 159,404 | 2,821 |
| * | Invitae Corp. | 355,052 | 2,819 |
| ^,* | WaVe Life Sciences Ltd. | 105,971 | 2,771 |
| ^,* | Corbus Pharmaceuticals Holdings Inc. | 326,208 | 2,756 |
| * | RadNet Inc. | 422,778 | 2,727 |
| * | Castlight Health Inc. Class B | 549,737 | 2,721 |
| * | Sangamo BioSciences Inc. | 890,707 | 2,717 |
| ^,* | Insys Therapeutics Inc. | 294,725 | 2,711 |
| * | Aratana Therapeutics Inc. | 374,677 | 2,690 |
| * | NewLink Genetics Corp. | 257,433 | 2,646 |
| * | PharmAthene Inc. | 792,958 | 2,577 |
| * | Trevena Inc. | 438,047 | 2,576 |
25
| | | |
| Vanguard® Extended Market Index Fund | | |
| Schedule of Investments | | |
| December 31, 2016 | | |
| |
| | | | Market |
| | | | Value |
| | | Shares | ($000) |
| * | Fluidigm Corp. | 349,430 | 2,544 |
| * | Quorum Health Corp. | 345,920 | 2,515 |
| ^,* | Cara Therapeutics Inc. | 269,440 | 2,503 |
| * | Esperion Therapeutics Inc. | 196,689 | 2,463 |
| ^,* | Seres Therapeutics Inc. | 244,838 | 2,424 |
| ^,* | TG Therapeutics Inc. | 516,891 | 2,404 |
| * | MyoKardia Inc. | 185,115 | 2,397 |
| * | Chimerix Inc. | 515,902 | 2,373 |
| * | Karyopharm Therapeutics Inc. | 249,393 | 2,344 |
| * | RTI Surgical Inc. | 714,267 | 2,321 |
| * | MediciNova Inc. | 383,348 | 2,312 |
| | Utah Medical Products Inc. | 31,411 | 2,285 |
| ^,* | Idera Pharmaceuticals Inc. | 1,517,570 | 2,276 |
| * | Durect Corp. | 1,692,439 | 2,268 |
| ^,* | MannKind Corp. | 3,506,741 | 2,233 |
| * | Stemline Therapeutics Inc. | 206,431 | 2,209 |
| ^,* | ImmunoGen Inc. | 1,074,575 | 2,192 |
| ^,* | Protagonist Therapeutics Inc. | 99,568 | 2,190 |
| * | Minerva Neurosciences Inc. | 186,059 | 2,186 |
| * | OncoMed Pharmaceuticals Inc. | 281,944 | 2,174 |
| * | Lantheus Holdings Inc. | 248,881 | 2,140 |
| ^,* | XBiotech Inc. | 210,843 | 2,134 |
| | Simulations Plus Inc. | 220,216 | 2,125 |
| * | Ignyta Inc. | 397,280 | 2,106 |
| * | Aevi Genomic Medicine Inc. | 405,817 | 2,102 |
| ^,* | Ocular Therapeutix Inc. | 250,329 | 2,095 |
| * | ChemoCentryx Inc. | 279,516 | 2,068 |
| * | Proteostasis Therapeutics Inc. | 162,252 | 1,989 |
| * | Concert Pharmaceuticals Inc. | 192,300 | 1,979 |
| | Psychemedics Corp. | 79,603 | 1,965 |
| * | Pfenex Inc. | 208,182 | 1,888 |
| * | Tetraphase Pharmaceuticals Inc. | 467,567 | 1,884 |
| ^,* | Sorrento Therapeutics Inc. | 382,837 | 1,876 |
| ^,* | Reata Pharmaceuticals Inc. Class A | 83,498 | 1,823 |
| | Digirad Corp. | 363,529 | 1,818 |
| ^,* | Dynavax Technologies Corp. | 453,967 | 1,793 |
| ^,* | NantKwest Inc. | 311,358 | 1,781 |
| * | Veracyte Inc. | 227,531 | 1,761 |
| * | FONAR Corp. | 91,223 | 1,747 |
| * | IRIDEX Corp. | 123,357 | 1,734 |
| ^,* | Athersys Inc. | 1,088,833 | 1,666 |
| * | Ophthotech Corp. | 341,037 | 1,647 |
| * | Derma Sciences Inc. | 315,867 | 1,643 |
| ^,* | Cempra Inc. | 585,771 | 1,640 |
| ^,* | Anavex Life Sciences Corp. | 414,138 | 1,640 |
| * | Harvard Bioscience Inc. | 537,268 | 1,639 |
| | National Research Corp. Class A | 85,884 | 1,632 |
| * | Entellus Medical Inc. | 85,602 | 1,624 |
| * | Assembly Biosciences Inc. | 130,804 | 1,589 |
| ^,* | InVivo Therapeutics Holdings Corp. | 371,281 | 1,559 |
| ^,* | Zynerba Pharmaceuticals Inc. | 97,960 | 1,527 |
| ^,* | BioScrip Inc. | 1,438,354 | 1,496 |
| ^,* | VIVUS Inc. | 1,261,035 | 1,450 |
| ^,* | Abeona Therapeutics Inc. | 294,998 | 1,431 |
| ^,* | Arrowhead Pharmaceuticals Inc. | 891,633 | 1,382 |
| * | Endocyte Inc. | 532,307 | 1,357 |
| ^,* | Adeptus Health Inc. Class A | 176,983 | 1,352 |
| ^,* | Osiris Therapeutics Inc. | 270,267 | 1,327 |
| ^,* | Vital Therapies Inc. | 301,067 | 1,310 |
| ^,* | TransEnterix Inc. | 1,007,234 | 1,309 |
| ^,* | Sientra Inc. | 151,502 | 1,291 |
| ^,* | Conatus Pharmaceuticals Inc. | 238,768 | 1,258 |
| * | Applied Genetic Technologies Corp. | 133,945 | 1,252 |
| ^,* | CytoSorbents Corp. | 228,684 | 1,246 |
26
| | | |
| Vanguard® Extended Market Index Fund | | |
| Schedule of Investments | | |
| December 31, 2016 | | |
| |
| | | | Market |
| | | | Value |
| | | Shares | ($000) |
| * | Genesis Healthcare Inc. | 289,345 | 1,230 |
| ^,* | BioDelivery Sciences International Inc. | 683,572 | 1,196 |
| * | Inotek Pharmaceuticals Corp. | 195,714 | 1,194 |
| * | Dimension Therapeutics Inc. | 272,840 | 1,187 |
| ^,* | T2 Biosystems Inc. | 224,691 | 1,182 |
| ^,* | ChromaDex Corp. | 351,731 | 1,164 |
| * | Clearside Biomedical Inc. | 130,225 | 1,164 |
| ^,* | Senseonics Holdings Inc. | 431,387 | 1,152 |
| ^,* | Navidea Biopharmaceuticals Inc. | 1,825,418 | 1,147 |
| * | Asterias Biotherapeutics Inc. | 249,224 | 1,146 |
| ^,* | Bio-Path Holdings Inc. | 835,995 | 1,129 |
| * | Alliance HealthCare Services Inc. | 117,162 | 1,125 |
| ^,* | Egalet Corp. | 146,611 | 1,122 |
| ^,* | Argos Therapeutics Inc. | 227,682 | 1,116 |
| ^,* | Cellular Biomedicine Group Inc. | 83,868 | 1,099 |
| ^,* | Genocea Biosciences Inc. | 266,365 | 1,097 |
| ^,* | Fortress Biotech Inc. | 402,296 | 1,086 |
| * | Vericel Corp. | 361,972 | 1,086 |
| * | AcelRx Pharmaceuticals Inc. | 404,934 | 1,053 |
| * | Intellia Therapeutics Inc. | 78,558 | 1,030 |
| * | Cidara Therapeutics Inc. | 98,411 | 1,023 |
| * | Syndax Pharmaceuticals Inc. | 142,328 | 1,020 |
| * | Mirati Therapeutics Inc. | 212,772 | 1,011 |
| * | SeaSpine Holdings Corp. | 127,737 | 1,009 |
| * | Cascadian Therapeutics Inc. | 232,062 | 1,000 |
| * | Regulus Therapeutics Inc. | 442,998 | 997 |
| ^,* | AAC Holdings Inc. | 135,879 | 984 |
| * | CTI BioPharma Corp. | 2,438,833 | 983 |
| * | Corvus Pharmaceuticals Inc. | 66,081 | 945 |
| * | Recro Pharma Inc. | 116,886 | 942 |
| ^,* | Invuity Inc. | 163,593 | 941 |
| ^,* | Catalyst Pharmaceuticals Inc. | 877,605 | 921 |
| * | Avinger Inc. | 245,071 | 907 |
| ^,* | Bovie Medical Corp. | 249,327 | 895 |
| * | Titan Pharmaceuticals Inc. | 222,994 | 892 |
| * | Zafgen Inc. | 280,098 | 891 |
| * | VolitionRX Ltd. | 193,694 | 885 |
| * | Selecta Biosciences Inc. | 50,997 | 875 |
| * | SCYNEXIS Inc. | 271,910 | 867 |
| ^,* | ContraVir Pharmaceuticals Inc. | 717,633 | 861 |
| ^,* | Synthetic Biologics Inc. | 1,119,816 | 854 |
| * | Juniper Pharmaceuticals Inc. | 145,613 | 815 |
| * | Peregrine Pharmaceuticals Inc. | 2,628,969 | 811 |
| * | Voyager Therapeutics Inc. | 63,399 | 808 |
| * | Infinity Pharmaceuticals Inc. | 594,123 | 802 |
| * | Palatin Technologies Inc. | 1,539,342 | 785 |
| ^,* | Trovagene Inc. | 366,544 | 770 |
| ^,* | CorMedix Inc. | 500,929 | 766 |
| * | Immune Design Corp. | 139,182 | 766 |
| ^,* | Neos Therapeutics Inc. | 129,639 | 758 |
| ^,* | Lipocine Inc. | 202,917 | 747 |
| * | Novan Inc. | 27,604 | 746 |
| * | MEI Pharma Inc. | 508,587 | 732 |
| ^,* | Adamis Pharmaceuticals Corp. | 227,111 | 715 |
| * | Audentes Therapeutics Inc. | 39,128 | 715 |
| * | ContraFect Corp. | 407,300 | 713 |
| * | Adverum Biotechnologies Inc. | 245,062 | 711 |
| ^,* | iRadimed Corp. | 63,253 | 702 |
| * | Agile Therapeutics Inc. | 122,469 | 698 |
| * | Biolase Inc. | 492,776 | 690 |
| * | Madrigal Pharmaceuticals Inc. | 45,831 | 683 |
| ^,* | Fate Therapeutics Inc. | 269,951 | 678 |
| * | GlycoMimetics Inc. | 110,674 | 675 |
| * | iRhythm Technologies Inc. | 22,429 | 673 |
27
| | | |
| Vanguard® Extended Market Index Fund | | |
| Schedule of Investments | | |
| December 31, 2016 | | |
| |
| | | | Market |
| | | | Value |
| | | Shares | ($000) |
| * | Kindred Biosciences Inc. | 157,268 | 668 |
| * | pSivida Corp. | 389,028 | 665 |
| * | OvaScience Inc. | 430,819 | 659 |
| * | Flex Pharma Inc. | 123,360 | 651 |
| * | Calithera Biosciences Inc. | 197,336 | 641 |
| * | Alimera Sciences Inc. | 571,883 | 618 |
| ^,* | Ampio Pharmaceuticals Inc. | 665,534 | 599 |
| * | Corium International Inc. | 146,185 | 594 |
| * | Dicerna Pharmaceuticals Inc. | 198,325 | 571 |
| ^,* | BrainStorm Cell Therapeutics Inc. | 224,848 | 571 |
| * | Cogentix Medical Inc. | 276,527 | 556 |
| * | Ohr Pharmaceutical Inc. | 370,228 | 555 |
| * | Nuvectra Corp. | 106,738 | 537 |
| * | Sunesis Pharmaceuticals Inc. | 146,679 | 531 |
| ^,* | IsoRay Inc. | 899,206 | 522 |
| ^,* | Actinium Pharmaceuticals Inc. | 590,270 | 516 |
| * | Tandem Diabetes Care Inc. | 238,448 | 513 |
| * | Tactile Systems Technology Inc. | 31,235 | 513 |
| * | vTv Therapeutics Inc. Class A | 104,300 | 504 |
| * | Icad Inc. | 151,494 | 490 |
| * | NanoViricides Inc. | 457,015 | 489 |
| ^,* | Ekso Bionics Holdings Inc. | 121,275 | 483 |
| ^,* | Corindus Vascular Robotics Inc. | 690,944 | 483 |
| * | Aptevo Therapeutics Inc. | 196,889 | 480 |
| * | Albireo Pharma Inc. | 26,735 | 474 |
| * | Sharps Compliance Corp. | 123,176 | 472 |
| * | Five Star Quality Care Inc. | 171,428 | 463 |
| ^,* | Second Sight Medical Products Inc. | 233,698 | 460 |
| * | Ra Pharmaceuticals Inc. | 30,110 | 457 |
| * | Verastem Inc. | 408,108 | 457 |
| * | Cumberland Pharmaceuticals Inc. | 83,070 | 457 |
| * | Kura Oncology Inc. | 75,416 | 445 |
| ^,* | CytRx Corp. | 1,177,731 | 438 |
| * | Repros Therapeutics Inc. | 324,976 | 429 |
| * | Obalon Therapeutics Inc. | 46,751 | 414 |
| * | Nivalis Therapeutics Inc. | 179,146 | 401 |
| * | Cymabay Therapeutics Inc. | 230,186 | 398 |
| ^,* | Tenax Therapeutics Inc. | 201,437 | 393 |
| * | AVEO Pharmaceuticals Inc. | 722,701 | 390 |
| * | Threshold Pharmaceuticals Inc. | 877,236 | 387 |
| ^,* | Unilife Corp. | 166,396 | 383 |
| * | Pain Therapeutics Inc. | 665,882 | 380 |
| * | Chembio Diagnostics Inc. | 55,638 | 378 |
| * | ArQule Inc. | 294,477 | 371 |
| ^,* | Eiger BioPharmaceuticals Inc. | 31,710 | 369 |
| ^,* | Neuralstem Inc. | 1,275,236 | 352 |
| * | Catabasis Pharmaceuticals Inc. | 97,213 | 351 |
| ^,* | XOMA Corp. | 82,339 | 347 |
| * | Ocera Therapeutics Inc. | 161,335 | 339 |
| * | Cytori Therapeutics Inc. | 220,670 | 333 |
| ^,* | Chiasma Inc. | 170,554 | 333 |
| * | aTyr Pharma Inc. | 149,848 | 322 |
| * | Misonix Inc. | 30,575 | 320 |
| ^,* | Galectin Therapeutics Inc. | 321,485 | 315 |
| * | Aviragen Therapeutics Inc. | 254,062 | 312 |
| ^,* | iBio Inc. | 778,558 | 308 |
| * | Rexahn Pharmaceuticals Inc. | 2,151,820 | 305 |
| ^,* | Immune Pharmaceuticals Inc. | 1,644,446 | 299 |
| * | Cyclacel Pharmaceuticals Inc. | 56,425 | 298 |
| ^,* | Anthera Pharmaceuticals Inc. | 459,479 | 298 |
| * | KemPharm Inc. | 92,405 | 273 |
| ^,* | Galena Biopharma Inc. | 137,845 | 267 |
| ^,* | Orexigen Therapeutics Inc. | 149,208 | 260 |
| * | Alphatec Holdings Inc. | 80,435 | 258 |
28
| | | |
| Vanguard® Extended Market Index Fund | | |
| Schedule of Investments | | |
| December 31, 2016 | | |
| |
| | | | Market |
| | | | Value |
| | | Shares | ($000) |
| * | Electromed Inc. | 65,485 | 254 |
| ^,* | Tracon Pharmaceuticals Inc. | 51,744 | 254 |
| * | Mast Therapeutics Inc. | 2,879,072 | 250 |
| ^,* | Sonoma Pharmaceuticals Inc. | 47,171 | 238 |
| * | MGC Diagnostics Corp. | 30,659 | 236 |
| * | AdCare Health Systems Inc. | 154,765 | 226 |
| ^,* | Tonix Pharmaceuticals Holding Corp. | 477,635 | 225 |
| ^,* | Eleven Biotherapeutics Inc. | 116,356 | 222 |
| * | Vical Inc. | 94,922 | 218 |
| ^,* | Heat Biologics Inc. | 249,554 | 213 |
| * | Fibrocell Science Inc. | 338,203 | 213 |
| * | Oncocyte Corp. | 30,109 | 212 |
| * | GTx Inc. | 38,765 | 205 |
| ^ | Pernix Therapeutics Holdings Inc. | 104,569 | 203 |
| ^,* | Cancer Genetics Inc. | 147,500 | 199 |
| ^,* | Amedica Corp. | 305,291 | 192 |
| ^,* | Evoke Pharma Inc. | 93,224 | 188 |
| * | OncoGenex Pharmaceuticals Inc. | 373,491 | 187 |
| * | TearLab Corp. Class A | 360,953 | 184 |
| * | Bioptix Inc. | 47,280 | 182 |
| ^,* | Dipexium Pharmaceuticals Inc. | 111,369 | 178 |
| ^,* | Marinus Pharmaceuticals Inc. | 164,030 | 166 |
| * | Hemispherx Biopharma Inc. | 234,096 | 161 |
| * | Syros Pharmaceuticals Inc. | 13,083 | 159 |
| * | Biostage Inc. | 175,608 | 156 |
| ^,* | Cesca Therapeutics Inc. | 45,008 | 155 |
| * | Connecture Inc. | 89,352 | 150 |
| * | Axsome Therapeutics Inc. | 21,924 | 148 |
| ^,* | Skyline Medical Inc. | 52,101 | 146 |
| * | ProPhase Labs Inc. | 72,896 | 146 |
| * | Caladrius Biosciences Inc. | 50,412 | 143 |
| * | Ritter Pharmaceuticals Inc. | 52,105 | 141 |
| * | CAS Medical Systems Inc. | 86,382 | 139 |
| * | CASI Pharmaceuticals Inc. | 119,606 | 138 |
| * | Imprimis Pharmaceuticals Inc. | 54,397 | 136 |
| * | Aldeyra Therapeutics Inc. | 25,182 | 135 |
| * | Cerulean Pharma Inc. | 189,449 | 134 |
| ^,* | OncoSec Medical Inc. | 107,403 | 132 |
| ^,* | Sunshine Heart Inc. | 376,718 | 132 |
| * | Aradigm Corp. | 81,743 | 131 |
| * | Tabula Rasa HealthCare Inc. | 8,597 | 129 |
| ^,* | Aethlon Medical Inc. | 30,551 | 128 |
| ^,* | Microbot Medical Inc. | 21,035 | 128 |
| * | CEL-SCI Corp. | 1,836,770 | 123 |
| ^,* | Tokai Pharmaceuticals Inc. | 125,110 | 122 |
| * | KalVista Pharmaceuticals Inc. | 16,292 | 115 |
| * | ADMA Biologics Inc. | 21,878 | 112 |
| * | Retractable Technologies Inc. | 116,008 | 108 |
| ^,* | Proteon Therapeutics Inc. | 56,237 | 107 |
| * | Viking Therapeutics Inc. | 89,522 | 107 |
| * | Apricus Biosciences Inc. | 81,812 | 106 |
| ^,* | Champions Oncology Inc. | 41,407 | 105 |
| ^,* | WaferGen Bio-systems Inc_1 | 21,088 | 104 |
| ^,* | ImmunoCellular Therapeutics Ltd. | 48,300 | 99 |
| * | Celsion Corp. | 317,144 | 99 |
| ^,* | Onconova Therapeutics Inc. | 43,127 | 98 |
| * | PhaseRx Inc. | 62,804 | 97 |
| * | Oragenics Inc. | 179,871 | 97 |
| ^,* | EyeGate Pharmaceuticals Inc. | 58,509 | 95 |
| * | PhotoMedex Inc. | 42,516 | 94 |
| ^,* | Atossa Genetics Inc. | 66,320 | 94 |
| ^,* | Windtree Therapeutics Inc. | 75,132 | 93 |
| ^,* | Biocept Inc. | 118,356 | 92 |
| ^,* | Cellectar Biosciences Inc. | 70,055 | 85 |
29
| | | |
| Vanguard® Extended Market Index Fund | | |
| Schedule of Investments | | |
| December 31, 2016 | | |
| |
| | | | Market |
| | | | Value |
| | | Shares | ($000) |
| ^,* | NovaBay Pharmaceuticals Inc. | 25,141 | 83 |
| * | SunLink Health Systems Inc. | 67,827 | 83 |
| * | ARCA biopharma Inc. | 28,967 | 83 |
| ^,* | Neothetics Inc. | 70,877 | 79 |
| * | InfuSystem Holdings Inc. | 30,037 | 77 |
| * | Mirna Therapeutics Inc. | 41,296 | 74 |
| ^,* | OpGen Inc. | 64,263 | 74 |
| ^,* | Roka Bioscience Inc. | 17,286 | 73 |
| ^,* | BioLife Solutions Inc. | 44,612 | 72 |
| * | Dextera Surgical Inc. | 73,902 | 71 |
| * | Viveve Medical Inc. | 13,746 | 71 |
| | Daxor Corp. | 8,705 | 71 |
| * | AmpliPhi Biosciences Corp. | 158,510 | 70 |
| * | Bioanalytical Systems Inc. | 91,696 | 70 |
| ^,* | Wright Medical Group Inc. CVR | 52,493 | 69 |
| ^,* | Opexa Therapeutics Inc. | 74,491 | 69 |
| * | Acura Pharmaceuticals Inc. | 89,117 | 68 |
| * | Catalyst Biosciences Inc. | 101,658 | 66 |
| * | Fulgent Genetics Inc. | 5,703 | 66 |
| * | Aeglea BioTherapeutics Inc. | 14,998 | 65 |
| ^,* | RXi Pharmaceuticals Corp. | 90,785 | 65 |
| * | Cleveland BioLabs Inc. | 45,001 | 64 |
| | Kewaunee Scientific Corp. | 2,595 | 63 |
| * | Novelion Therapeutics Inc. | 7,376 | 62 |
| * | GenVec Inc. | 17,639 | 57 |
| * | ViewRay Inc. | 17,901 | 56 |
| ^,* | Jaguar Animal Health Inc. | 77,275 | 55 |
| ^,* | Presbia plc | 15,400 | 54 |
| ^,* | Interpace Diagnostics Group Inc. | 12,227 | 54 |
| * | Signal Genetics Inc. | 10,118 | 51 |
| * | Capnia Inc. | 62,070 | 50 |
| | National Research Corp. Class B | 1,200 | 50 |
| * | Alliqua BioMedical Inc. | 84,563 | 50 |
| ^,* | Delcath Systems Inc. | 53,323 | 49 |
| * | Vermillion Inc. | 49,637 | 47 |
| | Hooper Holmes Inc. | 57,400 | 47 |
| * | CombiMatrix Corp. | 16,875 | 45 |
| * | Gemphire Therapeutics Inc. | 5,556 | 44 |
| * | BioPharmX Corp. | 110,662 | 41 |
| ^,* | Moleculin Biotech Inc. | 17,958 | 41 |
| ^,* | InspireMD Inc. | 15,881 | 40 |
| ^,* | EnteroMedics Inc. | 19,071 | 38 |
| ^,* | Cerecor Inc. | 42,876 | 38 |
| ^,* | Medovex Corp. | 26,905 | 36 |
| * | Transgenomic Inc. | 130,140 | 35 |
| ^,* | Rennova Health Inc. | 397,780 | 33 |
| * | Kadmon Holdings Inc. | 5,759 | 31 |
| * | Apollo Endosurgery Inc. | 2,122 | 29 |
| * | CareDx Inc. | 10,033 | 27 |
| * | Streamline Health Solutions Inc. | 21,760 | 27 |
| * | VistaGen Therapeutics Inc. | 6,972 | 26 |
| * | Strata Skin Sciences Inc. | 54,307 | 24 |
| * | Pro-Dex Inc. | 4,785 | 22 |
| ^,* | NeuroMetrix Inc. | 28,787 | 21 |
| * | Capricor Therapeutics Inc. | 7,229 | 19 |
| * | HTG Molecular Diagnostics Inc. | 8,100 | 18 |
| * | Xtant Medical Holdings Inc. | 32,713 | 18 |
| * | MabVax Therapeutics Holdings Inc. | 4,734 | 16 |
| ^,* | Asterias Biotherapeutics Inc. Warrants Exp. 02/15/2017 | 28,992 | 16 |
| ^,* | Akers Biosciences Inc. | 7,910 | 15 |
| * | Pulse Biosciences Inc. | 2,206 | 14 |
| | Span-America Medical Systems Inc. | 705 | 13 |
| * | Allied Healthcare Products Inc. | 5,860 | 12 |
| | Diversicare Healthcare Services Inc. | 953 | 10 |
30
| | |
| Vanguard® Extended Market Index Fund | | |
| Schedule of Investments | | |
| December 31, 2016 | | |
| |
| | | Market |
| | | Value |
| | Shares | ($000) |
| * Oncobiologics Inc. | 2,925 | 9 |
| * Pulmatrix Inc. | 14,046 | 8 |
| * Ligand Pharmaceuticals Glucagon CVR | 395,811 | 7 |
| * Ligand Pharmaceuticals General CVR | 395,811 | 7 |
| * Ligand Pharmaceuticals Beta CVR | 395,811 | 6 |
| * Arrhythmia Research Technology Inc. | 1,175 | 4 |
| * Ligand Pharmaceuticals Roche CVR | 395,811 | 1 |
| * American Shared Hospital Services | 276 | 1 |
| * DarioHealth Corp. | 251 | 1 |
| * Histogenics Corp. | 400 | 1 |
| * Zosano Pharma Corp. | 747 | 1 |
| | | 5,392,573 |
| Industrials (13.4%) | | |
| * IHS Markit Ltd. | 3,907,394 | 138,361 |
| Huntington Ingalls Industries Inc. | 550,342 | 101,368 |
| * HD Supply Holdings Inc. | 2,380,801 | 101,208 |
| * Middleby Corp. | 683,637 | 88,059 |
| Wabtec Corp. | 1,058,285 | 87,859 |
| * JetBlue Airways Corp. | 3,841,017 | 86,116 |
| Spirit AeroSystems Holdings Inc. Class A | 1,449,452 | 84,576 |
| Carlisle Cos. Inc. | 763,076 | 84,160 |
| AO Smith Corp. | 1,745,443 | 82,647 |
| IDEX Corp. | 905,913 | 81,587 |
| * Sensata Technologies Holding NV | 2,025,090 | 78,877 |
| Macquarie Infrastructure Corp. | 894,932 | 73,116 |
| B/E Aerospace Inc. | 1,206,922 | 72,645 |
| Toro Co. | 1,289,354 | 72,139 |
| ManpowerGroup Inc. | 796,319 | 70,769 |
| Hubbell Inc. Class B | 605,938 | 70,713 |
| Nordson Corp. | 629,505 | 70,536 |
| Lennox International Inc. | 459,148 | 70,328 |
| * Old Dominion Freight Line Inc. | 817,207 | 70,108 |
| KAR Auction Services Inc. | 1,639,551 | 69,878 |
| Owens Corning | 1,342,844 | 69,237 |
| * Copart Inc. | 1,204,902 | 66,764 |
| Allison Transmission Holdings Inc. | 1,960,880 | 66,062 |
| Donaldson Co. Inc. | 1,569,248 | 66,034 |
| * AECOM | 1,811,113 | 65,852 |
| * WABCO Holdings Inc. | 616,724 | 65,465 |
| Orbital ATK Inc. | 693,713 | 60,859 |
| Oshkosh Corp. | 884,550 | 57,151 |
| Lincoln Electric Holdings Inc. | 734,751 | 56,333 |
| Hexcel Corp. | 1,091,552 | 56,149 |
| Graco Inc. | 660,795 | 54,905 |
| Curtiss-Wright Corp. | 521,020 | 51,248 |
| EMCOR Group Inc. | 715,876 | 50,655 |
| * Genesee & Wyoming Inc. Class A | 724,127 | 50,262 |
| * Teledyne Technologies Inc. | 408,147 | 50,202 |
| Trinity Industries Inc. | 1,797,103 | 49,888 |
| MSC Industrial Direct Co. Inc. Class A | 521,459 | 48,178 |
| * Spirit Airlines Inc. | 825,309 | 47,752 |
| CLARCOR Inc. | 576,254 | 47,524 |
| BWX Technologies Inc. | 1,177,682 | 46,754 |
| AGCO Corp. | 797,934 | 46,168 |
| Watsco Inc. | 308,283 | 45,663 |
| Woodward Inc. | 652,348 | 45,045 |
| Crane Co. | 590,710 | 42,602 |
| * Kirby Corp. | 634,800 | 42,214 |
| Landstar System Inc. | 493,360 | 42,084 |
| * Colfax Corp. | 1,161,460 | 41,731 |
| * XPO Logistics Inc. | 959,954 | 41,432 |
| Deluxe Corp. | 566,374 | 40,558 |
| ITT Inc. | 1,047,354 | 40,396 |
| EnerSys | 510,654 | 39,882 |
31
| | |
| Vanguard® Extended Market Index Fund | | |
| Schedule of Investments | | |
| December 31, 2016 | | |
| |
| | | Market |
| | | Value |
| | Shares | ($000) |
| Terex Corp. | 1,262,603 | 39,810 |
| Rollins Inc. | 1,153,671 | 38,971 |
| Air Lease Corp. Class A | 1,127,961 | 38,723 |
| * Avis Budget Group Inc. | 1,045,514 | 38,349 |
| Chicago Bridge & Iron Co. NV | 1,190,183 | 37,788 |
| Valmont Industries Inc. | 267,720 | 37,722 |
| Regal Beloit Corp. | 526,115 | 36,433 |
| * Hawaiian Holdings Inc. | 632,471 | 36,051 |
| * Clean Harbors Inc. | 615,193 | 34,235 |
| Healthcare Services Group Inc. | 857,444 | 33,586 |
| * Beacon Roofing Supply Inc. | 710,976 | 32,755 |
| * WESCO International Inc. | 491,051 | 32,679 |
| Timken Co. | 820,012 | 32,554 |
| Joy Global Inc. | 1,160,260 | 32,487 |
| * TransUnion | 1,035,737 | 32,035 |
| * Manitowoc Foodservice Inc. | 1,633,017 | 31,566 |
| * WageWorks Inc. | 432,757 | 31,375 |
| * Generac Holdings Inc. | 765,611 | 31,191 |
| * USG Corp. | 1,071,449 | 30,943 |
| * Esterline Technologies Corp. | 346,833 | 30,938 |
| * Dycom Industries Inc. | 373,044 | 29,952 |
| * MasTec Inc. | 776,551 | 29,703 |
| John Bean Technologies Corp. | 344,451 | 29,606 |
| Kennametal Inc. | 938,624 | 29,341 |
| HNI Corp. | 524,020 | 29,303 |
| Tetra Tech Inc. | 672,108 | 29,001 |
| GATX Corp. | 468,026 | 28,821 |
| Matthews International Corp. Class A | 373,798 | 28,726 |
| * Univar Inc. | 1,009,874 | 28,650 |
| HEICO Corp. Class A | 421,866 | 28,645 |
| Hillenbrand Inc. | 740,658 | 28,404 |
| Barnes Group Inc. | 598,917 | 28,401 |
| KBR Inc. | 1,696,263 | 28,311 |
| * KLX Inc. | 613,957 | 27,696 |
| Applied Industrial Technologies Inc. | 465,238 | 27,635 |
| ABM Industries Inc. | 663,540 | 27,099 |
| Mueller Industries Inc. | 676,441 | 27,031 |
| UniFirst Corp. | 183,935 | 26,422 |
| * NOW Inc. | 1,273,540 | 26,069 |
| * RBC Bearings Inc. | 280,029 | 25,989 |
| Allegiant Travel Co. Class A | 155,259 | 25,835 |
| Knight Transportation Inc. | 778,815 | 25,740 |
| Granite Construction Inc. | 465,638 | 25,610 |
| MSA Safety Inc. | 368,625 | 25,557 |
| * On Assignment Inc. | 571,601 | 25,242 |
| Mueller Water Products Inc. Class A | 1,894,430 | 25,215 |
| * Moog Inc. Class A | 380,964 | 25,022 |
| * Armstrong World Industries Inc. | 586,366 | 24,510 |
| AMERCO | 66,266 | 24,491 |
| Universal Forest Products Inc. | 238,665 | 24,387 |
| Herman Miller Inc. | 709,337 | 24,259 |
| Covanta Holding Corp. | 1,545,702 | 24,113 |
| * Navistar International Corp. | 759,577 | 23,828 |
| * Swift Transportation Co. | 977,926 | 23,822 |
| * Rexnord Corp. | 1,212,096 | 23,745 |
| * Masonite International Corp. | 356,662 | 23,468 |
| * MRC Global Inc. | 1,147,731 | 23,253 |
| CEB Inc. | 379,514 | 22,999 |
| * FTI Consulting Inc. | 499,443 | 22,515 |
| G&K Services Inc. Class A | 232,756 | 22,449 |
| SkyWest Inc. | 615,309 | 22,428 |
| * Trex Co. Inc. | 344,424 | 22,181 |
| Brink's Co. | 531,664 | 21,931 |
| Watts Water Technologies Inc. Class A | 330,215 | 21,530 |
32
| | |
| Vanguard® Extended Market Index Fund | | |
| Schedule of Investments | | |
| December 31, 2016 | | |
| |
| | | Market |
| | | Value |
| | Shares | ($000) |
| Simpson Manufacturing Co. Inc. | 490,359 | 21,453 |
| * DigitalGlobe Inc. | 736,722 | 21,107 |
| Brady Corp. Class A | 552,406 | 20,743 |
| AZZ Inc. | 308,422 | 19,708 |
| Korn/Ferry International | 668,810 | 19,683 |
| HEICO Corp. | 252,379 | 19,471 |
| * Hertz Global Holdings Inc. | 873,430 | 18,831 |
| Steelcase Inc. Class A | 1,031,988 | 18,473 |
| Exponent Inc. | 304,489 | 18,361 |
| Apogee Enterprises Inc. | 339,788 | 18,199 |
| Franklin Electric Co. Inc. | 459,056 | 17,857 |
| Matson Inc. | 503,527 | 17,820 |
| Actuant Corp. Class A | 684,695 | 17,768 |
| ESCO Technologies Inc. | 312,085 | 17,680 |
| Forward Air Corp. | 370,218 | 17,541 |
| * Hub Group Inc. Class A | 394,960 | 17,280 |
| EnPro Industries Inc. | 256,419 | 17,272 |
| * ACCO Brands Corp. | 1,263,303 | 16,486 |
| Kaman Corp. | 335,798 | 16,431 |
| Knoll Inc. | 580,308 | 16,208 |
| Albany International Corp. | 344,673 | 15,958 |
| Insperity Inc. | 223,651 | 15,868 |
| * Advisory Board Co. | 476,679 | 15,850 |
| Mobile Mini Inc. | 522,542 | 15,807 |
| AAON Inc. | 476,923 | 15,762 |
| * SPX FLOW Inc. | 491,528 | 15,758 |
| * Atlas Air Worldwide Holdings Inc. | 299,567 | 15,622 |
| Triumph Group Inc. | 589,424 | 15,620 |
| * Gibraltar Industries Inc. | 370,550 | 15,433 |
| Astec Industries Inc. | 226,640 | 15,289 |
| Tennant Co. | 214,330 | 15,260 |
| * TASER International Inc. | 621,019 | 15,054 |
| * Aerojet Rocketdyne Holdings Inc. | 831,937 | 14,933 |
| * Mercury Systems Inc. | 487,631 | 14,736 |
| * Proto Labs Inc. | 286,673 | 14,721 |
| Comfort Systems USA Inc. | 440,968 | 14,684 |
| * Navigant Consulting Inc. | 559,415 | 14,645 |
| Interface Inc. Class A | 772,508 | 14,330 |
| Aircastle Ltd. | 684,319 | 14,268 |
| Werner Enterprises Inc. | 528,466 | 14,242 |
| Cubic Corp. | 294,359 | 14,115 |
| West Corp. | 565,445 | 14,000 |
| * Team Inc. | 351,900 | 13,812 |
| ^ Greenbrier Cos. Inc. | 331,683 | 13,781 |
| RR Donnelley & Sons Co. | 827,371 | 13,503 |
| Standex International Corp. | 152,678 | 13,413 |
| * Saia Inc. | 296,645 | 13,097 |
| * Patrick Industries Inc. | 170,736 | 13,027 |
| * Chart Industries Inc. | 361,282 | 13,013 |
| * Huron Consulting Group Inc. | 256,155 | 12,974 |
| * Tutor Perini Corp. | 462,180 | 12,941 |
| * ICF International Inc. | 233,626 | 12,896 |
| * TriMas Corp. | 545,919 | 12,829 |
| * Lydall Inc. | 207,350 | 12,825 |
| US Ecology Inc. | 258,550 | 12,708 |
| * Meritor Inc. | 1,022,280 | 12,697 |
| Harsco Corp. | 933,385 | 12,694 |
| CIRCOR International Inc. | 194,611 | 12,626 |
| AAR Corp. | 380,550 | 12,577 |
| * American Woodmark Corp. | 165,724 | 12,471 |
| * TrueBlue Inc. | 500,296 | 12,332 |
| Multi-Color Corp. | 158,275 | 12,282 |
| Sun Hydraulics Corp. | 304,501 | 12,171 |
| Altra Industrial Motion Corp. | 325,478 | 12,010 |
33
| | | |
| Vanguard® Extended Market Index Fund | | |
| Schedule of Investments | | |
| December 31, 2016 | | |
| |
| | | | Market |
| | | | Value |
| | | Shares | ($000) |
| * | Wabash National Corp. | 741,534 | 11,731 |
| * | Herc Holdings Inc. | 287,536 | 11,547 |
| | Federal Signal Corp. | 737,141 | 11,507 |
| * | SPX Corp. | 484,184 | 11,485 |
| | Briggs & Stratton Corp. | 510,857 | 11,372 |
| * | Continental Building Products Inc. | 484,994 | 11,203 |
| | McGrath RentCorp | 284,553 | 11,152 |
| | Primoris Services Corp. | 489,205 | 11,144 |
| * | BMC Stock Holdings Inc. | 567,298 | 11,062 |
| * | Builders FirstSource Inc. | 1,003,460 | 11,008 |
| | Viad Corp. | 247,340 | 10,908 |
| | Raven Industries Inc. | 432,623 | 10,902 |
| | General Cable Corp. | 569,999 | 10,858 |
| | Argan Inc. | 153,203 | 10,808 |
| | Encore Wire Corp. | 246,944 | 10,705 |
| * | TriNet Group Inc. | 414,849 | 10,628 |
| | Heartland Express Inc. | 521,368 | 10,615 |
| * | Wesco Aircraft Holdings Inc. | 700,381 | 10,471 |
| * | Rush Enterprises Inc. Class A | 325,508 | 10,384 |
| * | Aegion Corp. Class A | 430,960 | 10,214 |
| * | SiteOne Landscape Supply Inc. | 289,825 | 10,066 |
| * | Babcock & Wilcox Enterprises Inc. | 595,213 | 9,875 |
| | Lindsay Corp. | 129,526 | 9,664 |
| * | Manitowoc Co. Inc. | 1,611,407 | 9,636 |
| | LSC Communications Inc. | 317,607 | 9,427 |
| | Quad/Graphics Inc. | 346,716 | 9,320 |
| | Griffon Corp. | 351,549 | 9,211 |
| | Essendant Inc. | 439,700 | 9,190 |
| * | Air Transport Services Group Inc. | 573,586 | 9,154 |
| | Douglas Dynamics Inc. | 268,470 | 9,034 |
| * | CBIZ Inc. | 654,757 | 8,970 |
| | Advanced Drainage Systems Inc. | 429,145 | 8,840 |
| | Alamo Group Inc. | 115,855 | 8,817 |
| | Global Brass & Copper Holdings Inc. | 254,004 | 8,712 |
| | H&E Equipment Services Inc. | 368,342 | 8,564 |
| | Kadant Inc. | 139,029 | 8,509 |
| | Quanex Building Products Corp. | 417,435 | 8,474 |
| | Kelly Services Inc. Class A | 358,295 | 8,212 |
| | Resources Connection Inc. | 417,009 | 8,027 |
| * | Echo Global Logistics Inc. | 318,789 | 7,986 |
| | Kimball International Inc. Class B | 449,164 | 7,887 |
| | ArcBest Corp. | 284,375 | 7,863 |
| * | Thermon Group Holdings Inc. | 401,443 | 7,664 |
| | Hyster-Yale Materials Handling Inc. | 115,029 | 7,335 |
| | Insteel Industries Inc. | 203,953 | 7,269 |
| * | NCI Building Systems Inc. | 461,082 | 7,216 |
| | Kforce Inc. | 307,964 | 7,114 |
| | National Presto Industries Inc. | 66,766 | 7,104 |
| * | MYR Group Inc. | 187,815 | 7,077 |
| | Columbus McKinnon Corp. | 260,503 | 7,044 |
| * | Engility Holdings Inc. | 207,368 | 6,988 |
| ^,* | Nexeo Solutions Inc. | 744,350 | 6,930 |
| * | Aerovironment Inc. | 253,774 | 6,809 |
| * | CSW Industrials Inc. | 183,266 | 6,753 |
| * | SP Plus Corp. | 238,946 | 6,726 |
| * | Astronics Corp. | 198,363 | 6,713 |
| | Marten Transport Ltd. | 286,879 | 6,684 |
| * | PGT Innovations Inc. | 583,279 | 6,679 |
| * | RPX Corp. | 609,164 | 6,579 |
| | Gorman-Rupp Co. | 208,973 | 6,468 |
| * | DXP Enterprises Inc. | 183,213 | 6,365 |
| * | Armstrong Flooring Inc. | 311,877 | 6,209 |
| | Triton International Ltd. | 392,894 | 6,208 |
| | NN Inc. | 317,927 | 6,057 |
34
| | | |
| Vanguard® Extended Market Index Fund | | |
| Schedule of Investments | | |
| December 31, 2016 | | |
| |
| | | | Market |
| | | | Value |
| | | Shares | ($000) |
| * | Veritiv Corp. | 111,669 | 6,002 |
| * | Casella Waste Systems Inc. Class A | 477,394 | 5,924 |
| * | GP Strategies Corp. | 202,802 | 5,800 |
| | Titan International Inc. | 512,079 | 5,740 |
| | Ennis Inc. | 330,278 | 5,730 |
| * | Atkore International Group Inc. | 234,004 | 5,595 |
| | Barrett Business Services Inc. | 84,649 | 5,426 |
| ^,* | KEYW Holding Corp. | 459,388 | 5,416 |
| | Heidrick & Struggles International Inc. | 223,365 | 5,394 |
| * | Mistras Group Inc. | 201,533 | 5,175 |
| * | YRC Worldwide Inc. | 387,480 | 5,146 |
| * | Kratos Defense & Security Solutions Inc. | 663,863 | 4,913 |
| * | InnerWorkings Inc. | 489,297 | 4,820 |
| | CRA International Inc. | 124,179 | 4,545 |
| * | Advanced Disposal Services Inc. | 202,836 | 4,507 |
| | Park-Ohio Holdings Corp. | 105,494 | 4,494 |
| * | Ply Gem Holdings Inc. | 272,898 | 4,435 |
| | American Railcar Industries Inc. | 95,297 | 4,316 |
| | Powell Industries Inc. | 109,552 | 4,273 |
| | CECO Environmental Corp. | 306,143 | 4,271 |
| | VSE Corp. | 107,216 | 4,164 |
| ^,* | Sunrun Inc. | 755,283 | 4,011 |
| * | Acacia Research Corp. | 607,639 | 3,950 |
| * | Vicor Corp. | 257,599 | 3,890 |
| ^,* | Energy Recovery Inc. | 370,634 | 3,836 |
| * | Roadrunner Transportation Systems Inc. | 350,548 | 3,642 |
| * | Orion Group Holdings Inc. | 359,892 | 3,581 |
| * | Milacron Holdings Corp. | 190,887 | 3,556 |
| | Miller Industries Inc. | 131,403 | 3,476 |
| ^,* | Energous Corp. | 200,688 | 3,382 |
| * | Titan Machinery Inc. | 230,101 | 3,353 |
| * | Franklin Covey Co. | 162,710 | 3,279 |
| * | Ducommun Inc. | 124,595 | 3,185 |
| * | Hudson Technologies Inc. | 395,810 | 3,170 |
| * | Vectrus Inc. | 131,949 | 3,147 |
| * | NV5 Global Inc. | 94,173 | 3,145 |
| | LSI Industries Inc. | 318,009 | 3,097 |
| * | Great Lakes Dredge & Dock Corp. | 728,096 | 3,058 |
| * | Omega Flex Inc. | 52,866 | 2,948 |
| * | Sparton Corp. | 116,951 | 2,789 |
| ^,* | Plug Power Inc. | 2,314,550 | 2,777 |
| | DMC Global Inc. | 174,824 | 2,771 |
| * | Layne Christensen Co. | 247,564 | 2,691 |
| | Graham Corp. | 121,410 | 2,689 |
| * | Covenant Transportation Group Inc. Class A | 138,791 | 2,684 |
| * | Heritage-Crystal Clean Inc. | 170,291 | 2,674 |
| * | ARC Document Solutions Inc. | 519,035 | 2,637 |
| * | Sterling Construction Co. Inc. | 310,737 | 2,629 |
| * | GMS Inc. | 83,093 | 2,433 |
| * | HC2 Holdings Inc. | 399,902 | 2,371 |
| | FreightCar America Inc. | 158,566 | 2,367 |
| | Celadon Group Inc. | 330,133 | 2,360 |
| * | Northwest Pipe Co. | 137,039 | 2,360 |
| * | TRC Cos. Inc. | 221,785 | 2,351 |
| * | Astronics Corp. Class B | 64,296 | 2,167 |
| | Hurco Cos. Inc. | 64,564 | 2,137 |
| | Supreme Industries Inc. Class A | 135,414 | 2,126 |
| | Allied Motion Technologies Inc. | 97,910 | 2,094 |
| * | Hill International Inc. | 470,171 | 2,045 |
| * | Willdan Group Inc. | 83,047 | 1,876 |
| * | Commercial Vehicle Group Inc. | 336,390 | 1,860 |
| ^,* | Aqua Metals Inc. | 141,622 | 1,857 |
| * | Willis Lease Finance Corp. | 72,565 | 1,856 |
| * | IES Holdings Inc. | 95,123 | 1,822 |
35
| | | |
| Vanguard® Extended Market Index Fund | | |
| Schedule of Investments | | |
| December 31, 2016 | | |
| |
| | | | Market |
| | | | Value |
| | | Shares | ($000) |
| * | Lawson Products Inc. | 74,832 | 1,781 |
| | LB Foster Co. Class A | 128,824 | 1,752 |
| * | CAI International Inc. | 192,034 | 1,665 |
| * | Gencor Industries Inc. | 103,498 | 1,625 |
| | Preformed Line Products Co. | 27,933 | 1,623 |
| * | Twin Disc Inc. | 107,314 | 1,567 |
| ^,* | Cogint Inc. | 449,220 | 1,550 |
| | Houston Wire & Cable Co. | 229,259 | 1,490 |
| * | CDI Corp. | 199,837 | 1,479 |
| | Universal Logistics Holdings Inc. | 90,303 | 1,476 |
| | BG Staffing Inc. | 93,507 | 1,459 |
| ^,* | Blue Bird Corp. | 91,667 | 1,416 |
| * | Goldfield Corp. | 275,174 | 1,403 |
| * | Neff Corp. Class A | 96,808 | 1,365 |
| * | TPI Composites Inc. | 82,404 | 1,322 |
| * | Ameresco Inc. Class A | 238,619 | 1,312 |
| | Hardinge Inc. | 116,163 | 1,287 |
| * | Pendrell Corp. | 188,561 | 1,273 |
| * | NL Industries Inc. | 154,923 | 1,263 |
| * | Huttig Building Products Inc. | 189,104 | 1,250 |
| ^,* | ExOne Co. | 133,638 | 1,248 |
| * | Manitex International Inc. | 174,112 | 1,194 |
| * | American Superconductor Corp. | 160,473 | 1,183 |
| * | Rush Enterprises Inc. Class B | 37,435 | 1,156 |
| * | Radiant Logistics Inc. | 293,761 | 1,146 |
| * | LMI Aerospace Inc. | 120,694 | 1,040 |
| * | CPI Aerostructures Inc. | 109,718 | 1,015 |
| * | USA Truck Inc. | 115,451 | 1,006 |
| * | Arotech Corp. | 280,563 | 982 |
| * | Intersections Inc. | 230,073 | 918 |
| * | Xerium Technologies Inc. | 157,637 | 886 |
| * | Performant Financial Corp. | 362,336 | 851 |
| | Eastern Co. | 36,857 | 770 |
| * | Cenveo Inc. | 105,894 | 740 |
| ^,* | FuelCell Energy Inc. | 393,526 | 689 |
| * | Alpha Pro Tech Ltd. | 166,676 | 583 |
| * | Cemtrex Inc. | 77,347 | 571 |
| * | Broadwind Energy Inc. | 141,048 | 571 |
| * | Volt Information Sciences Inc. | 78,998 | 541 |
| * | Enphase Energy Inc. | 533,702 | 539 |
| * | Ultralife Corp. | 108,865 | 539 |
| * | Orion Energy Systems Inc. | 244,672 | 531 |
| * | MFRI Inc. | 62,526 | 506 |
| ^,* | Energy Focus Inc. | 119,019 | 506 |
| | LS Starrett Co. Class A | 53,715 | 500 |
| * | Revolution Lighting Technologies Inc. | 89,267 | 491 |
| ^,* | Power Solutions International Inc. | 61,416 | 461 |
| * | Key Technology Inc. | 39,089 | 456 |
| * | Astrotech Corp. | 304,120 | 453 |
| | Ecology and Environment Inc. | 42,341 | 447 |
| * | Innovative Solutions & Support Inc. | 128,429 | 428 |
| * | Taylor Devices Inc. | 27,595 | 419 |
| * | RCM Technologies Inc. | 59,789 | 380 |
| | BlueLinx Holdings Inc. | 48,194 | 360 |
| * | SIFCO Industries Inc. | 46,067 | 352 |
| * | Patriot Transportation Holding Inc. | 13,987 | 326 |
| ^,* | EnSync Inc. | 409,415 | 295 |
| * | Jewett-Cameron Trading Co. Ltd. | 23,964 | 294 |
| | Hudson Global Inc. | 213,918 | 291 |
| * | Transcat Inc. | 26,809 | 290 |
| * | Genco Shipping & Trading Ltd. | 39,166 | 289 |
| | EnviroStar Inc. | 19,908 | 289 |
| ^,* | Odyssey Marine Exploration Inc. | 78,053 | 267 |
| * | Perma-Fix Environmental Services | 64,750 | 253 |
36
| | | |
| Vanguard® Extended Market Index Fund | | |
| Schedule of Investments | | |
| December 31, 2016 | | |
| |
| | | | Market |
| | | | Value |
| | | Shares | ($000) |
| * | ARC Group Worldwide Inc. | 56,384 | 248 |
| ^,* | Capstone Turbine Corp. | 362,750 | 247 |
| ^,* | MagneGas Corp. | 542,533 | 244 |
| * | General Finance Corp. | 37,989 | 211 |
| ^,* | Ocean Power Technologies Inc. | 68,169 | 201 |
| | Servotronics Inc. | 19,902 | 200 |
| | American Outdoor Brands Corp. | 9,200 | 194 |
| * | Fuel Tech Inc. | 154,534 | 178 |
| * | Mastech Digital Inc. | 25,867 | 176 |
| * | Rand Logistics Inc. | 201,218 | 167 |
| * | AMREP Corp. | 22,245 | 165 |
| * | PAM Transportation Services Inc. | 5,940 | 154 |
| * | Air T Inc. | 6,332 | 145 |
| * | Marathon Patent Group Inc. | 79,068 | 136 |
| * | DLH Holdings Corp. | 20,751 | 123 |
| * | Jason Industries Inc. | 66,813 | 120 |
| | Chicago Rivet & Machine Co. | 2,805 | 117 |
| * | Industrial Services of America Inc. | 50,110 | 90 |
| * | Versar Inc. | 59,676 | 82 |
| ^,* | Lightbridge Corp. | 62,054 | 71 |
| * | American Electric Technologies Inc. | 43,060 | 67 |
| * | Pangaea Logistics Solutions Ltd. | 16,910 | 58 |
| ^,* | Spherix Inc. | 52,691 | 55 |
| ^,* | Real Goods Solar Inc. Class A | 183,913 | 44 |
| ^,* | Ideal Power Inc. | 9,203 | 30 |
| ^,* | GEE Group Inc. | 6,780 | 30 |
| * | Continental Materials Corp. | 1,122 | 27 |
| * | LiqTech International Inc. | 32,928 | 21 |
| * | Art's-Way Manufacturing Co. Inc. | 5,943 | 20 |
| * | Digital Power Corp. | 26,268 | 17 |
| * | Staffing 360 Solutions Inc. | 21,301 | 16 |
| | Espey Manufacturing & Electronics Corp. | 566 | 15 |
| * | Tel-Instrument Electronics Corp. | 3,304 | 15 |
| | CompX International Inc. | 679 | 11 |
| | Acme United Corp. | 409 | 10 |
| * | Micronet Enertec Technologies Inc. | 3,100 | 4 |
| | WSI Industries Inc. | 805 | 2 |
| * | Quest Resource Holding Corp. | 978 | 2 |
| * | Tecogen Inc. | 517 | 2 |
| * | CTPartners Executive Search Inc. | 83,162 | — |
| | | | 6,913,704 |
| Information Technology (16.5%) | | |
| * | FleetCor Technologies Inc. | 1,101,666 | 155,908 |
| * | Dell Technologies Inc. Class V | 2,641,049 | 145,178 |
| * | ServiceNow Inc. | 1,949,717 | 144,942 |
| * | Palo Alto Networks Inc. | 1,090,519 | 136,369 |
| | Maxim Integrated Products Inc. | 3,358,921 | 129,554 |
| * | Twitter Inc. | 7,139,726 | 116,378 |
| * | Vantiv Inc. Class A | 1,849,988 | 110,296 |
| | CDK Global Inc. | 1,767,145 | 105,481 |
| * | Synopsys Inc. | 1,779,828 | 104,761 |
| * | Advanced Micro Devices Inc. | 9,029,459 | 102,394 |
| | CDW Corp. | 1,899,105 | 98,924 |
| * | Gartner Inc. | 978,746 | 98,922 |
| | Computer Sciences Corp. | 1,664,314 | 98,894 |
| * | Workday Inc. Class A | 1,449,225 | 95,779 |
| * | ANSYS Inc. | 1,019,745 | 94,316 |
| | Broadridge Financial Solutions Inc. | 1,410,902 | 93,543 |
| * | Trimble Inc. | 2,957,349 | 89,164 |
| | Leidos Holdings Inc. | 1,697,633 | 86,817 |
| * | Cadence Design Systems Inc. | 3,403,662 | 85,840 |
| * | CommScope Holding Co. Inc. | 2,275,637 | 84,654 |
| * | Splunk Inc. | 1,596,895 | 81,681 |
| | Jack Henry & Associates Inc. | 915,546 | 81,282 |
37
| | | |
| Vanguard® Extended Market Index Fund | | |
| Schedule of Investments | | |
| December 31, 2016 | | |
| |
| | | | Market |
| | | | Value |
| | | Shares | ($000) |
| * | Arrow Electronics Inc. | 1,058,332 | 75,459 |
| * | Keysight Technologies Inc. | 2,010,971 | 73,541 |
| * | Microsemi Corp. | 1,362,546 | 73,537 |
| | Marvell Technology Group Ltd. | 5,291,490 | 73,393 |
| * | CoStar Group Inc. | 385,615 | 72,685 |
| | Avnet Inc. | 1,510,709 | 71,925 |
| * | ARRIS International plc | 2,260,799 | 68,118 |
| ^,* | VMware Inc. Class A | 845,480 | 66,565 |
| | Cognex Corp. | 1,010,803 | 64,307 |
| | Booz Allen Hamilton Holding Corp. Class A | 1,761,074 | 63,522 |
| * | ON Semiconductor Corp. | 4,940,952 | 63,047 |
| * | Ultimate Software Group Inc. | 345,465 | 62,996 |
| * | PTC Inc. | 1,353,676 | 62,635 |
| | Sabre Corp. | 2,446,473 | 61,039 |
| | Teradyne Inc. | 2,364,950 | 60,070 |
| | Brocade Communications Systems Inc. | 4,791,060 | 59,840 |
| * | NCR Corp. | 1,464,135 | 59,385 |
| | SS&C Technologies Holdings Inc. | 2,020,314 | 57,781 |
| * | Tyler Technologies Inc. | 397,578 | 56,762 |
| * | IAC/InterActiveCorp | 868,064 | 56,242 |
| * | Zebra Technologies Corp. | 624,763 | 53,580 |
| | Jabil Circuit Inc. | 2,226,029 | 52,690 |
| * | Fortinet Inc. | 1,744,196 | 52,535 |
| * | Take-Two Interactive Software Inc. | 1,029,702 | 50,754 |
| * | WEX Inc. | 454,777 | 50,753 |
| * | Cavium Inc. | 793,423 | 49,541 |
| * | Aspen Technology Inc. | 903,003 | 49,376 |
| | Mentor Graphics Corp. | 1,296,714 | 47,836 |
| ^,* | Arista Networks Inc. | 491,200 | 47,533 |
| | j2 Global Inc. | 567,073 | 46,387 |
| * | Nuance Communications Inc. | 3,022,783 | 45,039 |
| * | Manhattan Associates Inc. | 847,238 | 44,929 |
| * | Euronet Worldwide Inc. | 618,574 | 44,803 |
| | Science Applications International Corp. | 527,526 | 44,734 |
| ^,* | Zillow Group Inc. | 1,215,027 | 44,312 |
| | Fair Isaac Corp. | 367,090 | 43,764 |
| * | IPG Photonics Corp. | 442,989 | 43,727 |
| | Cypress Semiconductor Corp. | 3,773,500 | 43,169 |
| * | Guidewire Software Inc. | 870,663 | 42,950 |
| | MAXIMUS Inc. | 766,708 | 42,775 |
| * | Cirrus Logic Inc. | 755,569 | 42,720 |
| | SYNNEX Corp. | 344,236 | 41,659 |
| | DST Systems Inc. | 378,622 | 40,569 |
| * | ViaSat Inc. | 609,899 | 40,387 |
| | Littelfuse Inc. | 265,394 | 40,279 |
| * | Ciena Corp. | 1,643,025 | 40,106 |
| * | Coherent Inc. | 291,541 | 40,053 |
| * | Genpact Ltd. | 1,637,242 | 39,850 |
| * | Finisar Corp. | 1,304,899 | 39,499 |
| | National Instruments Corp. | 1,268,188 | 39,086 |
| * | CoreLogic Inc. | 1,037,127 | 38,197 |
| * | GrubHub Inc. | 1,014,047 | 38,148 |
| * | Integrated Device Technology Inc. | 1,593,164 | 37,535 |
| | MKS Instruments Inc. | 626,283 | 37,201 |
| | InterDigital Inc. | 404,032 | 36,908 |
| | Belden Inc. | 492,884 | 36,853 |
| | Intersil Corp. Class A | 1,623,252 | 36,199 |
| * | Versum Materials Inc. | 1,288,191 | 36,160 |
| | Monolithic Power Systems Inc. | 440,354 | 36,078 |
| | Blackbaud Inc. | 560,320 | 35,860 |
| * | CACI International Inc. Class A | 287,336 | 35,716 |
| * | Proofpoint Inc. | 503,498 | 35,572 |
| * | Pandora Media Inc. | 2,712,126 | 35,366 |
| * | Tech Data Corp. | 417,278 | 35,335 |
38
| | | |
| Vanguard® Extended Market Index Fund | | |
| Schedule of Investments | | |
| December 31, 2016 | | |
| |
| | | | Market |
| | | | Value |
| | | Shares | ($000) |
| * | EPAM Systems Inc. | 535,700 | 34,451 |
| * | NetScout Systems Inc. | 1,082,622 | 34,103 |
| * | Ellie Mae Inc. | 398,260 | 33,326 |
| * | First Data Corp. Class A | 2,307,052 | 32,737 |
| * | Silicon Laboratories Inc. | 490,954 | 31,912 |
| * | Sanmina Corp. | 867,484 | 31,793 |
| * | Cree Inc. | 1,180,132 | 31,144 |
| | Dolby Laboratories Inc. Class A | 676,127 | 30,554 |
| * | Entegris Inc. | 1,672,558 | 29,939 |
| * | Universal Display Corp. | 530,012 | 29,840 |
| * | TiVo Corp. | 1,425,458 | 29,792 |
| | LogMeIn Inc. | 302,565 | 29,213 |
| * | Cardtronics plc Class A | 534,592 | 29,173 |
| * | Tableau Software Inc. Class A | 683,624 | 28,815 |
| * | EchoStar Corp. Class A | 554,388 | 28,490 |
| | Convergys Corp. | 1,142,392 | 28,057 |
| * | Yelp Inc. Class A | 718,187 | 27,384 |
| * | Anixter International Inc. | 334,704 | 27,128 |
| * | Verint Systems Inc. | 754,288 | 26,589 |
| * | CommVault Systems Inc. | 499,171 | 25,657 |
| | Vishay Intertechnology Inc. | 1,573,008 | 25,483 |
| * | Advanced Energy Industries Inc. | 463,588 | 25,381 |
| * | Tessera Holding Corp. | 573,212 | 25,336 |
| * | ACI Worldwide Inc. | 1,392,473 | 25,273 |
| * | Cornerstone OnDemand Inc. | 594,640 | 25,159 |
| * | Lumentum Holdings Inc. | 648,860 | 25,078 |
| * | Itron Inc. | 395,677 | 24,868 |
| * | Blackhawk Network Holdings Inc. | 658,402 | 24,805 |
| * | Semtech Corp. | 772,292 | 24,366 |
| * | Electronics For Imaging Inc. | 554,384 | 24,315 |
| * | Acxiom Corp. | 903,275 | 24,208 |
| * | Zynga Inc. Class A | 9,254,288 | 23,784 |
| | Power Integrations Inc. | 349,825 | 23,736 |
| * | VeriFone Systems Inc. | 1,314,811 | 23,312 |
| * | Synaptics Inc. | 417,253 | 22,356 |
| * | Viavi Solutions Inc. | 2,726,227 | 22,301 |
| | Diebold Nixdorf Inc. | 883,938 | 22,231 |
| * | MicroStrategy Inc. Class A | 111,890 | 22,087 |
| ^,* | WebMD Health Corp. | 441,125 | 21,867 |
| * | Plexus Corp. | 404,619 | 21,866 |
| * | Paycom Software Inc. | 478,023 | 21,745 |
| ^,* | Stamps.com Inc. | 188,117 | 21,568 |
| * | FireEye Inc. | 1,803,892 | 21,466 |
| * | NeuStar Inc. Class A | 642,164 | 21,448 |
| * | NETGEAR Inc. | 394,545 | 21,444 |
| | Plantronics Inc. | 391,298 | 21,427 |
| * | Zillow Group Inc. Class A | 570,829 | 20,807 |
| * | GoDaddy Inc. Class A | 589,833 | 20,615 |
| | Travelport Worldwide Ltd. | 1,456,771 | 20,540 |
| * | ExlService Holdings Inc. | 398,880 | 20,119 |
| * | Inphi Corp. | 444,733 | 19,844 |
| * | II-VI Inc. | 646,053 | 19,155 |
| * | Synchronoss Technologies Inc. | 498,868 | 19,107 |
| * | RealPage Inc. | 634,408 | 19,032 |
| * | Zendesk Inc. | 878,078 | 18,615 |
| | CSG Systems International Inc. | 384,419 | 18,606 |
| | Cabot Microelectronics Corp. | 290,351 | 18,341 |
| * | Benchmark Electronics Inc. | 600,525 | 18,316 |
| | Progress Software Corp. | 570,929 | 18,230 |
| | Methode Electronics Inc. | 436,501 | 18,049 |
| * | Rambus Inc. | 1,309,646 | 18,034 |
| * | Envestnet Inc. | 507,529 | 17,890 |
| | NIC Inc. | 744,238 | 17,787 |
| * | Fabrinet | 434,363 | 17,505 |
39
| | | |
| Vanguard® Extended Market Index Fund | | |
| Schedule of Investments | | |
| December 31, 2016 | | |
| |
| | | | Market |
| | | | Value |
| | | Shares | ($000) |
| * | Knowles Corp. | 1,047,437 | 17,503 |
| ^,* | Ubiquiti Networks Inc. | 301,589 | 17,432 |
| * | HubSpot Inc. | 362,228 | 17,025 |
| * | Insight Enterprises Inc. | 418,887 | 16,940 |
| ^,* | 3D Systems Corp. | 1,261,766 | 16,769 |
| * | comScore Inc. | 530,971 | 16,768 |
| * | Gigamon Inc. | 363,796 | 16,571 |
| * | Rogers Corp. | 213,157 | 16,373 |
| * | OSI Systems Inc. | 213,222 | 16,230 |
| * | Amkor Technology Inc. | 1,501,486 | 15,841 |
| | Pegasystems Inc. | 432,330 | 15,564 |
| * | 8x8 Inc. | 1,066,192 | 15,247 |
| ^ | Ebix Inc. | 260,544 | 14,864 |
| * | 2U Inc. | 490,567 | 14,791 |
| * | RingCentral Inc. Class A | 706,238 | 14,548 |
| * | BroadSoft Inc. | 351,392 | 14,495 |
| * | Infinera Corp. | 1,700,368 | 14,436 |
| * | SPS Commerce Inc. | 203,858 | 14,248 |
| * | Veeco Instruments Inc. | 488,212 | 14,231 |
| | Brooks Automation Inc. | 826,564 | 14,109 |
| * | Sykes Enterprises Inc. | 479,339 | 13,834 |
| * | MACOM Technology Solutions Holdings Inc. | 297,916 | 13,788 |
| * | TTM Technologies Inc. | 1,002,769 | 13,668 |
| * | Kulicke & Soffa Industries Inc. | 854,233 | 13,625 |
| * | Oclaro Inc. | 1,488,857 | 13,325 |
| * | InvenSense Inc. | 1,033,760 | 13,222 |
| * | Imperva Inc. | 341,950 | 13,131 |
| * | MaxLinear Inc. | 601,509 | 13,113 |
| | EVERTEC Inc. | 737,624 | 13,093 |
| | ADTRAN Inc. | 581,025 | 12,986 |
| | Badger Meter Inc. | 350,674 | 12,957 |
| * | Web.com Group Inc. | 604,866 | 12,793 |
| | ManTech International Corp. Class A | 298,317 | 12,604 |
| * | Callidus Software Inc. | 746,985 | 12,549 |
| * | Super Micro Computer Inc. | 444,835 | 12,478 |
| * | ScanSource Inc. | 303,537 | 12,248 |
| * | Ixia | 754,380 | 12,146 |
| ^,* | Fitbit Inc. Class A | 1,656,366 | 12,125 |
| * | Diodes Inc. | 468,231 | 12,019 |
| | MTS Systems Corp. | 195,532 | 11,087 |
| * | Bottomline Technologies de Inc. | 443,006 | 11,084 |
| ^,* | Pure Storage Inc. Class A | 977,277 | 11,053 |
| * | Shutterstock Inc. | 229,423 | 10,902 |
| * | Qualys Inc. | 343,520 | 10,872 |
| * | Black Knight Financial Services Inc. Class A | 285,896 | 10,807 |
| * | Lattice Semiconductor Corp. | 1,450,133 | 10,673 |
| * | New Relic Inc. | 375,403 | 10,605 |
| * | Cray Inc. | 485,513 | 10,050 |
| ^,* | Acacia Communications Inc. | 159,761 | 9,865 |
| | Monotype Imaging Holdings Inc. | 495,233 | 9,830 |
| | CTS Corp. | 420,326 | 9,415 |
| * | FormFactor Inc. | 832,403 | 9,323 |
| * | Q2 Holdings Inc. | 322,641 | 9,308 |
| * | Rudolph Technologies Inc. | 392,735 | 9,170 |
| * | Photronics Inc. | 810,926 | 9,163 |
| * | ePlus Inc. | 79,439 | 9,151 |
| * | Box Inc. | 646,958 | 8,967 |
| ^,* | Match Group Inc. | 518,621 | 8,868 |
| ^,* | Unisys Corp. | 588,870 | 8,804 |
| * | CEVA Inc. | 261,242 | 8,765 |
| * | Quotient Technology Inc. | 808,399 | 8,690 |
| * | GTT Communications Inc. | 302,223 | 8,689 |
| * | Paylocity Holding Corp. | 288,301 | 8,652 |
| * | Applied Micro Circuits Corp. | 1,041,059 | 8,589 |
40
| | | |
| Vanguard® Extended Market Index Fund | | |
| Schedule of Investments | | |
| December 31, 2016 | | |
| |
| | | | Market |
| | | | Value |
| | | Shares | ($000) |
| * | Virtusa Corp. | 328,897 | 8,262 |
| | Cass Information Systems Inc. | 111,747 | 8,221 |
| * | Novanta Inc. | 391,359 | 8,219 |
| * | TrueCar Inc. | 637,108 | 7,964 |
| * | Nanometrics Inc. | 300,610 | 7,533 |
| * | Perficient Inc. | 429,038 | 7,504 |
| * | Eastman Kodak Co. | 471,332 | 7,306 |
| * | Barracuda Networks Inc. | 339,699 | 7,280 |
| | EarthLink Holdings Corp. | 1,282,583 | 7,234 |
| * | Endurance International Group Holdings Inc. | 771,863 | 7,178 |
| * | PDF Solutions Inc. | 318,282 | 7,177 |
| * | FARO Technologies Inc. | 197,884 | 7,124 |
| | AVX Corp. | 453,691 | 7,091 |
| * | Blucora Inc. | 460,222 | 6,788 |
| * | Ultratech Inc. | 281,857 | 6,759 |
| | TeleTech Holdings Inc. | 220,598 | 6,728 |
| * | PROS Holdings Inc. | 311,081 | 6,694 |
| | Syntel Inc. | 337,801 | 6,685 |
| * | Intralinks Holdings Inc. | 488,580 | 6,606 |
| * | Extreme Networks Inc. | 1,294,368 | 6,511 |
| * | Five9 Inc. | 458,218 | 6,502 |
| * | Actua Corp. | 461,715 | 6,464 |
| * | XO Group Inc. | 322,961 | 6,282 |
| * | Silver Spring Networks Inc. | 471,454 | 6,275 |
| ^,* | Twilio Inc. Class A | 216,920 | 6,258 |
| * | CalAmp Corp. | 429,402 | 6,226 |
| * | Kimball Electronics Inc. | 341,156 | 6,209 |
| * | Bankrate Inc. | 560,852 | 6,197 |
| ^,* | Gogo Inc. | 671,381 | 6,190 |
| * | ShoreTel Inc. | 827,557 | 5,917 |
| * | Nimble Storage Inc. | 691,635 | 5,478 |
| * | Exar Corp. | 500,937 | 5,400 |
| | Forrester Research Inc. | 125,578 | 5,394 |
| | Hackett Group Inc. | 303,518 | 5,360 |
| | Daktronics Inc. | 495,429 | 5,301 |
| * | Varonis Systems Inc. | 194,126 | 5,203 |
| * | Axcelis Technologies Inc. | 354,177 | 5,153 |
| * | Xcerra Corp. | 674,250 | 5,151 |
| | Mesa Laboratories Inc. | 41,675 | 5,116 |
| * | Benefitfocus Inc. | 170,417 | 5,061 |
| * | VASCO Data Security International Inc. | 363,725 | 4,965 |
| | Park Electrochemical Corp. | 263,821 | 4,920 |
| * | LivePerson Inc. | 634,686 | 4,792 |
| * | Harmonic Inc. | 943,710 | 4,719 |
| * | Alpha & Omega Semiconductor Ltd. | 220,890 | 4,698 |
| ^,* | Nutanix Inc. | 174,496 | 4,635 |
| * | CommerceHub Inc. | 307,150 | 4,616 |
| * | A10 Networks Inc. | 549,537 | 4,567 |
| ^,* | SunPower Corp. Class A | 689,647 | 4,559 |
| * | ServiceSource International Inc. | 802,282 | 4,557 |
| | Cohu Inc. | 326,718 | 4,541 |
| * | Bazaarvoice Inc. | 935,369 | 4,537 |
| * | ChannelAdvisor Corp. | 312,108 | 4,479 |
| * | Applied Optoelectronics Inc. | 189,034 | 4,431 |
| | IXYS Corp. | 371,056 | 4,416 |
| | NVE Corp. | 61,051 | 4,361 |
| * | DSP Group Inc. | 333,651 | 4,354 |
| ^,* | SolarEdge Technologies Inc. | 350,439 | 4,345 |
| * | Digi International Inc. | 315,963 | 4,344 |
| * | Calix Inc. | 548,844 | 4,226 |
| * | Alarm.com Holdings Inc. | 150,987 | 4,202 |
| * | RetailMeNot Inc. | 445,322 | 4,141 |
| ^,* | Hortonworks Inc. | 497,642 | 4,135 |
| * | PC Connection Inc. | 147,027 | 4,130 |
41
| | | |
| Vanguard® Extended Market Index Fund | | |
| Schedule of Investments | | |
| December 31, 2016 | | |
| |
| | | | Market |
| | | | Value |
| | | Shares | ($000) |
| ^,* | MINDBODY Inc. Class A | 192,352 | 4,097 |
| * | MoneyGram International Inc. | 343,332 | 4,055 |
| * | Blackline Inc. | 144,144 | 3,983 |
| * | NeoPhotonics Corp. | 368,329 | 3,982 |
| * | Lionbridge Technologies Inc. | 680,435 | 3,947 |
| ^,* | Digimarc Corp. | 131,180 | 3,935 |
| * | Ultra Clean Holdings Inc. | 400,775 | 3,887 |
| * | DHI Group Inc. | 619,150 | 3,870 |
| * | Sonus Networks Inc. | 604,551 | 3,809 |
| * | Immersion Corp. | 356,353 | 3,788 |
| | Bel Fuse Inc. Class B | 116,234 | 3,592 |
| ^,* | Workiva Inc. | 262,468 | 3,583 |
| * | Zix Corp. | 720,079 | 3,557 |
| * | Carbonite Inc. | 216,281 | 3,547 |
| * | Impinj Inc. | 98,866 | 3,494 |
| | QAD Inc. Class A | 114,372 | 3,477 |
| * | Angie's List Inc. | 414,502 | 3,411 |
| * | Kemet Corp. | 509,556 | 3,378 |
| | American Software Inc. Class A | 324,598 | 3,353 |
| * | Brightcove Inc. | 409,730 | 3,298 |
| * | Rubicon Project Inc. | 444,175 | 3,296 |
| | Comtech Telecommunications Corp. | 270,615 | 3,207 |
| * | Coupa Software Inc. | 123,925 | 3,099 |
| * | Liquidity Services Inc. | 313,978 | 3,061 |
| * | Square Inc. | 223,462 | 3,046 |
| * | Vishay Precision Group Inc. | 161,085 | 3,044 |
| * | Clearfield Inc. | 145,302 | 3,008 |
| | Black Box Corp. | 193,667 | 2,953 |
| * | Jive Software Inc. | 677,243 | 2,946 |
| ^,* | MeetMe Inc. | 593,220 | 2,925 |
| * | Trade Desk Inc. Class A | 105,305 | 2,914 |
| * | Telenav Inc. | 393,190 | 2,772 |
| * | Datalink Corp. | 244,270 | 2,750 |
| | EMCORE Corp. | 314,270 | 2,734 |
| * | Quantum Corp. | 3,280,369 | 2,730 |
| * | Sigma Designs Inc. | 450,971 | 2,706 |
| ^,* | Glu Mobile Inc. | 1,385,198 | 2,687 |
| | Reis Inc. | 117,717 | 2,619 |
| * | Rapid7 Inc. | 203,541 | 2,477 |
| * | Electro Scientific Industries Inc. | 418,358 | 2,477 |
| * | Kopin Corp. | 836,722 | 2,376 |
| * | Intevac Inc. | 273,719 | 2,340 |
| * | Tangoe Inc. | 296,153 | 2,334 |
| * | Mitek Systems Inc. | 376,688 | 2,317 |
| * | Model N Inc. | 261,203 | 2,312 |
| * | PRGX Global Inc. | 383,498 | 2,263 |
| * | Control4 Corp. | 220,256 | 2,247 |
| * | Exa Corp. | 144,549 | 2,220 |
| * | AXT Inc. | 459,230 | 2,204 |
| * | TechTarget Inc. | 253,226 | 2,160 |
| * | Planet Payment Inc. | 528,177 | 2,155 |
| * | Xactly Corp. | 195,757 | 2,153 |
| * | KVH Industries Inc. | 182,006 | 2,148 |
| * | Maxwell Technologies Inc. | 415,379 | 2,127 |
| * | CyberOptics Corp. | 81,450 | 2,126 |
| ^,* | Appfolio Inc. | 88,603 | 2,113 |
| * | Limelight Networks Inc. | 834,843 | 2,104 |
| * | EnerNOC Inc. | 350,425 | 2,103 |
| * | PCM Inc. | 92,504 | 2,081 |
| * | Rosetta Stone Inc. | 231,778 | 2,065 |
| ^,* | USA Technologies Inc. | 476,965 | 2,051 |
| * | MobileIron Inc. | 545,917 | 2,047 |
| ^,* | Park City Group Inc. | 160,948 | 2,044 |
| * | GigPeak Inc. | 797,981 | 2,011 |
42
| | | |
| Vanguard® Extended Market Index Fund | | |
| Schedule of Investments | | |
| December 31, 2016 | | |
| |
| | | | Market |
| | | | Value |
| | | Shares | ($000) |
| * | Aerohive Networks Inc. | 345,985 | 1,972 |
| * | QuinStreet Inc. | 513,890 | 1,932 |
| * | Agilysys Inc. | 181,788 | 1,883 |
| * | Radisys Corp. | 418,114 | 1,852 |
| * | Everi Holdings Inc. | 823,658 | 1,787 |
| * | RealNetworks Inc. | 363,593 | 1,767 |
| * | Avid Technology Inc. | 401,423 | 1,766 |
| * | Guidance Software Inc. | 244,459 | 1,731 |
| ^,* | CUI Global Inc. | 233,414 | 1,618 |
| * | Amber Road Inc. | 177,044 | 1,608 |
| * | PFSweb Inc. | 186,576 | 1,586 |
| * | Care.com Inc. | 182,552 | 1,564 |
| | MOCON Inc. | 79,438 | 1,549 |
| * | Autobytel Inc. | 111,370 | 1,498 |
| * | Aware Inc. | 244,472 | 1,491 |
| * | SecureWorks Corp. Class A | 134,675 | 1,426 |
| * | Information Services Group Inc. | 369,781 | 1,346 |
| ^,* | VirnetX Holding Corp. | 607,669 | 1,337 |
| * | Instructure Inc. | 65,174 | 1,274 |
| * | iPass Inc. | 772,207 | 1,274 |
| | NCI Inc. Class A | 90,498 | 1,262 |
| * | Upland Software Inc. | 140,774 | 1,260 |
| * | Key Tronic Corp. | 153,965 | 1,204 |
| * | Seachange International Inc. | 517,835 | 1,191 |
| * | Rightside Group Ltd. | 137,578 | 1,138 |
| ^,* | Inseego Corp. | 466,035 | 1,137 |
| * | Everbridge Inc. | 61,074 | 1,127 |
| * | BSQUARE Corp. | 188,386 | 1,102 |
| * | Internap Corp. | 700,801 | 1,079 |
| * | Great Elm Capital Group Inc. | 287,407 | 1,078 |
| * | Covisint Corp. | 552,843 | 1,050 |
| * | Marchex Inc. Class B | 391,532 | 1,038 |
| * | Aviat Networks Inc. | 73,690 | 1,023 |
| * | ModusLink Global Solutions Inc. | 700,523 | 1,023 |
| * | Leaf Group Ltd. | 153,025 | 1,002 |
| * | Frequency Electronics Inc. | 90,444 | 977 |
| * | Travelzoo Inc. | 103,245 | 970 |
| | AstroNova Inc. | 66,474 | 947 |
| ^ | CPI Card Group Inc. | 227,840 | 946 |
| ^,* | QuickLogic Corp. | 670,886 | 933 |
| ^,* | Neonode Inc. | 505,357 | 930 |
| * | Numerex Corp. Class A | 124,132 | 919 |
| ^,* | SITO Mobile Ltd. | 247,859 | 915 |
| ^,* | MicroVision Inc. | 722,126 | 910 |
| | TransAct Technologies Inc. | 136,353 | 900 |
| * | GSI Technology Inc. | 144,633 | 897 |
| ^,* | Pixelworks Inc. | 313,973 | 879 |
| | PC-Tel Inc. | 162,387 | 874 |
| | Systemax Inc. | 99,248 | 870 |
| * | YuMe Inc. | 240,113 | 860 |
| * | Apptio Inc. Class A | 45,088 | 835 |
| | Computer Task Group Inc. | 196,096 | 826 |
| | TESSCO Technologies Inc. | 62,919 | 818 |
| * | Synacor Inc. | 251,583 | 780 |
| * | Support.com Inc. | 896,019 | 771 |
| * | Mattersight Corp. | 201,994 | 747 |
| * | ID Systems Inc. | 137,003 | 743 |
| | Richardson Electronics Ltd. | 115,483 | 728 |
| * | Data I/O Corp. | 169,765 | 710 |
| * | GSE Systems Inc. | 200,594 | 702 |
| * | Napco Security Technologies Inc. | 80,840 | 687 |
| * | Tremor Video Inc. | 274,013 | 682 |
| | CSP Inc. | 63,690 | 674 |
| ^,* | Rocket Fuel Inc. | 387,243 | 662 |
43
| | | |
| Vanguard® Extended Market Index Fund | | |
| Schedule of Investments | | |
| December 31, 2016 | | |
| |
| | | | Market |
| | | | Value |
| | | Shares | ($000) |
| * | Quantenna Communications Inc. | 36,452 | 661 |
| * | Amtech Systems Inc. | 151,776 | 645 |
| * | PAR Technology Corp. | 111,171 | 620 |
| * | Marin Software Inc. | 262,100 | 616 |
| * | Datawatch Corp. | 111,955 | 616 |
| * | Ciber Inc. | 965,464 | 610 |
| * | Innodata Inc. | 244,930 | 600 |
| * | CVD Equipment Corp. | 68,681 | 596 |
| * | WidePoint Corp. | 750,211 | 593 |
| ^,* | Netlist Inc. | 543,895 | 555 |
| | Evolving Systems Inc. | 134,286 | 551 |
| * | CommerceHub Inc. Class A | 34,497 | 518 |
| | LRAD Corp. | 298,088 | 510 |
| * | StarTek Inc. | 59,745 | 505 |
| | ClearOne Inc. | 42,405 | 483 |
| ^,* | Onvia Inc. | 108,561 | 483 |
| ^,* | FORM Holdings Corp. | 226,659 | 483 |
| ^,* | Airgain Inc. | 33,471 | 482 |
| * | Edgewater Technology Inc. | 62,210 | 467 |
| ^,* | ClearSign Combustion Corp. | 136,993 | 466 |
| * | Inuvo Inc. | 278,510 | 465 |
| * | Perceptron Inc. | 69,801 | 463 |
| ^,* | Sunworks Inc. | 230,690 | 461 |
| * | ALJ Regional Holdings Inc. | 102,187 | 449 |
| * | Wireless Telecom Group Inc. | 233,098 | 445 |
| ^,* | Research Frontiers Inc. | 243,678 | 443 |
| | GlobalSCAPE Inc. | 108,826 | 443 |
| | Communications Systems Inc. | 95,107 | 440 |
| * | NetSol Technologies Inc. | 82,423 | 429 |
| * | Asure Software Inc. | 49,512 | 421 |
| ^,* | Digital Turbine Inc. | 602,527 | 407 |
| ^,* | Uni-Pixel Inc. | 409,118 | 402 |
| | Concurrent Computer Corp. | 75,123 | 402 |
| * | CardConnect Corp. | 30,415 | 386 |
| | QAD Inc. Class B | 14,091 | 360 |
| ^,* | Applied DNA Sciences Inc. | 194,035 | 359 |
| * | Optical Cable Corp. | 111,356 | 356 |
| * | IEC Electronics Corp. | 98,878 | 353 |
| * | Iteris Inc. | 92,205 | 336 |
| * | Identiv Inc. | 103,547 | 329 |
| * | Imation Corp. | 377,431 | 309 |
| * | eGain Corp. | 141,680 | 298 |
| ^,* | Digital Ally Inc. | 67,869 | 285 |
| * | DASAN Zhone Solutions Inc. | 284,409 | 280 |
| * | Zedge Inc. Class B | 88,819 | 278 |
| ^,* | ParkerVision Inc. | 147,773 | 272 |
| * | LightPath Technologies Inc. Class A | 175,942 | 271 |
| * | Westell Technologies Inc. Class A | 398,465 | 259 |
| * | Lantronix Inc. | 144,183 | 245 |
| * | LGL Group Inc. | 48,029 | 241 |
| * | Luna Innovations Inc. | 153,586 | 226 |
| * | eMagin Corp. | 103,760 | 223 |
| ^,* | FalconStor Software Inc. | 492,052 | 221 |
| * | Resonant Inc. | 42,290 | 214 |
| * | Qumu Corp. | 87,661 | 209 |
| * | BroadVision Inc. | 37,841 | 176 |
| * | ARI Network Services Inc. | 31,731 | 172 |
| * | Image Sensing Systems Inc. | 44,960 | 166 |
| * | Rubicon Technology Inc. | 268,319 | 166 |
| | RELM Wireless Corp. | 33,447 | 159 |
| * | Echelon Corp. | 32,507 | 153 |
| * | TSR Inc. | 26,495 | 152 |
| * | Sonic Foundry Inc. | 29,857 | 148 |
| * | Spark Networks Inc. | 172,667 | 145 |
44
| | | |
| Vanguard® Extended Market Index Fund | | |
| Schedule of Investments | | |
| December 31, 2016 | | |
| |
| | | | Market |
| | | | Value |
| | | Shares | ($000) |
| | Bel Fuse Inc. Class A | 5,719 | 145 |
| ^,* | Intellicheck Mobilisa Inc. | 51,942 | 143 |
| * | Professional Diversity Network Inc. | 13,009 | 142 |
| * | MRV Communications Inc. | 14,587 | 119 |
| * | MaxPoint Interactive Inc. | 19,715 | 118 |
| * | MoSys Inc. | 495,337 | 114 |
| * | Intermolecular Inc. | 117,829 | 112 |
| * | Remark Media Inc. | 26,404 | 103 |
| ^,* | Net Element Inc. | 119,046 | 92 |
| * | Crossroads Systems Inc. | 20,910 | 89 |
| * | Smith Micro Software Inc. | 51,722 | 81 |
| * | Network-1 Technologies Inc. | 23,833 | 81 |
| ^,* | NXT-ID Inc. | 27,831 | 77 |
| * | Majesco Entertainment Co. | 23,440 | 76 |
| * | Infosonics Corp. | 188,332 | 73 |
| ^,* | Superconductor Technologies Inc. Class A | 51,228 | 63 |
| ^,* | Aehr Test Systems | 25,888 | 62 |
| | Wayside Technology Group Inc. | 3,272 | 61 |
| * | Document Security Systems Inc. | 89,333 | 59 |
| * | inTEST Corp. | 12,602 | 58 |
| ^,* | Helios & Matheson Analytics Inc. | 17,315 | 57 |
| * | Sysorex Global | 233,013 | 57 |
| ^,* | Everspin Technologies Inc. | 6,492 | 54 |
| ^,* | xG Technology Inc. | 36,269 | 49 |
| * | Determine Inc. | 26,243 | 49 |
| ^ | Dataram Corp. | 20,158 | 44 |
| * | Atomera Inc. | 6,425 | 43 |
| ^,* | Inventergy Global Inc. | 57,674 | 43 |
| | RF Industries Ltd. | 20,988 | 37 |
| ^,* | Bridgeline Digital Inc. | 55,335 | 35 |
| * | Prism Technologies Group Inc. | 101,239 | 30 |
| * | Sevcon Inc. | 3,344 | 29 |
| * | RMG Networks Holding Corp. | 34,785 | 24 |
| * | Schmitt Industries Inc. | 13,971 | 23 |
| ^,* | FunctionX Inc. | 9,329 | 23 |
| * | Copsync Inc. | 27,347 | 22 |
| * | Majesco | 3,574 | 22 |
| * | Finjan Holdings Inc. | 18,418 | 21 |
| * | Giga-tronics Inc. | 25,845 | 20 |
| ^,* | Technical Communications Corp. | 7,931 | 19 |
| * | ADDvantage Technologies Group Inc. | 10,200 | 18 |
| * | Xplore Technologies Corp. | 8,900 | 18 |
| ^,* | Payment Data Systems Inc. | 7,800 | 14 |
| ^,* | Voltari Corp. | 6,099 | 14 |
| * | LookSmart Group Inc. | 84,826 | 14 |
| * | SigmaTron International Inc. | 2,686 | 13 |
| | Qualstar Corp. | 3,692 | 11 |
| * | Vicon Industries Inc. | 16,602 | 10 |
| * | Nortech Systems Inc. | 2,300 | 9 |
| ^,* | Adesto Technologies Corp. | 4,696 | 9 |
| * | IntriCon Corp. | 1,104 | 8 |
| * | Monster Digital Inc. | 3,700 | 6 |
| * | Socket Mobile Inc. | 1,390 | 5 |
| * | WPCS International Inc. | 2,914 | 4 |
| * | ITUS Corp. | 301 | 2 |
| * | MAM Software Group Inc. | 200 | 1 |
| * | Cartesian Inc. | 1,281 | 1 |
| * | LGL Group Inc. Warrants Exp. 06/08/2018 | 238,900 | — |
| | | | 8,501,655 |
| Materials (5.5%) | | |
| | Celanese Corp. Class A | 1,692,049 | 133,232 |
| | Steel Dynamics Inc. | 2,888,613 | 102,777 |
| | Packaging Corp. of America | 1,108,505 | 94,023 |
| | Valspar Corp. | 866,112 | 89,738 |
45
| | | |
| Vanguard® Extended Market Index Fund | | |
| Schedule of Investments | | |
| December 31, 2016 | | |
| |
| | | | Market |
| | | | Value |
| | | Shares | ($000) |
| * | Crown Holdings Inc. | 1,649,976 | 86,739 |
| | RPM International Inc. | 1,570,745 | 84,553 |
| | Ashland Global Holdings Inc. | 739,953 | 80,869 |
| * | Berry Plastics Group Inc. | 1,438,210 | 70,084 |
| * | Axalta Coating Systems Ltd. | 2,559,244 | 69,611 |
| | Reliance Steel & Aluminum Co. | 862,011 | 68,564 |
| | United States Steel Corp. | 2,051,890 | 67,733 |
| | Sonoco Products Co. | 1,174,546 | 61,899 |
| | WR Grace & Co. | 832,010 | 56,277 |
| | Eagle Materials Inc. | 567,025 | 55,869 |
| | AptarGroup Inc. | 742,422 | 54,531 |
| | Bemis Co. Inc. | 1,114,497 | 53,295 |
| | Scotts Miracle-Gro Co. Class A | 529,148 | 50,560 |
| | Olin Corp. | 1,954,578 | 50,057 |
| | Royal Gold Inc. | 780,187 | 49,425 |
| * | Alcoa Corp. | 1,728,551 | 48,538 |
| | Chemours Co. | 2,158,516 | 47,682 |
| | NewMarket Corp. | 111,372 | 47,204 |
| | Graphic Packaging Holding Co. | 3,768,238 | 47,028 |
| | Huntsman Corp. | 2,320,773 | 44,280 |
| | Sensient Technologies Corp. | 533,366 | 41,912 |
| * | AK Steel Holding Corp. | 3,703,609 | 37,814 |
| | Cabot Corp. | 731,880 | 36,989 |
| * | Owens-Illinois Inc. | 1,922,612 | 33,473 |
| | Trinseo SA | 536,582 | 31,819 |
| * | Louisiana-Pacific Corp. | 1,680,839 | 31,818 |
| | Compass Minerals International Inc. | 404,578 | 31,699 |
| | Minerals Technologies Inc. | 409,504 | 31,634 |
| | PolyOne Corp. | 986,996 | 31,623 |
| * | Balchem Corp. | 375,628 | 31,523 |
| | Commercial Metals Co. | 1,364,598 | 29,721 |
| | Domtar Corp. | 734,565 | 28,670 |
| | HB Fuller Co. | 593,316 | 28,663 |
| * | Ingevity Corp. | 497,603 | 27,298 |
| * | Summit Materials Inc. Class A | 1,085,963 | 25,835 |
| | Westlake Chemical Corp. | 444,087 | 24,864 |
| * | Chemtura Corp. | 746,375 | 24,780 |
| | Worthington Industries Inc. | 519,970 | 24,667 |
| | Hecla Mining Co. | 4,705,695 | 24,658 |
| * | Platform Specialty Products Corp. | 2,512,597 | 24,649 |
| * | Stillwater Mining Co. | 1,440,053 | 23,199 |
| | Silgan Holdings Inc. | 449,594 | 23,010 |
| | KapStone Paper and Packaging Corp. | 1,039,974 | 22,931 |
| * | GCP Applied Technologies Inc. | 840,740 | 22,490 |
| ^,* | Cliffs Natural Resources Inc. | 2,484,395 | 20,894 |
| | Greif Inc. Class A | 402,267 | 20,640 |
| * | Headwaters Inc. | 877,054 | 20,628 |
| | Allegheny Technologies Inc. | 1,291,336 | 20,571 |
| | Quaker Chemical Corp. | 160,321 | 20,511 |
| | Carpenter Technology Corp. | 550,049 | 19,895 |
| | Innospec Inc. | 281,864 | 19,308 |
| | Stepan Co. | 231,573 | 18,869 |
| * | Coeur Mining Inc. | 2,033,414 | 18,484 |
| | Neenah Paper Inc. | 197,858 | 16,858 |
| | Kaiser Aluminum Corp. | 215,675 | 16,756 |
| | Schweitzer-Mauduit International Inc. | 365,437 | 16,638 |
| * | Ferro Corp. | 979,522 | 14,037 |
| * | Clearwater Paper Corp. | 199,891 | 13,103 |
| | PH Glatfelter Co. | 518,781 | 12,394 |
| | Innophos Holdings Inc. | 233,230 | 12,189 |
| | A Schulman Inc. | 345,153 | 11,545 |
| ^,* | US Concrete Inc. | 164,855 | 10,798 |
| | Calgon Carbon Corp. | 624,414 | 10,615 |
| * | Kraton Corp. | 367,587 | 10,469 |
46
| | | |
| Vanguard® Extended Market Index Fund | | |
| Schedule of Investments | | |
| December 31, 2016 | | |
| |
| | | | Market |
| | | | Value |
| | | Shares | ($000) |
| * | Boise Cascade Co. | 455,105 | 10,240 |
| | Materion Corp. | 256,365 | 10,152 |
| * | Koppers Holdings Inc. | 245,837 | 9,907 |
| | Deltic Timber Corp. | 124,602 | 9,603 |
| * | SunCoke Energy Inc. | 767,157 | 8,700 |
| | Schnitzer Steel Industries Inc. | 319,564 | 8,213 |
| * | AdvanSix Inc. | 362,215 | 8,019 |
| ^ | Valvoline Inc. | 370,103 | 7,957 |
| | Tronox Ltd. Class A | 766,681 | 7,904 |
| | Rayonier Advanced Materials Inc. | 505,752 | 7,819 |
| ^ | McEwen Mining Inc. | 2,657,115 | 7,732 |
| | Tredegar Corp. | 309,152 | 7,420 |
| | Chase Corp. | 85,192 | 7,118 |
| * | TimkenSteel Corp. | 455,803 | 7,056 |
| | Haynes International Inc. | 153,498 | 6,599 |
| | Hawkins Inc. | 121,816 | 6,572 |
| ^,* | Flotek Industries Inc. | 636,821 | 5,980 |
| * | Resolute Forest Products Inc. | 1,103,688 | 5,905 |
| | American Vanguard Corp. | 306,190 | 5,864 |
| | AEP Industries Inc. | 48,530 | 5,634 |
| | Mercer International Inc. | 519,833 | 5,536 |
| * | OMNOVA Solutions Inc. | 507,660 | 5,077 |
| * | Century Aluminum Co. | 586,560 | 5,021 |
| * | Forterra Inc. | 219,618 | 4,757 |
| | Myers Industries Inc. | 273,549 | 3,912 |
| | FutureFuel Corp. | 279,834 | 3,890 |
| | KMG Chemicals Inc. | 91,192 | 3,546 |
| | Kronos Worldwide Inc. | 271,357 | 3,240 |
| | Gold Resource Corp. | 691,856 | 3,010 |
| | Olympic Steel Inc. | 114,293 | 2,769 |
| * | Verso Corp. | 355,089 | 2,521 |
| ^,* | Advanced Emissions Solutions Inc. | 265,135 | 2,450 |
| * | Ryerson Holding Corp. | 183,100 | 2,444 |
| * | Trecora Resources | 160,658 | 2,225 |
| | Ampco-Pittsburgh Corp. | 128,384 | 2,150 |
| ^,* | LSB Industries Inc. | 243,206 | 2,048 |
| * | Real Industry Inc. | 327,532 | 1,998 |
| | United States Lime & Minerals Inc. | 24,945 | 1,890 |
| * | Codexis Inc. | 373,546 | 1,718 |
| * | UFP Technologies Inc. | 63,508 | 1,616 |
| * | Core Molding Technologies Inc. | 92,717 | 1,586 |
| * | Handy & Harman Ltd. | 61,647 | 1,575 |
| * | Intrepid Potash Inc. | 676,735 | 1,408 |
| ^,* | TerraVia Holdings Inc. | 1,027,649 | 1,182 |
| * | Universal Stainless & Alloy Products Inc. | 85,974 | 1,162 |
| * | Synalloy Corp. | 90,893 | 995 |
| * | AgroFresh Solutions Inc. | 342,398 | 907 |
| ^,* | BioAmber Inc. | 139,525 | 767 |
| * | Rentech Inc. | 298,160 | 739 |
| ^,* | Pershing Gold Corp. | 190,450 | 623 |
| | Tecnoglass Inc. | 47,534 | 582 |
| ^,* | Senomyx Inc. | 582,216 | 559 |
| ^,* | Golden Minerals Co. | 598,462 | 347 |
| ^,* | Marrone Bio Innovations Inc. | 142,138 | 304 |
| * | TOR Minerals International Inc. | 42,930 | 260 |
| * | Solitario Exploration & Royalty Corp. | 381,460 | 243 |
| * | General Moly Inc. | 828,766 | 207 |
| * | Paramount Gold Nevada Corp. | 79,697 | 142 |
| ^,* | Comstock Mining Inc. | 392,455 | 103 |
| * | US Antimony Corp. | 181,971 | 46 |
| * | Northern Technologies International Corp. | 700 | 10 |
| | Friedman Industries Inc. | 763 | 5 |
| * | Metabolix Inc. | 8,216 | 3 |
| | | | 2,865,476 |
47
| | | |
| Vanguard® Extended Market Index Fund | | |
| Schedule of Investments | | |
| December 31, 2016 | | |
| |
| | | | Market |
| | | | Value |
| | | Shares | ($000) |
| Other (0.0%)2 | | |
| * | Dyax Corp CVR Exp. 12/31/2019 | 1,549,121 | 1,720 |
| * | Leap Wireless International Inc. CVR | 524,960 | 1,323 |
| * | Tobira Therapeutics Inc. CV Rights | 87,896 | 1,208 |
| * | Camco Financial Corp. Warrants Exp. 11/06/2017 | 45,300 | 366 |
| * | Adolor Corp. Rights Exp. 07/01/2019 | 596,841 | 310 |
| * | Chelsea Therapeutics International Ltd. CVR Exp. 12/31/2016 | 912,063 | 100 |
| * | Ambit Biosciences Corp. CVR Rights | 22,388 | 13 |
| * | Alexza Pharmaceuticals Inc. CVR | 128,704 | 5 |
| * | Dara Biosciences Inc. CVR Exp. 12/31/2018 | 15,573 | 1 |
| * | Bagger Dave's Burger Tavern Inc. | 10,100 | 1 |
| * | Seventy Seven Energy Inc. Escrow Line | 3,457 | — |
| * | Clinical Data Contingent Value Rights | 131,308 | — |
| * | Gerber Scientific Inc. CVR | 161,151 | — |
| * | Cubist Pharmaceuticals, Inc. CVR | 178,549 | — |
| * | ClearSign Combustion Corp. Rights Exp. 01/13/2017 | 121,247 | — |
| ^,* | Biosante Pharmaceutical Inc. CVR | 44,795 | — |
| * | CIL&D LLC | 36,800 | — |
| * | American Medical Alert Corp. | 17,992 | — |
| * | Seventy Seven Energy Inc. Warrants Exp. 08/01/2023 | 172 | — |
| * | Seventy Seven Energy Inc. Warrants Exp. 08/01/2021 | 192 | — |
| | | | 5,047 |
| Real Estate (9.3%) | | |
| | Duke Realty Corp. | 4,192,466 | 111,352 |
| | Alexandria Real Estate Equities Inc. | 939,415 | 104,397 |
| | VEREIT Inc. | 11,571,147 | 97,892 |
| | Camden Property Trust | 1,040,645 | 87,487 |
| | Regency Centers Corp. | 1,229,082 | 84,745 |
| | Kilroy Realty Corp. | 1,090,223 | 79,826 |
| | American Campus Communities Inc. | 1,565,817 | 77,931 |
| | National Retail Properties Inc. | 1,741,822 | 76,989 |
| | Brixmor Property Group Inc. | 3,103,063 | 75,777 |
| | WP Carey Inc. | 1,262,967 | 74,629 |
| | Omega Healthcare Investors Inc. | 2,308,220 | 72,155 |
| | Equity LifeStyle Properties Inc. | 961,867 | 69,351 |
| | Liberty Property Trust | 1,736,629 | 68,597 |
| | Gaming and Leisure Properties Inc. | 2,209,917 | 67,668 |
| | Lamar Advertising Co. Class A | 975,194 | 65,572 |
| | Douglas Emmett Inc. | 1,706,546 | 62,391 |
| | Spirit Realty Capital Inc. | 5,741,446 | 62,352 |
| | Sun Communities Inc. | 798,725 | 61,190 |
| | Hospitality Properties Trust | 1,912,570 | 60,705 |
| | Highwoods Properties Inc. | 1,176,018 | 59,989 |
| | CubeSmart | 2,131,041 | 57,048 |
| | DDR Corp. | 3,596,678 | 54,921 |
| | Forest City Realty Trust Inc. Class A | 2,606,208 | 54,313 |
| | EPR Properties | 752,758 | 54,025 |
| | Jones Lang LaSalle Inc. | 531,997 | 53,753 |
| | American Homes 4 Rent Class A | 2,556,263 | 53,630 |
| | Senior Housing Properties Trust | 2,823,031 | 53,440 |
| | Taubman Centers Inc. | 715,807 | 52,920 |
| | DCT Industrial Trust Inc. | 1,063,939 | 50,941 |
| | Hudson Pacific Properties Inc. | 1,432,603 | 49,826 |
| | Weingarten Realty Investors | 1,379,814 | 49,384 |
| | Healthcare Trust of America Inc. Class A | 1,688,347 | 49,148 |
| * | Howard Hughes Corp. | 423,975 | 48,376 |
| | Life Storage Inc. | 551,779 | 47,045 |
| | Medical Properties Trust Inc. | 3,759,685 | 46,244 |
| | STORE Capital Corp. | 1,863,410 | 46,045 |
| | Gramercy Property Trust | 4,972,518 | 45,648 |
| * | Equity Commonwealth | 1,490,126 | 45,061 |
| | Realogy Holdings Corp. | 1,687,205 | 43,412 |
| | Retail Properties of America Inc. | 2,796,936 | 42,877 |
| | Communications Sales & Leasing Inc. | 1,665,251 | 42,314 |
48
| | |
| Vanguard® Extended Market Index Fund | | |
| Schedule of Investments | | |
| December 31, 2016 | | |
| |
| | | Market |
| | | Value |
| | Shares | ($000) |
| Healthcare Realty Trust Inc. | 1,377,314 | 41,760 |
| Outfront Media Inc. | 1,638,261 | 40,744 |
| LaSalle Hotel Properties | 1,328,011 | 40,464 |
| Tanger Factory Outlet Centers Inc. | 1,130,395 | 40,446 |
| Rayonier Inc. | 1,479,832 | 39,364 |
| CyrusOne Inc. | 879,994 | 39,362 |
| DuPont Fabros Technology Inc. | 893,081 | 39,233 |
| Sunstone Hotel Investors Inc. | 2,535,648 | 38,669 |
| First Industrial Realty Trust Inc. | 1,362,862 | 38,228 |
| Ryman Hospitality Properties Inc. | 602,915 | 37,990 |
| Apple Hospitality REIT Inc. | 1,856,103 | 37,085 |
| Piedmont Office Realty Trust Inc. Class A | 1,765,446 | 36,915 |
| Education Realty Trust Inc. | 869,356 | 36,774 |
| RLJ Lodging Trust | 1,450,063 | 35,512 |
| National Health Investors Inc. | 473,456 | 35,116 |
| Brandywine Realty Trust | 2,086,499 | 34,448 |
| Corporate Office Properties Trust | 1,101,954 | 34,403 |
| Cousins Properties Inc. | 4,027,408 | 34,273 |
| * CoreCivic Inc. | 1,399,100 | 34,222 |
| Equity One Inc. | 1,101,667 | 33,810 |
| Paramount Group Inc. | 2,077,821 | 33,224 |
| NorthStar Realty Finance Corp. | 2,147,534 | 32,535 |
| Columbia Property Trust Inc. | 1,488,824 | 32,159 |
| GEO Group Inc. | 889,787 | 31,970 |
| CoreSite Realty Corp. | 400,064 | 31,753 |
| Acadia Realty Trust | 962,308 | 31,448 |
| Mack-Cali Realty Corp. | 1,064,620 | 30,895 |
| Physicians Realty Trust | 1,611,258 | 30,549 |
| Urban Edge Properties | 1,082,827 | 29,789 |
| Empire State Realty Trust Inc. | 1,465,686 | 29,592 |
| Washington REIT | 871,541 | 28,491 |
| EastGroup Properties Inc. | 379,481 | 28,021 |
| QTS Realty Trust Inc. Class A | 562,863 | 27,946 |
| PS Business Parks Inc. | 236,146 | 27,516 |
| Lexington Realty Trust | 2,511,107 | 27,120 |
| DiamondRock Hospitality Co. | 2,340,508 | 26,986 |
| Retail Opportunity Investments Corp. | 1,276,357 | 26,969 |
| Care Capital Properties Inc. | 1,005,172 | 25,129 |
| Pebblebrook Hotel Trust | 843,089 | 25,082 |
| Alexander & Baldwin Inc. | 543,637 | 24,393 |
| Xenia Hotels & Resorts Inc. | 1,256,011 | 24,392 |
| CBL & Associates Properties Inc. | 2,016,360 | 23,188 |
| Kite Realty Group Trust | 984,176 | 23,108 |
| LTC Properties Inc. | 483,657 | 22,722 |
| Washington Prime Group Inc. | 2,157,958 | 22,464 |
| Kennedy-Wilson Holdings Inc. | 1,089,911 | 22,343 |
| Monogram Residential Trust Inc. | 2,012,558 | 21,776 |
| STAG Industrial Inc. | 879,191 | 20,986 |
| American Assets Trust Inc. | 482,133 | 20,770 |
| New York REIT Inc. | 1,980,221 | 20,040 |
| Potlatch Corp. | 478,660 | 19,936 |
| Select Income REIT | 768,782 | 19,373 |
| Sabra Health Care REIT Inc. | 772,074 | 18,854 |
| Rexford Industrial Realty Inc. | 791,637 | 18,358 |
| Chesapeake Lodging Trust | 696,713 | 18,017 |
| Alexander's Inc. | 42,083 | 17,964 |
| * Quality Care Properties Inc. | 1,116,069 | 17,299 |
| * St. Joe Co. | 897,508 | 17,053 |
| Colony Starwood Homes | 591,542 | 17,042 |
| Franklin Street Properties Corp. | 1,291,629 | 16,740 |
| Summit Hotel Properties Inc. | 1,020,853 | 16,364 |
| Global Net Lease Inc. | 2,047,250 | 16,030 |
| Terreno Realty Corp. | 562,429 | 16,024 |
| Government Properties Income Trust | 838,279 | 15,982 |
49
| | |
| Vanguard® Extended Market Index Fund | | |
| Schedule of Investments | | |
| December 31, 2016 | | |
| |
| | | Market |
| | | Value |
| | Shares | ($000) |
| Ramco-Gershenson Properties Trust | 954,916 | 15,833 |
| Pennsylvania REIT | 818,970 | 15,528 |
| Four Corners Property Trust Inc. | 740,301 | 15,191 |
| Agree Realty Corp. | 324,897 | 14,961 |
| Monmouth Real Estate Investment Corp. | 857,871 | 13,074 |
| HFF Inc. Class A | 410,169 | 12,408 |
| FelCor Lodging Trust Inc. | 1,509,258 | 12,089 |
| RE/MAX Holdings Inc. Class A | 207,410 | 11,615 |
| * Parkway Inc. | 509,090 | 11,327 |
| CareTrust REIT Inc. | 738,983 | 11,321 |
| ^ Investors Real Estate Trust | 1,514,428 | 10,798 |
| * iStar Inc. | 848,944 | 10,501 |
| Universal Health Realty Income Trust | 159,879 | 10,486 |
| Hersha Hospitality Trust Class A | 480,542 | 10,332 |
| National Storage Affiliates Trust | 462,627 | 10,210 |
| Tier REIT Inc. | 580,995 | 10,103 |
| Saul Centers Inc. | 148,572 | 9,896 |
| New Senior Investment Group Inc. | 964,931 | 9,447 |
| Chatham Lodging Trust | 455,289 | 9,356 |
| NorthStar Realty Europe Corp. | 723,554 | 9,095 |
| Getty Realty Corp. | 351,269 | 8,954 |
| InfraREIT Inc. | 450,187 | 8,063 |
| First Potomac Realty Trust | 730,316 | 8,012 |
| Silver Bay Realty Trust Corp. | 448,387 | 7,685 |
| Ashford Hospitality Trust Inc. | 936,151 | 7,265 |
| ^ Seritage Growth Properties Class A | 164,341 | 7,019 |
| Urstadt Biddle Properties Inc. Class A | 283,514 | 6,836 |
| Easterly Government Properties Inc. | 329,542 | 6,597 |
| Cedar Realty Trust Inc. | 995,917 | 6,503 |
| Independence Realty Trust Inc. | 701,754 | 6,260 |
| Armada Hoffler Properties Inc. | 411,009 | 5,988 |
| CatchMark Timber Trust Inc. Class A | 507,745 | 5,717 |
| Gladstone Commercial Corp. | 271,011 | 5,447 |
| * Tejon Ranch Co. | 206,337 | 5,247 |
| Preferred Apartment Communities Inc. Class A | 343,267 | 5,118 |
| Whitestone REIT | 346,422 | 4,982 |
| One Liberty Properties Inc. | 197,772 | 4,968 |
| CorEnergy Infrastructure Trust Inc. | 138,359 | 4,826 |
| UMH Properties Inc. | 320,132 | 4,818 |
| NexPoint Residential Trust Inc. | 211,554 | 4,726 |
| * Marcus & Millichap Inc. | 175,882 | 4,700 |
| Ashford Hospitality Prime Inc. | 330,961 | 4,518 |
| Community Healthcare Trust Inc. | 172,944 | 3,983 |
| * Forestar Group Inc. | 295,642 | 3,932 |
| * Altisource Portfolio Solutions SA | 142,430 | 3,787 |
| City Office REIT Inc. | 273,868 | 3,607 |
| Consolidated-Tomoka Land Co. | 66,109 | 3,532 |
| RMR Group Inc. Class A | 88,992 | 3,515 |
| Bluerock Residential Growth REIT Inc. Class A | 241,196 | 3,309 |
| RAIT Financial Trust | 967,132 | 3,250 |
| * AV Homes Inc. | 152,570 | 2,411 |
| * Stratus Properties Inc. | 73,059 | 2,393 |
| * MedEquities Realty Trust Inc. | 213,713 | 2,372 |
| ^ Farmland Partners Inc. | 183,046 | 2,043 |
| * FRP Holdings Inc. | 50,670 | 1,910 |
| American Farmland Co. | 229,471 | 1,829 |
| Jernigan Capital Inc. | 80,946 | 1,704 |
| Wheeler REIT Inc. | 916,204 | 1,558 |
| * Trinity Place Holdings Inc. | 119,705 | 1,110 |
| Sotherly Hotels Inc. | 121,487 | 825 |
| * Maui Land & Pineapple Co. Inc. | 105,022 | 761 |
| Urstadt Biddle Properties Inc. | 38,700 | 759 |
| Gladstone Land Corp. | 59,192 | 665 |
| * BRT Realty Trust | 44,049 | 361 |
50
| | | |
| Vanguard® Extended Market Index Fund | | |
| Schedule of Investments | | |
| December 31, 2016 | | |
| |
| | | | Market |
| | | | Value |
| | | Shares | ($000) |
| | Griffin Industrial Realty Inc. | 5,462 | 173 |
| * | InterGroup Corp. | 6,400 | 173 |
| | Condor Hospitality Trust Inc. | 32,365 | 65 |
| * | Gyrodyne LLC | 3,245 | 59 |
| | Global Self Storage Inc. | 4,745 | 23 |
| * | Forest City Realty Trust Inc. Class B | 200 | 5 |
| * | Transcontinental Realty Investors Inc. | 400 | 5 |
| * | CKX Lands Inc. | 399 | 4 |
| * | Power REIT | 200 | 1 |
| | | | 4,776,520 |
| Telecommunication Services (1.3%) | | |
| * | T-Mobile US Inc. | 3,417,052 | 196,515 |
| * | SBA Communications Corp. Class A | 1,473,028 | 152,105 |
| * | Sprint Corp. | 7,561,808 | 63,670 |
| * | Zayo Group Holdings Inc. | 1,146,865 | 37,686 |
| | Telephone & Data Systems Inc. | 1,087,344 | 31,392 |
| | Cogent Communications Holdings Inc. | 483,930 | 20,011 |
| | Consolidated Communications Holdings Inc. | 595,943 | 16,001 |
| * | Vonage Holdings Corp. | 2,303,060 | 15,776 |
| | Shenandoah Telecommunications Co. | 542,890 | 14,821 |
| | Cincinnati Bell Inc. | 504,992 | 11,287 |
| | ATN International Inc. | 137,674 | 11,032 |
| | Inteliquent Inc. | 412,154 | 9,447 |
| * | Iridium Communications Inc. | 946,309 | 9,085 |
| | Windstream Holdings Inc. | 1,133,436 | 8,308 |
| * | United States Cellular Corp. | 172,834 | 7,556 |
| * | General Communication Inc. Class A | 372,819 | 7,251 |
| * | ORBCOMM Inc. | 761,456 | 6,297 |
| ^,* | Globalstar Inc. | 3,852,334 | 6,087 |
| * | Boingo Wireless Inc. | 449,141 | 5,475 |
| | Spok Holdings Inc. | 261,939 | 5,435 |
| * | FairPoint Communications Inc. | 265,205 | 4,959 |
| * | Lumos Networks Corp. | 277,481 | 4,334 |
| | IDT Corp. Class B | 219,486 | 4,069 |
| ^,* | Straight Path Communications Inc. Class B | 100,938 | 3,423 |
| ^,* | pdvWireless Inc. | 127,875 | 2,884 |
| * | Hawaiian Telcom Holdco Inc. | 109,993 | 2,726 |
| * | NII Holdings Inc. | 1,205,169 | 2,591 |
| * | Alaska Communications Systems Group Inc. | 653,207 | 1,071 |
| * | Ooma Inc. | 65,820 | 592 |
| * | Pareteum Corp. | 687,554 | 82 |
| ^,* | One Horizon Group Inc. | 84,018 | 25 |
| * | Fusion Telecommunications International Inc. | 2,852 | 4 |
| | | | 661,997 |
| Utilities (3.1%) | | |
| | UGI Corp. | 2,062,072 | 95,020 |
| | Westar Energy Inc. Class A | 1,673,225 | 94,286 |
| | Atmos Energy Corp. | 1,230,623 | 91,251 |
| | OGE Energy Corp. | 2,351,986 | 78,674 |
| | Great Plains Energy Inc. | 2,512,219 | 68,709 |
| | MDU Resources Group Inc. | 2,285,140 | 65,743 |
| | Aqua America Inc. | 2,051,060 | 61,614 |
| | National Fuel Gas Co. | 1,004,427 | 56,891 |
| | Vectren Corp. | 981,215 | 51,170 |
| | IDACORP Inc. | 608,404 | 49,007 |
| * | Calpine Corp. | 4,246,050 | 48,532 |
| | WGL Holdings Inc. | 602,735 | 45,977 |
| | Portland General Electric Co. | 1,059,336 | 45,901 |
| | Southwest Gas Corp. | 555,393 | 42,554 |
| | Hawaiian Electric Industries Inc. | 1,284,716 | 42,486 |
| | ONE Gas Inc. | 628,516 | 40,200 |
| | Black Hills Corp. | 637,544 | 39,107 |
| | ALLETE Inc. | 584,170 | 37,498 |
| | New Jersey Resources Corp. | 1,015,175 | 36,039 |
51
| | | | | |
| Vanguard® Extended Market Index Fund | | | | |
| Schedule of Investments | | | | |
| December 31, 2016 | | | | |
| |
| | | | | | Market |
| | | | | | Value |
| | | | | Shares | ($000) |
| | Spire Inc. | | | 547,664 | 35,352 |
| | PNM Resources Inc. | | | 942,941 | 32,343 |
| | NorthWestern Corp. | | | 566,511 | 32,217 |
| | South Jersey Industries Inc. | | | 931,756 | 31,391 |
| | Avista Corp. | | | 767,540 | 30,694 |
| | MGE Energy Inc. | | | 420,166 | 27,437 |
| | Avangrid Inc. | | | 691,742 | 26,203 |
| | Ormat Technologies Inc. | | | 426,557 | 22,872 |
| | El Paso Electric Co. | | | 487,369 | 22,663 |
| | Northwest Natural Gas Co. | | | 349,723 | 20,913 |
| | American States Water Co. | | | 442,493 | 20,160 |
| | California Water Service Group | | | 581,591 | 19,716 |
| | Otter Tail Corp. | | | 468,095 | 19,098 |
| | Empire District Electric Co. | | | 522,474 | 17,811 |
| | Pattern Energy Group Inc. Class A | | | 794,552 | 15,089 |
| | Chesapeake Utilities Corp. | | | 195,258 | 13,073 |
| | NRG Yield Inc. | | | 757,753 | 11,973 |
| * | Dynegy Inc. | | | 1,393,908 | 11,792 |
| * | TerraForm Power Inc. Class A | | | 851,227 | 10,904 |
| | SJW Group | | | 186,088 | 10,417 |
| | Middlesex Water Co. | | | 196,813 | 8,451 |
| | Unitil Corp. | | | 177,310 | 8,039 |
| | Connecticut Water Service Inc. | | | 141,409 | 7,898 |
| | NRG Yield Inc. Class A | | | 387,965 | 5,959 |
| | York Water Co. | | | 153,966 | 5,882 |
| * | AquaVenture Holdings Ltd. | | | 164,275 | 4,030 |
| | Artesian Resources Corp. Class A | | | 101,294 | 3,235 |
| ^,* | Cadiz Inc. | | | 213,317 | 2,666 |
| | Delta Natural Gas Co. Inc. | | | 82,384 | 2,416 |
| | TerraForm Global Inc. Class A | | | 573,359 | 2,265 |
| ^ | Spark Energy Inc. Class A | | | 69,275 | 2,099 |
| | Genie Energy Ltd. Class B | | | 207,572 | 1,194 |
| * | Pure Cycle Corp. | | | 190,254 | 1,046 |
| | Gas Natural Inc. | | | 80,015 | 1,004 |
| ^,* | Vivint Solar Inc. | | | 283,511 | 723 |
| * | US Geothermal Inc. | | | 127,589 | 522 |
| | RGC Resources Inc. | | | 17,135 | 431 |
| * | American DG Energy Inc. | | | 65,246 | 18 |
| |
| | | | | | 1,580,655 |
| Total Common Stocks (Cost $41,077,071) | | | | 51,424,633 |
| |
| | | | | Face | |
| | | | Maturity | Amount | |
| | | Coupon | Date | ($000) | |
| |
| Convertible Bonds (0.0%) | | | | |
| | Catalyst Biosciences Inc. Cvt. | 0.000% | 2/19/18 | 514 | 335 |
| Total Convertible Bonds (Cost $0) | | | | 335 |
| |
| |
| | | | | Shares | |
| |
| Temporary Cash Investments (1.6%)1 | | | | |
| Money Market Fund (1.6%) | | | | |
| 3,4 | Vanguard Market Liquidity Fund | 0.823% | | 8,010,345 | 801,115 |
| |
| |
| | | | | Face | |
| | | | | Amount | |
| | | | | ($000) | |
| U.S. Government and Agency Obligations (0.0%) | | | | |
| | United States Treasury Bill | 0.601% | 4/27/17 | 100 | 100 |
| | United States Treasury Bill | 0.564% | 5/4/17 | 1,000 | 998 |
52
| | | | | |
| Vanguard® Extended Market Index Fund | | | | |
| Schedule of Investments | | | | |
| December 31, 2016 | | | | |
| |
| | | | | Face | Market |
| | | | Maturity | Amount | Value |
| | | Coupon | Date | ($000) | ($000) |
| |
| 5 | United States Treasury Bill | 0.623% | 5/18/17 | 2,740 | 2,734 |
| 5,6 | United States Treasury Bill | 0.607%-0.608% | 5/25/17 | 7,000 | 6,983 |
| | | | | | 10,815 |
| Total Temporary Cash Investments (Cost $811,879) | | | | 811,930 |
| Total Investments (101.3%) (Cost $41,888,950) | | | | 52,236,898 |
| Other Assets and Liabilities—Net (-1.3%)4 | | | | (687,427) |
| Net Assets (100%) | | | | 51,549,471 |
^ Includes partial security positions on loan to broker-dealers. The total value of securities on loan is $607,029,000.
* Non-income-producing security.
1 The fund invests a portion of its cash reserves in equity markets through the use of index futures contracts and swap contracts. After giving
effect to futures and swap investments, the fund's effective common stock and temporary cash investment positions represent 100.0% and
1.3%, respectively, of net assets.
2 “Other” represents securities that are not classified by the fund’s benchmark index.
3 Affiliated money market fund available only to Vanguard funds and certain trusts and accounts managed by Vanguard. Rate shown is the 7-day
yield.
4 Includes $662,703,000 of collateral received for securities on loan.
5 Securities with a value of $6,425,000 have been segregated as initial margin for open futures contracts.
6 Securities with a value of $797,000 have been segregated as collateral for open over-the-counter swap contracts.
CVR—Contingent Value Rights.
REIT—Real Estate Investment Trust.
53
© 2017 The Vanguard Group, Inc.
All rights reserved.
Vanguard Marketing Corporation, Distributor.
SNA980 022017
| | | |
| Vanguard® Total Stock Market Index Fund | | |
| Schedule of Investments | | |
| December 31, 2016 | | |
| |
| | | | Market |
| | | | Value |
| | | Shares | ($000) |
| |
| Common Stocks (99.5%)1 | | |
| Basic Materials (2.6%) | | |
| | Dow Chemical Co. | 23,772,758 | 1,360,277 |
| | EI du Pont de Nemours & Co. | 18,469,469 | 1,355,659 |
| | Praxair Inc. | 6,043,761 | 708,268 |
| | Air Products & Chemicals Inc. | 4,590,678 | 660,231 |
| | Ecolab Inc. | 5,563,773 | 652,185 |
| | LyondellBasell Industries NV Class A | 6,932,822 | 594,697 |
| | PPG Industries Inc. | 5,641,524 | 534,591 |
| | International Paper Co. | 8,698,490 | 461,542 |
| | Nucor Corp. | 6,709,217 | 399,333 |
| | Newmont Mining Corp. | 11,242,949 | 383,047 |
| * | Freeport-McMoRan Inc. | 25,935,226 | 342,086 |
| | Celanese Corp. Class A | 3,065,307 | 241,362 |
| | Eastman Chemical Co. | 2,934,207 | 220,682 |
| | Mosaic Co. | 7,411,996 | 217,394 |
| | Albemarle Corp. | 2,380,817 | 204,941 |
| | International Flavors & Fragrances Inc. | 1,541,451 | 181,629 |
| | Steel Dynamics Inc. | 4,902,169 | 174,419 |
| | Arconic Inc. | 9,290,231 | 172,241 |
| | FMC Corp. | 2,832,158 | 160,187 |
| | CF Industries Holdings Inc. | 4,929,443 | 155,179 |
| | RPM International Inc. | 2,824,745 | 152,056 |
| | Ashland Global Holdings Inc. | 1,314,457 | 143,657 |
| | Avery Dennison Corp. | 1,877,984 | 131,872 |
| * | Axalta Coating Systems Ltd. | 4,559,640 | 124,022 |
| | United States Steel Corp. | 3,652,387 | 120,565 |
| | Reliance Steel & Aluminum Co. | 1,470,534 | 116,966 |
| * | Alcoa Corp. | 3,828,243 | 107,497 |
| | WR Grace & Co. | 1,490,190 | 100,796 |
| | US Silica Holdings Inc. | 1,674,757 | 94,925 |
| | Scotts Miracle-Gro Co. Class A | 960,869 | 91,811 |
| | Olin Corp. | 3,494,343 | 89,490 |
| | Royal Gold Inc. | 1,387,317 | 87,887 |
| | NewMarket Corp. | 204,003 | 86,465 |
| | Chemours Co. | 3,843,928 | 84,912 |
| | Huntsman Corp. | 4,270,923 | 81,489 |
| | Sensient Technologies Corp. | 945,818 | 74,322 |
| * | AK Steel Holding Corp. | 6,624,443 | 67,636 |
| * | Versum Materials Inc. | 2,293,022 | 64,365 |
| | CONSOL Energy Inc. | 3,403,473 | 62,045 |
| | Cabot Corp. | 1,187,825 | 60,033 |
| | PolyOne Corp. | 1,779,350 | 57,010 |
| | Minerals Technologies Inc. | 735,719 | 56,834 |
| | Compass Minerals International Inc. | 723,167 | 56,660 |
| * | Balchem Corp. | 668,526 | 56,103 |
| | Commercial Metals Co. | 2,551,623 | 55,574 |
| | Domtar Corp. | 1,326,886 | 51,788 |
| | HB Fuller Co. | 1,060,497 | 51,233 |
| * | Univar Inc. | 1,757,541 | 49,861 |
| * | Ingevity Corp. | 892,941 | 48,987 |
| | Westlake Chemical Corp. | 821,052 | 45,971 |
| | Hecla Mining Co. | 8,503,876 | 44,560 |
| * | Chemtura Corp. | 1,341,855 | 44,550 |
| | Worthington Industries Inc. | 939,022 | 44,547 |
| * | Stillwater Mining Co. | 2,580,646 | 41,574 |
| | KapStone Paper and Packaging Corp. | 1,844,027 | 40,661 |
| * | Platform Specialty Products Corp. | 4,101,975 | 40,240 |
| * | GCP Applied Technologies Inc. | 1,500,921 | 40,150 |
| *,^ | Fairmount Santrol Holdings Inc. | 3,293,195 | 38,827 |
| * | Cambrex Corp. | 679,307 | 36,649 |
| *,^ | Cliffs Natural Resources Inc. | 4,346,554 | 36,555 |
| ^ | Allegheny Technologies Inc. | 2,290,562 | 36,489 |
1
| | | |
| Vanguard® Total Stock Market Index Fund | | |
| Schedule of Investments | | |
| December 31, 2016 | | |
| |
| | | | Market |
| | | | Value |
| | | Shares | ($000) |
| * | Coeur Mining Inc. | 3,999,775 | 36,358 |
| | Carpenter Technology Corp. | 995,983 | 36,025 |
| * | Arch Coal Inc. Class A | 445,609 | 34,780 |
| | Stepan Co. | 415,443 | 33,850 |
| | Quaker Chemical Corp. | 255,419 | 32,678 |
| | Innospec Inc. | 476,566 | 32,645 |
| | Kaiser Aluminum Corp. | 390,668 | 30,351 |
| | Neenah Paper Inc. | 338,038 | 28,801 |
| * | Ferro Corp. | 1,730,591 | 24,799 |
| * | Clearwater Paper Corp. | 358,238 | 23,482 |
| | PH Glatfelter Co. | 898,946 | 21,476 |
| | Innophos Holdings Inc. | 390,067 | 20,385 |
| | A Schulman Inc. | 581,258 | 19,443 |
| * | Kraton Corp. | 652,031 | 18,570 |
| | Calgon Carbon Corp. | 1,058,945 | 18,002 |
| | Deltic Timber Corp. | 226,595 | 17,464 |
| * | Koppers Holdings Inc. | 406,473 | 16,381 |
| | Rayonier Advanced Materials Inc. | 938,153 | 14,504 |
| * | AdvanSix Inc. | 634,432 | 14,046 |
| | Tronox Ltd. Class A | 1,307,380 | 13,479 |
| | Aceto Corp. | 589,992 | 12,962 |
| | Tredegar Corp. | 539,318 | 12,944 |
| | Chase Corp. | 147,074 | 12,288 |
| * | CSW Industrials Inc. | 321,193 | 11,836 |
| | Haynes International Inc. | 269,088 | 11,568 |
| * | SunCoke Energy Inc. | 1,007,052 | 11,420 |
| | American Vanguard Corp. | 574,230 | 10,996 |
| * | Veritiv Corp. | 199,088 | 10,701 |
| | Hawkins Inc. | 185,000 | 9,981 |
| * | Century Aluminum Co. | 1,035,310 | 8,862 |
| * | OMNOVA Solutions Inc. | 881,839 | 8,818 |
| *,^ | Nexeo Solutions Inc. | 842,388 | 7,843 |
| * | Cloud Peak Energy Inc. | 1,297,199 | 7,277 |
| | KMG Chemicals Inc. | 178,150 | 6,928 |
| * | Resolute Forest Products Inc. | 1,279,793 | 6,847 |
| | FutureFuel Corp. | 486,122 | 6,757 |
| * | Westmoreland Coal Co. | 369,406 | 6,527 |
| ^ | Kronos Worldwide Inc. | 471,468 | 5,629 |
| * | Verso Corp. | 722,716 | 5,131 |
| | Gold Resource Corp. | 1,162,671 | 5,058 |
| | Olympic Steel Inc. | 198,115 | 4,800 |
| * | Ryerson Holding Corp. | 323,545 | 4,319 |
| *,^ | LSB Industries Inc. | 428,298 | 3,606 |
| | Ampco-Pittsburgh Corp. | 214,187 | 3,588 |
| * | Real Industry Inc. | 573,437 | 3,498 |
| | Hallador Energy Co. | 368,644 | 3,351 |
| *,^ | Uranium Energy Corp. | 2,296,250 | 2,572 |
| * | Universal Stainless & Alloy Products Inc. | 164,818 | 2,227 |
| * | Codexis Inc. | 472,529 | 2,174 |
| * | Synalloy Corp. | 187,582 | 2,054 |
| *,^ | Ur-Energy Inc. | 3,850,766 | 2,045 |
| * | ChromaDex Corp. | 475,100 | 1,573 |
| *,^ | Pershing Gold Corp. | 315,046 | 1,030 |
| *,^ | Senomyx Inc. | 1,000,586 | 961 |
| * | Northern Technologies International Corp. | 62,670 | 862 |
| * | Intrepid Potash Inc. | 398,420 | 829 |
| *,^ | AgroFresh Solutions Inc. | 288,862 | 765 |
| * | NL Industries Inc. | 92,843 | 757 |
| | Friedman Industries Inc. | 103,125 | 687 |
| * | Centrus Energy Corp. Class A | 98,468 | 628 |
| *,^ | Uni-Pixel Inc. | 607,970 | 598 |
| * | Handy & Harman Ltd. | 21,102 | 539 |
| *,^ | Comstock Mining Inc. | 2,018,866 | 531 |
| | Empire Resources Inc. | 78,065 | 530 |
2
| | | |
| Vanguard® Total Stock Market Index Fund | | |
| Schedule of Investments | | |
| December 31, 2016 | | |
| |
| | | | Market |
| | | | Value |
| | | Shares | ($000) |
| | United-Guardian Inc. | 26,819 | 416 |
| *,^ | Marrone Bio Innovations Inc. | 188,755 | 404 |
| * | Solitario Exploration & Royalty Corp. | 539,324 | 343 |
| *,^ | Golden Minerals Co. | 563,224 | 327 |
| * | General Moly Inc. | 1,015,507 | 254 |
| * | Dynasil Corp. of America | 158,073 | 202 |
| * | Ikonics Corp. | 6,410 | 73 |
| * | TOR Minerals International Inc. | 2,580 | 16 |
| * | US Antimony Corp. | 6,500 | 2 |
| | | | 12,812,037 |
| Consumer Goods (9.5%) | | |
| | Procter & Gamble Co. | 56,683,460 | 4,765,945 |
| | Coca-Cola Co. | 82,265,445 | 3,410,725 |
| | PepsiCo Inc. | 30,407,160 | 3,181,501 |
| | Philip Morris International Inc. | 32,864,233 | 3,006,749 |
| | Altria Group Inc. | 41,374,314 | 2,797,731 |
| | NIKE Inc. Class B | 28,314,543 | 1,439,228 |
| | Mondelez International Inc. Class A | 31,140,671 | 1,380,466 |
| | Colgate-Palmolive Co. | 18,900,163 | 1,236,827 |
| | Kraft Heinz Co. | 12,887,717 | 1,125,355 |
| | Reynolds American Inc. | 18,136,060 | 1,016,345 |
| | Ford Motor Co. | 82,605,613 | 1,002,006 |
| | Monsanto Co. | 9,280,867 | 976,440 |
| | General Motors Co. | 27,494,722 | 957,916 |
| | Kimberly-Clark Corp. | 7,607,098 | 868,122 |
| | General Mills Inc. | 12,565,081 | 776,145 |
| | Archer-Daniels-Midland Co. | 12,215,374 | 557,632 |
| | Constellation Brands Inc. Class A | 3,562,647 | 546,189 |
| *,^ | Tesla Motors Inc. | 2,554,526 | 545,877 |
| | Activision Blizzard Inc. | 14,152,284 | 511,039 |
| * | Electronic Arts Inc. | 6,060,507 | 477,326 |
| | Newell Brands Inc. | 10,215,173 | 456,107 |
| * | Monster Beverage Corp. | 9,065,766 | 401,976 |
| | Delphi Automotive plc | 5,749,454 | 387,226 |
| | Kellogg Co. | 5,189,278 | 382,502 |
| | Tyson Foods Inc. Class A | 6,173,150 | 380,760 |
| | Conagra Brands Inc. | 9,271,887 | 366,703 |
| | Stanley Black & Decker Inc. | 3,183,157 | 365,076 |
| | Molson Coors Brewing Co. Class B | 3,696,160 | 359,673 |
| | Estee Lauder Cos. Inc. Class A | 4,668,278 | 357,077 |
| | Dr Pepper Snapple Group Inc. | 3,926,876 | 356,050 |
| | Clorox Co. | 2,737,602 | 328,567 |
| | VF Corp. | 5,750,065 | 306,766 |
| | Hershey Co. | 2,905,729 | 300,540 |
| | JM Smucker Co. | 2,342,176 | 299,939 |
| | Whirlpool Corp. | 1,596,055 | 290,115 |
| | Genuine Parts Co. | 2,999,765 | 286,598 |
| | Mead Johnson Nutrition Co. | 3,908,355 | 276,555 |
| * | Mohawk Industries Inc. | 1,334,607 | 266,494 |
| | Campbell Soup Co. | 4,247,461 | 256,844 |
| | Church & Dwight Co. Inc. | 5,453,876 | 241,007 |
| | McCormick & Co. Inc. | 2,432,573 | 227,032 |
| | Harley-Davidson Inc. | 3,752,367 | 218,913 |
| | Bunge Ltd. | 2,950,456 | 213,141 |
| | Snap-on Inc. | 1,232,812 | 211,144 |
| * | WhiteWave Foods Co. Class A | 3,741,390 | 208,021 |
| | Coach Inc. | 5,895,332 | 206,455 |
| | DR Horton Inc. | 7,509,655 | 205,239 |
| | Lear Corp. | 1,517,148 | 200,825 |
| | Mattel Inc. | 7,204,202 | 198,476 |
| | Hormel Foods Corp. | 5,613,707 | 195,413 |
| | Ingredion Inc. | 1,525,485 | 190,625 |
| * | LKQ Corp. | 6,157,743 | 188,735 |
| | Hasbro Inc. | 2,384,107 | 185,460 |
3
| | | |
| Vanguard® Total Stock Market Index Fund | | |
| Schedule of Investments | | |
| December 31, 2016 | | |
| |
| | | | Market |
| | | | Value |
| | | Shares | ($000) |
| | BorgWarner Inc. | 4,433,957 | 174,875 |
| | Coty Inc. Class A | 9,495,493 | 173,862 |
| | Hanesbrands Inc. | 8,007,861 | 172,730 |
| | Brown-Forman Corp. Class B | 3,832,239 | 172,144 |
| | Goodyear Tire & Rubber Co. | 5,556,970 | 171,544 |
| | Lennar Corp. Class A | 3,912,475 | 167,963 |
| | Harman International Industries Inc. | 1,479,074 | 164,414 |
| | Leucadia National Corp. | 6,852,814 | 159,328 |
| * | Middleby Corp. | 1,220,079 | 157,158 |
| | PVH Corp. | 1,710,545 | 154,360 |
| * | Michael Kors Holdings Ltd. | 3,340,648 | 143,581 |
| | Leggett & Platt Inc. | 2,838,947 | 138,768 |
| | Pinnacle Foods Inc. | 2,488,857 | 133,029 |
| * | Lululemon Athletica Inc. | 2,016,396 | 131,046 |
| * | NVR Inc. | 78,422 | 130,886 |
| | Gentex Corp. | 6,137,688 | 120,851 |
| * | WABCO Holdings Inc. | 1,120,862 | 118,979 |
| | PulteGroup Inc. | 6,440,380 | 118,374 |
| | Lamb Weston Holdings Inc. | 3,079,250 | 116,550 |
| *,^ | Under Armour Inc. Class A | 3,948,296 | 114,698 |
| | Ralph Lauren Corp. Class A | 1,191,843 | 107,647 |
| ^ | Polaris Industries Inc. | 1,289,402 | 106,234 |
| | Thor Industries Inc. | 1,044,325 | 104,485 |
| * | Post Holdings Inc. | 1,295,578 | 104,152 |
| | Brunswick Corp. | 1,907,111 | 104,014 |
| * | Toll Brothers Inc. | 3,160,386 | 97,972 |
| * | Under Armour Inc. | 3,836,509 | 96,565 |
| * | Edgewell Personal Care Co. | 1,245,208 | 90,888 |
| * | Take-Two Interactive Software Inc. | 1,815,280 | 89,475 |
| | Pool Corp. | 836,654 | 87,296 |
| | Carter's Inc. | 1,007,338 | 87,024 |
| * | TreeHouse Foods Inc. | 1,198,667 | 86,532 |
| * | Hain Celestial Group Inc. | 2,186,483 | 85,338 |
| | Flowers Foods Inc. | 3,951,822 | 78,918 |
| * | Tenneco Inc. | 1,156,544 | 72,249 |
| *,^ | Tempur Sealy International Inc. | 1,050,000 | 71,694 |
| *,^ | Herbalife Ltd. | 1,441,788 | 69,408 |
| * | Skechers U.S.A. Inc. Class A | 2,820,832 | 69,336 |
| | Snyder's-Lance Inc. | 1,623,116 | 62,230 |
| | B&G Foods Inc. | 1,405,064 | 61,542 |
| | Spectrum Brands Holdings Inc. | 500,768 | 61,259 |
| | Energizer Holdings Inc. | 1,326,901 | 59,193 |
| | Dana Inc. | 3,073,544 | 58,336 |
| | Visteon Corp. | 712,876 | 57,272 |
| | Lancaster Colony Corp. | 403,170 | 57,004 |
| * | Manitowoc Foodservice Inc. | 2,902,822 | 56,112 |
| | Nu Skin Enterprises Inc. Class A | 1,121,892 | 53,604 |
| | CalAtlantic Group Inc. | 1,569,573 | 53,381 |
| | Drew Industries Inc. | 489,448 | 52,738 |
| | HNI Corp. | 940,098 | 52,570 |
| * | Dorman Products Inc. | 701,586 | 51,258 |
| * | Kate Spade & Co. | 2,694,582 | 50,308 |
| * | Helen of Troy Ltd. | 590,445 | 49,863 |
| * | Vista Outdoor Inc. | 1,280,557 | 47,253 |
| | Vector Group Ltd. | 2,051,684 | 46,655 |
| * | Avon Products Inc. | 9,252,344 | 46,632 |
| | Cooper Tire & Rubber Co. | 1,160,924 | 45,102 |
| *,^ | Blue Buffalo Pet Products Inc. | 1,875,506 | 45,087 |
| | Tupperware Brands Corp. | 854,709 | 44,975 |
| * | Darling Ingredients Inc. | 3,455,234 | 44,607 |
| | Wolverine World Wide Inc. | 1,989,553 | 43,671 |
| | Herman Miller Inc. | 1,272,300 | 43,513 |
| | Fresh Del Monte Produce Inc. | 704,840 | 42,734 |
| | J&J Snack Foods Corp. | 314,362 | 41,945 |
4
| | | |
| Vanguard® Total Stock Market Index Fund | | |
| Schedule of Investments | | |
| December 31, 2016 | | |
| |
| | | | Market |
| | | | Value |
| | | Shares | ($000) |
| | Dean Foods Co. | 1,914,661 | 41,701 |
| * | Steven Madden Ltd. | 1,161,525 | 41,525 |
| * | Zynga Inc. Class A | 15,341,271 | 39,427 |
| | Sanderson Farms Inc. | 404,101 | 38,082 |
| * | Deckers Outdoor Corp. | 672,004 | 37,222 |
| * | Cooper-Standard Holdings Inc. | 344,856 | 35,651 |
| | Columbia Sportswear Co. | 598,362 | 34,885 |
| * | TRI Pointe Group Inc. | 3,030,624 | 34,792 |
| * | US Foods Holding Corp. | 1,208,675 | 33,214 |
| | WD-40 Co. | 276,912 | 32,371 |
| | La-Z-Boy Inc. | 1,041,755 | 32,346 |
| * | iRobot Corp. | 552,069 | 32,268 |
| * | Boston Beer Co. Inc. Class A | 184,230 | 31,291 |
| | Steelcase Inc. Class A | 1,732,810 | 31,017 |
| * | American Axle & Manufacturing Holdings Inc. | 1,604,410 | 30,965 |
| * | ACCO Brands Corp. | 2,252,131 | 29,390 |
| | Schweitzer-Mauduit International Inc. | 634,811 | 28,903 |
| | Universal Corp. | 450,105 | 28,694 |
| * | Meritage Homes Corp. | 793,684 | 27,620 |
| | Knoll Inc. | 968,516 | 27,051 |
| | KB Home | 1,688,217 | 26,691 |
| * | Gentherm Inc. | 788,076 | 26,676 |
| ^ | Cal-Maine Foods Inc. | 599,100 | 26,465 |
| | Interface Inc. Class A | 1,399,578 | 25,962 |
| *,^ | Wayfair Inc. | 722,920 | 25,338 |
| * | G-III Apparel Group Ltd. | 816,772 | 24,144 |
| | Andersons Inc. | 535,739 | 23,948 |
| | Pilgrim's Pride Corp. | 1,221,534 | 23,197 |
| * | Fossil Group Inc. | 858,118 | 22,191 |
| *,^ | Fitbit Inc. Class A | 2,996,341 | 21,933 |
| | Callaway Golf Co. | 1,987,672 | 21,785 |
| | MDC Holdings Inc. | 844,914 | 21,680 |
| * | Seaboard Corp. | 5,421 | 21,424 |
| | Nutrisystem Inc. | 617,331 | 21,391 |
| | Standard Motor Products Inc. | 395,932 | 21,071 |
| * | Select Comfort Corp. | 929,127 | 21,017 |
| | Ethan Allen Interiors Inc. | 521,049 | 19,201 |
| | Briggs & Stratton Corp. | 861,525 | 19,178 |
| | Calavo Growers Inc. | 310,589 | 19,070 |
| | Oxford Industries Inc. | 314,805 | 18,929 |
| * | Universal Electronics Inc. | 286,983 | 18,525 |
| * | Cavco Industries Inc. | 178,657 | 17,839 |
| | Winnebago Industries Inc. | 555,690 | 17,588 |
| | Coca-Cola Bottling Co. Consolidated | 96,596 | 17,276 |
| ^ | Tootsie Roll Industries Inc. | 415,329 | 16,509 |
| * | Central Garden & Pet Co. Class A | 522,245 | 16,137 |
| * | Fox Factory Holding Corp. | 560,290 | 15,548 |
| *,^ | GoPro Inc. Class A | 1,744,982 | 15,199 |
| | AdvancePierre Foods Holdings Inc. | 503,482 | 14,994 |
| * | Modine Manufacturing Co. | 976,875 | 14,555 |
| * | USANA Health Sciences Inc. | 233,032 | 14,262 |
| | National Beverage Corp. | 254,939 | 13,022 |
| | Superior Industries International Inc. | 486,040 | 12,807 |
| * | Central Garden & Pet Co. | 386,149 | 12,778 |
| * | M/I Homes Inc. | 497,934 | 12,538 |
| | MGP Ingredients Inc. | 245,438 | 12,267 |
| * | Nautilus Inc. | 654,496 | 12,108 |
| | John B Sanfilippo & Son Inc. | 171,739 | 12,089 |
| * | Taylor Morrison Home Corp. Class A | 620,380 | 11,949 |
| | Tower International Inc. | 420,073 | 11,909 |
| | Inter Parfums Inc. | 360,480 | 11,806 |
| | National Presto Industries Inc. | 108,613 | 11,556 |
| | Phibro Animal Health Corp. Class A | 381,538 | 11,179 |
| * | Motorcar Parts of America Inc. | 384,226 | 10,343 |
5
| | | |
| Vanguard® Total Stock Market Index Fund | | |
| Schedule of Investments | | |
| December 31, 2016 | | |
| |
| | | | Market |
| | | | Value |
| | | Shares | ($000) |
| * | WCI Communities Inc. | 438,871 | 10,292 |
| *,^ | LGI Homes Inc. | 351,620 | 10,102 |
| * | Crocs Inc. | 1,463,441 | 10,039 |
| | Titan International Inc. | 895,078 | 10,034 |
| * | Unifi Inc. | 306,753 | 10,009 |
| * | Omega Protein Corp. | 398,341 | 9,978 |
| * | Stoneridge Inc. | 561,788 | 9,938 |
| | Movado Group Inc. | 344,760 | 9,912 |
| * | Beazer Homes USA Inc. | 717,156 | 9,538 |
| | Lennar Corp. Class B | 273,277 | 9,428 |
| * | William Lyon Homes Class A | 483,130 | 9,194 |
| * | Iconix Brand Group Inc. | 957,870 | 8,947 |
| | Medifast Inc. | 214,136 | 8,914 |
| * | Acushnet Holdings Corp. | 446,136 | 8,793 |
| | Flexsteel Industries Inc. | 140,299 | 8,652 |
| | Hooker Furniture Corp. | 225,825 | 8,570 |
| ^ | Camping World Holdings Inc. Class A | 254,742 | 8,302 |
| | Libbey Inc. | 426,017 | 8,290 |
| | Culp Inc. | 212,632 | 7,899 |
| * | Farmer Brothers Co. | 207,361 | 7,610 |
| * | Eastman Kodak Co. | 481,744 | 7,467 |
| * | Federal-Mogul Holdings Corp. | 709,901 | 7,319 |
| * | Century Communities Inc. | 341,999 | 7,182 |
| * | elf Beauty Inc. | 241,656 | 6,994 |
| * | Malibu Boats Inc. Class A | 365,540 | 6,975 |
| * | Primo Water Corp. | 558,897 | 6,863 |
| *,^ | Hovnanian Enterprises Inc. Class A | 2,479,494 | 6,769 |
| * | Revlon Inc. Class A | 230,189 | 6,710 |
| ^ | Orchids Paper Products Co. | 250,054 | 6,546 |
| | Bassett Furniture Industries Inc. | 213,662 | 6,495 |
| | Metaldyne Performance Group Inc. | 279,579 | 6,416 |
| * | Perry Ellis International Inc. | 251,463 | 6,264 |
| | Limoneira Co. | 286,252 | 6,157 |
| *,^ | Amplify Snack Brands Inc. | 614,010 | 5,409 |
| | Nutraceutical International Corp. | 152,936 | 5,345 |
| * | Vera Bradley Inc. | 428,063 | 5,017 |
| * | Seneca Foods Corp. Class A | 125,014 | 5,007 |
| | MCBC Holdings Inc. | 335,192 | 4,887 |
| * | Inventure Foods Inc. | 479,372 | 4,722 |
| * | Freshpet Inc. | 432,638 | 4,391 |
| * | ZAGG Inc. | 581,983 | 4,132 |
| *,^ | Glu Mobile Inc. | 2,094,346 | 4,063 |
| *,^ | Arctic Cat Inc. | 264,756 | 3,977 |
| | Oil-Dri Corp. of America | 96,105 | 3,672 |
| | Weyco Group Inc. | 114,453 | 3,582 |
| *,^ | Sequential Brands Group Inc. | 763,682 | 3,574 |
| | Superior Uniform Group Inc. | 179,445 | 3,521 |
| * | Core Molding Technologies Inc. | 201,018 | 3,439 |
| | Johnson Outdoors Inc. Class A | 84,976 | 3,373 |
| | Strattec Security Corp. | 83,626 | 3,370 |
| *,^ | Jamba Inc. | 309,686 | 3,190 |
| * | Craft Brew Alliance Inc. | 181,843 | 3,073 |
| * | Alliance One International Inc. | 157,621 | 3,026 |
| | A-Mark Precious Metals Inc. | 152,127 | 2,966 |
| *,^ | JAKKS Pacific Inc. | 552,677 | 2,846 |
| | Lifetime Brands Inc. | 157,660 | 2,798 |
| * | New Home Co. Inc. | 230,218 | 2,696 |
| * | Delta Apparel Inc. | 127,573 | 2,645 |
| * | Cherokee Inc. | 248,819 | 2,613 |
| * | Skyline Corp. | 164,720 | 2,547 |
| * | Black Diamond Inc. | 475,499 | 2,544 |
| | Crown Crafts Inc. | 324,287 | 2,513 |
| | Nature's Sunshine Products Inc. | 162,457 | 2,437 |
| * | Lifevantage Corp. | 291,057 | 2,372 |
6
| | | |
| Vanguard® Total Stock Market Index Fund | | |
| Schedule of Investments | | |
| December 31, 2016 | | |
| |
| | | | Market |
| | | | Value |
| | | Shares | ($000) |
| ^ | Valvoline Inc. | 107,048 | 2,302 |
| | Marine Products Corp. | 160,759 | 2,230 |
| *,^ | Vuzix Corp. | 318,298 | 2,164 |
| * | Lakeland Industries Inc. | 206,432 | 2,147 |
| | Rocky Brands Inc. | 183,158 | 2,115 |
| | Escalade Inc. | 145,056 | 1,915 |
| *,^ | Vince Holding Corp. | 407,335 | 1,650 |
| * | Turning Point Brands Inc. | 131,404 | 1,610 |
| | Acme United Corp. | 59,133 | 1,513 |
| * | Castle Brands Inc. | 1,989,401 | 1,512 |
| *,^ | 22nd Century Group Inc. | 1,365,718 | 1,489 |
| * | S&W Seed Co. | 317,456 | 1,460 |
| * | Fenix Parts Inc. | 515,373 | 1,453 |
| | Alico Inc. | 49,140 | 1,334 |
| * | Natural Alternatives International Inc. | 107,239 | 1,212 |
| | Unique Fabricating Inc. | 80,609 | 1,177 |
| * | Lifeway Foods Inc. | 97,126 | 1,118 |
| * | Shiloh Industries Inc. | 159,008 | 1,099 |
| * | US Auto Parts Network Inc. | 305,527 | 1,075 |
| * | Dixie Group Inc. | 296,984 | 1,069 |
| * | Alpha Pro Tech Ltd. | 292,060 | 1,022 |
| | LS Starrett Co. Class A | 105,372 | 980 |
| | Kewaunee Scientific Corp. | 39,165 | 958 |
| | Rocky Mountain Chocolate Factory Inc. | 93,674 | 955 |
| * | Virco Manufacturing Corp. | 218,789 | 941 |
| | Mannatech Inc. | 40,249 | 817 |
| * | Tandy Leather Factory Inc. | 93,919 | 761 |
| * | Reed's Inc. | 168,431 | 691 |
| * | Coffee Holding Co. Inc. | 130,802 | 608 |
| * | Zedge Inc. Class B | 155,961 | 488 |
| *,^ | Nova Lifestyle Inc. | 246,529 | 476 |
| * | Willamette Valley Vineyards Inc. | 55,833 | 447 |
| * | Summer Infant Inc. | 163,915 | 334 |
| * | Female Health Co. | 350,871 | 319 |
| *,^ | Lipocine Inc. | 83,770 | 308 |
| * | Charles & Colvard Ltd. | 233,777 | 257 |
| * | Emerson Radio Corp. | 183,685 | 193 |
| | Stanley Furniture Co. Inc. | 194,361 | 175 |
| | P&F Industries Inc. Class A | 18,458 | 153 |
| *,^ | DS Healthcare Group Inc. | 231,016 | 152 |
| * | Cyanotech Corp. | 23,466 | 101 |
| | CompX International Inc. | 5,846 | 94 |
| * | CTI Industries Corp. | 14,046 | 88 |
| * | Differential Brands Group Inc. | 31,820 | 75 |
| * | JRjr33 Inc. | 80,833 | 61 |
| * | Hovnanian Enterprises Inc. Class B | 19,300 | 53 |
| * | Crystal Rock Holdings Inc. | 60,050 | 49 |
| | Ocean Bio-Chem Inc. | 11,842 | 45 |
| * | RiceBran Technologies | 28,938 | 30 |
| * | Koss Corp. | 12,072 | 28 |
| *,^ | Long Island Iced Tea Corp. | 6,400 | 27 |
| | LCI Industries | 96 | 10 |
| | Monster Digital Inc. | 3,100 | 5 |
| * | Bridgford Foods Corp. | 53 | 1 |
| | | | 47,649,009 |
| Consumer Services (13.0%) | | |
| * | Amazon.com Inc. | 8,558,557 | 6,417,805 |
| | Comcast Corp. Class A | 50,479,761 | 3,485,628 |
| | Home Depot Inc. | 25,791,280 | 3,458,095 |
| | Walt Disney Co. | 30,329,375 | 3,160,927 |
| | Wal-Mart Stores Inc. | 32,757,385 | 2,264,190 |
| | McDonald's Corp. | 17,591,525 | 2,141,240 |
| | CVS Health Corp. | 22,588,149 | 1,782,431 |
| | Starbucks Corp. | 29,301,800 | 1,626,836 |
7
| | | |
| Vanguard® Total Stock Market Index Fund | | |
| Schedule of Investments | | |
| December 31, 2016 | | |
| |
| | | | Market |
| | | | Value |
| | | Shares | ($000) |
| | Walgreens Boots Alliance Inc. | 19,495,680 | 1,613,462 |
| * | Priceline Group Inc. | 1,046,652 | 1,534,455 |
| | Time Warner Inc. | 15,530,657 | 1,499,174 |
| | Costco Wholesale Corp. | 9,269,270 | 1,484,103 |
| | Lowe's Cos. Inc. | 18,540,088 | 1,318,571 |
| * | Charter Communications Inc. Class A | 4,303,031 | 1,238,929 |
| * | Netflix Inc. | 8,636,517 | 1,069,201 |
| | TJX Cos. Inc. | 13,208,832 | 992,380 |
| | Target Corp. | 11,909,957 | 860,256 |
| | Delta Air Lines Inc. | 15,847,303 | 779,529 |
| | Kroger Co. | 20,040,742 | 691,606 |
| | McKesson Corp. | 4,787,594 | 672,418 |
| * | eBay Inc. | 22,578,550 | 670,357 |
| | Southwest Airlines Co. | 13,041,061 | 649,966 |
| | Twenty-First Century Fox Inc. Class A | 22,349,546 | 626,681 |
| | Sysco Corp. | 10,471,480 | 579,806 |
| * | O'Reilly Automotive Inc. | 1,993,666 | 555,057 |
| | Ross Stores Inc. | 8,389,562 | 550,355 |
| | CBS Corp. Class B | 8,078,541 | 513,957 |
| | Marriott International Inc. Class A | 6,189,328 | 511,734 |
| | American Airlines Group Inc. | 10,437,006 | 487,304 |
| * | AutoZone Inc. | 616,963 | 487,271 |
| | Cardinal Health Inc. | 6,765,985 | 486,948 |
| | Yum! Brands Inc. | 7,377,173 | 467,196 |
| | Las Vegas Sands Corp. | 8,423,217 | 449,884 |
| | Dollar General Corp. | 5,936,364 | 439,706 |
| | Omnicom Group Inc. | 5,009,331 | 426,344 |
| * | United Continental Holdings Inc. | 5,798,893 | 422,623 |
| | Carnival Corp. | 8,017,370 | 417,384 |
| * | Dollar Tree Inc. | 4,741,103 | 365,918 |
| | Hilton Worldwide Holdings Inc. | 12,569,835 | 341,900 |
| | L Brands Inc. | 5,171,972 | 340,523 |
| * | Ulta Salon Cosmetics & Fragrance Inc. | 1,254,370 | 319,789 |
| | Nielsen Holdings plc | 7,558,616 | 317,084 |
| | Royal Caribbean Cruises Ltd. | 3,647,798 | 299,265 |
| * | MGM Resorts International | 10,293,394 | 296,759 |
| | Expedia Inc. | 2,612,595 | 295,955 |
| | AmerisourceBergen Corp. Class A | 3,509,060 | 274,373 |
| | Viacom Inc. Class B | 7,555,990 | 265,215 |
| * | DISH Network Corp. Class A | 4,553,251 | 263,770 |
| * | CarMax Inc. | 4,051,476 | 260,875 |
| | Advance Auto Parts Inc. | 1,480,894 | 250,449 |
| | Best Buy Co. Inc. | 5,728,469 | 244,434 |
| | Macy's Inc. | 6,528,507 | 233,786 |
| *,^ | Chipotle Mexican Grill Inc. Class A | 616,714 | 232,699 |
| | Alaska Air Group Inc. | 2,615,963 | 232,114 |
| | Twenty-First Century Fox Inc. | 8,508,236 | 231,849 |
| | Tractor Supply Co. | 2,793,749 | 211,794 |
| | Whole Foods Market Inc. | 6,742,663 | 207,404 |
| ^ | Tiffany & Co. | 2,620,230 | 202,884 |
| | Foot Locker Inc. | 2,838,932 | 201,252 |
| | Interpublic Group of Cos. Inc. | 8,479,245 | 198,499 |
| | Kohl's Corp. | 3,829,469 | 189,099 |
| | Darden Restaurants Inc. | 2,580,081 | 187,624 |
| | Aramark | 5,158,598 | 184,265 |
| * | Rite Aid Corp. | 22,200,255 | 182,930 |
| | Wyndham Worldwide Corp. | 2,322,836 | 177,395 |
| * | Liberty Interactive Corp. QVC Group Class A | 8,877,660 | 177,376 |
| | Domino's Pizza Inc. | 1,019,555 | 162,354 |
| ^ | Sirius XM Holdings Inc. | 36,095,286 | 160,624 |
| * | JetBlue Airways Corp. | 6,857,105 | 153,736 |
| | Signet Jewelers Ltd. | 1,621,605 | 152,852 |
| | Wynn Resorts Ltd. | 1,725,274 | 149,253 |
| * | Norwegian Cruise Line Holdings Ltd. | 3,365,067 | 143,116 |
8
| | | |
| Vanguard® Total Stock Market Index Fund | | |
| Schedule of Investments | | |
| December 31, 2016 | | |
| |
| | | | Market |
| | | | Value |
| | | Shares | ($000) |
| | FactSet Research Systems Inc. | 859,696 | 140,500 |
| * | Discovery Communications Inc. | 4,976,344 | 133,267 |
| * | Burlington Stores Inc. | 1,508,092 | 127,811 |
| | Bed Bath & Beyond Inc. | 3,103,186 | 126,113 |
| | Staples Inc. | 13,780,864 | 124,717 |
| | KAR Auction Services Inc. | 2,920,710 | 124,481 |
| | Vail Resorts Inc. | 766,451 | 123,636 |
| | Nordstrom Inc. | 2,563,916 | 122,889 |
| | Scripps Networks Interactive Inc. Class A | 1,712,730 | 122,238 |
| * | Liberty Media Corp-Liberty SiriusXM Class C | 3,582,138 | 121,506 |
| * | Copart Inc. | 2,088,269 | 115,711 |
| | News Corp. Class A | 10,095,045 | 115,689 |
| * | VCA Inc. | 1,624,823 | 111,544 |
| | Service Corp. International | 3,907,008 | 110,959 |
| * | TripAdvisor Inc. | 2,389,835 | 110,817 |
| * | ServiceMaster Global Holdings Inc. | 2,873,011 | 108,226 |
| | H&R Block Inc. | 4,697,332 | 107,992 |
| | Gap Inc. | 4,629,159 | 103,878 |
| | Sabre Corp. | 4,121,856 | 102,840 |
| | Dunkin' Brands Group Inc. | 1,939,325 | 101,698 |
| | Casey's General Stores Inc. | 831,009 | 98,790 |
| | TEGNA Inc. | 4,534,721 | 96,998 |
| * | Panera Bread Co. Class A | 469,539 | 96,298 |
| | Six Flags Entertainment Corp. | 1,575,426 | 94,463 |
| | Dick's Sporting Goods Inc. | 1,766,142 | 93,782 |
| | Dun & Bradstreet Corp. | 770,278 | 93,450 |
| * | Spirit Airlines Inc. | 1,483,529 | 85,837 |
| | Cinemark Holdings Inc. | 2,213,852 | 84,923 |
| ^ | Cracker Barrel Old Country Store Inc. | 507,889 | 84,807 |
| * | Discovery Communications Inc. Class A | 3,022,976 | 82,860 |
| * | Sally Beauty Holdings Inc. | 3,103,531 | 81,995 |
| | Williams-Sonoma Inc. | 1,693,987 | 81,972 |
| | Jack in the Box Inc. | 690,001 | 77,032 |
| | CST Brands Inc. | 1,595,125 | 76,805 |
| * | Live Nation Entertainment Inc. | 2,787,064 | 74,136 |
| * | AutoNation Inc. | 1,516,197 | 73,763 |
| * | Liberty Media Corp-Liberty SiriusXM Class A | 2,103,539 | 72,614 |
| | Rollins Inc. | 2,110,772 | 71,302 |
| * | Madison Square Garden Co. Class A | 414,024 | 71,009 |
| * | GrubHub Inc. | 1,798,786 | 67,670 |
| * | AMC Networks Inc. Class A | 1,276,882 | 66,832 |
| * | Cabela's Inc. | 1,137,053 | 66,574 |
| * | Bright Horizons Family Solutions Inc. | 943,135 | 66,038 |
| | Texas Roadhouse Inc. Class A | 1,346,770 | 64,968 |
| * | Hawaiian Holdings Inc. | 1,078,512 | 61,475 |
| * | Avis Budget Group Inc. | 1,674,815 | 61,432 |
| * | Pandora Media Inc. | 4,668,940 | 60,883 |
| | Cable One Inc. | 96,434 | 59,956 |
| * | Buffalo Wild Wings Inc. | 387,845 | 59,883 |
| * | Grand Canyon Education Inc. | 1,002,664 | 58,606 |
| * | Beacon Roofing Supply Inc. | 1,266,927 | 58,367 |
| | Wendy's Co. | 4,284,410 | 57,925 |
| * | Yelp Inc. Class A | 1,512,860 | 57,685 |
| | Tribune Media Co. Class A | 1,631,159 | 57,058 |
| | Cheesecake Factory Inc. | 932,084 | 55,813 |
| | GameStop Corp. Class A | 2,194,615 | 55,436 |
| | Brinker International Inc. | 1,103,438 | 54,653 |
| * | Sprouts Farmers Market Inc. | 2,882,892 | 54,544 |
| | John Wiley & Sons Inc. Class A | 993,421 | 54,141 |
| | Lions Gate Entertainment Corp. Class B | 2,206,054 | 54,137 |
| | Chemed Corp. | 327,905 | 52,599 |
| | American Eagle Outfitters Inc. | 3,465,092 | 52,565 |
| *,^ | JC Penney Co. Inc. | 6,174,853 | 51,313 |
| * | United Natural Foods Inc. | 1,057,501 | 50,464 |
9
| | | |
| Vanguard® Total Stock Market Index Fund | | |
| Schedule of Investments | | |
| December 31, 2016 | | |
| |
| | | | Market |
| | | | Value |
| | | Shares | ($000) |
| | Office Depot Inc. | 11,112,668 | 50,229 |
| * | Dave & Buster's Entertainment Inc. | 889,645 | 50,087 |
| | Dolby Laboratories Inc. Class A | 1,107,215 | 50,035 |
| | Aaron's Inc. | 1,539,033 | 49,234 |
| | Matthews International Corp. Class A | 637,301 | 48,977 |
| | Papa John's International Inc. | 567,185 | 48,540 |
| * | Michaels Cos. Inc. | 2,361,154 | 48,286 |
| * | Murphy USA Inc. | 785,239 | 48,269 |
| | Graham Holdings Co. Class B | 93,855 | 48,049 |
| | Big Lots Inc. | 941,921 | 47,294 |
| | Meredith Corp. | 793,029 | 46,908 |
| | Allegiant Travel Co. Class A | 280,600 | 46,692 |
| | AMERCO | 125,958 | 46,553 |
| | Regal Entertainment Group Class A | 2,257,269 | 46,500 |
| | Sinclair Broadcast Group Inc. Class A | 1,385,379 | 46,202 |
| * | Five Below Inc. | 1,149,420 | 45,931 |
| | Hillenbrand Inc. | 1,194,792 | 45,820 |
| * | Urban Outfitters Inc. | 1,608,807 | 45,819 |
| | Lithia Motors Inc. Class A | 470,783 | 45,586 |
| * | Liberty Expedia Holdings Inc. Class A | 1,140,731 | 45,253 |
| * | Media General Inc. | 2,288,722 | 43,097 |
| | Bloomin' Brands Inc. | 2,387,311 | 43,043 |
| | PriceSmart Inc. | 508,707 | 42,477 |
| | Churchill Downs Inc. | 282,056 | 42,435 |
| * | Acxiom Corp. | 1,553,946 | 41,646 |
| | ILG Inc. | 2,269,866 | 41,243 |
| | Core-Mark Holding Co. Inc. | 929,933 | 40,052 |
| | Choice Hotels International Inc. | 713,600 | 39,997 |
| * | Sotheby's | 1,002,526 | 39,961 |
| | Penske Automotive Group Inc. | 762,111 | 39,508 |
| | Nexstar Broadcasting Group Inc. Class A | 614,324 | 38,887 |
| | SkyWest Inc. | 1,060,206 | 38,645 |
| | Chico's FAS Inc. | 2,677,505 | 38,529 |
| | Children's Place Inc. | 380,599 | 38,421 |
| | New York Times Co. Class A | 2,834,449 | 37,698 |
| *,^ | WebMD Health Corp. | 760,460 | 37,696 |
| * | Stamps.com Inc. | 327,915 | 37,595 |
| | Extended Stay America Inc. | 2,302,075 | 37,179 |
| | Monro Muffler Brake Inc. | 649,224 | 37,136 |
| | Marriott Vacations Worldwide Corp. | 423,977 | 35,974 |
| | Time Inc. | 1,935,062 | 34,541 |
| | DeVry Education Group Inc. | 1,104,872 | 34,472 |
| * | Shutterfly Inc. | 681,496 | 34,197 |
| * | Boyd Gaming Corp. | 1,663,479 | 33,552 |
| * | Hyatt Hotels Corp. Class A | 578,528 | 31,969 |
| | Group 1 Automotive Inc. | 407,274 | 31,743 |
| * | Caesars Acquisition Co. Class A | 2,305,190 | 31,120 |
| * | Liberty Media Corp-Liberty Media | 985,298 | 30,869 |
| | DSW Inc. Class A | 1,360,374 | 30,812 |
| *,^ | Groupon Inc. Class A | 9,080,247 | 30,146 |
| * | comScore Inc. | 953,817 | 30,122 |
| | SpartanNash Co. | 742,471 | 29,357 |
| | Morningstar Inc. | 391,780 | 28,819 |
| *,^ | Ollie's Bargain Outlet Holdings Inc. | 1,007,531 | 28,664 |
| | Caleres Inc. | 862,732 | 28,315 |
| * | Houghton Mifflin Harcourt Co. | 2,589,085 | 28,092 |
| | DineEquity Inc. | 362,260 | 27,894 |
| * | MSG Networks Inc. | 1,288,118 | 27,695 |
| ^ | Lions Gate Entertainment Corp. Class A | 1,019,433 | 27,423 |
| * | Popeyes Louisiana Kitchen Inc. | 450,739 | 27,261 |
| ^ | SeaWorld Entertainment Inc. | 1,393,382 | 26,377 |
| * | SUPERVALU Inc. | 5,612,243 | 26,209 |
| | Tailored Brands Inc. | 1,022,651 | 26,129 |
| * | Asbury Automotive Group Inc. | 422,225 | 26,051 |
10
| | | |
| Vanguard® Total Stock Market Index Fund | | |
| Schedule of Investments | | |
| December 31, 2016 | | |
| |
| | | | Market |
| | | | Value |
| | | Shares | ($000) |
| * | Genesco Inc. | 416,097 | 25,840 |
| * | Hertz Global Holdings Inc. | 1,188,218 | 25,618 |
| * | Rush Enterprises Inc. Class A | 796,256 | 25,401 |
| * | La Quinta Holdings Inc. | 1,780,249 | 25,297 |
| *,^ | RH | 811,803 | 24,923 |
| | Scholastic Corp. | 520,608 | 24,724 |
| | Dillard's Inc. Class A | 391,837 | 24,564 |
| * | Belmond Ltd. Class A | 1,825,081 | 24,365 |
| * | Etsy Inc. | 2,053,408 | 24,189 |
| * | Ascena Retail Group Inc. | 3,881,193 | 24,025 |
| | Gannett Co. Inc. | 2,459,895 | 23,886 |
| * | Performance Food Group Co. | 980,144 | 23,523 |
| * | EW Scripps Co. Class A | 1,207,781 | 23,346 |
| | Sonic Corp. | 872,169 | 23,121 |
| | HSN Inc. | 661,016 | 22,673 |
| | Bob Evans Farms Inc. | 419,849 | 22,340 |
| * | Herc Holdings Inc. | 548,505 | 22,028 |
| * | Penn National Gaming Inc. | 1,577,470 | 21,753 |
| * | Liberty TripAdvisor Holdings Inc. Class A | 1,438,309 | 21,647 |
| | Capella Education Co. | 244,132 | 21,435 |
| | Planet Fitness Inc. Class A | 1,025,883 | 20,620 |
| ^ | AMC Entertainment Holdings Inc. | 608,282 | 20,469 |
| * | Denny's Corp. | 1,577,438 | 20,239 |
| | International Speedway Corp. Class A | 540,259 | 19,882 |
| * | Apollo Education Group Inc. | 1,924,721 | 19,055 |
| | ClubCorp Holdings Inc. | 1,292,573 | 18,548 |
| | National CineMedia Inc. | 1,254,901 | 18,485 |
| | Weis Markets Inc. | 273,282 | 18,266 |
| ^ | Wingstop Inc. | 604,748 | 17,895 |
| * | Hibbett Sports Inc. | 470,550 | 17,552 |
| * | BJ's Restaurants Inc. | 436,023 | 17,136 |
| * | Pinnacle Entertainment Inc. | 1,180,729 | 17,121 |
| * | Express Inc. | 1,585,308 | 17,058 |
| | Abercrombie & Fitch Co. | 1,417,964 | 17,016 |
| * | Strayer Education Inc. | 210,386 | 16,963 |
| * | Fiesta Restaurant Group Inc. | 565,112 | 16,869 |
| | New Media Investment Group Inc. | 1,048,589 | 16,767 |
| | Finish Line Inc. Class A | 890,763 | 16,755 |
| * | Red Robin Gourmet Burgers Inc. | 282,342 | 15,924 |
| | GNC Holdings Inc. Class A | 1,440,536 | 15,904 |
| | Cato Corp. Class A | 521,406 | 15,684 |
| * | Scientific Games Corp. Class A | 1,100,379 | 15,405 |
| * | Francesca's Holdings Corp. | 841,660 | 15,175 |
| | Guess? Inc. | 1,242,722 | 15,037 |
| * | Liberty Media Corp-Liberty Braves Series C | 727,698 | 14,983 |
| * | Quotient Technology Inc. | 1,360,063 | 14,621 |
| *,^ | Shake Shack Inc. Class A | 404,848 | 14,490 |
| * | Gray Television Inc. | 1,325,315 | 14,380 |
| | Pier 1 Imports Inc. | 1,683,211 | 14,375 |
| * | SiteOne Landscape Supply Inc. | 413,761 | 14,370 |
| * | Liberty Media Corp-Liberty Media Class A | 455,946 | 14,294 |
| | Buckle Inc. | 611,025 | 13,931 |
| | Ingles Markets Inc. Class A | 288,211 | 13,863 |
| ^ | Fred's Inc. Class A | 741,437 | 13,761 |
| * | Tile Shop Holdings Inc. | 700,509 | 13,695 |
| *,^ | TrueCar Inc. | 1,089,739 | 13,622 |
| * | Career Education Corp. | 1,337,932 | 13,500 |
| | Red Rock Resorts Inc. Class A | 574,855 | 13,331 |
| | Barnes & Noble Inc. | 1,178,434 | 13,140 |
| | Sonic Automotive Inc. Class A | 562,530 | 12,882 |
| * | Isle of Capri Casinos Inc. | 515,339 | 12,724 |
| | World Wrestling Entertainment Inc. Class A | 671,599 | 12,357 |
| * | Vitamin Shoppe Inc. | 517,965 | 12,302 |
| | Ruth's Hospitality Group Inc. | 667,481 | 12,215 |
11
| | | |
| Vanguard® Total Stock Market Index Fund | | |
| Schedule of Investments | | |
| December 31, 2016 | | |
| |
| | | | Market |
| | | | Value |
| | | Shares | ($000) |
| * | K12 Inc. | 705,433 | 12,105 |
| | Rent-A-Center Inc. | 1,063,848 | 11,968 |
| * | Bankrate Inc. | 1,048,451 | 11,585 |
| * | Diplomat Pharmacy Inc. | 906,457 | 11,421 |
| * | SP Plus Corp. | 401,704 | 11,308 |
| * | Chuy's Holdings Inc. | 346,901 | 11,257 |
| | Marcus Corp. | 353,632 | 11,139 |
| * | Biglari Holdings Inc. | 22,935 | 10,853 |
| * | Carrols Restaurant Group Inc. | 708,356 | 10,802 |
| * | Regis Corp. | 743,394 | 10,794 |
| *,^ | Caesars Entertainment Corp. | 1,232,713 | 10,478 |
| *,^ | Chegg Inc. | 1,417,101 | 10,458 |
| * | MarineMax Inc. | 521,442 | 10,090 |
| * | Providence Service Corp. | 259,701 | 9,882 |
| * | XO Group Inc. | 491,883 | 9,567 |
| *,^ | Zoe's Kitchen Inc. | 396,528 | 9,513 |
| * | Eldorado Resorts Inc. | 556,806 | 9,438 |
| | Entravision Communications Corp. Class A | 1,295,206 | 9,066 |
| ^ | PetMed Express Inc. | 391,792 | 9,039 |
| * | Del Taco Restaurants Inc. | 629,632 | 8,890 |
| | Blue Nile Inc. | 218,074 | 8,860 |
| *,^ | Party City Holdco Inc. | 615,017 | 8,733 |
| * | FTD Cos. Inc. | 363,752 | 8,672 |
| | Haverty Furniture Cos. Inc. | 362,955 | 8,602 |
| * | Smart & Final Stores Inc. | 604,461 | 8,523 |
| *,^ | Lumber Liquidators Holdings Inc. | 538,273 | 8,472 |
| * | Barnes & Noble Education Inc. | 738,519 | 8,471 |
| *,^ | Zumiez Inc. | 387,583 | 8,469 |
| * | Del Frisco's Restaurant Group Inc. | 484,849 | 8,242 |
| | Shoe Carnival Inc. | 292,424 | 7,890 |
| * | American Public Education Inc. | 316,764 | 7,777 |
| | Carriage Services Inc. Class A | 264,488 | 7,575 |
| *,^ | tronc Inc. | 544,833 | 7,557 |
| * | RetailMeNot Inc. | 808,524 | 7,519 |
| * | Angie's List Inc. | 852,156 | 7,013 |
| *,^ | Weight Watchers International Inc. | 609,855 | 6,983 |
| ^ | MDC Partners Inc. Class A | 1,065,816 | 6,981 |
| * | Clean Energy Fuels Corp. | 2,438,146 | 6,973 |
| * | 1-800-Flowers.com Inc. Class A | 648,433 | 6,938 |
| * | America's Car-Mart Inc. | 157,565 | 6,893 |
| | Big 5 Sporting Goods Corp. | 392,584 | 6,811 |
| * | Chefs' Warehouse Inc. | 425,560 | 6,724 |
| | Entercom Communications Corp. Class A | 437,705 | 6,697 |
| * | Global Eagle Entertainment Inc. | 1,034,576 | 6,683 |
| * | Potbelly Corp. | 505,539 | 6,521 |
| * | Bojangles' Inc. | 346,719 | 6,466 |
| * | Sportsman's Warehouse Holdings Inc. | 658,221 | 6,181 |
| * | Intrawest Resorts Holdings Inc. | 339,365 | 6,058 |
| * | Habit Restaurants Inc. Class A | 348,144 | 6,005 |
| * | Overstock.com Inc. | 338,656 | 5,926 |
| * | Rubicon Project Inc. | 790,152 | 5,863 |
| | News Corp. Class B | 496,186 | 5,855 |
| | Winmark Corp. | 45,000 | 5,677 |
| | Citi Trends Inc. | 296,071 | 5,578 |
| * | Monarch Casino & Resort Inc. | 211,116 | 5,443 |
| *,^ | Trupanion Inc. | 349,801 | 5,429 |
| *,^ | Lands' End Inc. | 352,618 | 5,342 |
| *,^ | El Pollo Loco Holdings Inc. | 432,335 | 5,318 |
| | Village Super Market Inc. Class A | 170,813 | 5,278 |
| *,^ | Duluth Holdings Inc. | 204,688 | 5,199 |
| | RCI Hospitality Holdings Inc. | 295,780 | 5,058 |
| * | J Alexander's Holdings Inc. | 466,456 | 5,014 |
| * | Titan Machinery Inc. | 337,978 | 4,924 |
| * | Daily Journal Corp. | 20,306 | 4,910 |
12
| | | |
| Vanguard® Total Stock Market Index Fund | | |
| Schedule of Investments | | |
| December 31, 2016 | | |
| |
| | | | Market |
| | | | Value |
| | | Shares | ($000) |
| | Speedway Motorsports Inc. | 224,949 | 4,875 |
| * | Tuesday Morning Corp. | 899,213 | 4,856 |
| * | Liquidity Services Inc. | 493,955 | 4,816 |
| * | Kirkland's Inc. | 309,634 | 4,802 |
| * | Lindblad Expeditions Holdings Inc. | 502,136 | 4,745 |
| * | Reading International Inc. Class A | 267,133 | 4,434 |
| *,^ | Sears Holdings Corp. | 474,483 | 4,408 |
| * | Care.com Inc. | 492,474 | 4,221 |
| ^ | Natural Health Trends Corp. | 169,273 | 4,206 |
| | CSS Industries Inc. | 152,348 | 4,124 |
| * | Build-A-Bear Workshop Inc. | 290,639 | 3,996 |
| * | Nathan's Famous Inc. | 60,924 | 3,954 |
| * | Ruby Tuesday Inc. | 1,191,510 | 3,849 |
| *,^ | Trade Desk Inc. Class A | 138,197 | 3,824 |
| * | PCM Inc. | 167,129 | 3,760 |
| * | Liberty Media Corp-Liberty Braves Series A | 180,472 | 3,698 |
| * | Ascent Capital Group Inc. Class A | 227,164 | 3,694 |
| * | Bridgepoint Education Inc. | 363,674 | 3,684 |
| | Clear Channel Outdoor Holdings Inc. Class A | 725,923 | 3,666 |
| * | Conn's Inc. | 285,058 | 3,606 |
| * | Boot Barn Holdings Inc. | 287,466 | 3,599 |
| | Saga Communications Inc. Class A | 71,295 | 3,586 |
| * | Tilly's Inc. Class A | 271,103 | 3,576 |
| * | Townsquare Media Inc. Class A | 341,712 | 3,557 |
| * | Avid Technology Inc. | 792,873 | 3,489 |
| * | Lee Enterprises Inc. | 1,110,959 | 3,222 |
| | Stein Mart Inc. | 583,377 | 3,197 |
| * | Century Casinos Inc. | 377,961 | 3,111 |
| * | Destination XL Group Inc. | 699,917 | 2,975 |
| * | At Home Group Inc. | 199,207 | 2,914 |
| | A H Belo Corp. Class A | 444,082 | 2,820 |
| * | West Marine Inc. | 264,561 | 2,770 |
| * | Autobytel Inc. | 198,457 | 2,669 |
| * | TechTarget Inc. | 304,451 | 2,597 |
| | Stage Stores Inc. | 578,358 | 2,527 |
| *,^ | Kona Grill Inc. | 200,313 | 2,514 |
| | Collectors Universe Inc. | 117,187 | 2,488 |
| * | Natural Grocers by Vitamin Cottage Inc. | 206,944 | 2,461 |
| * | Red Lion Hotels Corp. | 280,003 | 2,338 |
| * | Marchex Inc. Class B | 817,652 | 2,167 |
| *,^ | Hemisphere Media Group Inc. Class A | 193,265 | 2,165 |
| * | EVINE Live Inc. | 1,408,823 | 2,113 |
| * | QuinStreet Inc. | 549,349 | 2,066 |
| * | Gaia Inc. Class A | 236,794 | 2,048 |
| *,^ | Container Store Group Inc. | 314,632 | 1,998 |
| | Golden Entertainment Inc. | 162,280 | 1,965 |
| * | RealNetworks Inc. | 386,288 | 1,877 |
| * | Leaf Group Ltd. | 263,028 | 1,723 |
| * | Christopher & Banks Corp. | 697,604 | 1,632 |
| * | Fogo De Chao Inc. | 113,216 | 1,625 |
| | McClatchy Co. Class A | 119,995 | 1,582 |
| * | Travelzoo Inc. | 166,357 | 1,564 |
| * | Radio One Inc. | 538,531 | 1,562 |
| | Wayside Technology Group Inc. | 79,567 | 1,488 |
| * | Luby's Inc. | 335,552 | 1,436 |
| * | YuMe Inc. | 400,538 | 1,434 |
| *,^ | Papa Murphy's Holdings Inc. | 311,582 | 1,315 |
| | Salem Media Group Inc. Class A | 207,043 | 1,294 |
| * | Cambium Learning Group Inc. | 248,408 | 1,240 |
| * | Peak Resorts Inc. | 197,020 | 1,093 |
| * | Town Sports International Holdings Inc. | 404,990 | 1,012 |
| | Destination Maternity Corp. | 185,491 | 959 |
| * | New York & Co. Inc. | 406,347 | 922 |
| ^ | Live Ventures Inc. | 37,251 | 895 |
13
| | | |
| Vanguard® Total Stock Market Index Fund | | |
| Schedule of Investments | | |
| December 31, 2016 | | |
| |
| | | | Market |
| | | | Value |
| | | Shares | ($000) |
| | Liberty Tax Inc. | 64,719 | 867 |
| * | Remark Media Inc. | 219,630 | 861 |
| | Educational Development Corp. | 82,487 | 821 |
| * | Bravo Brio Restaurant Group Inc. | 154,523 | 587 |
| * | Nevada Gold & Casinos Inc. | 312,948 | 579 |
| * | Profire Energy Inc. | 409,919 | 566 |
| *,^ | Good Times Restaurants Inc. | 178,652 | 563 |
| * | Famous Dave's of America Inc. | 108,592 | 538 |
| | Gaming Partners International Corp. | 42,577 | 503 |
| * | Full House Resorts Inc. | 193,494 | 464 |
| *,^ | Digital Turbine Inc. | 625,025 | 422 |
| * | CafePress Inc. | 139,975 | 412 |
| | Emmis Communications Corp. Class A | 123,802 | 406 |
| *,^ | WeCast Network Inc. | 326,461 | 402 |
| | Ark Restaurants Corp. | 15,310 | 371 |
| *,^ | Bon-Ton Stores Inc. | 245,651 | 361 |
| * | TheStreet Inc. | 412,547 | 351 |
| | National American University Holdings Inc. | 175,287 | 342 |
| * | Dover Downs Gaming & Entertainment Inc. | 315,936 | 325 |
| * | Gordmans Stores Inc. | 446,665 | 306 |
| *,^ | hhgregg Inc. | 207,489 | 297 |
| * | Cumulus Media Inc. Class A | 257,942 | 263 |
| * | Spark Networks Inc. | 283,674 | 238 |
| * | Rave Restaurant Group Inc. | 123,069 | 231 |
| * | MaxPoint Interactive Inc. | 38,149 | 229 |
| * | Insignia Systems Inc. | 95,048 | 227 |
| * | Diversified Restaurant Holdings Inc. | 152,142 | 213 |
| | Value Line Inc. | 9,438 | 184 |
| * | Spanish Broadcasting System Inc. | 51,540 | 157 |
| | Flanigan's Enterprises Inc. | 5,174 | 128 |
| ^ | bebe stores inc | 23,971 | 122 |
| * | VistaGen Therapeutics Inc. | 30,687 | 114 |
| * | Rush Enterprises Inc. Class B | 2,967 | 92 |
| *,^ | Noodles & Co. Class A | 20,188 | 83 |
| *,^ | FunctionX Inc. | 15,119 | 37 |
| *,^ | Net Element Inc. | 46,142 | 36 |
| * | NTN Buzztime Inc. | 3,841 | 33 |
| | Haverty Furniture Cos. Inc. Class A | 1,375 | 32 |
| * | SPAR Group Inc. | 19,446 | 19 |
| | Viacom Inc. Class A | 300 | 12 |
| * | Universal Travel Group | 42,843 | 7 |
| * | ONE Group Hospitality Inc. | 2,677 | 6 |
| * | Radio One Inc. Class A | 950 | 3 |
| | | | 64,671,428 |
| Financials (20.6%) | | |
| | JPMorgan Chase & Co. | 75,817,317 | 6,542,276 |
| * | Berkshire Hathaway Inc. Class B | 39,400,223 | 6,421,448 |
| | Wells Fargo & Co. | 95,774,705 | 5,278,144 |
| | Bank of America Corp. | 214,199,154 | 4,733,801 |
| | Citigroup Inc. | 60,190,801 | 3,577,139 |
| | Visa Inc. Class A | 39,581,531 | 3,088,151 |
| | Mastercard Inc. Class A | 20,405,276 | 2,106,845 |
| | Goldman Sachs Group Inc. | 7,584,395 | 1,816,083 |
| | US Bancorp | 34,462,772 | 1,770,353 |
| | American International Group Inc. | 21,679,713 | 1,415,902 |
| | Morgan Stanley | 29,800,018 | 1,259,051 |
| | Chubb Ltd. | 9,355,851 | 1,236,095 |
| | American Express Co. | 16,496,910 | 1,222,091 |
| | PNC Financial Services Group Inc. | 10,378,104 | 1,213,823 |
| | Simon Property Group Inc. | 6,656,048 | 1,182,580 |
| | Bank of New York Mellon Corp. | 21,324,482 | 1,010,354 |
| | MetLife Inc. | 18,617,438 | 1,003,294 |
| | Charles Schwab Corp. | 25,193,362 | 994,382 |
| | American Tower Corporation | 9,018,762 | 953,103 |
14
| | |
| Vanguard® Total Stock Market Index Fund | | |
| Schedule of Investments | | |
| December 31, 2016 | | |
| |
| | | Market |
| | | Value |
| | Shares | ($000) |
| Prudential Financial Inc. | 9,116,711 | 948,685 |
| Capital One Financial Corp. | 10,278,751 | 896,718 |
| BlackRock Inc. | 2,239,398 | 852,181 |
| BB&T Corp. | 17,285,295 | 812,755 |
| CME Group Inc. | 6,816,896 | 786,329 |
| Marsh & McLennan Cos. Inc. | 10,957,611 | 740,625 |
| Travelers Cos. Inc. | 6,025,524 | 737,645 |
| Intercontinental Exchange Inc. | 12,564,326 | 708,879 |
| Public Storage | 3,121,279 | 697,606 |
| Crown Castle International Corp. | 7,632,563 | 662,278 |
| Synchrony Financial | 17,329,956 | 628,558 |
| Aon plc | 5,591,582 | 623,629 |
| Discover Financial Services | 8,416,813 | 606,768 |
| Aflac Inc. | 8,673,858 | 603,701 |
| S&P Global Inc. | 5,495,954 | 591,035 |
| Prologis Inc. | 11,113,911 | 586,703 |
| SunTrust Banks Inc. | 10,524,918 | 577,292 |
| Allstate Corp. | 7,785,156 | 577,036 |
| State Street Corp. | 7,376,312 | 573,287 |
| Equinix Inc. | 1,509,476 | 539,502 |
| AvalonBay Communities Inc. | 2,908,334 | 515,211 |
| Welltower Inc. | 7,660,677 | 512,729 |
| Equity Residential | 7,741,298 | 498,230 |
| Weyerhaeuser Co. | 15,845,479 | 476,790 |
| M&T Bank Corp. | 2,998,952 | 469,126 |
| Ventas Inc. | 7,489,759 | 468,260 |
| Fifth Third Bancorp | 16,242,180 | 438,052 |
| Progressive Corp. | 12,330,185 | 437,722 |
| KeyCorp | 22,912,617 | 418,614 |
| Boston Properties Inc. | 3,252,809 | 409,138 |
| Northern Trust Corp. | 4,556,504 | 405,757 |
| Citizens Financial Group Inc. | 11,024,777 | 392,813 |
| Hartford Financial Services Group Inc. | 8,036,329 | 382,931 |
| Regions Financial Corp. | 26,562,688 | 381,440 |
| Vornado Realty Trust | 3,596,184 | 375,334 |
| Ameriprise Financial Inc. | 3,363,873 | 373,188 |
| T. Rowe Price Group Inc. | 4,934,268 | 371,353 |
| Principal Financial Group Inc. | 6,085,772 | 352,123 |
| Willis Towers Watson plc | 2,761,751 | 337,707 |
| Digital Realty Trust Inc. | 3,362,352 | 330,385 |
| General Growth Properties Inc. | 13,089,029 | 326,964 |
| Moody's Corp. | 3,462,359 | 326,397 |
| Lincoln National Corp. | 4,870,841 | 322,791 |
| Essex Property Trust Inc. | 1,385,297 | 322,082 |
| Realty Income Corp. | 5,463,848 | 314,062 |
| Huntington Bancshares Inc. | 22,990,586 | 303,936 |
| Equifax Inc. | 2,528,490 | 298,943 |
| First Republic Bank | 3,214,610 | 296,194 |
| Host Hotels & Resorts Inc. | 15,711,362 | 296,002 |
| HCP Inc. | 9,895,628 | 294,098 |
| Franklin Resources Inc. | 7,278,410 | 288,079 |
| Loews Corp. | 6,109,144 | 286,091 |
| * IHS Markit Ltd. | 7,590,070 | 268,764 |
| Invesco Ltd. | 8,687,070 | 263,566 |
| * Markel Corp. | 282,185 | 255,236 |
| * Liberty Broadband Corp. | 3,409,884 | 252,570 |
| Cincinnati Financial Corp. | 3,323,962 | 251,790 |
| Comerica Inc. | 3,685,293 | 251,005 |
| * Berkshire Hathaway Inc. Class A | 978 | 238,750 |
| Mid-America Apartment Communities Inc. | 2,404,377 | 235,437 |
| SL Green Realty Corp. | 2,136,310 | 229,760 |
| Western Union Co. | 10,305,783 | 223,842 |
| TD Ameritrade Holding Corp. | 5,014,979 | 218,653 |
| Unum Group | 4,965,894 | 218,152 |
15
| | |
| Vanguard® Total Stock Market Index Fund | | |
| Schedule of Investments | | |
| December 31, 2016 | | |
| |
| | | Market |
| | | Value |
| | Shares | ($000) |
| XL Group Ltd. | 5,764,145 | 214,772 |
| Federal Realty Investment Trust | 1,508,967 | 214,439 |
| * Arch Capital Group Ltd. | 2,479,668 | 213,971 |
| Kimco Realty Corp. | 8,475,054 | 213,232 |
| Annaly Capital Management Inc. | 21,350,573 | 212,865 |
| UDR Inc. | 5,644,811 | 205,923 |
| Macerich Co. | 2,884,863 | 204,364 |
| * E*TRADE Financial Corp. | 5,792,329 | 200,704 |
| Duke Realty Corp. | 7,472,104 | 198,459 |
| * CBRE Group Inc. Class A | 6,232,611 | 196,265 |
| Extra Space Storage Inc. | 2,527,298 | 195,209 |
| Arthur J Gallagher & Co. | 3,753,786 | 195,047 |
| * Alleghany Corp. | 312,889 | 190,274 |
| * SVB Financial Group | 1,102,853 | 189,316 |
| Raymond James Financial Inc. | 2,703,631 | 187,281 |
| FNF Group | 5,513,907 | 187,252 |
| Zions Bancorporation | 4,349,908 | 187,220 |
| Alexandria Real Estate Equities Inc. | 1,671,343 | 185,736 |
| CIT Group Inc. | 4,303,836 | 183,688 |
| Ally Financial Inc. | 9,614,451 | 182,867 |
| Torchmark Corp. | 2,420,000 | 178,499 |
| VEREIT Inc. | 20,675,209 | 174,912 |
| Iron Mountain Inc. | 5,298,889 | 172,108 |
| Reinsurance Group of America Inc. Class A | 1,354,362 | 170,419 |
| * Affiliated Managers Group Inc. | 1,150,749 | 167,204 |
| Nasdaq Inc. | 2,468,419 | 165,680 |
| Voya Financial Inc. | 4,194,113 | 164,493 |
| * Signature Bank | 1,076,143 | 161,637 |
| Brixmor Property Group Inc. | 6,432,725 | 157,087 |
| New York Community Bancorp Inc. | 9,812,915 | 156,123 |
| East West Bancorp Inc. | 3,065,924 | 155,841 |
| Camden Property Trust | 1,848,812 | 155,430 |
| MSCI Inc. Class A | 1,966,555 | 154,925 |
| SEI Investments Co. | 3,079,911 | 152,024 |
| Regency Centers Corp. | 2,204,263 | 151,984 |
| Apartment Investment & Management Co. | 3,306,103 | 150,262 |
| Everest Re Group Ltd. | 693,123 | 149,992 |
| Kilroy Realty Corp. | 1,945,593 | 142,456 |
| American Campus Communities Inc. | 2,805,453 | 139,627 |
| National Retail Properties Inc. | 3,103,353 | 137,168 |
| PacWest Bancorp | 2,441,829 | 132,933 |
| WP Carey Inc. | 2,241,092 | 132,426 |
| American Financial Group Inc. | 1,486,340 | 130,976 |
| WR Berkley Corp. | 1,968,813 | 130,946 |
| Bank of the Ozarks Inc. | 2,437,090 | 128,167 |
| People's United Financial Inc. | 6,590,671 | 127,595 |
| ^ Omega Healthcare Investors Inc. | 4,079,863 | 127,537 |
| CBOE Holdings Inc. | 1,724,903 | 127,453 |
| AGNC Investment Corp. | 7,004,599 | 126,993 |
| Axis Capital Holdings Ltd. | 1,937,338 | 126,450 |
| Gaming and Leisure Properties Inc. | 4,120,617 | 126,173 |
| Endurance Specialty Holdings Ltd. | 1,357,657 | 125,448 |
| Liberty Property Trust | 3,098,068 | 122,374 |
| Starwood Property Trust Inc. | 5,422,381 | 119,021 |
| Lamar Advertising Co. Class A | 1,751,046 | 117,740 |
| Equity LifeStyle Properties Inc. | 1,624,092 | 117,097 |
| RenaissanceRe Holdings Ltd. | 845,038 | 115,111 |
| Assurant Inc. | 1,235,076 | 114,689 |
| Lazard Ltd. Class A | 2,755,291 | 113,215 |
| Spirit Realty Capital Inc. | 10,302,864 | 111,889 |
| MarketAxess Holdings Inc. | 759,279 | 111,553 |
| Douglas Emmett Inc. | 3,027,595 | 110,689 |
| Hospitality Properties Trust | 3,429,298 | 108,846 |
| Commerce Bancshares Inc. | 1,861,355 | 107,605 |
16
| | | |
| Vanguard® Total Stock Market Index Fund | | |
| Schedule of Investments | | |
| December 31, 2016 | | |
| |
| | | | Market |
| | | | Value |
| | | Shares | ($000) |
| | Navient Corp. | 6,510,028 | 106,960 |
| | Forest City Realty Trust Inc. Class A | 5,102,916 | 106,345 |
| | Assured Guaranty Ltd. | 2,815,097 | 106,326 |
| | Sun Communities Inc. | 1,386,873 | 106,248 |
| | Brown & Brown Inc. | 2,366,545 | 106,163 |
| | Webster Financial Corp. | 1,941,202 | 105,368 |
| | Highwoods Properties Inc. | 2,065,130 | 105,342 |
| | Cullen/Frost Bankers Inc. | 1,188,149 | 104,830 |
| | Synovus Financial Corp. | 2,509,739 | 103,100 |
| | CubeSmart | 3,790,805 | 101,480 |
| | Prosperity Bancshares Inc. | 1,403,121 | 100,716 |
| | Old Republic International Corp. | 5,283,948 | 100,395 |
| | DDR Corp. | 6,550,369 | 100,024 |
| | First Horizon National Corp. | 4,895,563 | 97,960 |
| * | Western Alliance Bancorp | 2,006,918 | 97,757 |
| | Jones Lang LaSalle Inc. | 954,905 | 96,484 |
| | EPR Properties | 1,342,326 | 96,339 |
| | Popular Inc. | 2,198,438 | 96,336 |
| | Senior Housing Properties Trust | 5,030,324 | 95,224 |
| | Eaton Vance Corp. | 2,268,681 | 95,012 |
| | American Homes 4 Rent Class A | 4,528,080 | 94,999 |
| | Allied World Assurance Co. Holdings AG | 1,768,050 | 94,962 |
| | Investors Bancorp Inc. | 6,729,267 | 93,873 |
| | Weingarten Realty Investors | 2,547,494 | 91,175 |
| | Hudson Pacific Properties Inc. | 2,598,293 | 90,369 |
| | DCT Industrial Trust Inc. | 1,886,569 | 90,329 |
| | Taubman Centers Inc. | 1,212,463 | 89,637 |
| | Validus Holdings Ltd. | 1,616,656 | 88,932 |
| | Umpqua Holdings Corp. | 4,693,862 | 88,151 |
| | Healthcare Trust of America Inc. Class A | 3,011,039 | 87,651 |
| | PrivateBancorp Inc. | 1,600,204 | 86,715 |
| * | Howard Hughes Corp. | 756,330 | 86,297 |
| | First American Financial Corp. | 2,330,728 | 85,375 |
| | Apple Hospitality REIT Inc. | 4,265,804 | 85,231 |
| | Life Storage Inc. | 979,369 | 83,501 |
| | Medical Properties Trust Inc. | 6,785,642 | 83,463 |
| | New Residential Investment Corp. | 5,288,026 | 83,128 |
| | BankUnited Inc. | 2,199,383 | 82,895 |
| | Hanover Insurance Group Inc. | 906,533 | 82,504 |
| | STORE Capital Corp. | 3,323,730 | 82,129 |
| | Gramercy Property Trust | 8,920,994 | 81,895 |
| | Bank of Hawaii Corp. | 922,572 | 81,823 |
| | Radian Group Inc. | 4,531,494 | 81,476 |
| * | Texas Capital Bancshares Inc. | 1,036,685 | 81,276 |
| | Wintrust Financial Corp. | 1,112,200 | 80,712 |
| | Communications Sales & Leasing Inc. | 3,172,033 | 80,601 |
| * | Equity Commonwealth | 2,660,044 | 80,440 |
| | Realogy Holdings Corp. | 3,100,275 | 79,770 |
| *,^ | Zillow Group Inc. | 2,167,952 | 79,065 |
| | Associated Banc-Corp | 3,198,271 | 78,997 |
| | IBERIABANK Corp. | 934,861 | 78,295 |
| | Chemical Financial Corp. | 1,421,403 | 76,997 |
| | Retail Properties of America Inc. | 4,997,683 | 76,615 |
| | Hancock Holding Co. | 1,749,115 | 75,387 |
| | United Bankshares Inc. | 1,625,602 | 75,184 |
| | CyrusOne Inc. | 1,675,018 | 74,924 |
| | Healthcare Realty Trust Inc. | 2,464,178 | 74,714 |
| * | MGIC Investment Corp. | 7,173,794 | 73,101 |
| | MB Financial Inc. | 1,539,211 | 72,697 |
| | Outfront Media Inc. | 2,911,652 | 72,413 |
| | LaSalle Hotel Properties | 2,375,433 | 72,379 |
| | Tanger Factory Outlet Centers Inc. | 2,004,647 | 71,726 |
| | FNB Corp. | 4,457,193 | 71,449 |
| | CNO Financial Group Inc. | 3,723,420 | 71,304 |
17
| | |
| Vanguard® Total Stock Market Index Fund | | |
| Schedule of Investments | | |
| December 31, 2016 | | |
| |
| | | Market |
| | | Value |
| | Shares | ($000) |
| Home BancShares Inc. | 2,531,577 | 70,302 |
| DuPont Fabros Technology Inc. | 1,599,471 | 70,265 |
| Aspen Insurance Holdings Ltd. | 1,272,833 | 70,006 |
| Fulton Financial Corp. | 3,704,742 | 69,649 |
| Sunstone Hotel Investors Inc. | 4,565,392 | 69,622 |
| UMB Financial Corp. | 901,487 | 69,523 |
| Rayonier Inc. | 2,599,394 | 69,144 |
| First Industrial Realty Trust Inc. | 2,442,151 | 68,502 |
| Primerica Inc. | 980,236 | 67,783 |
| * Stifel Financial Corp. | 1,339,576 | 66,912 |
| White Mountains Insurance Group Ltd. | 79,595 | 66,545 |
| Education Realty Trust Inc. | 1,543,697 | 65,298 |
| Washington Federal Inc. | 1,899,321 | 65,242 |
| Two Harbors Investment Corp. | 7,448,470 | 64,951 |
| Pinnacle Financial Partners Inc. | 933,173 | 64,669 |
| Empire State Realty Trust Inc. | 3,200,192 | 64,612 |
| Chimera Investment Corp. | 3,795,811 | 64,605 |
| Cousins Properties Inc. | 7,579,510 | 64,502 |
| TCF Financial Corp. | 3,290,159 | 64,454 |
| ProAssurance Corp. | 1,139,819 | 64,058 |
| Piedmont Office Realty Trust Inc. Class A | 3,042,020 | 63,609 |
| * Liberty Ventures Class A | 1,710,988 | 63,084 |
| Corporate Office Properties Trust | 1,987,246 | 62,042 |
| Sterling Bancorp | 2,627,083 | 61,474 |
| RLJ Lodging Trust | 2,502,371 | 61,283 |
| ^ First Financial Bankshares Inc. | 1,351,627 | 61,094 |
| * CoreCivic Inc. | 2,485,721 | 60,801 |
| Cathay General Bancorp | 1,597,911 | 60,769 |
| National Health Investors Inc. | 814,458 | 60,408 |
| Equity One Inc. | 1,966,999 | 60,367 |
| Brandywine Realty Trust | 3,653,520 | 60,320 |
| MFA Financial Inc. | 7,889,767 | 60,199 |
| LPL Financial Holdings Inc. | 1,699,327 | 59,833 |
| Hope Bancorp Inc. | 2,722,835 | 59,603 |
| Valley National Bancorp | 5,096,865 | 59,328 |
| Legg Mason Inc. | 1,972,728 | 59,004 |
| Erie Indemnity Co. Class A | 521,959 | 58,694 |
| First Citizens BancShares Inc. Class A | 165,216 | 58,652 |
| Paramount Group Inc. | 3,646,265 | 58,304 |
| Glacier Bancorp Inc. | 1,606,358 | 58,198 |
| NorthStar Realty Finance Corp. | 3,813,308 | 57,772 |
| Ryman Hospitality Properties Inc. | 914,326 | 57,612 |
| Urban Edge Properties | 2,081,071 | 57,250 |
| Blackstone Mortgage Trust Inc. Class A | 1,896,074 | 57,015 |
| GEO Group Inc. | 1,585,661 | 56,973 |
| CoreSite Realty Corp. | 715,574 | 56,795 |
| Columbia Property Trust Inc. | 2,627,869 | 56,762 |
| NorthStar Asset Management Group Inc. | 3,803,909 | 56,754 |
| Community Bank System Inc. | 910,114 | 56,236 |
| BancorpSouth Inc. | 1,807,495 | 56,123 |
| * SLM Corp. | 5,066,801 | 55,836 |
| Columbia Banking System Inc. | 1,248,772 | 55,795 |
| RLI Corp. | 881,587 | 55,655 |
| Federated Investors Inc. Class B | 1,949,831 | 55,141 |
| Physicians Realty Trust | 2,883,125 | 54,664 |
| Acadia Realty Trust | 1,663,247 | 54,355 |
| Great Western Bancorp Inc. | 1,239,899 | 54,047 |
| Selective Insurance Group Inc. | 1,219,700 | 52,508 |
| Old National Bancorp | 2,850,083 | 51,729 |
| Washington REIT | 1,516,565 | 49,577 |
| CVB Financial Corp. | 2,153,929 | 49,390 |
| Interactive Brokers Group Inc. | 1,345,328 | 49,118 |
| Mack-Cali Realty Corp. | 1,682,898 | 48,838 |
| DiamondRock Hospitality Co. | 4,228,041 | 48,749 |
18
| | | |
| Vanguard® Total Stock Market Index Fund | | |
| Schedule of Investments | | |
| December 31, 2016 | | |
| |
| | | | Market |
| | | | Value |
| | | Shares | ($000) |
| | International Bancshares Corp. | 1,191,695 | 48,621 |
| | Evercore Partners Inc. Class A | 699,068 | 48,026 |
| * | Essent Group Ltd. | 1,481,892 | 47,969 |
| | EastGroup Properties Inc. | 648,358 | 47,875 |
| | Trustmark Corp. | 1,337,499 | 47,682 |
| | Retail Opportunity Investments Corp. | 2,255,244 | 47,653 |
| | AmTrust Financial Services Inc. | 1,734,576 | 47,493 |
| | Hilltop Holdings Inc. | 1,585,042 | 47,234 |
| | PS Business Parks Inc. | 402,652 | 46,917 |
| | FirstCash Inc. | 987,423 | 46,409 |
| | Colony Capital Inc. Class A | 2,275,947 | 46,088 |
| | Colony Starwood Homes | 1,596,631 | 45,999 |
| | Xenia Hotels & Resorts Inc. | 2,333,511 | 45,317 |
| | Pebblebrook Hotel Trust | 1,514,535 | 45,057 |
| * | Blackhawk Network Holdings Inc. | 1,193,895 | 44,980 |
| | American National Insurance Co. | 359,542 | 44,803 |
| | BGC Partners Inc. Class A | 4,341,583 | 44,414 |
| | Care Capital Properties Inc. | 1,772,434 | 44,311 |
| | Lexington Realty Trust | 4,093,792 | 44,213 |
| | EverBank Financial Corp. | 2,255,702 | 43,873 |
| | Alexander & Baldwin Inc. | 976,406 | 43,811 |
| | South State Corp. | 497,284 | 43,463 |
| | Capitol Federal Financial Inc. | 2,618,611 | 43,102 |
| | First Midwest Bancorp Inc. | 1,677,305 | 42,318 |
| | QTS Realty Trust Inc. Class A | 837,411 | 41,577 |
| | CBL & Associates Properties Inc. | 3,608,162 | 41,494 |
| | Kite Realty Group Trust | 1,756,035 | 41,232 |
| | Janus Capital Group Inc. | 3,103,874 | 41,188 |
| | LTC Properties Inc. | 872,212 | 40,977 |
| | Financial Engines Inc. | 1,114,547 | 40,960 |
| * | Enstar Group Ltd. | 206,401 | 40,805 |
| | Washington Prime Group Inc. | 3,908,445 | 40,687 |
| * | Genworth Financial Inc. Class A | 10,551,547 | 40,201 |
| * | HealthEquity Inc. | 989,216 | 40,083 |
| | Argo Group International Holdings Ltd. | 607,558 | 40,038 |
| * | Eagle Bancorp Inc. | 655,010 | 39,923 |
| * | LendingClub Corp. | 7,561,599 | 39,698 |
| | United Community Banks Inc. | 1,338,554 | 39,648 |
| | American Equity Investment Life Holding Co. | 1,758,309 | 39,632 |
| *,^ | Zillow Group Inc. Class A | 1,081,448 | 39,419 |
| | STAG Industrial Inc. | 1,641,592 | 39,185 |
| | Towne Bank | 1,165,741 | 38,761 |
| | WesBanco Inc. | 892,158 | 38,416 |
| | Kennedy-Wilson Holdings Inc. | 1,863,911 | 38,210 |
| *,^ | Credit Acceptance Corp. | 174,642 | 37,986 |
| | Monogram Residential Trust Inc. | 3,502,213 | 37,894 |
| | Independent Bank Corp. | 533,954 | 37,617 |
| | Potlatch Corp. | 893,389 | 37,210 |
| | Northwest Bancshares Inc. | 2,054,664 | 37,046 |
| | NBT Bancorp Inc. | 880,497 | 36,875 |
| | LegacyTexas Financial Group Inc. | 854,609 | 36,799 |
| | Banner Corp. | 657,364 | 36,688 |
| * | PRA Group Inc. | 936,002 | 36,598 |
| * | HRG Group Inc. | 2,329,944 | 36,254 |
| | Kemper Corp. | 815,521 | 36,128 |
| | BOK Financial Corp. | 434,563 | 36,086 |
| * | FCB Financial Holdings Inc. Class A | 753,470 | 35,941 |
| | Mercury General Corp. | 593,285 | 35,722 |
| | Horace Mann Educators Corp. | 834,415 | 35,713 |
| | Simmons First National Corp. Class A | 573,302 | 35,631 |
| | Astoria Financial Corp. | 1,910,304 | 35,627 |
| | New York REIT Inc. | 3,507,569 | 35,497 |
| | Renasant Corp. | 837,567 | 35,362 |
| | ServisFirst Bancshares Inc. | 941,372 | 35,245 |
19
| | | |
| Vanguard® Total Stock Market Index Fund | | |
| Schedule of Investments | | |
| December 31, 2016 | | |
| |
| | | | Market |
| | | | Value |
| | | Shares | ($000) |
| | First Financial Bancorp | 1,238,460 | 35,234 |
| | American Assets Trust Inc. | 817,344 | 35,211 |
| *,^ | BofI Holding Inc. | 1,206,759 | 34,453 |
| | Invesco Mortgage Capital Inc. | 2,322,774 | 33,913 |
| | Yadkin Financial Corp. | 986,367 | 33,793 |
| | Rexford Industrial Realty Inc. | 1,439,068 | 33,372 |
| | First Merchants Corp. | 883,833 | 33,276 |
| | Park National Corp. | 275,743 | 32,995 |
| | Union Bankshares Corp. | 922,899 | 32,984 |
| ^ | Westamerica Bancorporation | 523,424 | 32,939 |
| | Provident Financial Services Inc. | 1,159,292 | 32,808 |
| | Chesapeake Lodging Trust | 1,261,885 | 32,632 |
| | Waddell & Reed Financial Inc. Class A | 1,669,501 | 32,572 |
| | Select Income REIT | 1,292,410 | 32,569 |
| | Apollo Commercial Real Estate Finance Inc. | 1,932,795 | 32,123 |
| | Sabra Health Care REIT Inc. | 1,307,304 | 31,924 |
| * | Santander Consumer USA Holdings Inc. | 2,320,243 | 31,323 |
| | Franklin Street Properties Corp. | 2,392,264 | 31,004 |
| | Ameris Bancorp | 704,638 | 30,722 |
| * | Quality Care Properties Inc. | 1,971,019 | 30,551 |
| | Navigators Group Inc. | 258,649 | 30,456 |
| | S&T Bancorp Inc. | 776,573 | 30,317 |
| | BNC Bancorp | 949,698 | 30,295 |
| | Summit Hotel Properties Inc. | 1,860,443 | 29,823 |
| | Beneficial Bancorp Inc. | 1,615,375 | 29,723 |
| | WSFS Financial Corp. | 635,392 | 29,450 |
| * | MBIA Inc. | 2,743,552 | 29,356 |
| ^ | Government Properties Income Trust | 1,498,895 | 28,576 |
| | Four Corners Property Trust Inc. | 1,390,269 | 28,528 |
| | Terreno Realty Corp. | 974,606 | 27,767 |
| | Tompkins Financial Corp. | 293,413 | 27,739 |
| ^ | WisdomTree Investments Inc. | 2,484,407 | 27,676 |
| | Kearny Financial Corp. | 1,775,573 | 27,610 |
| | Global Net Lease Inc. | 3,516,130 | 27,531 |
| | Ramco-Gershenson Properties Trust | 1,609,349 | 26,683 |
| | Boston Private Financial Holdings Inc. | 1,606,113 | 26,581 |
| | National General Holdings Corp. | 1,056,720 | 26,407 |
| | Pennsylvania REIT | 1,387,360 | 26,304 |
| | Agree Realty Corp. | 563,789 | 25,963 |
| | First Commonwealth Financial Corp. | 1,813,455 | 25,715 |
| * | OneMain Holdings Inc. Class A | 1,158,164 | 25,642 |
| | Employers Holdings Inc. | 645,234 | 25,551 |
| | Redwood Trust Inc. | 1,669,300 | 25,390 |
| | Artisan Partners Asset Management Inc. Class A | 843,154 | 25,084 |
| | Lakeland Financial Corp. | 526,041 | 24,913 |
| | TFS Financial Corp. | 1,278,899 | 24,350 |
| | CenterState Banks Inc. | 963,522 | 24,252 |
| | CYS Investments Inc. | 3,136,594 | 24,246 |
| | Athene Holding Ltd. Class A | 503,641 | 24,170 |
| | Heartland Financial USA Inc. | 503,511 | 24,169 |
| | Nelnet Inc. Class A | 473,661 | 24,038 |
| | AMERISAFE Inc. | 382,128 | 23,826 |
| | Berkshire Hills Bancorp Inc. | 624,526 | 23,014 |
| | PennyMac Mortgage Investment Trust | 1,403,002 | 22,967 |
| �� | Hanmi Financial Corp. | 649,449 | 22,666 |
| | HFF Inc. Class A | 748,642 | 22,646 |
| | Maiden Holdings Ltd. | 1,295,164 | 22,601 |
| * | St. Joe Co. | 1,186,174 | 22,537 |
| | Brookline Bancorp Inc. | 1,369,649 | 22,462 |
| | FelCor Lodging Trust Inc. | 2,766,343 | 22,158 |
| | Safety Insurance Group Inc. | 300,304 | 22,132 |
| * | Piper Jaffray Cos. | 299,393 | 21,706 |
| | City Holding Co. | 319,938 | 21,628 |
| | First Busey Corp. | 695,457 | 21,406 |
20
| | | |
| Vanguard® Total Stock Market Index Fund | | |
| Schedule of Investments | | |
| December 31, 2016 | | |
| |
| | | | Market |
| | | | Value |
| | | Shares | ($000) |
| | Southside Bancshares Inc. | 565,523 | 21,303 |
| | Cardinal Financial Corp. | 647,827 | 21,242 |
| | Monmouth Real Estate Investment Corp. | 1,389,534 | 21,177 |
| | Capstead Mortgage Corp. | 2,063,410 | 21,026 |
| ^ | Investors Real Estate Trust | 2,935,909 | 20,933 |
| * | Green Dot Corp. Class A | 886,661 | 20,881 |
| * | Pacific Premier Bancorp Inc. | 587,400 | 20,765 |
| | Stewart Information Services Corp. | 446,457 | 20,573 |
| | NRG Yield Inc. | 1,300,071 | 20,541 |
| | CareTrust REIT Inc. | 1,338,727 | 20,509 |
| | Universal Insurance Holdings Inc. | 714,724 | 20,298 |
| | Universal Health Realty Income Trust | 307,776 | 20,187 |
| | State Bank Financial Corp. | 748,638 | 20,108 |
| * | Customers Bancorp Inc. | 560,777 | 20,087 |
| | Capital Bank Financial Corp. | 509,492 | 19,998 |
| | Lakeland Bancorp Inc. | 1,020,457 | 19,899 |
| * | iStar Inc. | 1,602,586 | 19,824 |
| * | FNFV Group | 1,444,386 | 19,788 |
| | United Fire Group Inc. | 401,460 | 19,740 |
| | RE/MAX Holdings Inc. Class A | 351,466 | 19,682 |
| | Sandy Spring Bancorp Inc. | 491,196 | 19,643 |
| | National Storage Affiliates Trust | 888,327 | 19,605 |
| | National Bank Holdings Corp. Class A | 612,415 | 19,530 |
| | Ladder Capital Corp. Class A | 1,423,322 | 19,528 |
| | Central Pacific Financial Corp. | 619,365 | 19,460 |
| ^ | Seritage Growth Properties Class A | 454,638 | 19,418 |
| * | Parkway Inc. | 869,817 | 19,353 |
| *,^ | Black Knight Financial Services Inc. Class A | 509,062 | 19,243 |
| | Saul Centers Inc. | 288,358 | 19,208 |
| | Meridian Bancorp Inc. | 1,010,639 | 19,101 |
| | New Senior Investment Group Inc. | 1,942,629 | 19,018 |
| | Infinity Property & Casualty Corp. | 213,774 | 18,791 |
| | Stock Yards Bancorp Inc. | 399,712 | 18,766 |
| | Alexander's Inc. | 43,464 | 18,553 |
| | Northfield Bancorp Inc. | 927,459 | 18,521 |
| * | First BanCorp (NYSE) | 2,759,476 | 18,240 |
| | Hersha Hospitality Trust Class A | 846,496 | 18,200 |
| * | Walker & Dunlop Inc. | 579,314 | 18,075 |
| | Getty Realty Corp. | 707,451 | 18,033 |
| | First Interstate BancSystem Inc. Class A | 420,595 | 17,896 |
| | Hannon Armstrong Sustainable Infrastructure Capital Inc. | 935,183 | 17,759 |
| | Banc of California Inc. | 1,013,674 | 17,587 |
| | MainSource Financial Group Inc. | 510,368 | 17,557 |
| | United Financial Bancorp Inc. | 961,781 | 17,466 |
| | OceanFirst Financial Corp. | 577,307 | 17,337 |
| | ARMOUR Residential REIT Inc. | 794,527 | 17,233 |
| | Tier REIT Inc. | 985,798 | 17,143 |
| | Meta Financial Group Inc. | 165,530 | 17,033 |
| | Easterly Government Properties Inc. | 846,020 | 16,937 |
| * | KCG Holdings Inc. Class A | 1,274,173 | 16,883 |
| | ConnectOne Bancorp Inc. | 637,291 | 16,538 |
| | FBL Financial Group Inc. Class A | 210,390 | 16,442 |
| | Enterprise Financial Services Corp. | 379,092 | 16,301 |
| | Flushing Financial Corp. | 552,497 | 16,238 |
| | New York Mortgage Trust Inc. | 2,458,382 | 16,225 |
| | TrustCo Bank Corp. NY | 1,834,198 | 16,049 |
| | First Hawaiian Inc. | 457,360 | 15,925 |
| | Community Trust Bancorp Inc. | 320,664 | 15,905 |
| | Washington Trust Bancorp Inc. | 281,064 | 15,754 |
| | Chatham Lodging Trust | 755,302 | 15,521 |
| | Univest Corp. of Pennsylvania | 499,787 | 15,443 |
| | BancFirst Corp. | 164,324 | 15,290 |
| * | HomeStreet Inc. | 482,000 | 15,231 |
| | Virtus Investment Partners Inc. | 128,366 | 15,154 |
21
| | | |
| Vanguard® Total Stock Market Index Fund | | |
| Schedule of Investments | | |
| December 31, 2016 | | |
| |
| | | | Market |
| | | | Value |
| | | Shares | ($000) |
| *,^ | LendingTree Inc. | 148,953 | 15,096 |
| | Heritage Financial Corp. | 580,664 | 14,952 |
| | Oritani Financial Corp. | 797,224 | 14,948 |
| * | MTGE Investment Corp. | 944,349 | 14,826 |
| | James River Group Holdings Ltd. | 356,811 | 14,826 |
| | National Western Life Group Inc. Class A | 47,243 | 14,683 |
| | Greenhill & Co. Inc. | 526,254 | 14,577 |
| | Cohen & Steers Inc. | 432,586 | 14,535 |
| * | Third Point Reinsurance Ltd. | 1,253,447 | 14,477 |
| * | Liberty Broadband Corp. Class A | 199,415 | 14,450 |
| | Independent Bank Group Inc. | 231,350 | 14,436 |
| | TriCo Bancshares | 419,606 | 14,342 |
| | Camden National Corp. | 321,360 | 14,284 |
| | Horizon Bancorp | 507,428 | 14,208 |
| | CoBiz Financial Inc. | 836,620 | 14,131 |
| * | Greenlight Capital Re Ltd. Class A | 616,392 | 14,054 |
| | Independence Realty Trust Inc. | 1,558,727 | 13,904 |
| | Moelis & Co. Class A | 410,032 | 13,900 |
| | Bryn Mawr Bank Corp. | 329,033 | 13,869 |
| | Ashford Hospitality Trust Inc. | 1,771,741 | 13,749 |
| *,^ | Encore Capital Group Inc. | 479,557 | 13,739 |
| | Armada Hoffler Properties Inc. | 932,372 | 13,585 |
| | Mercantile Bank Corp. | 348,954 | 13,156 |
| | Urstadt Biddle Properties Inc. Class A | 543,677 | 13,108 |
| | Investment Technology Group Inc. | 658,215 | 12,993 |
| | Bridge Bancorp Inc. | 341,532 | 12,944 |
| | Preferred Bank | 245,689 | 12,879 |
| | Heritage Commerce Corp. | 891,202 | 12,860 |
| | First of Long Island Corp. | 446,737 | 12,754 |
| | InfraREIT Inc. | 711,885 | 12,750 |
| | Diamond Hill Investment Group Inc. | 60,602 | 12,749 |
| * | Seacoast Banking Corp. of Florida | 572,144 | 12,622 |
| | German American Bancorp Inc. | 237,874 | 12,515 |
| | First Potomac Realty Trust | 1,139,741 | 12,503 |
| | Great Southern Bancorp Inc. | 227,200 | 12,416 |
| * | NMI Holdings Inc. Class A | 1,165,381 | 12,411 |
| | Anworth Mortgage Asset Corp. | 2,346,903 | 12,134 |
| | OFG Bancorp | 917,265 | 12,016 |
| * | Ambac Financial Group Inc. | 528,630 | 11,894 |
| | Altisource Residential Corp. | 1,062,695 | 11,732 |
| | Gladstone Commercial Corp. | 583,419 | 11,727 |
| | Dime Community Bancshares Inc. | 581,604 | 11,690 |
| | CatchMark Timber Trust Inc. Class A | 1,036,624 | 11,672 |
| | First Financial Corp. | 220,334 | 11,634 |
| * | INTL. FCStone Inc. | 293,330 | 11,616 |
| | NRG Yield Inc. Class A | 754,664 | 11,592 |
| *,^ | Nationstar Mortgage Holdings Inc. | 638,344 | 11,529 |
| | AG Mortgage Investment Trust Inc. | 657,502 | 11,250 |
| | Guaranty Bancorp | 464,831 | 11,249 |
| | Silver Bay Realty Trust Corp. | 653,836 | 11,207 |
| | Southwest Bancorp Inc. | 376,995 | 10,933 |
| * | EZCORP Inc. Class A | 1,025,805 | 10,925 |
| | Peoples Bancorp Inc. | 336,332 | 10,917 |
| | Opus Bank | 362,857 | 10,904 |
| | Cedar Realty Trust Inc. | 1,627,937 | 10,630 |
| | Park Sterling Corp. | 984,629 | 10,624 |
| * | Ocwen Financial Corp. | 1,959,934 | 10,564 |
| * | CU Bancorp | 294,438 | 10,541 |
| | QCR Holdings Inc. | 243,352 | 10,537 |
| * | Flagstar Bancorp Inc. | 390,362 | 10,516 |
| | Suffolk Bancorp | 240,313 | 10,290 |
| | PJT Partners Inc. | 331,172 | 10,227 |
| * | Triumph Bancorp Inc. | 387,180 | 10,125 |
| | UMH Properties Inc. | 659,642 | 9,928 |
22
| | | |
| Vanguard® Total Stock Market Index Fund | | |
| Schedule of Investments | | |
| December 31, 2016 | | |
| |
| | | | Market |
| | | | Value |
| | | Shares | ($000) |
| | State National Cos. Inc. | 708,279 | 9,817 |
| | Stonegate Bank | 230,716 | 9,628 |
| * | Franklin Financial Network Inc. | 229,163 | 9,590 |
| | Bank Mutual Corp. | 991,212 | 9,367 |
| * | TriState Capital Holdings Inc. | 418,854 | 9,257 |
| | NexPoint Residential Trust Inc. | 414,161 | 9,252 |
| | Independent Bank Corp. Michigan | 424,010 | 9,201 |
| | Waterstone Financial Inc. | 499,977 | 9,200 |
| | United Community Financial Corp. | 1,019,232 | 9,112 |
| | Peapack Gladstone Financial Corp. | 294,408 | 9,091 |
| * | Bancorp Inc. | 1,152,119 | 9,056 |
| | Kinsale Capital Group Inc. | 265,729 | 9,037 |
| | Whitestone REIT | 623,647 | 8,968 |
| | Blue Hills Bancorp Inc. | 476,432 | 8,933 |
| | Virtu Financial Inc. Class A | 556,827 | 8,881 |
| | Fidelity Southern Corp. | 372,287 | 8,812 |
| | Preferred Apartment Communities Inc. Class A | 590,553 | 8,805 |
| | First Defiance Financial Corp. | 173,443 | 8,801 |
| | Financial Institutions Inc. | 254,896 | 8,717 |
| | Pacific Continental Corp. | 397,133 | 8,677 |
| * | Forestar Group Inc. | 644,548 | 8,573 |
| * | HomeTrust Bancshares Inc. | 330,585 | 8,562 |
| | First Bancorp | 314,940 | 8,547 |
| | Arrow Financial Corp. | 211,011 | 8,546 |
| * | Tejon Ranch Co. | 335,528 | 8,532 |
| | Westwood Holdings Group Inc. | 141,736 | 8,503 |
| * | Marcus & Millichap Inc. | 318,195 | 8,502 |
| | Midland States Bancorp Inc. | 234,785 | 8,495 |
| | CorEnergy Infrastructure Trust Inc. | 243,143 | 8,481 |
| | Clifton Bancorp Inc. | 501,079 | 8,478 |
| *,^ | Citizens Inc. Class A | 863,136 | 8,476 |
| | Western Asset Mortgage Capital Corp. | 824,137 | 8,299 |
| | Heritage Insurance Holdings Inc. | 526,969 | 8,258 |
| * | First Foundation Inc. | 289,377 | 8,247 |
| * | Atlantic Capital Bancshares Inc. | 425,706 | 8,088 |
| | Federal Agricultural Mortgage Corp. | 140,002 | 8,018 |
| | 1st Source Corp. | 175,787 | 7,851 |
| * | World Acceptance Corp. | 121,837 | 7,832 |
| ^ | Cowen Group Inc. Class A | 503,502 | 7,804 |
| | Community Healthcare Trust Inc. | 338,482 | 7,795 |
| | First Community Bancshares Inc. | 258,101 | 7,779 |
| * | MedEquities Realty Trust Inc. | 684,654 | 7,600 |
| * | Green Bancorp Inc. | 499,252 | 7,589 |
| | Farmers National Banc Corp. | 532,236 | 7,558 |
| | Houlihan Lokey Inc. | 238,157 | 7,411 |
| | West Bancorporation Inc. | 297,901 | 7,358 |
| | Live Oak Bancshares Inc. | 396,900 | 7,343 |
| | People's Utah Bancorp | 272,975 | 7,329 |
| * | Allegiance Bancshares Inc. | 201,417 | 7,281 |
| | Xenith Bankshares Inc. | 257,181 | 7,253 |
| | Ashford Hospitality Prime Inc. | 525,960 | 7,179 |
| | HCI Group Inc. | 177,536 | 7,009 |
| | EMC Insurance Group Inc. | 232,856 | 6,988 |
| | Ares Commercial Real Estate Corp. | 506,179 | 6,950 |
| | Arlington Asset Investment Corp. Class A | 462,362 | 6,852 |
| * | PennyMac Financial Services Inc. Class A | 411,092 | 6,845 |
| | City Office REIT Inc. | 519,471 | 6,841 |
| | One Liberty Properties Inc. | 271,435 | 6,818 |
| * | Global Indemnity Ltd. | 178,113 | 6,806 |
| | American National Bankshares Inc. | 195,532 | 6,805 |
| | Arbor Realty Trust Inc. | 911,743 | 6,802 |
| * | National Commerce Corp. | 183,030 | 6,800 |
| | State Auto Financial Corp. | 253,569 | 6,798 |
| * | PICO Holdings Inc. | 446,669 | 6,767 |
23
| | | |
| Vanguard® Total Stock Market Index Fund | | |
| Schedule of Investments | | |
| December 31, 2016 | | |
| |
| | | | Market |
| | | | Value |
| | | Shares | ($000) |
| ^ | Fidelity & Guaranty Life | 283,211 | 6,712 |
| | OneBeacon Insurance Group Ltd. Class A | 418,138 | 6,711 |
| *,^ | Altisource Portfolio Solutions SA | 252,370 | 6,711 |
| | Carolina Financial Corp. | 214,105 | 6,592 |
| * | MoneyGram International Inc. | 551,724 | 6,516 |
| | First Connecticut Bancorp Inc. | 286,860 | 6,497 |
| | MBT Financial Corp. | 569,575 | 6,465 |
| * | HarborOne Bancorp Inc. | 333,819 | 6,456 |
| | Dynex Capital Inc. | 933,848 | 6,369 |
| * | Nicolet Bankshares Inc. | 133,261 | 6,355 |
| | RMR Group Inc. Class A | 159,578 | 6,303 |
| | Cherry Hill Mortgage Investment Corp. | 343,342 | 6,245 |
| * | Enova International Inc. | 497,246 | 6,240 |
| | Old Second Bancorp Inc. | 563,540 | 6,227 |
| | Charter Financial Corp. | 372,448 | 6,209 |
| | RAIT Financial Trust | 1,831,718 | 6,155 |
| * | WMIH Corp. | 3,929,491 | 6,091 |
| | Bank of Marin Bancorp | 87,215 | 6,083 |
| | Prudential Bancorp Inc. | 353,203 | 6,047 |
| ^ | Peoples Financial Services Corp. | 123,049 | 5,993 |
| ^ | Orchid Island Capital Inc. | 545,124 | 5,904 |
| | Republic Bancorp Inc. Class A | 148,101 | 5,856 |
| | Hingham Institution for Savings | 29,020 | 5,711 |
| * | Regional Management Corp. | 216,812 | 5,698 |
| * | Veritex Holdings Inc. | 211,414 | 5,647 |
| | Heritage Oaks Bancorp | 457,286 | 5,638 |
| * | NewStar Financial Inc. | 608,100 | 5,625 |
| | National Bankshares Inc. | 129,222 | 5,615 |
| * | Pacific Mercantile Bancorp | 767,710 | 5,604 |
| | Timberland Bancorp Inc. | 270,330 | 5,585 |
| | CNB Financial Corp. | 202,637 | 5,419 |
| * | Safeguard Scientifics Inc. | 394,700 | 5,309 |
| | United Insurance Holdings Corp. | 349,790 | 5,296 |
| | Enterprise Bancorp Inc. | 140,874 | 5,291 |
| | Bluerock Residential Growth REIT Inc. Class A | 383,662 | 5,264 |
| * | FRP Holdings Inc. | 139,016 | 5,241 |
| | Pzena Investment Management Inc. Class A | 459,472 | 5,105 |
| | Farmers Capital Bank Corp. | 119,724 | 5,034 |
| | First Mid-Illinois Bancshares Inc. | 147,699 | 5,022 |
| | Resource Capital Corp. | 602,245 | 5,017 |
| | Macatawa Bank Corp. | 480,746 | 5,005 |
| | MidWestOne Financial Group Inc. | 131,944 | 4,961 |
| * | Southern First Bancshares Inc. | 137,728 | 4,958 |
| *,^ | CardConnect Corp. | 389,689 | 4,949 |
| | Consolidated-Tomoka Land Co. | 92,551 | 4,944 |
| | Merchants Bancshares Inc. | 90,332 | 4,896 |
| | Citizens & Northern Corp. | 186,835 | 4,895 |
| | Ames National Corp. | 146,601 | 4,838 |
| * | Republic First Bancorp Inc. | 575,397 | 4,805 |
| | Codorus Valley Bancorp Inc. | 166,545 | 4,763 |
| | Federated National Holding Co. | 253,013 | 4,729 |
| * | First Northwest Bancorp | 302,022 | 4,712 |
| | Orrstown Financial Services Inc. | 210,135 | 4,707 |
| * | Stratus Properties Inc. | 142,314 | 4,661 |
| | Sierra Bancorp | 173,955 | 4,625 |
| | Shore Bancshares Inc. | 303,151 | 4,623 |
| | First Bancorp Inc. | 138,764 | 4,593 |
| | Investar Holding Corp. | 243,121 | 4,534 |
| | ESCROW WINTHROP REALTYTRUST | 562,609 | 4,512 |
| * | Cascade Bancorp | 551,715 | 4,480 |
| | Territorial Bancorp Inc. | 136,300 | 4,476 |
| | GAIN Capital Holdings Inc. | 677,382 | 4,457 |
| | Sun Bancorp Inc. | 171,177 | 4,451 |
| | Drive Shack Inc. | 1,173,979 | 4,414 |
24
| | | |
| Vanguard® Total Stock Market Index Fund | | |
| Schedule of Investments | | |
| December 31, 2016 | | |
| |
| | | | Market |
| | | | Value |
| | | Shares | ($000) |
| * | Ladenburg Thalmann Financial Services Inc. | 1,803,152 | 4,400 |
| | Owens Realty Mortgage Inc. | 232,758 | 4,311 |
| | Jernigan Capital Inc. | 201,980 | 4,252 |
| | Southern National Bancorp of Virginia Inc. | 260,040 | 4,249 |
| | Western New England Bancorp Inc. | 453,610 | 4,241 |
| | Bank of Commerce Holdings | 442,890 | 4,207 |
| *,^ | First Community Financial Partners Inc. | 355,182 | 4,156 |
| | Baldwin & Lyons Inc. Class B | 164,743 | 4,152 |
| | American Farmland Co. | 520,817 | 4,151 |
| ^ | Global Medical REIT Inc. | 463,975 | 4,139 |
| | BankFinancial Corp. | 278,046 | 4,121 |
| | MidSouth Bancorp Inc. | 299,101 | 4,068 |
| | ESSA Bancorp Inc. | 256,659 | 4,035 |
| | Reis Inc. | 180,218 | 4,010 |
| * | Sutherland Asset Management Corp. | 296,505 | 3,988 |
| | First Financial Northwest Inc. | 201,997 | 3,987 |
| | Ellington Residential Mortgage REIT | 302,791 | 3,939 |
| | First Internet Bancorp | 123,009 | 3,936 |
| | Calamos Asset Management Inc. Class A | 459,317 | 3,927 |
| | Great Ajax Corp. | 293,875 | 3,900 |
| | Bear State Financial Inc. | 383,531 | 3,893 |
| | WashingtonFirst Bankshares Inc. | 133,150 | 3,860 |
| * | eHealth Inc. | 362,213 | 3,858 |
| ^ | Farmland Partners Inc. | 345,562 | 3,856 |
| | Tiptree Financial Inc. Class A | 624,992 | 3,844 |
| * | On Deck Capital Inc. | 810,857 | 3,754 |
| ^ | Central Valley Community Bancorp | 183,014 | 3,653 |
| | Bar Harbor Bankshares | 77,157 | 3,652 |
| * | BSB Bancorp Inc. | 123,470 | 3,574 |
| * | Carolina Bank Holdings Inc. | 138,316 | 3,573 |
| * | FB Financial Corp. | 137,654 | 3,572 |
| | Home Bancorp Inc. | 91,599 | 3,537 |
| | Manning & Napier Inc. | 464,929 | 3,510 |
| | Silvercrest Asset Management Group Inc. Class A | 264,796 | 3,482 |
| | Donegal Group Inc. Class A | 196,160 | 3,429 |
| | Investors Title Co. | 21,162 | 3,347 |
| | Marlin Business Services Corp. | 158,706 | 3,317 |
| | Southern Missouri Bancorp Inc. | 93,400 | 3,305 |
| | Wheeler REIT Inc. | 1,933,539 | 3,287 |
| | Lake Sunapee Bank Group | 138,742 | 3,273 |
| | Capital City Bank Group Inc. | 159,056 | 3,257 |
| * | Equity Bancshares Inc. Class A | 95,079 | 3,198 |
| *,^ | Impac Mortgage Holdings Inc. | 224,990 | 3,154 |
| | Unity Bancorp Inc. | 199,003 | 3,124 |
| * | UCP Inc. | 258,732 | 3,118 |
| | Sotherly Hotels Inc. | 458,677 | 3,114 |
| | Northrim BanCorp Inc. | 98,554 | 3,114 |
| * | Trinity Place Holdings Inc. | 330,021 | 3,059 |
| | Provident Financial Holdings Inc. | 150,670 | 3,047 |
| | Middleburg Financial Corp. | 87,119 | 3,027 |
| | Penns Woods Bancorp Inc. | 59,264 | 2,993 |
| * | Entegra Financial Corp. | 144,122 | 2,969 |
| * | Atlas Financial Holdings Inc. | 159,477 | 2,879 |
| | FBR & Co. | 219,692 | 2,856 |
| | Oppenheimer Holdings Inc. Class A | 153,353 | 2,852 |
| * | First NBC Bank Holding Co. | 382,989 | 2,796 |
| | C&F Financial Corp. | 55,655 | 2,774 |
| * | SmartFinancial Inc. | 139,194 | 2,756 |
| | Five Oaks Investment Corp. | 553,730 | 2,752 |
| | MutualFirst Financial Inc. | 82,894 | 2,744 |
| | Century Bancorp Inc. Class A | 45,204 | 2,712 |
| | GAMCO Investors Inc. Class A | 87,119 | 2,691 |
| ^ | Access National Corp. | 96,911 | 2,690 |
| | Summit Financial Group Inc. | 97,574 | 2,686 |
25
| | | |
| Vanguard® Total Stock Market Index Fund | | |
| Schedule of Investments | | |
| December 31, 2016 | | |
| |
| | | | Market |
| | | | Value |
| | | Shares | ($000) |
| *,^ | Walter Investment Management Corp. | 560,577 | 2,663 |
| | Old Line Bancshares Inc. | 110,778 | 2,656 |
| | First Business Financial Services Inc. | 111,527 | 2,645 |
| | Associated Capital Group Inc. Class A | 80,379 | 2,640 |
| | United Bancorp Inc. | 194,803 | 2,630 |
| * | AV Homes Inc. | 160,363 | 2,534 |
| * | Malvern Bancorp Inc. | 116,188 | 2,457 |
| | Kingstone Cos. Inc. | 175,538 | 2,414 |
| | SI Financial Group Inc. | 155,648 | 2,397 |
| * | Commerce Union Bancshares Inc. | 109,466 | 2,380 |
| | Federal Agricultural Mortgage Corp. Class A | 38,986 | 2,378 |
| | Gladstone Land Corp. | 210,951 | 2,371 |
| | Independence Holding Co. | 120,758 | 2,361 |
| * | Consumer Portfolio Services Inc. | 432,627 | 2,215 |
| * | Hallmark Financial Services Inc. | 190,242 | 2,213 |
| | HopFed Bancorp Inc. | 161,415 | 2,173 |
| | LCNB Corp. | 92,274 | 2,145 |
| *,^ | Centrue Financial Corp. | 96,509 | 2,115 |
| | 1st Constitution Bancorp | 112,587 | 2,105 |
| | Premier Financial Bancorp Inc. | 104,198 | 2,094 |
| * | MSB Financial Corp. | 137,827 | 2,026 |
| | FS Bancorp Inc. | 55,283 | 1,987 |
| | Blue Capital Reinsurance Holdings Ltd. | 107,626 | 1,986 |
| | Medley Management Inc. Class A | 191,156 | 1,892 |
| *,^ | Health Insurance Innovations Inc. Class A | 95,669 | 1,708 |
| | Global Self Storage Inc. | 357,723 | 1,706 |
| *,^ | Stonegate Mortgage Corp. | 283,714 | 1,694 |
| | Civista Bancshares Inc. | 86,961 | 1,690 |
| * | American River Bankshares | 111,451 | 1,684 |
| | First Bancshares Inc. | 60,415 | 1,661 |
| * | Atlantic Coast Financial Corp. | 240,434 | 1,635 |
| * | Westbury Bancorp Inc. | 75,189 | 1,556 |
| | Summit State Bank | 101,234 | 1,519 |
| | Northeast Bancorp | 110,689 | 1,450 |
| * | Performant Financial Corp. | 613,513 | 1,442 |
| * | Nicholas Financial Inc. | 120,764 | 1,436 |
| | Bankwell Financial Group Inc. | 43,392 | 1,410 |
| * | Maui Land & Pineapple Co. Inc. | 184,180 | 1,335 |
| | CB Financial Services Inc. | 50,236 | 1,299 |
| * | Ashford Inc. | 28,887 | 1,274 |
| | Urstadt Biddle Properties Inc. | 64,362 | 1,262 |
| | Manhattan Bridge Capital Inc. | 162,879 | 1,238 |
| | First US Bancshares Inc. | 102,457 | 1,142 |
| | Fifth Street Asset Management Inc. | 164,515 | 1,102 |
| * | Coastway Bancorp Inc. | 69,446 | 1,087 |
| | Parke Bancorp Inc. | 53,671 | 1,081 |
| | Select Bancorp Inc. | 102,462 | 1,009 |
| * | JW Mays Inc. | 22,036 | 989 |
| ^ | Poage Bankshares Inc. | 54,231 | 984 |
| | AmeriServ Financial Inc. | 261,840 | 969 |
| | Citizens Community Bancorp Inc. | 77,102 | 958 |
| | DNB Financial Corp. | 33,690 | 957 |
| | PB Bancorp Inc. | 95,384 | 949 |
| * | Asta Funding Inc. | 95,799 | 939 |
| * | Security National Financial Corp. Class A | 143,485 | 933 |
| | Sussex Bancorp | 42,121 | 880 |
| * | Sunshine Bancorp Inc. | 49,892 | 855 |
| | Mackinac Financial Corp. | 63,025 | 849 |
| * | Conifer Holdings Inc. | 103,497 | 844 |
| | SB Financial Group Inc. | 51,539 | 827 |
| | Hennessy Advisors Inc. | 22,997 | 730 |
| * | Provident Bancorp Inc. | 40,760 | 730 |
| | First Guaranty Bancshares Inc. | 30,460 | 730 |
| | Home Federal Bancorp Inc. | 26,980 | 725 |
26
| | | |
| Vanguard® Total Stock Market Index Fund | | |
| Schedule of Investments | | |
| December 31, 2016 | | |
| |
| | | | Market |
| | | | Value |
| | | Shares | ($000) |
| * | 1347 Property Insurance Holdings Inc. | 91,546 | 714 |
| *,^ | IZEA Inc. | 144,706 | 653 |
| *,^ | Altisource Asset Management Corp. | 11,228 | 601 |
| * | Jason Industries Inc. | 326,636 | 588 |
| | Bancorp of New Jersey Inc. | 42,822 | 578 |
| | Eagle Bancorp Montana Inc. | 25,938 | 547 |
| * | FXCM Inc. Class A | 70,356 | 496 |
| | California First National Bancorp | 28,965 | 453 |
| * | Emergent Capital Inc. | 366,873 | 444 |
| * | Anchor Bancorp Inc. | 14,890 | 405 |
| | First Savings Financial Group Inc. | 7,979 | 381 |
| * | First Acceptance Corp. | 340,089 | 354 |
| * | Melrose Bancorp Inc. | 19,964 | 336 |
| * | Connecture Inc. | 171,098 | 287 |
| | United Bancshares Inc. | 12,609 | 277 |
| | US Global Investors Inc. Class A | 203,281 | 276 |
| | Stewardship Financial Corp. | 27,139 | 266 |
| | Wellesley Bank | 9,400 | 261 |
| * | National Holdings Corp. | 93,836 | 252 |
| | Pathfinder Bancorp Inc. | 17,572 | 236 |
| * | Bay Bancorp Inc. | 34,372 | 227 |
| * | Capstar Financial Holdings Inc. | 8,149 | 179 |
| * | InterGroup Corp. | 6,301 | 170 |
| | WVS Financial Corp. | 11,313 | 167 |
| | Oxbridge Re Holdings Ltd. | 23,000 | 137 |
| | Institutional Financial Markets Inc. | 102,416 | 122 |
| *,^ | Income Opportunity Realty Investors Inc. | 12,550 | 92 |
| * | Gyrodyne LLC | 4,548 | 83 |
| * | RMG Networks Holding Corp. | 111,292 | 76 |
| *,^ | ZAIS Group Holdings Inc. | 40,786 | 60 |
| | Atlantic American Corp. | 11,780 | 48 |
| * | ITUS Corp. | 8,580 | 46 |
| * | Randolph Bancorp Inc. | 2,600 | 42 |
| * | Unico American Corp. | 1,600 | 17 |
| | Lake Shore Bancorp Inc. | 1,050 | 17 |
| * | Intersections Inc. | 4,274 | 17 |
| | National Security Group Inc. | 800 | 14 |
| | Paragon Commercial Corp. | 267 | 12 |
| * | Vestin Realty Mortgage II Inc. | 4,452 | 10 |
| | Porter Bancorp Inc. | 631 | 8 |
| * | LM Funding America Inc. | 1,700 | 7 |
| | Baldwin & Lyons Inc. Class A | 225 | 6 |
| * | American Realty Investors Inc. | 668 | 3 |
| | NorthStar Realty Europe Corp. | 22 | — |
| | | | 102,612,418 |
| Health Care (12.2%) | | |
| | Johnson & Johnson | 57,656,000 | 6,642,548 |
| | Pfizer Inc. | 128,584,313 | 4,176,419 |
| | Merck & Co. Inc. | 58,449,208 | 3,440,905 |
| | UnitedHealth Group Inc. | 20,169,939 | 3,227,997 |
| | Amgen Inc. | 15,786,623 | 2,308,162 |
| | AbbVie Inc. | 34,453,691 | 2,157,490 |
| | Medtronic plc | 29,348,359 | 2,090,484 |
| | Bristol-Myers Squibb Co. | 35,417,036 | 2,069,772 |
| | Gilead Sciences Inc. | 27,919,852 | 1,999,341 |
| * | Celgene Corp. | 16,423,272 | 1,900,994 |
| * | Allergan plc | 7,961,224 | 1,671,937 |
| | Eli Lilly & Co. | 21,046,019 | 1,547,935 |
| * | Biogen Inc. | 4,620,409 | 1,310,256 |
| | Abbott Laboratories | 31,181,236 | 1,197,671 |
| | Thermo Fisher Scientific Inc. | 8,361,155 | 1,179,759 |
| | Aetna Inc. | 7,429,060 | 921,278 |
| * | Express Scripts Holding Co. | 13,092,196 | 900,612 |
| | Anthem Inc. | 5,574,044 | 801,380 |
27
| | | |
| Vanguard® Total Stock Market Index Fund | | |
| Schedule of Investments | | |
| December 31, 2016 | | |
| |
| | | | Market |
| | | | Value |
| | | Shares | ($000) |
| | Stryker Corp. | 6,344,487 | 760,133 |
| | Becton Dickinson and Co. | 4,511,558 | 746,888 |
| | Cigna Corp. | 5,434,923 | 724,964 |
| | Humana Inc. | 3,156,838 | 644,090 |
| * | Boston Scientific Corp. | 28,828,593 | 623,562 |
| * | Regeneron Pharmaceuticals Inc. | 1,644,512 | 603,684 |
| | Zoetis Inc. | 10,484,653 | 561,243 |
| * | Alexion Pharmaceuticals Inc. | 4,512,224 | 552,071 |
| * | Intuitive Surgical Inc. | 819,327 | 519,593 |
| | St. Jude Medical Inc. | 6,034,194 | 483,882 |
| * | HCA Holdings Inc. | 6,388,229 | 472,857 |
| | Baxter International Inc. | 10,362,620 | 459,479 |
| | Zimmer Biomet Holdings Inc. | 4,242,269 | 437,802 |
| * | Edwards Lifesciences Corp. | 4,527,416 | 424,219 |
| * | Illumina Inc. | 3,110,766 | 398,302 |
| * | Vertex Pharmaceuticals Inc. | 5,252,462 | 386,949 |
| | CR Bard Inc. | 1,555,698 | 349,503 |
| * | Mylan NV | 9,148,346 | 349,009 |
| * | Incyte Corp. | 3,391,160 | 340,032 |
| * | BioMarin Pharmaceutical Inc. | 3,659,216 | 303,129 |
| | Dentsply Sirona Inc. | 4,939,495 | 285,157 |
| * | Laboratory Corp. of America Holdings | 2,165,718 | 278,035 |
| | Quest Diagnostics Inc. | 2,941,973 | 270,367 |
| * | Henry Schein Inc. | 1,720,382 | 260,999 |
| | Perrigo Co. plc | 2,885,602 | 240,169 |
| * | Quintiles IMS Holdings Inc. | 3,122,406 | 237,459 |
| * | Hologic Inc. | 5,870,261 | 235,515 |
| * | IDEXX Laboratories Inc. | 1,898,841 | 222,677 |
| * | Waters Corp. | 1,619,765 | 217,680 |
| * | DaVita Inc. | 3,384,029 | 217,255 |
| | Universal Health Services Inc. Class B | 1,907,806 | 202,952 |
| * | Centene Corp. | 3,432,516 | 193,971 |
| | ResMed Inc. | 2,980,513 | 184,941 |
| | Cooper Cos. Inc. | 1,027,901 | 179,811 |
| * | Alkermes plc | 3,216,290 | 178,761 |
| * | Varian Medical Systems Inc. | 1,973,044 | 177,140 |
| | Envision Healthcare Corp. | 2,482,196 | 157,098 |
| | Teleflex Inc. | 933,821 | 150,485 |
| * | Align Technology Inc. | 1,524,467 | 146,547 |
| * | Jazz Pharmaceuticals plc | 1,217,612 | 132,756 |
| * | MEDNAX Inc. | 1,984,338 | 132,276 |
| | West Pharmaceutical Services Inc. | 1,555,976 | 131,993 |
| * | United Therapeutics Corp. | 908,270 | 130,273 |
| * | WellCare Health Plans Inc. | 936,334 | 128,353 |
| | STERIS plc | 1,828,297 | 123,209 |
| *,^ | Ionis Pharmaceuticals Inc. | 2,565,053 | 122,686 |
| * | Mallinckrodt plc | 2,280,264 | 113,603 |
| * | DexCom Inc. | 1,793,013 | 107,043 |
| *,^ | TESARO Inc. | 791,558 | 106,449 |
| *,^ | Seattle Genetics Inc. | 1,995,772 | 105,317 |
| * | ABIOMED Inc. | 870,308 | 98,066 |
| * | Exelixis Inc. | 6,087,989 | 90,772 |
| | Bio-Techne Corp. | 786,301 | 80,855 |
| * | Bio-Rad Laboratories Inc. Class A | 440,012 | 80,205 |
| * | Charles River Laboratories International Inc. | 995,682 | 75,861 |
| | HealthSouth Corp. | 1,806,146 | 74,485 |
| * | PAREXEL International Corp. | 1,118,280 | 73,493 |
| | Patterson Cos. Inc. | 1,783,252 | 73,167 |
| * | Neurocrine Biosciences Inc. | 1,853,149 | 71,717 |
| * | Alere Inc. | 1,840,162 | 71,711 |
| * | NuVasive Inc. | 1,060,524 | 71,437 |
| * | Catalent Inc. | 2,636,149 | 71,071 |
| * | Endo International plc | 4,252,449 | 70,038 |
| | Hill-Rom Holdings Inc. | 1,240,474 | 69,640 |
28
| | | |
| Vanguard® Total Stock Market Index Fund | | |
| Schedule of Investments | | |
| December 31, 2016 | | |
| |
| | | | Market |
| | | | Value |
| | | Shares | ($000) |
| *,^ | OPKO Health Inc. | 7,109,171 | 66,115 |
| * | Masimo Corp. | 937,224 | 63,169 |
| * | Team Health Holdings Inc. | 1,411,838 | 61,344 |
| *,^ | ACADIA Pharmaceuticals Inc. | 2,037,376 | 58,758 |
| * | Prestige Brands Holdings Inc. | 1,113,665 | 58,022 |
| * | Alnylam Pharmaceuticals Inc. | 1,542,816 | 57,763 |
| | Healthcare Services Group Inc. | 1,456,943 | 57,068 |
| * | INC Research Holdings Inc. Class A | 1,079,131 | 56,762 |
| * | Ultragenyx Pharmaceutical Inc. | 800,948 | 56,315 |
| | Cantel Medical Corp. | 706,750 | 55,657 |
| * | Horizon Pharma plc | 3,406,989 | 55,125 |
| * | Integra LifeSciences Holdings Corp. | 627,281 | 53,814 |
| *,^ | Bluebird Bio Inc. | 866,853 | 53,485 |
| * | Wright Medical Group NV | 2,183,525 | 50,177 |
| *,^ | Acadia Healthcare Co. Inc. | 1,515,549 | 50,165 |
| * | Neogen Corp. | 758,344 | 50,051 |
| * | LifePoint Health Inc. | 870,946 | 49,470 |
| * | Molina Healthcare Inc. | 900,326 | 48,852 |
| * | Brookdale Senior Living Inc. | 3,920,367 | 48,691 |
| * | Medicines Co. | 1,418,889 | 48,157 |
| | Bruker Corp. | 2,243,265 | 47,512 |
| * | PRA Health Sciences Inc. | 846,880 | 46,680 |
| | Owens & Minor Inc. | 1,318,383 | 46,526 |
| *,^ | ARIAD Pharmaceuticals Inc. | 3,681,999 | 45,804 |
| * | Insulet Corp. | 1,214,182 | 45,750 |
| * | ICU Medical Inc. | 309,901 | 45,664 |
| * | VWR Corp. | 1,804,726 | 45,172 |
| * | Haemonetics Corp. | 1,083,070 | 43,539 |
| * | Ironwood Pharmaceuticals Inc. Class A | 2,765,505 | 42,285 |
| *,^ | Ligand Pharmaceuticals Inc. | 402,008 | 40,848 |
| * | Akorn Inc. | 1,868,548 | 40,790 |
| * | Nektar Therapeutics Class A | 3,232,013 | 39,657 |
| * | Nevro Corp. | 526,617 | 38,264 |
| *,^ | Kite Pharma Inc. | 840,033 | 37,667 |
| *,^ | Intercept Pharmaceuticals Inc. | 340,089 | 36,951 |
| * | Magellan Health Inc. | 490,990 | 36,947 |
| * | Halyard Health Inc. | 982,677 | 36,339 |
| * | NxStage Medical Inc. | 1,364,281 | 35,758 |
| * | Globus Medical Inc. | 1,440,236 | 35,732 |
| *,^ | Penumbra Inc. | 537,354 | 34,283 |
| * | Sage Therapeutics Inc. | 664,445 | 33,927 |
| *,^ | Zeltiq Aesthetics Inc. | 750,574 | 32,665 |
| * | HMS Holdings Corp. | 1,780,557 | 32,335 |
| *,^ | Radius Health Inc. | 847,544 | 32,232 |
| *,^ | Juno Therapeutics Inc. | 1,677,023 | 31,612 |
| *,^ | Array BioPharma Inc. | 3,541,417 | 31,129 |
| *,^ | Clovis Oncology Inc. | 690,395 | 30,667 |
| *,^ | Exact Sciences Corp. | 2,284,566 | 30,522 |
| * | Sarepta Therapeutics Inc. | 1,094,686 | 30,027 |
| * | Agios Pharmaceuticals Inc. | 705,546 | 29,442 |
| * | Select Medical Holdings Corp. | 2,187,486 | 28,984 |
| * | Five Prime Therapeutics Inc. | 577,430 | 28,935 |
| * | Inogen Inc. | 425,761 | 28,598 |
| * | Portola Pharmaceuticals Inc. | 1,265,732 | 28,403 |
| *,^ | Intrexon Corp. | 1,124,846 | 27,334 |
| * | Surgical Care Affiliates Inc. | 587,456 | 27,182 |
| *,^ | Theravance Biopharma Inc. | 822,532 | 26,222 |
| * | Aerie Pharmaceuticals Inc. | 683,445 | 25,868 |
| * | Amedisys Inc. | 597,855 | 25,487 |
| * | Supernus Pharmaceuticals Inc. | 996,377 | 25,159 |
| * | Tenet Healthcare Corp. | 1,684,616 | 25,000 |
| * | AMAG Pharmaceuticals Inc. | 717,694 | 24,976 |
| * | Myriad Genetics Inc. | 1,464,887 | 24,420 |
| * | Pacira Pharmaceuticals Inc. | 755,205 | 24,393 |
29
| | | |
| Vanguard® Total Stock Market Index Fund | | |
| Schedule of Investments | | |
| December 31, 2016 | | |
| |
| | | | Market |
| | | | Value |
| | | Shares | ($000) |
| * | Omnicell Inc. | 714,367 | 24,217 |
| *,^ | Spark Therapeutics Inc. | 485,140 | 24,209 |
| | CONMED Corp. | 547,644 | 24,189 |
| * | Emergent BioSolutions Inc. | 719,472 | 23,627 |
| | Abaxis Inc. | 447,079 | 23,592 |
| *,^ | Halozyme Therapeutics Inc. | 2,363,700 | 23,353 |
| * | Depomed Inc. | 1,289,353 | 23,234 |
| * | Merit Medical Systems Inc. | 867,972 | 23,001 |
| * | Momenta Pharmaceuticals Inc. | 1,523,043 | 22,922 |
| * | Natus Medical Inc. | 658,341 | 22,910 |
| * | Air Methods Corp. | 719,159 | 22,905 |
| * | FibroGen Inc. | 1,067,525 | 22,845 |
| * | Cynosure Inc. Class A | 495,658 | 22,602 |
| | Ensign Group Inc. | 1,003,286 | 22,283 |
| *,^ | Spectranetics Corp. | 899,864 | 22,047 |
| * | Synergy Pharmaceuticals Inc. | 3,619,193 | 22,041 |
| | Analogic Corp. | 263,660 | 21,871 |
| * | Repligen Corp. | 707,161 | 21,795 |
| * | Xencor Inc. | 820,893 | 21,606 |
| * | Impax Laboratories Inc. | 1,576,593 | 20,890 |
| * | Puma Biotechnology Inc. | 659,569 | 20,249 |
| * | Vascular Solutions Inc. | 347,522 | 19,496 |
| *,^ | TherapeuticsMD Inc. | 3,335,787 | 19,248 |
| *,^ | Alder Biopharmaceuticals Inc. | 893,726 | 18,590 |
| *,^ | MiMedx Group Inc. | 2,058,058 | 18,234 |
| * | Acorda Therapeutics Inc. | 966,711 | 18,174 |
| *,^ | Innoviva Inc. | 1,635,020 | 17,495 |
| | US Physical Therapy Inc. | 246,689 | 17,318 |
| * | Insmed Inc. | 1,291,964 | 17,093 |
| * | Dermira Inc. | 555,613 | 16,852 |
| * | Luminex Corp. | 813,860 | 16,464 |
| * | Cardiovascular Systems Inc. | 670,219 | 16,226 |
| * | Acceleron Pharma Inc. | 631,615 | 16,119 |
| * | Vanda Pharmaceuticals Inc. | 1,002,665 | 15,993 |
| * | Healthways Inc. | 684,771 | 15,579 |
| | Meridian Bioscience Inc. | 878,960 | 15,558 |
| * | PharMerica Corp. | 611,873 | 15,389 |
| | Atrion Corp. | 30,204 | 15,319 |
| *,^ | Eagle Pharmaceuticals Inc. | 192,868 | 15,302 |
| * | Amicus Therapeutics Inc. | 3,038,976 | 15,104 |
| * | Glaukos Corp. | 433,223 | 14,860 |
| * | LHC Group Inc. | 322,858 | 14,755 |
| * | Retrophin Inc. | 778,616 | 14,739 |
| | National HealthCare Corp. | 194,426 | 14,736 |
| *,^ | Lannett Co. Inc. | 667,600 | 14,721 |
| * | Anika Therapeutics Inc. | 292,302 | 14,311 |
| *,^ | Coherus Biosciences Inc. | 504,563 | 14,203 |
| * | MacroGenics Inc. | 682,934 | 13,959 |
| *,^ | Avexis Inc. | 289,499 | 13,818 |
| * | Blueprint Medicines Corp. | 478,675 | 13,427 |
| * | Amphastar Pharmaceuticals Inc. | 728,681 | 13,422 |
| *,^ | ZIOPHARM Oncology Inc. | 2,490,571 | 13,325 |
| | Kindred Healthcare Inc. | 1,696,555 | 13,318 |
| * | Orthofix International NV | 366,937 | 13,276 |
| * | K2M Group Holdings Inc. | 656,437 | 13,155 |
| * | HealthStream Inc. | 523,152 | 13,105 |
| * | AtriCure Inc. | 666,275 | 13,039 |
| * | Community Health Systems Inc. | 2,279,296 | 12,741 |
| * | Progenics Pharmaceuticals Inc. | 1,469,052 | 12,693 |
| * | GenMark Diagnostics Inc. | 1,034,108 | 12,657 |
| * | Corcept Therapeutics Inc. | 1,733,730 | 12,587 |
| * | BioTelemetry Inc. | 556,003 | 12,427 |
| * | NeoGenomics Inc. | 1,435,960 | 12,306 |
| * | CryoLife Inc. | 640,421 | 12,264 |
30
| | | |
| Vanguard® Total Stock Market Index Fund | | |
| Schedule of Investments | | |
| December 31, 2016 | | |
| |
| | | | Market |
| | | | Value |
| | | Shares | ($000) |
| *,^ | Lexicon Pharmaceuticals Inc. | 876,363 | 12,120 |
| * | Quidel Corp. | 556,135 | 11,912 |
| *,^ | Accelerate Diagnostics Inc. | 559,392 | 11,607 |
| * | Genomic Health Inc. | 381,206 | 11,204 |
| * | Cytokinetics Inc. | 920,131 | 11,180 |
| * | AngioDynamics Inc. | 662,232 | 11,172 |
| *,^ | Merrimack Pharmaceuticals Inc. | 2,574,118 | 10,502 |
| *,^ | Enanta Pharmaceuticals Inc. | 312,515 | 10,469 |
| * | Ardelyx Inc. | 733,157 | 10,411 |
| * | Intra-Cellular Therapies Inc. Class A | 679,890 | 10,260 |
| * | Epizyme Inc. | 842,227 | 10,191 |
| *,^ | Keryx Biopharmaceuticals Inc. | 1,737,331 | 10,181 |
| * | ANI Pharmaceuticals Inc. | 166,165 | 10,073 |
| * | SciClone Pharmaceuticals Inc. | 931,546 | 10,061 |
| *,^ | Inovio Pharmaceuticals Inc. | 1,446,159 | 10,036 |
| * | Universal American Corp. | 1,002,853 | 9,978 |
| *,^ | Albany Molecular Research Inc. | 529,789 | 9,939 |
| * | Achillion Pharmaceuticals Inc. | 2,386,414 | 9,856 |
| * | Flexion Therapeutics Inc. | 516,746 | 9,829 |
| *,^ | Cerus Corp. | 2,233,123 | 9,714 |
| * | Triple-S Management Corp. Class B | 467,641 | 9,680 |
| * | OraSure Technologies Inc. | 1,094,246 | 9,607 |
| *,^ | Endologix Inc. | 1,667,658 | 9,539 |
| *,^ | Loxo Oncology Inc. | 295,027 | 9,475 |
| * | Aclaris Therapeutics Inc. | 347,009 | 9,418 |
| * | Capital Senior Living Corp. | 583,605 | 9,367 |
| *,^ | Heron Therapeutics Inc. | 704,465 | 9,229 |
| * | BioCryst Pharmaceuticals Inc. | 1,452,180 | 9,192 |
| * | Heska Corp. | 127,220 | 9,109 |
| *,^ | Aimmune Therapeutics Inc. | 440,723 | 9,013 |
| *,^ | Teladoc Inc. | 544,624 | 8,986 |
| *,^ | Lion Biotechnologies Inc. | 1,285,885 | 8,937 |
| *,^ | Revance Therapeutics Inc. | 429,895 | 8,899 |
| *,^ | CoLucid Pharmaceuticals Inc. | 235,320 | 8,566 |
| *,^ | Omeros Corp. | 848,938 | 8,421 |
| * | REGENXBIO Inc. | 445,365 | 8,262 |
| * | Almost Family Inc. | 185,824 | 8,195 |
| *,^ | Global Blood Therapeutics Inc. | 565,795 | 8,176 |
| | Invacare Corp. | 613,609 | 8,008 |
| *,^ | Achaogen Inc. | 610,628 | 7,950 |
| * | NanoString Technologies Inc. | 354,684 | 7,909 |
| *,^ | Celldex Therapeutics Inc. | 2,137,785 | 7,568 |
| * | Otonomy Inc. | 472,511 | 7,513 |
| *,^ | Immunomedics Inc. | 2,045,575 | 7,507 |
| * | Accuray Inc. | 1,620,010 | 7,452 |
| * | PTC Therapeutics Inc. | 681,864 | 7,439 |
| | LeMaitre Vascular Inc. | 292,738 | 7,418 |
| * | CorVel Corp. | 202,343 | 7,406 |
| * | Arena Pharmaceuticals Inc. | 5,112,192 | 7,259 |
| *,^ | Novavax Inc. | 5,756,947 | 7,254 |
| | PDL BioPharma Inc. | 3,418,090 | 7,246 |
| *,^ | Novocure Ltd. | 916,783 | 7,197 |
| * | STAAR Surgical Co. | 659,118 | 7,151 |
| * | Curis Inc. | 2,298,786 | 7,080 |
| *,^ | Aduro Biotech Inc. | 619,537 | 7,063 |
| *,^ | Sucampo Pharmaceuticals Inc. Class A | 520,254 | 7,049 |
| * | Versartis Inc. | 466,191 | 6,946 |
| * | Antares Pharma Inc. | 2,955,714 | 6,887 |
| * | Surmodics Inc. | 269,468 | 6,845 |
| *,^ | Geron Corp. | 3,303,991 | 6,839 |
| * | Karyopharm Therapeutics Inc. | 720,161 | 6,770 |
| *,^ | Organovo Holdings Inc. | 1,969,550 | 6,677 |
| *,^ | Pacific Biosciences of California Inc. | 1,738,197 | 6,605 |
| * | Surgery Partners Inc. | 414,087 | 6,563 |
31
| | | |
| Vanguard® Total Stock Market Index Fund | | |
| Schedule of Investments | | |
| December 31, 2016 | | |
| |
| | | | Market |
| | | | Value |
| | | Shares | ($000) |
| *,^ | Bellicum Pharmaceuticals Inc. | 481,109 | 6,553 |
| *,^ | Editas Medicine Inc. | 403,508 | 6,549 |
| * | Medpace Holdings Inc. | 179,778 | 6,485 |
| *,^ | Rockwell Medical Inc. | 986,171 | 6,459 |
| * | Intersect ENT Inc. | 531,238 | 6,428 |
| * | Agenus Inc. | 1,555,992 | 6,411 |
| * | Natera Inc. | 540,737 | 6,332 |
| * | Akebia Therapeutics Inc. | 607,265 | 6,322 |
| *,^ | Corbus Pharmaceuticals Holdings Inc. | 744,904 | 6,294 |
| * | Civitas Solutions Inc. | 305,684 | 6,083 |
| *,^ | Collegium Pharmaceutical Inc. | 390,345 | 6,078 |
| * | Zogenix Inc. | 492,110 | 5,979 |
| *,^ | Minerva Neurosciences Inc. | 501,377 | 5,891 |
| *,^ | Teligent Inc. | 890,203 | 5,884 |
| * | Spectrum Pharmaceuticals Inc. | 1,319,702 | 5,846 |
| * | AxoGen Inc. | 644,881 | 5,804 |
| *,^ | Insys Therapeutics Inc. | 622,935 | 5,731 |
| *,^ | Adamas Pharmaceuticals Inc. | 332,937 | 5,627 |
| * | Exactech Inc. | 201,464 | 5,500 |
| | Utah Medical Products Inc. | 75,141 | 5,467 |
| *,^ | ConforMIS Inc. | 670,178 | 5,428 |
| * | BioSpecifics Technologies Corp. | 97,325 | 5,421 |
| *,^ | Advaxis Inc. | 756,031 | 5,413 |
| * | Enzo Biochem Inc. | 773,112 | 5,365 |
| * | Addus HomeCare Corp. | 153,052 | 5,364 |
| * | Paratek Pharmaceuticals Inc. | 346,115 | 5,330 |
| * | Aratana Therapeutics Inc. | 725,112 | 5,206 |
| * | Atara Biotherapeutics Inc. | 365,179 | 5,186 |
| * | La Jolla Pharmaceutical Co. | 285,899 | 5,012 |
| *,^ | BioTime Inc. | 1,386,571 | 5,006 |
| *,^ | Invitae Corp. | 623,559 | 4,951 |
| * | NewLink Genetics Corp. | 466,694 | 4,798 |
| *,^ | Foundation Medicine Inc. | 269,612 | 4,772 |
| * | Rigel Pharmaceuticals Inc. | 1,993,937 | 4,746 |
| *,^ | Sorrento Therapeutics Inc. | 958,302 | 4,696 |
| * | ChemoCentryx Inc. | 632,749 | 4,682 |
| * | Cutera Inc. | 267,094 | 4,634 |
| * | American Renal Associates Holdings Inc. | 216,586 | 4,609 |
| * | Fluidigm Corp. | 627,848 | 4,571 |
| * | Trevena Inc. | 767,965 | 4,516 |
| * | Edge Therapeutics Inc. | 359,777 | 4,497 |
| * | CytomX Therapeutics Inc. | 397,067 | 4,364 |
| * | MyoKardia Inc. | 335,242 | 4,341 |
| * | Quorum Health Corp. | 590,419 | 4,292 |
| * | Sangamo BioSciences Inc. | 1,391,399 | 4,244 |
| * | Seres Therapeutics Inc. | 412,625 | 4,085 |
| | Protagonist Therapeutics Inc. | 185,600 | 4,081 |
| *,^ | Esperion Therapeutics Inc. | 323,919 | 4,055 |
| *,^ | MannKind Corp. | 6,306,828 | 4,016 |
| * | Lantheus Holdings Inc. | 462,939 | 3,981 |
| *,^ | MediciNova Inc. | 650,207 | 3,921 |
| *,^ | Intellia Therapeutics Inc. | 298,649 | 3,915 |
| *,^ | Idera Pharmaceuticals Inc. | 2,607,756 | 3,912 |
| * | RadNet Inc. | 604,762 | 3,901 |
| * | Audentes Therapeutics Inc. | 210,772 | 3,851 |
| *,^ | ImmunoGen Inc. | 1,879,282 | 3,834 |
| *,^ | XBiotech Inc. | 373,154 | 3,776 |
| * | Veracyte Inc. | 482,611 | 3,735 |
| * | Chimerix Inc. | 810,753 | 3,729 |
| * | Stemline Therapeutics Inc. | 348,272 | 3,727 |
| *,^ | Cara Therapeutics Inc. | 395,999 | 3,679 |
| * | Assembly Biosciences Inc. | 302,456 | 3,675 |
| * | OncoMed Pharmaceuticals Inc. | 469,476 | 3,620 |
| * | Novan Inc. | 133,930 | 3,619 |
32
| | | |
| Vanguard® Total Stock Market Index Fund | | |
| Schedule of Investments | | |
| December 31, 2016 | | |
| |
| | | | Market |
| | | | Value |
| | | Shares | ($000) |
| * | Concert Pharmaceuticals Inc. | 347,518 | 3,576 |
| *,^ | TG Therapeutics Inc. | 749,917 | 3,487 |
| * | Durect Corp. | 2,576,202 | 3,452 |
| *,^ | Clearside Biomedical Inc. | 376,509 | 3,366 |
| | Aevi Genomic Medicine Inc. | 634,352 | 3,286 |
| *,^ | NantKwest Inc. | 572,884 | 3,277 |
| * | Ophthotech Corp. | 673,963 | 3,255 |
| *,^ | Voyager Therapeutics Inc. | 254,663 | 3,244 |
| | Digirad Corp. | 646,980 | 3,235 |
| *,^ | Dynavax Technologies Corp. | 816,600 | 3,226 |
| * | RTI Surgical Inc. | 985,239 | 3,202 |
| * | Ignyta Inc. | 600,099 | 3,181 |
| * | PharmAthene Inc. | 968,713 | 3,148 |
| *,^ | Ocular Therapeutix Inc. | 365,932 | 3,063 |
| *,^ | Anavex Life Sciences Corp. | 764,285 | 3,027 |
| | Psychemedics Corp. | 119,882 | 2,959 |
| * | Pfenex Inc. | 325,659 | 2,954 |
| * | Tetraphase Pharmaceuticals Inc. | 720,540 | 2,904 |
| * | FONAR Corp. | 150,332 | 2,879 |
| * | IRIDEX Corp. | 204,439 | 2,874 |
| * | Proteostasis Therapeutics Inc. | 231,393 | 2,837 |
| *,^ | Cempra Inc. | 967,979 | 2,710 |
| * | ArQule Inc. | 2,137,145 | 2,693 |
| * | Harvard Bioscience Inc. | 878,204 | 2,679 |
| *,^ | InVivo Therapeutics Holdings Corp. | 625,909 | 2,629 |
| *,^ | Zynerba Pharmaceuticals Inc. | 163,457 | 2,548 |
| | Fulgent Genetics Inc. | 220,000 | 2,545 |
| *,^ | Abeona Therapeutics Inc. | 518,436 | 2,514 |
| *,^ | Argos Therapeutics Inc. | 497,911 | 2,440 |
| * | Derma Sciences Inc. | 464,190 | 2,414 |
| * | Alliance HealthCare Services Inc. | 241,816 | 2,321 |
| *,^ | BioScrip Inc. | 2,231,081 | 2,320 |
| *,^ | Athersys Inc. | 1,489,845 | 2,279 |
| * | Bio-Path Holdings Inc. | 1,681,363 | 2,270 |
| *,^ | VIVUS Inc. | 1,968,718 | 2,264 |
| * | Corvus Pharmaceuticals Inc. | 157,500 | 2,252 |
| *,^ | Adeptus Health Inc. Class A | 288,080 | 2,201 |
| * | Entellus Medical Inc. | 114,578 | 2,174 |
| * | Applied Genetic Technologies Corp. | 221,786 | 2,074 |
| * | Recro Pharma Inc. | 255,810 | 2,062 |
| *,^ | Arrowhead Pharmaceuticals Inc. | 1,300,881 | 2,016 |
| *,^ | BioDelivery Sciences International Inc. | 1,145,388 | 2,004 |
| * | Cidara Therapeutics Inc. | 191,857 | 1,995 |
| *,^ | Chembio Diagnostics Inc. | 290,580 | 1,976 |
| *,^ | Vital Therapies Inc. | 442,228 | 1,924 |
| *,^ | AcelRx Pharmaceuticals Inc. | 732,481 | 1,904 |
| * | Endocyte Inc. | 735,099 | 1,875 |
| *,^ | Catalyst Pharmaceuticals Inc. | 1,748,734 | 1,836 |
| *,^ | T2 Biosystems Inc. | 336,001 | 1,767 |
| * | CTI BioPharma Corp. | 4,370,634 | 1,761 |
| *,^ | Bovie Medical Corp. | 486,896 | 1,748 |
| | Tactile Systems Technology Inc. | 106,179 | 1,742 |
| *,^ | Asterias Biotherapeutics Inc. | 375,039 | 1,725 |
| * | Cascadian Therapeutics Inc. | 393,118 | 1,694 |
| *,^ | Kura Oncology Inc. | 287,100 | 1,694 |
| *,^ | AAC Holdings Inc. | 230,474 | 1,669 |
| * | GlycoMimetics Inc. | 270,870 | 1,652 |
| * | Syndax Pharmaceuticals Inc. | 229,410 | 1,645 |
| *,^ | CytoSorbents Corp. | 295,020 | 1,608 |
| * | Genesis Healthcare Inc. | 374,905 | 1,593 |
| * | Titan Pharmaceuticals Inc. | 397,542 | 1,590 |
| *,^ | Genocea Biosciences Inc. | 376,301 | 1,550 |
| *,^ | Sophiris Bio Inc. | 548,430 | 1,536 |
| *,^ | Avinger Inc. | 412,020 | 1,524 |
33
| | | |
| Vanguard® Total Stock Market Index Fund | | |
| Schedule of Investments | | |
| December 31, 2016 | | |
| |
| | | | Market |
| | | | Value |
| | | Shares | ($000) |
| *,^ | Fortress Biotech Inc. | 559,887 | 1,512 |
| *,^ | Osiris Therapeutics Inc. | 307,407 | 1,509 |
| * | Agile Therapeutics Inc. | 259,723 | 1,480 |
| *,^ | Navidea Biopharmaceuticals Inc. | 2,346,720 | 1,475 |
| * | Axsome Therapeutics Inc. | 208,908 | 1,410 |
| * | Dimension Therapeutics Inc. | 322,496 | 1,403 |
| *,^ | Senseonics Holdings Inc. | 520,900 | 1,391 |
| * | Juniper Pharmaceuticals Inc. | 239,881 | 1,343 |
| *,^ | Tenax Therapeutics Inc. | 670,313 | 1,307 |
| ^ | Ekso Bionics Holdings Inc. | 324,075 | 1,290 |
| *,^ | Adamis Pharmaceuticals Corp. | 408,783 | 1,288 |
| *,^ | ContraVir Pharmaceuticals Inc. | 1,060,916 | 1,273 |
| * | pSivida Corp. | 699,532 | 1,196 |
| *,^ | ViewRay Inc. | 369,163 | 1,155 |
| * | Kindred Biosciences Inc. | 261,521 | 1,111 |
| * | SeaSpine Holdings Corp. | 139,932 | 1,105 |
| *,^ | Biolase Inc. | 782,521 | 1,096 |
| * | Eiger BioPharmaceuticals Inc. | 93,838 | 1,093 |
| * | Palatin Technologies Inc. | 2,069,790 | 1,055 |
| * | Zafgen Inc. | 330,152 | 1,050 |
| * | OvaScience Inc. | 672,993 | 1,030 |
| * | Mirati Therapeutics Inc. | 214,806 | 1,020 |
| * | Aptevo Therapeutics Inc. | 410,439 | 1,001 |
| *,^ | Sientra Inc. | 116,485 | 992 |
| *,^ | ContraFect Corp. | 562,432 | 984 |
| * | Vericel Corp. | 324,459 | 973 |
| *,^ | iRadimed Corp. | 87,565 | 972 |
| * | iRhythm Technologies Inc. | 32,239 | 967 |
| * | Cumberland Pharmaceuticals Inc. | 174,158 | 958 |
| * | Sunesis Pharmaceuticals Inc. | 262,053 | 949 |
| * | Invuity Inc. | 164,239 | 944 |
| * | Aviragen Therapeutics Inc. | 765,807 | 942 |
| * | SCYNEXIS Inc. | 279,836 | 893 |
| *,^ | BrainStorm Cell Therapeutics Inc. | 345,909 | 879 |
| *,^ | CorMedix Inc. | 573,435 | 877 |
| * | Inotek Pharmaceuticals Corp. | 142,704 | 871 |
| * | Fate Therapeutics Inc. | 344,044 | 864 |
| | Span-America Medical Systems Inc. | 46,312 | 845 |
| * | Oncobiologics Inc. | 275,848 | 830 |
| *,^ | Alimera Sciences Inc. | 765,933 | 827 |
| * | Flex Pharma Inc. | 149,915 | 792 |
| * | InfuSystem Holdings Inc. | 309,333 | 789 |
| *,^ | Corium International Inc. | 193,046 | 784 |
| * | Calithera Biosciences Inc. | 239,944 | 780 |
| *,^ | Conatus Pharmaceuticals Inc. | 141,976 | 748 |
| *,^ | VBI Vaccines Inc. | 241,319 | 748 |
| *,^ | Corindus Vascular Robotics Inc. | 1,065,903 | 744 |
| * | CareDx Inc. | 274,549 | 741 |
| * | vTv Therapeutics Inc. Class A | 150,518 | 727 |
| * | Misonix Inc. | 67,638 | 707 |
| *,^ | Unilife Corp. | 306,133 | 704 |
| *,^ | Ampio Pharmaceuticals Inc. | 762,451 | 686 |
| *,^ | Repros Therapeutics Inc. | 511,083 | 675 |
| *,^ | Actinium Pharmaceuticals Inc. | 761,144 | 666 |
| *,^ | Egalet Corp. | 86,983 | 665 |
| * | CAS Medical Systems Inc. | 412,750 | 665 |
| *,^ | Anthera Pharmaceuticals Inc. | 949,565 | 616 |
| *,^ | NanoViricides Inc. | 566,452 | 606 |
| * | Ra Pharmaceuticals Inc. | 39,693 | 603 |
| * | Verastem Inc. | 537,319 | 602 |
| *,^ | Obalon Therapeutics Inc. | 66,929 | 592 |
| *,^ | Trovagene Inc. | 281,797 | 592 |
| *,^ | ADMA Biologics Inc. | 113,943 | 583 |
| * | Madrigal Pharmaceuticals Inc. | 38,527 | 574 |
34
| | | |
| Vanguard® Total Stock Market Index Fund | | |
| Schedule of Investments | | |
| December 31, 2016 | | |
| |
| | | | Market |
| | | | Value |
| | | Shares | ($000) |
| *,^ | Ohr Pharmaceutical Inc. | 380,923 | 571 |
| * | AVEO Pharmaceuticals Inc. | 1,031,501 | 557 |
| * | Aldeyra Therapeutics Inc. | 102,570 | 549 |
| *,^ | KemPharm Inc. | 184,183 | 543 |
| * | Immune Design Corp. | 98,402 | 541 |
| | Daxor Corp. | 66,468 | 538 |
| *,^ | Tracon Pharmaceuticals Inc. | 108,586 | 532 |
| * | IsoRay Inc. | 900,205 | 522 |
| *,^ | Fibrocell Science Inc. | 802,852 | 506 |
| *,^ | Pain Therapeutics Inc. | 880,267 | 502 |
| * | Threshold Pharmaceuticals Inc. | 1,115,776 | 492 |
| * | Five Star Quality Care Inc. | 180,143 | 486 |
| *,^ | Vermillion Inc. | 504,917 | 480 |
| *,^ | Neuralstem Inc. | 1,710,759 | 472 |
| *,^ | XOMA Corp. | 108,693 | 459 |
| * | AdCare Health Systems Inc. | 309,348 | 452 |
| * | Cymabay Therapeutics Inc. | 258,141 | 447 |
| | Diversicare Healthcare Services Inc. | 42,483 | 442 |
| *,^ | aTyr Pharma Inc. | 200,968 | 432 |
| *,^ | Reata Pharmaceuticals Inc. Class A | 19,732 | 431 |
| * | Cogentix Medical Inc. | 209,595 | 421 |
| *,^ | CytRx Corp. | 1,128,662 | 420 |
| * | Catabasis Pharmaceuticals Inc. | 112,834 | 407 |
| *,^ | Immune Pharmaceuticals Inc. | 2,207,433 | 402 |
| * | Wright Medical Group Inc. CVR Exp. 12/31/2049 | 288,011 | 380 |
| *,^ | Second Sight Medical Products Inc. | 186,783 | 368 |
| *,^ | OncoSec Medical Inc. | 292,978 | 360 |
| * | MGC Diagnostics Corp. | 46,649 | 359 |
| * | Alphatec Holdings Inc. | 109,998 | 353 |
| * | Oncocyte Corp. | 46,753 | 330 |
| * | Imprimis Pharmaceuticals Inc. | 129,279 | 323 |
| ^ | Sonoma Pharmaceuticals Inc. | 63,391 | 320 |
| ^ | Pernix Therapeutics Holdings Inc. | 145,510 | 282 |
| *,^ | iBio Inc. | 695,887 | 275 |
| * | Adverum Biotechnologies Inc. | 86,265 | 250 |
| *,^ | Evoke Pharma Inc. | 122,519 | 248 |
| *,^ | Aethlon Medical Inc. | 58,207 | 244 |
| * | Pulse Biosciences Inc. | 37,130 | 241 |
| *,^ | Chiasma Inc. | 120,825 | 236 |
| * | CASI Pharmaceuticals Inc. | 203,062 | 234 |
| *,^ | Proteon Therapeutics Inc. | 120,924 | 230 |
| *,^ | Synthetic Biologics Inc. | 288,520 | 220 |
| * | Vical Inc. | 93,764 | 216 |
| * | Viking Therapeutics Inc. | 180,700 | 215 |
| *,^ | Orexigen Therapeutics Inc. | 114,777 | 200 |
| *,^ | Cerulean Pharma Inc. | 281,559 | 199 |
| * | Mirna Therapeutics Inc. | 110,371 | 199 |
| * | Joint Corp. | 70,775 | 188 |
| * | ImmuCell Corp. | 31,066 | 185 |
| * | Ritter Pharmaceuticals Inc. | 68,184 | 185 |
| * | Biostage Inc. | 206,222 | 184 |
| * | Alliqua BioMedical Inc. | 308,139 | 182 |
| * | TearLab Corp. Class A | 351,759 | 179 |
| | GTx Inc. | 33,383 | 176 |
| *,^ | Galectin Therapeutics Inc. | 178,655 | 175 |
| * | Retractable Technologies Inc. | 177,584 | 165 |
| *,^ | Tokai Pharmaceuticals Inc. | 168,149 | 164 |
| * | ARCA biopharma Inc. | 56,421 | 161 |
| *,^ | Cyclacel Pharmaceuticals Inc. | 29,908 | 158 |
| * | Aeglea BioTherapeutics Inc. | 36,160 | 157 |
| *,^ | Caladrius Biosciences Inc. | 53,621 | 152 |
| * | Electromed Inc. | 38,975 | 151 |
| * | Dicerna Pharmaceuticals Inc. | 50,890 | 147 |
| * | HTG Molecular Diagnostics Inc. | 62,008 | 139 |
35
| | | |
| Vanguard® Total Stock Market Index Fund | | |
| Schedule of Investments | | |
| December 31, 2016 | | |
| |
| | | | Market |
| | | | Value |
| | | Shares | ($000) |
| *,^ | OncoGenex Pharmaceuticals Inc. | 268,324 | 134 |
| * | Dextera Surgical Inc. | 132,288 | 127 |
| * | Hemispherx Biopharma Inc. | 183,002 | 126 |
| *,^ | KalVista Pharmaceuticals Inc. | 16,033 | 113 |
| *,^ | Tandem Diabetes Care Inc. | 48,830 | 105 |
| | PhaseRx Inc. | 67,478 | 105 |
| *,^ | Presbia plc | 29,300 | 102 |
| ^ | Novelion Therapeutics Inc. | 11,869 | 100 |
| * | Capricor Therapeutics Inc. | 35,961 | 96 |
| * | Cancer Genetics Inc. | 70,693 | 95 |
| | Aradigm Corp. | 50,300 | 80 |
| * | Windtree Therapeutics Inc. | 61,982 | 77 |
| * | Celsion Corp. | 243,540 | 76 |
| *,^ | BioLife Solutions Inc. | 45,286 | 73 |
| * | Apricus Biosciences Inc. | 53,785 | 70 |
| *,^ | EyeGate Pharmaceuticals Inc. | 42,337 | 69 |
| *,^ | Cytori Therapeutics Inc. | 44,642 | 67 |
| *,^ | Biocept Inc. | 85,506 | 66 |
| *,^ | Amedica Corp. | 89,379 | 56 |
| *,^ | BioPharmX Corp. | 144,970 | 54 |
| *,^ | Arcadia Biosciences Inc. | 58,253 | 54 |
| * | Cleveland BioLabs Inc. | 35,225 | 50 |
| * | Zosano Pharma Corp. | 64,011 | 50 |
| * | Acura Pharmaceuticals Inc. | 61,759 | 47 |
| * | Arrhythmia Research Technology Inc. | 12,440 | 47 |
| *,^ | ASTERIAS BIOTHERAPEUTICS INC WARRANTS EXP 2/15/2017 | 52,036 | 28 |
| * | Bellerophon Therapeutics Inc. | 53,719 | 28 |
| * | Pro-Dex Inc. | 6,000 | 28 |
| * | Milestone Scientific Inc. | 18,945 | 26 |
| * | MEI Pharma Inc. | 15,989 | 23 |
| *,^ | Tonix Pharmaceuticals Holding Corp. | 46,320 | 22 |
| * | ImmunoCellular Therapeutics Ltd. | 10,552 | 22 |
| *,^ | Cerecor Inc. | 20,749 | 18 |
| * | OpGen Inc. | 14,550 | 17 |
| *,^ | Nobilis Health Corp. | 7,679 | 16 |
| * | Gemphire Therapeutics Inc. | 1,600 | 13 |
| | Viveve Medical Inc. | 2,422 | 12 |
| * | Histogenics Corp. | 5,370 | 9 |
| *,^ | Medovex Corp. | 5,693 | 8 |
| *,^ | Marinus Pharmaceuticals Inc. | 5,791 | 6 |
| ^ | Spring Bank Pharmaceuticals Inc. | 596 | 5 |
| * | Ocera Therapeutics Inc. | 1,183 | 2 |
| * | Onconova Therapeutics Inc. | 488 | 1 |
| | Biomerica Inc. | 400 | 1 |
| * | Infinity Pharmaceuticals Inc. | 300 | — |
| | Galena Biopharma Inc Warrants Expire 3/18/2020 | 157,500 | — |
| | | | 60,970,360 |
| Industrials (12.9%) | | |
| | General Electric Co. | 187,373,784 | 5,921,012 |
| | 3M Co. | 12,749,834 | 2,276,738 |
| | Boeing Co. | 12,421,412 | 1,933,765 |
| | Honeywell International Inc. | 16,134,074 | 1,869,132 |
| | Union Pacific Corp. | 17,448,454 | 1,809,056 |
| | United Technologies Corp. | 15,702,725 | 1,721,333 |
| | United Parcel Service Inc. Class B | 14,577,924 | 1,671,213 |
| | Accenture plc Class A | 13,153,758 | 1,540,700 |
| | Lockheed Martin Corp. | 5,271,465 | 1,317,550 |
| | Caterpillar Inc. | 12,373,665 | 1,147,534 |
| | Danaher Corp. | 13,172,970 | 1,025,384 |
| * | PayPal Holdings Inc. | 24,286,187 | 958,576 |
| | General Dynamics Corp. | 5,493,892 | 948,575 |
| | FedEx Corp. | 5,060,428 | 942,252 |
| | Automatic Data Processing Inc. | 9,104,761 | 935,787 |
| | Raytheon Co. | 6,227,115 | 884,250 |
36
| | |
| Vanguard® Total Stock Market Index Fund | | |
| Schedule of Investments | | |
| December 31, 2016 | | |
| |
| | | Market |
| | | Value |
| | Shares | ($000) |
| Northrop Grumman Corp. | 3,738,907 | 869,595 |
| Illinois Tool Works Inc. | 6,704,264 | 821,004 |
| Johnson Controls International plc | 19,817,144 | 816,268 |
| Emerson Electric Co. | 13,630,443 | 759,897 |
| CSX Corp. | 19,833,934 | 712,633 |
| Norfolk Southern Corp. | 6,187,364 | 668,668 |
| Waste Management Inc. | 9,386,618 | 665,605 |
| Deere & Co. | 6,322,170 | 651,436 |
| Eaton Corp. plc | 9,624,352 | 645,698 |
| Fidelity National Information Services Inc. | 6,937,207 | 524,730 |
| TE Connectivity Ltd. | 7,532,304 | 521,838 |
| * Fiserv Inc. | 4,648,404 | 494,032 |
| Cummins Inc. | 3,567,039 | 487,507 |
| PACCAR Inc. | 7,424,449 | 474,422 |
| Sherwin-Williams Co. | 1,672,653 | 449,509 |
| Amphenol Corp. Class A | 6,541,564 | 439,593 |
| Paychex Inc. | 6,864,698 | 417,923 |
| Ingersoll-Rand plc | 5,460,838 | 409,781 |
| Parker-Hannifin Corp. | 2,847,572 | 398,660 |
| Roper Technologies Inc. | 2,148,381 | 393,326 |
| Rockwell Automation Inc. | 2,739,864 | 368,238 |
| Fortive Corp. | 6,586,363 | 353,227 |
| Vulcan Materials Co. | 2,816,497 | 352,485 |
| Agilent Technologies Inc. | 6,897,395 | 314,245 |
| Martin Marietta Materials Inc. | 1,340,569 | 296,976 |
| Republic Services Inc. Class A | 5,110,355 | 291,546 |
| Waste Connections Inc. | 3,702,044 | 290,944 |
| Fastenal Co. | 6,115,320 | 287,298 |
| * FleetCor Technologies Inc. | 1,960,824 | 277,496 |
| Ball Corp. | 3,691,114 | 277,092 |
| WestRock Co. | 5,323,772 | 270,288 |
| Alliance Data Systems Corp. | 1,168,802 | 267,071 |
| TransDigm Group Inc. | 1,071,313 | 266,714 |
| * Verisk Analytics Inc. Class A | 3,216,846 | 261,111 |
| Rockwell Collins Inc. | 2,749,784 | 255,070 |
| ^ WW Grainger Inc. | 1,079,869 | 250,800 |
| Textron Inc. | 5,145,597 | 249,870 |
| Dover Corp. | 3,285,925 | 246,214 |
| AMETEK Inc. | 4,929,814 | 239,589 |
| * Mettler-Toledo International Inc. | 560,203 | 234,479 |
| Global Payments Inc. | 3,254,600 | 225,902 |
| L-3 Communications Holdings Inc. | 1,475,048 | 224,370 |
| CH Robinson Worldwide Inc. | 3,028,338 | 221,856 |
| Masco Corp. | 7,009,380 | 221,637 |
| Acuity Brands Inc. | 930,787 | 214,881 |
| Cintas Corp. | 1,768,112 | 204,323 |
| Expeditors International of Washington Inc. | 3,845,362 | 203,650 |
| * Vantiv Inc. Class A | 3,324,346 | 198,198 |
| Kansas City Southern | 2,288,283 | 194,161 |
| Pentair plc | 3,458,202 | 193,901 |
| * United Rentals Inc. | 1,793,335 | 189,340 |
| Sealed Air Corp. | 4,162,975 | 188,749 |
| Xylem Inc. | 3,787,218 | 187,543 |
| JB Hunt Transport Services Inc. | 1,906,059 | 185,021 |
| Huntington Ingalls Industries Inc. | 991,737 | 182,668 |
| * HD Supply Holdings Inc. | 4,249,856 | 180,661 |
| Fortune Brands Home & Security Inc. | 3,269,675 | 174,797 |
| Total System Services Inc. | 3,501,515 | 171,679 |
| Packaging Corp. of America | 1,993,532 | 169,091 |
| Broadridge Financial Solutions Inc. | 2,505,052 | 166,085 |
| Xerox Corp. | 18,233,335 | 159,177 |
| * Trimble Inc. | 5,277,345 | 159,112 |
| Valspar Corp. | 1,510,976 | 156,552 |
| * Crown Holdings Inc. | 2,957,510 | 155,476 |
37
| | | |
| Vanguard® Total Stock Market Index Fund | | |
| Schedule of Investments | | |
| December 31, 2016 | | |
| |
| | | | Market |
| | | | Value |
| | | Shares | ($000) |
| | Fluor Corp. | 2,950,516 | 154,961 |
| | Spirit AeroSystems Holdings Inc. Class A | 2,615,116 | 152,592 |
| | Carlisle Cos. Inc. | 1,368,243 | 150,904 |
| | Wabtec Corp. | 1,813,121 | 150,525 |
| | AO Smith Corp. | 3,143,567 | 148,848 |
| | Jack Henry & Associates Inc. | 1,671,594 | 148,404 |
| * | Jacobs Engineering Group Inc. | 2,591,813 | 147,733 |
| | IDEX Corp. | 1,608,215 | 144,836 |
| * | Sensata Technologies Holding NV | 3,624,155 | 141,161 |
| * | Stericycle Inc. | 1,800,328 | 138,697 |
| * | Arrow Electronics Inc. | 1,932,061 | 137,756 |
| | Hubbell Inc. Class B | 1,174,359 | 137,048 |
| | Lennox International Inc. | 864,761 | 132,455 |
| | Flowserve Corp. | 2,753,044 | 132,284 |
| * | Keysight Technologies Inc. | 3,616,687 | 132,262 |
| | Macquarie Infrastructure Corp. | 1,617,292 | 132,133 |
| * | CoStar Group Inc. | 690,433 | 130,140 |
| | Allegion plc | 2,028,832 | 129,845 |
| | ManpowerGroup Inc. | 1,450,468 | 128,903 |
| | B/E Aerospace Inc. | 2,139,590 | 128,782 |
| | Avnet Inc. | 2,699,997 | 128,547 |
| * | Old Dominion Freight Line Inc. | 1,492,257 | 128,021 |
| | Robert Half International Inc. | 2,616,704 | 127,643 |
| | Owens Corning | 2,433,890 | 125,491 |
| * | Berry Plastics Group Inc. | 2,572,205 | 125,344 |
| | Toro Co. | 2,214,759 | 123,916 |
| | PerkinElmer Inc. | 2,319,836 | 120,979 |
| | MDU Resources Group Inc. | 4,133,468 | 118,920 |
| * | AECOM | 3,264,091 | 118,682 |
| | Donaldson Co. Inc. | 2,818,692 | 118,611 |
| | Nordson Corp. | 1,057,108 | 118,449 |
| | Sonoco Products Co. | 2,140,500 | 112,804 |
| | Cognex Corp. | 1,712,929 | 108,977 |
| | Orbital ATK Inc. | 1,241,918 | 108,953 |
| | Booz Allen Hamilton Holding Corp. Class A | 2,998,279 | 108,148 |
| * | Quanta Services Inc. | 3,069,417 | 106,969 |
| * | First Data Corp. Class A | 7,464,681 | 105,924 |
| | FLIR Systems Inc. | 2,916,233 | 105,538 |
| | Allison Transmission Holdings Inc. | 3,068,272 | 103,370 |
| | Oshkosh Corp. | 1,574,000 | 101,696 |
| *,^ | XPO Logistics Inc. | 2,339,106 | 100,956 |
| | Hexcel Corp. | 1,956,233 | 100,629 |
| | Lincoln Electric Holdings Inc. | 1,293,944 | 99,207 |
| | AptarGroup Inc. | 1,340,321 | 98,447 |
| | Graco Inc. | 1,181,317 | 98,156 |
| | Bemis Co. Inc. | 2,005,719 | 95,913 |
| | Eagle Materials Inc. | 967,282 | 95,306 |
| * | Zebra Technologies Corp. | 1,061,881 | 91,067 |
| | EMCOR Group Inc. | 1,285,680 | 90,975 |
| * | WEX Inc. | 812,274 | 90,650 |
| * | Genesee & Wyoming Inc. Class A | 1,298,360 | 90,119 |
| | Trinity Industries Inc. | 3,211,318 | 89,146 |
| | MSC Industrial Direct Co. Inc. Class A | 952,907 | 88,039 |
| | AGCO Corp. | 1,470,193 | 85,065 |
| | CLARCOR Inc. | 1,027,842 | 84,766 |
| | Graphic Packaging Holding Co. | 6,743,272 | 84,156 |
| | Ryder System Inc. | 1,125,905 | 83,812 |
| | Curtiss-Wright Corp. | 843,658 | 82,982 |
| | Jabil Circuit Inc. | 3,443,132 | 81,499 |
| * | Teledyne Technologies Inc. | 656,382 | 80,735 |
| | Watsco Inc. | 544,926 | 80,714 |
| | Woodward Inc. | 1,162,286 | 80,256 |
| | BWX Technologies Inc. | 1,960,704 | 77,840 |
| | Landstar System Inc. | 896,096 | 76,437 |
38
| | | |
| Vanguard® Total Stock Market Index Fund | | |
| Schedule of Investments | | |
| December 31, 2016 | | |
| |
| | | | Market |
| | | | Value |
| | | Shares | ($000) |
| | MAXIMUS Inc. | 1,368,474 | 76,347 |
| | National Instruments Corp. | 2,474,259 | 76,257 |
| | Crane Co. | 1,053,731 | 75,995 |
| * | Euronet Worldwide Inc. | 1,044,661 | 75,665 |
| | Deluxe Corp. | 1,035,630 | 74,161 |
| | ITT Inc. | 1,899,301 | 73,256 |
| * | Genpact Ltd. | 3,001,400 | 73,054 |
| * | IPG Photonics Corp. | 734,198 | 72,473 |
| * | Kirby Corp. | 1,089,504 | 72,452 |
| | Littelfuse Inc. | 476,435 | 72,309 |
| | Air Lease Corp. Class A | 2,099,197 | 72,065 |
| * | Coherent Inc. | 514,885 | 70,737 |
| | EnerSys | 898,267 | 70,155 |
| * | CoreLogic Inc. | 1,869,333 | 68,848 |
| | Terex Corp. | 2,181,404 | 68,780 |
| | World Fuel Services Corp. | 1,488,531 | 68,338 |
| | Chicago Bridge & Iron Co. NV | 2,132,727 | 67,714 |
| * | WESCO International Inc. | 1,000,413 | 66,577 |
| | Belden Inc. | 889,847 | 66,534 |
| | Regal Beloit Corp. | 956,732 | 66,254 |
| | HEICO Corp. Class A | 972,613 | 66,040 |
| * | Colfax Corp. | 1,836,799 | 65,996 |
| | Valmont Industries Inc. | 455,450 | 64,173 |
| * | USG Corp. | 2,146,806 | 62,000 |
| * | Clean Harbors Inc. | 1,083,366 | 60,289 |
| * | Owens-Illinois Inc. | 3,445,926 | 59,994 |
| * | TransUnion | 1,932,123 | 59,761 |
| | Timken Co. | 1,493,380 | 59,287 |
| | Joy Global Inc. | 2,074,316 | 58,081 |
| * | Sanmina Corp. | 1,556,711 | 57,053 |
| * | Generac Holdings Inc. | 1,400,120 | 57,041 |
| * | Louisiana-Pacific Corp. | 3,009,848 | 56,976 |
| * | WageWorks Inc. | 775,044 | 56,191 |
| * | Esterline Technologies Corp. | 619,721 | 55,279 |
| | GATX Corp. | 871,633 | 53,675 |
| * | MasTec Inc. | 1,378,322 | 52,721 |
| | Kennametal Inc. | 1,675,624 | 52,380 |
| * | Cardtronics plc Class A | 954,121 | 52,066 |
| | Tetra Tech Inc. | 1,200,593 | 51,806 |
| | Barnes Group Inc. | 1,080,815 | 51,252 |
| | KBR Inc. | 3,042,105 | 50,773 |
| | John Bean Technologies Corp. | 590,440 | 50,748 |
| * | Itron Inc. | 805,661 | 50,636 |
| *,^ | Universal Display Corp. | 896,345 | 50,464 |
| * | KLX Inc. | 1,109,734 | 50,060 |
| * | Anixter International Inc. | 592,911 | 48,055 |
| | Mueller Industries Inc. | 1,201,737 | 48,021 |
| * | Summit Materials Inc. Class A | 1,969,168 | 46,847 |
| ^ | Silgan Holdings Inc. | 899,687 | 46,046 |
| | Vishay Intertechnology Inc. | 2,829,637 | 45,840 |
| | MSA Safety Inc. | 660,269 | 45,776 |
| | Applied Industrial Technologies Inc. | 768,268 | 45,635 |
| *,^ | Cimpress NV | 497,833 | 45,606 |
| | ABM Industries Inc. | 1,116,167 | 45,584 |
| * | Moog Inc. Class A | 690,450 | 45,349 |
| * | On Assignment Inc. | 1,024,816 | 45,256 |
| | Granite Construction Inc. | 821,203 | 45,166 |
| | UniFirst Corp. | 313,882 | 45,089 |
| | Knight Transportation Inc. | 1,355,588 | 44,802 |
| | Convergys Corp. | 1,823,655 | 44,789 |
| * | RBC Bearings Inc. | 470,004 | 43,621 |
| * | Masonite International Corp. | 659,621 | 43,403 |
| | Mueller Water Products Inc. Class A | 3,224,081 | 42,913 |
| | Universal Forest Products Inc. | 418,107 | 42,722 |
39
| | | |
| Vanguard® Total Stock Market Index Fund | | |
| Schedule of Investments | | |
| December 31, 2016 | | |
| |
| | | | Market |
| | | | Value |
| | | Shares | ($000) |
| * | LifeLock Inc. | 1,762,784 | 42,166 |
| * | Rexnord Corp. | 2,147,215 | 42,064 |
| | CEB Inc. | 678,123 | 41,094 |
| *,^ | Swift Transportation Co. | 1,680,689 | 40,942 |
| * | FTI Consulting Inc. | 892,438 | 40,231 |
| | G&K Services Inc. Class A | 416,237 | 40,146 |
| * | Trex Co. Inc. | 617,869 | 39,791 |
| | Brink's Co. | 958,061 | 39,520 |
| * | AMN Healthcare Services Inc. | 1,015,062 | 39,029 |
| | Covanta Holding Corp. | 2,490,971 | 38,859 |
| | Simpson Manufacturing Co. Inc. | 879,276 | 38,468 |
| * | NeuStar Inc. Class A | 1,142,509 | 38,160 |
| * | DigitalGlobe Inc. | 1,322,349 | 37,885 |
| | Watts Water Technologies Inc. Class A | 576,817 | 37,608 |
| * | Plexus Corp. | 695,727 | 37,597 |
| | Brady Corp. Class A | 984,298 | 36,960 |
| | Otter Tail Corp. | 903,841 | 36,877 |
| * | Armstrong World Industries Inc. | 875,731 | 36,606 |
| *,^ | Ambarella Inc. | 656,746 | 35,550 |
| | AZZ Inc. | 555,786 | 35,515 |
| * | Headwaters Inc. | 1,482,517 | 34,869 |
| * | ExlService Holdings Inc. | 668,164 | 33,702 |
| | Greif Inc. Class A | 655,214 | 33,619 |
| *,^ | Navistar International Corp. | 1,040,655 | 32,645 |
| * | II-VI Inc. | 1,099,097 | 32,588 |
| | Apogee Enterprises Inc. | 608,331 | 32,582 |
| | Matson Inc. | 913,588 | 32,332 |
| | Franklin Electric Co. Inc. | 822,072 | 31,979 |
| | Korn/Ferry International | 1,086,270 | 31,969 |
| | Exponent Inc. | 523,210 | 31,550 |
| * | Benchmark Electronics Inc. | 1,030,224 | 31,422 |
| *,^ | Knowles Corp. | 1,872,560 | 31,290 |
| * | MACOM Technology Solutions Holdings Inc. | 675,789 | 31,276 |
| | Methode Electronics Inc. | 743,012 | 30,724 |
| | EnPro Industries Inc. | 449,363 | 30,269 |
| | Actuant Corp. Class A | 1,165,591 | 30,247 |
| * | Hub Group Inc. Class A | 687,873 | 30,094 |
| | Forward Air Corp. | 631,707 | 29,930 |
| * | Fabrinet | 727,296 | 29,310 |
| * | OSI Systems Inc. | 381,289 | 29,024 |
| * | Rogers Corp. | 377,758 | 29,016 |
| * | TopBuild Corp. | 808,769 | 28,792 |
| * | Advisory Board Co. | 861,159 | 28,634 |
| | Astec Industries Inc. | 421,529 | 28,436 |
| | Mobile Mini Inc. | 934,619 | 28,272 |
| | ESCO Technologies Inc. | 494,835 | 28,032 |
| * | Gibraltar Industries Inc. | 669,452 | 27,883 |
| | Albany International Corp. | 599,760 | 27,769 |
| | AAON Inc. | 839,224 | 27,736 |
| | Triumph Group Inc. | 1,044,795 | 27,687 |
| * | Atlas Air Worldwide Holdings Inc. | 523,760 | 27,314 |
| | Kaman Corp. | 554,474 | 27,130 |
| * | SPX FLOW Inc. | 841,922 | 26,992 |
| *,^ | TASER International Inc. | 1,095,534 | 26,556 |
| | Insperity Inc. | 373,111 | 26,472 |
| * | Navigant Consulting Inc. | 997,690 | 26,120 |
| | Tennant Co. | 365,735 | 26,040 |
| | Comfort Systems USA Inc. | 778,169 | 25,913 |
| * | Proto Labs Inc. | 499,491 | 25,649 |
| * | Veeco Instruments Inc. | 861,854 | 25,123 |
| | Aircastle Ltd. | 1,202,773 | 25,078 |
| *,^ | Smith & Wesson Holding Corp. | 1,182,124 | 24,919 |
| | Werner Enterprises Inc. | 919,409 | 24,778 |
| * | TTM Technologies Inc. | 1,798,754 | 24,517 |
40
| | | |
| Vanguard® Total Stock Market Index Fund | | |
| Schedule of Investments | | |
| December 31, 2016 | | |
| |
| | | | Market |
| | | | Value |
| | | Shares | ($000) |
| * | Aerojet Rocketdyne Holdings Inc. | 1,361,936 | 24,447 |
| | Cubic Corp. | 507,697 | 24,344 |
| | RR Donnelley & Sons Co. | 1,481,991 | 24,186 |
| * | Imperva Inc. | 617,797 | 23,723 |
| | Standex International Corp. | 267,681 | 23,516 |
| * | Saia Inc. | 530,664 | 23,429 |
| | Multi-Color Corp. | 301,693 | 23,411 |
| * | Sykes Enterprises Inc. | 810,873 | 23,402 |
| * | BMC Stock Holdings Inc. | 1,198,979 | 23,380 |
| | EVERTEC Inc. | 1,316,926 | 23,375 |
| * | Tutor Perini Corp. | 830,396 | 23,251 |
| | Greenbrier Cos. Inc. | 557,116 | 23,148 |
| * | Huron Consulting Group Inc. | 456,207 | 23,107 |
| * | Meritor Inc. | 1,852,880 | 23,013 |
| | AAR Corp. | 693,593 | 22,923 |
| * | Team Inc. | 583,800 | 22,914 |
| | Harsco Corp. | 1,677,981 | 22,821 |
| * | TriNet Group Inc. | 884,061 | 22,650 |
| * | TriMas Corp. | 954,314 | 22,426 |
| | CIRCOR International Inc. | 344,369 | 22,343 |
| | US Ecology Inc. | 450,775 | 22,156 |
| | ManTech International Corp. Class A | 519,156 | 21,934 |
| * | American Woodmark Corp. | 291,145 | 21,909 |
| * | TrueBlue Inc. | 886,917 | 21,863 |
| * | Patrick Industries Inc. | 285,020 | 21,747 |
| * | Wabash National Corp. | 1,368,822 | 21,655 |
| | Badger Meter Inc. | 577,943 | 21,355 |
| ^ | Sturm Ruger & Co. Inc. | 400,273 | 21,094 |
| * | Lydall Inc. | 340,447 | 21,057 |
| * | ICF International Inc. | 375,840 | 20,746 |
| | Heartland Express Inc. | 1,002,424 | 20,409 |
| *,^ | US Concrete Inc. | 309,966 | 20,303 |
| | Griffon Corp. | 771,490 | 20,213 |
| | MTS Systems Corp. | 350,474 | 19,872 |
| | Primoris Services Corp. | 868,913 | 19,794 |
| | Federal Signal Corp. | 1,252,910 | 19,558 |
| * | Builders FirstSource Inc. | 1,770,693 | 19,425 |
| * | Continental Building Products Inc. | 839,225 | 19,386 |
| | Raven Industries Inc. | 760,023 | 19,153 |
| * | Integer Holdings Corp. | 648,416 | 19,096 |
| | General Cable Corp. | 1,000,035 | 19,051 |
| | Argan Inc. | 269,260 | 18,996 |
| | Sun Hydraulics Corp. | 474,272 | 18,957 |
| | McGrath RentCorp | 478,526 | 18,753 |
| * | SPX Corp. | 782,270 | 18,555 |
| | Viad Corp. | 418,298 | 18,447 |
| * | Boise Cascade Co. | 818,595 | 18,418 |
| | Altra Industrial Motion Corp. | 498,901 | 18,409 |
| * | PHH Corp. | 1,195,086 | 18,118 |
| | Encore Wire Corp. | 411,107 | 17,822 |
| * | Babcock & Wilcox Enterprises Inc. | 1,066,344 | 17,691 |
| * | Installed Building Products Inc. | 425,501 | 17,573 |
| | Materion Corp. | 442,249 | 17,513 |
| * | Aegion Corp. Class A | 712,514 | 16,887 |
| * | Wesco Aircraft Holdings Inc. | 1,125,395 | 16,825 |
| * | Paylocity Holding Corp. | 560,614 | 16,824 |
| * | Air Transport Services Group Inc. | 1,048,600 | 16,736 |
| | Essendant Inc. | 797,779 | 16,674 |
| | Quad/Graphics Inc. | 619,800 | 16,660 |
| | Global Brass & Copper Holdings Inc. | 477,031 | 16,362 |
| | LSC Communications Inc. | 548,885 | 16,291 |
| | Lindsay Corp. | 214,768 | 16,024 |
| | AVX Corp. | 1,005,166 | 15,711 |
| | H&E Equipment Services Inc. | 675,097 | 15,696 |
41
| | | |
| Vanguard® Total Stock Market Index Fund | | |
| Schedule of Investments | | |
| December 31, 2016 | | |
| |
| | | | Market |
| | | | Value |
| | | Shares | ($000) |
| * | Manitowoc Co. Inc. | 2,575,142 | 15,399 |
| | Kimball International Inc. Class B | 874,493 | 15,356 |
| | Advanced Drainage Systems Inc. | 738,067 | 15,204 |
| | Douglas Dynamics Inc. | 445,385 | 14,987 |
| * | MYR Group Inc. | 395,222 | 14,892 |
| | CTS Corp. | 655,001 | 14,672 |
| | HEICO Corp. | 189,056 | 14,586 |
| *,^ | Inovalon Holdings Inc. Class A | 1,412,018 | 14,544 |
| | Quanex Building Products Corp. | 716,108 | 14,537 |
| | Alamo Group Inc. | 189,031 | 14,385 |
| | Cass Information Systems Inc. | 193,883 | 14,264 |
| * | Echo Global Logistics Inc. | 566,083 | 14,180 |
| | Kelly Services Inc. Class A | 614,192 | 14,077 |
| | Insteel Industries Inc. | 392,861 | 14,002 |
| | Resources Connection Inc. | 725,749 | 13,971 |
| | Schnitzer Steel Industries Inc. | 536,498 | 13,788 |
| * | CBIZ Inc. | 1,002,273 | 13,731 |
| * | NCI Building Systems Inc. | 874,944 | 13,693 |
| | ArcBest Corp. | 492,355 | 13,614 |
| | Triton International Ltd. | 853,190 | 13,480 |
| | Kadant Inc. | 215,927 | 13,215 |
| * | Astronics Corp. | 382,643 | 12,949 |
| * | Engility Holdings Inc. | 382,826 | 12,901 |
| * | Novanta Inc. | 614,157 | 12,897 |
| * | Thermon Group Holdings Inc. | 662,857 | 12,654 |
| * | Donnelley Financial Solutions Inc. | 545,096 | 12,526 |
| * | FARO Technologies Inc. | 347,235 | 12,500 |
| | Kforce Inc. | 515,389 | 11,905 |
| * | Aerovironment Inc. | 442,074 | 11,861 |
| | TeleTech Holdings Inc. | 380,883 | 11,617 |
| * | TimkenSteel Corp. | 731,559 | 11,325 |
| * | RPX Corp. | 1,036,797 | 11,197 |
| | Marten Transport Ltd. | 479,616 | 11,175 |
| * | DXP Enterprises Inc. | 320,408 | 11,131 |
| * | PGT Innovations Inc. | 959,013 | 10,981 |
| | Gorman-Rupp Co. | 349,977 | 10,832 |
| * | Evolent Health Inc. Class A | 705,597 | 10,443 |
| * | Milacron Holdings Corp. | 558,910 | 10,413 |
| * | GMS Inc. | 354,155 | 10,370 |
| * | Kimball Electronics Inc. | 563,106 | 10,249 |
| *,^ | MINDBODY Inc. Class A | 478,259 | 10,187 |
| * | Cross Country Healthcare Inc. | 651,701 | 10,173 |
| * | Cotiviti Holdings Inc. | 289,835 | 9,970 |
| | NN Inc. | 522,482 | 9,953 |
| * | Armstrong Flooring Inc. | 497,991 | 9,915 |
| | Hyster-Yale Materials Handling Inc. | 154,918 | 9,879 |
| | Columbus McKinnon Corp. | 364,129 | 9,846 |
| | Miller Industries Inc. | 370,944 | 9,811 |
| * | Casella Waste Systems Inc. Class A | 758,397 | 9,412 |
| | Landauer Inc. | 195,406 | 9,399 |
| * | InnerWorkings Inc. | 947,326 | 9,331 |
| * | Multi Packaging Solutions International Ltd. | 648,561 | 9,248 |
| * | Atkore International Group Inc. | 386,294 | 9,236 |
| * | Horizon Global Corp. | 379,406 | 9,106 |
| | Ennis Inc. | 524,240 | 9,096 |
| | Barrett Business Services Inc. | 141,804 | 9,090 |
| | Heidrick & Struggles International Inc. | 376,061 | 9,082 |
| | AEP Industries Inc. | 78,106 | 9,068 |
| * | Mistras Group Inc. | 352,153 | 9,043 |
| * | Kratos Defense & Security Solutions Inc. | 1,218,060 | 9,014 |
| * | YRC Worldwide Inc. | 653,433 | 8,678 |
| | Daktronics Inc. | 739,088 | 7,908 |
| ^ | American Railcar Industries Inc. | 174,425 | 7,900 |
| | CECO Environmental Corp. | 561,668 | 7,835 |
42
| | | |
| Vanguard® Total Stock Market Index Fund | | |
| Schedule of Investments | | |
| December 31, 2016 | | |
| |
| | | | Market |
| | | | Value |
| | | Shares | ($000) |
| | Mesa Laboratories Inc. | 63,759 | 7,826 |
| | Myers Industries Inc. | 542,871 | 7,763 |
| * | Forterra Inc. | 354,684 | 7,682 |
| | Park-Ohio Holdings Corp. | 180,019 | 7,669 |
| *,^ | Energy Recovery Inc. | 726,691 | 7,521 |
| * | GP Strategies Corp. | 262,840 | 7,517 |
| | NVE Corp. | 102,925 | 7,352 |
| * | Bazaarvoice Inc. | 1,507,644 | 7,312 |
| | Spartan Motors Inc. | 780,194 | 7,217 |
| * | Advanced Disposal Services Inc. | 323,808 | 7,195 |
| * | Landec Corp. | 518,187 | 7,151 |
| * | Ply Gem Holdings Inc. | 427,713 | 6,950 |
| | Park Electrochemical Corp. | 371,028 | 6,920 |
| | Powell Industries Inc. | 172,369 | 6,722 |
| * | Acacia Research Corp. | 1,029,137 | 6,689 |
| | NACCO Industries Inc. Class A | 73,097 | 6,619 |
| * | Roadrunner Transportation Systems Inc. | 632,957 | 6,576 |
| * | ServiceSource International Inc. | 1,133,418 | 6,438 |
| * | Era Group Inc. | 379,091 | 6,433 |
| | CRA International Inc. | 174,695 | 6,394 |
| * | Lionbridge Technologies Inc. | 1,044,911 | 6,060 |
| * | DHI Group Inc. | 967,787 | 6,049 |
| | International Seaways Inc. | 428,920 | 6,022 |
| | VSE Corp. | 149,982 | 5,825 |
| * | Kemet Corp. | 869,933 | 5,768 |
| | B. Riley Financial Inc. | 310,035 | 5,720 |
| *,^ | Energous Corp. | 336,127 | 5,664 |
| * | Ducommun Inc. | 217,433 | 5,558 |
| * | NV5 Global Inc. | 164,303 | 5,488 |
| * | Intevac Inc. | 628,101 | 5,370 |
| * | Hudson Technologies Inc. | 667,944 | 5,350 |
| | Bel Fuse Inc. Class B | 172,239 | 5,322 |
| * | Orion Group Holdings Inc. | 499,478 | 4,970 |
| | Overseas Shipholding Group Inc. Class A | 1,286,761 | 4,928 |
| | Black Box Corp. | 307,270 | 4,686 |
| * | Covenant Transportation Group Inc. Class A | 241,973 | 4,680 |
| | DMC Global Inc. | 294,290 | 4,665 |
| | LSI Industries Inc. | 474,117 | 4,618 |
| * | Great Lakes Dredge & Dock Corp. | 1,095,081 | 4,599 |
| *,^ | Layne Christensen Co. | 418,918 | 4,554 |
| *,^ | Advanced Emissions Solutions Inc. | 488,559 | 4,514 |
| | Supreme Industries Inc. Class A | 283,231 | 4,447 |
| * | Vicor Corp. | 289,060 | 4,365 |
| * | Control4 Corp. | 426,000 | 4,345 |
| * | Sparton Corp. | 182,157 | 4,344 |
| * | PRGX Global Inc. | 734,620 | 4,334 |
| * | Franklin Covey Co. | 212,060 | 4,273 |
| | Graham Corp. | 179,845 | 3,984 |
| * | Heritage-Crystal Clean Inc. | 253,510 | 3,980 |
| | National Research Corp. Class A | 208,582 | 3,963 |
| * | CyberOptics Corp. | 151,509 | 3,954 |
| | Crawford & Co. Class B | 313,468 | 3,937 |
| | Celadon Group Inc. | 549,932 | 3,932 |
| * | Northwest Pipe Co. | 227,039 | 3,910 |
| | FreightCar America Inc. | 261,724 | 3,908 |
| * | Commercial Vehicle Group Inc. | 686,712 | 3,798 |
| * | Information Services Group Inc. | 1,033,241 | 3,761 |
| * | Astronics Corp. Class B | 111,356 | 3,753 |
| *,^ | CUI Global Inc. | 539,270 | 3,737 |
| * | Vishay Precision Group Inc. | 195,688 | 3,699 |
| * | Sterling Construction Co. Inc. | 435,913 | 3,688 |
| * | ARC Document Solutions Inc. | 724,577 | 3,681 |
| ^ | National Research Corp. Class B | 87,271 | 3,637 |
| * | Willdan Group Inc. | 158,055 | 3,570 |
43
| | | |
| Vanguard® Total Stock Market Index Fund | | |
| Schedule of Investments | | |
| December 31, 2016 | | |
| |
| | | | Market |
| | | | Value |
| | | Shares | ($000) |
| | Hurco Cos. Inc. | 104,659 | 3,464 |
| | Eastern Co. | 156,839 | 3,278 |
| | Houston Wire & Cable Co. | 501,322 | 3,259 |
| | Hardinge Inc. | 294,077 | 3,258 |
| *,^ | Aqua Metals Inc. | 248,259 | 3,255 |
| * | Twin Disc Inc. | 222,915 | 3,255 |
| * | Neff Corp. Class A | 228,288 | 3,219 |
| | BG Staffing Inc. | 203,010 | 3,167 |
| * | CAI International Inc. | 361,967 | 3,138 |
| * | TRC Cos. Inc. | 295,261 | 3,130 |
| * | Maxwell Technologies Inc. | 610,039 | 3,123 |
| * | Willis Lease Finance Corp. | 121,866 | 3,117 |
| * | EnerNOC Inc. | 519,268 | 3,116 |
| | LB Foster Co. Class A | 228,304 | 3,105 |
| * | Electro Scientific Industries Inc. | 524,444 | 3,105 |
| * | UFP Technologies Inc. | 121,044 | 3,081 |
| *,^ | Workhorse Group Inc. | 435,995 | 3,078 |
| * | IES Holdings Inc. | 158,506 | 3,035 |
| * | Planet Payment Inc. | 720,688 | 2,940 |
| * | Hill International Inc. | 643,055 | 2,797 |
| * | Everi Holdings Inc. | 1,265,707 | 2,747 |
| | Allied Motion Technologies Inc. | 126,738 | 2,711 |
| * | CDI Corp. | 362,987 | 2,686 |
| * | Goldfield Corp. | 522,323 | 2,664 |
| | Universal Logistics Holdings Inc. | 157,806 | 2,580 |
| * | Gencor Industries Inc. | 162,211 | 2,547 |
| * | Omega Flex Inc. | 45,587 | 2,542 |
| *,^ | Blue Bird Corp. | 161,939 | 2,502 |
| | United States Lime & Minerals Inc. | 32,014 | 2,425 |
| * | Napco Security Technologies Inc. | 273,313 | 2,323 |
| * | Lawson Products Inc. | 96,392 | 2,294 |
| * | PFSweb Inc. | 265,272 | 2,255 |
| | Richardson Electronics Ltd. | 356,807 | 2,248 |
| * | Arotech Corp. | 624,710 | 2,186 |
| | Crawford & Co. Class A | 222,466 | 2,107 |
| * | Mattersight Corp. | 532,688 | 1,971 |
| * | ALJ Regional Holdings Inc. | 433,860 | 1,905 |
| *,^ | American Superconductor Corp. | 248,483 | 1,831 |
| * | Iteris Inc. | 491,878 | 1,790 |
| | Huttig Building Products Inc. | 267,332 | 1,767 |
| * | LMI Aerospace Inc. | 201,975 | 1,741 |
| *,^ | ExOne Co. | 185,756 | 1,735 |
| * | PAM Transportation Services Inc. | 65,144 | 1,692 |
| * | Manitex International Inc. | 246,535 | 1,691 |
| * | Ameresco Inc. Class A | 297,398 | 1,636 |
| * | Volt Information Sciences Inc. | 237,249 | 1,625 |
| * | Aspen Aerogels Inc. | 392,456 | 1,621 |
| ^ | Eagle Bulk Shipping Inc. | 269,339 | 1,576 |
| * | StarTek Inc. | 185,124 | 1,564 |
| * | Ballantyne Strong Inc. | 193,214 | 1,546 |
| * | Perceptron Inc. | 229,932 | 1,527 |
| * | ModusLink Global Solutions Inc. | 1,045,604 | 1,527 |
| | Global Water Resources Inc. | 154,220 | 1,403 |
| * | Sharps Compliance Corp. | 358,366 | 1,373 |
| * | Radiant Logistics Inc. | 350,329 | 1,366 |
| *,^ | Energy Focus Inc. | 300,272 | 1,276 |
| *,^ | Synthesis Energy Systems Inc. | 1,217,100 | 1,217 |
| * | CPI Aerostructures Inc. | 120,875 | 1,118 |
| * | MFRI Inc. | 136,141 | 1,103 |
| * | Broadwind Energy Inc. | 270,895 | 1,096 |
| * | Taylor Devices Inc. | 67,327 | 1,023 |
| * | Xerium Technologies Inc. | 180,929 | 1,017 |
| * | Frequency Electronics Inc. | 92,589 | 1,000 |
| * | Key Technology Inc. | 84,925 | 990 |
44
| | | |
| Vanguard® Total Stock Market Index Fund | | |
| Schedule of Investments | | |
| December 31, 2016 | | |
| |
| | | | Market |
| | | | Value |
| | | Shares | ($000) |
| * | Ultralife Corp. | 193,856 | 960 |
| * | Patriot Transportation Holding Inc. | 39,973 | 931 |
| * | Cenveo Inc. | 131,158 | 917 |
| * | Asure Software Inc. | 106,300 | 905 |
| * | Orion Energy Systems Inc. | 409,453 | 889 |
| * | Lincoln Educational Services Corp. | 438,257 | 841 |
| *,^ | MicroVision Inc. | 638,927 | 805 |
| * | Perma-Fix Environmental Services | 198,880 | 776 |
| * | Innovative Solutions & Support Inc. | 227,411 | 757 |
| * | Nuvectra Corp. | 143,510 | 722 |
| | EnviroStar Inc. | 47,800 | 693 |
| * | IEC Electronics Corp. | 191,258 | 683 |
| * | eMagin Corp. | 316,500 | 680 |
| | Universal Technical Institute Inc. | 230,576 | 671 |
| *,^ | Vertex Energy Inc. | 482,481 | 632 |
| *,^ | Research Frontiers Inc. | 336,660 | 613 |
| *,^ | Applied DNA Sciences Inc. | 328,013 | 607 |
| * | USA Truck Inc. | 67,991 | 592 |
| ^ | Patriot National Inc. | 124,959 | 581 |
| * | ENGlobal Corp. | 238,948 | 571 |
| *,^ | Cemtrex Inc. | 76,243 | 563 |
| | Textainer Group Holdings Ltd. | 72,760 | 542 |
| *,^ | CryoPort Inc. | 166,681 | 540 |
| | AMCON Distributing Co. | 4,565 | 526 |
| *,^ | Revolution Lighting Technologies Inc. | 90,476 | 498 |
| | Chicago Rivet & Machine Co. | 11,186 | 465 |
| *,^ | Digital Ally Inc. | 110,620 | 465 |
| *,^ | EnSync Inc. | 630,942 | 455 |
| * | Air T Inc. | 19,270 | 441 |
| | BlueLinx Holdings Inc. | 58,466 | 437 |
| *,^ | ClearSign Combustion Corp. | 121,920 | 415 |
| * | Wireless Telecom Group Inc. | 205,351 | 392 |
| *,^ | Turtle Beach Corp. | 273,113 | 358 |
| *,^ | Odyssey Marine Exploration Inc. | 102,472 | 350 |
| *,^ | Astrotech Corp. | 220,560 | 329 |
| * | Image Sensing Systems Inc. | 88,673 | 328 |
| * | LightPath Technologies Inc. Class A | 209,228 | 322 |
| * | AMREP Corp. | 41,186 | 306 |
| * | DLH Holdings Corp. | 50,884 | 302 |
| *,^ | GEE Group Inc. | 67,770 | 298 |
| *,^ | Capstone Turbine Corp. | 419,339 | 285 |
| * | Luna Innovations Inc. | 190,541 | 280 |
| *,^ | Power Solutions International Inc. | 37,180 | 279 |
| | Bel Fuse Inc. Class A | 10,580 | 268 |
| * | UQM Technologies Inc. | 561,390 | 241 |
| * | Rand Logistics Inc. | 289,234 | 240 |
| * | Fuel Tech Inc. | 201,954 | 232 |
| * | Versar Inc. | 164,937 | 228 |
| | Ecology and Environment Inc. | 21,480 | 227 |
| * | SIFCO Industries Inc. | 29,538 | 226 |
| * | Marathon Patent Group Inc. | 127,181 | 219 |
| * | Continental Materials Corp. | 8,941 | 214 |
| | RF Industries Ltd. | 117,256 | 205 |
| * | Echelon Corp. | 42,263 | 199 |
| * | Sevcon Inc. | 21,782 | 186 |
| * | Pioneer Power Solutions Inc. | 27,339 | 163 |
| * | SigmaTron International Inc. | 30,411 | 144 |
| * | IntriCon Corp. | 16,574 | 114 |
| * | American Electric Technologies Inc. | 73,150 | 113 |
| * | General Finance Corp. | 20,286 | 113 |
| * | Sypris Solutions Inc. | 114,894 | 101 |
| * | Quest Resource Holding Corp. | 37,893 | 93 |
| * | Industrial Services of America Inc. | 49,467 | 89 |
| * | American DG Energy Inc. | 304,050 | 85 |
45
| | | |
| Vanguard® Total Stock Market Index Fund | | |
| Schedule of Investments | | |
| December 31, 2016 | | |
| |
| | | | Market |
| | | | Value |
| | | Shares | ($000) |
| * | Nortech Systems Inc. | 17,942 | 70 |
| *,^ | Payment Data Systems Inc. | 37,516 | 69 |
| | Servotronics Inc. | 4,914 | 49 |
| | L3 Technologies Inc. | 296 | 45 |
| * | Command Security Corp. | 13,027 | 36 |
| * | AeroCentury Corp. | 3,772 | 36 |
| * | Art's-Way Manufacturing Co. Inc. | 7,669 | 26 |
| * | Tel-Instrument Electronics Corp. | 4,297 | 19 |
| | Greif Inc. Class B | 197 | 13 |
| * | Micronet Enertec Technologies Inc. | 9,444 | 13 |
| | American Outdoor Brands Corp. | 312 | 7 |
| | Issuer Direct Corp. | 600 | 5 |
| * | Electro-Sensors Inc. | 1,291 | 4 |
| * | Interlink Electronics Inc. | 462 | 3 |
| * | Jewett-Cameron Trading Co. Ltd. | 185 | 2 |
| * | CTPartners Executive Search Inc. | 100,659 | — |
| * | LGL Group Inc. Warrants expire 6/8/2018 | 3,000 | — |
| | | | 64,247,397 |
| Oil & Gas (7.0%) | | |
| | Exxon Mobil Corp. | 87,889,990 | 7,932,951 |
| | Chevron Corp. | 40,008,346 | 4,708,982 |
| | Schlumberger Ltd. | 29,469,666 | 2,473,978 |
| | ConocoPhillips | 26,248,049 | 1,316,077 |
| | EOG Resources Inc. | 12,212,402 | 1,234,674 |
| | Occidental Petroleum Corp. | 16,181,173 | 1,152,585 |
| | Halliburton Co. | 17,328,004 | 937,272 |
| | Kinder Morgan Inc. | 40,205,372 | 832,653 |
| | Anadarko Petroleum Corp. | 11,835,539 | 825,292 |
| | Phillips 66 | 9,409,557 | 813,080 |
| | Valero Energy Corp. | 9,609,772 | 656,540 |
| | Pioneer Natural Resources Co. | 3,591,344 | 646,693 |
| | Spectra Energy Corp. | 14,861,863 | 610,674 |
| | Baker Hughes Inc. | 8,991,063 | 584,149 |
| | Marathon Petroleum Corp. | 11,196,567 | 563,747 |
| | Apache Corp. | 8,035,523 | 510,015 |
| | Williams Cos. Inc. | 15,910,031 | 495,438 |
| | Devon Energy Corp. | 10,533,487 | 481,064 |
| * | Concho Resources Inc. | 3,092,414 | 410,054 |
| | Hess Corp. | 6,033,203 | 375,808 |
| | Noble Energy Inc. | 9,100,268 | 346,356 |
| | Marathon Oil Corp. | 17,948,050 | 310,681 |
| | National Oilwell Varco Inc. | 7,989,987 | 299,145 |
| | Cimarex Energy Co. | 2,009,742 | 273,124 |
| | EQT Corp. | 3,654,241 | 238,987 |
| | Cabot Oil & Gas Corp. | 9,851,151 | 230,123 |
| | Tesoro Corp. | 2,492,911 | 218,005 |
| | Targa Resources Corp. | 3,629,998 | 203,534 |
| * | Diamondback Energy Inc. | 1,875,665 | 189,555 |
| | Range Resources Corp. | 5,244,223 | 180,192 |
| * | Cheniere Energy Inc. | 4,237,954 | 175,578 |
| * | Newfield Exploration Co. | 4,202,765 | 170,212 |
| * | FMC Technologies Inc. | 4,756,057 | 168,983 |
| | Helmerich & Payne Inc. | 2,165,117 | 167,580 |
| | OGE Energy Corp. | 4,198,738 | 140,448 |
| *,^ | Chesapeake Energy Corp. | 18,886,545 | 132,584 |
| | HollyFrontier Corp. | 3,732,669 | 122,282 |
| * | Parsley Energy Inc. Class A | 3,449,864 | 121,573 |
| * | Energen Corp. | 2,054,102 | 118,460 |
| *,^ | Transocean Ltd. | 7,746,303 | 114,181 |
| * | Southwestern Energy Co. | 10,475,028 | 113,340 |
| | Core Laboratories NV | 931,135 | 111,773 |
| * | Antero Resources Corp. | 4,651,947 | 110,019 |
| | Murphy Oil Corp. | 3,465,667 | 107,886 |
| * | WPX Energy Inc. | 7,304,915 | 106,433 |
46
| | | |
| Vanguard® Total Stock Market Index Fund | | |
| Schedule of Investments | | |
| December 31, 2016 | | |
| |
| | | | Market |
| | | | Value |
| | | Shares | ($000) |
| *,^ | Weatherford International plc | 20,842,910 | 104,006 |
| * | Continental Resources Inc. | 1,984,550 | 102,284 |
| * | RSP Permian Inc. | 2,157,855 | 96,284 |
| * | QEP Resources Inc. | 5,078,912 | 93,503 |
| | Nabors Industries Ltd. | 5,687,332 | 93,272 |
| * | PDC Energy Inc. | 1,193,927 | 86,655 |
| | Patterson-UTI Energy Inc. | 2,948,246 | 79,367 |
| * | Oasis Petroleum Inc. | 5,028,507 | 76,132 |
| * | Rice Energy Inc. | 3,447,398 | 73,602 |
| * | Whiting Petroleum Corp. | 6,045,446 | 72,666 |
| * | Gulfport Energy Corp. | 3,271,632 | 70,798 |
| | SM Energy Co. | 2,043,328 | 70,454 |
| * | Callon Petroleum Co. | 4,257,672 | 65,440 |
| | Western Refining Inc. | 1,717,434 | 65,005 |
| | PBF Energy Inc. Class A | 2,290,525 | 63,860 |
| | Ensco plc Class A | 6,388,311 | 62,094 |
| | SemGroup Corp. Class A | 1,417,976 | 59,201 |
| | Oceaneering International Inc. | 2,084,073 | 58,792 |
| | Superior Energy Services Inc. | 3,219,664 | 54,348 |
| *,^ | First Solar Inc. | 1,642,650 | 52,713 |
| * | Rowan Cos. plc Class A | 2,697,426 | 50,954 |
| * | Matador Resources Co. | 1,899,587 | 48,933 |
| * | Carrizo Oil & Gas Inc. | 1,308,455 | 48,871 |
| * | Dril-Quip Inc. | 805,811 | 48,389 |
| * | NOW Inc. | 2,159,202 | 44,199 |
| * | Laredo Petroleum Inc. | 3,069,387 | 43,401 |
| * | Oil States International Inc. | 1,099,948 | 42,898 |
| * | MRC Global Inc. | 1,943,664 | 39,379 |
| * | McDermott International Inc. | 5,149,771 | 38,057 |
| *,^ | Synergy Resources Corp. | 4,031,820 | 35,924 |
| * | Denbury Resources Inc. | 8,420,992 | 30,989 |
| * | Forum Energy Technologies Inc. | 1,404,961 | 30,909 |
| | Noble Corp. plc | 5,110,650 | 30,255 |
| * | Centennial Resource Development Inc. Class A | 1,491,016 | 29,403 |
| * | Unit Corp. | 1,091,205 | 29,321 |
| | Delek US Holdings Inc. | 1,177,545 | 28,344 |
| | Pattern Energy Group Inc. Class A | 1,463,199 | 27,786 |
| * | SEACOR Holdings Inc. | 345,733 | 24,644 |
| *,^ | Diamond Offshore Drilling Inc. | 1,325,100 | 23,454 |
| * | Chart Industries Inc. | 642,205 | 23,132 |
| ^ | RPC Inc. | 1,164,371 | 23,066 |
| | Green Plains Inc. | 752,153 | 20,947 |
| * | Helix Energy Solutions Group Inc. | 2,366,691 | 20,874 |
| | Archrock Inc. | 1,399,470 | 18,473 |
| ^ | Atwood Oceanics Inc. | 1,328,919 | 17,449 |
| * | Exterran Corp. | 713,382 | 17,050 |
| ^ | California Resources Corp. | 785,630 | 16,726 |
| * | Resolute Energy Corp. | 377,498 | 15,549 |
| * | Matrix Service Co. | 580,632 | 13,180 |
| * | Newpark Resources Inc. | 1,689,337 | 12,670 |
| *,^ | Clayton Williams Energy Inc. | 103,481 | 12,341 |
| * | REX American Resources Corp. | 119,225 | 11,773 |
| * | TETRA Technologies Inc. | 2,252,177 | 11,306 |
| * | Ring Energy Inc. | 858,440 | 11,151 |
| *,^ | Flotek Industries Inc. | 1,139,200 | 10,697 |
| *,^ | Sanchez Energy Corp. | 1,181,915 | 10,673 |
| *,^ | Bill Barrett Corp. | 1,492,964 | 10,436 |
| * | Pioneer Energy Services Corp. | 1,516,281 | 10,387 |
| | Bristow Group Inc. | 503,180 | 10,305 |
| * | Natural Gas Services Group Inc. | 319,571 | 10,274 |
| * | Cobalt International Energy Inc. | 7,912,482 | 9,653 |
| * | Par Pacific Holdings Inc. | 661,146 | 9,613 |
| | CVR Energy Inc. | 374,207 | 9,501 |
| | Midstates Petroleum Co. Inc. | 420,300 | 8,717 |
47
| | | |
| Vanguard® Total Stock Market Index Fund | | |
| Schedule of Investments | | |
| December 31, 2016 | | |
| |
| | | | Market |
| | | | Value |
| | | Shares | ($000) |
| | Halcon Resources Corp. | 857,700 | 8,011 |
| * | Tesco Corp. | 941,004 | 7,763 |
| *,^ | SunPower Corp. Class A | 1,173,805 | 7,759 |
| | SandRidge Energy Inc. | 328,219 | 7,730 |
| | Alon USA Energy Inc. | 672,814 | 7,657 |
| | Panhandle Oil and Gas Inc. Class A | 321,643 | 7,575 |
| *,^ | Renewable Energy Group Inc. | 723,319 | 7,016 |
| * | Abraxas Petroleum Corp. | 2,646,359 | 6,801 |
| | Evolution Petroleum Corp. | 648,491 | 6,485 |
| * | Parker Drilling Co. | 2,423,500 | 6,301 |
| * | CARBO Ceramics Inc. | 541,252 | 5,662 |
| *,^ | Jones Energy Inc. Class A | 1,109,905 | 5,550 |
| * | Pacific Ethanol Inc. | 580,879 | 5,518 |
| *,^ | Extraction Oil & Gas Inc. | 274,571 | 5,502 |
| *,^ | EP Energy Corp. Class A | 811,259 | 5,314 |
| | Gulf Island Fabrication Inc. | 438,021 | 5,212 |
| * | Geospace Technologies Corp. | 255,500 | 5,202 |
| *,^ | Green Brick Partners Inc. | 477,433 | 4,798 |
| *,^ | Plug Power Inc. | 3,778,705 | 4,534 |
| *,^ | Eclipse Resources Corp. | 1,674,787 | 4,472 |
| * | Contango Oil & Gas Co. | 472,614 | 4,414 |
| * | Hornbeck Offshore Services Inc. | 607,776 | 4,388 |
| * | PHI Inc. Non-Voting Shares | 223,641 | 4,030 |
| * | Independence Contract Drilling Inc. | 594,489 | 3,983 |
| * | Trecora Resources | 283,725 | 3,930 |
| * | Willbros Group Inc. | 1,135,786 | 3,680 |
| * | Gastar Exploration Inc. | 2,249,277 | 3,486 |
| * | Dawson Geophysical Co. | 429,604 | 3,454 |
| *,^ | Mammoth Energy Services Inc. | 222,470 | 3,382 |
| | Smart Sand Inc. | 198,992 | 3,293 |
| *,^ | Northern Oil and Gas Inc. | 1,037,885 | 2,854 |
| *,^ | EXCO Resources Inc. | 3,232,988 | 2,825 |
| *,^ | Approach Resources Inc. | 823,916 | 2,760 |
| *,^ | TPI Composites Inc. | 153,652 | 2,465 |
| *,^ | W&T Offshore Inc. | 874,096 | 2,421 |
| *,^ | TerraVia Holdings Inc. | 1,670,800 | 1,921 |
| | Isramco Inc. | 15,179 | 1,887 |
| *,^ | Tidewater Inc. | 540,990 | 1,845 |
| * | VAALCO Energy Inc. | 1,300,873 | 1,353 |
| | Adams Resources & Energy Inc. | 34,060 | 1,351 |
| *,^ | Harvest Natural Resources Inc. | 212,634 | 1,314 |
| * | Zion Oil & Gas Inc. | 900,079 | 1,233 |
| *,^ | Bonanza Creek Energy Inc. | 1,176,141 | 1,200 |
| *,^ | Amyris Inc. | 1,624,711 | 1,186 |
| *,^ | ION Geophysical Corp. | 196,829 | 1,181 |
| | Lonestar Resources US Inc. Class A | 133,474 | 1,140 |
| * | Gulfmark Offshore Inc. | 651,155 | 1,140 |
| * | Stone Energy Corp. | 143,132 | 1,023 |
| ^ | Comstock Resources Inc. | 103,685 | 1,021 |
| * | Mitcham Industries Inc. | 241,556 | 1,002 |
| * | PetroQuest Energy Inc. | 178,180 | 590 |
| *,^ | Rex Energy Corp. | 1,232,669 | 581 |
| * | Enphase Energy Inc. | 552,794 | 558 |
| *,^ | Yuma Energy Inc. | 122,763 | 417 |
| *,^ | Ideal Power Inc. | 125,202 | 413 |
| *,^ | Torchlight Energy Resources Inc. | 334,264 | 394 |
| *,^ | Triangle Petroleum Corp. | 1,572,497 | 371 |
| * | Enservco Corp. | 573,746 | 321 |
| * | Aemetis Inc. | 226,506 | 315 |
| * | PrimeEnergy Corp. | 5,740 | 310 |
| *,^ | MagneGas Corp. | 575,218 | 259 |
| * | Superior Drilling Products Inc. | 113,740 | 150 |
| * | Eco-Stim Energy Solutions Inc. | 78,636 | 78 |
| * | PHI Inc. Voting Shares | 2,641 | 45 |
48
| | | |
| Vanguard® Total Stock Market Index Fund | | |
| Schedule of Investments | | |
| December 31, 2016 | | |
| |
| | | | Market |
| | | | Value |
| | | Shares | ($000) |
| *,^ | Basic Energy Services Inc. | 168 | 6 |
| | | | 34,776,121 |
| Other (0.0%)2 | | |
| * | Dyax Corp CVR Expire 12/31/2019 | 2,750,063 | 3,053 |
| * | Tobira Therapeutics Inc. CVR | 201,001 | 2,762 |
| * | Leap Wireless International Inc. CVR | 872,848 | 2,200 |
| * | Adolor Corp. Rights Exp. 07/01/2019 | 592,629 | 308 |
| * | Chelsea Therapeutics International Ltd. CVR Exp. 12/31/2049 | 1,157,305 | 127 |
| * | Ambit Biosciences Corp. CVR | 201,330 | 121 |
| * | Omthera Pharmaceuticals Inc. CVR | 121,311 | 73 |
| * | Alexza Pharmaceuticals Inc CVR | 327,391 | 11 |
| | Bagger Dave's Burger Tavern Inc. | 151,742 | 9 |
| * | Clinical Data CVR | 216,285 | — |
| * | Gerber Scientific Inc. CVR | 388,581 | — |
| *,^ | Cubist Pharmaceuticals, Inc. CVR | 511,822 | — |
| *,^ | Biosante Pharmaceutical Inc CVR | 253,823 | — |
| | ClearSign Combustion Corp Rights Expire 1/13/2017 | 180,408 | — |
| * | Allen Organ Co. Escrow Shares | 11,462 | — |
| ^ | Basic Energy Services Warrants Expire 12/23/23 | 4,642 | — |
| * | NuPathe Inc. CVR | 158,681 | — |
| | | | 8,664 |
| Technology (16.2%) | | |
| | Apple Inc. | 107,359,335 | 12,434,358 |
| | Microsoft Corp. | 156,550,284 | 9,728,035 |
| * | Facebook Inc. Class A | 49,598,883 | 5,706,351 |
| * | Alphabet Inc. Class A | 6,319,126 | 5,007,591 |
| * | Alphabet Inc. | 6,168,588 | 4,761,040 |
| | Intel Corp. | 100,431,928 | 3,642,666 |
| | Cisco Systems Inc. | 106,408,771 | 3,215,673 |
| | International Business Machines Corp. | 18,123,544 | 3,008,327 |
| | Oracle Corp. | 65,315,224 | 2,511,370 |
| | QUALCOMM Inc. | 31,299,189 | 2,040,707 |
| | Texas Instruments Inc. | 21,227,731 | 1,548,988 |
| | Broadcom Ltd. | 7,996,975 | 1,413,625 |
| | NVIDIA Corp. | 10,851,556 | 1,158,295 |
| * | Adobe Systems Inc. | 10,544,515 | 1,085,558 |
| * | salesforce. com Inc. | 14,016,038 | 959,538 |
| | Hewlett Packard Enterprise Co. | 35,217,285 | 814,928 |
| | Applied Materials Inc. | 22,862,377 | 737,769 |
| * | Cognizant Technology Solutions Corp. Class A | 12,853,335 | 720,172 |
| * | Yahoo! Inc. | 18,179,988 | 703,020 |
| | Intuit Inc. | 5,148,565 | 590,077 |
| | HP Inc. | 36,234,128 | 537,714 |
| | Corning Inc. | 20,371,237 | 494,410 |
| * | Micron Technology Inc. | 22,059,402 | 483,542 |
| | Analog Devices Inc. | 6,511,859 | 472,891 |
| | Western Digital Corp. | 6,039,047 | 410,353 |
| | Lam Research Corp. | 3,432,594 | 362,928 |
| * | Autodesk Inc. | 4,493,230 | 332,544 |
| | Xilinx Inc. | 5,367,335 | 324,026 |
| | Linear Technology Corp. | 5,084,926 | 317,045 |
| | Symantec Corp. | 13,170,354 | 314,640 |
| * | Cerner Corp. | 6,447,524 | 305,419 |
| | Skyworks Solutions Inc. | 3,966,831 | 296,164 |
| | Microchip Technology Inc. | 4,563,470 | 292,747 |
| | Motorola Solutions Inc. | 3,531,237 | 292,704 |
| * | Citrix Systems Inc. | 3,131,546 | 279,678 |
| | Harris Corp. | 2,640,921 | 270,615 |
| * | Red Hat Inc. | 3,831,589 | 267,062 |
| | KLA-Tencor Corp. | 3,302,105 | 259,810 |
| * | Dell Technologies Inc. Class V | 4,718,176 | 259,358 |
| * | ServiceNow Inc. | 3,344,950 | 248,664 |
49
| | | |
| Vanguard® Total Stock Market Index Fund | | |
| Schedule of Investments | | |
| December 31, 2016 | | |
| |
| | | | Market |
| | | | Value |
| | | Shares | ($000) |
| | Seagate Technology plc | 6,276,315 | 239,567 |
| * | Akamai Technologies Inc. | 3,518,706 | 234,627 |
| | Maxim Integrated Products Inc. | 6,008,800 | 231,759 |
| * | Palo Alto Networks Inc. | 1,843,283 | 230,503 |
| | Juniper Networks Inc. | 7,699,682 | 217,593 |
| | CA Inc. | 6,654,251 | 211,406 |
| | NetApp Inc. | 5,897,288 | 207,997 |
| * | F5 Networks Inc. | 1,400,915 | 202,740 |
| * | Twitter Inc. | 12,119,536 | 197,548 |
| | CDK Global Inc. | 3,185,767 | 190,158 |
| * | Advanced Micro Devices Inc. | 16,693,853 | 189,308 |
| * | Synopsys Inc. | 3,212,804 | 189,106 |
| | CDW Corp. | 3,429,915 | 178,664 |
| | Computer Sciences Corp. | 2,967,238 | 176,313 |
| * | ANSYS Inc. | 1,848,609 | 170,978 |
| * | Workday Inc. Class A | 2,580,019 | 170,513 |
| * | Gartner Inc. | 1,665,997 | 168,382 |
| | Leidos Holdings Inc. | 3,160,212 | 161,613 |
| * | Cadence Design Systems Inc. | 6,191,732 | 156,155 |
| * | CommScope Holding Co. Inc. | 4,075,535 | 151,610 |
| * | Splunk Inc. | 2,858,283 | 146,201 |
| *,^ | VeriSign Inc. | 1,919,640 | 146,027 |
| * | Qorvo Inc. | 2,706,773 | 142,728 |
| * | Microsemi Corp. | 2,434,553 | 131,393 |
| * | ARRIS International plc | 4,038,650 | 121,685 |
| | Marvell Technology Group Ltd. | 8,320,376 | 115,404 |
| *,^ | VMware Inc. Class A | 1,450,053 | 114,163 |
| * | PTC Inc. | 2,426,623 | 112,280 |
| * | ON Semiconductor Corp. | 8,787,995 | 112,135 |
| | CSRA Inc. | 3,459,843 | 110,161 |
| | Teradyne Inc. | 4,293,940 | 109,066 |
| | Brocade Communications Systems Inc. | 8,570,572 | 107,046 |
| | Garmin Ltd. | 2,200,507 | 106,703 |
| * | NCR Corp. | 2,618,964 | 106,225 |
| * | Ultimate Software Group Inc. | 581,693 | 106,072 |
| | SS&C Technologies Holdings Inc. | 3,616,658 | 103,436 |
| * | IAC/InterActiveCorp | 1,567,715 | 101,572 |
| * | Tyler Technologies Inc. | 693,762 | 99,048 |
| * | Fortinet Inc. | 3,101,825 | 93,427 |
| * | Aspen Technology Inc. | 1,696,391 | 92,759 |
| * | Nuance Communications Inc. | 6,069,391 | 90,434 |
| * | athenahealth Inc. | 832,489 | 87,553 |
| * | Arista Networks Inc. | 883,890 | 85,534 |
| * | Cavium Inc. | 1,354,326 | 84,564 |
| | Mentor Graphics Corp. | 2,276,732 | 83,989 |
| * | Veeva Systems Inc. Class A | 2,026,423 | 82,475 |
| * | Manhattan Associates Inc. | 1,519,200 | 80,563 |
| | j2 Global Inc. | 965,487 | 78,977 |
| | Fair Isaac Corp. | 651,024 | 77,615 |
| * | Cirrus Logic Inc. | 1,357,802 | 76,770 |
| | SYNNEX Corp. | 633,559 | 76,673 |
| * | Guidewire Software Inc. | 1,537,681 | 75,854 |
| * | Teradata Corp. | 2,752,501 | 74,785 |
| * | ViaSat Inc. | 1,125,934 | 74,559 |
| | Cypress Semiconductor Corp. | 6,491,736 | 74,265 |
| | DST Systems Inc. | 688,319 | 73,753 |
| * | Ciena Corp. | 2,918,559 | 71,242 |
| * | Finisar Corp. | 2,330,888 | 70,556 |
| | MKS Instruments Inc. | 1,130,849 | 67,172 |
| | InterDigital Inc. | 722,094 | 65,963 |
| | Science Applications International Corp. | 776,625 | 65,858 |
| * | EPAM Systems Inc. | 1,022,160 | 65,735 |
| | Intersil Corp. Class A | 2,886,522 | 64,369 |
| | Blackbaud Inc. | 1,001,526 | 64,098 |
50
| | | |
| Vanguard® Total Stock Market Index Fund | | |
| Schedule of Investments | | |
| December 31, 2016 | | |
| |
| | | | Market |
| | | | Value |
| | | Shares | ($000) |
| * | CACI International Inc. Class A | 513,703 | 63,853 |
| * | Integrated Device Technology Inc. | 2,702,571 | 63,673 |
| * | Tech Data Corp. | 746,070 | 63,177 |
| | Monolithic Power Systems Inc. | 767,217 | 62,858 |
| * | Proofpoint Inc. | 849,043 | 59,985 |
| | Pitney Bowes Inc. | 3,921,368 | 59,566 |
| * | NetScout Systems Inc. | 1,868,877 | 58,870 |
| * | Medidata Solutions Inc. | 1,151,093 | 57,175 |
| *,^ | Cree Inc. | 2,137,056 | 56,397 |
| * | Ellie Mae Inc. | 671,052 | 56,154 |
| * | Silicon Laboratories Inc. | 834,554 | 54,246 |
| * | Entegris Inc. | 2,987,288 | 53,472 |
| * | TiVo Corp. | 2,455,020 | 51,310 |
| * | Tableau Software Inc. Class A | 1,212,541 | 51,109 |
| *,^ | Dycom Industries Inc. | 628,379 | 50,453 |
| | LogMeIn Inc. | 509,390 | 49,182 |
| * | Verint Systems Inc. | 1,323,596 | 46,657 |
| | Tessera Holding Corp. | 1,028,920 | 45,478 |
| * | Advanced Energy Industries Inc. | 829,384 | 45,409 |
| * | Cornerstone OnDemand Inc. | 1,062,990 | 44,975 |
| * | ACI Worldwide Inc. | 2,475,331 | 44,927 |
| * | Square Inc. | 3,266,096 | 44,517 |
| * | Lumentum Holdings Inc. | 1,133,748 | 43,819 |
| * | Electronics For Imaging Inc. | 991,447 | 43,485 |
| * | CommVault Systems Inc. | 843,441 | 43,353 |
| * | Semtech Corp. | 1,369,327 | 43,202 |
| * | Paycom Software Inc. | 949,071 | 43,173 |
| * | VeriFone Systems Inc. | 2,335,156 | 41,402 |
| * | Allscripts Healthcare Solutions Inc. | 3,985,400 | 40,691 |
| * | Synaptics Inc. | 745,993 | 39,970 |
| * | Viavi Solutions Inc. | 4,850,206 | 39,675 |
| | Power Integrations Inc. | 580,130 | 39,362 |
| | Plantronics Inc. | 716,878 | 39,256 |
| * | MicroStrategy Inc. Class A | 198,253 | 39,135 |
| * | FireEye Inc. | 3,274,121 | 38,962 |
| * | Zendesk Inc. | 1,801,890 | 38,200 |
| * | GoDaddy Inc. Class A | 1,090,025 | 38,096 |
| * | EchoStar Corp. Class A | 723,877 | 37,200 |
| | Diebold Nixdorf Inc. | 1,443,224 | 36,297 |
| * | RealPage Inc. | 1,196,508 | 35,895 |
| * | NETGEAR Inc. | 651,954 | 35,434 |
| | Cogent Communications Holdings Inc. | 855,551 | 35,377 |
| * | Inphi Corp. | 779,032 | 34,760 |
| * | Synchronoss Technologies Inc. | 857,110 | 32,827 |
| | CSG Systems International Inc. | 663,847 | 32,130 |
| * | HubSpot Inc. | 679,788 | 31,950 |
| * | Rambus Inc. | 2,313,239 | 31,853 |
| | Progress Software Corp. | 990,531 | 31,628 |
| * | Gigamon Inc. | 685,037 | 31,203 |
| * | Insight Enterprises Inc. | 770,377 | 31,154 |
| | NIC Inc. | 1,302,663 | 31,134 |
| | Cabot Microelectronics Corp. | 490,385 | 30,978 |
| *,^ | Ubiquiti Networks Inc. | 520,363 | 30,077 |
| *,^ | 3D Systems Corp. | 2,247,478 | 29,869 |
| * | Premier Inc. Class A | 983,635 | 29,863 |
| * | Envestnet Inc. | 842,504 | 29,698 |
| * | Oclaro Inc. | 3,295,180 | 29,492 |
| *,^ | 2U Inc. | 934,872 | 28,186 |
| ^ | Ebix Inc. | 477,885 | 27,263 |
| * | MaxLinear Inc. | 1,213,197 | 26,448 |
| | Pegasystems Inc. | 729,009 | 26,244 |
| * | BroadSoft Inc. | 617,747 | 25,482 |
| * | Infinera Corp. | 2,998,825 | 25,460 |
| | West Corp. | 1,026,476 | 25,416 |
51
| | | |
| Vanguard® Total Stock Market Index Fund | | |
| Schedule of Investments | | |
| December 31, 2016 | | |
| |
| | | | Market |
| | | | Value |
| | | Shares | ($000) |
| * | SPS Commerce Inc. | 352,599 | 24,643 |
| * | Ixia | 1,528,663 | 24,611 |
| * | Mercury Systems Inc. | 810,713 | 24,500 |
| | Brooks Automation Inc. | 1,370,939 | 23,402 |
| * | RingCentral Inc. Class A | 1,122,741 | 23,128 |
| | ADTRAN Inc. | 1,027,969 | 22,975 |
| * | Super Micro Computer Inc. | 808,628 | 22,682 |
| * | InvenSense Inc. | 1,770,176 | 22,641 |
| * | New Relic Inc. | 786,088 | 22,207 |
| * | Callidus Software Inc. | 1,311,964 | 22,041 |
| * | ScanSource Inc. | 541,547 | 21,851 |
| * | Web.com Group Inc. | 995,853 | 21,062 |
| * | Bottomline Technologies de Inc. | 815,071 | 20,393 |
| * | Diodes Inc. | 766,918 | 19,687 |
| * | Amkor Technology Inc. | 1,857,221 | 19,594 |
| *,^ | Shutterstock Inc. | 407,472 | 19,363 |
| * | Qualys Inc. | 611,351 | 19,349 |
| * | Q2 Holdings Inc. | 622,505 | 17,959 |
| * | Lattice Semiconductor Corp. | 2,412,631 | 17,757 |
| * | Cray Inc. | 856,305 | 17,726 |
| *,^ | Acacia Communications Inc. | 285,414 | 17,624 |
| | Monotype Imaging Holdings Inc. | 857,432 | 17,020 |
| * | FormFactor Inc. | 1,490,834 | 16,697 |
| | Inteliquent Inc. | 716,750 | 16,428 |
| * | Photronics Inc. | 1,434,801 | 16,213 |
| * | ePlus Inc. | 136,808 | 15,760 |
| *,^ | Unisys Corp. | 1,046,667 | 15,648 |
| *,^ | Twilio Inc. Class A | 519,727 | 14,994 |
| * | CEVA Inc. | 445,248 | 14,938 |
| *,^ | Match Group Inc. | 860,459 | 14,714 |
| * | Barracuda Networks Inc. | 683,718 | 14,652 |
| * | Quality Systems Inc. | 1,092,750 | 14,370 |
| * | Virtusa Corp. | 564,256 | 14,174 |
| | Syntel Inc. | 712,623 | 14,103 |
| * | Rudolph Technologies Inc. | 603,250 | 14,086 |
| * | Intralinks Holdings Inc. | 1,012,735 | 13,692 |
| * | Endurance International Group Holdings Inc. | 1,440,290 | 13,395 |
| * | Applied Micro Circuits Corp. | 1,621,347 | 13,376 |
| * | Box Inc. | 962,564 | 13,341 |
| *,^ | Pure Storage Inc. Class A | 1,175,271 | 13,292 |
| * | Ultratech Inc. | 520,053 | 12,471 |
| * | Five9 Inc. | 874,674 | 12,412 |
| * | PDF Solutions Inc. | 548,518 | 12,369 |
| * | Perficient Inc. | 704,205 | 12,317 |
| * | Nanometrics Inc. | 488,999 | 12,254 |
| * | Blucora Inc. | 794,216 | 11,715 |
| *,^ | Gogo Inc. | 1,264,563 | 11,659 |
| * | PROS Holdings Inc. | 541,703 | 11,657 |
| * | Extreme Networks Inc. | 2,268,344 | 11,410 |
| * | Exar Corp. | 1,027,262 | 11,074 |
| * | Loral Space & Communications Inc. | 264,029 | 10,838 |
| * | CalAmp Corp. | 735,002 | 10,658 |
| *,^ | Nimble Storage Inc. | 1,312,512 | 10,395 |
| * | Actua Corp. | 733,975 | 10,276 |
| *,^ | Nutanix Inc. | 378,419 | 10,051 |
| * | ShoreTel Inc. | 1,395,049 | 9,975 |
| * | Silver Spring Networks Inc. | 744,061 | 9,903 |
| * | Vocera Communications Inc. | 533,146 | 9,858 |
| * | Benefitfocus Inc. | 322,809 | 9,587 |
| | Forrester Research Inc. | 217,134 | 9,326 |
| | Hackett Group Inc. | 518,141 | 9,150 |
| * | Boingo Wireless Inc. | 748,003 | 9,118 |
| * | Axcelis Technologies Inc. | 613,732 | 8,930 |
| * | CommerceHub Inc. | 587,683 | 8,833 |
52
| | | |
| Vanguard® Total Stock Market Index Fund | | |
| Schedule of Investments | | |
| December 31, 2016 | | |
| |
| | | | Market |
| | | | Value |
| | | Shares | ($000) |
| *,^ | KEYW Holding Corp. | 739,954 | 8,724 |
| *,^ | Alarm.com Holdings Inc. | 312,451 | 8,696 |
| * | Harmonic Inc. | 1,707,962 | 8,540 |
| * | VASCO Data Security International Inc. | 620,153 | 8,465 |
| * | NeoPhotonics Corp. | 759,547 | 8,211 |
| * | Applied Optoelectronics Inc. | 347,495 | 8,145 |
| * | Xcerra Corp. | 1,059,120 | 8,092 |
| * | A10 Networks Inc. | 964,375 | 8,014 |
| * | LivePerson Inc. | 1,058,961 | 7,995 |
| * | Alpha & Omega Semiconductor Ltd. | 375,311 | 7,983 |
| * | Varonis Systems Inc. | 294,932 | 7,904 |
| * | RigNet Inc. | 336,443 | 7,789 |
| * | Carbonite Inc. | 439,069 | 7,201 |
| * | Workiva Inc. | 520,376 | 7,103 |
| * | Jive Software Inc. | 1,613,587 | 7,019 |
| * | Ultra Clean Holdings Inc. | 716,809 | 6,953 |
| *,^ | Impinj Inc. | 195,219 | 6,899 |
| * | Calix Inc. | 874,595 | 6,734 |
| * | ChannelAdvisor Corp. | 466,637 | 6,696 |
| * | PC Connection Inc. | 237,077 | 6,660 |
| | Cohu Inc. | 469,834 | 6,531 |
| * | Immersion Corp. | 602,045 | 6,400 |
| *,^ | Hortonworks Inc. | 769,051 | 6,391 |
| * | Digi International Inc. | 464,566 | 6,388 |
| *,^ | Digimarc Corp. | 209,003 | 6,270 |
| | American Software Inc. Class A | 606,253 | 6,263 |
| * | Sonus Networks Inc. | 992,265 | 6,251 |
| * | Tangoe Inc. | 745,190 | 5,872 |
| | IXYS Corp. | 488,571 | 5,814 |
| *,^ | MeetMe Inc. | 1,131,173 | 5,577 |
| | Comtech Telecommunications Corp. | 459,437 | 5,444 |
| * | Exa Corp. | 354,366 | 5,443 |
| ^ | Computer Programs & Systems Inc. | 230,292 | 5,435 |
| * | Vectrus Inc. | 223,969 | 5,342 |
| * | Zix Corp. | 1,051,977 | 5,197 |
| | QAD Inc. Class A | 165,520 | 5,032 |
| * | Model N Inc. | 561,393 | 4,968 |
| * | Brightcove Inc. | 614,528 | 4,947 |
| * | Instructure Inc. | 249,872 | 4,885 |
| * | DSP Group Inc. | 371,532 | 4,849 |
| * | GSI Technology Inc. | 781,430 | 4,845 |
| * | Sigma Designs Inc. | 802,765 | 4,817 |
| | EMCORE Corp. | 549,620 | 4,782 |
| * | Blackline Inc. | 171,889 | 4,749 |
| * | Radisys Corp. | 1,033,859 | 4,580 |
| * | Rapid7 Inc. | 365,157 | 4,444 |
| *,^ | Coupa Software Inc. | 174,565 | 4,366 |
| * | Datalink Corp. | 377,762 | 4,254 |
| * | KVH Industries Inc. | 360,452 | 4,253 |
| * | Quantum Corp. | 5,080,784 | 4,228 |
| * | Clearfield Inc. | 200,171 | 4,144 |
| *,^ | Appfolio Inc. | 173,046 | 4,127 |
| * | CommerceHub Inc. Class A | 269,882 | 4,051 |
| *,^ | Mitek Systems Inc. | 646,054 | 3,973 |
| * | Xactly Corp. | 345,015 | 3,795 |
| * | GigPeak Inc. | 1,473,942 | 3,714 |
| * | Everbridge Inc. | 199,295 | 3,677 |
| * | Guidance Software Inc. | 518,568 | 3,671 |
| * | Telenav Inc. | 518,426 | 3,655 |
| * | Rosetta Stone Inc. | 406,874 | 3,625 |
| * | AXT Inc. | 721,559 | 3,463 |
| * | Limelight Networks Inc. | 1,365,485 | 3,441 |
| * | Castlight Health Inc. Class B | 687,159 | 3,401 |
| * | USA Technologies Inc. | 772,430 | 3,321 |
53
| | | |
| Vanguard® Total Stock Market Index Fund | | |
| Schedule of Investments | | |
| December 31, 2016 | | |
| |
| | | | Market |
| | | | Value |
| | | Shares | ($000) |
| * | Amber Road Inc. | 363,220 | 3,298 |
| * | Apptio Inc. Class A | 176,170 | 3,264 |
| * | Kopin Corp. | 1,134,754 | 3,223 |
| * | Agilysys Inc. | 300,463 | 3,113 |
| * | MobileIron Inc. | 810,395 | 3,039 |
| * | SecureWorks Corp. Class A | 270,060 | 2,860 |
| * | Quantenna Communications Inc. | 155,875 | 2,826 |
| | Simulations Plus Inc. | 286,767 | 2,767 |
| * | ARI Network Services Inc. | 500,995 | 2,710 |
| | PC-Tel Inc. | 471,771 | 2,538 |
| | Preformed Line Products Co. | 43,570 | 2,532 |
| * | VOXX International Corp. Class A | 524,627 | 2,466 |
| * | Key Tronic Corp. | 314,337 | 2,458 |
| | NCI Inc. Class A | 175,318 | 2,446 |
| * | Aerohive Networks Inc. | 424,692 | 2,421 |
| *,^ | Park City Group Inc. | 188,474 | 2,394 |
| * | Aware Inc. | 387,102 | 2,361 |
| | Computer Task Group Inc. | 540,202 | 2,274 |
| *,^ | VirnetX Holding Corp. | 1,007,331 | 2,216 |
| | Tabula Rasa HealthCare Inc. | 146,500 | 2,195 |
| | Airgain Inc. | 149,522 | 2,153 |
| * | Datawatch Corp. | 390,284 | 2,147 |
| | Great Elm Capital Group Inc. | 558,900 | 2,096 |
| * | Edgewater Technology Inc. | 271,591 | 2,037 |
| * | BSQUARE Corp. | 345,151 | 2,019 |
| * | Pendrell Corp. | 268,136 | 1,810 |
| *,^ | Pixelworks Inc. | 642,411 | 1,799 |
| * | Ooma Inc. | 195,376 | 1,758 |
| | Systemax Inc. | 196,928 | 1,727 |
| *,^ | Neonode Inc. | 911,744 | 1,678 |
| * | RCM Technologies Inc. | 257,001 | 1,635 |
| | TransAct Technologies Inc. | 246,089 | 1,624 |
| * | iPass Inc. | 983,950 | 1,624 |
| | ClearOne Inc. | 141,648 | 1,615 |
| * | Rightside Group Ltd. | 192,546 | 1,592 |
| | TESSCO Technologies Inc. | 121,875 | 1,584 |
| *,^ | TransEnterix Inc. | 1,165,497 | 1,515 |
| * | Tremor Video Inc. | 598,009 | 1,489 |
| * | Numerex Corp. Class A | 192,180 | 1,422 |
| * | NetSol Technologies Inc. | 268,367 | 1,396 |
| | Concurrent Computer Corp. | 245,188 | 1,312 |
| *,^ | Inseego Corp. | 480,281 | 1,172 |
| *,^ | QuickLogic Corp. | 841,787 | 1,170 |
| * | ID Systems Inc. | 207,353 | 1,124 |
| * | Synacor Inc. | 359,073 | 1,113 |
| * | Aviat Networks Inc. | 79,504 | 1,104 |
| * | Amtech Systems Inc. | 258,398 | 1,098 |
| * | PAR Technology Corp. | 189,722 | 1,059 |
| | LRAD Corp. | 602,425 | 1,030 |
| *,^ | Netlist Inc. | 1,005,691 | 1,026 |
| * | MRV Communications Inc. | 125,429 | 1,022 |
| | Evolving Systems Inc. | 239,404 | 982 |
| | QAD Inc. Class B | 38,321 | 979 |
| * | GSE Systems Inc. | 275,429 | 964 |
| *,^ | CVD Equipment Corp. | 107,442 | 933 |
| * | WidePoint Corp. | 1,178,418 | 931 |
| *,^ | Sunworks Inc. | 459,758 | 920 |
| *,^ | Rocket Fuel Inc. | 536,942 | 918 |
| * | Upland Software Inc. | 101,213 | 906 |
| | GlobalSCAPE Inc. | 213,477 | 869 |
| *,^ | SITO Mobile Ltd. | 225,398 | 832 |
| * | Covisint Corp. | 408,547 | 776 |
| | AstroNova Inc. | 50,100 | 714 |
| * | Icad Inc. | 214,839 | 695 |
54
| | | |
| Vanguard® Total Stock Market Index Fund | | |
| Schedule of Investments | | |
| December 31, 2016 | | |
| |
| | | | Market |
| | | | Value |
| | | Shares | ($000) |
| * | Xplore Technologies Corp. | 312,216 | 631 |
| * | Inuvo Inc. | 363,197 | 607 |
| | RELM Wireless Corp. | 127,563 | 606 |
| * | ARC Group Worldwide Inc. | 126,690 | 557 |
| * | Resonant Inc. | 101,540 | 513 |
| * | Westell Technologies Inc. Class A | 696,943 | 453 |
| * | Identiv Inc. | 128,529 | 409 |
| * | DASAN Zhone Solutions Inc. | 414,351 | 408 |
| * | Intermolecular Inc. | 420,975 | 399 |
| * | eGain Corp. | 180,736 | 380 |
| | Communications Systems Inc. | 75,909 | 351 |
| * | inTEST Corp. | 75,255 | 346 |
| * | Data I/O Corp. | 79,543 | 332 |
| * | Qumu Corp. | 136,998 | 326 |
| * | FalconStor Software Inc. | 703,835 | 317 |
| * | Marin Software Inc. | 133,535 | 314 |
| | CSP Inc. | 29,660 | 314 |
| * | FORM Holdings Corp. | 143,235 | 305 |
| *,^ | ParkerVision Inc. | 141,148 | 260 |
| *,^ | Aehr Test Systems | 93,715 | 226 |
| * | Streamline Health Solutions Inc. | 181,006 | 224 |
| * | SharpSpring Inc. | 35,880 | 189 |
| * | Lantronix Inc. | 107,354 | 183 |
| * | BroadVision Inc. | 38,131 | 177 |
| * | Network-1 Technologies Inc. | 45,755 | 156 |
| * | Smith Micro Software Inc. | 93,135 | 146 |
| * | Adesto Technologies Corp. | 63,582 | 118 |
| * | Mastech Digital Inc. | 15,394 | 105 |
| * | Cinedigm Corp. Class A | 67,058 | 97 |
| *,^ | NXT-ID Inc. | 33,800 | 93 |
| * | Determine Inc. | 48,769 | 90 |
| * | Sonic Foundry Inc. | 17,328 | 86 |
| * | ADDvantage Technologies Group Inc. | 29,519 | 52 |
| * | Fusion Telecommunications International Inc. | 31,290 | 47 |
| * | Internap Corp. | 15,400 | 24 |
| * | Imation Corp. | 26,366 | 22 |
| * | Atomera Inc. | 2,980 | 20 |
| * | Socket Mobile Inc. | 5,000 | 19 |
| * | Finjan Holdings Inc. | 6,800 | 8 |
| | Intelligent Systems Corp. | 1,383 | 6 |
| * | Infosonics Corp. | 14,144 | 6 |
| *,^ | Voltari Corp. | 2,237 | 5 |
| | | | 80,674,890 |
| Telecommunications (2.4%) | | |
| | AT&T Inc. | 130,162,950 | 5,535,830 |
| | Verizon Communications Inc. | 86,383,145 | 4,611,132 |
| * | T-Mobile US Inc. | 6,098,353 | 350,716 |
| * | Level 3 Communications Inc. | 6,095,827 | 343,561 |
| | CenturyLink Inc. | 11,566,995 | 275,063 |
| * | SBA Communications Corp. Class A | 2,638,586 | 272,460 |
| *,^ | Sprint Corp. | 12,641,148 | 106,439 |
| * | Zayo Group Holdings Inc. | 3,063,282 | 100,659 |
| | Frontier Communications Corp. | 24,792,580 | 83,799 |
| | Telephone & Data Systems Inc. | 1,924,246 | 55,553 |
| | Shenandoah Telecommunications Co. | 995,747 | 27,184 |
| | Consolidated Communications Holdings Inc. | 1,003,325 | 26,939 |
| * | Vonage Holdings Corp. | 3,915,472 | 26,821 |
| * | 8x8 Inc. | 1,775,688 | 25,392 |
| | Cincinnati Bell Inc. | 962,075 | 21,502 |
| | ATN International Inc. | 226,525 | 18,152 |
| *,^ | Iridium Communications Inc. | 1,691,911 | 16,242 |
| * | GTT Communications Inc. | 527,326 | 15,161 |
| | Windstream Holdings Inc. | 1,996,364 | 14,633 |
| *,^ | Globalstar Inc. | 8,993,896 | 14,210 |
55
| | | |
| Vanguard® Total Stock Market Index Fund | | |
| Schedule of Investments | | |
| December 31, 2016 | | |
| |
| | | | Market |
| | | | Value |
| | | Shares | ($000) |
| | EarthLink Holdings Corp. | 2,317,427 | 13,070 |
| * | United States Cellular Corp. | 270,905 | 11,844 |
| * | ORBCOMM Inc. | 1,366,538 | 11,301 |
| * | General Communication Inc. Class A | 538,965 | 10,483 |
| * | FairPoint Communications Inc. | 479,503 | 8,967 |
| | Spok Holdings Inc. | 405,283 | 8,410 |
| * | Hawaiian Telcom Holdco Inc. | 286,751 | 7,106 |
| * | Lumos Networks Corp. | 433,706 | 6,775 |
| | IDT Corp. Class B | 357,074 | 6,620 |
| *,^ | pdvWireless Inc. | 259,979 | 5,863 |
| *,^ | Straight Path Communications Inc. Class B | 151,385 | 5,134 |
| * | HC2 Holdings Inc. | 545,396 | 3,234 |
| * | Alaska Communications Systems Group Inc. | 1,432,201 | 2,349 |
| *,^ | Intelsat SA | 587,792 | 1,569 |
| * | Pareteum Corp. | 1,003,978 | 120 |
| * | Otelco Inc. Class A | 2,754 | 18 |
| | | | 12,044,311 |
| Utilities (3.1%) | | |
| | NextEra Energy Inc. | 10,151,300 | 1,212,674 |
| | Duke Energy Corp. | 14,559,005 | 1,130,070 |
| | Southern Co. | 20,710,219 | 1,018,736 |
| | Dominion Resources Inc. | 13,278,827 | 1,017,025 |
| | Exelon Corp. | 19,490,339 | 691,712 |
| | American Electric Power Co. Inc. | 10,392,347 | 654,302 |
| | PG&E Corp. | 10,691,639 | 649,731 |
| | Sempra Energy | 5,297,058 | 533,096 |
| | Edison International | 6,895,174 | 496,384 |
| | PPL Corp. | 14,344,058 | 488,415 |
| | Consolidated Edison Inc. | 6,431,161 | 473,848 |
| | Public Service Enterprise Group Inc. | 10,690,290 | 469,090 |
| | Xcel Energy Inc. | 10,712,314 | 435,991 |
| | WEC Energy Group Inc. | 6,664,429 | 390,869 |
| | DTE Energy Co. | 3,788,881 | 373,243 |
| | Eversource Energy | 6,709,627 | 370,573 |
| | FirstEnergy Corp. | 8,991,483 | 278,466 |
| | Entergy Corp. | 3,760,547 | 276,287 |
| | American Water Works Co. Inc. | 3,709,756 | 268,438 |
| | Ameren Corp. | 5,115,316 | 268,349 |
| | ONEOK Inc. | 4,449,934 | 255,471 |
| | CMS Energy Corp. | 5,796,580 | 241,254 |
| | CenterPoint Energy Inc. | 8,616,913 | 212,321 |
| | SCANA Corp. | 2,709,475 | 198,550 |
| | Pinnacle West Capital Corp. | 2,363,366 | 184,413 |
| | Alliant Energy Corp. | 4,814,252 | 182,412 |
| | UGI Corp. | 3,675,744 | 169,378 |
| | Westar Energy Inc. Class A | 2,993,028 | 168,657 |
| | Atmos Energy Corp. | 2,198,392 | 163,011 |
| | AES Corp. | 13,988,954 | 162,552 |
| | NiSource Inc. | 6,798,443 | 150,518 |
| | Great Plains Energy Inc. | 4,466,692 | 122,164 |
| | Aqua America Inc. | 3,635,610 | 109,214 |
| | National Fuel Gas Co. | 1,708,703 | 96,781 |
| | Vectren Corp. | 1,781,811 | 92,921 |
| | IDACORP Inc. | 1,111,140 | 89,502 |
| * | Calpine Corp. | 7,596,927 | 86,833 |
| | Portland General Electric Co. | 1,951,812 | 84,572 |
| | WGL Holdings Inc. | 1,074,636 | 81,973 |
| | NRG Energy Inc. | 6,670,306 | 81,778 |
| | Hawaiian Electric Industries Inc. | 2,283,128 | 75,503 |
| | Southwest Gas Corp. | 952,916 | 73,012 |
| | Black Hills Corp. | 1,162,905 | 71,333 |
| | ONE Gas Inc. | 1,099,153 | 70,302 |
| | ALLETE Inc. | 1,062,323 | 68,190 |
| | New Jersey Resources Corp. | 1,817,280 | 64,513 |
56
| | | | | |
| Vanguard® Total Stock Market Index Fund | | | | |
| Schedule of Investments | | | | |
| December 31, 2016 | | | | |
| |
| | | | | | Market |
| | | | | | Value |
| | | | | Shares | ($000) |
| | PNM Resources Inc. | | | 1,772,187 | 60,786 |
| | Spire Inc. | | | 931,528 | 60,130 |
| | Avista Corp. | | | 1,486,614 | 59,450 |
| | NorthWestern Corp. | | | 1,030,704 | 58,616 |
| | South Jersey Industries Inc. | | | 1,675,782 | 56,457 |
| | MGE Energy Inc. | | | 842,635 | 55,024 |
| | Avangrid Inc. | | | 1,340,894 | 50,793 |
| | Ormat Technologies Inc. | | | 850,518 | 45,605 |
| | El Paso Electric Co. | | | 906,080 | 42,133 |
| | California Water Service Group | | | 1,108,292 | 37,571 |
| | Northwest Natural Gas Co. | | | 601,574 | 35,974 |
| | American States Water Co. | | | 759,874 | 34,620 |
| | Empire District Electric Co. | | | 923,557 | 31,484 |
| * | TerraForm Power Inc. Class A | | | 1,825,120 | 23,380 |
| | Chesapeake Utilities Corp. | | | 335,144 | 22,438 |
| * | Dynegy Inc. | | | 2,493,045 | 21,091 |
| | SJW Group | | | 373,840 | 20,928 |
| | Connecticut Water Service Inc. | | | 330,836 | 18,477 |
| | Unitil Corp. | | | 406,314 | 18,422 |
| | Middlesex Water Co. | | | 369,766 | 15,878 |
| | York Water Co. | | | 285,431 | 10,903 |
| *,^ | Sunrun Inc. | | | 1,496,357 | 7,946 |
| | Artesian Resources Corp. Class A | | | 226,518 | 7,235 |
| * | Atlantic Power Corp. | | | 2,261,958 | 5,655 |
| | Delta Natural Gas Co. Inc. | | | 191,597 | 5,620 |
| *,^ | Cadiz Inc. | | | 367,102 | 4,589 |
| | Gas Natural Inc. | | | 345,011 | 4,330 |
| ^ | Spark Energy Inc. Class A | | | 125,328 | 3,797 |
| * | Pure Cycle Corp. | | | 483,835 | 2,661 |
| | Genie Energy Ltd. Class B | | | 296,510 | 1,705 |
| * | US Geothermal Inc. | | | 378,870 | 1,550 |
| *,^ | Vivint Solar Inc. | | | 225,836 | 576 |
| * | AquaVenture Holdings Ltd. | | | 21,284 | 522 |
| | | | | | 15,680,773 |
| |
| Total Common Stocks (Cost $341,328,447) | | | | 496,147,408 |
| |
| | | | | Face | |
| | | | Maturity | Amount | |
| | | Coupon | Date | ($000) | |
| Convertible Bonds (0.0%) | | | | |
| |
| | Catalyst Biosciences Inc. Cvt. | | | | |
| | | 0.000% | 2/19/18 | 649 | 424 |
| Total Convertible Bonds (Cost $0) | | | | 424 |
| |
| | | | | Shares | |
| |
| Temporary Cash Investments (0.7%)1 | | | | |
| Money Market Fund (0.7%) | | | | |
| 3,4 | Vanguard Market Liquidity Fund | 0.823% | | 32,961,150 | 3,296,445 |
| |
| | | | | Face | |
| | | | | Amount | |
| | | | | ($000) | |
| U.S. Government and Agency Obligations (0.0%) | | | | |
| | United States Treasury Bill | 0.290% | 1/5/17 | 5,000 | 5,000 |
| 5 | United States Treasury Bill | 0.406% | 2/9/17 | 210 | 210 |
| | United States Treasury Bill | 0.601% | 4/27/17 | 1,900 | 1,896 |
| 5 | United States Treasury Bill | 0.564%-0.567% | 5/4/17 | 29,900 | 29,842 |
| 5 | United States Treasury Bill | 0.623% | 5/18/17 | 12,100 | 12,073 |
57
| | | | |
| Vanguard® Total Stock Market Index Fund | | | | |
| Schedule of Investments | | | | |
| December 31, 2016 | | | | |
| |
| | | | Face | Market |
| | | Maturity | Amount | Value |
| | Coupon | Date | ($000) | ($000) |
| 5,6 United States Treasury Bill | 0.607%-0.618% | 5/25/17 | 52,600 | 52,474 |
| | | | | 101,495 |
| Total Temporary Cash Investments (Cost $3,397,810) | | | | 3,397,940 |
| Total Investments (100.2%) (Cost $344,726,257) | | | | 499,545,772 |
| Other Assets and Liabilities—Net (-0.2%)4 | | | | (1,093,840) |
| Net Assets (100%) | | | | 498,451,932 |
* Non-income-producing security.
^ Includes partial security positions on loan to broker-dealers. The total value of securities on loan is $1,517,319,000.
1 The fund invests a portion of its cash reserves in equity markets through the use of index futures contracts and swap contracts. After giving
effect to futures and swap investments, the fund's effective common stock and temporary cash investment positions represent 100.0% and
0.2%, respectively, of net assets.
2 “Other” represents securities that are not classified by the fund’s benchmark index.
3 Affiliated money market fund available only to Vanguard funds and certain trusts and accounts managed by Vanguard. Rate shown is the 7-day
yield.
4 Includes $1,635,086,000 of collateral received for securities on loan.
5 Securities with a value of $92,987,000 have been segregated as initial margin for open futures contracts.
6 Securities with a value of $1,501,000 have been segregated as collateral for open over-the-counter swap contracts.
CVR—Contingent Value Rights.
REIT—Real Estate Investment Trust.
58
This page intentionally left blank.
© 2017 The Vanguard Group, Inc.
All rights reserved.
Vanguard Marketing Corporation, Distributor.
SNA850 022017
 |
| Report of Independent Registered Public Accounting Firm |
To the Board of Trustees of Vanguard Index Funds and the Shareholders of Vanguard Small-Cap Index Fund, Vanguard Small-Cap Growth Index Fund and Vanguard Small-Cap Value Index Fund:
In our opinion, the accompanying statements of net assets–investments summary and the related statements of operations and of changes in net assets and the financial highlights (included in Item 1 of this Form N-CSR) and the schedules of investments (included in Item 6 of this Form N-CSR) present fairly, in all material respects, the financial position of Vanguard Small-Cap Index Fund, Vanguard Small-Cap Growth Index Fund and Vanguard Small-Cap Value Index Fund (constituting separate portfolios of Vanguard Index Funds, hereafter referred to as the “Funds”) at December 31, 2016, the results of each of their operations for the year then ended, the changes in each of their net assets for each of the two years in the period then ended, and the financial highlights for each of the five years in the period then ended, in conformity with accounting principles generally accepted in the United States of America. These financial statements, financial highlights, and schedules of investments (hereafter referred to as "financial statements") are the responsibility of the Funds’ management. Our responsibility is to express an opinion on these financial statements based on our audits. We conducted our audits of these financial statements in accordance with the standards of the Public Company Accounting Oversight Board (United States). Those standards require that we plan and perform the audit to obtain reasonable assurance about whether the financial statements are free of material misstatement. An audit includes examining, on a test basis, evidence supporting the amounts and disclosures in the financial statements, assessing the accounting principles used and significant estimates made by management, and evaluating the overall financial statement presentation. We believe that our audits, which included confirmation of securities at December 31, 2016 by correspondence with the custodians and brokers and by agreement to the underlying ownership records of the transfer agent, provide a reasonable basis for our opinion.

February 17, 2017
PricewaterhouseCoopers LLP, Two Commerce Square, Suite 1800, 2001 Market Street, Philadelphia, PA 19103-7042
T: (267) 330 3000, F: (267) 330 3300, www.pwc.com/us
 |
| Report of Independent Registered Public Accounting Firm |
To the Board of Trustees of Vanguard Index Funds and the Shareholders of Vanguard Extended Market Index Fund:
In our opinion, the accompanying statement of net assets–investments summary and the related statements of operations and of changes in net assets and the financial highlights (included in Item 1 of this Form N-CSR) and the schedule of investments (included in Item 6 of this Form N-CSR) present fairly, in all material respects, the financial position of Vanguard Extended Market Index Fund (constituting a separate portfolio of Vanguard Index Funds, hereafter referred to as the "Fund") at December 31, 2016, the results of its operations for the year then ended, the changes in its net assets for each of the two years in the period then ended, and the financial highlights for each of the periods indicated, in conformity with accounting principles generally accepted in the United States of America. These financial statements, financial highlights, and schedule of investments (hereafter referred to as "financial statements") are the responsibility of the Fund's management. Our responsibility is to express an opinion on these financial statements based on our audits. We conducted our audits of these financial statements in accordance with the standards of the Public Company Accounting Oversight Board (United States). Those standards require that we plan and perform the audit to obtain reasonable assurance about whether the financial statements are free of material misstatement. An audit includes examining, on a test basis, evidence supporting the amounts and disclosures in the financial statements, assessing the accounting principles used and significant estimates made by management, and evaluating the overall financial statement presentation. We believe that our audits, which included confirmation of securities at December 31, 2016 by correspondence with the custodian and brokers and by agreement to the underlying ownership records of the transfer agent, provide a reasonable basis for our opinion.

February 13, 2017
PricewaterhouseCoopers LLP, Two Commerce Square, Suite 1800, 2001 Market Street, Philadelphia, PA 19103-7042
T: (267) 330 3000, F: (267) 330 3300, www.pwc.com/us
 |
| Report of Independent Registered Public Accounting Firm |
To the Board of Trustees of Vanguard Index Funds and the Shareholders of Vanguard Total Stock Market Index Fund:
In our opinion, the accompanying statement of net assets–investments summary and the related statements of operations and of changes in net assets and the financial highlights (included in Item 1 of this Form N-CSR) and the schedule of investments (included in Item 6 of this Form N-CSR) present fairly, in all material respects, the financial position of Vanguard Total Stock Market Index Fund (constituting a separate portfolio of Vanguard Index Funds, hereafter referred to as the “Fund”) at December 31, 2016, the results of its operations for the year then ended, the changes in its net assets for each of the two years in the period then ended, and the financial highlights for each of the periods indicated, in conformity with accounting principles generally accepted in the United States of America. These financial statements, financial highlights, and schedule of investments (hereafter referred to as "financial statements") are the responsibility of the Fund's management. Our responsibility is to express an opinion on these financial statements based on our audits. We conducted our audits of these financial statements in accordance with the standards of the Public Company Accounting Oversight Board (United States). Those standards require that we plan and perform the audit to obtain reasonable assurance about whether the financial statements are free of material misstatement. An audit includes examining, on a test basis, evidence supporting the amounts and disclosures in the financial statements, assessing the accounting principles used and significant estimates made by management, and evaluating the overall financial statement presentation. We believe that our audits, which included confirmation of securities at December 31, 2016 by correspondence with the custodian and brokers and by agreement to the underlying ownership records of the transfer agent, provide a reasonable basis for our opinion.

February 13, 2017
PricewaterhouseCoopers LLP, Two Commerce Square, Suite 1800, 2001 Market Street, Philadelphia, PA 19103-7042
T: (267) 330 3000, F: (267) 330 3300, www.pwc.com/us
Item 7: Disclosure of Proxy Voting Policies and Procedures for Closed-End Management
Investment Companies.
Not Applicable.
Item 8: Portfolio Managers of Closed-End Management Investment Companies.
Not Applicable.
Item 9: Purchase of Equity Securities by Closed-End Management Investment Company and
Affiliated Purchasers.
Not Applicable.
Item 10: Submission of Matters to a Vote of Security Holders.
Not Applicable.
Item 11: Controls and Procedures.
(a) Disclosure Controls and Procedures. The Principal Executive and Financial Officers concluded that the Registrant’s Disclosure Controls and Procedures are effective based on their evaluation of the Disclosure Controls and Procedures as of a date within 90 days of the filing date of this report.
(b) Internal Control Over Financial Reporting. There were no significant changes in Registrant’s Internal Control Over Financial Reporting or in other factors that could significantly affect this control subsequent to the date of the evaluation, including any corrective actions with regard to significant deficiencies and material weaknesses.
Item 12: Exhibits.
(a) Code of Ethics.
(b) Certifications.
Pursuant to the requirements of the Securities Exchange Act of 1934 and the Investment Company Act of 1940, the registrant has duly caused this report to be signed on its behalf by the undersigned, thereunto duly authorized.
| |
| | VANGUARD INDEX FUNDS |
| |
| |
| BY: | /s/ F. WILLIAM MCNABB III* |
| | F. WILLIAM MCNABB III |
| | CHIEF EXECUTIVE OFFICER |
| |
| Date: February 16, 2017 |
Pursuant to the requirements of the Securities Exchange Act of 1934 and the Investment Company Act of 1940, this report has been signed below by the following persons on behalf of the registrant and in the capacities and on the dates indicated.
| |
| | VANGUARD INDEX FUNDS |
| |
| BY: | /s/ F. WILLIAM MCNABB III* |
| | F. WILLIAM MCNABB III |
| | CHIEF EXECUTIVE OFFICER |
Date: February 16, 2017 |
| VANGUARD INDEX FUNDS |
| |
| BY: | /s/ THOMAS J. HIGGINS* |
| | THOMAS J. HIGGINS |
| | CHIEF FINANCIAL OFFICER |
Date: February 16, 2017 |
* By: /s/ Anne E. Robinson
Anne E. Robinson, pursuant to a Power of Attorney filed on October 4, 2016 see file Number
33-32548, Incorporated by Reference.