UNITED STATES
SECURITIES AND EXCHANGE COMMISSION
Washington, D.C. 20549
FORM N-CSR
CERTIFIED SHAREHOLDER REPORT
OF
REGISTERED MANAGEMENT INVESTMENT COMPANIES
Investment Company Act file number: 811-02652
| Name of Registrant: | Vanguard Index Funds |
| Address of Registrant: | P.O. Box 2600 |
| Valley Forge, PA 19482 |
| Name and address of agent for service: | Anne E. Robinson, Esquire |
| P.O. Box 876 | |
| Valley Forge, PA 19482 |
Registrant’s telephone number, including area code: (610) 669-1000
Date of fiscal year end: December 31
Date of reporting period: January 1, 2021—December 31, 2021
Item 1: Reports to Shareholders

Your Fund’s Performance at a Glance | 1 |
About Your Fund’s Expenses | 2 |
Performance Summary | 4 |
Financial Statements | 7 |
| • | For the 12 months ended December 31, 2021, returns for Vanguard 500 Index Fund ranged from 28.53% for Investor Shares to 28.70% for Institutional Select Shares, closely tracking its target index, the Standard & Poor’s 500 Index. The fund provides exposure to the stocks of the largest U.S. companies. |
| • | The U.S. economy continued to heal over the 12 months. Vaccination programs started to roll out shortly after the beginning of the year, helping hard-hit sectors such as hospitality, leisure, and travel begin to rebound, and more workers returned to the labor force. U.S. stocks turned in a strong performance even with the spread of new COVID-19 variants, a surge in inflation, and Federal Reserve monetary policy turning less accommodative. |
| • | All 11 sectors recorded positive returns for the 12 months. Information technology, financial, health care, and consumer discretionary stocks contributed most to returns. |
| • | For the 10 years ended December 31, 2021, the fund posted average annual returns of 16.39% for Investor Shares and 16.51% for both ETF Shares (based on net asset value) and Admiral Shares. Institutional Select Shares recorded an annualized return of 18.85% since their 2016 inception. |
| Average Annual Total Returns Periods Ended December 31, 2021 | |||
| One Year | Three Years | Five Years | |
| Stocks | |||
| Russell 1000 Index (Large-caps) | 26.45% | 26.21% | 18.43% |
| Russell 2000 Index (Small-caps) | 14.82 | 20.02 | 12.02 |
| Russell 3000 Index (Broad U.S. market) | 25.66 | 25.79 | 17.97 |
| FTSE All-World ex US Index (International) | 8.36 | 13.66 | 9.89 |
| Bonds | |||
| Bloomberg U.S. Aggregate Bond Index (Broad taxable market) | -1.54% | 4.79% | 3.57% |
| Bloomberg Municipal Bond Index (Broad tax-exempt market) | 1.52 | 4.73 | 4.17 |
| FTSE Three-Month U.S. Treasury Bill Index | 0.05 | 0.95 | 1.11 |
| CPI | |||
| Consumer Price Index | 7.04% | 3.53% | 2.92% |
| • | Based on actual fund return. This section helps you to estimate the actual expenses that you paid over the period. The ”Ending Account Value“ shown is derived from the fund‘s actual return, and the third column shows the dollar amount that would have been paid by an investor who started with $1,000 in the fund. You may use the information here, together with the amount you invested, to estimate the expenses that you paid over the period. |
| • | Based on hypothetical 5% yearly return. This section is intended to help you compare your fund‘s costs with those of other mutual funds. It assumes that the fund had a yearly return of 5% before expenses, but that the expense ratio is unchanged. In this case—because the return used is not the fund’s actual return—the results do not apply to your investment. The example is useful in making comparisons because the Securities and Exchange Commission requires all mutual funds to calculate expenses based on a 5% return. You can assess your fund’s costs by comparing this hypothetical example with the hypothetical examples that appear in shareholder reports of other funds. |
| Six Months Ended December 31, 2021 | |||
| Beginning Account Value 6/30/2021 | Ending Account Value 12/31/2021 | Expenses Paid During Period | |
| Based on Actual Fund Return | |||
| 500 Index Fund | |||
| Investor Shares | $1,000.00 | $1,115.90 | $0.75 |
| ETF Shares | 1,000.00 | 1,116.40 | 0.16 |
| Admiral™ Shares | 1,000.00 | 1,116.50 | 0.21 |
| Institutional Select Shares | 1,000.00 | 1,116.60 | 0.05 |
| Based on Hypothetical 5% Yearly Return | |||
| 500 Index Fund | |||
| Investor Shares | $1,000.00 | $1,024.50 | $0.71 |
| ETF Shares | 1,000.00 | 1,025.05 | 0.15 |
| Admiral Shares | 1,000.00 | 1,025.00 | 0.20 |
| Institutional Select Shares | 1,000.00 | 1,025.16 | 0.05 |

| Average Annual Total Returns Periods Ended December 31, 2021 | |||||
| One Year | Five Years | Ten Years | Final Value of a $10,000 Investment | ||
 | 500 Index Fund Investor Shares | 28.53% | 18.32% | 16.39% | $45,615 |
 | S&P 500 Index | 28.71 | 18.47 | 16.55 | 46,257 |
 | Dow Jones U.S. Total Stock Market Float Adjusted Index | 25.66 | 17.92 | 16.24 | 45,050 |
| One Year | Five Years | Ten Years | Final Value of a $10,000 Investment | ||
| 500 Index Fund ETF Shares Net Asset Value | 28.66% | 18.43% | 16.51% | $46,098 | |
| 500 Index Fund ETF Shares Market Price | 28.60 | 18.41 | 16.51 | 46,091 | |
| S&P 500 Index | 28.71 | 18.47 | 16.55 | 46,257 | |
| Dow Jones U.S. Total Stock Market Float Adjusted Index | 25.66 | 17.92 | 16.24 | 45,050 | |
| Average Annual Total Returns Periods Ended December 31, 2021 | |||||
| One Year | Five Years | Ten Years | Final Value of a $10,000 Investment | ||
| 500 Index Fund Admiral Shares | 28.66% | 18.43% | 16.51% | $46,104 | |
| S&P 500 Index | 28.71 | 18.47 | 16.55 | 46,257 | |
| Dow Jones U.S. Total Stock Market Float Adjusted Index | 25.66 | 17.92 | 16.24 | 45,050 | |
| One Year | Five Years | Since Inception (6/24/2016) | Final Value of a $5,000,000,000 Investment | ||
| 500 Index Fund Institutional Select Shares | 28.70% | 18.47% | 18.85% | $12,966,881,000 | |
| S&P 500 Index | 28.71 | 18.47 | 18.85 | 12,967,382,000 | |
| Dow Jones U.S. Total Stock Market Float Adjusted Index | 25.66 | 17.92 | 18.51 | 12,762,816,500 | |
| One Year | Five Years | Ten Years | |
| 500 Index Fund ETF Shares Market Price | 28.60% | 132.78% | 360.91% |
| 500 Index Fund ETF Shares Net Asset Value | 28.66 | 132.99 | 360.98 |
| S&P 500 Index | 28.71 | 133.41 | 362.57 |
| Communication Services | 10.1% |
| Consumer Discretionary | 12.5 |
| Consumer Staples | 5.9 |
| Energy | 2.7 |
| Financials | 10.7 |
| Health Care | 13.3 |
| Industrials | 7.8 |
| Information Technology | 29.2 |
| Materials | 2.5 |
| Real Estate | 2.8 |
| Utilities | 2.5 |
| Shares | Market Value• ($000) | ||
| Common Stocks (99.5%) | |||
| Communication Services (10.1%) | |||
| * | Alphabet Inc. Class A | 6,351,744 | 18,401,256 |
| * | Alphabet Inc. Class C | 5,904,299 | 17,084,621 |
| * | Meta Platforms Inc. Class A | 49,965,809 | 16,806,000 |
| * | Walt Disney Co. | 38,370,522 | 5,943,210 |
| * | Netflix Inc. | 9,253,346 | 5,574,586 |
| Comcast Corp. Class A | 96,278,834 | 4,845,714 | |
| Verizon Communications Inc. | 87,421,915 | 4,542,443 | |
| AT&T Inc. | 150,786,160 | 3,709,340 | |
| * | Charter Communications Inc. Class A | 2,612,343 | 1,703,169 |
| * | T-Mobile US Inc. | 12,396,695 | 1,437,769 |
| Activision Blizzard Inc. | 16,447,000 | 1,094,219 | |
| * | Match Group Inc. | 5,977,671 | 790,547 |
| Electronic Arts Inc. | 5,971,744 | 787,673 | |
| * | Twitter Inc. | 16,884,523 | 729,749 |
| * | Take-Two Interactive Software Inc. | 2,433,929 | 432,558 |
| ViacomCBS Inc. Class B | 12,816,800 | 386,811 | |
| * | Live Nation Entertainment Inc. | 2,853,715 | 341,561 |
| Omnicom Group Inc. | 4,490,815 | 329,042 | |
| Interpublic Group of Cos. Inc. | 8,315,548 | 311,417 | |
| Fox Corp. Class A | 6,662,470 | 245,845 | |
| Lumen Technologies Inc. | 19,467,926 | 244,322 | |
| News Corp. Class A | 10,810,866 | 241,190 | |
| * | DISH Network Corp. Class A | 5,275,653 | 171,142 |
| * | Discovery Inc. Class C | 6,421,220 | 147,046 |
| Fox Corp. Class B | 3,224,079 | 110,489 | |
| *,1 | Discovery Inc. Class A | 3,553,865 | 83,658 |
| News Corp. Class B | 17,331 | 390 | |
| 86,495,767 | |||
| Consumer Discretionary (12.5%) | |||
| * | Amazon.com Inc. | 9,209,552 | 30,707,778 |
| * | Tesla Inc. | 17,176,682 | 18,151,974 |
| Home Depot Inc. | 22,284,695 | 9,248,371 | |
| NIKE Inc. Class B | 26,981,667 | 4,497,034 | |
| McDonald's Corp. | 15,778,554 | 4,229,757 | |
| Lowe's Cos. Inc. | 14,621,351 | 3,779,327 | |
| Shares | Market Value• ($000) | ||
| Starbucks Corp. | 24,916,595 | 2,914,494 | |
| Target Corp. | 10,305,341 | 2,385,068 | |
| * | Booking Holdings Inc. | 867,091 | 2,080,351 |
| TJX Cos. Inc. | 25,393,046 | 1,927,840 | |
| * | General Motors Co. | 30,657,430 | 1,797,445 |
| Ford Motor Co. | 82,888,325 | 1,721,591 | |
| Dollar General Corp. | 4,926,647 | 1,161,851 | |
| * | Chipotle Mexican Grill Inc. Class A | 594,083 | 1,038,606 |
| * | O'Reilly Automotive Inc. | 1,422,827 | 1,004,843 |
| * | Marriott International Inc. Class A | 5,776,861 | 954,569 |
| * | Aptiv plc | 5,712,179 | 942,224 |
| * | AutoZone Inc. | 442,786 | 928,252 |
| * | Hilton Worldwide Holdings Inc. | 5,885,658 | 918,104 |
| eBay Inc. | 13,218,767 | 879,048 | |
| Yum! Brands Inc. | 6,189,802 | 859,516 | |
| Ross Stores Inc. | 7,504,247 | 857,585 | |
| DR Horton Inc. | 6,883,024 | 746,464 | |
| * | Dollar Tree Inc. | 4,749,262 | 667,366 |
| Lennar Corp. Class A | 5,680,476 | 659,844 | |
| * | Etsy Inc. | 2,676,689 | 586,034 |
| Tractor Supply Co. | 2,403,050 | 573,368 | |
| * | Expedia Group Inc. | 3,082,502 | 557,070 |
| VF Corp. | 6,882,694 | 503,951 | |
| Pool Corp. | 846,578 | 479,163 | |
| Best Buy Co. Inc. | 4,673,428 | 474,820 | |
| * | Ulta Beauty Inc. | 1,147,693 | 473,240 |
| * | CarMax Inc. | 3,422,212 | 445,675 |
| Garmin Ltd. | 3,209,932 | 437,096 | |
| Domino's Pizza Inc. | 768,649 | 433,772 | |
| * | Caesars Entertainment Inc. | 4,512,859 | 422,088 |
| Genuine Parts Co. | 3,006,345 | 421,490 | |
| Darden Restaurants Inc. | 2,741,661 | 413,004 | |
| * | NVR Inc. | 68,925 | 407,269 |
| Bath & Body Works Inc. | 5,582,951 | 389,634 | |
| MGM Resorts International | 8,222,887 | 369,043 | |
| * | Royal Caribbean Cruises Ltd. | 4,734,452 | 364,079 |
| * | Carnival Corp. | 16,993,500 | 341,909 |
| LKQ Corp. | 5,664,417 | 340,035 | |
| Advance Auto Parts Inc. | 1,330,290 | 319,110 | |
| PulteGroup Inc. | 5,346,798 | 305,623 |
| Shares | Market Value• ($000) | ||
| Whirlpool Corp. | 1,283,210 | 301,118 | |
| Hasbro Inc. | 2,739,095 | 278,785 | |
| * | Las Vegas Sands Corp. | 7,257,330 | 273,166 |
| Tapestry Inc. | 5,812,165 | 235,974 | |
| BorgWarner Inc. (XNYS) | 5,063,481 | 228,211 | |
| * | Mohawk Industries Inc. | 1,159,013 | 211,149 |
| * | Wynn Resorts Ltd. | 2,221,559 | 188,921 |
| * | Penn National Gaming Inc. | 3,504,895 | 181,729 |
| Newell Brands Inc. | 7,989,948 | 174,501 | |
| * | Norwegian Cruise Line Holdings Ltd. | 7,813,664 | 162,055 |
| PVH Corp. | 1,500,162 | 159,992 | |
| Ralph Lauren Corp. Class A | 1,029,764 | 122,398 | |
| * | Under Armour Inc. Class A | 4,034,912 | 85,500 |
| * | Under Armour Inc. Class C | 4,483,284 | 80,878 |
| Gap Inc. | 4,524,159 | 79,851 | |
| Lennar Corp. Class B | 76,975 | 7,360 | |
| 106,888,363 | |||
| Consumer Staples (5.8%) | |||
| Procter & Gamble Co. | 51,098,083 | 8,358,625 | |
| Costco Wholesale Corp. | 9,329,431 | 5,296,318 | |
| PepsiCo Inc. | 29,195,493 | 5,071,549 | |
| Coca-Cola Co. | 82,086,409 | 4,860,336 | |
| Walmart Inc. | 30,029,188 | 4,344,923 | |
| Philip Morris International Inc. | 32,874,372 | 3,123,065 | |
| Mondelez International Inc. Class A | 29,456,333 | 1,953,250 | |
| Altria Group Inc. | 38,790,192 | 1,838,267 | |
| Estee Lauder Cos. Inc. Class A | 4,892,720 | 1,811,285 | |
| Colgate-Palmolive Co. | 17,796,968 | 1,518,793 | |
| Kimberly-Clark Corp. | 7,109,810 | 1,016,134 | |
| Constellation Brands Inc. Class A | 3,468,702 | 870,540 | |
| General Mills Inc. | 12,787,772 | 861,640 | |
| Sysco Corp. | 10,825,346 | 850,331 | |
| Archer-Daniels-Midland Co. | 11,813,109 | 798,448 | |
| Walgreens Boots Alliance Inc. | 15,171,086 | 791,324 | |
| * | Monster Beverage Corp. | 7,933,550 | 761,938 |
| Kroger Co. | 13,288,538 | 601,439 | |
| Hershey Co. | 3,070,247 | 594,001 | |
| Tyson Foods Inc. Class A | 6,224,128 | 542,495 | |
| Kraft Heinz Co. | 14,987,998 | 538,069 | |
| Church & Dwight Co. Inc. | 5,157,372 | 528,631 | |
| McCormick & Co. Inc. | 5,264,132 | 508,568 | |
| Clorox Co. | 2,595,235 | 452,505 | |
| Kellogg Co. | 5,403,844 | 348,116 | |
| Conagra Brands Inc. | 10,127,816 | 345,865 | |
| J M Smucker Co. | 2,288,397 | 310,810 | |
| Hormel Foods Corp. | 5,959,604 | 290,888 | |
| Brown-Forman Corp. Class B | 3,857,510 | 281,058 | |
| Shares | Market Value• ($000) | ||
| Lamb Weston Holdings Inc. | 3,085,362 | 195,550 | |
| Campbell Soup Co. | 4,273,787 | 185,739 | |
| Molson Coors Beverage Co. Class B | 3,976,717 | 184,321 | |
| 50,034,821 | |||
| Energy (2.7%) | |||
| Exxon Mobil Corp. | 89,394,613 | 5,470,056 | |
| Chevron Corp. | 40,704,332 | 4,776,653 | |
| ConocoPhillips | 27,851,211 | 2,010,301 | |
| EOG Resources Inc. | 12,355,008 | 1,097,495 | |
| Schlumberger NV | 29,620,199 | 887,125 | |
| Pioneer Natural Resources Co. | 4,794,427 | 872,011 | |
| Marathon Petroleum Corp. | 12,999,125 | 831,814 | |
| Phillips 66 | 9,252,046 | 670,403 | |
| Kinder Morgan Inc. | 41,173,348 | 653,009 | |
| Valero Energy Corp. | 8,632,557 | 648,391 | |
| Williams Cos. Inc. | 24,055,298 | 626,400 | |
| Devon Energy Corp. | 13,293,003 | 585,557 | |
| ONEOK Inc. | 9,415,331 | 553,245 | |
| Occidental Petroleum Corp. | 18,733,015 | 543,070 | |
| Baker Hughes Co. Class A | 18,450,200 | 443,912 | |
| Halliburton Co. | 18,895,629 | 432,143 | |
| Hess Corp. | 5,819,168 | 430,793 | |
| Diamondback Energy Inc. | 3,597,560 | 387,997 | |
| Coterra Energy Inc. | 17,186,066 | 326,535 | |
| Marathon Oil Corp. | 16,445,569 | 270,036 | |
| APA Corp. | 7,674,356 | 206,364 | |
| 22,723,310 | |||
| Financials (10.6%) | |||
| *,1 | Berkshire Hathaway Inc. Class B | 38,670,223 | 11,562,397 |
| JPMorgan Chase & Co. | 62,402,281 | 9,881,401 | |
| Bank of America Corp. | 152,075,109 | 6,765,822 | |
| Wells Fargo & Co. | 84,193,451 | 4,039,602 | |
| Morgan Stanley | 30,312,426 | 2,975,468 | |
| BlackRock Inc. | 3,015,420 | 2,760,798 | |
| Goldman Sachs Group Inc. | 7,146,344 | 2,733,834 | |
| Charles Schwab Corp. | 31,745,380 | 2,669,786 | |
| Citigroup Inc. | 41,899,065 | 2,530,284 | |
| S&P Global Inc. | 5,088,951 | 2,401,629 | |
| American Express Co. | 13,247,988 | 2,167,371 | |
| Marsh & McLennan Cos. Inc. | 10,660,947 | 1,853,086 | |
| PNC Financial Services Group Inc. | 8,924,536 | 1,789,548 | |
| Chubb Ltd. | 9,095,347 | 1,758,221 | |
| CME Group Inc. | 7,588,973 | 1,733,777 | |
| Truist Financial Corp. | 28,188,473 | 1,650,435 | |
| Intercontinental Exchange Inc. | 11,896,798 | 1,627,125 | |
| US Bancorp | 28,492,949 | 1,600,449 | |
| Aon plc Class A (XNYS) | 4,652,457 | 1,398,342 | |
| Moody's Corp. | 3,415,146 | 1,333,888 | |
| Capital One Financial Corp. | 8,987,516 | 1,303,999 | |
| Progressive Corp. | 12,353,830 | 1,268,121 | |
| MSCI Inc. Class A | 1,741,040 | 1,066,718 | |
| Shares | Market Value• ($000) | ||
| American International Group Inc. | 17,532,288 | 996,886 | |
| MetLife Inc. | 15,096,733 | 943,395 | |
| T Rowe Price Group Inc. | 4,746,071 | 933,267 | |
| Bank of New York Mellon Corp. | 16,043,248 | 931,792 | |
| Prudential Financial Inc. | 7,981,116 | 863,876 | |
| * | SVB Financial Group | 1,239,274 | 840,525 |
| Travelers Cos. Inc. | 5,194,499 | 812,575 | |
| First Republic Bank | 3,785,321 | 781,707 | |
| Aflac Inc. | 12,850,506 | 750,341 | |
| Arthur J Gallagher & Co. | 4,376,817 | 742,615 | |
| Discover Financial Services | 6,188,552 | 715,149 | |
| Ameriprise Financial Inc. | 2,362,677 | 712,725 | |
| Allstate Corp. | 6,053,206 | 712,160 | |
| Fifth Third Bancorp | 14,437,222 | 628,741 | |
| Willis Towers Watson plc | 2,631,160 | 624,874 | |
| State Street Corp. | 5,809,229 | 540,258 | |
| Synchrony Financial | 11,554,466 | 536,012 | |
| Northern Trust Corp. | 4,384,246 | 524,400 | |
| Nasdaq Inc. | 2,471,283 | 518,994 | |
| Hartford Financial Services Group Inc. | 7,185,524 | 496,089 | |
| Huntington Bancshares Inc. | 30,537,906 | 470,894 | |
| KeyCorp. | 19,668,975 | 454,943 | |
| Regions Financial Corp. | 20,131,615 | 438,869 | |
| Citizens Financial Group Inc. | 9,003,050 | 425,394 | |
| M&T Bank Corp. | 2,717,419 | 417,341 | |
| Raymond James Financial Inc. | 3,911,557 | 392,720 | |
| FactSet Research Systems Inc. | 794,018 | 385,901 | |
| Principal Financial Group Inc. | 5,203,379 | 376,360 | |
| Cincinnati Financial Corp. | 3,164,298 | 360,508 | |
| Signature Bank | 1,078,974 | 349,016 | |
| Brown & Brown Inc. | 4,951,754 | 348,009 | |
| MarketAxess Holdings Inc. | 803,248 | 330,352 | |
| Cboe Global Markets Inc. | 2,251,954 | 293,655 | |
| Lincoln National Corp. | 3,588,508 | 244,952 | |
| Loews Corp. | 4,233,813 | 244,545 | |
| W R Berkley Corp. | 2,948,140 | 242,897 | |
| Comerica Inc. | 2,770,344 | 241,020 | |
| Everest Re Group Ltd. | 831,794 | 227,845 | |
| Zions Bancorp NA | 3,301,033 | 208,493 | |
| Franklin Resources Inc. | 5,929,553 | 198,581 | |
| Assurant Inc. | 1,203,584 | 187,591 | |
| Globe Life Inc. | 1,962,662 | 183,941 | |
| Invesco Ltd. | 7,209,437 | 165,961 | |
| People's United Financial Inc. | 9,036,824 | 161,036 | |
| 90,829,306 |
| Shares | Market Value• ($000) | ||
| Health Care (13.2%) | |||
| UnitedHealth Group Inc. | 19,887,839 | 9,986,479 | |
| Johnson & Johnson | 55,589,131 | 9,509,633 | |
| Pfizer Inc. | 118,520,023 | 6,998,607 | |
| Thermo Fisher Scientific Inc. | 8,320,610 | 5,551,844 | |
| Abbott Laboratories | 37,338,408 | 5,255,008 | |
| AbbVie Inc. | 37,330,320 | 5,054,525 | |
| Eli Lilly & Co. | 16,765,305 | 4,630,913 | |
| Danaher Corp. | 13,429,019 | 4,418,282 | |
| Merck & Co. Inc. | 53,337,302 | 4,087,771 | |
| Medtronic plc | 28,417,486 | 2,939,789 | |
| Bristol-Myers Squibb Co. | 46,869,989 | 2,922,344 | |
| CVS Health Corp. | 27,874,078 | 2,875,490 | |
| * | Intuitive Surgical Inc. | 7,537,706 | 2,708,298 |
| Amgen Inc. | 11,893,889 | 2,675,768 | |
| Zoetis Inc. | 9,990,610 | 2,438,009 | |
| Anthem Inc. | 5,125,171 | 2,375,722 | |
| Gilead Sciences Inc. | 26,487,721 | 1,923,273 | |
| Stryker Corp. | 7,089,453 | 1,895,862 | |
| * | Moderna Inc. | 7,448,424 | 1,891,751 |
| * | Edwards Lifesciences Corp. | 13,183,357 | 1,707,904 |
| Cigna Corp. | 6,998,461 | 1,607,057 | |
| Becton Dickinson and Co. | 6,064,158 | 1,525,014 | |
| * | Regeneron Pharmaceuticals Inc. | 2,232,398 | 1,409,804 |
| HCA Healthcare Inc. | 5,057,084 | 1,299,266 | |
| * | Boston Scientific Corp. | 30,090,010 | 1,278,224 |
| Humana Inc. | 2,714,129 | 1,258,976 | |
| * | Illumina Inc. | 3,300,395 | 1,255,602 |
| * | Vertex Pharmaceuticals Inc. | 5,368,919 | 1,179,015 |
| * | IDEXX Laboratories Inc. | 1,790,501 | 1,178,973 |
| * | IQVIA Holdings Inc. | 4,034,071 | 1,138,173 |
| * | DexCom Inc. | 2,046,559 | 1,098,900 |
| Agilent Technologies Inc. | 6,392,510 | 1,020,564 | |
| * | Align Technology Inc. | 1,548,470 | 1,017,623 |
| * | Centene Corp. | 12,321,378 | 1,015,282 |
| Baxter International Inc. | 10,572,399 | 907,535 | |
| * | Mettler-Toledo International Inc. | 485,343 | 823,729 |
| ResMed Inc. | 3,076,953 | 801,485 | |
| McKesson Corp. | 3,224,126 | 801,421 | |
| * | Biogen Inc. | 3,101,759 | 744,174 |
| West Pharmaceutical Services Inc. | 1,564,279 | 733,662 | |
| * | Laboratory Corp. of America Holdings | 2,020,626 | 634,901 |
| Cerner Corp. | 6,212,339 | 576,940 | |
| Zimmer Biomet Holdings Inc. | 4,410,693 | 560,334 | |
| PerkinElmer Inc. | 2,665,427 | 535,911 | |
| STERIS plc | 2,111,608 | 513,986 | |
| * | Waters Corp. | 1,288,702 | 480,170 |
| * | Catalent Inc. | 3,613,867 | 462,683 |
| Quest Diagnostics Inc. | 2,589,556 | 448,019 | |
| Cooper Cos. Inc. | 1,041,378 | 436,275 | |
| Shares | Market Value• ($000) | ||
| Bio-Techne Corp. | 829,576 | 429,173 | |
| AmerisourceBergen Corp. Class A | 3,158,214 | 419,695 | |
| * | Hologic Inc. | 5,352,654 | 409,799 |
| * | Charles River Laboratories International Inc. | 1,065,297 | 401,383 |
| Viatris Inc. | 25,533,366 | 345,466 | |
| * | ABIOMED Inc. | 961,003 | 345,163 |
| * | Bio-Rad Laboratories Inc. Class A | 456,135 | 344,642 |
| Teleflex Inc. | 989,637 | 325,076 | |
| Cardinal Health Inc. | 5,947,498 | 306,237 | |
| * | Incyte Corp. | 3,963,011 | 290,885 |
| DENTSPLY SIRONA Inc. | 4,616,408 | 257,549 | |
| * | Henry Schein Inc. | 2,929,617 | 227,133 |
| Universal Health Services Inc. Class B | 1,544,805 | 200,299 | |
| Organon & Co. | 5,351,991 | 162,968 | |
| * | DaVita Inc. | 1,377,694 | 156,726 |
| 113,213,164 | |||
| Industrials (7.7%) | |||
| Union Pacific Corp. | 13,574,807 | 3,419,901 | |
| United Parcel Service Inc. Class B | 15,396,529 | 3,300,092 | |
| Honeywell International Inc. | 14,536,702 | 3,031,048 | |
| Raytheon Technologies Corp. | 31,605,319 | 2,719,954 | |
| Caterpillar Inc. | 11,422,477 | 2,361,483 | |
| * | Boeing Co. | 11,665,095 | 2,348,417 |
| General Electric Co. | 23,188,306 | 2,190,599 | |
| 3M Co. | 12,168,032 | 2,161,408 | |
| Deere & Co. | 5,957,931 | 2,042,915 | |
| Lockheed Martin Corp. | 5,182,727 | 1,841,993 | |
| CSX Corp. | 46,835,046 | 1,760,998 | |
| Norfolk Southern Corp. | 5,138,472 | 1,529,774 | |
| Illinois Tool Works Inc. | 6,031,215 | 1,488,504 | |
| Eaton Corp. plc | 8,416,697 | 1,454,574 | |
| Waste Management Inc. | 8,126,436 | 1,356,302 | |
| FedEx Corp. | 5,160,644 | 1,334,749 | |
| Northrop Grumman Corp. | 3,146,826 | 1,218,042 | |
| Johnson Controls International plc | 14,965,753 | 1,216,865 | |
| Emerson Electric Co. | 12,623,073 | 1,173,567 | |
| IHS Markit Ltd. | 8,421,898 | 1,119,439 | |
| Roper Technologies Inc. | 2,227,519 | 1,095,627 | |
| General Dynamics Corp. | 4,893,675 | 1,020,184 | |
| Trane Technologies plc | 5,016,233 | 1,013,430 | |
| Carrier Global Corp. | 18,299,495 | 992,565 | |
| L3Harris Technologies Inc. | 4,143,569 | 883,575 | |
| Parker-Hannifin Corp. | 2,726,167 | 867,248 | |
| Rockwell Automation Inc. | 2,449,122 | 854,376 | |
| Cintas Corp. | 1,856,154 | 822,592 | |
| Otis Worldwide Corp. | 8,969,349 | 780,961 | |
| Verisk Analytics Inc. Class A | 3,402,994 | 778,367 | |
| Fastenal Co. | 12,145,434 | 778,037 | |
| Shares | Market Value• ($000) | ||
| Equifax Inc. | 2,576,089 | 754,253 | |
| AMETEK Inc. | 4,884,680 | 718,243 | |
| Old Dominion Freight Line Inc. | 1,967,007 | 704,936 | |
| * | TransDigm Group Inc. | 1,105,447 | 703,374 |
| * | Copart Inc. | 4,505,954 | 683,193 |
| Cummins Inc. | 3,020,191 | 658,824 | |
| Stanley Black & Decker Inc. | 3,442,362 | 649,298 | |
| PACCAR Inc. | 7,330,612 | 647,000 | |
| Republic Services Inc. Class A | 4,418,679 | 616,185 | |
| Fortive Corp. | 7,570,754 | 577,573 | |
| Dover Corp. | 3,039,799 | 552,027 | |
| * | Southwest Airlines Co. | 12,496,818 | 535,364 |
| Ingersoll Rand Inc. | 8,605,218 | 532,405 | |
| * | Delta Air Lines Inc. | 13,511,501 | 528,029 |
| * | United Rentals Inc. | 1,528,531 | 507,916 |
| Expeditors International of Washington Inc. | 3,576,200 | 480,248 | |
| WW Grainger Inc. | 913,643 | 473,486 | |
| * | Generac Holdings Inc. | 1,332,167 | 468,816 |
| Xylem Inc. | 3,806,831 | 456,515 | |
| Jacobs Engineering Group Inc. | 2,751,785 | 383,131 | |
| IDEX Corp. | 1,604,980 | 379,289 | |
| Westinghouse Air Brake Technologies Corp. | 3,946,601 | 363,521 | |
| JB Hunt Transport Services Inc. | 1,774,184 | 362,643 | |
| Masco Corp. | 5,156,257 | 362,072 | |
| Textron Inc. | 4,656,005 | 359,444 | |
| Quanta Services Inc. | 3,010,190 | 345,148 | |
| Fortune Brands Home & Security Inc. | 2,867,466 | 306,532 | |
| * | United Airlines Holdings Inc. | 6,840,696 | 299,486 |
| CH Robinson Worldwide Inc. | 2,745,976 | 295,549 | |
| Leidos Holdings Inc. | 2,964,342 | 263,530 | |
| Robert Half International Inc. | 2,351,477 | 262,237 | |
| Howmet Aerospace Inc. | 8,122,329 | 258,534 | |
| Pentair plc | 3,494,110 | 255,175 | |
| Allegion plc | 1,893,291 | 250,747 | |
| * | American Airlines Group Inc. | 13,669,677 | 245,507 |
| Snap-on Inc. | 1,134,956 | 244,447 | |
| A O Smith Corp. | 2,810,498 | 241,281 | |
| Rollins Inc. | 4,780,239 | 163,532 | |
| Huntington Ingalls Industries Inc. | 845,194 | 157,832 | |
| Nielsen Holdings plc | 7,572,104 | 155,304 | |
| * | Alaska Air Group Inc. | 2,644,976 | 137,803 |
| 66,298,015 | |||
| Information Technology (29.0%) | |||
| Apple Inc. | 329,111,779 | 58,440,379 | |
| Microsoft Corp. | 158,536,434 | 53,318,974 | |
| NVIDIA Corp. | 52,789,400 | 15,525,890 | |
| Visa Inc. Class A | 35,161,122 | 7,619,767 | |
| Mastercard Inc. Class A | 18,317,734 | 6,581,928 | |
| Broadcom Inc. | 8,691,603 | 5,783,480 | |
| * | Adobe Inc. | 10,046,860 | 5,697,172 |
| Shares | Market Value• ($000) | ||
| Cisco Systems Inc. | 89,058,783 | 5,643,655 | |
| Accenture plc Class A | 13,337,578 | 5,529,093 | |
| * | salesforce.com Inc. | 20,672,360 | 5,253,467 |
| * | PayPal Holdings Inc. | 24,809,649 | 4,678,604 |
| Intel Corp. | 85,877,844 | 4,422,709 | |
| QUALCOMM Inc. | 23,649,770 | 4,324,833 | |
| Intuit Inc. | 5,979,319 | 3,846,018 | |
| Texas Instruments Inc. | 19,501,073 | 3,675,367 | |
| * | Advanced Micro Devices Inc. | 25,499,769 | 3,669,417 |
| Applied Materials Inc. | 19,066,347 | 3,000,280 | |
| Oracle Corp. | 34,056,947 | 2,970,106 | |
| * | ServiceNow Inc. | 4,202,082 | 2,727,613 |
| International Business Machines Corp. | 18,936,466 | 2,531,048 | |
| Micron Technology Inc. | 23,620,704 | 2,200,269 | |
| Automatic Data Processing Inc. | 8,897,882 | 2,194,040 | |
| Lam Research Corp. | 2,973,148 | 2,138,139 | |
| Analog Devices Inc. | 11,348,173 | 1,994,668 | |
| Fidelity National Information Services Inc. | 12,858,289 | 1,403,482 | |
| KLA Corp. | 3,201,716 | 1,377,090 | |
| * | Autodesk Inc. | 4,642,420 | 1,305,402 |
| * | Fiserv Inc. | 12,547,330 | 1,302,287 |
| NXP Semiconductors NV | 5,615,583 | 1,279,118 | |
| * | Synopsys Inc. | 3,220,325 | 1,186,690 |
| TE Connectivity Ltd. | 6,890,828 | 1,111,766 | |
| Xilinx Inc. | 5,234,376 | 1,109,845 | |
| Amphenol Corp. Class A | 12,629,171 | 1,104,547 | |
| * | Cadence Design Systems Inc. | 5,852,275 | 1,090,571 |
| * | Fortinet Inc. | 2,865,589 | 1,029,893 |
| Microchip Technology Inc. | 11,717,495 | 1,020,125 | |
| Cognizant Technology Solutions Corp. Class A | 11,091,227 | 984,014 | |
| Motorola Solutions Inc. | 3,566,726 | 969,079 | |
| Paychex Inc. | 6,776,691 | 925,018 | |
| HP Inc. | 24,338,266 | 916,822 | |
| Global Payments Inc. | 6,126,973 | 828,244 | |
| * | Keysight Technologies Inc. | 3,889,701 | 803,262 |
| * | EPAM Systems Inc. | 1,197,647 | 800,567 |
| * | ANSYS Inc. | 1,842,513 | 739,069 |
| * | Arista Networks Inc. | 4,736,575 | 680,883 |
| * | Zebra Technologies Corp. Class A | 1,128,326 | 671,580 |
| Corning Inc. | 16,219,893 | 603,867 | |
| CDW Corp. | 2,865,761 | 586,851 | |
| * | Gartner Inc. | 1,736,334 | 580,491 |
| Teradyne Inc. | 3,441,720 | 562,824 | |
| Skyworks Solutions Inc. | 3,486,839 | 540,948 | |
| * | Enphase Energy Inc. | 2,848,283 | 521,065 |
| * | VeriSign Inc. | 2,040,069 | 517,810 |
| Seagate Technology Holdings plc | 4,324,390 | 488,570 | |
| * | Tyler Technologies Inc. | 865,534 | 465,614 |
| * | Trimble Inc. | 5,299,395 | 462,054 |
| Monolithic Power Systems Inc. | 914,705 | 451,251 |
| Shares | Market Value• ($000) | ||
| Broadridge Financial Solutions Inc. | 2,460,981 | 449,917 | |
| Hewlett Packard Enterprise Co. | 27,613,898 | 435,471 | |
| NetApp Inc. | 4,722,125 | 434,388 | |
| * | Teledyne Technologies Inc. | 984,964 | 430,321 |
| * | Western Digital Corp. | 6,578,299 | 428,971 |
| * | Paycom Software Inc. | 1,016,197 | 421,915 |
| * | Akamai Technologies Inc. | 3,430,556 | 401,512 |
| * | FleetCor Technologies Inc. | 1,715,241 | 383,940 |
| * | Qorvo Inc. | 2,328,432 | 364,144 |
| NortonLifeLock Inc. | 12,288,551 | 319,257 | |
| * | F5 Inc. | 1,272,969 | 311,508 |
| * | SolarEdge Technologies Inc. | 1,107,970 | 310,863 |
| * | Ceridian HCM Holding Inc. | 2,877,012 | 300,533 |
| * | PTC Inc. | 2,229,912 | 270,154 |
| Jack Henry & Associates Inc. | 1,563,725 | 261,126 | |
| Citrix Systems Inc. | 2,634,684 | 249,215 | |
| Juniper Networks Inc. | 6,867,429 | 245,236 | |
| * | DXC Technology Co. | 5,326,559 | 171,462 |
| * | IPG Photonics Corp. | 753,187 | 129,654 |
| * | GreenSky Inc. Class A | 719,667 | 8,175 |
| 248,515,377 | |||
| Materials (2.6%) | |||
| Linde plc | 10,822,950 | 3,749,395 | |
| Sherwin-Williams Co. | 5,093,540 | 1,793,741 | |
| Air Products and Chemicals Inc. | 4,674,209 | 1,422,175 | |
| Freeport-McMoRan Inc. | 31,008,361 | 1,293,979 | |
| Ecolab Inc. | 5,264,342 | 1,234,962 | |
| Newmont Corp. | 16,838,318 | 1,044,313 | |
| Dow Inc. | 15,617,424 | 885,820 | |
| DuPont de Nemours Inc. | 10,940,158 | 883,746 | |
| PPG Industries Inc. | 5,012,939 | 864,431 | |
| International Flavors & Fragrances Inc. | 5,374,518 | 809,671 | |
| Corteva Inc. | 15,391,796 | 727,724 | |
| Nucor Corp. | 6,034,868 | 688,880 | |
| Ball Corp. | 6,838,913 | 658,382 | |
| Vulcan Materials Co. | 2,801,775 | 581,592 | |
| Martin Marietta Materials Inc. | 1,317,063 | 580,193 | |
| Albemarle Corp. | 2,469,804 | 577,366 | |
| LyondellBasell Industries NV Class A | 5,550,308 | 511,905 | |
| Amcor plc | 32,388,749 | 388,989 | |
| Celanese Corp. Class A | 2,299,757 | 386,497 | |
| International Paper Co. | 8,180,892 | 384,338 | |
| Avery Dennison Corp. | 1,748,210 | 378,610 | |
| Eastman Chemical Co. | 2,839,928 | 343,376 | |
| CF Industries Holdings Inc. | 4,530,516 | 320,670 | |
| Mosaic Co. | 7,818,320 | 307,182 | |
| FMC Corp. | 2,677,577 | 294,239 | |
| Packaging Corp. of America | 2,005,210 | 273,009 | |
| Shares | Market Value• ($000) | ||
| Westrock Co. | 5,634,366 | 249,941 | |
| Sealed Air Corp. | 3,129,823 | 211,169 | |
| 21,846,295 | |||
| Real Estate (2.8%) | |||
| American Tower Corp. | 9,616,381 | 2,812,791 | |
| Prologis Inc. | 15,611,398 | 2,628,335 | |
| Crown Castle International Corp. | 9,126,261 | 1,905,016 | |
| Equinix Inc. | 1,901,252 | 1,608,155 | |
| Public Storage | 3,221,392 | 1,206,604 | |
| Simon Property Group Inc. | 6,938,952 | 1,108,636 | |
| Digital Realty Trust Inc. | 5,992,422 | 1,059,880 | |
| SBA Communications Corp. Class A | 2,297,015 | 893,585 | |
| Realty Income Corp. | 11,946,429 | 855,245 | |
| Welltower Inc. | 9,190,997 | 788,312 | |
| * | CBRE Group Inc. Class A | 7,066,853 | 766,824 |
| AvalonBay Communities Inc. | 2,950,711 | 745,320 | |
| Alexandria Real Estate Equities Inc. | 2,977,456 | 663,854 | |
| Equity Residential | 7,205,516 | 652,099 | |
| Weyerhaeuser Co. | 15,815,680 | 651,290 | |
| Extra Space Storage Inc. | 2,826,939 | 640,952 | |
| Mid-America Apartment Communities Inc. | 2,430,730 | 557,707 | |
| Duke Realty Corp. | 8,040,282 | 527,764 | |
| Essex Property Trust Inc. | 1,374,153 | 484,018 | |
| Ventas Inc. | 8,432,000 | 431,044 | |
| Healthpeak Properties Inc. | 11,387,230 | 410,965 | |
| UDR Inc. | 6,138,512 | 368,249 | |
| Boston Properties Inc. | 3,002,675 | 345,848 | |
| Kimco Realty Corp. | 13,020,753 | 320,961 | |
| Iron Mountain Inc. | 6,114,177 | 319,955 | |
| * | Host Hotels & Resorts Inc. | 15,071,818 | 262,099 |
| Regency Centers Corp. | 3,254,690 | 245,241 | |
| Federal Realty Investment Trust | 1,477,568 | 201,422 | |
| Vornado Realty Trust | 3,357,544 | 140,547 | |
| 23,602,718 | |||
| Utilities (2.5%) | |||
| NextEra Energy Inc. | 41,432,126 | 3,868,103 | |
| Duke Energy Corp. | 16,242,395 | 1,703,827 | |
| Southern Co. | 22,378,603 | 1,534,725 | |
| Dominion Energy Inc. | 17,101,530 | 1,343,496 | |
| Exelon Corp. | 20,658,803 | 1,193,252 | |
| American Electric Power Co. Inc. | 10,635,120 | 946,207 | |
| Shares | Market Value• ($000) | ||
| Sempra Energy (XNYS) | 6,743,207 | 891,991 | |
| Xcel Energy Inc. | 11,374,431 | 770,049 | |
| American Water Works Co. Inc. | 3,833,033 | 723,907 | |
| Public Service Enterprise Group Inc. | 10,677,244 | 712,492 | |
| Eversource Energy | 7,259,242 | 660,446 | |
| WEC Energy Group Inc. | 6,659,806 | 646,467 | |
| Edison International | 8,020,951 | 547,430 | |
| DTE Energy Co. | 4,090,822 | 489,017 | |
| Ameren Corp. | 5,438,152 | 484,050 | |
| Consolidated Edison Inc. | 5,658,618 | 482,793 | |
| Entergy Corp. | 4,245,326 | 478,236 | |
| FirstEnergy Corp. | 11,492,888 | 477,989 | |
| PPL Corp. | 15,847,661 | 476,381 | |
| CMS Energy Corp. | 6,119,366 | 398,065 | |
| CenterPoint Energy Inc. | 13,282,544 | 370,716 | |
| AES Corp. | 14,072,154 | 341,953 | |
| Evergy Inc. | 4,842,582 | 332,250 | |
| Alliant Energy Corp. | 5,286,240 | 324,945 | |
| Atmos Energy Corp. | 2,797,344 | 293,078 | |
| NiSource Inc. | 8,298,606 | 229,125 | |
| NRG Energy Inc. | 5,168,885 | 222,676 | |
| Pinnacle West Capital Corp. | 2,380,712 | 168,054 | |
| 21,111,720 | |||
| Total Common Stocks (Cost $429,622,523) | 851,558,856 | ||
| Temporary Cash Investments (0.4%) | |||
| Money Market Fund (0.4%) | |||
| 2,3 | Vanguard Market Liquidity Fund, 0.090% (Cost $3,943,293) | 39,443,395 | 3,943,945 |
| Total Investments (99.9%) (Cost $433,565,816) | 855,502,801 | ||
| Other Assets and Liabilities—Net (0.1%) | 578,715 | ||
| Net Assets (100%) | 856,081,516 | ||
| Cost is in $000. | |||
| • | See Note A in Notes to Financial Statements. |
| * | Non-income-producing security. |
| 1 | Includes partial security positions on loan to broker-dealers. The total value of securities on loan is $31,699,000. |
| 2 | Affiliated money market fund available only to Vanguard funds and certain trusts and accounts managed by Vanguard. Rate shown is the 7-day yield. |
| 3 | Collateral of $33,645,000 was received for securities on loan. |
| Futures Contracts | ||||
| ($000) | ||||
| Expiration | Number of Long (Short) Contracts | Notional Amount | Value and Unrealized Appreciation (Depreciation) | |
| Long Futures Contracts | ||||
| E-mini S&P 500 Index | March 2022 | 17,007 | 4,046,390 | 90,333 |
| Over-the-Counter Total Return Swaps | ||||||
| Reference Entity | Termination Date | Counterparty | Notional Amount ($000) | Floating Interest Rate Received (Paid) (%) | Value and Unrealized Appreciation ($000) | Value and Unrealized (Depreciation) ($000) |
| Consolidated Edison Inc. | 8/31/22 | BANA | 154,429 | (0.570)1 | 1,781 | — |
| Kroger Co. | 1/31/22 | GSI | 46,220 | (0.108)2 | — | (962) |
| Netflix Inc. | 8/31/22 | BANA | 60,244 | (0.070)1 | — | (4) |
| Signature Bank | 8/31/23 | BANA | 64,694 | (0.820)1 | — | (15) |
| State Street Corp. | 8/31/23 | BANA | 176,700 | (0.670)1 | 988 | — |
| Visa Inc. Class A | 8/31/22 | BANA | 54,178 | 0.0301 | 95 | — |
| Williams Cos. Inc. | 8/31/22 | BANA | 41,664 | (0.470)1 | 959 | — |
| 3,823 | (981) | |||||
| 1 | Based on 1M USD Overnight Bank Funding Rate as of the most recent payment date. Floating interest payment received/paid monthly. |
| 2 | Based on 1M USD London Interbank Offered Rate (LIBOR) as of the most recent payment date. Floating interest payment received/paid monthly. |
| 1M—1-month. | |
| BANA—Bank of America, N.A. | |
| GSI—Goldman Sachs International. |
| ($000s, except shares and per-share amounts) | Amount |
| Assets | |
| Investments in Securities, at Value | |
| Unaffiliated Issuers (Cost $429,622,523) | 851,558,856 |
| Affiliated Issuers (Cost $3,943,293) | 3,943,945 |
| Total Investments in Securities | 855,502,801 |
| Investment in Vanguard | 27,259 |
| Cash Collateral Pledged—Futures Contracts | 195,589 |
| Cash Collateral Pledged—Over-the-Counter Swap Contracts | 1,090 |
| Receivables for Investment Securities Sold | 388,831 |
| Receivables for Accrued Income | 528,014 |
| Receivables for Capital Shares Issued | 453,802 |
| Unrealized Appreciation—Over-the-Counter Swap Contracts | 3,823 |
| Total Assets | 857,101,209 |
| Liabilities | |
| Due to Custodian | 14,165 |
| Payables for Investment Securities Purchased | 34,377 |
| Collateral for Securities on Loan | 33,645 |
| Payables for Capital Shares Redeemed | 912,564 |
| Payables to Vanguard | 12,269 |
| Variation Margin Payable—Futures Contracts | 11,692 |
| Unrealized Depreciation—Over-the-Counter Swap Contracts | 981 |
| Total Liabilities | 1,019,693 |
| Net Assets | 856,081,516 |
| Statement of Assets and Liabilities (continued) | |
| At December 31, 2021, net assets consisted of: | |
| ($000s, except shares and per-share amounts) | Amount |
| Paid-in Capital | 442,138,249 |
| Total Distributable Earnings (Loss) | 413,943,267 |
| Net Assets | 856,081,516 |
| Investor Shares—Net Assets | |
| Applicable to 10,257,635 outstanding $.001 par value shares of beneficial interest (unlimited authorization) | 4,511,974 |
| Net Asset Value Per Share—Investor Shares | $439.86 |
| ETF Shares—Net Assets | |
| Applicable to 641,164,020 outstanding $.001 par value shares of beneficial interest (unlimited authorization) | 279,849,657 |
| Net Asset Value Per Share—ETF Shares | $436.47 |
| Admiral Shares—Net Assets | |
| Applicable to 1,030,491,482 outstanding $.001 par value shares of beneficial interest (unlimited authorization) | 453,239,325 |
| Net Asset Value Per Share—Admiral Shares | $439.83 |
| Institutional Select Shares—Net Assets | |
| Applicable to 508,370,890 outstanding $.001 par value shares of beneficial interest (unlimited authorization) | 118,480,560 |
| Net Asset Value Per Share—Institutional Select Shares | $233.06 |
| Year Ended December 31, 2021 | |
| ($000) | |
| Investment Income | |
| Income | |
| Dividends1 | 10,462,119 |
| Interest2 | 2,064 |
| Securities Lending—Net | 3,503 |
| Total Income | 10,467,686 |
| Expenses | |
| The Vanguard Group—Note B | |
| Investment Advisory Services | 12,702 |
| Management and Administrative—Investor Shares | 6,222 |
| Management and Administrative—ETF Shares | 53,650 |
| Management and Administrative—Admiral Shares | 141,142 |
| Management and Administrative—Institutional Select Shares | 8,566 |
| Marketing and Distribution—Investor Shares | 240 |
| Marketing and Distribution—ETF Shares | 9,348 |
| Marketing and Distribution—Admiral Shares | 11,390 |
| Marketing and Distribution—Institutional Select Shares | 2 |
| Custodian Fees | 2,547 |
| Auditing Fees | 46 |
| Shareholders’ Reports—Investor Shares | 1 |
| Shareholders’ Reports—ETF Shares | 2,083 |
| Shareholders’ Reports—Admiral Shares | 1,931 |
| Shareholders’ Reports—Institutional Select Shares | — |
| Trustees’ Fees and Expenses | 219 |
| Total Expenses | 250,089 |
| Net Investment Income | 10,217,597 |
| Realized Net Gain (Loss) | |
| Investment Securities Sold2,3 | 30,213,184 |
| Futures Contracts | 608,552 |
| Swap Contracts | 148,534 |
| Realized Net Gain (Loss) | 30,970,270 |
| Change in Unrealized Appreciation (Depreciation) | |
| Investment Securities2 | 147,156,820 |
| Futures Contracts | 61,498 |
| Swap Contracts | (2,581) |
| Change in Unrealized Appreciation (Depreciation) | 147,215,737 |
| Net Increase (Decrease) in Net Assets Resulting from Operations | 188,403,604 |
| 1 | Dividends are net of foreign withholding taxes of $1,442,000. |
| 2 | Interest income, realized net gain (loss), capital gain distributions received, and change in unrealized appreciation (depreciation) from an affiliated company of the fund were $2,063,000, $42,000, $83,000, and ($274,000), respectively. Purchases and sales are for temporary cash investment purposes. |
| 3 | Includes $30,494,518,000 of net gain (loss) resulting from in-kind redemptions. |
| Year Ended December 31, | ||
| 2021 ($000) | 2020 ($000) | |
| Increase (Decrease) in Net Assets | ||
| Operations | ||
| Net Investment Income | 10,217,597 | 10,026,083 |
| Realized Net Gain (Loss) | 30,970,270 | 26,755,026 |
| Change in Unrealized Appreciation (Depreciation) | 147,215,737 | 63,111,484 |
| Net Increase (Decrease) in Net Assets Resulting from Operations | 188,403,604 | 99,892,593 |
| Distributions | ||
| Investor Shares | (59,162) | (71,146) |
| ETF Shares | (3,296,146) | (2,722,198) |
| Admiral Shares | (5,602,317) | (5,575,193) |
| Institutional Select Shares | (1,515,092) | (1,461,548) |
| Total Distributions | (10,472,717) | (9,830,085) |
| Capital Share Transactions | ||
| Investor Shares | (1,095,734) | (861,357) |
| ETF Shares | 47,041,730 | 21,243,502 |
| Admiral Shares | (2,715,238) | (10,267,593) |
| Institutional Select Shares | (1,997,365) | 434,639 |
| Net Increase (Decrease) from Capital Share Transactions | 41,233,393 | 10,549,191 |
| Total Increase (Decrease) | 219,164,280 | 100,611,699 |
| Net Assets | ||
| Beginning of Period | 636,917,236 | 536,305,537 |
| End of Period | 856,081,516 | 636,917,236 |
| Investor Shares | |||||
| For a Share Outstanding Throughout Each Period | Year Ended December 31, | ||||
| 2021 | 2020 | 2019 | 2018 | 2017 | |
| Net Asset Value, Beginning of Period | $346.60 | $298.16 | $231.44 | $246.82 | $206.57 |
| Investment Operations | |||||
| Net Investment Income1 | 4.910 | 5.128 | 4.801 | 4.896 | 4.221 |
| Net Realized and Unrealized Gain (Loss) on Investments | 93.389 | 48.323 | 67.211 | (15.776) | 40.205 |
| Total from Investment Operations | 98.299 | 53.451 | 72.012 | (10.880) | 44.426 |
| Distributions | |||||
| Dividends from Net Investment Income | (5.039) | (5.011) | (5.292) | (4.500) | (4.176) |
| Distributions from Realized Capital Gains | — | — | — | — | — |
| Total Distributions | (5.039) | (5.011) | (5.292) | (4.500) | (4.176) |
| Net Asset Value, End of Period | $439.86 | $346.60 | $298.16 | $231.44 | $246.82 |
| Total Return2 | 28.53% | 18.25% | 31.33% | -4.52% | 21.67% |
| Ratios/Supplemental Data | |||||
| Net Assets, End of Period (Millions) | $4,512 | $4,504 | $4,723 | $23,162 | $27,656 |
| Ratio of Total Expenses to Average Net Assets | 0.14% | 0.14% | 0.14% | 0.14% | 0.14% |
| Ratio of Net Investment Income to Average Net Assets | 1.25% | 1.73% | 1.82% | 1.95% | 1.87% |
| Portfolio Turnover Rate3 | 2% | 4% | 4% | 4% | 3% |
| 1 | Calculated based on average shares outstanding. |
| 2 | Total returns do not include account service fees that may have applied in the periods shown. Fund prospectuses provide information about any applicable account service fees. |
| 3 | Excludes the value of portfolio securities received or delivered as a result of in-kind purchases or redemptions of the fund’s capital shares, including ETF Creation Units. |
| ETF Shares | |||||
| For a Share Outstanding Throughout Each Period | Year Ended December 31, | ||||
| 2021 | 2020 | 2019 | 2018 | 2017 | |
| Net Asset Value, Beginning of Period | $343.93 | $295.87 | $229.68 | $244.94 | $205.00 |
| Investment Operations | |||||
| Net Investment Income1 | 5.353 | 5.413 | 5.298 | 5.196 | 4.434 |
| Net Realized and Unrealized Gain (Loss) on Investments | 92.624 | 47.950 | 66.463 | (15.719) | 39.874 |
| Total from Investment Operations | 97.977 | 53.363 | 71.761 | (10.523) | 44.308 |
| Distributions | |||||
| Dividends from Net Investment Income | (5.437) | (5.303) | (5.571) | (4.737) | (4.368) |
| Distributions from Realized Capital Gains | — | — | — | — | — |
| Total Distributions | (5.437) | (5.303) | (5.571) | (4.737) | (4.368) |
| Net Asset Value, End of Period | $436.47 | $343.93 | $295.87 | $229.68 | $244.94 |
| Total Return | 28.66% | 18.35% | 31.46% | -4.42% | 21.78% |
| Ratios/Supplemental Data | |||||
| Net Assets, End of Period (Millions) | $279,850 | $177,991 | $130,728 | $90,639 | $83,640 |
| Ratio of Total Expenses to Average Net Assets | 0.03% | 0.03% | 0.03% | 0.03% | 0.04% |
| Ratio of Net Investment Income to Average Net Assets | 1.36% | 1.83% | 1.98% | 2.06% | 1.97% |
| Portfolio Turnover Rate2 | 2% | 4% | 4% | 4% | 3% |
| 1 | Calculated based on average shares outstanding. |
| 2 | Excludes the value of portfolio securities received or delivered as a result of in-kind purchases or redemptions of the fund’s capital shares, including ETF Creation Units. |
| Admiral Shares | |||||
| For a Share Outstanding Throughout Each Period | Year Ended December 31, | ||||
| 2021 | 2020 | 2019 | 2018 | 2017 | |
| Net Asset Value, Beginning of Period | $346.57 | $298.14 | $231.44 | $246.82 | $206.57 |
| Investment Operations | |||||
| Net Investment Income1 | 5.326 | 5.427 | 5.319 | 5.181 | 4.458 |
| Net Realized and Unrealized Gain (Loss) on Investments | 93.371 | 48.314 | 66.962 | (15.808) | 40.193 |
| Total from Investment Operations | 98.697 | 53.741 | 72.281 | (10.627) | 44.651 |
| Distributions | |||||
| Dividends from Net Investment Income | (5.437) | (5.311) | (5.581) | (4.753) | (4.401) |
| Distributions from Realized Capital Gains | — | — | — | — | — |
| Total Distributions | (5.437) | (5.311) | (5.581) | (4.753) | (4.401) |
| Net Asset Value, End of Period | $439.83 | $346.57 | $298.14 | $231.44 | $246.82 |
| Total Return2 | 28.66% | 18.37% | 31.46% | -4.43% | 21.79% |
| Ratios/Supplemental Data | |||||
| Net Assets, End of Period (Millions) | $453,239 | $359,553 | $319,624 | $230,375 | $235,232 |
| Ratio of Total Expenses to Average Net Assets | 0.04% | 0.04% | 0.04% | 0.04% | 0.04% |
| Ratio of Net Investment Income to Average Net Assets | 1.35% | 1.83% | 1.97% | 2.05% | 1.97% |
| Portfolio Turnover Rate3 | 2% | 4% | 4% | 4% | 3% |
| 1 | Calculated based on average shares outstanding. |
| 2 | Total returns do not include account service fees that may have applied in the periods shown. Fund prospectuses provide information about any applicable account service fees. |
| 3 | Excludes the value of portfolio securities received or delivered as a result of in-kind purchases or redemptions of the fund’s capital shares, including ETF Creation Units. |
| Institutional Select Shares | |||||
| For a Share Outstanding Throughout Each Period | Year Ended December 31, | ||||
| 2021 | 2020 | 2019 | 2018 | 2017 | |
| Net Asset Value, Beginning of Period | $183.64 | $157.98 | $122.64 | $130.79 | $109.45 |
| Investment Operations | |||||
| Net Investment Income1 | 2.885 | 2.924 | 2.857 | 2.808 | 2.423 |
| Net Realized and Unrealized Gain (Loss) on Investments | 49.478 | 25.597 | 35.484 | (8.400) | 21.283 |
| Total from Investment Operations | 52.363 | 28.521 | 38.341 | (5.592) | 23.706 |
| Distributions | |||||
| Dividends from Net Investment Income | (2.943) | (2.861) | (3.001) | (2.558) | (2.366) |
| Distributions from Realized Capital Gains | — | — | — | — | — |
| Total Distributions | (2.943) | (2.861) | (3.001) | (2.558) | (2.366) |
| Net Asset Value, End of Period | $233.06 | $183.64 | $157.98 | $122.64 | $130.79 |
| Total Return | 28.70% | 18.40% | 31.49% | -4.40% | 21.83% |
| Ratios/Supplemental Data | |||||
| Net Assets, End of Period (Millions) | $118,481 | $94,870 | $81,230 | $56,531 | $44,907 |
| Ratio of Total Expenses to Average Net Assets | 0.01% | 0.01% | 0.01% | 0.01% | 0.01% |
| Ratio of Net Investment Income to Average Net Assets | 1.38% | 1.86% | 2.00% | 2.08% | 2.00% |
| Portfolio Turnover Rate2 | 2% | 4% | 4% | 4% | 3% |
| 1 | Calculated based on average shares outstanding. |
| 2 | Excludes the value of portfolio securities received or delivered as a result of in-kind purchases or redemptions of the fund’s capital shares, including ETF Creation Units. |
| A. | The following significant accounting policies conform to generally accepted accounting principles for U.S. investment companies. The fund consistently follows such policies in preparing its financial statements. |
| B. | In accordance with the terms of a Funds' Service Agreement (the “FSA”) between Vanguard and the fund, Vanguard furnishes to the fund investment advisory, corporate management, administrative, marketing, and distribution services at Vanguard’s cost of operations (as defined by the FSA). These costs of operations are allocated to the fund based on methods and guidelines approved by the board of trustees and are generally settled twice a month. |
| C. | Various inputs may be used to determine the value of the fund’s investments and derivatives. These inputs are summarized in three broad levels for financial statement purposes. The inputs or methodologies used to value securities are not necessarily an indication of the risk associated with investing in those securities. |
| Level 1 ($000) | Level 2 ($000) | Level 3 ($000) | Total ($000) | |
| Investments | ||||
| Assets | ||||
| Common Stocks | 851,558,856 | — | — | 851,558,856 |
| Temporary Cash Investments | 3,943,945 | — | — | 3,943,945 |
| Total | 855,502,801 | — | — | 855,502,801 |
| Derivative Financial Instruments | ||||
| Assets | ||||
| Futures Contracts1 | 90,333 | — | — | 90,333 |
| Swap Contracts | — | 3,823 | — | 3,823 |
| Total | 90,333 | 3,823 | — | 94,156 |
| Liabilities | ||||
| Swap Contracts | — | 981 | — | 981 |
| 1 | Includes cumulative appreciation (depreciation) on futures contracts and centrally cleared swaps, if any, as reported in the Schedule of Investments. Only current day’s variation margin is reported within the Statement of Assets and Liabilities. |
| D. | Permanent differences between book-basis and tax-basis components of net assets are reclassified among capital accounts in the financial statements to reflect their tax character. These reclassifications have no effect on net assets or net asset value per share. As of period end, permanent differences primarily attributable to the accounting for in-kind redemptions and swap agreements were reclassified between the following accounts: |
| Amount ($000) | |
| Paid-in Capital | 30,493,819 |
| Total Distributable Earnings (Loss) | (30,493,819) |
| Amount ($000) | |
| Undistributed Ordinary Income | 158,544 |
| Undistributed Long-Term Gains | — |
| Capital Loss Carryforwards | (7,943,854) |
| Qualified Late-Year Losses | — |
| Net Unrealized Gains (Losses) | 421,728,577 |
| Year Ended December 31, | ||
| 2021 Amount ($000) | 2020 Amount ($000) | |
| Ordinary Income* | 10,472,717 | 9,830,085 |
| Long-Term Capital Gains | — | — |
| Total | 10,472,717 | 9,830,085 |
| * | Includes short-term capital gains, if any. |
| Amount ($000) | |
| Tax Cost | 433,774,224 |
| Gross Unrealized Appreciation | 435,085,394 |
| Gross Unrealized Depreciation | (13,356,817) |
| Net Unrealized Appreciation (Depreciation) | 421,728,577 |
| E. | During the year ended December 31, 2021, the fund purchased $97,675,825,000 of investment securities and sold $57,757,704,000 of investment securities, other than temporary cash investments. Purchases and sales include $73,377,274,000 and $40,328,054,000, respectively, in connection with in-kind purchases and redemptions of the fund's capital shares. |
| F. | Capital share transactions for each class of shares were: |
| Year Ended December 31, | |||||
| 2021 | 2020 | ||||
| Amount ($000) | Shares (000) | Amount ($000) | Shares (000) | ||
| Investor Shares | |||||
| Issued | 172,587 | 443 | 200,895 | 689 | |
| Issued in Lieu of Cash Distributions | 59,155 | 150 | 71,140 | 244 | |
| Redeemed | (1,327,476) | (3,329) | (1,133,392) | (3,781) | |
| Net Increase (Decrease)—Investor Shares | (1,095,734) | (2,736) | (861,357) | (2,848) | |
| Year Ended December 31, | |||||
| 2021 | 2020 | ||||
| Amount ($000) | Shares (000) | Amount ($000) | Shares (000) | ||
| ETF Shares | |||||
| Issued | 79,932,127 | 204,970 | 63,687,902 | 221,707 | |
| Issued in Lieu of Cash Distributions | — | — | — | — | |
| Redeemed | (32,890,397) | (81,325) | (42,444,400) | (146,025) | |
| Net Increase (Decrease)—ETF Shares | 47,041,730 | 123,645 | 21,243,502 | 75,682 | |
| Admiral Shares | |||||
| Issued | 40,334,657 | 103,425 | 41,835,006 | 146,878 | |
| Issued in Lieu of Cash Distributions | 4,903,407 | 12,411 | 4,891,793 | 16,726 | |
| Redeemed | (47,953,302) | (122,796) | (56,994,392) | (198,197) | |
| Net Increase (Decrease)—Admiral Shares | (2,715,238) | (6,960) | (10,267,593) | (34,593) | |
| Institutional Select Shares | |||||
| Issued | 10,078,153 | 48,403 | 6,510,968 | 41,288 | |
| Issued in Lieu of Cash Distributions | 1,515,092 | 7,237 | 1,461,548 | 9,420 | |
| Redeemed | (13,590,610) | (63,866) | (7,537,877) | (48,280) | |
| Net Increase (Decrease)—Institutional Select Shares | (1,997,365) | (8,226) | 434,639 | 2,428 | |
| G. | Management has determined that no events or transactions occurred subsequent to December 31, 2021, that would require recognition or disclosure in these financial statements. |
Philadelphia, Pennsylvania
February 16, 2022
| Matthew Benchener | Thomas M. Rampulla |
| Joseph Brennan | Karin A. Risi |
| Mortimer J. Buckley | Anne E. Robinson |
| Gregory Davis | Michael Rollings |
| John James | Nitin Tandon |
| John T. Marcante | Lauren Valente |
| Chris D. Mclsaac |

All rights reserved.
U.S. Patent Nos. 6,879,964
Vanguard Marketing Corporation, Distributor.

| Vanguard Small-Cap Index Fund |
| Vanguard Small-Cap Growth Index Fund |
| Vanguard Small-Cap Value Index Fund |
| 1 | |
| 2 | |
| 4 | |
| 47 | |
| 77 |
| • | For the 12 months ended December 31, 2021, returns for the three Vanguard Small-Cap Index Funds ranged from 5.58% for Investor Shares of Vanguard Small-Cap Growth Index Fund to 28.11% for Institutional Shares of Vanguard Small-Cap Value Index Fund. Each fund closely tracked its target index. |
| • | The U.S. economy continued to heal over the 12 months. Vaccination programs started rolling out shortly after the period began, helping some of the hardest-hit sectors such as hospitality, leisure, and travel begin to rebound, and more workers returned to the labor force. U.S. stocks performed strongly even with the spread of new COVID-19 variants, a surge in inflation, and Federal Reserve monetary policy turning less accommodative. |
| • | The broad U.S. stock market, as measured by the CRSP US Total Market Index, returned 25.72%. Value stocks outperformed growth stocks for the 12 months. |
| • | All three funds benefited from their industrial holdings as well as consumer discretionary. Financials were strong for the Small-Cap Index and Value Index Funds. Real estate contributed to the Growth Index Fund’s results. Health care was the weakest performer for all three funds. |
| Average Annual Total Returns Periods Ended December 31, 2021 | |||
| One Year | Three Years | Five Years | |
| Stocks | |||
| Russell 1000 Index (Large-caps) | 26.45% | 26.21% | 18.43% |
| Russell 2000 Index (Small-caps) | 14.82 | 20.02 | 12.02 |
| Russell 3000 Index (Broad U.S. market) | 25.66 | 25.79 | 17.97 |
| FTSE All-World ex US Index (International) | 8.36 | 13.66 | 9.89 |
| Bonds | |||
| Bloomberg U.S. Aggregate Bond Index (Broad taxable market) | -1.54% | 4.79% | 3.57% |
| Bloomberg Municipal Bond Index (Broad tax-exempt market) | 1.52 | 4.73 | 4.17 |
| FTSE Three-Month U.S. Treasury Bill Index | 0.05 | 0.95 | 1.11 |
| CPI | |||
| Consumer Price Index | 7.04% | 3.53% | 2.92% |
| • | Based on actual fund return. This section helps you to estimate the actual expenses that you paid over the period. The ”Ending Account Value“ shown is derived from the fund’s actual return, and the third column shows the dollar amount that would have been paid by an investor who started with $1,000 in the fund. You may use the information here, together with the amount you invested, to estimate the expenses that you paid over the period. |
| • | Based on hypothetical 5% yearly return. This section is intended to help you compare your fund‘s costs with those of other mutual funds. It assumes that the fund had a yearly return of 5% before expenses, but that the expense ratio is unchanged. In this case—because the return used is not the fund’s actual return—the results do not apply to your investment. The example is useful in making comparisons because the Securities and Exchange Commission requires all mutual funds to calculate expenses based on a 5% return. You can assess your fund’s costs by comparing this hypothetical example with the hypothetical examples that appear in shareholder reports of other funds. |
| Six Months Ended December 31, 2021 | |||
| Beginning Account Value 6/30/2021 | Ending Account Value 12/31/2021 | Expenses Paid During Period | |
| Based on Actual Fund Return | |||
| Small-Cap Index Fund | |||
| Investor Shares | $1,000.00 | $1,010.90 | $0.86 |
| ETF Shares | 1,000.00 | 1,011.40 | 0.25 |
| Admiral™ Shares | 1,000.00 | 1,011.50 | 0.25 |
| Institutional Shares | 1,000.00 | 1,011.50 | 0.20 |
| Institutional Plus Shares | 1,000.00 | 1,011.60 | 0.15 |
| Small-Cap Growth Index Fund | |||
| Investor Shares | $1,000.00 | $973.40 | $0.95 |
| ETF Shares | 1,000.00 | 973.90 | 0.35 |
| Admiral Shares | 1,000.00 | 973.90 | 0.35 |
| Institutional Shares | 1,000.00 | 974.00 | 0.30 |
| Small-Cap Value Index Fund | |||
| Investor Shares | $1,000.00 | $1,040.00 | $0.98 |
| ETF Shares | 1,000.00 | 1,040.40 | 0.36 |
| Admiral Shares | 1,000.00 | 1,040.40 | 0.36 |
| Institutional Shares | 1,000.00 | 1,040.70 | 0.31 |
| Based on Hypothetical 5% Yearly Return | |||
| Small-Cap Index Fund | |||
| Investor Shares | $1,000.00 | $1,024.35 | $0.87 |
| ETF Shares | 1,000.00 | 1,024.95 | 0.26 |
| Admiral Shares | 1,000.00 | 1,024.95 | 0.26 |
| Institutional Shares | 1,000.00 | 1,025.00 | 0.20 |
| Institutional Plus Shares | 1,000.00 | 1,025.05 | 0.15 |
| Small-Cap Growth Index Fund | |||
| Investor Shares | $1,000.00 | $1,024.25 | $0.97 |
| ETF Shares | 1,000.00 | 1,024.85 | 0.36 |
| Admiral Shares | 1,000.00 | 1,024.85 | 0.36 |
| Institutional Shares | 1,000.00 | 1,024.90 | 0.31 |
| Small-Cap Value Index Fund | |||
| Investor Shares | $1,000.00 | $1,024.25 | $0.97 |
| ETF Shares | 1,000.00 | 1,024.85 | 0.36 |
| Admiral Shares | 1,000.00 | 1,024.85 | 0.36 |
| Institutional Shares | 1,000.00 | 1,024.90 | 0.31 |

| Average Annual Total Returns Periods Ended December 31, 2021 | |||||
| One Year | Five Years | Ten Years | Final Value of a $10,000 Investment | ||
 | Small-Cap Index Fund Investor Shares | 17.59% | 13.35% | 14.01% | $37,115 |
 | Spliced Small-Cap Index | 17.71 | 13.47 | 14.14 | 37,526 |
 | Dow Jones U.S. Total Stock Market Float Adjusted Index | 25.66 | 17.92 | 16.24 | 45,050 |
| One Year | Five Years | Ten Years | Final Value of a $10,000 Investment | ||
| Small-Cap Index Fund ETF Shares Net Asset Value | 17.72% | 13.48% | 14.16% | $37,581 | |
| Small-Cap Index Fund ETF Shares Market Price | 17.67 | 13.48 | 14.16 | 37,608 | |
| Spliced Small-Cap Index | 17.71 | 13.47 | 14.14 | 37,526 | |
| Dow Jones U.S. Total Stock Market Float Adjusted Index | 25.66 | 17.92 | 16.24 | 45,050 | |
| Average Annual Total Returns Periods Ended December 31, 2021 | |||||
| One Year | Five Years | Ten Years | Final Value of a $10,000 Investment | ||
| Small-Cap Index Fund Admiral Shares | 17.73% | 13.49% | 14.16% | $37,596 | |
| Spliced Small-Cap Index | 17.71 | 13.47 | 14.14 | 37,526 | |
| Dow Jones U.S. Total Stock Market Float Adjusted Index | 25.66 | 17.92 | 16.24 | 45,050 | |
| One Year | Five Years | Ten Years | Final Value of a $5,000,000 Investment | ||
| Small-Cap Index Fund Institutional Shares | 17.73% | 13.50% | 14.17% | $18,815,564 | |
| Spliced Small-Cap Index | 17.71 | 13.47 | 14.14 | 18,763,151 | |
| Dow Jones U.S. Total Stock Market Float Adjusted Index | 25.66 | 17.92 | 16.24 | 22,525,162 | |
| One Year | Five Years | Ten Years | Final Value of a $100,000,000 Investment | ||
| Small-Cap Index Fund Institutional Plus Shares | 17.75% | 13.51% | 14.19% | $376,898,160 | |
| Spliced Small-Cap Index | 17.71 | 13.47 | 14.14 | 375,263,020 | |
| Dow Jones U.S. Total Stock Market Float Adjusted Index | 25.66 | 17.92 | 16.24 | 450,503,240 | |
| Cumulative Returns of ETF Shares: December 31, 2011, Through December 31, 2021 | |||
| One Year | Five Years | Ten Years | |
| Small-Cap Index Fund ETF Shares Market Price | 17.67% | 88.22% | 276.08% |
| Small-Cap Index Fund ETF Shares Net Asset Value | 17.72 | 88.23 | 275.81 |
| Spliced Small-Cap Index | 17.71 | 88.13 | 275.26 |
| Basic Materials | 4.2% |
| Consumer Discretionary | 15.4 |
| Consumer Staples | 3.0 |
| Energy | 4.3 |
| Financials | 14.8 |
| Health Care | 11.7 |
| Industrials | 19.4 |
| Real Estate | 9.4 |
| Technology | 13.1 |
| Telecommunications | 1.6 |
| Utilities | 3.1 |
| Shares | Market Value• ($000) | |||||
| Common Stocks (99.3%) | ||||||
| Basic Materials (4.1%) | ||||||
| Mosaic Co. | 9,345,573 | 367,188 | ||||
| Steel Dynamics Inc. | 4,755,643 | 295,183 | ||||
| Alcoa Corp. | 4,719,390 | 281,181 | ||||
| Reliance Steel & Aluminum Co. | 1,580,803 | 256,438 | ||||
| * | Cleveland-Cliffs Inc. | 11,353,546 | 247,167 | |||
| Olin Corp. | 3,618,549 | 208,139 | ||||
| CF Industries Holdings Inc. | 2,705,329 | 191,483 | ||||
| Royal Gold Inc. | 1,655,383 | 174,163 | ||||
| Huntsman Corp. | 4,951,646 | 172,713 | ||||
| Valvoline Inc. | 4,541,220 | 169,342 | ||||
| Scotts Miracle-Gro Co. | 973,934 | 156,803 | ||||
| * | RBC Bearings Inc. | 727,950 | 147,024 | |||
| United States Steel Corp. | 6,134,357 | 146,059 | ||||
| Ashland Global Holdings Inc. | 1,291,377 | 139,030 | ||||
| Chemours Co. | 4,108,910 | 137,895 | ||||
| Balchem Corp. | 816,791 | 137,711 | ||||
| UFP Industries Inc. | 1,483,060 | 136,456 | ||||
| Avient Corp. | 2,306,545 | 129,051 | ||||
| Element Solutions Inc. | 5,306,466 | 128,841 | ||||
| * | Univar Solutions Inc. | 4,310,182 | 122,194 | |||
| Timken Co. | 1,720,734 | 119,230 | ||||
| Commercial Metals Co. | 3,064,842 | 111,223 | ||||
| * | Hexcel Corp. | 2,112,944 | 109,450 | |||
| Sensient Technologies Corp. | 1,059,778 | 106,041 | ||||
| *,1 | MP Materials Corp. | 2,242,150 | 101,838 | |||
| * | Livent Corp. | 4,074,711 | 99,341 | |||
| Mueller Industries Inc. | 1,373,838 | 81,551 | ||||
| Cabot Corp. | 1,428,394 | 80,276 | ||||
| * | Arconic Corp. | 2,412,361 | 79,632 | |||
| Quaker Chemical Corp. | 337,970 | 77,997 | ||||
| * | Ingevity Corp. | 988,417 | 70,869 | |||
| Hecla Mining Co. | 13,557,497 | 70,770 | ||||
| Boise Cascade Co. | 990,910 | 70,553 | ||||
| Shares | Market Value• ($000) | |||||
| Tronox Holdings plc Class A | 2,909,367 | 69,912 | ||||
| NewMarket Corp. | 200,991 | 68,884 | ||||
| Stepan Co. | 535,251 | 66,526 | ||||
| Minerals Technologies Inc. | 836,063 | 61,158 | ||||
| GrafTech International Ltd. | 4,975,108 | 58,856 | ||||
| Innospec Inc. | 619,791 | 55,992 | ||||
| Materion Corp. | 514,757 | 47,327 | ||||
| Compass Minerals International Inc. | 854,750 | 43,661 | ||||
| Worthington Industries Inc. | 775,927 | 42,412 | ||||
| * | GCP Applied Technologies Inc. | 1,292,573 | 40,923 | |||
| Westlake Chemical Corp. | 402,427 | 39,088 | ||||
| Kaiser Aluminum Corp. | 396,369 | 37,235 | ||||
| * | Kraton Corp. | 768,721 | 35,607 | |||
| Carpenter Technology Corp. | 1,202,636 | 35,105 | ||||
| Schnitzer Steel Industries Inc. Class A | 614,857 | 31,923 | ||||
| * | Coeur Mining Inc. | 5,939,875 | 29,937 | |||
| * | Amyris Inc. | 4,649,881 | 25,156 | |||
| Schweitzer-Mauduit International Inc. | 811,134 | 24,253 | ||||
| * | Century Aluminum Co. | 1,275,072 | 21,115 | |||
| Glatfelter Corp. | 1,145,140 | 19,696 | ||||
| * | Koppers Holdings Inc. | 523,641 | 16,390 | |||
| Ecovyst Inc. | 1,594,780 | 16,331 | ||||
| *,1 | Zymergen Inc. | 1,152,594 | 7,711 | |||
| American Vanguard Corp. | 379 | 6 | ||||
| Shares | Market Value• ($000) | |||||
| Tredegar Corp. | 429 | 5 | ||||
| * | Hycroft Mining Holding Corp. Warrants Exp. 10/22/22 | 19 | — | |||
| 5,818,041 | ||||||
| Consumer Discretionary (15.3%) | ||||||
| * | Floor & Decor Holdings Inc. Class A | 2,530,486 | 328,988 | |||
| Williams-Sonoma Inc. | 1,849,697 | 312,839 | ||||
| * | Liberty Media Corp.-Liberty Formula One Class C | 4,916,052 | 310,891 | |||
| * | Five Below Inc. | 1,412,921 | 292,319 | |||
| Tapestry Inc. | 6,941,723 | 281,834 | ||||
| Service Corp. International | 3,953,564 | 280,663 | ||||
| * | SiteOne Landscape Supply Inc. | 1,127,786 | 273,240 | |||
| Pool Corp. | 480,696 | 272,074 | ||||
| * | Deckers Outdoor Corp. | 692,535 | 253,682 | |||
| * | Capri Holdings Ltd. | 3,794,591 | 246,307 | |||
| * | BJ's Wholesale Club Holdings Inc. | 3,665,255 | 245,462 | |||
| Aramark | 6,458,641 | 238,001 | ||||
| * | RH | 432,197 | 231,632 | |||
| Tempur Sealy International Inc. | 4,857,015 | 228,425 | ||||
| Lithia Motors Inc. Class A | 763,744 | 226,794 | ||||
| * | Penn National Gaming Inc. | 4,275,520 | 221,686 | |||
| Bath & Body Works Inc. | 3,168,409 | 221,123 | ||||
| Toll Brothers Inc. | 2,918,180 | 211,247 | ||||
| Newell Brands Inc. | 9,659,602 | 210,966 | ||||
| Wyndham Hotels & Resorts Inc. | 2,351,222 | 210,787 | ||||
| Churchill Downs Inc. | 868,462 | 209,212 | ||||
| Gentex Corp. | 5,967,944 | 207,983 | ||||
| Macy's Inc. | 7,548,623 | 197,623 | ||||
| * | Norwegian Cruise Line Holdings Ltd. | 9,327,451 | 193,451 | |||
| New York Times Co. Class A | 4,002,875 | 193,339 | ||||
| * | Avis Budget Group Inc. | 925,528 | 191,927 | |||
| * | Bright Horizons Family Solutions Inc. | 1,522,063 | 191,597 | |||
| PVH Corp. | 1,791,650 | 191,079 | ||||
| * | Mattel Inc. | 8,836,535 | 190,516 | |||
| * | Planet Fitness Inc. Class A | 2,101,846 | 190,385 | |||
| Kohl's Corp. | 3,795,355 | 187,453 | ||||
| Interpublic Group of Cos. Inc. | 4,965,193 | 185,946 | ||||
| Shares | Market Value• ($000) | |||||
| Nielsen Holdings plc | 9,054,099 | 185,700 | ||||
| * | Crocs Inc. | 1,410,489 | 180,853 | |||
| * | Fox Factory Holding Corp. | 1,061,699 | 180,595 | |||
| * | YETI Holdings Inc. | 2,100,643 | 173,996 | |||
| Marriott Vacations Worldwide Corp. | 1,020,617 | 172,464 | ||||
| * | IAA Inc. | 3,399,706 | 172,093 | |||
| * | Zynga Inc. Class A | 26,837,771 | 171,762 | |||
| Vail Resorts Inc. | 510,474 | 167,384 | ||||
| * | Alaska Air Group Inc. | 3,160,518 | 164,663 | |||
| 1 | Dick's Sporting Goods Inc. | 1,428,146 | 164,222 | |||
| AMERCO | 222,706 | 161,736 | ||||
| Polaris Inc. | 1,454,061 | 159,816 | ||||
| * | Scientific Games Corp. | 2,311,766 | 154,495 | |||
| * | Goodyear Tire & Rubber Co. | 7,091,805 | 151,197 | |||
| Texas Roadhouse Inc. Class A | 1,669,204 | 149,027 | ||||
| * | Helen of Troy Ltd. | 608,555 | 148,773 | |||
| Nexstar Media Group Inc. Class A | 979,004 | 147,810 | ||||
| * | Skechers USA Inc. Class A | 3,402,347 | 147,662 | |||
| Hanesbrands Inc. | 8,806,402 | 147,243 | ||||
| * | American Airlines Group Inc. | 8,161,395 | 146,579 | |||
| Harley-Davidson Inc. | 3,878,839 | 146,193 | ||||
| * | AutoNation Inc. | 1,239,527 | 144,839 | |||
| Choice Hotels International Inc. | 912,757 | 142,381 | ||||
| * | Terminix Global Holdings Inc. | 3,053,134 | 138,093 | |||
| Thor Industries Inc. | 1,329,877 | 138,001 | ||||
| Lear Corp. | 751,525 | 137,491 | ||||
| Leggett & Platt Inc. | 3,195,315 | 131,519 | ||||
| Ralph Lauren Corp. | 1,105,941 | 131,452 | ||||
| * | Boyd Gaming Corp. | 1,984,198 | 130,104 | |||
| Wingstop Inc. | 752,210 | 129,982 | ||||
| Gap Inc. | 7,111,769 | 125,523 | ||||
| * | Victoria's Secret & Co. | 2,228,016 | 123,744 | |||
| Murphy USA Inc. | 613,844 | 122,302 | ||||
| *,1 | GameStop Corp. Class A | 820,133 | 121,700 | |||
| Travel + Leisure Co. | 2,174,956 | 120,210 | ||||
| * | Hilton Grand Vacations Inc. | 2,265,534 | 118,057 | |||
| * | Hyatt Hotels Corp. Class A | 1,204,619 | 115,523 | |||
| * | Meritage Homes Corp. | 941,308 | 114,896 | |||
| Foot Locker Inc. | 2,617,399 | 114,197 | ||||
| * | JetBlue Airways Corp. | 8,003,869 | 113,975 | |||
| Signet Jewelers Ltd. | 1,271,521 | 110,660 | ||||
| Shares | Market Value• ($000) | |||||
| Papa John's International Inc. | 825,758 | 110,214 | ||||
| * | Skyline Champion Corp. | 1,361,608 | 107,540 | |||
| * | Chegg Inc. | 3,470,313 | 106,539 | |||
| Wendy's Co. | 4,454,646 | 106,243 | ||||
| H&R Block Inc. | 4,428,403 | 104,333 | ||||
| * | Academy Sports & Outdoors Inc. | 2,357,651 | 103,501 | |||
| TEGNA Inc. | 5,574,056 | 103,454 | ||||
| * | Taylor Morrison Home Corp. Class A | 2,943,583 | 102,908 | |||
| Carter's Inc. | 1,012,048 | 102,439 | ||||
| * | National Vision Holdings Inc. | 2,085,197 | 100,069 | |||
| * | Asbury Automotive Group Inc. | 570,185 | 98,488 | |||
| * | Under Armour Inc. Class C | 5,383,354 | 97,116 | |||
| 1 | American Eagle Outfitters Inc. | 3,825,277 | 96,856 | |||
| * | Under Armour Inc. Class A | 4,556,778 | 96,558 | |||
| * | Callaway Golf Co. | 3,512,381 | 96,380 | |||
| * | Sonos Inc. | 3,207,207 | 95,575 | |||
| LCI Industries | 605,605 | 94,396 | ||||
| *,1 | Luminar Technologies Inc. Class A | 5,571,353 | 94,212 | |||
| * | Leslie's Inc. | 3,976,587 | 94,086 | |||
| KB Home | 2,096,235 | 93,765 | ||||
| Steven Madden Ltd. | 1,946,186 | 90,439 | ||||
| Columbia Sportswear Co. | 905,260 | 88,209 | ||||
| * | Coty Inc. Class A | 8,261,024 | 86,741 | |||
| * | Grand Canyon Education Inc. | 1,009,319 | 86,509 | |||
| * | LGI Homes Inc. | 550,605 | 85,057 | |||
| Group 1 Automotive Inc. | 433,246 | 84,578 | ||||
| Dana Inc. | 3,628,250 | 82,797 | ||||
| * | SeaWorld Entertainment Inc. | 1,264,770 | 82,033 | |||
| MDC Holdings Inc. | 1,423,471 | 79,472 | ||||
| * | Six Flags Entertainment Corp. | 1,838,477 | 78,282 | |||
| * | Visteon Corp. | 704,334 | 78,280 | |||
| * | Tri Pointe Homes Inc. | 2,803,250 | 78,183 | |||
| * | Frontdoor Inc. | 2,132,195 | 78,145 | |||
| * | Dorman Products Inc. | 676,156 | 76,412 | |||
| Cracker Barrel Old Country Store Inc. | 592,423 | 76,209 | ||||
| MillerKnoll Inc. | 1,908,184 | 74,782 | ||||
| Penske Automotive Group Inc. | 690,679 | 74,055 | ||||
| Red Rock Resorts Inc. Class A | 1,333,577 | 73,360 | ||||
| Shares | Market Value• ($000) | |||||
| * | Madison Square Garden Sports Corp. | 419,695 | 72,914 | |||
| * | Gentherm Inc. | 836,558 | 72,697 | |||
| * | Allegiant Travel Co. | 387,327 | 72,446 | |||
| Rent-A-Center Inc. | 1,500,785 | 72,098 | ||||
| * | Sabre Corp. | 8,144,199 | 69,959 | |||
| * | TripAdvisor Inc. | 2,528,204 | 68,919 | |||
| *,1 | Figs Inc. Class A | 2,487,261 | 68,549 | |||
| * | Shake Shack Inc. Class A | 937,102 | 67,621 | |||
| Qurate Retail Inc. Class A | 8,816,632 | 67,006 | ||||
| Kontoor Brands Inc. | 1,299,273 | 66,588 | ||||
| Rush Enterprises Inc. Class A | 1,183,282 | 65,838 | ||||
| * | Coursera Inc. | 2,656,761 | 64,931 | |||
| *,1 | PROG Holdings Inc. | 1,429,390 | 64,480 | |||
| * | Ollie's Bargain Outlet Holdings Inc. | 1,257,580 | 64,376 | |||
| * | Nordstrom Inc. | 2,810,497 | 63,573 | |||
| * | Overstock.com Inc. | 1,030,960 | 60,837 | |||
| John Wiley & Sons Inc. Class A | 1,061,066 | 60,767 | ||||
| Graham Holdings Co. Class B | 95,147 | 59,926 | ||||
| Wolverine World Wide Inc. | 2,073,963 | 59,751 | ||||
| * | Spirit Airlines Inc. | 2,726,739 | 59,579 | |||
| *,1 | Fisker Inc. | 3,713,043 | 58,406 | |||
| Levi Strauss & Co. Class A | 2,310,200 | 57,824 | ||||
| * | Revolve Group Inc. Class A | 1,001,519 | 56,125 | |||
| World Wrestling Entertainment Inc. Class A | 1,123,714 | 55,444 | ||||
| * | Knowles Corp. | 2,333,008 | 54,476 | |||
| * | Sally Beauty Holdings Inc. | 2,848,635 | 52,586 | |||
| * | Abercrombie & Fitch Co. Class A | 1,486,023 | 51,758 | |||
| * | iHeartMedia Inc. Class A | 2,414,397 | 50,799 | |||
| * | Cardlytics Inc. | 752,500 | 49,733 | |||
| * | SkyWest Inc. | 1,264,956 | 49,713 | |||
| * | Central Garden & Pet Co. Class A | 1,026,552 | 49,120 | |||
| * | Madison Square Garden Entertainment Corp. | 697,534 | 49,065 | |||
| * | Cheesecake Factory Inc. | 1,244,655 | 48,728 | |||
| * | KAR Auction Services Inc. | 3,071,361 | 47,975 | |||
| * | Bloomin' Brands Inc. | 2,243,486 | 47,068 | |||
| Inter Parfums Inc. | 438,479 | 46,873 | ||||
| Monro Inc. | 801,638 | 46,711 | ||||
| Shares | Market Value• ($000) | |||||
| * | ODP Corp. | 1,167,130 | 45,845 | |||
| * | Boot Barn Holdings Inc. | 372,397 | 45,823 | |||
| PriceSmart Inc. | 617,446 | 45,179 | ||||
| * | iRobot Corp. | 677,715 | 44,648 | |||
| * | ACV Auctions Inc. Class A | 2,349,893 | 44,272 | |||
| Acushnet Holdings Corp. | 833,272 | 44,230 | ||||
| * | Lions Gate Entertainment Corp. Class B | 2,864,934 | 44,091 | |||
| Jack in the Box Inc. | 501,465 | 43,868 | ||||
| HNI Corp. | 1,037,802 | 43,640 | ||||
| * | Urban Outfitters Inc. | 1,477,193 | 43,370 | |||
| * | Driven Brands Holdings Inc. | 1,261,734 | 42,419 | |||
| * | Sleep Number Corp. | 549,654 | 42,103 | |||
| * | Brinker International Inc. | 1,142,819 | 41,816 | |||
| * | elf Beauty Inc. | 1,246,101 | 41,383 | |||
| * | Cinemark Holdings Inc. | 2,554,699 | 41,182 | |||
| Camping World Holdings Inc. Class A | 1,017,022 | 41,088 | ||||
| Oxford Industries Inc. | 403,716 | 40,985 | ||||
| La-Z-Boy Inc. | 1,102,598 | 40,035 | ||||
| *,1 | Petco Health & Wellness Co. Inc. Class A | 1,993,303 | 39,447 | |||
| Big Lots Inc. | 833,515 | 37,550 | ||||
| * | Stitch Fix Inc. Class A | 1,983,132 | 37,521 | |||
| * | Dave & Buster's Entertainment Inc. | 967,886 | 37,167 | |||
| * | 2U Inc. | 1,829,552 | 36,719 | |||
| *,1 | ContextLogic Inc. Class A | 11,601,192 | 36,080 | |||
| Dillard's Inc. Class A | 146,517 | 35,900 | ||||
| *,1 | Bed Bath & Beyond Inc. | 2,413,426 | 35,188 | |||
| * | Adtalem Global Education Inc. | 1,183,287 | 34,978 | |||
| * | Cavco Industries Inc. | 109,308 | 34,722 | |||
| * | Liberty Media Corp.-Liberty Formula One Class A | 578,024 | 34,300 | |||
| * | Stride Inc. | 1,022,537 | 34,081 | |||
| * | GoPro Inc. Class A | 3,254,487 | 33,554 | |||
| * | Vista Outdoor Inc. | 719,569 | 33,151 | |||
| Sinclair Broadcast Group Inc. Class A | 1,229,937 | 32,507 | ||||
| Strategic Education Inc. | 553,855 | 32,035 | ||||
| * | Dine Brands Global Inc. | 420,201 | 31,855 | |||
| Buckle Inc. | 748,513 | 31,670 | ||||
| Shares | Market Value• ($000) | |||||
| Sturm Ruger & Co. Inc. | 452,961 | 30,810 | ||||
| * | Clear Channel Outdoor Holdings Inc. | 9,085,877 | 30,074 | |||
| * | G-III Apparel Group Ltd. | 1,059,808 | 29,293 | |||
| EW Scripps Co. Class A | 1,500,156 | 29,028 | ||||
| * | Selectquote Inc. | 3,147,314 | 28,515 | |||
| * | Mister Car Wash Inc. | 1,527,605 | 27,818 | |||
| Matthews International Corp. Class A | 745,425 | 27,335 | ||||
| * | Cars.com Inc. | 1,687,566 | 27,153 | |||
| *,1 | Dutch Bros Inc. Class A | 519,393 | 26,442 | |||
| * | American Axle & Manufacturing Holdings Inc. | 2,780,460 | 25,942 | |||
| *,1 | Canoo Inc. | 3,354,644 | 25,898 | |||
| * | AMC Networks Inc. Class A | 748,229 | 25,769 | |||
| * | Zumiez Inc. | 535,370 | 25,692 | |||
| Sonic Automotive Inc. Class A | 511,449 | 25,291 | ||||
| Interface Inc. Class A | 1,523,502 | 24,300 | ||||
| * | Lions Gate Entertainment Corp. Class A | 1,458,762 | 24,274 | |||
| * | Tenneco Inc. Class A | 2,110,410 | 23,848 | |||
| Guess? Inc. | 1,005,156 | 23,802 | ||||
| * | RealReal Inc. | 1,998,578 | 23,203 | |||
| Steelcase Inc. Class A | 1,975,628 | 23,154 | ||||
| * | Hawaiian Holdings Inc. | 1,255,598 | 23,065 | |||
| * | Sun Country Airlines Holdings Inc. | 806,192 | 21,969 | |||
| * | WW International Inc. | 1,346,164 | 21,714 | |||
| * | Designer Brands Inc. Class A | 1,471,352 | 20,908 | |||
| * | Rush Street Interactive Inc. | 1,263,375 | 20,846 | |||
| *,1 | Corsair Gaming Inc. | 965,175 | 20,278 | |||
| * | BJ's Restaurants Inc. | 571,543 | 19,747 | |||
| *,1 | Portillo's Inc. Class A | 520,493 | 19,539 | |||
| Aaron's Co. Inc. | 791,342 | 19,507 | ||||
| *,1 | Vizio Holding Corp. Class A | 972,049 | 18,887 | |||
| * | Latham Group Inc. | 751,898 | 18,820 | |||
| Scholastic Corp. | 458,414 | 18,318 | ||||
| * | Life Time Group Holdings Inc. | 988,628 | 17,014 | |||
| *,1 | ThredUp Inc. Class A | 1,309,574 | 16,710 | |||
| * | PowerSchool Holdings Inc. Class A | 990,806 | 16,319 | |||
| 1 | Krispy Kreme Inc. | 857,886 | 16,231 | |||
| Shares | Market Value• ($000) | |||||
| * | Quotient Technology Inc. | 2,177,385 | ��� 16,156 | |||
| Laureate Education Inc. Class A | 1,294,162 | 15,841 | ||||
| * | Angi Inc. Class A | 1,707,236 | 15,724 | |||
| * | Poshmark Inc. Class A | 886,702 | 15,101 | |||
| * | Children's Place Inc. | 179,811 | 14,257 | |||
| * | Integral Ad Science Holding Corp. | 597,623 | 13,273 | |||
| * | Duolingo Inc. Class A | 118,724 | 12,598 | |||
| * | Genesco Inc. | 182,628 | 11,719 | |||
| *,1 | Sweetgreen Inc. Class A | 357,460 | 11,439 | |||
| * | Frontier Group Holdings Inc. | 837,696 | 11,368 | |||
| * | Janus International Group Inc. | 908,016 | 11,368 | |||
| * | Central Garden & Pet Co. | 211,879 | 11,151 | |||
| *,1 | Cricut Inc. Class A | 500,314 | 11,052 | |||
| Smith & Wesson Brands Inc. | 618,948 | 11,017 | ||||
| *,1 | Lordstown Motors Corp. | 3,127,113 | 10,789 | |||
| Caleres Inc. | 466,124 | 10,572 | ||||
| *,1 | XL Fleet Corp. | 2,866,865 | 9,489 | |||
| * | Dream Finders Homes Inc. Class A | 485,893 | 9,451 | |||
| Global Industrial Co. | 218,705 | 8,945 | ||||
| * | Sciplay Corp. Class A | 593,891 | 8,184 | |||
| *,1 | Allbirds Inc. Class A | 518,064 | 7,812 | |||
| *,1 | Traeger Inc. | 606,463 | 7,375 | |||
| * | Udemy Inc. | 352,088 | 6,880 | |||
| Rush Enterprises Inc. Class B | 124,869 | 6,739 | ||||
| *,1 | Weber Inc. Class A | 471,589 | 6,098 | |||
| *,1 | Solo Brands Inc. Class A | 319,256 | 4,990 | |||
| * | Arhaus Inc. Class A | 367,893 | 4,875 | |||
| * | Lands' End Inc. | 188,356 | 3,697 | |||
| *,1 | Brilliant Earth Group Inc. Class A | 203,508 | 3,675 | |||
| * | El Pollo Loco Holdings Inc. | 216,346 | 3,070 | |||
| *,1 | Revlon Inc. Class A | 202,084 | 2,292 | |||
| * | Instructure Holdings Inc. | 19,478 | 467 | |||
| * | Torrid Holdings Inc. | 13,798 | 136 | |||
| 21,541,372 | ||||||
| Consumer Staples (3.0%) | ||||||
| Bunge Ltd. | 3,369,183 | 314,547 | ||||
| * | Darling Ingredients Inc. | 4,081,719 | 282,822 | |||
| Casey's General Stores Inc. | 935,249 | 184,571 | ||||
| Shares | Market Value• ($000) | |||||
| * | Performance Food Group Co. | 3,889,461 | 178,487 | |||
| * | US Foods Holding Corp. | 5,053,795 | 176,024 | |||
| * | Post Holdings Inc. | 1,419,572 | 160,028 | |||
| Ingredion Inc. | 1,595,072 | 154,148 | ||||
| Flowers Foods Inc. | 4,799,838 | 131,852 | ||||
| * | Boston Beer Co. Inc. Class A | 231,450 | 116,905 | |||
| Lamb Weston Holdings Inc. | 1,840,573 | 116,656 | ||||
| Spectrum Brands Holdings Inc. | 1,037,800 | 105,565 | ||||
| Molson Coors Beverage Co. Class B | 2,275,987 | 105,492 | ||||
| Sanderson Farms Inc. | 536,241 | 102,465 | ||||
| * | Freshpet Inc. | 1,038,296 | 98,918 | |||
| * | Herbalife Nutrition Ltd. | 2,403,449 | 98,373 | |||
| * | Hain Celestial Group Inc. | 2,263,813 | 96,461 | |||
| *,1 | Beyond Meat Inc. | 1,437,651 | 93,677 | |||
| * | Simply Good Foods Co. | 2,173,519 | 90,353 | |||
| WD-40 Co. | 345,267 | 84,466 | ||||
| * | Sprouts Farmers Market Inc. | 2,825,742 | 83,868 | |||
| Lancaster Colony Corp. | 485,466 | 80,393 | ||||
| Coca-Cola Consolidated Inc. | 116,954 | 72,417 | ||||
| * | United Natural Foods Inc. | 1,462,544 | 71,782 | |||
| * | Hostess Brands Inc. Class A | 3,486,464 | 71,194 | |||
| * | Celsius Holdings Inc. | 943,563 | 70,362 | |||
| Energizer Holdings Inc. | 1,684,732 | 67,558 | ||||
| * | Beauty Health Co. | 2,638,604 | 63,749 | |||
| Nu Skin Enterprises Inc. Class A | 1,254,805 | 63,681 | ||||
| Edgewell Personal Care Co. | 1,370,478 | 62,645 | ||||
| * | Grocery Outlet Holding Corp. | 2,175,449 | 61,522 | |||
| Medifast Inc. | 278,266 | 58,277 | ||||
| * | TreeHouse Foods Inc. | 1,399,830 | 56,735 | |||
| 1 | B&G Foods Inc. | 1,629,930 | 50,088 | |||
| J & J Snack Foods Corp. | 287,215 | 45,368 | ||||
| Reynolds Consumer Products Inc. | 1,317,484 | 41,369 | ||||
| Vector Group Ltd. | 3,285,594 | 37,719 | ||||
| Cal-Maine Foods Inc. | 995,347 | 36,818 | ||||
| * | Pilgrim's Pride Corp. | 1,226,727 | 34,594 | |||
| Universal Corp. | 600,120 | 32,959 | ||||
| Shares | Market Value• ($000) | |||||
| * | USANA Health Sciences Inc. | 296,038 | 29,959 | |||
| Andersons Inc. | 769,361 | 29,782 | ||||
| *,1 | BellRing Brands Inc. Class A | 1,016,170 | 28,991 | |||
| Weis Markets Inc. | 414,818 | 27,328 | ||||
| 1 | National Beverage Corp. | 599,467 | 27,174 | |||
| Utz Brands Inc. | 1,673,701 | 26,696 | ||||
| Fresh Del Monte Produce Inc. | 916,793 | 25,303 | ||||
| * | Hydrofarm Holdings Group Inc. | 847,868 | 23,986 | |||
| Seaboard Corp. | 5,929 | 23,331 | ||||
| * | Duckhorn Portfolio Inc. | 892,065 | 20,821 | |||
| * | Rite Aid Corp. | 1,343,578 | 19,737 | |||
| ACCO Brands Corp. | 2,336,805 | 19,302 | ||||
| Tootsie Roll Industries Inc. | 358,969 | 13,005 | ||||
| * | Honest Co. Inc. | 1,250,512 | 10,117 | |||
| * | Sovos Brands Inc. | 631,849 | 9,509 | |||
| * | Vital Farms Inc. | 465,575 | 8,408 | |||
| *,1 | AppHarvest Inc. | 815,940 | 3,174 | |||
| 4,201,531 | ||||||
| Energy (4.2%) | ||||||
| Diamondback Energy Inc. | 4,570,819 | 492,963 | ||||
| Coterra Energy Inc. | 20,522,476 | 389,927 | ||||
| Marathon Oil Corp. | 19,640,987 | 322,505 | ||||
| Targa Resources Corp. | 5,777,037 | 301,792 | ||||
| APA Corp. | 9,162,521 | 246,380 | ||||
| Ovintiv Inc. | 6,585,199 | 221,921 | ||||
| * | First Solar Inc. | 2,413,833 | 210,390 | |||
| * | EQT Corp. | 9,532,010 | 207,893 | |||
| Texas Pacific Land Corp. | 156,346 | 195,256 | ||||
| Chesapeake Energy Corp. | 2,599,910 | 167,746 | ||||
| * | NOV Inc. | 9,844,565 | 133,394 | |||
| HollyFrontier Corp. | 3,687,508 | 120,876 | ||||
| PDC Energy Inc. | 2,455,833 | 119,795 | ||||
| * | Southwestern Energy Co. | 25,590,068 | 119,250 | |||
| * | Antero Resources Corp. | 6,729,088 | 117,759 | |||
| DT Midstream Inc. | 2,440,308 | 117,086 | ||||
| * | Range Resources Corp. | 6,222,982 | 110,956 | |||
| *,1 | ChargePoint Holdings Inc. | 5,694,041 | 108,471 | |||
| Equitrans Midstream Corp. | 10,363,228 | 107,156 | ||||
| * | ChampionX Corp. | 5,087,559 | 102,820 | |||
| Matador Resources Co. | 2,659,175 | 98,177 | ||||
| Murphy Oil Corp. | 3,695,962 | 96,502 | ||||
| Shares | Market Value• ($000) | |||||
| * | Denbury Inc. | 1,199,511 | 91,871 | |||
| SM Energy Co. | 3,063,626 | 90,316 | ||||
| California Resources Corp. | 2,027,808 | 86,608 | ||||
| Antero Midstream Corp. | 7,827,920 | 75,774 | ||||
| Magnolia Oil & Gas Corp. Class A | 3,905,596 | 73,699 | ||||
| * | Stem Inc. | 3,460,191 | 65,640 | |||
| Arcosa Inc. | 1,214,873 | 64,024 | ||||
| * | Shoals Technologies Group Inc. Class A | 2,626,391 | 63,821 | |||
| * | Whiting Petroleum Corp. | 986,552 | 63,810 | |||
| * | Ameresco Inc. Class A | 762,152 | 62,070 | |||
| * | CNX Resources Corp. | 4,513,792 | 62,065 | |||
| Continental Resources Inc. | 1,381,808 | 61,850 | ||||
| Oasis Petroleum Inc. | 472,722 | 59,558 | ||||
| Helmerich & Payne Inc. | 2,443,586 | 57,913 | ||||
| Cactus Inc. Class A | 1,494,303 | 56,978 | ||||
| * | Renewable Energy Group Inc. | 1,266,530 | 53,751 | |||
| Civitas Resources Inc. | 1,053,560 | 51,593 | ||||
| * | Array Technologies Inc. | 3,234,954 | 50,756 | |||
| *,1 | FuelCell Energy Inc. | 8,786,525 | 45,690 | |||
| *,1 | SunPower Corp. | 2,176,199 | 45,417 | |||
| New Fortress Energy Inc. Class A | 1,826,468 | 44,091 | ||||
| World Fuel Services Corp. | 1,507,886 | 39,914 | ||||
| Patterson-UTI Energy Inc. | 4,624,172 | 39,074 | ||||
| *,1 | Transocean Ltd. | 14,020,747 | 38,697 | |||
| Arch Resources Inc. | 393,265 | 35,913 | ||||
| Warrior Met Coal Inc. | 1,322,993 | 34,014 | ||||
| * | PBF Energy Inc. Class A | 2,468,370 | 32,015 | |||
| * | Liberty Oilfield Services Inc. Class A | 2,999,372 | 29,094 | |||
| Archrock Inc. | 3,857,064 | 28,851 | ||||
| * | Oceaneering International Inc. | 2,490,695 | 28,170 | |||
| * | Delek US Holdings Inc. | 1,854,469 | 27,798 | |||
| * | Fluence Energy Inc. Class A | 749,922 | 26,667 | |||
| Core Laboratories NV | 1,189,644 | 26,541 | ||||
| * | NOW Inc. | 2,844,993 | 24,296 | |||
| * | ProPetro Holding Corp. | 2,257,320 | 18,284 | |||
| * | NexTier Oilfield Solutions Inc. | 5,149,471 | 18,281 | |||
| * | Dril-Quip Inc. | 910,854 | 17,926 | |||
| * | MRC Global Inc. | 2,021,231 | 13,906 | |||
| Shares | Market Value• ($000) | |||||
| CVR Energy Inc. | 772,939 | 12,993 | ||||
| * | RPC Inc. | 1,948,339 | 8,845 | |||
| *,1 | EVgo Inc. | 602,820 | 5,992 | |||
| * | Helix Energy Solutions Group Inc. | 1,753,686 | 5,471 | |||
| Devon Energy Corp. | 9,924 | 437 | ||||
| * | Denbury Inc. Warrants Exp. 9/18/23 | 2 | — | |||
| 5,949,489 | ||||||
| Financials (14.7%) | ||||||
| Brown & Brown Inc. | 6,063,414 | 426,137 | ||||
| Signature Bank | 1,276,080 | 412,774 | ||||
| LPL Financial Holdings Inc. | 1,921,161 | 307,559 | ||||
| Carlyle Group Inc. | 5,398,771 | 296,393 | ||||
| Ares Management Corp. Class A | 3,594,466 | 292,122 | ||||
| Comerica Inc. | 3,311,672 | 288,115 | ||||
| East West Bancorp Inc. | 3,582,595 | 281,879 | ||||
| Western Alliance Bancorp | 2,498,375 | 268,950 | ||||
| American Financial Group Inc. | 1,819,347 | 249,833 | ||||
| Zions Bancorp NA | 3,951,594 | 249,583 | ||||
| *,1 | SoFi Technologies Inc. | 15,264,808 | 241,337 | |||
| Invesco Ltd. | 10,473,488 | 241,100 | ||||
| Assurant Inc. | 1,439,366 | 224,340 | ||||
| First Horizon Corp. | 13,661,605 | 223,094 | ||||
| * | Upstart Holdings Inc. | 1,447,261 | 218,971 | |||
| First American Financial Corp. | 2,633,419 | 206,012 | ||||
| Morningstar Inc. | 598,082 | 204,538 | ||||
| AGNC Investment Corp. | 13,274,893 | 199,654 | ||||
| RenaissanceRe Holdings Ltd. | 1,161,222 | 196,630 | ||||
| SEI Investments Co. | 3,168,423 | 193,084 | ||||
| People's United Financial Inc. | 10,808,660 | 192,610 | ||||
| Commerce Bancshares Inc. | 2,774,539 | 190,722 | ||||
| Reinsurance Group of America Inc. | 1,705,186 | 186,701 | ||||
| Voya Financial Inc. | 2,803,139 | 185,876 | ||||
| Cullen/Frost Bankers Inc. | 1,449,262 | 182,708 | ||||
| Old Republic International Corp. | 7,369,555 | 181,144 | ||||
| Janus Henderson Group plc | 4,304,168 | 180,517 | ||||
| Jefferies Financial Group Inc. | 4,649,034 | 180,383 | ||||
| Starwood Property Trust Inc. | 7,304,606 | 177,502 | ||||
| Stifel Financial Corp. | 2,494,464 | 175,660 | ||||
| Shares | Market Value• ($000) | |||||
| Pinnacle Financial Partners Inc. | 1,825,138 | 174,301 | ||||
| First Financial Bankshares Inc. | 3,416,152 | 173,677 | ||||
| Synovus Financial Corp. | 3,489,509 | 167,043 | ||||
| Affiliated Managers Group Inc. | 974,065 | 160,243 | ||||
| Prosperity Bancshares Inc. | 2,211,920 | 159,922 | ||||
| Glacier Bancorp Inc. | 2,792,465 | 158,333 | ||||
| Popular Inc. | 1,877,081 | 153,996 | ||||
| Primerica Inc. | 995,797 | 152,626 | ||||
| Blue Owl Capital Inc. Class A | 10,211,617 | 152,255 | ||||
| Lincoln National Corp. | 2,166,287 | 147,871 | ||||
| OneMain Holdings Inc. | 2,940,251 | 147,130 | ||||
| SLM Corp. | 7,395,864 | 145,477 | ||||
| Cadence Bank | 4,859,850 | 144,775 | ||||
| Bank OZK | 3,110,039 | 144,710 | ||||
| Valley National Bancorp | 10,276,992 | 141,309 | ||||
| SouthState Corp. | 1,760,936 | 141,069 | ||||
| PacWest Bancorp | 2,958,823 | 133,650 | ||||
| Houlihan Lokey Inc. Class A | 1,286,897 | 133,220 | ||||
| New York Community Bancorp Inc. | 10,798,716 | 131,852 | ||||
| Wintrust Financial Corp. | 1,438,090 | 130,607 | ||||
| Kinsale Capital Group Inc. | 546,596 | 130,030 | ||||
| CIT Group Inc. | 2,501,861 | 128,446 | ||||
| Webster Financial Corp. | 2,285,154 | 127,603 | ||||
| * | Credit Acceptance Corp. | 183,332 | 126,074 | |||
| New Residential Investment Corp. | 11,763,744 | 125,990 | ||||
| Sterling Bancorp | 4,859,199 | 125,319 | ||||
| Selective Insurance Group Inc. | 1,515,807 | 124,205 | ||||
| Erie Indemnity Co. Class A | 640,795 | 123,456 | ||||
| Blackstone Mortgage Trust Inc. Class A | 4,002,750 | 122,564 | ||||
| RLI Corp. | 1,083,164 | 121,423 | ||||
| * | Trupanion Inc. | 916,111 | 120,954 | |||
| Essent Group Ltd. | 2,648,282 | 120,576 | ||||
| First Citizens BancShares Inc. Class A | 144,640 | 120,028 | ||||
| MGIC Investment Corp. | 8,226,033 | 118,619 | ||||
| United Bankshares Inc. | 3,265,367 | 118,468 | ||||
| Lazard Ltd. Class A | 2,700,057 | 117,803 | ||||
| Shares | Market Value• ($000) | |||||
| Unum Group | 4,638,908 | 113,978 | ||||
| Evercore Inc. Class A | 837,245 | 113,740 | ||||
| UMB Financial Corp. | 1,036,847 | 110,020 | ||||
| * | Alleghany Corp. | 164,542 | 109,847 | |||
| Walker & Dunlop Inc. | 727,427 | 109,754 | ||||
| Globe Life Inc. | 1,148,861 | 107,671 | ||||
| Hanover Insurance Group Inc. | 807,132 | 105,783 | ||||
| Umpqua Holdings Corp. | 5,466,525 | 105,176 | ||||
| Axis Capital Holdings Ltd. | 1,922,571 | 104,722 | ||||
| ServisFirst Bancshares Inc. | 1,231,241 | 104,582 | ||||
| * | Brighthouse Financial Inc. | 2,009,234 | 104,078 | |||
| Hancock Whitney Corp. | 2,078,957 | 103,989 | ||||
| Community Bank System Inc. | 1,360,176 | 101,306 | ||||
| * | Silvergate Capital Corp. Class A | 678,585 | 100,566 | |||
| Jackson Financial Inc. Class A | 2,348,970 | 98,257 | ||||
| FNB Corp. | 8,040,026 | 97,526 | ||||
| Moelis & Co. Class A | 1,537,374 | 96,101 | ||||
| Radian Group Inc. | 4,526,763 | 95,650 | ||||
| United Community Banks Inc. | 2,660,687 | 95,625 | ||||
| Pacific Premier Bancorp Inc. | 2,376,350 | 95,125 | ||||
| BankUnited Inc. | 2,245,491 | 95,007 | ||||
| Independent Bank Corp. | 1,133,946 | 92,451 | ||||
| Home BancShares Inc. | 3,714,094 | 90,438 | ||||
| Chimera Investment Corp. | 5,971,280 | 90,047 | ||||
| Kemper Corp. | 1,522,358 | 89,499 | ||||
| First Hawaiian Inc. | 3,246,836 | 88,736 | ||||
| Federated Hermes Inc. Class B | 2,317,534 | 87,093 | ||||
| Eastern Bankshares Inc. | 4,238,338 | 85,487 | ||||
| Investors Bancorp Inc. | 5,614,253 | 85,056 | ||||
| Bank of Hawaii Corp. | 1,014,232 | 84,952 | ||||
| Assured Guaranty Ltd. | 1,673,842 | 84,027 | ||||
| WSFS Financial Corp. | 1,652,893 | ��82,843 | ||||
| Ameris Bancorp | 1,666,702 | 82,802 | ||||
| Hamilton Lane Inc. Class A | 796,718 | 82,556 | ||||
| Navient Corp. | 3,863,917 | 81,992 | ||||
| American Equity Investment Life Holding Co. | 2,096,915 | 81,612 | ||||
| Virtu Financial Inc. Class A | 2,828,588 | 81,548 | ||||
| Shares | Market Value• ($000) | |||||
| Simmons First National Corp. Class A | 2,749,159 | 81,320 | ||||
| Associated Banc-Corp | 3,595,623 | 81,225 | ||||
| *,1 | Marathon Digital Holdings Inc. | 2,460,477 | 80,851 | |||
| Cathay General Bancorp | 1,847,372 | 79,419 | ||||
| * | Texas Capital Bancshares Inc. | 1,274,085 | 76,764 | |||
| Piper Sandler Cos. | 427,886 | 76,382 | ||||
| Old National Bancorp | 4,183,085 | 75,797 | ||||
| * | Axos Financial Inc. | 1,348,476 | 75,393 | |||
| CNO Financial Group Inc. | 3,125,608 | 74,514 | ||||
| Artisan Partners Asset Management Inc. Class A | 1,562,309 | 74,428 | ||||
| White Mountains Insurance Group Ltd. | 72,304 | 73,309 | ||||
| BOK Financial Corp. | 693,207 | 73,126 | ||||
| FirstCash Holdings Inc. | 968,359 | 72,443 | ||||
| First Bancorp | 5,181,726 | 71,404 | ||||
| CVB Financial Corp. | 3,247,706 | 69,533 | ||||
| * | Focus Financial Partners Inc. Class A | 1,159,413 | 69,240 | |||
| Fulton Financial Corp. | 4,059,290 | 69,008 | ||||
| * | Enstar Group Ltd. | 274,968 | 68,079 | |||
| Atlantic Union Bankshares Corp. | 1,807,020 | 67,384 | ||||
| * | Cannae Holdings Inc. | 1,906,163 | 67,002 | |||
| Independent Bank Group Inc. | 919,355 | 66,331 | ||||
| Santander Consumer USA Holdings Inc. | 1,552,349 | 65,230 | ||||
| Columbia Banking System Inc. | 1,976,722 | 64,678 | ||||
| Flagstar Bancorp Inc. | 1,332,257 | 63,868 | ||||
| *,1 | Riot Blockchain Inc. | 2,776,025 | 61,989 | |||
| * | LendingClub Corp. | 2,519,354 | 60,918 | |||
| International Bancshares Corp. | 1,433,364 | 60,760 | ||||
| First Midwest Bancorp Inc. | 2,869,758 | 58,773 | ||||
| Goosehead Insurance Inc. Class A | 448,733 | 58,371 | ||||
| PennyMac Financial Services Inc. | 818,732 | 57,131 | ||||
| First Merchants Corp. | 1,355,641 | 56,788 | ||||
| Cohen & Steers Inc. | 607,059 | 56,159 | ||||
| * | Ryan Specialty Group Holdings Inc. Class A | 1,383,929 | 55,842 | |||
| Washington Federal Inc. | 1,642,630 | 54,831 | ||||
| First Financial Bancorp | 2,238,452 | 54,573 | ||||
| Shares | Market Value• ($000) | |||||
| Virtus Investment Partners Inc. | 181,439 | 53,906 | ||||
| * | Open Lending Corp. Class A | 2,386,337 | 53,645 | |||
| StepStone Group Inc. Class A | 1,280,211 | 53,218 | ||||
| WesBanco Inc. | 1,508,730 | 52,790 | ||||
| * | PRA Group Inc. | 1,042,202 | 52,329 | |||
| Hilltop Holdings Inc. | 1,488,856 | 52,318 | ||||
| Towne Bank | 1,644,592 | 51,953 | ||||
| * | Genworth Financial Inc. Class A | 12,768,456 | 51,712 | |||
| MFA Financial Inc. | 11,068,470 | 50,472 | ||||
| Renasant Corp. | 1,328,513 | 50,417 | ||||
| Park National Corp. | 366,025 | 50,259 | ||||
| Two Harbors Investment Corp. | 8,636,274 | 49,831 | ||||
| Banner Corp. | 817,003 | 49,568 | ||||
| * | BRP Group Inc. Class A | 1,363,249 | 49,227 | |||
| Argo Group International Holdings Ltd. | 832,609 | 48,383 | ||||
| Great Western Bancorp Inc. | 1,386,414 | 47,083 | ||||
| Eagle Bancorp Inc. | 799,608 | 46,649 | ||||
| Apollo Commercial Real Estate Finance Inc. | 3,492,734 | 45,964 | ||||
| Trustmark Corp. | 1,409,883 | 45,765 | ||||
| 1 | iStar Inc. | 1,687,092 | 43,578 | |||
| Compass Diversified Holdings | 1,409,339 | 43,098 | ||||
| Northwest Bancshares Inc. | 3,016,736 | 42,717 | ||||
| Provident Financial Services Inc. | 1,745,874 | 42,285 | ||||
| Hope Bancorp Inc. | 2,868,274 | 42,192 | ||||
| PennyMac Mortgage Investment Trust | 2,427,963 | 42,077 | ||||
| Nelnet Inc. Class A | 417,602 | 40,791 | ||||
| First Interstate BancSystem Inc. Class A | 995,455 | 40,485 | ||||
| Horace Mann Educators Corp. | 1,037,537 | 40,153 | ||||
| NBT Bancorp Inc. | 1,028,075 | 39,601 | ||||
| First Commonwealth Financial Corp. | 2,432,709 | 39,142 | ||||
| *,1 | Lemonade Inc. | 929,213 | 39,129 | |||
| Redwood Trust Inc. | 2,910,300 | 38,387 | ||||
| BGC Partners Inc. Class A | 8,110,584 | 37,714 | ||||
| Capitol Federal Financial Inc. | 3,284,022 | 37,208 | ||||
| Mercury General Corp. | 695,000 | 36,877 | ||||
| Westamerica Bancorp | 637,620 | 36,810 | ||||
| Shares | Market Value• ($000) | |||||
| *,1 | Encore Capital Group Inc. | 592,281 | 36,787 | |||
| * | Triumph Bancorp Inc. | 301,462 | 35,898 | |||
| * | LendingTree Inc. | 290,544 | 35,621 | |||
| * | Mr Cooper Group Inc. | 855,312 | 35,590 | |||
| Live Oak Bancshares Inc. | 407,618 | 35,581 | ||||
| ProAssurance Corp. | 1,350,864 | 34,177 | ||||
| Ladder Capital Corp. | 2,800,787 | 33,581 | ||||
| OFG Bancorp | 1,247,001 | 33,120 | ||||
| National Bank Holdings Corp. Class A | 719,883 | 31,632 | ||||
| Berkshire Hills Bancorp Inc. | 1,096,365 | 31,170 | ||||
| Safety Insurance Group Inc. | 365,681 | 31,094 | ||||
| Broadmark Realty Capital Inc. | 3,235,895 | 30,514 | ||||
| S&T Bancorp Inc. | 962,388 | 30,334 | ||||
| Brookline Bancorp Inc. | 1,837,701 | 29,752 | ||||
| City Holding Co. | 358,043 | 29,284 | ||||
| BancFirst Corp. | 406,283 | 28,667 | ||||
| Employers Holdings Inc. | 661,650 | 27,379 | ||||
| Tompkins Financial Corp. | 321,498 | 26,871 | ||||
| * | World Acceptance Corp. | 109,332 | 26,833 | |||
| TFS Financial Corp. | 1,448,105 | 25,878 | ||||
| Heartland Financial USA Inc. | 489,869 | 24,792 | ||||
| *,1 | Oscar Health Inc. Class A | 3,064,460 | 24,056 | |||
| BrightSpire Capital Inc. Class A | 2,336,621 | 23,974 | ||||
| State Auto Financial Corp. | 453,994 | 23,467 | ||||
| Kearny Financial Corp. | 1,694,132 | 22,447 | ||||
| ARMOUR Residential REIT Inc. | 2,266,684 | 22,236 | ||||
| Invesco Mortgage Capital Inc. | 7,931,661 | 22,050 | ||||
| PJT Partners Inc. Class A | 283,851 | 21,031 | ||||
| * | Blucora Inc. | 1,192,201 | 20,649 | |||
| * | Palomar Holdings Inc. | 309,646 | 20,056 | |||
| * | Columbia Financial Inc. | 959,818 | 20,022 | |||
| TPG RE Finance Trust Inc. | 1,586,301 | 19,543 | ||||
| Central Pacific Financial Corp. | 691,945 | 19,492 | ||||
| WisdomTree Investments Inc. | 3,165,295 | 19,372 | ||||
| * | Ambac Financial Group Inc. | 1,187,122 | 19,053 | |||
| * | SiriusPoint Ltd. | 2,294,889 | 18,657 | |||
| Shares | Market Value• ($000) | |||||
| * | Clearwater Analytics Holdings Inc. Class A | 770,776 | 17,712 | |||
| KKR Real Estate Finance Trust Inc. | 828,625 | 17,260 | ||||
| Northfield Bancorp Inc. | 1,038,183 | 16,777 | ||||
| United Fire Group Inc. | 644,313 | 14,942 | ||||
| * | AssetMark Financial Holdings Inc. | 472,733 | 12,390 | |||
| * | Franklin BSP Realty Trust Inc. | 774,870 | 11,577 | |||
| National Western Life Group Inc. Class A | 48,815 | 10,468 | ||||
| GCM Grosvenor Inc. Class A | 929,226 | 9,757 | ||||
| *,1 | Romeo Power Inc. | 2,418,703 | 8,828 | |||
| *,1 | Root Inc. Class A | 2,816,433 | 8,731 | |||
| Granite Point Mortgage Trust Inc. | 704,950 | 8,255 | ||||
| * | P10 Inc. Class A | 498,161 | 6,964 | |||
| * | eHealth Inc. | 263,327 | 6,715 | |||
| * | GoHealth Inc. Class A | 1,540,993 | 5,840 | |||
| *,1 | Hagerty Inc. Class A | 320,725 | 4,548 | |||
| * | Bakkt Holdings Inc. | 313,173 | 2,665 | |||
| * | MetroMile Inc. | 1,027,116 | 2,249 | |||
| loanDepot Inc. Class A | 452,588 | 2,172 | ||||
| Associated Capital Group Inc. Class A | 49,883 | 2,145 | ||||
| Apollo Asset Management Inc. | 3,117 | 226 | ||||
| American National Group Inc. | 393 | 74 | ||||
| * | Athene Holding Ltd. Class A | 548 | 46 | |||
| *,2 | Frontier Financial Corp. | 1 | — | |||
| 20,712,791 | ||||||
| Health Care (11.7%) | ||||||
| Bio-Techne Corp. | 991,411 | 512,897 | ||||
| * | Molina Healthcare Inc. | 1,472,716 | 468,441 | |||
| * | Masimo Corp. | 1,253,773 | 367,080 | |||
| * | Repligen Corp. | 1,324,733 | 350,842 | |||
| * | Novavax Inc. | 1,907,289 | 272,876 | |||
| * | Syneos Health Inc. | 2,615,275 | 268,536 | |||
| * | Penumbra Inc. | 894,953 | 257,138 | |||
| * | Guardant Health Inc. | 2,435,426 | 243,591 | |||
| * | Tandem Diabetes Care Inc. | 1,602,211 | 241,165 | |||
| * | Charles River Laboratories International Inc. | 636,515 | 239,826 | |||
| * | Tenet Healthcare Corp. | 2,700,783 | 220,627 | |||
| * | United Therapeutics Corp. | 1,016,011 | 219,540 | |||
| Bruker Corp. | 2,486,725 | 208,661 | ||||
| Chemed Corp. | 388,036 | 205,287 | ||||
| Shares | Market Value• ($000) | |||||
| * | Neurocrine Biosciences Inc. | 2,392,702 | 203,786 | |||
| * | Natera Inc. | 2,146,714 | 200,482 | |||
| * | Omnicell Inc. | 1,108,043 | 199,935 | |||
| * | Intellia Therapeutics Inc. | 1,689,383 | 199,753 | |||
| Organon & Co. | 6,392,040 | 194,638 | ||||
| * | Sarepta Therapeutics Inc. | 2,085,671 | 187,815 | |||
| * | Jazz Pharmaceuticals plc | 1,471,758 | 187,502 | |||
| * | Mirati Therapeutics Inc. | 1,253,748 | 183,912 | |||
| * | Envista Holdings Corp. | 4,068,312 | 183,318 | |||
| * | Arrowhead Pharmaceuticals Inc. | 2,503,912 | 166,009 | |||
| Encompass Health Corp. | 2,505,926 | 163,537 | ||||
| * | Blueprint Medicines Corp. | 1,483,121 | 158,857 | |||
| * | Medpace Holdings Inc. | 724,969 | 157,782 | |||
| * | Shockwave Medical Inc. | 845,674 | 150,809 | |||
| * | Inspire Medical Systems Inc. | 655,203 | 150,736 | |||
| * | Exelixis Inc. | 7,975,889 | 145,799 | |||
| * | Globus Medical Inc. Class A | 1,992,113 | 143,831 | |||
| * | Arena Pharmaceuticals Inc. | 1,545,279 | 143,618 | |||
| * | Halozyme Therapeutics Inc. | 3,548,543 | 142,687 | |||
| * | Acadia Healthcare Co. Inc. | 2,264,946 | 137,482 | |||
| * | Ultragenyx Pharmaceutical Inc. | 1,632,021 | 137,237 | |||
| * | Amedisys Inc. | 821,547 | 132,992 | |||
| Perrigo Co. plc | 3,370,542 | 131,114 | ||||
| * | Neogen Corp. | 2,708,678 | 123,001 | |||
| * | Integra LifeSciences Holdings Corp. | 1,813,409 | 121,480 | |||
| * | ICU Medical Inc. | 508,422 | 120,669 | |||
| * | Quidel Corp. | 893,267 | 120,582 | |||
| Premier Inc. Class A | 2,916,066 | 120,054 | ||||
| * | Fate Therapeutics Inc. | 2,046,077 | 119,716 | |||
| * | Maravai LifeSciences Holdings Inc. Class A | 2,817,194 | 118,040 | |||
| Ensign Group Inc. | 1,321,592 | 110,961 | ||||
| * | STAAR Surgical Co. | 1,199,989 | 109,559 | |||
| * | Pacific Biosciences of California Inc. | 5,284,404 | 108,119 | |||
| CONMED Corp. | 736,383 | 104,390 | ||||
| * | LHC Group Inc. | 757,678 | 103,976 | |||
| * | Option Care Health Inc. | 3,624,615 | 103,084 | |||
| Shares | Market Value• ($000) | |||||
| * | Beam Therapeutics Inc. | 1,288,353 | 102,669 | |||
| * | NeoGenomics Inc. | 2,946,948 | 100,550 | |||
| * | Apellis Pharmaceuticals Inc. | 2,084,120 | 98,537 | |||
| * | Intra-Cellular Therapies Inc. | 1,847,041 | 96,674 | |||
| * | Denali Therapeutics Inc. | 2,154,148 | 96,075 | |||
| * | Alkermes plc | 4,073,941 | 94,760 | |||
| * | HealthEquity Inc. | 2,101,224 | 92,958 | |||
| * | Ionis Pharmaceuticals Inc. | 3,022,813 | 91,984 | |||
| * | Adaptive Biotechnologies Corp. | 3,198,328 | 89,745 | |||
| * | R1 RCM Inc. | 3,494,855 | 89,084 | |||
| * | Arvinas Inc. | 1,065,238 | 87,499 | |||
| * | Twist Bioscience Corp. | 1,125,574 | 87,108 | |||
| * | Progyny Inc. | 1,709,567 | 86,077 | |||
| * | Merit Medical Systems Inc. | 1,350,855 | 84,158 | |||
| * | Novocure Ltd. | 1,111,187 | 83,428 | |||
| * | iRhythm Technologies Inc. | 705,164 | 82,991 | |||
| * | Vir Biotechnology Inc. | 1,978,463 | 82,838 | |||
| * | Invitae Corp. | 5,418,653 | 82,743 | |||
| * | Insmed Inc. | 2,981,598 | 81,219 | |||
| * | Amicus Therapeutics Inc. | 7,015,974 | 81,034 | |||
| Select Medical Holdings Corp. | 2,698,285 | 79,330 | ||||
| Owens & Minor Inc. | 1,805,635 | 78,545 | ||||
| * | Prestige Consumer Healthcare Inc. | 1,260,015 | 76,420 | |||
| * | AtriCure Inc. | 1,098,681 | 76,391 | |||
| * | Inari Medical Inc. | 822,596 | 75,078 | |||
| * | Veracyte Inc. | 1,789,846 | 73,742 | |||
| * | Karuna Therapeutics Inc. | 559,217 | 73,257 | |||
| * | Certara Inc. | 2,575,721 | 73,202 | |||
| *,1 | Warby Parker Inc. Class A | 1,547,641 | 72,058 | |||
| * | Zentalis Pharmaceuticals Inc. | 856,236 | 71,975 | |||
| * | Integer Holdings Corp. | 829,882 | 71,030 | |||
| * | ACADIA Pharmaceuticals Inc. | 3,036,287 | 70,867 | |||
| * | PTC Therapeutics Inc. | 1,775,859 | 70,732 | |||
| * | NuVasive Inc. | 1,301,578 | 68,307 | |||
| * | Haemonetics Corp. | 1,286,987 | 68,262 | |||
| * | Nevro Corp. | 834,461 | 67,650 | |||
| * | 1Life Healthcare Inc. | 3,844,823 | 67,554 | |||
| * | Apollo Medical Holdings Inc. | 909,287 | 66,814 | |||
| * | Kodiak Sciences Inc. | 780,303 | 66,154 | |||
| Shares | Market Value• ($000) | |||||
| * | Iovance Biotherapeutics Inc. | 3,391,421 | 64,742 | |||
| Patterson Cos. Inc. | 2,203,422 | 64,670 | ||||
| * | Pacira BioSciences Inc. | 1,063,655 | 64,000 | |||
| * | Ortho Clinical Diagnostics Holdings plc | 2,984,269 | 63,834 | |||
| * | Nektar Therapeutics | 4,637,874 | 62,658 | |||
| * | Ligand Pharmaceuticals Inc. | 399,352 | 61,684 | |||
| * | TG Therapeutics Inc. | 3,241,693 | 61,592 | |||
| * | CareDx Inc. | 1,330,813 | 60,525 | |||
| * | Xencor Inc. | 1,469,294 | 58,948 | |||
| * | Sotera Health Co. | 2,496,970 | 58,804 | |||
| * | Doximity Inc. Class A | 1,164,832 | 58,393 | |||
| * | Magellan Health Inc. | 599,883 | 56,983 | |||
| * | MEDNAX Inc. | 2,061,877 | 56,104 | |||
| * | Evolent Health Inc. Class A | 2,022,877 | 55,973 | |||
| * | Surgery Partners Inc. | 1,024,315 | 54,709 | |||
| * | Sage Therapeutics Inc. | 1,259,117 | 53,563 | |||
| * | Emergent BioSolutions Inc. | 1,220,558 | 53,058 | |||
| * | Myriad Genetics Inc. | 1,909,600 | 52,705 | |||
| * | Outset Medical Inc. | 1,133,709 | 52,253 | |||
| * | ChemoCentryx Inc. | 1,411,950 | 51,409 | |||
| * | CorVel Corp. | 244,767 | 50,912 | |||
| * | Relay Therapeutics Inc. | 1,633,691 | 50,171 | |||
| * | SpringWorks Therapeutics Inc. | 804,779 | 49,880 | |||
| * | Glaukos Corp. | 1,118,695 | 49,715 | |||
| * | Kymera Therapeutics Inc. | 777,910 | 49,389 | |||
| *,1 | Corcept Therapeutics Inc. | 2,422,692 | 47,969 | |||
| * | Global Blood Therapeutics Inc. | 1,623,747 | 47,527 | |||
| * | Turning Point Therapeutics Inc. | 996,239 | 47,521 | |||
| * | Cytokinetics Inc. | 1,003,406 | 45,735 | |||
| * | Editas Medicine Inc. | 1,719,636 | 45,656 | |||
| * | AdaptHealth Corp. Class A | 1,855,593 | 45,388 | |||
| *,1 | OPKO Health Inc. | 9,412,503 | 45,274 | |||
| * | Oak Street Health Inc. | 1,363,521 | 45,187 | |||
| * | Agios Pharmaceuticals Inc. | 1,364,791 | 44,861 | |||
| * | REVOLUTION Medicines Inc. | 1,760,516 | 44,312 | |||
| * | Health Catalyst Inc. | 1,112,943 | 44,095 | |||
| * | Bridgebio Pharma Inc. | 2,590,061 | 43,202 | |||
| * | Cerevel Therapeutics Holdings Inc. | 1,303,705 | 42,266 | |||
| * | Avanos Medical Inc. | 1,210,554 | 41,970 | |||
| Shares | Market Value• ($000) | |||||
| * | Ironwood Pharmaceuticals Inc. Class A | 3,492,511 | 40,723 | |||
| *,1 | Multiplan Corp. | 8,923,556 | 39,531 | |||
| * | Supernus Pharmaceuticals Inc. | 1,264,805 | 36,882 | |||
| * | Accolade Inc. | 1,365,876 | 36,004 | |||
| * | Silk Road Medical Inc. | 800,990 | 34,130 | |||
| Healthcare Services Group Inc. | 1,866,662 | 33,208 | ||||
| * | Sana Biotechnology Inc. | 2,133,362 | 33,024 | |||
| * | Varex Imaging Corp. | 1,012,869 | 31,956 | |||
| *,1 | Recursion Pharmaceuticals Inc. Class A | 1,801,970 | 30,868 | |||
| * | REGENXBIO Inc. | 932,857 | 30,504 | |||
| * | FibroGen Inc. | 2,141,160 | 30,190 | |||
| * | Alector Inc. | 1,430,057 | 29,531 | |||
| * | Tivity Health Inc. | 1,087,646 | 28,757 | |||
| * | Cano Health Inc. | 3,163,992 | 28,191 | |||
| * | Harmony Biosciences Holdings Inc. | 660,432 | 28,161 | |||
| *,1 | Clover Health Investments Corp. Class A | 7,474,434 | 27,805 | |||
| *,1 | Seer Inc. Class A | 1,217,382 | 27,768 | |||
| * | Innoviva Inc. | 1,605,342 | 27,692 | |||
| * | Privia Health Group Inc. | 1,065,072 | 27,553 | |||
| * | American Well Corp. Class A | 4,553,073 | 27,501 | |||
| *,1 | Axsome Therapeutics Inc. | 725,277 | 27,401 | |||
| * | Allogene Therapeutics Inc. | 1,833,514 | 27,356 | |||
| * | Alignment Healthcare Inc. | 1,927,185 | 27,096 | |||
| * | Axonics Inc. | 473,596 | 26,521 | |||
| * | Nuvation Bio Inc. | 3,006,985 | 25,559 | |||
| * | Madrigal Pharmaceuticals Inc. | 298,024 | 25,255 | |||
| * | Arcus Biosciences Inc. | 616,929 | 24,967 | |||
| * | NanoString Technologies Inc. | 584,853 | 24,698 | |||
| * | NextGen Healthcare Inc. | 1,386,300 | 24,662 | |||
| * | Brookdale Senior Living Inc. | 4,769,054 | 24,608 | |||
| *,1 | Butterfly Network Inc. | 3,668,699 | 24,544 | |||
| * | Heron Therapeutics Inc. | 2,639,329 | 24,097 | |||
| * | Phreesia Inc. | 573,282 | 23,883 | |||
| * | Berkeley Lights Inc. | 1,291,739 | 23,484 | |||
| * | Meridian Bioscience Inc. | 1,113,978 | 22,725 | |||
| * | Instil Bio Inc. | 1,294,158 | 22,143 | |||
| Shares | Market Value• ($000) | |||||
| * | Endo International plc | 5,722,757 | 21,518 | |||
| National HealthCare Corp. | 316,261 | 21,487 | ||||
| *,1 | Hims & Hers Health Inc. | 3,251,584 | 21,298 | |||
| * | Pulmonx Corp. | 658,662 | 21,123 | |||
| * | Vaxcyte Inc. | 874,810 | 20,812 | |||
| * | Agiliti Inc. | 836,174 | 19,366 | |||
| * | Inogen Inc. | 538,962 | 18,325 | |||
| * | Praxis Precision Medicines Inc. | 924,540 | 18,213 | |||
| * | Reata Pharmaceuticals Inc. Class A | 686,519 | 18,103 | |||
| * | Gossamer Bio Inc. | 1,558,780 | 17,630 | |||
| * | Bluebird Bio Inc. | 1,753,776 | 17,520 | |||
| * | PMV Pharmaceuticals Inc. | 756,725 | 17,480 | |||
| * | Definitive Healthcare Corp. Class A | 636,374 | 17,392 | |||
| * | AnaptysBio Inc. | 496,155 | 17,241 | |||
| * | HealthStream Inc. | 646,919 | 17,053 | |||
| *,1 | Day One Biopharmaceuticals Inc. | 1,007,215 | 16,972 | |||
| * | Theravance Biopharma Inc. | 1,509,630 | 16,681 | |||
| * | Atara Biotherapeutics Inc. | 1,044,579 | 16,463 | |||
| * | Pennant Group Inc. | 655,582 | 15,131 | |||
| * | Orthofix Medical Inc. | 480,226 | 14,930 | |||
| * | Atea Pharmaceuticals Inc. | 1,650,140 | 14,752 | |||
| * | Amneal Pharmaceuticals Inc. | 3,066,710 | 14,690 | |||
| * | NGM Biopharmaceuticals Inc. | 774,404 | 13,715 | |||
| *,1 | Verve Therapeutics Inc. | 369,698 | 13,631 | |||
| * | BioAtla Inc. | 683,018 | 13,408 | |||
| * | Kronos Bio Inc. | 940,161 | 12,777 | |||
| * | Stoke Therapeutics Inc. | 521,357 | 12,507 | |||
| * | Rocket Pharmaceuticals Inc. | 571,891 | 12,484 | |||
| * | Treace Medical Concepts Inc. | 663,221 | 12,362 | |||
| *,1 | ImmunityBio Inc. | 2,006,908 | 12,202 | |||
| *,1 | Design Therapeutics Inc. | 556,075 | 11,906 | |||
| * | Zogenix Inc. | 716,718 | 11,647 | |||
| * | Forma Therapeutics Holdings Inc. | 792,139 | 11,264 | |||
| * | Sangamo Therapeutics Inc. | 1,497,888 | 11,234 | |||
| * | Phathom Pharmaceuticals Inc. | 544,190 | 10,704 | |||
| Shares | Market Value• ($000) | |||||
| Phibro Animal Health Corp. Class A | 522,532 | 10,670 | ||||
| * | Natus Medical Inc. | 435,140 | 10,326 | |||
| * | Cullinan Oncology Inc. | 668,928 | 10,322 | |||
| * | Precigen Inc. | 2,747,745 | 10,194 | |||
| * | ALX Oncology Holdings Inc. | 466,749 | 10,030 | |||
| * | Kinnate Biopharma Inc. | 561,242 | 9,945 | |||
| * | Allovir Inc. | 757,647 | 9,804 | |||
| * | Allakos Inc. | 954,793 | 9,347 | |||
| *,1 | LifeStance Health Group Inc. | 970,674 | 9,241 | |||
| * | Signify Health Inc. Class A | 636,900 | 9,057 | |||
| * | Kiniksa Pharmaceuticals Ltd. Class A | 754,638 | 8,882 | |||
| * | Immunovant Inc. | 1,038,705 | 8,850 | |||
| * | Aveanna Healthcare Holdings Inc. | 1,173,320 | 8,683 | |||
| * | Radius Health Inc. | 1,214,258 | 8,403 | |||
| * | Singular Genomics Systems Inc. | 718,773 | 8,309 | |||
| *,1 | 23andMe Holding Co. | 1,227,059 | 8,172 | |||
| * | 2seventy bio Inc. | 293,743 | 7,529 | |||
| *,1 | Erasca Inc. | 452,072 | 7,043 | |||
| *,1 | SmileDirectClub Inc. Class A | 2,904,645 | 6,826 | |||
| * | Generation Bio Co. | 950,293 | 6,728 | |||
| *,1 | Monte Rosa Therapeutics Inc. | 296,567 | 6,056 | |||
| * | Rubius Therapeutics Inc. | 577,838 | 5,593 | |||
| * | Cytek Biosciences Inc. | 342,692 | 5,593 | |||
| *,1 | P3 Health Partners Inc. | 773,902 | 5,448 | |||
| * | Deciphera Pharmaceuticals Inc. | 506,698 | 4,950 | |||
| *,1 | Lyell Immunopharma Inc. | 620,609 | 4,803 | |||
| *,1 | G1 Therapeutics Inc. | 435,734 | 4,449 | |||
| * | PROCEPT BioRobotics Corp. | 162,672 | 4,068 | |||
| *,1 | Nuvalent Inc. Class A | 211,307 | 4,023 | |||
| * | Aerie Pharmaceuticals Inc. | 557,431 | 3,913 | |||
| *,1 | Olema Pharmaceuticals Inc. | 401,017 | 3,754 | |||
| *,1 | Adagio Therapeutics Inc. | 419,638 | 3,047 | |||
| *,1 | Absci Corp. | 364,365 | 2,988 | |||
| * | Innovage Holding Corp. | 515,391 | 2,577 | |||
| * | Epizyme Inc. | 1,001,631 | 2,504 | |||
| * | Nkarta Inc. | 161,272 | 2,476 | |||
| Shares | Market Value• ($000) | |||||
| *,1 | Prelude Therapeutics Inc. | 175,549 | 2,186 | |||
| *,1 | Vor BioPharma Inc. | 182,164 | 2,117 | |||
| *,2 | Alder Biopharmaceuticals Inc. CVR Exp. 12/31/24 | 1,792,706 | 1,578 | |||
| *,1 | Silverback Therapeutics Inc. | 233,142 | 1,553 | |||
| * | Eargo Inc. | 280,561 | 1,431 | |||
| *,1 | Bright Health Group Inc. | 164,948 | 567 | |||
| *,1 | Cue Health Inc. | 34,129 | 458 | |||
| PerkinElmer Inc. | 1,640 | 330 | ||||
| * | Avantor Inc. | 7,293 | 307 | |||
| * | Intercept Pharmaceuticals Inc. | 400 | 7 | |||
| *,1 | Clovis Oncology Inc. | 1,744 | 5 | |||
| *,1,2 | Synergy Pharmaceuticals LLC | 2,001,166 | — | |||
| *,2 | Wright Medical Group NV | 3,767 | — | |||
| 16,409,046 | ||||||
| Industrials (19.2%) | ||||||
| IDEX Corp. | 1,920,315 | 453,809 | ||||
| * | Builders FirstSource Inc. | 4,832,143 | 414,163 | |||
| Quanta Services Inc. | 3,595,716 | 412,285 | ||||
| * | Trex Co. Inc. | 2,904,425 | 392,185 | |||
| Graco Inc. | 4,294,046 | 346,186 | ||||
| Nordson Corp. | 1,320,748 | 337,147 | ||||
| RPM International Inc. | 3,274,267 | 330,701 | ||||
| Carlisle Cos. Inc. | 1,319,656 | 327,433 | ||||
| Howmet Aerospace Inc. | 9,697,925 | 308,685 | ||||
| Pentair plc | 4,176,856 | 305,036 | ||||
| Allegion plc | 2,263,188 | 299,737 | ||||
| Robert Half International Inc. | 2,670,410 | 297,804 | ||||
| Regal Rexnord Corp. | 1,709,766 | 290,968 | ||||
| A O Smith Corp. | 3,361,027 | 288,544 | ||||
| Booz Allen Hamilton Holding Corp. | 3,378,832 | 286,491 | ||||
| * | Fair Isaac Corp. | 655,640 | 284,331 | |||
| * | AECOM | 3,587,569 | 277,498 | |||
| * | Middleby Corp. | 1,403,830 | 276,218 | |||
| Lennox International Inc. | 830,909 | 269,514 | ||||
| Toro Co. | 2,687,091 | 268,467 | ||||
| * | GXO Logistics Inc. | 2,891,464 | 262,632 | |||
| Watsco Inc. | 833,475 | 260,778 | ||||
| * | Axon Enterprise Inc. | 1,640,870 | 257,617 | |||
| * | Berry Global Group Inc. | 3,421,724 | 252,455 | |||
| Sealed Air Corp. | 3,739,774 | 252,323 | ||||
| Genpact Ltd. | 4,748,242 | 252,037 | ||||
| Shares | Market Value• ($000) | |||||
| * | Sensata Technologies Holding plc | 3,997,962 | 246,634 | |||
| MKS Instruments Inc. | 1,399,121 | 243,685 | ||||
| Tetra Tech Inc. | 1,359,648 | 230,868 | ||||
| * | WillScot Mobile Mini Holdings Corp. | 5,630,479 | 229,949 | |||
| Knight-Swift Transportation Holdings Inc. Class A | 3,769,606 | 229,720 | ||||
| Owens Corning | 2,535,473 | 229,460 | ||||
| * | Paylocity Holding Corp. | 971,599 | 229,453 | |||
| * | TopBuild Corp. | 830,786 | 229,222 | |||
| * | Saia Inc. | 664,463 | 223,944 | |||
| ITT Inc. | 2,161,878 | 220,922 | ||||
| Lincoln Electric Holdings Inc. | 1,491,005 | 207,950 | ||||
| AptarGroup Inc. | 1,661,399 | 203,488 | ||||
| Brunswick Corp. | 1,944,811 | 195,901 | ||||
| Littelfuse Inc. | 621,311 | 195,514 | ||||
| Oshkosh Corp. | 1,703,015 | 191,947 | ||||
| * | XPO Logistics Inc. | 2,465,515 | 190,905 | |||
| * | Axalta Coating Systems Ltd. | 5,761,572 | 190,823 | |||
| Huntington Ingalls Industries Inc. | 1,011,045 | 188,803 | ||||
| Acuity Brands Inc. | 882,856 | 186,918 | ||||
| Donaldson Co. Inc. | 3,120,436 | 184,917 | ||||
| Advanced Drainage Systems Inc. | 1,347,842 | 183,482 | ||||
| AGCO Corp. | 1,510,099 | 175,202 | ||||
| Louisiana-Pacific Corp. | 2,217,665 | 173,754 | ||||
| Landstar System Inc. | 961,918 | 172,203 | ||||
| EMCOR Group Inc. | 1,346,023 | 171,470 | ||||
| Eagle Materials Inc. | 1,026,811 | 170,923 | ||||
| * | WESCO International Inc. | 1,270,987 | 167,249 | |||
| Woodward Inc. | 1,511,038 | 165,398 | ||||
| * | Coherent Inc. | 619,199 | 165,041 | |||
| Cognex Corp. | 2,118,818 | 164,759 | ||||
| * | Colfax Corp. | 3,516,292 | 161,644 | |||
| nVent Electric plc | 4,244,282 | 161,283 | ||||
| * | WEX Inc. | 1,130,072 | 158,651 | |||
| MDU Resources Group Inc. | 5,132,164 | 158,276 | ||||
| Jack Henry & Associates Inc. | 935,056 | 156,145 | ||||
| * | ASGN Inc. | 1,248,580 | 154,075 | |||
| Exponent Inc. | 1,314,427 | 153,433 | ||||
| Simpson Manufacturing Co. Inc. | 1,095,087 | 152,294 | ||||
| Graphic Packaging Holding Co. | 7,749,534 | 151,116 | ||||
| * | Euronet Worldwide Inc. | 1,266,170 | 150,889 | |||
| * | Chart Industries Inc. | 917,756 | 146,373 | |||
| Shares | Market Value• ($000) | |||||
| * | AMN Healthcare Services Inc. | 1,191,599 | 145,768 | |||
| Sonoco Products Co. | 2,483,467 | 143,768 | ||||
| Hubbell Inc. Class B | 687,366 | 143,158 | ||||
| MSA Safety Inc. | 939,298 | 141,796 | ||||
| Armstrong World Industries Inc. | 1,196,782 | 138,970 | ||||
| Curtiss-Wright Corp. | 989,867 | 137,265 | ||||
| Watts Water Technologies Inc. Class A | 695,544 | 135,054 | ||||
| Valmont Industries Inc. | 535,231 | 134,075 | ||||
| ManpowerGroup Inc. | 1,368,052 | 133,153 | ||||
| * | FTI Consulting Inc. | 864,826 | 132,682 | |||
| Vontier Corp. | 4,264,061 | 131,035 | ||||
| * | MasTec Inc. | 1,405,046 | 129,658 | |||
| * | Atkore Inc. | 1,160,523 | 129,039 | |||
| Crane Co. | 1,258,617 | 128,039 | ||||
| * | AZEK Co. Inc. Class A | 2,733,908 | 126,416 | |||
| Maximus Inc. | 1,563,390 | 124,555 | ||||
| * | Mohawk Industries Inc. | 683,556 | 124,530 | |||
| * | API Group Corp. | 4,812,452 | 124,017 | |||
| John Bean Technologies Corp. | 800,905 | 122,987 | ||||
| Air Lease Corp. Class A | 2,728,723 | 120,691 | ||||
| * | Summit Materials Inc. Class A | 2,990,382 | 120,034 | |||
| * | ExlService Holdings Inc. | 797,697 | 115,483 | |||
| Spirit AeroSystems Holdings Inc. Class A | 2,645,884 | 114,011 | ||||
| BWX Technologies Inc. | 2,325,879 | 111,363 | ||||
| Insperity Inc. | 922,287 | 108,931 | ||||
| HB Fuller Co. | 1,325,289 | 107,348 | ||||
| Ryder System Inc. | 1,285,866 | 105,994 | ||||
| Zurn Water Solutions Corp. | 2,909,421 | 105,903 | ||||
| Korn Ferry | 1,373,415 | 104,009 | ||||
| * | ACI Worldwide Inc. | 2,961,552 | 102,766 | |||
| *,1 | TuSimple Holdings Inc. Class A | 2,857,726 | 102,449 | |||
| Triton International Ltd. | 1,683,754 | 101,413 | ||||
| Flowserve Corp. | 3,282,460 | 100,443 | ||||
| Herc Holdings Inc. | 635,942 | 99,557 | ||||
| Applied Industrial Technologies Inc. | 967,820 | 99,395 | ||||
| Matson Inc. | 1,061,149 | 95,535 | ||||
| Allison Transmission Holdings Inc. | 2,625,749 | 95,446 | ||||
| * | TriNet Group Inc. | 995,566 | 94,838 | |||
| * | Resideo Technologies Inc. | 3,637,004 | 94,671 | |||
| Shares | Market Value• ($000) | |||||
| MSC Industrial Direct Co. Inc. Class A | 1,121,334 | 94,259 | ||||
| Franklin Electric Co. Inc. | 994,532 | 94,043 | ||||
| GATX Corp. | 893,113 | ���93,053 | ||||
| SPX FLOW Inc. | 1,058,973 | 91,580 | ||||
| EVERTEC Inc. | 1,814,193 | 90,673 | ||||
| Western Union Co. | 5,072,201 | 90,488 | ||||
| Aerojet Rocketdyne Holdings Inc. | 1,927,947 | 90,151 | ||||
| * | Kirby Corp. | 1,516,733 | 90,124 | |||
| Silgan Holdings Inc. | 2,087,535 | 89,430 | ||||
| * | Fluor Corp. | 3,564,515 | 88,293 | |||
| Comfort Systems USA Inc. | 863,110 | 85,396 | ||||
| Hillenbrand Inc. | 1,638,947 | 85,209 | ||||
| Altra Industrial Motion Corp. | 1,635,248 | 84,330 | ||||
| AAON Inc. | 1,055,820 | 83,864 | ||||
| Installed Building Products Inc. | 599,249 | 83,727 | ||||
| EnerSys | 1,054,844 | 83,396 | ||||
| Forward Air Corp. | 679,083 | 82,230 | ||||
| Brink's Co. | 1,237,632 | 81,152 | ||||
| * | Beacon Roofing Supply Inc. | 1,411,240 | 80,935 | |||
| UniFirst Corp. | 383,535 | 80,696 | ||||
| Alliance Data Systems Corp. | 1,192,151 | 79,361 | ||||
| * | Mercury Systems Inc. | 1,428,652 | 78,662 | |||
| Badger Meter Inc. | 736,819 | 78,515 | ||||
| * | Itron Inc. | 1,139,675 | 78,091 | |||
| Helios Technologies Inc. | 734,707 | 77,269 | ||||
| * | Welbilt Inc. | 3,239,407 | 77,001 | |||
| Kennametal Inc. | 2,106,045 | 75,628 | ||||
| * | Shift4 Payments Inc. Class A | 1,298,744 | 75,236 | |||
| Otter Tail Corp. | 1,045,131 | 74,643 | ||||
| Belden Inc. | 1,130,769 | 74,325 | ||||
| * | Bloom Energy Corp. Class A | 3,352,630 | 73,523 | |||
| Terex Corp. | 1,669,994 | 73,396 | ||||
| ArcBest Corp. | 612,317 | 73,386 | ||||
| Albany International Corp. Class A | 816,885 | 72,253 | ||||
| * | Vicor Corp. | 564,546 | 71,686 | |||
| * | Masonite International Corp. | 597,723 | 70,501 | |||
| Encore Wire Corp. | 485,493 | 69,474 | ||||
| ABM Industries Inc. | 1,691,816 | 69,111 | ||||
| * | Atlas Air Worldwide Holdings Inc. | 732,899 | 68,980 | |||
| * | Hub Group Inc. Class A | 813,186 | 68,503 | |||
| Werner Enterprises Inc. | 1,431,092 | 68,206 | ||||
| Shares | Market Value• ($000) | |||||
| * | Dycom Industries Inc. | 722,384 | 67,731 | |||
| * | Alight Inc. Class A | 6,185,984 | 66,870 | |||
| *,1 | Virgin Galactic Holdings Inc. | 4,876,238 | 65,244 | |||
| * | SPX Corp. | 1,086,448 | 64,839 | |||
| Trinity Industries Inc. | 2,083,489 | 62,921 | ||||
| Brady Corp. Class A | 1,152,811 | 62,137 | ||||
| * | GMS Inc. | 1,029,518 | 61,884 | |||
| *,1 | Flywire Corp. | 1,615,612 | 61,490 | |||
| * | Hayward Holdings Inc. | 2,337,758 | 61,319 | |||
| * | Kratos Defense & Security Solutions Inc. | 3,117,439 | 60,478 | |||
| Moog Inc. Class A | 733,788 | 59,415 | ||||
| * | JELD-WEN Holding Inc. | 2,184,619 | 57,587 | |||
| * | Verra Mobility Corp. Class A | 3,729,309 | 57,543 | |||
| Mueller Water Products Inc. Class A | 3,970,678 | 57,178 | ||||
| EnPro Industries Inc. | 518,455 | 57,066 | ||||
| Barnes Group Inc. | 1,210,556 | 56,400 | ||||
| ESCO Technologies Inc. | 623,586 | 56,117 | ||||
| Maxar Technologies Inc. | 1,736,743 | 51,286 | ||||
| * | Allegheny Technologies Inc. | 3,193,436 | 50,871 | |||
| *,1 | Nikola Corp. | 5,125,817 | 50,592 | |||
| ManTech International Corp. Class A | 693,186 | 50,554 | ||||
| McGrath RentCorp | 609,968 | 48,956 | ||||
| * | O-I Glass Inc. | 3,934,611 | 47,333 | |||
| * | Green Dot Corp. Class A | 1,304,788 | 47,286 | |||
| * | Ferro Corp. | 2,091,024 | 45,647 | |||
| Granite Construction Inc. | 1,152,569 | 44,604 | ||||
| * | Air Transport Services Group Inc. | 1,491,307 | 43,815 | |||
| * | Meritor Inc. | 1,759,048 | 43,589 | |||
| TTEC Holdings Inc. | 472,348 | 42,771 | ||||
| Lindsay Corp. | 274,485 | 41,722 | ||||
| * | Gates Industrial Corp. plc | 2,568,524 | 40,865 | |||
| * | OSI Systems Inc. | 428,462 | 39,933 | |||
| TriMas Corp. | 1,075,399 | 39,790 | ||||
| Greif Inc. Class A | 640,245 | 38,652 | ||||
| Astec Industries Inc. | 542,821 | 37,601 | ||||
| * | TaskUS Inc. Class A | 683,734 | 36,894 | |||
| * | AeroVironment Inc. | 591,785 | 36,708 | |||
| Griffon Corp. | 1,280,116 | 36,458 | ||||
| Kforce Inc. | 484,309 | 36,430 | ||||
| Greenbrier Cos. Inc. | 791,801 | 36,336 | ||||
| Tennant Co. | 440,475 | 35,696 | ||||
| * | Proto Labs Inc. | 692,926 | 35,582 | |||
| Shares | Market Value• ($000) | |||||
| Schneider National Inc. Class B | 1,307,513 | 35,185 | ||||
| * | ZipRecruiter Inc. Class A | 1,409,296 | 35,148 | |||
| H&E Equipment Services Inc. | 788,348 | 34,900 | ||||
| * | CryoPort Inc. | 587,550 | 34,765 | |||
| Standex International Corp. | 311,927 | 34,518 | ||||
| Deluxe Corp. | 1,067,974 | 34,293 | ||||
| * | AAR Corp. | 843,750 | 32,932 | |||
| AZZ Inc. | 590,791 | 32,665 | ||||
| ADT Inc. | 3,852,795 | 32,402 | ||||
| * | FARO Technologies Inc. | 455,351 | 31,884 | |||
| Primoris Services Corp. | 1,313,464 | 31,497 | ||||
| * | Evo Payments Inc. Class A | 1,218,036 | 31,182 | |||
| Enerpac Tool Group Corp. Class A | 1,531,239 | 31,054 | ||||
| Kaman Corp. | 715,409 | 30,870 | ||||
| * | CoreCivic Inc. | 3,091,379 | 30,821 | |||
| Apogee Enterprises Inc. | 600,486 | 28,913 | ||||
| Pitney Bowes Inc. | 4,295,948 | 28,482 | ||||
| * | Cimpress plc | 391,428 | 28,030 | |||
| * | Gibraltar Industries Inc. | 419,992 | 28,005 | |||
| * | Huron Consulting Group Inc. | 549,167 | 27,403 | |||
| *,1 | Desktop Metal Inc. Class A | 5,433,786 | 26,897 | |||
| * | TrueBlue Inc. | 915,059 | 25,320 | |||
| * | Core & Main Inc. Class A | 801,033 | 24,303 | |||
| Gorman-Rupp Co. | 536,476 | 23,900 | ||||
| Wabash National Corp. | 1,171,307 | 22,864 | ||||
| * | First Advantage Corp. | 1,176,263 | 22,396 | |||
| * | Conduent Inc. | 4,100,660 | 21,898 | |||
| Quanex Building Products Corp. | 864,552 | 21,424 | ||||
| * | Mirion Technologies Inc. | 2,010,001 | 21,045 | |||
| Heartland Express Inc. | 1,224,914 | 20,603 | ||||
| * | Ranpak Holdings Corp. Class A | 542,194 | 20,376 | |||
| * | BTRS Holdings Inc. Class A | 2,569,436 | 20,093 | |||
| *,1 | PureCycle Technologies Inc. | 2,040,307 | 19,526 | |||
| *,1 | Hyliion Holdings Corp. | 3,109,891 | 19,281 | |||
| * | BrightView Holdings Inc. | 1,359,254 | 19,138 | |||
| *,1 | Latch Inc. | 2,526,141 | 19,123 | |||
| *,1 | Danimer Scientific Inc. | 2,151,554 | 18,331 | |||
| Shares | Market Value• ($000) | |||||
| * | Forrester Research Inc. | 295,972 | 17,382 | |||
| * | Advantage Solutions Inc. | 2,042,368 | 16,380 | |||
| * | Enovix Corp. | 547,186 | 14,927 | |||
| * | Loyalty Ventures Inc. | 493,062 | 14,826 | |||
| Kelly Services Inc. Class A | 883,023 | 14,808 | ||||
| * | Triumph Group Inc. | 787,369 | 14,590 | |||
| * | Thermon Group Holdings Inc. | 858,976 | 14,542 | |||
| * | CIRCOR International Inc. | 519,914 | 14,131 | |||
| * | American Woodmark Corp. | 213,494 | 13,920 | |||
| * | CS Disco Inc. | 371,043 | 13,265 | |||
| * | Tutor Perini Corp. | 1,044,607 | 12,922 | |||
| * | Hillman Solutions Corp. | 1,161,810 | 12,489 | |||
| * | Payoneer Global Inc. | 1,694,113 | 12,452 | |||
| *,1 | Paymentus Holdings Inc. Class A | 352,208 | 12,320 | |||
| REV Group Inc. | 830,279 | 11,748 | ||||
| *,1 | Velodyne Lidar Inc. | 2,507,126 | 11,633 | |||
| Pactiv Evergreen Inc. | 910,308 | 11,543 | ||||
| National Presto Industries Inc. | 136,175 | 11,170 | ||||
| * | AvidXchange Holdings Inc. | 736,011 | 11,084 | |||
| Hyster-Yale Materials Handling Inc. | 266,416 | 10,950 | ||||
| * | Vivint Smart Home Inc. | 1,069,525 | 10,460 | |||
| *,1 | View Inc. | 2,515,276 | 9,835 | |||
| Greif Inc. Class B | 161,641 | 9,663 | ||||
| Kronos Worldwide Inc. | 598,477 | 8,983 | ||||
| International Seaways Inc. | 593,737 | 8,716 | ||||
| * | Sterling Check Corp. | 361,279 | 7,410 | |||
| *,1 | Proterra Inc. | 816,181 | 7,207 | |||
| *,1 | Velo3D Inc. | 918,025 | 7,170 | |||
| * | Joby Aviation Inc. | 747,518 | 5,457 | |||
| * | IHS Holding Ltd. | 49,439 | 697 | |||
| *,1 | Legalzoom.com Inc. | 27,584 | 443 | |||
| * | Bill.com Holdings Inc. | 1,402 | 349 | |||
| * | Remitly Global Inc. | 2,752 | 57 | |||
| Macquarie Infrastructure Holdings LLC | 2,195 | 8 | ||||
| 27,027,945 | ||||||
| Real Estate (9.4%) | ||||||
| VICI Properties Inc. | 15,878,091 | 478,089 | ||||
| Kimco Realty Corp. | 15,553,798 | 383,401 | ||||
| Equity LifeStyle Properties Inc. | 4,176,934 | 366,150 | ||||
| Medical Properties Trust Inc. | 15,047,641 | 355,576 | ||||
| Shares | Market Value• ($000) | |||||
| * | Jones Lang LaSalle Inc. | 1,273,225 | 342,930 | |||
| Life Storage Inc. | 2,070,525 | 317,163 | ||||
| CubeSmart | 5,472,562 | 311,443 | ||||
| Rexford Industrial Realty Inc. | 3,827,676 | 310,463 | ||||
| American Homes 4 Rent Class A | 6,743,931 | 294,103 | ||||
| CyrusOne Inc. | 3,203,040 | 287,377 | ||||
| Gaming & Leisure Properties Inc. | 5,716,006 | 278,141 | ||||
| Federal Realty Investment Trust | 1,963,231 | 267,628 | ||||
| Lamar Advertising Co. Class A | 2,190,098 | 265,659 | ||||
| EastGroup Properties Inc. | 1,027,412 | 234,096 | ||||
| Americold Realty Trust | 6,729,842 | 220,671 | ||||
| First Industrial Realty Trust Inc. | 3,294,537 | 218,098 | ||||
| Apartment Income REIT Corp. | 3,959,584 | 216,470 | ||||
| STORE Capital Corp. | 6,194,820 | 213,102 | ||||
| National Retail Properties Inc. | 4,432,547 | 213,073 | ||||
| STAG Industrial Inc. | 4,420,100 | 211,988 | ||||
| American Campus Communities Inc. | 3,509,371 | 201,052 | ||||
| Kilroy Realty Corp. | 2,938,910 | 195,320 | ||||
| Vornado Realty Trust | 4,591,359 | 192,194 | ||||
| Brixmor Property Group Inc. | 7,487,714 | 190,263 | ||||
| Healthcare Trust of America Inc. Class A | 5,574,895 | 186,146 | ||||
| Omega Healthcare Investors Inc. | 6,029,804 | 178,422 | ||||
| Regency Centers Corp. | 2,162,467 | 162,942 | ||||
| Terreno Realty Corp. | 1,889,192 | 161,129 | ||||
| Innovative Industrial Properties Inc. | 603,727 | 158,726 | ||||
| * | Host Hotels & Resorts Inc. | 9,006,615 | 156,625 | |||
| Cousins Properties Inc. | 3,752,884 | 151,166 | ||||
| Spirit Realty Capital Inc. | 3,112,404 | 149,987 | ||||
| Rayonier Inc. | 3,610,692 | 145,727 | ||||
| Douglas Emmett Inc. | 4,202,822 | 140,795 | ||||
| National Storage Affiliates Trust | 2,023,070 | 139,996 | ||||
| Agree Realty Corp. | 1,761,485 | 125,700 | ||||
| * | Ryman Hospitality Properties Inc. | 1,317,463 | 121,154 | |||
| SL Green Realty Corp. | 1,681,497 | 120,563 | ||||
| Kite Realty Group Trust | 5,517,084 | 120,162 | ||||
| Shares | Market Value• ($000) | |||||
| Healthcare Realty Trust Inc. | 3,720,327 | 117,711 | ||||
| Highwoods Properties Inc. | 2,630,619 | 117,299 | ||||
| Hannon Armstrong Sustainable Infrastructure Capital Inc. | 2,134,575 | 113,389 | ||||
| LXP Industrial Trust | 7,142,974 | 111,573 | ||||
| * | DigitalBridge Group Inc. | 12,943,558 | 107,820 | |||
| * | Park Hotels & Resorts Inc. | 5,658,505 | 106,833 | |||
| * | Howard Hughes Corp. | 1,042,111 | 106,066 | |||
| Physicians Realty Trust | 5,559,335 | 104,682 | ||||
| Outfront Media Inc. | 3,667,011 | 98,349 | ||||
| * | Redfin Corp. | 2,524,187 | 96,904 | |||
| PotlatchDeltic Corp. | 1,607,219 | 96,787 | ||||
| PS Business Parks Inc. | 520,900 | 95,934 | ||||
| Broadstone Net Lease Inc. | 3,861,872 | 95,852 | ||||
| Hudson Pacific Properties Inc. | 3,841,115 | 94,914 | ||||
| EPR Properties | 1,884,203 | 89,481 | ||||
| JBG SMITH Properties | 3,099,751 | 88,994 | ||||
| Essential Properties Realty Trust Inc. | 3,062,704 | 88,298 | ||||
| Apple Hospitality REIT Inc. | 5,454,598 | 88,092 | ||||
| Macerich Co. | 5,097,298 | 88,081 | ||||
| Uniti Group Inc. | 5,949,337 | 83,350 | ||||
| * | Cushman & Wakefield plc | 3,659,129 | 81,379 | |||
| Newmark Group Inc. Class A | 4,336,532 | 81,093 | ||||
| Corporate Office Properties Trust | 2,822,956 | 78,958 | ||||
| Sabra Health Care REIT Inc. | 5,792,999 | 78,437 | ||||
| * | Equity Commonwealth | 2,894,429 | 74,966 | |||
| Pebblebrook Hotel Trust | 3,308,592 | 74,013 | ||||
| SITE Centers Corp. | 4,509,063 | 71,378 | ||||
| Kennedy-Wilson Holdings Inc. | 2,981,493 | 71,198 | ||||
| * | Sunstone Hotel Investors Inc. | 5,518,938 | 64,737 | |||
| National Health Investors Inc. | 1,093,825 | 62,862 | ||||
| RLJ Lodging Trust | 4,173,248 | 58,133 | ||||
| Brandywine Realty Trust | 4,297,231 | 57,669 | ||||
| Piedmont Office Realty Trust Inc. Class A | 3,113,860 | 57,233 | ||||
| Shares | Market Value• ($000) | |||||
| Retail Opportunity Investments Corp. | 2,893,515 | 56,713 | ||||
| eXp World Holdings Inc. | 1,671,999 | 56,330 | ||||
| *,1 | Compass Inc. Class A | 6,144,826 | 55,856 | |||
| CareTrust REIT Inc. | 2,438,934 | 55,681 | ||||
| Washington REIT | 2,127,161 | 54,987 | ||||
| Urban Edge Properties | 2,786,522 | 52,944 | ||||
| * | Xenia Hotels & Resorts Inc. | 2,865,591 | 51,896 | |||
| * | DiamondRock Hospitality Co. | 5,288,793 | 50,825 | |||
| * | Realogy Holdings Corp. | 2,933,159 | 49,306 | |||
| Acadia Realty Trust | 2,215,192 | 48,358 | ||||
| 1 | Tanger Factory Outlet Centers Inc. | 2,482,427 | 47,861 | |||
| American Assets Trust Inc. | 1,212,543 | 45,507 | ||||
| 1 | InvenTrust Properties Corp. | 1,610,282 | 43,896 | |||
| Alexander & Baldwin Inc. | 1,723,974 | 43,254 | ||||
| St. Joe Co. | 812,721 | 42,302 | ||||
| Industrial Logistics Properties Trust | 1,643,461 | 41,169 | ||||
| Safehold Inc. | 507,216 | 40,501 | ||||
| Centerspace | 361,836 | 40,128 | ||||
| Global Net Lease Inc. | 2,611,848 | 39,909 | ||||
| Paramount Group Inc. | 4,649,652 | 38,778 | ||||
| Empire State Realty Trust Inc. Class A | 4,330,007 | 38,537 | ||||
| Service Properties Trust | 4,137,863 | 36,372 | ||||
| * | Veris Residential Inc. | 1,941,822 | 35,691 | |||
| LTC Properties Inc. | 1,011,256 | 34,524 | ||||
| * | Marcus & Millichap Inc. | 660,856 | 34,008 | |||
| Getty Realty Corp. | 979,196 | 31,422 | ||||
| Office Properties Income Trust | 1,246,913 | 30,973 | ||||
| American Finance Trust Inc. Class A | 3,088,610 | 28,199 | ||||
| * | Apartment Investment & Management Co. Class A | 3,616,537 | 27,920 | |||
| RPT Realty | 2,083,324 | 27,875 | ||||
| GEO Group Inc. | 2,995,771 | 23,217 | ||||
| * | Douglas Elliman Inc. | 1,659,645 | 19,086 | |||
| Universal Health Realty Income Trust | 318,978 | 18,970 | ||||
| Diversified Healthcare Trust | 6,115,512 | 18,897 | ||||
| Saul Centers Inc. | 333,703 | 17,693 | ||||
| Franklin Street Properties Corp. | 2,371,078 | 14,108 | ||||
| Shares | Market Value• ($000) | |||||
| 1 | Phillips Edison & Co. Inc. | 420,199 | 13,883 | |||
| RMR Group Inc. Class A | 395,822 | 13,727 | ||||
| Alexander's Inc. | 52,304 | 13,615 | ||||
| * | Summit Hotel Properties Inc. | 1,296,915 | 12,658 | |||
| * | Bridge Investment Group Holdings Inc. Class A | 471,288 | 11,768 | |||
| * | Seritage Growth Properties Class A | 790,898 | 10,495 | |||
| * | Forestar Group Inc. | 446,757 | 9,717 | |||
| Urstadt Biddle Properties Inc. Class A | 412,800 | 8,793 | ||||
| *,1 | Offerpad Solutions Inc. | 1,118,166 | 7,156 | |||
| *,2 | Spirit MTA REIT | 529,410 | 142 | |||
| Urstadt Biddle Properties Inc. | 787 | 15 | ||||
| 13,181,817 | ||||||
| Technology (13.0%) | ||||||
| Entegris Inc. | 3,419,055 | 473,813 | ||||
| * | Nuance Communications Inc. | 8,071,596 | 446,521 | |||
| * | Ceridian HCM Holding Inc. | 3,436,386 | 358,965 | |||
| * | Wolfspeed Inc. | 2,931,481 | 327,652 | |||
| * | PTC Inc. | 2,676,256 | 324,228 | |||
| * | Dynatrace Inc. | 5,035,232 | 303,876 | |||
| * | Synaptics Inc. | 990,894 | 286,874 | |||
| * | Lattice Semiconductor Corp. | 3,454,831 | 266,229 | |||
| * | Avalara Inc. | 1,992,715 | 257,279 | |||
| * | Aspen Technology Inc. | 1,688,133 | 256,934 | |||
| * | Manhattan Associates Inc. | 1,596,448 | 248,232 | |||
| * | Guidewire Software Inc. | 2,101,568 | 238,591 | |||
| * | Arrow Electronics Inc. | 1,758,144 | 236,066 | |||
| * | Five9 Inc. | 1,716,204 | 235,669 | |||
| * | Smartsheet Inc. Class A | 3,018,100 | 233,752 | |||
| Jabil Inc. | 3,255,008 | 228,990 | ||||
| * | Elastic NV | 1,857,283 | 228,613 | |||
| * | Pure Storage Inc. Class A | 6,829,611 | 222,304 | |||
| * | Silicon Laboratories Inc. | 1,013,952 | 209,300 | |||
| * | DXC Technology Co. | 6,361,990 | 204,792 | |||
| Azenta Inc. | 1,875,387 | 193,371 | ||||
| Vertiv Holdings Co. Class A | 7,582,182 | 189,327 | ||||
| * | F5 Inc. | 772,327 | 188,996 | |||
| Concentrix Corp. | 1,056,044 | 188,631 | ||||
| * | II-VI Inc. | 2,677,459 | 182,951 | |||
| Shares | Market Value• ($000) | |||||
| * | Ambarella Inc. | 878,446 | 178,228 | |||
| Universal Display Corp. | 1,069,676 | 176,529 | ||||
| * | Nutanix Inc. Class A | 5,329,463 | 169,797 | |||
| KBR Inc. | 3,539,699 | 168,560 | ||||
| * | Anaplan Inc. | 3,502,487 | 160,589 | |||
| * | Rapid7 Inc. | 1,352,405 | 159,165 | |||
| * | Zendesk Inc. | 1,524,384 | 158,978 | |||
| * | CACI International Inc. Class A | 588,631 | 158,465 | |||
| Leidos Holdings Inc. | 1,770,574 | 157,404 | ||||
| Dolby Laboratories Inc. Class A | 1,642,164 | 156,367 | ||||
| * | Novanta Inc. | 852,501 | 150,321 | |||
| * | New Relic Inc. | 1,319,450 | 145,087 | |||
| * | Semtech Corp. | 1,623,420 | 144,371 | |||
| * | Asana Inc. Class A | 1,919,588 | 143,105 | |||
| * | Blackline Inc. | 1,330,434 | 137,753 | |||
| CMC Materials Inc. | 716,730 | 137,390 | ||||
| Power Integrations Inc. | 1,445,158 | 134,241 | ||||
| * | Digital Turbine Inc. | 2,193,286 | ��133,769 | |||
| * | NCR Corp. | 3,327,093 | 133,749 | |||
| * | Workiva Inc. Class A | 1,024,349 | 133,667 | |||
| * | Cirrus Logic Inc. | 1,440,757 | 132,578 | |||
| * | Varonis Systems Inc. | 2,704,869 | 131,943 | |||
| * | MaxLinear Inc. Class A | 1,741,350 | 131,280 | |||
| National Instruments Corp. | 2,993,651 | 130,733 | ||||
| * | SPS Commerce Inc. | 906,752 | 129,076 | |||
| * | Rogers Corp. | 472,697 | 129,046 | |||
| * | Ziff Davis Inc. | 1,154,337 | 127,970 | |||
| * | Tenable Holdings Inc. | 2,301,295 | 126,732 | |||
| * | Change Healthcare Inc. | 5,889,084 | 125,909 | |||
| * | Onto Innovation Inc. | 1,242,457 | 125,774 | |||
| TD SYNNEX Corp. | 1,090,096 | 124,663 | ||||
| CDK Global Inc. | 2,982,905 | 124,506 | ||||
| Science Applications International Corp. | 1,450,961 | 121,286 | ||||
| * | Qualys Inc. | 881,197 | 120,918 | |||
| * | Procore Technologies Inc. | 1,496,609 | 119,684 | |||
| * | Diodes Inc. | 1,077,966 | 118,371 | |||
| Pegasystems Inc. | 1,030,075 | 115,183 | ||||
| * | Sailpoint Technologies Holdings Inc. | 2,350,239 | 113,611 | |||
| * | Dun & Bradstreet Holdings Inc. | 5,434,131 | 111,345 | |||
| * | DigitalOcean Holdings Inc. | 1,376,636 | 110,585 | |||
| * | Fabrinet | 933,418 | 110,582 | |||
| * | Teradata Corp. | 2,600,027 | 110,423 | |||
| * | Q2 Holdings Inc. | 1,359,839 | 108,026 | |||
| * | Perficient Inc. | 831,422 | 107,495 | |||
| Shares | Market Value• ($000) | |||||
| * | SiTime Corp. | 362,938 | 106,174 | |||
| * | Envestnet Inc. | 1,308,912 | 103,849 | |||
| Avnet Inc. | 2,503,952 | 103,238 | ||||
| * | Mandiant Corp. | 5,743,648 | 100,744 | |||
| * | Upwork Inc. | 2,911,074 | 99,442 | |||
| * | MACOM Technology Solutions Holdings Inc. | 1,228,043 | 96,156 | |||
| * | Alarm.com Holdings Inc. | 1,133,619 | 96,142 | |||
| * | Blackbaud Inc. | 1,213,855 | 95,870 | |||
| * | Box Inc. Class A | 3,629,517 | 95,057 | |||
| * | Altair Engineering Inc. Class A | 1,216,975 | 94,096 | |||
| * | Insight Enterprises Inc. | 879,046 | 93,706 | |||
| * | Alteryx Inc. Class A | 1,503,347 | 90,952 | |||
| * | FormFactor Inc. | 1,969,698 | 90,055 | |||
| *,1 | Fastly Inc. Class A | 2,515,657 | 89,180 | |||
| Advanced Energy Industries Inc. | 949,037 | 86,419 | ||||
| *,1 | MicroStrategy Inc. Class A | 157,854 | 85,950 | |||
| Switch Inc. Class A | 2,901,112 | 83,088 | ||||
| * | Cargurus Inc. Class A | 2,433,088 | 81,849 | |||
| * | Kyndryl Holdings Inc. | 4,519,518 | 81,803 | |||
| * | Rambus Inc. | 2,756,424 | 81,011 | |||
| * | nCino Inc. | 1,463,503 | 80,288 | |||
| * | LiveRamp Holdings Inc. | 1,630,411 | 78,178 | |||
| * | Sprout Social Inc. Class A | 861,814 | 78,158 | |||
| * | Verint Systems Inc. | 1,487,509 | 78,109 | |||
| *,1 | E2open Parent Holdings Inc. | 6,800,661 | 76,575 | |||
| Xerox Holdings Corp. | 3,368,262 | 76,257 | ||||
| * | IPG Photonics Corp. | 437,351 | 75,286 | |||
| * | CommVault Systems Inc. | 1,089,809 | 75,110 | |||
| * | Cerence Inc. | 972,113 | 74,503 | |||
| Vishay Intertechnology Inc. | 3,344,978 | 73,155 | ||||
| * | Plexus Corp. | 704,405 | 67,545 | |||
| * | Momentive Global Inc. | 3,191,542 | 67,501 | |||
| Shutterstock Inc. | 597,776 | 66,281 | ||||
| * | 3D Systems Corp. | 3,062,014 | 65,956 | |||
| * | Everbridge Inc. | 970,563 | 65,348 | |||
| * | Appian Corp. | 999,911 | 65,204 | |||
| * | Sanmina Corp. | 1,540,490 | 63,869 | |||
| * | Yelp Inc. Class A | 1,741,139 | 63,099 | |||
| * | Jamf Holding Corp. | 1,650,365 | 62,730 | |||
| Amkor Technology Inc. | 2,463,857 | 61,079 | ||||
| * | Bottomline Technologies DE Inc. | 1,081,558 | 61,076 | |||
| * | Allegro MicroSystems Inc. | 1,672,160 | 60,499 | |||
| * | Vimeo Inc. | 3,338,283 | 59,956 | |||
| Shares | Market Value• ($000) | |||||
| * | PagerDuty Inc. | 1,723,089 | 59,877 | |||
| McAfee Corp. Class A | 2,305,192 | 59,451 | ||||
| * | NetScout Systems Inc. | 1,764,159 | 58,358 | |||
| * | LivePerson Inc. | 1,616,435 | 57,739 | |||
| *,1 | C3.ai Inc. Class A | 1,772,804 | 55,400 | |||
| * | Magnite Inc. | 3,158,984 | 55,282 | |||
| * | Duck Creek Technologies Inc. | 1,831,110 | 55,135 | |||
| * | Allscripts Healthcare Solutions Inc. | 2,965,048 | 54,705 | |||
| * | Zuora Inc. Class A | 2,907,418 | 54,311 | |||
| Progress Software Corp. | 1,104,607 | 53,319 | ||||
| * | Appfolio Inc. Class A | 439,368 | 53,190 | |||
| * | Covetrus Inc. | 2,602,382 | 51,970 | |||
| Xperi Holding Corp. | 2,629,747 | 49,729 | ||||
| * | Super Micro Computer Inc. | 1,091,635 | 47,977 | |||
| * | BigCommerce Holdings Inc. | 1,351,286 | 47,795 | |||
| * | SentinelOne Inc. Class A | 946,141 | 47,771 | |||
| * | Amplitude Inc. Class A | 890,378 | 47,137 | |||
| *,1 | Confluent Inc. Class A | 612,285 | 46,681 | |||
| * | DoubleVerify Holdings Inc. | 1,396,917 | 46,489 | |||
| * | Schrodinger Inc. | 1,319,049 | 45,942 | |||
| CSG Systems International Inc. | 781,920 | 45,054 | ||||
| Methode Electronics Inc. | 912,957 | 44,890 | ||||
| * | Ping Identity Holding Corp. | 1,891,638 | 43,281 | |||
| * | Avaya Holdings Corp. | 2,005,988 | 39,719 | |||
| * | TTM Technologies Inc. | 2,499,772 | 37,247 | |||
| * | Veeco Instruments Inc. | 1,294,742 | 36,861 | |||
| * | JFrog Ltd. | 1,235,422 | 36,692 | |||
| * | Bumble Inc. Class A | 1,058,767 | 35,850 | |||
| * | PROS Holdings Inc. | 999,368 | 34,468 | |||
| * | Eventbrite Inc. Class A | 1,946,289 | 33,943 | |||
| * | Bandwidth Inc. Class A | 465,558 | 33,408 | |||
| * | Unisys Corp. | 1,598,879 | 32,889 | |||
| * | Informatica Inc. Class A | 867,028 | 32,063 | |||
| * | Sumo Logic Inc. | 2,354,434 | 31,926 | |||
| * | Vroom Inc. | 2,754,397 | 29,720 | |||
| * | Yext Inc. | 2,930,365 | 29,069 | |||
| * | Olo Inc. Class A | 1,361,503 | 28,333 | |||
| * | Paycor HCM Inc. | 899,899 | 25,926 | |||
| * | Parsons Corp. | 767,479 | 25,826 | |||
| *,1 | Skillz Inc. Class A | 3,413,563 | 25,397 | |||
| * | nLight Inc. | 1,057,607 | 25,330 | |||
| * | CEVA Inc. | 560,626 | 24,241 | |||
| Shares | Market Value• ($000) | |||||
| * | Consensus Cloud Solutions Inc. | 399,777 | 23,135 | |||
| * | ScanSource Inc. | 655,120 | 22,982 | |||
| * | KnowBe4 Inc. Class A | 985,168 | 22,600 | |||
| Benchmark Electronics Inc. | 832,078 | 22,549 | ||||
| * | PubMatic Inc. Class A | 657,660 | 22,393 | |||
| *,1 | Aeva Technologies Inc. | 2,954,199 | 22,334 | |||
| *,1 | Thoughtworks Holding Inc. | 767,458 | 20,576 | |||
| *,1 | Squarespace Inc. Class A | 694,134 | 20,477 | |||
| *,1 | Samsara Inc. Class A | 704,477 | 19,803 | |||
| *,1 | Freshworks Inc. Class A | 736,861 | 19,350 | |||
| Ebix Inc. | 634,772 | 19,297 | ||||
| * | Telos Corp. | 1,200,068 | 18,505 | |||
| * | N-able Inc. | 1,606,131 | 17,828 | |||
| * | Alkami Technology Inc. | 883,586 | 17,725 | |||
| * | ON24 Inc. | 955,974 | 16,586 | |||
| *,1 | Ouster Inc. | 3,126,291 | 16,257 | |||
| *,1 | Datto Holding Corp. | 614,649 | 16,196 | |||
| * | Braze Inc. Class A | 205,170 | 15,831 | |||
| *,1 | Groupon Inc. | 645,158 | 14,942 | |||
| 1 | Vivid Seats Inc. Class A | 1,350,528 | 14,694 | |||
| SolarWinds Corp. | 1,014,427 | 14,395 | ||||
| * | SEMrush Holdings Inc. Class A | 634,194 | 13,223 | |||
| *,1 | IonQ Inc. | 723,983 | 12,091 | |||
| * | Vertex Inc. Class A | 750,076 | 11,904 | |||
| *,1 | Clear Secure Inc. Class A | 371,363 | 11,650 | |||
| * | Expensify Inc. Class A | 259,014 | 11,397 | |||
| *,1 | Rackspace Technology Inc. | 804,017 | 10,830 | |||
| * | Enfusion Inc. Class A | 492,575 | 10,315 | |||
| *,1 | Matterport Inc. | 456,369 | 9,419 | |||
| * | Diebold Nixdorf Inc. | 955,814 | 8,650 | |||
| * | MediaAlpha Inc. Class A | 554,792 | 8,566 | |||
| * | CCC Intelligent Solutions Holdings Inc. | 747,272 | 8,511 | |||
| *,1 | Xometry Inc. Class A | 156,232 | 8,007 | |||
| * | Nextdoor Holdings Inc. | 1,003,534 | 7,918 | |||
| *,1 | ForgeRock Inc. Class A | 282,576 | 7,542 | |||
| *,1 | SmartRent Inc. Class A | 725,741 | 7,025 | |||
| * | Sprinklr Inc. Class A | 429,238 | 6,812 | |||
| * | MeridianLink Inc. | 309,661 | 6,682 | |||
| * | Intapp Inc. | 231,651 | 5,828 | |||
| *,1 | Couchbase Inc. | 212,237 | 5,297 | |||
| *,1 | Zeta Global Holdings Corp. Class A | 592,783 | 4,991 | |||
| Shares | Market Value• ($000) | |||||
| * | WM Technology Inc. | 803,148 | 4,803 | |||
| * | AvePoint Inc. | 664,099 | 4,177 | |||
| * | SecureWorks Corp. Class A | 260,031 | 4,153 | |||
| *,1 | BuzzFeed Inc. | 660,912 | 3,523 | |||
| * | Viant Technology Inc. Class A | 315,936 | 3,066 | |||
| * | NerdWallet Inc. Class A | 169,794 | 2,640 | |||
| * | EngageSmart Inc. | 21,874 | 528 | |||
| * | ON Semiconductor Corp. | 6,320 | 429 | |||
| * | UserTesting Inc. | 27,603 | 232 | |||
| * | EverCommerce Inc. | 8,305 | 131 | |||
| *,2 | Media General Inc. CVR | 2,474,410 | 96 | |||
| 18,307,035 | ||||||
| Telecommunications (1.6%) | ||||||
| * | Ciena Corp. | 3,908,312 | 300,823 | |||
| Cable One Inc. | 144,815 | 255,374 | ||||
| * | Lumentum Holdings Inc. | 1,732,198 | 183,215 | |||
| * | Frontier Communications Parent Inc. | 6,163,387 | 181,758 | |||
| Juniper Networks Inc. | 4,101,759 | 146,474 | ||||
| * | Vonage Holdings Corp. | 6,049,932 | 125,778 | |||
| * | Iridium Communications Inc. | 2,997,096 | 123,750 | |||
| * | Viavi Solutions Inc. | 5,983,954 | 105,437 | |||
| Cogent Communications Holdings Inc. | 1,078,937 | 78,957 | ||||
| * | Viasat Inc. | 1,758,034 | 78,303 | |||
| * | CommScope Holding Co. Inc. | 5,144,457 | 56,795 | |||
| InterDigital Inc. | 770,474 | 55,189 | ||||
| * | Calix Inc. | 682,771 | 54,601 | |||
| Telephone & Data Systems Inc. | 2,562,139 | 51,627 | ||||
| *,1 | fuboTV Inc. | 3,102,245 | 48,147 | |||
| * | 8x8 Inc. | 2,742,227 | 45,960 | |||
| * | Infinera Corp. | 4,565,612 | 43,784 | |||
| * | Altice USA Inc. Class A | 2,702,950 | 43,734 | |||
| * | Plantronics Inc. | 1,030,541 | 30,236 | |||
| Shenandoah Telecommunications Co. | 1,184,403 | 30,202 | ||||
| * | WideOpenWest Inc. | 1,343,949 | 28,922 | |||
| ADTRAN Inc. | 1,250,513 | 28,549 | ||||
| *,1 | Globalstar Inc. | 23,045,037 | 26,732 | |||
| * | EchoStar Corp. Class A | 928,239 | 24,459 | |||
| * | NETGEAR Inc. | 692,859 | 20,238 | |||
| Shares | Market Value• ($000) | |||||
| * | United States Cellular Corp. | 417,749 | 13,167 | |||
| ATN International Inc. | 266,050 | 10,629 | ||||
| *,1 | Gogo Inc. | 635,461 | 8,598 | |||
| 2,201,438 | ||||||
| Utilities (3.1%) | ||||||
| Atmos Energy Corp. | 3,345,045 | 350,460 | ||||
| Essential Utilities Inc. | 5,748,580 | 308,641 | ||||
| NRG Energy Inc. | 6,178,382 | 266,165 | ||||
| UGI Corp. | 5,286,735 | 242,714 | ||||
| Pinnacle West Capital Corp. | 2,847,013 | 200,971 | ||||
| OGE Energy Corp. | 5,057,055 | 194,090 | ||||
| * | Sunrun Inc. | 4,959,725 | 170,119 | |||
| National Fuel Gas Co. | 2,302,282 | 147,208 | ||||
| IDACORP Inc. | 1,274,155 | 144,374 | ||||
| * | Evoqua Water Technologies Corp. | 3,041,388 | 142,185 | |||
| * | Stericycle Inc. | 2,315,353 | 138,088 | |||
| * | Clean Harbors Inc. | 1,234,773 | 123,193 | |||
| Portland General Electric Co. | 2,253,182 | 119,238 | ||||
| Black Hills Corp. | 1,608,772 | 113,531 | ||||
| Hawaiian Electric Industries Inc. | 2,618,268 | 108,658 | ||||
| * | Casella Waste Systems Inc. Class A | 1,269,633 | 108,452 | |||
| ONE Gas Inc. | 1,349,961 | 104,743 | ||||
| New Jersey Resources Corp. | 2,416,240 | 99,211 | ||||
| Southwest Gas Holdings Inc. | 1,414,554 | 99,089 | ||||
| PNM Resources Inc. | 2,170,342 | 98,989 | ||||
| American States Water Co. | 931,458 | 96,350 | ||||
| California Water Service Group | 1,325,977 | 95,285 | ||||
| Ormat Technologies Inc. | 1,128,890 | 89,521 | ||||
| ALLETE Inc. | 1,323,735 | 87,830 | ||||
| Spire Inc. | 1,237,179 | 80,689 | ||||
| NorthWestern Corp. | 1,361,849 | 77,843 | ||||
| Avista Corp. | 1,793,093 | 76,189 | ||||
| MGE Energy Inc. | 909,656 | 74,819 | ||||
| South Jersey Industries Inc. | 2,832,575 | 73,987 | ||||
| Clearway Energy Inc. Class C | 2,053,274 | 73,979 | ||||
| * | Sunnova Energy International Inc. | 2,263,488 | 63,197 | |||
| Northwest Natural Holding Co. | 768,528 | 37,489 | ||||
| * | Harsco Corp. | 1,987,373 | 33,209 | |||
| Shares | Market Value• ($000) | |||||
| Clearway Energy Inc. Class A | 885,843 | 29,658 | ||||
| * | Archaea Energy Inc. | 604,535 | 11,051 | |||
| 4,281,215 | ||||||
| Total Common Stocks (Cost $95,237,674) | 139,631,720 | |||||
| Temporary Cash Investments (1.5%) | ||||||
| Money Market Fund (1.5%) | ||||||
| 3,4 | Vanguard Market Liquidity Fund, 0.090% (Cost $2,098,079) | 20,985,587 | 2,098,349 | |||
| Total Investments (100.8%) (Cost $97,335,753) | 141,730,069 | |||||
| Other Assets and Liabilities—Net (-0.8%) | (1,179,658) | |||||
| Net Assets (100%) | 140,550,411 | |||||
| Cost is in $000. | |
| • | See Note A in Notes to Financial Statements. |
| * | Non-income-producing security. |
| 1 | Includes partial security positions on loan to broker-dealers. The total value of securities on loan is $1,270,062,000. |
| 2 | Security value determined using significant unobservable inputs. |
| 3 | Affiliated money market fund available only to Vanguard funds and certain trusts and accounts managed by Vanguard. Rate shown is the 7-day yield. |
| 4 | Collateral of $1,372,627,000 was received for securities on loan, of which $1,343,983,000 is held in Vanguard Market Liquidity Fund and $28,644,000 is held in cash. |
| CVR—Contingent Value Rights. | |
| REIT—Real Estate Investment Trust. |
| Futures Contracts | ||||
| ($000) | ||||
| Expiration | Number of Long (Short) Contracts | Notional Amount | Value and Unrealized Appreciation (Depreciation) | |
| Long Futures Contracts | ||||
| E-mini Russell 2000 Index | March 2022 | 2,506 | 281,023 | 3,347 |
| E-mini S&P Mid-Cap 400 Index | March 2022 | 1,824 | 517,596 | 12,129 |
| 15,476 | ||||
| Over-the-Counter Total Return Swaps | ||||||
| Reference Entity | Termination Date | Counterparty | Notional Amount ($000) | Floating Interest Rate Received (Paid) (%) | Value and Unrealized Appreciation ($000) | Value and Unrealized (Depreciation) ($000) |
| Avalara Inc. | 8/31/22 | BOANA | 12,571 | (0.071)1 | — | (952) |
| Bandwidth Inc. Class A | 8/31/22 | BOANA | 6,306 | (0.000)1 | 6 | — |
| New York Community Bancorp Inc. | 8/31/22 | BOANA | 4,193 | (0.623)1 | 79 | — |
| Ollie's Bargain Outlet Holdings Inc. | 1/31/22 | GSI | 14,754 | (0.109)2 | 603 | — |
| Popular Inc. | 8/31/22 | BOANA | 10,895 | (0.474)1 | 643 | — |
| Signature Bank | 8/31/23 | BOANA | 76,065 | (0.836)1 | 4,783 | — |
| United Therapeutics Corp. | 8/31/22 | BOANA | 22,740 | (0.072)1 | 3,188 | — |
| 9,302 | (952) | |||||
| 1 | Based on USD Overnight Bank Funding Rate as of the most recent payment date. Floating interest payment received/paid monthly. |
| 2 | Based on 1M USD London Interbank Offered Rate (LIBOR) as of the most recent payment date. Floating interest payment received/paid monthly. |
| 1M—1-month. | |
| BOANA—Bank of America, N.A. | |
| GSI—Goldman Sachs International. |
| ($000s, except shares and per-share amounts) | Amount |
| Assets | |
| Investments in Securities, at Value | |
| Unaffiliated Issuers (Cost $95,237,674) | 139,631,720 |
| Affiliated Issuers (Cost $2,098,079) | 2,098,349 |
| Total Investments in Securities | 141,730,069 |
| Investment in Vanguard | 4,476 |
| Cash | 10,429 |
| Cash Collateral Pledged—Futures Contracts | 39,669 |
| Receivables for Investment Securities Sold | 302,979 |
| Receivables for Accrued Income | 126,302 |
| Receivables for Capital Shares Issued | 247,409 |
| Unrealized Appreciation—Over-the-Counter Swap Contracts | 9,302 |
| Total Assets | 142,470,635 |
| Liabilities | |
| Payables for Investment Securities Purchased | 214,255 |
| Collateral for Securities on Loan | 1,372,627 |
| Payables for Capital Shares Redeemed | 329,208 |
| Payables to Vanguard | 2,869 |
| Variation Margin Payable—Futures Contracts | 313 |
| Unrealized Depreciation—Over-the-Counter Swap Contracts | 952 |
| Total Liabilities | 1,920,224 |
| Net Assets | 140,550,411 |
| Statement of Assets and Liabilities (continued) | |
| At December 31, 2021, net assets consisted of: | |
| ($000s, except shares and per-share amounts) | Amount |
| Paid-in Capital | 101,627,703 |
| Total Distributable Earnings (Loss) | 38,922,708 |
| Net Assets | 140,550,411 |
| Investor Shares—Net Assets | |
| Applicable to 5,711,702 outstanding $.001 par value shares of beneficial interest (unlimited authorization) | 618,849 |
| Net Asset Value Per Share—Investor Shares | $108.35 |
| ETF Shares—Net Assets | |
| Applicable to 221,917,515 outstanding $.001 par value shares of beneficial interest (unlimited authorization) | 50,187,261 |
| Net Asset Value Per Share—ETF Shares | $226.15 |
| Admiral Shares—Net Assets | |
| Applicable to 509,983,289 outstanding $.001 par value shares of beneficial interest (unlimited authorization) | 55,265,634 |
| Net Asset Value Per Share—Admiral Shares | $108.37 |
| Institutional Shares—Net Assets | |
| Applicable to 201,548,211 outstanding $.001 par value shares of beneficial interest (unlimited authorization) | 21,840,526 |
| Net Asset Value Per Share—Institutional Shares | $108.36 |
| Institutional Plus Shares—Net Assets | |
| Applicable to 40,406,127 outstanding $.001 par value shares of beneficial interest (unlimited authorization) | 12,638,141 |
| Net Asset Value Per Share—Institutional Plus Shares | $312.78 |
| Year Ended December 31, 2021 | |
| ($000) | |
| Investment Income | |
| Income | |
| Dividends1 | 1,736,992 |
| Interest2 | 615 |
| Securities Lending—Net | 44,823 |
| Total Income | 1,782,430 |
| Expenses | |
| The Vanguard Group—Note B | |
| Investment Advisory Services | 4,133 |
| Management and Administrative—Investor Shares | 1,167 |
| Management and Administrative—ETF Shares | 18,074 |
| Management and Administrative—Admiral Shares | 22,420 |
| Management and Administrative—Institutional Shares | 6,953 |
| Management and Administrative—Institutional Plus Shares | 2,827 |
| Marketing and Distribution—Investor Shares | 42 |
| Marketing and Distribution—ETF Shares | 2,052 |
| Marketing and Distribution—Admiral Shares | 1,905 |
| Marketing and Distribution—Institutional Shares | 630 |
| Marketing and Distribution—Institutional Plus Shares | 181 |
| Custodian Fees | 788 |
| Auditing Fees | 39 |
| Shareholders’ Reports—Investor Shares | 2 |
| Shareholders’ Reports—ETF Shares | 1,233 |
| Shareholders’ Reports—Admiral Shares | 693 |
| Shareholders’ Reports—Institutional Shares | 277 |
| Shareholders’ Reports—Institutional Plus Shares | 78 |
| Trustees’ Fees and Expenses | 42 |
| Total Expenses | 63,536 |
| Net Investment Income | 1,718,894 |
| Realized Net Gain (Loss) | |
| Investment Securities Sold2,3 | 10,390,008 |
| Futures Contracts | 128,976 |
| Swap Contracts | (23,405) |
| Realized Net Gain (Loss) | 10,495,579 |
| Statement of Operations (continued) | |
| Year Ended December 31, 2021 | |
| ($000) | |
| Change in Unrealized Appreciation (Depreciation) | |
| Investment Securities2 | 8,203,160 |
| Futures Contracts | 1,778 |
| Swap Contracts | 943 |
| Change in Unrealized Appreciation (Depreciation) | 8,205,881 |
| Net Increase (Decrease) in Net Assets Resulting from Operations | 20,420,354 |
| 1 | Dividends are net of foreign withholding taxes of $19,000. |
| 2 | Interest income, realized net gain (loss), capital gain distributions received, and change in unrealized appreciation (depreciation) from an affiliated company of the fund were $615,000, ($99,000), $21,000, and ($140,000), respectively. Purchases and sales are for temporary cash investment purposes. |
| 3 | Includes $8,887,919,000 of net gain (loss) resulting from in-kind redemptions. |
| Year Ended December 31, | ||
| 2021 ($000) | 2020 ($000) | |
| Increase (Decrease) in Net Assets | ||
| Operations | ||
| Net Investment Income | 1,718,894 | 1,296,033 |
| Realized Net Gain (Loss) | 10,495,579 | 3,870,929 |
| Change in Unrealized Appreciation (Depreciation) | 8,205,881 | 13,074,363 |
| Net Increase (Decrease) in Net Assets Resulting from Operations | 20,420,354 | 18,241,325 |
| Distributions | ||
| Investor Shares | (8,073) | (8,214) |
| ETF Shares | (596,413) | (413,915) |
| Admiral Shares | (684,429) | (548,152) |
| Institutional Shares | (275,247) | (223,749) |
| Institutional Plus Shares | (153,202) | (122,453) |
| Total Distributions | (1,717,364) | (1,316,483) |
| Capital Share Transactions | ||
| Investor Shares | (201,756) | (147,445) |
| ETF Shares | 6,570,091 | 4,228,769 |
| Admiral Shares | 234,027 | (1,839,081) |
| Institutional Shares | (197,115) | (1,146,922) |
| Institutional Plus Shares | 799,184 | (141,850) |
| Net Increase (Decrease) from Capital Share Transactions | 7,204,431 | 953,471 |
| Total Increase (Decrease) | 25,907,421 | 17,878,313 |
| Net Assets | ||
| Beginning of Period | 114,642,990 | 96,764,677 |
| End of Period | 140,550,411 | 114,642,990 |
| Investor Shares | |||||
| For a Share Outstanding Throughout Each Period | Year Ended December 31, | ||||
| 2021 | 2020 | 2019 | 2018 | 2017 | |
| Net Asset Value, Beginning of Period | $93.20 | $79.35 | $63.21 | $70.76 | $61.75 |
| Investment Operations | |||||
| Net Investment Income1 | 1.230 | .928 | .832 | .967 | .876 |
| Net Realized and Unrealized Gain (Loss) on Investments | 15.130 | 13.897 | 16.319 | (7.552) | 9.011 |
| Total from Investment Operations | 16.360 | 14.825 | 17.151 | (6.585) | 9.887 |
| Distributions | |||||
| Dividends from Net Investment Income | (1.210) | (.975) | (1.011) | (.965) | (.877) |
| Distributions from Realized Capital Gains | — | — | — | — | — |
| Total Distributions | (1.210) | (.975) | (1.011) | (.965) | (.877) |
| Net Asset Value, End of Period | $108.35 | $93.20 | $79.35 | $63.21 | $70.76 |
| Total Return2 | 17.59% | 18.96% | 27.22% | -9.43% | 16.10% |
| Ratios/Supplemental Data | |||||
| Net Assets, End of Period (Millions) | $619 | $709 | $754 | $3,332 | $4,345 |
| Ratio of Total Expenses to Average Net Assets | 0.17% | 0.17% | 0.17% | 0.17% | 0.17% |
| Ratio of Net Investment Income to Average Net Assets | 1.17% | 1.26% | 1.14% | 1.34% | 1.36% |
| Portfolio Turnover Rate3 | 17% | 22% | 16% | 15% | 15% |
| 1 | Calculated based on average shares outstanding. |
| 2 | Total returns do not include account service fees that may have applied in the periods shown. Fund prospectuses provide information about any applicable account service fees. |
| 3 | Excludes the value of portfolio securities received or delivered as a result of in-kind purchases or redemptions of the fund’s capital shares, including ETF Creation Units. |
| ETF Shares | |||||
| For a Share Outstanding Throughout Each Period | Year Ended December 31, | ||||
| 2021 | 2020 | 2019 | 2018 | 2017 | |
| Net Asset Value, Beginning of Period | $194.54 | $165.64 | $131.94 | $147.71 | $128.90 |
| Investment Operations | |||||
| Net Investment Income1 | 2.769 | 2.262 | 2.298 | 2.239 | 2.037 |
| Net Realized and Unrealized Gain (Loss) on Investments | 31.637 | 28.863 | 33.707 | (15.808) | 18.768 |
| Total from Investment Operations | 34.406 | 31.125 | 36.005 | (13.569) | 20.805 |
| Distributions | |||||
| Dividends from Net Investment Income | (2.796) | (2.225) | (2.305) | (2.201) | (1.995) |
| Distributions from Realized Capital Gains | — | — | — | — | — |
| Total Distributions | (2.796) | (2.225) | (2.305) | (2.201) | (1.995) |
| Net Asset Value, End of Period | $226.15 | $194.54 | $165.64 | $131.94 | $147.71 |
| Total Return | 17.72% | 19.08% | 27.37% | -9.30% | 16.24% |
| Ratios/Supplemental Data | |||||
| Net Assets, End of Period (Millions) | $50,187 | $37,492 | $27,442 | $20,914 | $21,605 |
| Ratio of Total Expenses to Average Net Assets | 0.05% | 0.05% | 0.05% | 0.05% | 0.05% |
| Ratio of Net Investment Income to Average Net Assets | 1.25% | 1.47% | 1.49% | 1.46% | 1.48% |
| Portfolio Turnover Rate2 | 17% | 22% | 16% | 15% | 15% |
| 1 | Calculated based on average shares outstanding. |
| 2 | Excludes the value of portfolio securities received or delivered as a result of in-kind purchases or redemptions of the fund’s capital shares, including ETF Creation Units. |
| Admiral Shares | |||||
| For a Share Outstanding Throughout Each Period | Year Ended December 31, | ||||
| 2021 | 2020 | 2019 | 2018 | 2017 | |
| Net Asset Value, Beginning of Period | $93.22 | $79.37 | $63.23 | $70.78 | $61.77 |
| Investment Operations | |||||
| Net Investment Income1 | 1.358 | 1.029 | 1.108 | 1.067 | .970 |
| Net Realized and Unrealized Gain (Loss) on Investments | 15.131 | 13.887 | 16.136 | (7.563) | 8.997 |
| Total from Investment Operations | 16.489 | 14.916 | 17.244 | (6.496) | 9.967 |
| Distributions | |||||
| Dividends from Net Investment Income | (1.339) | (1.066) | (1.104) | (1.054) | (.957) |
| Distributions from Realized Capital Gains | — | — | — | — | — |
| Total Distributions | (1.339) | (1.066) | (1.104) | (1.054) | (.957) |
| Net Asset Value, End of Period | $108.37 | $93.22 | $79.37 | $63.23 | $70.78 |
| Total Return2 | 17.73% | 19.11% | 27.37% | -9.31% | 16.24% |
| Ratios/Supplemental Data | |||||
| Net Assets, End of Period (Millions) | $55,266 | $47,313 | $42,386 | $31,382 | $33,801 |
| Ratio of Total Expenses to Average Net Assets | 0.05% | 0.05% | 0.05% | 0.05% | 0.05% |
| Ratio of Net Investment Income to Average Net Assets | 1.29% | 1.40% | 1.50% | 1.46% | 1.48% |
| Portfolio Turnover Rate3 | 17% | 22% | 16% | 15% | 15% |
| 1 | Calculated based on average shares outstanding. |
| 2 | Total returns do not include account service fees that may have applied in the periods shown. Fund prospectuses provide information about any applicable account service fees. |
| 3 | Excludes the value of portfolio securities received or delivered as a result of in-kind purchases or redemptions of the fund’s capital shares, including ETF Creation Units. |
| Institutional Shares | |||||
| For a Share Outstanding Throughout Each Period | Year Ended December 31, | ||||
| 2021 | 2020 | 2019 | 2018 | 2017 | |
| Net Asset Value, Beginning of Period | $93.22 | $79.37 | $63.22 | $70.78 | $61.77 |
| Investment Operations | |||||
| Net Investment Income1 | 1.367 | 1.034 | 1.101 | 1.076 | .975 |
| Net Realized and Unrealized Gain (Loss) on Investments | 15.123 | 13.889 | 16.161 | (7.575) | 8.998 |
| Total from Investment Operations | 16.490 | 14.923 | 17.262 | (6.499) | 9.973 |
| Distributions | |||||
| Dividends from Net Investment Income | (1.350) | (1.073) | (1.112) | (1.061) | (.963) |
| Distributions from Realized Capital Gains | — | — | — | — | — |
| Total Distributions | (1.350) | (1.073) | (1.112) | (1.061) | (.963) |
| Net Asset Value, End of Period | $108.36 | $93.22 | $79.37 | $63.22 | $70.78 |
| Total Return | 17.73% | 19.12% | 27.40% | -9.32% | 16.25% |
| Ratios/Supplemental Data | |||||
| Net Assets, End of Period (Millions) | $21,841 | $18,957 | $17,337 | $14,454 | $15,352 |
| Ratio of Total Expenses to Average Net Assets | 0.04% | 0.04% | 0.04% | 0.04% | 0.04% |
| Ratio of Net Investment Income to Average Net Assets | 1.29% | 1.41% | 1.49% | 1.47% | 1.49% |
| Portfolio Turnover Rate2 | 17% | 22% | 16% | 15% | 15% |
| 1 | Calculated based on average shares outstanding. |
| 2 | Excludes the value of portfolio securities received or delivered as a result of in-kind purchases or redemptions of the fund’s capital shares, including ETF Creation Units. |
| Institutional Plus Shares | |||||
| For a Share Outstanding Throughout Each Period | Year Ended December 31, | ||||
| 2021 | 2020 | 2019 | 2018 | 2017 | |
| Net Asset Value, Beginning of Period | $269.07 | $229.09 | $182.49 | $204.30 | $178.28 |
| Investment Operations | |||||
| Net Investment Income1 | 4.029 | 2.988 | 3.186 | 3.102 | 2.835 |
| Net Realized and Unrealized Gain (Loss) on Investments | 43.607 | 40.111 | 46.645 | (21.825) | 25.980 |
| Total from Investment Operations | 47.636 | 43.099 | 49.831 | (18.723) | 28.815 |
| Distributions | |||||
| Dividends from Net Investment Income | (3.926) | (3.119) | (3.231) | (3.087) | (2.795) |
| Distributions from Realized Capital Gains | — | — | — | — | — |
| Total Distributions | (3.926) | (3.119) | (3.231) | (3.087) | (2.795) |
| Net Asset Value, End of Period | $312.78 | $269.07 | $229.09 | $182.49 | $204.30 |
| Total Return | 17.75% | 19.13% | 27.40% | -9.30% | 16.27% |
| Ratios/Supplemental Data | |||||
| Net Assets, End of Period (Millions) | $12,638 | $10,172 | $8,846 | $7,866 | $9,531 |
| Ratio of Total Expenses to Average Net Assets | 0.03% | 0.03% | 0.03% | 0.03% | 0.03% |
| Ratio of Net Investment Income to Average Net Assets | 1.32% | 1.41% | 1.49% | 1.48% | 1.50% |
| Portfolio Turnover Rate2 | 17% | 22% | 16% | 15% | 15% |
| 1 | Calculated based on average shares outstanding. |
| 2 | Excludes the value of portfolio securities received or delivered as a result of in-kind purchases or redemptions of the fund’s capital shares, including ETF Creation Units. |
| A. | The following significant accounting policies conform to generally accepted accounting principles for U.S. investment companies. The fund consistently follows such policies in preparing its financial statements. |
| B. | In accordance with the terms of a Funds’ Service Agreement (the “FSA”) between Vanguard and the fund, Vanguard furnishes to the fund investment advisory, corporate management, administrative, marketing, and distribution services at Vanguard’s cost of operations (as defined by the FSA). These costs of operations are allocated to the fund based on methods and guidelines approved by the board of trustees and are generally settled twice a month. |
| C. | Various inputs may be used to determine the value of the fund’s investments and derivatives. These inputs are summarized in three broad levels for financial statement purposes. The inputs or methodologies used to value securities are not necessarily an indication of the risk associated with investing in those securities. |
| Level 1 ($000) | Level 2 ($000) | Level 3 ($000) | Total ($000) | |
| Investments | ||||
| Assets | ||||
| Common Stocks | 139,629,904 | — | 1,816 | 139,631,720 |
| Temporary Cash Investments | 2,098,349 | — | — | 2,098,349 |
| Total | 141,728,253 | — | 1,816 | 141,730,069 |
| Derivative Financial Instruments | ||||
| Assets | ||||
| Futures Contracts1 | 15,476 | — | — | 15,476 |
| Swap Contracts | — | 9,302 | — | 9,302 |
| Total | 15,476 | 9,302 | — | 24,778 |
| Liabilities | ||||
| Swap Contracts | — | 952 | — | 952 |
| 1 | Includes cumulative appreciation (depreciation) on futures contracts and centrally cleared swaps, if any, as reported in the Schedule of Investments. Only current day’s variation margin is reported within the Statement of Assets and Liabilities. |
| D. | Permanent differences between book-basis and tax-basis components of net assets are reclassified among capital accounts in the financial statements to reflect their tax character. These reclassifications have no effect on net assets or net asset value per share. As of period end, permanent differences primarily attributable to the accounting for in-kind redemptions, passive foreign investment companies, and swap agreements were reclassified between the following accounts: |
| Amount ($000) | |
| Paid-in Capital | 8,884,297 |
| Total Distributable Earnings (Loss) | (8,884,297) |
| Amount ($000) | |
| Undistributed Ordinary Income | 22,175 |
| Undistributed Long-Term Gains | — |
| Capital Loss Carryforwards | (5,198,211) |
| Qualified Late-Year Losses | — |
| Net Unrealized Gains (Losses) | 44,098,744 |
| Year Ended December 31, | ||
| 2021 Amount ($000) | 2020 Amount ($000) | |
| Ordinary Income* | 1,717,364 | 1,316,483 |
| Long-Term Capital Gains | — | — |
| Total | 1,717,364 | 1,316,483 |
| * | Includes short-term capital gains, if any. |
| Amount ($000) | |
| Tax Cost | 97,631,325 |
| Gross Unrealized Appreciation | 53,505,539 |
| Gross Unrealized Depreciation | (9,406,795) |
| Net Unrealized Appreciation (Depreciation) | 44,098,744 |
| E. | During the year ended December 31, 2021, the fund purchased $42,324,071,000 of investment securities and sold $35,162,449,000 of investment securities, other than temporary cash investments. Purchases and sales include $17,197,274,000 and $12,798,135,000, respectively, in connection with in-kind purchases and redemptions of the fund’s capital shares. |
| F. | Capital share transactions for each class of shares were: |
| Year Ended December 31, | |||||
| 2021 | 2020 | ||||
| Amount ($000) | Shares (000) | Amount ($000) | Shares (000) | ||
| Investor Shares | |||||
| Issued | 83,822 | 804 | 52,197 | 745 | |
| Issued in Lieu of Cash Distributions | 8,073 | 77 | 8,214 | 109 | |
| Redeemed | (293,651) | (2,772) | (207,856) | (2,748) | |
| Net Increase (Decrease)—Investor Shares | (201,756) | (1,891) | (147,445) | (1,894) | |
| ETF Shares | |||||
| Issued | 19,022,966 | 85,746 | 16,291,928 | 103,198 | |
| Issued in Lieu of Cash Distributions | — | — | — | — | |
| Redeemed | (12,452,875) | (56,550) | (12,063,159) | (76,150) | |
| Net Increase (Decrease)—ETF Shares | 6,570,091 | 29,196 | 4,228,769 | 27,048 | |
| Admiral Shares | |||||
| Issued | 8,639,338 | 82,503 | 7,197,182 | 101,668 | |
| Issued in Lieu of Cash Distributions | 609,812 | 5,775 | 488,424 | 6,445 | |
| Redeemed | (9,015,123) | (85,813) | (9,524,687) | (134,614) | |
| Net Increase (Decrease)—Admiral Shares | 234,027 | 2,465 | (1,839,081) | (26,501) | |
| Institutional Shares | |||||
| Issued | 4,948,740 | 47,094 | 3,037,642 | 42,453 | |
| Issued in Lieu of Cash Distributions | 260,028 | 2,463 | 210,983 | 2,787 | |
| Redeemed | (5,405,883) | (51,369) | (4,395,547) | (60,308) | |
| Net Increase (Decrease)—Institutional Shares | (197,115) | (1,812) | (1,146,922) | (15,068) | |
| Institutional Plus Shares | |||||
| Issued | 3,027,331 | 9,968 | 1,822,548 | 8,480 | |
| Issued in Lieu of Cash Distributions | 153,202 | 502 | 122,453 | 562 | |
| Redeemed | (2,381,349) | (7,870) | (2,086,851) | (9,851) | |
| Net Increase (Decrease)—Institutional Plus Shares | 799,184 | 2,600 | (141,850) | (809) | |
| G. | Management has determined that no events or transactions occurred subsequent to December 31, 2021, that would require recognition or disclosure in these financial statements. |

| Average Annual Total Returns Periods Ended December 31, 2021 | |||||
| One Year | Five Years | Ten Years | Final Value of a $10,000 Investment | ||
| Small-Cap Growth Index Fund Investor Shares | 5.58% | 16.76% | 14.69% | $39,363 |
| Spliced Small-Cap Growth Index | 5.71 | 16.91 | 14.77 | 39,670 |
| Dow Jones U.S. Total Stock Market Float Adjusted Index | 25.66 | 17.92 | 16.24 | 45,050 |
| One Year | Five Years | Ten Years | Final Value of a $10,000 Investment | ||
| Small-Cap Growth Index Fund ETF Shares Net Asset Value | 5.71% | 16.90% | 14.83% | $39,862 | |
| Small-Cap Growth Index Fund ETF Shares Market Price | 5.62 | 16.90 | 14.83 | 39,856 | |
| Spliced Small-Cap Growth Index | 5.71 | 16.91 | 14.77 | 39,670 | |
| Dow Jones U.S. Total Stock Market Float Adjusted Index | 25.66 | 17.92 | 16.24 | 45,050 | |
| Average Annual Total Returns Periods Ended December 31, 2021 | |||||
| One Year | Five Years | Ten Years | Final Value of a $10,000 Investment | ||
| Small-Cap Growth Index Fund Admiral Shares | 5.69% | 16.90% | 14.83% | $39,861 | |
| Spliced Small-Cap Growth Index | 5.71 | 16.91 | 14.77 | 39,670 | |
| Dow Jones U.S. Total Stock Market Float Adjusted Index | 25.66 | 17.92 | 16.24 | 45,050 | |
| One Year | Five Years | Ten Years | Final Value of a $5,000,000 Investment | ||
| Small-Cap Growth Index Fund Institutional Shares | 5.70% | 16.91% | 14.84% | $19,945,853 | |
| Spliced Small-Cap Growth Index | 5.71 | 16.91 | 14.77 | 19,834,989 | |
| Dow Jones U.S. Total Stock Market Float Adjusted Index | 25.66 | 17.92 | 16.24 | 22,525,162 | |
| Cumulative Returns of ETF Shares: December 31, 2011, Through December 31, 2021 | |||
| One Year | Five Years | Ten Years | |
| Small-Cap Growth Index Fund ETF Shares Market Price | 5.62% | 118.29% | 298.56% |
| Small-Cap Growth Index Fund ETF Shares Net Asset Value | 5.71 | 118.30 | 298.62 |
| Spliced Small-Cap Growth Index | 5.71 | 118.37 | 296.70 |
| Basic Materials | 1.8% |
| Consumer Discretionary | 15.9 |
| Consumer Staples | 2.8 |
| Energy | 2.8 |
| Financials | 5.1 |
| Health Care | 20.5 |
| Industrials | 17.8 |
| Real Estate | 8.3 |
| Technology | 21.9 |
| Telecommunications | 1.8 |
| Utilities | 1.3 |
| Shares | Market Value• ($000) | |||||
| Common Stocks (99.7%) | ||||||
| Basic Materials (1.8%) | ||||||
| Royal Gold Inc. | 1,028,587 | 108,218 | ||||
| * | RBC Bearings Inc. | 452,425 | 91,376 | |||
| Balchem Corp. | 507,370 | 85,543 | ||||
| * | Hexcel Corp. | 1,315,001 | 68,117 | |||
| * | MP Materials Corp. | 1,392,669 | 63,255 | |||
| * | Livent Corp. | 2,531,685 | 61,722 | |||
| Quaker Chemical Corp. | 210,464 | 48,571 | ||||
| * | Ingevity Corp. | 616,332 | 44,191 | |||
| NewMarket Corp. | 125,174 | 42,900 | ||||
| * | Amyris Inc. | 2,889,564 | 15,632 | |||
| * | Century Aluminum Co. | 774,464 | 12,825 | |||
| * | Zymergen Inc. | 719,357 | 4,812 | |||
| GrafTech International Ltd. | 2,113 | 25 | ||||
| American Vanguard Corp. | 280 | 5 | ||||
| 647,192 | ||||||
| Consumer Discretionary (15.9%) | ||||||
| * | Floor & Decor Holdings Inc. Class A | 1,572,278 | 204,412 | |||
| * | Liberty Media Corp.-Liberty Formula One Class C | 3,027,989 | 191,490 | |||
| * | Five Below Inc. | 878,558 | 181,765 | |||
| * | SiteOne Landscape Supply Inc. | 701,051 | 169,851 | |||
| Pool Corp. | 298,553 | 168,981 | ||||
| * | Deckers Outdoor Corp. | 430,509 | 157,700 | |||
| * | RH | 268,509 | 143,905 | |||
| Tempur Sealy International Inc. | 3,018,316 | 141,951 | ||||
| * | Penn National Gaming Inc. | 2,662,114 | 138,031 | |||
| Wyndham Hotels & Resorts Inc. | 1,461,783 | 131,049 | ||||
| Churchill Downs Inc. | 540,023 | 130,092 | ||||
| Gentex Corp. | 3,708,728 | 129,249 | ||||
| * | Bright Horizons Family Solutions Inc. | 947,282 | 119,244 | |||
| * | Planet Fitness Inc. Class A | 1,307,553 | 118,438 | |||
| Shares | Market Value• ($000) | |||||
| * | Crocs Inc. | 876,926 | 112,439 | |||
| * | Fox Factory Holding Corp. | 660,584 | 112,365 | |||
| * | YETI Holdings Inc. | 1,306,072 | 108,182 | |||
| * | IAA Inc. | 2,115,779 | 107,101 | |||
| * | Zynga Inc. Class A | 16,699,535 | 106,877 | |||
| Vail Resorts Inc. | 317,381 | 104,069 | ||||
| * | Scientific Games Corp. | 1,436,854 | 96,025 | |||
| Texas Roadhouse Inc. Class A | 1,038,550 | 92,722 | ||||
| Nexstar Media Group Inc. Class A | 608,541 | 91,877 | ||||
| * | Skechers USA Inc. Class A | 2,112,865 | 91,698 | |||
| Choice Hotels International Inc. | 567,350 | 88,501 | ||||
| * | Boyd Gaming Corp. | 1,234,627 | 80,954 | |||
| Wingstop Inc. | 468,241 | 80,912 | ||||
| * | Hilton Grand Vacations Inc. | 1,408,070 | 73,375 | |||
| Papa John's International Inc. | 512,690 | 68,429 | ||||
| * | Skyline Champion Corp. | 847,129 | 66,906 | |||
| * | Chegg Inc. | 2,157,436 | 66,233 | |||
| * | National Vision Holdings Inc. | 1,295,836 | 62,187 | |||
| * | Callaway Golf Co. | 2,186,042 | 59,985 | |||
| * | Sonos Inc. | 1,992,344 | 59,372 | |||
| * | Leslie's Inc. | 2,502,522 | 59,210 | |||
| LCI Industries | 376,315 | 58,656 | ||||
| *,1 | Luminar Technologies Inc. Class A | 3,462,475 | 58,550 | |||
| Columbia Sportswear Co. | 562,350 | 54,795 | ||||
| * | Grand Canyon Education Inc. | 628,348 | 53,856 | |||
| * | LGI Homes Inc. | 342,540 | 52,916 | |||
| * | SeaWorld Entertainment Inc. | 787,491 | 51,077 | |||
| * | Ollie's Bargain Outlet Holdings Inc. | 971,333 | 49,723 | |||
| * | Six Flags Entertainment Corp. | 1,146,156 | 48,803 | |||
| * | Visteon Corp. | 439,032 | 48,794 | |||
| Shares | Market Value• ($000) | |||||
| * | Frontdoor Inc. | 1,328,192 | 48,678 | |||
| * | Dorman Products Inc. | 421,688 | 47,655 | |||
| * | Madison Square Garden Sports Corp. | 262,562 | 45,615 | |||
| Red Rock Resorts Inc. Class A | 823,791 | 45,317 | ||||
| * | Gentherm Inc. | 521,308 | 45,302 | |||
| * | Allegiant Travel Co. | 241,301 | 45,133 | |||
| * | TripAdvisor Inc. | 1,572,931 | 42,878 | |||
| *,1 | Figs Inc. Class A | 1,545,972 | 42,607 | |||
| * | Shake Shack Inc. Class A | 583,441 | 42,101 | |||
| Ralph Lauren Corp. | 344,710 | 40,972 | ||||
| * | Coursera Inc. | 1,654,116 | 40,427 | |||
| * | Overstock.com Inc. | 641,487 | 37,854 | |||
| *,1 | Fisker Inc. | 2,314,603 | 36,409 | |||
| Levi Strauss & Co. Class A | 1,441,316 | 36,076 | ||||
| * | Hyatt Hotels Corp. Class A | 374,911 | 35,954 | |||
| * | Revolve Group Inc. Class A | 619,742 | 34,730 | |||
| World Wrestling Entertainment Inc. Class A | 702,400 | 34,656 | ||||
| * | Madison Square Garden Entertainment Corp. | 429,505 | 30,211 | |||
| Monro Inc. | 497,811 | 29,007 | ||||
| * | Boot Barn Holdings Inc. | 231,005 | 28,425 | |||
| Steven Madden Ltd. | 604,029 | 28,069 | ||||
| * | iRobot Corp. | 423,896 | 27,926 | |||
| * | ACV Auctions Inc. Class A | 1,466,265 | 27,624 | |||
| Jack in the Box Inc. | 314,027 | 27,471 | ||||
| * | Driven Brands Holdings Inc. | 790,074 | 26,562 | |||
| * | Sleep Number Corp. | 336,150 | 25,749 | |||
| Camping World Holdings Inc. Class A | 630,723 | 25,481 | ||||
| * | Petco Health & Wellness Co. Inc. Class A | 1,238,293 | 24,506 | |||
| Cracker Barrel Old Country Store Inc. | 183,744 | 23,637 | ||||
| * | Stitch Fix Inc. Class A | 1,232,578 | 23,320 | |||
| * | Liberty Media Corp.-Liberty Formula One Class A | 389,599 | 23,119 | |||
| * | 2U Inc. | 1,129,512 | 22,669 | |||
| *,1 | ContextLogic Inc. Class A | 7,211,521 | 22,428 | |||
| * | Cavco Industries Inc. | 68,102 | 21,633 | |||
| EW Scripps Co. Class A | 937,423 | 18,139 | ||||
| * | Selectquote Inc. | 1,921,160 | 17,406 | |||
| * | Mister Car Wash Inc. | 929,081 | 16,919 | |||
| *,1 | Dutch Bros Inc. Class A | 322,551 | 16,421 | |||
| * | Cardlytics Inc. | 233,895 | 15,458 | |||
| Inter Parfums Inc. | 136,341 | 14,575 | ||||
| * | RealReal Inc. | 1,226,945 | 14,245 | |||
| Shares | Market Value• ($000) | |||||
| * | Sun Country Airlines Holdings Inc. | 494,530 | 13,476 | |||
| * | elf Beauty Inc. | 386,109 | 12,823 | |||
| *,1 | Corsair Gaming Inc. | 589,557 | 12,387 | |||
| *,1 | Portillo's Inc. Class A | 314,350 | 11,801 | |||
| * | Latham Group Inc. | 468,004 | 11,714 | |||
| * | Dave & Buster's Entertainment Inc. | 301,961 | 11,595 | |||
| * | Stride Inc. | 317,369 | 10,578 | |||
| *,1 | ThredUp Inc. Class A | 815,590 | 10,407 | |||
| Strategic Education Inc. | 173,169 | 10,016 | ||||
| * | Quotient Technology Inc. | 1,327,837 | 9,853 | |||
| * | Angi Inc. Class A | 1,067,347 | 9,830 | |||
| * | Dine Brands Global Inc. | 127,775 | 9,687 | |||
| * | Poshmark Inc. Class A | 552,065 | 9,402 | |||
| * | Integral Ad Science Holding Corp. | 360,515 | 8,007 | |||
| *,1 | Canoo Inc. | 1,025,220 | 7,915 | |||
| * | Rush Street Interactive Inc. | 393,173 | 6,487 | |||
| *,1 | Dream Finders Homes Inc. Class A | 302,683 | 5,887 | |||
| * | Vizio Holding Corp. Class A | 302,653 | 5,881 | |||
| * | Life Time Group Holdings Inc. | 301,606 | 5,191 | |||
| * | Sciplay Corp. Class A | 364,179 | 5,018 | |||
| * | Traeger Inc. | 367,271 | 4,466 | |||
| *,1 | Weber Inc. Class A | 287,059 | 3,712 | |||
| * | Janus International Group Inc. | 289,656 | 3,626 | |||
| *,1 | Sweetgreen Inc. Class A | 109,580 | 3,507 | |||
| * | Frontier Group Holdings Inc. | 253,121 | 3,435 | |||
| *,1 | XL Fleet Corp. | 871,198 | 2,884 | |||
| *,1 | Allbirds Inc. Class A | 154,191 | 2,325 | |||
| * | Brilliant Earth Group Inc. Class A | 127,101 | 2,295 | |||
| * | Udemy Inc. | 107,273 | 2,096 | |||
| *,1 | Solo Brands Inc. Class A | 94,488 | 1,477 | |||
| *,1 | Revlon Inc. Class A | 125,074 | 1,418 | |||
| * | Arhaus Inc. Class A | 102,584 | 1,359 | |||
| * | Instructure Holdings Inc. | 5,620 | 135 | |||
| Travel + Leisure Co. | 910 | 50 | ||||
| * | Academy Sports & Outdoors Inc. | 932 | 41 | |||
| * | Torrid Holdings Inc. | 3,955 | 39 | |||
| Sinclair Broadcast Group Inc. Class A | 512 | 14 | ||||
| * | PowerSchool Holdings Inc. Class A | 503 | 8 | |||
| * | Duolingo Inc. Class A | 70 | 7 | |||
| *,1 | Lordstown Motors Corp. | 1,120 | 4 | |||
| 5,866,964 | ||||||
| Consumer Staples (2.8%) | ||||||
| * | Darling Ingredients Inc. | 2,538,427 | 175,888 | |||
| Shares | Market Value• ($000) | |||||
| Casey's General Stores Inc. | 581,369 | 114,733 | ||||
| * | Post Holdings Inc. | 882,348 | 99,467 | |||
| * | Boston Beer Co. Inc. Class A | 143,876 | 72,672 | |||
| * | Freshpet Inc. | 646,028 | 61,547 | |||
| * | Simply Good Foods Co. | 1,352,015 | 56,203 | |||
| WD-40 Co. | 214,935 | 52,582 | ||||
| Coca-Cola Consolidated Inc. | 72,832 | 45,097 | ||||
| * | Celsius Holdings Inc. | 586,890 | 43,764 | |||
| *,1 | Beyond Meat Inc. | 653,263 | 42,567 | |||
| Medifast Inc. | 173,304 | 36,295 | ||||
| Sanderson Farms Inc. | 166,662 | 31,846 | ||||
| J & J Snack Foods Corp. | 180,130 | 28,453 | ||||
| Lancaster Colony Corp. | 151,654 | 25,114 | ||||
| Cal-Maine Foods Inc. | 623,865 | 23,077 | ||||
| * | Beauty Health Co. | 818,095 | 19,765 | |||
| * | USANA Health Sciences Inc. | 182,445 | 18,463 | |||
| *,1 | BellRing Brands Inc. Class A | 618,121 | 17,635 | |||
| 1 | National Beverage Corp. | 364,489 | 16,522 | |||
| Utz Brands Inc. | 1,030,100 | 16,430 | ||||
| * | Hydrofarm Holdings Group Inc. | 521,645 | 14,757 | |||
| * | Sovos Brands Inc. | 393,547 | 5,923 | |||
| * | Vital Farms Inc. | 283,341 | 5,117 | |||
| * | Honest Co. Inc. | 390,789 | 3,162 | |||
| *,1 | AppHarvest Inc. | 255,945 | 996 | |||
| 1,028,075 | ||||||
| Energy (2.8%) | ||||||
| Coterra Energy Inc. | 12,756,552 | 242,375 | ||||
| Texas Pacific Land Corp. | 97,249 | 121,451 | ||||
| PDC Energy Inc. | 1,526,004 | 74,438 | ||||
| *,1 | ChargePoint Holdings Inc. | 3,537,493 | 67,389 | |||
| * | ChampionX Corp. | 3,169,847 | 64,063 | |||
| Matador Resources Co. | 1,654,572 | 61,087 | ||||
| * | Denbury Inc. | 746,356 | 57,163 | |||
| * | Shoals Technologies Group Inc. Class A | 1,634,915 | 39,728 | |||
| * | Ameresco Inc. Class A | 474,175 | 38,617 | |||
| Cactus Inc. Class A | 926,170 | 35,315 | ||||
| Civitas Resources Inc. | 656,038 | 32,126 | ||||
| * | Array Technologies Inc. | 2,018,123 | 31,664 | |||
| *,1 | FuelCell Energy Inc. | 5,469,851 | 28,443 | |||
| New Fortress Energy Inc. Class A | 1,138,803 | 27,491 | ||||
| Magnolia Oil & Gas Corp. Class A | 1,216,659 | 22,958 | ||||
| * | Stem Inc. | 1,072,056 | 20,337 | |||
| * | Liberty Oilfield Services Inc. Class A | 1,891,959 | 18,352 | |||
| * | Oceaneering International Inc. | 1,576,220 | 17,827 | |||
| * | Dril-Quip Inc. | 552,774 | 10,879 | |||
| Shares | Market Value• ($000) | |||||
| * | Fluence Energy Inc. Class A | 232,641 | 8,273 | |||
| * | NexTier Oilfield Solutions Inc. | 1,607,303 | 5,706 | |||
| * | Helix Energy Solutions Group Inc. | 1,119,457 | 3,493 | |||
| *,1 | EVgo Inc. | 187,685 | 1,866 | |||
| 1,031,041 | ||||||
| Financials (5.1%) | ||||||
| * | Upstart Holdings Inc. | 899,969 | 136,165 | |||
| Morningstar Inc. | 371,732 | 127,129 | ||||
| Pinnacle Financial Partners Inc. | 1,133,451 | 108,245 | ||||
| Ares Management Corp. Class A | 1,117,193 | 90,794 | ||||
| Western Alliance Bancorp | 777,021 | 83,646 | ||||
| Kinsale Capital Group Inc. | 339,548 | 80,775 | ||||
| *,1 | Credit Acceptance Corp. | 113,867 | 78,304 | |||
| Erie Indemnity Co. Class A | 398,053 | 76,689 | ||||
| * | Trupanion Inc. | 569,220 | 75,154 | |||
| * | SoFi Technologies Inc. | 4,740,331 | 74,945 | |||
| * | Alleghany Corp. | 101,947 | 68,059 | |||
| ServisFirst Bancshares Inc. | 764,365 | 64,925 | ||||
| * | Silvergate Capital Corp. Class A | 421,407 | 62,452 | |||
| Ameris Bancorp | 1,037,391 | 51,538 | ||||
| Hamilton Lane Inc. Class A | 495,607 | 51,355 | ||||
| Virtu Financial Inc. Class A | 1,761,995 | 50,798 | ||||
| *,1 | Marathon Digital Holdings Inc. | 1,527,898 | 50,207 | |||
| 1 | Blue Owl Capital Inc. Class A | 3,175,401 | 47,345 | |||
| * | Focus Financial Partners Inc. Class A | 727,174 | 43,427 | |||
| Houlihan Lokey Inc. Class A | 400,123 | 41,421 | ||||
| *,1 | Riot Blockchain Inc. | 1,727,351 | 38,572 | |||
| Goosehead Insurance Inc. Class A | 279,713 | 36,385 | ||||
| Cohen & Steers Inc. | 376,982 | 34,875 | ||||
| * | Open Lending Corp. Class A | 1,488,580 | 33,463 | |||
| StepStone Group Inc. Class A | 799,150 | 33,221 | ||||
| * | BRP Group Inc. Class A | 849,486 | 30,675 | |||
| Pacific Premier Bancorp Inc. | 738,028 | 29,543 | ||||
| *,1 | Lemonade Inc. | 577,691 | 24,327 | |||
| * | Triumph Bancorp Inc. | 187,749 | 22,357 | |||
| Live Oak Bancshares Inc. | 254,317 | 22,199 | ||||
| * | LendingTree Inc. | 177,093 | 21,712 | |||
| TFS Financial Corp. | 887,554 | 15,861 | ||||
| *,1 | Oscar Health Inc. Class A | 1,905,640 | 14,959 | |||
| Shares | Market Value• ($000) | |||||
| PJT Partners Inc. Class A | 170,623 | 12,641 | ||||
| * | Palomar Holdings Inc. | 188,600 | 12,216 | |||
| * | Clearwater Analytics Holdings Inc. Class A | 480,676 | 11,046 | |||
| *,1 | Root Inc. Class A | 1,759,008 | 5,453 | |||
| * | eHealth Inc. | 164,931 | 4,206 | |||
| * | AssetMark Financial Holdings Inc. | 143,612 | 3,764 | |||
| * | GoHealth Inc. Class A | 986,383 | 3,738 | |||
| *,1 | Romeo Power Inc. | 733,413 | 2,677 | |||
| * | P10 Inc. Class A | 156,026 | 2,181 | |||
| *,1 | Hagerty Inc. Class A | 99,854 | 1,416 | |||
| * | Bakkt Holdings Inc. | 97,469 | 829 | |||
| * | MetroMile Inc. | 324,627 | 711 | |||
| Essent Group Ltd. | 1,120 | 51 | ||||
| Independent Bank Group Inc. | 385 | 28 | ||||
| * | Ryan Specialty Group Holdings Inc. Class A | 700 | 28 | |||
| National Bank Holdings Corp. Class A | 306 | 13 | ||||
| Kearny Financial Corp. | 770 | 10 | ||||
| 1,882,530 | ||||||
| Health Care (20.4%) | ||||||
| Bio-Techne Corp. | 615,987 | 318,675 | ||||
| * | Masimo Corp. | 779,200 | 228,134 | |||
| * | Repligen Corp. | 823,999 | 218,228 | |||
| * | Syneos Health Inc. | 1,625,854 | 166,943 | |||
| * | Penumbra Inc. | 556,652 | 159,937 | |||
| * | Guardant Health Inc. | 1,515,590 | 151,589 | |||
| * | Tandem Diabetes Care Inc. | 996,444 | 149,985 | |||
| * | Charles River Laboratories International Inc. | 395,595 | 149,052 | |||
| Bruker Corp. | 1,545,857 | 129,713 | ||||
| Chemed Corp. | 241,529 | 127,778 | ||||
| * | Neurocrine Biosciences Inc. | 1,488,217 | 126,751 | |||
| * | Natera Inc. | 1,337,129 | 124,874 | |||
| * | Omnicell Inc. | 689,117 | 124,344 | |||
| * | Intellia Therapeutics Inc. | 1,051,253 | 124,300 | |||
| * | Sarepta Therapeutics Inc. | 1,298,641 | 116,943 | |||
| * | Arrowhead Pharmaceuticals Inc. | 1,559,230 | 103,377 | |||
| * | Blueprint Medicines Corp. | 923,963 | 98,966 | |||
| * | Medpace Holdings Inc. | 451,167 | 98,192 | |||
| * | Inspire Medical Systems Inc. | 408,058 | 93,878 | |||
| * | Shockwave Medical Inc. | 526,401 | 93,873 | |||
| * | Exelixis Inc. | 4,957,603 | 90,625 | |||
| * | Globus Medical Inc. Class A | 1,240,729 | 89,581 | |||
| * | Arena Pharmaceuticals Inc. | 961,114 | 89,326 | |||
| Shares | Market Value• ($000) | |||||
| * | Halozyme Therapeutics Inc. | 2,205,246 | 88,673 | |||
| * | Ultragenyx Pharmaceutical Inc. | 1,014,629 | 85,320 | |||
| * | Amedisys Inc. | 510,839 | 82,695 | |||
| * | Neogen Corp. | 1,684,456 | 76,491 | |||
| * | Integra LifeSciences Holdings Corp. | 1,127,854 | 75,555 | |||
| * | ICU Medical Inc. | 316,096 | 75,022 | |||
| * | Quidel Corp. | 554,948 | 74,912 | |||
| * | Fate Therapeutics Inc. | 1,271,826 | 74,415 | |||
| * | Maravai LifeSciences Holdings Inc. Class A | 1,750,244 | 73,335 | |||
| Ensign Group Inc. | 822,442 | 69,052 | ||||
| * | STAAR Surgical Co. | 745,719 | 68,084 | |||
| * | LHC Group Inc. | 471,482 | 64,701 | |||
| * | Option Care Health Inc. | 2,254,790 | 64,126 | |||
| * | Beam Therapeutics Inc. | 800,667 | 63,805 | |||
| * | NeoGenomics Inc. | 1,832,964 | 62,541 | |||
| * | Apellis Pharmaceuticals Inc. | 1,295,713 | 61,261 | |||
| * | Intra-Cellular Therapies Inc. | 1,148,883 | 60,133 | |||
| * | Denali Therapeutics Inc. | 1,339,708 | 59,751 | |||
| * | Alkermes plc | 2,534,122 | 58,944 | |||
| * | HealthEquity Inc. | 1,308,792 | 57,901 | |||
| * | Ionis Pharmaceuticals Inc. | 1,881,286 | 57,248 | |||
| * | Adaptive Biotechnologies Corp. | 1,991,312 | 55,876 | |||
| * | R1 RCM Inc. | 2,175,990 | 55,466 | |||
| * | Arvinas Inc. | 663,047 | 54,463 | |||
| * | Twist Bioscience Corp. | 700,178 | 54,187 | |||
| * | Progyny Inc. | 1,063,149 | 53,530 | |||
| * | Merit Medical Systems Inc. | 840,839 | 52,384 | |||
| * | iRhythm Technologies Inc. | 438,288 | 51,582 | |||
| * | Vir Biotechnology Inc. | 1,231,435 | 51,560 | |||
| * | Insmed Inc. | 1,855,907 | 50,555 | |||
| * | Amicus Therapeutics Inc. | 4,368,230 | 50,453 | |||
| * | AtriCure Inc. | 684,253 | 47,576 | |||
| * | Inari Medical Inc. | 511,792 | 46,711 | |||
| * | Invitae Corp. | 3,011,793 | 45,990 | |||
| * | Veracyte Inc. | 1,114,525 | 45,918 | |||
| * | Certara Inc. | 1,604,168 | 45,590 | |||
| * | Zentalis Pharmaceuticals Inc. | 533,116 | 44,814 | |||
| *,1 | Warby Parker Inc. Class A | 959,112 | 44,656 | |||
| * | PTC Therapeutics Inc. | 1,108,987 | 44,171 | |||
| * | ACADIA Pharmaceuticals Inc. | 1,891,222 | 44,141 | |||
| * | NuVasive Inc. | 811,788 | 42,603 | |||
| * | Haemonetics Corp. | 801,909 | 42,533 | |||
| * | Nevro Corp. | 520,228 | 42,175 | |||
| * | 1Life Healthcare Inc. | 2,395,576 | 42,090 | |||
| Shares | Market Value• ($000) | |||||
| * | Apollo Medical Holdings Inc. | 566,366 | 41,617 | |||
| * | Pacira BioSciences Inc. | 664,493 | 39,983 | |||
| * | Ortho Clinical Diagnostics Holdings plc | 1,859,497 | 39,775 | |||
| * | Nektar Therapeutics | 2,895,323 | 39,116 | |||
| * | Ligand Pharmaceuticals Inc. | 249,194 | 38,490 | |||
| * | Novocure Ltd. | 511,586 | 38,410 | |||
| * | TG Therapeutics Inc. | 2,018,477 | 38,351 | |||
| * | CareDx Inc. | 829,127 | 37,709 | |||
| * | Xencor Inc. | 918,187 | 36,838 | |||
| * | Sotera Health Co. | 1,554,878 | 36,617 | |||
| * | Doximity Inc. Class A | 725,765 | 36,383 | |||
| * | Evolent Health Inc. Class A | 1,264,038 | 34,976 | |||
| * | Sage Therapeutics Inc. | 787,768 | 33,512 | |||
| * | Emergent BioSolutions Inc. | 761,408 | 33,098 | |||
| CONMED Corp. | 229,746 | 32,569 | ||||
| * | ChemoCentryx Inc. | 880,226 | 32,049 | |||
| * | CorVel Corp. | 153,155 | 31,856 | |||
| * | Relay Therapeutics Inc. | 1,018,517 | 31,279 | |||
| * | SpringWorks Therapeutics Inc. | 502,972 | 31,174 | |||
| * | Glaukos Corp. | 699,926 | 31,105 | |||
| *,1 | Corcept Therapeutics Inc. | 1,519,510 | 30,086 | |||
| * | Global Blood Therapeutics Inc. | 1,015,303 | 29,718 | |||
| * | Editas Medicine Inc. | 1,077,605 | 28,610 | |||
| * | Cytokinetics Inc. | 625,711 | 28,520 | |||
| * | Oak Street Health Inc. | 851,063 | 28,204 | |||
| * | AdaptHealth Corp. Class A | 1,144,053 | 27,984 | |||
| * | REVOLUTION Medicines Inc. | 1,100,568 | 27,701 | |||
| * | Health Catalyst Inc. | 698,435 | 27,672 | |||
| * | Cerevel Therapeutics Holdings Inc. | 809,913 | 26,257 | |||
| * | Ironwood Pharmaceuticals Inc. Class A | 2,173,185 | 25,339 | |||
| * | Accolade Inc. | 844,372 | 22,258 | |||
| * | Silk Road Medical Inc. | 495,933 | 21,132 | |||
| * | Sana Biotechnology Inc. | 1,327,547 | 20,550 | |||
| *,1 | Recursion Pharmaceuticals Inc. Class A | 1,132,138 | 19,394 | |||
| * | REGENXBIO Inc. | 567,932 | 18,571 | |||
| * | FibroGen Inc. | 1,303,528 | 18,380 | |||
| * | Alector Inc. | 888,753 | 18,353 | |||
| * | Harmony Biosciences Holdings Inc. | 411,297 | 17,538 | |||
| * | American Well Corp. Class A | 2,871,211 | 17,342 | |||
| *,1 | Seer Inc. Class A | 757,106 | 17,270 | |||
| * | Privia Health Group Inc. | 663,989 | 17,177 | |||
| Shares | Market Value• ($000) | |||||
| * | Surgery Partners Inc. | 317,029 | 16,933 | |||
| * | Innoviva Inc. | 977,127 | 16,855 | |||
| * | Allogene Therapeutics Inc. | 1,113,230 | 16,609 | |||
| * | Alignment Healthcare Inc. | 1,170,169 | 16,453 | |||
| * | Outset Medical Inc. | 353,476 | 16,292 | |||
| * | Axonics Inc. | 289,316 | 16,202 | |||
| * | Arcus Biosciences Inc. | 383,624 | 15,525 | |||
| * | NanoString Technologies Inc. | 356,597 | 15,059 | |||
| * | Phreesia Inc. | 357,681 | 14,901 | |||
| * | Heron Therapeutics Inc. | 1,592,418 | 14,539 | |||
| * | Berkeley Lights Inc. | 790,546 | 14,372 | |||
| * | OPKO Health Inc. | 2,927,112 | 14,079 | |||
| * | Agios Pharmaceuticals Inc. | 424,226 | 13,944 | |||
| * | Instil Bio Inc. | 805,023 | 13,774 | |||
| * | Pulmonx Corp. | 402,854 | 12,920 | |||
| * | Vaxcyte Inc. | 535,996 | 12,751 | |||
| * | Agiliti Inc. | 510,291 | 11,818 | |||
| * | Supernus Pharmaceuticals Inc. | 394,645 | 11,508 | |||
| * | Inogen Inc. | 337,281 | 11,468 | |||
| * | Bluebird Bio Inc. | 1,099,293 | 10,982 | |||
| * | Gossamer Bio Inc. | 955,502 | 10,807 | |||
| * | PMV Pharmaceuticals Inc. | 460,823 | 10,645 | |||
| * | Definitive Healthcare Corp. Class A | 387,445 | 10,589 | |||
| * | AnaptysBio Inc. | 300,805 | 10,453 | |||
| * | HealthStream Inc. | 394,434 | 10,397 | |||
| * | Atara Biotherapeutics Inc. | 657,368 | 10,360 | |||
| * | Theravance Biopharma Inc. | 921,059 | 10,178 | |||
| * | Pennant Group Inc. | 400,397 | 9,241 | |||
| * | Cano Health Inc. | 986,604 | 8,791 | |||
| *,1 | Clover Health Investments Corp. Class A | 2,323,407 | 8,643 | |||
| * | Verve Therapeutics Inc. | 225,617 | 8,318 | |||
| * | BioAtla Inc. | 414,057 | 8,128 | |||
| * | Nuvation Bio Inc. | 935,899 | 7,955 | |||
| * | Kronos Bio Inc. | 572,128 | 7,775 | |||
| * | Treace Medical Concepts Inc. | 415,177 | 7,739 | |||
| * | Rocket Pharmaceuticals Inc. | 352,332 | 7,691 | |||
| *,1 | Butterfly Network Inc. | 1,134,211 | 7,588 | |||
| * | ImmunityBio Inc. | 1,242,245 | 7,553 | |||
| * | Design Therapeutics Inc. | 347,590 | 7,442 | |||
| * | Sangamo Therapeutics Inc. | 910,145 | 6,826 | |||
| * | Phathom Pharmaceuticals Inc. | 343,463 | 6,756 | |||
| * | Hims & Hers Health Inc. | 992,813 | 6,503 | |||
| Shares | Market Value• ($000) | |||||
| * | Cullinan Oncology Inc. | 409,470 | 6,318 | |||
| * | Kinnate Biopharma Inc. | 341,287 | 6,048 | |||
| * | Precigen Inc. | 1,614,522 | 5,990 | |||
| * | Allakos Inc. | 593,965 | 5,815 | |||
| * | Signify Health Inc. Class A | 399,179 | 5,676 | |||
| * | LifeStance Health Group Inc. | 584,520 | 5,565 | |||
| * | Aveanna Healthcare Holdings Inc. | 719,234 | 5,322 | |||
| * | Singular Genomics Systems Inc. | 449,919 | 5,201 | |||
| * | Radius Health Inc. | 739,582 | 5,118 | |||
| * | 2seventy bio Inc. | 182,990 | 4,690 | |||
| *,1 | Erasca Inc. | 283,981 | 4,424 | |||
| *,1 | SmileDirectClub Inc. Class A | 1,768,122 | 4,155 | |||
| * | Generation Bio Co. | 577,859 | 4,091 | |||
| *,1 | Monte Rosa Therapeutics Inc. | 181,503 | 3,706 | |||
| * | Cytek Biosciences Inc. | 208,773 | 3,407 | |||
| * | Rubius Therapeutics Inc. | 350,965 | 3,397 | |||
| * | Natus Medical Inc. | 133,516 | 3,168 | |||
| * | Deciphera Pharmaceuticals Inc. | 319,965 | 3,126 | |||
| *,1 | Lyell Immunopharma Inc. | 375,389 | 2,905 | |||
| *,1 | 23andMe Holding Co. | 383,961 | 2,557 | |||
| * | Aerie Pharmaceuticals Inc. | 351,390 | 2,467 | |||
| *,1 | Olema Pharmaceuticals Inc. | 252,055 | 2,359 | |||
| * | Absci Corp. | 216,775 | 1,778 | |||
| *,1 | P3 Health Partners Inc. | 238,478 | 1,679 | |||
| * | Epizyme Inc. | 649,504 | 1,624 | |||
| * | Innovage Holding Corp. | 317,551 | 1,588 | |||
| * | Nkarta Inc. | 103,057 | 1,582 | |||
| * | Prelude Therapeutics Inc. | 111,977 | 1,394 | |||
| * | Vor BioPharma Inc. | 116,637 | 1,355 | |||
| * | PROCEPT BioRobotics Corp. | 51,850 | 1,297 | |||
| *,1 | Adagio Therapeutics Inc. | 130,410 | 947 | |||
| * | Eargo Inc. | 184,140 | 939 | |||
| *,2 | Alder Biopharmaceuticals Inc. CVR Exp. 12/31/24 | 1,054,451 | 928 | |||
| PerkinElmer Inc. | 1,177 | 237 | ||||
| * | Avantor Inc. | 5,224 | 220 | |||
| *,1 | Bright Health Group Inc. | 47,686 | 164 | |||
| *,1 | Cue Health Inc. | 9,658 | 130 | |||
| * | Multiplan Corp. | 3,522 | 16 | |||
| * | Orthofix Medical Inc. | 197 | 6 | |||
| * | Intercept Pharmaceuticals Inc. | 280 | 5 | |||
| * | Clovis Oncology Inc. | 1,247 | 3 | |||
| * | Day One Biopharmaceuticals Inc. | 96 | 2 | |||
| Shares | Market Value• ($000) | |||||
| * | Nuvalent Inc. Class A | 83 | 2 | |||
| *,2 | Wright Medical Group NV | 1,712 | — | |||
| 7,529,779 | ||||||
| Industrials (17.7%) | ||||||
| * | Trex Co. Inc. | 1,805,092 | 243,742 | |||
| Graco Inc. | 2,665,078 | 214,859 | ||||
| Nordson Corp. | 820,072 | 209,340 | ||||
| A O Smith Corp. | 2,088,185 | 179,271 | ||||
| * | Fair Isaac Corp. | 407,511 | 176,725 | |||
| Lennox International Inc. | 516,334 | 167,478 | ||||
| Toro Co. | 1,669,458 | 166,796 | ||||
| * | GXO Logistics Inc. | 1,799,141 | 163,416 | |||
| Watsco Inc. | 518,071 | 162,094 | ||||
| * | Axon Enterprise Inc. | 1,020,484 | 160,216 | |||
| * | Berry Global Group Inc. | 2,126,819 | 156,917 | |||
| Genpact Ltd. | 2,949,496 | 156,559 | ||||
| MKS Instruments Inc. | 869,907 | 151,512 | ||||
| * | WillScot Mobile Mini Holdings Corp. | 3,499,479 | 142,919 | |||
| * | Paylocity Holding Corp. | 604,104 | 142,665 | |||
| * | TopBuild Corp. | 516,336 | 142,462 | |||
| * | Saia Inc. | 413,114 | 139,232 | |||
| Littelfuse Inc. | 386,526 | 121,632 | ||||
| Advanced Drainage Systems Inc. | 838,243 | 114,110 | ||||
| Landstar System Inc. | 597,982 | 107,051 | ||||
| Eagle Materials Inc. | 638,091 | 106,217 | ||||
| * | Coherent Inc. | 385,007 | 102,620 | |||
| Cognex Corp. | 1,318,281 | 102,510 | ||||
| * | WEX Inc. | 703,622 | 98,781 | |||
| Jack Henry & Associates Inc. | 581,047 | 97,029 | ||||
| * | ASGN Inc. | 776,791 | 95,856 | |||
| Exponent Inc. | 817,945 | 95,479 | ||||
| Simpson Manufacturing Co. Inc. | 681,789 | 94,816 | ||||
| * | Euronet Worldwide Inc. | 788,300 | 93,942 | |||
| * | Chart Industries Inc. | 569,989 | 90,908 | |||
| * | AMN Healthcare Services Inc. | 742,050 | 90,775 | |||
| * | Middleby Corp. | 408,541 | 80,384 | |||
| * | AZEK Co. Inc. Class A | 1,698,127 | 78,521 | |||
| Maximus Inc. | 970,801 | 77,344 | ||||
| John Bean Technologies Corp. | 497,749 | 76,434 | ||||
| * | ExlService Holdings Inc. | 495,560 | 71,742 | |||
| BWX Technologies Inc. | 1,444,582 | 69,167 | ||||
| Insperity Inc. | 573,050 | 67,683 | ||||
| * | ACI Worldwide Inc. | 1,842,058 | 63,919 | |||
| *,1 | TuSimple Holdings Inc. Class A | 1,777,053 | 63,707 | |||
| * | TriNet Group Inc. | 618,276 | 58,897 | |||
| Franklin Electric Co. Inc. | 618,929 | 58,526 | ||||
| Aerojet Rocketdyne Holdings Inc. | 1,198,801 | 56,056 | ||||
| AAON Inc. | 657,568 | 52,231 | ||||
| Shares | Market Value• ($000) | |||||
| Installed Building Products Inc. | 372,618 | 52,062 | ||||
| Woodward Inc. | 469,749 | 51,419 | ||||
| Forward Air Corp. | 422,745 | 51,190 | ||||
| * | Mercury Systems Inc. | 888,325 | 48,911 | |||
| Badger Meter Inc. | 458,710 | 48,880 | ||||
| * | Itron Inc. | 710,045 | 48,652 | |||
| Helios Technologies Inc. | 457,345 | 48,099 | ||||
| * | Welbilt Inc. | 2,004,192 | 47,640 | |||
| * | Shift4 Payments Inc. Class A | 808,053 | 46,810 | |||
| * | Bloom Energy Corp. Class A | 2,085,617 | 45,738 | |||
| * | Vicor Corp. | 351,506 | 44,634 | |||
| * | Masonite International Corp. | 373,094 | 44,006 | |||
| Armstrong World Industries Inc. | 372,455 | 43,249 | ||||
| * | Virgin Galactic Holdings Inc. | 3,036,113 | 40,623 | |||
| * | Flywire Corp. | 1,006,078 | 38,291 | |||
| * | Hayward Holdings Inc. | 1,456,835 | 38,213 | |||
| * | Kratos Defense & Security Solutions Inc. | 1,946,480 | 37,762 | |||
| * | Verra Mobility Corp. Class A | 2,328,154 | 35,923 | |||
| Mueller Water Products Inc. Class A | 2,481,441 | 35,733 | ||||
| *,1 | Nikola Corp. | 3,175,944 | 31,347 | |||
| Herc Holdings Inc. | 197,848 | 30,973 | ||||
| * | Air Transport Services Group Inc. | 933,626 | 27,430 | |||
| Comfort Systems USA Inc. | 269,303 | 26,645 | ||||
| Lindsay Corp. | 172,487 | 26,218 | ||||
| * | TaskUS Inc. Class A | 428,105 | 23,101 | |||
| * | AeroVironment Inc. | 371,184 | 23,025 | |||
| Tennant Co. | 277,357 | 22,477 | ||||
| * | Proto Labs Inc. | 431,040 | 22,134 | |||
| * | CryoPort Inc. | 368,828 | 21,824 | |||
| * | Dycom Industries Inc. | 226,653 | 21,251 | |||
| * | FARO Technologies Inc. | 286,979 | 20,094 | |||
| * | Evo Payments Inc. Class A | 740,918 | 18,967 | |||
| * | Cimpress plc | 244,684 | 17,522 | |||
| * | Gibraltar Industries Inc. | 255,269 | 17,021 | |||
| *,1 | Desktop Metal Inc. Class A | 3,375,544 | 16,709 | |||
| Maxar Technologies Inc. | 539,241 | 15,924 | ||||
| * | Core & Main Inc. Class A | 500,312 | 15,179 | |||
| * | Ranpak Holdings Corp. Class A | 336,747 | 12,655 | |||
| *,1 | PureCycle Technologies Inc. | 1,269,416 | 12,148 | |||
| *,1 | Danimer Scientific Inc. | 1,331,661 | 11,346 | |||
| * | Forrester Research Inc. | 179,733 | 10,556 | |||
| Shares | Market Value• ($000) | |||||
| Enerpac Tool Group Corp. Class A | 478,472 | 9,703 | ||||
| * | CS Disco Inc. | 224,921 | 8,041 | |||
| * | Paymentus Holdings Inc. Class A | 219,533 | 7,679 | |||
| Gorman-Rupp Co. | 163,248 | 7,273 | ||||
| * | Mirion Technologies Inc. | 622,515 | 6,518 | |||
| * | BTRS Holdings Inc. Class A | 778,880 | 6,091 | |||
| *,1 | Latch Inc. | 777,570 | 5,886 | |||
| *,1 | Hyliion Holdings Corp. | 947,654 | 5,875 | |||
| * | Enovix Corp. | 169,973 | 4,637 | |||
| * | Thermon Group Holdings Inc. | 260,385 | 4,408 | |||
| * | Hillman Solutions Corp. | 366,102 | 3,936 | |||
| * | Payoneer Global Inc. | 529,780 | 3,894 | |||
| Pactiv Evergreen Inc. | 277,244 | 3,515 | ||||
| *,1 | View Inc. | 762,985 | 2,983 | |||
| * | Sterling Check Corp. | 110,090 | 2,258 | |||
| * | Proterra Inc. | 255,465 | 2,256 | |||
| *,1 | Velo3D Inc. | 285,776 | 2,232 | |||
| * | Joby Aviation Inc. | 235,549 | 1,719 | |||
| * | Bill.com Holdings Inc. | 1,015 | 253 | |||
| * | IHS Holding Ltd. | 14,074 | 198 | |||
| *,1 | Legalzoom.com Inc. | 7,903 | 127 | |||
| * | Remitly Global Inc. | 777 | 16 | |||
| * | ZipRecruiter Inc. Class A | 477 | 12 | |||
| * | American Woodmark Corp. | 83 | 5 | |||
| * | Velodyne Lidar Inc. | 1,028 | 5 | |||
| * | AvidXchange Holdings Inc. | 302 | 5 | |||
| 6,544,446 | ||||||
| Real Estate (8.3%) | ||||||
| Equity LifeStyle Properties Inc. | 2,593,552 | 227,351 | ||||
| CubeSmart | 3,398,094 | 193,386 | ||||
| Rexford Industrial Realty Inc. | 2,374,151 | 192,567 | ||||
| American Homes 4 Rent Class A | 4,186,935 | 182,592 | ||||
| CyrusOne Inc. | 1,989,933 | 178,537 | ||||
| Americold Realty Trust | 4,185,899 | 137,256 | ||||
| STORE Capital Corp. | 3,846,979 | 132,336 | ||||
| STAG Industrial Inc. | 2,745,238 | 131,662 | ||||
| American Campus Communities Inc. | 2,184,268 | 125,137 | ||||
| Healthcare Trust of America Inc. Class A | 3,465,619 | 115,717 | ||||
| Terreno Realty Corp. | 1,174,345 | 100,160 | ||||
| Innovative Industrial Properties Inc. | 375,489 | 98,720 | ||||
| * | Host Hotels & Resorts Inc. | 5,595,827 | 97,311 | |||
| Spirit Realty Capital Inc. | 1,933,425 | 93,172 | ||||
| Shares | Market Value• ($000) | |||||
| National Storage Affiliates Trust | 1,257,807 | 87,040 | ||||
| Lamar Advertising Co. Class A | 681,528 | 82,669 | ||||
| * | Ryman Hospitality Properties Inc. | 819,713 | 75,381 | |||
| Kite Realty Group Trust | 3,430,904 | 74,725 | ||||
| Hannon Armstrong Sustainable Infrastructure Capital Inc. | 1,326,570 | 70,467 | ||||
| * | Howard Hughes Corp. | 648,125 | 65,966 | |||
| Kilroy Realty Corp. | 912,886 | 60,670 | ||||
| * | Redfin Corp. | 1,570,179 | 60,279 | |||
| PS Business Parks Inc. | 324,099 | 59,689 | ||||
| Broadstone Net Lease Inc. | 2,401,736 | 59,611 | ||||
| Essential Properties Realty Trust Inc. | 1,905,840 | 54,945 | ||||
| Uniti Group Inc. | 3,701,962 | 51,864 | ||||
| Regency Centers Corp. | 672,097 | 50,643 | ||||
| eXp World Holdings Inc. | 1,042,423 | 35,119 | ||||
| St. Joe Co. | 509,558 | 26,523 | ||||
| Safehold Inc. | 311,630 | 24,884 | ||||
| Paramount Group Inc. | 2,944,452 | 24,557 | ||||
| Pebblebrook Hotel Trust | 1,036,808 | 23,193 | ||||
| * | Marcus & Millichap Inc. | 406,384 | 20,913 | |||
| CareTrust REIT Inc. | 757,940 | 17,304 | ||||
| Universal Health Realty Income Trust | 193,793 | 11,525 | ||||
| Alexander's Inc. | 15,975 | 4,158 | ||||
| * | Bridge Investment Group Holdings Inc. Class A | 147,463 | 3,682 | |||
| * | Offerpad Solutions Inc. | 348,746 | 2,232 | |||
| * | DigitalBridge Group Inc. | 5,180 | 43 | |||
| Phillips Edison & Co. Inc. | 210 | 7 | ||||
| 3,053,993 | ||||||
| Technology (21.8%) | ||||||
| Entegris Inc. | 2,124,475 | 294,410 | ||||
| * | Ceridian HCM Holding Inc. | 2,135,321 | 223,056 | |||
| * | Wolfspeed Inc. | 1,823,882 | 203,855 | |||
| * | PTC Inc. | 1,663,384 | 201,519 | |||
| * | Dynatrace Inc. | 3,128,818 | 188,824 | |||
| * | Avalara Inc. | 1,295,281 | 167,234 | |||
| * | Lattice Semiconductor Corp. | 2,147,254 | 165,467 | |||
| * | Aspen Technology Inc. | 1,049,514 | 159,736 | |||
| * | Manhattan Associates Inc. | 992,493 | 154,323 | |||
| * | Guidewire Software Inc. | 1,306,941 | 148,377 | |||
| * | Five9 Inc. | 1,067,581 | 146,600 | |||
| * | Smartsheet Inc. Class A | 1,878,278 | 145,473 | |||
| * | Pure Storage Inc. Class A | 4,248,170 | 138,278 | |||
| * | Elastic NV | 1,115,709 | 137,333 | |||
| * | Silicon Laboratories Inc. | 630,512 | 130,150 | |||
| Shares | Market Value• ($000) | |||||
| Azenta Inc. | 1,166,552 | 120,283 | ||||
| Vertiv Holdings Co. Class A | 4,713,158 | 117,688 | ||||
| * | II-VI Inc. | 1,665,513 | 113,804 | |||
| * | Ambarella Inc. | 546,717 | 110,923 | |||
| Universal Display Corp. | 665,631 | 109,849 | ||||
| * | Nutanix Inc. Class A | 3,316,919 | 105,677 | |||
| * | Anaplan Inc. | 2,179,927 | 99,950 | |||
| * | Rapid7 Inc. | 841,641 | 99,053 | |||
| * | Zendesk Inc. | 948,535 | 98,923 | |||
| Dolby Laboratories Inc. Class A | 1,021,396 | 97,257 | ||||
| * | Novanta Inc. | 530,896 | 93,613 | |||
| * | New Relic Inc. | 821,325 | 90,313 | |||
| * | Semtech Corp. | 1,011,019 | 89,910 | |||
| * | Asana Inc. Class A | 1,194,734 | 89,067 | |||
| * | Blackline Inc. | 828,583 | 85,791 | |||
| CMC Materials Inc. | 445,361 | 85,371 | ||||
| Power Integrations Inc. | 897,904 | 83,406 | ||||
| * | Workiva Inc. Class A | 637,865 | 83,235 | |||
| * | Digital Turbine Inc. | 1,362,278 | 83,085 | |||
| * | Varonis Systems Inc. | 1,681,543 | 82,026 | |||
| * | MaxLinear Inc. Class A | 1,084,150 | 81,734 | |||
| National Instruments Corp. | 1,860,169 | 81,234 | ||||
| * | SPS Commerce Inc. | 564,656 | 80,379 | |||
| * | Rogers Corp. | 293,999 | 80,262 | |||
| * | Ziff Davis Inc. | 719,165 | 79,727 | |||
| * | Tenable Holdings Inc. | 1,433,920 | 78,966 | |||
| * | Onto Innovation Inc. | 773,755 | 78,327 | |||
| * | Qualys Inc. | 547,370 | 75,110 | |||
| * | Procore Technologies Inc. | 930,235 | 74,391 | |||
| * | Diodes Inc. | 669,909 | 73,563 | |||
| Pegasystems Inc. | 639,858 | 71,549 | ||||
| * | Sailpoint Technologies Holdings Inc. | 1,461,197 | 70,634 | |||
| * | Fabrinet | 579,991 | 68,711 | |||
| * | DigitalOcean Holdings Inc. | 855,090 | 68,689 | |||
| * | Q2 Holdings Inc. | 845,782 | 67,189 | |||
| * | Perficient Inc. | 517,103 | 66,856 | |||
| * | SiTime Corp. | 225,373 | 65,931 | |||
| * | Envestnet Inc. | 813,277 | 64,525 | |||
| * | Mandiant Corp. | 3,572,318 | 62,658 | |||
| * | Upwork Inc. | 1,808,253 | 61,770 | |||
| * | Alarm.com Holdings Inc. | 706,077 | 59,882 | |||
| * | MACOM Technology Solutions Holdings Inc. | 763,592 | 59,789 | |||
| * | Box Inc. Class A | 2,256,023 | 59,085 | |||
| *,1 | Altair Engineering Inc. Class A | 756,242 | 58,473 | |||
| * | Alteryx Inc. Class A | 935,472 | 56,596 | |||
| * | FormFactor Inc. | 1,226,020 | 56,054 | |||
| * | Fastly Inc. Class A | 1,565,082 | 55,482 | |||
| Advanced Energy Industries Inc. | 590,575 | 53,778 | ||||
| Shares | Market Value• ($000) | |||||
| *,1 | MicroStrategy Inc. Class A | 97,977 | 53,347 | |||
| Switch Inc. Class A | 1,802,146 | 51,613 | ||||
| * | Cargurus Inc. Class A | 1,514,505 | 50,948 | |||
| * | nCino Inc. | 910,164 | 49,932 | |||
| * | LiveRamp Holdings Inc. | 1,013,947 | 48,619 | |||
| * | Sprout Social Inc. Class A | 535,896 | 48,600 | |||
| * | IPG Photonics Corp. | 271,604 | 46,754 | |||
| * | CommVault Systems Inc. | 678,090 | 46,734 | |||
| Shutterstock Inc. | 372,826 | 41,339 | ||||
| * | 3D Systems Corp. | 1,904,144 | 41,015 | |||
| * | Everbridge Inc. | 605,201 | 40,748 | |||
| * | Appian Corp. | 622,541 | 40,596 | |||
| * | Yelp Inc. Class A | 1,088,710 | 39,455 | |||
| * | Jamf Holding Corp. | 1,027,270 | 39,046 | |||
| * | Bottomline Technologies DE Inc. | 673,733 | 38,046 | |||
| * | Vimeo Inc. | 2,080,577 | 37,367 | |||
| * | PagerDuty Inc. | 1,067,188 | 37,085 | |||
| * | LivePerson Inc. | 1,000,111 | 35,724 | |||
| * | Magnite Inc. | 1,966,622 | 34,416 | |||
| * | Duck Creek Technologies Inc. | 1,140,785 | 34,349 | |||
| * | Zuora Inc. Class A | 1,812,511 | 33,858 | |||
| * | Appfolio Inc. Class A | 271,654 | 32,886 | |||
| * | Blackbaud Inc. | 378,609 | 29,903 | |||
| * | BigCommerce Holdings Inc. | 844,885 | 29,884 | |||
| * | DoubleVerify Holdings Inc. | 870,928 | 28,984 | |||
| * | Schrodinger Inc. | 825,064 | 28,737 | |||
| * | Ping Identity Holding Corp. | 1,185,346 | 27,121 | |||
| *,1 | E2open Parent Holdings Inc. | 2,124,264 | 23,919 | |||
| * | JFrog Ltd. | 758,716 | 22,534 | |||
| * | Veeco Instruments Inc. | 788,994 | 22,463 | |||
| * | Bumble Inc. Class A | 660,851 | 22,376 | |||
| * | PROS Holdings Inc. | 629,449 | 21,710 | |||
| * | Bandwidth Inc. Class A | 297,601 | 21,356 | |||
| * | Momentive Global Inc. | 996,253 | 21,071 | |||
| * | Eventbrite Inc. Class A | 1,205,116 | 21,017 | |||
| * | Vroom Inc. | 1,711,279 | 18,465 | |||
| * | Yext Inc. | 1,797,542 | 17,832 | |||
| * | Parsons Corp. | 479,264 | 16,127 | |||
| *,1 | Skillz Inc. Class A | 2,120,218 | 15,774 | |||
| * | nLight Inc. | 651,834 | 15,611 | |||
| * | CEVA Inc. | 340,965 | 14,743 | |||
| * | Amplitude Inc. Class A | 273,570 | 14,483 | |||
| * | Consensus Cloud Solutions Inc. | 248,506 | 14,381 | |||
| * | PubMatic Inc. Class A | 408,690 | 13,916 | |||
| * | Thoughtworks Holding Inc. | 476,378 | 12,772 | |||
| * | Telos Corp. | 730,040 | 11,257 | |||
| * | Alkami Technology Inc. | 550,130 | 11,036 | |||
| Shares | Market Value• ($000) | |||||
| * | ON24 Inc. | 594,406 | 10,313 | |||
| *,1 | Datto Holding Corp. | 382,457 | 10,078 | |||
| * | Informatica Inc. Class A | 269,054 | 9,950 | |||
| * | Sumo Logic Inc. | 732,720 | 9,936 | |||
| * | SEMrush Holdings Inc. Class A | 386,301 | 8,054 | |||
| * | Paycor HCM Inc. | 272,153 | 7,841 | |||
| * | Clear Secure Inc. Class A | 231,872 | 7,274 | |||
| * | KnowBe4 Inc. Class A | 305,971 | 7,019 | |||
| * | Aeva Technologies Inc. | 919,312 | 6,950 | |||
| *,1 | Samsara Inc. Class A | 218,506 | 6,142 | |||
| * | Freshworks Inc. Class A | 228,632 | 6,004 | |||
| Ebix Inc. | 193,371 | 5,878 | ||||
| * | N-able Inc. | 489,305 | 5,431 | |||
| * | MediaAlpha Inc. Class A | 338,563 | 5,227 | |||
| * | Xometry Inc. Class A | 97,894 | 5,017 | |||
| * | Ouster Inc. | 938,790 | 4,882 | |||
| * | Braze Inc. Class A | 61,867 | 4,774 | |||
| 1 | Vivid Seats Inc. Class A | 420,360 | 4,573 | |||
| *,1 | ForgeRock Inc. Class A | 167,880 | 4,481 | |||
| * | Sprinklr Inc. Class A | 264,827 | 4,203 | |||
| * | MeridianLink Inc. | 188,460 | 4,067 | |||
| *,1 | IonQ Inc. | 225,247 | 3,762 | |||
| * | Intapp Inc. | 142,822 | 3,593 | |||
| * | Vertex Inc. Class A | 222,907 | 3,538 | |||
| * | Expensify Inc. Class A | 78,911 | 3,472 | |||
| * | Enfusion Inc. Class A | 155,911 | 3,265 | |||
| * | Zeta Global Holdings Corp. Class A | 373,722 | 3,147 | |||
| *,1 | Matterport Inc. | 141,894 | 2,929 | |||
| * | CCC Intelligent Solutions Holdings Inc. | 235,446 | 2,682 | |||
| *,1 | Nextdoor Holdings Inc. | 312,718 | 2,467 | |||
| * | SecureWorks Corp. Class A | 143,814 | 2,297 | |||
| * | SmartRent Inc. Class A | 227,136 | 2,199 | |||
| * | Viant Technology Inc. Class A | 203,492 | 1,975 | |||
| * | WM Technology Inc. | 260,713 | 1,559 | |||
| * | AvePoint Inc. | 212,521 | 1,337 | |||
| *,1 | BuzzFeed Inc. | 203,943 | 1,087 | |||
| *,1 | NerdWallet Inc. Class A | 53,636 | 834 | |||
| * | ON Semiconductor Corp. | 2,262 | 154 | |||
| * | EngageSmart Inc. | 6,174 | 149 | |||
| * | UserTesting Inc. | 7,782 | 65 | |||
| CDK Global Inc. | 1,273 | 53 | ||||
| *,2 | Media General Inc. CVR | 1,362,047 | 53 | |||
| * | EverCommerce Inc. | 2,380 | 37 | |||
| * | Confluent Inc. Class A | 293 | 22 | |||
| * | Rackspace Technology Inc. | 328 | 4 | |||
| * | Couchbase Inc. | 83 | 2 | |||
| 8,053,928 | ||||||
| Telecommunications (1.8%) | ||||||
| * | Ciena Corp. | 2,429,544 | 187,002 | |||
| Shares | Market Value• ($000) | |||||
| Cable One Inc. | 90,092 | 158,873 | ||||
| * | Lumentum Holdings Inc. | 1,077,707 | 113,989 | |||
| Cogent Communications Holdings Inc. | 672,877 | 49,241 | ||||
| * | Viasat Inc. | 1,094,175 | 48,734 | |||
| * | Calix Inc. | 425,436 | 34,022 | |||
| * | Infinera Corp. | 2,822,513 | 27,068 | |||
| * | WideOpenWest Inc. | 817,052 | 17,583 | |||
| *,1 | Globalstar Inc. | 14,006,322 | 16,247 | |||
| Shenandoah Telecommunications Co. | 370,778 | 9,455 | ||||
| ATN International Inc. | 160,667 | 6,419 | ||||
| *,1 | Gogo Inc. | 386,517 | 5,229 | |||
| * | fuboTV Inc. | 1,269 | 20 | |||
| 673,882 | ||||||
| Utilities (1.3%) | ||||||
| * | Sunrun Inc. | 3,088,959 | 105,951 | |||
| * | Evoqua Water Technologies Corp. | 1,892,797 | 88,488 | |||
| * | Clean Harbors Inc. | 767,005 | 76,524 | |||
| * | Casella Waste Systems Inc. Class A | 789,768 | 67,462 | |||
| Ormat Technologies Inc. | 702,404 | 55,701 | ||||
| * | Sunnova Energy International Inc. | 1,409,862 | 39,364 | |||
| California Water Service Group | 413,543 | 29,717 | ||||
| Clearway Energy Inc. Class C | 643,000 | 23,167 | ||||
| Clearway Energy Inc. Class A | 270,096 | 9,043 | ||||
| * | Archaea Energy Inc. | 188,139 | 3,439 | |||
| 498,856 | ||||||
| Total Common Stocks (Cost $26,901,648) | 36,810,686 | |||||
| Shares | Market Value• ($000) | |||||
| Temporary Cash Investments (1.7%) | ||||||
| Money Market Fund (1.7%) | ||||||
| 3,4 | Vanguard Market Liquidity Fund, 0.090% (Cost $630,843) | 6,309,692 | 630,906 | |||
| Total Investments (101.4%) (Cost $27,532,491) | 37,441,592 | |||||
| Other Assets and Liabilities—Net (-1.4%) | (513,579) | |||||
| Net Assets (100%) | 36,928,013 | |||||
| Cost is in $000. | |
| • | See Note A in Notes to Financial Statements. |
| * | Non-income-producing security. |
| 1 | Includes partial security positions on loan to broker-dealers. The total value of securities on loan is $467,050,000. |
| 2 | Security value determined using significant unobservable inputs. |
| 3 | Affiliated money market fund available only to Vanguard funds and certain trusts and accounts managed by Vanguard. Rate shown is the 7-day yield. |
| 4 | Collateral of $500,798,000 was received for securities on loan, of which $499,409,000 is held in Vanguard Market Liquidity Fund and $1,389,000 is held in cash. |
| CVR—Contingent Value Rights. | |
| REIT—Real Estate Investment Trust. |
| Futures Contracts | ||||
| ($000) | ||||
| Expiration | Number of Long (Short) Contracts | Notional Amount | Value and Unrealized Appreciation (Depreciation) | |
| Long Futures Contracts | ||||
| E-mini Russell 2000 Index | March 2022 | 860 | 96,440 | 2,262 |
| Over-the-Counter Total Return Swaps | ||||||
| Reference Entity | Termination Date | Counterparty | Notional Amount ($000) | Floating Interest Rate Received (Paid)1 (%) | Value and Unrealized Appreciation ($000) | Value and Unrealized (Depreciation) ($000) |
| Bandwidth Inc. Class A | 8/31/22 | BOANA | 3,583 | (0.521) | 3 | — |
| Beyond Meat Inc. | 8/31/22 | BOANA | 16,862 | (0.071) | — | (1,225) |
| Elastic NV | 8/31/22 | BOANA | 6,218 | (0.069) | — | (1,295) |
| Invitae Corp. | 8/31/22 | BOANA | 6,120 | (0.070) | — | (623) |
| Middleby Corp. | 8/31/22 | BOANA | 4,891 | (0.072) | 618 | — |
| Novocure Ltd. | 8/31/22 | BOANA | 16,855 | (0.070) | — | (3,342) |
| 621 | (6,485) | |||||
| 1 | Based on USD Overnight Bank Funding Rate as of the most recent payment date. Floating interest payment received/paid monthly. |
| BOANA—Bank of America, N.A. |
| ($000s, except shares and per-share amounts) | Amount |
| Assets | |
| Investments in Securities, at Value | |
| Unaffiliated Issuers (Cost $26,901,648) | 36,810,686 |
| Affiliated Issuers (Cost $630,843) | 630,906 |
| Total Investments in Securities | 37,441,592 |
| Investment in Vanguard | 1,195 |
| Cash | 23,212 |
| Cash Collateral Pledged—Futures Contracts | 5,610 |
| Cash Collateral Pledged—Over-the-Counter Swap Contracts | 4,210 |
| Receivables for Investment Securities Sold | 399 |
| Receivables for Accrued Income | 17,329 |
| Receivables for Capital Shares Issued | 12,901 |
| Unrealized Appreciation—Over-the-Counter Swap Contracts | 621 |
| Total Assets | 37,507,069 |
| Liabilities | |
| Payables for Investment Securities Purchased | 19,756 |
| Collateral for Securities on Loan | 500,798 |
| Payables for Capital Shares Redeemed | 50,727 |
| Payables to Vanguard | 1,114 |
| Variation Margin Payable—Futures Contracts | 176 |
| Unrealized Depreciation—Over-the-Counter Swap Contracts | 6,485 |
| Total Liabilities | 579,056 |
| Net Assets | 36,928,013 |
| Statement of Assets and Liabilities (continued) | |
| At December 31, 2021, net assets consisted of: | |
| ($000s, except shares and per-share amounts) | Amount |
| Paid-in Capital | 29,157,031 |
| Total Distributable Earnings (Loss) | 7,770,982 |
| Net Assets | 36,928,013 |
| Investor Shares—Net Assets | |
| Applicable to 1,883,127 outstanding $.001 par value shares of beneficial interest (unlimited authorization) | 149,154 |
| Net Asset Value Per Share—Investor Shares | $79.21 |
| ETF Shares—Net Assets | |
| Applicable to 58,163,189 outstanding $.001 par value shares of beneficial interest (unlimited authorization) | 16,379,249 |
| Net Asset Value Per Share—ETF Shares | $281.61 |
| Admiral Shares—Net Assets | |
| Applicable to 167,596,579 outstanding $.001 par value shares of beneficial interest (unlimited authorization) | 16,594,188 |
| Net Asset Value Per Share—Admiral Shares | $99.01 |
| Institutional Shares—Net Assets | |
| Applicable to 47,991,344 outstanding $.001 par value shares of beneficial interest (unlimited authorization) | 3,805,422 |
| Net Asset Value Per Share—Institutional Shares | $79.29 |
| Year Ended December 31, 2021 | |
| ($000) | |
| Investment Income | |
| Income | |
| Dividends | 179,901 |
| Interest1 | 71 |
| Securities Lending—Net | 13,715 |
| Total Income | 193,687 |
| Expenses | |
| The Vanguard Group—Note B | |
| Investment Advisory Services | 2,787 |
| Management and Administrative—Investor Shares | 320 |
| Management and Administrative—ETF Shares | 8,552 |
| Management and Administrative—Admiral Shares | 9,750 |
| Management and Administrative—Institutional Shares | 1,782 |
| Marketing and Distribution—Investor Shares | 14 |
| Marketing and Distribution—ETF Shares | 721 |
| Marketing and Distribution—Admiral Shares | 618 |
| Marketing and Distribution—Institutional Shares | 120 |
| Custodian Fees | 243 |
| Auditing Fees | 38 |
| Shareholders’ Reports—Investor Shares | 1 |
| Shareholders’ Reports—ETF Shares | 546 |
| Shareholders’ Reports—Admiral Shares | 207 |
| Shareholders’ Reports—Institutional Shares | 106 |
| Trustees’ Fees and Expenses | 12 |
| Total Expenses | 25,817 |
| Net Investment Income | 167,870 |
| Realized Net Gain (Loss) | |
| Investment Securities Sold1,2 | 4,313,004 |
| Futures Contracts | 1,101 |
| Swap Contracts | (42,187) |
| Realized Net Gain (Loss) | 4,271,918 |
| Statement of Operations (continued) | |
| Year Ended December 31, 2021 | |
| ($000) | |
| Change in Unrealized Appreciation (Depreciation) | |
| Investment Securities1 | (2,563,125) |
| Futures Contracts | 1,686 |
| Swap Contracts | (5,348) |
| Change in Unrealized Appreciation (Depreciation) | (2,566,787) |
| Net Increase (Decrease) in Net Assets Resulting from Operations | 1,873,001 |
| 1 | Interest income, realized net gain (loss), capital gain distributions received, and change in unrealized appreciation (depreciation) from an affiliated company of the fund were $71,000, ($38,000), $3,000, and ($32,000), respectively. Purchases and sales are for temporary cash investment purposes. |
| 2 | Includes $3,994,735,000 of net gain (loss) resulting from in-kind redemptions. |
| Year Ended December 31, | ||
| 2021 ($000) | 2020 ($000) | |
| Increase (Decrease) in Net Assets | ||
| Operations | ||
| Net Investment Income | 167,870 | 144,245 |
| Realized Net Gain (Loss) | 4,271,918 | 2,982,774 |
| Change in Unrealized Appreciation (Depreciation) | (2,566,787) | 5,875,892 |
| Net Increase (Decrease) in Net Assets Resulting from Operations | 1,873,001 | 9,002,911 |
| Distributions | ||
| Investor Shares | (401) | (736) |
| ETF Shares | (57,438) | (61,658) |
| Admiral Shares | (61,028) | (72,055) |
| Institutional Shares | (14,238) | (17,057) |
| Total Distributions | (133,105) | (151,506) |
| Capital Share Transactions | ||
| Investor Shares | (71,356) | (12,462) |
| ETF Shares | 1,267,326 | 850,058 |
| Admiral Shares | (412,500) | (644,807) |
| Institutional Shares | (65,864) | (513,761) |
| Net Increase (Decrease) from Capital Share Transactions | 717,606 | (320,972) |
| Total Increase (Decrease) | 2,457,502 | 8,530,433 |
| Net Assets | ||
| Beginning of Period | 34,470,511 | 25,940,078 |
| End of Period | 36,928,013 | 34,470,511 |
| Investor Shares | |||||
| For a Share Outstanding Throughout Each Period | Year Ended December 31, | ||||
| 2021 | 2020 | 2019 | 2018 | 2017 | |
| Net Asset Value, Beginning of Period | $75.20 | $55.89 | $42.36 | $45.24 | $37.43 |
| Investment Operations | |||||
| Net Investment Income1 | .257 | .241 | .178 | .274 | .315 |
| Net Realized and Unrealized Gain (Loss) on Investments | 3.938 | 19.331 | 13.617 | (2.879) | 7.814 |
| Total from Investment Operations | 4.195 | 19.572 | 13.795 | (2.605) | 8.129 |
| Distributions | |||||
| Dividends from Net Investment Income | (.185) | (.262) | (.265) | (.275) | (.319) |
| Distributions from Realized Capital Gains | — | — | — | — | — |
| Total Distributions | (.185) | (.262) | (.265) | (.275) | (.319) |
| Net Asset Value, End of Period | $79.21 | $75.20 | $55.89 | $42.36 | $45.24 |
| Total Return2 | 5.58% | 35.12% | 32.60% | -5.80% | 21.78% |
| Ratios/Supplemental Data | |||||
| Net Assets, End of Period (Millions) | $149 | $209 | $171 | $1,461 | $1,816 |
| Ratio of Total Expenses to Average Net Assets | 0.19% | 0.19% | 0.19% | 0.19% | 0.19% |
| Ratio of Net Investment Income to Average Net Assets | 0.32% | 0.42% | 0.35% | 0.58% | 0.78% |
| Portfolio Turnover Rate3 | 29% | 24% | 18% | 22% | 19% |
| 1 | Calculated based on average shares outstanding. |
| 2 | Total returns do not include account service fees that may have applied in the periods shown. Fund prospectuses provide information about any applicable account service fees. |
| 3 | Excludes the value of portfolio securities received or delivered as a result of in-kind purchases or redemptions of the fund’s capital shares, including ETF Creation Units. |
| ETF Shares | |||||
| For a Share Outstanding Throughout Each Period | Year Ended December 31, | ||||
| 2021 | 2020 | 2019 | 2018 | 2017 | |
| Net Asset Value, Beginning of Period | $267.36 | $198.68 | $150.57 | $160.81 | $133.07 |
| Investment Operations | |||||
| Net Investment Income1 | 1.291 | 1.129 | 1.175 | 1.214 | 1.320 |
| Net Realized and Unrealized Gain (Loss) on Investments | 13.975 | 68.729 | 48.077 | (10.263) | 27.731 |
| Total from Investment Operations | 15.266 | 69.858 | 49.252 | (9.049) | 29.051 |
| Distributions | |||||
| Dividends from Net Investment Income | (1.016) | (1.178) | (1.142) | (1.191) | (1.311) |
| Distributions from Realized Capital Gains | — | — | — | — | — |
| Total Distributions | (1.016) | (1.178) | (1.142) | (1.191) | (1.311) |
| Net Asset Value, End of Period | $281.61 | $267.36 | $198.68 | $150.57 | $160.81 |
| Total Return | 5.71% | 35.29% | 32.75% | -5.68% | 21.90% |
| Ratios/Supplemental Data | |||||
| Net Assets, End of Period (Millions) | $16,379 | $14,436 | $9,833 | $7,286 | $6,981 |
| Ratio of Total Expenses to Average Net Assets | 0.07% | 0.07% | 0.07% | 0.07% | 0.07% |
| Ratio of Net Investment Income to Average Net Assets | 0.45% | 0.55% | 0.64% | 0.70% | 0.90% |
| Portfolio Turnover Rate2 | 29% | 24% | 18% | 22% | 19% |
| 1 | Calculated based on average shares outstanding. |
| 2 | Excludes the value of portfolio securities received or delivered as a result of in-kind purchases or redemptions of the fund’s capital shares, including ETF Creation Units. |
| Admiral Shares | |||||
| For a Share Outstanding Throughout Each Period | Year Ended December 31, | ||||
| 2021 | 2020 | 2019 | 2018 | 2017 | |
| Net Asset Value, Beginning of Period | $94.02 | $69.87 | $52.95 | $56.55 | $46.79 |
| Investment Operations | |||||
| Net Investment Income1 | .448 | .392 | .419 | .423 | .465 |
| Net Realized and Unrealized Gain (Loss) on Investments | 4.899 | 24.172 | 16.902 | (3.605) | 9.755 |
| Total from Investment Operations | 5.347 | 24.564 | 17.321 | (3.182) | 10.220 |
| Distributions | |||||
| Dividends from Net Investment Income | (.357) | (.414) | (.401) | (.418) | (.460) |
| Distributions from Realized Capital Gains | — | — | — | — | — |
| Total Distributions | (.357) | (.414) | (.401) | (.418) | (.460) |
| Net Asset Value, End of Period | $99.01 | $94.02 | $69.87 | $52.95 | $56.55 |
| Total Return2 | 5.69% | 35.30% | 32.76% | -5.68% | 21.92% |
| Ratios/Supplemental Data | |||||
| Net Assets, End of Period (Millions) | $16,594 | $16,149 | $12,717 | $8,560 | $8,729 |
| Ratio of Total Expenses to Average Net Assets | 0.07% | 0.07% | 0.07% | 0.07% | 0.07% |
| Ratio of Net Investment Income to Average Net Assets | 0.45% | 0.54% | 0.65% | 0.70% | 0.90% |
| Portfolio Turnover Rate3 | 29% | 24% | 18% | 22% | 19% |
| 1 | Calculated based on average shares outstanding. |
| 2 | Total returns do not include account service fees that may have applied in the periods shown. Fund prospectuses provide information about any applicable account service fees. |
| 3 | Excludes the value of portfolio securities received or delivered as a result of in-kind purchases or redemptions of the fund’s capital shares, including ETF Creation Units. |
| Institutional Shares | |||||
| For a Share Outstanding Throughout Each Period | Year Ended December 31, | ||||
| 2021 | 2020 | 2019 | 2018 | 2017 | |
| Net Asset Value, Beginning of Period | $75.29 | $55.95 | $42.40 | $45.29 | $37.47 |
| Investment Operations | |||||
| Net Investment Income1 | .367 | .319 | .327 | .335 | .375 |
| Net Realized and Unrealized Gain (Loss) on Investments | 3.927 | 19.358 | 13.550 | (2.886) | 7.818 |
| Total from Investment Operations | 4.294 | 19.677 | 13.877 | (2.551) | 8.193 |
| Distributions | |||||
| Dividends from Net Investment Income | (.294) | (.337) | (.327) | (.339) | (.373) |
| Distributions from Realized Capital Gains | — | — | — | — | — |
| Total Distributions | (.294) | (.337) | (.327) | (.339) | (.373) |
| Net Asset Value, End of Period | $79.29 | $75.29 | $55.95 | $42.40 | $45.29 |
| Total Return | 5.70% | 35.31% | 32.77% | -5.69% | 21.94% |
| Ratios/Supplemental Data | |||||
| Net Assets, End of Period (Millions) | $3,805 | $3,676 | $3,218 | $2,858 | $3,690 |
| Ratio of Total Expenses to Average Net Assets | 0.06% | 0.06% | 0.06% | 0.06% | 0.06% |
| Ratio of Net Investment Income to Average Net Assets | 0.46% | 0.55% | 0.64% | 0.71% | 0.91% |
| Portfolio Turnover Rate2 | 29% | 24% | 18% | 22% | 19% |
| 1 | Calculated based on average shares outstanding. |
| 2 | Excludes the value of portfolio securities received or delivered as a result of in-kind purchases or redemptions of the fund’s capital shares, including ETF Creation Units. |
| A. | The following significant accounting policies conform to generally accepted accounting principles for U.S. investment companies. The fund consistently follows such policies in preparing its financial statements. |
| B. | In accordance with the terms of a Funds’ Service Agreement (the “FSA”) between Vanguard and the fund, Vanguard furnishes to the fund investment advisory, corporate management, administrative, marketing, and distribution services at Vanguard’s cost of operations (as defined by the FSA). These costs of operations are allocated to the fund based on methods and guidelines approved by the board of trustees and are generally settled twice a month. |
| C. | Various inputs may be used to determine the value of the fund’s investments and derivatives. These inputs are summarized in three broad levels for financial statement purposes. The inputs or methodologies used to value securities are not necessarily an indication of the risk associated with investing in those securities. |
| Level 1 ($000) | Level 2 ($000) | Level 3 ($000) | Total ($000) | |
| Investments | ||||
| Assets | ||||
| Common Stocks | 36,809,705 | — | 981 | 36,810,686 |
| Temporary Cash Investments | 630,906 | — | — | 630,906 |
| Total | 37,440,611 | — | 981 | 37,441,592 |
| Derivative Financial Instruments | ||||
| Assets | ||||
| Futures Contracts1 | 2,262 | — | — | 2,262 |
| Swap Contracts | — | 621 | — | 621 |
| Total | 2,262 | 621 | — | 2,883 |
| Liabilities | ||||
| Swap Contracts | — | 6,485 | — | 6,485 |
| 1 | Includes cumulative appreciation (depreciation) on futures contracts and centrally cleared swaps, if any, as reported in the Schedule of Investments. Only current day’s variation margin is reported within the Statement of Assets and Liabilities. |
| D. | Permanent differences between book-basis and tax-basis components of net assets are reclassified among capital accounts in the financial statements to reflect their tax character. These reclassifications have no effect on net assets or net asset value per share. As of period end, permanent differences primarily attributable to the accounting for in-kind redemptions and swap agreements were reclassified between the following accounts: |
| Amount ($000) | |
| Paid-in Capital | 3,993,663 |
| Total Distributable Earnings (Loss) | (3,993,663) |
| Amount ($000) | |
| Undistributed Ordinary Income | — |
| Undistributed Long-Term Gains | — |
| Capital Loss Carryforwards | (2,052,247) |
| Qualified Late-Year Losses | (17,737) |
| Net Unrealized Gains (Losses) | 9,840,966 |
| Year Ended December 31, | ||
| 2021 Amount ($000) | 2020 Amount ($000) | |
| Ordinary Income* | 133,105 | 151,506 |
| Long-Term Capital Gains | — | — |
| Total | 133,105 | 151,506 |
| * | Includes short-term capital gains, if any. |
| Amount ($000) | |
| Tax Cost | 27,600,626 |
| Gross Unrealized Appreciation | 12,923,171 |
| Gross Unrealized Depreciation | (3,082,205) |
| Net Unrealized Appreciation (Depreciation) | 9,840,966 |
| E. | During the year ended December 31, 2021, the fund purchased $18,030,133,000 of investment securities and sold $17,357,577,000 of investment securities, other than temporary cash investments. Purchases and sales include $7,085,828,000 and $6,878,029,000, respectively, in connection with in-kind purchases and redemptions of the fund’s capital shares. |
| F. | Capital share transactions for each class of shares were: |
| Year Ended December 31, | |||||
| 2021 | 2020 | ||||
| Amount ($000) | Shares (000) | Amount ($000) | Shares (000) | ||
| Investor Shares | |||||
| Issued | 27,595 | 344 | 34,870 | 559 | |
| Issued in Lieu of Cash Distributions | 401 | 5 | 736 | 12 | |
| Redeemed | (99,352) | (1,245) | (48,068) | (856) | |
| Net Increase (Decrease)—Investor Shares | (71,356) | (896) | (12,462) | (285) | |
| Year Ended December 31, | |||||
| 2021 | 2020 | ||||
| Amount ($000) | Shares (000) | Amount ($000) | Shares (000) | ||
| ETF Shares | |||||
| Issued | 8,232,657 | 28,868 | 6,364,154 | 29,978 | |
| Issued in Lieu of Cash Distributions | — | — | — | — | |
| Redeemed | (6,965,331) | (24,700) | (5,514,096) | (25,475) | |
| Net Increase (Decrease)—ETF Shares | 1,267,326 | 4,168 | 850,058 | 4,503 | |
| Admiral Shares | |||||
| Issued | 2,933,136 | 29,431 | 2,496,750 | 35,213 | |
| Issued in Lieu of Cash Distributions | 54,667 | 553 | 65,017 | 860 | |
| Redeemed | (3,400,303) | (34,161) | (3,206,574) | (46,325) | |
| Net Increase (Decrease)—Admiral Shares | (412,500) | (4,177) | (644,807) | (10,252) | |
| Institutional Shares | |||||
| Issued | 721,080 | 9,029 | 658,957 | 11,461 | |
| Issued in Lieu of Cash Distributions | 13,272 | 168 | 15,526 | 256 | |
| Redeemed | (800,216) | (10,031) | (1,188,244) | (20,410) | |
| Net Increase (Decrease)—Institutional Shares | (65,864) | (834) | (513,761) | (8,693) | |
| G. | Management has determined that no events or transactions occurred subsequent to December 31, 2021, that would require recognition or disclosure in these financial statements. |

| Average Annual Total Returns Periods Ended December 31, 2021 | |||||
| One Year | Five Years | Ten Years | Final Value of a $10,000 Investment | ||
| Small-Cap Value Index Fund Investor Shares | 27.96% | 10.18% | 13.15% | $34,409 |
| Spliced Small-Cap Value Index | 28.15 | 10.30 | 13.31 | 34,897 |
| Dow Jones U.S. Total Stock Market Float Adjusted Index | 25.66 | 17.92 | 16.24 | 45,050 |
| One Year | Five Years | Ten Years | Final Value of a $10,000 Investment | ||
| Small-Cap Value Index Fund ETF Shares Net Asset Value | 28.07% | 10.30% | 13.29% | $34,834 | |
| Small-Cap Value Index Fund ETF Shares Market Price | 28.00 | 10.30 | 13.29 | 34,830 | |
| Spliced Small-Cap Value Index | 28.15 | 10.30 | 13.31 | 34,897 | |
| Dow Jones U.S. Total Stock Market Float Adjusted Index | 25.66 | 17.92 | 16.24 | 45,050 | |
| Average Annual Total Returns Periods Ended December 31, 2021 | |||||
| One Year | Five Years | Ten Years | Final Value of a $10,000 Investment | ||
| Small-Cap Value Index Fund Admiral Shares | 28.09% | 10.31% | 13.30% | $34,844 | |
| Spliced Small-Cap Value Index | 28.15 | 10.30 | 13.31 | 34,897 | |
| Dow Jones U.S. Total Stock Market Float Adjusted Index | 25.66 | 17.92 | 16.24 | 45,050 | |
| One Year | Five Years | Ten Years | Final Value of a $5,000,000 Investment | ||
| Small-Cap Value Index Fund Institutional Shares | 28.11% | 10.32% | 13.31% | $17,439,944 | |
| Spliced Small-Cap Value Index | 28.15 | 10.30 | 13.31 | 17,448,286 | |
| Dow Jones U.S. Total Stock Market Float Adjusted Index | 25.66 | 17.92 | 16.24 | 22,525,162 | |
| Cumulative Returns of ETF Shares: December 31, 2011, Through December 31, 2021 | |||
| One Year | Five Years | Ten Years | |
| Small-Cap Value Index Fund ETF Shares Market Price | 28.00% | 63.28% | 248.30% |
| Small-Cap Value Index Fund ETF Shares Net Asset Value | 28.07 | 63.26 | 248.34 |
| Spliced Small-Cap Value Index | 28.15 | 63.23 | 248.97 |
| Basic Materials | 5.9% |
| Consumer Discretionary | 15.1 |
| Consumer Staples | 3.1 |
| Energy | 5.3 |
| Financials | 22.1 |
| Health Care | 5.3 |
| Industrials | 20.5 |
| Real Estate | 10.3 |
| Technology | 6.7 |
| Telecommunications | 1.4 |
| Utilities | 4.3 |
| Shares | Market Value• ($000) | |||||
| Common Stocks (99.7%) | ||||||
| Basic Materials (5.9%) | ||||||
| Mosaic Co. | 5,915,237 | 232,410 | ||||
| Steel Dynamics Inc. | 3,010,740 | 186,877 | ||||
| Alcoa Corp. | 2,987,905 | 178,019 | ||||
| Reliance Steel & Aluminum Co. | 1,000,548 | 162,309 | ||||
| * | Cleveland-Cliffs Inc. | 7,187,504 | 156,472 | |||
| Olin Corp. | 2,290,657 | 131,759 | ||||
| CF Industries Holdings Inc. | 1,712,534 | 121,213 | ||||
| Huntsman Corp. | 3,133,714 | 109,304 | ||||
| Valvoline Inc. | 2,875,060 | 107,211 | ||||
| Scotts Miracle-Gro Co. | 616,574 | 99,268 | ||||
| United States Steel Corp. | 3,883,872 | 92,475 | ||||
| Ashland Global Holdings Inc. | 817,042 | 87,963 | ||||
| Chemours Co. | 2,602,473 | 87,339 | ||||
| UFP Industries Inc. | 938,883 | 86,387 | ||||
| Avient Corp. | 1,461,080 | 81,747 | ||||
| Element Solutions Inc. | 3,359,665 | 81,573 | ||||
| * | Univar Solutions Inc. | 2,730,072 | 77,397 | |||
| Timken Co. | 1,090,336 | 75,549 | ||||
| Commercial Metals Co. | 1,941,740 | 70,466 | ||||
| Sensient Technologies Corp. | 671,137 | 67,154 | ||||
| Mueller Industries Inc. | 870,281 | 51,660 | ||||
| Cabot Corp. | 905,892 | 50,911 | ||||
| * | Arconic Corp. | 1,530,567 | 50,524 | |||
| Hecla Mining Co. | 8,593,793 | 44,860 | ||||
| Boise Cascade Co. | 628,076 | 44,719 | ||||
| Tronox Holdings plc Class A | 1,842,887 | 44,285 | ||||
| Stepan Co. | 340,086 | 42,269 | ||||
| Minerals Technologies Inc. | 531,707 | 38,894 | ||||
| GrafTech International Ltd. | 3,150,834 | 37,274 | ||||
| Innospec Inc. | 393,640 | 35,561 | ||||
| Materion Corp. | 326,399 | 30,009 | ||||
| Shares | Market Value• ($000) | |||||
| Compass Minerals International Inc. | 543,591 | 27,767 | ||||
| Worthington Industries Inc. | 484,374 | 26,476 | ||||
| * | GCP Applied Technologies Inc. | 821,749 | 26,017 | |||
| Westlake Chemical Corp. | 255,167 | 24,784 | ||||
| Kaiser Aluminum Corp. | 253,324 | 23,797 | ||||
| * | Kraton Corp. | 487,721 | 22,591 | |||
| Carpenter Technology Corp. | 769,564 | 22,463 | ||||
| Schnitzer Steel Industries Inc. Class A | 392,818 | 20,395 | ||||
| * | Coeur Mining Inc. | 3,693,178 | 18,614 | |||
| Schweitzer-Mauduit International Inc. | 502,433 | 15,023 | ||||
| Glatfelter Corp. | 711,158 | 12,232 | ||||
| * | Koppers Holdings Inc. | 323,275 | 10,118 | |||
| Ecovyst Inc. | 985,218 | 10,089 | ||||
| Tredegar Corp. | 248 | 3 | ||||
| 3,024,227 | ||||||
| Consumer Discretionary (15.0%) | ||||||
| Williams-Sonoma Inc. | 1,170,975 | 198,047 | ||||
| Tapestry Inc. | 4,393,961 | 178,395 | ||||
| Service Corp. International | 2,501,810 | 177,603 | ||||
| * | Capri Holdings Ltd. | 2,402,644 | 155,956 | |||
| * | BJ's Wholesale Club Holdings Inc. | 2,320,933 | 155,433 | |||
| Aramark | 4,086,207 | 150,577 | ||||
| Lithia Motors Inc. Class A | 483,539 | 143,587 | ||||
| Bath & Body Works Inc. | 2,005,334 | 139,952 | ||||
| Toll Brothers Inc. | 1,846,514 | 133,669 | ||||
| Newell Brands Inc. | 6,113,986 | 133,529 | ||||
| Macy's Inc. | 4,779,825 | 125,136 | ||||
| * | Norwegian Cruise Line Holdings Ltd. | 5,909,243 | 122,558 | |||
| New York Times Co. Class A | 2,534,981 | 122,440 | ||||
| * | Avis Budget Group Inc. | 586,112 | 121,542 | |||
| PVH Corp. | 1,134,675 | 121,013 | ||||
| Shares | Market Value• ($000) | |||||
| * | Mattel Inc. | 5,594,494 | 120,617 | |||
| Kohl's Corp. | 2,404,010 | 118,734 | ||||
| Interpublic Group of Cos. Inc. | 3,143,975 | 117,742 | ||||
| Nielsen Holdings plc | 5,731,955 | 117,562 | ||||
| Marriott Vacations Worldwide Corp. | 646,176 | 109,191 | ||||
| * | Alaska Air Group Inc. | 2,000,940 | 104,249 | |||
| Dick's Sporting Goods Inc. | 904,181 | 103,972 | ||||
| AMERCO | 140,895 | 102,322 | ||||
| Polaris Inc. | 920,564 | 101,179 | ||||
| * | Goodyear Tire & Rubber Co. | 4,492,070 | 95,771 | |||
| * | Helen of Troy Ltd. | 385,298 | 94,194 | |||
| Hanesbrands Inc. | 5,576,695 | 93,242 | ||||
| * | American Airlines Group Inc. | 5,170,103 | 92,855 | |||
| Harley-Davidson Inc. | 2,457,326 | 92,617 | ||||
| * | AutoNation Inc. | 785,018 | 91,729 | |||
| * | Terminix Global Holdings Inc. | 1,934,683 | 87,506 | |||
| Thor Industries Inc. | 842,457 | 87,422 | ||||
| Lear Corp. | 476,047 | 87,093 | ||||
| Leggett & Platt Inc. | 2,023,391 | 83,283 | ||||
| Gap Inc. | 4,504,664 | 79,507 | ||||
| * | Victoria's Secret & Co. | 1,411,048 | 78,370 | |||
| Murphy USA Inc. | 388,862 | 77,477 | ||||
| * | GameStop Corp. Class A | 519,150 | 77,037 | |||
| Travel + Leisure Co. | 1,378,131 | 76,169 | ||||
| * | Meritage Homes Corp. | 595,815 | 72,725 | |||
| Foot Locker Inc. | 1,657,703 | 72,326 | ||||
| * | JetBlue Airways Corp. | 5,078,173 | 72,313 | |||
| Signet Jewelers Ltd. | 804,878 | 70,049 | ||||
| Wendy's Co. | 2,818,480 | 67,221 | ||||
| H&R Block Inc. | 2,804,530 | 66,075 | ||||
| TEGNA Inc. | 3,533,628 | 65,584 | ||||
| * | Academy Sports & Outdoors Inc. | 1,492,093 | 65,503 | |||
| * | Taylor Morrison Home Corp. Class A | 1,864,301 | 65,176 | |||
| Carter's Inc. | 641,264 | 64,909 | ||||
| * | Asbury Automotive Group Inc. | 361,557 | 62,452 | |||
| * | Under Armour Inc. Class A | 2,900,901 | 61,470 | |||
| 1 | American Eagle Outfitters Inc. | 2,423,473 | 61,362 | |||
| * | Under Armour Inc. Class C | 3,388,141 | 61,122 | |||
| KB Home | 1,327,087 | 59,361 | ||||
| * | Coty Inc. Class A | 5,228,289 | 54,897 | |||
| Group 1 Automotive Inc. | 274,594 | 53,606 | ||||
| Dana Inc. | 2,303,470 | 52,565 | ||||
| MDC Holdings Inc. | 902,867 | 50,407 | ||||
| * | Tri Pointe Homes Inc. | 1,774,714 | 49,497 | |||
| Shares | Market Value• ($000) | |||||
| MillerKnoll Inc. | 1,210,052 | 47,422 | ||||
| Penske Automotive Group Inc. | 437,676 | 46,928 | ||||
| Rent-A-Center Inc. | 950,530 | 45,663 | ||||
| * | Sabre Corp. | 5,165,322 | 44,370 | |||
| Qurate Retail Inc. Class A | 5,584,537 | 42,442 | ||||
| Kontoor Brands Inc. | 823,814 | 42,220 | ||||
| Ralph Lauren Corp. | 350,250 | 41,631 | ||||
| * | PROG Holdings Inc. | 905,768 | 40,859 | |||
| * | Nordstrom Inc. | 1,780,752 | 40,281 | |||
| John Wiley & Sons Inc. Class A | 673,017 | 38,544 | ||||
| Rush Enterprises Inc. Class A | 690,524 | 38,421 | ||||
| Graham Holdings Co. Class B | 60,492 | 38,100 | ||||
| Wolverine World Wide Inc. | 1,315,464 | 37,899 | ||||
| * | Spirit Airlines Inc. | 1,730,977 | 37,822 | |||
| * | Hyatt Hotels Corp. Class A | 381,923 | 36,626 | |||
| * | Knowles Corp. | 1,474,610 | 34,432 | |||
| * | Sally Beauty Holdings Inc. | 1,805,228 | 33,325 | |||
| * | Abercrombie & Fitch Co. Class A | 943,532 | 32,863 | |||
| * | iHeartMedia Inc. Class A | 1,535,662 | 32,310 | |||
| * | SkyWest Inc. | 804,433 | 31,614 | |||
| * | Cheesecake Factory Inc. | 791,419 | 30,984 | |||
| * | Central Garden & Pet Co. Class A | 639,967 | 30,622 | |||
| * | KAR Auction Services Inc. | 1,934,757 | 30,221 | |||
| * | Bloomin' Brands Inc. | 1,425,103 | 29,899 | |||
| * | ODP Corp. | 741,252 | 29,116 | |||
| PriceSmart Inc. | 394,060 | 28,833 | ||||
| Steven Madden Ltd. | 617,424 | 28,692 | ||||
| Acushnet Holdings Corp. | 529,039 | 28,081 | ||||
| * | Lions Gate Entertainment Corp. Class B | 1,808,505 | 27,833 | |||
| HNI Corp. | 660,848 | 27,789 | ||||
| * | Urban Outfitters Inc. | 937,703 | 27,531 | |||
| * | Brinker International Inc. | 725,252 | 26,537 | |||
| * | Cinemark Holdings Inc. | 1,623,915 | 26,178 | |||
| Oxford Industries Inc. | 256,324 | 26,022 | ||||
| La-Z-Boy Inc. | 701,116 | 25,458 | ||||
| Cracker Barrel Old Country Store Inc. | 187,782 | 24,156 | ||||
| Big Lots Inc. | 519,932 | 23,423 | ||||
| Dillard's Inc. Class A | 92,925 | 22,768 | ||||
| *,1 | Bed Bath & Beyond Inc. | 1,533,251 | 22,355 | |||
| Shares | Market Value• ($000) | |||||
| * | Adtalem Global Education Inc. | 754,939 | 22,316 | |||
| * | GoPro Inc. Class A | 2,063,426 | 21,274 | |||
| * | Vista Outdoor Inc. | 457,417 | 21,073 | |||
| Sinclair Broadcast Group Inc. Class A | 784,869 | 20,744 | ||||
| Buckle Inc. | 476,993 | 20,182 | ||||
| Sturm Ruger & Co. Inc. | 280,970 | 19,112 | ||||
| * | Clear Channel Outdoor Holdings Inc. | 5,637,782 | 18,661 | |||
| * | G-III Apparel Group Ltd. | 659,266 | 18,222 | |||
| Matthews International Corp. Class A | 477,438 | 17,508 | ||||
| * | Cars.com Inc. | 1,048,395 | 16,869 | |||
| * | Zumiez Inc. | 341,599 | 16,393 | |||
| Sonic Automotive Inc. Class A | 326,675 | 16,154 | ||||
| * | American Axle & Manufacturing Holdings Inc. | 1,730,578 | 16,146 | |||
| * | AMC Networks Inc. Class A | 466,753 | 16,075 | |||
| * | Cardlytics Inc. | 239,104 | 15,802 | |||
| * | Lions Gate Entertainment Corp. Class A | 932,471 | 15,516 | |||
| Interface Inc. Class A | 942,976 | 15,040 | ||||
| Inter Parfums Inc. | 139,363 | 14,898 | ||||
| Steelcase Inc. Class A | 1,269,759 | 14,882 | ||||
| * | Tenneco Inc. Class A | 1,311,371 | 14,818 | |||
| Guess? Inc. | 622,390 | 14,738 | ||||
| * | Hawaiian Holdings Inc. | 776,862 | 14,271 | |||
| * | WW International Inc. | 838,644 | 13,527 | |||
| * | Designer Brands Inc. Class A | 938,072 | 13,330 | |||
| * | elf Beauty Inc. | 394,686 | 13,108 | |||
| Aaron's Co. Inc. | 502,782 | 12,394 | ||||
| * | BJ's Restaurants Inc. | 353,516 | 12,214 | |||
| * | Dave & Buster's Entertainment Inc. | 307,840 | 11,821 | |||
| Scholastic Corp. | 287,617 | 11,493 | ||||
| * | Stride Inc. | 324,762 | 10,824 | |||
| * | PowerSchool Holdings Inc. Class A | 630,162 | 10,379 | |||
| Strategic Education Inc. | 176,548 | 10,212 | ||||
| Laureate Education Inc. Class A | 826,920 | 10,121 | ||||
| 1 | Krispy Kreme Inc. | 534,174 | 10,107 | |||
| * | Dine Brands Global Inc. | 130,545 | 9,897 | |||
| * | Children's Place Inc. | 111,664 | 8,854 | |||
| *,1 | Canoo Inc. | 1,047,917 | 8,090 | |||
| * | Duolingo Inc. Class A | 75,651 | 8,027 | |||
| * | Central Garden & Pet Co. | 145,069 | 7,635 | |||
| * | Genesco Inc. | 115,092 | 7,385 | |||
| Rush Enterprises Inc. Class B | 136,282 | 7,355 | ||||
| Shares | Market Value• ($000) | |||||
| *,1 | Cricut Inc. Class A | 318,452 | 7,035 | |||
| *,1 | Lordstown Motors Corp. | 1,994,267 | 6,880 | |||
| Smith & Wesson Brands Inc. | 383,652 | 6,829 | ||||
| * | Rush Street Interactive Inc. | 401,934 | 6,632 | |||
| Caleres Inc. | 290,255 | 6,583 | ||||
| * | Vizio Holding Corp. Class A | 309,410 | 6,012 | |||
| Global Industrial Co. | 135,713 | 5,551 | ||||
| * | Life Time Group Holdings Inc. | 310,303 | 5,340 | |||
| * | Janus International Group Inc. | 292,688 | 3,664 | |||
| *,1 | Sweetgreen Inc. Class A | 113,042 | 3,617 | |||
| * | Frontier Group Holdings Inc. | 260,638 | 3,537 | |||
| *,1 | XL Fleet Corp. | 882,266 | 2,920 | |||
| *,1 | Allbirds Inc. Class A | 156,025 | 2,353 | |||
| * | Lands' End Inc. | 119,703 | 2,350 | |||
| * | Udemy Inc. | 111,473 | 2,178 | |||
| * | El Pollo Loco Holdings Inc. | 145,903 | 2,070 | |||
| *,1 | Solo Brands Inc. Class A | 101,107 | 1,580 | |||
| * | Arhaus Inc. Class A | 104,840 | 1,389 | |||
| * | Instructure Holdings Inc. | 5,822 | 140 | |||
| Wyndham Hotels & Resorts Inc. | 817 | 73 | ||||
| * | Torrid Holdings Inc. | 4,140 | 41 | |||
| * | TripAdvisor Inc. | 868 | 24 | |||
| * | Dutch Bros Inc. Class A | 186 | 9 | |||
| * | Portillo's Inc. Class A | 172 | 6 | |||
| * | Integral Ad Science Holding Corp. | 200 | 4 | |||
| * | Weber Inc. Class A | 161 | 2 | |||
| 7,672,453 | ||||||
| Consumer Staples (3.1%) | ||||||
| Bunge Ltd. | 2,131,811 | 199,026 | ||||
| * | Performance Food Group Co. | 2,464,296 | 113,086 | |||
| * | US Foods Holding Corp. | 3,202,024 | 111,526 | |||
| Ingredion Inc. | 1,009,400 | 97,548 | ||||
| Flowers Foods Inc. | 3,038,174 | 83,459 | ||||
| Lamb Weston Holdings Inc. | 1,164,948 | 73,834 | ||||
| Spectrum Brands Holdings Inc. | 657,800 | 66,911 | ||||
| Molson Coors Beverage Co. Class B | 1,441,467 | 66,812 | ||||
| * | Herbalife Nutrition Ltd. | 1,522,271 | 62,307 | |||
| * | Hain Celestial Group Inc. | 1,434,901 | 61,141 | |||
| * | Sprouts Farmers Market Inc. | 1,792,669 | 53,206 | |||
| * | United Natural Foods Inc. | 925,727 | 45,435 | |||
| Shares | Market Value• ($000) | |||||
| * | Hostess Brands Inc. Class A | 2,209,557 | 45,119 | |||
| Energizer Holdings Inc. | 1,067,800 | 42,819 | ||||
| Nu Skin Enterprises Inc. Class A | 795,680 | 40,381 | ||||
| Edgewell Personal Care Co. | 868,282 | 39,689 | ||||
| * | Grocery Outlet Holding Corp. | 1,380,008 | 39,027 | |||
| * | TreeHouse Foods Inc. | 890,861 | 36,107 | |||
| Sanderson Farms Inc. | 169,342 | 32,358 | ||||
| 1 | B&G Foods Inc. | 1,036,350 | 31,847 | |||
| Reynolds Consumer Products Inc. | 837,463 | 26,296 | ||||
| Lancaster Colony Corp. | 153,882 | 25,483 | ||||
| Vector Group Ltd. | 2,089,886 | 23,992 | ||||
| * | Pilgrim's Pride Corp. | 778,212 | 21,946 | |||
| Universal Corp. | 373,337 | 20,504 | ||||
| * | Beauty Health Co. | 836,204 | 20,203 | |||
| Andersons Inc. | 478,346 | 18,517 | ||||
| Weis Markets Inc. | 257,713 | 16,978 | ||||
| Fresh Del Monte Produce Inc. | 569,453 | 15,717 | ||||
| Seaboard Corp. | 3,701 | 14,563 | ||||
| * | Duckhorn Portfolio Inc. | 551,204 | 12,865 | |||
| * | Rite Aid Corp. | 847,989 | 12,457 | |||
| ACCO Brands Corp. | 1,452,346 | 11,996 | ||||
| Tootsie Roll Industries Inc. | 219,845 | 7,965 | ||||
| * | Honest Co. Inc. | 399,660 | 3,233 | |||
| *,1 | AppHarvest Inc. | 261,840 | 1,019 | |||
| Cal-Maine Foods Inc. | 347 | 13 | ||||
| 1,595,385 | ||||||
| Energy (5.3%) | ||||||
| Diamondback Energy Inc. | 2,893,247 | 312,037 | ||||
| Marathon Oil Corp. | 12,432,947 | 204,149 | ||||
| Targa Resources Corp. | 3,656,527 | 191,017 | ||||
| APA Corp. | 5,801,599 | 156,005 | ||||
| Ovintiv Inc. | 4,169,413 | 140,509 | ||||
| * | First Solar Inc. | 1,528,180 | 133,196 | |||
| * | EQT Corp. | 6,034,332 | 131,609 | |||
| Chesapeake Energy Corp. | 1,645,881 | 106,192 | ||||
| * | NOV Inc. | 6,239,229 | 84,542 | |||
| HollyFrontier Corp. | 2,335,494 | 76,557 | ||||
| * | Southwestern Energy Co. | 16,208,948 | 75,534 | |||
| * | Antero Resources Corp. | 4,261,269 | 74,572 | |||
| DT Midstream Inc. | 1,544,749 | 74,117 | ||||
| * | Range Resources Corp. | 3,941,332 | 70,274 | |||
| Equitrans Midstream Corp. | 6,561,547 | 67,846 | ||||
| Murphy Oil Corp. | 2,343,323 | 61,184 | ||||
| SM Energy Co. | 1,938,697 | 57,153 | ||||
| Shares | Market Value• ($000) | |||||
| California Resources Corp. | 1,283,835 | 54,833 | ||||
| Antero Midstream Corp. | 4,956,666 | 47,981 | ||||
| Arcosa Inc. | 771,821 | 40,675 | ||||
| * | Whiting Petroleum Corp. | 624,935 | 40,421 | |||
| * | CNX Resources Corp. | 2,867,161 | 39,423 | |||
| Continental Resources Inc. | 876,058 | 39,212 | ||||
| Oasis Petroleum Inc. | 299,605 | 37,747 | ||||
| Helmerich & Payne Inc. | 1,552,258 | 36,789 | ||||
| * | Renewable Energy Group Inc. | 802,823 | 34,072 | |||
| *,1 | SunPower Corp. | 1,381,290 | 28,828 | |||
| World Fuel Services Corp. | 958,410 | 25,369 | ||||
| Patterson-UTI Energy Inc. | 2,925,365 | 24,719 | ||||
| * | Transocean Ltd. | 8,897,834 | 24,558 | |||
| Magnolia Oil & Gas Corp. Class A | 1,232,828 | 23,263 | ||||
| Arch Resources Inc. | 244,586 | 22,336 | ||||
| Warrior Met Coal Inc. | 821,026 | 21,109 | ||||
| * | Stem Inc. | 1,095,912 | 20,789 | |||
| * | PBF Energy Inc. Class A | 1,532,964 | 19,883 | |||
| Archrock Inc. | 2,459,899 | 18,400 | ||||
| * | Delek US Holdings Inc. | 1,183,908 | 17,747 | |||
| Core Laboratories NV | 739,239 | 16,492 | ||||
| * | NOW Inc. | 1,765,656 | 15,079 | |||
| * | ProPetro Holding Corp. | 1,403,223 | 11,366 | |||
| * | MRC Global Inc. | 1,254,270 | 8,629 | |||
| * | Fluence Energy Inc. Class A | 237,816 | 8,457 | |||
| CVR Energy Inc. | 481,742 | 8,098 | ||||
| * | NexTier Oilfield Solutions Inc. | 1,640,604 | 5,824 | |||
| * | RPC Inc. | 1,203,533 | 5,464 | |||
| *,1 | EVgo Inc. | 191,891 | 1,907 | |||
| Devon Energy Corp. | 5,890 | 259 | ||||
| * | Whiting Petroleum Corp. Warrants Exp. 9/1/25 | 699 | 8 | |||
| * | Helix Energy Solutions Group Inc. | 1,249 | 4 | |||
| * | Whiting Petroleum Corp. Class A Warrants Exp. 9/1/24 | 196 | 3 | |||
| 2,716,237 | ||||||
| Financials (22.0%) | ||||||
| Signature Bank | 965,640 | 312,356 | ||||
| Brown & Brown Inc. | 3,833,617 | 269,427 | ||||
| LPL Financial Holdings Inc. | 1,215,920 | 194,657 | ||||
| Carlyle Group Inc. | 3,416,079 | 187,543 | ||||
| Comerica Inc. | 2,094,398 | 182,213 | ||||
| East West Bancorp Inc. | 2,266,182 | 178,303 | ||||
| Shares | Market Value• ($000) | |||||
| American Financial Group Inc. | 1,151,144 | 158,075 | ||||
| Zions Bancorp NA | 2,498,726 | 157,820 | ||||
| Invesco Ltd. | 6,628,776 | 152,594 | ||||
| Assurant Inc. | 909,916 | 141,820 | ||||
| First Horizon Corp. | 8,635,619 | 141,020 | ||||
| First American Financial Corp. | 1,665,229 | 130,271 | ||||
| AGNC Investment Corp. | 8,382,120 | 126,067 | ||||
| RenaissanceRe Holdings Ltd. | 734,939 | 124,447 | ||||
| SEI Investments Co. | 2,003,174 | 122,073 | ||||
| People's United Financial Inc. | 6,835,248 | 121,804 | ||||
| Commerce Bancshares Inc. | 1,753,217 | 120,516 | ||||
| Reinsurance Group of America Inc. | 1,079,539 | 118,199 | ||||
| Voya Financial Inc. | 1,772,546 | 117,538 | ||||
| Cullen/Frost Bankers Inc. | 915,739 | 115,447 | ||||
| Old Republic International Corp. | 4,657,385 | 114,479 | ||||
| Janus Henderson Group plc | 2,724,195 | 114,253 | ||||
| Jefferies Financial Group Inc. | 2,941,065 | 114,113 | ||||
| Starwood Property Trust Inc. | 4,621,039 | 112,291 | ||||
| Stifel Financial Corp. | 1,579,506 | 111,229 | ||||
| First Financial Bankshares Inc. | 2,161,483 | 109,890 | ||||
| Synovus Financial Corp. | 2,207,546 | 105,675 | ||||
| Popular Inc. | 1,275,224 | 104,619 | ||||
| Affiliated Managers Group Inc. | 616,731 | 101,458 | ||||
| Prosperity Bancshares Inc. | 1,398,253 | 101,094 | ||||
| Glacier Bancorp Inc. | 1,767,535 | 100,219 | ||||
| Primerica Inc. | 630,631 | 96,657 | ||||
| Lincoln National Corp. | 1,370,823 | 93,572 | ||||
| OneMain Holdings Inc. | 1,861,030 | 93,126 | ||||
| Ares Management Corp. Class A | 1,139,195 | 92,582 | ||||
| SLM Corp. | 4,682,138 | 92,098 | ||||
| Cadence Bank | 3,074,757 | 91,597 | ||||
| Bank OZK | 1,967,963 | 91,569 | ||||
| Valley National Bancorp | 6,498,757 | 89,358 | ||||
| SouthState Corp. | 1,115,009 | 89,323 | ||||
| Western Alliance Bancorp | 790,415 | 85,088 | ||||
| PacWest Bancorp | 1,872,495 | 84,581 | ||||
| New York Community Bancorp Inc. | 6,804,746 | 83,086 | ||||
| Wintrust Financial Corp. | 910,359 | 82,679 | ||||
| CIT Group Inc. | 1,583,648 | 81,304 | ||||
| Webster Financial Corp. | 1,446,670 | 80,782 | ||||
| Shares | Market Value• ($000) | |||||
| New Residential Investment Corp. | 7,451,071 | 79,801 | ||||
| Sterling Bancorp | 3,077,260 | 79,363 | ||||
| Selective Insurance Group Inc. | 960,151 | 78,675 | ||||
| Blackstone Mortgage Trust Inc. Class A | 2,534,800 | 77,616 | ||||
| RLI Corp. | 686,417 | 76,947 | ||||
| * | SoFi Technologies Inc. | 4,832,303 | 76,399 | |||
| Essent Group Ltd. | 1,674,415 | 76,236 | ||||
| First Citizens BancShares Inc. Class A | 91,461 | 75,898 | ||||
| United Bankshares Inc. | 2,068,300 | 75,038 | ||||
| MGIC Investment Corp. | 5,199,489 | 74,977 | ||||
| Lazard Ltd. Class A | 1,710,826 | 74,643 | ||||
| Unum Group | 2,938,448 | 72,198 | ||||
| Evercore Inc. Class A | 529,657 | 71,954 | ||||
| UMB Financial Corp. | 656,404 | 69,651 | ||||
| Walker & Dunlop Inc. | 460,459 | 69,474 | ||||
| Globe Life Inc. | 724,818 | 67,930 | ||||
| Hanover Insurance Group Inc. | 511,379 | 67,021 | ||||
| Umpqua Holdings Corp. | 3,459,374 | 66,558 | ||||
| Axis Capital Holdings Ltd. | 1,218,421 | 66,367 | ||||
| * | Brighthouse Financial Inc. | 1,274,744 | 66,032 | |||
| Hancock Whitney Corp. | 1,317,296 | 65,891 | ||||
| Community Bank System Inc. | 861,266 | 64,147 | ||||
| Jackson Financial Inc. Class A | 1,484,951 | 62,115 | ||||
| FNB Corp. | 5,092,870 | 61,777 | ||||
| Moelis & Co. Class A | 973,574 | 60,858 | ||||
| United Community Banks Inc. | 1,686,173 | 60,601 | ||||
| Radian Group Inc. | 2,863,949 | 60,515 | ||||
| BankUnited Inc. | 1,422,792 | 60,198 | ||||
| Independent Bank Corp. | 718,370 | 58,569 | ||||
| Home BancShares Inc. | 2,354,914 | 57,342 | ||||
| Chimera Investment Corp. | 3,782,454 | 57,039 | ||||
| Kemper Corp. | 965,714 | 56,774 | ||||
| First Hawaiian Inc. | 2,057,249 | 56,225 | ||||
| Federated Hermes Inc. Class B | 1,469,284 | 55,216 | ||||
| Eastern Bankshares Inc. | 2,684,154 | 54,139 | ||||
| Investors Bancorp Inc. | 3,560,570 | 53,943 | ||||
| Bank of Hawaii Corp. | 642,735 | 53,835 | ||||
| Assured Guaranty Ltd. | 1,059,711 | 53,197 | ||||
| WSFS Financial Corp. | 1,049,026 | 52,577 | ||||
| Navient Corp. | 2,445,101 | 51,885 | ||||
| American Equity Investment Life Holding Co. | 1,329,630 | 51,749 | ||||
| Shares | Market Value• ($000) | |||||
| Simmons First National Corp. Class A | 1,741,936 | 51,526 | ||||
| Associated Banc-Corp | 2,276,744 | 51,432 | ||||
| Cathay General Bancorp | 1,171,555 | 50,365 | ||||
| * | Texas Capital Bancshares Inc. | 808,196 | 48,694 | |||
| Piper Sandler Cos. | 271,228 | 48,417 | ||||
| Blue Owl Capital Inc. Class A | 3,233,199 | 48,207 | ||||
| Old National Bancorp | 2,647,867 | 47,979 | ||||
| * | Axos Financial Inc. | 855,059 | 47,806 | |||
| Artisan Partners Asset Management Inc. Class A | 989,438 | 47,137 | ||||
| CNO Financial Group Inc. | 1,969,243 | 46,947 | ||||
| White Mountains Insurance Group Ltd. | 45,781 | 46,417 | ||||
| BOK Financial Corp. | 438,183 | 46,224 | ||||
| FirstCash Holdings Inc. | 613,425 | 45,890 | ||||
| First Bancorp | 3,283,822 | 45,251 | ||||
| CVB Financial Corp. | 2,056,030 | 44,020 | ||||
| Fulton Financial Corp. | 2,575,913 | 43,791 | ||||
| * | Enstar Group Ltd. | 174,250 | 43,143 | |||
| Atlantic Union Bankshares Corp. | 1,147,810 | 42,802 | ||||
| * | Cannae Holdings Inc. | 1,206,968 | 42,425 | |||
| Houlihan Lokey Inc. Class A | 407,215 | 42,155 | ||||
| Independent Bank Group Inc. | 582,495 | 42,027 | ||||
| Santander Consumer USA Holdings Inc. | 977,507 | 41,075 | ||||
| Columbia Banking System Inc. | 1,254,036 | 41,032 | ||||
| Flagstar Bancorp Inc. | 844,208 | 40,471 | ||||
| International Bancshares Corp. | 910,751 | 38,607 | ||||
| * | LendingClub Corp. | 1,594,786 | 38,562 | |||
| First Midwest Bancorp Inc. | 1,823,010 | 37,335 | ||||
| PennyMac Financial Services Inc. | 518,423 | 36,176 | ||||
| First Merchants Corp. | 861,078 | 36,071 | ||||
| * | Ryan Specialty Group Holdings Inc. Class A | 877,149 | 35,393 | |||
| Washington Federal Inc. | 1,041,654 | 34,770 | ||||
| First Financial Bancorp | 1,422,263 | 34,675 | ||||
| Virtus Investment Partners Inc. | 115,114 | 34,200 | ||||
| WesBanco Inc. | 959,311 | 33,566 | ||||
| Hilltop Holdings Inc. | 945,695 | 33,232 | ||||
| * | PRA Group Inc. | 661,699 | 33,224 | |||
| Towne Bank | 1,044,187 | 32,986 | ||||
| * | Genworth Financial Inc. Class A | 8,102,642 | 32,816 | |||
| MFA Financial Inc. | 7,041,228 | 32,108 | ||||
| Shares | Market Value• ($000) | |||||
| Renasant Corp. | 845,794 | 32,098 | ||||
| Park National Corp. | 233,135 | 32,012 | ||||
| Two Harbors Investment Corp. | 5,492,349 | 31,691 | ||||
| Banner Corp. | 519,639 | 31,526 | ||||
| Argo Group International Holdings Ltd. | 529,059 | 30,744 | ||||
| Pacific Premier Bancorp Inc. | 752,516 | 30,123 | ||||
| Great Western Bancorp Inc. | 880,170 | 29,891 | ||||
| Eagle Bancorp Inc. | 510,213 | 29,766 | ||||
| Apollo Commercial Real Estate Finance Inc. | 2,234,029 | 29,400 | ||||
| Trustmark Corp. | 897,636 | 29,137 | ||||
| Compass Diversified Holdings | 894,139 | 27,343 | ||||
| 1 | iStar Inc. | 1,053,975 | 27,224 | |||
| Northwest Bancshares Inc. | 1,920,160 | 27,189 | ||||
| Provident Financial Services Inc. | 1,112,064 | 26,934 | ||||
| PennyMac Mortgage Investment Trust | 1,549,146 | 26,847 | ||||
| Hope Bancorp Inc. | 1,823,455 | 26,823 | ||||
| Nelnet Inc. Class A | 264,020 | 25,789 | ||||
| First Interstate BancSystem Inc. Class A | 632,894 | 25,740 | ||||
| Horace Mann Educators Corp. | 662,570 | 25,641 | ||||
| NBT Bancorp Inc. | 657,706 | 25,335 | ||||
| First Commonwealth Financial Corp. | 1,515,881 | 24,391 | ||||
| Redwood Trust Inc. | 1,827,624 | 24,106 | ||||
| BGC Partners Inc. Class A | 5,156,382 | 23,977 | ||||
| Capitol Federal Financial Inc. | 2,106,718 | 23,869 | ||||
| Westamerica Bancorp | 407,630 | 23,532 | ||||
| Mercury General Corp. | 442,125 | 23,459 | ||||
| * | Encore Capital Group Inc. | 376,156 | 23,363 | |||
| * | Mr Cooper Group Inc. | 539,846 | 22,463 | |||
| ProAssurance Corp. | 862,129 | 21,812 | ||||
| Ladder Capital Corp. | 1,803,453 | 21,623 | ||||
| OFG Bancorp | 796,046 | 21,143 | ||||
| National Bank Holdings Corp. Class A | 459,370 | 20,185 | ||||
| Berkshire Hills Bancorp Inc. | 699,331 | ��� 19,882 | ||||
| Safety Insurance Group Inc. | 227,300 | 19,327 | ||||
| Brookline Bancorp Inc. | 1,177,755 | 19,068 | ||||
| Broadmark Realty Capital Inc. | 2,013,341 | 18,986 | ||||
| S&T Bancorp Inc. | 596,981 | 18,817 | ||||
| Shares | Market Value• ($000) | |||||
| City Holding Co. | 229,371 | 18,760 | ||||
| BancFirst Corp. | 260,108 | 18,353 | ||||
| Employers Holdings Inc. | 424,251 | 17,556 | ||||
| * | World Acceptance Corp. | 69,539 | 17,067 | |||
| Tompkins Financial Corp. | 199,026 | 16,635 | ||||
| Heartland Financial USA Inc. | 303,628 | 15,367 | ||||
| BrightSpire Capital Inc. Class A | 1,450,765 | 14,885 | ||||
| State Auto Financial Corp. | 284,204 | 14,690 | ||||
| Kearny Financial Corp. | 1,078,077 | 14,285 | ||||
| ARMOUR Residential REIT Inc. | 1,432,073 | 14,049 | ||||
| Invesco Mortgage Capital Inc. | 4,978,086 | 13,839 | ||||
| * | Blucora Inc. | 739,173 | 12,802 | |||
| * | Columbia Financial Inc. | 594,135 | 12,394 | |||
| TPG RE Finance Trust Inc. | 984,452 | 12,128 | ||||
| WisdomTree Investments Inc. | 1,970,388 | 12,059 | ||||
| Central Pacific Financial Corp. | 424,253 | 11,951 | ||||
| * | Ambac Financial Group Inc. | 739,471 | 11,869 | |||
| * | SiriusPoint Ltd. | 1,422,275 | 11,563 | |||
| KKR Real Estate Finance Trust Inc. | 534,333 | 11,130 | ||||
| Northfield Bancorp Inc. | 673,455 | 10,883 | ||||
| United Fire Group Inc. | 400,613 | 9,290 | ||||
| * | Franklin BSP Realty Trust Inc. | 491,614 | 7,345 | |||
| National Western Life Group Inc. Class A | 30,186 | 6,473 | ||||
| GCM Grosvenor Inc. Class A | 597,795 | 6,277 | ||||
| Granite Point Mortgage Trust Inc. | 429,459 | 5,029 | ||||
| * | AssetMark Financial Holdings Inc. | 145,623 | 3,817 | |||
| *,1 | Romeo Power Inc. | 760,298 | 2,775 | |||
| * | P10 Inc. Class A | 159,515 | 2,230 | |||
| *,1 | Hagerty Inc. Class A | 102,079 | 1,447 | |||
| loanDepot Inc. Class A | 287,920 | 1,382 | ||||
| Associated Capital Group Inc. Class A | 27,079 | 1,164 | ||||
| * | Bakkt Holdings Inc. | 99,656 | 848 | |||
| * | MetroMile Inc. | 332,371 | 728 | |||
| Apollo Asset Management Inc. | 1,846 | 134 | ||||
| American National Group Inc. | 234 | 44 | ||||
| * | Athene Holding Ltd. Class A | 376 | 31 | |||
| Shares | Market Value• ($000) | |||||
| * | Clearwater Analytics Holdings Inc. Class A | 262 | 6 | |||
| *,2 | Frontier Financial Corp. | 2 | — | |||
| 11,251,777 | ||||||
| Health Care (5.3%) | ||||||
| * | Molina Healthcare Inc. | 932,623 | 296,649 | |||
| * | United Therapeutics Corp. | 719,211 | 155,407 | |||
| * | Novavax Inc. | 1,057,400 | 151,282 | |||
| * | Tenet Healthcare Corp. | 1,710,719 | 139,749 | |||
| Organon & Co. | 4,049,072 | 123,294 | ||||
| * | Jazz Pharmaceuticals plc | 932,568 | 118,809 | |||
| * | Mirati Therapeutics Inc. | 794,318 | 116,518 | |||
| * | Envista Holdings Corp. | 2,577,096 | 116,124 | |||
| Encompass Health Corp. | 1,588,917 | 103,693 | ||||
| * | Acadia Healthcare Co. Inc. | 1,436,260 | 87,181 | |||
| Perrigo Co. plc | 2,136,332 | 83,103 | ||||
| Premier Inc. Class A | 1,848,821 | 76,116 | ||||
| * | Pacific Biosciences of California Inc. | 3,346,385 | 68,467 | |||
| Select Medical Holdings Corp. | 1,713,850 | 50,387 | ||||
| Owens & Minor Inc. | 1,144,750 | 49,797 | ||||
| * | Prestige Consumer Healthcare Inc. | 800,111 | 48,527 | |||
| * | Karuna Therapeutics Inc. | 354,825 | 46,482 | |||
| * | Integer Holdings Corp. | 527,364 | 45,137 | |||
| * | Kodiak Sciences Inc. | 495,571 | 42,015 | |||
| Patterson Cos. Inc. | 1,398,811 | 41,055 | ||||
| * | Iovance Biotherapeutics Inc. | 2,129,911 | 40,660 | |||
| * | Magellan Health Inc. | 378,422 | 35,946 | |||
| * | MEDNAX Inc. | 1,311,628 | 35,689 | |||
| * | Myriad Genetics Inc. | 1,212,339 | 33,461 | |||
| CONMED Corp. | 233,564 | 33,110 | ||||
| * | Kymera Therapeutics Inc. | 492,395 | 31,262 | |||
| * | Turning Point Therapeutics Inc. | 632,214 | 30,157 | |||
| * | Avanos Medical Inc. | 769,684 | 26,685 | |||
| *,1 | Multiplan Corp. | 5,603,067 | 24,822 | |||
| * | Bridgebio Pharma Inc. | 1,345,454 | 22,442 | |||
| Healthcare Services Group Inc. | 1,190,391 | 21,177 | ||||
| * | Varex Imaging Corp. | 630,841 | 19,903 | |||
| * | Tivity Health Inc. | 675,308 | 17,855 | |||
| * | Surgery Partners Inc. | 321,401 | 17,166 | |||
| * | Axsome Therapeutics Inc. | 451,502 | 17,058 | |||
| * | Outset Medical Inc. | 357,733 | 16,488 | |||
| * | Madrigal Pharmaceuticals Inc. | 191,178 | 16,200 | |||
| * | NextGen Healthcare Inc. | 871,447 | 15,503 | |||
| Shares | Market Value• ($000) | |||||
| * | Brookdale Senior Living Inc. | 2,960,274 | 15,275 | |||
| *,1 | OPKO Health Inc. | 2,992,667 | 14,395 | |||
| * | Agios Pharmaceuticals Inc. | 433,787 | 14,259 | |||
| * | Meridian Bioscience Inc. | 692,622 | 14,129 | |||
| National HealthCare Corp. | 197,076 | 13,389 | ||||
| * | Endo International plc | 3,545,154 | 13,330 | |||
| * | Supernus Pharmaceuticals Inc. | 403,435 | 11,764 | |||
| * | Praxis Precision Medicines Inc. | 573,141 | 11,291 | |||
| * | Reata Pharmaceuticals Inc. Class A | 427,267 | 11,267 | |||
| *,1 | Day One Biopharmaceuticals Inc. | 642,262 | 10,822 | |||
| * | Orthofix Medical Inc. | 299,536 | 9,313 | |||
| * | Amneal Pharmaceuticals Inc. | 1,908,676 | 9,143 | |||
| * | Cano Health Inc. | 1,008,757 | 8,988 | |||
| * | Atea Pharmaceuticals Inc. | 995,316 | 8,898 | |||
| *,1 | Clover Health Investments Corp. Class A | 2,375,196 | 8,836 | |||
| * | NGM Biopharmaceuticals Inc. | 496,116 | 8,786 | |||
| * | Nuvation Bio Inc. | 956,737 | 8,132 | |||
| * | Stoke Therapeutics Inc. | 322,585 | 7,739 | |||
| *,1 | Butterfly Network Inc. | 1,154,477 | 7,723 | |||
| * | Zogenix Inc. | 446,633 | 7,258 | |||
| * | Forma Therapeutics Holdings Inc. | 492,235 | 7,000 | |||
| Phibro Animal Health Corp. Class A | 324,698 | 6,630 | ||||
| * | Hims & Hers Health Inc. | 1,009,795 | 6,614 | |||
| * | ALX Oncology Holdings Inc. | 289,414 | 6,219 | |||
| * | Allovir Inc. | 468,245 | 6,059 | |||
| * | Kiniksa Pharmaceuticals Ltd. Class A | 487,189 | 5,734 | |||
| * | Immunovant Inc. | 642,330 | 5,473 | |||
| * | Natus Medical Inc. | 136,338 | 3,235 | |||
| *,1 | G1 Therapeutics Inc. | 268,522 | 2,742 | |||
| *,1 | 23andMe Holding Co. | 392,804 | 2,616 | |||
| * | Nuvalent Inc. Class A | 132,144 | 2,516 | |||
| *,1 | P3 Health Partners Inc. | 244,013 | 1,718 | |||
| * | PROCEPT BioRobotics Corp. | 51,191 | 1,280 | |||
| * | Silverback Therapeutics Inc. | 154,396 | 1,028 | |||
| *,1 | Adagio Therapeutics Inc. | 133,315 | 968 | |||
| * | Bright Health Group Inc. | 49,145 | 169 | |||
| Shares | Market Value• ($000) | |||||
| *,1 | Cue Health Inc. | 10,364 | 139 | |||
| * | Warby Parker Inc. Class A | 521 | 24 | |||
| * | TG Therapeutics Inc. | 1,116 | 21 | |||
| * | Cerevel Therapeutics Holdings Inc. | 443 | 14 | |||
| * | American Well Corp. Class A | 1,465 | 9 | |||
| * | Definitive Healthcare Corp. Class A | 211 | 6 | |||
| * | Verve Therapeutics Inc. | 124 | 5 | |||
| * | Aerie Pharmaceuticals Inc. | 411 | 3 | |||
| * | Erasca Inc. | 211 | 3 | |||
| * | Lyell Immunopharma Inc. | 211 | 2 | |||
| * | Monte Rosa Therapeutics Inc. | 101 | 2 | |||
| * | Cytek Biosciences Inc. | 113 | 2 | |||
| * | Absci Corp. | 76 | 1 | |||
| *,1,2 | Synergy Pharmaceuticals LLC | 1,169,882 | — | |||
| 2,690,345 | ||||||
| Industrials (20.4%) | ||||||
| IDEX Corp. | 1,214,186 | 286,936 | ||||
| * | Builders FirstSource Inc. | 3,058,442 | 262,139 | |||
| Quanta Services Inc. | 2,275,534 | 260,913 | ||||
| RPM International Inc. | 2,071,492 | 209,221 | ||||
| Carlisle Cos. Inc. | 834,934 | 207,164 | ||||
| Howmet Aerospace Inc. | 6,140,256 | 195,444 | ||||
| Pentair plc | 2,642,582 | 192,988 | ||||
| Allegion plc | 1,432,391 | 189,706 | ||||
| Robert Half International Inc. | 1,688,960 | 188,353 | ||||
| Regal Rexnord Corp. | 1,082,083 | 184,149 | ||||
| Booz Allen Hamilton Holding Corp. | 2,138,278 | 181,305 | ||||
| * | AECOM | 2,270,904 | 175,654 | |||
| Sealed Air Corp. | 2,365,941 | 159,630 | ||||
| * | Sensata Technologies Holding plc | 2,530,759 | 156,123 | |||
| Tetra Tech Inc. | 860,521 | 146,116 | ||||
| Knight-Swift Transportation Holdings Inc. Class A | 2,385,208 | 145,355 | ||||
| Owens Corning | 1,604,756 | 145,230 | ||||
| ITT Inc. | 1,367,015 | 139,695 | ||||
| Lincoln Electric Holdings Inc. | 942,970 | 131,516 | ||||
| AptarGroup Inc. | 1,051,240 | 128,756 | ||||
| Brunswick Corp. | 1,231,130 | 124,012 | ||||
| Oshkosh Corp. | 1,077,754 | 121,474 | ||||
| * | XPO Logistics Inc. | 1,560,100 | 120,799 | |||
| * | Axalta Coating Systems Ltd. | 3,646,693 | 120,778 | |||
| Huntington Ingalls Industries Inc. | 639,736 | 119,464 | ||||
| Shares | Market Value• ($000) | |||||
| Acuity Brands Inc. | 558,732 | 118,295 | ||||
| Donaldson Co. Inc. | 1,973,799 | 116,967 | ||||
| AGCO Corp. | 956,067 | 110,923 | ||||
| Louisiana-Pacific Corp. | 1,405,260 | 110,102 | ||||
| EMCOR Group Inc. | 852,355 | 108,581 | ||||
| * | WESCO International Inc. | 805,015 | 105,932 | |||
| * | Colfax Corp. | 2,224,737 | 102,271 | |||
| nVent Electric plc | 2,686,675 | 102,094 | ||||
| MDU Resources Group Inc. | 3,247,406 | 100,150 | ||||
| Graphic Packaging Holding Co. | 4,904,142 | 95,631 | ||||
| Sonoco Products Co. | 1,570,212 | 90,900 | ||||
| Hubbell Inc. Class B | 434,458 | 90,485 | ||||
| MSA Safety Inc. | 594,807 | 89,792 | ||||
| * | Middleby Corp. | 444,154 | 87,392 | |||
| Curtiss-Wright Corp. | 626,664 | 86,899 | ||||
| Watts Water Technologies Inc. Class A | 440,087 | 85,452 | ||||
| Valmont Industries Inc. | 338,917 | 84,899 | ||||
| ManpowerGroup Inc. | 866,194 | 84,307 | ||||
| * | FTI Consulting Inc. | 547,559 | 84,006 | |||
| Vontier Corp. | 2,699,780 | 82,964 | ||||
| * | MasTec Inc. | 889,941 | 82,124 | |||
| * | Atkore Inc. | 734,859 | 81,709 | |||
| Crane Co. | 797,183 | 81,097 | ||||
| * | Mohawk Industries Inc. | 432,649 | 78,820 | |||
| * | API Group Corp. | 3,048,820 | 78,568 | |||
| Air Lease Corp. Class A | 1,729,293 | 76,487 | ||||
| * | Summit Materials Inc. Class A | 1,893,366 | 76,000 | |||
| Spirit AeroSystems Holdings Inc. Class A | 1,677,602 | 72,288 | ||||
| HB Fuller Co. | 839,259 | 67,980 | ||||
| Ryder System Inc. | 814,572 | 67,145 | ||||
| Zurn Water Solutions Corp. | 1,840,961 | 67,011 | ||||
| Korn Ferry | 870,444 | 65,919 | ||||
| Triton International Ltd. | 1,066,303 | 64,223 | ||||
| Flowserve Corp. | 2,080,380 | 63,660 | ||||
| Applied Industrial Technologies Inc. | 614,153 | 63,074 | ||||
| Allison Transmission Holdings Inc. | 1,665,031 | 60,524 | ||||
| Matson Inc. | 671,256 | 60,433 | ||||
| * | Resideo Technologies Inc. | 2,305,793 | 60,020 | |||
| MSC Industrial Direct Co. Inc. Class A | 710,327 | 59,710 | ||||
| GATX Corp. | 566,926 | 59,068 | ||||
| SPX FLOW Inc. | 670,231 | 57,962 | ||||
| EVERTEC Inc. | 1,149,327 | 57,443 | ||||
| Western Union Co. | 3,206,123 | 57,197 | ||||
| * | Kirby Corp. | 959,958 | 57,041 | |||
| Shares | Market Value• ($000) | |||||
| Silgan Holdings Inc. | 1,322,347 | 56,649 | ||||
| * | Fluor Corp. | 2,258,308 | 55,938 | |||
| Hillenbrand Inc. | 1,038,211 | 53,977 | ||||
| Altra Industrial Motion Corp. | 1,036,759 | 53,466 | ||||
| EnerSys | 669,034 | 52,894 | ||||
| Woodward Inc. | 478,437 | 52,370 | ||||
| Brink's Co. | 784,958 | 51,470 | ||||
| * | Beacon Roofing Supply Inc. | 895,745 | 51,371 | |||
| UniFirst Corp. | 243,147 | 51,158 | ||||
| Alliance Data Systems Corp. | 755,503 | 50,294 | ||||
| Kennametal Inc. | 1,335,801 | 47,969 | ||||
| Otter Tail Corp. | 663,326 | 47,375 | ||||
| Belden Inc. | 717,002 | 47,129 | ||||
| Terex Corp. | 1,058,968 | 46,542 | ||||
| ArcBest Corp. | 387,886 | 46,488 | ||||
| Albany International Corp. Class A | 517,074 | 45,735 | ||||
| Armstrong World Industries Inc. | 379,067 | 44,017 | ||||
| Encore Wire Corp. | 307,301 | 43,975 | ||||
| ABM Industries Inc. | 1,073,774 | 43,864 | ||||
| * | Atlas Air Worldwide Holdings Inc. | 463,546 | 43,629 | |||
| * | Hub Group Inc. Class A | 515,322 | 43,411 | |||
| Werner Enterprises Inc. | 907,892 | 43,270 | ||||
| * | Alight Inc. Class A | 3,924,519 | 42,424 | |||
| * | SPX Corp. | 688,995 | 41,119 | |||
| Trinity Industries Inc. | 1,321,836 | 39,919 | ||||
| Brady Corp. Class A | 732,639 | 39,489 | ||||
| * | GMS Inc. | 654,587 | 39,347 | |||
| Moog Inc. Class A | 466,833 | 37,799 | ||||
| * | JELD-WEN Holding Inc. | 1,390,310 | 36,649 | |||
| EnPro Industries Inc. | 329,051 | 36,219 | ||||
| Barnes Group Inc. | 768,108 | 35,786 | ||||
| ESCO Technologies Inc. | 395,407 | 35,583 | ||||
| * | Allegheny Technologies Inc. | 2,032,256 | 32,374 | |||
| ManTech International Corp. Class A | 440,193 | 32,103 | ||||
| Herc Holdings Inc. | 201,514 | 31,547 | ||||
| McGrath RentCorp | 387,207 | 31,077 | ||||
| * | O-I Glass Inc. | 2,504,522 | 30,129 | |||
| * | Green Dot Corp. Class A | 829,666 | 30,067 | |||
| * | Ferro Corp. | 1,321,195 | 28,842 | |||
| Granite Construction Inc. | 731,840 | 28,322 | ||||
| * | Meritor Inc. | 1,119,133 | 27,732 | |||
| TTEC Holdings Inc. | 300,163 | 27,180 | ||||
| Comfort Systems USA Inc. | 273,361 | 27,046 | ||||
| * | Gates Industrial Corp. plc | 1,631,751 | 25,961 | |||
| * | OSI Systems Inc. | 272,193 | 25,368 | |||
| Shares | Market Value• ($000) | |||||
| TriMas Corp. | 684,446 | 25,324 | ||||
| Greif Inc. Class A | 404,119 | 24,397 | ||||
| Astec Industries Inc. | 345,377 | 23,924 | ||||
| Griffon Corp. | 813,710 | 23,174 | ||||
| Kforce Inc. | 307,897 | 23,160 | ||||
| Greenbrier Cos. Inc. | 493,771 | 22,659 | ||||
| Schneider National Inc. Class B | 831,075 | 22,364 | ||||
| * | ZipRecruiter Inc. Class A | 896,216 | 22,352 | |||
| Deluxe Corp. | 680,384 | 21,847 | ||||
| H&E Equipment Services Inc. | 490,617 | 21,720 | ||||
| Standex International Corp. | 194,971 | 21,575 | ||||
| * | Dycom Industries Inc. | 228,952 | 21,467 | |||
| * | AAR Corp. | 538,209 | 21,006 | |||
| AZZ Inc. | 376,875 | 20,837 | ||||
| ADT Inc. | 2,449,876 | 20,603 | ||||
| Primoris Services Corp. | 816,555 | 19,581 | ||||
| Kaman Corp. | 444,810 | 19,194 | ||||
| * | CoreCivic Inc. | 1,920,838 | 19,151 | |||
| Apogee Enterprises Inc. | 384,366 | 18,507 | ||||
| Pitney Bowes Inc. | 2,671,093 | 17,709 | ||||
| * | Huron Consulting Group Inc. | 350,054 | 17,468 | |||
| Maxar Technologies Inc. | 551,189 | 16,277 | ||||
| * | TrueBlue Inc. | 566,635 | 15,679 | |||
| Wabash National Corp. | 750,733 | 14,654 | ||||
| * | First Advantage Corp. | 732,453 | 13,946 | |||
| * | Conduent Inc. | 2,548,854 | 13,611 | |||
| Quanex Building Products Corp. | 535,402 | 13,267 | ||||
| Heartland Express Inc. | 756,106 | 12,718 | ||||
| * | BrightView Holdings Inc. | 839,972 | 11,827 | |||
| * | Advantage Solutions Inc. | 1,272,075 | 10,202 | |||
| Enerpac Tool Group Corp. Class A | 485,592 | 9,848 | ||||
| * | Loyalty Ventures Inc. | 314,071 | 9,444 | |||
| Kelly Services Inc. Class A | 546,694 | 9,168 | ||||
| * | Triumph Group Inc. | 490,148 | 9,082 | |||
| * | CIRCOR International Inc. | 323,568 | 8,795 | |||
| * | American Woodmark Corp. | 132,261 | 8,623 | |||
| * | Tutor Perini Corp. | 652,486 | 8,071 | |||
| Gorman-Rupp Co. | 166,896 | 7,435 | ||||
| REV Group Inc. | 516,996 | 7,315 | ||||
| *,1 | Velodyne Lidar Inc. | 1,568,022 | 7,276 | |||
| * | AvidXchange Holdings Inc. | 469,746 | 7,074 | |||
| National Presto Industries Inc. | 84,204 | 6,907 | ||||
| Hyster-Yale Materials Handling Inc. | 165,383 | 6,797 | ||||
| Shares | Market Value• ($000) | |||||
| * | Mirion Technologies Inc. | 636,511 | 6,664 | |||
| * | Vivint Smart Home Inc. | 666,735 | 6,521 | |||
| Greif Inc. Class B | 104,054 | 6,220 | ||||
| * | BTRS Holdings Inc. Class A | 793,600 | 6,206 | |||
| *,1 | Latch Inc. | 795,021 | 6,018 | |||
| *,1 | Hyliion Holdings Corp. | 965,757 | 5,988 | |||
| Kronos Worldwide Inc. | 367,279 | 5,513 | ||||
| International Seaways Inc. | 363,049 | 5,330 | ||||
| * | Enovix Corp. | 173,761 | 4,740 | |||
| * | Thermon Group Holdings Inc. | 263,671 | 4,464 | |||
| * | Hillman Solutions Corp. | 374,475 | 4,026 | |||
| * | Payoneer Global Inc. | 541,661 | 3,981 | |||
| Pactiv Evergreen Inc. | 282,891 | 3,587 | ||||
| *,1 | View Inc. | 772,144 | 3,019 | |||
| * | Sterling Check Corp. | 114,291 | 2,344 | |||
| * | Proterra Inc. | 261,328 | 2,308 | |||
| *,1 | Velo3D Inc. | 292,194 | 2,282 | |||
| * | Joby Aviation Inc. | 240,878 | 1,758 | |||
| * | IHS Holding Ltd. | 14,906 | 210 | |||
| * | Legalzoom.com Inc. | 8,271 | 133 | |||
| * | GXO Logistics Inc. | 992 | 90 | |||
| * | Remitly Global Inc. | 839 | 17 | |||
| * | Desktop Metal Inc. Class A | 1,750 | 9 | |||
| * | Danimer Scientific Inc. | 721 | 6 | |||
| Macquarie Infrastructure Holdings LLC | 1,302 | 5 | ||||
| * | CS Disco Inc. | 124 | 4 | |||
| * | Flywire Corp. | 85 | 3 | |||
| 10,439,019 | ||||||
| Real Estate (10.3%) | ||||||
| VICI Properties Inc. | 10,043,462 | 302,409 | ||||
| Kimco Realty Corp. | 9,843,743 | 242,648 | ||||
| Medical Properties Trust Inc. | 9,522,484 | 225,016 | ||||
| * | Jones Lang LaSalle Inc. | 805,967 | 217,079 | |||
| Life Storage Inc. | 1,309,718 | 200,623 | ||||
| Gaming & Leisure Properties Inc. | 3,615,840 | 175,947 | ||||
| Federal Realty Investment Trust | 1,242,217 | 169,339 | ||||
| EastGroup Properties Inc. | 649,673 | 148,028 | ||||
| First Industrial Realty Trust Inc. | 2,080,462 | 137,727 | ||||
| Apartment Income REIT Corp. | 2,506,913 | 137,053 | ||||
| National Retail Properties Inc. | 2,804,398 | 134,807 | ||||
| Vornado Realty Trust | 2,907,975 | 121,728 | ||||
| Brixmor Property Group Inc. | 4,742,579 | 120,509 | ||||
| Shares | Market Value• ($000) | |||||
| Omega Healthcare Investors Inc. | 3,816,270 | 112,923 | ||||
| Cousins Properties Inc. | 2,374,379 | 95,640 | ||||
| Rayonier Inc. | 2,286,007 | 92,263 | ||||
| Douglas Emmett Inc. | 2,662,256 | 89,186 | ||||
| Lamar Advertising Co. Class A | 693,203 | 84,086 | ||||
| Agree Realty Corp. | 1,114,254 | 79,513 | ||||
| SL Green Realty Corp. | 1,065,565 | 76,401 | ||||
| Healthcare Realty Trust Inc. | 2,356,012 | 74,544 | ||||
| Highwoods Properties Inc. | 1,666,842 | 74,325 | ||||
| LXP Industrial Trust | 4,514,058 | 70,510 | ||||
| * | DigitalBridge Group Inc. | 8,194,902 | 68,264 | |||
| * | Park Hotels & Resorts Inc. | 3,587,691 | 67,736 | |||
| Physicians Realty Trust | 3,517,597 | 66,236 | ||||
| Outfront Media Inc. | 2,325,390 | 62,367 | ||||
| Kilroy Realty Corp. | 929,886 | 61,800 | ||||
| PotlatchDeltic Corp. | 1,017,968 | 61,302 | ||||
| Hudson Pacific Properties Inc. | 2,434,867 | 60,166 | ||||
| EPR Properties | 1,194,531 | 56,728 | ||||
| JBG SMITH Properties | 1,967,995 | 56,501 | ||||
| Apple Hospitality REIT Inc. | 3,464,190 | 55,947 | ||||
| Macerich Co. | 3,231,950 | 55,848 | ||||
| * | Cushman & Wakefield plc | 2,319,801 | 51,592 | |||
| Regency Centers Corp. | 682,636 | 51,437 | ||||
| Newmark Group Inc. Class A | 2,748,481 | 51,397 | ||||
| Corporate Office Properties Trust | 1,793,692 | 50,170 | ||||
| Sabra Health Care REIT Inc. | 3,651,710 | 49,444 | ||||
| * | Equity Commonwealth | 1,834,171 | 47,505 | |||
| SITE Centers Corp. | 2,866,914 | 45,383 | ||||
| Kennedy-Wilson Holdings Inc. | 1,890,926 | 45,155 | ||||
| * | Sunstone Hotel Investors Inc. | 3,502,703 | 41,087 | |||
| National Health Investors Inc. | 695,592 | 39,976 | ||||
| RLJ Lodging Trust | 2,660,325 | 37,058 | ||||
| Brandywine Realty Trust | 2,732,590 | 36,671 | ||||
| Piedmont Office Realty Trust Inc. Class A | 1,982,234 | 36,433 | ||||
| Retail Opportunity Investments Corp. | 1,841,768 | 36,099 | ||||
| * | Compass Inc. Class A | 3,893,247 | 35,390 | |||
| Washington REIT | 1,351,477 | 34,936 | ||||
| Urban Edge Properties | 1,777,025 | 33,763 | ||||
| * | Xenia Hotels & Resorts Inc. | 1,823,897 | 33,031 | |||
| Shares | Market Value• ($000) | |||||
| * | DiamondRock Hospitality Co. | 3,363,694 | 32,325 | |||
| * | Realogy Holdings Corp. | 1,861,987 | 31,300 | |||
| Acadia Realty Trust | 1,412,463 | 30,834 | ||||
| Tanger Factory Outlet Centers Inc. | 1,577,506 | 30,414 | ||||
| American Assets Trust Inc. | 772,486 | 28,991 | ||||
| 1 | InvenTrust Properties Corp. | 1,019,165 | 27,782 | |||
| Alexander & Baldwin Inc. | 1,100,298 | 27,607 | ||||
| Industrial Logistics Properties Trust | 1,044,386 | 26,162 | ||||
| Global Net Lease Inc. | 1,654,129 | 25,275 | ||||
| Centerspace | 227,891 | 25,273 | ||||
| Empire State Realty Trust Inc. Class A | 2,754,217 | 24,513 | ||||
| Pebblebrook Hotel Trust | 1,049,098 | 23,468 | ||||
| Service Properties Trust | 2,636,626 | 23,176 | ||||
| * | Veris Residential Inc. | 1,234,410 | 22,688 | |||
| LTC Properties Inc. | 628,765 | 21,466 | ||||
| Getty Realty Corp. | 617,085 | 19,802 | ||||
| Office Properties Income Trust | 773,209 | 19,207 | ||||
| RPT Realty | 1,345,746 | 18,006 | ||||
| American Finance Trust Inc. Class A | 1,971,975 | 18,004 | ||||
| * | Apartment Investment & Management Co. Class A | 2,309,572 | 17,830 | |||
| CareTrust REIT Inc. | 774,788 | 17,688 | ||||
| GEO Group Inc. | 1,858,977 | 14,407 | ||||
| * | Douglas Elliman Inc. | 1,044,301 | 12,009 | |||
| Diversified Healthcare Trust | 3,817,181 | 11,795 | ||||
| Saul Centers Inc. | 208,088 | 11,033 | ||||
| Franklin Street Properties Corp. | 1,518,198 | 9,033 | ||||
| Phillips Edison & Co. Inc. | 265,888 | 8,785 | ||||
| RMR Group Inc. Class A | 247,422 | 8,581 | ||||
| * | Summit Hotel Properties Inc. | 807,611 | 7,882 | |||
| * | Seritage Growth Properties Class A | 487,741 | 6,472 | |||
| * | Forestar Group Inc. | 275,261 | 5,987 | |||
| Urstadt Biddle Properties Inc. Class A | 246,340 | 5,247 | ||||
| Alexander's Inc. | 16,283 | 4,238 | ||||
| * | Bridge Investment Group Holdings Inc. Class A | 150,753 | 3,764 | |||
| * | Offerpad Solutions Inc. | 356,722 | 2,283 | |||
| Shares | Market Value• ($000) | |||||
| Urstadt Biddle Properties Inc. | 21,801 | 418 | ||||
| *,2 | Spirit MTA REIT | 334,911 | 90 | |||
| 5,235,561 | ||||||
| Technology (6.7%) | ||||||
| * | Nuance Communications Inc. | 5,101,242 | 282,201 | |||
| * | Synaptics Inc. | 627,129 | 181,560 | |||
| * | Arrow Electronics Inc. | 1,111,969 | 149,304 | |||
| Jabil Inc. | 2,060,117 | 144,929 | ||||
| * | DXC Technology Co. | 4,028,131 | 129,666 | |||
| * | F5 Inc. | 488,894 | 119,637 | |||
| Concentrix Corp. | 668,412 | 119,392 | ||||
| KBR Inc. | 2,240,271 | 106,682 | ||||
| * | CACI International Inc. Class A | 372,523 | 100,287 | |||
| Leidos Holdings Inc. | 1,120,596 | 99,621 | ||||
| * | NCR Corp. | 2,107,981 | 84,741 | |||
| * | Cirrus Logic Inc. | 912,449 | 83,964 | |||
| * | Change Healthcare Inc. | 3,731,428 | 79,778 | |||
| TD SYNNEX Corp. | 689,910 | 78,898 | ||||
| CDK Global Inc. | 1,888,661 | 78,833 | ||||
| Science Applications International Corp. | 919,311 | 76,845 | ||||
| * | Dun & Bradstreet Holdings Inc. | 3,442,243 | 70,532 | |||
| * | Teradata Corp. | 1,646,055 | 69,908 | |||
| Avnet Inc. | 1,584,509 | 65,329 | ||||
| * | Insight Enterprises Inc. | 557,097 | 59,387 | |||
| * | Kyndryl Holdings Inc. | 2,863,462 | 51,829 | |||
| * | Rambus Inc. | 1,746,487 | 51,329 | |||
| * | Verint Systems Inc. | 940,069 | 49,363 | |||
| Xerox Holdings Corp. | 2,137,854 | 48,401 | ||||
| * | Cerence Inc. | 615,433 | 47,167 | |||
| Vishay Intertechnology Inc. | 2,119,384 | 46,351 | ||||
| * | Plexus Corp. | 447,149 | 42,877 | |||
| * | Sanmina Corp. | 976,676 | ���40,493 | |||
| Amkor Technology Inc. | 1,561,986 | 38,722 | ||||
| * | Allegro MicroSystems Inc. | 1,060,172 | 38,357 | |||
| McAfee Corp. Class A | 1,460,076 | 37,655 | ||||
| * | NetScout Systems Inc. | 1,120,746 | 37,074 | |||
| *,1 | C3.ai Inc. Class A | 1,124,701 | 35,147 | |||
| * | Allscripts Healthcare Solutions Inc. | 1,859,860 | 34,314 | |||
| Progress Software Corp. | 700,153 | 33,796 | ||||
| * | Covetrus Inc. | 1,650,346 | 32,957 | |||
| Xperi Holding Corp. | 1,669,337 | 31,567 | ||||
| * | Super Micro Computer Inc. | 694,140 | 30,507 | |||
| * | Blackbaud Inc. | 384,686 | 30,383 | |||
| *,1 | SentinelOne Inc. Class A | 599,047 | 30,246 | |||
| *,1 | Confluent Inc. Class A | 388,478 | 29,618 | |||
| Shares | Market Value• ($000) | |||||
| CSG Systems International Inc. | 495,283 | 28,538 | ||||
| Methode Electronics Inc. | 579,126 | 28,476 | ||||
| * | Avaya Holdings Corp. | 1,276,163 | 25,268 | |||
| *,1 | E2open Parent Holdings Inc. | 2,154,854 | 24,264 | |||
| * | TTM Technologies Inc. | 1,583,016 | 23,587 | |||
| * | Momentive Global Inc. | 1,012,060 | 21,405 | |||
| * | Unisys Corp. | 1,018,896 | 20,959 | |||
| * | Olo Inc. Class A | 865,486 | 18,011 | |||
| * | Amplitude Inc. Class A | 280,060 | 14,826 | |||
| Benchmark Electronics Inc. | 534,430 | 14,483 | ||||
| * | ScanSource Inc. | 407,745 | 14,304 | |||
| * | Squarespace Inc. Class A | 433,573 | 12,790 | |||
| * | Informatica Inc. Class A | 275,012 | 10,170 | |||
| * | Sumo Logic Inc. | 749,138 | 10,158 | |||
| * | Groupon Inc. | 401,226 | 9,292 | |||
| SolarWinds Corp. | 633,256 | 8,986 | ||||
| * | Paycor HCM Inc. | 278,942 | 8,036 | |||
| * | KnowBe4 Inc. Class A | 313,390 | 7,189 | |||
| * | Aeva Technologies Inc. | 939,917 | 7,106 | |||
| * | Rackspace Technology Inc. | 502,279 | 6,766 | |||
| *,1 | Samsara Inc. Class A | 223,432 | 6,281 | |||
| * | Freshworks Inc. Class A | 234,288 | 6,152 | |||
| Ebix Inc. | 197,687 | 6,010 | ||||
| * | N-able Inc. | 498,363 | 5,532 | |||
| * | Diebold Nixdorf Inc. | 588,617 | 5,327 | |||
| * | Ouster Inc. | 959,288 | 4,988 | |||
| * | Braze Inc. Class A | 63,250 | 4,880 | |||
| 1 | Vivid Seats Inc. Class A | 429,457 | 4,672 | |||
| *,1 | IonQ Inc. | 230,287 | 3,846 | |||
| * | Vertex Inc. Class A | 227,956 | 3,618 | |||
| *,1 | Expensify Inc. Class A | 81,941 | 3,605 | |||
| *,1 | Couchbase Inc. | 138,387 | 3,454 | |||
| * | Enfusion Inc. Class A | 155,603 | 3,258 | |||
| *,1 | Matterport Inc. | 145,062 | 2,994 | |||
| * | CCC Intelligent Solutions Holdings Inc. | 240,950 | 2,744 | |||
| * | Nextdoor Holdings Inc. | 319,743 | 2,523 | |||
| * | SmartRent Inc. Class A | 232,294 | 2,249 | |||
| * | WM Technology Inc. | 262,538 | 1,570 | |||
| * | AvePoint Inc. | 217,846 | 1,370 | |||
| *,1 | BuzzFeed Inc. | 208,377 | 1,111 | |||
| *,1 | NerdWallet Inc. Class A | 53,760 | 836 | |||
| * | EngageSmart Inc. | 6,667 | 161 | |||
| * | ON Semiconductor Corp. | 1,874 | 127 | |||
| * | UserTesting Inc. | 8,291 | 70 | |||
| * | EverCommerce Inc. | 2,491 | 39 | |||
| * | LiveRamp Holdings Inc. | 558 | 27 | |||
| * | JFrog Ltd. | 420 | 12 | |||
| Shares | Market Value• ($000) | |||||
| * | Thoughtworks Holding Inc. | 262 | 7 | |||
| * | Clear Secure Inc. Class A | 99 | 3 | |||
| * | ForgeRock Inc. Class A | 99 | 3 | |||
| * | Intapp Inc. | 76 | 2 | |||
| * | Zeta Global Holdings Corp. Class A | 200 | 2 | |||
| * | Sprinklr Inc. Class A | 138 | 2 | |||
| * | MeridianLink Inc. | 105 | 2 | |||
| 3,391,738 | ||||||
| Telecommunications (1.4%) | ||||||
| * | Frontier Communications Parent Inc. | 3,902,996 | 115,099 | |||
| Juniper Networks Inc. | 2,596,442 | 92,719 | ||||
| * | Vonage Holdings Corp. | 3,830,250 | 79,631 | |||
| * | Iridium Communications Inc. | 1,900,122 | 78,456 | |||
| * | Viavi Solutions Inc. | 3,795,581 | 66,878 | |||
| * | CommScope Holding Co. Inc. | 3,265,908 | 36,056 | |||
| InterDigital Inc. | 489,922 | 35,093 | ||||
| Telephone & Data Systems Inc. | 1,629,038 | 32,825 | ||||
| *,1 | fuboTV Inc. | 1,961,429 | 30,442 | |||
| * | 8x8 Inc. | 1,726,626 | 28,938 | |||
| * | Altice USA Inc. Class A | 1,715,462 | 27,756 | |||
| * | Plantronics Inc. | 648,259 | 19,020 | |||
| ADTRAN Inc. | 777,426 | 17,749 | ||||
| * | EchoStar Corp. Class A | 590,827 | 15,568 | |||
| * | NETGEAR Inc. | 444,035 | 12,970 | |||
| Shenandoah Telecommunications Co. | 379,050 | 9,666 | ||||
| * | United States Cellular Corp. | 254,821 | 8,032 | |||
| 706,898 | ||||||
| Utilities (4.3%) | ||||||
| Atmos Energy Corp. | 2,114,742 | 221,561 | ||||
| Essential Utilities Inc. | 3,632,632 | 195,036 | ||||
| NRG Energy Inc. | 3,907,588 | 168,339 | ||||
| UGI Corp. | 3,341,071 | 153,389 | ||||
| Pinnacle West Capital Corp. | 1,801,667 | 127,180 | ||||
| OGE Energy Corp. | 3,196,606 | 122,686 | ||||
| National Fuel Gas Co. | 1,456,219 | 93,111 | ||||
| IDACORP Inc. | 806,720 | 91,409 | ||||
| * | Stericycle Inc. | 1,467,011 | 87,493 | |||
| Portland General Electric Co. | 1,427,777 | 75,558 | ||||
| Black Hills Corp. | 1,019,168 | 71,923 | ||||
| Hawaiian Electric Industries Inc. | 1,658,373 | 68,822 | ||||
| ONE Gas Inc. | 855,774 | 66,399 | ||||
| Shares | Market Value• ($000) | |||||
| New Jersey Resources Corp. | 1,532,295 | 62,916 | ||||
| Southwest Gas Holdings Inc. | 897,211 | 62,850 | ||||
| PNM Resources Inc. | 1,370,656 | 62,516 | ||||
| American States Water Co. | 589,925 | 61,022 | ||||
| ALLETE Inc. | 839,548 | 55,704 | ||||
| Spire Inc. | 784,192 | 51,145 | ||||
| NorthWestern Corp. | 863,186 | 49,340 | ||||
| Avista Corp. | 1,130,121 | 48,019 | ||||
| MGE Energy Inc. | 577,531 | 47,502 | ||||
| South Jersey Industries Inc. | 1,795,737 | 46,905 | ||||
| California Water Service Group | 419,703 | 30,160 | ||||
| Northwest Natural Holding Co. | 489,553 | 23,880 | ||||
| Clearway Energy Inc. Class C | 653,940 | 23,561 | ||||
| * | Harsco Corp. | 1,264,883 | 21,136 | |||
| Clearway Energy Inc. Class A | 276,413 | 9,254 | ||||
| * | Archaea Energy Inc. | 192,312 | 3,515 | |||
| 2,202,331 | ||||||
| Total Common Stocks (Cost $35,873,634) | 50,925,971 | |||||
| Preferred Stock (0.0%) | ||||||
| Brookfield Property Preferred LP Pfd., 6.250%, 7/26/26 (Cost $1) | 40 | 1 | ||||
| Shares | Market Value• ($000) | |||||
| Temporary Cash Investments (0.3%) | ||||||
| Money Market Fund (0.3%) | ||||||
| 3,4 | Vanguard Market Liquidity Fund, 0.090% (Cost $170,930) | 1,709,773 | 170,961 | |||
| Total Investments (100.0%) (Cost $36,044,565) | 51,096,933 | |||||
| Other Assets and Liabilities—Net (0.0%) | 4,568 | |||||
| Net Assets (100%) | 51,101,501 | |||||
| Cost is in $000. | |
| • | See Note A in Notes to Financial Statements. |
| * | Non-income-producing security. |
| 1 | Includes partial security positions on loan to broker-dealers. The total value of securities on loan is $159,644,000. |
| 2 | Security value determined using significant unobservable inputs. |
| 3 | Affiliated money market fund available only to Vanguard funds and certain trusts and accounts managed by Vanguard. Rate shown is the 7-day yield. |
| 4 | Collateral of $171,563,000 was received for securities on loan, of which $170,953,000 is held in Vanguard Market Liquidity Fund and $610,000 is held in cash. |
| REIT—Real Estate Investment Trust. |
| Futures Contracts | ||||
| ($000) | ||||
| Expiration | Number of Long (Short) Contracts | Notional Amount | Value and Unrealized Appreciation (Depreciation) | |
| Long Futures Contracts | ||||
| E-mini Russell 2000 Index | March 2022 | 1,480 | 165,967 | (48) |
| Over-the-Counter Total Return Swaps | ||||||
| Reference Entity | Termination Date | Counterparty | Notional Amount ($000) | Floating Interest Rate Received (Paid) (%) | Value and Unrealized Appreciation ($000) | Value and Unrealized (Depreciation) ($000) |
| Bridgebio Pharma Inc. | 8/31/22 | BOANA | 12,150 | (0.066)1 | — | (7,147) |
| New York Community Bancorp Inc. | 8/31/22 | BOANA | 2,995 | (0.623)1 | 56 | — |
| Novavax Inc. | 1/31/22 | GSI | 26,924 | (0.109)2 | — | (5,464) |
| 56 | (12,611) | |||||
| 1 | Based on USD Overnight Bank Funding Rate as of the most recent payment date. Floating interest payment received/paid monthly. |
| 2 | Based on 1M USD London Interbank Offered Rate (LIBOR) as of the most recent payment date. Floating interest payment received/paid monthly. |
| 1M—1-month. | |
| BOANA—Bank of America, N.A. | |
| GSI—Goldman Sachs International. |
| ($000s, except shares and per-share amounts) | Amount |
| Assets | |
| Investments in Securities, at Value | |
| Unaffiliated Issuers (Cost $35,873,635) | 50,925,972 |
| Affiliated Issuers (Cost $170,930) | 170,961 |
| Total Investments in Securities | 51,096,933 |
| Investment in Vanguard | 1,608 |
| Cash | 610 |
| Cash Collateral Pledged—Futures Contracts | 960 |
| Cash Collateral Pledged—Over-the-Counter Swap Contracts | 10,170 |
| Receivables for Investment Securities Sold | 184,348 |
| Receivables for Accrued Income | 62,398 |
| Receivables for Capital Shares Issued | 21,771 |
| Unrealized Appreciation—Over-the-Counter Swap Contracts | 56 |
| Total Assets | 51,378,854 |
| Liabilities | |
| Due to Custodian | 14,038 |
| Payables for Investment Securities Purchased | 24,328 |
| Collateral for Securities on Loan | 171,563 |
| Payables for Capital Shares Redeemed | 53,243 |
| Payables to Vanguard | 1,535 |
| Variation Margin Payable—Futures Contracts | 35 |
| Unrealized Depreciation—Over-the-Counter Swap Contracts | 12,611 |
| Total Liabilities | 277,353 |
| Net Assets | 51,101,501 |
| Statement of Assets and Liabilities (continued) | |
| At December 31, 2021, net assets consisted of: | |
| ($000s, except shares and per-share amounts) | Amount |
| Paid-in Capital | 38,975,643 |
| Total Distributable Earnings (Loss) | 12,125,858 |
| Net Assets | 51,101,501 |
| Investor Shares—Net Assets | |
| Applicable to 4,849,732 outstanding $.001 par value shares of beneficial interest (unlimited authorization) | 207,887 |
| Net Asset Value Per Share—Investor Shares | $42.87 |
| ETF Shares—Net Assets | |
| Applicable to 150,214,945 outstanding $.001 par value shares of beneficial interest (unlimited authorization) | 26,853,662 |
| Net Asset Value Per Share—ETF Shares | $178.77 |
| Admiral Shares—Net Assets | |
| Applicable to 251,340,652 outstanding $.001 par value shares of beneficial interest (unlimited authorization) | 19,306,711 |
| Net Asset Value Per Share—Admiral Shares | $76.81 |
| Institutional Shares—Net Assets | |
| Applicable to 110,239,330 outstanding $.001 par value shares of beneficial interest (unlimited authorization) | 4,733,241 |
| Net Asset Value Per Share—Institutional Shares | $42.94 |
| Year Ended December 31, 2021 | |
| ($000) | |
| Investment Income | |
| Income | |
| Dividends1 | 888,797 |
| Interest2 | 66 |
| Securities Lending—Net | 13,205 |
| Total Income | 902,068 |
| Expenses | |
| The Vanguard Group—Note B | |
| Investment Advisory Services | 2,919 |
| Management and Administrative—Investor Shares | 445 |
| Management and Administrative—ETF Shares | 13,195 |
| Management and Administrative—Admiral Shares | 10,279 |
| Management and Administrative—Institutional Shares | 2,091 |
| Marketing and Distribution—Investor Shares | 16 |
| Marketing and Distribution—ETF Shares | 909 |
| Marketing and Distribution—Admiral Shares | 683 |
| Marketing and Distribution—Institutional Shares | 143 |
| Custodian Fees | 518 |
| Auditing Fees | 41 |
| Shareholders’ Reports—Investor Shares | 1 |
| Shareholders’ Reports—ETF Shares | 876 |
| Shareholders’ Reports—Admiral Shares | 242 |
| Shareholders’ Reports—Institutional Shares | 97 |
| Trustees’ Fees and Expenses | 15 |
| Total Expenses | 32,470 |
| Net Investment Income | 869,598 |
| Realized Net Gain (Loss) | |
| Investment Securities Sold2,3 | 2,608,294 |
| Futures Contracts | 5,727 |
| Swap Contracts | 4,629 |
| Realized Net Gain (Loss) | 2,618,650 |
| Statement of Operations (continued) | |
| Year Ended December 31, 2021 | |
| ($000) | |
| Change in Unrealized Appreciation (Depreciation) | |
| Investment Securities2 | 7,034,785 |
| Futures Contracts | (331) |
| Swap Contracts | (10,507) |
| Change in Unrealized Appreciation (Depreciation) | 7,023,947 |
| Net Increase (Decrease) in Net Assets Resulting from Operations | 10,512,195 |
| 1 | Dividends are net of foreign withholding taxes of $4,000. |
| 2 | Interest income, realized net gain (loss), capital gain distributions received, and change in unrealized appreciation (depreciation) from an affiliated company of the fund were $66,000, $8,000, $3,000, and ($27,000), respectively. Purchases and sales are for temporary cash investment purposes. |
| 3 | Includes $2,011,494,000 of net gain (loss) resulting from in-kind redemptions. |
| Year Ended December 31, | ||
| 2021 ($000) | 2020 ($000) | |
| Increase (Decrease) in Net Assets | ||
| Operations | ||
| Net Investment Income | 869,598 | 620,314 |
| Realized Net Gain (Loss) | 2,618,650 | (634,360) |
| Change in Unrealized Appreciation (Depreciation) | 7,023,947 | 2,345,495 |
| Net Increase (Decrease) in Net Assets Resulting from Operations | 10,512,195 | 2,331,449 |
| Distributions | ||
| Investor Shares | (4,230) | (3,847) |
| ETF Shares | (452,167) | (285,203) |
| Admiral Shares | (333,221) | (241,645) |
| Institutional Shares | (82,438) | (63,508) |
| Total Distributions | (872,056) | (594,203) |
| Capital Share Transactions | ||
| Investor Shares | (85,331) | (25,540) |
| ETF Shares | 4,135,700 | 1,967,955 |
| Admiral Shares | 1,226,583 | (82,929) |
| Institutional Shares | 25,431 | (39,394) |
| Net Increase (Decrease) from Capital Share Transactions | 5,302,383 | 1,820,092 |
| Total Increase (Decrease) | 14,942,522 | 3,557,338 |
| Net Assets | ||
| Beginning of Period | 36,158,979 | 32,601,641 |
| End of Period | 51,101,501 | 36,158,979 |
| Investor Shares | |||||
| For a Share Outstanding Throughout Each Period | Year Ended December 31, | ||||
| 2021 | 2020 | 2019 | 2018 | 2017 | |
| Net Asset Value, Beginning of Period | $34.08 | $32.86 | $27.35 | $31.82 | $29.00 |
| Investment Operations | |||||
| Net Investment Income1 | .724 | .550 | .543 | .603 | .534 |
| Net Realized and Unrealized Gain (Loss) on Investments | 8.767 | 1.208 | 5.608 | (4.471) | 2.820 |
| Total from Investment Operations | 9.491 | 1.758 | 6.151 | (3.868) | 3.354 |
| Distributions | |||||
| Dividends from Net Investment Income | (.701) | (.538) | (.641) | (.602) | (.534) |
| Distributions from Realized Capital Gains | — | — | — | — | — |
| Total Distributions | (.701) | (.538) | (.641) | (.602) | (.534) |
| Net Asset Value, End of Period | $42.87 | $34.08 | $32.86 | $27.35 | $31.82 |
| Total Return2 | 27.96% | 5.72% | 22.61% | -12.34% | 11.67% |
| Ratios/Supplemental Data | |||||
| Net Assets, End of Period (Millions) | $208 | $234 | $255 | $1,501 | $2,060 |
| Ratio of Total Expenses to Average Net Assets | 0.19% | 0.19% | 0.19% | 0.19% | 0.19% |
| Ratio of Net Investment Income to Average Net Assets | 1.78% | 1.98% | 1.76% | 1.92% | 1.82% |
| Portfolio Turnover Rate3 | 16% | 26% | 19% | 18% | 19% |
| 1 | Calculated based on average shares outstanding. |
| 2 | Total returns do not include account service fees that may have applied in the periods shown. Fund prospectuses provide information about any applicable account service fees. |
| 3 | Excludes the value of portfolio securities received or delivered as a result of in-kind purchases or redemptions of the fund’s capital shares, including ETF Creation Units. |
| ETF Shares | |||||
| For a Share Outstanding Throughout Each Period | Year Ended December 31, | ||||
| 2021 | 2020 | 2019 | 2018 | 2017 | |
| Net Asset Value, Beginning of Period | $142.13 | $137.05 | $114.05 | $132.71 | $120.95 |
| Investment Operations | |||||
| Net Investment Income1 | 3.131 | 2.584 | 2.840 | 2.720 | 2.427 |
| Net Realized and Unrealized Gain (Loss) on Investments | 36.640 | 4.884 | 22.984 | (18.702) | 11.709 |
| Total from Investment Operations | 39.771 | 7.468 | 25.824 | (15.982) | 14.136 |
| Distributions | |||||
| Dividends from Net Investment Income | (3.131) | (2.388) | (2.824) | (2.678) | (2.376) |
| Distributions from Realized Capital Gains | — | — | — | — | — |
| Total Distributions | (3.131) | (2.388) | (2.824) | (2.678) | (2.376) |
| Net Asset Value, End of Period | $178.77 | $142.13 | $137.05 | $114.05 | $132.71 |
| Total Return | 28.07% | 5.82% | 22.76% | -12.22% | 11.79% |
| Ratios/Supplemental Data | |||||
| Net Assets, End of Period (Millions) | $26,854 | $17,837 | $14,808 | $11,560 | $12,650 |
| Ratio of Total Expenses to Average Net Assets | 0.07% | 0.07% | 0.07% | 0.07% | 0.07% |
| Ratio of Net Investment Income to Average Net Assets | 1.84% | 2.23% | 2.19% | 2.04% | 1.94% |
| Portfolio Turnover Rate2 | 16% | 26% | 19% | 18% | 19% |
| 1 | Calculated based on average shares outstanding. |
| 2 | Excludes the value of portfolio securities received or delivered as a result of in-kind purchases or redemptions of the fund’s capital shares, including ETF Creation Units. |
| Admiral Shares | |||||
| For a Share Outstanding Throughout Each Period | Year Ended December 31, | ||||
| 2021 | 2020 | 2019 | 2018 | 2017 | |
| Net Asset Value, Beginning of Period | $61.07 | $58.89 | $49.01 | $57.02 | $51.97 |
| Investment Operations | |||||
| Net Investment Income1 | 1.381 | 1.058 | 1.230 | 1.165 | 1.039 |
| Net Realized and Unrealized Gain (Loss) on Investments | 15.704 | 2.148 | 9.863 | (8.024) | 5.032 |
| Total from Investment Operations | 17.085 | 3.206 | 11.093 | (6.859) | 6.071 |
| Distributions | |||||
| Dividends from Net Investment Income | (1.345) | (1.026) | (1.213) | (1.151) | (1.021) |
| Distributions from Realized Capital Gains | — | — | — | — | — |
| Total Distributions | (1.345) | (1.026) | (1.213) | (1.151) | (1.021) |
| Net Asset Value, End of Period | $76.81 | $61.07 | $58.89 | $49.01 | $57.02 |
| Total Return2 | 28.09% | 5.85% | 22.76% | -12.23% | 11.80% |
| Ratios/Supplemental Data | |||||
| Net Assets, End of Period (Millions) | $19,307 | $14,314 | $13,907 | $10,167 | $11,278 |
| Ratio of Total Expenses to Average Net Assets | 0.07% | 0.07% | 0.07% | 0.07% | 0.07% |
| Ratio of Net Investment Income to Average Net Assets | 1.89% | 2.13% | 2.21% | 2.04% | 1.94% |
| Portfolio Turnover Rate3 | 16% | 26% | 19% | 18% | 19% |
| 1 | Calculated based on average shares outstanding. |
| 2 | Total returns do not include account service fees that may have applied in the periods shown. Fund prospectuses provide information about any applicable account service fees. |
| 3 | Excludes the value of portfolio securities received or delivered as a result of in-kind purchases or redemptions of the fund’s capital shares, including ETF Creation Units. |
| Institutional Shares | |||||
| For a Share Outstanding Throughout Each Period | Year Ended December 31, | ||||
| 2021 | 2020 | 2019 | 2018 | 2017 | |
| Net Asset Value, Beginning of Period | $34.14 | $32.92 | $27.39 | $31.87 | $29.05 |
| Investment Operations | |||||
| Net Investment Income1 | .781 | .597 | .684 | .651 | .587 |
| Net Realized and Unrealized Gain (Loss) on Investments | 8.775 | 1.199 | 5.527 | (4.485) | 2.808 |
| Total from Investment Operations | 9.556 | 1.796 | 6.211 | (3.834) | 3.395 |
| Distributions | |||||
| Dividends from Net Investment Income | (.756) | (.576) | (.681) | (.646) | (.575) |
| Distributions from Realized Capital Gains | — | — | — | — | — |
| Total Distributions | (.756) | (.576) | (.681) | (.646) | (.575) |
| Net Asset Value, End of Period | $42.94 | $34.14 | $32.92 | $27.39 | $31.87 |
| Total Return | 28.11% | 5.86% | 22.81% | -12.23% | 11.80% |
| Ratios/Supplemental Data | |||||
| Net Assets, End of Period (Millions) | $4,733 | $3,774 | $3,632 | $3,077 | $3,649 |
| Ratio of Total Expenses to Average Net Assets | 0.06% | 0.06% | 0.06% | 0.06% | 0.06% |
| Ratio of Net Investment Income to Average Net Assets | 1.91% | 2.14% | 2.20% | 2.05% | 1.95% |
| Portfolio Turnover Rate2 | 16% | 26% | 19% | 18% | 19% |
| 1 | Calculated based on average shares outstanding. |
| 2 | Excludes the value of portfolio securities received or delivered as a result of in-kind purchases or redemptions of the fund’s capital shares, including ETF Creation Units. |
| A. | The following significant accounting policies conform to generally accepted accounting principles for U.S. investment companies. The fund consistently follows such policies in preparing its financial statements. |
| B. | In accordance with the terms of a Funds’ Service Agreement (the “FSA”) between Vanguard and the fund, Vanguard furnishes to the fund investment advisory, corporate management, administrative, marketing, and distribution services at Vanguard’s cost of operations (as defined by the FSA). These costs of operations are allocated to the fund based on methods and guidelines approved by the board of trustees and are generally settled twice a month. |
| C. | Various inputs may be used to determine the value of the fund’s investments and derivatives. These inputs are summarized in three broad levels for financial statement purposes. The inputs or methodologies used to value securities are not necessarily an indication of the risk associated with investing in those securities. |
| Level 1 ($000) | Level 2 ($000) | Level 3 ($000) | Total ($000) | |
| Investments | ||||
| Assets | ||||
| Common Stocks | 50,925,881 | — | 90 | 50,925,971 |
| Preferred Stock | 1 | — | — | 1 |
| Temporary Cash Investments | 170,961 | — | — | 170,961 |
| Total | 51,096,843 | — | 90 | 51,096,933 |
| Derivative Financial Instruments | ||||
| Assets | ||||
| Swap Contracts | — | 56 | — | 56 |
| Liabilities | ||||
| Futures Contracts1 | 48 | — | — | 48 |
| Swap Contracts | — | 12,611 | — | 12,611 |
| Total | 48 | 12,611 | — | 12,659 |
| 1 | Includes cumulative appreciation (depreciation) on futures contracts and centrally cleared swaps, if any, as reported in the Schedule of Investments. Only current day’s variation margin is reported within the Statement of Assets and Liabilities. |
| D. | Permanent differences between book-basis and tax-basis components of net assets are reclassified among capital accounts in the financial statements to reflect their tax character. These reclassifications have no effect on net assets or net asset value per share. As of period end, permanent differences primarily attributable to the accounting for in-kind redemptions, passive foreign investment companies, and swap agreements were reclassified between the following accounts: |
| Amount ($000) | |
| Paid-in Capital | 2,011,211 |
| Total Distributable Earnings (Loss) | (2,011,211) |
| Amount ($000) | |
| Undistributed Ordinary Income | 13,910 |
| Undistributed Long-Term Gains | — |
| Capital Loss Carryforwards | (2,897,288) |
| Qualified Late-Year Losses | — |
| Net Unrealized Gains (Losses) | 15,009,236 |
| Year Ended December 31, | ||
| 2021 Amount ($000) | 2020 Amount ($000) | |
| Ordinary Income* | 872,056 | 594,203 |
| Long-Term Capital Gains | — | — |
| Total | 872,056 | 594,203 |
| * | Includes short-term capital gains, if any. |
| Amount ($000) | |
| Tax Cost | 36,087,697 |
| Gross Unrealized Appreciation | 17,213,819 |
| Gross Unrealized Depreciation | (2,204,583) |
| Net Unrealized Appreciation (Depreciation) | 15,009,236 |
| E. | During the year ended December 31, 2021, the fund purchased $15,683,409,000 of investment securities and sold $10,445,012,000 of investment securities, other than temporary cash investments. Purchases and sales include $6,748,626,000 and $3,251,151,000, respectively, in connection with in-kind purchases and redemptions of the fund’s capital shares. |
| F. | Capital share transactions for each class of shares were: |
| Year Ended December 31, | |||||
| 2021 | 2020 | ||||
| Amount ($000) | Shares (000) | Amount ($000) | Shares (000) | ||
| Investor Shares | |||||
| Issued | 54,280 | 1,367 | 19,233 | 700 | |
| Issued in Lieu of Cash Distributions | 4,230 | 104 | 3,847 | 138 | |
| Redeemed | (143,841) | (3,484) | (48,620) | (1,724) | |
| Net Increase (Decrease)—Investor Shares | (85,331) | (2,013) | (25,540) | (886) | |
| ETF Shares | |||||
| Issued | 7,328,388 | 43,317 | 4,997,914 | 43,220 | |
| Issued in Lieu of Cash Distributions | — | — | — | — | |
| Redeemed | (3,192,688) | (18,600) | (3,029,959) | (25,775) | |
| Net Increase (Decrease)—ETF Shares | 4,135,700 | 24,717 | 1,967,955 | 17,445 | |
| Admiral Shares | |||||
| Issued | 4,310,954 | 59,661 | 3,197,023 | 67,416 | |
| Issued in Lieu of Cash Distributions | 290,460 | 3,954 | 210,169 | 4,208 | |
| Redeemed | (3,374,831) | (46,666) | (3,490,121) | (73,393) | |
| Net Increase (Decrease)—Admiral Shares | 1,226,583 | 16,949 | (82,929) | (1,769) | |
| Institutional Shares | |||||
| Issued | 1,068,001 | 26,335 | 884,087 | 33,455 | |
| Issued in Lieu of Cash Distributions | 77,051 | 1,876 | 57,484 | 2,056 | |
| Redeemed | (1,119,621) | (28,530) | (980,965) | (35,290) | |
| Net Increase (Decrease)—Institutional Shares | 25,431 | (319) | (39,394) | 221 | |
| G. | Management has determined that no events or transactions occurred subsequent to December 31, 2021, that would require recognition or disclosure in these financial statements. |
Philadelphia, Pennsylvania
February 17, 2022
| Fund | ($000) |
| Small-Cap Index Fund | 1,402,228 |
| Small-Cap Growth Index Fund | 128,007 |
| Small-Cap Value Index Fund | 739,591 |
| Fund | ($000) |
| Small-Cap Index Fund | 208,316 |
| Small-Cap Growth Index Fund | 5,098 |
| Small-Cap Value Index Fund | 88,078 |
| Fund | Percentage |
| Small-Cap Index Fund | 78.3% |
| Small-Cap Growth Index Fund | 94.6 |
| Small-Cap Value Index Fund | 80.0 |
| Matthew Benchener | Thomas M. Rampulla |
| Joseph Brennan | Karin A. Risi |
| Mortimer J. Buckley | Anne E. Robinson |
| Gregory Davis | Michael Rollings |
| John James | Nitin Tandon |
| John T. Marcante | Lauren Valente |
| Chris D. McIsaac |

Who Are Deaf or Hard of Hearing > 800-749-7273
All rights reserved.
U.S. Patent No. 6,879,964.
Vanguard Marketing Corporation, Distributor.

Mid-Capitalization Portfolios
| Vanguard Extended Market Index Fund |
| Vanguard Mid-Cap Index Fund |
| Vanguard Mid-Cap Growth Index Fund |
| Vanguard Mid-Cap Value Index Fund |
| 1 | |
| 2 | |
| 5 | |
| 75 | |
| 102 | |
| 122 |
| • | For the 12 months ended December 31, 2021, returns for the three Vanguard Mid-Cap Index Funds ranged from 20.32% for Investor Shares of Vanguard Mid-Cap Growth Index Fund to 28.76% for Admiral Shares of Vanguard Mid-Cap Value Index Fund. All share classes of Vanguard Extended Market Index Fund, which includes both small- and mid-capitalization holdings, returned more than 12%. Each fund closely tracked its target index. |
| • | Vaccination programs started shortly after the period began—helping some of the hardest-hit sectors, such as hospitality and travel, begin to rebound—and more workers returned to the labor force. U.S. stocks performed strongly even as new COVID-19 variants spread, inflation surged, and Federal Reserve monetary policy turned less accommodative. |
| • | Technology contributed most to the Mid-Cap Index Fund and financials contributed most to the Value Index Fund. Financials and industrials helped the Extended Market Index Fund’s performance most. Technology contributed most to the Growth Index Fund. |
| • | Consumer staples performed poorly for the Mid-Cap Growth and Mid-Cap Index Funds. Health care contributed least to the Extended Market and Mid-Cap Value Index Funds. |
| • | Please note that the Extended Market Index Fund uses the Global Industry Classification Standard methodology, while the three other funds use the Industry Classification Benchmark methodology. |
| Average Annual Total Returns Periods Ended December 31, 2021 | |||
| One Year | Three Years | Five Years | |
| Stocks | |||
| Russell 1000 Index (Large-caps) | 26.45% | 26.21% | 18.43% |
| Russell 2000 Index (Small-caps) | 14.82 | 20.02 | 12.02 |
| Russell 3000 Index (Broad U.S. market) | 25.66 | 25.79 | 17.97 |
| FTSE All-World ex US Index (International) | 8.36 | 13.66 | 9.89 |
| Bonds | |||
| Bloomberg U.S. Aggregate Bond Index (Broad taxable market) | -1.54% | 4.79% | 3.57% |
| Bloomberg Municipal Bond Index (Broad tax-exempt market) | 1.52 | 4.73 | 4.17 |
| FTSE Three-Month U.S. Treasury Bill Index | 0.05 | 0.95 | 1.11 |
| CPI | |||
| Consumer Price Index | 7.04% | 3.53% | 2.92% |
| • | Based on actual fund return. This section helps you to estimate the actual expenses that you paid over the period. The ”Ending Account Value“ shown is derived from the fund’s actual return, and the third column shows the dollar amount that would have been paid by an investor who started with $1,000 in the fund. You may use the information here, together with the amount you invested, to estimate the expenses that you paid over the period. |
| • | Based on hypothetical 5% yearly return. This section is intended to help you compare your fund‘s costs with those of other mutual funds. It assumes that the fund had a yearly return of 5% before expenses, but that the expense ratio is unchanged. In this case—because the return used is not the fund’s actual return—the results do not apply to your investment. The example is useful in making comparisons because the Securities and Exchange Commission requires all mutual funds to calculate expenses based on a 5% return. You can assess your fund’s costs by comparing this hypothetical example with the hypothetical examples that appear in shareholder reports of other funds. |
| Six Months Ended December 31, 2021 | |||
| Beginning Account Value 6/30/2021 | Ending Account Value 12/31/2021 | Expenses Paid During Period | |
| Based on Actual Fund Return | |||
| Extended Market Index Fund | |||
| Investor Shares | $1,000.00 | $973.40 | $0.95 |
| ETF Shares | 1,000.00 | 974.00 | 0.30 |
| Admiral™ Shares | 1,000.00 | 974.00 | 0.30 |
| Institutional Shares | 1,000.00 | 974.10 | 0.25 |
| Institutional Plus Shares | 1,000.00 | 974.10 | 0.20 |
| Institutional Select Shares | 1,000.00 | 974.20 | 0.10 |
| Mid-Cap Index Fund | |||
| Investor Shares | $1,000.00 | $1,079.10 | $0.89 |
| ETF Shares | 1,000.00 | 1,079.70 | 0.21 |
| Admiral Shares | 1,000.00 | 1,079.80 | 0.26 |
| Institutional Shares | 1,000.00 | 1,080.00 | 0.21 |
| Institutional Plus Shares | 1,000.00 | 1,079.90 | 0.16 |
| Mid-Cap Growth Index Fund | |||
| Investor Shares | $1,000.00 | $1,078.60 | $1.00 |
| ETF Shares | 1,000.00 | 1,079.20 | 0.37 |
| Admiral Shares | 1,000.00 | 1,079.20 | 0.37 |
| Mid-Cap Value Index Fund | |||
| Investor Shares | $1,000.00 | $1,079.50 | $1.00 |
| ETF Shares | 1,000.00 | 1,080.00 | 0.37 |
| Admiral Shares | 1,000.00 | 1,080.10 | 0.37 |
| Six Months Ended December 31, 2021 | |||
| Beginning Account Value 6/30/2021 | Ending Account Value 12/31/2021 | Expenses Paid During Period | |
| Based on Hypothetical 5% Yearly Return | |||
| Extended Market Index Fund | |||
| Investor Shares | $1,000.00 | $1,024.25 | $0.97 |
| ETF Shares | 1,000.00 | 1,024.90 | 0.31 |
| AdmiralTM Shares | 1,000.00 | 1,024.90 | 0.31 |
| Institutional Shares | 1,000.00 | 1,024.95 | 0.26 |
| Institutional Plus Shares | 1,000.00 | 1,025.00 | 0.20 |
| Institutional Select Shares | 1,000.00 | 1,025.10 | 0.10 |
| Mid-Cap Index Fund | |||
| Investor Shares | $1,000.00 | $1,024.35 | $0.87 |
| ETF Shares | 1,000.00 | 1,025.00 | 0.20 |
| Admiral Shares | 1,000.00 | 1,024.95 | 0.26 |
| Institutional Shares | 1,000.00 | 1,025.00 | 0.20 |
| Institutional Plus Shares | 1,000.00 | 1,025.05 | 0.15 |
| Mid-Cap Growth Index Fund | |||
| Investor Shares | $1,000.00 | $1,024.25 | $0.97 |
| ETF Shares | 1,000.00 | 1,024.85 | 0.36 |
| Admiral Shares | 1,000.00 | 1,024.85 | 0.36 |
| Mid-Cap Value Index Fund | |||
| Investor Shares | $1,000.00 | $1,024.25 | $0.97 |
| ETF Shares | 1,000.00 | 1,024.85 | 0.36 |
| Admiral Shares | 1,000.00 | 1,024.85 | 0.36 |

| Average Annual Total Returns Periods Ended December 31, 2021 | |||||
| One Year | Five Years | Ten Years | Final Value of a $10,000 Investment | ||
 | Extended Market Index Fund Investor Shares | 12.31% | 15.15% | 14.83% | $39,846 |
 | S&P Completion Index | 12.35 | 15.20 | 14.88 | 40,032 |
 | Dow Jones U.S. Total Stock Market Float Adjusted Index | 25.66 | 17.92 | 16.24 | 45,050 |
| One Year | Five Years | Ten Years | Final Value of a $10,000 Investment | ||
| Extended Market Index Fund ETF Shares Net Asset Value | 12.44% | 15.29% | 14.97% | $40,360 | |
| Extended Market Index Fund ETF Shares Market Price | 12.38 | 15.28 | 14.98 | 40,387 | |
| S&P Completion Index | 12.35 | 15.20 | 14.88 | 40,032 | |
| Dow Jones U.S. Total Stock Market Float Adjusted Index | 25.66 | 17.92 | 16.24 | 45,050 | |
| Average Annual Total Returns Periods Ended December 31, 2021 | |||||
| One Year | Five Years | Ten Years | Final Value of a $10,000 Investment | ||
| Extended Market Index Fund Admiral Shares | 12.45% | 15.30% | 14.97% | $40,366 | |
| S&P Completion Index | 12.35 | 15.20 | 14.88 | 40,032 | |
| Dow Jones U.S. Total Stock Market Float Adjusted Index | 25.66 | 17.92 | 16.24 | 45,050 | |
| One Year | Five Years | Ten Years | Final Value of a $5,000,000 Investment | ||
| Extended Market Index Fund Institutional Shares | 12.47% | 15.31% | 14.99% | $20,216,995 | |
| S&P Completion Index | 12.35 | 15.20 | 14.88 | 20,016,110 | |
| Dow Jones U.S. Total Stock Market Float Adjusted Index | 25.66 | 17.92 | 16.24 | 22,525,162 | |
| One Year | Five Years | Ten Years | Final Value of a $100,000,000 Investment | ||
| Extended Market Index Fund Institutional Plus Shares | 12.48% | 15.32% | 15.01% | $404,869,450 | |
| S&P Completion Index | 12.35 | 15.20 | 14.88 | 400,322,190 | |
| Dow Jones U.S. Total Stock Market Float Adjusted Index | 25.66 | 17.92 | 16.24 | 450,503,240 | |
| One Year | Five Years | Since Inception (6/27/2016) | Final Value of a $3,000,000,000 Investment | ||
| Extended Market Index Fund Institutional Select Shares | 12.50% | 15.35% | 17.63% | $7,341,276,000 | |
| S&P Completion Index | 12.35 | 15.20 | 17.47 | 7,285,236,900 | |
| Dow Jones U.S. Total Stock Market Float Adjusted Index | 25.66 | 17.92 | 18.98 | 7,816,813,200 | |
| Cumulative Returns of ETF Shares: December 31, 2011, Through December 31, 2021 | |||
| One Year | Five Years | Ten Years | |
| Extended Market Index Fund ETF Shares Market Price | 12.38% | 103.63% | 303.87% |
| Extended Market Index Fund ETF Shares Net Asset Value | 12.44 | 103.71 | 303.60 |
| S&P Completion Index | 12.35 | 102.93 | 300.32 |
| Communication Services | 4.3% |
| Consumer Discretionary | 12.0 |
| Consumer Staples | 2.8 |
| Energy | 2.6 |
| Financials | 14.3 |
| Health Care | 13.3 |
| Industrials | 14.0 |
| Information Technology | 23.5 |
| Materials | 3.7 |
| Other | 0.0 |
| Real Estate | 7.5 |
| Utilities | 2.0 |
| Shares | Market Value• ($000) | |||||
| Common Stocks (99.2%) | ||||||
| Communication Services (4.3%) | ||||||
| * | Snap Inc. Class A | 14,209,342 | 668,265 | |||
| * | Liberty Broadband Corp. Class C | 2,026,784 | 326,515 | |||
| * | Roku Inc. | 1,237,138 | 282,315 | |||
| * | Pinterest Inc. Class A | 7,454,774 | 270,981 | |||
| * | ZoomInfo Technologies Inc. Class A | 4,004,342 | 257,079 | |||
| *,1 | AMC Entertainment Holdings Inc. Class A | 6,742,522 | 183,397 | |||
| * | Liberty Media Corp.-Liberty Formula One Class C | 2,562,321 | 162,041 | |||
| * | Liberty Global plc Class C | 5,324,075 | 149,553 | |||
| * | IAC/InterActiveCorp | 1,105,686 | 144,524 | |||
| Cable One Inc. | 65,541 | 115,578 | ||||
| New York Times Co. Class A | 2,208,527 | 106,672 | ||||
| * | Liberty Media Corp.-Liberty SiriusXM Class C | 2,061,346 | 104,819 | |||
| * | Zynga Inc. Class A | 13,994,227 | 89,563 | |||
| Nexstar Media Group Inc. Class A | 540,075 | 81,540 | ||||
| * | Frontier Communications Parent Inc. | 2,740,783 | 80,826 | |||
| * | Iridium Communications Inc. | 1,743,949 | 72,008 | |||
| * | Ziff Davis Inc. | 629,451 | 69,781 | |||
| Warner Music Group Corp. Class A | 1,349,969 | 58,292 | ||||
| * | Liberty Media Corp.-Liberty SiriusXM Class A | 1,084,109 | 55,127 | |||
| TEGNA Inc. | 2,907,649 | 53,966 | ||||
| 1 | Sirius XM Holdings Inc. | 7,975,517 | 50,644 | |||
| * | Altice USA Inc. Class A | 2,981,032 | 48,233 | |||
| Cogent Communications Holdings Inc. | 551,570 | 40,364 | ||||
| Shares | Market Value• ($000) | |||||
| * | Madison Square Garden Sports Corp. | 223,466 | 38,823 | |||
| * | Liberty Global plc Class A | 1,385,248 | 38,427 | |||
| * | Cargurus Inc. Class A | 1,138,457 | 38,298 | |||
| * | Vimeo Inc. | 2,048,531 | 36,792 | |||
| * | TripAdvisor Inc. | 1,282,090 | 34,950 | |||
| John Wiley & Sons Inc. Class A | 587,718 | 33,659 | ||||
| * | TechTarget Inc. | 344,685 | 32,973 | |||
| * | Bumble Inc. Class A | 959,853 | 32,501 | |||
| * | Yelp Inc. Class A | 879,742 | 31,882 | |||
| * | iHeartMedia Inc. Class A | 1,456,358 | 30,642 | |||
| *,1 | fuboTV Inc. | 1,903,615 | 29,544 | |||
| * | Cardlytics Inc. | 441,137 | 29,155 | |||
| World Wrestling Entertainment Inc. Class A | 583,808 | 28,805 | ||||
| * | Magnite Inc. | 1,515,099 | 26,514 | |||
| Telephone & Data Systems Inc. | 1,293,639 | 26,067 | ||||
| *,1 | Skillz Inc. Class A | 3,485,025 | 25,929 | |||
| * | Liberty Media Corp.-Liberty Formula One Class A | 434,250 | 25,768 | |||
| * | Lions Gate Entertainment Corp. Class B | 1,642,698 | 25,281 | |||
| * | Madison Square Garden Entertainment Corp. | 340,129 | 23,925 | |||
| * | Liberty Broadband Corp. Class A | 146,199 | 23,523 | |||
| * | Playtika Holding Corp. | 1,358,538 | 23,489 | |||
| Gray Television Inc. | 1,158,688 | 23,359 | ||||
| * | Cinemark Holdings Inc. | 1,365,178 | 22,007 | |||
| * | Bandwidth Inc. Class A | 296,179 | 21,254 | |||
| * | Liberty Latin America Ltd. Class C | 1,769,209 | 20,169 | |||
| * | Clear Channel Outdoor Holdings Inc. | 6,062,522 | 20,067 | |||
| * | Eventbrite Inc. Class A | 1,011,407 | 17,639 | |||
| Shares | Market Value• ($000) | |||||
| Sinclair Broadcast Group Inc. Class A | 660,743 | 17,463 | ||||
| Shenandoah Telecommunications Co. | 665,657 | 16,974 | ||||
| Scholastic Corp. | 417,208 | 16,672 | ||||
| * | WideOpenWest Inc. | 703,001 | 15,129 | |||
| EW Scripps Co. Class A | 730,620 | 14,137 | ||||
| * | Anterix Inc. | 235,650 | 13,847 | |||
| * | Cars.com Inc. | 856,613 | 13,783 | |||
| * | AMC Networks Inc. Class A | 394,479 | 13,586 | |||
| * | EchoStar Corp. Class A | 507,822 | 13,381 | |||
| * | Liberty Media Corp.-Liberty Braves Class C | 465,517 | 13,081 | |||
| * | Radius Global Infrastructure Inc. | 810,966 | 13,057 | |||
| * | Lions Gate Entertainment Corp. Class A | 755,033 | 12,564 | |||
| * | PubMatic Inc. Class A | 364,272 | 12,403 | |||
| * | QuinStreet Inc. | 673,014 | 12,242 | |||
| *,1 | Gogo Inc. | 884,496 | 11,967 | |||
| * | Advantage Solutions Inc. | 1,369,850 | 10,986 | |||
| * | IDT Corp. Class B | 234,024 | 10,334 | |||
| * | Gannett Co. Inc. | 1,934,217 | 10,309 | |||
| * | Globalstar Inc. | 8,782,685 | 10,188 | |||
| * | Liberty Latin America Ltd. Class A | 795,424 | 9,275 | |||
| * | Thryv Holdings Inc. | 224,730 | 9,243 | |||
| * | Angi Inc. Class A | 1,002,429 | 9,232 | |||
| * | Loyalty Ventures Inc. | 270,884 | 8,145 | |||
| * | Consolidated Communications Holdings Inc. | 1,011,097 | 7,563 | |||
| * | Nextdoor Holdings Inc. | 879,791 | 6,942 | |||
| * | Stagwell Inc. | 762,296 | 6,609 | |||
| * | Boston Omaha Corp. Class A | 227,536 | 6,537 | |||
| * | Ooma Inc. | 307,526 | 6,286 | |||
| Entravision Communications Corp. Class A | 865,984 | 5,871 | ||||
| * | United States Cellular Corp. | 179,857 | 5,669 | |||
| ATN International Inc. | 135,403 | 5,409 | ||||
| * | Marcus Corp. | 302,075 | 5,395 | |||
| * | Sciplay Corp. Class A | 336,101 | 4,631 | |||
| *,1 | Liberty Media Corp.-Liberty Braves Class A | 159,018 | 4,572 | |||
| *,1 | AST SpaceMobile Inc. | 546,928 | 4,343 | |||
| * | Audacy Inc. Class A | 1,680,780 | 4,320 | |||
| * | MediaAlpha Inc. Class A | 279,154 | 4,310 | |||
| * | Integral Ad Science Holding Corp. | 186,555 | 4,143 | |||
| Shares | Market Value• ($000) | |||||
| * | Playstudios Inc. | 1,024,292 | 4,046 | |||
| * | DHI Group Inc. | 642,768 | 4,011 | |||
| * | Daily Journal Corp. | 11,007 | 3,926 | |||
| * | TrueCar Inc. | 1,095,234 | 3,724 | |||
| * | EverQuote Inc. Class A | 225,232 | 3,527 | |||
| * | ZipRecruiter Inc. Class A | 137,954 | 3,441 | |||
| * | comScore Inc. | 908,163 | 3,033 | |||
| *,1 | KORE Group Holdings Inc. | 434,608 | 2,929 | |||
| * | Reservoir Media Inc. | 362,036 | 2,864 | |||
| * | Cumulus Media Inc. Class A | 251,626 | 2,831 | |||
| * | Lee Enterprises Inc. | 74,103 | 2,559 | |||
| National CineMedia Inc. | 868,027 | 2,439 | ||||
| Spok Holdings Inc. | 258,905 | 2,416 | ||||
| * | Liberty TripAdvisor Holdings Inc. Class A | 1,004,162 | 2,179 | |||
| * | CuriosityStream Inc. | 357,963 | 2,123 | |||
| *,1 | Cinedigm Corp. Class A | 1,785,641 | 2,071 | |||
| * | Hemisphere Media Group Inc. Class A | 260,645 | 1,895 | |||
| * | Townsquare Media Inc. Class A | 136,294 | 1,817 | |||
| * | Gaia Inc. Class A | 194,110 | 1,663 | |||
| * | NerdWallet Inc. Class A | 104,081 | 1,618 | |||
| Saga Communications Inc. Class A | 62,836 | 1,509 | ||||
| * | Emerald Holding Inc. | 366,898 | 1,457 | |||
| * | Chicken Soup For The Soul Entertainment Inc. | 102,374 | 1,417 | |||
| * | Zedge Inc. Class B | 154,934 | 1,317 | |||
| * | Fluent Inc. | 638,538 | 1,271 | |||
| * | Outbrain Inc. | 81,247 | 1,137 | |||
| *,1 | Redbox Entertainment Inc. | 150,277 | 1,114 | |||
| *,1 | IZEA Worldwide Inc. | 784,653 | 1,051 | |||
| * | Marchex Inc. Class B | 400,100 | 992 | |||
| * | LiveOne Inc. | 762,327 | 976 | |||
| * | Travelzoo | 102,326 | 964 | |||
| * | Super League Gaming Inc. | 363,066 | 857 | |||
| * | Reading International Inc. Class A | 211,846 | 856 | |||
| * | Dolphin Entertainment Inc. | 86,444 | 736 | |||
| * | Ballantyne Strong Inc. | 249,405 | 721 | |||
| * | Urban One Inc. Class A | 147,049 | 684 | |||
| * | Endeavor Group Holdings Inc. Class A | 15,925 | 556 | |||
| *,1 | AutoWeb Inc. | 128,788 | 438 | |||
| *,1 | Insignia Systems Inc. | 17,904 | 413 | |||
| * | Salem Media Group Inc. Class A | 133,017 | 407 | |||
| * | Kubient Inc. | 128,879 | 389 | |||
| Shares | Market Value• ($000) | |||||
| * | IHS Holding Ltd. | 26,803 | 378 | |||
| DallasNews Corp. | 52,044 | 374 | ||||
| *,1 | NextPlay Technologies Inc. | 434,199 | 371 | |||
| *,1,2 | NII Holdings Inc. | 1,297,367 | 337 | |||
| * | Society Pass Inc. | 30,421 | 317 | |||
| *,1 | Creatd Inc. | 125,916 | 263 | |||
| * | Motorsport Games Inc. Class A | 62,787 | 213 | |||
| * | Beasley Broadcast Group Inc. Class A | 109,596 | 207 | |||
| * | Mediaco Holding Inc. Class A | 32,748 | 175 | |||
| *,1 | Digital Media Solutions Inc. | 35,739 | 171 | |||
| * | Cuentas Inc. | 114,035 | 152 | |||
| * | Creative Realities Inc. | 102,697 | 144 | |||
| * | SPAR Group Inc. | 108,259 | 133 | |||
| *,1 | Stran & Co. Inc. | 20,458 | 124 | |||
| * | Paltalk Inc. | 29,418 | 84 | |||
| * | Troika Media Group Inc. | 69,905 | 82 | |||
| * | Professional Diversity Network Inc. | 73,847 | 72 | |||
| * | Grom Social Enterprises Inc. | 33,277 | 60 | |||
| * | Orbsat Corp. | 300 | 1 | |||
| 4,682,155 | ||||||
| Consumer Discretionary (11.9%) | ||||||
| * | Airbnb Inc. Class A | 4,601,296 | 766,070 | |||
| * | Lululemon Athletica Inc. | 1,565,502 | 612,816 | |||
| * | DoorDash Inc. Class A | 2,147,905 | 319,823 | |||
| * | Carvana Co. | 1,133,026 | 262,624 | |||
| * | Burlington Stores Inc. | 883,355 | 257,507 | |||
| * | Rivian Automotive Inc. Class A | 2,053,410 | 212,918 | |||
| *,1 | Lucid Group Inc. | 5,462,718 | 207,856 | |||
| * | Floor & Decor Holdings Inc. Class A | 1,397,421 | 181,679 | |||
| Vail Resorts Inc. | 535,244 | 175,507 | ||||
| * | Wayfair Inc. Class A | 901,961 | 171,346 | |||
| Williams-Sonoma Inc. | 983,559 | 166,349 | ||||
| Service Corp. International | 2,187,572 | 155,296 | ||||
| * | Five Below Inc. | 741,632 | 153,436 | |||
| Lear Corp. | 788,678 | 144,289 | ||||
| * | Peloton Interactive Inc. Class A | 3,958,451 | 141,554 | |||
| * | Deckers Outdoor Corp. | 363,262 | 133,067 | |||
| * | Capri Holdings Ltd. | 1,995,102 | 129,502 | |||
| Aramark | 3,372,785 | 124,287 | ||||
| * | RH | 229,181 | 122,827 | |||
| *,1 | GameStop Corp. Class A | 821,970 | 121,972 | |||
| * | DraftKings Inc. Class A | 4,427,617 | 121,627 | |||
| * | TopBuild Corp. | 436,029 | 120,305 | |||
| Tempur Sealy International Inc. | 2,548,561 | 119,859 | ||||
| Shares | Market Value• ($000) | |||||
| Lithia Motors Inc. Class A | 400,612 | 118,962 | ||||
| Wyndham Hotels & Resorts Inc. | 1,232,259 | 110,472 | ||||
| Churchill Downs Inc. | 455,319 | 109,686 | ||||
| Toll Brothers Inc. | 1,512,877 | 109,517 | ||||
| Gentex Corp. | 3,123,903 | 108,868 | ||||
| Autoliv Inc. | 1,042,645 | 107,820 | ||||
| Macy's Inc. | 4,056,449 | 106,198 | ||||
| Brunswick Corp. | 1,020,524 | 102,797 | ||||
| * | Bright Horizons Family Solutions Inc. | 803,872 | 101,191 | |||
| * | Planet Fitness Inc. Class A | 1,108,246 | 100,385 | |||
| * | Mattel Inc. | 4,643,896 | 100,122 | |||
| Dick's Sporting Goods Inc. | 859,068 | 98,784 | ||||
| * | Crocs Inc. | 769,986 | 98,728 | |||
| Kohl's Corp. | 1,992,731 | 98,421 | ||||
| * | YETI Holdings Inc. | 1,160,178 | 96,098 | |||
| Marriott Vacations Worldwide Corp. | 563,358 | 95,196 | ||||
| * | Fox Factory Holding Corp. | 554,493 | 94,319 | |||
| * | Scientific Games Corp. | 1,268,109 | 84,748 | |||
| Polaris Inc. | 752,054 | 82,658 | ||||
| Texas Roadhouse Inc. Class A | 913,295 | 81,539 | ||||
| * | Goodyear Tire & Rubber Co. | 3,696,221 | 78,803 | |||
| * | Skechers USA Inc. Class A | 1,787,233 | 77,566 | |||
| * | Helen of Troy Ltd. | 316,649 | 77,411 | |||
| Hanesbrands Inc. | 4,620,416 | 77,253 | ||||
| Harley-Davidson Inc. | 2,043,145 | 77,006 | ||||
| Thor Industries Inc. | 736,620 | 76,439 | ||||
| *,1 | QuantumScape Corp. Class A | 3,292,806 | 73,067 | |||
| * | Terminix Global Holdings Inc. | 1,606,091 | 72,644 | |||
| Leggett & Platt Inc. | 1,761,866 | 72,518 | ||||
| * | Boyd Gaming Corp. | 1,083,458 | 71,042 | |||
| Wingstop Inc. | 390,236 | 67,433 | ||||
| Choice Hotels International Inc. | 427,483 | 66,683 | ||||
| * | Hyatt Hotels Corp. Class A | 657,010 | 63,007 | |||
| Travel + Leisure Co. | 1,131,449 | 62,535 | ||||
| * | AutoNation Inc. | 528,697 | 61,778 | |||
| Murphy USA Inc. | 305,865 | 60,941 | ||||
| Signet Jewelers Ltd. | 693,435 | 60,350 | ||||
| * | Hilton Grand Vacations Inc. | 1,158,034 | 60,345 | |||
| * | Meritage Homes Corp. | 488,409 | 59,615 | |||
| * | Chegg Inc. | 1,935,592 | 59,423 | |||
| * | Adient plc | 1,236,828 | 59,219 | |||
| Carter's Inc. | 557,820 | 56,463 | ||||
| Papa John's International Inc. | 421,215 | 56,220 | ||||
| Shares | Market Value• ($000) | |||||
| * | Taylor Morrison Home Corp. Class A | 1,596,975 | 55,830 | |||
| Wendy's Co. | 2,313,890 | 55,186 | ||||
| H&R Block Inc. | 2,326,057 | 54,802 | ||||
| * | Skyline Champion Corp. | 692,676 | 54,708 | |||
| * | Victoria's Secret & Co. | 956,743 | 53,138 | |||
| * | Asbury Automotive Group Inc. | 302,604 | 52,269 | |||
| * | National Vision Holdings Inc. | 1,082,140 | 51,932 | |||
| Foot Locker Inc. | 1,186,517 | 51,768 | ||||
| LCI Industries | 331,629 | 51,691 | ||||
| * | Chewy Inc. Class A | 862,308 | 50,850 | |||
| * | Academy Sports & Outdoors Inc. | 1,156,221 | 50,758 | |||
| 1 | American Eagle Outfitters Inc. | 1,995,419 | 50,524 | |||
| KB Home | 1,123,271 | 50,244 | ||||
| * | Sonos Inc. | 1,649,413 | 49,153 | |||
| *,1 | Luminar Technologies Inc. Class A | 2,861,971 | 48,396 | |||
| * | Boot Barn Holdings Inc. | 386,737 | 47,588 | |||
| * | Veoneer Inc. | 1,326,597 | 47,068 | |||
| Steven Madden Ltd. | 1,000,996 | 46,516 | ||||
| Group 1 Automotive Inc. | 236,850 | 46,238 | ||||
| * | Grand Canyon Education Inc. | 525,111 | 45,007 | |||
| Columbia Sportswear Co. | 457,509 | 44,580 | ||||
| * | SeaWorld Entertainment Inc. | 674,591 | 43,754 | |||
| * | LGI Homes Inc. | 280,449 | 43,324 | |||
| * | Six Flags Entertainment Corp. | 1,014,661 | 43,204 | |||
| Dana Inc. | 1,892,390 | 43,184 | ||||
| Penske Automotive Group Inc. | 402,320 | 43,137 | ||||
| * | Leslie's Inc. | 1,807,922 | 42,775 | |||
| Installed Building Products Inc. | 305,622 | 42,702 | ||||
| * | Dorman Products Inc. | 374,737 | 42,349 | |||
| * | Callaway Golf Co. | 1,540,552 | 42,273 | |||
| MDC Holdings Inc. | 740,685 | 41,352 | ||||
| * | Frontdoor Inc. | 1,117,528 | 40,957 | |||
| * | Ollie's Bargain Outlet Holdings Inc. | 797,333 | 40,815 | |||
| * | Tri Pointe Homes Inc. | 1,461,998 | 40,775 | |||
| * | Visteon Corp. | 363,996 | 40,455 | |||
| Cracker Barrel Old Country Store Inc. | 308,265 | 39,655 | ||||
| Red Rock Resorts Inc. Class A | 699,635 | 38,487 | ||||
| Rent-A-Center Inc. | 787,589 | 37,836 | ||||
| * | Gentherm Inc. | 432,051 | 37,545 | |||
| * | Shake Shack Inc. Class A | 510,129 | 36,811 | |||
| Qurate Retail Inc. Class A | 4,724,511 | 35,906 | ||||
| Shares | Market Value• ($000) | |||||
| * | Cavco Industries Inc. | 112,747 | 35,814 | |||
| * | Vista Outdoor Inc. | 738,742 | 34,034 | |||
| Shutterstock Inc. | 302,675 | 33,561 | ||||
| * | Overstock.com Inc. | 557,304 | 32,887 | |||
| Graham Holdings Co. Class B | 51,815 | 32,635 | ||||
| * | Nordstrom Inc. | 1,441,214 | 32,600 | |||
| Winnebago Industries Inc. | 434,648 | 32,564 | ||||
| Kontoor Brands Inc. | 616,637 | 31,603 | ||||
| Century Communities Inc. | 386,272 | 31,593 | ||||
| Levi Strauss & Co. Class A | 1,255,899 | 31,435 | ||||
| Wolverine World Wide Inc. | 1,070,584 | 30,844 | ||||
| * | Revolve Group Inc. Class A | 514,212 | 28,816 | |||
| *,1 | Fisker Inc. | 1,822,555 | 28,669 | |||
| * | Abercrombie & Fitch Co. Class A | 778,284 | 27,108 | |||
| * | Sally Beauty Holdings Inc. | 1,459,386 | 26,940 | |||
| * | Houghton Mifflin Harcourt Co. | 1,662,521 | 26,767 | |||
| * | Coursera Inc. | 1,089,170 | 26,619 | |||
| * | Everi Holdings Inc. | 1,206,987 | 25,769 | |||
| * | Urban Outfitters Inc. | 863,204 | 25,344 | |||
| Jack in the Box Inc. | 289,240 | 25,303 | ||||
| Monro Inc. | 429,881 | 25,049 | ||||
| * | Cheesecake Factory Inc. | 625,630 | 24,493 | |||
| * | M/I Homes Inc. | 392,123 | 24,382 | |||
| Patrick Industries Inc. | 300,853 | 24,276 | ||||
| * | ODP Corp. | 598,017 | 23,490 | |||
| * | iRobot Corp. | 356,059 | 23,457 | |||
| Acushnet Holdings Corp. | 441,264 | 23,422 | ||||
| * | Sleep Number Corp. | 298,753 | 22,884 | |||
| * | Bloomin' Brands Inc. | 1,081,430 | 22,688 | |||
| Camping World Holdings Inc. Class A | 537,164 | 21,701 | ||||
| Oxford Industries Inc. | 213,582 | 21,683 | ||||
| * | Petco Health & Wellness Co. Inc. Class A | 1,087,226 | 21,516 | |||
| * | Brinker International Inc. | 586,638 | 21,465 | |||
| La-Z-Boy Inc. | 578,228 | 20,995 | ||||
| * | Stitch Fix Inc. Class A | 1,087,837 | 20,582 | |||
| * | 2U Inc. | 1,010,474 | 20,280 | |||
| * | Adtalem Global Education Inc. | 676,488 | 19,997 | |||
| * | Dave & Buster's Entertainment Inc. | 516,916 | 19,850 | |||
| Big Lots Inc. | 432,505 | 19,484 | ||||
| *,1 | Bed Bath & Beyond Inc. | 1,328,812 | 19,374 | |||
| * | Malibu Boats Inc. Class A | 281,409 | 19,341 | |||
| * | Green Brick Partners Inc. | 624,523 | 18,942 | |||
| Shares | Market Value• ($000) | |||||
| * | Stride Inc. | 566,795 | 18,891 | |||
| Franchise Group Inc. | 359,067 | 18,729 | ||||
| * | Vroom Inc. | 1,707,023 | 18,419 | |||
| Strategic Education Inc. | 310,594 | 17,965 | ||||
| * | Dine Brands Global Inc. | 232,160 | 17,600 | |||
| * | GoPro Inc. Class A | 1,694,095 | 17,466 | |||
| * | MarineMax Inc. | 288,382 | 17,026 | |||
| *,1 | Dutch Bros Inc. Class A | 327,950 | 16,696 | |||
| Buckle Inc. | 388,194 | 16,424 | ||||
| Sturm Ruger & Co. Inc. | 235,973 | 16,051 | ||||
| Laureate Education Inc. Class A | 1,270,575 | 15,552 | ||||
| * | Porch Group Inc. | 995,044 | 15,513 | |||
| * | G-III Apparel Group Ltd. | 556,441 | 15,380 | |||
| * | XPEL Inc. | 221,848 | 15,148 | |||
| * | Bally's Corp. | 392,233 | 14,928 | |||
| * | Hayward Holdings Inc. | 565,532 | 14,834 | |||
| * | Children's Place Inc. | 186,537 | 14,791 | |||
| * | American Axle & Manufacturing Holdings Inc. | 1,566,138 | 14,612 | |||
| *,1 | Canoo Inc. | 1,890,900 | 14,598 | |||
| Hibbett Inc. | 201,308 | 14,480 | ||||
| * | Playa Hotels & Resorts NV | 1,740,355 | 13,888 | |||
| Dillard's Inc. Class A | 56,283 | 13,790 | ||||
| *,1 | ContextLogic Inc. Class A | 4,414,614 | 13,729 | |||
| * | Golden Entertainment Inc. | 269,619 | 13,624 | |||
| Sonic Automotive Inc. Class A | 274,185 | 13,558 | ||||
| * | Zumiez Inc. | 271,216 | 13,016 | |||
| * | Denny's Corp. | 813,012 | 13,008 | |||
| Carriage Services Inc. Class A | 201,037 | 12,955 | ||||
| Guess? Inc. | 529,329 | 12,535 | ||||
| * | RealReal Inc. | 1,076,401 | 12,497 | |||
| Standard Motor Products Inc. | 237,427 | 12,439 | ||||
| * | Genesco Inc. | 191,971 | 12,319 | |||
| *,1 | Faraday Future Intelligent Electric Inc. | 2,310,769 | 12,293 | |||
| * | Monarch Casino & Resort Inc. | 164,716 | 12,181 | |||
| Caleres Inc. | 526,618 | 11,944 | ||||
| * | Lovesac Co. | 179,331 | 11,882 | |||
| *,1 | Volta Inc. | 1,614,508 | 11,850 | |||
| * | Designer Brands Inc. Class A | 824,718 | 11,719 | |||
| * | WW International Inc. | 721,407 | 11,636 | |||
| * | Rush Street Interactive Inc. | 703,207 | 11,603 | |||
| * | Citi Trends Inc. | 122,212 | 11,580 | |||
| * | Tenneco Inc. Class A | 1,017,304 | 11,496 | |||
| Shares | Market Value• ($000) | |||||
| * | Perdoceo Education Corp. | 970,668 | 11,415 | |||
| Smith & Wesson Brands Inc. | 640,112 | 11,394 | ||||
| * | BJ's Restaurants Inc. | 323,456 | 11,175 | |||
| *,1 | Cricut Inc. Class A | 480,129 | 10,606 | |||
| * | Purple Innovation Inc. Class A | 779,965 | 10,350 | |||
| * | Accel Entertainment Inc. Class A | 781,585 | 10,176 | |||
| * | Tupperware Brands Corp. | 662,463 | 10,129 | |||
| *,1 | Portillo's Inc. Class A | 265,776 | 9,978 | |||
| Winmark Corp. | 39,930 | 9,914 | ||||
| *,1 | Rover Group Inc. Class A | 1,015,268 | 9,899 | |||
| Aaron's Co. Inc. | 395,432 | 9,747 | ||||
| Movado Group Inc. | 227,443 | 9,514 | ||||
| * | Vizio Holding Corp. Class A | 489,504 | 9,511 | |||
| * | Mister Car Wash Inc. | 521,678 | 9,500 | |||
| Shoe Carnival Inc. | 241,743 | 9,447 | ||||
| * | Beazer Homes USA Inc. | 400,516 | 9,300 | |||
| * | GrowGeneration Corp. | 711,188 | 9,281 | |||
| *,1 | EVgo Inc. | 915,513 | 9,100 | |||
| Clarus Corp. | 327,895 | 9,089 | ||||
| * | ThredUp Inc. Class A | 704,817 | 8,993 | |||
| * | Quotient Technology Inc. | 1,201,254 | 8,913 | |||
| * | Chico's FAS Inc. | 1,643,370 | 8,841 | |||
| * | PowerSchool Holdings Inc. Class A | 533,582 | 8,788 | |||
| * | America's Car-Mart Inc. | 85,725 | 8,778 | |||
| RCI Hospitality Holdings Inc. | 111,812 | 8,708 | ||||
| * | Life Time Group Holdings Inc. | 501,597 | 8,632 | |||
| * | Party City Holdco Inc. | 1,520,427 | 8,469 | |||
| * | TravelCenters of America Inc. | 163,268 | 8,428 | |||
| * | Chuy's Holdings Inc. | 279,678 | 8,424 | |||
| * | Poshmark Inc. Class A | 493,271 | 8,400 | |||
| * | Duolingo Inc. Class A | 78,851 | 8,367 | |||
| Johnson Outdoors Inc. Class A | 88,393 | 8,282 | ||||
| * | Hovnanian Enterprises Inc. Class A | 64,705 | 8,236 | |||
| Ethan Allen Interiors Inc. | 311,829 | 8,198 | ||||
| * | OneSpaWorld Holdings Ltd. | 814,720 | 8,164 | |||
| * | 1-800-Flowers.com Inc. Class A | 347,190 | 8,114 | |||
| * | Arko Corp. | 921,121 | 8,078 | |||
| * | Ruth's Hospitality Group Inc. | 394,607 | 7,853 | |||
| * | Liquidity Services Inc. | 355,462 | 7,849 | |||
| Shares | Market Value• ($000) | |||||
| * | Universal Electronics Inc. | 190,431 | 7,760 | |||
| * | Stoneridge Inc. | 392,539 | 7,749 | |||
| *,1 | PLBY Group Inc. | 282,661 | 7,530 | |||
| * | Modine Manufacturing Co. | 742,810 | 7,495 | |||
| * | MasterCraft Boat Holdings Inc. | 258,649 | 7,328 | |||
| OneWater Marine Inc. Class A | 119,254 | 7,271 | ||||
| 1 | Krispy Kreme Inc. | 381,497 | 7,218 | |||
| *,1 | Workhorse Group Inc. | 1,655,025 | 7,216 | |||
| 1 | PetMed Express Inc. | 279,742 | 7,066 | |||
| *,1 | Vuzix Corp. | 807,624 | 7,002 | |||
| * | CarParts.com Inc. | 609,755 | 6,829 | |||
| * | Lindblad Expeditions Holdings Inc. | 437,094 | 6,819 | |||
| * | LL Flooring Holdings Inc. | 399,254 | 6,815 | |||
| * | Latham Group Inc. | 269,666 | 6,750 | |||
| * | Fossil Group Inc. | 648,363 | 6,672 | |||
| Haverty Furniture Cos. Inc. | 216,199 | 6,609 | ||||
| * | Sportsman's Warehouse Holdings Inc. | 545,822 | 6,441 | |||
| * | Groupon Inc. | 278,006 | 6,439 | |||
| * | Warby Parker Inc. Class A | 135,972 | 6,331 | |||
| * | AMMO Inc. | 1,154,214 | 6,290 | |||
| * | Garrett Motion Inc. | 780,477 | 6,267 | |||
| * | Conn's Inc. | 261,892 | 6,160 | |||
| * | Funko Inc. Class A | 324,033 | 6,092 | |||
| * | European Wax Center Inc. Class A | 194,777 | 5,911 | |||
| Del Taco Restaurants Inc. | 468,050 | 5,827 | ||||
| *,1 | Holley Inc. | 443,909 | 5,766 | |||
| * | American Public Education Inc. | 258,110 | 5,743 | |||
| * | Golden Nugget Online Gaming Inc. | 576,200 | 5,733 | |||
| * | Bluegreen Vacations Holding Corp. Class A | 156,576 | 5,496 | |||
| * | Full House Resorts Inc. | 444,208 | 5,379 | |||
| 1 | Big 5 Sporting Goods Corp. | 282,016 | 5,361 | |||
| *,1 | Lordstown Motors Corp. | 1,548,343 | 5,342 | |||
| Tilly's Inc. Class A | 329,794 | 5,313 | ||||
| * | Cooper-Standard Holdings Inc. | 235,918 | 5,287 | |||
| * | Vivint Smart Home Inc. | 538,479 | 5,266 | |||
| * | Membership Collective Group Inc. Class A | 391,913 | 5,009 | |||
| * | GAN Ltd. | 531,609 | 4,885 | |||
| Cato Corp. Class A | 279,551 | 4,797 | ||||
| * | Unifi Inc. | 205,860 | 4,766 | |||
| Shares | Market Value• ($000) | |||||
| * | RumbleON Inc. Class B | 113,553 | 4,715 | |||
| * | Motorcar Parts of America Inc. | 274,315 | 4,683 | |||
| * | Century Casinos Inc. | 382,084 | 4,654 | |||
| * | Dream Finders Homes Inc. Class A | 236,564 | 4,601 | |||
| * | Xometry Inc. Class A | 87,272 | 4,473 | |||
| *,1 | Electric Last Mile Solutions I | 635,291 | 4,466 | |||
| *,1 | XL Fleet Corp. | 1,345,824 | 4,455 | |||
| * | Noodles & Co. Class A | 487,210 | 4,419 | |||
| * | Container Store Group Inc. | 433,857 | 4,330 | |||
| *,1 | BARK Inc. | 1,016,163 | 4,288 | |||
| * | Kura Sushi USA Inc. Class A | 52,184 | 4,219 | |||
| *,1 | Genius Brands International Inc. | 3,944,268 | 4,141 | |||
| * | American Outdoor Brands Inc. | 204,236 | 4,070 | |||
| *,1 | Allbirds Inc. Class A | 267,229 | 4,030 | |||
| * | Nerdy Inc. | 885,741 | 3,986 | |||
| * | ONE Group Hospitality Inc. | 312,049 | 3,935 | |||
| * | El Pollo Loco Holdings Inc. | 277,213 | 3,934 | |||
| * | Build-A-Bear Workshop Inc. | 197,191 | 3,849 | |||
| * | Udemy Inc. | 195,087 | 3,812 | |||
| * | Legacy Housing Corp. | 143,216 | 3,791 | |||
| * | Red Robin Gourmet Burgers Inc. | 223,678 | 3,697 | |||
| * | Universal Technical Institute Inc. | 471,125 | 3,684 | |||
| *,1 | Traeger Inc. | 301,806 | 3,670 | |||
| Rocky Brands Inc. | 91,776 | 3,653 | ||||
| * | Inspired Entertainment Inc. | 272,244 | 3,528 | |||
| * | Snap One Holdings Corp. | 164,782 | 3,474 | |||
| *,1 | Vinco Ventures Inc. | 1,445,419 | 3,440 | |||
| Hooker Furnishings Corp. | 144,224 | 3,358 | ||||
| *,1 | 1847 Goedeker Inc. | 1,394,059 | 3,346 | |||
| * | Lands' End Inc. | 168,448 | 3,307 | |||
| 1 | Vivid Seats Inc. Class A | 294,894 | 3,208 | |||
| * | Barnes & Noble Education Inc. | 467,013 | 3,180 | |||
| *,1 | Shift Technologies Inc. | 901,160 | 3,073 | |||
| *,1 | Beachbody Co. Inc. | 1,260,923 | 2,988 | |||
| * | XpresSpa Group Inc. | 1,478,050 | 2,986 | |||
| *,1 | Arcimoto Inc. | 380,464 | 2,960 | |||
| * | Vera Bradley Inc. | 345,584 | 2,941 | |||
| Superior Group of Cos. Inc. | 133,063 | 2,919 | ||||
| *,1 | Lottery.com Inc. | 457,623 | 2,915 | |||
| * | F45 Training Holdings Inc. | 261,388 | 2,847 | |||
| * | Express Inc. | 918,336 | 2,828 | |||
| Shares | Market Value• ($000) | |||||
| * | Xponential Fitness Inc. Class A | 138,310 | 2,827 | |||
| * | Fiesta Restaurant Group Inc. | 255,912 | 2,818 | |||
| *,1 | Weber Inc. Class A | 217,748 | 2,815 | |||
| Tile Shop Holdings Inc. | 386,664 | 2,757 | ||||
| * | PlayAGS Inc. | 404,403 | 2,746 | |||
| * | Brilliant Earth Group Inc. Class A | 150,657 | 2,721 | |||
| * | Destination XL Group Inc. | 476,772 | 2,708 | |||
| *,1 | Kirkland's Inc. | 181,120 | 2,704 | |||
| * | Duluth Holdings Inc. Class B | 177,733 | 2,698 | |||
| * | Nautilus Inc. | 434,117 | 2,661 | |||
| * | Solo Brands Inc. Class A | 167,459 | 2,617 | |||
| Flexsteel Industries Inc. | 96,772 | 2,599 | ||||
| * | Lincoln Educational Services Corp. | 346,233 | 2,586 | |||
| * | Lakeland Industries Inc. | 118,707 | 2,576 | |||
| Lifetime Brands Inc. | 159,603 | 2,549 | ||||
| * | Delta Apparel Inc. | 85,481 | 2,542 | |||
| * | Casper Sleep Inc. | 367,798 | 2,457 | |||
| * | Lazydays Holdings Inc. | 113,263 | 2,440 | |||
| * | Arhaus Inc. Class A | 179,801 | 2,382 | |||
| Nathan's Famous Inc. | 40,632 | 2,373 | ||||
| * | Horizon Global Corp. | 296,562 | 2,367 | |||
| *,1 | Aterian Inc. | 567,308 | 2,332 | |||
| Bassett Furniture Industries Inc. | 135,907 | 2,279 | ||||
| * | VOXX International Corp. Class A | 220,373 | 2,241 | |||
| *,1 | Enjoy Technology Inc. | 483,593 | 2,234 | |||
| * | BBQ Holdings Inc. | 129,641 | 2,059 | |||
| * | CarLotz Inc. | 906,318 | 2,057 | |||
| * | Strattec Security Corp. | 55,213 | 2,044 | |||
| Escalade Inc. | 128,370 | 2,027 | ||||
| * | First Watch Restaurant Group Inc. | 120,090 | 2,013 | |||
| Weyco Group Inc. | 77,297 | 1,851 | ||||
| *,1 | Rent the Runway Inc. Class A | 225,526 | 1,838 | |||
| * | Potbelly Corp. | 316,599 | 1,767 | |||
| Marine Products Corp. | 138,653 | 1,733 | ||||
| * | Superior Industries International Inc. | 376,611 | 1,687 | |||
| * | Drive Shack Inc. | 1,176,271 | 1,682 | |||
| 1 | JOANN Inc. | 153,814 | 1,597 | |||
| Carrols Restaurant Group Inc. | 519,956 | 1,539 | ||||
| * | Landsea Homes Corp. | 198,157 | 1,451 | |||
| Culp Inc. | 147,635 | 1,404 | ||||
| * | Target Hospitality Corp. | 390,065 | 1,389 | |||
| * | Torrid Holdings Inc. | 137,868 | 1,362 | |||
| Shares | Market Value• ($000) | |||||
| * | Tuesday Morning Corp. | 585,590 | 1,335 | |||
| Hamilton Beach Brands Holding Co. Class A | 91,773 | 1,318 | ||||
| * | Charles & Colvard Ltd. | 443,539 | 1,282 | |||
| * | Hall of Fame Resort & Entertainment Co. | 817,409 | 1,242 | |||
| *,1 | Remark Holdings Inc. | 1,182,250 | 1,172 | |||
| * | iMedia Brands Inc. | 185,283 | 1,112 | |||
| * | Dixie Group Inc. | 188,449 | 1,080 | |||
| *,1 | Waitr Holdings Inc. | 1,410,517 | 1,044 | |||
| *,1 | J. Jill Inc. | 54,078 | 1,037 | |||
| * | JAKKS Pacific Inc. | 99,636 | 1,012 | |||
| * | 1stdibs.com Inc. | 79,197 | 991 | |||
| *,1 | BurgerFi International Inc. | 167,609 | 950 | |||
| * | Biglari Holdings Inc. Class A | 1,330 | 924 | |||
| * | Biglari Holdings Inc. Class B | 6,433 | 917 | |||
| *,1 | Koss Corp. | 80,849 | 863 | |||
| * | StoneMor Inc. | 373,699 | 852 | |||
| * | Regis Corp. | 455,543 | 793 | |||
| *,1 | Esports Entertainment Group Inc. | 224,626 | 788 | |||
| * | Aspen Group Inc. | 331,830 | 783 | |||
| * | Ark Restaurants Corp. | 38,415 | 640 | |||
| * | Live Ventures Inc. | 19,993 | 630 | |||
| *,1 | LMP Automotive Holdings Inc. | 85,415 | 597 | |||
| Crown Crafts Inc. | 81,882 | 595 | ||||
| Educational Development Corp. | 64,641 | 577 | ||||
| *,1 | AYRO Inc. | 351,561 | 566 | |||
| *,1 | Esports Technologies Inc. | 27,374 | 563 | |||
| * | Zovio Inc. Class A | 419,786 | 533 | |||
| *,1 | Harbor Custom Development Inc. | 201,700 | 530 | |||
| * | Luby's Inc. | 167,887 | 480 | |||
| *,1 | Sweetgreen Inc. Class A | 14,957 | 479 | |||
| * | Sypris Solutions Inc. | 190,093 | 468 | |||
| * | Toughbuilt Industries Inc. | 1,235,523 | 451 | |||
| * | Good Times Restaurants Inc. | 99,163 | 430 | |||
| AMCON Distributing Co. | 2,113 | 422 | ||||
| * | Vince Holding Corp. | 40,117 | 320 | |||
| * | Greenlane Holdings Inc. Class A | 306,859 | 296 | |||
| * | Nephros Inc. | 44,580 | 268 | |||
| * | Flanigan's Enterprises Inc. | 8,326 | 257 | |||
| * | Rave Restaurant Group Inc. | 246,099 | 249 | |||
| * | Lulu's Fashion Lounge Holdings Inc. | 22,858 | 234 | |||
| * | Forward Industries Inc. | 139,573 | 218 | |||
| Shares | Market Value• ($000) | |||||
| * | aka Brands Holding Corp. | 20,153 | 186 | |||
| *,1 | Digital Brands Group Inc. | 59,422 | 137 | |||
| *,1 | Allied Esports Entertainment Inc. | 77,728 | 133 | |||
| * | Unique Fabricating Inc. | 65,040 | 127 | |||
| * | Xcel Brands Inc. | 113,019 | 123 | |||
| *,1 | Nova Lifestyle Inc. | 60,182 | 113 | |||
| * | Amesite Inc. | 103,256 | 106 | |||
| * | iPower Inc. | 42,702 | 102 | |||
| * | Yunhong CTI Ltd. | 80,660 | 96 | |||
| *,1 | TRxADE HEALTH Inc. | 39,629 | 93 | |||
| *,1 | Muscle Maker Inc. | 128,241 | 92 | |||
| * | Volcon Inc. | 7,055 | 76 | |||
| * | Envela Corp. | 17,179 | 70 | |||
| 1 | FAT Brands Inc. Class B | 4,374 | 59 | |||
| * | Emerson Radio Corp. | 68,379 | 55 | |||
| * | Canterbury Park Holding Corp. | 2,678 | 46 | |||
| *,2 | Zagg Inc. CVR | 448,712 | 40 | |||
| * | Kidpik Corp. | 5,900 | 37 | |||
| Jerash Holdings US Inc. | 2,870 | 19 | ||||
| * | Kaival Brands Innovations Group Inc. | 25,070 | 19 | |||
| * | Amergent Hospitality Group Inc. | 19,975 | 8 | |||
| *,2 | Ocuphire Pharma Inc. CVR | 13,673 | 3 | |||
| * | Worksport Ltd. | 700 | 2 | |||
| *,2 | resTORbio Inc. CVR | 31,197 | — | |||
| 12,912,721 | ||||||
| Consumer Staples (2.7%) | ||||||
| Keurig Dr Pepper Inc. | 9,758,884 | 359,712 | ||||
| Bunge Ltd. | 1,854,410 | 173,128 | ||||
| * | Darling Ingredients Inc. | 2,139,890 | 148,273 | |||
| * | BJ's Wholesale Club Holdings Inc. | 1,790,785 | 119,929 | |||
| * | US Foods Holding Corp. | 2,952,605 | 102,839 | |||
| Casey's General Stores Inc. | 493,369 | 97,366 | ||||
| * | Performance Food Group Co. | 2,029,590 | 93,138 | |||
| * | Post Holdings Inc. | 773,862 | 87,237 | |||
| Ingredion Inc. | 879,913 | 85,035 | ||||
| Flowers Foods Inc. | 2,625,932 | 72,134 | ||||
| * | Boston Beer Co. Inc. Class A | 124,216 | 62,742 | |||
| Spectrum Brands Holdings Inc. | 554,900 | 56,444 | ||||
| * | Freshpet Inc. | 573,860 | 54,672 | |||
| * | Herbalife Nutrition Ltd. | 1,306,390 | 53,471 | |||
| * | Hain Celestial Group Inc. | 1,229,907 | 52,406 | |||
| Sanderson Farms Inc. | 274,175 | 52,389 | ||||
| Shares | Market Value• ($000) | |||||
| *,1 | Beyond Meat Inc. | 792,603 | 51,646 | |||
| * | Coty Inc. Class A | 4,399,752 | 46,197 | |||
| * | Simply Good Foods Co. | 1,101,066 | 45,771 | |||
| WD-40 Co. | 180,285 | 44,105 | ||||
| * | Sprouts Farmers Market Inc. | 1,485,329 | 44,085 | |||
| Lancaster Colony Corp. | 254,130 | 42,084 | ||||
| 1 | Albertsons Cos. Inc. Class A | 1,273,285 | 38,441 | |||
| * | Celsius Holdings Inc. | 502,151 | 37,445 | |||
| Coca-Cola Consolidated Inc. | 60,403 | 37,401 | ||||
| * | Hostess Brands Inc. Class A | 1,829,466 | 37,358 | |||
| * | United Natural Foods Inc. | 733,871 | 36,018 | |||
| Nu Skin Enterprises Inc. Class A | 643,371 | 32,651 | ||||
| Energizer Holdings Inc. | 812,120 | 32,566 | ||||
| Edgewell Personal Care Co. | 705,142 | 32,232 | ||||
| * | Grocery Outlet Holding Corp. | 1,136,515 | 32,141 | |||
| Medifast Inc. | 150,433 | 31,505 | ||||
| J & J Snack Foods Corp. | 195,060 | 30,812 | ||||
| * | Beauty Health Co. | 1,263,427 | 30,524 | |||
| * | TreeHouse Foods Inc. | 726,001 | 29,425 | |||
| * | Olaplex Holdings Inc. | 934,161 | 27,212 | |||
| 1 | B&G Foods Inc. | 834,725 | 25,651 | |||
| Inter Parfums Inc. | 234,165 | 25,032 | ||||
| PriceSmart Inc. | 325,481 | 23,815 | ||||
| Reynolds Consumer Products Inc. | 727,353 | 22,839 | ||||
| * | Central Garden & Pet Co. Class A | 476,542 | 22,803 | |||
| * | elf Beauty Inc. | 621,351 | 20,635 | |||
| Vector Group Ltd. | 1,691,900 | 19,423 | ||||
| Cal-Maine Foods Inc. | 506,610 | 18,740 | ||||
| Universal Corp. | 329,758 | 18,110 | ||||
| * | Pilgrim's Pride Corp. | 636,386 | 17,946 | |||
| Ingles Markets Inc. Class A | 182,549 | 15,761 | ||||
| * | USANA Health Sciences Inc. | 151,978 | 15,380 | |||
| Andersons Inc. | 388,726 | 15,048 | ||||
| *,1 | BellRing Brands Inc. Class A | 504,045 | 14,380 | |||
| 1 | National Beverage Corp. | 310,892 | 14,093 | |||
| MGP Ingredients Inc. | 164,889 | 14,014 | ||||
| Weis Markets Inc. | 208,570 | 13,741 | ||||
| * | Chefs' Warehouse Inc. | 407,583 | 13,573 | |||
| *,1 | Benson Hill Inc. | 1,811,371 | 13,205 | |||
| Seaboard Corp. | 3,346 | 13,167 | ||||
| SpartanNash Co. | 500,309 | 12,888 | ||||
| Utz Brands Inc. | 799,321 | 12,749 | ||||
| Shares | Market Value• ($000) | |||||
| Fresh Del Monte Produce Inc. | 446,081 | 12,312 | ||||
| * | Rite Aid Corp. | 757,141 | 11,122 | |||
| Calavo Growers Inc. | 245,842 | 10,424 | ||||
| John B Sanfilippo & Son Inc. | 109,073 | 9,834 | ||||
| * | Duckhorn Portfolio Inc. | 420,010 | 9,803 | |||
| * | Central Garden & Pet Co. | 175,098 | 9,215 | |||
| *,1 | Tattooed Chef Inc. | 591,253 | 9,188 | |||
| Tootsie Roll Industries Inc. | 210,676 | 7,633 | ||||
| * | Mission Produce Inc. | 464,820 | 7,298 | |||
| Turning Point Brands Inc. | 192,161 | 7,260 | ||||
| *,1 | 22nd Century Group Inc. | 2,220,946 | 6,863 | |||
| * | Vital Farms Inc. | 286,566 | 5,175 | |||
| * | Sovos Brands Inc. | 324,477 | 4,883 | |||
| * | Whole Earth Brands Inc. | 452,236 | 4,857 | |||
| * | Veru Inc. | 784,281 | 4,619 | |||
| *,1 | HF Foods Group Inc. | 539,182 | 4,562 | |||
| * | Landec Corp. | 380,720 | 4,226 | |||
| *,1 | Vintage Wine Estates Inc. | 342,564 | 4,049 | |||
| * | Seneca Foods Corp. Class A | 75,274 | 3,609 | |||
| Nature's Sunshine Products Inc. | 181,017 | 3,349 | ||||
| *,1 | AppHarvest Inc. | 790,036 | 3,073 | |||
| * | Honest Co. Inc. | 364,606 | 2,950 | |||
| Limoneira Co. | 187,472 | 2,812 | ||||
| Village Super Market Inc. Class A | 118,861 | 2,780 | ||||
| Alico Inc. | 68,569 | 2,539 | ||||
| Natural Grocers by Vitamin Cottage Inc. | 166,956 | 2,379 | ||||
| Oil-Dri Corp. of America | 62,018 | 2,030 | ||||
| *,1 | NewAge Inc. | 1,874,944 | 1,931 | |||
| * | Blue Apron Holdings Inc. Class A | 280,810 | 1,890 | |||
| * | Vita Coco Co. Inc. | 169,219 | 1,890 | |||
| * | Farmer Bros Co. | 220,466 | 1,643 | |||
| * | Alkaline Water Co. Inc. | 1,171,415 | 1,382 | |||
| * | Lifevantage Corp. | 195,139 | 1,233 | |||
| * | S&W Seed Co. | 428,541 | 1,170 | |||
| *,1 | Revlon Inc. Class A | 98,065 | 1,112 | |||
| *,1 | LifeMD Inc. | 269,119 | 1,042 | |||
| * | Natural Alternatives International Inc. | 74,963 | 948 | |||
| * | Zevia PBC Class A | 126,723 | 893 | |||
| United-Guardian Inc. | 52,153 | 855 | ||||
| * | Better Choice Co. Inc. | 261,363 | 844 | |||
| * | Rocky Mountain Chocolate Factory Inc. | 95,693 | 746 | |||
| Natural Health Trends Corp. | 109,142 | 739 | ||||
| Shares | Market Value• ($000) | |||||
| * | Willamette Valley Vineyards Inc. | 72,806 | 632 | |||
| *,1 | Laird Superfood Inc. | 46,278 | 603 | |||
| * | Lifeway Foods Inc. | 87,562 | 413 | |||
| * | Reed's Inc. | 1,113,652 | 400 | |||
| * | Arcadia Biosciences Inc. | 300,033 | 312 | |||
| * | Thorne HealthTech Inc. | 47,371 | 294 | |||
| Mannatech Inc. | 7,348 | 282 | ||||
| Ocean Bio-Chem Inc. | 31,040 | 270 | ||||
| * | RiceBran Technologies | 697,387 | 243 | |||
| * | Coffee Holding Co. Inc. | 55,673 | 242 | |||
| * | Eastside Distilling Inc. | 132,920 | 238 | |||
| * | Summer Infant Inc. | 18,966 | 197 | |||
| * | Seneca Foods Corp. Class B | 4,095 | 193 | |||
| *,1 | Nuzee Inc. | 43,969 | 182 | |||
| *,1 | Guardion Health Sciences Inc. | 278,115 | 180 | |||
| * | Cyanotech Corp. | 51,994 | 166 | |||
| * | Real Good Food Co. Inc. Class A | 23,739 | 149 | |||
| * | Stryve Foods Inc. Class A | 16,690 | 66 | |||
| * | Bridgford Foods Corp. | 4,554 | 53 | |||
| *,1 | Jupiter Wellness Inc. | 59,271 | 53 | |||
| *,1 | Grove Inc. | 10,208 | 41 | |||
| * | Zivo Bioscience Inc. | 9,996 | 29 | |||
| * | MedAvail Holdings Inc. | 9,280 | 13 | |||
| 2,975,940 | ||||||
| Energy (2.6%) | ||||||
| Cheniere Energy Inc. | 3,110,913 | 315,509 | ||||
| Targa Resources Corp. | 3,017,710 | 157,645 | ||||
| Ovintiv Inc. | 3,422,212 | 115,329 | ||||
| Texas Pacific Land Corp. | 81,937 | 102,329 | ||||
| Chesapeake Energy Corp. | 1,360,869 | 87,803 | ||||
| * | EQT Corp. | 4,007,333 | 87,400 | |||
| * | NOV Inc. | 5,134,559 | 69,573 | |||
| * | Antero Resources Corp. | 3,756,538 | 65,739 | |||
| HollyFrontier Corp. | 1,972,145 | 64,647 | ||||
| PDC Energy Inc. | 1,279,273 | 62,403 | ||||
| * | Southwestern Energy Co. | 13,344,940 | 62,187 | |||
| DT Midstream Inc. | 1,273,595 | 61,107 | ||||
| * | Range Resources Corp. | 3,288,017 | 58,625 | |||
| Equitrans Midstream Corp. | 5,294,047 | 54,740 | ||||
| Matador Resources Co. | 1,448,246 | 53,469 | ||||
| * | ChampionX Corp. | 2,631,314 | 53,179 | |||
| * | Denbury Inc. | 658,009 | 50,397 | |||
| Murphy Oil Corp. | 1,906,394 | 49,776 | ||||
| SM Energy Co. | 1,590,546 | 46,889 | ||||
| Civitas Resources Inc. | 951,705 | 46,605 | ||||
| Shares | Market Value• ($000) | |||||
| California Resources Corp. | 1,066,032 | 45,530 | ||||
| Antero Midstream Corp. | 4,311,875 | 41,739 | ||||
| * | CNX Resources Corp. | 2,784,595 | 38,288 | |||
| Magnolia Oil & Gas Corp. Class A | 1,924,383 | 36,313 | ||||
| Continental Resources Inc. | 763,057 | 34,154 | ||||
| Helmerich & Payne Inc. | 1,392,504 | 33,002 | ||||
| * | Whiting Petroleum Corp. | 508,439 | 32,886 | |||
| * | TechnipFMC plc | 5,503,202 | 32,579 | |||
| * | Valaris Ltd. | 872,325 | 31,404 | |||
| Oasis Petroleum Inc. | 241,421 | 30,417 | ||||
| * | Callon Petroleum Co. | 626,159 | 29,586 | |||
| Cactus Inc. Class A | 772,288 | 29,447 | ||||
| * | Renewable Energy Group Inc. | 661,365 | 28,068 | |||
| * | Green Plains Inc. | 707,686 | 24,599 | |||
| Patterson-UTI Energy Inc. | 2,855,248 | 24,127 | ||||
| * | Weatherford International plc | 870,162 | 24,121 | |||
| World Fuel Services Corp. | 830,025 | 21,971 | ||||
| * | Transocean Ltd. | 7,693,425 | 21,234 | |||
| * | Kosmos Energy Ltd. | 5,964,719 | 20,638 | |||
| *,1 | Noble Corp. | 801,984 | 19,897 | |||
| Arch Resources Inc. | 204,034 | 18,632 | ||||
| Northern Oil & Gas Inc. | 868,551 | 17,875 | ||||
| * | PBF Energy Inc. Class A | 1,261,639 | 16,363 | |||
| * | Aspen Aerogels Inc. | 328,551 | 16,359 | |||
| * | Tellurian Inc. | 5,160,895 | 15,896 | |||
| * | Centennial Resource Development Inc. Class A | 2,456,343 | 14,689 | |||
| * | Oceaneering International Inc. | 1,248,218 | 14,117 | |||
| * | Delek US Holdings Inc. | 933,398 | 13,992 | |||
| Core Laboratories NV | 626,462 | 13,976 | ||||
| * | Clean Energy Fuels Corp. | 2,246,271 | 13,770 | |||
| New Fortress Energy Inc. Class A | 554,641 | 13,389 | ||||
| * | Liberty Oilfield Services Inc. Class A | 1,352,275 | 13,117 | |||
| Archrock Inc. | 1,749,954 | 13,090 | ||||
| Brigham Minerals Inc. Class A | 581,922 | 12,273 | ||||
| * | Peabody Energy Corp. | 1,201,647 | 12,101 | |||
| * | Uranium Energy Corp. | 3,459,927 | 11,591 | |||
| *,1 | Gevo Inc. | 2,686,057 | 11,496 | |||
| * | Laredo Petroleum Inc. | 181,917 | 10,939 | |||
| * | Gulfport Energy Corp. | 150,242 | 10,822 | |||
| * | Par Pacific Holdings Inc. | 629,634 | 10,383 | |||
| * | DMC Global Inc. | 255,064 | 10,103 | |||
| Shares | Market Value• ($000) | |||||
| * | CONSOL Energy Inc. | 428,409 | 9,729 | |||
| * | Dril-Quip Inc. | 482,210 | 9,490 | |||
| * | Comstock Resources Inc. | 1,172,329 | 9,484 | |||
| * | US Silica Holdings Inc. | 1,004,560 | 9,443 | |||
| * | ProPetro Holding Corp. | 1,149,720 | 9,313 | |||
| * | Bristow Group Inc. Class A | 280,358 | 8,879 | |||
| International Seaways Inc. | 585,897 | 8,601 | ||||
| * | Nabors Industries Ltd. | 101,926 | 8,265 | |||
| Berry Corp. | 924,168 | 7,782 | ||||
| * | NexTier Oilfield Solutions Inc. | 2,188,468 | 7,769 | |||
| * | Ranger Oil Corp. | 283,295 | 7,626 | |||
| * | Centrus Energy Corp. Class A | 143,701 | 7,172 | |||
| CVR Energy Inc. | 393,851 | 6,621 | ||||
| * | Archaea Energy Inc. | 353,890 | 6,469 | |||
| * | REX American Resources Corp. | 66,364 | 6,371 | |||
| * | Helix Energy Solutions Group Inc. | 1,881,125 | 5,869 | |||
| * | Tidewater Inc. | 541,475 | 5,799 | |||
| * | Select Energy Services Inc. Class A | 894,212 | 5,571 | |||
| * | Expro Group Holdings NV | 368,005 | 5,281 | |||
| * | TETRA Technologies Inc. | 1,754,397 | 4,983 | |||
| Dorian LPG Ltd. | 389,593 | 4,944 | ||||
| * | Talos Energy Inc. | 494,704 | 4,848 | |||
| *,1 | Aemetis Inc. | 381,949 | 4,698 | |||
| * | Alto Ingredients Inc. | 940,780 | 4,525 | |||
| * | SandRidge Energy Inc. | 425,482 | 4,451 | |||
| * | Oil States International Inc. | 877,335 | 4,360 | |||
| * | Crescent Energy Inc. Class A | 340,799 | 4,321 | |||
| * | W&T Offshore Inc. | 1,309,518 | 4,230 | |||
| * | Newpark Resources Inc. | 1,310,990 | 3,854 | |||
| * | Earthstone Energy Inc. Class A | 338,984 | 3,709 | |||
| * | RPC Inc. | 794,043 | 3,605 | |||
| * | FTS International Inc. Class A | 126,396 | 3,318 | |||
| *,1 | Camber Energy Inc. | 3,332,183 | 2,832 | |||
| Solaris Oilfield Infrastructure Inc. Class A | 431,609 | 2,827 | ||||
| Falcon Minerals Corp. | 567,576 | 2,764 | ||||
| *,1 | Vertex Energy Inc. | 585,794 | 2,654 | |||
| *,1 | Ring Energy Inc. | 1,141,002 | 2,602 | |||
| Altus Midstream Co. | 41,022 | 2,515 | ||||
| * | VAALCO Energy Inc. | 754,862 | 2,423 | |||
| Evolution Petroleum Corp. | 432,930 | 2,186 | ||||
| NACCO Industries Inc. Class A | 59,884 | 2,173 | ||||
| Shares | Market Value• ($000) | |||||
| * | SilverBow Resources Inc. | 98,522 | 2,145 | |||
| * | Overseas Shipholding Group Inc. Class A | 1,069,027 | 2,010 | |||
| * | Natural Gas Services Group Inc. | 178,408 | 1,868 | |||
| * | Amplify Energy Corp. | 542,072 | 1,686 | |||
| * | Epsilon Energy Ltd. | 268,837 | 1,524 | |||
| * | Geospace Technologies Corp. | 178,733 | 1,201 | |||
| *,1 | American Resources Corp. | 648,850 | 1,168 | |||
| * | Exterran Corp. | 389,303 | 1,160 | |||
| 1 | Riley Exploration Permian Inc. | 57,421 | 1,109 | |||
| * | NextDecade Corp. | 373,848 | 1,065 | |||
| * | SEACOR Marine Holdings Inc. | 288,980 | 983 | |||
| * | Forum Energy Technologies Inc. | 59,624 | 957 | |||
| * | Gulf Island Fabrication Inc. | 227,018 | 910 | |||
| PHX Minerals Inc. | 391,669 | 850 | ||||
| * | Hallador Energy Co. | 305,667 | 752 | |||
| Adams Resources & Energy Inc. | 26,384 | 734 | ||||
| * | Ranger Energy Services Inc. Class A | 65,621 | 674 | |||
| * | Ecoark Holdings Inc. | 286,702 | 639 | |||
| * | Dawson Geophysical Co. | 260,024 | 602 | |||
| * | Smart Sand Inc. | 335,545 | 597 | |||
| * | Battalion Oil Corp. | 56,797 | 557 | |||
| * | Lightbridge Corp. | 83,426 | 553 | |||
| * | Profire Energy Inc. | 440,514 | 467 | |||
| *,1 | ENGlobal Corp. | 296,135 | 391 | |||
| * | NCS Multistage Holdings Inc. | 10,147 | 294 | |||
| * | PrimeEnergy Resources Corp. | 4,159 | 287 | |||
| * | Mammoth Energy Services Inc. | 157,081 | 286 | |||
| * | MIND Technology Inc. | 165,579 | 275 | |||
| *,1 | ION Geophysical Corp. | 281,112 | 247 | |||
| *,1 | KLX Energy Services Holdings Inc. | 79,207 | 246 | |||
| * | US Energy Corp. Wyoming | 72,244 | 236 | |||
| * | Independence Contract Drilling Inc. | 75,420 | 226 | |||
| *,1 | US Well Services Inc. Class A | 193,158 | 222 | |||
| * | Houston American Energy Corp. | 128,737 | 184 | |||
| * | Nine Energy Service Inc. | 182,633 | 183 | |||
| * | Barnwell Industries Inc. | 62,082 | 181 | |||
| *,1 | Nuverra Environmental Solutions Inc. | 56,792 | 173 | |||
| Shares | Market Value• ($000) | |||||
| * | Mexco Energy Corp. | 16,503 | 155 | |||
| * | Superior Drilling Products Inc. | 200,379 | 146 | |||
| * | PEDEVCO Corp. | 132,348 | 140 | |||
| * | Nabors Industries Ltd. Warrants Exp. 6/11/26 | 37,085 | 138 | |||
| * | New Concept Energy Inc. | 54,202 | 129 | |||
| * | Enservco Corp. | 76,526 | 65 | |||
| *,1,2 | Miragen Therapeutics Inc. CVR | 330,960 | 7 | |||
| *,1,2 | Harvest Natural Resources Inc. | 133,886 | — | |||
| 2,803,102 | ||||||
| Financials (14.2%) | ||||||
| Blackstone Inc. | 9,111,751 | 1,178,969 | ||||
| KKR & Co. Inc. | 7,737,738 | 576,461 | ||||
| * | Arch Capital Group Ltd. | 5,074,518 | 225,562 | |||
| * | Markel Corp. | 179,596 | 221,621 | |||
| Ally Financial Inc. | 4,561,910 | 217,193 | ||||
| Apollo Asset Management Inc. | 2,881,264 | 208,690 | ||||
| Fidelity National Financial Inc. | 3,748,267 | 195,585 | ||||
| Ares Management Corp. Class A | 2,210,156 | 179,619 | ||||
| LPL Financial Holdings Inc. | 1,057,850 | 169,351 | ||||
| Equitable Holdings Inc. | 4,967,898 | 162,897 | ||||
| Annaly Capital Management Inc. | 19,009,406 | 148,654 | ||||
| Western Alliance Bancorp | 1,379,535 | 148,507 | ||||
| East West Bancorp Inc. | 1,871,658 | 147,262 | ||||
| * | Athene Holding Ltd. Class A | 1,741,446 | 145,115 | |||
| Tradeweb Markets Inc. Class A | 1,360,758 | 136,266 | ||||
| *,1 | SoFi Technologies Inc. | 8,570,677 | 135,502 | |||
| * | Alleghany Corp. | 180,122 | 120,248 | |||
| American Financial Group Inc. | 871,678 | 119,699 | ||||
| First Horizon Corp. | 7,141,737 | 116,625 | ||||
| First American Financial Corp. | 1,448,106 | 113,285 | ||||
| Morningstar Inc. | 311,573 | 106,555 | ||||
| RenaissanceRe Holdings Ltd. | 609,369 | 103,184 | ||||
| AGNC Investment Corp. | 6,856,352 | 103,120 | ||||
| Jefferies Financial Group Inc. | 2,590,367 | 100,506 | ||||
| Commerce Bancshares Inc. | 1,459,754 | 100,344 | ||||
| Carlyle Group Inc. | 1,826,583 | 100,279 | ||||
| * | Upstart Holdings Inc. | 652,998 | 98,799 | |||
| Shares | Market Value• ($000) | |||||
| * | Coinbase Global Inc. Class A | 388,911 | 98,149 | |||
| Reinsurance Group of America Inc. | 894,433 | 97,931 | ||||
| Starwood Property Trust Inc. | 4,029,356 | 97,913 | ||||
| Voya Financial Inc. | 1,465,170 | 97,155 | ||||
| Stifel Financial Corp. | 1,372,549 | 96,655 | ||||
| Pinnacle Financial Partners Inc. | 1,009,633 | 96,420 | ||||
| Janus Henderson Group plc | 2,250,604 | 94,390 | ||||
| Cullen/Frost Bankers Inc. | 747,017 | 94,176 | ||||
| Synovus Financial Corp. | 1,925,256 | 92,162 | ||||
| Old Republic International Corp. | 3,746,169 | 92,081 | ||||
| Interactive Brokers Group Inc. Class A | 1,151,083 | 91,419 | ||||
| Prosperity Bancshares Inc. | 1,221,008 | 88,279 | ||||
| Affiliated Managers Group Inc. | 534,991 | 88,011 | ||||
| Popular Inc. | 1,058,805 | 86,864 | ||||
| First Financial Bankshares Inc. | 1,686,246 | 85,729 | ||||
| SEI Investments Co. | 1,381,373 | 84,181 | ||||
| Glacier Bancorp Inc. | 1,429,739 | 81,066 | ||||
| Primerica Inc. | 522,062 | 80,016 | ||||
| First Citizens BancShares Inc. Class A | 94,932 | 78,778 | ||||
| SLM Corp. | 3,901,831 | 76,749 | ||||
| Cadence Bank | 2,562,563 | 76,339 | ||||
| *,1 | Credit Acceptance Corp. | 109,822 | 75,522 | |||
| New York Community Bancorp Inc. | 6,159,665 | 75,210 | ||||
| Bank OZK | 1,610,210 | 74,923 | ||||
| OneMain Holdings Inc. | 1,478,670 | 73,993 | ||||
| SouthState Corp. | 921,266 | 73,803 | ||||
| Valley National Bancorp | 5,365,562 | 73,776 | ||||
| Evercore Inc. Class A | 516,513 | 70,168 | ||||
| PacWest Bancorp | 1,552,760 | 70,138 | ||||
| Houlihan Lokey Inc. Class A | 666,592 | 69,006 | ||||
| Wintrust Financial Corp. | 756,908 | 68,742 | ||||
| Webster Financial Corp. | 1,201,646 | 67,100 | ||||
| Blackstone Mortgage Trust Inc. Class A | 2,185,626 | 66,924 | ||||
| Kinsale Capital Group Inc. | 280,769 | 66,792 | ||||
| New Residential Investment Corp. | 6,235,403 | 66,781 | ||||
| CIT Group Inc. | 1,299,207 | 66,701 | ||||
| Unum Group | 2,698,298 | 66,297 | ||||
| Essent Group Ltd. | 1,453,710 | 66,187 | ||||
| Shares | Market Value• ($000) | |||||
| 1 | Blue Owl Capital Inc. Class A | 4,401,270 | 65,623 | |||
| Sterling Bancorp | 2,539,377 | 65,491 | ||||
| Lazard Ltd. Class A | 1,499,205 | 65,410 | ||||
| United Bankshares Inc. | 1,774,136 | 64,366 | ||||
| Selective Insurance Group Inc. | 782,618 | 64,128 | ||||
| Erie Indemnity Co. Class A | 328,718 | 63,331 | ||||
| MGIC Investment Corp. | 4,336,395 | 62,531 | ||||
| Hanover Insurance Group Inc. | 466,133 | 61,091 | ||||
| UMB Financial Corp. | 562,729 | 59,711 | ||||
| * | Trupanion Inc. | 449,692 | 59,373 | |||
| Hannon Armstrong Sustainable Infrastructure Capital Inc. | 1,109,437 | 58,933 | ||||
| Walker & Dunlop Inc. | 386,864 | 58,370 | ||||
| * | Silvergate Capital Corp. Class A | 392,424 | 58,157 | |||
| RLI Corp. | 517,221 | 57,980 | ||||
| Hancock Whitney Corp. | 1,132,614 | 56,653 | ||||
| Axis Capital Holdings Ltd. | 1,018,199 | 55,461 | ||||
| Umpqua Holdings Corp. | 2,857,321 | 54,975 | ||||
| * | Brighthouse Financial Inc. | 1,059,905 | 54,903 | |||
| ServisFirst Bancshares Inc. | 637,427 | 54,143 | ||||
| Community Bank System Inc. | 710,807 | 52,941 | ||||
| Jackson Financial Inc. Class A | 1,231,002 | 51,493 | ||||
| Independent Bank Corp. (XNGS) | 623,749 | 50,854 | ||||
| FNB Corp. | 4,156,555 | 50,419 | ||||
| Pacific Premier Bancorp Inc. | 1,243,745 | 49,787 | ||||
| Radian Group Inc. | 2,353,331 | 49,726 | ||||
| Moelis & Co. Class A | 791,052 | 49,449 | ||||
| BankUnited Inc. | 1,160,566 | 49,104 | ||||
| Home BancShares Inc. | 1,970,028 | 47,970 | ||||
| Federated Hermes Inc. Class B | 1,265,893 | 47,572 | ||||
| Hamilton Lane Inc. Class A | 457,570 | 47,413 | ||||
| Chimera Investment Corp. | 3,091,867 | 46,625 | ||||
| Kemper Corp. | 789,590 | 46,420 | ||||
| Assured Guaranty Ltd. | 924,384 | 46,404 | ||||
| First Hawaiian Inc. | 1,695,988 | 46,351 | ||||
| Eastern Bankshares Inc. | 2,229,784 | 44,975 | ||||
| Simmons First National Corp. Class A | 1,514,137 | 44,788 | ||||
| Shares | Market Value• ($000) | |||||
| Navient Corp. | 2,106,685 | 44,704 | ||||
| Investors Bancorp Inc. | 2,938,755 | 44,522 | ||||
| Associated Banc-Corp | 1,965,320 | 44,397 | ||||
| Bank of Hawaii Corp. | 528,321 | 44,252 | ||||
| Cathay General Bancorp | 1,015,900 | 43,674 | ||||
| Ameris Bancorp | 868,204 | 43,132 | ||||
| BOK Financial Corp. | 401,696 | 42,375 | ||||
| United Community Banks Inc. | 1,169,653 | 42,037 | ||||
| American Equity Investment Life Holding Co. | 1,074,143 | 41,806 | ||||
| * | Mr Cooper Group Inc. | 994,022 | 41,361 | |||
| * | Focus Financial Partners Inc. Class A | 684,849 | 40,899 | |||
| * | Enstar Group Ltd. | 163,488 | 40,478 | |||
| Artisan Partners Asset Management Inc. Class A | 849,186 | 40,455 | ||||
| White Mountains Insurance Group Ltd. | 39,239 | 39,784 | ||||
| Old National Bancorp | 2,188,055 | 39,648 | ||||
| * | Texas Capital Bancshares Inc. | 657,489 | 39,614 | |||
| FirstCash Holdings Inc. | 524,938 | 39,271 | ||||
| * | Axos Financial Inc. | 700,952 | 39,190 | |||
| CNO Financial Group Inc. | 1,617,159 | 38,553 | ||||
| * | Cannae Holdings Inc. | 1,082,587 | 38,053 | |||
| First Bancorp (XNYS) | 2,715,877 | 37,425 | ||||
| Atlantic Union Bankshares Corp. | 1,000,487 | 37,308 | ||||
| Live Oak Bancshares Inc. | 420,969 | 36,746 | ||||
| * | Triumph Bancorp Inc. | 308,293 | 36,712 | |||
| CVB Financial Corp. | 1,692,451 | 36,235 | ||||
| Arbor Realty Trust Inc. | 1,977,589 | 36,229 | ||||
| Fulton Financial Corp. | 2,093,416 | 35,588 | ||||
| Independent Bank Group Inc. | 479,745 | 34,614 | ||||
| Goosehead Insurance Inc. Class A | 261,290 | 33,989 | ||||
| Columbia Banking System Inc. | 1,032,996 | 33,800 | ||||
| Flagstar Bancorp Inc. | 703,848 | 33,742 | ||||
| * | PROG Holdings Inc. | 741,065 | 33,429 | |||
| Piper Sandler Cos. | 183,991 | 32,844 | ||||
| Virtu Financial Inc. Class A | 1,131,184 | 32,612 | ||||
| American National Group Inc. | 169,137 | 31,940 | ||||
| * | LendingClub Corp. | 1,312,573 | 31,738 | |||
| WSFS Financial Corp. | 617,016 | 30,925 | ||||
| * | Ryan Specialty Group Holdings Inc. Class A | 758,790 | 30,617 | |||
| First Midwest Bancorp Inc. | 1,491,702 | 30,550 | ||||
| First Financial Bancorp | 1,249,002 | 30,451 | ||||
| Shares | Market Value• ($000) | |||||
| * | Open Lending Corp. Class A | 1,326,567 | 29,821 | |||
| WesBanco Inc. | 851,974 | 29,811 | ||||
| First Merchants Corp. | 706,461 | 29,594 | ||||
| Sandy Spring Bancorp Inc. | 615,389 | 29,588 | ||||
| PennyMac Financial Services Inc. | 423,051 | 29,521 | ||||
| Cohen & Steers Inc. | 318,200 | 29,437 | ||||
| Washington Federal Inc. | 880,945 | 29,406 | ||||
| International Bancshares Corp. | 688,633 | 29,191 | ||||
| * | PRA Group Inc. | 581,127 | 29,178 | |||
| Stewart Information Services Corp. | 357,385 | 28,494 | ||||
| Hilltop Holdings Inc. | 800,437 | 28,127 | ||||
| Renasant Corp. | 735,880 | 27,927 | ||||
| Heartland Financial USA Inc. | 544,049 | 27,534 | ||||
| Virtus Investment Partners Inc. | 92,171 | 27,384 | ||||
| Banner Corp. | 448,816 | 27,230 | ||||
| * | Genworth Financial Inc. Class A | 6,710,344 | 27,177 | |||
| Towne Bank | 853,014 | 26,947 | ||||
| Seacoast Banking Corp. of Florida | 750,350 | 26,555 | ||||
| StepStone Group Inc. Class A | 636,443 | 26,457 | ||||
| Park National Corp. | 192,605 | 26,447 | ||||
| Argo Group International Holdings Ltd. | 454,830 | 26,430 | ||||
| Trustmark Corp. | 813,007 | 26,390 | ||||
| Lakeland Financial Corp. | 328,293 | 26,309 | ||||
| Nelnet Inc. Class A | 267,128 | 26,093 | ||||
| * | Customers Bancorp Inc. | 399,120 | 26,090 | |||
| Veritex Holdings Inc. | 648,294 | 25,789 | ||||
| * | Green Dot Corp. Class A | 709,530 | 25,713 | |||
| Two Harbors Investment Corp. | 4,432,513 | 25,576 | ||||
| * | BRP Group Inc. Class A | 705,227 | 25,466 | |||
| 1 | Rocket Cos. Inc. Class A | 1,784,807 | 24,987 | |||
| Provident Financial Services Inc. | 1,025,682 | 24,842 | ||||
| Meta Financial Group Inc. | 410,886 | 24,513 | ||||
| Eagle Bancorp Inc. | 418,263 | 24,401 | ||||
| * | NMI Holdings Inc. Class A | 1,114,490 | 24,352 | |||
| Great Western Bancorp Inc. | 713,044 | 24,215 | ||||
| Enterprise Financial Services Corp. | 504,791 | 23,771 | ||||
| Northwest Bancshares Inc. | 1,672,781 | 23,687 | ||||
| Shares | Market Value• ($000) | |||||
| PJT Partners Inc. Class A | 317,711 | 23,539 | ||||
| MFA Financial Inc. | 5,140,583 | 23,441 | ||||
| Hope Bancorp Inc. | 1,564,781 | 23,018 | ||||
| Apollo Commercial Real Estate Finance Inc. | 1,710,216 | 22,506 | ||||
| PennyMac Mortgage Investment Trust | 1,275,339 | 22,102 | ||||
| Horace Mann Educators Corp. | 568,321 | 21,994 | ||||
| NBT Bancorp Inc. | 568,854 | 21,912 | ||||
| First Bancorp (XNGS) | 474,207 | 21,681 | ||||
| *,1 | Lemonade Inc. | 511,574 | 21,542 | |||
| Stock Yards Bancorp Inc. | 333,959 | 21,333 | ||||
| * | Palomar Holdings Inc. | 323,741 | 20,969 | |||
| Redwood Trust Inc. | 1,557,240 | 20,540 | ||||
| FB Financial Corp. | 466,519 | 20,443 | ||||
| * | Encore Capital Group Inc. | 326,627 | 20,287 | |||
| First Commonwealth Financial Corp. | 1,244,207 | 20,019 | ||||
| Westamerica Bancorp | 346,460 | 20,001 | ||||
| BGC Partners Inc. Class A | 4,242,477 | 19,728 | ||||
| * | Enova International Inc. | 473,889 | 19,411 | |||
| Capitol Federal Financial Inc. | 1,709,159 | 19,365 | ||||
| First Interstate BancSystem Inc. Class A | 465,654 | 18,938 | ||||
| B. Riley Financial Inc. | 212,283 | 18,863 | ||||
| Mercury General Corp. | 353,600 | 18,762 | ||||
| * | Bancorp Inc. | 741,088 | 18,757 | |||
| * | LendingTree Inc. | 151,311 | 18,551 | |||
| First Busey Corp. | 682,584 | 18,512 | ||||
| New York Mortgage Trust Inc. | 4,866,830 | 18,105 | ||||
| National Bank Holdings Corp. Class A | 411,542 | 18,083 | ||||
| Southside Bancshares Inc. | 428,021 | 17,900 | ||||
| Berkshire Hills Bancorp Inc. | 620,853 | 17,651 | ||||
| OFG Bancorp | 661,379 | 17,566 | ||||
| ProAssurance Corp. | 692,667 | 17,524 | ||||
| Ladder Capital Corp. | 1,459,261 | 17,497 | ||||
| * | Donnelley Financial Solutions Inc. | 368,432 | 17,368 | |||
| BancFirst Corp. | 241,463 | 17,038 | ||||
| OceanFirst Financial Corp. | 761,073 | 16,896 | ||||
| S&T Bancorp Inc. | 535,427 | 16,877 | ||||
| Brookline Bancorp Inc. | 1,005,991 | 16,287 | ||||
| City Holding Co. | 198,908 | 16,269 | ||||
| Broadmark Realty Capital Inc. | 1,702,126 | 16,051 | ||||
| Shares | Market Value• ($000) | |||||
| Safety Insurance Group Inc. | 183,842 | 15,632 | ||||
| Employers Holdings Inc. | 370,743 | 15,341 | ||||
| ConnectOne Bancorp Inc. | 463,429 | 15,159 | ||||
| TriCo Bancshares | 351,615 | 15,105 | ||||
| * | Selectquote Inc. | 1,657,115 | 15,013 | |||
| Dime Community Bancshares Inc. | 425,882 | 14,974 | ||||
| Premier Financial Corp. | 478,461 | 14,789 | ||||
| CNA Financial Corp. | 332,387 | 14,652 | ||||
| James River Group Holdings Ltd. | 502,432 | 14,475 | ||||
| * | Metropolitan Bank Holding Corp. | 135,447 | 14,429 | |||
| Banc of California Inc. | 735,085 | 14,422 | ||||
| *,1 | Hippo Holdings Inc. | 4,989,332 | 14,120 | |||
| * | World Acceptance Corp. | 55,917 | 13,724 | |||
| * | StoneX Group Inc. | 223,680 | 13,700 | |||
| HomeStreet Inc. | 261,855 | 13,616 | ||||
| AMERISAFE Inc. | 250,553 | 13,487 | ||||
| * | Nicolet Bankshares Inc. | 156,377 | 13,409 | |||
| Federal Agricultural Mortgage Corp. Class C | 105,485 | 13,073 | ||||
| BrightSpire Capital Inc. Class A | 1,270,474 | 13,035 | ||||
| Origin Bancorp Inc. | 302,324 | 12,976 | ||||
| Cowen Inc. Class A | 357,666 | 12,912 | ||||
| Bryn Mawr Bank Corp. | 281,384 | 12,665 | ||||
| First Foundation Inc. | 509,074 | 12,656 | ||||
| Kearny Financial Corp. | 950,150 | 12,590 | ||||
| Preferred Bank | 175,250 | 12,581 | ||||
| Ready Capital Corp. | 800,791 | 12,516 | ||||
| Tompkins Financial Corp. | 149,553 | 12,500 | ||||
| German American Bancorp Inc. | 319,363 | 12,449 | ||||
| Washington Trust Bancorp Inc. | 219,553 | 12,376 | ||||
| KKR Real Estate Finance Trust Inc. | 591,239 | 12,316 | ||||
| * | Amerant Bancorp Inc. Class A | 353,929 | 12,228 | |||
| Univest Financial Corp. | 407,881 | 12,204 | ||||
| Lakeland Bancorp Inc. | 639,129 | 12,137 | ||||
| ARMOUR Residential REIT Inc. | 1,235,928 | 12,124 | ||||
| State Auto Financial Corp. | 234,071 | 12,099 | ||||
| Brightsphere Investment Group Inc. | 468,565 | 11,995 | ||||
| Ellington Financial Inc. | 694,010 | 11,861 | ||||
| First Bancshares Inc. | 301,995 | 11,663 | ||||
| Shares | Market Value• ($000) | |||||
| * | Columbia Financial Inc. | 547,329 | 11,417 | |||
| * | TriState Capital Holdings Inc. | 375,088 | 11,350 | |||
| Invesco Mortgage Capital Inc. | 4,027,286 | 11,196 | ||||
| Heritage Financial Corp. | 447,828 | 10,945 | ||||
| TFS Financial Corp. | 598,842 | 10,701 | ||||
| 1st Source Corp. | 213,383 | 10,584 | ||||
| Peoples Bancorp Inc. | 332,668 | 10,582 | ||||
| QCR Holdings Inc. | 188,560 | 10,559 | ||||
| * | Blucora Inc. | 606,860 | 10,511 | |||
| Horizon Bancorp Inc. | 498,863 | 10,401 | ||||
| * | MBIA Inc. | 652,191 | 10,298 | |||
| * | Ambac Financial Group Inc. | 639,679 | 10,267 | |||
| Allegiance Bancshares Inc. | 242,655 | 10,242 | ||||
| TPG RE Finance Trust Inc. | 827,992 | 10,201 | ||||
| Heritage Commerce Corp. | 850,845 | 10,159 | ||||
| First Mid Bancshares Inc. | 233,563 | 9,994 | ||||
| 1 | Orchid Island Capital Inc. | 2,215,787 | 9,971 | |||
| Merchants Bancorp | 210,500 | 9,963 | ||||
| Central Pacific Financial Corp. | 348,900 | 9,829 | ||||
| Northfield Bancorp Inc. | 602,409 | 9,735 | ||||
| Ares Commercial Real Estate Corp. | 655,675 | 9,534 | ||||
| * | SiriusPoint Ltd. | 1,167,903 | 9,495 | |||
| WisdomTree Investments Inc. | 1,541,160 | 9,432 | ||||
| HarborOne Bancorp Inc. | 635,441 | 9,430 | ||||
| Flushing Financial Corp. | 385,935 | 9,378 | ||||
| Cambridge Bancorp | 98,321 | 9,202 | ||||
| Hanmi Financial Corp. | 386,822 | 9,160 | ||||
| Hingham Institution For Savings | 21,665 | 9,097 | ||||
| HCI Group Inc. | 107,264 | 8,961 | ||||
| Camden National Corp. | 184,496 | 8,885 | ||||
| Great Southern Bancorp Inc. | 149,256 | 8,843 | ||||
| Byline Bancorp Inc. | 321,629 | 8,797 | ||||
| Granite Point Mortgage Trust Inc. | 749,915 | 8,782 | ||||
| * | Franklin BSP Realty Trust Inc. | 587,358 | 8,775 | |||
| TrustCo Bank Corp. | 262,231 | 8,735 | ||||
| Dynex Capital Inc. | 518,133 | 8,658 | ||||
| Peapack-Gladstone Financial Corp. | 242,650 | 8,590 | ||||
| * | CrossFirst Bankshares Inc. | 548,804 | 8,567 | |||
| Shares | Market Value• ($000) | |||||
| Bank of Marin Bancorp | 226,631 | 8,437 | ||||
| * | eHealth Inc. | 322,883 | 8,234 | |||
| Community Trust Bancorp Inc. | 187,827 | 8,191 | ||||
| * | Atlantic Capital Bancshares Inc. | 282,420 | 8,125 | |||
| Farmers National Banc Corp. | 436,314 | 8,094 | ||||
| Reliant Bancorp Inc. | 224,706 | 7,977 | ||||
| Arrow Financial Corp. | 225,103 | 7,930 | ||||
| Diamond Hill Investment Group Inc. | 39,784 | 7,727 | ||||
| Equity Bancshares Inc. Class A | 226,765 | 7,694 | ||||
| Regional Management Corp. | 133,231 | 7,655 | ||||
| CBTX Inc. | 263,013 | 7,627 | ||||
| Business First Bancshares Inc. | 267,242 | 7,566 | ||||
| Victory Capital Holdings Inc. Class A | 205,889 | 7,521 | ||||
| First Financial Corp. | 160,442 | 7,266 | ||||
| * | Bridge Investment Group Holdings Inc. Class A | 290,206 | 7,246 | |||
| First Community Bankshares Inc. | 215,279 | 7,195 | ||||
| 1 | UWM Holdings Corp. Class A | 1,192,198 | 7,058 | |||
| United Fire Group Inc. | 303,449 | 7,037 | ||||
| Independent Bank Corp. | 292,201 | 6,975 | ||||
| Universal Insurance Holdings Inc. | 402,466 | 6,842 | ||||
| First of Long Island Corp. | 316,476 | 6,833 | ||||
| Mercantile Bank Corp. | 193,019 | 6,761 | ||||
| A-Mark Precious Metals Inc. | 109,923 | 6,716 | ||||
| Financial Institutions Inc. | 210,944 | 6,708 | ||||
| Midland States Bancorp Inc. | 265,744 | 6,588 | ||||
| MidWestOne Financial Group Inc. | 202,789 | 6,564 | ||||
| Alerus Financial Corp. | 221,853 | 6,496 | ||||
| * | AssetMark Financial Holdings Inc. | 247,389 | 6,484 | |||
| National Western Life Group Inc. Class A | 30,179 | 6,472 | ||||
| HomeTrust Bancshares Inc. | 208,542 | 6,461 | ||||
| Perella Weinberg Partners Class A | 502,279 | 6,459 | ||||
| * | Coastal Financial Corp. | 126,892 | 6,423 | |||
| Waterstone Financial Inc. | 289,103 | 6,320 | ||||
| Shares | Market Value• ($000) | |||||
| Metrocity Bankshares Inc. | 228,614 | 6,294 | ||||
| First Internet Bancorp | 133,572 | 6,283 | ||||
| * | Southern First Bancshares Inc. | 99,430 | 6,213 | |||
| West Bancorp Inc. | 199,877 | 6,210 | ||||
| Bank First Corp. | 85,749 | 6,195 | ||||
| MVB Financial Corp. | 147,233 | 6,113 | ||||
| CNB Financial Corp. | 226,856 | 6,012 | ||||
| Republic Bancorp Inc. Class A | 117,336 | 5,965 | ||||
| * | Blue Foundry Bancorp | 405,607 | 5,934 | |||
| Bar Harbor Bankshares | 202,285 | 5,852 | ||||
| * | EZCORP Inc. Class A | 779,701 | 5,746 | |||
| Oppenheimer Holdings Inc. Class A | 122,770 | 5,693 | ||||
| SmartFinancial Inc. | 204,788 | 5,603 | ||||
| Sculptor Capital Management Inc. Class A | 260,847 | 5,569 | ||||
| Independence Holding Co. | 96,781 | 5,486 | ||||
| Mid Penn Bancorp Inc. | 172,371 | 5,471 | ||||
| Citizens & Northern Corp. | 209,102 | 5,462 | ||||
| * | Atlanticus Holdings Corp. | 75,873 | 5,411 | |||
| * | Carter Bankshares Inc. | 346,869 | 5,338 | |||
| Capstar Financial Holdings Inc. | 253,769 | 5,337 | ||||
| Sierra Bancorp | 192,891 | 5,237 | ||||
| Spirit of Texas Bancshares Inc. | 181,162 | 5,214 | ||||
| American National Bankshares Inc. | 137,995 | 5,200 | ||||
| * | Moneylion Inc. | 1,278,896 | 5,154 | |||
| * | Oportun Financial Corp. | 253,995 | 5,143 | |||
| Southern Missouri Bancorp Inc. | 96,694 | 5,045 | ||||
| Peoples Financial Services Corp. | 93,637 | 4,934 | ||||
| Old Second Bancorp Inc. | 382,721 | 4,818 | ||||
| Farmers & Merchants Bancorp Inc. | 146,367 | 4,805 | ||||
| Home Bancorp Inc. | 112,003 | 4,649 | ||||
| Enterprise Bancorp Inc. | 103,421 | 4,646 | ||||
| GCM Grosvenor Inc. Class A | 441,003 | 4,631 | ||||
| * | Ocwen Financial Corp. | 115,250 | 4,607 | |||
| Shore Bancshares Inc. | 220,407 | 4,595 | ||||
| Civista Bancshares Inc. | 186,753 | 4,557 | ||||
| Provident Bancorp Inc. | 238,739 | 4,441 | ||||
| * | Bridgewater Bancshares Inc. | 244,629 | 4,328 | |||
| Great Ajax Corp. | 326,856 | 4,301 | ||||
| Shares | Market Value• ($000) | |||||
| Curo Group Holdings Corp. | 266,484 | 4,266 | ||||
| FS Bancorp Inc. | 124,013 | 4,171 | ||||
| Investors Title Co. | 21,033 | 4,147 | ||||
| South Plains Financial Inc. | 148,103 | 4,119 | ||||
| *,1 | Oscar Health Inc. Class A | 522,904 | 4,105 | |||
| RBB Bancorp | 154,614 | 4,051 | ||||
| Guaranty Bancshares Inc. | 106,714 | 4,010 | ||||
| Capital City Bank Group Inc. | 151,106 | 3,989 | ||||
| ACNB Corp. | 125,770 | 3,934 | ||||
| * | P10 Inc. Class A | 279,024 | 3,901 | |||
| Orrstown Financial Services Inc. | 153,660 | 3,872 | ||||
| Northrim Bancorp Inc. | 88,313 | 3,838 | ||||
| Tiptree Inc. Class A | 277,013 | 3,831 | ||||
| Northeast Bank | 106,765 | 3,815 | ||||
| *,1 | Root Inc. Class A | 1,216,113 | 3,770 | |||
| * | Velocity Financial Inc. | 273,207 | 3,743 | |||
| Greenhill & Co. Inc. | 206,465 | 3,702 | ||||
| AFC Gamma Inc. | 162,122 | 3,690 | ||||
| PCSB Financial Corp. | 193,725 | 3,689 | ||||
| * | Professional Holding Corp. Class A | 190,415 | 3,648 | |||
| 1 | Blue Ridge Bankshares Inc. | 202,241 | 3,620 | |||
| First Bancorp Inc. | 113,699 | 3,570 | ||||
| Red River Bancshares Inc. | 65,868 | 3,524 | ||||
| Federal Agricultural Mortgage Corp. Class A | 29,589 | 3,512 | ||||
| LCNB Corp. | 178,672 | 3,489 | ||||
| * | Howard Bancorp Inc. | 158,987 | 3,464 | |||
| Amalgamated Financial Corp. | 202,671 | 3,399 | ||||
| *,1 | Bakkt Holdings Inc. | 398,260 | 3,389 | |||
| First Bank | 232,486 | 3,373 | ||||
| * | Citizens Inc. Class A | 632,742 | 3,360 | |||
| Evans Bancorp Inc. | 82,185 | 3,312 | ||||
| Territorial Bancorp Inc. | 129,778 | 3,277 | ||||
| BCB Bancorp Inc. | 212,341 | 3,276 | ||||
| Summit Financial Group Inc. | 118,808 | 3,261 | ||||
| Capital Bancorp Inc. | 122,969 | 3,222 | ||||
| * | Esquire Financial Holdings Inc. | 101,788 | 3,219 | |||
| * | GoHealth Inc. Class A | 849,255 | 3,219 | |||
| National Bankshares Inc. | 88,424 | 3,206 | ||||
| PCB Bancorp | 145,810 | 3,202 | ||||
| Western New England Bancorp Inc. | 365,084 | 3,198 | ||||
| Central Valley Community Bancorp | 148,191 | 3,078 | ||||
| 1st Constitution Bancorp | 119,075 | 3,059 | ||||
| * | Maiden Holdings Ltd. | 999,523 | 3,059 | |||
| Ames National Corp. | 124,371 | 3,046 | ||||
| Shares | Market Value• ($000) | |||||
| Meridian Corp. | 81,911 | 3,012 | ||||
| Community Financial Corp. | 76,296 | 2,999 | ||||
| * | Republic First Bancorp Inc. | 797,187 | 2,966 | |||
| * | FVCBankcorp Inc. | 148,613 | 2,944 | |||
| First Northwest Bancorp | 145,405 | 2,942 | ||||
| Macatawa Bank Corp. | 332,193 | 2,930 | ||||
| Fidelity D&D Bancorp Inc. | 49,363 | 2,912 | ||||
| Bankwell Financial Group Inc. | 88,086 | 2,893 | ||||
| Norwood Financial Corp. | 110,554 | 2,873 | ||||
| * | Greenlight Capital Re Ltd. Class A | 361,465 | 2,834 | |||
| HBT Financial Inc. | 151,274 | 2,833 | ||||
| Marlin Business Services Corp. | 121,362 | 2,825 | ||||
| Timberland Bancorp Inc. | 100,093 | 2,773 | ||||
| Parke Bancorp Inc. | 129,820 | 2,763 | ||||
| Donegal Group Inc. Class A | 190,416 | 2,721 | ||||
| Unity Bancorp Inc. | 101,713 | 2,670 | ||||
| *,1 | Katapult Holdings Inc. | 779,045 | 2,625 | |||
| OP Bancorp | 200,747 | 2,562 | ||||
| Codorus Valley Bancorp Inc. | 118,327 | 2,556 | ||||
| AG Mortgage Investment Trust Inc. | 248,577 | 2,548 | ||||
| First Business Financial Services Inc. | 86,353 | 2,519 | ||||
| Investar Holding Corp. | 136,704 | 2,517 | ||||
| Richmond Mutual Bancorp Inc. | 155,807 | 2,510 | ||||
| *,1 | MarketWise Inc. | 330,847 | 2,495 | |||
| Virginia National Bankshares Corp. | 65,882 | 2,438 | ||||
| * | First Western Financial Inc. | 79,462 | 2,412 | |||
| Colony Bankcorp Inc. | 141,239 | 2,411 | ||||
| Luther Burbank Corp. | 170,687 | 2,396 | ||||
| Level One Bancorp Inc. | 60,601 | 2,390 | ||||
| Riverview Bancorp Inc. | 305,977 | 2,353 | ||||
| Bank of Princeton | 79,818 | 2,341 | ||||
| ESSA Bancorp Inc. | 135,039 | 2,340 | ||||
| Heritage Insurance Holdings Inc. | 398,021 | 2,340 | ||||
| C&F Financial Corp. | 45,401 | 2,324 | ||||
| * | Consumer Portfolio Services Inc. | 194,856 | 2,309 | |||
| Five Star Bancorp | 76,817 | 2,305 | ||||
| * | BayCom Corp. | 122,704 | 2,302 | |||
| Penns Woods Bancorp Inc. | 97,344 | 2,294 | ||||
| Middlefield Banc Corp. | 91,987 | 2,283 | ||||
| Shares | Market Value• ($000) | |||||
| ChoiceOne Financial Services Inc. | 86,197 | 2,283 | ||||
| Cherry Hill Mortgage Investment Corp. | 274,777 | 2,272 | ||||
| * | MainStreet Bancshares Inc. | 91,479 | 2,249 | |||
| Chemung Financial Corp. | 48,607 | 2,225 | ||||
| * | Sunlight Financial Holdings Inc. | 464,556 | 2,221 | |||
| * | NI Holdings Inc. | 117,275 | 2,218 | |||
| * | California Bancorp | 110,633 | 2,217 | |||
| Associated Capital Group Inc. Class A | 51,505 | 2,215 | ||||
| FNCB Bancorp Inc. | 235,886 | 2,149 | ||||
| Hawthorn Bancshares Inc. | 82,623 | 2,134 | ||||
| * | MetroMile Inc. | 970,104 | 2,125 | |||
| Pzena Investment Management Inc. Class A | 222,711 | 2,109 | ||||
| Western Asset Mortgage Capital Corp. | 981,644 | 2,071 | ||||
| BankFinancial Corp. | 193,469 | 2,064 | ||||
| First Savings Financial Group Inc. | 77,924 | 2,057 | ||||
| Citizens Community Bancorp Inc. | 147,132 | 2,026 | ||||
| Ellington Residential Mortgage REIT | 194,047 | 2,016 | ||||
| Eagle Bancorp Montana Inc. | 87,136 | 2,002 | ||||
| Crawford & Co. Class B | 265,916 | 1,992 | ||||
| Westwood Holdings Group Inc. | 117,060 | 1,983 | ||||
| Sachem Capital Corp. | 339,133 | 1,981 | ||||
| William Penn Bancorp | 163,503 | 1,975 | ||||
| Finward Bancorp | 41,124 | 1,936 | ||||
| First United Corp. | 100,991 | 1,906 | ||||
| First Guaranty Bancshares Inc. | 92,686 | 1,889 | ||||
| Seven Hills Realty Trust | 181,233 | 1,881 | ||||
| First Community Corp. | 90,477 | 1,878 | ||||
| Franklin Financial Services Corp. | 56,818 | 1,875 | ||||
| SB Financial Group Inc. | 94,702 | 1,844 | ||||
| * | Security National Financial Corp. Class A | 199,366 | 1,834 | |||
| Salisbury Bancorp Inc. | 33,684 | 1,781 | ||||
| Northeast Community Bancorp Inc. | 157,983 | 1,758 | ||||
| Randolph Bancorp Inc. | 73,189 | 1,748 | ||||
| * | Safeguard Scientifics Inc. | 237,576 | 1,746 | |||
| GAMCO Investors Inc. Class A | 69,560 | 1,738 | ||||
| Shares | Market Value• ($000) | |||||
| Manning & Napier Inc. Class A | 208,505 | 1,733 | ||||
| * | Arlington Asset Investment Corp. Class A | 494,024 | 1,729 | |||
| First Capital Inc. | 42,197 | 1,686 | ||||
| Silvercrest Asset Management Group Inc. Class A | 97,641 | 1,677 | ||||
| * | PDL Community Bancorp | 112,549 | 1,648 | |||
| Guild Holdings Co. Class A | 117,176 | 1,644 | ||||
| Nexpoint Real Estate Finance Inc. | 85,212 | 1,640 | ||||
| * | Trean Insurance Group Inc. | 183,208 | 1,632 | |||
| * | Malvern Bancorp Inc. | 102,416 | 1,605 | |||
| First Financial Northwest Inc. | 98,791 | 1,597 | ||||
| Oak Valley Bancorp | 88,224 | 1,535 | ||||
| Provident Financial Holdings Inc. | 92,138 | 1,525 | ||||
| United Security Bancshares | 183,759 | 1,492 | ||||
| Ohio Valley Banc Corp. | 51,092 | 1,484 | ||||
| * | Catalyst Bancorp Inc. | 108,477 | 1,483 | |||
| First National Corp. | 64,436 | 1,472 | ||||
| Bank of South Carolina Corp. | 72,414 | 1,461 | ||||
| * | Sterling Bancorp Inc. | 249,917 | 1,437 | |||
| * | Third Coast Bancshares Inc. | 54,695 | 1,421 | |||
| Plumas Bancorp | 41,804 | 1,413 | ||||
| *,1 | Finance of America Cos. Inc. Class A | 339,206 | 1,347 | |||
| United Insurance Holdings Corp. | 308,517 | 1,339 | ||||
| CF Bankshares Inc. | 63,217 | 1,319 | ||||
| Summit State Bank | 85,789 | 1,293 | ||||
| * | SWK Holdings Corp. | 65,223 | 1,280 | |||
| * | Nicholas Financial Inc. | 106,813 | 1,259 | |||
| Guaranty Federal Bancshares Inc. | 38,723 | 1,237 | ||||
| Primis Financial Corp. | 82,022 | 1,234 | ||||
| * | Pioneer Bancorp Inc. | 108,951 | 1,233 | |||
| * | Medallion Financial Corp. | 210,128 | 1,219 | |||
| Landmark Bancorp Inc. | 42,400 | 1,208 | ||||
| Prudential Bancorp Inc. | 88,906 | 1,207 | ||||
| * | ACRES Commercial Realty Corp. | 96,782 | 1,207 | |||
| Crawford & Co. Class A | 159,098 | 1,192 | ||||
| * | Hallmark Financial Services Inc. | 269,016 | 1,170 | |||
| Bank of the James Financial Group Inc. | 75,721 | 1,168 | ||||
| * | HMN Financial Inc. | 47,095 | 1,148 | |||
| Shares | Market Value• ($000) | |||||
| *,1 | Reliance Global Group Inc. | 173,937 | 1,120 | |||
| United Bancorp Inc. | 66,947 | 1,115 | ||||
| Union Bankshares Inc. | 38,300 | 1,113 | ||||
| Old Point Financial Corp. | 44,911 | 1,023 | ||||
| AmeriServ Financial Inc. | 262,583 | 1,014 | ||||
| Citizens Holding Co. | 54,008 | 1,013 | ||||
| CB Financial Services Inc. | 41,665 | 1,004 | ||||
| * | FFBW Inc. | 85,136 | 1,000 | |||
| Sound Financial Bancorp Inc. | 22,590 | 994 | ||||
| Angel Oak Mortgage Inc. | 60,020 | 983 | ||||
| loanDepot Inc. Class A | 196,039 | 941 | ||||
| * | Elevate Credit Inc. | 313,340 | 931 | |||
| Greene County Bancorp Inc. | 25,270 | 929 | ||||
| IF Bancorp Inc. | 35,959 | 893 | ||||
| US Global Investors Inc. Class A | 200,591 | 883 | ||||
| Partners Bancorp | 87,982 | 860 | ||||
| Lument Finance Trust Inc. | 221,872 | 852 | ||||
| * | Kingsway Financial Services Inc. | 151,099 | 828 | |||
| Bank7 Corp. | 35,498 | 816 | ||||
| First US Bancshares Inc. | 76,671 | 811 | ||||
| *,1 | OppFi Inc. | 178,650 | 811 | |||
| Donegal Group Inc. Class B | 61,092 | 775 | ||||
| Community West Bancshares | 55,316 | 736 | ||||
| United Bancshares Inc. | 20,954 | 639 | ||||
| Auburn National Bancorp Inc. | 19,557 | 620 | ||||
| Hennessy Advisors Inc. | 56,865 | 618 | ||||
| Kingstone Cos. Inc. | 123,015 | 615 | ||||
| * | Limestone Bancorp Inc. | 32,326 | 603 | |||
| * | Broadway Financial Corp. | 235,423 | 544 | |||
| Pathfinder Bancorp Inc. | 31,287 | 530 | ||||
| * | LM Funding America Inc. | 98,813 | 480 | |||
| * | Oxbridge Re Holdings Ltd. | 84,970 | 478 | |||
| Elmira Savings Bank | 19,993 | 457 | ||||
| * | Midwest Holding Inc. | 25,823 | 449 | |||
| Emclaire Financial Corp. | 14,701 | 425 | ||||
| * | FlexShopper Inc. | 180,047 | 423 | |||
| Manhattan Bridge Capital Inc. | 76,457 | 421 | ||||
| * | Ashford Inc. | 20,076 | 334 | |||
| Shares | Market Value• ($000) | |||||
| * | Heritage Global Inc. | 175,564 | 327 | |||
| *,1 | Bright Health Group Inc. | 92,592 | 319 | |||
| * | Bogota Financial Corp. | 29,674 | 302 | |||
| * | Siebert Financial Corp. | 129,565 | 301 | |||
| Oconee Federal Financial Corp. | 13,246 | 289 | ||||
| * | Affinity Bancshares Inc. | 17,347 | 267 | |||
| * | FedNat Holding Co. | 178,123 | 251 | |||
| * | Rhinebeck Bancorp Inc. | 21,436 | 229 | |||
| *,1,2 | Contran Corp. CVR | 238,902 | 229 | |||
| * | Marpai Inc. Class A | 50,925 | 223 | |||
| 1 | Atlantic American Corp. | 88,286 | 216 | |||
| * | Impac Mortgage Holdings Inc. | 181,058 | 201 | |||
| * | Carver Bancorp Inc. | 21,622 | 185 | |||
| * | Vericity Inc. | 26,052 | 178 | |||
| 1 | Cohen & Co. Inc. | 11,109 | 165 | |||
| Magyar Bancorp Inc. | 12,780 | 157 | ||||
| Mid-Southern Bancorp Inc. | 10,175 | 153 | ||||
| * | USCB Financial Holdings Inc. | 9,881 | 142 | |||
| Glen Burnie Bancorp | 9,237 | 129 | ||||
| * | Income Opportunity Realty Investors Inc. | 8,937 | 110 | |||
| Value Line Inc. | 1,919 | 90 | ||||
| Home Federal Bancorp Inc. of Louisiana | 4,434 | 88 | ||||
| * | OptimumBank Holdings Inc. | 21,456 | 85 | |||
| Village Bank & Trust Financial Corp. | 1,327 | 75 | ||||
| * | Finwise Bancorp | 5,390 | 74 | |||
| Kentucky First Federal Bancorp | 9,399 | 71 | ||||
| * | Conifer Holdings Inc. | 24,973 | 58 | |||
| * | FG Financial Group Inc. | 15,130 | 56 | |||
| Peoples Bancorp of North Carolina Inc. | 1,839 | 51 | ||||
| * | Patriot National Bancorp Inc. | 3,024 | 47 | |||
| * | ICC Holdings Inc. | 2,593 | 43 | |||
| * | GWG Holdings Inc. | 2,941 | 29 | |||
| National Security Group Inc. | 1,272 | 12 | ||||
| * | HV Bancorp Inc. | 483 | 11 | |||
| * | Unico American Corp. | 1,377 | 5 | |||
| Lake Shore Bancorp Inc. | 263 | 4 | ||||
| *,2 | F-star Therapeutics Inc. CVR | 40,838 | 3 | |||
| WVS Financial Corp. | 100 | 2 | ||||
| Shares | Market Value• ($000) | |||||
| *,2 | Frontier Financial Corp. | 1 | — | |||
| *,2 | Cogent Biosciences Inc. CVR | 101,693 | — | |||
| 15,401,338 | ||||||
| Health Care (13.2%) | ||||||
| * | Veeva Systems Inc. Class A | 1,832,605 | 468,194 | |||
| * | Avantor Inc. | 8,027,254 | 338,268 | |||
| * | Horizon Therapeutics plc | 2,994,606 | 322,699 | |||
| * | Alnylam Pharmaceuticals Inc. | 1,585,751 | 268,912 | |||
| * | Seagen Inc. | 1,686,761 | 260,773 | |||
| * | Molina Healthcare Inc. | 771,296 | 245,334 | |||
| * | Insulet Corp. | 912,469 | 242,781 | |||
| * | BioMarin Pharmaceutical Inc. | 2,426,604 | 214,390 | |||
| * | Masimo Corp. | 669,990 | 196,160 | |||
| * | Teladoc Health Inc. | 2,119,718 | 194,632 | |||
| Royalty Pharma plc Class A | 4,704,808 | 187,487 | ||||
| * | 10X Genomics Inc. Class A | 1,215,927 | 181,124 | |||
| * | Repligen Corp. | 680,950 | 180,343 | |||
| * | Exact Sciences Corp. | 2,280,966 | 177,528 | |||
| * | Elanco Animal Health Inc. | 6,251,431 | 177,416 | |||
| * | Novavax Inc. | 1,004,447 | 143,706 | |||
| * | Syneos Health Inc. | 1,370,002 | 140,672 | |||
| * | Guardant Health Inc. | 1,350,185 | 135,045 | |||
| * | Penumbra Inc. | 464,279 | 133,397 | |||
| *,1 | Ginkgo Bioworks Holdings Inc. | 15,538,245 | 129,123 | |||
| * | United Therapeutics Corp. | 592,772 | 128,086 | |||
| * | Tandem Diabetes Care Inc. | 842,562 | 126,822 | |||
| * | Tenet Healthcare Corp. | 1,397,914 | 114,196 | |||
| Bruker Corp. | 1,334,802 | 112,003 | ||||
| * | Natera Inc. | 1,165,266 | 108,824 | |||
| * | Intellia Therapeutics Inc. | 908,535 | 107,425 | |||
| Chemed Corp. | 202,250 | 106,998 | ||||
| * | Neurocrine Biosciences Inc. | 1,252,170 | 106,647 | |||
| * | Biohaven Pharmaceutical Holding Co. Ltd. | 767,471 | 105,765 | |||
| * | Omnicell Inc. | 577,900 | 104,276 | |||
| * | Sarepta Therapeutics Inc. | 1,151,808 | 103,720 | |||
| * | Jazz Pharmaceuticals plc | 811,826 | 103,427 | |||
| * | Mirati Therapeutics Inc. | 656,960 | 96,369 | |||
| * | Envista Holdings Corp. | 2,111,867 | 95,161 | |||
| * | Arrowhead Pharmaceuticals Inc. | 1,368,264 | 90,716 | |||
| * | Novocure Ltd. | 1,184,034 | 88,897 | |||
| Shares | Market Value• ($000) | |||||
| Encompass Health Corp. | 1,311,936 | 85,617 | ||||
| * | Blueprint Medicines Corp. | 775,228 | 83,035 | |||
| * | Inspire Medical Systems Inc. | 360,533 | 82,944 | |||
| * | Shockwave Medical Inc. | 464,710 | 82,872 | |||
| * | Medpace Holdings Inc. | 375,635 | 81,753 | |||
| * | Exelixis Inc. | 4,176,252 | 76,342 | |||
| * | AMN Healthcare Services Inc. | 620,535 | 75,910 | |||
| * | Ultragenyx Pharmaceutical Inc. | 901,741 | 75,827 | |||
| * | Arena Pharmaceuticals Inc. | 807,610 | 75,059 | |||
| * | Globus Medical Inc. Class A | 1,034,137 | 74,665 | |||
| * | Halozyme Therapeutics Inc. | 1,836,792 | 73,857 | |||
| * | Acadia Healthcare Co. Inc. | 1,184,477 | 71,898 | |||
| * | Change Healthcare Inc. | 3,354,358 | 71,716 | |||
| * | Amedisys Inc. | 431,462 | 69,845 | |||
| Perrigo Co. plc | 1,774,467 | 69,027 | ||||
| * | Quidel Corp. | 503,596 | 67,980 | |||
| Premier Inc. Class A | 1,591,471 | 65,521 | ||||
| * | Integra LifeSciences Holdings Corp. | 955,016 | 63,977 | |||
| * | Neogen Corp. | 1,400,387 | 63,592 | |||
| * | Fate Therapeutics Inc. | 1,068,972 | 62,546 | |||
| * | ICU Medical Inc. | 262,017 | 62,187 | |||
| * | Oak Street Health Inc. | 1,858,141 | 61,579 | |||
| * | LivaNova plc | 698,028 | 61,029 | |||
| * | Maravai LifeSciences Holdings Inc. Class A | 1,446,063 | 60,590 | |||
| * | Pacific Biosciences of California Inc. | 2,900,415 | 59,342 | |||
| Ensign Group Inc. | 685,712 | 57,572 | ||||
| * | STAAR Surgical Co. | 625,759 | 57,132 | |||
| * | LHC Group Inc. | 414,826 | 56,927 | |||
| * | Ionis Pharmaceuticals Inc. | 1,862,164 | 56,666 | |||
| * | NeoGenomics Inc. | 1,619,025 | 55,241 | |||
| * | Denali Therapeutics Inc. | 1,220,613 | 54,439 | |||
| CONMED Corp. | 382,531 | 54,228 | ||||
| * | Option Care Health Inc. | 1,812,054 | 51,535 | |||
| * | Intra-Cellular Therapies Inc. | 971,610 | 50,854 | |||
| * | Apellis Pharmaceuticals Inc. | 1,057,862 | 50,016 | |||
| * | Twist Bioscience Corp. | 646,164 | 50,007 | |||
| * | Cytokinetics Inc. | 1,095,915 | 49,952 | |||
| * | Alkermes plc | 2,118,813 | 49,284 | |||
| * | HealthEquity Inc. | 1,095,614 | 48,470 | |||
| * | Beam Therapeutics Inc. | 592,374 | 47,206 | |||
| Shares | Market Value• ($000) | |||||
| * | Arvinas Inc. | 565,502 | 46,450 | |||
| * | Progyny Inc. | 915,598 | 46,100 | |||
| * | iRhythm Technologies Inc. | 385,187 | 45,333 | |||
| * | R1 RCM Inc. | 1,747,795 | 44,551 | |||
| Owens & Minor Inc. | 984,323 | 42,818 | ||||
| * | Insmed Inc. | 1,565,606 | 42,647 | |||
| * | AtriCure Inc. | 600,948 | 41,784 | |||
| * | Invitae Corp. | 2,713,638 | 41,437 | |||
| * | Merit Medical Systems Inc. | 664,508 | 41,399 | |||
| * | Zentalis Pharmaceuticals Inc. | 489,526 | 41,150 | |||
| Select Medical Holdings Corp. | 1,384,304 | 40,699 | ||||
| * | Vir Biotechnology Inc. | 963,891 | 40,358 | |||
| * | Prestige Consumer Healthcare Inc. | 664,214 | 40,285 | |||
| * | Adaptive Biotechnologies Corp. | 1,426,007 | 40,014 | |||
| * | Certara Inc. | 1,389,002 | 39,475 | |||
| * | 1Life Healthcare Inc. | 2,243,871 | 39,425 | |||
| * | Inari Medical Inc. | 421,512 | 38,471 | |||
| * | Veracyte Inc. | 924,485 | 38,089 | |||
| * | Karuna Therapeutics Inc. | 289,010 | 37,860 | |||
| * | Amicus Therapeutics Inc. | 3,264,436 | 37,704 | |||
| * | Kodiak Sciences Inc. | 436,644 | 37,019 | |||
| * | Integer Holdings Corp. | 430,941 | 36,884 | |||
| * | Nevro Corp. | 454,657 | 36,859 | |||
| * | PTC Therapeutics Inc. | 923,293 | 36,775 | |||
| * | Apollo Medical Holdings Inc. | 492,681 | 36,202 | |||
| * | ACADIA Pharmaceuticals Inc. | 1,530,089 | 35,712 | |||
| * | CryoPort Inc. | 603,299 | 35,697 | |||
| * | NuVasive Inc. | 677,384 | 35,549 | |||
| * | Haemonetics Corp. | 662,715 | 35,150 | |||
| * | Iovance Biotherapeutics Inc. | 1,828,190 | 34,900 | |||
| * | Pacira BioSciences Inc. | 577,691 | 34,760 | |||
| * | Axonics Inc. | 614,685 | 34,422 | |||
| * | Ligand Pharmaceuticals Inc. | 216,364 | 33,420 | |||
| Patterson Cos. Inc. | 1,137,380 | 33,382 | ||||
| * | BioCryst Pharmaceuticals Inc. | 2,379,637 | 32,958 | |||
| * | TG Therapeutics Inc. | 1,720,007 | 32,680 | |||
| * | Nektar Therapeutics | 2,402,761 | 32,461 | |||
| * | Doximity Inc. Class A | 643,447 | 32,256 | |||
| * | Ortho Clinical Diagnostics Holdings plc | 1,490,752 | 31,887 | |||
| * | CareDx Inc. | 696,978 | 31,699 | |||
| * | Turning Point Therapeutics Inc. | 657,519 | 31,364 | |||
| * | AdaptHealth Corp. Class A | 1,276,721 | 31,229 | |||
| Shares | Market Value• ($000) | |||||
| * | Relay Therapeutics Inc. | 1,012,267 | 31,087 | |||
| * | Sotera Health Co. | 1,305,792 | 30,751 | |||
| * | MEDNAX Inc. | 1,118,956 | 30,447 | |||
| * | Xencor Inc. | 756,138 | 30,336 | |||
| * | Vocera Communications Inc. | 464,979 | 30,149 | |||
| * | Allscripts Healthcare Solutions Inc. | 1,621,672 | 29,920 | |||
| * | Evolent Health Inc. Class A | 1,080,668 | 29,902 | |||
| * | Kymera Therapeutics Inc. | 467,239 | 29,665 | |||
| * | Myriad Genetics Inc. | 1,053,778 | 29,084 | |||
| * | Sage Therapeutics Inc. | 670,705 | 28,532 | |||
| * | Phreesia Inc. | 676,766 | 28,194 | |||
| * | Magellan Health Inc. | 296,707 | 28,184 | |||
| * | Glaukos Corp. | 620,331 | 27,567 | |||
| *,1 | GoodRx Holdings Inc. Class A | 841,425 | 27,498 | |||
| * | Health Catalyst Inc. | 692,834 | 27,450 | |||
| * | Emergent BioSolutions Inc. | 630,420 | 27,404 | |||
| * | Covetrus Inc. | 1,361,952 | 27,198 | |||
| * | Heska Corp. | 143,997 | 26,278 | |||
| * | OPKO Health Inc. | 5,391,884 | 25,935 | |||
| * | Fulgent Genetics Inc. | 254,619 | 25,612 | |||
| * | NanoString Technologies Inc. | 606,286 | 25,603 | |||
| * | CorVel Corp. | 121,138 | 25,197 | |||
| * | Ironwood Pharmaceuticals Inc. Class A | 2,154,157 | 25,117 | |||
| * | Lantheus Holdings Inc. | 865,616 | 25,008 | |||
| * | Outset Medical Inc. | 541,485 | 24,957 | |||
| *,1 | Corcept Therapeutics Inc. | 1,255,644 | 24,862 | |||
| * | Codexis Inc. | 778,674 | 24,349 | |||
| * | Vericel Corp. | 619,079 | 24,330 | |||
| * | ModivCare Inc. | 163,616 | 24,263 | |||
| * | Surgery Partners Inc. | 453,973 | 24,247 | |||
| * | Arcus Biosciences Inc. | 595,515 | 24,100 | |||
| * | Editas Medicine Inc. | 906,021 | 24,055 | |||
| * | Cerevel Therapeutics Holdings Inc. | 741,791 | 24,049 | |||
| * | Celldex Therapeutics Inc. | 618,905 | 23,914 | |||
| * | Agios Pharmaceuticals Inc. | 720,136 | 23,671 | |||
| * | Bridgebio Pharma Inc. | 1,419,066 | 23,670 | |||
| * | Avid Bioservices Inc. | 810,343 | 23,646 | |||
| * | IVERIC bio Inc. | 1,411,174 | 23,595 | |||
| * | ChemoCentryx Inc. | 646,631 | 23,544 | |||
| Mesa Laboratories Inc. | 71,044 | 23,309 | ||||
| * | Prothena Corp. plc | 471,759 | 23,305 | |||
| * | Global Blood Therapeutics Inc. | 779,024 | 22,802 | |||
| * | Community Health Systems Inc. | 1,642,523 | 21,862 | |||
| Shares | Market Value• ($000) | |||||
| * | SomaLogic Inc. | 1,877,294 | 21,852 | |||
| * | Schrodinger Inc. | 626,414 | 21,818 | |||
| *,1 | Cassava Sciences Inc. | 494,589 | 21,614 | |||
| * | Cano Health Inc. | 2,412,848 | 21,498 | |||
| * | SpringWorks Therapeutics Inc. | 343,590 | 21,296 | |||
| * | Avanos Medical Inc. | 611,360 | 21,196 | |||
| * | Travere Therapeutics Inc. | 682,071 | 21,171 | |||
| * | REVOLUTION Medicines Inc. | 832,464 | 20,953 | |||
| * | Supernus Pharmaceuticals Inc. | 712,451 | 20,775 | |||
| *,1 | Dynavax Technologies Corp. | 1,453,875 | 20,456 | |||
| * | Accolade Inc. | 773,453 | 20,388 | |||
| * | Protagonist Therapeutics Inc. | 595,361 | 20,361 | |||
| * | Addus HomeCare Corp. | 214,320 | 20,041 | |||
| * | Silk Road Medical Inc. | 469,058 | 19,987 | |||
| * | Krystal Biotech Inc. | 271,800 | 19,012 | |||
| * | Quanterix Corp. | 447,178 | 18,960 | |||
| *,1 | Sorrento Therapeutics Inc. | 4,059,629 | 18,877 | |||
| * | Atara Biotherapeutics Inc. | 1,164,006 | 18,345 | |||
| * | ImmunoGen Inc. | 2,439,267 | 18,099 | |||
| * | RadNet Inc. | 596,258 | 17,953 | |||
| * | Enanta Pharmaceuticals Inc. | 240,040 | 17,950 | |||
| * | Anavex Life Sciences Corp. | 1,007,373 | 17,468 | |||
| *,1 | Sharecare Inc. | 3,868,122 | 17,368 | |||
| * | agilon health Inc. | 631,194 | 17,042 | |||
| * | Sana Biotechnology Inc. | 1,098,780 | 17,009 | |||
| * | Varex Imaging Corp. | 530,265 | 16,730 | |||
| * | REGENXBIO Inc. | 504,632 | 16,501 | |||
| US Physical Therapy Inc. | 171,753 | 16,411 | ||||
| * | Morphic Holding Inc. | 346,326 | 16,409 | |||
| * | FibroGen Inc. | 1,150,491 | 16,222 | |||
| * | American Well Corp. Class A | 2,670,576 | 16,130 | |||
| * | Alector Inc. | 775,574 | 16,016 | |||
| * | Cerus Corp. | 2,347,047 | 15,983 | |||
| * | C4 Therapeutics Inc. | 494,689 | 15,929 | |||
| * | Nurix Therapeutics Inc. | 541,805 | 15,685 | |||
| * | Tivity Health Inc. | 577,100 | 15,259 | |||
| *,1 | Axsome Therapeutics Inc. | 400,918 | 15,147 | |||
| * | Pulmonx Corp. | 464,054 | 14,882 | |||
| * | OptimizeRx Corp. | 237,675 | 14,762 | |||
| * | Allogene Therapeutics Inc. | 988,078 | 14,742 | |||
| * | MannKind Corp. | 3,367,732 | 14,717 | |||
| * | Innoviva Inc. | 852,840 | 14,711 | |||
| * | Revance Therapeutics Inc. | 899,973 | 14,688 | |||
| * | BioLife Solutions Inc. | 393,096 | 14,651 | |||
| Shares | Market Value• ($000) | |||||
| * | AngioDynamics Inc. | 528,170 | 14,567 | |||
| *,1 | Senseonics Holdings Inc. | 5,449,395 | 14,550 | |||
| * | Crinetics Pharmaceuticals Inc. | 508,369 | 14,443 | |||
| * | NextGen Healthcare Inc. | 800,405 | 14,239 | |||
| * | Madrigal Pharmaceuticals Inc. | 166,779 | 14,133 | |||
| *,1 | Inovio Pharmaceuticals Inc. | 2,824,084 | 14,092 | |||
| * | Coherus Biosciences Inc. | 866,446 | 13,828 | |||
| * | Multiplan Corp. | 3,113,555 | 13,793 | |||
| Atrion Corp. | 19,319 | 13,618 | ||||
| * | Castle Biosciences Inc. | 314,835 | 13,497 | |||
| * | Avidity Biosciences Inc. | 566,801 | 13,473 | |||
| LeMaitre Vascular Inc. | 266,243 | 13,373 | ||||
| *,1 | Figs Inc. Class A | 483,239 | 13,318 | |||
| * | Rocket Pharmaceuticals Inc. | 608,041 | 13,274 | |||
| * | Cross Country Healthcare Inc. | 475,962 | 13,213 | |||
| *,1 | Clover Health Investments Corp. Class A | 3,542,516 | 13,178 | |||
| * | Nuvation Bio Inc. | 1,528,373 | 12,991 | |||
| * | Brookdale Senior Living Inc. | 2,504,795 | 12,925 | |||
| * | Joint Corp. | 194,209 | 12,758 | |||
| * | Heron Therapeutics Inc. | 1,393,501 | 12,723 | |||
| * | Kura Oncology Inc. | 903,500 | 12,649 | |||
| * | Intersect ENT Inc. | 459,062 | 12,537 | |||
| * | Sangamo Therapeutics Inc. | 1,666,052 | 12,495 | |||
| * | Harmony Biosciences Holdings Inc. | 293,010 | 12,494 | |||
| * | iTeos Therapeutics Inc. | 266,182 | 12,393 | |||
| * | Syndax Pharmaceuticals Inc. | 565,268 | 12,374 | |||
| *,1 | Ocugen Inc. | 2,637,546 | 12,001 | |||
| * | MacroGenics Inc. | 743,703 | 11,936 | |||
| * | Meridian Bioscience Inc. | 584,981 | 11,934 | |||
| * | Vanda Pharmaceuticals Inc. | 757,139 | 11,879 | |||
| * | Inhibrx Inc. | 271,145 | 11,841 | |||
| * | Triple-S Management Corp. Class B | 330,282 | 11,784 | |||
| *,1 | Butterfly Network Inc. | 1,753,433 | 11,730 | |||
| * | Endo International plc | 3,109,031 | 11,690 | |||
| * | OrthoPediatrics Corp. | 192,411 | 11,518 | |||
| National HealthCare Corp. | 167,834 | 11,403 | ||||
| *,1 | Bionano Genomics Inc. | 3,804,033 | 11,374 | |||
| * | CryoLife Inc. | 558,490 | 11,365 | |||
| * | Natus Medical Inc. | 477,063 | 11,321 | |||
| Shares | Market Value• ($000) | |||||
| * | Hims & Hers Health Inc. | 1,668,182 | 10,927 | |||
| * | Seer Inc. Class A | 476,174 | 10,862 | |||
| * | Replimune Group Inc. | 400,723 | 10,860 | |||
| * | Amphastar Pharmaceuticals Inc. | 464,603 | 10,821 | |||
| * | Arcturus Therapeutics Holdings Inc. | 290,493 | 10,751 | |||
| * | Alphatec Holdings Inc. | 928,261 | 10,610 | |||
| *,1 | Vaxart Inc. | 1,670,808 | 10,476 | |||
| * | Cardiovascular Systems Inc. | 557,222 | 10,465 | |||
| * | ViewRay Inc. | 1,893,729 | 10,434 | |||
| * | Ideaya Biosciences Inc. | 435,665 | 10,299 | |||
| * | Zogenix Inc. | 631,472 | 10,261 | |||
| Simulations Plus Inc. | 215,669 | 10,201 | ||||
| * | Chinook Therapeutics Inc. | 624,837 | 10,191 | |||
| * | uniQure NV | 491,272 | 10,189 | |||
| * | Berkeley Lights Inc. | 554,859 | 10,087 | |||
| * | Keros Therapeutics Inc. | 171,433 | 10,031 | |||
| * | Vaxcyte Inc. | 418,516 | 9,956 | |||
| *,1 | Roivant Sciences Ltd. | 978,768 | 9,866 | |||
| * | Reata Pharmaceuticals Inc. Class A | 372,818 | 9,831 | |||
| * | Definitive Healthcare Corp. Class A | 356,877 | 9,753 | |||
| * | Agenus Inc. | 3,008,397 | 9,687 | |||
| * | Inogen Inc. | 280,724 | 9,545 | |||
| * | RAPT Therapeutics Inc. | 258,978 | 9,512 | |||
| * | Hanger Inc. | 523,563 | 9,492 | |||
| * | Bluebird Bio Inc. | 945,603 | 9,447 | |||
| *,1 | Tango Therapeutics Inc. | 859,575 | 9,404 | |||
| * | Gritstone bio Inc. | 730,626 | 9,396 | |||
| *,1 | Myovant Sciences Ltd. | 601,159 | 9,360 | |||
| * | Aclaris Therapeutics Inc. | 642,971 | 9,349 | |||
| * | Cutera Inc. | 225,502 | 9,318 | |||
| *,1 | DocGo Inc. | 993,072 | 9,285 | |||
| * | Privia Health Group Inc. | 358,421 | 9,272 | |||
| * | Praxis Precision Medicines Inc. | 470,251 | 9,264 | |||
| * | AnaptysBio Inc. | 265,753 | 9,235 | |||
| * | Collegium Pharmaceutical Inc. | 483,054 | 9,023 | |||
| * | Scholar Rock Holding Corp. | 362,343 | 9,001 | |||
| * | Catalyst Pharmaceuticals Inc. | 1,317,231 | 8,918 | |||
| * | Orthofix Medical Inc. | 282,903 | 8,795 | |||
| *,1 | Science 37 Holdings Inc. | 704,514 | 8,785 | |||
| * | NGM Biopharmaceuticals Inc. | 494,394 | 8,756 | |||
| Shares | Market Value• ($000) | |||||
| *,1 | Quantum-Si Inc. | 1,100,329 | 8,660 | |||
| * | OraSure Technologies Inc. | 983,031 | 8,543 | |||
| * | Agiliti Inc. | 365,923 | 8,475 | |||
| * | Pennant Group Inc. | 367,157 | 8,474 | |||
| * | Gossamer Bio Inc. | 744,643 | 8,422 | |||
| * | PetIQ Inc. Class A | 370,082 | 8,405 | |||
| * | Sutro Biopharma Inc. | 563,652 | 8,387 | |||
| * | SI-BONE Inc. | 375,006 | 8,329 | |||
| * | HealthStream Inc. | 315,926 | 8,328 | |||
| * | PMV Pharmaceuticals Inc. | 359,981 | 8,316 | |||
| * | Eagle Pharmaceuticals Inc. | 161,567 | 8,227 | |||
| * | Inotiv Inc. | 195,035 | 8,205 | |||
| * | Surmodics Inc. | 166,537 | 8,019 | |||
| * | Theravance Biopharma Inc. | 725,567 | 8,017 | |||
| * | Arcutis Biotherapeutics Inc. | 385,292 | 7,991 | |||
| National Research Corp. | 192,162 | 7,979 | ||||
| * | Kezar Life Sciences Inc. | 472,614 | 7,902 | |||
| *,1 | VBI Vaccines Inc. | 3,364,961 | 7,874 | |||
| * | 2seventy bio Inc. | 306,835 | 7,864 | |||
| * | Organogenesis Holdings Inc. Class A | 842,878 | 7,788 | |||
| * | 4D Molecular Therapeutics Inc. | 348,796 | 7,653 | |||
| * | Sema4 Holdings Corp. | 1,708,636 | 7,620 | |||
| * | Ocular Therapeutix Inc. | 1,084,213 | 7,557 | |||
| *,1 | 23andMe Holding Co. | 1,127,166 | 7,507 | |||
| * | Y-mAbs Therapeutics Inc. | 460,439 | 7,464 | |||
| * | Relmada Therapeutics Inc. | 331,088 | 7,459 | |||
| * | Kronos Bio Inc. | 546,351 | 7,425 | |||
| * | TransMedics Group Inc. | 382,158 | 7,322 | |||
| * | Antares Pharma Inc. | 2,050,562 | 7,320 | |||
| * | Stoke Therapeutics Inc. | 304,615 | 7,308 | |||
| * | Cara Therapeutics Inc. | 587,543 | 7,156 | |||
| * | Verve Therapeutics Inc. | 192,408 | 7,094 | |||
| * | Anika Therapeutics Inc. | 197,802 | 7,087 | |||
| * | Seres Therapeutics Inc. | 849,315 | 7,075 | |||
| * | Vapotherm Inc. | 327,412 | 6,781 | |||
| * | Personalis Inc. | 474,765 | 6,775 | |||
| * | Fulcrum Therapeutics Inc. | 382,666 | 6,769 | |||
| *,1 | Aadi Bioscience Inc. | 279,190 | 6,742 | |||
| * | MiMedx Group Inc. | 1,108,392 | 6,695 | |||
| * | Amneal Pharmaceuticals Inc. | 1,359,961 | 6,514 | |||
| * | Rigel Pharmaceuticals Inc. | 2,447,181 | 6,485 | |||
| * | CareMax Inc. | 822,988 | 6,321 | |||
| Shares | Market Value• ($000) | |||||
| * | Atea Pharmaceuticals Inc. | 704,712 | 6,300 | |||
| * | Akero Therapeutics Inc. | 296,001 | 6,260 | |||
| * | ORIC Pharmaceuticals Inc. | 424,538 | 6,241 | |||
| * | Karyopharm Therapeutics Inc. | 969,534 | 6,234 | |||
| * | ANI Pharmaceuticals Inc. | 133,209 | 6,138 | |||
| * | Accuray Inc. | 1,282,772 | 6,119 | |||
| * | ALX Oncology Holdings Inc. | 283,230 | 6,087 | |||
| * | Chimerix Inc. | 926,929 | 5,960 | |||
| Phibro Animal Health Corp. Class A | 291,324 | 5,949 | ||||
| * | SeaSpine Holdings Corp. | 435,508 | 5,932 | |||
| * | Semler Scientific Inc. | 64,508 | 5,912 | |||
| * | Forma Therapeutics Holdings Inc. | 413,137 | 5,875 | |||
| * | Deciphera Pharmaceuticals Inc. | 600,439 | 5,866 | |||
| * | Computer Programs & Systems Inc. | 199,433 | 5,843 | |||
| * | Spero Therapeutics Inc. | 359,284 | 5,752 | |||
| *,1 | Humacyte Inc. | 792,828 | 5,748 | |||
| *,1 | Recursion Pharmaceuticals Inc. Class A | 330,009 | 5,653 | |||
| * | Prometheus Biosciences Inc. | 142,470 | 5,633 | |||
| *,1 | Omeros Corp. | 866,208 | 5,570 | |||
| *,1 | Vicarious Surgical Inc. | 523,257 | 5,557 | |||
| * | Foghorn Therapeutics Inc. | 242,772 | 5,552 | |||
| * | Rhythm Pharmaceuticals Inc. | 555,772 | 5,547 | |||
| * | Albireo Pharma Inc. | 236,997 | 5,520 | |||
| * | Mersana Therapeutics Inc. | 886,673 | 5,515 | |||
| * | ImmunityBio Inc. | 906,962 | 5,514 | |||
| *,1 | Athira Pharma Inc. | 419,525 | 5,466 | |||
| * | Rubius Therapeutics Inc. | 564,323 | 5,463 | |||
| *,1 | DermTech Inc. | 342,841 | 5,417 | |||
| *,1 | Point Biopharma Global Inc. Class A | 963,341 | 5,395 | |||
| * | Akebia Therapeutics Inc. | 2,384,520 | 5,389 | |||
| * | Geron Corp. | 4,416,962 | 5,389 | |||
| * | Apyx Medical Corp. | 416,959 | 5,345 | |||
| * | Axogen Inc. | 569,269 | 5,334 | |||
| * | Bioxcel Therapeutics Inc. | 261,545 | 5,317 | |||
| * | Viridian Therapeutics Inc. | 266,824 | 5,275 | |||
| * | Tactile Systems Technology Inc. | 276,187 | 5,256 | |||
| * | Arbutus Biopharma Corp. | 1,350,235 | 5,252 | |||
| Shares | Market Value• ($000) | |||||
| * | Curis Inc. | 1,098,479 | 5,229 | |||
| * | Marinus Pharmaceuticals Inc. | 439,115 | 5,217 | |||
| *,1 | G1 Therapeutics Inc. | 509,340 | 5,200 | |||
| *,1 | LifeStance Health Group Inc. | 542,913 | 5,169 | |||
| * | Alignment Healthcare Inc. | 363,579 | 5,112 | |||
| * | Allovir Inc. | 388,550 | 5,028 | |||
| * | Immunovant Inc. | 588,015 | 5,010 | |||
| * | Precision BioSciences Inc. | 676,238 | 5,004 | |||
| Utah Medical Products Inc. | 49,998 | 5,000 | ||||
| * | Cullinan Oncology Inc. | 320,717 | 4,949 | |||
| * | Verastem Inc. | 2,408,595 | 4,938 | |||
| *,1 | Intercept Pharmaceuticals Inc. | 296,342 | 4,827 | |||
| * | Aerie Pharmaceuticals Inc. | 667,455 | 4,686 | |||
| *,1 | Tabula Rasa HealthCare Inc. | 311,840 | 4,678 | |||
| * | VistaGen Therapeutics Inc. | 2,389,516 | 4,660 | |||
| *,1 | Clovis Oncology Inc. | 1,681,897 | 4,558 | |||
| * | Precigen Inc. | 1,225,427 | 4,546 | |||
| * | Allakos Inc. | 458,654 | 4,490 | |||
| * | Radius Health Inc. | 644,858 | 4,462 | |||
| *,1 | Xeris Biopharma Holdings Inc. | 1,520,662 | 4,456 | |||
| * | Signify Health Inc. Class A | 313,177 | 4,453 | |||
| * | Cue Biopharma Inc. | 392,131 | 4,435 | |||
| * | Viking Therapeutics Inc. | 951,502 | 4,377 | |||
| *,2 | PDL BioPharma Inc. | 1,757,467 | 4,341 | |||
| * | BioDelivery Sciences International Inc. | 1,399,733 | 4,339 | |||
| * | DICE Therapeutics Inc. | 169,140 | 4,281 | |||
| * | InfuSystem Holdings Inc. | 250,919 | 4,273 | |||
| *,1 | CEL-SCI Corp. | 595,752 | 4,230 | |||
| * | Kiniksa Pharmaceuticals Ltd. Class A | 358,602 | 4,221 | |||
| * | Generation Bio Co. | 590,845 | 4,183 | |||
| * | Lineage Cell Therapeutics Inc. | 1,704,495 | 4,176 | |||
| * | BioAtla Inc. | 211,200 | 4,146 | |||
| * | Phathom Pharmaceuticals Inc. | 209,852 | 4,128 | |||
| * | Selecta Biosciences Inc. | 1,266,133 | 4,128 | |||
| *,1 | ADMA Biologics Inc. | 2,880,583 | 4,062 | |||
| * | Provention Bio Inc. | 719,945 | 4,046 | |||
| * | Altimmune Inc. | 441,298 | 4,042 | |||
| *,1 | Esperion Therapeutics Inc. | 806,711 | 4,034 | |||
| * | Bioventus Inc. Class A | 277,313 | 4,018 | |||
| * | Avita Medical Inc. | 334,804 | 4,011 | |||
| * | Stereotaxis Inc. | 638,545 | 3,959 | |||
| *,1 | Zomedica Corp. | 12,903,334 | 3,955 | |||
| Shares | Market Value• ($000) | |||||
| * | Aveanna Healthcare Holdings Inc. | 534,364 | 3,954 | |||
| * | Tricida Inc. | 410,430 | 3,924 | |||
| * | Apollo Endosurgery Inc. | 462,043 | 3,895 | |||
| * | Cogent Biosciences Inc. | 453,790 | 3,893 | |||
| * | SIGA Technologies Inc. | 516,327 | 3,883 | |||
| * | Annexon Inc. | 335,473 | 3,855 | |||
| * | Caribou Biosciences Inc. | 253,111 | 3,819 | |||
| * | iRadimed Corp. | 82,049 | 3,791 | |||
| * | Dyne Therapeutics Inc. | 318,763 | 3,790 | |||
| * | Instil Bio Inc. | 221,393 | 3,788 | |||
| * | Lexicon Pharmaceuticals Inc. | 956,981 | 3,770 | |||
| *,1 | Fluidigm Corp. | 960,982 | 3,767 | |||
| * | Pliant Therapeutics Inc. | 272,076 | 3,673 | |||
| * | CytomX Therapeutics Inc. | 843,775 | 3,654 | |||
| * | Design Therapeutics Inc. | 170,317 | 3,646 | |||
| * | Harvard Bioscience Inc. | 511,664 | 3,607 | |||
| *,1 | Icosavax Inc. | 157,305 | 3,599 | |||
| * | Olema Pharmaceuticals Inc. | 381,189 | 3,568 | |||
| *,1 | Erasca Inc. | 225,947 | 3,520 | |||
| * | Kinnate Biopharma Inc. | 197,766 | 3,504 | |||
| * | KemPharm Inc. | 397,652 | 3,464 | |||
| * | Mirum Pharmaceuticals Inc. | 217,074 | 3,462 | |||
| * | MEI Pharma Inc. | 1,292,822 | 3,452 | |||
| * | Quotient Ltd. | 1,327,497 | 3,438 | |||
| * | KalVista Pharmaceuticals Inc. | 258,446 | 3,419 | |||
| * | Asensus Surgical Inc. | 3,064,734 | 3,402 | |||
| *,1 | ZIOPHARM Oncology Inc. | 3,097,222 | 3,376 | |||
| * | Jounce Therapeutics Inc. | 402,800 | 3,363 | |||
| * | Co-Diagnostics Inc. | 375,292 | 3,351 | |||
| *,1 | Taysha Gene Therapies Inc. | 287,596 | 3,350 | |||
| * | Apria Inc. | 102,255 | 3,333 | |||
| * | EyePoint Pharmaceuticals Inc. | 271,811 | 3,327 | |||
| *,1 | Progenity Inc. | 1,568,387 | 3,278 | |||
| * | Pieris Pharmaceuticals Inc. | 859,015 | 3,247 | |||
| * | Adicet Bio Inc. | 184,616 | 3,229 | |||
| *,1 | SmileDirectClub Inc. Class A | 1,366,479 | 3,211 | |||
| * | Epizyme Inc. | 1,279,874 | 3,200 | |||
| * | Cymabay Therapeutics Inc. | 946,307 | 3,198 | |||
| * | Cardiff Oncology Inc. | 532,156 | 3,198 | |||
| * | IGM Biosciences Inc. | 108,542 | 3,184 | |||
| * | Durect Corp. | 3,190,608 | 3,146 | |||
| Shares | Market Value• ($000) | |||||
| * | Oyster Point Pharma Inc. | 171,624 | 3,134 | |||
| *,1 | XOMA Corp. | 149,888 | 3,125 | |||
| *,1 | Nautilus Biotechnology Inc. Class A | 603,024 | 3,124 | |||
| * | Applied Molecular Transport Inc. | 222,282 | 3,107 | |||
| * | Shattuck Labs Inc. | 363,637 | 3,095 | |||
| * | Tenaya Therapeutics Inc. | 163,035 | 3,089 | |||
| * | Evolus Inc. | 473,001 | 3,079 | |||
| * | Treace Medical Concepts Inc. | 161,106 | 3,003 | |||
| *,1 | Monte Rosa Therapeutics Inc. | 146,915 | 3,000 | |||
| * | Cytek Biosciences Inc. | 183,633 | 2,997 | |||
| * | Harrow Health Inc. | 346,656 | 2,995 | |||
| * | 9 Meters Biopharma Inc. | 3,040,409 | 2,976 | |||
| * | Janux Therapeutics Inc. | 149,777 | 2,955 | |||
| * | Nkarta Inc. | 189,484 | 2,909 | |||
| * | Aldeyra Therapeutics Inc. | 716,158 | 2,865 | |||
| *,1 | Cortexyme Inc. | 225,353 | 2,844 | |||
| * | Infinity Pharmaceuticals Inc. | 1,258,444 | 2,831 | |||
| *,1 | Pulse Biosciences Inc. | 190,750 | 2,825 | |||
| * | Aligos Therapeutics Inc. | 236,483 | 2,807 | |||
| * | Passage Bio Inc. | 438,742 | 2,786 | |||
| * | Sientra Inc. | 758,465 | 2,784 | |||
| * | Spectrum Pharmaceuticals Inc. | 2,191,617 | 2,783 | |||
| *,1 | Zynex Inc. | 278,707 | 2,779 | |||
| *,1 | Atossa Therapeutics Inc. | 1,683,368 | 2,693 | |||
| *,1 | SAB Biotherapeutics Inc. | 339,966 | 2,655 | |||
| *,1 | PLx Pharma Inc. | 329,367 | 2,638 | |||
| * | aTyr Pharma Inc. | 352,693 | 2,635 | |||
| * | Paratek Pharmaceuticals Inc. | 586,131 | 2,632 | |||
| * | Checkpoint Therapeutics Inc. | 843,983 | 2,625 | |||
| * | Aeglea BioTherapeutics Inc. | 551,501 | 2,620 | |||
| * | ChromaDex Corp. | 693,015 | 2,592 | |||
| *,1 | Ventyx Biosciences Inc. | 130,468 | 2,591 | |||
| * | Eiger BioPharmaceuticals Inc. | 496,572 | 2,577 | |||
| * | PDS Biotechnology Corp. | 316,861 | 2,567 | |||
| *,1 | Citius Pharmaceuticals Inc. | 1,664,511 | 2,563 | |||
| * | Syros Pharmaceuticals Inc. | 779,586 | 2,541 | |||
| *,1 | DarioHealth Corp. | 195,014 | 2,529 | |||
| Shares | Market Value• ($000) | |||||
| * | Imago Biosciences Inc. | 105,987 | 2,513 | |||
| * | PAVmed Inc. | 1,020,354 | 2,510 | |||
| *,1 | Xilio Therapeutics Inc. | 156,816 | 2,509 | |||
| * | Poseida Therapeutics Inc. | 368,186 | 2,507 | |||
| *,1 | MyMD Pharmaceuticals Inc. | 410,026 | 2,485 | |||
| * | Liquidia Corp. | 509,053 | 2,479 | |||
| * | Fortress Biotech Inc. | 984,130 | 2,460 | |||
| * | Akouos Inc. | 285,455 | 2,426 | |||
| * | Beyond Air Inc. | 256,788 | 2,424 | |||
| *,1 | Accelerate Diagnostics Inc. | 463,803 | 2,421 | |||
| *,1 | Athersys Inc. | 2,681,991 | 2,421 | |||
| * | CytoSorbents Corp. | 574,625 | 2,408 | |||
| *,1 | CTI BioPharma Corp. | 966,394 | 2,397 | |||
| * | Edgewise Therapeutics Inc. | 156,276 | 2,388 | |||
| * | ClearPoint Neuro Inc. | 212,207 | 2,381 | |||
| *,1 | Owlet Inc. | 891,156 | 2,379 | |||
| * | Oncocyte Corp. | 1,089,017 | 2,363 | |||
| *,1 | Matinas BioPharma Holdings Inc. | 2,328,905 | 2,352 | |||
| *,1 | CorMedix Inc. | 516,109 | 2,348 | |||
| * | Harpoon Therapeutics Inc. | 308,417 | 2,329 | |||
| *,1 | Evelo Biosciences Inc. | 381,811 | 2,318 | |||
| * | Neoleukin Therapeutics Inc. | 478,112 | 2,304 | |||
| * | Sight Sciences Inc. | 130,911 | 2,300 | |||
| * | PROCEPT BioRobotics Corp. | 91,789 | 2,296 | |||
| * | iCAD Inc. | 318,743 | 2,295 | |||
| *,1 | Lyell Immunopharma Inc. | 295,982 | 2,291 | |||
| *,1 | Humanigen Inc. | 614,576 | 2,286 | |||
| * | Codiak Biosciences Inc. | 204,969 | 2,283 | |||
| *,1 | Talkspace Inc. | 1,156,491 | 2,278 | |||
| * | Frequency Therapeutics Inc. | 443,323 | 2,274 | |||
| XBiotech Inc. | 203,977 | 2,270 | ||||
| * | Seelos Therapeutics Inc. | 1,388,840 | 2,264 | |||
| * | Alpine Immune Sciences Inc. | 160,255 | 2,220 | |||
| * | Molecular Templates Inc. | 565,684 | 2,217 | |||
| * | UpHealth Inc. | 984,568 | 2,205 | |||
| * | Graphite Bio Inc. | 177,091 | 2,201 | |||
| *,1 | Biotricity Inc. | 550,453 | 2,191 | |||
| * | Adverum Biotechnologies Inc. | 1,240,466 | 2,183 | |||
| *,1 | Leap Therapeutics Inc. | 671,823 | 2,177 | |||
| * | Applied Therapeutics Inc. | 242,749 | 2,173 | |||
| *,1 | Nuvalent Inc. Class A | 113,646 | 2,164 | |||
| * | Immunic Inc. | 225,814 | 2,161 | |||
| *,1 | ATI Physical Therapy Inc. | 625,407 | 2,120 | |||
| Shares | Market Value• ($000) | |||||
| * | Castlight Health Inc. Class B | 1,356,597 | 2,089 | |||
| *,1 | Day One Biopharmaceuticals Inc. | 122,683 | 2,067 | |||
| Forian Inc. | 228,825 | 2,064 | ||||
| * | TCR2 Therapeutics Inc. | 438,705 | 2,044 | |||
| *,1 | Century Therapeutics Inc. | 128,560 | 2,039 | |||
| * | Prelude Therapeutics Inc. | 163,440 | 2,035 | |||
| *,1 | Sesen Bio Inc. | 2,488,635 | 2,028 | |||
| * | IntriCon Corp. | 125,233 | 2,025 | |||
| * | SQZ Biotechnologies Co. | 225,092 | 2,010 | |||
| * | Entrada Therapeutics Inc. | 117,094 | 2,005 | |||
| * | Enzo Biochem Inc. | 624,206 | 2,004 | |||
| * | Celcuity Inc. | 151,836 | 2,003 | |||
| *,1 | Tyra Biosciences Inc. | 142,355 | 2,003 | |||
| * | Larimar Therapeutics Inc. | 185,052 | 1,997 | |||
| * | Conformis Inc. | 2,618,559 | 1,994 | |||
| * | Avrobio Inc. | 513,661 | 1,978 | |||
| * | Homology Medicines Inc. | 535,097 | 1,948 | |||
| * | Surface Oncology Inc. | 405,497 | 1,938 | |||
| * | Tarsus Pharmaceuticals Inc. | 85,254 | 1,918 | |||
| * | Clearside Biomedical Inc. | 696,581 | 1,916 | |||
| * | TFF Pharmaceuticals Inc. | 212,750 | 1,887 | |||
| *,1 | Pyxis Oncology Inc. | 170,836 | 1,874 | |||
| *,1 | Silverback Therapeutics Inc. | 278,627 | 1,856 | |||
| * | Ovid therapeutics Inc. | 576,453 | 1,850 | |||
| * | Talaris Therapeutics Inc. | 119,365 | 1,825 | |||
| * | Paragon 28 Inc. | 102,345 | 1,810 | |||
| * | Opiant Pharmaceuticals Inc. | 53,766 | 1,808 | |||
| *,1 | Theseus Pharmaceuticals Inc. | 142,215 | 1,803 | |||
| *,1 | TherapeuticsMD Inc. | 5,061,709 | 1,799 | |||
| *,1 | Adagio Therapeutics Inc. | 246,191 | 1,787 | |||
| *,1 | SCYNEXIS Inc. | 292,607 | 1,785 | |||
| * | Mustang Bio Inc. | 1,070,054 | 1,776 | |||
| * | Outlook Therapeutics Inc. | 1,289,830 | 1,754 | |||
| *,1 | Surrozen Inc. | 271,491 | 1,748 | |||
| *,1 | Zynerba Pharmaceuticals Inc. | 603,145 | 1,737 | |||
| * | AVEO Pharmaceuticals Inc. | 369,347 | 1,732 | |||
| * | Magenta Therapeutics Inc. | 388,676 | 1,722 | |||
| *,1 | Inmune Bio Inc. | 167,766 | 1,711 | |||
| * | Savara Inc. | 1,364,571 | 1,692 | |||
| Shares | Market Value• ($000) | |||||
| * | WaVe Life Sciences Ltd. | 535,518 | 1,682 | |||
| *,1 | Vor BioPharma Inc. | 144,337 | 1,677 | |||
| *,1 | iBio Inc. | 3,046,799 | 1,673 | |||
| * | Otonomy Inc. | 800,841 | 1,666 | |||
| * | Vincerx Pharma Inc. | 162,403 | 1,655 | |||
| * | Tonix Pharmaceuticals Holding Corp. | 4,612,314 | ��� 1,650 | |||
| * | Exagen Inc. | 141,784 | 1,649 | |||
| *,1 | Enochian Biosciences Inc. | 224,087 | 1,634 | |||
| *,1 | MediciNova Inc. | 609,149 | 1,632 | |||
| * | Immunome Inc. | 125,377 | 1,625 | |||
| *,1 | BrainStorm Cell Therapeutics Inc. | 405,606 | 1,622 | |||
| *,1 | Jasper Therapeutics Inc. | 206,469 | 1,621 | |||
| * | Puma Biotechnology Inc. | 528,174 | 1,606 | |||
| * | Retractable Technologies Inc. | 229,386 | 1,590 | |||
| * | 89bio Inc. | 121,613 | 1,589 | |||
| * | Aspira Women's Health Inc. | 897,444 | 1,588 | |||
| * | Ikena Oncology Inc. | 125,336 | 1,572 | |||
| *,1 | Dare Bioscience Inc. | 780,636 | 1,561 | |||
| *,1 | Actinium Pharmaceuticals Inc. | 259,453 | 1,559 | |||
| * | Brooklyn ImmunoTherapeutics Inc. | 370,478 | 1,545 | |||
| * | Singular Genomics Systems Inc. | 133,617 | 1,545 | |||
| * | Solid Biosciences Inc. | 882,100 | 1,544 | |||
| * | Immuneering Corp. Class A | 95,416 | 1,543 | |||
| *,1 | VolitionRX Ltd. | 489,552 | 1,537 | |||
| * | Verrica Pharmaceuticals Inc. | 166,230 | 1,523 | |||
| * | Tela Bio Inc. | 118,352 | 1,515 | |||
| * | Alpha Teknova Inc. | 73,861 | 1,513 | |||
| * | Synlogic Inc. | 623,408 | 1,509 | |||
| * | Eargo Inc. | 294,763 | 1,503 | |||
| *,1 | Palatin Technologies Inc. | 2,887,432 | 1,477 | |||
| *,1 | Ampio Pharmaceuticals Inc. | 2,587,329 | 1,475 | |||
| *,1 | PhaseBio Pharmaceuticals Inc. | 563,593 | 1,471 | |||
| * | Avalo Therapeutics Inc. | 863,405 | 1,468 | |||
| * | Akoya Biosciences Inc. | 95,703 | 1,465 | |||
| *,1 | Athenex Inc. | 1,063,900 | 1,447 | |||
| * | Vera Therapeutics Inc. Class A | 54,032 | 1,444 | |||
| * | Neuronetics Inc. | 323,114 | 1,441 | |||
| * | F-star Therapeutics Inc. | 285,564 | 1,434 | |||
| * | Oncternal Therapeutics Inc. | 620,309 | 1,408 | |||
| Shares | Market Value• ($000) | |||||
| *,1 | Werewolf Therapeutics Inc. | 117,928 | 1,405 | |||
| *,1 | Galectin Therapeutics Inc. | 669,113 | 1,385 | |||
| * | Sonida Senior Living Inc. | 48,598 | 1,385 | |||
| *,1 | NRX Pharmaceuticals Inc. | 289,309 | 1,383 | |||
| * | La Jolla Pharmaceutical Co. | 297,161 | 1,382 | |||
| * | FONAR Corp. | 92,217 | 1,381 | |||
| * | Convey Health Solutions Holdings Inc. | 163,984 | 1,371 | |||
| * | Trevena Inc. | 2,309,501 | 1,345 | |||
| *,1 | Rani Therapeutics Holdings Inc. Class A | 82,278 | 1,345 | |||
| *,1 | Absci Corp. | 162,902 | 1,336 | |||
| * | Invacare Corp. | 490,517 | 1,334 | |||
| * | Sharps Compliance Corp. | 186,634 | 1,331 | |||
| * | Assertio Holdings Inc. | 609,803 | 1,329 | |||
| * | Milestone Scientific Inc. | 643,170 | 1,325 | |||
| * | Aptinyx Inc. Class A | 490,875 | 1,311 | |||
| * | Repro-Med Systems Inc. | 436,377 | 1,309 | |||
| * | Rain Therapeutics Inc. | 100,844 | 1,299 | |||
| *,1 | Aerovate Therapeutics Inc. | 109,293 | 1,289 | |||
| * | Electromed Inc. | 98,004 | 1,274 | |||
| *,1 | Adamis Pharmaceuticals Corp. | 2,103,096 | 1,272 | |||
| ProPhase Labs Inc. | 176,029 | 1,262 | ||||
| * | Renovacor Inc. | 163,183 | 1,256 | |||
| *,1 | Aquestive Therapeutics Inc. | 322,545 | 1,255 | |||
| * | Lipocine Inc. | 1,260,794 | 1,250 | |||
| * | Annovis Bio Inc. | 70,905 | 1,246 | |||
| * | Hepion Pharmaceuticals Inc. | 1,089,086 | 1,242 | |||
| * | Innovage Holding Corp. | 245,528 | 1,228 | |||
| *,1 | AquaBounty Technologies Inc. | 576,348 | 1,210 | |||
| * | Assembly Biosciences Inc. | 519,500 | 1,210 | |||
| * | Concert Pharmaceuticals Inc. | 383,819 | 1,209 | |||
| * | Greenwich Lifesciences Inc. | 49,704 | 1,209 | |||
| *,1 | Augmedix Inc. | 383,607 | 1,208 | |||
| * | Atreca Inc. Class A | 392,599 | 1,190 | |||
| *,1 | Oncorus Inc. | 224,961 | 1,186 | |||
| * | NextCure Inc. | 197,476 | 1,185 | |||
| * | Black Diamond Therapeutics Inc. | 222,397 | 1,185 | |||
| *,1 | Clene Inc. | 288,123 | 1,181 | |||
| * | Surgalign Holdings Inc. | 1,626,182 | 1,165 | |||
| Shares | Market Value• ($000) | |||||
| * | Finch Therapeutics Group Inc. | 116,096 | 1,157 | |||
| * | Sensus Healthcare Inc. | 158,732 | 1,146 | |||
| * | Lucira Health Inc. | 130,090 | 1,120 | |||
| * | ContraFect Corp. | 423,212 | 1,113 | |||
| *,1 | Ardelyx Inc. | 1,010,721 | 1,112 | |||
| *,1 | Eton Pharmaceuticals Inc. | 259,195 | 1,112 | |||
| *,1 | T2 Biosystems Inc. | 2,150,741 | 1,110 | |||
| * | Eyenovia Inc. | 277,328 | 1,109 | |||
| * | SELLAS Life Sciences Group Inc. | 196,727 | 1,088 | |||
| *,1 | eFFECTOR Therapeutics Inc. | 131,356 | 1,088 | |||
| * | Heat Biologics Inc. | 351,949 | 1,070 | |||
| * | SOC Telemed Inc. Class A | 830,992 | 1,064 | |||
| * | Applied Genetic Technologies Corp. | 556,629 | 1,058 | |||
| * | Candel Therapeutics Inc. | 133,875 | 1,047 | |||
| * | Corbus Pharmaceuticals Holdings Inc. | 1,697,444 | 1,045 | |||
| *,1 | 180 Life Sciences Corp. | 266,948 | 1,041 | |||
| * | Omega Therapeutics Inc. | 90,698 | 1,028 | |||
| * | NeuBase Therapeutics Inc. | 362,230 | 1,018 | |||
| * | Codex DNA Inc. | 93,668 | 1,012 | |||
| * | CASI Pharmaceuticals Inc. | 1,257,956 | 1,006 | |||
| * | IRIDEX Corp. | 163,869 | 1,001 | |||
| *,1 | Rapid Micro Biosystems Inc. Class A | 93,526 | 995 | |||
| * | Voyager Therapeutics Inc. | 366,732 | 994 | |||
| *,1 | Anixa Biosciences Inc. | 327,750 | 973 | |||
| * | Sonendo Inc. | 166,582 | 959 | |||
| * | Protara Therapeutics Inc. | 140,444 | 948 | |||
| * | Acutus Medical Inc. | 277,784 | 947 | |||
| * | Reneo Pharmaceuticals Inc. | 109,129 | 933 | |||
| * | AcelRx Pharmaceuticals Inc. | 1,657,710 | 929 | |||
| * | CVRx Inc. | 75,513 | 924 | |||
| * | Five Star Senior Living Inc. | 312,843 | 923 | |||
| *,1 | Cyteir Therapeutics Inc. | 80,980 | 921 | |||
| * | Equillium Inc. | 242,039 | 908 | |||
| *,1 | Biolase Inc. | 2,313,972 | 902 | |||
| *,1 | BioSig Technologies Inc. | 403,690 | 900 | |||
| * | Biomea Fusion Inc. | 119,961 | 894 | |||
| * | Capricor Therapeutics Inc. | 303,522 | 889 | |||
| * | Rallybio Corp. | 92,986 | 887 | |||
| Shares | Market Value• ($000) | |||||
| * | Eledon Pharmaceuticals Inc. | 200,945 | 886 | |||
| *,1 | Viracta Therapeutics Inc. | 240,475 | 878 | |||
| * | Novan Inc. | 209,835 | 875 | |||
| * | Statera Biopharma Inc. | 378,677 | 871 | |||
| *,1 | Evofem Biosciences Inc. | 2,316,042 | 870 | |||
| * | IsoRay Inc. | 2,232,052 | 866 | |||
| * | Orgenesis Inc. | 300,195 | 865 | |||
| * | Merrimack Pharmaceuticals Inc. | 220,899 | 864 | |||
| * | NeuroPace Inc. | 85,399 | 861 | |||
| * | Streamline Health Solutions Inc. | 582,649 | 856 | |||
| *,1 | Tyme Technologies Inc. | 1,414,981 | 853 | |||
| * | DiaMedica Therapeutics Inc. | 228,271 | 851 | |||
| *,1 | Microbot Medical Inc. | 113,273 | 850 | |||
| * | Moleculin Biotech Inc. | 454,105 | 845 | |||
| * | Eliem Therapeutics Inc. | 80,793 | 845 | |||
| * | GT Biopharma Inc. | 275,611 | 841 | |||
| * | GlycoMimetics Inc. | 582,678 | 839 | |||
| * | Talis Biomedical Corp. | 209,178 | 839 | |||
| * | Corvus Pharmaceuticals Inc. | 347,346 | 837 | |||
| * | Ocuphire Pharma Inc. | 224,241 | 836 | |||
| *,1 | Impel Neuropharma Inc. | 95,935 | 828 | |||
| * | Marker Therapeutics Inc. | 869,815 | 826 | |||
| * | Acumen Pharmaceuticals Inc. | 120,419 | 814 | |||
| * | Eloxx Pharmaceuticals Inc. | 1,154,415 | 808 | |||
| * | Cyclerion Therapeutics Inc. | 468,984 | 807 | |||
| * | Recro Pharma Inc. | 470,492 | 805 | |||
| * | Lannett Co. Inc. | 491,745 | 797 | |||
| * | LENSAR Inc. | 133,054 | 793 | |||
| * | Lantern Pharma Inc. | 99,130 | 791 | |||
| * | Biocept Inc. | 217,755 | 788 | |||
| * | Optinose Inc. | 484,440 | 785 | |||
| * | Genprex Inc. | 597,928 | 783 | |||
| * | Kaleido Biosciences Inc. | 326,763 | 781 | |||
| * | AIkido Pharma Inc. | 1,319,023 | 774 | |||
| * | Bolt Biotherapeutics Inc. | 157,140 | 770 | |||
| * | Achieve Life Sciences Inc. | 98,787 | 769 | |||
| * | Sio Gene Therapies Inc. | 593,038 | 765 | |||
| *,1 | Ontrak Inc. | 121,450 | 764 | |||
| *,1 | Clever Leaves Holdings Inc. | 244,530 | 758 | |||
| * | CareCloud Inc. | 119,683 | 756 | |||
| * | VYNE Therapeutics Inc. | 738,229 | 753 | |||
| Shares | Market Value• ($000) | |||||
| * | Terns Pharmaceuticals Inc. | 103,931 | 735 | |||
| * | Tracon Pharmaceuticals Inc. | 262,440 | 727 | |||
| * | Cabaletta Bio Inc. | 191,348 | 725 | |||
| * | Caladrius Biosciences Inc. | 850,585 | 716 | |||
| *,1 | Delcath Systems Inc. | 92,408 | 716 | |||
| * | Hookipa Pharma Inc. | 305,886 | 713 | |||
| * | NantHealth Inc. | 668,998 | 706 | |||
| *,1 | Zosano Pharma Corp. | 1,496,416 | 703 | |||
| * | Cidara Therapeutics Inc. | 545,619 | 693 | |||
| * | Gemini Therapeutics Inc. Class A | 237,759 | 692 | |||
| * | UNITY Biotechnology Inc. | 470,670 | 687 | |||
| * | enVVeno Medical Corp. | 104,199 | 687 | |||
| * | Predictive Oncology Inc. | 712,227 | 678 | |||
| * | Biomerica Inc. | 167,984 | 653 | |||
| * | LogicBio Therapeutics Inc. | 282,216 | 652 | |||
| * | Inozyme Pharma Inc. | 95,089 | 648 | |||
| * | Celsion Corp. | 1,193,997 | 645 | |||
| * | Avinger Inc. | 1,411,786 | 635 | |||
| * | Aileron Therapeutics Inc. | 1,106,799 | 623 | |||
| *,1 | Galera Therapeutics Inc. | 135,361 | 621 | |||
| *,1 | Vivos Therapeutics Inc. | 274,143 | 617 | |||
| *,1 | Kala Pharmaceuticals Inc. | 508,706 | 616 | |||
| * | Calithera Biosciences Inc. | 920,990 | 613 | |||
| *,1 | Jaguar Health Inc. | 587,867 | 611 | |||
| *,1 | Oragenics Inc. | 1,364,121 | 608 | |||
| * | Aura Biosciences Inc. | 35,544 | 604 | |||
| *,1 | Onconova Therapeutics Inc. | 236,310 | 603 | |||
| * | Edesa Biotech Inc. | 106,091 | 597 | |||
| * | X4 Pharmaceuticals Inc. | 259,577 | 594 | |||
| *,1 | Nemaura Medical Inc. | 126,397 | 576 | |||
| * | Agile Therapeutics Inc. | 1,176,762 | 574 | |||
| * | Great Elm Group Inc. | 274,500 | 574 | |||
| * | cbdMD Inc. | 529,204 | 572 | |||
| * | AIM ImmunoTech Inc. | 619,120 | 570 | |||
| * | Sensei Biotherapeutics Inc. | 97,509 | 566 | |||
| * | Precipio Inc. | 352,392 | 557 | |||
| * | scPharmaceuticals Inc. | 110,442 | 554 | |||
| * | Sanara Medtech Inc. | 18,221 | 554 | |||
| * | Second Sight Medical Products Inc. | 337,895 | 551 | |||
| * | Cocrystal Pharma Inc. | 841,362 | 547 | |||
| * | Psychemedics Corp. | 78,208 | 543 | |||
| * | Axcella Health Inc. | 259,076 | 541 | |||
| Shares | Market Value• ($000) | |||||
| *,1 | Rockwell Medical Inc. | 1,319,673 | 541 | |||
| * | Aprea Therapeutics Inc. | 187,071 | 537 | |||
| * | Synthetic Biologics Inc. | 1,942,122 | 529 | |||
| * | ImmuCell Corp. | 66,076 | 528 | |||
| * | Champions Oncology Inc. | 65,827 | 527 | |||
| * | Decibel Therapeutics Inc. | 110,152 | 512 | |||
| * | Landos Biopharma Inc. | 103,089 | 495 | |||
| * | Dyadic International Inc. | 108,822 | 492 | |||
| * | RxSight Inc. | 43,728 | 492 | |||
| * | Aptevo Therapeutics Inc. | 62,319 | 490 | |||
| * | Catalyst Biosciences Inc. | 533,743 | 488 | |||
| * | Ekso Bionics Holdings Inc. | 179,165 | 475 | |||
| * | PolarityTE Inc. | 796,892 | 468 | |||
| *,1 | Spruce Biosciences Inc. | 104,042 | 464 | |||
| * | Satsuma Pharmaceuticals Inc. | 102,986 | 463 | |||
| *,1 | NanoViricides Inc. | 123,977 | 461 | |||
| * | Adial Pharmaceuticals Inc. | 170,755 | 461 | |||
| * | Odonate Therapeutics Inc. | 340,745 | 460 | |||
| *,1 | Aytu BioPharma Inc. | 336,761 | 455 | |||
| * | NexImmune Inc. | 97,320 | 449 | |||
| * | Tempest Therapeutics Inc. | 84,613 | 447 | |||
| * | OpGen Inc. | 444,132 | 444 | |||
| * | Diffusion Pharmaceuticals Inc. | 1,446,806 | 441 | |||
| *,1 | Bellerophon Therapeutics Inc. | 142,009 | 440 | |||
| * | Cellectar Biosciences Inc. | 653,769 | 434 | |||
| *,1 | Longeveron Inc. | 35,595 | 430 | |||
| *,1 | Ensysce Biosciences Inc. | 90,340 | 425 | |||
| * | Myomo Inc. | 61,353 | 420 | |||
| *,1 | Chembio Diagnostics Inc. | 359,348 | 410 | |||
| * | Calyxt Inc. | 192,274 | 410 | |||
| *,2 | Tobira Therapeutics Inc. CVR Exp. 12/31/28 | 87,894 | 398 | |||
| *,1 | Qualigen Therapeutics Inc. | 370,708 | 397 | |||
| * | Minerva Neurosciences Inc. | 488,628 | 391 | |||
| *,1 | Cumberland Pharmaceuticals Inc. | 82,984 | 388 | |||
| *,1 | HTG Molecular Diagnostics Inc. | 70,922 | 384 | |||
| *,1 | Organovo Holdings Inc. | 104,359 | 379 | |||
| Shares | Market Value• ($000) | |||||
| * | NeuroMetrix Inc. | 75,275 | 378 | |||
| * | Pro-Dex Inc. | 15,693 | 375 | |||
| * | Idera Pharmaceuticals Inc. | 644,748 | 367 | |||
| * | Aravive Inc. | 166,831 | 365 | |||
| * | Regulus Therapeutics Inc. | 1,150,914 | 363 | |||
| 1 | Petros Pharmaceuticals Inc. | 107,823 | 359 | |||
| * | Bio-Path Holdings Inc. | 94,978 | 358 | |||
| * | Venus Concept Inc. | 209,199 | 356 | |||
| * | ENDRA Life Sciences Inc. | 513,961 | 356 | |||
| *,1 | Applied DNA Sciences Inc. | 87,412 | 351 | |||
| * | INVO BioScience Inc. | 105,539 | 351 | |||
| * | Abeona Therapeutics Inc. | 1,037,222 | 350 | |||
| * | IsoPlexis Corp. | 38,055 | 350 | |||
| * | Strata Skin Sciences Inc. | 235,454 | 346 | |||
| * | Allena Pharmaceuticals Inc. | 577,425 | 342 | |||
| * | Cyclacel Pharmaceuticals Inc. | 86,789 | 336 | |||
| *,1 | GeoVax Labs Inc. | 91,154 | 330 | |||
| *,1 | Aethlon Medical Inc. | 176,989 | 329 | |||
| *,1 | Biofrontera Inc. | 43,273 | 325 | |||
| * | ElectroCore Inc. | 556,366 | 324 | |||
| *,1 | Genocea Biosciences Inc. | 279,537 | 324 | |||
| * | Forte Biosciences Inc. | 148,829 | 318 | |||
| *,2 | Alder Biopharmaceuticals Inc. CVR Exp. 12/31/24 | 355,460 | 313 | |||
| * | Biodesix Inc. | 58,892 | 312 | |||
| * | Soleno Therapeutics Inc. | 749,100 | 307 | |||
| * | Entasis Therapeutics Holdings Inc. | 139,372 | 305 | |||
| * | vTv Therapeutics Inc. Class A | 304,454 | 303 | |||
| * | NanoVibronix Inc. | 289,829 | 301 | |||
| *,1 | ARCA biopharma Inc. | 140,054 | 301 | |||
| * | Lumos Pharma Inc. | 42,130 | 292 | |||
| * | Processa Pharmaceuticals Inc. | 57,932 | 284 | |||
| * | Vyant Bio Inc. | 210,231 | 284 | |||
| * | AgeX Therapeutics Inc. | 258,811 | 282 | |||
| *,1 | Acorda Therapeutics Inc. | 117,219 | 280 | |||
| * | Baudax Bio Inc. | 1,270,494 | 278 | |||
| * | Navidea Biopharmaceuticals Inc. | 276,491 | 276 | |||
| * | Alimera Sciences Inc. | 53,677 | 275 | |||
| *,1 | OncoSec Medical Inc. | 286,551 | 275 | |||
| * | Kewaunee Scientific Corp. | 21,459 | 273 | |||
| *,1 | Soligenix Inc. | 400,675 | 265 | |||
| Shares | Market Value• ($000) | |||||
| *,1 | Allied Healthcare Products Inc. | 45,588 | 265 | |||
| * | Cyclo Therapeutics Inc. | 71,043 | 265 | |||
| * | Sigilon Therapeutics Inc. | 95,157 | 263 | |||
| *,1 | Cue Health Inc. | 18,991 | 255 | |||
| * | Virpax Pharmaceuticals Inc. | 73,368 | 252 | |||
| * | Angion Biomedica Corp. | 84,876 | 246 | |||
| 1 | iSpecimen Inc. | 30,360 | 237 | |||
| * | Pulmatrix Inc. | 536,108 | 235 | |||
| *,1 | SiNtx Technologies Inc. | 362,591 | 233 | |||
| * | Astria Therapeutics Inc. | 43,064 | 232 | |||
| * | BioCardia Inc. | 117,600 | 228 | |||
| * | Reviva Pharmaceuticals Holdings Inc. | 76,880 | 218 | |||
| *,1 | Osmotica Pharmaceuticals plc | 200,978 | 217 | |||
| * | Windtree Therapeutics Inc. | 133,554 | 214 | |||
| * | Cohbar Inc. | 606,938 | 212 | |||
| *,1 | Motus GI Holdings Inc. | 449,879 | 210 | |||
| *,1 | Lucid Diagnostics Inc. | 39,131 | 210 | |||
| * | Evoke Pharma Inc. | 358,222 | 201 | |||
| * | Exicure Inc. | 995,482 | 201 | |||
| *,1 | Star Equity Holdings Inc. | 78,142 | 199 | |||
| *,1 | Benitec Biopharma Inc. | 74,773 | 196 | |||
| * | Brickell Biotech Inc. | 848,782 | 194 | |||
| * | Sera Prognostics Inc. Class A | 28,210 | 194 | |||
| * | Kintara Therapeutics Inc. | 377,452 | 192 | |||
| * | Lyra Therapeutics Inc. | 43,756 | 191 | |||
| * | Aridis Pharmaceuticals Inc. | 81,046 | 189 | |||
| * | Salarius Pharmaceuticals Inc. | 377,847 | 187 | |||
| *,1 | Yield10 Bioscience Inc. | 36,944 | 182 | |||
| * | Tenax Therapeutics Inc. | 173,801 | 181 | |||
| * | Enveric Biosciences Inc. | 191,247 | 178 | |||
| * | Graybug Vision Inc. | 96,699 | 177 | |||
| * | Protagenic Therapeutics Inc. | 126,837 | 176 | |||
| * | SunLink Health Systems Inc. | 108,130 | 166 | |||
| *,1 | American Shared Hospital Services | 68,306 | 162 | |||
| * | TScan Therapeutics Inc. | 35,247 | 159 | |||
| * | Acer Therapeutics Inc. | 68,499 | 158 | |||
| *,1 | PetVivo Holdings Inc. | 41,686 | 157 | |||
| Shares | Market Value• ($000) | |||||
| * | Plus Therapeutics Inc. | 146,907 | 154 | |||
| * | Better Therapeutics Inc. | 32,412 | 151 | |||
| * | IMARA Inc. | 65,610 | 148 | |||
| * | BioVie Inc. Class A | 32,672 | 147 | |||
| * | Monopar Therapeutics Inc. | 45,070 | 146 | |||
| * | ReShape Lifesciences Inc. | 88,359 | 145 | |||
| *,1 | NovaBay Pharmaceuticals Inc. | 373,541 | 141 | |||
| *,1 | Vaccinex Inc. | 132,901 | 140 | |||
| *,1 | Bellicum Pharmaceuticals Inc. | 92,706 | 138 | |||
| *,1 | InVivo Therapeutics Holdings Corp. | 301,037 | 138 | |||
| * | IN8bio Inc. | 31,297 | 137 | |||
| * | Phio Pharmaceuticals Corp. | 135,019 | 135 | |||
| *,1 | SCWorx Corp. | 103,672 | 135 | |||
| * | Lexaria Bioscience Corp. | 33,164 | 134 | |||
| * | Viveve Medical Inc. | 114,011 | 129 | |||
| * | Helius Medical Technologies Inc. Class A | 24,894 | 129 | |||
| * | CNS Pharmaceuticals Inc. | 182,006 | 128 | |||
| * | Sonoma Pharmaceuticals Inc. | 27,591 | 126 | |||
| * | Xenetic Biosciences Inc. | 96,724 | 125 | |||
| *,2 | Strongbridge Biopharma plc CVR | 687,671 | 125 | |||
| * | Regional Health Properties Inc. | 26,748 | 121 | |||
| * | Checkmate Pharmaceuticals Inc. | 41,483 | 119 | |||
| * | Armata Pharmaceuticals Inc. | 21,625 | 118 | |||
| * | RA Medical Systems Inc. | 74,338 | 116 | |||
| * | Avenue Therapeutics Inc. | 125,030 | 114 | |||
| * | Longboard Pharmaceuticals Inc. | 23,559 | 114 | |||
| *,1 | First Wave BioPharma Inc. | 78,451 | 113 | |||
| * | Minerva Surgical Inc. | 21,195 | 109 | |||
| *,1 | Artelo Biosciences Inc. | 207,027 | 107 | |||
| * | Dynatronics Corp. | 106,188 | 106 | |||
| *,1 | Synaptogenix Inc. | 12,517 | 106 | |||
| * | Hoth Therapeutics Inc. | 155,714 | 103 | |||
| * | Elevation Oncology Inc. | 16,281 | 98 | |||
| * | Timber Pharmaceuticals Inc. | 252,587 | 96 | |||
| * | Virios Therapeutics Inc. | 18,685 | 96 | |||
| * | Histogen Inc. | 272,775 | 91 | |||
| Shares | Market Value• ($000) | |||||
| * | Kiora Pharmaceuticals Inc. | 59,968 | 91 | |||
| *,2 | Aduro Biotech Inc. CVR | 150,581 | 90 | |||
| *,1 | Context Therapeutics Inc. | 33,979 | 90 | |||
| *,1 | Vaxxinity Inc. Class A | 15,947 | 89 | |||
| * | Vallon Pharmaceuticals Inc. | 14,805 | 89 | |||
| * | Yumanity Therapeutics Inc. | 29,192 | 86 | |||
| * | Rezolute Inc. | 17,272 | 83 | |||
| * | Bluejay Diagnostics Inc. | 32,170 | 82 | |||
| * | CynergisTek Inc. | 55,455 | 80 | |||
| * | Trevi Therapeutics Inc. | 100,874 | 79 | |||
| * | ThermoGenesis Holdings Inc. | 77,065 | 78 | |||
| * | Galecto Inc. | 25,708 | 78 | |||
| * | Senestech Inc. | 77,831 | 76 | |||
| *,1 | Titan Pharmaceuticals Inc. | 72,773 | 74 | |||
| * | Nuwellis Inc. | 64,714 | 74 | |||
| * | NeuroBo Pharmaceuticals Inc. | 59,547 | 73 | |||
| * | Aziyo Biologics Inc. Class A | 11,215 | 71 | |||
| *,2 | Adamas Pharmaceuticals Inc. CVR | 1,055,708 | 64 | |||
| * | Aditxt Inc. | 118,348 | 63 | |||
| * | Avalon GloboCare Corp. | 76,195 | 62 | |||
| *,1 | Biorestorative Therapies Inc. | 14,000 | 60 | |||
| * | Tivic Health Systems Inc. | 15,520 | 60 | |||
| * | Lixte Biotechnology Holdings Inc. | 48,388 | 58 | |||
| * | Palisade Bio Inc. | 41,396 | 54 | |||
| Indaptus Therapeutics Inc. | 9,478 | 54 | ||||
| * | HCW Biologics Inc. | 23,321 | 54 | |||
| * | Imac Holdings Inc. | 45,983 | 52 | |||
| * | PharmaCyte Biotech Inc. | 20,661 | 52 | |||
| * | Inhibikase Therapeutics Inc. | 34,361 | 50 | |||
| *,1 | GBS Inc. | 33,859 | 48 | |||
| * | Sonnet BioTherapeutics Holdings Inc. | 96,474 | 40 | |||
| * | Metacrine Inc. | 57,440 | 39 | |||
| *,1 | Panbela Therapeutics Inc. | 20,608 | 36 | |||
| * | Cognition Therapeutics Inc. | 4,487 | 28 | |||
| * | HeartBeam Inc. | 9,050 | 28 | |||
| * | Xtant Medical Holdings Inc. | 44,170 | 25 | |||
| *,1 | Pasithea Therapeutics Corp. | 12,700 | 22 | |||
| Shares | Market Value• ($000) | |||||
| *,1,2 | Oncternal Therapeutics Inc. CVR | 20,153 | 21 | |||
| *,2 | Aevi Genomic Medicine Inc. CVR | 631,947 | 21 | |||
| *,2 | Elanco Animal Health Inc. CVR | 701,074 | 18 | |||
| * | Kiromic BioPharma Inc. | 11,095 | 17 | |||
| *,2 | Ocera Therapeutics Inc. CVR | 48,417 | 13 | |||
| *,2 | Qualigen Therapeutics Inc. CVR | 91,096 | 6 | |||
| *,2 | Alexza Pharmaceuticals Inc. CVR | 128,704 | 4 | |||
| * | Ligand Pharmaceuticals Inc. General CVR Rights | 395,811 | 4 | |||
| * | Ligand Pharmaceuticals Inc. Roche CVR Rights | 395,811 | 3 | |||
| *,1,2 | Seelos Therapeutics Inc. CVR | 5,736 | 3 | |||
| * | Dermata Therapeutics Inc. | 1,718 | 3 | |||
| * | Ligand Pharmaceuticals Inc. Glucagon CVR Rights | 395,811 | 2 | |||
| *,2 | Ambit Biosciences Corp. CVR | 22,388 | — | |||
| *,2 | NeuroBo Pharmaceuticals Inc. CVR | 5,194 | — | |||
| * | Advaxis Inc. Warrants Exp. 9/11/24 | 47,130 | — | |||
| *,2 | Lantheus Holdings Inc. CVR | 1,316,898 | — | |||
| *,2 | Phenomix Corp. CVR | 47 | — | |||
| *,2 | Achillion Pharmaceuticals Inc. CVR | 374 | — | |||
| *,1,2 | Aerpio Pharmaceuticals Inc. CVR | 498,929 | — | |||
| *,2 | Salarius Pharmaceuticals Inc. Warrants Exp. 1/20/25 | 119,407 | — | |||
| *,2 | Wright Medical Group NV | 389 | — | |||
| 14,381,454 | ||||||
| Industrials (13.9%) | ||||||
| * | Uber Technologies Inc. | 22,122,120 | 927,580 | |||
| * | CoStar Group Inc. | 5,220,660 | 412,589 | |||
| TransUnion | 2,523,172 | 299,198 | ||||
| * | Builders FirstSource Inc. | 2,536,452 | 217,399 | |||
| Shares | Market Value• ($000) | |||||
| * | Trex Co. Inc. | 1,524,306 | 205,827 | |||
| * | Plug Power Inc. | 6,885,466 | 194,377 | |||
| Nordson Corp. | 709,389 | 181,086 | ||||
| Graco Inc. | 2,220,254 | 178,997 | ||||
| Carlisle Cos. Inc. | 690,517 | 171,331 | ||||
| * | Lyft Inc. Class A | 3,929,250 | 167,897 | |||
| Regal Rexnord Corp. | 895,801 | 152,447 | ||||
| Booz Allen Hamilton Holding Corp. | 1,768,297 | 149,934 | ||||
| Hubbell Inc. Class B | 715,846 | 149,089 | ||||
| * | AECOM | 1,908,244 | 147,603 | |||
| * | Middleby Corp. | 734,965 | 144,612 | |||
| Lennox International Inc. | 443,816 | 143,956 | ||||
| * | SiteOne Landscape Supply Inc. | 593,736 | 143,850 | |||
| Toro Co. | 1,399,361 | 139,810 | ||||
| * | Axon Enterprise Inc. | 871,546 | 136,833 | |||
| Watsco Inc. | 436,803 | 136,667 | ||||
| Knight-Swift Transportation Holdings Inc. Class A | 2,199,216 | 134,020 | ||||
| * | Sensata Technologies Holding plc | 2,094,142 | 129,188 | |||
| HEICO Corp. Class A | 962,088 | 123,648 | ||||
| Tetra Tech Inc. | 707,739 | 120,174 | ||||
| Owens Corning | 1,324,575 | 119,874 | ||||
| * | WillScot Mobile Mini Holdings Corp. | 2,935,115 | 119,870 | |||
| * | GXO Logistics Inc. | 1,305,033 | 118,536 | |||
| * | Saia Inc. | 345,125 | 116,317 | |||
| * | Clarivate plc | 4,920,002 | 115,718 | |||
| ITT Inc. | 1,125,159 | 114,980 | ||||
| * | Avis Budget Group Inc. | 525,349 | 108,942 | |||
| Lincoln Electric Holdings Inc. | 774,620 | 108,036 | ||||
| Oshkosh Corp. | 902,150 | 101,681 | ||||
| Advanced Drainage Systems Inc. | 745,596 | 101,498 | ||||
| * | XPO Logistics Inc. | 1,309,423 | 101,389 | |||
| Vertiv Holdings Co. Class A | 4,014,620 | 100,245 | ||||
| Acuity Brands Inc. | 462,017 | 97,818 | ||||
| Donaldson Co. Inc. | 1,626,212 | 96,369 | ||||
| * | Sunrun Inc. | 2,747,852 | 94,251 | |||
| AMERCO | 129,450 | 94,010 | ||||
| AGCO Corp. | 809,727 | 93,945 | ||||
| Woodward Inc. | 834,509 | 91,345 | ||||
| * | IAA Inc. | 1,791,163 | 90,669 | |||
| Landstar System Inc. | 502,035 | 89,874 | ||||
| EMCOR Group Inc. | 703,899 | 89,670 | ||||
| KBR Inc. | 1,838,703 | 87,559 | ||||
| nVent Electric plc | 2,230,703 | 84,767 | ||||
| * | ASGN Inc. | 684,238 | 84,435 | |||
| * | CACI International Inc. Class A | 308,985 | 83,182 | |||
| HEICO Corp. | 576,275 | 83,110 | ||||
| * | Colfax Corp. | 1,780,368 | 81,844 | |||
| Exponent Inc. | 684,752 | 79,931 | ||||
| Shares | Market Value• ($000) | |||||
| Simpson Manufacturing Co. Inc. | 568,687 | 79,087 | ||||
| * | WESCO International Inc. | 587,353 | 77,290 | |||
| * | RBC Bearings Inc. | 378,172 | 76,379 | |||
| * | Chart Industries Inc. | 467,927 | 74,630 | |||
| UFP Industries Inc. | 810,371 | 74,562 | ||||
| * | Evoqua Water Technologies Corp. | 1,577,158 | 73,732 | |||
| Armstrong World Industries Inc. | 630,821 | 73,251 | ||||
| MSA Safety Inc. | 484,670 | 73,166 | ||||
| * | Stericycle Inc. | 1,225,265 | 73,075 | |||
| Curtiss-Wright Corp. | 523,350 | 72,573 | ||||
| Valmont Industries Inc. | 282,687 | 70,813 | ||||
| Watts Water Technologies Inc. Class A | 360,903 | 70,077 | ||||
| * | MasTec Inc. | 758,722 | 70,015 | |||
| ManpowerGroup Inc. | 718,289 | 69,911 | ||||
| * | FTI Consulting Inc. | 452,703 | 69,454 | |||
| * | AZEK Co. Inc. Class A | 1,486,615 | 68,741 | |||
| Crane Co. | 662,544 | 67,401 | ||||
| * | Atkore Inc. | 604,104 | 67,170 | |||
| * | API Group Corp. | 2,579,319 | 66,469 | |||
| * | Clean Harbors Inc. | 663,461 | 66,194 | |||
| * | Univar Solutions Inc. | 2,258,197 | 64,020 | |||
| John Bean Technologies Corp. | 416,439 | 63,948 | ||||
| Science Applications International Corp. | 762,116 | 63,705 | ||||
| Timken Co. | 917,926 | 63,603 | ||||
| Air Lease Corp. Class A | 1,417,913 | 62,714 | ||||
| Spirit AeroSystems Holdings Inc. Class A | 1,394,035 | 60,069 | ||||
| * | JetBlue Airways Corp. | 4,125,522 | 58,747 | |||
| Ryder System Inc. | 709,624 | 58,494 | ||||
| BWX Technologies Inc. | 1,217,937 | 58,315 | ||||
| Zurn Water Solutions Corp. | 1,595,866 | 58,090 | ||||
| * | Hexcel Corp. | 1,110,653 | 57,532 | |||
| * | Casella Waste Systems Inc. Class A | 664,504 | 56,762 | |||
| Insperity Inc. | 465,557 | 54,987 | ||||
| * | Upwork Inc. | 1,588,028 | 54,247 | |||
| Korn Ferry | 714,769 | 54,129 | ||||
| Triton International Ltd. | 882,633 | 53,161 | ||||
| Flowserve Corp. | 1,719,934 | 52,630 | ||||
| Applied Industrial Technologies Inc. | 509,474 | 52,323 | ||||
| Herc Holdings Inc. | 328,447 | 51,418 | ||||
| MSC Industrial Direct Co. Inc. Class A | 611,094 | 51,369 | ||||
| Allison Transmission Holdings Inc. | 1,377,621 | 50,077 | ||||
| * | TriNet Group Inc. | 524,968 | 50,008 | |||
| Hillenbrand Inc. | 952,742 | 49,533 | ||||
| Shares | Market Value• ($000) | |||||
| * | Resideo Technologies Inc. | 1,896,609 | 49,369 | |||
| Matson Inc. | 545,756 | 49,134 | ||||
| GATX Corp. | 470,772 | 49,050 | ||||
| Franklin Electric Co. Inc. | 502,154 | 47,484 | ||||
| SPX FLOW Inc. | 549,040 | 47,481 | ||||
| Comfort Systems USA Inc. | 476,293 | 47,124 | ||||
| * | Kirby Corp. | 789,430 | 46,908 | |||
| * | Fluor Corp. | 1,860,426 | 46,083 | |||
| Aerojet Rocketdyne Holdings Inc. | 985,293 | 46,072 | ||||
| Mueller Industries Inc. | 752,155 | 44,648 | ||||
| Helios Technologies Inc. | 423,455 | 44,535 | ||||
| Altra Industrial Motion Corp. | 849,594 | 43,814 | ||||
| *,1 | ChargePoint Holdings Inc. | 2,295,068 | 43,721 | |||
| EnerSys | 546,241 | 43,186 | ||||
| AAON Inc. | 542,936 | 43,125 | ||||
| * | Bloom Energy Corp. Class A | 1,950,203 | 42,768 | |||
| Forward Air Corp. | 352,269 | 42,656 | ||||
| Brink's Co. | 646,194 | 42,371 | ||||
| UniFirst Corp. | 199,536 | 41,982 | ||||
| * | Mercury Systems Inc. | 756,580 | 41,657 | |||
| * | Beacon Roofing Supply Inc. | 725,707 | 41,619 | |||
| * | Dun & Bradstreet Holdings Inc. | 1,986,731 | 40,708 | |||
| Terex Corp. | 913,757 | 40,160 | ||||
| * | Welbilt Inc. | 1,688,652 | 40,139 | |||
| ArcBest Corp. | 333,643 | 39,987 | ||||
| Kennametal Inc. | 1,085,597 | 38,984 | ||||
| MillerKnoll Inc. | 987,331 | 38,694 | ||||
| *,1 | Aurora Innovation Inc. | 3,399,782 | 38,282 | |||
| Encore Wire Corp. | 267,006 | 38,209 | ||||
| Werner Enterprises Inc. | 798,579 | 38,060 | ||||
| Albany International Corp. Class A | 424,683 | 37,563 | ||||
| * | Dycom Industries Inc. | 398,482 | 37,362 | |||
| * | Hub Group Inc. Class A | 442,775 | 37,299 | |||
| * | Masonite International Corp. | 314,342 | 37,077 | |||
| Boise Cascade Co. | 513,051 | 36,529 | ||||
| * | Allegiant Travel Co. | 193,336 | 36,162 | |||
| * | Vicor Corp. | 282,414 | 35,861 | |||
| ABM Industries Inc. | 877,421 | 35,843 | ||||
| * | SPX Corp. | 590,701 | 35,253 | |||
| * | Enovix Corp. | 1,283,773 | 35,021 | |||
| Kadant Inc. | 150,307 | 34,643 | ||||
| * | Alight Inc. Class A | 3,202,484 | 34,619 | |||
| Federal Signal Corp. | 797,446 | 34,561 | ||||
| Brady Corp. Class A | 633,962 | 34,171 | ||||
| * | GMS Inc. | 562,847 | 33,833 | |||
| * | Shoals Technologies Group Inc. Class A | 1,387,240 | 33,710 | |||
| Arcosa Inc. | 634,121 | 33,418 | ||||
| Shares | Market Value• ($000) | |||||
| * | Ameresco Inc. Class A | 407,702 | 33,203 | |||
| * | Atlas Air Worldwide Holdings Inc. | 350,196 | 32,960 | |||
| Trinity Industries Inc. | 1,075,422 | 32,478 | ||||
| * | Virgin Galactic Holdings Inc. | 2,359,591 | 31,571 | |||
| * | JELD-WEN Holding Inc. | 1,193,566 | 31,462 | |||
| * | Stem Inc. | 1,656,502 | 31,424 | |||
| * | Kratos Defense & Security Solutions Inc. | 1,608,725 | 31,209 | |||
| * | Spirit Airlines Inc. | 1,418,729 | 30,999 | |||
| Moog Inc. Class A | 381,441 | 30,885 | ||||
| GrafTech International Ltd. | 2,599,839 | 30,756 | ||||
| Rush Enterprises Inc. Class A | 550,449 | 30,627 | ||||
| ESCO Technologies Inc. | 336,719 | 30,301 | ||||
| EnPro Industries Inc. | 273,577 | 30,113 | ||||
| Mueller Water Products Inc. Class A | 2,053,753 | 29,574 | ||||
| * | Gibraltar Industries Inc. | 426,130 | 28,414 | |||
| Maxar Technologies Inc. | 958,181 | 28,295 | ||||
| Barnes Group Inc. | 599,935 | 27,951 | ||||
| * | CBIZ Inc. | 689,923 | 26,990 | |||
| *,1 | Nikola Corp. | 2,717,830 | 26,825 | |||
| * | SkyWest Inc. | 659,431 | 25,916 | |||
| *,1 | Joby Aviation Inc. | 3,542,131 | 25,858 | |||
| ManTech International Corp. Class A | 354,220 | 25,833 | ||||
| CSW Industrials Inc. | 210,904 | 25,490 | ||||
| McGrath RentCorp | 317,075 | 25,448 | ||||
| *,1 | FuelCell Energy Inc. | 4,824,604 | 25,088 | |||
| * | KAR Auction Services Inc. | 1,604,902 | 25,069 | |||
| * | Array Technologies Inc. | 1,575,280 | 24,716 | |||
| * | Montrose Environmental Group Inc. | 350,206 | 24,693 | |||
| * | Driven Brands Holdings Inc. | 728,851 | 24,504 | |||
| HNI Corp. | 570,802 | 24,002 | ||||
| * | MYR Group Inc. | 217,081 | 23,998 | |||
| * | ACV Auctions Inc. Class A | 1,242,827 | 23,415 | |||
| *,1 | Rocket Lab USA Inc. | 1,904,082 | 23,382 | |||
| * | Meritor Inc. | 936,945 | 23,218 | |||
| Granite Construction Inc. | 590,452 | 22,851 | ||||
| ICF International Inc. | 219,103 | 22,469 | ||||
| * | Air Transport Services Group Inc. | 761,523 | 22,374 | |||
| * | NV5 Global Inc. | 159,844 | 22,078 | |||
| * | Veritiv Corp. | 178,279 | 21,852 | |||
| *,1 | Proterra Inc. | 2,426,208 | 21,423 | |||
| Lindsay Corp. | 140,318 | 21,328 | ||||
| Shyft Group Inc. | 426,399 | 20,949 | ||||
| Shares | Market Value• ($000) | |||||
| Tennant Co. | 252,910 | 20,496 | ||||
| Astec Industries Inc. | 291,406 | 20,186 | ||||
| * | Gates Industrial Corp. plc | 1,265,850 | 20,140 | |||
| Greenbrier Cos. Inc. | 438,403 | 20,118 | ||||
| Alamo Group Inc. | 133,754 | 19,686 | ||||
| Kforce Inc. | 259,719 | 19,536 | ||||
| * | AeroVironment Inc. | 311,203 | 19,304 | |||
| * | Proto Labs Inc. | 366,814 | 18,836 | |||
| *,1 | Hertz Global Holdings Inc. | 753,137 | 18,821 | |||
| Standex International Corp. | 168,212 | 18,614 | ||||
| * | Cimpress plc | 257,235 | 18,421 | |||
| H&E Equipment Services Inc. | 410,596 | 18,177 | ||||
| Healthcare Services Group Inc. | 1,014,499 | 18,048 | ||||
| AZZ Inc. | 322,632 | 17,838 | ||||
| * | Harsco Corp. | 1,067,524 | 17,838 | |||
| *,1 | Microvast Holdings Inc. | 3,133,030 | 17,733 | |||
| Griffon Corp. | 617,864 | 17,597 | ||||
| * | PGT Innovations Inc. | 781,115 | 17,567 | |||
| Deluxe Corp. | 544,049 | 17,469 | ||||
| Primoris Services Corp. | 699,608 | 16,777 | ||||
| Columbus McKinnon Corp. | 361,954 | 16,744 | ||||
| ADT Inc. | 1,962,905 | 16,508 | ||||
| * | AAR Corp. | 420,640 | 16,418 | |||
| *,1 | TuSimple Holdings Inc. Class A | 455,064 | 16,314 | |||
| Enerpac Tool Group Corp. Class A | 802,798 | 16,281 | ||||
| * | Triumph Group Inc. | 876,662 | 16,245 | |||
| * | CoreCivic Inc. | 1,620,023 | 16,152 | |||
| * | Fluence Energy Inc. Class A | 449,429 | 15,982 | |||
| Apogee Enterprises Inc. | 326,294 | 15,711 | ||||
| Kaman Corp. | 351,879 | 15,184 | ||||
| Pitney Bowes Inc. | 2,239,887 | 14,850 | ||||
| Matthews International Corp. Class A | 398,161 | 14,601 | ||||
| * | Core & Main Inc. Class A | 476,658 | 14,462 | |||
| Marten Transport Ltd. | 829,297 | 14,231 | ||||
| * | Huron Consulting Group Inc. | 281,913 | 14,067 | |||
| * | American Woodmark Corp. | 215,359 | 14,041 | |||
| * | Hillman Solutions Corp. | 1,304,432 | 14,023 | |||
| * | Construction Partners Inc. Class A | 471,067 | 13,854 | |||
| * | TrueBlue Inc. | 488,711 | 13,523 | |||
| * | Hydrofarm Holdings Group Inc. | 476,179 | 13,471 | |||
| * | Great Lakes Dredge & Dock Corp. | 851,587 | 13,387 | |||
| Shares | Market Value• ($000) | |||||
| Steelcase Inc. Class A | 1,129,524 | 13,238 | ||||
| Interface Inc. Class A | 815,840 | 13,013 | ||||
| *,1 | Blink Charging Co. | 489,775 | 12,984 | |||
| * | Hawaiian Holdings Inc. | 706,666 | 12,981 | |||
| * | NOW Inc. | 1,506,675 | 12,867 | |||
| * | US Ecology Inc. | 402,862 | 12,867 | |||
| Schneider National Inc. Class B | 474,528 | 12,770 | ||||
| Gorman-Rupp Co. | 283,745 | 12,641 | ||||
| * | Cornerstone Building Brands Inc. | 721,347 | 12,580 | |||
| * | BlueLinx Holdings Inc. | 130,621 | 12,508 | |||
| Wabash National Corp. | 626,493 | 12,229 | ||||
| *,1 | Desktop Metal Inc. Class A | 2,465,492 | 12,204 | |||
| Heidrick & Struggles International Inc. | 274,433 | 12,001 | ||||
| *,1 | Bird Global Inc. Class A | 1,936,858 | 11,950 | |||
| * | Parsons Corp. | 354,505 | 11,929 | |||
| * | Viad Corp. | 276,787 | 11,844 | |||
| *,1 | Astra Space Inc. | 1,679,761 | 11,641 | |||
| Quanex Building Products Corp. | 459,121 | 11,377 | ||||
| * | Energy Recovery Inc. | 526,960 | 11,324 | |||
| Douglas Dynamics Inc. | 288,897 | 11,284 | ||||
| * | Sun Country Airlines Holdings Inc. | 413,012 | 11,255 | |||
| ACCO Brands Corp. | 1,348,954 | 11,142 | ||||
| *,1 | Wheels Up Experience Inc. | 2,366,594 | 10,981 | |||
| * | RR Donnelley & Sons Co. | 973,075 | 10,957 | |||
| Insteel Industries Inc. | 275,196 | 10,956 | ||||
| * | Sterling Construction Co. Inc. | 401,993 | 10,572 | |||
| * | First Advantage Corp. | 550,357 | 10,479 | |||
| Heartland Express Inc. | 587,099 | 9,875 | ||||
| CRA International Inc. | 104,619 | 9,767 | ||||
| * | BrightView Holdings Inc. | 685,122 | 9,647 | |||
| *,1 | Hyliion Holdings Corp. | 1,528,507 | 9,477 | |||
| *,1 | Archer Aviation Inc. Class A | 1,554,649 | 9,390 | |||
| * | Titan Machinery Inc. | 276,497 | 9,315 | |||
| * | Manitowoc Co. Inc. | 492,106 | 9,148 | |||
| * | Forrester Research Inc. | 151,790 | 8,915 | |||
| Global Industrial Co. | 217,672 | 8,903 | ||||
| * | Janus International Group Inc. | 706,781 | 8,849 | |||
| VSE Corp. | 141,533 | 8,625 | ||||
| Argan Inc. | 220,935 | 8,548 | ||||
| 1 | Eagle Bulk Shipping Inc. | 187,449 | 8,529 | |||
| *,1 | Sarcos Technology & Robotics Corp. | 831,958 | 8,303 | |||
| *,1 | ESS Tech Inc. | 723,058 | 8,272 | |||
| * | Daseke Inc. | 814,835 | 8,181 | |||
| Shares | Market Value• ($000) | |||||
| Kelly Services Inc. Class A | 486,300 | 8,155 | ||||
| * | Transcat Inc. | 87,962 | 8,130 | |||
| * | SP Plus Corp. | 284,775 | 8,036 | |||
| * | Thermon Group Holdings Inc. | 473,372 | 8,014 | |||
| Genco Shipping & Trading Ltd. | 499,389 | 7,990 | ||||
| * | CIRCOR International Inc. | 289,097 | 7,858 | |||
| *,1 | Hyzon Motors Inc. | 1,207,315 | 7,835 | |||
| * | PAE Inc. | 784,868 | 7,794 | |||
| * | Titan International Inc. | 710,866 | 7,791 | |||
| * | Vectrus Inc. | 168,114 | 7,695 | |||
| Resources Connection Inc. | 426,036 | 7,600 | ||||
| 1 | Tecnoglass Inc. | 286,507 | 7,504 | |||
| * | TPI Composites Inc. | 499,424 | 7,471 | |||
| *,1 | Skillsoft Corp. | 809,218 | 7,404 | |||
| Ennis Inc. | 369,337 | 7,213 | ||||
| * | Heritage-Crystal Clean Inc. | 224,244 | 7,180 | |||
| * | Ducommun Inc. | 152,608 | 7,137 | |||
| * | Tutor Perini Corp. | 575,518 | 7,119 | |||
| * | Franklin Covey Co. | 151,262 | 7,013 | |||
| Barrett Business Services Inc. | 99,674 | 6,883 | ||||
| * | Babcock & Wilcox Enterprises Inc. | 746,740 | 6,736 | |||
| * | Velo3D Inc. | 804,304 | 6,282 | |||
| * | Lawson Products Inc. | 113,279 | 6,202 | |||
| * | IES Holdings Inc. | 122,362 | 6,196 | |||
| Rush Enterprises Inc. Class B | 112,190 | 6,055 | ||||
| REV Group Inc. | 423,210 | 5,988 | ||||
| * | MRC Global Inc. | 850,731 | 5,853 | |||
| * | DXP Enterprises Inc. | 226,320 | 5,810 | |||
| * | Yellow Corp. | 457,962 | 5,766 | |||
| * | Willdan Group Inc. | 163,541 | 5,757 | |||
| Allied Motion Technologies Inc. | 156,190 | 5,699 | ||||
| *,1 | Blade Air Mobility Inc. | 638,775 | 5,640 | |||
| *,1 | Red Violet Inc. | 135,069 | 5,361 | |||
| Omega Flex Inc. | 41,920 | 5,322 | ||||
| Kimball International Inc. Class B | 518,167 | 5,301 | ||||
| * | Frontier Group Holdings Inc. | 388,093 | 5,266 | |||
| Hyster-Yale Materials Handling Inc. | 127,694 | 5,248 | ||||
| *,1 | Custom Truck One Source Inc. | 627,547 | 5,020 | |||
| Miller Industries Inc. | 148,394 | 4,956 | ||||
| * | Alta Equipment Group Inc. | 335,658 | 4,914 | |||
| * | Radiant Logistics Inc. | 664,309 | 4,843 | |||
| * | HireRight Holdings Corp. | 294,035 | 4,705 | |||
| National Presto Industries Inc. | 56,574 | 4,641 | ||||
| *,1 | Romeo Power Inc. | 1,260,601 | 4,601 | |||
| Shares | Market Value• ($000) | |||||
| * | Spire Global Inc. | 1,358,280 | 4,591 | |||
| *,1 | Markforged Holding Corp. | 850,574 | 4,568 | |||
| * | Astronics Corp. | 348,489 | 4,182 | |||
| *,1 | Legalzoom.com Inc. | 252,532 | 4,058 | |||
| Powell Industries Inc. | 133,383 | 3,933 | ||||
| * | Sterling Check Corp. | 191,168 | 3,921 | |||
| *,1 | Eos Energy Enterprises Inc. | 513,836 | 3,864 | |||
| * | Covenant Logistics Group Inc. Class A | 145,760 | 3,852 | |||
| * | American Superconductor Corp. | 348,051 | 3,787 | |||
| * | Acacia Research Corp. | 707,269 | 3,628 | |||
| * | PAM Transportation Services Inc. | 50,049 | 3,554 | |||
| *,1 | Advent Technologies Holdings Inc. | 505,567 | 3,544 | |||
| * | Blue Bird Corp. | 220,816 | 3,454 | |||
| * | Infrastructure & Energy Alternatives Inc. | 375,133 | 3,451 | |||
| * | Northwest Pipe Co. | 106,716 | 3,394 | |||
| * | BlackSky Technology Inc. | 754,219 | 3,386 | |||
| Park Aerospace Corp. | 256,061 | 3,380 | ||||
| * | Huttig Building Products Inc. | 295,431 | 3,270 | |||
| * | Aris Water Solution Inc. Class A | 252,491 | 3,270 | |||
| *,1 | View Inc. | 819,029 | 3,202 | |||
| * | Vidler Water Resouces Inc. | 263,877 | 3,188 | |||
| * | Commercial Vehicle Group Inc. | 387,706 | 3,125 | |||
| * | Matrix Service Co. | 390,745 | 2,938 | |||
| *,1 | Momentus Inc. | 683,481 | 2,857 | |||
| LSI Industries Inc. | 397,782 | 2,729 | ||||
| Hurco Cos. Inc. | 90,466 | 2,687 | ||||
| * | CECO Environmental Corp. | 427,598 | 2,664 | |||
| * | Berkshire Grey Inc. | 482,563 | 2,654 | |||
| Park-Ohio Holdings Corp. | 125,056 | 2,647 | ||||
| * | Byrna Technologies Inc. | 196,900 | 2,629 | |||
| * | NN Inc. | 612,157 | 2,510 | |||
| *,1 | Nuvve Holding Corp. | 177,660 | 2,366 | |||
| * | Xos Inc. | 747,681 | 2,355 | |||
| * | EVI Industries Inc. | 74,732 | 2,334 | |||
| Preformed Line Products Co. | 35,415 | 2,291 | ||||
| * | INNOVATE Corp. | 616,408 | 2,281 | |||
| * | Mesa Air Group Inc. | 403,224 | 2,258 | |||
| * | Concrete Pumping Holdings Inc. | 275,179 | 2,256 | |||
| *,1 | Lightning eMotors Inc. | 372,740 | 2,240 | |||
| Eastern Co. | 88,795 | 2,234 | ||||
| *,1 | Beam Global | 119,987 | 2,232 | |||
| *,1 | Agrify Corp. | 237,662 | 2,186 | |||
| Shares | Market Value• ($000) | |||||
| * | AerSale Corp. | 122,479 | 2,173 | |||
| * | DLH Holdings Corp. | 100,453 | 2,081 | |||
| * | Hudson Technologies Inc. | 464,105 | 2,061 | |||
| * | FTC Solar Inc. | 271,125 | 2,050 | |||
| * | USA Truck Inc. | 102,838 | 2,044 | |||
| Cadre Holdings Inc. | 79,243 | 2,014 | ||||
| * | Quad/Graphics Inc. | 490,560 | 1,962 | |||
| BGSF Inc. | 136,529 | 1,959 | ||||
| * | L B Foster Co. Class A | 142,200 | 1,955 | |||
| * | Mistras Group Inc. | 260,690 | 1,937 | |||
| ARC Document Solutions Inc. | 533,380 | 1,867 | ||||
| * | Mayville Engineering Co. Inc. | 125,036 | 1,864 | |||
| Graham Corp. | 147,083 | 1,830 | ||||
| * | US Xpress Enterprises Inc. Class A | 311,378 | 1,828 | |||
| *,1 | Orbital Energy Group Inc. | 831,169 | 1,820 | |||
| * | Orion Group Holdings Inc. | 456,467 | 1,721 | |||
| * | Atlas Technical Consultants Inc. Class A | 203,067 | 1,710 | |||
| *,1 | KULR Technology Group Inc. | 619,208 | 1,709 | |||
| 1 | AeroCentury Corp. | 28,591 | 1,707 | |||
| * | Quest Resource Holding Corp. | 239,167 | 1,660 | |||
| * | Gencor Industries Inc. | 140,566 | 1,621 | |||
| *,1 | AgEagle Aerial Systems Inc. | 1,016,964 | 1,597 | |||
| * | Orion Energy Systems Inc. | 435,136 | 1,575 | |||
| *,1 | Redwire Corp. | 232,847 | 1,572 | |||
| Universal Logistics Holdings Inc. | 79,413 | 1,498 | ||||
| * | Karat Packaging Inc. | 71,174 | 1,438 | |||
| * | Twin Disc Inc. | 129,437 | 1,419 | |||
| *,1 | LiqTech International Inc. | 246,351 | 1,409 | |||
| * | Bowman Consulting Group Ltd. | 61,694 | 1,311 | |||
| * | Urban-Gro Inc. | 121,009 | 1,268 | |||
| * | Manitex International Inc. | 195,893 | 1,246 | |||
| * | Performant Financial Corp. | 515,495 | 1,242 | |||
| *,1 | Aqua Metals Inc. | 989,763 | 1,217 | |||
| * | Hill International Inc. | 616,501 | 1,202 | |||
| * | Sunworks Inc. | 388,148 | 1,192 | |||
| * | HyreCar Inc. | 251,372 | 1,184 | |||
| *,1 | Energous Corp. | 897,593 | 1,122 | |||
| *,1 | Ocean Power Technologies Inc. | 752,572 | 1,114 | |||
| * | GEE Group Inc. | 1,898,034 | 1,082 | |||
| * | Alpha Pro Tech Ltd. | 176,646 | 1,055 | |||
| Acme United Corp. | 30,999 | 1,045 | ||||
| NL Industries Inc. | 134,360 | 994 | ||||
| * | Limbach Holdings Inc. | 109,220 | 983 | |||
| Shares | Market Value• ($000) | |||||
| * | VirTra Inc. | 139,803 | 979 | |||
| * | RCM Technologies Inc. | 132,622 | 944 | |||
| * | Westwater Resources Inc. | 438,140 | 942 | |||
| * | Ideal Power Inc. | 77,902 | 940 | |||
| *,1 | BitNile Holdings Inc. | 716,077 | 852 | |||
| HireQuest Inc. | 39,177 | 790 | ||||
| * | Mastech Digital Inc. | 46,161 | 788 | |||
| Innovative Solutions & Support Inc. | 118,046 | 774 | ||||
| * | Charah Solutions Inc. | 155,260 | 734 | |||
| * | Williams Industrial Services Group Inc. | 244,347 | 731 | |||
| Pangaea Logistics Solutions Ltd. | 181,573 | 686 | ||||
| * | FreightCar America Inc. | 183,723 | 678 | |||
| * | Ultralife Corp. | 109,767 | 663 | |||
| * | Capstone Green Energy Corp. | 192,817 | 640 | |||
| * | Perma-Fix Environmental Services Inc. | 99,897 | 632 | |||
| * | Perma-Pipe International Holdings Inc. | 72,289 | 622 | |||
| *,1 | India Globalization Capital Inc. | 629,478 | 615 | |||
| * | Armstrong Flooring Inc. | 308,553 | 611 | |||
| * | Volt Information Sciences Inc. | 189,655 | 552 | |||
| * | Hudson Global Inc. | 18,261 | 526 | |||
| *,1 | iSun Inc. | 87,229 | 520 | |||
| *,1 | Akerna Corp. | 296,093 | 518 | |||
| * | Willis Lease Finance Corp. | 13,303 | 501 | |||
| * | Fuel Tech Inc. | 347,225 | 486 | |||
| * | Team Inc. | 441,525 | 481 | |||
| * | Virco Manufacturing Corp. | 152,389 | 466 | |||
| *,1 | Flux Power Holdings Inc. | 107,827 | 463 | |||
| * | Broadwind Inc. | 242,181 | 455 | |||
| *,1 | Odyssey Marine Exploration Inc. | 85,385 | 444 | |||
| * | CPI Aerostructures Inc. | 160,138 | 437 | |||
| * | Air T Inc. | 17,055 | 429 | |||
| * | LS Starrett Co. Class A | 44,215 | 413 | |||
| *,1 | Air Industries Group | 452,721 | 411 | |||
| 1 | Pioneer Power Solutions Inc. | 52,857 | 396 | |||
| * | Taylor Devices Inc. | 35,698 | 389 | |||
| * | SIFCO Industries Inc. | 59,569 | 387 | |||
| * | Jewett-Cameron Trading Co. Ltd. | 44,541 | 375 | |||
| *,1 | Energy Focus Inc. | 81,557 | 348 | |||
| *,1 | SG Blocks Inc. | 183,195 | 344 | |||
| * | DSS Inc. | 433,041 | 291 | |||
| *,1 | Polar Power Inc. | 79,893 | 286 | |||
| Shares | Market Value• ($000) | |||||
| *,1 | Shapeways Holdings Inc. | 71,943 | 267 | |||
| *,1 | Sigma Labs Inc. | 135,116 | 249 | |||
| * | Servotronics Inc. | 19,402 | 246 | |||
| * | Astrotech Corp. | 350,646 | 238 | |||
| *,1 | Gaucho Group Holdings Inc. | 107,968 | 230 | |||
| *,1 | Renovare Environmental Inc. | 259,346 | 182 | |||
| *,1 | ShiftPixy Inc. | 154,308 | 181 | |||
| *,1 | TOMI Environmental Solutions Inc. | 107,702 | 178 | |||
| * | JanOne Inc. | 39,400 | 161 | |||
| *,1 | Applied UV Inc. | 59,088 | 160 | |||
| *,1,2 | FTE Networks Inc. | 82,837 | 124 | |||
| * | Wilhelmina International Inc. | 22,778 | 120 | |||
| * | Helbiz Inc. | 21,892 | 120 | |||
| Patriot Transportation Holding Inc. | 14,422 | 116 | ||||
| Espey Manufacturing & Electronics Corp. | 7,053 | 100 | ||||
| *,1 | Staffing 360 Solutions Inc. | 90,297 | 83 | |||
| Chicago Rivet & Machine Co. | 2,905 | 76 | ||||
| CompX International Inc. | 2,775 | 62 | ||||
| * | P&F Industries Inc. Class A | 9,628 | 59 | |||
| * | Recruiter.com Group Inc. | 14,094 | 37 | |||
| * | Art's-Way Manufacturing Co. Inc. | 4,243 | 15 | |||
| *,2 | Recycling Asset Holdings Inc. | 43,054 | 5 | |||
| 15,078,163 | ||||||
| Information Technology (23.3%) | ||||||
| * | Snowflake Inc. Class A | 2,922,480 | 989,990 | |||
| Marvell Technology Inc. | 10,919,713 | 955,366 | ||||
| * | Block Inc. Class A | 5,289,403 | 854,291 | |||
| * | Palo Alto Networks Inc. | 1,298,144 | 722,755 | |||
| * | Workday Inc. Class A | 2,528,985 | 690,868 | |||
| * | Datadog Inc. Class A | 3,410,734 | 607,486 | |||
| * | Twilio Inc. Class A | 2,232,542 | 587,918 | |||
| * | Crowdstrike Holdings Inc. Class A | 2,729,003 | 558,763 | |||
| * | Trade Desk Inc. Class A | 5,785,573 | 530,190 | |||
| * | Zoom Video Communications Inc. Class A | 2,872,451 | 528,272 | |||
| * | Cloudflare Inc. Class A | 3,632,746 | 477,706 | |||
| * | MongoDB Inc. | 877,698 | 464,609 | |||
| * | Okta Inc. | 1,955,425 | 438,348 | |||
| * | HubSpot Inc. | 594,868 | 392,107 | |||
| Shares | Market Value• ($000) | |||||
| * | Palantir Technologies Inc. Class A | 21,242,167 | 386,820 | |||
| * | ON Semiconductor Corp. | 5,693,261 | 386,686 | |||
| * | DocuSign Inc. | 2,423,728 | 369,158 | |||
| * | Zscaler Inc. | 1,046,330 | 336,217 | |||
| VMware Inc. Class A | 2,660,738 | 308,326 | ||||
| * | Unity Software Inc. | 2,123,656 | 303,662 | |||
| * | Bill.com Holdings Inc. | 1,210,538 | 301,606 | |||
| Entegris Inc. | 1,787,602 | 247,726 | ||||
| * | Splunk Inc. | 2,137,932 | 247,401 | |||
| SS&C Technologies Holdings Inc. | 2,913,994 | 238,889 | ||||
| * | Dell Technologies Inc. Class C | 3,819,782 | 214,557 | |||
| * | Nuance Communications Inc. | 3,738,527 | 206,815 | |||
| * | RingCentral Inc. Class A | 1,089,216 | 204,065 | |||
| * | Affirm Holdings Inc. Class A | 1,940,824 | 195,169 | |||
| * | GoDaddy Inc. Class A | 2,199,382 | 186,640 | |||
| Cognex Corp. | 2,334,780 | 181,552 | ||||
| * | Wolfspeed Inc. | 1,531,551 | 171,181 | |||
| * | Black Knight Inc. | 2,057,226 | 170,523 | |||
| * | Zendesk Inc. | 1,604,494 | 167,333 | |||
| * | Ciena Corp. | 2,036,927 | 156,782 | |||
| * | Dynatrace Inc. | 2,597,319 | 156,748 | |||
| * | Fair Isaac Corp. | 361,195 | 156,639 | |||
| * | Coupa Software Inc. | 982,895 | 155,347 | |||
| * | Avalara Inc. | 1,152,600 | 148,812 | |||
| * | Synaptics Inc. | 513,113 | 148,551 | |||
| * | UiPath Inc. Class A | 3,426,857 | 147,800 | |||
| * | Lattice Semiconductor Corp. | 1,786,826 | 137,693 | |||
| * | Aspen Technology Inc. | 886,454 | 134,918 | |||
| Jabil Inc. | 1,889,163 | 132,903 | ||||
| * | Manhattan Associates Inc. | 835,962 | 129,984 | |||
| * | Smartsheet Inc. Class A | 1,673,559 | 129,617 | |||
| MKS Instruments Inc. | 728,784 | 126,932 | ||||
| * | Guidewire Software Inc. | 1,101,665 | 125,072 | |||
| * | Five9 Inc. | 904,002 | 124,138 | |||
| * | Paylocity Holding Corp. | 524,190 | 123,793 | |||
| * | Arrow Electronics Inc. | 914,402 | 122,777 | |||
| Genpact Ltd. | 2,261,083 | 120,018 | ||||
| Bentley Systems Inc. Class B | 2,438,095 | 117,833 | ||||
| * | Elastic NV | 953,185 | 117,328 | |||
| * | Pure Storage Inc. Class A | 3,538,072 | 115,164 | |||
| * | First Solar Inc. | 1,306,864 | 113,906 | |||
| * | Silicon Laboratories Inc. | 522,573 | 107,870 | |||
| Littelfuse Inc. | 324,339 | 102,063 | ||||
| Concentrix Corp. | 566,873 | 101,255 | ||||
| Azenta Inc. | 978,812 | 100,925 | ||||
| Shares | Market Value• ($000) | |||||
| * | Lumentum Holdings Inc. | 951,363 | 100,626 | |||
| * | Ambarella Inc. | 481,203 | 97,631 | |||
| * | II-VI Inc. | 1,391,187 | 95,060 | |||
| Western Union Co. | 5,292,455 | 94,417 | ||||
| Universal Display Corp. | 571,684 | 94,345 | ||||
| * | Dropbox Inc. Class A | 3,739,829 | 91,775 | |||
| * | Nutanix Inc. Class A | 2,806,972 | 89,430 | |||
| * | Anaplan Inc. | 1,944,030 | 89,134 | |||
| * | Rapid7 Inc. | 742,170 | 87,346 | |||
| * | Coherent Inc. | 323,901 | 86,333 | |||
| * | New Relic Inc. | 778,582 | 85,613 | |||
| * | Euronet Worldwide Inc. | 699,485 | 83,358 | |||
| * | WEX Inc. | 593,194 | 83,279 | |||
| * | Novanta Inc. | 469,260 | 82,745 | |||
| Dolby Laboratories Inc. Class A | 860,072 | 81,896 | ||||
| * | Asana Inc. Class A | 1,063,864 | 79,311 | |||
| * | Workiva Inc. Class A | 594,133 | 77,528 | |||
| National Instruments Corp. | 1,744,924 | 76,201 | ||||
| * | Semtech Corp. | 840,943 | 74,785 | |||
| Power Integrations Inc. | 789,092 | 73,299 | ||||
| * | Blackline Inc. | 702,725 | 72,760 | |||
| CMC Materials Inc. | 370,150 | 70,954 | ||||
| * | NCR Corp. | 1,753,902 | 70,507 | |||
| * | Digital Turbine Inc. | 1,153,685 | 70,363 | |||
| * | MaxLinear Inc. Class A | 924,661 | 69,710 | |||
| * | Cirrus Logic Inc. | 751,153 | 69,121 | |||
| * | Varonis Systems Inc. | 1,414,657 | 69,007 | |||
| * | Vonage Holdings Corp. | 3,308,260 | 68,779 | |||
| Vontier Corp. | 2,228,047 | 68,468 | ||||
| * | SPS Commerce Inc. | 473,256 | 67,368 | |||
| * | Rogers Corp. | 244,900 | 66,858 | |||
| * | Tenable Holdings Inc. | 1,199,656 | 66,065 | |||
| CDK Global Inc. | 1,565,457 | 65,342 | ||||
| * | Onto Innovation Inc. | 643,140 | 65,105 | |||
| * | Mimecast Ltd. | 805,952 | 64,130 | |||
| * | Diodes Inc. | 583,427 | 64,066 | |||
| Maximus Inc. | 796,359 | 63,446 | ||||
| * | ExlService Holdings Inc. | 431,999 | 62,540 | |||
| TD SYNNEX Corp. | 542,395 | 62,028 | ||||
| *,1 | Confluent Inc. Class A | 812,034 | 61,909 | |||
| * | Teradata Corp. | 1,440,375 | 61,173 | |||
| Pegasystems Inc. | 539,665 | 60,345 | ||||
| *,1 | MicroStrategy Inc. Class A | 110,131 | 59,965 | |||
| * | Qualys Inc. | 436,565 | 59,905 | |||
| * | Q2 Holdings Inc. | 745,641 | 59,234 | |||
| * | Sailpoint Technologies Holdings Inc. | 1,221,357 | 59,040 | |||
| * | Fabrinet | 485,050 | 57,464 | |||
| * | SiTime Corp. | 196,170 | 57,388 | |||
| * | Calix Inc. | 715,575 | 57,225 | |||
| * | Envestnet Inc. | 713,914 | 56,642 | |||
| Shares | Market Value• ($000) | |||||
| * | Perficient Inc. | 430,431 | 55,650 | |||
| * | Mandiant Corp. | 3,162,748 | 55,475 | |||
| * | Viavi Solutions Inc. | 3,102,528 | 54,667 | |||
| * | Sprout Social Inc. Class A | 598,970 | 54,321 | |||
| Avnet Inc. | 1,296,727 | 53,464 | ||||
| * | ACI Worldwide Inc. | 1,538,411 | 53,383 | |||
| * | Marqeta Inc. Class A | 3,080,918 | 52,899 | |||
| * | Box Inc. Class A | 1,989,473 | 52,104 | |||
| * | Altair Engineering Inc. Class A | 669,043 | 51,730 | |||
| * | Alarm.com Holdings Inc. | 601,383 | 51,003 | |||
| *,1 | Matterport Inc. | 2,444,805 | 50,461 | |||
| * | Fastly Inc. Class A | 1,416,553 | 50,217 | |||
| Switch Inc. Class A | 1,737,099 | 49,751 | ||||
| Kulicke & Soffa Industries Inc. | 811,078 | 49,103 | ||||
| * | MACOM Technology Solutions Holdings Inc. | 623,455 | 48,817 | |||
| * | Insight Enterprises Inc. | 455,119 | 48,516 | |||
| * | Alteryx Inc. Class A | 784,506 | 47,463 | |||
| * | FormFactor Inc. | 1,019,970 | 46,633 | |||
| Advanced Energy Industries Inc. | 495,559 | 45,126 | ||||
| * | Verint Systems Inc. | 852,842 | 44,783 | |||
| * | Qualtrics International Inc. Class A | 1,251,472 | 44,302 | |||
| Alliance Data Systems Corp. | 653,591 | 43,510 | ||||
| *,1 | Marathon Digital Holdings Inc. | 1,309,575 | 43,033 | |||
| * | Viasat Inc. | 962,939 | 42,889 | |||
| * | Kyndryl Holdings Inc. | 2,368,969 | 42,878 | |||
| * | LiveRamp Holdings Inc. | 888,504 | 42,604 | |||
| * | Blackbaud Inc. | 538,494 | 42,530 | |||
| * | Rambus Inc. | 1,426,607 | 41,928 | |||
| * | CommVault Systems Inc. | 597,985 | 41,213 | |||
| * | nCino Inc. | 750,857 | 41,192 | |||
| Xerox Holdings Corp. | 1,794,958 | 40,638 | ||||
| Badger Meter Inc. | 380,906 | 40,589 | ||||
| * | Itron Inc. | 591,913 | 40,558 | |||
| EVERTEC Inc. | 775,587 | 38,764 | ||||
| Vishay Intertechnology Inc. | 1,757,985 | 38,447 | ||||
| Belden Inc. | 584,374 | 38,411 | ||||
| * | Cerence Inc. | 497,445 | 38,124 | |||
| * | Sabre Corp. | 4,221,138 | 36,260 | |||
| * | Shift4 Payments Inc. Class A | 625,156 | 36,215 | |||
| * | 3D Systems Corp. | 1,675,658 | 36,094 | |||
| * | Momentive Global Inc. | 1,704,171 | 36,043 | |||
| * | Plexus Corp. | 369,575 | 35,439 | |||
| * | Sanmina Corp. | 835,977 | 34,660 | |||
| * | PagerDuty Inc. | 995,781 | 34,603 | |||
| * | Everbridge Inc. | 508,843 | 34,260 | |||
| *,1 | Toast Inc. Class A | 975,447 | 33,858 | |||
| Shares | Market Value• ($000) | |||||
| * | Appian Corp. | 518,775 | 33,829 | |||
| * | Ultra Clean Holdings Inc. | 589,734 | 33,827 | |||
| * | AppLovin Corp. Class A | 358,132 | 33,758 | |||
| Amkor Technology Inc. | 1,307,900 | 32,423 | ||||
| * | Axcelis Technologies Inc. | 432,651 | 32,258 | |||
| * | NetScout Systems Inc. | ��965,868 | 31,951 | |||
| * | LivePerson Inc. | 868,811 | 31,034 | |||
| * | Appfolio Inc. Class A | 254,398 | 30,797 | |||
| * | Duck Creek Technologies Inc. | 988,718 | 29,770 | |||
| *,1 | C3.ai Inc. Class A | 938,093 | 29,315 | |||
| * | CommScope Holding Co. Inc. | 2,645,045 | 29,201 | |||
| * | Bottomline Technologies DE Inc. | 508,883 | 28,737 | |||
| * | Knowles Corp. | 1,228,274 | 28,680 | |||
| * | Zuora Inc. Class A | 1,526,270 | 28,511 | |||
| InterDigital Inc. | 395,503 | 28,330 | ||||
| *,1 | SentinelOne Inc. Class A | 554,575 | 28,000 | |||
| * | Jamf Holding Corp. | 730,470 | 27,765 | |||
| * | BigCommerce Holdings Inc. | 783,868 | 27,725 | |||
| Progress Software Corp. | 563,040 | 27,178 | ||||
| * | Infinera Corp. | 2,825,924 | 27,101 | |||
| * | Extreme Networks Inc. | 1,724,705 | 27,078 | |||
| *,1 | E2open Parent Holdings Inc. | 2,328,987 | 26,224 | |||
| * | Allegro MicroSystems Inc. | 723,500 | 26,176 | |||
| * | Verra Mobility Corp. Class A | 1,680,505 | 25,930 | |||
| Xperi Holding Corp. | 1,357,386 | 25,668 | ||||
| McAfee Corp. Class A | 994,285 | 25,643 | ||||
| * | 8x8 Inc. | 1,517,413 | 25,432 | |||
| * | Super Micro Computer Inc. | 577,871 | 25,397 | |||
| *,1 | IonQ Inc. | 1,503,492 | 25,108 | |||
| Ubiquiti Inc. | 80,591 | 24,717 | ||||
| CSG Systems International Inc. | 427,845 | 24,652 | ||||
| * | Cohu Inc. | 642,795 | 24,484 | |||
| *,1 | Riot Blockchain Inc. | 1,083,926 | 24,204 | |||
| Methode Electronics Inc. | 491,619 | 24,173 | ||||
| * | Grid Dynamics Holdings Inc. | 602,647 | 22,883 | |||
| *,1 | SunPower Corp. | 1,090,251 | 22,754 | |||
| *,1 | Embark Technology Inc. | 2,603,976 | 22,603 | |||
| * | Avaya Holdings Corp. | 1,118,490 | 22,146 | |||
| * | Impinj Inc. | 249,018 | 22,088 | |||
| TTEC Holdings Inc. | 238,215 | 21,570 | ||||
| * | SMART Global Holdings Inc. | 303,621 | 21,554 | |||
| * | TTM Technologies Inc. | 1,356,228 | 20,208 | |||
| Shares | Market Value• ($000) | |||||
| * | OSI Systems Inc. | 214,937 | 20,032 | |||
| *,1 | Lightwave Logic Inc. | 1,335,926 | 19,879 | |||
| * | TaskUS Inc. Class A | 363,773 | 19,629 | |||
| * | ePlus Inc. | 361,206 | 19,462 | |||
| * | Domo Inc. Class B | 387,221 | 19,206 | |||
| * | Payoneer Global Inc. | 2,588,738 | 19,027 | |||
| * | Unisys Corp. | 895,634 | 18,423 | |||
| * | Ping Identity Holding Corp. | 802,613 | 18,364 | |||
| * | Veeco Instruments Inc. | 640,582 | 18,237 | |||
| * | Repay Holdings Corp. Class A | 997,088 | 18,217 | |||
| * | DigitalOcean Holdings Inc. | 223,818 | 17,979 | |||
| * | PROS Holdings Inc. | 514,084 | 17,731 | |||
| *,1 | PAR Technology Corp. | 333,754 | 17,612 | |||
| * | Ichor Holdings Ltd. | 382,037 | 17,585 | |||
| * | Alpha & Omega Semiconductor Ltd. | 280,505 | 16,987 | |||
| *,1 | Navitas Semiconductor Corp. | 996,764 | 16,955 | |||
| * | Plantronics Inc. | 569,770 | 16,717 | |||
| * | Harmonic Inc. | 1,408,165 | 16,560 | |||
| * | Evo Payments Inc. Class A | 637,281 | 16,314 | |||
| * | FARO Technologies Inc. | 232,560 | 16,284 | |||
| * | Amplitude Inc. Class A | 299,571 | 15,859 | |||
| * | Olo Inc. Class A | 759,652 | 15,808 | |||
| * | Sumo Logic Inc. | 1,148,473 | 15,573 | |||
| * | Avid Technology Inc. | 472,015 | 15,374 | |||
| ADTRAN Inc. | 667,191 | 15,232 | ||||
| CTS Corp. | 413,068 | 15,168 | ||||
| * | Yext Inc. | 1,525,574 | 15,134 | |||
| * | Photronics Inc. | 789,690 | 14,886 | |||
| * | Informatica Inc. Class A | 389,513 | 14,404 | |||
| * | Mirion Technologies Inc. | 1,365,172 | 14,293 | |||
| * | ACM Research Inc. Class A | 164,845 | 14,056 | |||
| * | nLight Inc. | 581,634 | 13,930 | |||
| * | CEVA Inc. | 312,540 | 13,514 | |||
| * | Model N Inc. | 446,041 | 13,395 | |||
| A10 Networks Inc. | 805,154 | 13,349 | ||||
| * | KnowBe4 Inc. Class A | 570,443 | 13,086 | |||
| * | Thoughtworks Holding Inc. | 484,160 | 12,980 | |||
| * | PDF Solutions Inc. | 408,285 | 12,979 | |||
| * | Clearfield Inc. | 150,297 | 12,688 | |||
| * | Consensus Cloud Solutions Inc. | 216,084 | 12,505 | |||
| * | Freshworks Inc. Class A | 475,885 | 12,497 | |||
| * | ScanSource Inc. | 351,063 | 12,315 | |||
| * | Paycor HCM Inc. | 426,740 | 12,294 | |||
| Benchmark Electronics Inc. | 446,170 | 12,091 | ||||
| * | Arlo Technologies Inc. | 1,150,195 | 12,066 | |||
| * | Gitlab Inc. Class A | 137,694 | 11,979 | |||
| * | Agilysys Inc. | 264,724 | 11,770 | |||
| Shares | Market Value• ($000) | |||||
| * | Digi International Inc. | 478,512 | 11,757 | |||
| * | Conduent Inc. | 2,196,843 | 11,731 | |||
| * | SmartRent Inc. Class A | 1,189,599 | 11,515 | |||
| * | Rackspace Technology Inc. | 826,786 | 11,137 | |||
| * | Squarespace Inc. Class A | 376,569 | 11,109 | |||
| *,1 | MicroVision Inc. | 2,192,264 | 10,983 | |||
| * | Mitek Systems Inc. | 617,570 | 10,962 | |||
| * | Telos Corp. | 710,187 | 10,951 | |||
| * | NETGEAR Inc. | 370,839 | 10,832 | |||
| * | NeoPhotonics Corp. | 697,376 | 10,719 | |||
| *,1 | Tucows Inc. Class A | 125,442 | 10,515 | |||
| * | ChannelAdvisor Corp. | 418,156 | 10,320 | |||
| * | Ribbon Communications Inc. | 1,679,927 | 10,164 | |||
| American Software Inc. Class A | 387,765 | 10,148 | ||||
| * | Clearwater Analytics Holdings Inc. Class A | 436,793 | 10,038 | |||
| * | N-able Inc. | 894,278 | 9,926 | |||
| Ebix Inc. | 321,146 | 9,763 | ||||
| * | MoneyGram International Inc. | 1,234,654 | 9,741 | |||
| * | Napco Security Technologies Inc. | 187,264 | 9,359 | |||
| *,1 | Aeva Technologies Inc. | 1,233,883 | 9,328 | |||
| *,1 | Latch Inc. | 1,231,593 | 9,323 | |||
| * | CCC Intelligent Solutions Holdings Inc. | 805,550 | 9,175 | |||
| *,1 | Datto Holding Corp. | 346,602 | 9,133 | |||
| *,1 | Corsair Gaming Inc. | 434,499 | 9,129 | |||
| * | Diebold Nixdorf Inc. | 998,334 | 9,035 | |||
| * | Veritone Inc. | 398,188 | 8,951 | |||
| Comtech Telecommunications Corp. | 364,117 | 8,626 | ||||
| * | Identiv Inc. | 300,298 | 8,450 | |||
| SolarWinds Corp. | 585,880 | 8,314 | ||||
| * | OneSpan Inc. | 490,106 | 8,297 | |||
| *,1 | indie Semiconductor Inc. Class A | 670,005 | 8,033 | |||
| * | Kimball Electronics Inc. | 359,509 | 7,823 | |||
| * | BTRS Holdings Inc. Class A | 978,811 | 7,654 | |||
| *,1 | Meta Materials Inc. | 3,099,798 | 7,626 | |||
| Hackett Group Inc. | 368,098 | 7,557 | ||||
| * | Cantaloupe Inc. | 828,294 | 7,355 | |||
| *,1 | AvePoint Inc. | 1,164,273 | 7,323 | |||
| * | International Money Express Inc. | 450,188 | 7,185 | |||
| * | I3 Verticals Inc. Class A | 308,691 | 7,035 | |||
| * | Aehr Test Systems | 288,151 | 6,967 | |||
| * | Paya Holdings Inc. | 1,098,515 | 6,965 | |||
| *,1 | Digimarc Corp. | 175,161 | 6,915 | |||
| *,1 | AEye Inc. | 1,420,982 | 6,878 | |||
| Shares | Market Value• ($000) | |||||
| * | Vishay Precision Group Inc. | 183,360 | 6,806 | |||
| * | Paymentus Holdings Inc. Class A | 184,645 | 6,459 | |||
| PC Connection Inc. | 149,698 | 6,456 | ||||
| Cass Information Systems Inc. | 163,074 | 6,412 | ||||
| * | Upland Software Inc. | 354,140 | 6,353 | |||
| * | Limelight Networks Inc. | 1,801,276 | 6,178 | |||
| *,1 | Velodyne Lidar Inc. | 1,317,278 | 6,112 | |||
| * | CS Disco Inc. | 170,701 | 6,103 | |||
| *,1 | Inseego Corp. | 1,042,869 | 6,080 | |||
| *,1 | Atomera Inc. | 293,795 | 5,911 | |||
| * | Vertex Inc. Class A | 368,976 | 5,856 | |||
| * | Clear Secure Inc. Class A | 182,359 | 5,721 | |||
| * | Brightcove Inc. | 538,682 | 5,505 | |||
| *,1 | Expensify Inc. Class A | 124,376 | 5,473 | |||
| * | Flywire Corp. | 134,754 | 5,129 | |||
| * | Enfusion Inc. Class A | 244,871 | 5,128 | |||
| *,1 | Cyxtera Technologies Inc. | 404,131 | 5,096 | |||
| * | AvidXchange Holdings Inc. | 338,125 | 5,092 | |||
| * | CyberOptics Corp. | 108,821 | 5,060 | |||
| * | Turtle Beach Corp. | 222,638 | 4,956 | |||
| * | Ouster Inc. | 950,467 | 4,942 | |||
| * | AXT Inc. | 554,521 | 4,885 | |||
| * | SEMrush Holdings Inc. Class A | 231,363 | 4,824 | |||
| NVE Corp. | 68,577 | 4,684 | ||||
| * | 908 Devices Inc. | 177,050 | 4,580 | |||
| * | Benefitfocus Inc. | 428,732 | 4,570 | |||
| * | ForgeRock Inc. Class A | 169,693 | 4,529 | |||
| *,1 | Cleanspark Inc. | 463,104 | 4,409 | |||
| * | GTY Technology Holdings Inc. | 649,439 | 4,351 | |||
| *,1 | Eastman Kodak Co. | 923,665 | 4,323 | |||
| *,1 | Akoustis Technologies Inc. | 646,943 | 4,322 | |||
| *,1 | Kopin Corp. | 1,037,864 | 4,245 | |||
| * | Aviat Networks Inc. | 129,599 | 4,158 | |||
| * | WM Technology Inc. | 668,302 | 3,996 | |||
| * | Alpine 4 Holdings Inc. | 1,985,056 | 3,811 | |||
| *,1 | EverCommerce Inc. | 241,244 | 3,800 | |||
| Information Services Group Inc. | 483,446 | 3,684 | ||||
| * | CoreCard Corp. | 93,497 | 3,628 | |||
| * | Luna Innovations Inc. | 428,193 | 3,614 | |||
| * | CalAmp Corp. | 501,566 | 3,541 | |||
| * | Cambium Networks Corp. | 137,610 | 3,527 | |||
| * | ShotSpotter Inc. | 116,993 | 3,454 | |||
| * | MeridianLink Inc. | 159,453 | 3,441 | |||
| * | DZS Inc. | 210,679 | 3,417 | |||
| * | Sprinklr Inc. Class A | 214,675 | 3,407 | |||
| * | Quantum Corp. | 611,927 | 3,378 | |||
| * | Intapp Inc. | 132,493 | 3,334 | |||
| * | EMCORE Corp. | 446,140 | 3,114 | |||
| * | eGain Corp. | 311,555 | 3,109 | |||
| Shares | Market Value• ($000) | |||||
| *,1 | Evolv Technologies Holdings Inc. | 692,383 | 3,088 | |||
| * | PFSweb Inc. | 236,891 | 3,051 | |||
| * | Smith Micro Software Inc. | 616,766 | 3,034 | |||
| *,1 | Rekor Systems Inc. | 447,959 | 2,934 | |||
| *,1 | Ipsidy Inc. | 206,209 | 2,893 | |||
| * | Synchronoss Technologies Inc. | 1,182,868 | 2,886 | |||
| * | Daktronics Inc. | 569,171 | 2,874 | |||
| * | Pixelworks Inc. | 641,564 | �� 2,823 | |||
| * | Casa Systems Inc. | 487,239 | 2,763 | |||
| *,1 | Couchbase Inc. | 107,870 | 2,692 | |||
| *,1 | Cipher Mining Inc. | 572,553 | 2,651 | |||
| * | Rimini Street Inc. | 437,983 | 2,615 | |||
| * | Powerfleet Inc. | 535,648 | 2,539 | |||
| *,1 | Phunware Inc. | 955,184 | 2,512 | |||
| *,1 | LiveVox Holdings Inc. | 484,371 | 2,495 | |||
| *,1 | NextNav Inc. | 275,380 | 2,412 | |||
| * | Iteris Inc. | 594,898 | 2,380 | |||
| * | VirnetX Holding Corp. | 904,272 | 2,351 | |||
| *,1 | Focus Universal Inc. | 257,109 | 2,278 | |||
| *,1 | Ondas Holdings Inc. | 333,298 | 2,236 | |||
| Bel Fuse Inc. Class B | 169,576 | 2,193 | ||||
| * | Everspin Technologies Inc. | 193,989 | 2,192 | |||
| * | SecureWorks Corp. Class A | 136,531 | 2,180 | |||
| * | Genasys Inc. | 539,552 | 2,147 | |||
| * | ON24 Inc. | 122,769 | 2,130 | |||
| * | Zeta Global Holdings Corp. Class A | 252,527 | 2,126 | |||
| * | Immersion Corp. | 359,370 | 2,052 | |||
| Richardson Electronics Ltd. | 150,816 | 2,039 | ||||
| * | KVH Industries Inc. | 220,466 | 2,026 | |||
| * | Lantronix Inc. | 256,171 | 2,006 | |||
| *,1 | Blend Labs Inc. Class A | 265,327 | 1,948 | |||
| *,1 | IronNet Inc. | 450,564 | 1,892 | |||
| * | inTEST Corp. | 148,143 | 1,884 | |||
| * | Computer Task Group Inc. | 186,210 | 1,857 | |||
| *,1 | American Virtual Cloud Technologies Inc. | 750,467 | 1,824 | |||
| * | Amtech Systems Inc. | 181,247 | 1,791 | |||
| * | Applied Optoelectronics Inc. | 348,449 | 1,791 | |||
| * | Innodata Inc. | 295,732 | 1,751 | |||
| * | Asure Software Inc. | 218,983 | 1,715 | |||
| *,1 | BM Technologies Inc. | 185,226 | 1,706 | |||
| *,1 | Greenidge Generation Holdings Inc. | 105,493 | 1,693 | |||
| * | Viant Technology Inc. Class A | 171,039 | 1,660 | |||
| * | Airgain Inc. | 152,031 | 1,616 | |||
| *,1 | Exela Technologies Inc. | 1,822,328 | 1,599 | |||
| * | Intevac Inc. | 335,609 | 1,581 | |||
| *,1 | SkyWater Technology Inc. | 96,677 | 1,568 | |||
| * | PCTEL Inc. | 275,624 | 1,563 | |||
| Shares | Market Value• ($000) | |||||
| * | Airspan Networks Holdings Inc. | 393,381 | 1,491 | |||
| * | Arteris Inc. | 69,377 | 1,465 | |||
| *,1 | AgileThought Inc. Class A | 305,366 | 1,441 | |||
| *,1 | Backblaze Inc. Class A | 82,538 | 1,394 | |||
| *,1 | Wrap Technologies Inc. | 337,522 | 1,326 | |||
| * | TransAct Technologies Inc. | 118,240 | 1,289 | |||
| *,1 | SRAX Inc. Class A | 286,040 | 1,284 | |||
| * | Soluna Holdings Inc. | 118,915 | 1,280 | |||
| *,1 | MICT Inc. | 1,530,039 | 1,270 | |||
| * | Stronghold Digital Mining Inc. Class A | 96,856 | 1,245 | |||
| *,1 | Resonant Inc. | 726,219 | 1,242 | |||
| * | ServiceSource International Inc. | 1,248,811 | 1,236 | |||
| * | eMagin Corp. | 904,971 | 1,167 | |||
| * | Park City Group Inc. | 193,141 | 1,124 | |||
| * | Intellicheck Inc. | 242,030 | 1,118 | |||
| *,1 | Inpixon | 1,830,210 | 1,098 | |||
| * | AstroNova Inc. | 81,242 | 1,097 | |||
| * | Usio Inc. | 234,074 | 1,021 | |||
| * | GSI Technology Inc. | 219,225 | 1,015 | |||
| *,1 | GreenBox POS | 241,671 | 1,015 | |||
| * | Issuer Direct Corp. | 34,223 | 1,008 | |||
| Wayside Technology Group Inc. | 28,246 | 990 | ||||
| *,1 | Boxlight Corp. Class A | 701,328 | 968 | |||
| * | Key Tronic Corp. | 152,901 | 951 | |||
| *,1 | Quantum Computing Inc. | 276,738 | 944 | |||
| * | CPI Card Group Inc. | 48,983 | 909 | |||
| *,1 | LightPath Technologies Inc. Class A | 369,197 | 901 | |||
| *,1 | SeaChange International Inc. | 555,067 | 888 | |||
| * | Frequency Electronics Inc. | 89,424 | 882 | |||
| *,1 | Verb Technology Co. Inc. | 711,115 | 882 | |||
| * | StarTek Inc. | 160,783 | 839 | |||
| *,1 | One Stop Systems Inc. | 167,844 | 831 | |||
| * | QuickLogic Corp. | 157,615 | 805 | |||
| * | Paysign Inc. | 495,746 | 793 | |||
| *,1 | Vislink Technologies Inc. | 667,529 | 788 | |||
| *,1 | Inuvo Inc. | 1,409,054 | 747 | |||
| * | NetSol Technologies Inc. | 188,228 | 742 | |||
| * | Steel Connect Inc. | 526,873 | 732 | |||
| * | LGL Group Inc. | 63,106 | 719 | |||
| * | RF Industries Ltd. | 89,809 | 718 | |||
| *,1 | Neonode Inc. | 79,508 | 704 | |||
| *,1 | Marin Software Inc. | 188,026 | 698 | |||
| *,1 | Digital Ally Inc. | 646,697 | 692 | |||
| * | Franklin Wireless Corp. | 144,813 | 633 | |||
| Shares | Market Value• ($000) | |||||
| * | Research Frontiers Inc. | 360,890 | 621 | |||
| *,1 | Red Cat Holdings Inc. | 298,378 | 621 | |||
| * | ClearSign Technologies Corp. | 448,479 | 619 | |||
| * | Kaltura Inc. | 181,872 | 613 | |||
| * | Data I/O Corp. | 131,381 | 606 | |||
| * | Aware Inc. | 182,226 | 574 | |||
| * | Qumu Corp. | 258,434 | 548 | |||
| * | Wireless Telecom Group Inc. | 248,831 | 547 | |||
| *,1 | AudioEye Inc. | 77,855 | 547 | |||
| * | Optical Cable Corp. | 101,217 | 544 | |||
| *,1 | Intrusion Inc. | 157,429 | 542 | |||
| * | CPS Technologies Corp. | 139,869 | 530 | |||
| * | TESSCO Technologies Inc. | 84,807 | 525 | |||
| * | CSP Inc. | 58,049 | 510 | |||
| * | Trio-Tech International | 37,821 | 508 | |||
| * | SigmaTron International Inc. | 45,416 | 469 | |||
| * | RealNetworks Inc. | 451,582 | 443 | |||
| * | WidePoint Corp. | 112,347 | 442 | |||
| Autoscope Technologies Corp. | 70,421 | 442 | ||||
| * | GSE Systems Inc. | 255,595 | 437 | |||
| * | ComSovereign Holding Corp. | 556,676 | 420 | |||
| * | Peraso Inc. | 96,589 | 406 | |||
| *,1 | Coda Octopus Group Inc. | 45,235 | 362 | |||
| *,1 | Mullen Automotive Inc. | 68,202 | 357 | |||
| * | Electro-Sensors Inc. | 53,093 | 340 | |||
| *,1 | VerifyMe Inc. | 104,906 | 335 | |||
| *,1 | BSQUARE Corp. | 189,335 | 324 | |||
| * | EngageSmart Inc. | 12,150 | 293 | |||
| Communications Systems Inc. | 121,510 | 292 | ||||
| * | Research Solutions Inc. | 116,162 | 286 | |||
| * | CVD Equipment Corp. | 68,503 | 282 | |||
| * | Socket Mobile Inc. | 66,909 | 273 | |||
| * | Instructure Holdings Inc. | 11,047 | 265 | |||
| Network-1 Technologies Inc. | 92,930 | 262 | ||||
| * | AmpliTech Group Inc. | 66,272 | 261 | |||
| *,1 | Bio-key International Inc. | 118,874 | 260 | |||
| *,1 | NXT-ID Inc. | 79,942 | 245 | |||
| * | Bridgeline Digital Inc. | 106,529 | 241 | |||
| * | DoubleVerify Holdings Inc. | 6,396 | 213 | |||
| * | Evolving Systems Inc. | �� 93,207 | 209 | |||
| * | TSR Inc. | 23,470 | 208 | |||
| * | Cemtrex Inc. | 244,785 | 201 | |||
| * | ALJ Regional Holdings Inc. | 106,831 | 194 | |||
| * | Summit Wireless Technologies Inc. | 134,717 | 187 | |||
| Shares | Market Value• ($000) | |||||
| *,1 | Terawulf Inc. | 12,227 | 184 | |||
| * | Glimpse Group Inc. | 18,473 | 182 | |||
| * | DatChat Inc. | 58,981 | 179 | |||
| * | Weave Communications Inc. | 10,646 | 162 | |||
| SilverSun Technologies Inc. | 34,810 | 155 | ||||
| * | ClearOne Inc. | 114,463 | 148 | |||
| * | CYNGN Inc. | 32,519 | 146 | |||
| * | Schmitt Industries Inc. | 25,776 | 143 | |||
| * | Universal Security Instruments Inc. | 42,010 | 143 | |||
| * | Alfi Inc. | 61,422 | 141 | |||
| * | Priority Technology Holdings Inc. | 19,186 | 136 | |||
| *,1 | OLB Group Inc. | 51,473 | 136 | |||
| * | Kaspien Holdings Inc. | 12,336 | 131 | |||
| *,1 | Auddia Inc. | 71,444 | 127 | |||
| * | UserTesting Inc. | 14,898 | 125 | |||
| * | Oblong Inc. | 115,701 | 119 | |||
| * | Braze Inc. Class A | 1,493 | 115 | |||
| BK Technologies Corp. | 44,027 | 106 | ||||
| * | Sonim Technologies Inc. | 107,944 | 100 | |||
| * | Data Storage Corp. | 32,514 | 99 | |||
| * | Nortech Systems Inc. | 9,269 | 96 | |||
| * | Crexendo Inc. | 18,473 | 92 | |||
| * | ADDvantage Technologies Group Inc. | 40,013 | 69 | |||
| * | Procore Technologies Inc. | 648 | 52 | |||
| * | Moving Image Technologies Inc. | 24,263 | 51 | |||
| * | Blonder Tongue Laboratories Inc. | 77,100 | 45 | |||
| * | Duos Technologies Group Inc. | 8,483 | 43 | |||
| Bel Fuse Inc. Class A | 2,745 | 40 | ||||
| * | Alkami Technology Inc. | 1,593 | 32 | |||
| * | Remitly Global Inc. | 1,529 | 32 | |||
| *,2 | SRAX Inc. | 284,252 | 23 | |||
| * | Sono-Tek Corp. | 1,196 | 9 | |||
| * | Rubicon Technology Inc. | 561 | 5 | |||
| 25,319,696 | ||||||
| Materials (3.7%) | ||||||
| Crown Holdings Inc. | 1,688,787 | 186,814 | ||||
| RPM International Inc. | 1,707,189 | 172,426 | ||||
| Steel Dynamics Inc. | 2,492,736 | 154,724 | ||||
| Alcoa Corp. | 2,483,564 | 147,971 | ||||
| Reliance Steel & Aluminum Co. | 826,631 | 134,096 | ||||
| * | Berry Global Group Inc. | 1,785,993 | 131,771 | |||
| * | Cleveland-Cliffs Inc. | 6,037,502 | 131,436 | |||
| Olin Corp. | 1,894,821 | 108,990 | ||||
| AptarGroup Inc. | 868,622 | 106,389 | ||||
| Huntsman Corp. | 2,712,530 | 94,613 | ||||
| * | Axalta Coating Systems Ltd. | 2,816,740 | 93,290 | |||
| Royal Gold Inc. | 871,067 | 91,645 | ||||
| Shares | Market Value• ($000) | |||||
| Louisiana-Pacific Corp. | 1,167,623 | 91,483 | ||||
| Eagle Materials Inc. | 539,023 | 89,726 | ||||
| Valvoline Inc. | 2,390,648 | 89,147 | ||||
| Scotts Miracle-Gro Co. | 539,448 | 86,851 | ||||
| United States Steel Corp. | 3,587,351 | 85,415 | ||||
| Ashland Global Holdings Inc. | 749,610 | 80,703 | ||||
| Sonoco Products Co. | 1,302,105 | 75,379 | ||||
| Graphic Packaging Holding Co. | 3,751,421 | ��� 73,153 | ||||
| Chemours Co. | 2,157,644 | 72,411 | ||||
| Balchem Corp. | 423,128 | 71,339 | ||||
| Element Solutions Inc. | 2,894,928 | 70,289 | ||||
| Avient Corp. | 1,200,292 | 67,156 | ||||
| * | Summit Materials Inc. Class A | 1,550,977 | 62,256 | |||
| Commercial Metals Co. | 1,579,848 | 57,333 | ||||
| HB Fuller Co. | 685,815 | 55,551 | ||||
| Sensient Technologies Corp. | 547,056 | 54,738 | ||||
| * | Livent Corp. | 2,123,884 | 51,780 | |||
| Silgan Holdings Inc. | 1,097,989 | 47,038 | ||||
| * | Arconic Corp. | 1,401,734 | 46,271 | |||
| * | MP Materials Corp. | 980,972 | 44,556 | |||
| Westlake Chemical Corp. | 435,171 | 42,268 | ||||
| Cabot Corp. | 738,700 | 41,515 | ||||
| Quaker Chemical Corp. | 174,998 | 40,386 | ||||
| * | Ingevity Corp. | 518,048 | 37,144 | |||
| Hecla Mining Co. | 7,031,504 | 36,704 | ||||
| Tronox Holdings plc Class A | 1,475,678 | 35,461 | ||||
| Stepan Co. | 279,822 | 34,779 | ||||
| Minerals Technologies Inc. | 438,233 | 32,057 | ||||
| NewMarket Corp. | 91,089 | 31,218 | ||||
| Innospec Inc. | 317,846 | 28,714 | ||||
| * | Allegheny Technologies Inc. | 1,662,809 | 26,489 | |||
| Trinseo plc | 499,749 | 26,217 | ||||
| Greif Inc. Class A | 428,738 | 25,883 | ||||
| * | O-I Glass Inc. | 2,012,452 | 24,210 | |||
| Materion Corp. | 262,088 | 24,096 | ||||
| * | Ferro Corp. | 1,084,781 | 23,681 | |||
| Compass Minerals International Inc. | 450,948 | 23,034 | ||||
| Worthington Industries Inc. | 411,680 | 22,502 | ||||
| * | GCP Applied Technologies Inc. | 687,730 | 21,774 | |||
| TriMas Corp. | 558,964 | 20,682 | ||||
| * | Kraton Corp. | 426,245 | 19,744 | |||
| * | Ranpak Holdings Corp. Class A | 509,501 | 19,147 | |||
| Kaiser Aluminum Corp. | 202,382 | 19,012 | ||||
| Carpenter Technology Corp. | 647,794 | 18,909 | ||||
| AdvanSix Inc. | 382,118 | 18,055 | ||||
| Shares | Market Value• ($000) | |||||
| Warrior Met Coal Inc. | 686,894 | 17,660 | ||||
| * | Coeur Mining Inc. | 3,432,082 | 17,298 | |||
| Schnitzer Steel Industries Inc. Class A | 325,680 | 16,909 | ||||
| * | Alpha Metallurgical Resources Inc. | 233,865 | 14,277 | |||
| * | Orion Engineered Carbons SA | 758,669 | 13,929 | |||
| * | Amyris Inc. | 2,558,983 | 13,844 | |||
| * | Sylvamo Corp. | 478,919 | 13,357 | |||
| Schweitzer-Mauduit International Inc. | 411,605 | 12,307 | ||||
| * | Century Aluminum Co. | 676,788 | 11,208 | |||
| Hawkins Inc. | 265,811 | 10,486 | ||||
| *,1 | Origin Materials Inc. | 1,555,449 | 10,033 | |||
| Resolute Forest Products Inc. | 653,126 | 9,973 | ||||
| Chase Corp. | 98,266 | 9,783 | ||||
| *,1 | PureCycle Technologies Inc. | 1,016,342 | 9,726 | |||
| Neenah Inc. | 209,963 | 9,717 | ||||
| *,1 | Danimer Scientific Inc. | 1,129,468 | 9,623 | |||
| Glatfelter Corp. | 559,165 | 9,618 | ||||
| Myers Industries Inc. | 472,346 | 9,452 | ||||
| * | Koppers Holdings Inc. | 300,920 | 9,419 | |||
| * | TimkenSteel Corp. | 567,605 | 9,366 | |||
| Verso Corp. Class A | 345,560 | 9,337 | ||||
| * | Forterra Inc. | 382,614 | 9,099 | |||
| * | Piedmont Lithium Inc. | 166,905 | 8,756 | |||
| * | Clearwater Paper Corp. | 233,840 | 8,575 | |||
| * | Diversey Holdings Ltd. | 630,893 | 8,397 | |||
| Ecovyst Inc. | 748,597 | 7,666 | ||||
| SunCoke Energy Inc. | 1,140,964 | 7,519 | ||||
| Pactiv Evergreen Inc. | 590,355 | 7,486 | ||||
| Haynes International Inc. | 176,988 | 7,138 | ||||
| Mercer International Inc. | 572,447 | 6,864 | ||||
| * | Gatos Silver Inc. | 624,242 | 6,480 | |||
| * | UFP Technologies Inc. | 89,848 | 6,313 | |||
| American Vanguard Corp. | 381,135 | 6,247 | ||||
| Ryerson Holding Corp. | 193,146 | 5,031 | ||||
| * | Rayonier Advanced Materials Inc. | 878,010 | 5,013 | |||
| * | Intrepid Potash Inc. | 117,023 | 5,000 | |||
| * | LSB Industries Inc. | 417,251 | 4,611 | |||
| * | Loop Industries Inc. | 360,785 | 4,427 | |||
| Tredegar Corp. | 362,062 | 4,280 | ||||
| Kronos Worldwide Inc. | 273,382 | 4,103 | ||||
| *,1 | McEwen Mining Inc. | 4,342,722 | 3,850 | |||
| Olympic Steel Inc. | 135,370 | 3,181 | ||||
| FutureFuel Corp. | 392,331 | 2,997 | ||||
| * | Smith-Midland Corp. | 58,159 | 2,733 | |||
| United States Lime & Minerals Inc. | 21,070 | 2,718 | ||||
| * | Trecora Resources | 330,514 | 2,671 | |||
| * | Synalloy Corp. | 114,447 | 1,880 | |||
| Shares | Market Value• ($000) | |||||
| * | Advanced Emissions Solutions Inc. | 280,584 | 1,857 | |||
| Gold Resource Corp. | 1,097,065 | 1,711 | ||||
| * | Ramaco Resources Inc. | 125,702 | 1,710 | |||
| * | Zymergen Inc. | 228,875 | 1,531 | |||
| Northern Technologies International Corp. | 89,504 | 1,369 | ||||
| * | Flotek Industries Inc. | 940,861 | 1,063 | |||
| * | Marrone Bio Innovations Inc. | 1,424,715 | 1,026 | |||
| * | Universal Stainless & Alloy Products Inc. | 113,722 | 897 | |||
| * | Core Molding Technologies Inc. | 97,729 | 832 | |||
| Friedman Industries Inc. | 85,667 | 804 | ||||
| * | Ampco-Pittsburgh Corp. | 158,635 | 793 | |||
| * | AgroFresh Solutions Inc. | 393,836 | 784 | |||
| * | Crown ElectroKinetics Corp. | 173,237 | 691 | |||
| * | Comstock Mining Inc. | 503,522 | 650 | |||
| *,1 | United States Antimony Corp. | 1,197,293 | 596 | |||
| *,1 | Golden Minerals Co. | 1,362,026 | 476 | |||
| * | US Gold Corp. | 48,538 | 435 | |||
| * | Solitario Zinc Corp. | 784,751 | 392 | |||
| * | Hycroft Mining Holding Corp. | 526,322 | 321 | |||
| * | Paramount Gold Nevada Corp. | 339,615 | 237 | |||
| *,2 | Partners LP CVR | 40,838 | 3 | |||
| *,2 | Ikonics Corp. CVR | 12,227 | — | |||
| 4,028,956 | ||||||
| Other (0.0%)3 | ||||||
| *,2 | Media General Inc. CVR | 1,202,098 | 47 | |||
| *,2 | Biosante Pharmaceutical Inc. CVR | 44,795 | — | |||
| 47 | ||||||
| Real Estate (7.4%) | ||||||
| Invitation Homes Inc. | 7,858,168 | 356,289 | ||||
| Sun Communities Inc. | 1,530,166 | 321,289 | ||||
| VICI Properties Inc. | 8,305,247 | 250,071 | ||||
| Camden Property Trust | 1,346,281 | 240,553 | ||||
| WP Carey Inc. | 2,455,964 | 201,512 | ||||
| Equity LifeStyle Properties Inc. | 2,253,330 | 197,527 | ||||
| Medical Properties Trust Inc. | 7,898,558 | 186,643 | ||||
| * | Jones Lang LaSalle Inc. | 667,431 | 179,766 | |||
| Life Storage Inc. | 1,087,492 | 166,582 | ||||
| CubeSmart | 2,873,302 | 163,520 | ||||
| American Homes 4 Rent Class A | 3,744,428 | 163,294 | ||||
| Shares | Market Value• ($000) | |||||
| Rexford Industrial Realty Inc. | 2,008,744 | 162,929 | ||||
| CyrusOne Inc. | 1,681,185 | 150,836 | ||||
| Gaming & Leisure Properties Inc. | 3,002,727 | 146,113 | ||||
| * | Zillow Group Inc. Class C | 2,256,246 | 144,061 | |||
| Lamar Advertising Co. Class A | 1,152,622 | 139,813 | ||||
| EastGroup Properties Inc. | 535,217 | 121,949 | ||||
| Americold Realty Trust | 3,546,009 | 116,274 | ||||
| Apartment Income REIT Corp. | 2,094,845 | 114,525 | ||||
| First Industrial Realty Trust Inc. | 1,728,909 | 114,454 | ||||
| National Retail Properties Inc. | 2,340,848 | 112,525 | ||||
| STORE Capital Corp. | 3,266,384 | 112,364 | ||||
| STAG Industrial Inc. | 2,310,253 | 110,800 | ||||
| American Campus Communities Inc. | 1,850,008 | 105,987 | ||||
| Brixmor Property Group Inc. | 3,947,673 | 100,310 | ||||
| Healthcare Trust of America Inc. Class A | 2,916,828 | 97,393 | ||||
| Omega Healthcare Investors Inc. | 3,188,121 | 94,336 | ||||
| Kilroy Realty Corp. | 1,396,856 | 92,835 | ||||
| Terreno Realty Corp. | 985,919 | 84,089 | ||||
| Innovative Industrial Properties Inc. | 316,284 | 83,154 | ||||
| Cousins Properties Inc. | 1,994,481 | 80,338 | ||||
| Spirit Realty Capital Inc. | 1,644,800 | 79,263 | ||||
| Douglas Emmett Inc. | 2,341,771 | 78,449 | ||||
| Rayonier Inc. | 1,909,969 | 77,086 | ||||
| * | Opendoor Technologies Inc. | 5,126,633 | 74,900 | |||
| National Storage Affiliates Trust | 1,079,766 | 74,720 | ||||
| * | Ryman Hospitality Properties Inc. | 727,702 | 66,919 | |||
| Agree Realty Corp. | 918,635 | 65,554 | ||||
| SL Green Realty Corp. | 886,497 | 63,562 | ||||
| Kite Realty Group Trust | 2,897,125 | 63,099 | ||||
| Highwoods Properties Inc. | 1,378,630 | 61,473 | ||||
| Healthcare Realty Trust Inc. | 1,930,295 | 61,074 | ||||
| * | Park Hotels & Resorts Inc. | 3,129,084 | 59,077 | |||
| LXP Industrial Trust | 3,726,146 | 58,202 | ||||
| * | DigitalBridge Group Inc. | 6,778,191 | 56,462 | |||
| * | Howard Hughes Corp. | 545,423 | 55,513 | |||
| Physicians Realty Trust | 2,911,762 | 54,828 | ||||
| * | Redfin Corp. | 1,390,119 | 53,367 | |||
| PotlatchDeltic Corp. | 880,947 | 53,051 | ||||
| Shares | Market Value• ($000) | |||||
| Broadstone Net Lease Inc. | 2,136,218 | 53,021 | ||||
| Outfront Media Inc. | 1,919,185 | 51,473 | ||||
| Hudson Pacific Properties Inc. | 2,004,105 | 49,521 | ||||
| PS Business Parks Inc. | 264,663 | 48,743 | ||||
| Macerich Co. | 2,785,079 | 48,126 | ||||
| EPR Properties | 985,212 | 46,788 | ||||
| Essential Properties Realty Trust Inc. | 1,602,705 | 46,206 | ||||
| Apple Hospitality REIT Inc. | 2,802,701 | 45,264 | ||||
| Uniti Group Inc. | 3,136,655 | 43,945 | ||||
| * | Cushman & Wakefield plc | 1,967,742 | 43,763 | |||
| JBG SMITH Properties | 1,497,491 | 42,993 | ||||
| Corporate Office Properties Trust | 1,487,462 | 41,604 | ||||
| * | Equity Commonwealth | 1,597,870 | 41,385 | |||
| Sabra Health Care REIT Inc. | 2,985,918 | 40,429 | ||||
| Newmark Group Inc. Class A | 2,156,325 | 40,323 | ||||
| Pebblebrook Hotel Trust | 1,720,825 | 38,495 | ||||
| Kennedy-Wilson Holdings Inc. | 1,594,169 | 38,069 | ||||
| SITE Centers Corp. | 2,358,878 | 37,341 | ||||
| Independence Realty Trust Inc. | 1,382,535 | 35,711 | ||||
| National Health Investors Inc. | 596,103 | 34,258 | ||||
| * | Sunstone Hotel Investors Inc. | 2,850,561 | 33,437 | |||
| Retail Opportunity Investments Corp. | 1,568,871 | 30,750 | ||||
| Four Corners Property Trust Inc. | 1,043,390 | 30,686 | ||||
| * | Zillow Group Inc. Class A | 492,427 | 30,639 | |||
| RLJ Lodging Trust | 2,178,513 | 30,347 | ||||
| Piedmont Office Realty Trust Inc. Class A | 1,639,699 | 30,138 | ||||
| Brandywine Realty Trust | 2,232,191 | 29,956 | ||||
| eXp World Holdings Inc. | 871,032 | 29,345 | ||||
| CareTrust REIT Inc. | 1,271,381 | 29,026 | ||||
| Washington REIT | 1,122,515 | 29,017 | ||||
| Monmouth Real Estate Investment Corp. | 1,307,041 | 27,461 | ||||
| Urban Edge Properties | 1,436,345 | 27,291 | ||||
| * | Xenia Hotels & Resorts Inc. | 1,488,950 | 26,965 | |||
| * | DiamondRock Hospitality Co. | 2,746,866 | 26,397 | |||
| Shares | Market Value• ($000) | |||||
| Easterly Government Properties Inc. Class A | 1,141,690 | 26,167 | ||||
| Tanger Factory Outlet Centers Inc. | 1,347,488 | 25,980 | ||||
| * | Realogy Holdings Corp. | 1,542,223 | 25,925 | |||
| American Assets Trust Inc. | 689,890 | 25,892 | ||||
| Acadia Realty Trust | 1,155,977 | 25,235 | ||||
| NexPoint Residential Trust Inc. | 293,988 | 24,645 | ||||
| 1 | InvenTrust Properties Corp. | 884,853 | 24,121 | |||
| 1 | iStar Inc. | 931,503 | 24,061 | |||
| *,1 | WeWork Inc. | 2,779,515 | 23,904 | |||
| Alexander & Baldwin Inc. | 945,967 | 23,734 | ||||
| St. Joe Co. | 430,446 | 22,405 | ||||
| Industrial Logistics Properties Trust | 856,940 | 21,466 | ||||
| Centerspace | 193,251 | 21,432 | ||||
| Global Net Lease Inc. | 1,375,369 | 21,016 | ||||
| * | Veris Residential Inc. | 1,035,149 | 19,026 | |||
| Service Properties Trust | 2,139,202 | 18,804 | ||||
| Paramount Group Inc. | 2,104,873 | 17,555 | ||||
| Empire State Realty Trust Inc. Class A | 1,938,965 | 17,257 | ||||
| LTC Properties Inc. | 502,951 | 17,171 | ||||
| UMH Properties Inc. | 620,407 | 16,956 | ||||
| Getty Realty Corp. | 513,977 | 16,493 | ||||
| * | Marcus & Millichap Inc. | 319,736 | 16,454 | |||
| * | Apartment Investment & Management Co. Class A | 2,099,023 | 16,204 | |||
| Office Properties Income Trust | 640,574 | 15,912 | ||||
| RPT Realty | 1,156,336 | 15,472 | ||||
| Safehold Inc. | 185,902 | 14,844 | ||||
| American Finance Trust Inc. Class A | 1,622,374 | 14,812 | ||||
| Plymouth Industrial REIT Inc. | 451,534 | 14,449 | ||||
| Community Healthcare Trust Inc. | 298,589 | 14,114 | ||||
| Global Medical REIT Inc. | 789,585 | 14,015 | ||||
| * | Orion Office REIT Inc. | 735,291 | 13,728 | |||
| Gladstone Land Corp. | 401,118 | 13,542 | ||||
| * | Summit Hotel Properties Inc. | 1,372,845 | 13,399 | |||
| Gladstone Commercial Corp. | 510,892 | 13,166 | ||||
| GEO Group Inc. | 1,652,903 | 12,810 | ||||
| Preferred Apartment Communities Inc. | 705,573 | 12,743 | ||||
| Armada Hoffler Properties Inc. | 820,340 | 12,486 | ||||
| * | Doma Holdings Inc. | 2,345,875 | 11,917 | |||
| NETSTREIT Corp. | 517,525 | 11,851 | ||||
| Shares | Market Value• ($000) | |||||
| City Office REIT Inc. | 591,456 | 11,663 | ||||
| Universal Health Realty Income Trust | 180,671 | 10,744 | ||||
| Diversified Healthcare Trust | 3,391,196 | 10,479 | ||||
| * | Douglas Elliman Inc. | 880,772 | 10,129 | |||
| Bluerock Residential Growth REIT Inc. Class A | 348,274 | 9,191 | ||||
| * | CorePoint Lodging Inc. | 550,557 | 8,644 | |||
| Saul Centers Inc. | 161,812 | 8,579 | ||||
| Urstadt Biddle Properties Inc. Class A | 400,383 | 8,528 | ||||
| * | Chatham Lodging Trust | 616,014 | 8,452 | |||
| RE/MAX Holdings Inc. Class A | 272,289 | 8,302 | ||||
| Phillips Edison & Co. Inc. | 243,153 | 8,034 | ||||
| Alexander's Inc. | 30,388 | 7,910 | ||||
| RMR Group Inc. Class A | 221,877 | 7,695 | ||||
| One Liberty Properties Inc. | 217,840 | 7,685 | ||||
| Franklin Street Properties Corp. | 1,284,410 | 7,642 | ||||
| * | Seritage Growth Properties Class A | 523,924 | 6,952 | |||
| Indus Realty Trust Inc. | 85,393 | 6,922 | ||||
| Whitestone REIT | 638,419 | 6,467 | ||||
| * | Tejon Ranch Co. | 335,369 | 6,399 | |||
| *,1 | Offerpad Solutions Inc. | 969,657 | 6,206 | |||
| CatchMark Timber Trust Inc. Class A | 701,310 | 6,108 | ||||
| * | Forestar Group Inc. | 257,983 | 5,611 | |||
| * | FRP Holdings Inc. | 96,904 | 5,601 | |||
| Farmland Partners Inc. | 399,633 | 4,776 | ||||
| CTO Realty Growth Inc. | 76,555 | 4,702 | ||||
| Cedar Realty Trust Inc. | 179,560 | 4,509 | ||||
| * | Hersha Hospitality Trust Class A | 445,164 | 4,082 | |||
| Postal Realty Trust Inc. Class A | 203,878 | 4,037 | ||||
| * | Ashford Hospitality Trust Inc. | 409,533 | 3,931 | |||
| BRT Apartments Corp. | 159,953 | 3,837 | ||||
| * | Braemar Hotels & Resorts Inc. | 703,681 | 3,589 | |||
| * | Stratus Properties Inc. | 95,187 | 3,481 | |||
| Alpine Income Property Trust Inc. | 144,159 | 2,889 | ||||
| Clipper Realty Inc. | 217,586 | 2,163 | ||||
| New York City REIT Inc. Class A | 152,611 | 1,619 | ||||
| �� * | Power REIT | 23,415 | 1,613 | |||
| Retail Value Inc. | 246,624 | 1,583 | ||||
| * | Altisource Portfolio Solutions SA | 135,146 | 1,516 | |||
| Shares | Market Value• ($000) | |||||
| * | Fathom Holdings Inc. | 70,973 | 1,452 | |||
| CIM Commercial Trust Corp. | 186,383 | 1,370 | ||||
| * | Pennsylvania REIT | 918,301 | 937 | |||
| * | Transcontinental Realty Investors Inc. | 22,463 | 878 | |||
| * | Maui Land & Pineapple Co. Inc. | 87,398 | 870 | |||
| * | AMREP Corp. | 56,416 | 857 | |||
| 1 | CorEnergy Infrastructure Trust Inc. | 234,079 | 733 | |||
| *,1 | Rafael Holdings Inc. Class B | 140,092 | 714 | |||
| * | Trinity Place Holdings Inc. | 313,786 | 577 | |||
| * | Sotherly Hotels Inc. | 218,019 | 456 | |||
| Global Self Storage Inc. | 79,508 | 452 | ||||
| * | InterGroup Corp. | 6,757 | 365 | |||
| * | Wheeler REIT Inc. | 146,044 | 283 | |||
| * | Comstock Holding Cos. Inc. Class A | 52,273 | 255 | |||
| * | JW Mays Inc. | 4,600 | 187 | |||
| *,2 | Spirit MTA REIT | 653,668 | 175 | |||
| * | American Realty Investors Inc. | 12,316 | 156 | |||
| * | Compass Inc. Class A | 16,022 | 146 | |||
| InnSuites Hospitality Trust | 51,296 | 112 | ||||
| Medalist Diversified REIT Inc. | 91,118 | 109 | ||||
| * | Alset EHome International Inc. | 179,134 | 100 | |||
| *,2 | Altisource Asset Management Corp. | 2,609 | 47 | |||
| * | HMG/Courtland Properties Inc. | 1,000 | 23 | |||
| * | CKX Lands Inc. | 1,000 | 12 | |||
| 8,102,342 | ||||||
| Utilities (2.0%) | ||||||
| * | PG&E Corp. | 19,955,840 | 242,264 | |||
| Essential Utilities Inc. | 3,017,317 | 162,000 | ||||
| Vistra Corp. | 6,388,390 | 145,464 | ||||
| UGI Corp. | 2,732,904 | 125,468 | ||||
| OGE Energy Corp. | 2,639,966 | 101,322 | ||||
| MDU Resources Group Inc. | 2,683,631 | 82,763 | ||||
| National Fuel Gas Co. | 1,199,038 | 76,666 | ||||
| IDACORP Inc. | 674,707 | 76,451 | ||||
| Portland General Electric Co. | 1,180,151 | 62,454 | ||||
| Hawaiian Electric Industries Inc. | 1,459,120 | 60,553 | ||||
| Black Hills Corp. | 827,923 | 58,426 | ||||
| Southwest Gas Holdings Inc. | 795,668 | 55,737 | ||||
| ONE Gas Inc. | 694,249 | 53,867 | ||||
| New Jersey Resources Corp. | 1,249,740 | 51,314 | ||||
| PNM Resources Inc. | 1,123,414 | 51,239 | ||||
| Shares | Market Value• ($000) | |||||
| American States Water Co. | 473,955 | 49,026 | ||||
| California Water Service Group | 680,959 | 48,934 | ||||
| Ormat Technologies Inc. | 587,789 | 46,612 | ||||
| Clearway Energy Inc. Class C | 1,278,776 | 46,074 | ||||
| ALLETE Inc. | 691,092 | 45,854 | ||||
| Avangrid Inc. | 902,180 | 45,001 | ||||
| Spire Inc. | 674,228 | 43,973 | ||||
| Avista Corp. | 936,877 | 39,808 | ||||
| Otter Tail Corp. | 556,091 | 39,716 | ||||
| NorthWestern Corp. | 693,595 | 39,646 | ||||
| MGE Energy Inc. | 478,139 | 39,327 | ||||
| South Jersey Industries Inc. | 1,465,616 | 38,282 | ||||
| * | Sunnova Energy International Inc. | 1,216,260 | 33,958 | |||
| Chesapeake Utilities Corp. | 230,697 | 33,638 | ||||
| Middlesex Water Co. | 227,637 | 27,385 | ||||
| SJW Group | 366,853 | 26,854 | ||||
| Northwest Natural Holding Co. | 419,912 | 20,483 | ||||
| Unitil Corp. | 222,487 | 10,232 | ||||
| York Water Co. | 188,112 | 9,364 | ||||
| Clearway Energy Inc. Class A | 257,240 | 8,612 | ||||
| *,1 | Montauk Renewables Inc. | 805,059 | 8,252 | |||
| Artesian Resources Corp. Class A | 110,634 | 5,126 | ||||
| * | Pure Cycle Corp. | 257,764 | 3,763 | |||
| RGC Resources Inc. | 101,978 | 2,346 | ||||
| Via Renewables Inc. Class A | 197,139 | 2,253 | ||||
| Global Water Resources Inc. | 124,335 | 2,126 | ||||
| Genie Energy Ltd. Class B | 326,109 | 1,816 | ||||
| * | Cadiz Inc. | 379,213 | 1,464 | |||
| 2,125,913 | ||||||
| Total Common Stocks (Cost $73,769,579) | 107,811,827 | |||||
| Preferred Stocks (0.0%) | ||||||
| Meta Materials Inc. Pfd., 1/31/22 | 1,758,570 | 2,655 | ||||
| FAT Brands Inc. Pfd., 8.250%, 2/7/22 | 7,939 | 147 | ||||
| Shares | Market Value• ($000) | |||||
| Air T Funding Pfd., 8.000%, 6/7/24 | 704 | 17 | ||||
| Total Preferred Stocks (Cost $143) | 2,819 | |||||
| Face Amount ($000) | ||||||
| Corporate Bonds (0.0%) | ||||||
| Financials (0.0%) | ||||||
| GAMCO Investors Inc., 4.000%,6/15/23 (Cost $139) | 139 | 138 | ||||
| Shares | ||||||
| Temporary Cash Investments (2.6%) | ||||||
| Money Market Fund (2.6%) | ||||||
| 4,5 | Vanguard Market Liquidity Fund, 0.090% (Cost $2,819,673) | 28,200,561 | 2,819,774 | |||
| Total Investments (101.8%) (Cost $76,589,534) | 110,634,558 | |||||
| Other Assets and Liabilities—Net (-1.8%) | (1,919,683) | |||||
| Net Assets (100%) | 108,714,875 | |||||
| Cost is in $000. |
| • | See Note A in Notes to Financial Statements. |
| * | Non-income-producing security. |
| 1 | Includes partial security positions on loan to broker-dealers. The total value of securities on loan is $1,780,489,000. |
| 2 | Security value determined using significant unobservable inputs. |
| 3 | “Other” represents securities that are not classified by the fund’s benchmark index. |
| 4 | Affiliated money market fund available only to Vanguard funds and certain trusts and accounts managed by Vanguard. Rate shown is the 7-day yield. |
| 5 | Collateral of $1,962,441,000 was received for securities on loan, of which $1,909,907,000 is held in Vanguard Market Liquidity Fund and $52,534,000 is held in cash. |
| CVR—Contingent Value Rights. | |
| REIT—Real Estate Investment Trust. |
| Futures Contracts | ||||
| ($000) | ||||
| Expiration | Number of Long (Short) Contracts | Notional Amount | Value and Unrealized Appreciation (Depreciation) | |
| Long Futures Contracts | ||||
| E-mini Russell 2000 Index | March 2022 | 4,313 | 483,660 | 6,726 |
| E-mini S&P 500 Index | March 2022 | 454 | 108,018 | 3,345 |
| E-mini S&P Mid-Cap 400 Index | March 2022 | 110 | 31,214 | 726 |
| 10,797 | ||||
| Over-the-Counter Total Return Swaps | ||||||
| Reference Entity | Termination Date | Counterparty | Notional Amount ($000) | Floating Interest Rate Received (Paid) (%) | Value and Unrealized Appreciation ($000) | Value and Unrealized (Depreciation) ($000) |
| Chewy Inc. Class A | 1/31/22 | GSI | 17,475 | (0.109)1 | 805 | — |
| DocuSign Inc. | 8/31/22 | BOANA | 44,838 | (0.068)2 | — | (17,120) |
| Lucid Group Inc. | 1/31/22 | GSI | 75,090 | (0.109)1 | — | (5,081) |
| Roku Inc. | 1/31/22 | GSI | 66,281 | (0.109)1 | 7,882 | — |
| Seagen Inc. | 8/31/22 | BOANA | 12,000 | (0.071)2 | — | (406) |
| Sirius XM Holdings Inc. | 1/31/22 | GSI | 25,520 | (0.109)1 | — | (121) |
| Snowflake Inc. Class A | 8/31/22 | BOANA | 53,744 | (0.071)2 | — | (224) |
| Wayfair Inc. Class A | 8/31/22 | BOANA | 32,219 | (0.069)2 | — | (7,525) |
| 8,687 | (30,477) | |||||
| 1 | Based on 1M USD London Interbank Offered Rate (LIBOR) as of the most recent payment date. Floating interest payment received/paid monthly. |
| 2 | Based on USD Overnight Bank Funding Rate as of the most recent payment date. Floating interest payment received/paid monthly. |
| 1M—1-month. | |
| BOANA—Bank of America, N.A. | |
| GSI—Goldman Sachs International. |
| ($000s, except shares and per-share amounts) | Amount |
| Assets | |
| Investments in Securities, at Value | |
| Unaffiliated Issuers (Cost $73,769,861) | 107,814,784 |
| Affiliated Issuers (Cost $2,819,673) | 2,819,774 |
| Total Investments in Securities | 110,634,558 |
| Investment in Vanguard | 3,613 |
| Cash | 13,673 |
| Cash Collateral Pledged—Futures Contracts | 36,682 |
| Cash Collateral Pledged—Over-the-Counter Swap Contracts | 23,839 |
| Receivables for Investment Securities Sold | 290,806 |
| Receivables for Accrued Income | 78,182 |
| Receivables for Capital Shares Issued | 46,615 |
| Unrealized Appreciation—Over-the-Counter Swap Contracts | 8,687 |
| Total Assets | 111,136,655 |
| Liabilities | |
| Payables for Investment Securities Purchased | 16,618 |
| Collateral for Securities on Loan | 1,962,441 |
| Payables for Capital Shares Redeemed | 408,691 |
| Payables to Vanguard | 2,189 |
| Variation Margin Payable—Futures Contracts | 1,364 |
| Unrealized Depreciation—Over-the-Counter Swap Contracts | 30,477 |
| Total Liabilities | 2,421,780 |
| Net Assets | 108,714,875 |
| Statement of Assets and Liabilities (continued) | |
| At December 31, 2021, net assets consisted of: | |
| ($000s, except shares and per-share amounts) | Amount |
| Paid-in Capital | 78,046,007 |
| Total Distributable Earnings (Loss) | 30,668,868 |
| Net Assets | 108,714,875 |
| Investor Shares—Net Assets | |
| Applicable to 2,872,156 outstanding $.001 par value shares of beneficial interest (unlimited authorization) | 398,648 |
| Net Asset Value Per Share—Investor Shares | $138.80 |
| ETF Shares—Net Assets | |
| Applicable to 96,237,772 outstanding $.001 par value shares of beneficial interest (unlimited authorization) | 17,593,369 |
| Net Asset Value Per Share—ETF Shares | $182.81 |
| Admiral Shares—Net Assets | |
| Applicable to 209,475,188 outstanding $.001 par value shares of beneficial interest (unlimited authorization) | 29,054,476 |
| Net Asset Value Per Share—Admiral Shares | $138.70 |
| Institutional Shares—Net Assets | |
| Applicable to 140,279,889 outstanding $.001 par value shares of beneficial interest (unlimited authorization) | 19,455,599 |
| Net Asset Value Per Share—Institutional Shares | $138.69 |
| Institutional Plus Shares—Net Assets | |
| Applicable to 46,668,179 outstanding $.001 par value shares of beneficial interest (unlimited authorization) | 15,972,928 |
| Net Asset Value Per Share—Institutional Plus Shares | $342.27 |
| Institutional Select Shares—Net Assets | |
| Applicable to 117,739,788 outstanding $.001 par value shares of beneficial interest (unlimited authorization) | 26,239,855 |
| Net Asset Value Per Share—Institutional Select Shares | $222.86 |
| Year Ended December 31, 2021 | |
| ($000) | |
| Investment Income | |
| Income | |
| Dividends1 | 1,101,659 |
| Interest2 | 715 |
| Securities Lending—Net | 79,006 |
| Total Income | 1,181,380 |
| Expenses | |
| The Vanguard Group—Note B | |
| Investment Advisory Services | 3,801 |
| Management and Administrative—Investor Shares | 821 |
| Management and Administrative—ETF Shares | 8,095 |
| Management and Administrative—Admiral Shares | 15,316 |
| Management and Administrative—Institutional Shares | 8,721 |
| Management and Administrative—Institutional Plus Shares | 4,611 |
| Management and Administrative—Institutional Select Shares | 4,229 |
| Marketing and Distribution—Investor Shares | 26 |
| Marketing and Distribution—ETF Shares | 769 |
| Marketing and Distribution—Admiral Shares | 907 |
| Marketing and Distribution—Institutional Shares | 607 |
| Marketing and Distribution—Institutional Plus Shares | 206 |
| Marketing and Distribution—Institutional Select Shares | 1 |
| Custodian Fees | 1,374 |
| Auditing Fees | 50 |
| Shareholders’ Reports—Investor Shares | 2 |
| Shareholders’ Reports—ETF Shares | 422 |
| Shareholders’ Reports—Admiral Shares | 216 |
| Shareholders’ Reports—Institutional Shares | 244 |
| Shareholders’ Reports—Institutional Plus Shares | 183 |
| Shareholders’ Reports—Institutional Select Shares | — |
| Trustees’ Fees and Expenses | 33 |
| Total Expenses | 50,634 |
| Net Investment Income | 1,130,746 |
| Realized Net Gain (Loss) | |
| Investment Securities Sold2,3 | 8,428,628 |
| Futures Contracts | 98,388 |
| Swap Contracts | (29,203) |
| Realized Net Gain (Loss) | 8,497,813 |
| Statement of Operations (continued) | |
| Year Ended December 31, 2021 | |
| ($000) | |
| Change in Unrealized Appreciation (Depreciation) | |
| Investment Securities2 | 2,420,094 |
| Futures Contracts | (2,721) |
| Swap Contracts | (22,020) |
| Change in Unrealized Appreciation (Depreciation) | 2,395,353 |
| Net Increase (Decrease) in Net Assets Resulting from Operations | 12,023,912 |
| 1 | Dividends are net of foreign withholding taxes of $525,000. |
| 2 | Interest income, realized net gain (loss), capital gain distributions received, and change in unrealized appreciation (depreciation) from an affiliated company of the fund were $706,000, ($123,000), $22,000, and ($160,000), respectively. Purchases and sales are for temporary cash investment purposes. |
| 3 | Includes $9,360,927,000 of net gain (loss) resulting from in-kind redemptions. |
| Year Ended December 31, | ||
| 2021 ($000) | 2020 ($000) | |
| Increase (Decrease) in Net Assets | ||
| Operations | ||
| Net Investment Income | 1,130,746 | 872,480 |
| Realized Net Gain (Loss) | 8,497,813 | 8,918,158 |
| Change in Unrealized Appreciation (Depreciation) | 2,395,353 | 13,654,329 |
| Net Increase (Decrease) in Net Assets Resulting from Operations | 12,023,912 | 23,444,967 |
| Distributions | ||
| Investor Shares | (4,470) | (4,603) |
| ETF Shares | (191,121) | (137,503) |
| Admiral Shares | (332,583) | (294,052) |
| Institutional Shares | (236,015) | (203,836) |
| Institutional Plus Shares | (169,310) | (128,356) |
| Institutional Select Shares | (319,405) | (266,898) |
| Total Distributions | (1,252,904) | (1,035,248) |
| Capital Share Transactions | ||
| Investor Shares | (107,099) | (104,325) |
| ETF Shares | 2,323,941 | 2,263,951 |
| Admiral Shares | (743,562) | (1,839,723) |
| Institutional Shares | (1,373,546) | (660,488) |
| Institutional Plus Shares | 3,042,375 | (518,910) |
| Institutional Select Shares | (994,136) | (297,897) |
| Net Increase (Decrease) from Capital Share Transactions | 2,147,973 | (1,157,392) |
| Total Increase (Decrease) | 12,918,981 | 21,252,327 |
| Net Assets | ||
| Beginning of Period | 95,795,894 | 74,543,567 |
| End of Period | 108,714,875 | 95,795,894 |
| Investor Shares | |||||
| For a Share Outstanding Throughout Each Period | Year Ended December 31, | ||||
| 2021 | 2020 | 2019 | 2018 | 2017 | |
| Net Asset Value, Beginning of Period | $124.83 | $95.66 | $75.74 | $84.80 | $72.76 |
| Investment Operations | |||||
| Net Investment Income1 | 1.216 | .983 | .962 | 1.193 | .916 |
| Net Realized and Unrealized Gain (Loss) on Investments | 14.134 | 29.401 | 20.089 | (9.104) | 12.074 |
| Total from Investment Operations | 15.350 | 30.384 | 21.051 | (7.911) | 12.990 |
| Distributions | |||||
| Dividends from Net Investment Income | (1.380) | (1.214) | (1.131) | (1.149) | (.950) |
| Distributions from Realized Capital Gains | — | — | — | — | — |
| Total Distributions | (1.380) | (1.214) | (1.131) | (1.149) | (.950) |
| Net Asset Value, End of Period | $138.80 | $124.83 | $95.66 | $75.74 | $84.80 |
| Total Return2 | 12.31% | 32.04% | 27.87% | -9.47% | 17.94% |
| Ratios/Supplemental Data | |||||
| Net Assets, End of Period (Millions) | $399 | $454 | $455 | $1,139 | $1,548 |
| Ratio of Total Expenses to Average Net Assets | 0.19% | 0.19% | 0.19% | 0.19% | 0.21% |
| Ratio of Net Investment Income to Average Net Assets | 0.87% | 1.04% | 1.09% | 1.38% | 1.24% |
| Portfolio Turnover Rate3 | 19% | 19% | 13% | 10% | 11% |
| 1 | Calculated based on average shares outstanding. |
| 2 | Total returns do not include account service fees that may have applied in the periods shown. Fund prospectuses provide information about any applicable account service fees. |
| 3 | Excludes the value of portfolio securities received or delivered as a result of in-kind purchases or redemptions of the fund’s capital shares, including ETF Creation Units. |
| ETF Shares | |||||
| For a Share Outstanding Throughout Each Period | Year Ended December 31, | ||||
| 2021 | 2020 | 2019 | 2018 | 2017 | |
| Net Asset Value, Beginning of Period | $164.43 | $126.02 | $99.77 | $111.72 | $95.86 |
| Investment Operations | |||||
| Net Investment Income1 | 1.867 | 1.509 | 1.636 | 1.742 | 1.420 |
| Net Realized and Unrealized Gain (Loss) on Investments | 18.576 | 38.668 | 26.255 | (12.036) | 15.835 |
| Total from Investment Operations | 20.443 | 40.177 | 27.891 | (10.294) | 17.255 |
| Distributions | |||||
| Dividends from Net Investment Income | (2.063) | (1.767) | (1.641) | (1.656) | (1.395) |
| Distributions from Realized Capital Gains | — | — | — | — | — |
| Total Distributions | (2.063) | (1.767) | (1.641) | (1.656) | (1.395) |
| Net Asset Value, End of Period | $182.81 | $164.43 | $126.02 | $99.77 | $111.72 |
| Total Return | 12.44% | 32.20% | 28.04% | -9.37% | 18.10% |
| Ratios/Supplemental Data | |||||
| Net Assets, End of Period (Millions) | $17,593 | $13,761 | $8,119 | $6,095 | $5,711 |
| Ratio of Total Expenses to Average Net Assets | 0.06% | 0.06% | 0.06% | 0.07% | 0.08% |
| Ratio of Net Investment Income to Average Net Assets | 1.02% | 1.20% | 1.40% | 1.50% | 1.37% |
| Portfolio Turnover Rate2 | 19% | 19% | 13% | 10% | 11% |
| 1 | Calculated based on average shares outstanding. |
| 2 | Excludes the value of portfolio securities received or delivered as a result of in-kind purchases or redemptions of the fund’s capital shares, including ETF Creation Units. |
| Admiral Shares | |||||
| For a Share Outstanding Throughout Each Period | Year Ended December 31, | ||||
| 2021 | 2020 | 2019 | 2018 | 2017 | |
| Net Asset Value, Beginning of Period | $124.75 | $95.61 | $75.70 | $84.76 | $72.72 |
| Investment Operations | |||||
| Net Investment Income1 | 1.408 | 1.112 | 1.236 | 1.307 | 1.071 |
| Net Realized and Unrealized Gain (Loss) on Investments | 14.106 | 29.367 | 19.918 | (9.111) | 12.026 |
| Total from Investment Operations | 15.514 | 30.479 | 21.154 | (7.804) | 13.097 |
| Distributions | |||||
| Dividends from Net Investment Income | (1.564) | (1.339) | (1.244) | (1.256) | (1.057) |
| Distributions from Realized Capital Gains | — | — | — | — | — |
| Total Distributions | (1.564) | (1.339) | (1.244) | (1.256) | (1.057) |
| Net Asset Value, End of Period | $138.70 | $124.75 | $95.61 | $75.70 | $84.76 |
| Total Return2 | 12.45% | 32.21% | 28.03% | -9.36% | 18.11% |
| Ratios/Supplemental Data | |||||
| Net Assets, End of Period (Millions) | $29,054 | $26,784 | $22,391 | $17,644 | $19,712 |
| Ratio of Total Expenses to Average Net Assets | 0.06% | 0.06% | 0.06% | 0.07% | 0.08% |
| Ratio of Net Investment Income to Average Net Assets | 1.01% | 1.18% | 1.39% | 1.50% | 1.37% |
| Portfolio Turnover Rate3 | 19% | 19% | 13% | 10% | 11% |
| 1 | Calculated based on average shares outstanding. |
| 2 | Total returns do not include account service fees that may have applied in the periods shown. Fund prospectuses provide information about any applicable account service fees. |
| 3 | Excludes the value of portfolio securities received or delivered as a result of in-kind purchases or redemptions of the fund’s capital shares, including ETF Creation Units. |
| Institutional Shares | |||||
| For a Share Outstanding Throughout Each Period | Year Ended December 31, | ||||
| 2021 | 2020 | 2019 | 2018 | 2017 | |
| Net Asset Value, Beginning of Period | $124.74 | $95.60 | $75.69 | $84.75 | $72.72 |
| Investment Operations | |||||
| Net Investment Income1 | 1.413 | 1.125 | 1.239 | 1.319 | 1.085 |
| Net Realized and Unrealized Gain (Loss) on Investments | 14.115 | 29.364 | 19.925 | (9.113) | 12.018 |
| Total from Investment Operations | 15.528 | 30.489 | 21.164 | (7.794) | 13.103 |
| Distributions | |||||
| Dividends from Net Investment Income | (1.578) | (1.349) | (1.254) | (1.266) | (1.073) |
| Distributions from Realized Capital Gains | — | — | — | — | — |
| Total Distributions | (1.578) | (1.349) | (1.254) | (1.266) | (1.073) |
| Net Asset Value, End of Period | $138.69 | $124.74 | $95.60 | $75.69 | $84.75 |
| Total Return | 12.47% | 32.23% | 28.05% | -9.35% | 18.12% |
| Ratios/Supplemental Data | |||||
| Net Assets, End of Period (Millions) | $19,456 | $18,659 | $14,927 | $12,443 | $13,359 |
| Ratio of Total Expenses to Average Net Assets | 0.05% | 0.05% | 0.05% | 0.06% | 0.06% |
| Ratio of Net Investment Income to Average Net Assets | 1.01% | 1.19% | 1.40% | 1.51% | 1.39% |
| Portfolio Turnover Rate2 | 19% | 19% | 13% | 10% | 11% |
| 1 | Calculated based on average shares outstanding. |
| 2 | Excludes the value of portfolio securities received or delivered as a result of in-kind purchases or redemptions of the fund’s capital shares, including ETF Creation Units. |
| Institutional Plus Shares | |||||
| For a Share Outstanding Throughout Each Period | Year Ended December 31, | ||||
| 2021 | 2020 | 2019 | 2018 | 2017 | |
| Net Asset Value, Beginning of Period | $307.85 | $235.94 | $186.80 | $209.16 | $179.47 |
| Investment Operations | |||||
| Net Investment Income1 | 3.595 | 2.798 | 3.078 | 3.208 | 2.611 |
| Net Realized and Unrealized Gain (Loss) on Investments | 34.757 | 72.466 | 49.178 | (22.426) | 29.741 |
| Total from Investment Operations | 38.352 | 75.264 | 52.256 | (19.218) | 32.352 |
| Distributions | |||||
| Dividends from Net Investment Income | (3.932) | (3.354) | (3.116) | (3.142) | (2.662) |
| Distributions from Realized Capital Gains | — | — | — | — | — |
| Total Distributions | (3.932) | (3.354) | (3.116) | (3.142) | (2.662) |
| Net Asset Value, End of Period | $342.27 | $307.85 | $235.94 | $186.80 | $209.16 |
| Total Return | 12.48% | 32.24% | 28.07% | -9.35% | 18.13% |
| Ratios/Supplemental Data | |||||
| Net Assets, End of Period (Millions) | $15,973 | $11,665 | $9,486 | $7,559 | $10,565 |
| Ratio of Total Expenses to Average Net Assets | 0.04% | 0.04% | 0.04% | 0.05% | 0.05% |
| Ratio of Net Investment Income to Average Net Assets | 1.04% | 1.20% | 1.41% | 1.52% | 1.40% |
| Portfolio Turnover Rate2 | 19% | 19% | 13% | 10% | 11% |
| 1 | Calculated based on average shares outstanding. |
| 2 | Excludes the value of portfolio securities received or delivered as a result of in-kind purchases or redemptions of the fund’s capital shares, including ETF Creation Units. |
| Institutional Select Shares | |||||
| For a Share Outstanding Throughout Each Period | Year Ended December 31, | ||||
| 2021 | 2020 | 2019 | 2018 | 2017 | |
| Net Asset Value, Beginning of Period | $200.45 | $153.63 | $121.63 | $136.19 | $116.85 |
| Investment Operations | |||||
| Net Investment Income1 | 2.352 | 1.855 | 2.059 | 2.184 | 1.891 |
| Net Realized and Unrealized Gain (Loss) on Investments | 22.661 | 47.179 | 31.999 | (14.655) | 19.221 |
| Total from Investment Operations | 25.013 | 49.034 | 34.058 | (12.471) | 21.112 |
| Distributions | |||||
| Dividends from Net Investment Income | (2.603) | (2.214) | (2.058) | (2.089) | (1.772) |
| Distributions from Realized Capital Gains | — | — | — | — | — |
| Total Distributions | (2.603) | (2.214) | (2.058) | (2.089) | (1.772) |
| Net Asset Value, End of Period | $222.86 | $200.45 | $153.63 | $121.63 | $136.19 |
| Total Return | 12.50% | 32.27% | 28.09% | -9.32% | 18.17% |
| Ratios/Supplemental Data | |||||
| Net Assets, End of Period (Millions) | $26,240 | $24,472 | $19,166 | $13,390 | $12,250 |
| Ratio of Total Expenses to Average Net Assets | 0.02% | 0.02% | 0.02% | 0.02% | 0.02% |
| Ratio of Net Investment Income to Average Net Assets | 1.05% | 1.22% | 1.44% | 1.55% | 1.43% |
| Portfolio Turnover Rate2 | 19% | 19% | 13% | 10% | 11% |
| 1 | Calculated based on average shares outstanding. |
| 2 | Excludes the value of portfolio securities received or delivered as a result of in-kind purchases or redemptions of the fund’s capital shares, including ETF Creation Units. |
| A. | The following significant accounting policies conform to generally accepted accounting principles for U.S. investment companies. The fund consistently follows such policies in preparing its financial statements. |
| B. | In accordance with the terms of a Funds’ Service Agreement (the “FSA”) between Vanguard and the fund, Vanguard furnishes to the fund investment advisory, corporate management, administrative, marketing, and distribution services at Vanguard’s cost of operations (as defined by the FSA). These costs of operations are allocated to the fund based on methods and guidelines approved by the board of trustees and are generally settled twice a month. |
| C. | Various inputs may be used to determine the value of the fund’s investments and derivatives. These inputs are summarized in three broad levels for financial statement purposes. The inputs or methodologies used to value securities are not necessarily an indication of the risk associated with investing in those securities. |
| Level 1 ($000) | Level 2 ($000) | Level 3 ($000) | Total ($000) | |
| Investments | ||||
| Assets | ||||
| Common Stocks | 107,805,367 | — | 6,460 | 107,811,827 |
| Preferred Stocks | 2,819 | — | — | 2,819 |
| Corporate Bonds | — | 138 | — | 138 |
| Temporary Cash Investments | 2,819,774 | — | — | 2,819,774 |
| Total | 110,627,960 | 138 | 6,460 | 110,634,558 |
| Derivative Financial Instruments | ||||
| Assets | ||||
| Futures Contracts1 | 10,797 | — | — | 10,797 |
| Swap Contracts | — | 8,687 | — | 8,687 |
| Total | 10,797 | 8,687 | — | 19,484 |
| Liabilities | ||||
| Swap Contracts | — | 30,477 | — | 30,477 |
| 1 | Includes cumulative appreciation (depreciation) on futures contracts and centrally cleared swaps, if any, as reported in the Schedule of Investments. Only current day’s variation margin is reported within the Statement of Assets and Liabilities. |
| D. | Permanent differences between book-basis and tax-basis components of net assets are reclassified among capital accounts in the financial statements to reflect their tax character. These reclassifications have no effect on net assets or net asset value per share. As of period end, permanent differences primarily attributable to the accounting for in-kind redemptions, passive foreign investment companies, and swap agreements were reclassified between the following accounts: |
| Amount ($000) | |
| Paid-in Capital | 9,356,489 |
| Total Distributable Earnings (Loss) | (9,356,489) |
| Amount ($000) | |
| Undistributed Ordinary Income | — |
| Undistributed Long-Term Gains | — |
| Capital Loss Carryforwards | (3,139,975) |
| Qualified Late-Year Losses | (34,247) |
| Net Unrealized Gains (Losses) | 33,843,090 |
| Year Ended December 31, | ||
| 2021 Amount ($000) | 2020 Amount ($000) | |
| Ordinary Income* | 1,252,904 | 1,035,248 |
| Long-Term Capital Gains | — | — |
| Total | 1,252,904 | 1,035,248 |
| * | Includes short-term capital gains, if any. |
| Amount ($000) | |
| Tax Cost | 76,791,468 |
| Gross Unrealized Appreciation | 42,967,651 |
| Gross Unrealized Depreciation | (9,124,561) |
| Net Unrealized Appreciation (Depreciation) | 33,843,090 |
| E. | During the year ended December 31, 2021, the fund purchased $36,384,050,000 of investment securities and sold $34,291,890,000 of investment securities, other than temporary cash investments. Purchases and sales include $15,519,855,000 and $14,252,216,000, respectively, in connection with in-kind purchases and redemptions of the fund’s capital shares. |
| F. | Capital share transactions for each class of shares were: |
| Year Ended December 31, | |||||
| 2021 | 2020 | ||||
| Amount ($000) | Shares (000) | Amount ($000) | Shares (000) | ||
| Investor Shares | |||||
| Issued | 39,158 | 282 | 22,830 | 247 | |
| Issued in Lieu of Cash Distributions | 4,470 | 33 | 4,603 | 45 | |
| Redeemed | (150,727) | (1,083) | (131,758) | (1,409) | |
| Net Increase (Decrease)—Investor Shares | (107,099) | (768) | (104,325) | (1,117) | |
| ETF Shares | |||||
| Issued | 15,985,886 | 87,247 | 14,624,815 | 107,064 | |
| Issued in Lieu of Cash Distributions | — | — | — | — | |
| Redeemed | (13,661,945) | (74,700) | (12,360,864) | (87,800) | |
| Net Increase (Decrease)—ETF Shares | 2,323,941 | 12,547 | 2,263,951 | 19,264 | |
| Admiral Shares | |||||
| Issued | 3,642,653 | 26,360 | 3,059,775 | 34,243 | |
| Issued in Lieu of Cash Distributions | 279,124 | 2,035 | 247,838 | 2,462 | |
| Redeemed | (4,665,339) | (33,620) | (5,147,336) | (56,192) | |
| Net Increase (Decrease)—Admiral Shares | (743,562) | (5,225) | (1,839,723) | (19,487) | |
| Institutional Shares | |||||
| Issued | 4,149,788 | 30,111 | 2,848,323 | 30,960 | |
| Issued in Lieu of Cash Distributions | 221,019 | 1,611 | 191,072 | 1,896 | |
| Redeemed | (5,744,353) | (41,017) | (3,699,883) | (39,412) | |
| Net Increase (Decrease)—Institutional Shares | (1,373,546) | (9,295) | (660,488) | (6,556) | |
| Institutional Plus Shares | |||||
| Issued | 5,116,528 | 14,794 | 1,524,569 | 6,648 | |
| Issued in Lieu of Cash Distributions | 161,853 | 477 | 122,184 | 493 | |
| Redeemed | (2,236,006) | (6,495) | (2,165,663) | (9,455) | |
| Net Increase (Decrease)—Institutional Plus Shares | 3,042,375 | 8,776 | (518,910) | (2,314) | |
| Institutional Select Shares | |||||
| Issued | 1,654,421 | 7,468 | 1,631,575 | 10,461 | |
| Issued in Lieu of Cash Distributions | 319,405 | 1,448 | 266,898 | 1,647 | |
| Redeemed | (2,967,962) | (13,263) | (2,196,370) | (14,775) | |
| Net Increase (Decrease)—Institutional Select Shares | (994,136) | (4,347) | (297,897) | (2,667) | |
| G. | Management has determined that no events or transactions occurred subsequent to December 31, 2021, that would require recognition or disclosure in these financial statements. |

| Average Annual Total Returns Periods Ended December 31, 2021 | |||||
| One Year | Five Years | Ten Years | Final Value of a $10,000 Investment | ||
| Mid-Cap Index Fund Investor Shares | 24.36% | 15.72% | 14.97% | $40,344 |
| Spliced Mid-Cap Index | 24.52 | 15.89 | 15.15 | 40,996 |
| Dow Jones U.S. Total Stock Market Float Adjusted Index | 25.66 | 17.92 | 16.24 | 45,050 |
| One Year | Five Years | Ten Years | Final Value of a $10,000 Investment | ||
| Mid-Cap Index Fund ETF Shares Net Asset Value | 24.52% | 15.87% | 15.12% | $40,863 | |
| Mid-Cap Index Fund ETF Shares Market Price | 24.50 | 15.86 | 15.12 | 40,866 | |
| Spliced Mid-Cap Index | 24.52 | 15.89 | 15.15 | 40,996 | |
| Dow Jones U.S. Total Stock Market Float Adjusted Index | 25.66 | 17.92 | 16.24 | 45,050 | |
| Average Annual Total Returns Periods Ended December 31, 2021 | |||||
| One Year | Five Years | Ten Years | Final Value of a $10,000 Investment | ||
| Mid-Cap Index Fund Admiral Shares | 24.51% | 15.86% | 15.12% | $40,864 | |
| Spliced Mid-Cap Index | 24.52 | 15.89 | 15.15 | 40,996 | |
| Dow Jones U.S. Total Stock Market Float Adjusted Index | 25.66 | 17.92 | 16.24 | 45,050 | |
| One Year | Five Years | Ten Years | Final Value of a $5,000,000 Investment | ||
| Mid-Cap Index Fund Institutional Shares | 24.53% | 15.88% | 15.13% | $20,456,810 | |
| Spliced Mid-Cap Index | 24.52 | 15.89 | 15.15 | 20,498,009 | |
| Dow Jones U.S. Total Stock Market Float Adjusted Index | 25.66 | 17.92 | 16.24 | 22,525,162 | |
| One Year | Five Years | Ten Years | Final Value of a $100,000,000 Investment | ||
| Mid-Cap Index Fund Institutional Plus Shares | 24.53% | 15.89% | 15.14% | $409,641,870 | |
| Spliced Mid-Cap Index | 24.52 | 15.89 | 15.15 | 409,960,170 | |
| Dow Jones U.S. Total Stock Market Float Adjusted Index | 25.66 | 17.92 | 16.24 | 450,503,240 | |
| Cumulative Returns of ETF Shares: December 31, 2011, Through December 31, 2021 | |||
| One Year | Five Years | Ten Years | |
| Mid-Cap Index Fund ETF Shares Market Price | 24.50% | 108.80% | 308.66% |
| Mid-Cap Index Fund ETF Shares Net Asset Value | 24.52 | 108.83 | 308.63 |
| Spliced Mid-Cap Index | 24.52 | 109.03 | 309.96 |
| Basic Materials | 3.4% |
| Consumer Discretionary | 14.3 |
| Consumer Staples | 4.0 |
| Energy | 4.4 |
| Financials | 11.1 |
| Health Care | 11.2 |
| Industrials | 15.6 |
| Real Estate | 9.5 |
| Technology | 18.7 |
| Telecommunications | 2.1 |
| Utilities | 5.7 |
| Shares | Market Value• ($000) | |||||
| Common Stocks (99.8%) | ||||||
| Basic Materials (3.4%) | ||||||
| International Flavors & Fragrances Inc. | 5,754,405 | 866,901 | ||||
| Fastenal Co. | 13,002,885 | 832,965 | ||||
| Nucor Corp. | 6,460,312 | 737,445 | ||||
| Albemarle Corp. | 2,644,216 | 618,138 | ||||
| LyondellBasell Industries NV Class A | 6,015,170 | 554,779 | ||||
| Celanese Corp. | 2,460,565 | 413,523 | ||||
| International Paper Co. | 8,757,666 | 411,435 | ||||
| Avery Dennison Corp. | 1,871,219 | 405,250 | ||||
| Eastman Chemical Co. | 3,038,194 | 367,348 | ||||
| FMC Corp. | 2,866,438 | 314,993 | ||||
| CF Industries Holdings Inc. | 2,425,023 | 171,643 | ||||
| Westlake Chemical Corp. | 361,340 | 35,097 | ||||
| 5,729,517 | ||||||
| Consumer Discretionary (14.3%) | ||||||
| * | Aptiv plc | 6,115,635 | 1,008,774 | |||
| * | Trade Desk Inc. Class A | 9,857,556 | 903,346 | |||
| DR Horton Inc. | 7,656,633 | 830,362 | ||||
| * | Copart Inc. | 4,827,407 | 731,931 | |||
| Lennar Corp. Class A | 6,247,585 | 725,719 | ||||
| * | Dollar Tree Inc. | 5,085,326 | 714,590 | |||
| * | Etsy Inc. | 2,865,875 | 627,455 | |||
| Tractor Supply Co. | 2,572,770 | 613,863 | ||||
| * | Expedia Group Inc. | 3,300,320 | 596,434 | |||
| * | Southwest Airlines Co. | 13,374,181 | 572,950 | |||
| * | Delta Air Lines Inc. | 14,466,596 | 565,355 | |||
| * | Chipotle Mexican Grill Inc. | 302,113 | 528,169 | |||
| Best Buy Co. Inc. | 5,003,708 | 508,377 | ||||
| * | Ulta Beauty Inc. | 1,228,609 | 506,605 | |||
| * | AutoZone Inc. | 237,079 | 497,010 | |||
| * | Hilton Worldwide Holdings Inc. | 3,151,528 | 491,607 | |||
| * | CarMax Inc. | 3,664,086 | 477,174 | |||
| Garmin Ltd. | 3,477,522 | 473,534 | ||||
| Domino's Pizza Inc. | 822,418 | 464,115 | ||||
| Shares | Market Value• ($000) | |||||
| * | Take-Two Interactive Software Inc. | 2,606,033 | 463,144 | |||
| Genuine Parts Co. | 3,220,775 | 451,553 | ||||
| * | NVR Inc. | 74,788 | 441,913 | |||
| Darden Restaurants Inc. | 2,933,364 | 441,882 | ||||
| * | Burlington Stores Inc. | 1,508,964 | 439,878 | |||
| * | Caesars Entertainment Inc. | 4,589,905 | 429,294 | |||
| MGM Resorts International | 9,009,203 | 404,333 | ||||
| * | Live Nation Entertainment Inc. | 3,300,220 | 395,003 | |||
| ViacomCBS Inc. Class B | 13,080,299 | 394,763 | ||||
| * | Carnival Corp. | 18,845,134 | 379,164 | |||
| * | Royal Caribbean Cruises Ltd. | 4,894,264 | 376,369 | |||
| Omnicom Group Inc. | 4,807,651 | 352,257 | ||||
| Advance Auto Parts Inc. | 1,410,141 | 338,265 | ||||
| LKQ Corp. | 5,603,146 | 336,357 | ||||
| Whirlpool Corp. | 1,373,776 | 322,370 | ||||
| * | United Airlines Holdings Inc. | 7,312,637 | 320,147 | |||
| * | Wayfair Inc. Class A | 1,675,279 | 318,253 | |||
| *,1 | AMC Entertainment Holdings Inc. Class A | 11,614,014 | 315,901 | |||
| PulteGroup Inc. | 5,435,445 | 310,690 | ||||
| Hasbro Inc. | 2,963,557 | 301,631 | ||||
| VF Corp. | 3,990,118 | 292,156 | ||||
| * | Lyft Inc. Class A | 6,378,034 | 272,533 | |||
| Fox Corp. Class A | 7,104,960 | 262,173 | ||||
| News Corp. Class A | 11,196,744 | 249,799 | ||||
| BorgWarner Inc. | 5,422,189 | 244,378 | ||||
| Pool Corp. | 429,874 | 243,309 | ||||
| * | Peloton Interactive Inc. Class A | 6,404,372 | 229,020 | |||
| * | Wynn Resorts Ltd. | 2,353,945 | 200,180 | |||
| Bath & Body Works Inc. | 2,839,827 | 198,192 | ||||
| * | DraftKings Inc. Class A | 6,763,812 | 185,802 | |||
| * | Liberty Media Corp.-Liberty SiriusXM Class C | 3,560,929 | 181,073 | |||
| Shares | Market Value• ($000) | |||||
| * | Las Vegas Sands Corp. | 4,742,918 | 178,523 | |||
| *,1 | Lucid Group Inc. | 4,652,473 | 177,027 | |||
| Rollins Inc. | 5,008,204 | 171,331 | ||||
| Interpublic Group of Cos. Inc. | 4,453,300 | 166,776 | ||||
| * | Discovery Inc. Class C | 7,070,762 | 161,920 | |||
| Vail Resorts Inc. | 457,351 | 149,965 | ||||
| * | American Airlines Group Inc. | 7,321,115 | 131,487 | |||
| Lear Corp. | 674,095 | 123,326 | ||||
| Fox Corp. Class B | 3,530,747 | 120,999 | ||||
| * | Endeavor Group Holdings Inc. Class A | 3,279,510 | 114,422 | |||
| *,1 | Chewy Inc. Class A | 1,927,987 | 113,693 | |||
| *,1 | GameStop Corp. Class A | 735,143 | 109,088 | |||
| 1 | Sirius XM Holdings Inc. | 15,620,296 | 99,189 | |||
| *,1 | QuantumScape Corp. Class A | 4,420,236 | 98,085 | |||
| Warner Music Group Corp. Class A | 2,226,790 | 96,153 | ||||
| * | Liberty Media Corp.-Liberty SiriusXM Class A | 1,708,308 | 86,867 | |||
| *,1 | Discovery Inc. Class A | 3,657,956 | 86,108 | |||
| Lennar Corp. Class B | 212,879 | 20,356 | ||||
| News Corp. Class B | 355,310 | 7,995 | ||||
| ViacomCBS Inc. Class A | 188,193 | 6,280 | ||||
| * | Lululemon Athletica Inc. | 393 | 154 | |||
| 24,148,896 | ||||||
| Consumer Staples (3.9%) | ||||||
| Corteva Inc. | 16,508,991 | 780,545 | ||||
| Kroger Co. | 15,121,732 | 684,410 | ||||
| Tyson Foods Inc. Class A | 6,662,411 | 580,696 | ||||
| Church & Dwight Co. Inc. | 5,521,242 | 565,927 | ||||
| McCormick & Co. Inc. (Non-Voting) | 5,638,837 | 544,768 | ||||
| Clorox Co. | 2,778,390 | 484,440 | ||||
| AmerisourceBergen Corp. | 3,294,673 | 437,829 | ||||
| McKesson Corp. | 1,726,429 | 429,138 | ||||
| Archer-Daniels-Midland Co. | 6,321,953 | 427,301 | ||||
| Kellogg Co. | 5,785,413 | 372,696 | ||||
| Conagra Brands Inc. | 10,840,495 | 370,203 | ||||
| J M Smucker Co. | 2,328,020 | 316,192 | ||||
| Hormel Foods Corp. | 5,684,596 | 277,465 | ||||
| Campbell Soup Co. | 3,440,691 | 149,532 | ||||
| Lamb Weston Holdings Inc. | 1,650,422 | 104,604 | ||||
| Shares | Market Value• ($000) | |||||
| Molson Coors Beverage Co. Class B | 2,041,396 | 94,619 | ||||
| * | Olaplex Holdings Inc. | 1,465,660 | 42,695 | |||
| 6,663,060 | ||||||
| Energy (4.4%) | ||||||
| Pioneer Natural Resources Co. | 4,967,347 | 903,461 | ||||
| Valero Energy Corp. | 9,242,030 | 694,169 | ||||
| Devon Energy Corp. | 15,296,451 | 673,809 | ||||
| ONEOK Inc. | 10,080,223 | 592,314 | ||||
| Occidental Petroleum Corp. | 20,056,235 | 581,430 | ||||
| Cheniere Energy Inc. | 5,159,179 | 523,244 | ||||
| * | Enphase Energy Inc. | 2,744,441 | 502,068 | |||
| Hess Corp. | 6,300,336 | 466,414 | ||||
| Baker Hughes Co. | 18,701,473 | 449,957 | ||||
| Marathon Petroleum Corp. | 6,957,018 | 445,180 | ||||
| Halliburton Co. | 19,229,474 | 439,778 | ||||
| * | Plug Power Inc. | 13,024,885 | 367,692 | |||
| Phillips 66 | 4,954,371 | 358,994 | ||||
| Williams Cos. Inc. | 13,078,385 | 340,561 | ||||
| 7,339,071 | ||||||
| Financials (11.1%) | ||||||
| MSCI Inc. | 1,770,672 | 1,084,873 | ||||
| * | SVB Financial Group | 1,326,710 | 899,828 | |||
| First Republic Bank | 4,048,042 | 835,961 | ||||
| Arthur J Gallagher & Co. | 4,685,734 | 795,029 | ||||
| Discover Financial Services | 6,625,607 | 765,655 | ||||
| Ameriprise Financial Inc. | 2,529,535 | 763,060 | ||||
| Fifth Third Bancorp | 15,456,911 | 673,149 | ||||
| Willis Towers Watson plc | 2,816,912 | 668,988 | ||||
| Nasdaq Inc. | 2,645,898 | 555,665 | ||||
| State Street Corp. | 5,940,834 | 552,498 | ||||
| American International Group Inc. | 9,384,237 | 533,588 | ||||
| Northern Trust Corp. | 4,459,173 | 533,362 | ||||
| Hartford Financial Services Group Inc. | 7,696,772 | 531,385 | ||||
| Huntington Bancshares Inc. | 32,695,272 | 504,161 | ||||
| KeyCorp | 21,045,259 | 486,777 | ||||
| Broadridge Financial Solutions Inc. | 2,636,313 | 481,971 | ||||
| Regions Financial Corp. | 21,546,363 | 469,711 | ||||
| Citizens Financial Group Inc. | 9,632,941 | 455,156 | ||||
| M&T Bank Corp. | 2,910,089 | 446,931 | ||||
| Principal Financial Group Inc. | 5,990,985 | 433,328 | ||||
| Raymond James Financial Inc. | 4,196,001 | 421,279 | ||||
| Shares | Market Value• ($000) | |||||
| FactSet Research Systems Inc. | 850,719 | 413,458 | ||||
| Cincinnati Financial Corp. | 3,461,796 | 394,402 | ||||
| * | Markel Corp. | 309,106 | 381,437 | |||
| Ally Financial Inc. | 7,829,726 | 372,773 | ||||
| * | Arch Capital Group Ltd. | 8,295,779 | 368,747 | |||
| Apollo Asset Management Inc. | 5,013,977 | 363,162 | ||||
| MarketAxess Holdings Inc. | 816,306 | 335,722 | ||||
| Fidelity National Financial Inc. | 6,107,953 | 318,713 | ||||
| Cboe Global Markets Inc. | 2,411,569 | 314,469 | ||||
| Equitable Holdings Inc. | 9,153,769 | 300,152 | ||||
| Loews Corp. | 4,876,672 | 281,677 | ||||
| Annaly Capital Management Inc. | 32,792,322 | 256,436 | ||||
| * | Athene Holding Ltd. Class A | 2,982,939 | 248,568 | |||
| W R Berkley Corp. | 2,995,863 | 246,829 | ||||
| Everest Re Group Ltd. | 890,334 | 243,880 | ||||
| Tradeweb Markets Inc. Class A | 2,377,426 | 238,075 | ||||
| Franklin Resources Inc. | 6,808,607 | 228,020 | ||||
| Interactive Brokers Group Inc. Class A | 1,998,120 | 158,691 | ||||
| Lincoln National Corp. | 1,937,727 | 132,269 | ||||
| * | Alleghany Corp. | 147,176 | 98,253 | |||
| Globe Life Inc. | 1,026,790 | 96,231 | ||||
| 1 | UWM Holdings Corp. Class A | 2,042,070 | 12,089 | |||
| 18,696,408 | ||||||
| Health Care (11.2%) | ||||||
| * | IQVIA Holdings Inc. | 4,318,786 | 1,218,502 | |||
| * | Dexcom Inc. | 2,191,008 | 1,176,462 | |||
| * | Centene Corp. | 13,190,736 | 1,086,917 | |||
| ResMed Inc. | 3,294,330 | 858,107 | ||||
| * | Veeva Systems Inc. Class A | 3,134,666 | 800,845 | |||
| West Pharmaceutical Services Inc. | 1,674,692 | 785,447 | ||||
| * | Laboratory Corp. of America Holdings | 2,163,384 | 679,757 | |||
| * | IDEXX Laboratories Inc. | 958,403 | 631,070 | |||
| Cerner Corp. | 6,650,849 | 617,664 | ||||
| PerkinElmer Inc. | 2,851,161 | 573,254 | ||||
| * | Horizon Therapeutics plc | 5,127,023 | 552,488 | |||
| STERIS plc | 2,260,880 | 550,321 | ||||
| * | Catalent Inc. | 3,869,237 | 495,378 | |||
| * | Avantor Inc. | 11,704,234 | 493,216 | |||
| Quest Diagnostics Inc. | 2,772,658 | 479,698 | ||||
| * | Seagen Inc. | 3,099,672 | 479,209 | |||
| Cooper Cos. Inc. | 1,114,377 | 466,857 | ||||
| Shares | Market Value• ($000) | |||||
| * | Alnylam Pharmaceuticals Inc. | 2,703,180 | 458,405 | |||
| * | Hologic Inc. | 5,682,439 | 435,048 | |||
| * | Insulet Corp. | 1,558,698 | 414,723 | |||
| Viatris Inc. | 27,349,719 | 370,042 | ||||
| * | BioMarin Pharmaceutical Inc. | 4,148,981 | 366,563 | |||
| * | Bio-Rad Laboratories Inc. Class A | 477,383 | 360,696 | |||
| * | ABIOMED Inc. | 976,718 | 350,808 | |||
| Teleflex Inc. | 1,058,593 | 347,727 | ||||
| Cardinal Health Inc. | 6,367,942 | 327,885 | ||||
| * | Incyte Corp. | 4,245,960 | 311,653 | |||
| * | Exact Sciences Corp. | 3,893,588 | 303,038 | |||
| Zimmer Biomet Holdings Inc. | 2,358,039 | 299,565 | ||||
| * | Teladoc Health Inc. | 3,255,557 | 298,925 | |||
| Royalty Pharma plc Class A | 7,279,208 | 290,076 | ||||
| * | Elanco Animal Health Inc. | 10,163,717 | 288,446 | |||
| * | 10X Genomics Inc. Class A | 1,862,317 | 277,411 | |||
| DENTSPLY SIRONA Inc. | 4,943,669 | 275,807 | ||||
| * | Henry Schein Inc. | 3,136,077 | 243,140 | |||
| * | Charles River Laboratories International Inc. | 570,609 | 214,994 | |||
| Universal Health Services Inc. Class B | 1,569,077 | 203,447 | ||||
| * | DaVita Inc. | 1,382,664 | 157,292 | |||
| * | agilon health Inc. | 4,002,059 | 108,056 | |||
| * | Novocure Ltd. | 997,801 | 74,915 | |||
| *,1 | GoodRx Holdings Inc. Class A | 1,642,113 | 53,664 | |||
| * | Oak Street Health Inc. | 1,227,976 | 40,695 | |||
| *,1 | Ginkgo Bioworks Holdings Inc. | 4,025,211 | 33,450 | |||
| 18,851,663 | ||||||
| Industrials (15.5%) | ||||||
| IHS Markit Ltd. | 8,117,334 | 1,078,956 | ||||
| Carrier Global Corp. | 19,591,298 | 1,062,632 | ||||
| * | Mettler-Toledo International Inc. | 519,638 | 881,935 | |||
| Cintas Corp. | 1,987,694 | 880,886 | ||||
| * | Keysight Technologies Inc. | 4,112,343 | 849,240 | |||
| Old Dominion Freight Line Inc. | 2,339,798 | 838,537 | ||||
| Verisk Analytics Inc. | 3,644,482 | 833,602 | ||||
| Equifax Inc. | 2,758,890 | 807,775 | ||||
| AMETEK Inc. | 5,229,377 | 768,928 | ||||
| * | TransDigm Group Inc. | 1,186,499 | 754,946 | |||
| * | Zebra Technologies Corp. Class A | 1,208,091 | 719,056 | |||
| Shares | Market Value• ($000) | |||||
| Ball Corp. | 7,321,857 | 704,875 | ||||
| PACCAR Inc. | 7,060,511 | 623,161 | ||||
| Vulcan Materials Co. | 2,999,265 | 622,588 | ||||
| Martin Marietta Materials Inc. | 1,409,819 | 621,054 | ||||
| Dover Corp. | 3,256,059 | 591,300 | ||||
| Fortive Corp. | 7,703,355 | 587,689 | ||||
| Synchrony Financial | 12,370,971 | 573,889 | ||||
| Ingersoll Rand Inc. | 9,216,797 | 570,243 | ||||
| * | Bill.com Holdings Inc. | 2,201,281 | 548,449 | |||
| * | United Rentals Inc. | 1,636,382 | 543,753 | |||
| Expeditors International of Washington Inc. | 3,830,821 | 514,441 | ||||
| * | Waters Corp. | 1,379,617 | 514,045 | |||
| TransUnion | 4,332,784 | 513,782 | ||||
| WW Grainger Inc. | 990,298 | 513,212 | ||||
| * | Generac Holdings Inc. | 1,426,007 | 501,840 | |||
| * | Trimble Inc. | 5,673,500 | 494,673 | |||
| Xylem Inc. | 4,077,827 | 489,013 | ||||
| * | Teledyne Technologies Inc. | 1,055,044 | 460,938 | |||
| Rockwell Automation Inc. | 1,311,354 | 457,466 | ||||
| Otis Worldwide Corp. | 4,802,767 | 418,177 | ||||
| Jacobs Engineering Group Inc. | 2,916,089 | 406,007 | ||||
| * | Affirm Holdings Inc. Class A | 3,999,305 | 402,170 | |||
| * | FleetCor Technologies Inc. | 1,743,511 | 390,268 | |||
| JB Hunt Transport Services Inc. | 1,898,613 | 388,077 | ||||
| Masco Corp. | 5,520,027 | 387,616 | ||||
| Textron Inc. | 4,981,634 | 384,582 | ||||
| Westinghouse Air Brake Technologies Corp. | 4,013,788 | 369,710 | ||||
| Stanley Black & Decker Inc. | 1,840,209 | 347,100 | ||||
| Fortune Brands Home & Security Inc. | 3,069,714 | 328,152 | ||||
| Crown Holdings Inc. | 2,889,433 | 319,629 | ||||
| CH Robinson Worldwide Inc. | 2,939,602 | 316,389 | ||||
| Packaging Corp. of America | 2,148,136 | 292,469 | ||||
| Westrock Co. | 5,993,001 | 265,850 | ||||
| Snap-on Inc. | 1,214,946 | 261,675 | ||||
| HEICO Corp. Class A | 1,654,546 | 212,642 | ||||
| Cognex Corp. | 1,899,153 | 147,678 | ||||
| Jack Henry & Associates Inc. | 837,184 | 139,801 | ||||
| HEICO Corp. | 917,348 | 132,300 | ||||
| Hubbell Inc. Class B | 615,213 | 128,130 | ||||
| * | Mohawk Industries Inc. | 612,760 | 111,633 | |||
| Western Union Co. | 4,539,507 | 80,985 | ||||
| Shares | Market Value• ($000) | |||||
| * | Marqeta Inc. Class A | 1,577,018 | 27,077 | |||
| *,1 | Aurora Innovation Inc. | 2,176,910 | 24,512 | |||
| 26,205,533 | ||||||
| Real Estate (9.5%) | ||||||
| Digital Realty Trust Inc. | 6,415,143 | 1,134,646 | ||||
| SBA Communications Corp. | 2,459,220 | 956,686 | ||||
| Realty Income Corp. | 12,789,215 | 915,580 | ||||
| Welltower Inc. | 9,839,505 | 843,934 | ||||
| AvalonBay Communities Inc. | 3,158,749 | 797,868 | ||||
| Alexandria Real Estate Equities Inc. | 3,502,865 | 780,999 | ||||
| * | CBRE Group Inc. Class A | 7,186,556 | 779,813 | |||
| Equity Residential | 8,053,543 | 728,846 | ||||
| * | CoStar Group Inc. | 8,927,871 | 705,570 | |||
| Weyerhaeuser Co. | 16,931,885 | 697,255 | ||||
| Extra Space Storage Inc. | 3,026,651 | 686,233 | ||||
| Invitation Homes Inc. | 13,489,070 | 611,594 | ||||
| Mid-America Apartment Communities Inc. | 2,603,692 | 597,391 | ||||
| Simon Property Group Inc. | 3,713,989 | 593,384 | ||||
| Sun Communities Inc. | 2,700,302 | 566,982 | ||||
| Duke Realty Corp. | 8,612,563 | 565,329 | ||||
| Essex Property Trust Inc. | 1,471,876 | 518,439 | ||||
| Ventas Inc. | 9,021,721 | 461,190 | ||||
| Healthpeak Properties Inc. | 12,182,721 | 439,674 | ||||
| UDR Inc. | 6,991,443 | 419,417 | ||||
| Camden Property Trust | 2,310,942 | 412,919 | ||||
| Boston Properties Inc. | 3,177,060 | 365,934 | ||||
| WP Carey Inc. | 4,209,626 | 345,400 | ||||
| Iron Mountain Inc. | 6,543,038 | 342,397 | ||||
| * | Zillow Group Inc. Class C | 3,807,487 | 243,108 | |||
| * | Opendoor Technologies Inc. | 10,391,168 | 151,815 | |||
| Regency Centers Corp. | 1,935,949 | 145,874 | ||||
| * | Host Hotels & Resorts Inc. | 8,073,838 | 140,404 | |||
| * | Zillow Group Inc. Class A | 970,263 | 60,370 | |||
| 16,009,051 | ||||||
| Technology (18.6%) | ||||||
| * | Synopsys Inc. | 3,447,445 | 1,270,382 | |||
| Xilinx Inc. | 5,603,506 | 1,188,111 | ||||
| Amphenol Corp. Class A | 13,520,194 | 1,182,476 | ||||
| * | Cadence Design Systems Inc. | 6,264,993 | 1,167,481 | |||
| * | Palo Alto Networks Inc. | 2,084,983 | 1,160,835 | |||
| Shares | Market Value• ($000) | |||||
| * | Fortinet Inc. | 3,141,668 | 1,129,115 | |||
| Microchip Technology Inc. | 12,544,019 | 1,092,082 | ||||
| * | Datadog Inc. Class A | 5,523,383 | 983,770 | |||
| Marvell Technology Inc. | 9,309,360 | 814,476 | ||||
| * | EPAM Systems Inc. | 1,218,084 | 814,228 | |||
| * | Match Group Inc. | 6,079,477 | 804,011 | |||
| * | ANSYS Inc. | 1,972,506 | 791,212 | |||
| * | MongoDB Inc. | 1,421,190 | 752,307 | |||
| * | Okta Inc. | 3,336,897 | 748,032 | |||
| * | Cloudflare Inc. Class A | 5,571,971 | 732,714 | |||
| * | HubSpot Inc. | 1,014,719 | 668,852 | |||
| * | ON Semiconductor Corp. | 9,734,418 | 661,162 | |||
| Corning Inc. | 17,362,225 | 646,396 | ||||
| CDW Corp. | 3,068,066 | 628,279 | ||||
| * | Zscaler Inc. | 1,899,165 | 610,259 | |||
| Teradyne Inc. | 3,684,716 | 602,562 | ||||
| * | Gartner Inc. | 1,766,061 | 590,430 | |||
| Skyworks Solutions Inc. | 3,738,403 | 579,976 | ||||
| * | Unity Software Inc. | 3,878,328 | 554,562 | |||
| * | VeriSign Inc. | 2,135,150 | 541,944 | |||
| Seagate Technology Holdings plc | 4,780,467 | 540,097 | ||||
| * | Tyler Technologies Inc. | 926,154 | 498,225 | |||
| Monolithic Power Systems Inc. | 989,702 | 488,250 | ||||
| * | Paycom Software Inc. | 1,153,205 | 478,799 | |||
| *,1 | AppLovin Corp. Class A | 5,000,260 | 471,324 | |||
| Hewlett Packard Enterprise Co. | 29,564,381 | 466,230 | ||||
| NetApp Inc. | 5,054,437 | 464,958 | ||||
| * | Western Digital Corp. | 7,042,364 | 459,233 | |||
| * | Pinterest Inc. Class A | 12,506,791 | 454,622 | |||
| * | Akamai Technologies Inc. | 3,674,346 | 430,045 | |||
| * | Splunk Inc. | 3,651,127 | 422,508 | |||
| SS&C Technologies Holdings Inc. | 4,887,677 | 400,692 | ||||
| * | Qorvo Inc. | 2,490,996 | 389,567 | |||
| * | Twitter Inc. | 8,583,514 | 370,979 | |||
| * | ZoomInfo Technologies Inc. Class A | 5,468,727 | 351,092 | |||
| * | Palantir Technologies Inc. Class A | 19,131,347 | 348,382 | |||
| * | RingCentral Inc. Class A | 1,855,587 | 347,644 | |||
| NortonLifeLock Inc. | 12,498,183 | 324,703 | ||||
| * | GoDaddy Inc. Class A | 3,758,732 | 318,966 | |||
| * | DocuSign Inc. | 2,057,432 | 313,367 | |||
| * | Black Knight Inc. | 3,336,595 | 276,570 | |||
| Citrix Systems Inc. | 2,820,435 | 266,785 | ||||
| * | Coupa Software Inc. | 1,673,247 | 264,457 | |||
| * | UiPath Inc. Class A | 5,848,065 | 252,227 | |||
| Shares | Market Value• ($000) | |||||
| * | IAC/InterActiveCorp | 1,799,846 | 235,258 | |||
| Bentley Systems Inc. Class B | 4,591,968 | 221,930 | ||||
| * | F5 Inc. | 692,287 | 169,410 | |||
| * | Dropbox Inc. Class A | 6,657,980 | 163,387 | |||
| * | Zendesk Inc. | 1,366,870 | 142,551 | |||
| Leidos Holdings Inc. | 1,586,805 | 141,067 | ||||
| * | IPG Photonics Corp. | 391,038 | 67,313 | |||
| * | Qualtrics International Inc. Class A | 1,223,018 | 43,295 | |||
| * | Bumble Inc. Class A | 951,596 | 32,221 | |||
| *,1 | HashiCorp Inc. Class A | 346,116 | 31,510 | |||
| *,1 | Gitlab Inc. Class A | 241,746 | 21,032 | |||
| *,1 | Toast Inc. Class A | 500,213 | 17,362 | |||
| KLA Corp. | 172 | 74 | ||||
| 31,401,786 | ||||||
| Telecommunications (2.2%) | ||||||
| Motorola Solutions Inc. | 3,817,557 | 1,037,230 | ||||
| * | Arista Networks Inc. | 5,209,295 | 748,836 | |||
| * | Roku Inc. | 2,659,541 | 606,907 | |||
| * | Liberty Broadband Corp. Class C | 3,147,910 | 507,128 | |||
| Lumen Technologies Inc. | 23,157,898 | 290,632 | ||||
| * | DISH Network Corp. Class A | 5,581,868 | 181,076 | |||
| Juniper Networks Inc. | 3,676,763 | 131,297 | ||||
| * | Liberty Broadband Corp. Class A | 562,742 | 90,545 | |||
| * | Altice USA Inc. Class A | 2,436,993 | 39,431 | |||
| 3,633,082 | ||||||
| Utilities (5.7%) | ||||||
| Waste Connections Inc. | 5,822,477 | 793,429 | ||||
| American Water Works Co. Inc. | 4,103,542 | 774,995 | ||||
| Eversource Energy | 7,771,821 | 707,080 | ||||
| WEC Energy Group Inc. | 7,129,701 | 692,080 | ||||
| Edison International | 8,591,117 | 586,344 | ||||
| * | PG&E Corp. | 44,538,013 | 540,692 | |||
| Consolidated Edison Inc. | 6,285,694 | 536,295 | ||||
| Ameren Corp. | 5,757,786 | 512,501 | ||||
| FirstEnergy Corp. | 12,305,571 | 511,789 | ||||
| Entergy Corp. | 4,542,709 | 511,736 | ||||
| PPL Corp. | 16,966,085 | 510,001 | ||||
| DTE Energy Co. | 3,941,243 | 471,136 | ||||
| CMS Energy Corp. | 6,547,077 | 425,887 | ||||
| CenterPoint Energy Inc. | 14,211,826 | 396,652 | ||||
| Evergy Inc. | 5,133,266 | 352,193 | ||||
| AES Corp. | 14,323,078 | 348,051 | ||||
| Alliant Energy Corp. | 5,661,600 | 348,019 | ||||
| Vistra Corp. | 10,913,892 | 248,509 | ||||
| Shares | Market Value• ($000) | |||||
| NiSource Inc. | 8,871,780 | 244,950 | ||||
| Avangrid Inc. | 1,751,390 | 87,359 | ||||
| 9,599,698 | ||||||
| Total Common Stocks (Cost $98,190,559) | 168,277,765 | |||||
| Temporary Cash Investments (0.8%) | ||||||
| Money Market Fund (0.8%) | ||||||
| 2,3 | Vanguard Market Liquidity Fund, 0.090% (Cost $1,432,125) | 14,323,766 | 1,432,233 | |||
| Total Investments (100.6%) (Cost $99,622,684) | 169,709,998 | |||||
| Other Assets and Liabilities—Net (-0.6%) | (1,043,690) | |||||
| Net Assets (100%) | 168,666,308 | |||||
| Cost is in $000. | |
| • | See Note A in Notes to Financial Statements. |
| * | Non-income-producing security. |
| 1 | Includes partial security positions on loan to broker-dealers. The total value of securities on loan is $887,135,000. |
| 2 | Affiliated money market fund available only to Vanguard funds and certain trusts and accounts managed by Vanguard. Rate shown is the 7-day yield. |
| 3 | Collateral of $955,913,000 was received for securities on loan. |
| Futures Contracts | ||||
| ($000) | ||||
| Expiration | Number of Long (Short) Contracts | Notional Amount | Value and Unrealized Appreciation (Depreciation) | |
| Long Futures Contracts | ||||
| E-mini Russell 2000 Index | March 2022 | 1 | 112 | 1 |
| E-mini S&P 500 Index | March 2022 | 1 | 238 | (1) |
| E-mini S&P Mid-Cap 400 Index | March 2022 | 1 | 284 | 7 |
| 7 | ||||
| Over-the-Counter Total Return Swaps | ||||||
| Reference Entity | Termination Date | Counterparty | Notional Amount ($000) | Floating Interest Rate Received (Paid) (%) | Value and Unrealized Appreciation ($000) | Value and Unrealized (Depreciation) ($000) |
| Ameren Corp. | 1/31/22 | GSI | 1,326 | (0.109)1 | 17 | — |
| Campbell Soup Co. | 1/31/22 | GSI | 43,490 | (0.109)1 | — | (32) |
| Consolidated Edison Inc. | 8/31/22 | BOANA | 132,764 | (0.578)2 | 14,397 | — |
| DocuSign Inc. | 8/31/22 | BOANA | 13,303 | (0.068)2 | — | (5,080) |
| DraftKings Inc. Class A | 8/31/22 | BOANA | 4,457 | (0.069)2 | — | (914) |
| Hormel Foods Corp. | 1/31/22 | GSI | 21,866 | (0.109)1 | 98 | — |
| Palantir Technologies Inc. Class A | 8/31/22 | BOANA | 5,534 | (0.070)2 | — | (654) |
| Palo Alto Networks Inc. | 8/31/22 | BOANA | 18,596 | (0.071)2 | 333 | — |
| Pinterest Inc. Class A | 8/31/22 | BOANA | 8,292 | (0.070)2 | — | (768) |
| Sirius XM Holdings Inc. | 1/31/22 | GSI | 15,791 | (0.109)1 | — | (75) |
| State Street Corp. | 8/31/23 | BOANA | 169,043 | (0.675)2 | 8,648 | — |
| Williams Cos. Inc. | 8/31/22 | BOANA | 17,681 | (0.470)2 | — | (231) |
| 23,493 | (7,754) | |||||
| 1 | Based on 1M USD London Interbank Offered Rate (LIBOR) as of the most recent payment date. Floating interest payment received/paid monthly. |
| 2 | Based on USD Overnight Bank Funding Rate as of the most recent payment date. Floating interest payment received/paid monthly. |
| 1M—1-month. | |
| BOANA—Bank of America, N.A. | |
| GSI—Goldman Sachs International. |
| ($000s, except shares and per-share amounts) | Amount |
| Assets | |
| Investments in Securities, at Value | |
| Unaffiliated Issuers (Cost $98,190,559) | 168,277,765 |
| Affiliated Issuers (Cost $1,432,125) | 1,432,233 |
| Total Investments in Securities | 169,709,998 |
| Investment in Vanguard | 5,344 |
| Cash | 2,486 |
| Cash Collateral Pledged—Futures Contracts | 11,555 |
| Cash Collateral Pledged—Over-the-Counter Swap Contracts | 130 |
| Receivables for Investment Securities Sold | 126,181 |
| Receivables for Accrued Income | 173,280 |
| Receivables for Capital Shares Issued | 140,724 |
| Unrealized Appreciation—Over-the-Counter Swap Contracts | 23,493 |
| Total Assets | 170,193,191 |
| Liabilities | |
| Payables for Investment Securities Purchased | 269,555 |
| Collateral for Securities on Loan | 955,913 |
| Payables for Capital Shares Redeemed | 290,146 |
| Payables to Vanguard | 3,171 |
| Variation Margin Payable—Futures Contracts | 344 |
| Unrealized Depreciation—Over-the-Counter Swap Contracts | 7,754 |
| Total Liabilities | 1,526,883 |
| Net Assets | 168,666,308 |
| Statement of Assets and Liabilities (continued) | |
| At December 31, 2021, net assets consisted of: | |
| ($000s, except shares and per-share amounts) | Amount |
| Paid-in Capital | 106,477,465 |
| Total Distributable Earnings (Loss) | 62,188,843 |
| Net Assets | 168,666,308 |
| Investor Shares—Net Assets | |
| Applicable to 10,635,125 outstanding $.001 par value shares of beneficial interest (unlimited authorization) | 739,606 |
| Net Asset Value Per Share—Investor Shares | $69.54 |
| ETF Shares—Net Assets | |
| Applicable to 226,838,688 outstanding $.001 par value shares of beneficial interest (unlimited authorization) | 57,774,032 |
| Net Asset Value Per Share—ETF Shares | $254.69 |
| Admiral Shares—Net Assets | |
| Applicable to 206,423,744 outstanding $.001 par value shares of beneficial interest (unlimited authorization) | 65,117,768 |
| Net Asset Value Per Share—Admiral Shares | $315.46 |
| Institutional Shares—Net Assets | |
| Applicable to 391,928,835 outstanding $.001 par value shares of beneficial interest (unlimited authorization) | 27,312,032 |
| Net Asset Value Per Share—Institutional Shares | $69.69 |
| Institutional Plus Shares—Net Assets | |
| Applicable to 51,568,130 outstanding $.001 par value shares of beneficial interest (unlimited authorization) | 17,722,870 |
| Net Asset Value Per Share—Institutional Plus Shares | $343.68 |
| Year Ended December 31, 2021 | |
| ($000) | |
| Investment Income | |
| Income | |
| Dividends1 | 1,821,083 |
| Interest2 | 591 |
| Securities Lending—Net | 8,809 |
| Total Income | 1,830,483 |
| Expenses | |
| The Vanguard Group—Note B | |
| Investment Advisory Services | 4,391 |
| Management and Administrative—Investor Shares | 1,359 |
| Management and Administrative—ETF Shares | 15,226 |
| Management and Administrative—Admiral Shares | 25,681 |
| Management and Administrative—Institutional Shares | 8,340 |
| Management and Administrative—Institutional Plus Shares | 4,151 |
| Marketing and Distribution—Investor Shares | 44 |
| Marketing and Distribution—ETF Shares | 2,103 |
| Marketing and Distribution—Admiral Shares | 2,058 |
| Marketing and Distribution—Institutional Shares | 672 |
| Marketing and Distribution—Institutional Plus Shares | 210 |
| Custodian Fees | 205 |
| Auditing Fees | 37 |
| Shareholders’ Reports—Investor Shares | 3 |
| Shareholders’ Reports—ETF Shares | 1,121 |
| Shareholders’ Reports—Admiral Shares | 664 |
| Shareholders’ Reports—Institutional Shares | 251 |
| Shareholders’ Reports—Institutional Plus Shares | 102 |
| Trustees’ Fees and Expenses | 46 |
| Total Expenses | 66,664 |
| Net Investment Income | 1,763,819 |
| Realized Net Gain (Loss) | |
| Investment Securities Sold2,3 | 12,506,814 |
| Futures Contracts | 93,292 |
| Swap Contracts | 82,844 |
| Realized Net Gain (Loss) | 12,682,950 |
| Statement of Operations (continued) | |
| Year Ended December 31, 2021 | |
| ($000) | |
| Change in Unrealized Appreciation (Depreciation) | |
| Investment Securities2 | 18,195,558 |
| Futures Contracts | (5,181) |
| Swap Contracts | 593 |
| Change in Unrealized Appreciation (Depreciation) | 18,190,970 |
| Net Increase (Decrease) in Net Assets Resulting from Operations | 32,637,739 |
| 1 | Dividends are net of foreign withholding taxes of $749,000. |
| 2 | Interest income, realized net gain (loss), capital gain distributions received, and change in unrealized appreciation (depreciation) from an affiliated company of the fund were $590,000, $50,000, $15,000, and ($208,000), respectively. Purchases and sales are for temporary cash investment purposes. |
| 3 | Includes $11,587,194,000 of net gain (loss) resulting from in-kind redemptions. |
| Year Ended December 31, | ||
| 2021 ($000) | 2020 ($000) | |
| Increase (Decrease) in Net Assets | ||
| Operations | ||
| Net Investment Income | 1,763,819 | 1,785,629 |
| Realized Net Gain (Loss) | 12,682,950 | 1,159,065 |
| Change in Unrealized Appreciation (Depreciation) | 18,190,970 | 18,100,382 |
| Net Increase (Decrease) in Net Assets Resulting from Operations | 32,637,739 | 21,045,076 |
| Distributions | ||
| Investor Shares | (9,018) | (12,175) |
| ETF Shares | (617,083) | (572,413) |
| Admiral Shares | (728,126) | (778,637) |
| Institutional Shares | (304,735) | (329,676) |
| Institutional Plus Shares | (201,610) | (231,416) |
| Total Distributions | (1,860,572) | (1,924,317) |
| Capital Share Transactions | ||
| Investor Shares | (268,407) | (154,201) |
| ETF Shares | 6,295,046 | 5,989,817 |
| Admiral Shares | (452,497) | (1,686,781) |
| Institutional Shares | (72,833) | (1,236,767) |
| Institutional Plus Shares | (563,005) | (649,316) |
| Net Increase (Decrease) from Capital Share Transactions | 4,938,304 | 2,262,752 |
| Total Increase (Decrease) | 35,715,471 | 21,383,511 |
| Net Assets | ||
| Beginning of Period | 132,950,837 | 111,567,326 |
| End of Period | 168,666,308 | 132,950,837 |
| Investor Shares | |||||
| For a Share Outstanding Throughout Each Period | Year Ended December 31, | ||||
| 2021 | 2020 | 2019 | 2018 | 2017 | |
| Net Asset Value, Beginning of Period | $56.52 | $48.64 | $37.71 | $42.23 | $35.92 |
| Investment Operations | |||||
| Net Investment Income1 | .652 | .698 | .577 | .640 | .520 |
| Net Realized and Unrealized Gain (Loss) on Investments | 13.065 | 7.937 | 11.018 | (4.528) | 6.313 |
| Total from Investment Operations | 13.717 | 8.635 | 11.595 | (3.888) | 6.833 |
| Distributions | |||||
| Dividends from Net Investment Income | (.697) | (.755) | (.665) | (.632) | (.523) |
| Distributions from Realized Capital Gains | — | — | — | — | — |
| Total Distributions | (.697) | (.755) | (.665) | (.632) | (.523) |
| Net Asset Value, End of Period | $69.54 | $56.52 | $48.64 | $37.71 | $42.23 |
| Total Return2 | 24.36% | 18.10% | 30.86% | -9.34% | 19.12% |
| Ratios/Supplemental Data | |||||
| Net Assets, End of Period (Millions) | $740 | $834 | $877 | $3,043 | $4,047 |
| Ratio of Total Expenses to Average Net Assets | 0.17% | 0.17% | 0.17% | 0.17% | 0.17% |
| Ratio of Net Investment Income to Average Net Assets | 1.02% | 1.49% | 1.31% | 1.49% | 1.34% |
| Portfolio Turnover Rate3 | 16% | 26% | 15% | 16% | 14% |
| 1 | Calculated based on average shares outstanding. |
| 2 | Total returns do not include account service fees that may have applied in the periods shown. Fund prospectuses provide information about any applicable account service fees. |
| 3 | Excludes the value of portfolio securities received or delivered as a result of in-kind purchases or redemptions of the fund’s capital shares, including ETF Creation Units. |
| ETF Shares | |||||
| For a Share Outstanding Throughout Each Period | Year Ended December 31, | ||||
| 2021 | 2020 | 2019 | 2018 | 2017 | |
| Net Asset Value, Beginning of Period | $207.00 | $178.14 | $138.08 | $154.65 | $131.55 |
| Investment Operations | |||||
| Net Investment Income1 | 2.741 | 2.772 | 2.663 | 2.535 | 2.112 |
| Net Realized and Unrealized Gain (Loss) on Investments | 47.811 | 29.084 | 40.043 | (16.584) | 23.076 |
| Total from Investment Operations | 50.552 | 31.856 | 42.706 | (14.049) | 25.188 |
| Distributions | |||||
| Dividends from Net Investment Income | (2.862) | (2.996) | (2.646) | (2.521) | (2.088) |
| Distributions from Realized Capital Gains | — | — | — | — | — |
| Total Distributions | (2.862) | (2.996) | (2.646) | (2.521) | (2.088) |
| Net Asset Value, End of Period | $254.69 | $207.00 | $178.14 | $138.08 | $154.65 |
| Total Return | 24.52% | 18.22% | 31.04% | -9.21% | 19.25% |
| Ratios/Supplemental Data | |||||
| Net Assets, End of Period (Millions) | $57,774 | $41,587 | $29,014 | $21,261 | $21,937 |
| Ratio of Total Expenses to Average Net Assets | 0.04% | 0.04% | 0.04% | 0.04% | 0.05% |
| Ratio of Net Investment Income to Average Net Assets | 1.16% | 1.61% | 1.62% | 1.62% | 1.46% |
| Portfolio Turnover Rate2 | 16% | 26% | 15% | 16% | 14% |
| 1 | Calculated based on average shares outstanding. |
| 2 | Excludes the value of portfolio securities received or delivered as a result of in-kind purchases or redemptions of the fund’s capital shares, including ETF Creation Units. |
| Admiral Shares | |||||
| For a Share Outstanding Throughout Each Period | Year Ended December 31, | ||||
| 2021 | 2020 | 2019 | 2018 | 2017 | |
| Net Asset Value, Beginning of Period | $256.40 | $220.66 | $171.04 | $191.55 | $162.94 |
| Investment Operations | |||||
| Net Investment Income1 | 3.333 | 3.418 | 3.296 | 3.135 | 2.606 |
| Net Realized and Unrealized Gain (Loss) on Investments | 59.242 | 36.010 | 49.578 | (20.539) | 28.591 |
| Total from Investment Operations | 62.575 | 39.428 | 52.874 | (17.404) | 31.197 |
| Distributions | |||||
| Dividends from Net Investment Income | (3.515) | (3.688) | (3.254) | (3.106) | (2.587) |
| Distributions from Realized Capital Gains | — | — | — | — | — |
| Total Distributions | (3.515) | (3.688) | (3.254) | (3.106) | (2.587) |
| Net Asset Value, End of Period | $315.46 | $256.40 | $220.66 | $171.04 | $191.55 |
| Total Return2 | 24.51% | 18.24% | 31.03% | -9.23% | 19.25% |
| Ratios/Supplemental Data | |||||
| Net Assets, End of Period (Millions) | $65,118 | $53,301 | $47,640 | $34,754 | $37,778 |
| Ratio of Total Expenses to Average Net Assets | 0.05% | 0.05% | 0.05% | 0.05% | 0.05% |
| Ratio of Net Investment Income to Average Net Assets | 1.14% | 1.61% | 1.62% | 1.61% | 1.46% |
| Portfolio Turnover Rate3 | 16% | 26% | 15% | 16% | 14% |
| 1 | Calculated based on average shares outstanding. |
| 2 | Total returns do not include account service fees that may have applied in the periods shown. Fund prospectuses provide information about any applicable account service fees. |
| 3 | Excludes the value of portfolio securities received or delivered as a result of in-kind purchases or redemptions of the fund’s capital shares, including ETF Creation Units. |
| Institutional Shares | |||||
| For a Share Outstanding Throughout Each Period | Year Ended December 31, | ||||
| 2021 | 2020 | 2019 | 2018 | 2017 | |
| Net Asset Value, Beginning of Period | $56.64 | $48.74 | $37.78 | $42.32 | $35.99 |
| Investment Operations | |||||
| Net Investment Income1 | .743 | .759 | .727 | .697 | .580 |
| Net Realized and Unrealized Gain (Loss) on Investments | 13.090 | 7.961 | 10.957 | (4.547) | 6.325 |
| Total from Investment Operations | 13.833 | 8.720 | 11.684 | (3.850) | 6.905 |
| Distributions | |||||
| Dividends from Net Investment Income | (.783) | (.820) | (.724) | (.690) | (.575) |
| Distributions from Realized Capital Gains | — | — | — | — | — |
| Total Distributions | (.783) | (.820) | (.724) | (.690) | (.575) |
| Net Asset Value, End of Period | $69.69 | $56.64 | $48.74 | $37.78 | $42.32 |
| Total Return | 24.53% | 18.26% | 31.04% | -9.24% | 19.29% |
| Ratios/Supplemental Data | |||||
| Net Assets, End of Period (Millions) | $27,312 | $22,291 | $20,425 | $16,524 | $18,222 |
| Ratio of Total Expenses to Average Net Assets | 0.04% | 0.04% | 0.04% | 0.04% | 0.04% |
| Ratio of Net Investment Income to Average Net Assets | 1.15% | 1.62% | 1.62% | 1.62% | 1.47% |
| Portfolio Turnover Rate2 | 16% | 26% | 15% | 16% | 14% |
| 1 | Calculated based on average shares outstanding. |
| 2 | Excludes the value of portfolio securities received or delivered as a result of in-kind purchases or redemptions of the fund’s capital shares, including ETF Creation Units. |
| Institutional Plus Shares | |||||
| For a Share Outstanding Throughout Each Period | Year Ended December 31, | ||||
| 2021 | 2020 | 2019 | 2018 | 2017 | |
| Net Asset Value, Beginning of Period | $279.34 | $240.40 | $186.34 | $208.69 | $177.51 |
| Investment Operations | |||||
| Net Investment Income1 | 3.688 | 3.774 | 3.598 | 3.464 | 2.856 |
| Net Realized and Unrealized Gain (Loss) on Investments | 64.544 | 39.230 | 54.052 | (22.388) | 31.179 |
| Total from Investment Operations | 68.232 | 43.004 | 57.650 | (18.924) | 34.035 |
| Distributions | |||||
| Dividends from Net Investment Income | (3.892) | (4.064) | (3.590) | (3.426) | (2.855) |
| Distributions from Realized Capital Gains | — | — | — | — | — |
| Total Distributions | (3.892) | (4.064) | (3.590) | (3.426) | (2.855) |
| Net Asset Value, End of Period | $343.68 | $279.34 | $240.40 | $186.34 | $208.69 |
| Total Return | 24.53% | 18.27% | 31.06% | -9.21% | 19.28% |
| Ratios/Supplemental Data | |||||
| Net Assets, End of Period (Millions) | $17,723 | $14,937 | $13,612 | $11,426 | $12,749 |
| Ratio of Total Expenses to Average Net Assets | 0.03% | 0.03% | 0.03% | 0.03% | 0.03% |
| Ratio of Net Investment Income to Average Net Assets | 1.16% | 1.63% | 1.62% | 1.63% | 1.48% |
| Portfolio Turnover Rate2 | 16% | 26% | 15% | 16% | 14% |
| 1 | Calculated based on average shares outstanding. |
| 2 | Excludes the value of portfolio securities received or delivered as a result of in-kind purchases or redemptions of the fund’s capital shares, including ETF Creation Units. |
| A. | The following significant accounting policies conform to generally accepted accounting principles for U.S. investment companies. The fund consistently follows such policies in preparing its financial statements. |
| B. | In accordance with the terms of a Funds’ Service Agreement (the “FSA”) between Vanguard and the fund, Vanguard furnishes to the fund investment advisory, corporate management, administrative, marketing, and distribution services at Vanguard’s cost of operations (as defined by the FSA). These costs of operations are allocated to the fund based on methods and guidelines approved by the board of trustees and are generally settled twice a month. |
| C. | Various inputs may be used to determine the value of the fund’s investments and derivatives. These inputs are summarized in three broad levels for financial statement purposes. The inputs or methodologies used to value securities are not necessarily an indication of the risk associated with investing in those securities. |
| Level 1 ($000) | Level 2 ($000) | Level 3 ($000) | Total ($000) | |
| Investments | ||||
| Assets | ||||
| Common Stocks | 168,277,765 | — | — | 168,277,765 |
| Temporary Cash Investments | 1,432,233 | — | — | 1,432,233 |
| Total | 169,709,998 | — | — | 169,709,998 |
| Derivative Financial Instruments | ||||
| Assets | ||||
| Futures Contracts1 | 8 | — | — | 8 |
| Swap Contracts | — | 23,493 | — | 23,493 |
| Total | 8 | 23,493 | — | 23,501 |
| Liabilities | ||||
| Futures Contracts1 | 1 | — | — | 1 |
| Swap Contracts | — | 7,754 | — | 7,754 |
| Total | 1 | 7,754 | — | 7,755 |
| 1 | Includes cumulative appreciation (depreciation) on futures contracts and centrally cleared swaps, if any, as reported in the Schedule of Investments. Only current day’s variation margin is reported within the Statement of Assets and Liabilities. |
| D. | Permanent differences between book-basis and tax-basis components of net assets are reclassified among capital accounts in the financial statements to reflect their tax character. These reclassifications have no effect on net assets or net asset value per share. As of period end, permanent differences primarily attributable to the accounting for in-kind redemptions, passive foreign investment companies, and swap agreements were reclassified between the following accounts: |
| Amount ($000) | |
| Paid-in Capital | 11,583,957 |
| Total Distributable Earnings (Loss) | (11,583,957) |
| Amount ($000) | |
| Undistributed Ordinary Income | 48,392 |
| Undistributed Long-Term Gains | — |
| Capital Loss Carryforwards | (7,894,431) |
| Qualified Late-Year Losses | — |
| Net Unrealized Gains (Losses) | 70,034,882 |
| Year Ended December 31, | ||
| 2021 Amount ($000) | 2020 Amount ($000) | |
| Ordinary Income* | 1,860,572 | 1,924,317 |
| Long-Term Capital Gains | — | — |
| Total | 1,860,572 | 1,924,317 |
| * | Includes short-term capital gains, if any. |
| Amount ($000) | |
| Tax Cost | 99,675,116 |
| Gross Unrealized Appreciation | 73,913,218 |
| Gross Unrealized Depreciation | (3,878,336) |
| Net Unrealized Appreciation (Depreciation) | 70,034,882 |
| E. | During the year ended December 31, 2021, the fund purchased $46,874,852,000 of investment securities and sold $41,470,616,000 of investment securities, other than temporary cash investments. Purchases and sales include $22,183,882,000 and $17,449,234,000, respectively, in connection with in-kind purchases and redemptions of the fund’s capital shares. |
| F. | Capital share transactions for each class of shares were: |
| Year Ended December 31, | |||||
| 2021 | 2020 | ||||
| Amount ($000) | Shares (000) | Amount ($000) | Shares (000) | ||
| Investor Shares | |||||
| Issued | 57,093 | 901 | 44,080 | 979 | |
| Issued in Lieu of Cash Distributions | 9,018 | 140 | 12,175 | 263 | |
| Redeemed | (334,518) | (5,165) | (210,456) | (4,509) | |
| Net Increase (Decrease)—Investor Shares | (268,407) | (4,124) | (154,201) | (3,267) | |
| ETF Shares | |||||
| Issued | 23,926,059 | 100,340 | 15,531,899 | 91,028 | |
| Issued in Lieu of Cash Distributions | — | — | — | — | |
| Redeemed | (17,631,013) | (74,400) | (9,542,082) | (53,000) | |
| Net Increase (Decrease)—ETF Shares | 6,295,046 | 25,940 | 5,989,817 | 38,028 | |
| Admiral Shares | |||||
| Issued | 8,108,777 | 28,148 | 7,980,693 | 38,938 | |
| Issued in Lieu of Cash Distributions | 628,000 | 2,134 | 681,716 | 3,239 | |
| Redeemed | (9,189,274) | (31,741) | (10,349,190) | (50,192) | |
| Net Increase (Decrease)—Admiral Shares | (452,497) | (1,459) | (1,686,781) | (8,015) | |
| Institutional Shares | |||||
| Issued | 4,726,431 | 73,690 | 3,188,268 | 69,770 | |
| Issued in Lieu of Cash Distributions | 282,871 | 4,349 | 306,154 | 6,581 | |
| Redeemed | (5,082,135) | (79,672) | (4,731,189) | (101,811) | |
| Net Increase (Decrease)—Institutional Shares | (72,833) | (1,633) | (1,236,767) | (25,460) | |
| Institutional Plus Shares | |||||
| Issued | 1,743,703 | 5,449 | 2,101,329 | 9,035 | |
| Issued in Lieu of Cash Distributions | 200,859 | 626 | 229,076 | 1,003 | |
| Redeemed | (2,507,567) | (7,981) | (2,979,721) | (13,185) | |
| Net Increase (Decrease)—Institutional Plus Shares | (563,005) | (1,906) | (649,316) | (3,147) | |
| G. | Management has determined that no events or transactions occurred subsequent to December 31, 2021, that would require recognition or disclosure in these financial statements. |

| Average Annual Total Returns Periods Ended December 31, 2021 | |||||
| One Year | Five Years | Ten Years | Final Value of a $10,000 Investment | ||
| Mid-Cap Growth Index Fund Investor Shares | 20.32% | 19.91% | 16.31% | $45,295 |
| Spliced Mid-Cap Growth Index | 20.51 | 20.12 | 16.50 | 46,034 |
| Dow Jones U.S. Total Stock Market Float Adjusted Index | 25.66 | 17.92 | 16.24 | 45,050 |
| One Year | Five Years | Ten Years | Final Value of a $10,000 Investment | ||
| Mid-Cap Growth Index Fund ETF Shares Net Asset Value | 20.47% | 20.05% | 16.45% | $45,860 | |
| Mid-Cap Growth Index Fund ETF Shares Market Price | 20.44 | 20.05 | 16.46 | 45,883 | |
| Spliced Mid-Cap Growth Index | 20.51 | 20.12 | 16.50 | 46,034 | |
| Dow Jones U.S. Total Stock Market Float Adjusted Index | 25.66 | 17.92 | 16.24 | 45,050 | |
| Average Annual Total Returns Periods Ended December 31, 2021 | |||||
| One Year | Five Years | Ten Years | Final Value of a $10,000 Investment | ||
| Mid-Cap Growth Index Fund Admiral Shares | 20.48% | 20.05% | 16.45% | $45,868 | |
| Spliced Mid-Cap Growth Index | 20.51 | 20.12 | 16.50 | 46,034 | |
| Dow Jones U.S. Total Stock Market Float Adjusted Index | 25.66 | 17.92 | 16.24 | 45,050 | |
| Cumulative Returns of ETF Shares: December 31, 2011, Through December 31, 2021 | |||
| One Year | Five Years | Ten Years | |
| Mid-Cap Growth Index Fund ETF Shares Market Price | 20.44% | 149.33% | 358.83% |
| Mid-Cap Growth Index Fund ETF Shares Net Asset Value | 20.47 | 149.39 | 358.60 |
| Spliced Mid-Cap Growth Index | 20.51 | 150.06 | 360.34 |
| Basic Materials | 1.2% |
| Consumer Discretionary | 13.5 |
| Consumer Staples | 1.1 |
| Energy | 3.4 |
| Financials | 6.0 |
| Health Care | 16.1 |
| Industrials | 18.4 |
| Real Estate | 6.4 |
| Technology | 30.7 |
| Telecommunications | 2.3 |
| Utilities | 0.9 |
| Shares | Market Value• ($000) | |||||
| Common Stocks (99.8%) | ||||||
| Basic Materials (1.2%) | ||||||
| Fastenal Co. | 3,831,789 | 245,464 | ||||
| FMC Corp. | 422,213 | 46,397 | ||||
| 291,861 | ||||||
| Consumer Discretionary (13.5%) | ||||||
| * | Aptiv plc | 1,802,188 | 297,271 | |||
| * | Trade Desk Inc. Class A | 2,905,183 | 266,231 | |||
| * | Copart Inc. | 1,422,151 | 215,627 | |||
| * | Etsy Inc. | 844,623 | 184,922 | |||
| Tractor Supply Co. | 758,246 | 180,918 | ||||
| * | Expedia Group Inc. | 972,691 | 175,785 | |||
| * | Chipotle Mexican Grill Inc. | 89,034 | 155,654 | |||
| * | Ulta Beauty Inc. | 362,134 | 149,322 | |||
| * | Hilton Worldwide Holdings Inc. | 928,434 | 144,826 | |||
| Domino's Pizza Inc. | 242,411 | 136,800 | ||||
| * | Take-Two Interactive Software Inc. | 768,136 | 136,513 | |||
| * | NVR Inc. | 22,040 | 130,231 | |||
| * | Burlington Stores Inc. | 444,796 | 129,662 | |||
| * | Caesars Entertainment Inc. | 1,352,972 | 126,543 | |||
| * | Live Nation Entertainment Inc. | 972,855 | 116,441 | |||
| LKQ Corp. | 1,650,647 | 99,088 | ||||
| * | Wayfair Inc. Class A | 493,538 | 93,757 | |||
| * | Lyft Inc. Class A | 1,880,734 | 80,364 | |||
| Pool Corp. | 126,860 | 71,803 | ||||
| * | Peloton Interactive Inc. Class A | 1,886,569 | 67,464 | |||
| * | Wynn Resorts Ltd. | 693,470 | 58,973 | |||
| * | DraftKings Inc. Class A | 2,030,868 | 55,788 | |||
| * | Royal Caribbean Cruises Ltd. | 721,407 | 55,476 | |||
| * | Las Vegas Sands Corp. | 1,399,681 | 52,684 | |||
| Rollins Inc. | 1,475,119 | 50,464 | ||||
| Vail Resorts Inc. | 134,739 | 44,181 | ||||
| 1 | Sirius XM Holdings Inc. | 5,329,009 | 33,839 | |||
| * | Endeavor Group Holdings Inc. Class A | 967,732 | 33,764 | |||
| *,1 | Chewy Inc. Class A | 568,005 | 33,495 | |||
| Shares | Market Value• ($000) | |||||
| *,1 | QuantumScape Corp. Class A | 1,302,521 | 28,903 | |||
| Warner Music Group Corp. Class A | 655,947 | 28,324 | ||||
| *,1 | Lucid Group Inc. | 685,513 | 26,084 | |||
| 3,461,197 | ||||||
| Consumer Staples (1.1%) | ||||||
| Church & Dwight Co. Inc. | 1,626,527 | 166,719 | ||||
| McCormick & Co. Inc. (Non-Voting) | 830,600 | 80,244 | ||||
| Lamb Weston Holdings Inc. | 486,556 | 30,838 | ||||
| * | Olaplex Holdings Inc. | 431,785 | 12,578 | |||
| 290,379 | ||||||
| Energy (3.4%) | ||||||
| Pioneer Natural Resources Co. | 1,463,798 | 266,236 | ||||
| Devon Energy Corp. | 4,510,225 | 198,675 | ||||
| Cheniere Energy Inc. | 1,520,486 | 154,208 | ||||
| * | Enphase Energy Inc. | 808,916 | 147,983 | |||
| * | Plug Power Inc. | 3,839,725 | 108,395 | |||
| 875,497 | ||||||
| Financials (6.0%) | ||||||
| MSCI Inc. | 521,804 | 319,704 | ||||
| * | SVB Financial Group | 390,978 | 265,177 | |||
| First Republic Bank | 1,192,907 | 246,347 | ||||
| Broadridge Financial Solutions Inc. | 776,654 | 141,988 | ||||
| FactSet Research Systems Inc. | 250,773 | 121,878 | ||||
| Apollo Asset Management Inc. | 1,483,131 | 107,423 | ||||
| MarketAxess Holdings Inc. | 240,669 | 98,980 | ||||
| * | Athene Holding Ltd. Class A | 876,719 | 73,057 | |||
| Tradeweb Markets Inc. Class A | 700,380 | 70,136 | ||||
| * | Markel Corp. | 45,528 | 56,182 | |||
| Interactive Brokers Group Inc. Class A | 588,635 | 46,749 | ||||
| 1,547,621 | ||||||
| Shares | Market Value• ($000) | |||||
| Health Care (16.1%) | ||||||
| * | IQVIA Holdings Inc. | 1,272,721 | 359,086 | |||
| * | Dexcom Inc. | 645,703 | 346,710 | |||
| * | Centene Corp. | 3,887,343 | 320,317 | |||
| ResMed Inc. | 970,821 | 252,879 | ||||
| * | Veeva Systems Inc. Class A | 923,762 | 236,003 | |||
| West Pharmaceutical Services Inc. | 493,524 | 231,468 | ||||
| * | IDEXX Laboratories Inc. | 282,450 | 185,982 | |||
| PerkinElmer Inc. | 840,754 | 169,042 | ||||
| * | Horizon Therapeutics plc | 1,511,092 | 162,835 | |||
| * | Catalent Inc. | 1,140,466 | 146,014 | |||
| * | Avantor Inc. | 3,451,193 | 145,433 | |||
| * | Seagen Inc. | 913,647 | 141,250 | |||
| Cooper Cos. Inc. | 328,469 | 137,609 | ||||
| * | Alnylam Pharmaceuticals Inc. | 796,789 | 135,119 | |||
| * | Insulet Corp. | 459,464 | 122,250 | |||
| * | BioMarin Pharmaceutical Inc. | 1,223,107 | 108,062 | |||
| * | Bio-Rad Laboratories Inc. Class A | 140,641 | 106,264 | |||
| * | ABIOMED Inc. | 287,953 | 103,424 | |||
| * | Incyte Corp. | 1,250,841 | 91,812 | |||
| Cerner Corp. | 980,065 | 91,019 | ||||
| * | Exact Sciences Corp. | 1,147,995 | 89,348 | |||
| * | Teladoc Health Inc. | 959,859 | 88,134 | |||
| * | 10X Genomics Inc. Class A | 549,138 | 81,800 | |||
| STERIS plc | 333,181 | 81,100 | ||||
| * | Charles River Laboratories International Inc. | 168,099 | 63,336 | |||
| Teleflex Inc. | 156,043 | 51,257 | ||||
| * | agilon health Inc. | 1,180,146 | 31,864 | |||
| * | Novocure Ltd. | 293,950 | 22,070 | |||
| *,1 | GoodRx Holdings Inc. Class A | 483,851 | 15,812 | |||
| * | Oak Street Health Inc. | 361,138 | 11,968 | |||
| *,1 | Ginkgo Bioworks Holdings Inc. | 594,986 | 4,944 | |||
| 4,134,211 | ||||||
| Industrials (18.3%) | ||||||
| IHS Markit Ltd. | 2,391,404 | 317,865 | ||||
| * | Mettler-Toledo International Inc. | 153,132 | 259,897 | |||
| Cintas Corp. | 585,574 | 259,509 | ||||
| Old Dominion Freight Line Inc. | 689,594 | 247,137 | ||||
| Verisk Analytics Inc. | 1,073,670 | 245,581 | ||||
| Equifax Inc. | 812,782 | 237,974 | ||||
| AMETEK Inc. | 1,541,108 | 226,605 | ||||
| * | TransDigm Group Inc. | 349,669 | 222,487 | |||
| * | Zebra Technologies Corp. Class A | 356,033 | 211,911 | |||
| Vulcan Materials Co. | 884,091 | 183,520 | ||||
| Shares | Market Value• ($000) | |||||
| Martin Marietta Materials Inc. | 415,596 | 183,078 | ||||
| * | Bill.com Holdings Inc. | 649,062 | 161,714 | |||
| Expeditors International of Washington Inc. | 1,128,580 | 151,557 | ||||
| * | Waters Corp. | 406,628 | 151,510 | |||
| TransUnion | 1,276,455 | 151,362 | ||||
| * | Generac Holdings Inc. | 420,312 | 147,916 | |||
| * | Trimble Inc. | 1,672,240 | 145,803 | |||
| Xylem Inc. | 1,201,341 | 144,065 | ||||
| * | Teledyne Technologies Inc. | 310,819 | 135,794 | |||
| * | Affirm Holdings Inc. Class A | 1,178,964 | 118,557 | |||
| * | FleetCor Technologies Inc. | 513,905 | 115,032 | |||
| JB Hunt Transport Services Inc. | 559,688 | 114,400 | ||||
| Masco Corp. | 1,626,138 | 114,187 | ||||
| Westinghouse Air Brake Technologies Corp. | 1,182,390 | 108,910 | ||||
| Ball Corp. | 1,078,905 | 103,866 | ||||
| HEICO Corp. Class A | 486,553 | 62,532 | ||||
| Fortune Brands Home & Security Inc. | 452,137 | 48,333 | ||||
| Cognex Corp. | 559,472 | 43,505 | ||||
| Jack Henry & Associates Inc. | 246,633 | 41,185 | ||||
| HEICO Corp. | 270,994 | 39,083 | ||||
| * | Marqeta Inc. Class A | 464,663 | 7,978 | |||
| * | Aurora Innovation Inc. | 321,776 | 3,623 | |||
| 4,706,476 | ||||||
| Real Estate (6.4%) | ||||||
| Digital Realty Trust Inc. | 1,890,614 | 334,393 | ||||
| SBA Communications Corp. | 724,714 | 281,928 | ||||
| * | CoStar Group Inc. | 2,631,093 | 207,935 | |||
| Extra Space Storage Inc. | 891,996 | 202,242 | ||||
| Invitation Homes Inc. | 3,975,735 | 180,260 | ||||
| Sun Communities Inc. | 795,898 | 167,115 | ||||
| Realty Income Corp. | 1,884,753 | 134,930 | ||||
| * | Zillow Group Inc. Class C | 1,122,278 | 71,657 | |||
| * | Opendoor Technologies Inc. | 3,060,956 | 44,721 | |||
| * | Zillow Group Inc. Class A | 286,440 | 17,822 | |||
| 1,643,003 | ||||||
| Technology (30.6%) | ||||||
| * | Synopsys Inc. | 1,015,987 | 374,391 | |||
| Xilinx Inc. | 1,651,399 | 350,146 | ||||
| Amphenol Corp. Class A | 3,984,118 | 348,451 | ||||
| * | Palo Alto Networks Inc. | 624,460 | 347,674 | |||
| * | Cadence Design Systems Inc. | 1,846,338 | 344,065 | |||
| * | Fortinet Inc. | 925,863 | 332,755 | |||
| Microchip Technology Inc. | 3,696,599 | 321,826 | ||||
| * | Datadog Inc. Class A | 1,627,793 | 289,926 | |||
| Marvell Technology Inc. | 2,743,552 | 240,033 | ||||
| Shares | Market Value• ($000) | |||||
| * | EPAM Systems Inc. | 358,976 | 239,958 | |||
| * | Match Group Inc. | 1,791,641 | 236,945 | |||
| * | ANSYS Inc. | 581,288 | 233,166 | |||
| * | MongoDB Inc. | 418,839 | 221,712 | |||
| * | Okta Inc. | 983,427 | 220,455 | |||
| * | Cloudflare Inc. Class A | 1,642,167 | 215,945 | |||
| * | HubSpot Inc. | 299,042 | 197,114 | |||
| * | ON Semiconductor Corp. | 2,870,249 | 194,947 | |||
| * | Zscaler Inc. | 559,824 | 179,888 | |||
| Teradyne Inc. | 1,085,948 | 177,585 | ||||
| * | Gartner Inc. | 520,491 | 174,011 | |||
| Skyworks Solutions Inc. | 1,101,824 | 170,937 | ||||
| * | Unity Software Inc. | 1,143,256 | 163,474 | |||
| * | VeriSign Inc. | 629,016 | 159,657 | |||
| * | Tyler Technologies Inc. | 272,988 | 146,854 | |||
| Monolithic Power Systems Inc. | 291,723 | 143,916 | ||||
| * | Paycom Software Inc. | 339,914 | 141,129 | |||
| * | AppLovin Corp. Class A | 1,473,877 | 138,928 | |||
| * | Pinterest Inc. Class A | 3,748,755 | 136,267 | |||
| * | Akamai Technologies Inc. | 1,082,460 | 126,691 | |||
| * | Splunk Inc. | 1,076,231 | 124,542 | |||
| SS&C Technologies Holdings Inc. | 1,439,879 | 118,041 | ||||
| * | Twitter Inc. | 2,530,360 | 109,362 | |||
| * | Palantir Technologies Inc. Class A | 5,715,837 | 104,085 | |||
| * | ZoomInfo Technologies Inc. Class A | 1,611,756 | 103,475 | |||
| * | RingCentral Inc. Class A | 547,044 | 102,489 | |||
| * | DocuSign Inc. | 622,513 | 94,815 | |||
| * | GoDaddy Inc. Class A | 1,107,287 | 93,964 | |||
| * | Black Knight Inc. | 982,954 | 81,477 | |||
| * | Coupa Software Inc. | 493,390 | 77,980 | |||
| * | IAC/InterActiveCorp | 530,226 | 69,306 | |||
| Bentley Systems Inc. Class B | 1,352,789 | 65,380 | ||||
| * | Dropbox Inc. Class A | 1,961,333 | 48,131 | |||
| * | Zendesk Inc. | 402,682 | 41,996 | |||
| * | IPG Photonics Corp. | 115,423 | 19,869 | |||
| * | Qualtrics International Inc. Class A | 359,935 | 12,742 | |||
| Shares | Market Value• ($000) | |||||
| * | Bumble Inc. Class A | 279,832 | 9,475 | |||
| *,1 | HashiCorp Inc. Class A | 101,929 | 9,280 | |||
| *,1 | Gitlab Inc. Class A | 71,299 | 6,203 | |||
| *,1 | Toast Inc. Class A | 147,284 | 5,112 | |||
| 7,866,570 | ||||||
| Telecommunications (2.3%) | ||||||
| * | Arista Networks Inc. | 1,535,358 | 220,708 | |||
| * | Roku Inc. | 784,175 | 178,949 | |||
| * | Liberty Broadband Corp. Class C | 942,536 | 151,842 | |||
| * | Liberty Broadband Corp. Class A | 150,571 | 24,227 | |||
| * | Altice USA Inc. Class A | 358,225 | 5,796 | |||
| 581,522 | ||||||
| Utilities (0.9%) | ||||||
| Waste Connections Inc. | 1,735,646 | 236,517 | ||||
| Total Common Stocks (Cost $15,948,682) | 25,634,854 | |||||
| Temporary Cash Investments (0.5%) | ||||||
| Money Market Fund (0.5%) | ||||||
| 2,3 | Vanguard Market Liquidity Fund, 0.090% (Cost $127,557) | 1,275,700 | 127,557 | |||
| Total Investments (100.3%) (Cost $16,076,239) | 25,762,411 | |||||
| Other Assets and Liabilities—Net (-0.3%) | (81,236) | |||||
| Net Assets (100%) | 25,681,175 | |||||
| Cost is in $000. | |
| • | See Note A in Notes to Financial Statements. |
| * | Non-income-producing security. |
| 1 | Includes partial security positions on loan to broker-dealers. The total value of securities on loan is $100,724,000. |
| 2 | Affiliated money market fund available only to Vanguard funds and certain trusts and accounts managed by Vanguard. Rate shown is the 7-day yield. |
| 3 | Collateral of $107,434,000 was received for securities on loan, of which $105,258,000 is held in Vanguard Market Liquidity Fund and $2,176,000 is held in cash. |
| Futures Contracts | ||||
| ($000) | ||||
| Expiration | Number of Long (Short) Contracts | Notional Amount | Value and Unrealized Appreciation (Depreciation) | |
| Long Futures Contracts | ||||
| E-mini S&P 500 Index | March 2022 | 126 | 29,978 | 684 |
| E-mini S&P Mid-Cap 400 Index | March 2022 | 79 | 22,418 | 586 |
| 1,270 | ||||
| ($000s, except shares and per-share amounts) | Amount |
| Assets | |
| Investments in Securities, at Value | |
| Unaffiliated Issuers (Cost $15,948,682) | 25,634,854 |
| Affiliated Issuers (Cost $127,557) | 127,557 |
| Total Investments in Securities | 25,762,411 |
| Investment in Vanguard | 825 |
| Cash | 2,176 |
| Cash Collateral Pledged—Futures Contracts | 2,516 |
| Receivables for Investment Securities Sold | 104,067 |
| Receivables for Accrued Income | 6,681 |
| Receivables for Capital Shares Issued | 16,107 |
| Total Assets | 25,894,783 |
| Liabilities | |
| Due to Custodian | 4,733 |
| Payables for Investment Securities Purchased | 73,059 |
| Collateral for Securities on Loan | 107,434 |
| Payables for Capital Shares Redeemed | 27,519 |
| Payables to Vanguard | 785 |
| Variation Margin Payable—Futures Contracts | 78 |
| Total Liabilities | 213,608 |
| Net Assets | 25,681,175 |
| Statement of Assets and Liabilities (continued) | |
| At December 31, 2021, net assets consisted of: | |
| ($000s, except shares and per-share amounts) | Amount |
| Paid-in Capital | 17,190,298 |
| Total Distributable Earnings (Loss) | 8,490,877 |
| Net Assets | 25,681,175 |
| Investor Shares—Net Assets | |
| Applicable to 860,166 outstanding $.001 par value shares of beneficial interest (unlimited authorization) | 86,081 |
| Net Asset Value Per Share—Investor Shares | $100.07 |
| ETF Shares—Net Assets | |
| Applicable to 50,288,290 outstanding $.001 par value shares of beneficial interest (unlimited authorization) | 12,798,089 |
| Net Asset Value Per Share—ETF Shares | $254.49 |
| Admiral Shares—Net Assets | |
| Applicable to 116,814,038 outstanding $.001 par value shares of beneficial interest (unlimited authorization) | 12,797,005 |
| Net Asset Value Per Share—Admiral Shares | $109.55 |
| Year Ended December 31, 2021 | |
| ($000) | |
| Investment Income | |
| Income | |
| Dividends1 | 101,387 |
| Interest2 | 18 |
| Securities Lending—Net | 998 |
| Total Income | 102,403 |
| Expenses | |
| The Vanguard Group—Note B | |
| Investment Advisory Services | 2,596 |
| Management and Administrative—Investor Shares | 143 |
| Management and Administrative—ETF Shares | 5,807 |
| Management and Administrative—Admiral Shares | 6,288 |
| Marketing and Distribution—Investor Shares | 6 |
| Marketing and Distribution—ETF Shares | 450 |
| Marketing and Distribution—Admiral Shares | 471 |
| Custodian Fees | 64 |
| Auditing Fees | 34 |
| Shareholders’ Reports—Investor Shares | 1 |
| Shareholders’ Reports—ETF Shares | 329 |
| Shareholders’ Reports—Admiral Shares | 160 |
| Trustees’ Fees and Expenses | 7 |
| Total Expenses | 16,356 |
| Net Investment Income | 86,047 |
| Realized Net Gain (Loss) | |
| Investment Securities Sold2,3 | 2,741,232 |
| Futures Contracts | 4,995 |
| Realized Net Gain (Loss) | 2,746,227 |
| Change in Unrealized Appreciation (Depreciation) | |
| Investment Securities2 | 1,422,360 |
| Futures Contracts | 950 |
| Change in Unrealized Appreciation (Depreciation) | 1,423,310 |
| Net Increase (Decrease) in Net Assets Resulting from Operations | 4,255,584 |
| 1 | Dividends are net of foreign withholding taxes of $220,000. |
| 2 | Interest income, realized net gain (loss), capital gain distributions received, and change in unrealized appreciation (depreciation) from an affiliated company of the fund were $18,000, ($12,000), $1,000, and ($2,000), respectively. Purchases and sales are for temporary cash investment purposes. |
| 3 | Includes $2,691,552,000 of net gain (loss) resulting from in-kind redemptions. |
| Year Ended December 31, | ||
| 2021 ($000) | 2020 ($000) | |
| Increase (Decrease) in Net Assets | ||
| Operations | ||
| Net Investment Income | 86,047 | 103,809 |
| Realized Net Gain (Loss) | 2,746,227 | 651,931 |
| Change in Unrealized Appreciation (Depreciation) | 1,423,310 | 4,547,237 |
| Net Increase (Decrease) in Net Assets Resulting from Operations | 4,255,584 | 5,302,977 |
| Distributions | ||
| Investor Shares | (202) | (369) |
| ETF Shares | (41,740) | (54,537) |
| Admiral Shares | (43,398) | (59,779) |
| Total Distributions | (85,340) | (114,685) |
| Capital Share Transactions | ||
| Investor Shares | (10,066) | (1,935) |
| ETF Shares | 630,212 | 649,823 |
| Admiral Shares | (65,985) | (111,739) |
| Net Increase (Decrease) from Capital Share Transactions | 554,161 | 536,149 |
| Total Increase (Decrease) | 4,724,405 | 5,724,441 |
| Net Assets | ||
| Beginning of Period | 20,956,770 | 15,232,329 |
| End of Period | 25,681,175 | 20,956,770 |
| Investor Shares | |||||
| For a Share Outstanding Throughout Each Period | Year Ended December 31, | ||||
| 2021 | 2020 | 2019 | 2018 | 2017 | |
| Net Asset Value, Beginning of Period | $83.37 | $62.43 | $47.02 | $50.21 | $41.52 |
| Investment Operations | |||||
| Net Investment Income1 | .229 | .340 | .345 | .333 | .304 |
| Net Realized and Unrealized Gain (Loss) on Investments | 16.697 | 20.984 | 15.485 | (3.193) | 8.692 |
| Total from Investment Operations | 16.926 | 21.324 | 15.830 | (2.860) | 8.996 |
| Distributions | |||||
| Dividends from Net Investment Income | (.226) | (.384) | (.420) | (.330) | (.306) |
| Distributions from Realized Capital Gains | — | — | — | — | — |
| Total Distributions | (.226) | (.384) | (.420) | (.330) | (.306) |
| Net Asset Value, End of Period | $100.07 | $83.37 | $62.43 | $47.02 | $50.21 |
| Total Return2 | 20.32% | 34.32% | 33.72% | -5.74% | 21.72% |
| Ratios/Supplemental Data | |||||
| Net Assets, End of Period (Millions) | $86 | $81 | $63 | $405 | $495 |
| Ratio of Total Expenses to Average Net Assets | 0.19% | 0.19% | 0.19% | 0.19% | 0.19% |
| Ratio of Net Investment Income to Average Net Assets | 0.25% | 0.51% | 0.62% | 0.64% | 0.67% |
| Portfolio Turnover Rate3 | 25% | 22% | 18% | 25% | 23% |
| 1 | Calculated based on average shares outstanding. |
| 2 | Total returns do not include account service fees that may have applied in the periods shown. Fund prospectuses provide information about any applicable account service fees. |
| 3 | Excludes the value of portfolio securities received or delivered as a result of in-kind purchases or redemptions of the fund’s capital shares, including ETF Creation Units. |
| ETF Shares | |||||
| For a Share Outstanding Throughout Each Period | Year Ended December 31, | ||||
| 2021 | 2020 | 2019 | 2018 | 2017 | |
| Net Asset Value, Beginning of Period | $212.00 | $158.76 | $119.58 | $127.67 | $105.60 |
| Investment Operations | |||||
| Net Investment Income1 | .870 | 1.074 | 1.386 | 1.016 | .932 |
| Net Realized and Unrealized Gain (Loss) on Investments | 42.479 | 53.347 | 39.040 | (8.101) | 22.058 |
| Total from Investment Operations | 43.349 | 54.421 | 40.426 | (7.085) | 22.990 |
| Distributions | |||||
| Dividends from Net Investment Income | (.859) | (1.181) | (1.246) | (1.005) | (.920) |
| Distributions from Realized Capital Gains | — | — | — | — | — |
| Total Distributions | (.859) | (1.181) | (1.246) | (1.005) | (.920) |
| Net Asset Value, End of Period | $254.49 | $212.00 | $158.76 | $119.58 | $127.67 |
| Total Return | 20.47% | 34.46% | 33.86% | -5.60% | 21.83% |
| Ratios/Supplemental Data | |||||
| Net Assets, End of Period (Millions) | $12,798 | $10,164 | $6,995 | $4,956 | $5,130 |
| Ratio of Total Expenses to Average Net Assets | 0.07% | 0.07% | 0.07% | 0.07% | 0.07% |
| Ratio of Net Investment Income to Average Net Assets | 0.37% | 0.63% | 0.95% | 0.76% | 0.79% |
| Portfolio Turnover Rate2 | 25% | 22% | 18% | 25% | 23% |
| 1 | Calculated based on average shares outstanding. |
| 2 | Excludes the value of portfolio securities received or delivered as a result of in-kind purchases or redemptions of the fund’s capital shares, including ETF Creation Units. |
| Admiral Shares | |||||
| For a Share Outstanding Throughout Each Period | Year Ended December 31, | ||||
| 2021 | 2020 | 2019 | 2018 | 2017 | |
| Net Asset Value, Beginning of Period | $91.26 | $68.34 | $51.48 | $54.96 | $45.46 |
| Investment Operations | |||||
| Net Investment Income1 | .373 | .461 | .603 | .437 | .400 |
| Net Realized and Unrealized Gain (Loss) on Investments | 18.287 | 22.967 | 16.793 | (3.485) | 9.496 |
| Total from Investment Operations | 18.660 | 23.428 | 17.396 | (3.048) | 9.896 |
| Distributions | |||||
| Dividends from Net Investment Income | (.370) | (.508) | (.536) | (.432) | (.396) |
| Distributions from Realized Capital Gains | — | — | — | — | — |
| Total Distributions | (.370) | (.508) | (.536) | (.432) | (.396) |
| Net Asset Value, End of Period | $109.55 | $91.26 | $68.34 | $51.48 | $54.96 |
| Total Return2 | 20.48% | 34.48% | 33.86% | -5.60% | 21.83% |
| Ratios/Supplemental Data | |||||
| Net Assets, End of Period (Millions) | $12,797 | $10,712 | $8,173 | $5,544 | $5,659 |
| Ratio of Total Expenses to Average Net Assets | 0.07% | 0.07% | 0.07% | 0.07% | 0.07% |
| Ratio of Net Investment Income to Average Net Assets | 0.37% | 0.63% | 0.96% | 0.76% | 0.79% |
| Portfolio Turnover Rate3 | 25% | 22% | 18% | 25% | 23% |
| 1 | Calculated based on average shares outstanding. |
| 2 | Total returns do not include account service fees that may have applied in the periods shown. Fund prospectuses provide information about any applicable account service fees. |
| 3 | Excludes the value of portfolio securities received or delivered as a result of in-kind purchases or redemptions of the fund’s capital shares, including ETF Creation Units. |
| A. | The following significant accounting policies conform to generally accepted accounting principles for U.S. investment companies. The fund consistently follows such policies in preparing its financial statements. |
| B. | In accordance with the terms of a Funds’ Service Agreement (the “FSA”) between Vanguard and the fund, Vanguard furnishes to the fund investment advisory, corporate management, administrative, marketing, and distribution services at Vanguard’s cost of operations (as defined by the FSA). These costs of operations are allocated to the fund based on methods and guidelines approved by the board of trustees and are generally settled twice a month. |
| C. | Various inputs may be used to determine the value of the fund’s investments and derivatives. These inputs are summarized in three broad levels for financial statement purposes. The inputs or methodologies used to value securities are not necessarily an indication of the risk associated with investing in those securities. |
| D. | Permanent differences between book-basis and tax-basis components of net assets are reclassified among capital accounts in the financial statements to reflect their tax character. These reclassifications have no effect on net assets or net asset value per share. As of period end, permanent differences primarily attributable to the accounting for in-kind redemptions were reclassified between the following accounts: |
| Amount ($000) | |
| Paid-in Capital | 2,690,740 |
| Total Distributable Earnings (Loss) | (2,690,740) |
| Amount ($000) | |
| Undistributed Ordinary Income | 1,075 |
| Undistributed Long-Term Gains | — |
| Capital Loss Carryforwards | (1,189,969) |
| Qualified Late-Year Losses | — |
| Net Unrealized Gains (Losses) | 9,679,771 |
| Year Ended December 31, | ||
| 2021 Amount ($000) | 2020 Amount ($000) | |
| Ordinary Income* | 85,340 | 114,685 |
| Long-Term Capital Gains | — | — |
| Total | 85,340 | 114,685 |
| * | Includes short-term capital gains, if any. |
| Amount ($000) | |
| Tax Cost | 16,082,640 |
| Gross Unrealized Appreciation | 10,537,046 |
| Gross Unrealized Depreciation | (857,275) |
| Net Unrealized Appreciation (Depreciation) | 9,679,771 |
| E. | During the year ended December 31, 2021, the fund purchased $10,883,848,000 of investment securities and sold $10,343,197,000 of investment securities, other than temporary cash investments. Purchases and sales include $4,927,512,000 and $4,606,424,000, respectively, in connection with in-kind purchases and redemptions of the fund’s capital shares. |
| F. | Capital share transactions for each class of shares were: |
| Year Ended December 31, | |||||
| 2021 | 2020 | ||||
| Amount ($000) | Shares (000) | Amount ($000) | Shares (000) | ||
| Investor Shares | |||||
| Issued | 19,175 | 208 | 18,844 | 279 | |
| Issued in Lieu of Cash Distributions | 202 | 2 | 369 | 6 | |
| Redeemed | (29,443) | (320) | (21,148) | (332) | |
| Net Increase (Decrease)—Investor Shares | (10,066) | (110) | (1,935) | (47) | |
| ETF Shares | |||||
| Issued | 5,301,356 | 22,469 | 2,610,129 | 14,482 | |
| Issued in Lieu of Cash Distributions | — | — | — | — | |
| Redeemed | (4,671,144) | (20,125) | (1,960,306) | (10,600) | |
| Net Increase (Decrease)—ETF Shares | 630,212 | 2,344 | 649,823 | 3,882 | |
| Admiral Shares | |||||
| Issued | 2,259,984 | 22,820 | 2,288,238 | 31,674 | |
| Issued in Lieu of Cash Distributions | 38,861 | 380 | 53,622 | 742 | |
| Redeemed | (2,364,830) | (23,759) | (2,453,599) | (34,639) | |
| Net Increase (Decrease)—Admiral Shares | (65,985) | (559) | (111,739) | (2,223) | |
| G. | Management has determined that no events or transactions occurred subsequent to December 31, 2021, that would require recognition or disclosure in these financial statements. |

| Average Annual Total Returns Periods Ended December 31, 2021 | |||||
| One Year | Five Years | Ten Years | Final Value of a $10,000 Investment | ||
| Mid-Cap Value Index Fund Investor Shares | 28.59% | 11.48% | 13.43% | $35,250 |
| Spliced Mid-Cap Value Index | 28.83 | 11.64 | 13.62 | 35,842 |
| Dow Jones U.S. Total Stock Market Float Adjusted Index | 25.66 | 17.92 | 16.24 | 45,050 |
| One Year | Five Years | Ten Years | Final Value of a $10,000 Investment | ||
| Mid-Cap Value Index Fund ETF Shares Net Asset Value | 28.74% | 11.60% | 13.56% | $35,678 | |
| Mid-Cap Value Index Fund ETF Shares Market Price | 28.69 | 11.60 | 13.56 | 35,668 | |
| Spliced Mid-Cap Value Index | 28.83 | 11.64 | 13.62 | 35,842 | |
| Dow Jones U.S. Total Stock Market Float Adjusted Index | 25.66 | 17.92 | 16.24 | 45,050 | |
| Average Annual Total Returns Periods Ended December 31, 2021 | |||||
| One Year | Five Years | Ten Years | Final Value of a $10,000 Investment | ||
| Mid-Cap Value Index Fund Admiral Shares | 28.76% | 11.61% | 13.57% | $35,692 | |
| Spliced Mid-Cap Value Index | 28.83 | 11.64 | 13.62 | 35,842 | |
| Dow Jones U.S. Total Stock Market Float Adjusted Index | 25.66 | 17.92 | 16.24 | 45,050 | |
| Cumulative Returns of ETF Shares: December 31, 2011, Through December 31, 2021 | |||
| One Year | Five Years | Ten Years | |
| Mid-Cap Value Index Fund ETF Shares Market Price | 28.69% | 73.11% | 256.68% |
| Mid-Cap Value Index Fund ETF Shares Net Asset Value | 28.74 | 73.14 | 256.78 |
| Spliced Mid-Cap Value Index | 28.83 | 73.44 | 258.42 |
| Basic Materials | 5.8% |
| Consumer Discretionary | 15.2 |
| Consumer Staples | 7.1 |
| Energy | 5.4 |
| Financials | 16.6 |
| Health Care | 5.9 |
| Industrials | 12.6 |
| Real Estate | 12.8 |
| Technology | 5.8 |
| Telecommunications | 2.0 |
| Utilities | 10.8 |
| Shares | Market Value• ($000) | |||||
| Common Stocks (99.3%) | ||||||
| Basic Materials (5.8%) | ||||||
| International Flavors & Fragrances Inc. | 2,059,339 | 310,239 | ||||
| Nucor Corp. | 2,312,165 | 263,934 | ||||
| Albemarle Corp. | 946,357 | 221,230 | ||||
| LyondellBasell Industries NV Class A | 2,153,794 | 198,644 | ||||
| Celanese Corp. | 880,787 | 148,025 | ||||
| International Paper Co. | 3,132,987 | 147,188 | ||||
| Avery Dennison Corp. | 669,835 | 145,066 | ||||
| Eastman Chemical Co. | 1,087,689 | 131,513 | ||||
| CF Industries Holdings Inc. | 867,567 | 61,406 | ||||
| FMC Corp. | 512,767 | 56,348 | ||||
| Westlake Chemical Corp. | 129,223 | 12,552 | ||||
| 1,696,145 | ||||||
| Consumer Discretionary (15.1%) | ||||||
| DR Horton Inc. | 2,740,154 | 297,170 | ||||
| * | Dollar Tree Inc. | 1,819,936 | 255,737 | |||
| Lennar Corp. Class A | 2,198,608 | 255,390 | ||||
| * | Southwest Airlines Co. | 4,788,648 | 205,146 | |||
| * | Delta Air Lines Inc. | 5,177,745 | 202,346 | |||
| Best Buy Co. Inc. | 1,790,913 | 181,957 | ||||
| * | AutoZone Inc. | 84,818 | 177,812 | |||
| * | CarMax Inc. | 1,311,530 | 170,800 | |||
| Garmin Ltd. | 1,244,738 | 169,496 | ||||
| Genuine Parts Co. | 1,152,209 | 161,540 | ||||
| Darden Restaurants Inc. | 1,050,024 | 158,176 | ||||
| MGM Resorts International | 3,224,952 | 144,736 | ||||
| ViacomCBS Inc. Class B | 4,667,896 | 140,877 | ||||
| * | Carnival Corp. | 6,746,514 | 135,740 | |||
| Omnicom Group Inc. | 1,719,862 | 126,014 | ||||
| Advance Auto Parts Inc. | 504,491 | 121,017 | ||||
| Whirlpool Corp. | 491,452 | 115,324 | ||||
| * | United Airlines Holdings Inc. | 2,618,309 | 114,630 | |||
| *,1 | AMC Entertainment Holdings Inc. Class A | 4,158,207 | 113,103 | |||
| PulteGroup Inc. | 1,946,065 | 111,237 | ||||
| Hasbro Inc. | 1,060,313 | 107,919 | ||||
| Shares | Market Value• ($000) | |||||
| VF Corp. | 1,430,065 | 104,709 | ||||
| Fox Corp. Class A | 2,556,411 | 94,332 | ||||
| BorgWarner Inc. | 1,939,589 | 87,417 | ||||
| News Corp. Class A | 3,770,700 | 84,124 | ||||
| Bath & Body Works Inc. | 1,015,908 | 70,900 | ||||
| * | Royal Caribbean Cruises Ltd. | 876,046 | 67,368 | |||
| * | Liberty Media Corp.-Liberty SiriusXM Class C | 1,278,497 | 65,012 | |||
| Interpublic Group of Cos. Inc. | 1,593,125 | 59,662 | ||||
| * | Discovery Inc. Class C | 2,531,383 | 57,969 | |||
| * | American Airlines Group Inc. | 2,619,645 | 47,049 | |||
| Lear Corp. | 241,197 | 44,127 | ||||
| Fox Corp. Class B | 1,249,225 | 42,811 | ||||
| *,1 | GameStop Corp. Class A | 263,067 | 39,036 | |||
| *,1 | Lucid Group Inc. | 832,140 | 31,663 | |||
| * | Liberty Media Corp.-Liberty SiriusXM Class A | 606,135 | 30,822 | |||
| *,1 | Discovery Inc. Class A | 1,306,416 | 30,753 | |||
| Lennar Corp. Class B | 122,627 | 11,726 | ||||
| News Corp. Class B | 378,120 | 8,508 | ||||
| ViacomCBS Inc. Class A | 78,043 | 2,604 | ||||
| 4,446,759 | ||||||
| Consumer Staples (7.0%) | ||||||
| Corteva Inc. | 5,907,999 | 279,330 | ||||
| Kroger Co. | 5,414,551 | 245,062 | ||||
| Tyson Foods Inc. Class A | 2,384,702 | 207,851 | ||||
| Clorox Co. | 994,000 | 173,314 | ||||
| AmerisourceBergen Corp. | 1,178,688 | 156,636 | ||||
| McKesson Corp. | 617,610 | 153,519 | ||||
| Archer-Daniels-Midland Co. | 2,262,999 | 152,956 | ||||
| Kellogg Co. | 2,069,842 | 133,339 | ||||
| Conagra Brands Inc. | 3,880,935 | 132,534 | ||||
| J M Smucker Co. | 832,902 | 113,125 | ||||
| Hormel Foods Corp. | 2,194,876 | 107,132 | ||||
| Shares | Market Value• ($000) | |||||
| McCormick & Co. Inc. (Non-Voting) | 1,008,530 | 97,434 | ||||
| Campbell Soup Co. | 1,588,652 | 69,043 | ||||
| Molson Coors Beverage Co. Class B | 729,981 | 33,835 | ||||
| 2,055,110 | ||||||
| Energy (5.3%) | ||||||
| Valero Energy Corp. | 3,307,555 | 248,430 | ||||
| ONEOK Inc. | 3,607,769 | 211,993 | ||||
| Occidental Petroleum Corp. | 7,178,316 | 208,099 | ||||
| Hess Corp. | 2,255,198 | 166,952 | ||||
| Baker Hughes Co. | 6,694,847 | 161,078 | ||||
| Marathon Petroleum Corp. | 2,490,100 | 159,342 | ||||
| Halliburton Co. | 6,879,528 | 157,335 | ||||
| Phillips 66 | 1,772,480 | 128,434 | ||||
| Williams Cos. Inc. | 4,914,986 | 127,986 | ||||
| 1,569,649 | ||||||
| Financials (16.5%) | ||||||
| Arthur J Gallagher & Co. | 1,676,892 | 284,518 | ||||
| Discover Financial Services | 2,371,015 | 273,994 | ||||
| Ameriprise Financial Inc. | 905,137 | 273,043 | ||||
| Fifth Third Bancorp | 5,531,588 | 240,901 | ||||
| Willis Towers Watson plc | 1,008,084 | 239,410 | ||||
| State Street Corp. | 2,334,634 | 217,121 | ||||
| Nasdaq Inc. | 946,949 | 198,869 | ||||
| American International Group Inc. | 3,358,544 | 190,967 | ||||
| Northern Trust Corp. | 1,595,959 | 190,893 | ||||
| Hartford Financial Services Group Inc. | 2,753,476 | 190,100 | ||||
| Huntington Bancshares Inc. | 11,702,082 | 180,446 | ||||
| KeyCorp | 7,532,303 | 174,222 | ||||
| Regions Financial Corp. | 7,712,195 | 168,126 | ||||
| Citizens Financial Group Inc. | 3,448,023 | 162,919 | ||||
| M&T Bank Corp. | 1,041,086 | 159,890 | ||||
| Principal Financial Group Inc. | 2,144,445 | 155,108 | ||||
| Raymond James Financial Inc. | 1,500,863 | 150,687 | ||||
| Cincinnati Financial Corp. | 1,238,485 | 141,100 | ||||
| Ally Financial Inc. | 2,802,850 | 133,444 | ||||
| * | Arch Capital Group Ltd. | 2,967,759 | 131,917 | |||
| Fidelity National Financial Inc. | 2,186,972 | 114,116 | ||||
| Cboe Global Markets Inc. | 862,620 | 112,486 | ||||
| Equitable Holdings Inc. | 3,274,193 | 107,361 | ||||
| Loews Corp. | 1,744,665 | 100,772 | ||||
| Annaly Capital Management Inc. | 11,729,942 | 91,728 | ||||
| W R Berkley Corp. | 1,071,689 | 88,296 | ||||
| Everest Re Group Ltd. | 318,479 | 87,238 | ||||
| Shares | Market Value• ($000) | |||||
| Franklin Resources Inc. | 2,435,589 | 81,568 | ||||
| * | Markel Corp. | 55,288 | 68,225 | |||
| Lincoln National Corp. | 694,181 | 47,385 | ||||
| * | Alleghany Corp. | 52,667 | 35,160 | |||
| Globe Life Inc. | 367,754 | 34,466 | ||||
| 1 | UWM Holdings Corp. Class A | 728,814 | 4,314 | |||
| 4,830,790 | ||||||
| Health Care (5.9%) | ||||||
| * | Laboratory Corp. of America Holdings | 774,232 | 243,271 | |||
| Quest Diagnostics Inc. | 992,469 | 171,707 | ||||
| * | Hologic Inc. | 2,034,054 | 155,727 | |||
| Viatris Inc. | 9,784,553 | 132,385 | ||||
| Cardinal Health Inc. | 2,279,842 | 117,389 | ||||
| Cerner Corp. | 1,190,264 | 110,540 | ||||
| Zimmer Biomet Holdings Inc. | 845,117 | 107,364 | ||||
| Royalty Pharma plc Class A | 2,606,389 | 103,865 | ||||
| * | Elanco Animal Health Inc. | 3,636,492 | 103,204 | |||
| DENTSPLY SIRONA Inc. | 1,768,822 | 98,682 | ||||
| STERIS plc | 404,560 | 98,474 | ||||
| * | Henry Schein Inc. | 1,121,814 | 86,974 | |||
| Universal Health Services Inc. Class B | 561,953 | 72,863 | ||||
| Teleflex Inc. | 189,494 | 62,245 | ||||
| * | DaVita Inc. | 494,653 | 56,272 | |||
| *,1 | Ginkgo Bioworks Holdings Inc. | 720,022 | 5,983 | |||
| 1,726,945 | ||||||
| Industrials (12.5%) | ||||||
| Carrier Global Corp. | 7,010,807 | 380,266 | ||||
| * | Keysight Technologies Inc. | 1,471,603 | 303,901 | |||
| PACCAR Inc. | 2,527,830 | 223,106 | ||||
| Dover Corp. | 1,164,833 | 211,534 | ||||
| Fortive Corp. | 2,755,868 | 210,245 | ||||
| Synchrony Financial | 4,427,352 | 205,385 | ||||
| Ingersoll Rand Inc. | 3,297,418 | 204,011 | ||||
| * | United Rentals Inc. | 585,681 | 194,616 | |||
| WW Grainger Inc. | 354,276 | 183,600 | ||||
| Rockwell Automation Inc. | 469,152 | 163,664 | ||||
| Otis Worldwide Corp. | 1,718,205 | 149,604 | ||||
| Jacobs Engineering Group Inc. | 1,043,245 | 145,251 | ||||
| Textron Inc. | 1,783,324 | 137,673 | ||||
| Ball Corp. | 1,310,195 | 126,132 | ||||
| Stanley Black & Decker Inc. | 659,510 | 124,397 | ||||
| Crown Holdings Inc. | 1,034,541 | 114,441 | ||||
| CH Robinson Worldwide Inc. | 1,051,683 | 113,193 | ||||
| Packaging Corp. of America | 768,573 | 104,641 | ||||
| Westrock Co. | 2,143,642 | 95,092 | ||||
| Shares | Market Value• ($000) | |||||
| Snap-on Inc. | 434,592 | 93,602 | ||||
| Fortune Brands Home & Security Inc. | 549,088 | 58,697 | ||||
| Hubbell Inc. Class B | 220,124 | 45,845 | ||||
| * | Mohawk Industries Inc. | 219,232 | 39,940 | |||
| Western Union Co. | 1,625,544 | 29,000 | ||||
| * | Aurora Innovation Inc. | 390,622 | 4,398 | |||
| 3,662,234 | ||||||
| Real Estate (12.7%) | ||||||
| Welltower Inc. | 3,521,465 | 302,036 | ||||
| AvalonBay Communities Inc. | 1,130,526 | 285,560 | ||||
| Alexandria Real Estate Equities Inc. | 1,253,716 | 279,528 | ||||
| * | CBRE Group Inc. Class A | 2,572,135 | 279,102 | |||
| Equity Residential | 2,882,228 | 260,842 | ||||
| Weyerhaeuser Co. | 6,059,980 | 249,550 | ||||
| Mid-America Apartment Communities Inc. | 931,498 | 213,723 | ||||
| Simon Property Group Inc. | 1,329,278 | 212,379 | ||||
| Duke Realty Corp. | 3,081,191 | 202,249 | ||||
| Essex Property Trust Inc. | 526,581 | 185,478 | ||||
| Ventas Inc. | 3,229,418 | 165,088 | ||||
| Realty Income Corp. | 2,288,847 | 163,859 | ||||
| Healthpeak Properties Inc. | 4,361,247 | 157,397 | ||||
| UDR Inc. | 2,501,411 | 150,060 | ||||
| Camden Property Trust | 826,803 | 147,733 | ||||
| Boston Properties Inc. | 1,137,416 | 131,008 | ||||
| WP Carey Inc. | 1,507,167 | 123,663 | ||||
| Iron Mountain Inc. | 2,342,602 | 122,588 | ||||
| Regency Centers Corp. | 692,661 | 52,192 | ||||
| * | Host Hotels & Resorts Inc. | 2,888,682 | 50,234 | |||
| 3,734,269 | ||||||
| Technology (5.8%) | ||||||
| Corning Inc. | 6,213,791 | 231,339 | ||||
| CDW Corp. | 1,098,024 | 224,853 | ||||
| Seagate Technology Holdings plc | 1,711,121 | 193,322 | ||||
| Hewlett Packard Enterprise Co. | 10,582,392 | 166,884 | ||||
| NetApp Inc. | 1,809,224 | 166,431 | ||||
| * | Western Digital Corp. | 2,521,109 | 164,402 | |||
| * | Qorvo Inc. | 891,739 | 139,459 | |||
| NortonLifeLock Inc. | 4,471,545 | 116,171 | ||||
| Citrix Systems Inc. | 1,008,902 | 95,432 | ||||
| * | UiPath Inc. Class A | 2,092,316 | 90,242 | |||
| * | F5 Inc. | 247,692 | 60,613 | |||
| Leidos Holdings Inc. | 567,749 | 50,473 | ||||
| 1,699,621 | ||||||
| Telecommunications (2.0%) | ||||||
| Motorola Solutions Inc. | 1,366,397 | 371,250 | ||||
| Shares | Market Value• ($000) | |||||
| Lumen Technologies Inc. | 8,282,416 | 103,944 | ||||
| * | DISH Network Corp. Class A | 1,996,866 | 64,778 | |||
| Juniper Networks Inc. | 1,315,567 | 46,979 | ||||
| * | Altice USA Inc. Class A | 435,902 | 7,053 | |||
| 594,004 | ||||||
| Utilities (10.7%) | ||||||
| American Water Works Co. Inc. | 1,468,651 | 277,369 | ||||
| Eversource Energy | 2,781,468 | 253,058 | ||||
| WEC Energy Group Inc. | 2,551,882 | 247,711 | ||||
| Edison International | 3,073,555 | 209,770 | ||||
| * | PG&E Corp. | 15,941,124 | 193,525 | |||
| Consolidated Edison Inc. | 2,261,852 | 192,981 | ||||
| Ameren Corp. | 2,066,302 | 183,922 | ||||
| FirstEnergy Corp. | 4,404,594 | 183,187 | ||||
| Entergy Corp. | 1,626,014 | 183,171 | ||||
| PPL Corp. | 6,073,429 | 182,567 | ||||
| DTE Energy Co. | 1,410,743 | 168,640 | ||||
| CMS Energy Corp. | 2,343,751 | 152,461 | ||||
| CenterPoint Energy Inc. | 5,087,681 | 141,997 | ||||
| Evergy Inc. | 1,836,492 | 126,002 | ||||
| AES Corp. | 5,124,348 | 124,522 | ||||
| Alliant Energy Corp. | 2,025,559 | 124,511 | ||||
| Vistra Corp. | 3,904,156 | 88,898 | ||||
| NiSource Inc. | 3,177,674 | 87,736 | ||||
| Avangrid Inc. | 626,286 | 31,239 | ||||
| 3,153,267 | ||||||
| Total Common Stocks (Cost $19,721,223) | 29,168,793 | |||||
| Temporary Cash Investments (1.0%) | ||||||
| Money Market Fund (1.0%) | ||||||
| 2,3 | Vanguard Market Liquidity Fund, 0.090% (Cost $291,420) | 2,914,481 | 291,419 | |||
| Total Investments (100.3%) (Cost $20,012,643) | 29,460,212 | |||||
| Other Assets and Liabilities—Net (-0.3%) | (98,154) | |||||
| Net Assets (100%) | 29,362,058 | |||||
| Cost is in $000. | |
| • | See Note A in Notes to Financial Statements. |
| * | Non-income-producing security. |
| 1 | Includes partial security positions on loan to broker-dealers. The total value of securities on loan is $140,540,000. |
| 2 | Affiliated money market fund available only to Vanguard funds and certain trusts and accounts managed by Vanguard. Rate shown is the 7-day yield. |
| 3 | Collateral of $152,848,000 was received for securities on loan, of which $152,847,000 is held in Vanguard Market Liquidity Fund and $1,000 is held in cash. |
| Futures Contracts | ||||
| ($000) | ||||
| Expiration | Number of Long (Short) Contracts | Notional Amount | Value and Unrealized Appreciation (Depreciation) | |
| Long Futures Contracts | ||||
| E-mini S&P 500 Index | March 2022 | 128 | 30,454 | 656 |
| E-mini S&P Mid-Cap 400 Index | March 2022 | 259 | 73,497 | 1,914 |
| 2,570 | ||||
| Over-the-Counter Total Return Swaps | ||||||
| Reference Entity | Termination Date | Counterparty | Notional Amount ($000) | Floating Interest Rate Received (Paid)1 (%) | Value and Unrealized Appreciation ($000) | Value and Unrealized (Depreciation) ($000) |
| Consolidated Edison Inc. | 8/31/22 | BOANA | 46,584 | (0.578) | 5,052 | — |
| State Street Corp. | 8/31/23 | BOANA | 42,261 | (0.675) | 2,162 | — |
| 7,214 | — | |||||
| 1 | Based on USD Overnight Bank Funding Rate as of the most recent payment date. Floating interest payment received/paid monthly. |
| BOANA—Bank of America, N.A. |
| ($000s, except shares and per-share amounts) | Amount |
| Assets | |
| Investments in Securities, at Value | |
| Unaffiliated Issuers (Cost $19,721,223) | 29,168,793 |
| Affiliated Issuers (Cost $291,420) | 291,419 |
| Total Investments in Securities | 29,460,212 |
| Investment in Vanguard | 908 |
| Cash | 1 |
| Cash Collateral Pledged—Futures Contracts | 4,970 |
| Receivables for Investment Securities Sold | 16,070 |
| Receivables for Accrued Income | 54,422 |
| Receivables for Capital Shares Issued | 13,195 |
| Unrealized Appreciation—Over-the-Counter Swap Contracts | 7,214 |
| Total Assets | 29,556,992 |
| Liabilities | |
| Due to Custodian | 3,220 |
| Payables for Investment Securities Purchased | 11,314 |
| Collateral for Securities on Loan | 152,848 |
| Payables for Capital Shares Redeemed | 26,604 |
| Payables to Vanguard | 888 |
| Variation Margin Payable—Futures Contracts | 60 |
| Total Liabilities | 194,934 |
| Net Assets | 29,362,058 |
| Statement of Assets and Liabilities (continued) | |
| At December 31, 2021, net assets consisted of: | |
| ($000s, except shares and per-share amounts) | Amount |
| Paid-in Capital | 22,895,691 |
| Total Distributable Earnings (Loss) | 6,466,367 |
| Net Assets | 29,362,058 |
| Investor Shares—Net Assets | |
| Applicable to 971,348 outstanding $.001 par value shares of beneficial interest (unlimited authorization) | 57,466 |
| Net Asset Value Per Share—Investor Shares | $59.16 |
| ETF Shares—Net Assets | |
| Applicable to 107,055,920 outstanding $.001 par value shares of beneficial interest (unlimited authorization) | 16,086,245 |
| Net Asset Value Per Share—ETF Shares | $150.26 |
| Admiral Shares—Net Assets | |
| Applicable to 169,814,207 outstanding $.001 par value shares of beneficial interest (unlimited authorization) | 13,218,347 |
| Net Asset Value Per Share—Admiral Shares | $77.84 |
| Year Ended December 31, 2021 | |
| ($000) | |
| Investment Income | |
| Income | |
| Dividends | 530,688 |
| Interest1 | 40 |
| Securities Lending—Net | 1,714 |
| Total Income | 532,442 |
| Expenses | |
| The Vanguard Group—Note B | |
| Investment Advisory Services | 2,637 |
| Management and Administrative—Investor Shares | 91 |
| Management and Administrative—ETF Shares | 7,176 |
| Management and Administrative—Admiral Shares | 6,495 |
| Marketing and Distribution—Investor Shares | 4 |
| Marketing and Distribution—ETF Shares | 527 |
| Marketing and Distribution—Admiral Shares | 507 |
| Custodian Fees | 65 |
| Auditing Fees | 35 |
| Shareholders’ Reports—Investor Shares | 1 |
| Shareholders’ Reports—ETF Shares | 685 |
| Shareholders’ Reports—Admiral Shares | 193 |
| Trustees’ Fees and Expenses | 8 |
| Total Expenses | 18,424 |
| Net Investment Income | 514,018 |
| Realized Net Gain (Loss) | |
| Investment Securities Sold1,2 | 1,276,823 |
| Futures Contracts | 5,342 |
| Swap Contracts | (1,597) |
| Realized Net Gain (Loss) | 1,280,568 |
| Change in Unrealized Appreciation (Depreciation) | |
| Investment Securities1 | 4,456,306 |
| Futures Contracts | 2,047 |
| Swap Contracts | 7,214 |
| Change in Unrealized Appreciation (Depreciation) | 4,465,567 |
| Net Increase (Decrease) in Net Assets Resulting from Operations | 6,260,153 |
| 1 | Interest income, realized net gain (loss), capital gain distributions received, and change in unrealized appreciation (depreciation) from an affiliated company of the fund were $40,000, ($14,000), $5,000, and ($14,000), respectively. Purchases and sales are for temporary cash investment purposes. |
| 2 | Includes $899,162,000 of net gain (loss) resulting from in-kind redemptions. |
| Year Ended December 31, | ||
| 2021 ($000) | 2020 ($000) | |
| Increase (Decrease) in Net Assets | ||
| Operations | ||
| Net Investment Income | 514,018 | 499,306 |
| Realized Net Gain (Loss) | 1,280,568 | (1,007,235) |
| Change in Unrealized Appreciation (Depreciation) | 4,465,567 | 863,169 |
| Net Increase (Decrease) in Net Assets Resulting from Operations | 6,260,153 | 355,240 |
| Distributions | ||
| Investor Shares | (965) | (1,066) |
| ETF Shares | (274,814) | (251,536) |
| Admiral Shares | (232,248) | (250,673) |
| Total Distributions | (508,027) | (503,275) |
| Capital Share Transactions | ||
| Investor Shares | 2,483 | (7,436) |
| ETF Shares | 1,966,665 | 694,076 |
| Admiral Shares | 445,190 | (882,562) |
| Net Increase (Decrease) from Capital Share Transactions | 2,414,338 | (195,922) |
| Total Increase (Decrease) | 8,166,464 | (343,957) |
| Net Assets | ||
| Beginning of Period | 21,195,594 | 21,539,551 |
| End of Period | 29,362,058 | 21,195,594 |
| Investor Shares | |||||
| For a Share Outstanding Throughout Each Period | Year Ended December 31, | ||||
| 2021 | 2020 | 2019 | 2018 | 2017 | |
| Net Asset Value, Beginning of Period | $46.83 | $46.96 | $37.50 | $43.89 | $38.24 |
| Investment Operations | |||||
| Net Investment Income1 | 1.006 | 1.0482 | .808 | 1.0013 | .771 |
| Net Realized and Unrealized Gain (Loss) on Investments | 12.311 | (.122) | 9.566 | (6.415) | 5.646 |
| Total from Investment Operations | 13.317 | .926 | 10.374 | (5.414) | 6.417 |
| Distributions | |||||
| Dividends from Net Investment Income | (.987) | (1.056) | (.914) | (.976) | (.767) |
| Distributions from Realized Capital Gains | — | — | — | — | — |
| Total Distributions | (.987) | (1.056) | (.914) | (.976) | (.767) |
| Net Asset Value, End of Period | $59.16 | $46.83 | $46.96 | $37.50 | $43.89 |
| Total Return4 | 28.59% | 2.43% | 27.82% | -12.53% | 16.91% |
| Ratios/Supplemental Data | |||||
| Net Assets, End of Period (Millions) | $57 | $43 | $52 | $508 | $682 |
| Ratio of Total Expenses to Average Net Assets | 0.19% | 0.19% | 0.19% | 0.19% | 0.19% |
| Ratio of Net Investment Income to Average Net Assets | 1.83% | 2.58%2 | 1.90% | 2.29%3 | 1.92% |
| Portfolio Turnover Rate5 | 17% | 39% | 17% | 17% | 17% |
| 1 | Calculated based on average shares outstanding. |
| 2 | Net investment income per share and the ratio of net investment income to average net assets include $.142 and 0.35%, respectively, resulting from a special dividend from NortonLifeLock Inc. in February 2020. |
| 3 | Net investment income per share and the ratio of net investment income to average net assets include $.111 and 0.26%, respectively, resulting from a special dividend from Dr Pepper Snapple Group Inc. in July 2018. |
| 4 | Total returns do not include account service fees that may have applied in the periods shown. Fund prospectuses provide information about any applicable account service fees. |
| 5 | Excludes the value of portfolio securities received or delivered as a result of in-kind purchases or redemptions of the fund’s capital shares, including ETF Creation Units. |
| ETF Shares | |||||
| For a Share Outstanding Throughout Each Period | Year Ended December 31, | ||||
| 2021 | 2020 | 2019 | 2018 | 2017 | |
| Net Asset Value, Beginning of Period | $118.93 | $119.27 | $95.22 | $111.47 | $97.12 |
| Investment Operations | |||||
| Net Investment Income1 | 2.744 | 2.7812 | 2.497 | 2.6453 | 2.116 |
| Net Realized and Unrealized Gain (Loss) on Investments | 31.258 | (.310) | 23.996 | (16.278) | 14.306 |
| Total from Investment Operations | 34.002 | 2.471 | 26.493 | (13.633) | 16.422 |
| Distributions | |||||
| Dividends from Net Investment Income | (2.672) | (2.811) | (2.443) | (2.617) | (2.072) |
| Distributions from Realized Capital Gains | — | — | — | — | — |
| Total Distributions | (2.672) | (2.811) | (2.443) | (2.617) | (2.072) |
| Net Asset Value, End of Period | $150.26 | $118.93 | $119.27 | $95.22 | $111.47 |
| Total Return | 28.74% | 2.50% | 27.98% | -12.41% | 17.05% |
| Ratios/Supplemental Data | |||||
| Net Assets, End of Period (Millions) | $16,086 | $11,061 | $10,339 | $7,898 | $8,355 |
| Ratio of Total Expenses to Average Net Assets | 0.07% | 0.07% | 0.07% | 0.07% | 0.07% |
| Ratio of Net Investment Income to Average Net Assets | 1.96% | 2.69%2 | 2.26% | 2.41%3 | 2.04% |
| Portfolio Turnover Rate4 | 17% | 39% | 17% | 17% | 17% |
| 1 | Calculated based on average shares outstanding. |
| 2 | Net investment income per share and the ratio of net investment income to average net assets include $.362 and 0.35%, respectively, resulting from a special dividend from NortonLifeLock Inc. in February 2020. |
| 3 | Net investment income per share and the ratio of net investment income to average net assets include $.282 and 0.26%, respectively, resulting from a special dividend from Dr Pepper Snapple Group Inc. in July 2018. |
| 4 | Excludes the value of portfolio securities received or delivered as a result of in-kind purchases or redemptions of the fund’s capital shares, including ETF Creation Units. |
| Admiral Shares | |||||
| For a Share Outstanding Throughout Each Period | Year Ended December 31, | ||||
| 2021 | 2020 | 2019 | 2018 | 2017 | |
| Net Asset Value, Beginning of Period | $61.61 | $61.79 | $49.33 | $57.74 | $50.31 |
| Investment Operations | |||||
| Net Investment Income1 | 1.413 | 1.4382 | 1.303 | 1.3853 | 1.096 |
| Net Realized and Unrealized Gain (Loss) on Investments | 16.201 | (.162) | 12.422 | (8.439) | 7.407 |
| Total from Investment Operations | 17.614 | 1.276 | 13.725 | (7.054) | 8.503 |
| Distributions | |||||
| Dividends from Net Investment Income | (1.384) | (1.456) | (1.265) | (1.356) | (1.073) |
| Distributions from Realized Capital Gains | — | — | — | — | — |
| Total Distributions | (1.384) | (1.456) | (1.265) | (1.356) | (1.073) |
| Net Asset Value, End of Period | $77.84 | $61.61 | $61.79 | $49.33 | $57.74 |
| Total Return4 | 28.76% | 2.54% | 27.99% | -12.42% | 17.04% |
| Ratios/Supplemental Data | |||||
| Net Assets, End of Period (Millions) | $13,218 | $10,092 | $11,148 | $7,738 | $8,134 |
| Ratio of Total Expenses to Average Net Assets | 0.07% | 0.07% | 0.07% | 0.07% | 0.07% |
| Ratio of Net Investment Income to Average Net Assets | 1.95% | 2.69%2 | 2.28% | 2.41%3 | 2.04% |
| Portfolio Turnover Rate5 | 17% | 39% | 17% | 17% | 17% |
| 1 | Calculated based on average shares outstanding. |
| 2 | Net investment income per share and the ratio of net investment income to average net assets include $.187 and 0.35%, respectively, resulting from a special dividend from NortonLifeLock Inc. in February 2020. |
| 3 | Net investment income per share and the ratio of net investment income to average net assets include $.146 and 0.26%, respectively, resulting from a special dividend from Dr Pepper Snapple Group Inc. in July 2018. |
| 4 | Total returns do not include account service fees that may have applied in the periods shown. Fund prospectuses provide information about any applicable account service fees. |
| 5 | Excludes the value of portfolio securities received or delivered as a result of in-kind purchases or redemptions of the fund’s capital shares, including ETF Creation Units. |
| A. | The following significant accounting policies conform to generally accepted accounting principles for U.S. investment companies. The fund consistently follows such policies in preparing its financial statements. |
| B. | In accordance with the terms of a Funds’ Service Agreement (the “FSA”) between Vanguard and the fund, Vanguard furnishes to the fund investment advisory, corporate management, administrative, marketing, and distribution services at Vanguard’s cost of operations (as defined by the FSA). These costs of operations are allocated to the fund based on methods and guidelines approved by the board of trustees and are generally settled twice a month. |
| C. | Various inputs may be used to determine the value of the fund’s investments and derivatives. These inputs are summarized in three broad levels for financial statement purposes. The inputs or methodologies used to value securities are not necessarily an indication of the risk associated with investing in those securities. |
| Level 1 ($000) | Level 2 ($000) | Level 3 ($000) | Total ($000) | |
| Investments | ||||
| Assets | ||||
| Common Stocks | 29,168,793 | — | — | 29,168,793 |
| Temporary Cash Investments | 291,419 | — | — | 291,419 |
| Total | 29,460,212 | — | — | 29,460,212 |
| Derivative Financial Instruments | ||||
| Assets | ||||
| Futures Contracts1 | 2,570 | — | — | 2,570 |
| Swap Contracts | — | 7,214 | — | 7,214 |
| Total | 2,570 | 7,214 | — | 9,784 |
| 1 | Includes cumulative appreciation (depreciation) on futures contracts and centrally cleared swaps, if any, as reported in the Schedule of Investments. Only current day’s variation margin is reported within the Statement of Assets and Liabilities. |
| D. | Permanent differences between book-basis and tax-basis components of net assets are reclassified among capital accounts in the financial statements to reflect their tax character. These reclassifications have no effect on net assets or net asset value per share. As of period end, permanent differences primarily attributable to the accounting for in-kind redemptions, passive foreign investment companies, and swap agreements were reclassified between the following accounts: |
| Amount ($000) | |
| Paid-in Capital | 898,766 |
| Total Distributable Earnings (Loss) | (898,766) |
| Amount ($000) | |
| Undistributed Ordinary Income | 18,568 |
| Undistributed Long-Term Gains | — |
| Capital Loss Carryforwards | (2,979,657) |
| Qualified Late-Year Losses | — |
| Net Unrealized Gains (Losses) | 9,427,456 |
| Year Ended December 31, | ||
| 2021 Amount ($000) | 2020 Amount ($000) | |
| Ordinary Income* | 508,027 | 503,275 |
| Long-Term Capital Gains | — | — |
| Total | 508,027 | 503,275 |
| * | Includes short-term capital gains, if any. |
| Amount ($000) | |
| Tax Cost | 20,032,756 |
| Gross Unrealized Appreciation | 9,837,824 |
| Gross Unrealized Depreciation | (410,368) |
| Net Unrealized Appreciation (Depreciation) | 9,427,456 |
| E. | During the year ended December 31, 2021, the fund purchased $8,381,236,000 of investment securities and sold $6,095,529,000 of investment securities, other than temporary cash investments. Purchases and sales include $3,535,365,000 and $1,669,929,000, respectively, in connection with in-kind purchases and redemptions of the fund’s capital shares. |
| F. | Capital share transactions for each class of shares were: |
| Year Ended December 31, | |||||
| 2021 | 2020 | ||||
| Amount ($000) | Shares (000) | Amount ($000) | Shares (000) | ||
| Investor Shares | |||||
| Issued | 15,393 | 281 | 8,255 | 208 | |
| Issued in Lieu of Cash Distributions | 965 | 17 | 1,066 | 27 | |
| Redeemed | (13,875) | (252) | (16,757) | (423) | |
| Net Increase (Decrease)—Investor Shares | 2,483 | 46 | (7,436) | (188) | |
| Year Ended December 31, | |||||
| 2021 | 2020 | ||||
| Amount ($000) | Shares (000) | Amount ($000) | Shares (000) | ||
| ETF Shares | |||||
| Issued | 3,658,900 | 25,904 | 3,661,867 | 35,714 | |
| Issued in Lieu of Cash Distributions | — | — | — | — | |
| Redeemed | (1,692,235) | (11,850) | (2,967,791) | (29,400) | |
| Net Increase (Decrease)—ETF Shares | 1,966,665 | 14,054 | 694,076 | 6,314 | |
| Admiral Shares | |||||
| Issued | 2,834,601 | 39,559 | 2,506,721 | 48,206 | |
| Issued in Lieu of Cash Distributions | 205,615 | 2,818 | 222,711 | 4,318 | |
| Redeemed | (2,595,026) | (36,366) | (3,611,994) | (69,151) | |
| Net Increase (Decrease)—Admiral Shares | 445,190 | 6,011 | (882,562) | (16,627) | |
| G. | Management has determined that no events or transactions occurred subsequent to December 31, 2021, that would require recognition or disclosure in these financial statements. |
Philadelphia, Pennsylvania
February 17, 2022
| Fund | ($000) |
| Extended Market Index Fund | 862,248 |
| Mid-Cap Index Fund | 1,513,389 |
| Mid-Cap Growth Index Fund | 78,044 |
| Mid-Cap Value Index Fund | 448,588 |
| Fund | ($000) |
| Extended Market Index Fund | 147,216 |
| Mid-Cap Index Fund | 202,616 |
| Mid-Cap Growth Index Fund | 7,297 |
| Mid-Cap Value Index Fund | 36,324 |
| Fund | Percentage |
| Extended Market Index Fund | 73.4% |
| Mid-Cap Index Fund | 78.7 |
| Mid-Cap Growth Index Fund | 88.1 |
| Mid-Cap Value Index Fund | 82.8 |
| Matthew Benchener | Thomas M. Rampulla |
| Joseph Brennan | Karin A. Risi |
| Mortimer J. Buckley | Anne E. Robinson |
| Gregory Davis | Michael Rollings |
| John James | Nitin Tandon |
| John T. Marcante | Lauren Valente |
| Chris D. McIsaac |

Who Are Deaf or Hard of Hearing > 800-749-7273
All rights reserved.
U.S. Patent No. 6,879,964.
Vanguard Marketing Corporation, Distributor.

| Vanguard Growth Index Fund |
| Vanguard Value Index Fund |
| Vanguard Large-Cap Index Fund |
Your Fund’s Performance at a Glance | 1 |
About Your Fund’s Expenses | 2 |
Growth Index Fund | 4 |
Value Index Fund | 27 |
Large-Cap Index Fund | 52 |
| • | For the 12 months ended December 31, 2021, returns for the funds included in this report ranged from 26.31% for Investor Shares of Vanguard Value Index Fund to 27.27% for Institutional Shares of Vanguard Growth Index Fund. Returns for Vanguard Large-Cap Index Fund, which contains both growth and value stocks, ranged from 26.87% for Investor Shares to 27.03% for Institutional Shares. Each fund closely tracked its target index. |
| • | The U.S. economy continued to heal over the 12 months. Vaccination programs started to roll out shortly after the beginning of the period, helping some of the hardest-hit sectors like hospitality, leisure, and travel, and more workers returned to the labor force. U.S. stocks turned in a strong performance even with the spread of new COVID-19 variants, a surge in inflation, and Federal Reserve monetary policy turning less accommodative. |
| • | Technology stocks made the biggest contribution to performance for both the Large-Cap Index Fund and the Growth Index Fund. The Value Index Fund benefited most from its financial stocks. |
| • | For the 10 years ended December 31, 2021, the funds’ annualized returns ranged from 13.59% for Investor Shares of the Value Index Fund to 19.31% for Institutional Shares of the Growth Index Fund. |
| Average Annual Total Returns Periods Ended December 31, 2021 | |||
| One Year | Three Years | Five Years | |
| Stocks | |||
| Russell 1000 Index (Large-caps) | 26.45% | 26.21% | 18.43% |
| Russell 2000 Index (Small-caps) | 14.82 | 20.02 | 12.02 |
| Russell 3000 Index (Broad U.S. market) | 25.66 | 25.79 | 17.97 |
| FTSE All-World ex US Index (International) | 8.36 | 13.66 | 9.89 |
| Bonds | |||
| Bloomberg U.S. Aggregate Bond Index (Broad taxable market) | -1.54% | 4.79% | 3.57% |
| Bloomberg Municipal Bond Index (Broad tax-exempt market) | 1.52 | 4.73 | 4.17 |
| FTSE Three-Month U.S. Treasury Bill Index | 0.05 | 0.95 | 1.11 |
| CPI | |||
| Consumer Price Index | 7.04% | 3.53% | 2.92% |
| • | Based on actual fund return. This section helps you to estimate the actual expenses that you paid over the period. The ”Ending Account Value“ shown is derived from the fund‘s actual return, and the third column shows the dollar amount that would have been paid by an investor who started with $1,000 in the fund. You may use the information here, together with the amount you invested, to estimate the expenses that you paid over the period. |
| • | Based on hypothetical 5% yearly return. This section is intended to help you compare your fund‘s costs with those of other mutual funds. It assumes that the fund had a yearly return of 5% before expenses, but that the expense ratio is unchanged. In this case—because the return used is not the fund’s actual return—the results do not apply to your investment. The example is useful in making comparisons because the Securities and Exchange Commission requires all mutual funds to calculate expenses based on a 5% return. You can assess your fund’s costs by comparing this hypothetical example with the hypothetical examples that appear in shareholder reports of other funds. |
| Six Months Ended December 31, 2021 | |||
| Beginning Account Value 6/30/2021 | Ending Account Value 12/31/2021 | Expenses Paid During Period | |
| Based on Actual Fund Return | |||
| Growth Index Fund | |||
| Investor Shares | $1,000.00 | $1,121.80 | $0.91 |
| ETF Shares | 1,000.00 | 1,122.60 | 0.21 |
| Admiral™ Shares | 1,000.00 | 1,122.60 | 0.27 |
| Institutional Shares | 1,000.00 | 1,122.60 | 0.21 |
| Value Index Fund | |||
| Investor Shares | $1,000.00 | $1,082.20 | $0.89 |
| ETF Shares | 1,000.00 | 1,082.80 | 0.21 |
| Admiral Shares | 1,000.00 | 1,082.80 | 0.26 |
| Institutional Shares | 1,000.00 | 1,082.90 | 0.21 |
| Large-Cap Index Fund | |||
| Investor Shares | $1,000.00 | $1,104.50 | $0.90 |
| ETF Shares | 1,000.00 | 1,105.20 | 0.21 |
| Admiral Shares | 1,000.00 | 1,105.30 | 0.27 |
| Institutional Shares | 1,000.00 | 1,105.30 | 0.21 |
| Based on Hypothetical 5% Yearly Return | |||
| Growth Index Fund | |||
| Investor Shares | $1,000.00 | $1,024.35 | $0.87 |
| ETF Shares | 1,000.00 | 1,025.00 | 0.20 |
| Admiral Shares | 1,000.00 | 1,024.95 | 0.26 |
| Institutional Shares | 1,000.00 | 1,025.00 | 0.20 |
| Value Index Fund | |||
| Investor Shares | $1,000.00 | $1,024.35 | $0.87 |
| ETF Shares | 1,000.00 | 1,025.00 | 0.20 |
| Admiral Shares | 1,000.00 | 1,024.95 | 0.26 |
| Institutional Shares | 1,000.00 | 1,025.00 | 0.20 |
| Large-Cap Index Fund | |||
| Investor Shares | $1,000.00 | $1,024.35 | $0.87 |
| ETF Shares | 1,000.00 | 1,025.00 | 0.20 |
| Admiral Shares | 1,000.00 | 1,024.95 | 0.26 |
| Institutional Shares | 1,000.00 | 1,025.00 | 0.20 |

| Average Annual Total Returns Periods Ended December 31, 2021 | |||||
| One Year | Five Years | Ten Years | Final Value of a $10,000 Investment | ||
 | Growth Index Fund Investor Shares | 27.10% | 24.62% | 19.14% | $57,621 |
 | Spliced Growth Index | 27.30 | 24.82 | 19.36 | 58,671 |
 | Dow Jones U.S. Total Stock Market Float Adjusted Index | 25.66 | 17.92 | 16.24 | 45,050 |
| One Year | Five Years | Ten Years | Final Value of a $10,000 Investment | ||
| Growth Index Fund ETF Shares Net Asset Value | 27.26% | 24.78% | 19.30% | $58,387 | |
| Growth Index Fund ETF Shares Market Price | 27.20 | 24.77 | 19.30 | 58,381 | |
| Spliced Growth Index | 27.30 | 24.82 | 19.36 | 58,671 | |
| Dow Jones U.S. Total Stock Market Float Adjusted Index | 25.66 | 17.92 | 16.24 | 45,050 | |
| Average Annual Total Returns Periods Ended December 31, 2021 | |||||
| One Year | Five Years | Ten Years | Final Value of a $10,000 Investment | ||
| Growth Index Fund Admiral Shares | 27.26% | 24.77% | 19.29% | $58,363 | |
| Spliced Growth Index | 27.30 | 24.82 | 19.36 | 58,671 | |
| Dow Jones U.S. Total Stock Market Float Adjusted Index | 25.66 | 17.92 | 16.24 | 45,050 | |
| One Year | Five Years | Ten Years | Final Value of a $5,000,000 Investment | ||
| Growth Index Fund Institutional Shares | 27.27% | 24.79% | 19.31% | $29,213,238 | |
| Spliced Growth Index | 27.30 | 24.82 | 19.36 | 29,335,637 | |
| Dow Jones U.S. Total Stock Market Float Adjusted Index | 25.66 | 17.92 | 16.24 | 22,525,162 | |
| One Year | Five Years | Ten Years | |
| Growth Index Fund ETF Shares Market Price | 27.20% | 202.36% | 483.81% |
| Growth Index Fund ETF Shares Net Asset Value | 27.26 | 202.52 | 483.87 |
| Spliced Growth Index | 27.30 | 203.02 | 486.71 |
| Basic Materials | 1.2% |
| Consumer Discretionary | 24.0 |
| Consumer Staples | 0.6 |
| Energy | 0.4 |
| Financials | 2.1 |
| Health Care | 7.6 |
| Industrials | 10.5 |
| Real Estate | 2.5 |
| Technology | 50.1 |
| Telecommunications | 0.8 |
| Utilities | 0.2 |
| Shares | Market Value• ($000) | ||
| Common Stocks (99.9%) | |||
| Basic Materials (1.2%) | |||
| Linde plc | 4,062,742 | 1,407,456 | |
| Ecolab Inc. | 2,047,461 | 480,314 | |
| Fastenal Co. | 4,566,462 | 292,527 | |
| Albemarle Corp. | 464,686 | 108,630 | |
| FMC Corp. | 972 | 107 | |
| 2,289,034 | |||
| Consumer Discretionary (23.9%) | |||
| * | Amazon.com Inc. | 3,422,296 | 11,411,098 |
| * | Tesla Inc. | 6,378,259 | 6,740,417 |
| Home Depot Inc. | 8,290,100 | 3,440,474 | |
| * | Walt Disney Co. | 14,430,112 | 2,235,080 |
| * | Netflix Inc. | 3,416,555 | 2,058,269 |
| Costco Wholesale Corp. | 3,507,549 | 1,991,236 | |
| NIKE Inc. Class B | 10,144,547 | 1,690,792 | |
| McDonald's Corp. | 5,932,107 | 1,590,220 | |
| Lowe's Cos. Inc. | 5,348,759 | 1,382,547 | |
| Starbucks Corp. | 9,313,657 | 1,089,418 | |
| * | Booking Holdings Inc. | 325,998 | 782,144 |
| TJX Cos. Inc. | 9,069,423 | 688,551 | |
| Estee Lauder Cos. Inc. Class A | 1,747,491 | 646,921 | |
| * | Uber Technologies Inc. | 11,552,402 | 484,392 |
| Dollar General Corp. | 1,852,060 | 436,771 | |
| * | Airbnb Inc. Class A | 2,615,766 | 435,499 |
| * | O'Reilly Automotive Inc. | 534,857 | 377,732 |
| * | Chipotle Mexican Grill Inc. Class A | 212,188 | 370,958 |
| * | Lululemon Athletica Inc. | 939,837 | 367,899 |
| * | Marriott International Inc. Class A | 2,197,589 | 363,130 |
| * | Aptiv plc | 2,147,805 | 354,280 |
| * | AutoZone Inc. | 166,455 | 348,955 |
| * | Hilton Worldwide Holdings Inc. | 2,212,567 | 345,138 |
| Yum! Brands Inc. | 2,326,956 | 323,121 | |
| Ross Stores Inc. | 2,821,190 | 322,406 | |
| * | Trade Desk Inc. Class A | 3,440,041 | 315,245 |
| Electronic Arts Inc. | 2,245,077 | 296,126 | |
| * | Copart Inc. | 1,694,885 | 256,978 |
| * | Roblox Corp. Class A | 2,303,315 | 237,610 |
| * | Etsy Inc. | 1,006,679 | 220,402 |
| Tractor Supply Co. | 903,778 | 215,641 | |
| * | Expedia Group Inc. | 1,159,375 | 209,522 |
| Shares | Market Value• ($000) | ||
| Activision Blizzard Inc. | 3,095,264 | 205,928 | |
| * | Ulta Beauty Inc. | 431,577 | 177,956 |
| Domino's Pizza Inc. | 289,001 | 163,092 | |
| * | Take-Two Interactive Software Inc. | 915,810 | 162,758 |
| * | Carvana Co. Class A | 679,827 | 157,577 |
| * | NVR Inc. | 26,273 | 155,244 |
| * | Burlington Stores Inc. | 530,003 | 154,501 |
| * | Caesars Entertainment Inc. | 1,613,318 | 150,894 |
| * | Rivian Automotive Inc. Class A | 1,403,494 | 145,528 |
| * | Live Nation Entertainment Inc. | 1,160,066 | 138,848 |
| * | Royal Caribbean Cruises Ltd. | 1,719,476 | 132,228 |
| *,1 | Wayfair Inc. Class A | 587,697 | 111,645 |
| *,1 | AMC Entertainment Holdings Inc. Class A | 4,080,303 | 110,984 |
| * | Lyft Inc. Class A | 2,239,469 | 95,693 |
| Pool Corp. | 151,146 | 85,549 | |
| * | Peloton Interactive Inc. Class A | 2,246,725 | 80,343 |
| * | Wynn Resorts Ltd. | 825,778 | 70,224 |
| * | DraftKings Inc. Class A | 2,418,055 | 66,424 |
| * | Las Vegas Sands Corp. | 1,669,164 | 62,827 |
| *,1 | Lucid Group Inc. | 1,632,598 | 62,120 |
| Rollins Inc. | 1,757,132 | 60,112 | |
| Vail Resorts Inc. | 160,472 | 52,619 | |
| 1 | Sirius XM Holdings Inc. | 6,345,463 | 40,294 |
| * | Endeavor Group Holdings Inc. Class A | 1,150,219 | 40,131 |
| *,1 | Chewy Inc. Class A | 676,365 | 39,885 |
| *,1 | QuantumScape Corp. Class A | 1,550,721 | 34,411 |
| Warner Music Group Corp. Class A | 781,044 | 33,726 | |
| MGM Resorts International | 3,052 | 137 | |
| * | Penn National Gaming Inc. | 1,193 | 62 |
| 44,820,712 |
| Shares | Market Value• ($000) | ||
| Consumer Staples (0.7%) | |||
| Colgate-Palmolive Co. | 3,349,354 | 285,834 | |
| * | Monster Beverage Corp. | 2,938,928 | 282,255 |
| Hershey Co. | 1,153,387 | 223,146 | |
| Church & Dwight Co. Inc. | 1,936,811 | 198,523 | |
| Brown-Forman Corp. Class B | 2,334,899 | 170,121 | |
| Lamb Weston Holdings Inc. | 291,305 | 18,463 | |
| Brown-Forman Corp. Class A | 270,101 | 18,310 | |
| * | Olaplex Holdings Inc. | 514,195 | 14,978 |
| McCormick & Co. Inc. | 1,858 | 179 | |
| 1,211,809 | |||
| Energy (0.4%) | |||
| Pioneer Natural Resources Co. | 1,744,454 | 317,281 | |
| Cheniere Energy Inc. | 1,811,091 | 183,681 | |
| * | Enphase Energy Inc. | 964,309 | 176,411 |
| * | Plug Power Inc. | 4,572,310 | 129,076 |
| 806,449 | |||
| Financials (2.1%) | |||
| S&P Global Inc. | 1,913,249 | 902,920 | |
| Aon plc Class A (XNYS) | 1,661,742 | 499,453 | |
| Moody's Corp. | 1,254,473 | 489,972 | |
| MSCI Inc. Class A | 621,848 | 381,000 | |
| * | SVB Financial Group | 465,965 | 316,036 |
| First Republic Bank | 1,421,627 | 293,580 | |
| * | Coinbase Global Inc. Class A | 1,047,618 | 264,387 |
| Broadridge Financial Solutions Inc. | 924,789 | 169,070 | |
| FactSet Research Systems Inc. | 299,028 | 145,331 | |
| Apollo Global Management Inc. Class A | 1,761,895 | 127,614 | |
| MarketAxess Holdings Inc. | 286,811 | 117,957 | |
| * | Athene Holding Ltd. Class A | 1,048,506 | 87,372 |
| Tradeweb Markets Inc. Class A | 834,034 | 83,520 | |
| * | Markel Corp. | 54,202 | 66,885 |
| Interactive Brokers Group Inc. Class A | 350,283 | 27,820 | |
| SEI Investments Co. | 972 | 59 | |
| 3,972,976 | |||
| Health Care (7.6%) | |||
| Thermo Fisher Scientific Inc. | 3,128,345 | 2,087,357 | |
| * | Intuitive Surgical Inc. | 2,836,133 | 1,019,023 |
| Zoetis Inc. | 3,755,934 | 916,561 | |
| Danaher Corp. | 2,552,860 | 839,916 | |
| Stryker Corp. | 2,695,441 | 720,815 | |
| * | Moderna Inc. | 2,736,021 | 694,895 |
| * | Edwards Lifesciences Corp. | 4,956,681 | 642,138 |
| * | Regeneron Pharmaceuticals Inc. | 797,301 | 503,512 |
| * | Boston Scientific Corp. | 11,312,873 | 480,571 |
| * | Illumina Inc. | 1,240,876 | 472,079 |
| Shares | Market Value• ($000) | ||
| * | IDEXX Laboratories Inc. | 673,171 | 443,256 |
| * | Vertex Pharmaceuticals Inc. | 2,018,348 | 443,229 |
| * | IQVIA Holdings Inc. | 1,516,667 | 427,912 |
| * | DexCom Inc. | 769,476 | 413,170 |
| * | Align Technology Inc. | 594,722 | 390,839 |
| Agilent Technologies Inc. | 2,397,599 | 382,777 | |
| ResMed Inc. | 1,156,852 | 301,337 | |
| * | Veeva Systems Inc. Class A | 1,100,805 | 281,234 |
| West Pharmaceutical Services Inc. | 588,150 | 275,848 | |
| PerkinElmer Inc. | 1,001,869 | 201,436 | |
| * | Horizon Therapeutics plc | 1,801,256 | 194,103 |
| * | Catalent Inc. | 1,359,657 | 174,077 |
| * | Avantor Inc. | 4,112,660 | 173,307 |
| * | Seagen Inc. | 1,089,250 | 168,398 |
| Cooper Cos. Inc. | 391,174 | 163,878 | |
| * | Alnylam Pharmaceuticals Inc. | 949,989 | 161,099 |
| * | Insulet Corp. | 547,125 | 145,574 |
| * | BioMarin Pharmaceutical Inc. | 1,456,737 | 128,703 |
| * | Bio-Rad Laboratories Inc. Class A | 167,467 | 126,533 |
| * | ABIOMED Inc. | 342,925 | 123,168 |
| * | Incyte Corp. | 1,491,656 | 109,488 |
| * | Exact Sciences Corp. | 1,367,070 | 106,399 |
| * | Teladoc Health Inc. | 1,143,033 | 104,953 |
| * | 10X Genomics Inc. Class A | 653,906 | 97,406 |
| STERIS plc | 396,766 | 96,577 | |
| * | Charles River Laboratories International Inc. | 200,423 | 75,515 |
| Teleflex Inc. | 186,176 | 61,155 | |
| * | agilon health Inc. | 1,403,338 | 37,890 |
| * | Novocure Ltd. | 349,398 | 26,233 |
| *,1 | GoodRx Holdings Inc. Class A | 576,080 | 18,826 |
| * | Oak Street Health Inc. | 430,853 | 14,278 |
| *,1 | Ginkgo Bioworks Holdings Inc. | 706,039 | 5,867 |
| Baxter International Inc. | 3,757 | 323 | |
| Cerner Corp. | 2,210 | 205 | |
| 14,251,860 | |||
| Industrials (10.4%) | |||
| Visa Inc. Class A | 12,810,778 | 2,776,224 | |
| Mastercard Inc. Class A | 6,964,310 | 2,502,416 | |
| Accenture plc Class A | 5,213,671 | 2,161,327 | |
| * | PayPal Holdings Inc. | 9,327,686 | 1,759,015 |
| * | Boeing Co. | 4,665,880 | 939,335 |
| Automatic Data Processing Inc. | 3,345,053 | 824,823 | |
| Sherwin-Williams Co. | 1,873,340 | 659,715 | |
| Union Pacific Corp. | 2,551,979 | 642,920 | |
| United Parcel Service Inc. Class B | 2,894,184 | 620,339 | |
| * | Block Inc. | 3,169,023 | 511,829 |
| * | Fiserv Inc. | 4,716,959 | 489,573 |
| IHS Markit Ltd. | 2,849,708 | 378,783 | |
| Shares | Market Value• ($000) | ||
| Paychex Inc. | 2,576,000 | 351,624 | |
| Rockwell Automation Inc. | 920,956 | 321,275 | |
| Global Payments Inc. | 2,303,389 | 311,372 | |
| * | Mettler-Toledo International Inc. | 182,480 | 309,707 |
| Cintas Corp. | 697,797 | 309,243 | |
| * | Keysight Technologies Inc. | 1,444,108 | 298,223 |
| Old Dominion Freight Line Inc. | 821,856 | 294,537 | |
| Verisk Analytics Inc. Class A | 1,279,385 | 292,634 | |
| Equifax Inc. | 968,535 | 283,577 | |
| * | Zebra Technologies Corp. Class A | 424,291 | 252,538 |
| Vulcan Materials Co. | 1,053,848 | 218,758 | |
| * | Bill.Com Holdings Inc. | 773,478 | 192,712 |
| Expeditors International of Washington Inc. | 1,345,471 | 180,683 | |
| * | Waters Corp. | 484,754 | 180,619 |
| TransUnion | 1,520,726 | 180,328 | |
| * | Generac Holdings Inc. | 500,612 | 176,175 |
| * | Trimble Inc. | 1,993,676 | 173,829 |
| * | Teledyne Technologies Inc. | 370,168 | 161,723 |
| * | Affirm Holdings Inc. | 1,404,953 | 141,282 |
| JB Hunt Transport Services Inc. | 666,539 | 136,241 | |
| Ball Corp. | 1,284,748 | 123,683 | |
| Martin Marietta Materials Inc. | 247,441 | 109,003 | |
| HEICO Corp. Class A | 573,640 | 73,724 | |
| * | FleetCor Technologies Inc. | 306,630 | 68,636 |
| Cognex Corp. | 665,639 | 51,760 | |
| Jack Henry & Associates Inc. | 293,594 | 49,027 | |
| HEICO Corp. | 327,922 | 47,293 | |
| *,1 | Aurora Innovation Inc. | 381,776 | 4,299 |
| Fidelity National Information Services Inc. | 4,641 | 507 | |
| 19,561,311 | |||
| Real Estate (2.5%) | |||
| American Tower Corp. | 3,615,471 | 1,057,525 | |
| Crown Castle International Corp. | 3,431,155 | 716,219 | |
| Equinix Inc. | 714,834 | 604,635 | |
| Public Storage | 1,183,241 | 443,195 | |
| Digital Realty Trust Inc. | 2,252,868 | 398,465 | |
| SBA Communications Corp. Class A | 863,547 | 335,937 | |
| * | CoStar Group Inc. | 3,135,319 | 247,784 |
| Invitation Homes Inc. | 4,737,532 | 214,800 | |
| Sun Communities Inc. | 948,545 | 199,166 | |
| Realty Income Corp. | 2,244,539 | 160,687 | |
| * | Zillow Group Inc. Class C | 1,328,914 | 84,851 |
| UDR Inc. | 1,225,902 | 73,542 | |
| * | Opendoor Technologies Inc. | 3,645,386 | 53,259 |
| * | Zillow Group Inc. Class A | 348,769 | 21,700 |
| Shares | Market Value• ($000) | ||
| Alexandria Real Estate Equities Inc. | 1,148 | 256 | |
| 4,612,021 | |||
| Technology (50.1%) | |||
| Apple Inc. | 123,737,396 | 21,972,049 | |
| Microsoft Corp. | 59,605,573 | 20,046,546 | |
| * | Alphabet Inc. Class A | 2,388,493 | 6,919,560 |
| * | Meta Platforms Inc. Class A | 18,785,762 | 6,318,591 |
| * | Alphabet Inc. Class C | 2,143,748 | 6,203,128 |
| NVIDIA Corp. | 18,855,101 | 5,545,474 | |
| * | Adobe Inc. | 3,777,342 | 2,141,980 |
| * | salesforce.com Inc. | 7,383,601 | 1,876,395 |
| Intuit Inc. | 2,248,035 | 1,445,981 | |
| Texas Instruments Inc. | 7,331,609 | 1,381,788 | |
| * | Advanced Micro Devices Inc. | 9,587,172 | 1,379,594 |
| Applied Materials Inc. | 7,168,388 | 1,128,018 | |
| * | ServiceNow Inc. | 1,579,846 | 1,025,494 |
| Micron Technology Inc. | 8,880,564 | 827,225 | |
| QUALCOMM Inc. | 4,445,758 | 812,996 | |
| Lam Research Corp. | 1,117,793 | 803,861 | |
| * | Snowflake Inc. Class A | 2,149,961 | 728,299 |
| Marvell Technology Inc. | 6,538,855 | 572,084 | |
| KLA Corp. | 1,203,729 | 517,736 | |
| * | Autodesk Inc. | 1,745,362 | 490,778 |
| * | Snap Inc. Class A | 9,685,209 | 455,495 |
| * | Synopsys Inc. | 1,210,694 | 446,141 |
| * | Workday Inc. Class A | 1,532,192 | 418,564 |
| Xilinx Inc. | 1,967,942 | 417,263 | |
| Amphenol Corp. Class A | 4,747,825 | 415,245 | |
| * | Palo Alto Networks Inc. | 744,126 | 414,300 |
| Roper Technologies Inc. | 837,417 | 411,892 | |
| * | Cadence Design Systems Inc. | 2,200,159 | 410,000 |
| * | Fortinet Inc. | 1,103,325 | 396,535 |
| Microchip Technology Inc. | 4,405,121 | 383,510 | |
| * | Twilio Inc. Class A | 1,337,296 | 352,164 |
| * | Datadog Inc. Class A | 1,939,805 | 345,499 |
| * | Crowdstrike Holdings Inc. Class A | 1,552,417 | 317,857 |
| * | Zoom Video Communications Inc. Class A | 1,634,626 | 300,624 |
| * | EPAM Systems Inc. | 427,755 | 285,933 |
| * | Match Group Inc. | 2,134,963 | 282,349 |
| * | ANSYS Inc. | 692,679 | 277,847 |
| * | MongoDB Inc. Class A | 499,119 | 264,209 |
| * | Okta Inc. | 1,171,913 | 262,708 |
| * | Twitter Inc. | 6,030,869 | 260,654 |
| * | Cloudflare Inc. Class A | 1,956,958 | 257,340 |
| * | Palantir Technologies Inc. Class A | 13,622,748 | 248,070 |
| * | DoorDash Inc. Class A | 1,608,040 | 239,437 |
| * | HubSpot Inc. | 356,385 | 234,911 |
| * | DocuSign Inc. Class A | 1,483,875 | 226,009 |
| * | Zscaler Inc. | 667,150 | 214,375 |
| Teradyne Inc. | 1,294,402 | 211,674 | |
| * | Gartner Inc. | 620,404 | 207,413 |
| Shares | Market Value• ($000) | ||
| Skyworks Solutions Inc. | 1,312,460 | 203,615 | |
| * | Unity Software Inc. | 1,362,555 | 194,832 |
| * | VeriSign Inc. | 749,801 | 190,314 |
| * | Tyler Technologies Inc. | 325,468 | 175,086 |
| Monolithic Power Systems Inc. | 347,784 | 171,572 | |
| * | Paycom Software Inc. | 405,119 | 168,201 |
| *,1 | AppLovin Corp. Class A | 1,756,400 | 165,558 |
| * | Pinterest Inc. Class A | 4,469,385 | 162,462 |
| * | Splunk Inc. | 1,281,636 | 148,311 |
| SS&C Technologies Holdings Inc. | 1,714,628 | 140,565 | |
| * | ZoomInfo Technologies Inc. Class A | 1,921,469 | 123,358 |
| * | RingCentral Inc. Class A | 651,427 | 122,045 |
| * | GoDaddy Inc. Class A | 1,318,572 | 111,894 |
| * | Black Knight Inc. | 1,170,550 | 97,027 |
| * | Coupa Software Inc. | 587,531 | 92,859 |
| * | IAC/InterActiveCorp. | 631,424 | 82,533 |
| Bentley Systems Inc. Class B | 1,610,982 | 77,859 | |
| * | Akamai Technologies Inc. | 645,663 | 75,568 |
| * | Dropbox Inc. Class A | 2,335,540 | 57,314 |
| * | Zendesk Inc. | 479,495 | 50,007 |
| * | IPG Photonics Corp. | 137,760 | 23,714 |
| * | Qualtrics International Inc. Class A | 429,141 | 15,192 |
| * | Bumble Inc. Class A | 333,864 | 11,305 |
| *,1 | HashiCorp Inc. Class A | 121,393 | 11,052 |
| *,1 | Gitlab Inc. Class A | 85,268 | 7,418 |
| *,1 | Toast Inc. Class A | 178,289 | 6,188 |
| VMware Inc. Class A | 1,547 | 179 | |
| 93,781,623 | |||
| Telecommunications (0.8%) | |||
| * | Charter Communications Inc. Class A | 925,132 | 603,158 |
| * | Arista Networks Inc. | 1,829,701 | 263,019 |
| Shares | Market Value• ($000) | ||
| * | Roku Inc. | 934,615 | 213,279 |
| * | Liberty Broadband Corp. Class C | 1,131,813 | 182,335 |
| Motorola Solutions Inc. | 669,961 | 182,028 | |
| * | Liberty Broadband Corp. Class A | 170,905 | 27,499 |
| * | Altice USA Inc. Class A | 428,903 | 6,940 |
| Ubiquiti Inc. | 87 | 27 | |
| 1,478,285 | |||
| Utilities (0.2%) | |||
| Waste Connections Inc. (XTSE) | 2,068,311 | 281,849 | |
| Total Common Stocks (Cost $73,601,160) | 187,067,929 | ||
| Temporary Cash Investments (0.3%) | |||
| Money Market Fund (0.3%) | |||
| 2,3 | Vanguard Market Liquidity Fund, 0.090% (Cost $638,054) | 6,381,446 | 638,081 |
| Total Investments (100.2%) (Cost $74,239,214) | 187,706,010 | ||
| Other Assets and Liabilities—Net (-0.2%) | (448,943) | ||
| Net Assets (100%) | 187,257,067 | ||
| Cost is in $000. | |||
| • | See Note A in Notes to Financial Statements. |
| * | Non-income-producing security. |
| 1 | Includes partial security positions on loan to broker-dealers. The total value of securities on loan is $252,340,000. |
| 2 | Affiliated money market fund available only to Vanguard funds and certain trusts and accounts managed by Vanguard. Rate shown is the 7-day yield. |
| 3 | Collateral of $270,420,000 was received for securities on loan. |
| Futures Contracts | ||||
| ($000) | ||||
| Expiration | Number of Long (Short) Contracts | Notional Amount | Value and Unrealized Appreciation (Depreciation) | |
| Long Futures Contracts | ||||
| E-mini S&P 500 Index | March 2022 | 425 | 101,118 | 2,853 |
| Over-the-Counter Total Return Swaps | ||||||
| Reference Entity | Termination Date | Counterparty | Notional Amount ($000) | Floating Interest Rate Received (Paid)1 (%) | Value and Unrealized Appreciation ($000) | Value and Unrealized (Depreciation) ($000) |
| Netflix Inc. | 8/31/22 | BANA | 60,244 | (0.070) | — | (4) |
| Visa Inc. Class A | 8/31/22 | BANA | 96,436 | 0.030 | 169 | — |
| 169 | (4) | |||||
| 1 | Based on 1M USD Overnight Bank Funding Rate as of the most recent payment date. Floating interest payment received/paid monthly. |
| 1M—1-month. | |
| BANA—Bank of America, N.A. |
| ($000s, except shares and per-share amounts) | Amount |
| Assets | |
| Investments in Securities, at Value | |
| Unaffiliated Issuers (Cost $73,601,160) | 187,067,929 |
| Affiliated Issuers (Cost $638,054) | 638,081 |
| Total Investments in Securities | 187,706,010 |
| Investment in Vanguard | 6,062 |
| Cash Collateral Pledged—Futures Contracts | 12,365 |
| Receivables for Investment Securities Sold | 13,913 |
| Receivables for Accrued Income | 37,357 |
| Receivables for Capital Shares Issued | 74,900 |
| Unrealized Appreciation—Over-the-Counter Swap Contracts | 169 |
| Total Assets | 187,850,776 |
| Liabilities | |
| Due to Custodian | 4,468 |
| Payables for Investment Securities Purchased | 91,353 |
| Collateral for Securities on Loan | 270,420 |
| Payables for Capital Shares Redeemed | 223,299 |
| Payables to Vanguard | 3,588 |
| Variation Margin Payable—Futures Contracts | 577 |
| Unrealized Depreciation—Over-the-Counter Swap Contracts | 4 |
| Total Liabilities | 593,709 |
| Net Assets | 187,257,067 |
| Statement of Assets and Liabilities (continued) | |
| At December 31, 2021, net assets consisted of: | |
| ($000s, except shares and per-share amounts) | Amount |
| Paid-in Capital | 76,953,528 |
| Total Distributable Earnings (Loss) | 110,303,539 |
| Net Assets | 187,257,067 |
| Investor Shares—Net Assets | |
| Applicable to 4,188,807 outstanding $.001 par value shares of beneficial interest (unlimited authorization) | 691,987 |
| Net Asset Value Per Share—Investor Shares | $165.20 |
| ETF Shares—Net Assets | |
| Applicable to 282,099,376 outstanding $.001 par value shares of beneficial interest (unlimited authorization) | 90,505,702 |
| Net Asset Value Per Share—ETF Shares | $320.83 |
| Admiral Shares—Net Assets | |
| Applicable to 414,006,312 outstanding $.001 par value shares of beneficial interest (unlimited authorization) | 68,371,623 |
| Net Asset Value Per Share—Admiral Shares | $165.15 |
| Institutional Shares—Net Assets | |
| Applicable to 167,646,884 outstanding $.001 par value shares of beneficial interest (unlimited authorization) | 27,687,755 |
| Net Asset Value Per Share—Institutional Shares | $165.16 |
| Year Ended December 31, 2021 | |
| ($000) | |
| Investment Income | |
| Income | |
| Dividends1 | 920,065 |
| Interest2 | 233 |
| Securities Lending—Net | 3,049 |
| Total Income | 923,347 |
| Expenses | |
| The Vanguard Group—Note B | |
| Investment Advisory Services | 4,562 |
| Management and Administrative—Investor Shares | 1,180 |
| Management and Administrative—ETF Shares | 24,901 |
| Management and Administrative—Admiral Shares | 25,931 |
| Management and Administrative—Institutional Shares | 8,242 |
| Marketing and Distribution—Investor Shares | 41 |
| Marketing and Distribution—ETF Shares | 2,444 |
| Marketing and Distribution—Admiral Shares | 2,069 |
| Marketing and Distribution—Institutional Shares | 662 |
| Custodian Fees | 853 |
| Auditing Fees | 35 |
| Shareholders’ Reports—Investor Shares | 2 |
| Shareholders’ Reports—ETF Shares | 1,506 |
| Shareholders’ Reports—Admiral Shares | 484 |
| Shareholders’ Reports—Institutional Shares | 109 |
| Trustees’ Fees and Expenses | 49 |
| Total Expenses | 73,070 |
| Net Investment Income | 850,277 |
| Realized Net Gain (Loss) | |
| Investment Securities Sold2,3 | 9,305,158 |
| Futures Contracts | 47,540 |
| Swap Contracts | 14,572 |
| Realized Net Gain (Loss) | 9,367,270 |
| Change in Unrealized Appreciation (Depreciation) | |
| Investment Securities2 | 29,624,333 |
| Futures Contracts | 2,606 |
| Swap Contracts | (8,705) |
| Change in Unrealized Appreciation (Depreciation) | 29,618,234 |
| Net Increase (Decrease) in Net Assets Resulting from Operations | 39,835,781 |
| 1 | Dividends are net of foreign withholding taxes of $260,000. |
| 2 | Interest income, realized net gain (loss), capital gain distributions received, and change in unrealized appreciation (depreciation) from an affiliated company of the fund were $226,000, ($8,000), ($13,000), and ($46,000), respectively. Purchases and sales are for temporary cash investment purposes. |
| 3 | Includes $9,337,949,000 of net gain (loss) resulting from in-kind redemptions. |
| Year Ended December 31, | ||
| 2021 ($000) | 2020 ($000) | |
| Increase (Decrease) in Net Assets | ||
| Operations | ||
| Net Investment Income | 850,277 | 959,207 |
| Realized Net Gain (Loss) | 9,367,270 | 6,085,082 |
| Change in Unrealized Appreciation (Depreciation) | 29,618,234 | 35,082,887 |
| Net Increase (Decrease) in Net Assets Resulting from Operations | 39,835,781 | 42,127,176 |
| Distributions | ||
| Investor Shares | (2,918) | (4,183) |
| ETF Shares | (426,504) | (453,408) |
| Admiral Shares | (323,130) | (351,474) |
| Institutional Shares | (132,576) | (152,514) |
| Total Distributions | (885,128) | (961,579) |
| Capital Share Transactions | ||
| Investor Shares | (228,745) | (29,849) |
| ETF Shares | 3,475,469 | 2,591,427 |
| Admiral Shares | 24,196 | 742,741 |
| Institutional Shares | (697,636) | (319,460) |
| Net Increase (Decrease) from Capital Share Transactions | 2,573,284 | 2,984,859 |
| Total Increase (Decrease) | 41,523,937 | 44,150,456 |
| Net Assets | ||
| Beginning of Period | 145,733,130 | 101,582,674 |
| End of Period | 187,257,067 | 145,733,130 |
| Investor Shares | |||||
| For a Share Outstanding Throughout Each Period | Year Ended December 31, | ||||
| 2021 | 2020 | 2019 | 2018 | 2017 | |
| Net Asset Value, Beginning of Period | $130.50 | $93.87 | $69.10 | $72.36 | $57.32 |
| Investment Operations | |||||
| Net Investment Income1 | .565 | .728 | .746 | .823 | .750 |
| Net Realized and Unrealized Gain (Loss) on Investments | 34.731 | 36.631 | 24.802 | (3.271) | 15.037 |
| Total from Investment Operations | 35.296 | 37.359 | 25.548 | (2.448) | 15.787 |
| Distributions | |||||
| Dividends from Net Investment Income | (.596) | (.729) | (.778) | (.812) | (.747) |
| Distributions from Realized Capital Gains | — | — | — | — | — |
| Total Distributions | (.596) | (.729) | (.778) | (.812) | (.747) |
| Net Asset Value, End of Period | $165.20 | $130.50 | $93.87 | $69.10 | $72.36 |
| Total Return2 | 27.10% | 40.01% | 37.08% | -3.46% | 27.65% |
| Ratios/Supplemental Data | |||||
| Net Assets, End of Period (Millions) | $692 | $750 | $572 | $2,654 | $3,210 |
| Ratio of Total Expenses to Average Net Assets | 0.17% | 0.17% | 0.17% | 0.17% | 0.17% |
| Ratio of Net Investment Income to Average Net Assets | 0.39% | 0.69% | 0.92% | 1.08% | 1.15% |
| Portfolio Turnover Rate3 | 8% | 6% | 11% | 11% | 8% |
| 1 | Calculated based on average shares outstanding. |
| 2 | Total returns do not include account service fees that may have applied in the periods shown. Fund prospectuses provide information about any applicable account service fees. |
| 3 | Excludes the value of portfolio securities received or delivered as a result of in-kind purchases or redemptions of the fund’s capital shares, including ETF Creation Units. |
| ETF Shares | |||||
| For a Share Outstanding Throughout Each Period | Year Ended December 31, | ||||
| 2021 | 2020 | 2019 | 2018 | 2017 | |
| Net Asset Value, Beginning of Period | $253.44 | $182.31 | $134.21 | $140.55 | $111.33 |
| Investment Operations | |||||
| Net Investment Income1 | 1.483 | 1.683 | 1.773 | 1.807 | 1.626 |
| Net Realized and Unrealized Gain (Loss) on Investments | 67.447 | 71.131 | 48.065 | (6.373) | 29.200 |
| Total from Investment Operations | 68.930 | 72.814 | 49.838 | (4.566) | 30.826 |
| Distributions | |||||
| Dividends from Net Investment Income | (1.540) | (1.684) | (1.738) | (1.774) | (1.606) |
| Distributions from Realized Capital Gains | — | — | — | — | — |
| Total Distributions | (1.540) | (1.684) | (1.738) | (1.774) | (1.606) |
| Net Asset Value, End of Period | $320.83 | $253.44 | $182.31 | $134.21 | $140.55 |
| Total Return | 27.26% | 40.16% | 37.26% | -3.32% | 27.80% |
| Ratios/Supplemental Data | |||||
| Net Assets, End of Period (Millions) | $90,506 | $68,474 | $46,481 | $32,489 | $31,399 |
| Ratio of Total Expenses to Average Net Assets | 0.04% | 0.04% | 0.04% | 0.04% | 0.05% |
| Ratio of Net Investment Income to Average Net Assets | 0.52% | 0.81% | 1.09% | 1.21% | 1.27% |
| Portfolio Turnover Rate2 | 8% | 6% | 11% | 11% | 8% |
| 1 | Calculated based on average shares outstanding. |
| 2 | Excludes the value of portfolio securities received or delivered as a result of in-kind purchases or redemptions of the fund’s capital shares, including ETF Creation Units. |
| Admiral Shares | |||||
| For a Share Outstanding Throughout Each Period | Year Ended December 31, | ||||
| 2021 | 2020 | 2019 | 2018 | 2017 | |
| Net Asset Value, Beginning of Period | $130.46 | $93.84 | $69.09 | $72.35 | $57.31 |
| Investment Operations | |||||
| Net Investment Income1 | .748 | .855 | .907 | .921 | .836 |
| Net Realized and Unrealized Gain (Loss) on Investments | 34.720 | 36.621 | 24.728 | (3.274) | 15.032 |
| Total from Investment Operations | 35.468 | 37.476 | 25.635 | (2.353) | 15.868 |
| Distributions | |||||
| Dividends from Net Investment Income | (.778) | (.856) | (.885) | (.907) | (.828) |
| Distributions from Realized Capital Gains | — | — | — | — | — |
| Total Distributions | (.778) | (.856) | (.885) | (.907) | (.828) |
| Net Asset Value, End of Period | $165.15 | $130.46 | $93.84 | $69.09 | $72.35 |
| Total Return2 | 27.26% | 40.19% | 37.23% | -3.34% | 27.80% |
| Ratios/Supplemental Data | |||||
| Net Assets, End of Period (Millions) | $68,372 | $53,928 | $38,103 | $25,609 | $26,013 |
| Ratio of Total Expenses to Average Net Assets | 0.05% | 0.05% | 0.05% | 0.05% | 0.05% |
| Ratio of Net Investment Income to Average Net Assets | 0.51% | 0.80% | 1.08% | 1.20% | 1.27% |
| Portfolio Turnover Rate3 | 8% | 6% | 11% | 11% | 8% |
| 1 | Calculated based on average shares outstanding. |
| 2 | Total returns do not include account service fees that may have applied in the periods shown. Fund prospectuses provide information about any applicable account service fees. |
| 3 | Excludes the value of portfolio securities received or delivered as a result of in-kind purchases or redemptions of the fund’s capital shares, including ETF Creation Units. |
| Institutional Shares | |||||
| For a Share Outstanding Throughout Each Period | Year Ended December 31, | ||||
| 2021 | 2020 | 2019 | 2018 | 2017 | |
| Net Asset Value, Beginning of Period | $130.47 | $93.85 | $69.09 | $72.35 | $57.31 |
| Investment Operations | |||||
| Net Investment Income1 | .762 | .867 | .912 | .928 | .841 |
| Net Realized and Unrealized Gain (Loss) on Investments | 34.721 | 36.620 | 24.742 | (3.274) | 15.032 |
| Total from Investment Operations | 35.483 | 37.487 | 25.654 | (2.346) | 15.873 |
| Distributions | |||||
| Dividends from Net Investment Income | (.793) | (.867) | (.894) | (.914) | (.833) |
| Distributions from Realized Capital Gains | — | — | — | — | — |
| Total Distributions | (.793) | (.867) | (.894) | (.914) | (.833) |
| Net Asset Value, End of Period | $165.16 | $130.47 | $93.85 | $69.09 | $72.35 |
| Total Return | 27.27% | 40.20% | 37.26% | -3.33% | 27.81% |
| Ratios/Supplemental Data | |||||
| Net Assets, End of Period (Millions) | $27,688 | $22,582 | $16,426 | $12,400 | $12,495 |
| Ratio of Total Expenses to Average Net Assets | 0.04% | 0.04% | 0.04% | 0.04% | 0.04% |
| Ratio of Net Investment Income to Average Net Assets | 0.52% | 0.82% | 1.09% | 1.21% | 1.28% |
| Portfolio Turnover Rate2 | 8% | 6% | 11% | 11% | 8% |
| 1 | Calculated based on average shares outstanding. |
| 2 | Excludes the value of portfolio securities received or delivered as a result of in-kind purchases or redemptions of the fund’s capital shares, including ETF Creation Units. |
| A. | The following significant accounting policies conform to generally accepted accounting principles for U.S. investment companies. The fund consistently follows such policies in preparing its financial statements. |
| B. | In accordance with the terms of a Funds' Service Agreement (the “FSA”) between Vanguard and the fund, Vanguard furnishes to the fund investment advisory, corporate management, administrative, marketing, and distribution services at Vanguard’s cost of operations (as defined by the FSA). These costs of operations are allocated to the fund based on methods and guidelines approved by the board of trustees and are generally settled twice a month. |
| C. | Various inputs may be used to determine the value of the fund’s investments and derivatives. These inputs are summarized in three broad levels for financial statement purposes. The inputs or methodologies used to value securities are not necessarily an indication of the risk associated with investing in those securities. |
| Level 1 ($000) | Level 2 ($000) | Level 3 ($000) | Total ($000) | |
| Investments | ||||
| Assets | ||||
| Common Stocks | 187,067,929 | — | — | 187,067,929 |
| Temporary Cash Investments | 638,081 | — | — | 638,081 |
| Total | 187,706,010 | — | — | 187,706,010 |
| Derivative Financial Instruments | ||||
| Assets | ||||
| Futures Contracts1 | 2,853 | — | — | 2,853 |
| Swap Contracts | — | 169 | — | 169 |
| Total | 2,853 | 169 | — | 3,022 |
| Liabilities | ||||
| Swap Contracts | — | 4 | — | 4 |
| 1 | Includes cumulative appreciation (depreciation) on futures contracts and centrally cleared swaps, if any, as reported in the Schedule of Investments. Only current day’s variation margin is reported within the Statement of Assets and Liabilities. |
| D. | Permanent differences between book-basis and tax-basis components of net assets are reclassified among capital accounts in the financial statements to reflect their tax character. These reclassifications have no effect on net assets or net asset value per share. As of period end, permanent differences primarily attributable to the accounting for in-kind redemptions and swap agreements were reclassified between the following accounts: |
| Amount ($000) | |
| Paid-in Capital | 9,338,210 |
| Total Distributable Earnings (Loss) | (9,338,210) |
| Amount ($000) | |
| Undistributed Ordinary Income | 2,964 |
| Undistributed Long-Term Gains | — |
| Capital Loss Carryforwards | (3,157,351) |
| Qualified Late-Year Losses | — |
| Net Unrealized Gains (Losses) | 113,457,926 |
| Year Ended December 31, | ||
| 2021 Amount ($000) | 2020 Amount ($000) | |
| Ordinary Income* | 885,128 | 961,579 |
| Long-Term Capital Gains | — | — |
| Total | 885,128 | 961,579 |
| * | Includes short-term capital gains, if any. |
| Amount ($000) | |
| Tax Cost | 74,248,084 |
| Gross Unrealized Appreciation | 116,111,882 |
| Gross Unrealized Depreciation | (2,653,956) |
| Net Unrealized Appreciation (Depreciation) | 113,457,926 |
| E. | During the year ended December 31, 2021, the fund purchased $30,292,855,000 of investment securities and sold $27,767,637,000 of investment securities, other than temporary cash investments. Purchases and sales include $17,051,886,000 and $15,285,667,000, respectively, in connection with in-kind purchases and redemptions of the fund's capital shares. |
| F. | Capital share transactions for each class of shares were: |
| Year Ended December 31, | |||||
| 2021 | 2020 | ||||
| Amount ($000) | Shares (000) | Amount ($000) | Shares (000) | ||
| Investor Shares | |||||
| Issued | 72,222 | 492 | 111,192 | 1,046 | |
| Issued in Lieu of Cash Distributions | 2,919 | 20 | 4,183 | 41 | |
| Redeemed | (303,886) | (2,069) | (145,224) | (1,439) | |
| Net Increase (Decrease)—Investor Shares | (228,745) | (1,557) | (29,849) | (352) | |
| Year Ended December 31, | |||||
| 2021 | 2020 | ||||
| Amount ($000) | Shares (000) | Amount ($000) | Shares (000) | ||
| ETF Shares | |||||
| Issued | 18,729,170 | 64,747 | 13,029,182 | 63,516 | |
| Issued in Lieu of Cash Distributions | — | — | — | — | |
| Redeemed | (15,253,701) | (52,825) | (10,437,755) | (48,300) | |
| Net Increase (Decrease)—ETF Shares | 3,475,469 | 11,922 | 2,591,427 | 15,216 | |
| Admiral Shares | |||||
| Issued | 9,587,947 | 66,521 | 10,835,142 | 105,463 | |
| Issued in Lieu of Cash Distributions | 286,028 | 1,930 | 311,604 | 3,035 | |
| Redeemed | (9,849,779) | (67,814) | (10,404,005) | (101,164) | |
| Net Increase (Decrease)—Admiral Shares | 24,196 | 637 | 742,741 | 7,334 | |
| Institutional Shares | |||||
| Issued | 3,444,250 | 23,706 | 3,743,543 | 35,924 | |
| Issued in Lieu of Cash Distributions | 126,911 | 856 | 141,051 | 1,375 | |
| Redeemed | (4,268,797) | (29,999) | (4,204,054) | (39,249) | |
| Net Increase (Decrease)—Institutional Shares | (697,636) | (5,437) | (319,460) | (1,950) | |
| G. | Management has determined that no events or transactions occurred subsequent to December 31, 2021, that would require recognition or disclosure in these financial statements. |

| Average Annual Total Returns Periods Ended December 31, 2021 | |||||
| One Year | Five Years | Ten Years | Final Value of a $10,000 Investment | ||
| Value Index Fund Investor Shares | 26.31% | 12.38% | 13.59% | $35,766 |
| Spliced Value Index | 26.51 | 12.53 | 13.78 | 36,360 |
| Dow Jones U.S. Total Stock Market Float Adjusted Index | 25.66 | 17.92 | 16.24 | 45,050 |
| One Year | Five Years | Ten Years | Final Value of a $10,000 Investment | ||
| Value Index Fund ETF Shares Net Asset Value | 26.47% | 12.51% | 13.74% | $36,228 | |
| Value Index Fund ETF Shares Market Price | 26.41 | 12.50 | 13.74 | 36,222 | |
| Spliced Value Index | 26.51 | 12.53 | 13.78 | 36,360 | |
| Dow Jones U.S. Total Stock Market Float Adjusted Index | 25.66 | 17.92 | 16.24 | 45,050 | |
| Average Annual Total Returns Periods Ended December 31, 2021 | |||||
| One Year | Five Years | Ten Years | Final Value of a $10,000 Investment | ||
| Value Index Fund Admiral Shares | 26.49% | 12.52% | 13.74% | $36,236 | |
| Spliced Value Index | 26.51 | 12.53 | 13.78 | 36,360 | |
| Dow Jones U.S. Total Stock Market Float Adjusted Index | 25.66 | 17.92 | 16.24 | 45,050 | |
| One Year | Five Years | Ten Years | Final Value of a $5,000,000 Investment | ||
| Value Index Fund Institutional Shares | 26.48% | 12.52% | 13.75% | $18,134,181 | |
| Spliced Value Index | 26.51 | 12.53 | 13.78 | 18,180,054 | |
| Dow Jones U.S. Total Stock Market Float Adjusted Index | 25.66 | 17.92 | 16.24 | 22,525,162 | |
| One Year | Five Years | Ten Years | |
| Value Index Fund ETF Shares Market Price | 26.41% | 80.20% | 262.22% |
| Value Index Fund ETF Shares Net Asset Value | 26.47 | 80.30 | 262.28 |
| Spliced Value Index | 26.51 | 80.46 | 263.60 |
| Basic Materials | 2.3% |
| Consumer Discretionary | 5.9 |
| Consumer Staples | 10.5 |
| Energy | 5.4 |
| Financials | 20.7 |
| Health Care | 19.2 |
| Industrials | 13.9 |
| Real Estate | 3.5 |
| Technology | 7.4 |
| Telecommunications | 5.2 |
| Utilities | 6.0 |
| Shares | Market Value• ($000) | ||
| Common Stocks (99.9%) | |||
| Basic Materials (2.3%) | |||
| Air Products and Chemicals Inc. | 1,692,924 | 515,089 | |
| Freeport-McMoRan Inc. | 11,225,561 | 468,443 | |
| Newmont Corp. | 6,095,964 | 378,072 | |
| Dow Inc. | 5,653,820 | 320,685 | |
| International Flavors & Fragrances Inc. | 1,945,797 | 293,134 | |
| Nucor Corp. | 2,184,813 | 249,396 | |
| LyondellBasell Industries NV Class A | 2,035,020 | 187,690 | |
| Celanese Corp. Class A | 832,263 | 139,870 | |
| International Paper Co. | 2,960,404 | 139,080 | |
| Avery Dennison Corp. | 633,000 | 137,089 | |
| Eastman Chemical Co. | 1,027,678 | 124,256 | |
| FMC Corp. | 968,171 | 106,392 | |
| Albemarle Corp. | 447,135 | 104,527 | |
| CF Industries Holdings Inc. | 819,731 | 58,021 | |
| Westlake Chemical Corp. | 122,734 | 11,921 | |
| 3,233,665 | |||
| Consumer Discretionary (5.9%) | |||
| Walmart Inc. | 10,658,381 | 1,542,161 | |
| Target Corp. | 3,662,765 | 847,710 | |
| Ford Motor Co. | 30,007,330 | 623,252 | |
| * | General Motors Co. | 9,988,828 | 585,645 |
| eBay Inc. | 4,546,410 | 302,336 | |
| DR Horton Inc. | 2,589,177 | 280,796 | |
| Lennar Corp. Class A | 2,157,814 | 250,652 | |
| * | Dollar Tree Inc. | 1,719,634 | 241,643 |
| VF Corp. | 2,702,280 | 197,861 | |
| Activision Blizzard Inc. | 2,972,415 | 197,755 | |
| * | Southwest Airlines Co. | 4,525,084 | 193,855 |
| * | Delta Air Lines Inc. | 4,892,672 | 191,206 |
| Best Buy Co. Inc. | 1,692,268 | 171,934 | |
| * | CarMax Inc. | 1,239,299 | 161,394 |
| Garmin Ltd. | 1,176,205 | 160,164 | |
| Genuine Parts Co. | 1,088,841 | 152,655 | |
| Darden Restaurants Inc. | 992,177 | 149,462 | |
| MGM Resorts International | 3,045,030 | 136,661 | |
| ViacomCBS Inc. Class B | 4,404,349 | 132,923 | |
| * | Carnival Corp. | 6,374,653 | 128,258 |
| Omnicom Group Inc. | 1,625,355 | 119,090 | |
| Shares | Market Value• ($000) | ||
| Advance Auto Parts Inc. | 476,741 | 114,361 | |
| LKQ Corp. | 1,894,292 | 113,714 | |
| Whirlpool Corp. | 464,401 | 108,976 | |
| * | United Airlines Holdings Inc. | 2,473,941 | 108,309 |
| PulteGroup Inc. | 1,839,031 | 105,119 | |
| Hasbro Inc. | 1,001,746 | 101,958 | |
| Fox Corp. Class A | 2,401,304 | 88,608 | |
| News Corp. Class A | 3,876,193 | 86,478 | |
| BorgWarner Inc. (XNYS) | 1,832,989 | 82,613 | |
| Bath & Body Works Inc. | 959,904 | 66,992 | |
| * | Liberty Media Corp.- Liberty SiriusXM Class C | 1,192,276 | 60,627 |
| * | Las Vegas Sands Corp. | 1,608,625 | 60,549 |
| *,1 | Lucid Group Inc. | 1,573,090 | 59,856 |
| Interpublic Group of Cos. Inc. | 1,505,618 | 56,385 | |
| * | Discovery Inc. Class C | 2,393,680 | 54,815 |
| * | American Airlines Group Inc. | 2,473,941 | 44,432 |
| Lear Corp. | 227,878 | 41,690 | |
| Fox Corp. Class B | 1,196,879 | 41,017 | |
| *,1 | GameStop Corp. Class A | 248,587 | 36,888 |
| * | Liberty Media Corp.- Liberty SiriusXM Class A | 589,274 | 29,965 |
| *,1 | Discovery Inc. Class A | 1,233,337 | 29,033 |
| ViacomCBS Inc. Class A | 79,655 | 2,658 | |
| Lennar Corp. Class B | 15,603 | 1,492 | |
| News Corp. Class B | 27,910 | 628 | |
| Aramark | 1,466 | 54 | |
| 8,264,630 | |||
| Consumer Staples (10.5%) | |||
| Procter & Gamble Co. | 18,499,295 | 3,026,115 | |
| PepsiCo Inc. | 10,569,699 | 1,836,062 | |
| Coca-Cola Co. | 29,717,745 | 1,759,588 | |
| Philip Morris International Inc. | 11,901,197 | 1,130,614 | |
| CVS Health Corp. | 10,091,138 | 1,041,002 | |
| Mondelez International Inc. Class A | 10,663,978 | 707,128 | |
| Altria Group Inc. | 14,042,948 | 665,495 | |
| Kimberly-Clark Corp. | 2,573,991 | 367,875 | |
| General Mills Inc. | 4,630,060 | 311,973 | |
| Sysco Corp. | 3,918,502 | 307,798 | |
| Shares | Market Value• ($000) | ||
| Constellation Brands Inc. Class A | 1,192,990 | 299,405 | |
| Walgreens Boots Alliance Inc. | 5,624,455 | 293,372 | |
| McKesson Corp. | 1,167,205 | 290,132 | |
| Archer-Daniels-Midland Co. | 4,276,654 | 289,059 | |
| Colgate-Palmolive Co. | 3,216,535 | 274,499 | |
| Corteva Inc. | 5,582,586 | 263,945 | |
| Keurig Dr Pepper Inc. | 5,961,343 | 219,735 | |
| Tyson Foods Inc. Class A | 2,253,403 | 196,407 | |
| Kroger Co. | 4,116,068 | 186,293 | |
| Kraft Heinz Co. | 5,151,661 | 184,945 | |
| McCormick & Co. Inc. | 1,904,654 | 184,009 | |
| Clorox Co. | 939,203 | 163,759 | |
| AmerisourceBergen Corp. Class A | 1,113,677 | 147,996 | |
| Kellogg Co. | 1,955,607 | 125,980 | |
| Conagra Brands Inc. | 3,666,987 | 125,228 | |
| J M Smucker Co. | 786,994 | 106,889 | |
| Hormel Foods Corp. | 2,073,728 | 101,219 | |
| Campbell Soup Co. | 1,501,037 | 65,235 | |
| Molson Coors Beverage Co. Class B | 688,653 | 31,919 | |
| Lamb Weston Holdings Inc. | 278,625 | 17,659 | |
| 14,721,335 | |||
| Energy (5.4%) | |||
| Exxon Mobil Corp. | 32,363,195 | 1,980,304 | |
| Chevron Corp. | 14,736,169 | 1,729,289 | |
| ConocoPhillips | 10,082,881 | 727,782 | |
| EOG Resources Inc. | 4,472,646 | 397,305 | |
| Schlumberger NV | 10,722,185 | 321,130 | |
| Marathon Petroleum Corp. | 4,706,083 | 301,142 | |
| Kinder Morgan Inc. | 15,598,617 | 247,394 | |
| Phillips 66 | 3,349,522 | 242,706 | |
| Williams Cos. Inc. | 9,288,217 | 241,865 | |
| Valero Energy Corp. | 3,125,287 | 234,740 | |
| Devon Energy Corp. | 5,171,191 | 227,791 | |
| ONEOK Inc. | 3,408,882 | 200,306 | |
| Occidental Petroleum Corp. | 6,782,775 | 196,633 | |
| Hess Corp. | 2,130,901 | 157,751 | |
| Baker Hughes Co. Class A | 6,325,386 | 152,189 | |
| Halliburton Co. | 6,500,153 | 148,659 | |
| 7,506,986 | |||
| Financials (20.7%) | |||
| * | Berkshire Hathaway Inc. Class B | 13,377,992 | 4,000,020 |
| JPMorgan Chase & Co. | 22,591,690 | 3,577,394 | |
| Bank of America Corp. | 53,185,719 | 2,366,233 | |
| Wells Fargo & Co. | 30,481,473 | 1,462,501 | |
| Morgan Stanley | 10,974,255 | 1,077,233 | |
| Charles Schwab Corp. | 11,769,505 | 989,815 | |
| Goldman Sachs Group Inc. | 2,578,740 | 986,497 | |
| BlackRock Inc. | 1,045,220 | 956,962 | |
| Citigroup Inc. | 15,169,258 | 916,071 | |
| Blackstone Inc. | 5,250,770 | 679,397 | |
| Marsh & McLennan Cos. Inc. | 3,859,674 | 670,889 | |
| PNC Financial Services Group Inc. | 3,230,901 | 647,860 | |
| CME Group Inc. | 2,747,437 | 627,679 | |
| Shares | Market Value• ($000) | ||
| Truist Financial Corp. | 10,204,617 | 597,480 | |
| Intercontinental Exchange Inc. | 4,307,075 | 589,079 | |
| US Bancorp | 10,201,497 | 573,018 | |
| Chubb Ltd. | 2,798,952 | 541,065 | |
| Progressive Corp. | 4,467,435 | 458,582 | |
| American International Group Inc. | 6,347,603 | 360,925 | |
| T Rowe Price Group Inc. | 1,718,176 | 337,862 | |
| Bank of New York Mellon Corp. | 5,682,262 | 330,026 | |
| KKR & Co. Inc. | 4,248,484 | 316,512 | |
| Prudential Financial Inc. | 2,889,818 | 312,794 | |
| MetLife Inc. | 4,822,988 | 301,389 | |
| Travelers Cos. Inc. | 1,880,681 | 294,195 | |
| Arthur J Gallagher & Co. | 1,584,550 | 268,851 | |
| Aflac Inc. | 4,551,428 | 265,758 | |
| Discover Financial Services | 2,240,483 | 258,910 | |
| Ameriprise Financial Inc. | 855,392 | 258,038 | |
| Allstate Corp. | 2,191,589 | 257,840 | |
| State Street Corp. | 2,655,358 | 246,948 | |
| Fifth Third Bancorp | 5,226,888 | 227,631 | |
| Willis Towers Watson plc | 952,597 | 226,232 | |
| Nasdaq Inc. | 894,912 | 187,940 | |
| Northern Trust Corp. | 1,508,208 | 180,397 | |
| Hartford Financial Services Group Inc. | 2,601,834 | 179,631 | |
| Huntington Bancshares Inc. | 11,057,603 | 170,508 | |
| KeyCorp. | 7,117,573 | 164,629 | |
| Regions Financial Corp. | 7,287,205 | 158,861 | |
| Citizens Financial Group Inc. | 3,258,006 | 153,941 | |
| M&T Bank Corp. | 983,711 | 151,078 | |
| Principal Financial Group Inc. | 2,026,322 | 146,564 | |
| Raymond James Financial Inc. | 1,418,537 | 142,421 | |
| Cincinnati Financial Corp. | 1,170,257 | 133,327 | |
| Ally Financial Inc. | 2,648,575 | 126,099 | |
| * | Arch Capital Group Ltd. | 2,804,537 | 124,662 |
| Fidelity National Financial Inc. | 2,066,427 | 107,826 | |
| Cboe Global Markets Inc. | 815,242 | 106,308 | |
| Equitable Holdings Inc. | 3,095,582 | 101,504 | |
| Loews Corp. | 1,648,730 | 95,231 | |
| Annaly Capital Management Inc. | 11,087,917 | 86,707 | |
| W R Berkley Corp. | 1,012,830 | 83,447 | |
| Everest Re Group Ltd. | 300,984 | 82,446 | |
| Franklin Resources Inc. | 2,301,634 | 77,082 | |
| * | Markel Corp. | 52,190 | 64,402 |
| Lincoln National Corp. | 656,307 | 44,799 | |
| * | Alleghany Corp. | 49,707 | 33,184 |
| Globe Life Inc. | 348,024 | 32,617 | |
| Interactive Brokers Group Inc. Class A | 336,816 | 26,750 | |
| Rocket Cos. Inc. Class A | 1,033,069 | 14,463 | |
| * | Berkshire Hathaway Inc. Class A | 14 | 6,309 |
| Shares | Market Value• ($000) | ||
| 1 | UWM Holdings Corp. | 689,992 | 4,085 |
| 28,968,904 | |||
| Health Care (19.2%) | |||
| UnitedHealth Group Inc. | 7,199,926 | 3,615,371 | |
| Johnson & Johnson | 20,124,697 | 3,442,732 | |
| Pfizer Inc. | 42,906,904 | 2,533,653 | |
| Abbott Laboratories | 13,517,595 | 1,902,466 | |
| AbbVie Inc. | 13,514,395 | 1,829,849 | |
| Eli Lilly & Co. | 6,581,349 | 1,817,900 | |
| Merck & Co. Inc. | 19,309,380 | 1,479,871 | |
| Medtronic plc | 10,280,774 | 1,063,546 | |
| Bristol-Myers Squibb Co. | 16,967,917 | 1,057,950 | |
| Amgen Inc. | 4,305,904 | 968,699 | |
| Anthem Inc. | 1,855,426 | 860,064 | |
| Danaher Corp. | 2,458,120 | 808,746 | |
| Gilead Sciences Inc. | 9,588,993 | 696,257 | |
| Cigna Corp. | 2,533,683 | 581,810 | |
| Becton Dickinson and Co. | 2,171,258 | 546,028 | |
| HCA Healthcare Inc. | 1,783,492 | 458,215 | |
| Humana Inc. | 982,589 | 455,784 | |
| * | Centene Corp. | 4,460,567 | 367,551 |
| Baxter International Inc. | 3,824,515 | 328,296 | |
| * | Biogen Inc. | 1,122,909 | 269,408 |
| * | Laboratory Corp. of America Holdings | 731,565 | 229,865 |
| Cerner Corp. | 2,247,465 | 208,722 | |
| Zimmer Biomet Holdings Inc. | 1,597,000 | 202,883 | |
| Quest Diagnostics Inc. | 937,827 | 162,253 | |
| * | Hologic Inc. | 1,922,009 | 147,149 |
| Viatris Inc. | 9,245,494 | 125,092 | |
| Cardinal Health Inc. | 2,154,167 | 110,918 | |
| Royalty Pharma plc Class A | 2,462,762 | 98,141 | |
| * | Elanco Animal Health Inc. (XNYS) | 3,435,789 | 97,508 |
| DENTSPLY SIRONA Inc. | 1,671,217 | 93,237 | |
| STERIS plc | 382,159 | 93,021 | |
| * | Henry Schein Inc. | 1,060,130 | 82,192 |
| Universal Health Services Inc. Class B | 531,073 | 68,859 | |
| Teleflex Inc. | 178,806 | 58,734 | |
| * | DaVita Inc. | 467,365 | 53,167 |
| *,1 | Ginkgo Bioworks Holdings Inc. | 680,398 | 5,654 |
| * | agilon health Inc. | 451 | 12 |
| 26,921,603 | |||
| Industrials (13.9%) | |||
| Honeywell International Inc. | 5,262,636 | 1,097,312 | |
| Raytheon Technologies Corp. | 11,442,145 | 984,711 | |
| Caterpillar Inc. | 4,135,230 | 854,917 | |
| General Electric Co. | 8,394,588 | 793,037 | |
| 3M Co. | 4,405,152 | 782,487 | |
| Deere & Co. | 2,133,215 | 731,458 | |
| American Express Co. | 4,440,943 | 726,538 | |
| CSX Corp. | 16,955,719 | 637,535 | |
| Lockheed Martin Corp. | 1,791,983 | 636,889 | |
| Union Pacific Corp. | 2,457,247 | 619,054 | |
| United Parcel Service Inc. Class B | 2,787,011 | 597,368 | |
| Norfolk Southern Corp. | 1,860,268 | 553,820 | |
| Shares | Market Value• ($000) | ||
| Illinois Tool Works Inc. | 2,159,504 | 532,966 | |
| Eaton Corp. plc | 3,047,082 | 526,597 | |
| Fidelity National Information Services Inc. | 4,651,443 | 507,705 | |
| FedEx Corp. | 1,827,704 | 472,717 | |
| Capital One Financial Corp. | 3,253,924 | 472,112 | |
| Johnson Controls International plc | 5,384,403 | 437,806 | |
| Emerson Electric Co. | 4,547,704 | 422,800 | |
| Northrop Grumman Corp. | 1,090,766 | 422,203 | |
| General Dynamics Corp. | 1,814,343 | 378,236 | |
| Trane Technologies plc | 1,815,898 | 366,866 | |
| Carrier Global Corp. | 6,624,594 | 359,318 | |
| DuPont de Nemours Inc. | 3,960,628 | 319,940 | |
| L3Harris Technologies Inc. | 1,500,107 | 319,883 | |
| PPG Industries Inc. | 1,814,792 | 312,943 | |
| Parker-Hannifin Corp. | 982,439 | 312,534 | |
| Otis Worldwide Corp. | 3,247,075 | 282,723 | |
| AMETEK Inc. | 1,768,426 | 260,029 | |
| * | TransDigm Group Inc. | 401,299 | 255,339 |
| Cummins Inc. | 1,093,407 | 238,516 | |
| Stanley Black & Decker Inc. | 1,246,317 | 235,080 | |
| PACCAR Inc. | 2,389,013 | 210,854 | |
| Dover Corp. | 1,100,678 | 199,883 | |
| Fortive Corp. | 2,604,106 | 198,667 | |
| Synchrony Financial | 4,183,698 | 194,082 | |
| Ingersoll Rand Inc. | 3,115,761 | 192,772 | |
| * | United Rentals Inc. | 553,469 | 183,912 |
| WW Grainger Inc. | 334,788 | 173,501 | |
| Xylem Inc. | 1,378,427 | 165,301 | |
| Jacobs Engineering Group Inc. | 985,794 | 137,252 | |
| Masco Corp. | 1,866,063 | 131,035 | |
| Textron Inc. | 1,685,051 | 130,086 | |
| Westinghouse Air Brake Technologies Corp. | 1,356,901 | 124,984 | |
| Ball Corp. | 1,237,981 | 119,180 | |
| Fortune Brands Home & Security Inc. | 1,037,707 | 110,931 | |
| Crown Holdings Inc. | 977,573 | 108,139 | |
| CH Robinson Worldwide Inc. | 993,701 | 106,952 | |
| Martin Marietta Materials Inc. | 238,371 | 105,007 | |
| Packaging Corp. of America | 726,120 | 98,861 | |
| Westrock Co. | 2,025,903 | 89,869 | |
| Snap-on Inc. | 410,715 | 88,460 | |
| * | FleetCor Technologies Inc. | 294,425 | 65,904 |
| Hubbell Inc. Class B | 207,673 | 43,252 | |
| * | Mohawk Industries Inc. | 207,152 | 37,739 |
| Western Union Co. | 1,538,893 | 27,454 | |
| * | Marqeta Inc. Class A | 533,102 | 9,153 |
| *,1 | Aurora Innovation Inc. | 368,043 | 4,144 |
| * | GreenSky Inc. Class A | 50,067 | 569 |
| * | XPO Logistics Inc. | 570 | 44 |
| 19,509,426 |
| Shares | Market Value• ($000) | ||
| Real Estate (3.4%) | |||
| Prologis Inc. | 5,654,950 | 952,067 | |
| Simon Property Group Inc. | 2,512,020 | 401,345 | |
| Welltower Inc. | 3,327,243 | 285,378 | |
| AvalonBay Communities Inc. | 1,068,208 | 269,819 | |
| Alexandria Real Estate Equities Inc. | 1,183,730 | 263,924 | |
| * | CBRE Group Inc. Class A | 2,430,507 | 263,734 |
| Equity Residential | 2,723,364 | 246,465 | |
| Weyerhaeuser Co. | 5,726,117 | 235,802 | |
| Extra Space Storage Inc. | 1,023,514 | 232,061 | |
| Mid-America Apartment Communities Inc. | 880,116 | 201,934 | |
| Duke Realty Corp. | 2,911,514 | 191,112 | |
| Essex Property Trust Inc. | 497,538 | 175,248 | |
| Ventas Inc. | 3,050,888 | 155,961 | |
| Realty Income Corp. | 2,162,645 | 154,824 | |
| Healthpeak Properties Inc. | 4,120,859 | 148,722 | |
| Camden Property Trust | 781,168 | 139,579 | |
| Boston Properties Inc. | 1,074,621 | 123,775 | |
| WP Carey Inc. | 1,424,043 | 116,843 | |
| Iron Mountain Inc. | 2,213,345 | 115,824 | |
| UDR Inc. | 1,181,657 | 70,888 | |
| Regency Centers Corp. | 654,510 | 49,317 | |
| * | Host Hotels & Resorts Inc. | 2,729,030 | 47,458 |
| * | Orion Office REIT Inc. | 18 | — |
| 4,842,080 | |||
| Technology (7.4%) | |||
| Broadcom Inc. | 2,989,210 | 1,989,050 | |
| Intel Corp. | 31,089,703 | 1,601,120 | |
| Oracle Corp. | 12,538,898 | 1,093,517 | |
| International Business Machines Corp. | 6,575,528 | 878,885 | |
| QUALCOMM Inc. | 4,280,890 | 782,846 | |
| Analog Devices Inc. | 4,108,251 | 722,107 | |
| TE Connectivity Ltd. | 2,494,485 | 402,460 | |
| Cognizant Technology Solutions Corp. Class A | 4,015,295 | 356,237 | |
| HP Inc. | 8,810,788 | 331,903 | |
| * | ON Semiconductor Corp. | 3,290,861 | 223,515 |
| Corning Inc. | 5,871,473 | 218,595 | |
| CDW Corp. | 1,037,561 | 212,472 | |
| VMware Inc. Class A | 1,602,779 | 185,730 | |
| Seagate Technology Holdings plc | 1,616,661 | 182,650 | |
| Hewlett Packard Enterprise Co. | 9,999,339 | 157,690 | |
| NetApp Inc. | 1,709,484 | 157,256 | |
| * | Western Digital Corp. | 2,381,900 | 155,324 |
| * | Qorvo Inc. | 842,620 | 131,777 |
| * | Dell Technologies Inc. Class C | 2,112,308 | 118,648 |
| NortonLifeLock Inc. | 4,224,918 | 109,763 | |
| Citrix Systems Inc. | 953,413 | 90,183 | |
| * | UiPath Inc. Class A | 1,976,894 | 85,264 |
| * | Akamai Technologies Inc. | 620,101 | 72,577 |
| * | F5 Inc. | 234,015 | 57,266 |
| Shares | Market Value• ($000) | ||
| Leidos Holdings Inc. | 536,409 | 47,687 | |
| 10,364,522 | |||
| Telecommunications (5.2%) | |||
| Cisco Systems Inc. | 29,017,069 | 1,838,812 | |
| Comcast Corp. Class A | 34,855,645 | 1,754,285 | |
| Verizon Communications Inc. | 28,882,781 | 1,500,749 | |
| AT&T Inc. | 54,589,054 | 1,342,891 | |
| * | T-Mobile US Inc. | 4,296,892 | 498,353 |
| Motorola Solutions Inc. | 645,578 | 175,404 | |
| Lumen Technologies Inc. | 7,827,844 | 98,239 | |
| * | DISH Network Corp. Class A | 1,884,171 | 61,122 |
| Juniper Networks Inc. | 1,241,639 | 44,339 | |
| * | Altice USA Inc. Class A | 410,877 | 6,648 |
| 7,320,842 | |||
| Utilities (6.0%) | |||
| NextEra Energy Inc. | 14,574,416 | 1,360,668 | |
| Duke Energy Corp. | 5,878,583 | 616,663 | |
| Southern Co. | 8,101,677 | 555,613 | |
| Waste Management Inc. | 3,197,891 | 533,728 | |
| Dominion Energy Inc. | 6,191,218 | 486,382 | |
| Exelon Corp. | 7,467,039 | 431,296 | |
| American Electric Power Co. Inc. | 3,850,130 | 342,546 | |
| Sempra Energy (XNYS) | 2,408,598 | 318,609 | |
| Xcel Energy Inc. | 4,117,890 | 278,781 | |
| American Water Works Co. Inc. | 1,387,644 | 262,071 | |
| Public Service Enterprise Group Inc. | 3,865,454 | 257,942 | |
| Eversource Energy | 2,628,184 | 239,112 | |
| WEC Energy Group Inc. | 2,411,155 | 234,051 | |
| Consolidated Edison Inc. | 2,704,201 | 230,722 | |
| Republic Services Inc. Class A | 1,575,674 | 219,728 | |
| Edison International | 2,904,161 | 198,209 | |
| * | PG&E Corp. | 15,062,793 | 182,862 |
| Ameren Corp. | 1,952,447 | 173,787 | |
| FirstEnergy Corp. | 4,161,847 | 173,091 | |
| Entergy Corp. | 1,536,405 | 173,076 | |
| PPL Corp. | 5,738,697 | 172,505 | |
| DTE Energy Co. | 1,332,998 | 159,347 | |
| CMS Energy Corp. | 2,214,520 | 144,055 | |
| CenterPoint Energy Inc. | 4,807,208 | 134,169 | |
| Evergy Inc. | 1,735,370 | 119,064 | |
| AES Corp. | 4,842,094 | 117,663 | |
| Alliant Energy Corp. | 1,913,837 | 117,644 | |
| Vistra Corp. | 3,689,395 | 84,008 | |
| NiSource Inc. | 3,002,038 | 82,886 | |
| Avangrid Inc. | 591,218 | 29,490 | |
| NRG Energy Inc. | 1,425 | 61 | |
| 8,429,829 | |||
| Total Common Stocks (Cost $97,453,717) | 140,083,822 | ||
| Shares | Market Value• ($000) | ||
| Temporary Cash Investments (0.1%) | |||
| Money Market Fund (0.1%) | |||
| 2,3 | Vanguard Market Liquidity Fund, 0.090% (Cost $145,991) | 1,460,126 | 145,998 |
| Total Investments (100.0%) (Cost $97,599,708) | 140,229,820 | ||
| Other Assets and Liabilities—Net (0.0%) | (3,711) | ||
| Net Assets (100%) | 140,226,109 | ||
| Cost is in $000. | |||
| • | See Note A in Notes to Financial Statements. |
| * | Non-income-producing security. |
| 1 | Includes partial security positions on loan to broker-dealers. The total value of securities on loan is $110,062,000. |
| 2 | Affiliated money market fund available only to Vanguard funds and certain trusts and accounts managed by Vanguard. Rate shown is the 7-day yield. |
| 3 | Collateral of $117,752,000 was received for securities on loan, of which $117,748,000 is held in Vanguard Market Liquidity Fund and $4,000 is held in cash. |
| REIT—Real Estate Investment Trust. |
| Futures Contracts | ||||
| ($000) | ||||
| Expiration | Number of Long (Short) Contracts | Notional Amount | Value and Unrealized Appreciation (Depreciation) | |
| Long Futures Contracts | ||||
| E-mini S&P 500 Index | March 2022 | 208 | 49,488 | (137) |
| Over-the-Counter Total Return Swaps | ||||||
| Reference Entity | Termination Date | Counterparty | Notional Amount ($000) | Floating Interest Rate Received (Paid) (%) | Value and Unrealized Appreciation ($000) | Value and Unrealized (Depreciation) ($000) |
| International Business Machines Corp. | 8/31/22 | BANA | 37,425 | (0.070)1 | 457 | — |
| Kroger Co. | 1/31/22 | GSI | 46,220 | (0.108)2 | — | (962) |
| NextEra Energy Inc. | 8/31/22 | BANA | 39,678 | (0.070)1 | 162 | — |
| 619 | (962) | |||||
| 1 | Based on 1M USD Overnight Bank Funding Rate as of the most recent payment date. Floating interest payment received/paid monthly. |
| 2 | Based on 1M USD London Interbank Offered Rate (LIBOR) as of the most recent payment date. Floating interest payment received/paid monthly. |
| 1M—1-month. | |
| BANA—Bank of America, N.A. | |
| GSI—Goldman Sachs International. |
| ($000s, except shares and per-share amounts) | Amount |
| Assets | |
| Investments in Securities, at Value | |
| Unaffiliated Issuers (Cost $97,453,717) | 140,083,822 |
| Affiliated Issuers (Cost $145,991) | 145,998 |
| Total Investments in Securities | 140,229,820 |
| Investment in Vanguard | 4,332 |
| Cash | 20,815 |
| Cash Collateral Pledged—Futures Contracts | 4,296 |
| Cash Collateral Pledged—Over-the-Counter Swap Contracts | 1,090 |
| Receivables for Investment Securities Sold | 7,433 |
| Receivables for Accrued Income | 165,297 |
| Receivables for Capital Shares Issued | 94,279 |
| Unrealized Appreciation—Over-the-Counter Swap Contracts | 619 |
| Total Assets | 140,527,981 |
| Liabilities | |
| Payables for Investment Securities Purchased | 6,360 |
| Collateral for Securities on Loan | 117,752 |
| Payables for Capital Shares Redeemed | 174,005 |
| Payables to Vanguard | 2,578 |
| Variation Margin Payable—Futures Contracts | 215 |
| Unrealized Depreciation—Over-the-Counter Swap Contracts | 962 |
| Total Liabilities | 301,872 |
| Net Assets | 140,226,109 |
| Statement of Assets and Liabilities (continued) | |
| At December 31, 2021, net assets consisted of: | |
| ($000s, except shares and per-share amounts) | Amount |
| Paid-in Capital | 101,270,606 |
| Total Distributable Earnings (Loss) | 38,955,503 |
| Net Assets | 140,226,109 |
| Investor Shares—Net Assets | |
| Applicable to 4,600,577 outstanding $.001 par value shares of beneficial interest (unlimited authorization) | 264,041 |
| Net Asset Value Per Share—Investor Shares | $57.39 |
| ETF Shares—Net Assets | |
| Applicable to 630,803,679 outstanding $.001 par value shares of beneficial interest (unlimited authorization) | 92,775,889 |
| Net Asset Value Per Share—ETF Shares | $147.08 |
| Admiral Shares—Net Assets | |
| Applicable to 553,205,764 outstanding $.001 par value shares of beneficial interest (unlimited authorization) | 31,740,593 |
| Net Asset Value Per Share—Admiral Shares | $57.38 |
| Institutional Shares—Net Assets | |
| Applicable to 269,210,844 outstanding $.001 par value shares of beneficial interest (unlimited authorization) | 15,445,586 |
| Net Asset Value Per Share—Institutional Shares | $57.37 |
| Year Ended December 31, 2021 | |
| ($000) | |
| Investment Income | |
| Income | |
| Dividends | 2,934,309 |
| Interest1 | 148 |
| Securities Lending—Net | 3,071 |
| Total Income | 2,937,528 |
| Expenses | |
| The Vanguard Group—Note B | |
| Investment Advisory Services | 3,974 |
| Management and Administrative—Investor Shares | 435 |
| Management and Administrative—ETF Shares | 23,988 |
| Management and Administrative—Admiral Shares | 11,859 |
| Management and Administrative—Institutional Shares | 4,538 |
| Marketing and Distribution—Investor Shares | 17 |
| Marketing and Distribution—ETF Shares | 2,814 |
| Marketing and Distribution—Admiral Shares | 1,061 |
| Marketing and Distribution—Institutional Shares | 437 |
| Custodian Fees | 756 |
| Auditing Fees | 37 |
| Shareholders’ Reports—Investor Shares | 1 |
| Shareholders’ Reports—ETF Shares | 1,939 |
| Shareholders’ Reports—Admiral Shares | 299 |
| Shareholders’ Reports—Institutional Shares | 146 |
| Trustees’ Fees and Expenses | 35 |
| Total Expenses | 52,336 |
| Net Investment Income | 2,885,192 |
| Realized Net Gain (Loss) | |
| Investment Securities Sold1,2 | 3,060,960 |
| Futures Contracts | 52,092 |
| Swap Contracts | 38,187 |
| Realized Net Gain (Loss) | 3,151,239 |
| Change in Unrealized Appreciation (Depreciation) | |
| Investment Securities1 | 21,563,089 |
| Futures Contracts | (1,063) |
| Swap Contracts | (4,662) |
| Change in Unrealized Appreciation (Depreciation) | 21,557,364 |
| Net Increase (Decrease) in Net Assets Resulting from Operations | 27,593,795 |
| 1 | Interest income, realized net gain (loss), capital gain distributions received, and change in unrealized appreciation (depreciation) from an affiliated company of the fund were $142,000, ($2,000), $10,000, and ($23,000), respectively. Purchases and sales are for temporary cash investment purposes. |
| 2 | Includes $3,366,440,000 of net gain (loss) resulting from in-kind redemptions. |
| Year Ended December 31, | ||
| 2021 ($000) | 2020 ($000) | |
| Increase (Decrease) in Net Assets | ||
| Operations | ||
| Net Investment Income | 2,885,192 | 2,385,409 |
| Realized Net Gain (Loss) | 3,151,239 | 999,499 |
| Change in Unrealized Appreciation (Depreciation) | 21,557,364 | (862,492) |
| Net Increase (Decrease) in Net Assets Resulting from Operations | 27,593,795 | 2,522,416 |
| Distributions | ||
| Investor Shares | (5,928) | (7,153) |
| ETF Shares | (1,889,549) | (1,491,672) |
| Admiral Shares | (667,738) | (569,513) |
| Institutional Shares | (329,587) | (322,802) |
| Total Distributions | (2,892,802) | (2,391,140) |
| Capital Share Transactions | ||
| Investor Shares | (68,271) | (45,817) |
| ETF Shares | 15,310,468 | 5,496,388 |
| Admiral Shares | 3,414,060 | 138,688 |
| Institutional Shares | (49,760) | 65,298 |
| Net Increase (Decrease) from Capital Share Transactions | 18,606,497 | 5,654,557 |
| Total Increase (Decrease) | 43,307,490 | 5,785,833 |
| Net Assets | ||
| Beginning of Period | 96,918,619 | 91,132,786 |
| End of Period | 140,226,109 | 96,918,619 |
| Investor Shares | |||||
| For a Share Outstanding Throughout Each Period | Year Ended December 31, | ||||
| 2021 | 2020 | 2019 | 2018 | 2017 | |
| Net Asset Value, Beginning of Period | $46.43 | $46.78 | $38.18 | $41.42 | $36.24 |
| Investment Operations | |||||
| Net Investment Income1 | 1.177 | 1.142 | 1.093 | 1.009 | .918 |
| Net Realized and Unrealized Gain (Loss) on Investments | 10.945 | (.362) | 8.623 | (3.261) | 5.166 |
| Total from Investment Operations | 12.122 | .780 | 9.716 | (2.252) | 6.084 |
| Distributions | |||||
| Dividends from Net Investment Income | (1.162) | (1.130) | (1.116) | (.988) | (.904) |
| Distributions from Realized Capital Gains | — | — | — | — | — |
| Total Distributions | (1.162) | (1.130) | (1.116) | (.988) | (.904) |
| Net Asset Value, End of Period | $57.39 | $46.43 | $46.78 | $38.18 | $41.42 |
| Total Return2 | 26.31% | 2.18% | 25.67% | -5.55% | 16.99% |
| Ratios/Supplemental Data | |||||
| Net Assets, End of Period (Millions) | $264 | $273 | $328 | $1,381 | $1,626 |
| Ratio of Total Expenses to Average Net Assets | 0.17% | 0.17% | 0.17% | 0.17% | 0.17% |
| Ratio of Net Investment Income to Average Net Assets | 2.22% | 2.75% | 2.58% | 2.43% | 2.40% |
| Portfolio Turnover Rate3 | 9% | 10% | 12% | 8% | 9% |
| 1 | Calculated based on average shares outstanding. |
| 2 | Total returns do not include account service fees that may have applied in the periods shown. Fund prospectuses provide information about any applicable account service fees. |
| 3 | Excludes the value of portfolio securities received or delivered as a result of in-kind purchases or redemptions of the fund’s capital shares, including ETF Creation Units. |
| ETF Shares | |||||
| For a Share Outstanding Throughout Each Period | Year Ended December 31, | ||||
| 2021 | 2020 | 2019 | 2018 | 2017 | |
| Net Asset Value, Beginning of Period | $118.98 | $119.90 | $97.84 | $106.14 | $92.87 |
| Investment Operations | |||||
| Net Investment Income1 | 3.212 | 3.055 | 3.046 | 2.722 | 2.473 |
| Net Realized and Unrealized Gain (Loss) on Investments | 28.045 | (.935) | 22.014 | (8.352) | 13.234 |
| Total from Investment Operations | 31.257 | 2.120 | 25.060 | (5.630) | 15.707 |
| Distributions | |||||
| Dividends from Net Investment Income | (3.157) | (3.040) | (3.000) | (2.670) | (2.437) |
| Distributions from Realized Capital Gains | — | — | — | — | — |
| Total Distributions | (3.157) | (3.040) | (3.000) | (2.670) | (2.437) |
| Net Asset Value, End of Period | $147.08 | $118.98 | $119.90 | $97.84 | $106.14 |
| Total Return | 26.47% | 2.23% | 25.85% | -5.39% | 17.12% |
| Ratios/Supplemental Data | |||||
| Net Assets, End of Period (Millions) | $92,776 | $61,580 | $55,909 | $41,510 | $36,560 |
| Ratio of Total Expenses to Average Net Assets | 0.04% | 0.04% | 0.04% | 0.04% | 0.05% |
| Ratio of Net Investment Income to Average Net Assets | 2.35% | 2.87% | 2.76% | 2.56% | 2.52% |
| Portfolio Turnover Rate2 | 9% | 10% | 12% | 8% | 9% |
| 1 | Calculated based on average shares outstanding. |
| 2 | Excludes the value of portfolio securities received or delivered as a result of in-kind purchases or redemptions of the fund’s capital shares, including ETF Creation Units. |
| Admiral Shares | |||||
| For a Share Outstanding Throughout Each Period | Year Ended December 31, | ||||
| 2021 | 2020 | 2019 | 2018 | 2017 | |
| Net Asset Value, Beginning of Period | $46.41 | $46.77 | $38.17 | $41.41 | $36.23 |
| Investment Operations | |||||
| Net Investment Income1 | 1.245 | 1.188 | 1.185 | 1.059 | .965 |
| Net Realized and Unrealized Gain (Loss) on Investments | 10.951 | (.367) | 8.581 | (3.261) | 5.165 |
| Total from Investment Operations | 12.196 | .821 | 9.766 | (2.202) | 6.130 |
| Distributions | |||||
| Dividends from Net Investment Income | (1.226) | (1.181) | (1.166) | (1.038) | (.950) |
| Distributions from Realized Capital Gains | — | — | — | — | — |
| Total Distributions | (1.226) | (1.181) | (1.166) | (1.038) | (.950) |
| Net Asset Value, End of Period | $57.38 | $46.41 | $46.77 | $38.17 | $41.41 |
| Total Return2 | 26.49% | 2.29% | 25.82% | -5.43% | 17.13% |
| Ratios/Supplemental Data | |||||
| Net Assets, End of Period (Millions) | $31,741 | $22,486 | $22,414 | $16,522 | $16,778 |
| Ratio of Total Expenses to Average Net Assets | 0.05% | 0.05% | 0.05% | 0.05% | 0.05% |
| Ratio of Net Investment Income to Average Net Assets | 2.34% | 2.86% | 2.75% | 2.55% | 2.52% |
| Portfolio Turnover Rate3 | 9% | 10% | 12% | 8% | 9% |
| 1 | Calculated based on average shares outstanding. |
| 2 | Total returns do not include account service fees that may have applied in the periods shown. Fund prospectuses provide information about any applicable account service fees. |
| 3 | Excludes the value of portfolio securities received or delivered as a result of in-kind purchases or redemptions of the fund’s capital shares, including ETF Creation Units. |
| Institutional Shares | |||||
| For a Share Outstanding Throughout Each Period | Year Ended December 31, | ||||
| 2021 | 2020 | 2019 | 2018 | 2017 | |
| Net Asset Value, Beginning of Period | $46.41 | $46.77 | $38.17 | $41.41 | $36.23 |
| Investment Operations | |||||
| Net Investment Income1 | 1.250 | 1.193 | 1.189 | 1.063 | .969 |
| Net Realized and Unrealized Gain (Loss) on Investments | 10.941 | (.368) | 8.581 | (3.260) | 5.165 |
| Total from Investment Operations | 12.191 | .825 | 9.770 | (2.197) | 6.134 |
| Distributions | |||||
| Dividends from Net Investment Income | (1.231) | (1.185) | (1.170) | (1.043) | (.954) |
| Distributions from Realized Capital Gains | — | — | — | — | — |
| Total Distributions | (1.231) | (1.185) | (1.170) | (1.043) | (.954) |
| Net Asset Value, End of Period | $57.37 | $46.41 | $46.77 | $38.17 | $41.41 |
| Total Return | 26.48% | 2.30% | 25.83% | -5.42% | 17.14% |
| Ratios/Supplemental Data | |||||
| Net Assets, End of Period (Millions) | $15,446 | $12,579 | $12,481 | $9,789 | $10,085 |
| Ratio of Total Expenses to Average Net Assets | 0.04% | 0.04% | 0.04% | 0.04% | 0.04% |
| Ratio of Net Investment Income to Average Net Assets | 2.35% | 2.87% | 2.76% | 2.56% | 2.53% |
| Portfolio Turnover Rate2 | 9% | 10% | 12% | 8% | 9% |
| 1 | Calculated based on average shares outstanding. |
| 2 | Excludes the value of portfolio securities received or delivered as a result of in-kind purchases or redemptions of the fund’s capital shares, including ETF Creation Units. |
| A. | The following significant accounting policies conform to generally accepted accounting principles for U.S. investment companies. The fund consistently follows such policies in preparing its financial statements. |
| B. | In accordance with the terms of a Funds' Service Agreement (the “FSA”) between Vanguard and the fund, Vanguard furnishes to the fund investment advisory, corporate management, administrative, marketing, and distribution services at Vanguard’s cost of operations (as defined by the FSA). These costs of operations are allocated to the fund based on methods and guidelines approved by the board of trustees and are generally settled twice a month. |
| C. | Various inputs may be used to determine the value of the fund’s investments and derivatives. These inputs are summarized in three broad levels for financial statement purposes. The inputs or methodologies used to value securities are not necessarily an indication of the risk associated with investing in those securities. |
| Level 1 ($000) | Level 2 ($000) | Level 3 ($000) | Total ($000) | |
| Investments | ||||
| Assets | ||||
| Common Stocks | 140,083,822 | — | — | 140,083,822 |
| Temporary Cash Investments | 145,998 | — | — | 145,998 |
| Total | 140,229,820 | — | — | 140,229,820 |
| Derivative Financial Instruments | ||||
| Assets | ||||
| Swap Contracts | — | 619 | — | 619 |
| Liabilities | ||||
| Futures Contracts1 | 137 | — | — | 137 |
| Swap Contracts | — | 962 | — | 962 |
| Total | 137 | 962 | — | 1,099 |
| 1 | Includes cumulative appreciation (depreciation) on futures contracts and centrally cleared swaps, if any, as reported in the Schedule of Investments. Only current day’s variation margin is reported within the Statement of Assets and Liabilities. |
| D. | Permanent differences between book-basis and tax-basis components of net assets are reclassified among capital accounts in the financial statements to reflect their tax character. These reclassifications have no effect on net assets or net asset value per share. As of period end, permanent differences primarily attributable to the accounting for in-kind redemptions, passive foreign investment companies, and swap agreements were reclassified between the following accounts: |
| Amount ($000) | |
| Paid-in Capital | 3,366,322 |
| Total Distributable Earnings (Loss) | (3,366,322) |
| Amount ($000) | |
| Undistributed Ordinary Income | 56,072 |
| Undistributed Long-Term Gains | — |
| Capital Loss Carryforwards | (3,660,549) |
| Qualified Late-Year Losses | — |
| Net Unrealized Gains (Losses) | 42,559,980 |
| Year Ended December 31, | ||
| 2021 Amount ($000) | 2020 Amount ($000) | |
| Ordinary Income* | 2,892,802 | 2,391,140 |
| Long-Term Capital Gains | — | — |
| Total | 2,892,802 | 2,391,140 |
| * | Includes short-term capital gains, if any. |
| Amount ($000) | |
| Tax Cost | 97,669,839 |
| Gross Unrealized Appreciation | 45,522,990 |
| Gross Unrealized Depreciation | (2,963,010) |
| Net Unrealized Appreciation (Depreciation) | 42,559,980 |
| E. | During the year ended December 31, 2021, the fund purchased $35,741,003,000 of investment securities and sold $18,097,438,000 of investment securities, other than temporary cash investments. Purchases and sales include $21,284,417,000 and $7,272,321,000, respectively, in connection with in-kind purchases and redemptions of the fund's capital shares. |
| F. | Capital share transactions for each class of shares were: |
| Year Ended December 31, | |||||
| 2021 | 2020 | ||||
| Amount ($000) | Shares (000) | Amount ($000) | Shares (000) | ||
| Investor Shares | |||||
| Issued | 42,557 | 819 | 30,119 | 734 | |
| Issued in Lieu of Cash Distributions | 5,927 | 111 | 7,153 | 186 | |
| Redeemed | (116,755) | (2,214) | (83,089) | (2,048) | |
| Net Increase (Decrease)—Investor Shares | (68,271) | (1,284) | (45,817) | (1,128) | |
| Year Ended December 31, | |||||
| 2021 | 2020 | ||||
| Amount ($000) | Shares (000) | Amount ($000) | Shares (000) | ||
| ETF Shares | |||||
| Issued | 22,597,318 | 166,669 | 12,323,003 | 114,853 | |
| Issued in Lieu of Cash Distributions | — | — | — | — | |
| Redeemed | (7,286,850) | (53,450) | (6,826,615) | (63,575) | |
| Net Increase (Decrease)—ETF Shares | 15,310,468 | 113,219 | 5,496,388 | 51,278 | |
| Admiral Shares | |||||
| Issued | 6,495,181 | 125,044 | 5,109,104 | 126,982 | |
| Issued in Connection with Acquisition of Vanguard Capital Value Fund | 1,035,654 | 21,626 | — | — | |
| Issued in Lieu of Cash Distributions | 581,649 | 10,864 | 491,886 | 12,702 | |
| Redeemed | (4,698,424) | (88,804) | (5,462,302) | (134,427) | |
| Net Increase (Decrease)—Admiral Shares | 3,414,060 | 68,730 | 138,688 | 5,257 | |
| Institutional Shares | |||||
| Issued | 2,348,847 | 44,862 | 2,756,913 | 66,872 | |
| Issued in Lieu of Cash Distributions | 315,580 | 5,897 | 292,134 | 7,539 | |
| Redeemed | (2,714,187) | (52,572) | (2,983,749) | (70,252) | |
| Net Increase (Decrease)—Institutional Shares | (49,760) | (1,813) | 65,298 | 4,159 | |
| G. | On February 5, 2021, the fund acquired all the net assets of Vanguard U.S. Value Fund pursuant to a plan of reorganization approved by the funds’ boards of trustees on July 23, 2020, and by the shareholders of the U.S. Value Fund at a special meeting on January 22, 2021. The purpose of the transaction was to consolidate the assets of the two funds, placing U.S. Value Fund shareholders in a comparable fund with better historical long-term investment performance; delivering a large expense ratio reduction for U.S. Value Fund shareholders; and creating a larger combined fund, which we anticipate, over time, will achieve greater economies of scale. The acquisition was accomplished by a tax-free exchange of 21.6 million Admiral Shares of the Value Index Fund for the 60.0 million shares of the U.S. Value Fund outstanding on February 5, 2021. The U.S. Value Fund’s net assets of $1.0 billion, including $156.3 million of unrealized appreciation, were combined with the Value Index Fund’s net assets of $101.5 billion, resulting in combined net assets of $102.5 billion on February 5, 2021. |
| ($000) | |
| Net Investment Income | 2,887,123 |
| Realized Net Gain (Loss) | 3,287,241 |
| Change in Unrealized Appreciation (Depreciation) | 21,465,600 |
| Net Increase (Decrease) in Net Assets Resulting from Operations | 27,639,964 |
| H. | Management has determined that no other events or transactions occurred subsequent to December 31, 2021, that would require recognition or disclosure in these financial statements. |

| Average Annual Total Returns Periods Ended December 31, 2021 | |||||
| One Year | Five Years | Ten Years | Final Value of a $10,000 Investment | ||
| Large-Cap Index Fund Investor Shares | 26.87% | 18.54% | 16.44% | $45,804 |
| Spliced Large Cap Index | 27.07 | 18.73 | 16.65 | 46,642 |
| Dow Jones U.S. Total Stock Market Float Adjusted Index | 25.66 | 17.92 | 16.24 | 45,050 |
| One Year | Five Years | Ten Years | Final Value of a $10,000 Investment | ||
| Large-Cap Index Fund ETF Shares Net Asset Value | 27.02% | 18.68% | 16.59% | $46,397 | |
| Large-Cap Index Fund ETF Shares Market Price | 26.94 | 18.67 | 16.59 | 46,420 | |
| Spliced Large Cap Index | 27.07 | 18.73 | 16.65 | 46,642 | |
| Dow Jones U.S. Total Stock Market Float Adjusted Index | 25.66 | 17.92 | 16.24 | 45,050 | |
| Average Annual Total Returns Periods Ended December 31, 2021 | |||||
| One Year | Five Years | Ten Years | Final Value of a $10,000 Investment | ||
| Large-Cap Index Fund Admiral Shares | 27.01% | 18.68% | 16.58% | $46,381 | |
| Spliced Large Cap Index | 27.07 | 18.73 | 16.65 | 46,642 | |
| Dow Jones U.S. Total Stock Market Float Adjusted Index | 25.66 | 17.92 | 16.24 | 45,050 | |
| One Year | Five Years | Ten Years | Final Value of a $5,000,000 Investment | ||
| Large-Cap Index Fund Institutional Shares | 27.03% | 18.69% | 16.60% | $23,218,315 | |
| Spliced Large Cap Index | 27.07 | 18.73 | 16.65 | 23,321,220 | |
| Dow Jones U.S. Total Stock Market Float Adjusted Index | 25.66 | 17.92 | 16.24 | 22,525,162 | |
| One Year | Five Years | Ten Years | |
| Large-Cap Index Fund ETF Shares Market Price | 26.94% | 135.33% | 364.20% |
| Large-Cap Index Fund ETF Shares Net Asset Value | 27.02 | 135.48 | 363.97 |
| Spliced Large Cap Index | 27.07 | 135.90 | 366.42 |
| Basic Materials | 1.7% |
| Consumer Discretionary | 16.1 |
| Consumer Staples | 5.0 |
| Energy | 2.6 |
| Financials | 10.2 |
| Health Care | 12.7 |
| Industrials | 12.0 |
| Real Estate | 2.9 |
| Technology | 31.4 |
| Telecommunications | 2.7 |
| Utilities | 2.7 |
| Shares | Market Value• ($000) | ||
| Common Stocks (99.7%) | |||
| Basic Materials (1.7%) | |||
| Linde plc | 519,052 | 179,815 | |
| Air Products and Chemicals Inc. | 224,619 | 68,343 | |
| Freeport-McMoRan Inc. | 1,489,424 | 62,154 | |
| Ecolab Inc. | 261,565 | 61,360 | |
| Newmont Corp. | 808,834 | 50,164 | |
| Dow Inc. | 750,177 | 42,550 | |
| International Flavors & Fragrances Inc. | 258,166 | 38,893 | |
| Fastenal Co. | 583,292 | 37,366 | |
| Nucor Corp. | 289,901 | 33,092 | |
| Albemarle Corp. | 118,602 | 27,726 | |
| LyondellBasell Industries NV Class A | 270,027 | 24,905 | |
| Celanese Corp. Class A | 110,422 | 18,557 | |
| International Paper Co. | 392,771 | 18,452 | |
| Avery Dennison Corp. | 83,971 | 18,186 | |
| Eastman Chemical Co. | 136,376 | 16,489 | |
| FMC Corp. | 128,574 | 14,129 | |
| CF Industries Holdings Inc. | 108,639 | 7,689 | |
| Westlake Chemical Corp. | 16,248 | 1,578 | |
| 721,448 | |||
| Consumer Discretionary (16.0%) | |||
| * | Amazon.com Inc. | 437,235 | 1,457,890 |
| * | Tesla Inc. | 814,883 | 861,152 |
| Home Depot Inc. | 1,059,143 | 439,555 | |
| * | Walt Disney Co. | 1,843,581 | 285,552 |
| * | Netflix Inc. | 449,259 | 270,652 |
| Costco Wholesale Corp. | 448,122 | 254,399 | |
| NIKE Inc. Class B | 1,296,045 | 216,012 | |
| Walmart Inc. | 1,414,142 | 204,612 | |
| McDonald's Corp. | 757,892 | 203,168 | |
| Lowe's Cos. Inc. | 683,405 | 176,646 | |
| Starbucks Corp. | 1,189,930 | 139,186 | |
| Target Corp. | 485,977 | 112,474 | |
| * | Booking Holdings Inc. | 41,662 | 99,957 |
| TJX Cos. Inc. | 1,158,743 | 87,972 | |
| Ford Motor Co. | 3,981,443 | 82,695 | |
| Estee Lauder Cos. Inc. Class A | 223,265 | 82,653 | |
| * | General Motors Co. | 1,325,352 | 77,705 |
| * | Uber Technologies Inc. | 1,475,707 | 61,876 |
| Dollar General Corp. | 236,659 | 55,811 | |
| * | Airbnb Inc. Class A | 334,162 | 55,635 |
| Activision Blizzard Inc. | 789,986 | 52,558 | |
| Shares | Market Value• ($000) | ||
| * | O'Reilly Automotive Inc. | 68,351 | 48,272 |
| * | Chipotle Mexican Grill Inc. Class A | 27,129 | 47,428 |
| * | Lululemon Athletica Inc. | 120,089 | 47,009 |
| * | Marriott International Inc. Class A | 280,756 | 46,392 |
| * | Aptiv plc | 274,433 | 45,268 |
| * | AutoZone Inc. | 21,278 | 44,607 |
| * | Hilton Worldwide Holdings Inc. | 282,708 | 44,100 |
| Yum! Brands Inc. | 297,332 | 41,287 | |
| Ross Stores Inc. | 360,466 | 41,194 | |
| * | Trade Desk Inc. Class A | 442,278 | 40,530 |
| eBay Inc. | 603,196 | 40,113 | |
| Electronic Arts Inc. | 286,831 | 37,833 | |
| DR Horton Inc. | 343,549 | 37,258 | |
| * | Copart Inc. | 216,526 | 32,830 |
| Lennar Corp. Class A | 277,077 | 32,185 | |
| * | Dollar Tree Inc. | 228,186 | 32,065 |
| * | Roblox Corp. Class A | 294,229 | 30,353 |
| * | Etsy Inc. | 128,622 | 28,160 |
| Tractor Supply Co. | 115,451 | 27,547 | |
| * | Expedia Group Inc. | 148,078 | 26,761 |
| VF Corp. | 358,416 | 26,243 | |
| * | Southwest Airlines Co. | 600,239 | 25,714 |
| * | Delta Air Lines Inc. | 649,127 | 25,368 |
| Best Buy Co. Inc. | 224,539 | 22,813 | |
| * | Ulta Beauty Inc. | 55,104 | 22,722 |
| * | CarMax Inc. | 164,422 | 21,413 |
| Garmin Ltd. | 155,992 | 21,241 | |
| Domino's Pizza Inc. | 36,914 | 20,832 | |
| * | Take-Two Interactive Software Inc. | 116,933 | 20,781 |
| Genuine Parts Co. | 144,482 | 20,256 | |
| * | Carvana Co. Class A | 86,801 | 20,120 |
| Darden Restaurants Inc. | 131,627 | 19,828 | |
| * | Burlington Stores Inc. | 67,682 | 19,730 |
| * | NVR Inc. | 3,339 | 19,730 |
| * | Caesars Entertainment Inc. | 205,995 | 19,267 |
| * | Rivian Automotive Inc. Class A | 179,193 | 18,580 |
| MGM Resorts International | 404,295 | 18,145 | |
| ViacomCBS Inc. Class B | 587,694 | 17,737 | |
| * | Live Nation Entertainment Inc. | 148,100 | 17,726 |
| * | Carnival Corp. | 845,777 | 17,017 |
| * | Royal Caribbean Cruises Ltd. | 219,875 | 16,908 |
| Shares | Market Value• ($000) | ||
| * | Las Vegas Sands Corp. | 425,835 | 16,028 |
| *,1 | Lucid Group Inc. | 417,455 | 15,884 |
| Omnicom Group Inc. | 215,580 | 15,796 | |
| Advance Auto Parts Inc. | 63,247 | 15,172 | |
| LKQ Corp. | 251,358 | 15,089 | |
| Whirlpool Corp. | 61,615 | 14,459 | |
| * | United Airlines Holdings Inc. | 327,952 | 14,358 |
| * | Wayfair Inc. Class A | 75,146 | 14,275 |
| *,1 | AMC Entertainment Holdings Inc. Class A | 521,425 | 14,183 |
| PulteGroup Inc. | 243,991 | 13,946 | |
| Hasbro Inc. | 132,827 | 13,519 | |
| Fox Corp. Class A | 334,666 | 12,349 | |
| * | Lyft Inc. Class A | 286,319 | 12,234 |
| BorgWarner Inc. (XNYS) | 242,874 | 10,946 | |
| Pool Corp. | 19,315 | 10,932 | |
| * | Peloton Interactive Inc. Class A | 287,233 | 10,271 |
| * | Wynn Resorts Ltd. | 105,780 | 8,996 |
| Bath & Body Works Inc. | 127,319 | 8,886 | |
| News Corp. Class A | 398,145 | 8,883 | |
| * | DraftKings Inc. Class A | 309,151 | 8,492 |
| * | Liberty Media Corp.- Liberty SiriusXM Class C | 161,203 | 8,197 |
| Rollins Inc. | 224,580 | 7,683 | |
| Interpublic Group of Cos. Inc. | 199,930 | 7,487 | |
| * | Discovery Inc. Class C | 318,417 | 7,292 |
| Vail Resorts Inc. | 20,499 | 6,722 | |
| * | American Airlines Group Inc. | 328,833 | 5,906 |
| Lear Corp. | 30,166 | 5,519 | |
| 1 | Sirius XM Holdings Inc. | 811,242 | 5,151 |
| * | Endeavor Group Holdings Inc. Class A | 147,187 | 5,135 |
| * | Chewy Inc. Class A | 86,460 | 5,099 |
| * | GameStop Corp. Class A | 32,865 | 4,877 |
| Fox Corp. Class B | 140,833 | 4,826 | |
| *,1 | QuantumScape Corp. Class A | 198,297 | 4,400 |
| Warner Music Group Corp. Class A | 99,853 | 4,312 | |
| * | Discovery Inc. Class A | 163,315 | 3,844 |
| * | Liberty Media Corp.- Liberty SiriusXM Class A | 75,079 | 3,818 |
| News Corp. Class B | 122,590 | 2,758 | |
| Lennar Corp. Class B | 13,609 | 1,301 | |
| ViacomCBS Inc. Class A | 7,509 | 251 | |
| * | Penn National Gaming Inc. | 76 | 4 |
| 6,830,803 | |||
| Consumer Staples (5.0%) | |||
| Procter & Gamble Co. | 2,454,490 | 401,505 | |
| PepsiCo Inc. | 1,402,396 | 243,610 | |
| Coca-Cola Co. | 3,942,950 | 233,462 | |
| Philip Morris International Inc. | 1,579,063 | 150,011 | |
| CVS Health Corp. | 1,338,892 | 138,120 | |
| Mondelez International Inc. Class A | 1,414,958 | 93,826 | |
| Altria Group Inc. | 1,863,224 | 88,298 | |
| Colgate-Palmolive Co. | 854,914 | 72,958 | |
| Kimberly-Clark Corp. | 341,527 | 48,811 | |
| General Mills Inc. | 614,412 | 41,399 | |
| Shares | Market Value• ($000) | ||
| Sysco Corp. | 519,922 | 40,840 | |
| Constellation Brands Inc. Class A | 158,300 | 39,729 | |
| Walgreens Boots Alliance Inc. | 746,157 | 38,920 | |
| McKesson Corp. | 154,855 | 38,492 | |
| Archer-Daniels-Midland Co. | 567,466 | 38,355 | |
| * | Monster Beverage Corp. | 375,697 | 36,082 |
| Corteva Inc. | 740,704 | 35,020 | |
| Kroger Co. | 678,837 | 30,724 | |
| Keurig Dr Pepper Inc. | 790,984 | 29,156 | |
| Hershey Co. | 147,480 | 28,533 | |
| Tyson Foods Inc. Class A | 299,016 | 26,062 | |
| Church & Dwight Co. Inc. | 247,649 | 25,384 | |
| Kraft Heinz Co. | 683,504 | 24,538 | |
| McCormick & Co. Inc. | 252,766 | 24,420 | |
| Brown-Forman Corp. Class B | 301,098 | 21,938 | |
| Clorox Co. | 124,519 | 21,711 | |
| AmerisourceBergen Corp. Class A | 147,786 | 19,639 | |
| Kellogg Co. | 259,700 | 16,730 | |
| Conagra Brands Inc. | 486,623 | 16,618 | |
| J M Smucker Co. | 104,363 | 14,175 | |
| Hormel Foods Corp. | 274,842 | 13,415 | |
| Campbell Soup Co. | 199,217 | 8,658 | |
| Lamb Weston Holdings Inc. | 74,156 | 4,700 | |
| Molson Coors Beverage Co. Class B | 91,712 | 4,251 | |
| Brown-Forman Corp. Class A | 31,340 | 2,125 | |
| * | Olaplex Holdings Inc. | 65,849 | 1,918 |
| 2,114,133 | |||
| Energy (2.6%) | |||
| Exxon Mobil Corp. | 4,293,938 | 262,746 | |
| Chevron Corp. | 1,955,180 | 229,440 | |
| ConocoPhillips | 1,337,771 | 96,560 | |
| EOG Resources Inc. | 593,528 | 52,723 | |
| Schlumberger NV | 1,422,657 | 42,609 | |
| Pioneer Natural Resources Co. | 222,858 | 40,533 | |
| Marathon Petroleum Corp. | 624,390 | 39,955 | |
| Kinder Morgan Inc. | 2,069,697 | 32,825 | |
| Phillips 66 | 444,431 | 32,204 | |
| Williams Cos. Inc. | 1,232,375 | 32,091 | |
| Valero Energy Corp. | 414,670 | 31,146 | |
| Devon Energy Corp. | 686,337 | 30,233 | |
| ONEOK Inc. | 452,146 | 26,568 | |
| Occidental Petroleum Corp. | 899,884 | 26,088 | |
| Cheniere Energy Inc. | 231,500 | 23,479 | |
| * | Enphase Energy Inc. | 123,203 | 22,539 |
| Hess Corp. | 282,697 | 20,928 | |
| Baker Hughes Co. Class A | 839,315 | 20,194 | |
| Halliburton Co. | 862,520 | 19,726 | |
| * | Plug Power Inc. | 584,566 | 16,502 |
| 1,099,089 | |||
| Financials (10.2%) | |||
| * | Berkshire Hathaway Inc. Class B | 1,768,713 | 528,845 |
| JPMorgan Chase & Co. | 2,997,457 | 474,647 | |
| Bank of America Corp. | 7,056,325 | 313,936 | |
| Shares | Market Value• ($000) | ||
| Wells Fargo & Co. | 4,044,228 | 194,042 | |
| Morgan Stanley | 1,456,055 | 142,926 | |
| Charles Schwab Corp. | 1,561,749 | 131,343 | |
| Goldman Sachs Group Inc. | 342,227 | 130,919 | |
| BlackRock Inc. | 138,678 | 126,968 | |
| Citigroup Inc. | 2,012,666 | 121,545 | |
| S&P Global Inc. | 244,453 | 115,365 | |
| Blackstone Inc. | 696,778 | 90,156 | |
| Marsh & McLennan Cos. Inc. | 512,093 | 89,012 | |
| PNC Financial Services Group Inc. | 428,699 | 85,963 | |
| CME Group Inc. | 364,521 | 83,278 | |
| Truist Financial Corp. | 1,353,964 | 79,275 | |
| Intercontinental Exchange Inc. | 571,459 | 78,158 | |
| US Bancorp | 1,353,581 | 76,031 | |
| Chubb Ltd. | 371,363 | 71,788 | |
| Aon plc Class A (XNYS) | 212,319 | 63,815 | |
| Moody's Corp. | 160,282 | 62,603 | |
| Progressive Corp. | 592,750 | 60,846 | |
| MSCI Inc. Class A | 79,431 | 48,667 | |
| American International Group Inc. | 842,182 | 47,886 | |
| T Rowe Price Group Inc. | 227,979 | 44,830 | |
| Bank of New York Mellon Corp. | 753,940 | 43,789 | |
| KKR & Co. Inc. | 563,687 | 41,995 | |
| Prudential Financial Inc. | 383,436 | 41,503 | |
| * | SVB Financial Group | 59,532 | 40,377 |
| MetLife Inc. | 639,926 | 39,989 | |
| Travelers Cos. Inc. | 249,523 | 39,033 | |
| First Republic Bank | 181,600 | 37,502 | |
| Arthur J Gallagher & Co. | 210,224 | 35,669 | |
| Aflac Inc. | 603,903 | 35,262 | |
| Discover Financial Services | 297,275 | 34,353 | |
| Ameriprise Financial Inc. | 113,502 | 34,239 | |
| Allstate Corp. | 290,797 | 34,212 | |
| * | Coinbase Global Inc. Class A | 133,825 | 33,773 |
| State Street Corp. | 352,139 | 32,749 | |
| Fifth Third Bancorp | 693,563 | 30,205 | |
| Willis Towers Watson plc | 126,377 | 30,013 | |
| Nasdaq Inc. | 118,690 | 24,926 | |
| Northern Trust Corp. | 200,108 | 23,935 | |
| Hartford Financial Services Group Inc. | 345,233 | 23,835 | |
| Huntington Bancshares Inc. | 1,467,211 | 22,624 | |
| KeyCorp. | 944,438 | 21,845 | |
| Broadridge Financial Solutions Inc. | 118,228 | 21,614 | |
| Regions Financial Corp. | 966,934 | 21,079 | |
| Citizens Financial Group Inc. | 432,046 | 20,414 | |
| M&T Bank Corp. | 130,478 | 20,039 | |
| Principal Financial Group Inc. | 268,847 | 19,446 | |
| Raymond James Financial Inc. | 188,125 | 18,888 | |
| FactSet Research Systems Inc. | 38,183 | 18,557 | |
| Cincinnati Financial Corp. | 155,222 | 17,684 | |
| * | Markel Corp. | 13,872 | 17,118 |
| Ally Financial Inc. | 351,439 | 16,732 | |
| * | Arch Capital Group Ltd. | 372,081 | 16,539 |
| Shares | Market Value• ($000) | ||
| Apollo Global Management Inc. Class A | 224,977 | 16,295 | |
| MarketAxess Holdings Inc. | 36,620 | 15,061 | |
| Fidelity National Financial Inc. | 274,161 | 14,306 | |
| Cboe Global Markets Inc. | 108,044 | 14,089 | |
| Equitable Holdings Inc. | 410,664 | 13,466 | |
| Loews Corp. | 218,756 | 12,635 | |
| Annaly Capital Management Inc. | 1,473,117 | 11,520 | |
| * | Athene Holding Ltd. Class A | 133,815 | 11,151 |
| W R Berkley Corp. | 134,370 | 11,071 | |
| Everest Re Group Ltd. | 39,925 | 10,936 | |
| Tradeweb Markets Inc. Class A | 106,511 | 10,666 | |
| Franklin Resources Inc. | 305,389 | 10,227 | |
| Interactive Brokers Group Inc. Class A | 89,784 | 7,131 | |
| Lincoln National Corp. | 87,063 | 5,943 | |
| * | Alleghany Corp. | 6,562 | 4,381 |
| Globe Life Inc. | 46,207 | 4,330 | |
| * | Berkshire Hathaway Inc. Class A | 6 | 2,704 |
| Rocket Cos. Inc. Class A | 137,067 | 1,919 | |
| 1 | UWM Holdings Corp. | 91,586 | 542 |
| 4,351,155 | |||
| Health Care (12.6%) | |||
| UnitedHealth Group Inc. | 955,287 | 479,688 | |
| Johnson & Johnson | 2,670,135 | 456,780 | |
| Pfizer Inc. | 5,692,908 | 336,166 | |
| Thermo Fisher Scientific Inc. | 399,676 | 266,680 | |
| Abbott Laboratories | 1,793,485 | 252,415 | |
| AbbVie Inc. | 1,793,066 | 242,781 | |
| Eli Lilly & Co. | 873,203 | 241,196 | |
| Danaher Corp. | 652,306 | 214,615 | |
| Merck & Co. Inc. | 2,561,959 | 196,349 | |
| Medtronic plc | 1,364,025 | 141,108 | |
| Bristol-Myers Squibb Co. | 2,251,289 | 140,368 | |
| * | Intuitive Surgical Inc. | 362,376 | 130,202 |
| Amgen Inc. | 571,296 | 128,524 | |
| Zoetis Inc. | 479,856 | 117,099 | |
| Anthem Inc. | 246,178 | 114,113 | |
| Gilead Sciences Inc. | 1,272,232 | 92,377 | |
| Stryker Corp. | 344,360 | 92,089 | |
| * | Moderna Inc. | 349,533 | 88,774 |
| * | Edwards Lifesciences Corp. | 633,180 | 82,028 |
| Cigna Corp. | 336,177 | 77,196 | |
| Becton Dickinson and Co. | 288,063 | 72,442 | |
| * | Regeneron Pharmaceuticals Inc. | 101,856 | 64,324 |
| * | Boston Scientific Corp. | 1,445,269 | 61,395 |
| HCA Healthcare Inc. | 236,625 | 60,794 | |
| Humana Inc. | 130,371 | 60,474 | |
| * | Illumina Inc. | 158,545 | 60,317 |
| * | Vertex Pharmaceuticals Inc. | 257,865 | 56,627 |
| * | IDEXX Laboratories Inc. | 85,994 | 56,624 |
| * | IQVIA Holdings Inc. | 193,754 | 54,666 |
| * | DexCom Inc. | 98,316 | 52,791 |
| * | Align Technology Inc. | 75,982 | 49,934 |
| Shares | Market Value• ($000) | ||
| Agilent Technologies Inc. | 306,311 | 48,903 | |
| * | Centene Corp. | 591,835 | 48,767 |
| Baxter International Inc. | 507,852 | 43,594 | |
| ResMed Inc. | 147,789 | 38,496 | |
| * | Veeva Systems Inc. Class A | 140,622 | 35,926 |
| * | Biogen Inc. | 148,978 | 35,743 |
| West Pharmaceutical Services Inc. | 75,185 | 35,263 | |
| * | Laboratory Corp. of America Holdings | 97,081 | 30,504 |
| Cerner Corp. | 298,423 | 27,715 | |
| Zimmer Biomet Holdings Inc. | 211,842 | 26,912 | |
| PerkinElmer Inc. | 127,943 | 25,724 | |
| * | Horizon Therapeutics plc | 230,050 | 24,790 |
| STERIS plc | 101,469 | 24,699 | |
| * | Catalent Inc. | 173,625 | 22,229 |
| * | Avantor Inc. | 525,147 | 22,130 |
| Quest Diagnostics Inc. | 124,418 | 21,526 | |
| * | Seagen Inc. | 139,089 | 21,503 |
| Cooper Cos. Inc. | 49,968 | 20,934 | |
| * | Alnylam Pharmaceuticals Inc. | 121,314 | 20,572 |
| * | Hologic Inc. | 254,991 | 19,522 |
| * | Insulet Corp. | 69,952 | 18,612 |
| Viatris Inc. | 1,225,626 | 16,583 | |
| * | BioMarin Pharmaceutical Inc. | 186,377 | 16,466 |
| * | Bio-Rad Laboratories Inc. Class A | 21,421 | 16,185 |
| * | ABIOMED Inc. | 43,836 | 15,745 |
| Teleflex Inc. | 47,517 | 15,608 | |
| Cardinal Health Inc. | 285,801 | 14,716 | |
| * | Incyte Corp. | 190,689 | 13,997 |
| * | Exact Sciences Corp. | 174,708 | 13,598 |
| * | Teladoc Health Inc. | 146,128 | 13,417 |
| Royalty Pharma plc Class A | 326,712 | 13,019 | |
| * | Elanco Animal Health Inc. (XNYS) | 456,473 | 12,955 |
| * | 10X Genomics Inc. Class A | 83,605 | 12,454 |
| DENTSPLY SIRONA Inc. | 222,036 | 12,387 | |
| * | Henry Schein Inc. | 140,638 | 10,904 |
| * | Charles River Laboratories International Inc. | 25,536 | ��� 9,621 |
| Universal Health Services Inc. Class B | 70,448 | 9,134 | |
| * | DaVita Inc. | 62,010 | 7,054 |
| * | agilon health Inc. | 179,551 | 4,848 |
| * | Novocure Ltd. | 44,772 | 3,362 |
| * | GoodRx Holdings Inc. Class A | 73,659 | 2,407 |
| * | Oak Street Health Inc. | 55,016 | 1,823 |
| *,1 | Ginkgo Bioworks Holdings Inc. | 180,641 | 1,501 |
| 5,392,784 | |||
| Industrials (12.0%) | |||
| Visa Inc. Class A | 1,693,544 | 367,008 | |
| Mastercard Inc. Class A | 889,744 | 319,703 | |
| Accenture plc Class A | 666,075 | 276,121 | |
| * | PayPal Holdings Inc. | 1,191,674 | 224,726 |
| Union Pacific Corp. | 652,045 | 164,270 | |
| United Parcel Service Inc. Class B | 739,567 | 158,519 | |
| Shares | Market Value• ($000) | ||
| Honeywell International Inc. | 698,231 | 145,588 | |
| Raytheon Technologies Corp. | 1,518,144 | 130,651 | |
| * | Boeing Co. | 596,065 | 120,000 |
| Caterpillar Inc. | 548,666 | 113,431 | |
| Automatic Data Processing Inc. | 427,387 | 105,385 | |
| General Electric Co. | 1,113,793 | 105,220 | |
| 3M Co. | 584,484 | 103,822 | |
| Deere & Co. | 283,048 | 97,054 | |
| American Express Co. | 589,210 | 96,395 | |
| CSX Corp. | 2,249,680 | 84,588 | |
| Lockheed Martin Corp. | 237,767 | 84,505 | |
| Sherwin-Williams Co. | 239,345 | 84,288 | |
| Norfolk Southern Corp. | 246,821 | 73,481 | |
| Illinois Tool Works Inc. | 286,530 | 70,716 | |
| Eaton Corp. plc | 404,249 | 69,862 | |
| Fidelity National Information Services Inc. | 617,627 | 67,414 | |
| * | Block Inc. | 404,848 | 65,387 |
| FedEx Corp. | 242,498 | 62,720 | |
| Capital One Financial Corp. | 431,732 | 62,640 | |
| * | Fiserv Inc. | 602,684 | 62,553 |
| Johnson Controls International plc | 714,411 | 58,089 | |
| Emerson Electric Co. | 603,342 | 56,093 | |
| Northrop Grumman Corp. | 144,729 | 56,020 | |
| General Dynamics Corp. | 240,716 | 50,182 | |
| Trane Technologies plc | 240,919 | 48,673 | |
| IHS Markit Ltd. | 364,080 | 48,394 | |
| Carrier Global Corp. | 878,949 | 47,674 | |
| Paychex Inc. | 329,296 | 44,949 | |
| DuPont de Nemours Inc. | 525,516 | 42,451 | |
| L3Harris Technologies Inc. | 199,030 | 42,441 | |
| PPG Industries Inc. | 240,785 | 41,521 | |
| Parker-Hannifin Corp. | 130,355 | 41,469 | |
| Rockwell Automation Inc. | 117,616 | 41,030 | |
| Global Payments Inc. | 294,288 | 39,782 | |
| * | Mettler-Toledo International Inc. | 23,312 | 39,565 |
| Cintas Corp. | 89,167 | 39,516 | |
| * | Keysight Technologies Inc. | 184,497 | 38,100 |
| Old Dominion Freight Line Inc. | 105,001 | 37,630 | |
| Otis Worldwide Corp. | 430,843 | 37,514 | |
| Verisk Analytics Inc. Class A | 163,462 | 37,389 | |
| Equifax Inc. | 123,758 | 36,235 | |
| AMETEK Inc. | 234,574 | 34,492 | |
| * | TransDigm Group Inc. | 53,258 | 33,887 |
| * | Zebra Technologies Corp. Class A | 54,184 | 32,250 |
| Cummins Inc. | 145,086 | 31,649 | |
| Ball Corp. | 328,519 | 31,627 | |
| Stanley Black & Decker Inc. | 165,299 | 31,179 | |
| PACCAR Inc. | 316,962 | 27,975 | |
| Vulcan Materials Co. | 134,591 | 27,938 | |
| Martin Marietta Materials Inc. | 63,253 | 27,864 | |
| Dover Corp. | 146,042 | 26,521 |
| Shares | Market Value• ($000) | ||
| Fortive Corp. | 345,414 | 26,352 | |
| Synchrony Financial | 555,108 | 25,751 | |
| Ingersoll Rand Inc. | 413,415 | 25,578 | |
| * | Bill.Com Holdings Inc. | 98,771 | 24,609 |
| * | United Rentals Inc. | 73,450 | 24,407 |
| Expeditors International of Washington Inc. | 171,811 | 23,073 | |
| * | Waters Corp. | 61,904 | 23,065 |
| TransUnion | 194,193 | 23,027 | |
| WW Grainger Inc. | 44,431 | 23,026 | |
| * | Generac Holdings Inc. | 63,974 | 22,514 |
| * | Trimble Inc. | 254,581 | 22,197 |
| Xylem Inc. | 183,049 | 21,951 | |
| * | Teledyne Technologies Inc. | 47,325 | 20,676 |
| Jacobs Engineering Group Inc. | 130,794 | 18,210 | |
| * | Affirm Holdings Inc. | 179,420 | 18,042 |
| * | FleetCor Technologies Inc. | 78,239 | 17,513 |
| JB Hunt Transport Services Inc. | 85,206 | 17,416 | |
| Masco Corp. | 247,575 | 17,385 | |
| Textron Inc. | 223,563 | 17,259 | |
| Westinghouse Air Brake Technologies Corp. | 180,021 | 16,582 | |
| Fortune Brands Home & Security Inc. | 137,673 | 14,717 | |
| Crown Holdings Inc. | 129,685 | 14,346 | |
| CH Robinson Worldwide Inc. | 131,843 | 14,190 | |
| Packaging Corp. of America | 96,446 | 13,131 | |
| Westrock Co. | 268,779 | 11,923 | |
| Snap-on Inc. | 54,492 | 11,736 | |
| HEICO Corp. Class A | 73,086 | 9,393 | |
| Cognex Corp. | 85,234 | 6,628 | |
| Jack Henry & Associates Inc. | 37,605 | 6,280 | |
| HEICO Corp. | 42,136 | 6,077 | |
| Hubbell Inc. Class B | 27,674 | 5,764 | |
| * | Mohawk Industries Inc. | 27,502 | 5,010 |
| Western Union Co. | 204,022 | 3,640 | |
| * | Marqeta Inc. Class A | 70,723 | 1,214 |
| *,1 | Aurora Innovation Inc. | 97,727 | 1,100 |
| * | GreenSky Inc. Class A | 7,467 | 85 |
| * | XPO Logistics Inc. | 18 | 1 |
| 5,100,014 | |||
| Real Estate (2.9%) | |||
| American Tower Corp. | 461,915 | 135,110 | |
| Prologis Inc. | 750,288 | 126,319 | |
| Crown Castle International Corp. | 438,374 | 91,506 | |
| Equinix Inc. | 91,331 | 77,251 | |
| Public Storage | 151,192 | 56,630 | |
| Simon Property Group Inc. | 333,281 | 53,248 | |
| Digital Realty Trust Inc. | 287,822 | 50,907 | |
| SBA Communications Corp. Class A | 110,322 | 42,917 | |
| Realty Income Corp. | 573,849 | 41,082 | |
| Welltower Inc. | 441,467 | 37,865 | |
| AvalonBay Communities Inc. | 141,773 | 35,810 | |
| Alexandria Real Estate Equities Inc. | 157,164 | 35,041 | |
| * | CBRE Group Inc. Class A | 322,481 | 34,992 |
| Shares | Market Value• ($000) | ||
| Equity Residential | 361,373 | 32,704 | |
| * | CoStar Group Inc. | 400,576 | 31,658 |
| Weyerhaeuser Co. | 759,710 | 31,285 | |
| Extra Space Storage Inc. | 135,813 | 30,793 | |
| Invitation Homes Inc. | 605,241 | 27,442 | |
| Mid-America Apartment Communities Inc. | 116,772 | 26,792 | |
| Sun Communities Inc. | 121,173 | 25,443 | |
| Duke Realty Corp. | 386,272 | 25,355 | |
| Essex Property Trust Inc. | 66,022 | 23,255 | |
| Ventas Inc. | 404,853 | 20,696 | |
| Healthpeak Properties Inc. | 546,442 | 19,721 | |
| UDR Inc. | 313,587 | 18,812 | |
| Camden Property Trust | 103,634 | 18,517 | |
| Boston Properties Inc. | 142,450 | 16,407 | |
| WP Carey Inc. | 188,916 | 15,501 | |
| Iron Mountain Inc. | 293,745 | 15,372 | |
| * | Zillow Group Inc. Class C | 169,051 | 10,794 |
| * | Opendoor Technologies Inc. | 466,016 | 6,809 |
| Regency Centers Corp. | 86,804 | 6,541 | |
| * | Host Hotels & Resorts Inc. | 362,604 | 6,306 |
| * | Zillow Group Inc. Class A | 45,466 | 2,829 |
| 1,231,710 | |||
| Technology (31.3%) | |||
| Apple Inc. | 15,808,460 | 2,807,108 | |
| Microsoft Corp. | 7,615,066 | 2,561,099 | |
| * | Alphabet Inc. Class A | 305,167 | 884,081 |
| * | Meta Platforms Inc. Class A | 2,400,048 | 807,256 |
| * | Alphabet Inc. Class C | 273,870 | 792,467 |
| NVIDIA Corp. | 2,408,865 | 708,471 | |
| * | Adobe Inc. | 482,600 | 273,663 |
| Broadcom Inc. | 396,593 | 263,897 | |
| * | salesforce.com Inc. | 943,260 | 239,711 |
| Intel Corp. | 4,124,999 | 212,437 | |
| QUALCOMM Inc. | 1,135,972 | 207,735 | |
| Intuit Inc. | 287,173 | 184,715 | |
| Texas Instruments Inc. | 936,685 | 176,537 | |
| * | Advanced Micro Devices Inc. | 1,224,841 | 176,255 |
| Oracle Corp. | 1,663,648 | 145,087 | |
| Applied Materials Inc. | 915,808 | 144,112 | |
| * | ServiceNow Inc. | 201,828 | 131,009 |
| International Business Machines Corp. | 909,593 | 121,576 | |
| Micron Technology Inc. | 1,134,581 | 105,686 | |
| Lam Research Corp. | 142,819 | 102,708 | |
| Analog Devices Inc. | 545,086 | 95,810 | |
| * | Snowflake Inc. Class A | 274,675 | 93,046 |
| Marvell Technology Inc. | 835,359 | 73,086 | |
| KLA Corp. | 153,783 | 66,144 | |
| * | Autodesk Inc. | 222,986 | 62,701 |
| * | Snap Inc. Class A | 1,237,297 | 58,190 |
| * | Synopsys Inc. | 154,671 | 56,996 |
| * | Workday Inc. Class A | 195,732 | 53,470 |
| TE Connectivity Ltd. | 330,967 | 53,398 | |
| Xilinx Inc. | 251,434 | 53,312 | |
| Amphenol Corp. Class A | 606,564 | 53,050 | |
| * | Palo Alto Networks Inc. | 95,056 | 52,923 |
| Roper Technologies Inc. | 106,996 | 52,627 | |
| * | Cadence Design Systems Inc. | 281,102 | 52,383 |
| * | Fortinet Inc. | 140,978 | 50,667 |
| Shares | Market Value• ($000) | ||
| Microchip Technology Inc. | 562,759 | 48,994 | |
| Cognizant Technology Solutions Corp. Class A | 532,742 | 47,265 | |
| * | Twilio Inc. Class A | 170,844 | 44,990 |
| * | Datadog Inc. Class A | 247,795 | 44,135 |
| HP Inc. | 1,168,988 | 44,036 | |
| * | Crowdstrike Holdings Inc. Class A | 198,338 | 40,610 |
| * | Zoom Video Communications Inc. Class A | 208,834 | 38,407 |
| * | EPAM Systems Inc. | 54,640 | 36,524 |
| * | Match Group Inc. | 272,756 | 36,072 |
| * | ANSYS Inc. | 88,484 | 35,493 |
| * | MongoDB Inc. Class A | 63,755 | 33,749 |
| * | Okta Inc. | 149,703 | 33,559 |
| * | Twitter Inc. | 770,090 | 33,283 |
| * | Cloudflare Inc. Class A | 249,987 | 32,873 |
| * | Palantir Technologies Inc. Class A | 1,740,261 | 31,690 |
| * | DoorDash Inc. Class A | 205,433 | 30,589 |
| * | HubSpot Inc. | 45,530 | 30,011 |
| * | ON Semiconductor Corp. | 436,775 | 29,666 |
| Corning Inc. | 779,009 | 29,003 | |
| * | DocuSign Inc. Class A | 189,553 | 28,871 |
| CDW Corp. | 137,663 | 28,191 | |
| * | Zscaler Inc. | 85,220 | 27,384 |
| Teradyne Inc. | 165,314 | 27,034 | |
| * | Gartner Inc. | 79,229 | 26,488 |
| Skyworks Solutions Inc. | 167,791 | 26,031 | |
| * | Unity Software Inc. | 174,049 | 24,887 |
| VMware Inc. Class A | 212,698 | 24,647 | |
| * | VeriSign Inc. | 95,755 | 24,305 |
| Seagate Technology Holdings plc | 214,521 | 24,237 | |
| * | Tyler Technologies Inc. | 41,543 | 22,348 |
| Monolithic Power Systems Inc. | 44,419 | 21,913 | |
| * | Paycom Software Inc. | 51,758 | 21,489 |
| * | AppLovin Corp. Class A | 224,535 | 21,165 |
| Hewlett Packard Enterprise Co. | 1,327,314 | 20,932 | |
| NetApp Inc. | 226,815 | 20,865 | |
| * | Pinterest Inc. Class A | 570,721 | 20,746 |
| * | Western Digital Corp. | 316,049 | 20,610 |
| * | Akamai Technologies Inc. | 164,786 | 19,287 |
| * | Splunk Inc. | 163,840 | 18,960 |
| SS&C Technologies Holdings Inc. | 219,187 | 17,969 | |
| * | Qorvo Inc. | 111,780 | 17,481 |
| * | ZoomInfo Technologies Inc. Class A | 245,337 | 15,751 |
| * | Dell Technologies Inc. Class C | 280,011 | 15,728 |
| * | RingCentral Inc. Class A | 83,290 | 15,604 |
| NortonLifeLock Inc. | 560,761 | 14,569 | |
| * | GoDaddy Inc. Class A | 168,582 | 14,306 |
| * | Black Knight Inc. | 149,636 | 12,403 |
| Citrix Systems Inc. | 126,561 | 11,971 | |
| * | Coupa Software Inc. | 75,122 | 11,873 |
| * | UiPath Inc. Class A | 262,309 | 11,313 |
| * | IAC/InterActiveCorp. | 80,742 | 10,554 |
| Bentley Systems Inc. Class B | 205,752 | 9,944 | |
| * | F5 Inc. | 31,051 | 7,598 |
| Shares | Market Value• ($000) | ||
| * | Dropbox Inc. Class A | 298,585 | 7,327 |
| * | Zendesk Inc. | 61,310 | 6,394 |
| Leidos Holdings Inc. | 71,173 | 6,327 | |
| * | IPG Photonics Corp. | 17,616 | 3,032 |
| * | Qualtrics International Inc. Class A | 54,807 | 1,940 |
| * | Bumble Inc. Class A | 42,656 | 1,444 |
| * | HashiCorp Inc. Class A | 15,528 | 1,414 |
| * | Gitlab Inc. Class A | 11,007 | 958 |
| *,1 | Toast Inc. Class A | 22,099 | 767 |
| 13,361,419 | |||
| Telecommunications (2.7%) | |||
| Cisco Systems Inc. | 3,849,997 | 243,974 | |
| Comcast Corp. Class A | 4,624,516 | 232,752 | |
| Verizon Communications Inc. | 3,832,039 | 199,113 | |
| AT&T Inc. | 7,242,837 | 178,174 | |
| * | Charter Communications Inc. Class A | 118,195 | 77,060 |
| * | T-Mobile US Inc. | 570,102 | 66,120 |
| Motorola Solutions Inc. | 171,299 | 46,542 | |
| * | Arista Networks Inc. | 233,736 | 33,600 |
| * | Roku Inc. | 119,368 | 27,240 |
| * | Liberty Broadband Corp. Class C | 143,945 | 23,189 |
| Lumen Technologies Inc. | 1,038,535 | 13,034 | |
| * | DISH Network Corp. Class A | 249,884 | 8,106 |
| Juniper Networks Inc. | 164,954 | 5,890 | |
| * | Liberty Broadband Corp. Class A | 22,478 | 3,617 |
| * | Altice USA Inc. Class A | 109,168 | 1,766 |
| 1,160,177 | |||
| Utilities (2.7%) | |||
| NextEra Energy Inc. | 1,990,130 | 185,799 | |
| Duke Energy Corp. | 779,997 | 81,822 | |
| Southern Co. | 1,074,948 | 73,720 | |
| Waste Management Inc. | 424,292 | 70,814 | |
| Dominion Energy Inc. | 821,258 | 64,518 | |
| Exelon Corp. | 990,738 | 57,225 | |
| American Electric Power Co. Inc. | 510,874 | 45,452 | |
| Sempra Energy (XNYS) | 319,577 | 42,274 | |
| Xcel Energy Inc. | 546,394 | 36,991 | |
| Waste Connections Inc. (XTSE) | ��� 264,243 | 36,008 | |
| American Water Works Co. Inc. | 184,110 | 34,771 | |
| Public Service Enterprise Group Inc. | 512,907 | 34,226 | |
| Eversource Energy | 348,648 | 31,720 | |
| WEC Energy Group Inc. | 319,956 | 31,058 | |
| Consolidated Edison Inc. | 358,906 | 30,622 | |
| Republic Services Inc. Class A | 209,056 | 29,153 | |
| Edison International | 385,163 | 26,287 | |
| * | PG&E Corp. | 1,998,455 | 24,261 |
| Ameren Corp. | 259,091 | 23,062 | |
| FirstEnergy Corp. | 551,951 | 22,956 | |
| Entergy Corp. | 203,747 | 22,952 | |
| PPL Corp. | 761,503 | 22,891 | |
| DTE Energy Co. | 176,848 | 21,140 | |
| CMS Energy Corp. | 293,647 | 19,102 | |
| CenterPoint Energy Inc. | 637,876 | 17,803 | |
| Evergy Inc. | 230,084 | 15,786 | |
| Alliant Energy Corp. | 254,198 | 15,626 | |
| AES Corp. | 643,053 | 15,626 | |
| Shares | Market Value• ($000) | ||
| Vistra Corp. | 490,077 | 11,159 | |
| NiSource Inc. | 398,580 | 11,005 | |
| Avangrid Inc. | 78,190 | 3,900 | |
| NRG Energy Inc. | 120 | 5 | |
| 1,159,734 | |||
| Total Common Stocks (Cost $20,043,108) | 42,522,466 | ||
| Temporary Cash Investments (0.3%) | |||
| Money Market Fund (0.3%) | |||
| 2,3 | Vanguard Market Liquidity Fund, 0.090% (Cost $146,322) | 1,463,409 | 146,326 |
| Total Investments (100.0%) (Cost $20,189,430) | 42,668,792 | ||
| Other Assets and Liabilities—Net (0.0%) | (19,964) | ||
| Net Assets (100%) | 42,648,828 | ||
| Cost is in $000. | |||
| • | See Note A in Notes to Financial Statements. |
| * | Non-income-producing security. |
| 1 | Includes partial security positions on loan to broker-dealers. The total value of securities on loan is $34,214,000. |
| 2 | Affiliated money market fund available only to Vanguard funds and certain trusts and accounts managed by Vanguard. Rate shown is the 7-day yield. |
| 3 | Collateral of $37,039,000 was received for securities on loan. |
| Futures Contracts | ||||
| ($000) | ||||
| Expiration | Number of Long (Short) Contracts | Notional Amount | Value and Unrealized Appreciation (Depreciation) | |
| Long Futures Contracts | ||||
| E-mini S&P 500 Index | March 2022 | 568 | 135,141 | 3,118 |
| ($000s, except shares and per-share amounts) | Amount |
| Assets | |
| Investments in Securities, at Value | |
| Unaffiliated Issuers (Cost $20,043,108) | 42,522,466 |
| Affiliated Issuers (Cost $146,322) | 146,326 |
| Total Investments in Securities | 42,668,792 |
| Investment in Vanguard | 1,351 |
| Cash Collateral Pledged—Futures Contracts | 6,537 |
| Receivables for Accrued Income | 26,032 |
| Receivables for Capital Shares Issued | 27,435 |
| Total Assets | 42,730,147 |
| Liabilities | |
| Due to Custodian | 1,741 |
| Payables for Investment Securities Purchased | 11,952 |
| Collateral for Securities on Loan | 37,039 |
| Payables for Capital Shares Redeemed | 29,407 |
| Payables to Vanguard | 790 |
| Variation Margin Payable—Futures Contracts | 390 |
| Total Liabilities | 81,319 |
| Net Assets | 42,648,828 |
| Statement of Assets and Liabilities (continued) | |
| At December 31, 2021, net assets consisted of: | |
| ($000s, except shares and per-share amounts) | Amount |
| Paid-in Capital | 20,716,210 |
| Total Distributable Earnings (Loss) | 21,932,618 |
| Net Assets | 42,648,828 |
| Investor Shares—Net Assets | |
| Applicable to 398,815 outstanding $.001 par value shares of beneficial interest (unlimited authorization) | 35,507 |
| Net Asset Value Per Share—Investor Shares | $89.03 |
| ETF Shares—Net Assets | |
| Applicable to 128,117,756 outstanding $.001 par value shares of beneficial interest (unlimited authorization) | 28,242,106 |
| Net Asset Value Per Share—ETF Shares | $220.44 |
| Admiral Shares—Net Assets | |
| Applicable to 106,415,435 outstanding $.001 par value shares of beneficial interest (unlimited authorization) | 11,847,313 |
| Net Asset Value Per Share—Admiral Shares | $111.33 |
| Institutional Shares—Net Assets | |
| Applicable to 5,508,094 outstanding $.001 par value shares of beneficial interest (unlimited authorization) | 2,523,902 |
| Net Asset Value Per Share—Institutional Shares | $458.22 |
| Year Ended December 31, 2021 | |
| ($000) | |
| Investment Income | |
| Income | |
| Dividends1 | 513,555 |
| Interest2 | 107 |
| Securities Lending—Net | 889 |
| Total Income | 514,551 |
| Expenses | |
| The Vanguard Group—Note B | |
| Investment Advisory Services | 2,796 |
| Management and Administrative—Investor Shares | 57 |
| Management and Administrative—ETF Shares | 7,311 |
| Management and Administrative—Admiral Shares | 3,425 |
| Management and Administrative—Institutional Shares | 536 |
| Marketing and Distribution—Investor Shares | 3 |
| Marketing and Distribution—ETF Shares | 683 |
| Marketing and Distribution—Admiral Shares | 378 |
| Marketing and Distribution—Institutional Shares | 74 |
| Custodian Fees | 423 |
| Auditing Fees | 36 |
| Shareholders’ Reports—Investor Shares | — |
| Shareholders’ Reports—ETF Shares | 367 |
| Shareholders’ Reports—Admiral Shares | 73 |
| Shareholders’ Reports—Institutional Shares | 4 |
| Trustees’ Fees and Expenses | 11 |
| Total Expenses | 16,177 |
| Net Investment Income | 498,374 |
| Realized Net Gain (Loss) | |
| Investment Securities Sold2,3 | 966,868 |
| Futures Contracts | 38,844 |
| Realized Net Gain (Loss) | 1,005,712 |
| Change in Unrealized Appreciation (Depreciation) | |
| Investment Securities2 | 7,409,047 |
| Futures Contracts | (951) |
| Change in Unrealized Appreciation (Depreciation) | 7,408,096 |
| Net Increase (Decrease) in Net Assets Resulting from Operations | 8,912,182 |
| 1 | Dividends are net of foreign withholding taxes of $33,000. |
| 2 | Interest income, realized net gain (loss), capital gain distributions received, and change in unrealized appreciation (depreciation) from an affiliated company of the fund were $101,000, ($13,000), $4,000, and ($3,000), respectively. Purchases and sales are for temporary cash investment purposes. |
| 3 | Includes $1,055,916,000 of net gain (loss) resulting from in-kind redemptions. |
| Year Ended December 31, | ||
| 2021 ($000) | 2020 ($000) | |
| Increase (Decrease) in Net Assets | ||
| Operations | ||
| Net Investment Income | 498,374 | 475,660 |
| Realized Net Gain (Loss) | 1,005,712 | 736,290 |
| Change in Unrealized Appreciation (Depreciation) | 7,408,096 | 4,719,115 |
| Net Increase (Decrease) in Net Assets Resulting from Operations | 8,912,182 | 5,931,065 |
| Distributions | ||
| Investor Shares | (430) | (488) |
| ETF Shares | (325,818) | (309,168) |
| Admiral Shares | (138,853) | (134,821) |
| Institutional Shares | (30,532) | (30,593) |
| Total Distributions | (495,633) | (475,070) |
| Capital Share Transactions | ||
| Investor Shares | (9,719) | 679 |
| ETF Shares | 1,199,308 | 1,675,512 |
| Admiral Shares | 129,204 | 247,258 |
| Institutional Shares | (150,593) | 42,631 |
| Net Increase (Decrease) from Capital Share Transactions | 1,168,200 | 1,966,080 |
| Total Increase (Decrease) | 9,584,749 | 7,422,075 |
| Net Assets | ||
| Beginning of Period | 33,064,079 | 25,642,004 |
| End of Period | 42,648,828 | 33,064,079 |
| Investor Shares | |||||
| For a Share Outstanding Throughout Each Period | Year Ended December 31, | ||||
| 2021 | 2020 | 2019 | 2018 | 2017 | |
| Net Asset Value, Beginning of Period | $71.00 | $59.72 | $46.36 | $49.48 | $41.31 |
| Investment Operations | |||||
| Net Investment Income1 | .956 | .969 | .918 | .966 | .819 |
| Net Realized and Unrealized Gain (Loss) on Investments | 18.025 | 11.268 | 13.466 | (3.184) | 8.161 |
| Total from Investment Operations | 18.981 | 12.237 | 14.384 | (2.218) | 8.980 |
| Distributions | |||||
| Dividends from Net Investment Income | (.951) | (.957) | (1.024) | (.902) | (.810) |
| Distributions from Realized Capital Gains | — | — | — | — | — |
| Total Distributions | (.951) | (.957) | (1.024) | (.902) | (.810) |
| Net Asset Value, End of Period | $89.03 | $71.00 | $59.72 | $46.36 | $49.48 |
| Total Return2 | 26.87% | 20.89% | 31.23% | -4.59% | 21.89% |
| Ratios/Supplemental Data | |||||
| Net Assets, End of Period (Millions) | $36 | $37 | $30 | $344 | $387 |
| Ratio of Total Expenses to Average Net Assets | 0.17% | 0.17% | 0.17% | 0.17% | 0.17% |
| Ratio of Net Investment Income to Average Net Assets | 1.19% | 1.61% | 1.75% | 1.91% | 1.81% |
| Portfolio Turnover Rate3 | 4% | 3% | 5% | 4% | 3% |
| 1 | Calculated based on average shares outstanding. |
| 2 | Total returns do not include account service fees that may have applied in the periods shown. Fund prospectuses provide information about any applicable account service fees. |
| 3 | Excludes the value of portfolio securities received or delivered as a result of in-kind purchases or redemptions of the fund’s capital shares, including ETF Creation Units. |
| ETF Shares | |||||
| For a Share Outstanding Throughout Each Period | Year Ended December 31, | ||||
| 2021 | 2020 | 2019 | 2018 | 2017 | |
| Net Asset Value, Beginning of Period | $175.80 | $147.88 | $114.77 | $122.49 | $102.27 |
| Investment Operations | |||||
| Net Investment Income1 | 2.646 | 2.594 | 2.581 | 2.572 | 2.168 |
| Net Realized and Unrealized Gain (Loss) on Investments | 44.617 | 27.890 | 33.204 | (7.896) | 20.196 |
| Total from Investment Operations | 47.263 | 30.484 | 35.785 | (5.324) | 22.364 |
| Distributions | |||||
| Dividends from Net Investment Income | (2.623) | (2.564) | (2.675) | (2.396) | (2.144) |
| Distributions from Realized Capital Gains | — | — | — | — | — |
| Total Distributions | (2.623) | (2.564) | (2.675) | (2.396) | (2.144) |
| Net Asset Value, End of Period | $220.44 | $175.80 | $147.88 | $114.77 | $122.49 |
| Total Return | 27.02% | 20.99% | 31.39% | -4.44% | 22.03% |
| Ratios/Supplemental Data | |||||
| Net Assets, End of Period (Millions) | $28,242 | $21,540 | $16,270 | $12,358 | $11,613 |
| Ratio of Total Expenses to Average Net Assets | 0.04% | 0.04% | 0.04% | 0.04% | 0.05% |
| Ratio of Net Investment Income to Average Net Assets | 1.33% | 1.74% | 1.93% | 2.04% | 1.93% |
| Portfolio Turnover Rate2 | 4% | 3% | 5% | 4% | 3% |
| 1 | Calculated based on average shares outstanding. |
| 2 | Excludes the value of portfolio securities received or delivered as a result of in-kind purchases or redemptions of the fund’s capital shares, including ETF Creation Units. |
| Admiral Shares | |||||
| For a Share Outstanding Throughout Each Period | Year Ended December 31, | ||||
| 2021 | 2020 | 2019 | 2018 | 2017 | |
| Net Asset Value, Beginning of Period | $88.79 | $74.69 | $57.96 | $61.86 | $51.65 |
| Investment Operations | |||||
| Net Investment Income1 | 1.325 | 1.303 | 1.299 | 1.288 | 1.094 |
| Net Realized and Unrealized Gain (Loss) on Investments | 22.530 | 14.084 | 16.774 | (3.983) | 10.197 |
| Total from Investment Operations | 23.855 | 15.387 | 18.073 | (2.695) | 11.291 |
| Distributions | |||||
| Dividends from Net Investment Income | (1.315) | (1.287) | (1.343) | (1.205) | (1.081) |
| Distributions from Realized Capital Gains | — | — | — | — | — |
| Total Distributions | (1.315) | (1.287) | (1.343) | (1.205) | (1.081) |
| Net Asset Value, End of Period | $111.33 | $88.79 | $74.69 | $57.96 | $61.86 |
| Total Return2 | 27.01% | 21.03% | 31.39% | -4.47% | 22.03% |
| Ratios/Supplemental Data | |||||
| Net Assets, End of Period (Millions) | $11,847 | $9,338 | $7,546 | $5,306 | $5,375 |
| Ratio of Total Expenses to Average Net Assets | 0.05% | 0.05% | 0.05% | 0.05% | 0.05% |
| Ratio of Net Investment Income to Average Net Assets | 1.32% | 1.73% | 1.92% | 2.03% | 1.93% |
| Portfolio Turnover Rate3 | 4% | 3% | 5% | 4% | 3% |
| 1 | Calculated based on average shares outstanding. |
| 2 | Total returns do not include account service fees that may have applied in the periods shown. Fund prospectuses provide information about any applicable account service fees. |
| 3 | Excludes the value of portfolio securities received or delivered as a result of in-kind purchases or redemptions of the fund’s capital shares, including ETF Creation Units. |
| Institutional Shares | |||||
| For a Share Outstanding Throughout Each Period | Year Ended December 31, | ||||
| 2021 | 2020 | 2019 | 2018 | 2017 | |
| Net Asset Value, Beginning of Period | $365.43 | $307.39 | $238.57 | $254.60 | $212.59 |
| Investment Operations | |||||
| Net Investment Income1 | 5.477 | 5.389 | 5.363 | 5.345 | 4.529 |
| Net Realized and Unrealized Gain (Loss) on Investments | 92.764 | 57.981 | 69.016 | (16.390) | 41.958 |
| Total from Investment Operations | 98.241 | 63.370 | 74.379 | (11.045) | 46.487 |
| Distributions | |||||
| Dividends from Net Investment Income | (5.451) | (5.330) | (5.559) | (4.985) | (4.477) |
| Distributions from Realized Capital Gains | — | — | — | — | — |
| Total Distributions | (5.451) | (5.330) | (5.559) | (4.985) | (4.477) |
| Net Asset Value, End of Period | $458.22 | $365.43 | $307.39 | $238.57 | $254.60 |
| Total Return | 27.03% | 21.05% | 31.39% | -4.46% | 22.03% |
| Ratios/Supplemental Data | |||||
| Net Assets, End of Period (Millions) | $2,524 | $2,149 | $1,796 | $1,178 | $1,212 |
| Ratio of Total Expenses to Average Net Assets | 0.04% | 0.04% | 0.04% | 0.04% | 0.04% |
| Ratio of Net Investment Income to Average Net Assets | 1.32% | 1.74% | 1.92% | 2.04% | 1.94% |
| Portfolio Turnover Rate2 | 4% | 3% | 5% | 4% | 3% |
| 1 | Calculated based on average shares outstanding. |
| 2 | Excludes the value of portfolio securities received or delivered as a result of in-kind purchases or redemptions of the fund’s capital shares, including ETF Creation Units. |
| A. | The following significant accounting policies conform to generally accepted accounting principles for U.S. investment companies. The fund consistently follows such policies in preparing its financial statements. |
| B. | In accordance with the terms of a Funds' Service Agreement (the “FSA”) between Vanguard and the fund, Vanguard furnishes to the fund investment advisory, corporate management, administrative, marketing, and distribution services at Vanguard’s cost of operations (as defined by the FSA). These costs of operations are allocated to the fund based on methods and guidelines approved by the board of trustees and are generally settled twice a month. |
| C. | Various inputs may be used to determine the value of the fund’s investments and derivatives. These inputs are summarized in three broad levels for financial statement purposes. The inputs or methodologies used to value securities are not necessarily an indication of the risk associated with investing in those securities. |
| D. | Permanent differences between book-basis and tax-basis components of net assets are reclassified among capital accounts in the financial statements to reflect their tax character. These reclassifications have no effect on net assets or net asset value per share. As of period end, permanent differences primarily attributable to the accounting for in-kind redemtions and passive foreign investment companies were reclassified between the following accounts: |
| Amount ($000) | |
| Paid-in Capital | 1,055,936 |
| Total Distributable Earnings (Loss) | (1,055,936) |
| Amount ($000) | |
| Undistributed Ordinary Income | 6,784 |
| Undistributed Long-Term Gains | — |
| Capital Loss Carryforwards | (548,877) |
| Qualified Late-Year Losses | — |
| Net Unrealized Gains (Losses) | 22,474,711 |
| Year Ended December 31, | ||
| 2021 Amount ($000) | 2020 Amount ($000) | |
| Ordinary Income* | 495,633 | 475,070 |
| Long-Term Capital Gains | — | — |
| Total | 495,633 | 475,070 |
| * | Includes short-term capital gains, if any. |
| Amount ($000) | |
| Tax Cost | 20,194,081 |
| Gross Unrealized Appreciation | 23,120,438 |
| Gross Unrealized Depreciation | (645,727) |
| Net Unrealized Appreciation (Depreciation) | 22,474,711 |
| E. | During the year ended December 31, 2021, the fund purchased $4,279,792,000 of investment securities and sold $3,016,565,000 of investment securities, other than temporary cash investments. Purchases and sales include $2,482,297,000 and $1,422,074,000, respectively, in connection with in-kind purchases and redemptions of the fund's capital shares. |
| F. | Capital share transactions for each class of shares were: |
| Year Ended December 31, | |||||
| 2021 | 2020 | ||||
| Amount ($000) | Shares (000) | Amount ($000) | Shares (000) | ||
| Investor Shares | |||||
| Issued | 6,179 | 78 | 12,683 | 220 | |
| Issued in Lieu of Cash Distributions | 430 | 5 | 488 | 9 | |
| Redeemed | (16,328) | (202) | (12,492) | (213) | |
| Net Increase (Decrease)—Investor Shares | (9,719) | (119) | 679 | 16 | |
| ETF Shares | |||||
| Issued | 2,640,652 | 12,968 | 2,981,881 | 21,401 | |
| Issued in Lieu of Cash Distributions | — | — | — | — | |
| Redeemed | (1,441,344) | (7,375) | (1,306,369) | (8,900) | |
| Net Increase (Decrease)—ETF Shares | 1,199,308 | 5,593 | 1,675,512 | 12,501 | |
| Admiral Shares | |||||
| Issued | 1,711,321 | 17,206 | 2,270,102 | 32,290 | |
| Issued in Lieu of Cash Distributions | 112,879 | 1,108 | 109,775 | 1,534 | |
| Redeemed | (1,694,996) | (17,070) | (2,132,619) | (29,688) | |
| Net Increase (Decrease)—Admiral Shares | 129,204 | 1,244 | 247,258 | 4,136 | |
| Year Ended December 31, | |||||
| 2021 | 2020 | ||||
| Amount ($000) | Shares (000) | Amount ($000) | Shares (000) | ||
| Institutional Shares | |||||
| Issued | 539,667 | 1,322 | 602,657 | 1,940 | |
| Issued in Lieu of Cash Distributions | 26,988 | 65 | 26,683 | 91 | |
| Redeemed | (717,248) | (1,761) | (586,709) | (1,991) | |
| Net Increase (Decrease)—Institutional Shares | (150,593) | (374) | 42,631 | 40 | |
| G. | Management has determined that no events or transactions occurred subsequent to December 31, 2021, that would require recognition or disclosure in these financial statements. |
Philadelphia, Pennsylvania
February 16, 2022
| Fund | Percentage |
| Growth Index Fund | 93.4% |
| Value Index Fund | 94.2 |
| Large-Cap Index Fund | 94.2 |
| Fund | ($000) |
| Growth Index Fund | 843,350 |
| Value Index Fund | 2,892,802 |
| Large-Cap Index Fund | 484,779 |
| Fund | ($000) |
| Growth Index Fund | 41,778 |
| Value Index Fund | — |
| Large-Cap Index Fund | 10,854 |
| Matthew Benchener | Thomas M. Rampulla |
| Joseph Brennan | Karin A. Risi |
| Mortimer J. Buckley | Anne E. Robinson |
| Gregory Davis | Michael Rollings |
| John James | Nitin Tandon |
| John T. Marcante | Lauren Valente |
| Chris D. Mclsaac |

All rights reserved.
U.S. Patent Nos. 6,879,964
Vanguard Marketing Corporation, Distributor.

| 1 | |
| 2 | |
| 4 | |
| 8 |
| • | For the 12 months ended December 31, 2021, returns for Vanguard Total Stock Market Index Fund ranged from 25.59% for Investor Shares to 25.75% for Institutional Select Shares. |
| • | The U.S. economy continued to heal over the 12 months. Vaccination programs started to roll out shortly after the beginning of the year, helping hard-hit sectors such as hospitality, leisure, and travel begin to rebound, and more workers returned to the labor force. U.S. stocks turned in a strong performance even with the spread of new COVID-19 variants, a surge in inflation, and Federal Reserve monetary policy turning less accommodative. |
| • | The fund, which offers investors exposure to every segment, size, and style of the U.S. equity market, closely tracked its target index, the CRSP US Total Market Index. |
| • | All 11 sectors recorded positive returns for the 12 months. Technology, financial, and consumer discretionary stocks contributed most to the fund’s performance. |
| Average Annual Total Returns Periods Ended December 31, 2021 | |||
| One Year | Three Years | Five Years | |
| Stocks | |||
| Russell 1000 Index (Large-caps) | 26.45% | 26.21% | 18.43% |
| Russell 2000 Index (Small-caps) | 14.82 | 20.02 | 12.02 |
| Russell 3000 Index (Broad U.S. market) | 25.66 | 25.79 | 17.97 |
| FTSE All-World ex US Index (International) | 8.36 | 13.66 | 9.89 |
| Bonds | |||
| Bloomberg U.S. Aggregate Bond Index (Broad taxable market) | -1.54% | 4.79% | 3.57% |
| Bloomberg Municipal Bond Index (Broad tax-exempt market) | 1.52 | 4.73 | 4.17 |
| FTSE Three-Month U.S. Treasury Bill Index | 0.05 | 0.95 | 1.11 |
| CPI | |||
| Consumer Price Index | 7.04% | 3.53% | 2.92% |
| • | Based on actual fund return. This section helps you to estimate the actual expenses that you paid over the period. The ”Ending Account Value“ shown is derived from the fund’s actual return, and the third column shows the dollar amount that would have been paid by an investor who started with $1,000 in the fund. You may use the information here, together with the amount you invested, to estimate the expenses that you paid over the period. |
| • | Based on hypothetical 5% yearly return. This section is intended to help you compare your fund‘s costs with those of other mutual funds. It assumes that the fund had a yearly return of 5% before expenses, but that the expense ratio is unchanged. In this case—because the return used is not the fund’s actual return—the results do not apply to your investment. The example is useful in making comparisons because the Securities and Exchange Commission requires all mutual funds to calculate expenses based on a 5% return. You can assess your fund’s costs by comparing this hypothetical example with the hypothetical examples that appear in shareholder reports of other funds. |
| Six Months Ended December 31, 2021 | |||
| Beginning Account Value 6/30/2021 | Ending Account Value 12/31/2021 | Expenses Paid During Period | |
| Based on Actual Fund Return | |||
| Total Stock Market Index Fund | |||
| Investor Shares | $1,000.00 | $1,090.30 | $0.74 |
| ETF Shares | 1,000.00 | 1,090.80 | 0.16 |
| Admiral™ Shares | 1,000.00 | 1,090.90 | 0.21 |
| Institutional Shares | 1,000.00 | 1,090.90 | 0.16 |
| Institutional Plus Shares | 1,000.00 | 1,090.90 | 0.11 |
| Institutional Select Shares | 1,000.00 | 1,091.00 | 0.05 |
| Based on Hypothetical 5% Yearly Return | |||
| Total Stock Market Index Fund | |||
| Investor Shares | $1,000.00 | $1,024.50 | $0.71 |
| ETF Shares | 1,000.00 | 1,025.05 | 0.15 |
| Admiral Shares | 1,000.00 | 1,025.00 | 0.20 |
| Institutional Shares | 1,000.00 | 1,025.05 | 0.15 |
| Institutional Plus Shares | 1,000.00 | 1,025.10 | 0.10 |
| Institutional Select Shares | 1,000.00 | 1,025.15 | 0.05 |
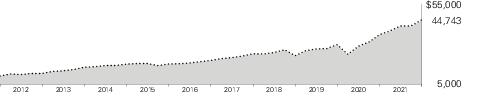
| Average Annual Total Returns Periods Ended December 31, 2021 | |||||
| One Year | Five Years | Ten Years | Final Value of a $10,000 Investment | ||
 | Total Stock Market Index Fund Investor Shares | 25.59% | 17.86% | 16.16% | $44,743 |
 | Spliced Total Stock Market Index | 25.72 | 18.00 | 16.31 | 45,289 |
| One Year | Five Years | Ten Years | Final Value of a $10,000 Investment | ||
| Total Stock Market Index Fund ETF Shares Net Asset Value | 25.72% | 17.98% | 16.29% | $45,240 | |
| Total Stock Market Index Fund ETF Shares Market Price | 25.64 | 17.97 | 16.29 | 45,245 | |
| Spliced Total Stock Market Index | 25.72 | 18.00 | 16.31 | 45,289 | |
| Average Annual Total Returns Periods Ended December 31, 2021 | |||||
| One Year | Five Years | Ten Years | Final Value of a $10,000 Investment | ||
| Total Stock Market Index Fund Admiral Shares | 25.71% | 17.98% | 16.29% | $45,224 | |
| Spliced Total Stock Market Index | 25.72 | 18.00 | 16.31 | 45,289 | |
| One Year | Five Years | Ten Years | Final Value of a $5,000,000 Investment | ||
| Total Stock Market Index Fund Institutional Shares | 25.73% | 17.99% | 16.30% | $22,632,376 | |
| Spliced Total Stock Market Index | 25.72 | 18.00 | 16.31 | 22,644,332 | |
| One Year | Five Years | Since Inception (4/28/2015) | Final Value of a $100,000,000 Investment | ||
| Total Stock Market Index Fund Institutional Plus Shares | 25.74% | 18.01% | 14.67% | $249,417,470 | |
| CRSP US Total Market Index | 25.72 | 18.00 | 14.66 | 249,242,800 | |
| One Year | Five Years | Since Inception (6/27/2016) | Final Value of a $5,000,000,000 Investment | ||
| Total Stock Market Index Fund Institutional Select Shares | 25.75% | 18.02% | 19.06% | $13,077,055,500 | |
| CRSP US Total Market Index | 25.72 | 18.00 | 19.04 | 13,063,790,500 | |
| Cumulative Returns of ETF Shares: December 31, 2011, Through December 31, 2021 | |||
| One Year | Five Years | Ten Years | |
| Total Stock Market Index Fund ETF Shares Market Price | 25.64% | 128.50% | 352.45% |
| Total Stock Market Index Fund ETF Shares Net Asset Value | 25.72 | 128.61 | 352.40 |
| Spliced Total Stock Market Index | 25.72 | 128.73 | 352.89 |
| Basic Materials | 2.0% |
| Consumer Discretionary | 16.0 |
| Consumer Staples | 4.7 |
| Energy | 2.8 |
| Financials | 10.9 |
| Health Care | 12.8 |
| Industrials | 12.8 |
| Real Estate | 3.7 |
| Technology | 29.0 |
| Telecommunications | 2.6 |
| Utilities | 2.7 |
| Shares | Market Value• ($000) | |||||
| Common Stocks (99.6%) | ||||||
| Basic Materials (2.0%) | ||||||
| Linde plc | 14,543,767 | 5,038,397 | ||||
| Air Products and Chemicals Inc. | 6,294,953 | 1,915,302 | ||||
| Freeport-McMoRan Inc. | 41,735,180 | 1,741,609 | ||||
| Ecolab Inc. | 7,329,473 | 1,719,421 | ||||
| Newmont Corp. | 22,661,214 | 1,405,448 | ||||
| Dow Inc. | 21,020,483 | 1,192,282 | ||||
| International Flavors & Fragrances Inc. | 7,234,165 | 1,089,827 | ||||
| Fastenal Co. | 16,346,708 | 1,047,170 | ||||
| Nucor Corp. | 8,122,422 | 927,174 | ||||
| Albemarle Corp. | 3,324,814 | 777,242 | ||||
| LyondellBasell Industries NV Class A | 7,566,634 | 697,871 | ||||
| Celanese Corp. | 3,094,117 | 519,997 | ||||
| International Paper Co. | 11,006,638 | 517,092 | ||||
| Avery Dennison Corp. | 2,352,252 | 509,427 | ||||
| Eastman Chemical Co. | 3,821,453 | 462,052 | ||||
| CF Industries Holdings Inc. | 6,096,710 | 431,525 | ||||
| Mosaic Co. | 10,518,914 | 413,288 | ||||
| FMC Corp. | 3,602,212 | 395,847 | ||||
| Steel Dynamics Inc. | 5,356,743 | 332,493 | ||||
| Alcoa Corp. | 5,318,356 | 316,868 | ||||
| Reliance Steel & Aluminum Co. | 1,779,532 | 288,676 | ||||
| * | Cleveland-Cliffs Inc. | 12,790,692 | 278,453 | |||
| Olin Corp. | 4,077,809 | 234,556 | ||||
| Royal Gold Inc. | 1,863,823 | 196,093 | ||||
| Huntsman Corp. | 5,575,458 | 194,472 | ||||
| Valvoline Inc. | 5,117,124 | 190,818 | ||||
| Scotts Miracle-Gro Co. | 1,097,268 | 176,660 | ||||
| * | RBC Bearings Inc. | 820,925 | 165,802 | |||
| United States Steel Corp. | 6,894,514 | 164,158 | ||||
| Shares | Market Value• ($000) | |||||
| Ashland Global Holdings Inc. | 1,453,857 | 156,522 | ||||
| Chemours Co. | 4,633,493 | 155,500 | ||||
| Balchem Corp. | 920,794 | 155,246 | ||||
| UFP Industries Inc. | 1,670,505 | 153,703 | ||||
| Avient Corp. | 2,601,769 | 145,569 | ||||
| Element Solutions Inc. | 5,977,174 | 145,126 | ||||
| * | Univar Solutions Inc. | 4,851,470 | 137,539 | |||
| Timken Co. | 1,941,655 | 134,537 | ||||
| Commercial Metals Co. | 3,461,159 | 125,605 | ||||
| * | Hexcel Corp. | 2,387,039 | 123,649 | |||
| Sensient Technologies Corp. | 1,195,304 | 119,602 | ||||
| *,1 | MP Materials Corp. | 2,526,129 | 114,737 | |||
| * | Livent Corp. | 4,581,285 | 111,692 | |||
| Mueller Industries Inc. | 1,548,402 | 91,913 | ||||
| Cabot Corp. | 1,614,227 | 90,720 | ||||
| * | Arconic Corp. | 2,725,301 | 89,962 | |||
| Westlake Chemical Corp. | 907,576 | 88,153 | ||||
| 1 | Quaker Chemical Corp. | 381,730 | 88,096 | |||
| * | Ingevity Corp. | 1,121,374 | 80,403 | |||
| Hecla Mining Co. | 15,338,342 | 80,066 | ||||
| Boise Cascade Co. | 1,118,842 | 79,662 | ||||
| Tronox Holdings plc Class A | 3,281,029 | 78,843 | ||||
| NewMarket Corp. | 226,927 | 77,772 | ||||
| Stepan Co. | 605,635 | 75,274 | ||||
| Minerals Technologies Inc. | 948,157 | 69,358 | ||||
| GrafTech International Ltd. | 5,613,712 | 66,410 | ||||
| Innospec Inc. | 698,841 | 63,133 | ||||
| Materion Corp. | 580,245 | 53,348 | ||||
| Compass Minerals International Inc. | 967,246 | 49,407 | ||||
| Worthington Industries Inc. | 856,689 | 46,827 | ||||
| Shares | Market Value• ($000) | |||||
| * | GCP Applied Technologies Inc. | 1,464,593 | 46,369 | |||
| Kaiser Aluminum Corp. | 453,321 | 42,585 | ||||
| * | Kraton Corp. | 871,582 | 40,372 | |||
| Carpenter Technology Corp. | 1,371,752 | 40,041 | ||||
| Schnitzer Steel Industries Inc. Class A | 698,597 | 36,271 | ||||
| AdvanSix Inc. | 753,607 | 35,608 | ||||
| *,1 | Energy Fuels Inc. | 4,421,625 | 33,737 | |||
| * | Coeur Mining Inc. | 6,516,993 | 32,846 | |||
| *,1 | Amyris Inc. | 5,253,903 | 28,424 | |||
| * | Sylvamo Corp. | 1,005,492 | 28,043 | |||
| Schweitzer-Mauduit International Inc. | 901,505 | 26,955 | ||||
| *,1 | Uranium Energy Corp. | 7,359,096 | 24,653 | |||
| * | Century Aluminum Co. | 1,382,886 | 22,901 | |||
| Glatfelter Corp. | 1,275,904 | 21,946 | ||||
| Neenah Inc. | 470,344 | 21,768 | ||||
| Hawkins Inc. | 532,230 | 20,996 | ||||
| Resolute Forest Products Inc. | 1,349,536 | 20,607 | ||||
| Verso Corp. Class A | 740,740 | 20,015 | ||||
| * | US Silica Holdings Inc. | 1,992,459 | 18,729 | |||
| * | Koppers Holdings Inc. | 587,127 | 18,377 | |||
| * | TimkenSteel Corp. | 1,090,490 | 17,993 | |||
| Ecovyst Inc. | 1,747,108 | 17,890 | ||||
| * | Clearwater Paper Corp. | 473,105 | 17,349 | |||
| * | Piedmont Lithium Inc. | 326,173 | 17,111 | |||
| Haynes International Inc. | 347,482 | 14,014 | ||||
| * | Gatos Silver Inc. | 1,256,006 | 13,037 | |||
| *,1 | Origin Materials Inc. | 1,949,891 | 12,577 | |||
| American Vanguard Corp. | 749,948 | 12,292 | ||||
| * | Intrepid Potash Inc. | 283,137 | 12,098 | |||
| Ryerson Holding Corp. | 434,515 | 11,319 | ||||
| Omega Flex Inc. | 88,289 | 11,208 | ||||
| Tredegar Corp. | 838,057 | 9,906 | ||||
| * | Unifi Inc. | 422,068 | 9,771 | |||
| * | Alto Ingredients Inc. | 1,951,445 | 9,386 | |||
| * | Rayonier Advanced Materials Inc. | 1,621,220 | 9,257 | |||
| *,1 | Zymergen Inc. | 1,311,077 | 8,771 | |||
| * | LSB Industries Inc. | 758,771 | 8,384 | |||
| * | Northwest Pipe Co. | 261,682 | 8,321 | |||
| * | Ur-Energy Inc. | 5,846,618 | 7,133 | |||
| Olympic Steel Inc. | 266,301 | 6,258 | ||||
| Shares | Market Value• ($000) | |||||
| FutureFuel Corp. | 739,753 | 5,652 | ||||
| * | NN Inc. | 1,112,705 | 4,562 | |||
| Eastern Co. | 163,141 | 4,105 | ||||
| * | Synalloy Corp. | 237,258 | 3,898 | |||
| Northern Technologies International Corp. | 243,564 | 3,727 | ||||
| Gold Resource Corp. | 2,125,660 | 3,316 | ||||
| Culp Inc. | 277,660 | 2,641 | ||||
| * | Perma-Pipe International Holdings Inc. | 263,560 | 2,267 | |||
| * | Universal Stainless & Alloy Products Inc. | 278,493 | 2,197 | |||
| *,1 | Westwater Resources Inc. | 989,913 | 2,128 | |||
| * | Marrone Bio Innovations Inc. | 2,812,532 | 2,026 | |||
| * | Comstock Mining Inc. | 1,460,392 | 1,884 | |||
| * | US Gold Corp. | 201,077 | 1,802 | |||
| * | Ampco-Pittsburgh Corp. | 357,753 | 1,789 | |||
| Friedman Industries Inc. | 185,959 | 1,744 | ||||
| *,1 | Golden Minerals Co. | 4,469,717 | 1,561 | |||
| *,1 | PharmaCyte Biotech Inc. | 590,900 | 1,477 | |||
| *,1 | United States Antimony Corp. | 2,763,406 | 1,376 | |||
| *,1 | CPS Technologies Corp. | 336,311 | 1,275 | |||
| * | AgroFresh Solutions Inc. | 635,804 | 1,265 | |||
| * | ABVC BioPharma Inc. | 372,760 | 1,264 | |||
| United-Guardian Inc. | 73,036 | 1,198 | ||||
| * | Paramount Gold Nevada Corp. | 1,225,450 | 856 | |||
| * | Hycroft Mining Holding Corp. | 986,180 | 602 | |||
| * | Flexible Solutions International Inc. | 151,258 | 588 | |||
| * | Solitario Zinc Corp. | 638,028 | 319 | |||
| Chicago Rivet & Machine Co. | 11,238 | 295 | ||||
| * | Orbsat Corp. | 50,264 | 162 | |||
| * | Hycroft Mining Holding Corp. Warrants Exp. 10/6/25 | 155,000 | 18 | |||
| *,2 | Partners LP CVR | 61,021 | 4 | |||
| 27,259,710 | ||||||
| Consumer Discretionary (15.9%) | ||||||
| * | Amazon.com Inc. | 12,251,420 | 40,850,400 | |||
| * | Tesla Inc. | 22,833,680 | 24,130,176 | |||
| Home Depot Inc. | 29,677,684 | 12,316,536 | ||||
| * | Walt Disney Co. | 51,659,466 | 8,001,535 | |||
| Shares | Market Value• ($000) | |||||
| * | Netflix Inc. | 12,588,931 | 7,584,076 | |||
| Costco Wholesale Corp. | 12,557,012 | 7,128,616 | ||||
| NIKE Inc. Class B | 36,315,359 | 6,052,681 | ||||
| Walmart Inc. | 39,624,211 | 5,733,227 | ||||
| McDonald's Corp. | 21,236,707 | 5,692,924 | ||||
| Lowe's Cos. Inc. | 19,148,036 | 4,949,384 | ||||
| Starbucks Corp. | 33,341,115 | 3,899,910 | ||||
| Target Corp. | 13,616,463 | 3,151,394 | ||||
| * | Booking Holdings Inc. | 1,166,961 | 2,799,808 | |||
| TJX Cos. Inc. | 32,467,240 | 2,464,913 | ||||
| Ford Motor Co. | 111,552,791 | 2,316,951 | ||||
| Estee Lauder Cos. Inc. Class A | 6,256,258 | 2,316,067 | ||||
| * | General Motors Co. | 37,137,412 | 2,177,366 | |||
| * | Uber Technologies Inc. | 41,355,353 | 1,734,030 | |||
| Dollar General Corp. | 6,629,763 | 1,563,497 | ||||
| * | Airbnb Inc. Class A | 9,364,259 | 1,559,055 | |||
| Activision Blizzard Inc. | 22,137,065 | 1,472,779 | ||||
| * | O'Reilly Automotive Inc. | 1,914,787 | 1,352,280 | |||
| * | Chipotle Mexican Grill Inc. | 759,588 | 1,327,950 | |||
| * | Lululemon Athletica Inc. | 3,364,407 | 1,316,997 | |||
| * | Marriott International Inc. Class A | 7,866,848 | 1,299,918 | |||
| * | Aptiv plc | 7,688,486 | 1,268,216 | |||
| * | AutoZone Inc. | 595,953 | 1,249,350 | |||
| * | Hilton Worldwide Holdings Inc. | 7,920,317 | 1,235,490 | |||
| Yum! Brands Inc. | 8,329,093 | 1,156,578 | ||||
| Ross Stores Inc. | 10,099,477 | 1,154,168 | ||||
| * | Trade Desk Inc. Class A | 12,394,032 | 1,135,789 | |||
| eBay Inc. | 16,901,659 | 1,123,960 | ||||
| Electronic Arts Inc. | 8,037,915 | 1,060,201 | ||||
| DR Horton Inc. | 9,625,981 | 1,043,938 | ||||
| * | Copart Inc. | 6,066,720 | 919,836 | |||
| * | Dollar Tree Inc. | 6,394,307 | 898,528 | |||
| Lennar Corp. Class A | 7,353,948 | 854,235 | ||||
| * | ROBLOX Corp. Class A | 8,245,691 | 850,625 | |||
| * | Etsy Inc. | 3,604,714 | 789,216 | |||
| Tractor Supply Co. | 3,234,491 | 771,750 | ||||
| * | Expedia Group Inc. | 4,149,671 | 749,929 | |||
| VF Corp. | 10,046,410 | 735,598 | ||||
| * | Southwest Airlines Co. | 16,828,738 | 720,943 | |||
| * | Delta Air Lines Inc. | 18,200,263 | 711,266 | |||
| Best Buy Co. Inc. | 6,291,594 | 639,226 | ||||
| * | Ulta Beauty Inc. | 1,544,958 | 637,048 | |||
| Pool Corp. | 1,081,785 | 612,290 | ||||
| Shares | Market Value• ($000) | |||||
| * | CarMax Inc. | 4,607,433 | 600,026 | |||
| Garmin Ltd. | 4,370,417 | 595,120 | ||||
| Domino's Pizza Inc. | 1,033,981 | 583,507 | ||||
| * | Take-Two Interactive Software Inc. | 3,277,010 | 582,390 | |||
| Genuine Parts Co. | 4,046,954 | 567,383 | ||||
| * | Carvana Co. | 2,432,228 | 563,766 | |||
| * | NVR Inc. | 94,045 | 555,700 | |||
| Darden Restaurants Inc. | 3,687,923 | 555,549 | ||||
| * | Burlington Stores Inc. | 1,897,609 | 553,172 | |||
| * | Caesars Entertainment Inc. | 5,770,573 | 539,722 | |||
| *,1 | Rivian Automotive Inc. Class A | 5,021,486 | 520,678 | |||
| MGM Resorts International | 11,329,267 | 508,458 | ||||
| ViacomCBS Inc. Class B | 16,698,902 | 503,973 | ||||
| Bath & Body Works Inc. | 7,134,103 | 497,889 | ||||
| * | Live Nation Entertainment Inc. | 4,151,132 | 496,849 | |||
| * | Carnival Corp. | 23,707,539 | 476,996 | |||
| * | Royal Caribbean Cruises Ltd. | 6,153,089 | 473,173 | |||
| * | Las Vegas Sands Corp. | 11,947,168 | 449,691 | |||
| *,1 | Lucid Group Inc. | 11,698,786 | 445,139 | |||
| Omnicom Group Inc. | 6,042,274 | 442,717 | ||||
| Advance Auto Parts Inc. | 1,772,234 | 425,124 | ||||
| LKQ Corp. | 7,041,683 | 422,712 | ||||
| Interpublic Group of Cos. Inc. | 11,193,299 | 419,189 | ||||
| Whirlpool Corp. | 1,726,218 | 405,074 | ||||
| * | United Airlines Holdings Inc. | 9,196,987 | 402,644 | |||
| * | Wayfair Inc. Class A | 2,105,495 | 399,981 | |||
| *,1 | AMC Entertainment Holdings Inc. Class A | 14,599,205 | 397,098 | |||
| PulteGroup Inc. | 6,835,665 | 390,727 | ||||
| Hasbro Inc. | 3,724,421 | 379,072 | ||||
| Vail Resorts Inc. | 1,149,367 | 376,877 | ||||
| * | Floor & Decor Holdings Inc. Class A | 2,850,891 | 370,644 | |||
| Williams-Sonoma Inc. | 2,084,255 | 352,510 | ||||
| * | Lyft Inc. Class A | 8,025,249 | 342,919 | |||
| * | Liberty Media Corp.-Liberty Formula One Class C | 5,278,105 | 333,787 | |||
| * | American Airlines Group Inc. | 18,418,499 | 330,796 | |||
| Shares | Market Value• ($000) | |||||
| * | Five Below Inc. | 1,592,336 | 329,438 | |||
| Fox Corp. Class A | 8,902,445 | 328,500 | ||||
| Tapestry Inc. | 7,820,060 | 317,494 | ||||
| Service Corp. International | 4,452,632 | 316,092 | ||||
| Lear Corp. | 1,694,167 | 309,948 | ||||
| * | SiteOne Landscape Supply Inc. | 1,269,760 | 307,637 | |||
| BorgWarner Inc. | 6,815,140 | 307,158 | ||||
| News Corp. Class A | 13,395,796 | 298,860 | ||||
| * | Peloton Interactive Inc. Class A | 8,049,408 | 287,847 | |||
| * | Deckers Outdoor Corp. | 780,138 | 285,772 | |||
| * | Capri Holdings Ltd. | 4,276,731 | 277,603 | |||
| * | BJ's Wholesale Club Holdings Inc. | 4,132,121 | 276,728 | |||
| *,1 | GameStop Corp. Class A | 1,847,892 | 274,209 | |||
| Aramark | 7,285,002 | 268,452 | ||||
| * | RH | 486,895 | 260,947 | |||
| Tempur Sealy International Inc. | 5,471,848 | 257,341 | ||||
| Lithia Motors Inc. Class A | 860,018 | 255,382 | ||||
| * | Wynn Resorts Ltd. | 2,961,649 | 251,859 | |||
| * | Penn National Gaming Inc. | 4,817,607 | 249,793 | |||
| * | DraftKings Inc. Class A | 8,664,446 | 238,012 | |||
| Toll Brothers Inc. | 3,286,801 | 237,932 | ||||
| Newell Brands Inc. | 10,881,720 | 237,657 | ||||
| Wyndham Hotels & Resorts Inc. | 2,647,348 | 237,335 | ||||
| Churchill Downs Inc. | 977,823 | 235,558 | ||||
| Gentex Corp. | 6,721,348 | 234,239 | ||||
| * | Liberty Media Corp.-Liberty SiriusXM Class C | 4,512,478 | 229,460 | |||
| Macy's Inc. | 8,508,465 | 222,752 | ||||
| * | Norwegian Cruise Line Holdings Ltd. | 10,522,514 | 218,237 | |||
| New York Times Co. Class A | 4,507,055 | 217,691 | ||||
| * | Avis Budget Group Inc. | 1,043,053 | 216,298 | |||
| * | Bright Horizons Family Solutions Inc. | 1,716,298 | 216,048 | |||
| PVH Corp. | 2,019,663 | 215,397 | ||||
| Rollins Inc. | 6,292,967 | 215,282 | ||||
| * | Planet Fitness Inc. Class A | 2,368,268 | 214,518 | |||
| * | Mattel Inc. | 9,948,071 | 214,480 | |||
| Kohl's Corp. | 4,279,059 | 211,343 | ||||
| Nielsen Holdings plc | 10,201,161 | 209,226 | ||||
| Shares | Market Value• ($000) | |||||
| * | Discovery Inc. Class C | 8,906,501 | 203,959 | |||
| * | Crocs Inc. | 1,589,037 | 203,746 | |||
| * | Fox Factory Holding Corp. | 1,196,099 | 203,456 | |||
| * | YETI Holdings Inc. | 2,368,395 | 196,174 | |||
| Marriott Vacations Worldwide Corp. | 1,149,662 | 194,270 | ||||
| * | IAA Inc. | 3,832,553 | 194,004 | |||
| * | Zynga Inc. Class A | 30,250,143 | 193,601 | |||
| * | Alaska Air Group Inc. | 3,553,511 | 185,138 | |||
| 1 | Dick's Sporting Goods Inc. | 1,609,549 | 185,082 | |||
| AMERCO | 250,834 | 182,163 | ||||
| Polaris Inc. | 1,641,370 | 180,403 | ||||
| * | Scientific Games Corp. | 2,609,174 | 174,371 | |||
| * | Goodyear Tire & Rubber Co. | 8,001,994 | 170,603 | |||
| Texas Roadhouse Inc. Class A | 1,880,020 | 167,848 | ||||
| * | Helen of Troy Ltd. | 686,296 | 167,779 | |||
| Nexstar Media Group Inc. Class A | 1,104,407 | 166,743 | ||||
| * | Skechers USA Inc. Class A | 3,840,130 | 166,662 | |||
| Hanesbrands Inc. | 9,924,240 | 165,933 | ||||
| Harley-Davidson Inc. | 4,374,990 | 164,893 | ||||
| * | AutoNation Inc. | 1,397,353 | 163,281 | |||
| Choice Hotels International Inc. | 1,027,450 | 160,272 | ||||
| * | Terminix Global Holdings Inc. | 3,445,483 | 155,839 | |||
| Thor Industries Inc. | 1,497,400 | 155,385 | ||||
| Fox Corp. Class B | 4,478,348 | 153,473 | ||||
| Ralph Lauren Corp. | 1,247,798 | 148,313 | ||||
| Leggett & Platt Inc. | 3,602,339 | 148,272 | ||||
| Wingstop Inc. | 849,325 | 146,763 | ||||
| * | Boyd Gaming Corp. | 2,234,229 | 146,498 | |||
| 1 | Sirius XM Holdings Inc. | 22,738,623 | 144,390 | |||
| * | Endeavor Group Holdings Inc. Class A | 4,128,800 | 144,054 | |||
| *,1 | Chewy Inc. Class A | 2,423,239 | 142,898 | |||
| Gap Inc. | 7,996,106 | 141,131 | ||||
| * | Victoria's Secret & Co. | 2,511,791 | 139,505 | |||
| Murphy USA Inc. | 692,371 | 137,948 | ||||
| Travel + Leisure Co. | 2,454,604 | 135,666 | ||||
| * | Hilton Grand Vacations Inc. | 2,554,794 | 133,130 | |||
| * | Hyatt Hotels Corp. Class A | 1,358,919 | 130,320 | |||
| * | Meritage Homes Corp. | 1,060,833 | 129,485 | |||
| Foot Locker Inc. | 2,954,785 | 128,917 | ||||
| Shares | Market Value• ($000) | |||||
| * | JetBlue Airways Corp. | 9,023,337 | 128,492 | |||
| Signet Jewelers Ltd. | 1,433,117 | 124,724 | ||||
| Papa John's International Inc. | 930,036 | 124,132 | ||||
| *,1 | QuantumScape Corp. Class A | 5,557,425 | 123,319 | |||
| * | Skyline Champion Corp. | 1,534,502 | 121,195 | |||
| Warner Music Group Corp. Class A | 2,799,189 | 120,869 | ||||
| * | Chegg Inc. | 3,915,237 | 120,198 | |||
| Wendy's Co. | 5,012,904 | 119,558 | ||||
| H&R Block Inc. | 4,994,275 | 117,665 | ||||
| * | Academy Sports & Outdoors Inc. | 2,658,122 | 116,692 | |||
| TEGNA Inc. | 6,281,171 | 116,579 | ||||
| * | Taylor Morrison Home Corp. Class A | 3,318,552 | 116,017 | |||
| Carter's Inc. | 1,141,463 | 115,539 | ||||
| * | National Vision Holdings Inc. | 2,358,364 | 113,178 | |||
| * | Asbury Automotive Group Inc. | 644,864 | 111,387 | |||
| * | Under Armour Inc. Class C | 6,124,371 | 110,484 | |||
| 1 | American Eagle Outfitters Inc. | 4,312,685 | 109,197 | |||
| * | Callaway Golf Co. | 3,966,605 | 108,844 | |||
| *,1 | Discovery Inc. Class A | 4,580,165 | 107,817 | |||
| * | Under Armour Inc. Class A | 5,084,312 | 107,737 | |||
| * | Sonos Inc. | 3,614,846 | 107,722 | |||
| * | Liberty Media Corp.-Liberty SiriusXM Class A | 2,108,435 | 107,214 | |||
| LCI Industries | 682,455 | 106,374 | ||||
| *,1 | Luminar Technologies Inc. Class A | 6,282,706 | 106,241 | |||
| KB Home | 2,362,961 | 105,695 | ||||
| * | Leslie's Inc. | 4,413,244 | 104,417 | |||
| * | Boot Barn Holdings Inc. | 842,207 | 103,634 | |||
| Steven Madden Ltd. | 2,198,830 | 102,180 | ||||
| Columbia Sportswear Co. | 1,016,981 | 99,095 | ||||
| * | Grand Canyon Education Inc. | 1,140,456 | 97,748 | |||
| * | Coty Inc. Class A | 9,271,639 | 97,352 | |||
| * | LGI Homes Inc. | 618,877 | 95,604 | |||
| Group 1 Automotive Inc. | 488,983 | 95,459 | ||||
| Dana Inc. | 4,103,966 | 93,653 | ||||
| * | SeaWorld Entertainment Inc. | 1,428,204 | 92,633 | |||
| Shares | Market Value• ($000) | |||||
| * | Ollie's Bargain Outlet Holdings Inc. | 1,757,744 | 89,979 | |||
| MDC Holdings Inc. | 1,607,171 | 89,728 | ||||
| * | Visteon Corp. | 796,525 | 88,526 | |||
| * | Frontdoor Inc. | 2,408,996 | 88,290 | |||
| * | Six Flags Entertainment Corp. | 2,072,282 | 88,238 | |||
| * | Tri Pointe Homes Inc. | 3,157,085 | 88,051 | |||
| * | Dorman Products Inc. | 764,391 | 86,384 | |||
| Cracker Barrel Old Country Store Inc. | 668,715 | 86,024 | ||||
| Lennar Corp. Class B | 892,929 | 85,382 | ||||
| MillerKnoll Inc. | 2,153,414 | 84,392 | ||||
| Penske Automotive Group Inc. | 777,823 | 83,398 | ||||
| * | Madison Square Garden Sports Corp. | 476,440 | 82,772 | |||
| Red Rock Resorts Inc. Class A | 1,496,638 | 82,330 | ||||
| * | Gentherm Inc. | 944,152 | 82,047 | |||
| * | Allegiant Travel Co. | 434,952 | 81,353 | |||
| Rent-A-Center Inc. | 1,692,151 | 81,291 | ||||
| * | Sabre Corp. | 9,167,070 | 78,745 | |||
| * | Cavco Industries Inc. | 247,745 | 78,696 | |||
| * | TripAdvisor Inc. | 2,842,207 | 77,479 | |||
| *,1 | Figs Inc. Class A | 2,801,723 | 77,216 | |||
| * | Shake Shack Inc. Class A | 1,057,169 | 76,285 | |||
| Qurate Retail Inc. Class A | 9,935,944 | 75,513 | ||||
| Kontoor Brands Inc. | 1,466,970 | 75,182 | ||||
| * | Vista Outdoor Inc. | 1,629,510 | 75,072 | |||
| * | Coursera Inc. | 2,998,543 | 73,284 | |||
| *,1 | PROG Holdings Inc. | 1,613,112 | 72,767 | |||
| Rush Enterprises Inc. Class A | 1,293,213 | 71,954 | ||||
| * | Nordstrom Inc. | 3,161,808 | 71,520 | |||
| Century Communities Inc. | 862,906 | 70,577 | ||||
| * | Overstock.com Inc. | 1,160,313 | 68,470 | |||
| John Wiley & Sons Inc. Class A | 1,195,153 | 68,446 | ||||
| Graham Holdings Co. Class B | 107,809 | 67,901 | ||||
| Winnebago Industries Inc. | 904,451 | 67,761 | ||||
| * | Spirit Airlines Inc. | 3,099,963 | 67,734 | |||
| Wolverine World Wide Inc. | 2,342,183 | 67,478 | ||||
| *,1 | Fisker Inc. | 4,187,755 | 65,873 | |||
| Levi Strauss & Co. Class A | 2,606,132 | 65,231 | ||||
| * | Revolve Group Inc. Class A | 1,122,753 | 62,919 | |||
| Shares | Market Value• ($000) | |||||
| World Wrestling Entertainment Inc. Class A | 1,272,323 | 62,776 | ||||
| * | Knowles Corp. | 2,639,024 | 61,621 | |||
| * | Sally Beauty Holdings Inc. | 3,214,705 | 59,343 | |||
| * | Abercrombie & Fitch Co. Class A | 1,685,206 | 58,696 | |||
| * | Houghton Mifflin Harcourt Co. | 3,628,981 | 58,427 | |||
| * | iHeartMedia Inc. Class A | 2,737,141 | 57,589 | |||
| * | SkyWest Inc. | 1,427,580 | 56,104 | |||
| * | Cardlytics Inc. | 846,908 | 55,972 | |||
| * | Liberty Media Corp.-Liberty Formula One Class A | 931,971 | 55,303 | |||
| * | Cheesecake Factory Inc. | 1,409,648 | 55,188 | |||
| * | Everi Holdings Inc. | 2,582,987 | 55,147 | |||
| * | Madison Square Garden Entertainment Corp. | 782,547 | 55,044 | |||
| * | KAR Auction Services Inc. | 3,443,502 | 53,788 | |||
| * | Bloomin' Brands Inc. | 2,545,187 | 53,398 | |||
| Inter Parfums Inc. | 497,987 | 53,235 | ||||
| Monro Inc. | 906,491 | 52,821 | ||||
| * | ODP Corp. | 1,319,899 | 51,846 | |||
| * | M/I Homes Inc. | 831,424 | 51,698 | |||
| PriceSmart Inc. | 702,559 | 51,406 | ||||
| *,1 | iRobot Corp. | 767,039 | 50,533 | |||
| * | ACV Auctions Inc. Class A | 2,650,718 | 49,940 | |||
| Acushnet Holdings Corp. | 939,066 | 49,846 | ||||
| HNI Corp. | 1,179,369 | 49,592 | ||||
| Jack in the Box Inc. | 566,861 | 49,589 | ||||
| * | Urban Outfitters Inc. | 1,670,873 | 49,057 | |||
| * | Lions Gate Entertainment Corp. Class B | 3,183,715 | 48,997 | |||
| Gray Television Inc. | 2,391,838 | 48,219 | ||||
| * | Driven Brands Holdings Inc. | 1,422,836 | 47,836 | |||
| * | Brinker International Inc. | 1,291,775 | 47,266 | |||
| * | Cinemark Holdings Inc. | 2,909,906 | 46,908 | |||
| * | Sleep Number Corp. | 612,223 | 46,896 | |||
| * | elf Beauty Inc. | 1,407,008 | 46,727 | |||
| Oxford Industries Inc. | 457,621 | 46,458 | ||||
| Camping World Holdings Inc. Class A | 1,142,508 | 46,157 | ||||
| La-Z-Boy Inc. | 1,247,649 | 45,302 | ||||
| Shares | Market Value• ($000) | |||||
| * | Central Garden & Pet Co. Class A | 931,779 | 44,586 | |||
| * | Petco Health & Wellness Co. Inc. Class A | 2,250,688 | 44,541 | |||
| * | Stitch Fix Inc. Class A | 2,241,298 | 42,405 | |||
| * | Dave & Buster's Entertainment Inc. | 1,102,602 | 42,340 | |||
| Big Lots Inc. | 931,048 | 41,944 | ||||
| Franchise Group Inc. | 798,414 | 41,645 | ||||
| * | 2U Inc. | 2,037,494 | 40,893 | |||
| * | Malibu Boats Inc. Class A | 594,655 | 40,871 | |||
| 1 | Dillard's Inc. Class A | 166,498 | 40,795 | |||
| *,1 | ContextLogic Inc. Class A | 13,114,358 | 40,786 | |||
| *,1 | Bed Bath & Beyond Inc. | 2,727,840 | 39,772 | |||
| * | Adtalem Global Education Inc. | 1,336,028 | 39,493 | |||
| * | Stride Inc. | 1,155,222 | 38,504 | |||
| * | Bally's Corp. | 1,003,294 | 38,185 | |||
| * | GoPro Inc. Class A | 3,633,707 | 37,464 | |||
| Sinclair Broadcast Group Inc. Class A | 1,406,282 | 37,168 | ||||
| * | MarineMax Inc. | 623,233 | 36,796 | |||
| Strategic Education Inc. | 630,218 | 36,452 | ||||
| Buckle Inc. | 850,015 | 35,964 | ||||
| * | Dine Brands Global Inc. | 467,022 | 35,405 | |||
| * | XPEL Inc. | 510,050 | 34,826 | |||
| Sturm Ruger & Co. Inc. | 497,397 | 33,833 | ||||
| * | Clear Channel Outdoor Holdings Inc. | 10,064,766 | 33,314 | |||
| EW Scripps Co. Class A | 1,705,726 | 33,006 | ||||
| * | G-III Apparel Group Ltd. | 1,169,676 | 32,330 | |||
| *,1 | Rover Group Inc. Class A | 3,249,186 | 31,680 | |||
| * | Selectquote Inc. | 3,480,012 | 31,529 | |||
| * | Children's Place Inc. | 396,459 | 31,435 | |||
| * | Clean Energy Fuels Corp. | 5,058,167 | 31,007 | |||
| Matthews International Corp. Class A | 840,980 | 30,839 | ||||
| *,1 | Mister Car Wash Inc. | 1,676,736 | 30,533 | |||
| * | Cars.com Inc. | 1,865,417 | 30,015 | |||
| *,1 | Dutch Bros Inc. Class A | 586,836 | 29,876 | |||
| * | Zumiez Inc. | 603,962 | 28,984 | |||
| * | American Axle & Manufacturing Holdings Inc. | 3,090,797 | 28,837 | |||
| Shares | Market Value• ($000) | |||||
| *,1 | Canoo Inc. | 3,729,337 | 28,790 | |||
| Hibbett Inc. | 399,774 | 28,756 | ||||
| Sonic Automotive Inc. Class A | 579,713 | 28,667 | ||||
| * | AMC Networks Inc. Class A | 830,849 | 28,614 | |||
| * | Lions Gate Entertainment Corp. Class A | 1,672,185 | 27,825 | |||
| Standard Motor Products Inc. | 525,112 | 27,511 | ||||
| Carriage Services Inc. Class A | 426,478 | 27,482 | ||||
| * | Golden Entertainment Inc. | 542,354 | 27,405 | |||
| * | Monarch Casino & Resort Inc. | 367,965 | 27,211 | |||
| * | Denny's Corp. | 1,699,029 | 27,184 | |||
| Interface Inc. Class A | 1,684,351 | 26,865 | ||||
| *,1 | Blink Charging Co. | 1,007,737 | 26,715 | |||
| Guess? Inc. | 1,120,158 | 26,525 | ||||
| * | Liberty Media Corp.-Liberty Braves Class C | 940,129 | 26,418 | |||
| Steelcase Inc. Class A | 2,236,903 | 26,217 | ||||
| * | Genesco Inc. | 407,043 | 26,120 | |||
| * | Tenneco Inc. Class A | 2,309,411 | 26,096 | |||
| * | Green Brick Partners Inc. | 858,495 | 26,038 | |||
| * | RealReal Inc. | 2,224,204 | 25,823 | |||
| * | Hawaiian Holdings Inc. | 1,397,468 | 25,672 | |||
| News Corp. Class B | 1,138,629 | 25,619 | ||||
| * | Lovesac Co. | 386,590 | 25,615 | |||
| * | QuinStreet Inc. | 1,392,113 | 25,323 | |||
| Smith & Wesson Brands Inc. | 1,365,747 | 24,310 | ||||
| * | Sun Country Airlines Holdings Inc. | 889,258 | 24,232 | |||
| * | Arlo Technologies Inc. | 2,276,863 | 23,884 | |||
| * | Central Garden & Pet Co. | 453,040 | 23,844 | |||
| * | Thryv Holdings Inc. | 579,382 | 23,830 | |||
| * | Viad Corp. | 555,751 | 23,781 | |||
| * | Designer Brands Inc. Class A | 1,670,792 | 23,742 | |||
| * | WW International Inc. | 1,470,013 | 23,711 | |||
| Caleres Inc. | 1,036,100 | 23,499 | ||||
| * | Rush Street Interactive Inc. | 1,412,344 | 23,304 | |||
| * | Citi Trends Inc. | 245,188 | 23,232 | |||
| *,1 | Corsair Gaming Inc. | 1,066,340 | 22,404 | |||
| * | Perdoceo Education Corp. | 1,894,742 | 22,282 | |||
| Shares | Market Value• ($000) | |||||
| Aaron's Co. Inc. | 894,931 | 22,060 | ||||
| * | Arko Corp. | 2,481,279 | 21,761 | |||
| Clarus Corp. | 775,402 | 21,494 | ||||
| *,1 | Vizio Holding Corp. Class A | 1,102,849 | 21,428 | |||
| *,1 | Portillo's Inc. Class A | 569,641 | 21,384 | |||
| * | BJ's Restaurants Inc. | 618,740 | 21,377 | |||
| * | Latham Group Inc. | 851,305 | 21,308 | |||
| * | Purple Innovation Inc. Class A | 1,599,775 | 21,229 | |||
| * | Accel Entertainment Inc. Class A | 1,600,271 | 20,836 | |||
| Scholastic Corp. | 513,493 | 20,519 | ||||
| * | Gannett Co. Inc. | 3,818,003 | 20,350 | |||
| * | Tupperware Brands Corp. | 1,323,079 | 20,230 | |||
| Global Industrial Co. | 486,761 | 19,909 | ||||
| * | Beazer Homes USA Inc. | 830,575 | 19,286 | |||
| *,1 | ThredUp Inc. Class A | 1,484,311 | 18,940 | |||
| Movado Group Inc. | 449,351 | 18,796 | ||||
| * | Life Time Group Holdings Inc. | 1,083,300 | 18,644 | |||
| * | Ruth's Hospitality Group Inc. | 929,579 | 18,499 | |||
| * | PowerSchool Holdings Inc. Class A | 1,122,480 | 18,487 | |||
| 1 | Krispy Kreme Inc. | 972,532 | 18,400 | |||
| Laureate Education Inc. Class A | 1,480,558 | 18,122 | ||||
| * | America's Car-Mart Inc. | 176,312 | 18,054 | |||
| * | 1-800-Flowers.com Inc. Class A | 771,537 | 18,031 | |||
| * | TravelCenters of America Inc. | 347,029 | 17,914 | |||
| Winmark Corp. | 72,138 | 17,911 | ||||
| * | Quotient Technology Inc. | 2,412,918 | 17,904 | |||
| * | Chico's FAS Inc. | 3,319,275 | 17,858 | |||
| RCI Hospitality Holdings Inc. | 225,730 | 17,580 | ||||
| * | Angi Inc. Class A | 1,904,642 | 17,542 | |||
| *,1 | Poshmark Inc. Class A | 1,022,034 | 17,405 | |||
| OneWater Marine Inc. Class A | 282,871 | 17,247 | ||||
| Shoe Carnival Inc. | 436,102 | 17,043 | ||||
| Ethan Allen Interiors Inc. | 647,614 | 17,026 | ||||
| * | Party City Holdco Inc. | 3,031,691 | 16,887 | |||
| * | Chuy's Holdings Inc. | 560,372 | 16,878 | |||
| * | Liquidity Services Inc. | 740,267 | 16,345 | |||
| Shares | Market Value• ($000) | |||||
| * | Hovnanian Enterprises Inc. Class A | 127,447 | 16,223 | |||
| *,1 | Vuzix Corp. | 1,706,177 | 14,793 | |||
| * | MasterCraft Boat Holdings Inc. | 519,098 | 14,706 | |||
| * | Integral Ad Science Holding Corp. | 659,627 | 14,650 | |||
| A-Mark Precious Metals Inc. | 239,095 | 14,609 | ||||
| * | European Wax Center Inc. Class A | 477,548 | 14,494 | |||
| * | Stoneridge Inc. | 733,128 | 14,472 | |||
| *,1 | Duolingo Inc. Class A | 134,834 | 14,307 | |||
| * | Boston Omaha Corp. Class A | 487,816 | 14,015 | |||
| * | Stagwell Inc. | 1,611,357 | 13,970 | |||
| * | Funko Inc. Class A | 738,271 | 13,880 | |||
| * | Sportsman's Warehouse Holdings Inc. | 1,162,482 | 13,717 | |||
| * | LL Flooring Holdings Inc. | 802,995 | 13,707 | |||
| * | CarParts.com Inc. | 1,217,153 | 13,632 | |||
| * | Fossil Group Inc. | 1,319,131 | 13,574 | |||
| * | AMMO Inc. | 2,454,609 | 13,378 | |||
| * | Lindblad Expeditions Holdings Inc. | 851,979 | 13,291 | |||
| Haverty Furniture Cos. Inc. | 430,730 | 13,167 | ||||
| Johnson Outdoors Inc. Class A | 139,239 | 13,045 | ||||
| * | Bluegreen Vacations Holding Corp. Class A | 365,934 | 12,844 | |||
| * | Janus International Group Inc. | 1,023,381 | 12,813 | |||
| *,1 | Sweetgreen Inc. Class A | 394,655 | 12,629 | |||
| *,1 | Cricut Inc. Class A | 567,341 | 12,533 | |||
| * | Frontier Group Holdings Inc. | 910,699 | 12,358 | |||
| *,1 | Lordstown Motors Corp. | 3,556,255 | 12,269 | |||
| * | Universal Electronics Inc. | 293,728 | 11,969 | |||
| * | Conn's Inc. | 499,363 | 11,745 | |||
| * | Golden Nugget Online Gaming Inc. | 1,166,902 | 11,611 | |||
| Kimball International Inc. Class B | 1,134,107 | 11,602 | ||||
| * | Full House Resorts Inc. | 952,478 | 11,535 | |||
| *,1 | Marcus Corp. | 643,540 | 11,494 | |||
| * | American Public Education Inc. | 511,008 | 11,370 | |||
| Shares | Market Value• ($000) | |||||
| Entravision Communications Corp. Class A | 1,674,306 | 11,352 | ||||
| 1 | Big 5 Sporting Goods Corp. | 596,868 | 11,346 | |||
| *,1 | BARK Inc. | 2,686,777 | 11,338 | |||
| *,1 | Liberty Media Corp.-Liberty Braves Class A | 390,380 | 11,223 | |||
| * | Cooper-Standard Holdings Inc. | 497,350 | 11,146 | |||
| * | Noodles & Co. Class A | 1,186,247 | 10,759 | |||
| *,1 | Dream Finders Homes Inc. Class A | 550,933 | 10,716 | |||
| Tilly's Inc. Class A | 658,710 | 10,612 | ||||
| * | RumbleON Inc. Class B | 253,143 | 10,511 | |||
| *,1 | XL Fleet Corp. | 3,139,688 | 10,392 | |||
| Del Taco Restaurants Inc. | 826,810 | 10,294 | ||||
| * | Kura Sushi USA Inc. Class A | 120,616 | 9,751 | |||
| * | Turtle Beach Corp. | 430,683 | 9,587 | |||
| Rush Enterprises Inc. Class B | 177,642 | 9,587 | ||||
| Cato Corp. Class A | 536,537 | 9,207 | ||||
| * | Century Casinos Inc. | 751,313 | 9,151 | |||
| * | Snap One Holdings Corp. | 427,850 | 9,019 | |||
| * | Sciplay Corp. Class A | 652,071 | 8,986 | |||
| * | ONE Group Hospitality Inc. | 706,651 | 8,911 | |||
| * | Destination XL Group Inc. | 1,528,407 | 8,681 | |||
| * | Motorcar Parts of America Inc. | 508,491 | 8,680 | |||
| * | Container Store Group Inc. | 863,409 | 8,617 | |||
| *,1 | Allbirds Inc. Class A | 571,448 | 8,617 | |||
| *,1 | Genius Brands International Inc. | 8,048,873 | 8,451 | |||
| *,1 | Vinco Ventures Inc. | 3,506,721 | 8,346 | |||
| * | Alta Equipment Group Inc. | 568,355 | 8,321 | |||
| *,1 | Eastman Kodak Co. | 1,773,206 | 8,299 | |||
| * | Audacy Inc. Class A | 3,219,968 | 8,275 | |||
| * | Holley Inc. | 635,789 | 8,259 | |||
| * | Lands' End Inc. | 415,014 | 8,147 | |||
| *,1 | Traeger Inc. | 665,828 | 8,096 | |||
| Rocky Brands Inc. | 202,930 | 8,077 | ||||
| * | American Outdoor Brands Inc. | 401,980 | 8,011 | |||
| * | Daily Journal Corp. | 22,234 | 7,932 | |||
| Hooker Furnishings Corp. | 333,634 | 7,767 | ||||
| *,1 | Udemy Inc. | 388,908 | 7,599 | |||
| Shares | Market Value• ($000) | |||||
| Superior Group of Cos. Inc. | 336,688 | 7,387 | ||||
| *,1 | Esports Technologies Inc. | 357,232 | 7,345 | |||
| * | Build-A-Bear Workshop Inc. | 370,870 | 7,239 | |||
| * | El Pollo Loco Holdings Inc. | 506,628 | 7,189 | |||
| *,1 | 1847 Goedeker Inc. | 2,939,372 | 7,055 | |||
| * | Red Robin Gourmet Burgers Inc. | 426,022 | 7,042 | |||
| * | Barnes & Noble Education Inc. | 1,030,888 | 7,020 | |||
| *,1 | F45 Training Holdings Inc. | 644,113 | 7,014 | |||
| Tile Shop Holdings Inc. | 961,063 | 6,852 | ||||
| * | Universal Technical Institute Inc. | 863,741 | 6,754 | |||
| *,1 | Arcimoto Inc. | 839,472 | 6,531 | |||
| * | Lazydays Holdings Inc. | 302,067 | 6,507 | |||
| *,1 | Weber Inc. Class A | 497,623 | 6,434 | |||
| Lifetime Brands Inc. | 397,860 | 6,354 | ||||
| * | Lincoln Educational Services Corp. | 842,781 | 6,296 | |||
| * | Vera Bradley Inc. | 727,256 | 6,189 | |||
| * | Legacy Housing Corp. | 233,301 | 6,175 | |||
| * | Nerdy Inc. | 1,316,500 | 5,924 | |||
| *,1 | Ondas Holdings Inc. | 877,371 | 5,887 | |||
| * | XpresSpa Group Inc. | 2,891,324 | 5,840 | |||
| * | Fiesta Restaurant Group Inc. | 503,077 | 5,539 | |||
| *,1 | Kirkland's Inc. | 368,678 | 5,504 | |||
| *,1 | Solo Brands Inc. Class A | 352,117 | 5,504 | |||
| * | Nautilus Inc. | 897,105 | 5,499 | |||
| * | Xponential Fitness Inc. Class A | 266,864 | 5,455 | |||
| * | Express Inc. | 1,747,660 | 5,383 | |||
| * | Arhaus Inc. Class A | 405,773 | 5,377 | |||
| * | PlayAGS Inc. | 787,936 | 5,350 | |||
| * | Cumulus Media Inc. Class A | 469,461 | 5,281 | |||
| * | Delta Apparel Inc. | 177,059 | 5,266 | |||
| * | Mesa Air Group Inc. | 931,159 | 5,215 | |||
| *,1 | Cinedigm Corp. Class A | 4,433,038 | 5,142 | |||
| * | Lee Enterprises Inc. | 144,656 | 4,996 | |||
| *,1 | Faraday Future Intelligent Electric Inc. | 930,089 | 4,948 | |||
| * | Duluth Holdings Inc. Class B | 324,610 | 4,928 | |||
| *,1 | CarLotz Inc. | 2,116,825 | 4,805 | |||
| Shares | Market Value• ($000) | |||||
| * | Lakeland Industries Inc. | 219,969 | 4,773 | |||
| Flexsteel Industries Inc. | 176,856 | 4,750 | ||||
| National CineMedia Inc. | 1,676,816 | 4,712 | ||||
| * | Aterian Inc. | 1,142,716 | 4,697 | |||
| * | Townsquare Media Inc. Class A | 336,709 | 4,488 | |||
| * | Liberty TripAdvisor Holdings Inc. Class A | 2,050,097 | 4,449 | |||
| *,1 | Shift Technologies Inc. | 1,302,731 | 4,442 | |||
| Bassett Furniture Industries Inc. | 264,538 | 4,436 | ||||
| 1 | JOANN Inc. | 423,780 | 4,399 | |||
| *,1 | Focus Universal Inc. | 493,800 | 4,375 | |||
| *,1 | CuriosityStream Inc. | 728,847 | 4,322 | |||
| * | VOXX International Corp. Class A | 421,895 | 4,291 | |||
| * | Strattec Security Corp. | 115,520 | 4,277 | |||
| * | First Watch Restaurant Group Inc. | 250,998 | 4,207 | |||
| *,1 | Brilliant Earth Group Inc. Class A | 231,495 | 4,181 | |||
| *,1 | Rent the Runway Inc. Class A | 509,942 | 4,156 | |||
| * | Casper Sleep Inc. | 596,360 | 3,984 | |||
| Nathan's Famous Inc. | 66,657 | 3,892 | ||||
| *,1 | Reservoir Media Inc. | 489,336 | 3,871 | |||
| Weyco Group Inc. | 150,356 | 3,600 | ||||
| Escalade Inc. | 225,800 | 3,565 | ||||
| Wayside Technology Group Inc. | 100,234 | 3,514 | ||||
| * | Drive Shack Inc. | 2,362,238 | 3,378 | |||
| * | Outbrain Inc. | 240,155 | 3,362 | |||
| * | Potbelly Corp. | 601,878 | 3,358 | |||
| * | Tuesday Morning Corp. | 1,465,187 | 3,341 | |||
| * | Wheels Up Experience Inc. | 708,381 | 3,287 | |||
| Hamilton Beach Brands Holding Co. Class A | 228,579 | 3,282 | ||||
| Marine Products Corp. | 255,346 | 3,192 | ||||
| * | Gaia Inc. Class A | 367,401 | 3,149 | |||
| * | iMedia Brands Inc. | 512,961 | 3,078 | |||
| Saga Communications Inc. Class A | 127,309 | 3,057 | ||||
| * | Biglari Holdings Inc. Class A | 4,330 | 3,009 | |||
| Shares | Market Value• ($000) | |||||
| Carrols Restaurant Group Inc. | 1,009,447 | 2,988 | ||||
| *,1 | Redbox Entertainment Inc. | 402,900 | 2,986 | |||
| * | Chicken Soup For The Soul Entertainment Inc. | 211,224 | 2,923 | |||
| Acme United Corp. | 85,199 | 2,871 | ||||
| * | Urban One Inc. | 844,838 | 2,864 | |||
| * | Superior Industries International Inc. | 622,847 | 2,790 | |||
| * | Emerald Holding Inc. | 690,955 | 2,743 | |||
| * | Biglari Holdings Inc. Class B | 18,772 | 2,676 | |||
| * | SRAX Inc. Class A | 591,097 | 2,654 | |||
| * | Landsea Homes Corp. | 356,896 | 2,612 | |||
| *,1 | HyreCar Inc. | 526,051 | 2,478 | |||
| *,1 | Revlon Inc. Class A | 214,200 | 2,429 | |||
| * | BBQ Holdings Inc. | 152,057 | 2,415 | |||
| *,1 | Hall of Fame Resort & Entertainment Co. | 1,464,451 | 2,226 | |||
| * | NextPlay Technologies Inc. | 2,436,472 | 2,084 | |||
| * | Fluent Inc. | 1,044,952 | 2,079 | |||
| *,1 | J. Jill Inc. | 108,388 | 2,079 | |||
| *,1 | BurgerFi International Inc. | 362,697 | 2,057 | |||
| * | Dixie Group Inc. | 344,452 | 1,974 | |||
| * | Travelzoo | 204,643 | 1,928 | |||
| *,1 | LiveOne Inc. | 1,461,313 | 1,870 | |||
| * | Regis Corp. | 1,043,845 | 1,816 | |||
| Educational Development Corp. | 202,269 | 1,804 | ||||
| * | Charles & Colvard Ltd. | 610,246 | 1,764 | |||
| * | StoneMor Inc. | 770,131 | 1,756 | |||
| *,1 | Red Cat Holdings Inc. | 844,136 | 1,756 | |||
| * | Luby's Inc. | 600,620 | 1,718 | |||
| *,1 | Dolphin Entertainment Inc. | 199,020 | 1,696 | |||
| *,1 | Owlet Inc. | 625,636 | 1,670 | |||
| FAT Brands Inc. Class A | 153,984 | 1,631 | ||||
| * | Good Times Restaurants Inc. | 350,945 | 1,523 | |||
| * | Aspen Group Inc. | 638,706 | 1,507 | |||
| *,1 | LMP Automotive Holdings Inc. | 210,630 | 1,472 | |||
| Crown Crafts Inc. | 197,670 | 1,437 | ||||
| *,1 | AYRO Inc. | 891,109 | 1,435 | |||
| *,1 | Envela Corp. | 343,551 | 1,398 | |||
| * | Marchex Inc. Class B | 546,577 | 1,356 | |||
| DallasNews Corp. | 176,590 | 1,270 | ||||
| * | Kewaunee Scientific Corp. | 97,612 | 1,244 | |||
| Shares | Market Value• ($000) | |||||
| * | JAKKS Pacific Inc. | 116,504 | 1,184 | |||
| * | Salem Media Group Inc. Class A | 370,322 | 1,133 | |||
| * | Live Ventures Inc. | 34,139 | 1,076 | |||
| * | Zovio Inc. Class A | 827,480 | 1,051 | |||
| *,1 | Koss Corp. | 96,440 | 1,030 | |||
| * | FlexShopper Inc. | 425,184 | 999 | |||
| * | Volcon Inc. | 83,500 | 902 | |||
| CompX International Inc. | 38,137 | 857 | ||||
| *,1 | Digital Media Solutions Inc. | 173,744 | 831 | |||
| NL Industries Inc. | 109,805 | 813 | ||||
| * | Harte Hanks Inc. | 102,600 | 780 | |||
| * | Ark Restaurants Corp. | 42,468 | 707 | |||
| *,1 | Troika Media Group Inc. | 595,828 | 697 | |||
| * | Digital Brands Group Inc. | 296,678 | 682 | |||
| *,1 | Vince Holding Corp. | 85,410 | 680 | |||
| *,1 | InterGroup Corp. | 12,233 | 661 | |||
| * | Canterbury Park Holding Corp. | 35,941 | 620 | |||
| *,1 | Mullen Automotive Inc. | 117,454 | 614 | |||
| * | Beasley Broadcast Group Inc. Class A | 314,502 | 594 | |||
| * | Instructure Holdings Inc. | 23,243 | 557 | |||
| *,1 | Allied Esports Entertainment Inc. | 298,452 | 510 | |||
| * | Urban One Inc. Class A | 107,488 | 500 | |||
| *,1 | EzFill Holdings Inc. | 348,800 | 481 | |||
| * | Motorsport Games Inc. Class A | 138,235 | 470 | |||
| *,1 | Auddia Inc. | 264,100 | 470 | |||
| * | aka Brands Holding Corp. | 45,691 | 423 | |||
| * | Lulu's Fashion Lounge Holdings Inc. | 36,667 | 375 | |||
| *,1 | Lottery.com Inc. | 58,000 | 369 | |||
| *,1 | Mediaco Holding Inc. Class A | 67,571 | 362 | |||
| *,1 | Muscle Maker Inc. | 487,573 | 351 | |||
| * | PARTS iD Inc. | 138,518 | 338 | |||
| * | Reading International Inc. Class A | 83,326 | 337 | |||
| *,1 | Amesite Inc. | 292,757 | 302 | |||
| Jerash Holdings US Inc. | 43,903 | 284 | ||||
| * | Kaspien Holdings Inc. | 23,810 | 252 | |||
| * | Grom Social Enterprises Inc. | 134,277 | 242 | |||
| Shares | Market Value• ($000) | |||||
| *,1 | Applied UV Inc. | 86,071 | 232 | |||
| * | Forward Industries Inc. | 144,468 | 225 | |||
| 1 | FAT Brands Inc. Class B | 16,647 | 224 | |||
| * | Torrid Holdings Inc. | 16,980 | 168 | |||
| * | Xcel Brands Inc. | 151,456 | 165 | |||
| * | Unique Fabricating Inc. | 79,983 | 157 | |||
| * | Virco Manufacturing Corp. | 38,418 | 118 | |||
| * | Flanigan's Enterprises Inc. | 3,749 | 116 | |||
| * | Moving Image Technologies Inc. | 40,290 | 85 | |||
| *,2 | Zagg Inc. CVR | 780,631 | 70 | |||
| *,2 | SRAX Inc. | 590,641 | 47 | |||
| * | Rave Restaurant Group Inc. | 21,026 | 21 | |||
| * | Summer Infant Inc. | 522 | 5 | |||
| *,2 | resTORbio Inc. CVR | 70,194 | — | |||
| 218,314,246 | ||||||
| Consumer Staples (4.7%) | ||||||
| Procter & Gamble Co. | 68,774,496 | 11,250,132 | ||||
| PepsiCo Inc. | 39,294,953 | 6,825,926 | ||||
| Coca-Cola Co. | 110,482,879 | 6,541,691 | ||||
| Philip Morris International Inc. | 44,245,226 | 4,203,297 | ||||
| CVS Health Corp. | 37,517,401 | 3,870,295 | ||||
| Mondelez International Inc. Class A | 39,640,610 | 2,628,569 | ||||
| Altria Group Inc. | 52,205,320 | 2,474,010 | ||||
| Colgate-Palmolive Co. | 23,947,429 | 2,043,674 | ||||
| Kimberly-Clark Corp. | 9,569,512 | 1,367,675 | ||||
| General Mills Inc. | 17,213,544 | 1,159,849 | ||||
| Sysco Corp. | 14,571,218 | 1,144,569 | ||||
| Constellation Brands Inc. Class A | 4,435,351 | 1,113,140 | ||||
| Walgreens Boots Alliance Inc. | 20,913,653 | 1,090,856 | ||||
| McKesson Corp. | 4,329,765 | 1,076,250 | ||||
| Archer-Daniels-Midland Co. | 15,902,225 | 1,074,831 | ||||
| * | Monster Beverage Corp. | 10,527,725 | 1,011,083 | |||
| Corteva Inc. | 20,754,473 | 981,272 | ||||
| Kroger Co. | 19,025,330 | 861,086 | ||||
| Keurig Dr Pepper Inc. | 22,167,787 | 817,105 | ||||
| Hershey Co. | 4,131,631 | 799,347 | ||||
| Tyson Foods Inc. Class A | 8,376,405 | 730,087 | ||||
| Church & Dwight Co. Inc. | 6,940,931 | 711,445 | ||||
| Kraft Heinz Co. | 19,154,502 | 687,647 | ||||
| Shares | Market Value• ($000) | |||||
| McCormick & Co. Inc. (Non-Voting) | 7,086,139 | 684,592 | ||||
| Brown-Forman Corp. Class B | 9,005,018 | 656,106 | ||||
| Clorox Co. | 3,493,193 | 609,073 | ||||
| AmerisourceBergen Corp. | 4,137,284 | 549,804 | ||||
| Kellogg Co. | 7,272,263 | 468,479 | ||||
| Conagra Brands Inc. | 13,637,110 | 465,707 | ||||
| J M Smucker Co. | 2,924,160 | 397,159 | ||||
| Hormel Foods Corp. | 7,710,013 | 376,326 | ||||
| Bunge Ltd. | 3,793,451 | 354,157 | ||||
| * | Darling Ingredients Inc. | 4,598,916 | 318,659 | |||
| Lamb Weston Holdings Inc. | 4,152,473 | 263,184 | ||||
| Campbell Soup Co. | 5,581,045 | 242,552 | ||||
| Molson Coors Beverage Co. Class B | 5,134,011 | 237,961 | ||||
| Casey's General Stores Inc. | 1,055,817 | 208,366 | ||||
| * | Performance Food Group Co. | 4,378,630 | 200,935 | |||
| * | US Foods Holding Corp. | 5,688,259 | 198,122 | |||
| * | Post Holdings Inc. | 1,599,854 | 180,352 | |||
| Ingredion Inc. | 1,796,611 | 173,625 | ||||
| Flowers Foods Inc. | 5,408,573 | 148,574 | ||||
| * | Boston Beer Co. Inc. Class A | 260,452 | 131,554 | |||
| Spectrum Brands Holdings Inc. | 1,172,286 | 119,245 | ||||
| Sanderson Farms Inc. | 602,792 | 115,182 | ||||
| * | Freshpet Inc. | 1,169,456 | 111,414 | |||
| * | Herbalife Nutrition Ltd. | 2,710,803 | 110,953 | |||
| * | Hain Celestial Group Inc. | 2,562,737 | 109,198 | |||
| *,1 | Beyond Meat Inc. | 1,616,714 | 105,345 | |||
| * | Simply Good Foods Co. | 2,452,396 | 101,946 | |||
| WD-40 Co. | 390,101 | 95,434 | ||||
| * | Sprouts Farmers Market Inc. | 3,195,645 | 94,847 | |||
| Lancaster Colony Corp. | 547,995 | 90,748 | ||||
| Coca-Cola Consolidated Inc. | 132,113 | 81,803 | ||||
| * | United Natural Foods Inc. | 1,648,698 | 80,918 | |||
| * | Hostess Brands Inc. Class A | 3,932,404 | 80,300 | |||
| * | Celsius Holdings Inc. | 1,064,986 | 79,416 | |||
| Primo Water Corp. | 4,328,024 | 76,303 | ||||
| Energizer Holdings Inc. | 1,901,802 | 76,262 | ||||
| Shares | Market Value• ($000) | |||||
| Nu Skin Enterprises Inc. Class A | 1,418,629 | 71,995 | ||||
| * | Beauty Health Co. | 2,977,847 | 71,945 | |||
| Edgewell Personal Care Co. | 1,547,480 | 70,735 | ||||
| *,1 | Grocery Outlet Holding Corp. | 2,459,571 | 69,557 | |||
| Medifast Inc. | 314,128 | 65,788 | ||||
| * | TreeHouse Foods Inc. | 1,588,167 | 64,368 | |||
| 1 | B&G Foods Inc. | 1,846,771 | 56,751 | |||
| * | Olaplex Holdings Inc. | 1,832,868 | 53,391 | |||
| J & J Snack Foods Corp. | 326,028 | 51,499 | ||||
| Reynolds Consumer Products Inc. | 1,475,996 | 46,346 | ||||
| Vector Group Ltd. | 3,721,616 | 42,724 | ||||
| Cal-Maine Foods Inc. | 1,130,220 | 41,807 | ||||
| * | Pilgrim's Pride Corp. | 1,391,177 | 39,231 | |||
| Universal Corp. | 667,177 | 36,641 | ||||
| Ingles Markets Inc. Class A | 406,165 | 35,068 | ||||
| MGP Ingredients Inc. | 405,852 | 34,493 | ||||
| * | USANA Health Sciences Inc. | 332,532 | 33,652 | |||
| Andersons Inc. | 844,343 | 32,685 | ||||
| * | Chefs' Warehouse Inc. | 970,749 | 32,326 | |||
| *,1 | BellRing Brands Inc. Class A | 1,115,843 | 31,835 | |||
| Weis Markets Inc. | 459,818 | 30,293 | ||||
| Utz Brands Inc. | 1,891,544 | 30,170 | ||||
| 1 | National Beverage Corp. | 656,795 | 29,773 | |||
| Fresh Del Monte Produce Inc. | 1,013,637 | 27,976 | ||||
| * | Hydrofarm Holdings Group Inc. | 934,972 | 26,450 | |||
| Seaboard Corp. | 6,616 | 26,034 | ||||
| SpartanNash Co. | 970,540 | 25,001 | ||||
| *,1 | Duckhorn Portfolio Inc. | 976,373 | 22,789 | |||
| John B Sanfilippo & Son Inc. | 251,600 | 22,684 | ||||
| * | Rite Aid Corp. | 1,482,120 | 21,772 | |||
| ACCO Brands Corp. | 2,592,751 | 21,416 | ||||
| Calavo Growers Inc. | 478,378 | 20,283 | ||||
| * | GrowGeneration Corp. | 1,467,130 | 19,146 | |||
| *,1 | Tattooed Chef Inc. | 1,187,742 | 18,458 | |||
| Brown-Forman Corp. Class A | 259,279 | 17,577 | ||||
| Turning Point Brands Inc. | 456,482 | 17,246 | ||||
| *,1 | PLBY Group Inc. | 646,732 | 17,229 | |||
| * | Mission Produce Inc. | 1,001,161 | 15,718 | |||
| Shares | Market Value• ($000) | |||||
| Nature's Sunshine Products Inc. | 789,554 | 14,607 | ||||
| 1 | PetMed Express Inc. | 568,993 | 14,373 | |||
| *,1 | 22nd Century Group Inc. | 4,628,765 | 14,303 | |||
| Tootsie Roll Industries Inc. | 391,887 | 14,198 | ||||
| * | Honest Co. Inc. | 1,426,618 | 11,541 | |||
| * | Whole Earth Brands Inc. | 1,037,374 | 11,141 | |||
| * | Sovos Brands Inc. | 716,600 | 10,785 | |||
| * | Veru Inc. | 1,770,928 | 10,431 | |||
| * | Vital Farms Inc. | 520,595 | 9,402 | |||
| * | Benson Hill Inc. | 1,265,490 | 9,225 | |||
| *,1 | HF Foods Group Inc. | 1,087,920 | 9,204 | |||
| Oil-Dri Corp. of America | 263,293 | 8,618 | ||||
| * | Landec Corp. | 714,876 | 7,935 | |||
| * | Seneca Foods Corp. Class A | 162,229 | 7,779 | |||
| *,1 | AppHarvest Inc. | 1,904,283 | 7,408 | |||
| Limoneira Co. | 451,596 | 6,774 | ||||
| Alico Inc. | 149,534 | 5,537 | ||||
| Village Super Market Inc. Class A | 219,880 | 5,143 | ||||
| Natural Grocers by Vitamin Cottage Inc. | 317,495 | 4,524 | ||||
| *,1 | Local Bounti Corp. | 617,326 | 3,982 | |||
| *,1 | NewAge Inc. | 3,820,555 | 3,935 | |||
| *,1 | Vita Coco Co. Inc. | 315,970 | 3,529 | |||
| *,1 | Alkaline Water Co. Inc. | 2,698,649 | 3,184 | |||
| * | Lifevantage Corp. | 500,965 | 3,166 | |||
| * | Farmer Bros Co. | 415,167 | 3,093 | |||
| *,1 | AquaBounty Technologies Inc. | 1,307,824 | 2,746 | |||
| * | Natural Alternatives International Inc. | 197,375 | 2,495 | |||
| *,1 | LifeMD Inc. | 621,308 | 2,404 | |||
| *,1 | Laird Superfood Inc. | 182,168 | 2,376 | |||
| *,1 | Zevia PBC Class A | 333,732 | 2,353 | |||
| * | Blue Apron Holdings Inc. Class A | 344,335 | 2,317 | |||
| *,1 | Beachbody Co. Inc. | 968,258 | 2,295 | |||
| ProPhase Labs Inc. | 303,130 | 2,173 | ||||
| * | Urban-Gro Inc. | 189,972 | 1,991 | |||
| *,1 | Greenlane Holdings Inc. Class A | 2,011,084 | 1,939 | |||
| * | Nuzee Inc. | 410,002 | 1,697 | |||
| * | S&W Seed Co. | 576,492 | 1,574 | |||
| AMCON Distributing Co. | 6,105 | 1,218 | ||||
| * | Rocky Mountain Chocolate Factory Inc. | 152,787 | 1,192 | |||
| Shares | Market Value• ($000) | |||||
| Mannatech Inc. | 30,953 | 1,186 | ||||
| * | Willamette Valley Vineyards Inc. | 130,770 | 1,135 | |||
| Ocean Bio-Chem Inc. | 124,500 | 1,083 | ||||
| * | Coffee Holding Co. Inc. | 230,234 | 1,002 | |||
| * | Real Good Food Co. Inc. Class A | 157,843 | 988 | |||
| * | Reed's Inc. | 2,530,478 | 908 | |||
| *,1 | MedAvail Holdings Inc. | 629,749 | 882 | |||
| *,1 | Calyxt Inc. | 333,863 | 711 | |||
| * | Better Choice Co. Inc. | 197,337 | 637 | |||
| * | Eastside Distilling Inc. | 341,987 | 612 | |||
| * | Guardion Health Sciences Inc. | 787,758 | 510 | |||
| * | Arcadia Biosciences Inc. | 483,138 | 503 | |||
| * | Bridgford Foods Corp. | 39,983 | 465 | |||
| * | MamaMancini's Holdings Inc. | 205,991 | 416 | |||
| * | Yield10 Bioscience Inc. | 75,975 | 374 | |||
| * | Lifeway Foods Inc. | 45,393 | 214 | |||
| * | RiceBran Technologies | 560,464 | 195 | |||
| * | Zivo Bioscience Inc. | 62,634 | 180 | |||
| 64,495,877 | ||||||
| Energy (2.8%) | ||||||
| Exxon Mobil Corp. | 120,319,130 | 7,362,328 | ||||
| Chevron Corp. | 54,784,484 | 6,428,959 | ||||
| ConocoPhillips | 37,485,339 | 2,705,692 | ||||
| EOG Resources Inc. | 16,629,234 | 1,477,175 | ||||
| Schlumberger NV | 39,874,353 | 1,194,237 | ||||
| Pioneer Natural Resources Co. | 6,246,129 | 1,136,046 | ||||
| Marathon Petroleum Corp. | 17,496,110 | 1,119,576 | ||||
| Kinder Morgan Inc. | 57,991,542 | 919,746 | ||||
| Phillips 66 | 12,455,848 | 902,551 | ||||
| Valero Energy Corp. | 11,614,485 | 872,364 | ||||
| Williams Cos. Inc. | 33,153,587 | 863,319 | ||||
| Devon Energy Corp. | 19,233,799 | 847,249 | ||||
| ONEOK Inc. | 12,678,056 | 744,963 | ||||
| Occidental Petroleum Corp. | 25,206,963 | 730,750 | ||||
| Cheniere Energy Inc. | 6,486,678 | 657,879 | ||||
| * | Enphase Energy Inc. | 3,451,568 | 631,430 | |||
| Hess Corp. | 7,923,192 | 586,554 | ||||
| Baker Hughes Co. | 23,525,253 | 566,018 | ||||
| Diamondback Energy Inc. | 5,149,710 | 555,396 | ||||
| Halliburton Co. | 24,185,025 | 553,112 | ||||
| * | Plug Power Inc. | 16,387,798 | 462,628 | |||
| Shares | Market Value• ($000) | |||||
| Coterra Energy Inc. | 23,124,856 | 439,372 | ||||
| Marathon Oil Corp. | 22,133,274 | 363,428 | ||||
| Targa Resources Corp. | 6,507,505 | 339,952 | ||||
| APA Corp. | 10,326,651 | 277,684 | ||||
| Ovintiv Inc. | 7,422,687 | 250,145 | ||||
| * | First Solar Inc. | 2,720,101 | 237,084 | |||
| * | EQT Corp. | 10,744,643 | 234,341 | |||
| Texas Pacific Land Corp. | 176,157 | 219,997 | ||||
| Chesapeake Energy Corp. | 2,924,725 | 188,703 | ||||
| * | NOV Inc. | 11,120,234 | 150,679 | |||
| HollyFrontier Corp. | 4,157,470 | 136,282 | ||||
| PDC Energy Inc. | 2,768,909 | 135,067 | ||||
| * | Southwestern Energy Co. | 28,904,087 | 134,693 | |||
| * | Antero Resources Corp. | 7,587,733 | 132,785 | |||
| DT Midstream Inc. | 2,749,231 | 131,908 | ||||
| * | Range Resources Corp. | 7,018,074 | 125,132 | |||
| *,1 | ChargePoint Holdings Inc. | 6,419,977 | 122,301 | |||
| Equitrans Midstream Corp. | 11,678,401 | 120,755 | ||||
| Civitas Resources Inc. | 2,377,588 | 116,430 | ||||
| * | ChampionX Corp. | 5,752,265 | 116,253 | |||
| Matador Resources Co. | 3,003,844 | 110,902 | ||||
| Murphy Oil Corp. | 4,175,145 | 109,013 | ||||
| * | Denbury Inc. | 1,353,732 | 103,682 | |||
| SM Energy Co. | 3,454,445 | 101,837 | ||||
| California Resources Corp. | 2,285,489 | 97,613 | ||||
| Antero Midstream Corp. | 8,820,351 | 85,381 | ||||
| Magnolia Oil & Gas Corp. Class A | 4,390,416 | 82,847 | ||||
| *,1 | Stem Inc. | 3,902,594 | 74,032 | |||
| Arcosa Inc. | 1,372,884 | 72,351 | ||||
| * | Shoals Technologies Group Inc. Class A | 2,969,583 | 72,161 | |||
| * | Whiting Petroleum Corp. | 1,107,029 | 71,603 | |||
| * | CNX Resources Corp. | 5,108,559 | 70,243 | |||
| * | Ameresco Inc. Class A | 858,200 | 69,892 | |||
| Continental Resources Inc. | 1,560,025 | 69,827 | ||||
| Oasis Petroleum Inc. | 534,448 | 67,335 | ||||
| * | Callon Petroleum Co. | 1,395,398 | 65,933 | |||
| Helmerich & Payne Inc. | 2,770,002 | 65,649 | ||||
| Cactus Inc. Class A | 1,677,887 | 63,978 | ||||
| Shares | Market Value• ($000) | |||||
| * | Renewable Energy Group Inc. | 1,432,078 | 60,777 | |||
| * | Array Technologies Inc. | 3,647,281 | 57,226 | |||
| *,1 | FuelCell Energy Inc. | 9,902,701 | 51,494 | |||
| *,1 | SunPower Corp. | 2,455,269 | 51,241 | |||
| * | Green Plains Inc. | 1,446,539 | 50,282 | |||
| * | Weatherford International plc | 1,794,387 | 49,740 | |||
| 1 | New Fortress Energy Inc. Class A | 2,057,729 | 49,674 | |||
| World Fuel Services Corp. | 1,698,033 | 44,947 | ||||
| Patterson-UTI Energy Inc. | 5,216,876 | 44,083 | ||||
| * | Transocean Ltd. | 15,701,779 | 43,337 | |||
| Arch Resources Inc. | 435,409 | 39,762 | ||||
| Warrior Met Coal Inc. | 1,470,663 | 37,811 | ||||
| *,1 | Tellurian Inc. | 11,565,108 | 35,621 | |||
| * | PBF Energy Inc. Class A | 2,732,636 | 35,442 | |||
| Northern Oil & Gas Inc. | 1,715,318 | 35,301 | ||||
| * | Liberty Oilfield Services Inc. Class A | 3,408,195 | 33,059 | |||
| Archrock Inc. | 4,390,845 | 32,844 | ||||
| * | Oceaneering International Inc. | 2,859,768 | 32,344 | |||
| * | Delek US Holdings Inc. | 2,122,957 | 31,823 | |||
| * | Centennial Resource Development Inc. Class A | 5,263,526 | 31,476 | |||
| * | Fluence Energy Inc. Class A | 845,919 | 30,081 | |||
| * | Peabody Energy Corp. | 2,896,192 | 29,165 | |||
| Core Laboratories NV | 1,300,792 | 29,021 | ||||
| * | Alpha Metallurgical Resources Inc. | 443,333 | 27,065 | |||
| * | NOW Inc. | 3,119,549 | 26,641 | |||
| * | Laredo Petroleum Inc. | 437,939 | 26,333 | |||
| Brigham Minerals Inc. Class A | 1,223,920 | 25,812 | ||||
| *,1 | Noble Corp. | 1,027,335 | 25,488 | |||
| *,1 | Gevo Inc. | 5,448,564 | 23,320 | |||
| * | Gulfport Energy Corp. | 321,805 | 23,180 | |||
| * | DMC Global Inc. | 530,714 | 21,022 | |||
| * | Par Pacific Holdings Inc. | 1,264,259 | 20,848 | |||
| * | NexTier Oilfield Solutions Inc. | 5,861,975 | 20,810 | |||
| * | ProPetro Holding Corp. | 2,528,442 | 20,480 | |||
| Shares | Market Value• ($000) | |||||
| * | Bristow Group Inc. Class A | 644,164 | 20,401 | |||
| * | Dril-Quip Inc. | 1,016,414 | 20,003 | |||
| * | Comstock Resources Inc. | 2,272,847 | 18,387 | |||
| * | Nabors Industries Ltd. | 208,953 | 16,944 | |||
| * | CONSOL Energy Inc. | 735,685 | 16,707 | |||
| *,1 | Montauk Renewables Inc. | 1,624,116 | 16,647 | |||
| Berry Corp. | 1,936,014 | 16,301 | ||||
| SunCoke Energy Inc. | 2,368,439 | 15,608 | ||||
| * | Centrus Energy Corp. Class A | 310,367 | 15,490 | |||
| * | Ranger Oil Corp. | 570,189 | 15,349 | |||
| * | MRC Global Inc. | 2,220,526 | 15,277 | |||
| * | TPI Composites Inc. | 982,532 | 14,699 | |||
| * | REX American Resources Corp. | 150,951 | 14,491 | |||
| CVR Energy Inc. | 855,403 | 14,379 | ||||
| * | Talos Energy Inc. | 1,284,887 | 12,592 | |||
| * | Helix Energy Solutions Group Inc. | 3,988,209 | 12,443 | |||
| * | Tidewater Inc. | 1,081,354 | 11,581 | |||
| * | Select Energy Services Inc. Class A | 1,858,281 | 11,577 | |||
| *,1 | Aemetis Inc. | 805,835 | 9,912 | |||
| * | RPC Inc. | 2,163,613 | 9,823 | |||
| * | SandRidge Energy Inc. | 920,016 | 9,623 | |||
| * | TETRA Technologies Inc. | 3,298,148 | 9,367 | |||
| * | Earthstone Energy Inc. Class A | 834,701 | 9,132 | |||
| *,1 | Crescent Energy Inc. Class A | 696,896 | 8,837 | |||
| * | W&T Offshore Inc. | 2,683,486 | 8,668 | |||
| * | Oil States International Inc. | 1,675,598 | 8,328 | |||
| *,1 | Volta Inc. | 1,089,200 | 7,995 | |||
| * | American Superconductor Corp. | 699,725 | 7,613 | |||
| * | Newpark Resources Inc. | 2,465,453 | 7,248 | |||
| * | FTS International Inc. Class A | 274,859 | 7,215 | |||
| * | SilverBow Resources Inc. | 320,799 | 6,984 | |||
| *,1 | EVgo Inc. | 684,200 | 6,801 | |||
| *,1 | Camber Energy Inc. | 7,107,332 | 6,041 | |||
| 1 | Altus Midstream Co. | 96,236 | 5,900 | |||
| * | Trecora Resources | 711,814 | 5,751 | |||
| *,1 | Advent Technologies Holdings Inc. | 804,755 | 5,641 | |||
| * | Matrix Service Co. | 742,386 | 5,583 | |||
| Shares | Market Value• ($000) | |||||
| Solaris Oilfield Infrastructure Inc. Class A | 851,953 | 5,580 | ||||
| * | Ramaco Resources Inc. | 376,500 | 5,120 | |||
| * | VAALCO Energy Inc. | 1,573,656 | 5,051 | |||
| Falcon Minerals Corp. | 1,004,143 | 4,890 | ||||
| *,1 | Ring Energy Inc. | 2,080,950 | 4,745 | |||
| NACCO Industries Inc. Class A | 125,541 | 4,556 | ||||
| *,1 | Beam Global | 225,421 | 4,193 | |||
| * | Natural Gas Services Group Inc. | 378,603 | 3,964 | |||
| Evolution Petroleum Corp. | 784,579 | 3,962 | ||||
| *,1 | NextDecade Corp. | 1,303,072 | 3,714 | |||
| * | FTC Solar Inc. | 470,149 | 3,554 | |||
| * | Amplify Energy Corp. | 859,535 | 2,673 | |||
| *,1 | American Resources Corp. | 1,448,956 | 2,608 | |||
| * | Geospace Technologies Corp. | 385,060 | 2,588 | |||
| * | Sunworks Inc. | 763,794 | 2,345 | |||
| * | Flotek Industries Inc. | 1,911,170 | 2,160 | |||
| *,1 | Ocean Power Technologies Inc. | 1,436,122 | 2,125 | |||
| * | Exterran Corp. | 707,599 | 2,109 | |||
| * | Battalion Oil Corp. | 207,283 | 2,031 | |||
| * | Epsilon Energy Ltd. | 355,787 | 2,017 | |||
| Adams Resources & Energy Inc. | 67,642 | 1,881 | ||||
| * | Ranger Energy Services Inc. Class A | 179,548 | 1,844 | |||
| * | Ideal Power Inc. | 149,114 | 1,798 | |||
| * | SEACOR Marine Holdings Inc. | 507,121 | 1,724 | |||
| *,1 | ESS Tech Inc. | 147,986 | 1,693 | |||
| PHX Minerals Inc. | 766,499 | 1,663 | ||||
| * | Ecoark Holdings Inc. | 703,727 | 1,569 | |||
| *,1 | iSun Inc. | 262,173 | 1,563 | |||
| * | PrimeEnergy Resources Corp. | 21,626 | 1,493 | |||
| * | Gulf Island Fabrication Inc. | 372,057 | 1,492 | |||
| * | Forum Energy Technologies Inc. | 89,925 | 1,443 | |||
| * | Hallador Energy Co. | 579,365 | 1,425 | |||
| * | Capstone Green Energy Corp. | 344,624 | 1,144 | |||
| * | Smart Sand Inc. | 618,977 | 1,102 | |||
| *,1 | US Well Services Inc. Class A | 895,941 | 1,030 | |||
| * | Dawson Geophysical Co. | 420,698 | 974 | |||
| Shares | Market Value• ($000) | |||||
| * | MIND Technology Inc. | 491,883 | 817 | |||
| * | Profire Energy Inc. | 598,754 | 635 | |||
| *,1 | KLX Energy Services Holdings Inc. | 186,512 | 578 | |||
| * | Mammoth Energy Services Inc. | 307,258 | 559 | |||
| *,1 | ION Geophysical Corp. | 615,545 | 542 | |||
| * | PEDEVCO Corp. | 460,492 | 488 | |||
| * | Independence Contract Drilling Inc. | 129,345 | 388 | |||
| *,1 | New Concept Energy Inc. | 154,300 | 367 | |||
| *,1 | Nine Energy Service Inc. | 332,516 | 332 | |||
| * | Nabors Industries Ltd. Warrants Exp. 6/11/26 | 70,676 | 264 | |||
| * | US Energy Corp. Wyoming | 73,862 | 242 | |||
| * | Stabilis Solutions Inc. | 43,809 | 188 | |||
| * | NCS Multistage Holdings Inc. | 5,982 | 173 | |||
| * | Tidewater Inc. Class A Warrants Exp. 7/31/23 | 8,839 | 5 | |||
| * | Tidewater Inc. Class B Warrants Exp. 7/31/23 | 9,555 | 3 | |||
| *,1,2 | Harvest Natural Resources Inc. | 51,829 | — | |||
| *,1 | FTS International Inc. Warrants Exp. 11/19/23 | 22,671 | — | |||
| 38,467,534 | ||||||
| Financials (10.8%) | ||||||
| * | Berkshire Hathaway Inc. Class B | 48,225,937 | 14,419,555 | |||
| JPMorgan Chase & Co. | 83,988,235 | 13,299,537 | ||||
| Bank of America Corp. | 197,709,410 | 8,796,092 | ||||
| Wells Fargo & Co. | 113,321,790 | 5,437,179 | ||||
| Morgan Stanley | 40,798,842 | 4,004,814 | ||||
| Charles Schwab Corp. | 43,757,082 | 3,679,971 | ||||
| Goldman Sachs Group Inc. | 9,533,979 | 3,647,224 | ||||
| BlackRock Inc. | 3,885,635 | 3,557,532 | ||||
| Citigroup Inc. | 56,391,721 | 3,405,496 | ||||
| S&P Global Inc. | 6,849,223 | 3,232,354 | ||||
| Blackstone Inc. | 19,521,962 | 2,525,947 | ||||
| Marsh & McLennan Cos. Inc. | 14,348,153 | 2,493,996 | ||||
| PNC Financial Services Group Inc. | 12,010,806 | 2,408,407 | ||||
| Shares | Market Value• ($000) | |||||
| CME Group Inc. | 10,215,056 | 2,333,732 | ||||
| Truist Financial Corp. | 37,928,163 | 2,220,694 | ||||
| Intercontinental Exchange Inc. | 16,010,771 | 2,189,793 | ||||
| US Bancorp | 37,925,164 | 2,130,256 | ||||
| Chubb Ltd. | 10,405,274 | 2,011,444 | ||||
| Aon plc Class A | 5,949,029 | 1,788,040 | ||||
| Moody's Corp. | 4,490,534 | 1,753,913 | ||||
| Progressive Corp. | 16,608,682 | 1,704,881 | ||||
| MSCI Inc. | 2,226,044 | 1,363,875 | ||||
| American International Group Inc. | 23,599,107 | 1,341,845 | ||||
| T. Rowe Price Group Inc. | 6,387,721 | 1,256,081 | ||||
| Bank of New York Mellon Corp. | 21,124,633 | 1,226,919 | ||||
| KKR & Co. Inc. | 15,795,030 | 1,176,730 | ||||
| Prudential Financial Inc. | 10,740,838 | 1,162,588 | ||||
| * | SVB Financial Group | 1,668,009 | 1,131,310 | |||
| MetLife Inc. | 17,930,203 | 1,120,458 | ||||
| Travelers Cos. Inc. | 6,991,414 | 1,093,667 | ||||
| First Republic Bank | 5,088,465 | 1,050,819 | ||||
| Arthur J Gallagher & Co. | 5,891,200 | 999,560 | ||||
| Aflac Inc. | 16,920,915 | 988,012 | ||||
| Discover Financial Services | 8,330,088 | 962,625 | ||||
| Ameriprise Financial Inc. | 3,180,155 | 959,326 | ||||
| Allstate Corp. | 8,146,969 | 958,491 | ||||
| * | Coinbase Global Inc. Class A | 3,750,497 | 946,513 | |||
| Fifth Third Bancorp | 19,434,478 | 846,372 | ||||
| Willis Towers Watson plc | 3,541,684 | 841,115 | ||||
| Nasdaq Inc. | 3,326,160 | 698,527 | ||||
| State Street Corp. | 7,300,767 | 678,971 | ||||
| Northern Trust Corp. | 5,607,132 | 670,669 | ||||
| Hartford Financial Services Group Inc. | 9,674,667 | 667,939 | ||||
| Huntington Bancshares Inc. | 41,112,365 | 633,953 | ||||
| KeyCorp | 26,461,232 | 612,048 | ||||
| Broadridge Financial Solutions Inc. | 3,312,162 | 605,529 | ||||
| Regions Financial Corp. | 27,105,395 | 590,898 | ||||
| Citizens Financial Group Inc. | 12,114,193 | 572,396 | ||||
| M&T Bank Corp. | 3,657,449 | 561,711 | ||||
| Principal Financial Group Inc. | 7,533,780 | 544,918 | ||||
| Raymond James Financial Inc. | 5,273,097 | 529,419 | ||||
| Shares | Market Value• ($000) | |||||
| FactSet Research Systems Inc. | 1,069,802 | 519,934 | ||||
| Cincinnati Financial Corp. | 4,352,185 | 495,844 | ||||
| Brown & Brown Inc. | 6,822,503 | 479,486 | ||||
| * | Markel Corp. | 388,240 | 479,088 | |||
| * | Berkshire Hathaway Inc. Class A | 1,051 | 473,646 | |||
| Ally Financial Inc. | 9,846,914 | 468,812 | ||||
| * | Arch Capital Group Ltd. | 10,424,414 | 463,365 | |||
| Signature Bank | 1,418,801 | 458,940 | ||||
| Apollo Asset Management Inc. | 6,234,076 | 451,534 | ||||
| MarketAxess Holdings Inc. | 1,026,900 | 422,333 | ||||
| Fidelity National Financial Inc. | 7,679,797 | 400,732 | ||||
| Cboe Global Markets Inc. | 3,029,409 | 395,035 | ||||
| Equitable Holdings Inc. | 11,511,808 | 377,472 | ||||
| Loews Corp. | 6,126,880 | 353,889 | ||||
| LPL Financial Holdings Inc. | 2,164,186 | 346,465 | ||||
| Carlyle Group Inc. | 6,079,507 | 333,765 | ||||
| Lincoln National Corp. | 4,880,883 | 333,169 | ||||
| Ares Management Corp. Class A | 4,048,954 | 329,058 | ||||
| Comerica Inc. | 3,728,720 | 324,399 | ||||
| Annaly Capital Management Inc. | 41,142,564 | 321,735 | ||||
| * | Athene Holding Ltd. Class A | 3,822,576 | 318,535 | |||
| East West Bancorp Inc. | 4,033,493 | 317,355 | ||||
| W R Berkley Corp. | 3,765,001 | 310,198 | ||||
| Everest Re Group Ltd. | 1,118,860 | 306,478 | ||||
| Western Alliance Bancorp | 2,813,951 | 302,922 | ||||
| Tradeweb Markets Inc. Class A | 2,985,306 | 298,949 | ||||
| Franklin Resources Inc. | 8,564,594 | 286,828 | ||||
| American Financial Group Inc. | 2,046,578 | 281,036 | ||||
| Zions Bancorp NA | 4,447,949 | 280,932 | ||||
| *,1 | SoFi Technologies Inc. | 17,196,053 | 271,870 | |||
| Invesco Ltd. | 11,802,080 | 271,684 | ||||
| Assurant Inc. | 1,618,971 | 252,333 | ||||
| First Horizon Corp. | 15,365,123 | 250,912 | ||||
| * | Alleghany Corp. | 369,779 | 246,861 | |||
| * | Upstart Holdings Inc. | 1,630,582 | 246,707 | |||
| Shares | Market Value• ($000) | |||||
| Globe Life Inc. | 2,586,301 | 242,388 | ||||
| First American Financial Corp. | 2,962,815 | 231,781 | ||||
| Morningstar Inc. | 673,698 | 230,398 | ||||
| AGNC Investment Corp. | 14,894,178 | 224,008 | ||||
| RenaissanceRe Holdings Ltd. | 1,308,156 | 221,510 | ||||
| SEI Investments Co. | 3,565,874 | 217,304 | ||||
| People's United Financial Inc. | 12,166,689 | 216,810 | ||||
| Commerce Bancshares Inc. | 3,117,858 | 214,322 | ||||
| Reinsurance Group of America Inc. | 1,921,747 | 210,412 | ||||
| Voya Financial Inc. | 3,158,599 | 209,447 | ||||
| Cullen/Frost Bankers Inc. | 1,628,534 | 205,309 | ||||
| Old Republic International Corp. | 8,285,987 | 203,670 | ||||
| Janus Henderson Group plc | 4,848,475 | 203,345 | ||||
| Jefferies Financial Group Inc. | 5,233,530 | 203,061 | ||||
| Starwood Property Trust Inc. | 8,232,975 | 200,061 | ||||
| Interactive Brokers Group Inc. Class A | 2,514,881 | 199,732 | ||||
| Stifel Financial Corp. | 2,813,917 | 198,156 | ||||
| Pinnacle Financial Partners Inc. | 2,056,226 | 196,370 | ||||
| First Financial Bankshares Inc. | 3,846,987 | 195,581 | ||||
| Synovus Financial Corp. | 3,929,745 | 188,117 | ||||
| Affiliated Managers Group Inc. | 1,097,879 | 180,612 | ||||
| Prosperity Bancshares Inc. | 2,486,041 | 179,741 | ||||
| Glacier Bancorp Inc. | 3,146,050 | 178,381 | ||||
| Popular Inc. | 2,129,164 | 174,677 | ||||
| Primerica Inc. | 1,122,369 | 172,025 | ||||
| 1 | Blue Owl Capital Inc. Class A | 11,522,581 | 171,802 | |||
| OneMain Holdings Inc. | 3,311,140 | 165,689 | ||||
| SLM Corp. | 8,333,532 | 163,921 | ||||
| Bank OZK | 3,506,828 | 163,173 | ||||
| Cadence Bank | 5,473,997 | 163,070 | ||||
| Valley National Bancorp | 11,576,034 | 159,170 | ||||
| SouthState Corp. | 1,983,629 | 158,909 | ||||
| PacWest Bancorp | 3,334,427 | 150,616 | ||||
| Houlihan Lokey Inc. Class A | 1,449,608 | 150,063 | ||||
| New York Community Bancorp Inc. | 12,109,549 | 147,858 | ||||
| Shares | Market Value• ($000) | |||||
| Wintrust Financial Corp. | 1,621,326 | 147,249 | ||||
| Kinsale Capital Group Inc. | 616,377 | 146,630 | ||||
| CIT Group Inc. | 2,812,456 | 144,391 | ||||
| Webster Financial Corp. | 2,576,552 | 143,875 | ||||
| New Residential Investment Corp. | 13,253,198 | 141,942 | ||||
| *,1 | Credit Acceptance Corp. | 206,217 | 141,811 | |||
| Sterling Bancorp | 5,484,248 | 141,439 | ||||
| Selective Insurance Group Inc. | 1,709,589 | 140,084 | ||||
| Erie Indemnity Co. Class A | 722,007 | 139,102 | ||||
| Blackstone Mortgage Trust Inc. Class A | 4,521,143 | 138,437 | ||||
| RLI Corp. | 1,222,251 | 137,014 | ||||
| * | Trupanion Inc. | 1,034,070 | 136,528 | |||
| Essent Group Ltd. | 2,985,528 | 135,931 | ||||
| First Citizens BancShares Inc. Class A | 162,416 | 134,779 | ||||
| United Bankshares Inc. | 3,687,105 | 133,768 | ||||
| MGIC Investment Corp. | 9,252,544 | 133,422 | ||||
| Lazard Ltd. Class A | 3,041,343 | 132,694 | ||||
| Unum Group | 5,233,902 | 128,597 | ||||
| Evercore Inc. Class A | 942,795 | 128,079 | ||||
| UMB Financial Corp. | 1,169,394 | 124,084 | ||||
| Walker & Dunlop Inc. | 819,811 | 123,693 | ||||
| Hanover Insurance Group Inc. | 910,754 | 119,363 | ||||
| Umpqua Holdings Corp. | 6,150,217 | 118,330 | ||||
| Axis Capital Holdings Ltd. | 2,170,226 | 118,212 | ||||
| ServisFirst Bancshares Inc. | 1,387,609 | 117,864 | ||||
| * | Brighthouse Financial Inc. | 2,271,871 | 117,683 | |||
| Hancock Whitney Corp. | 2,346,496 | 117,372 | ||||
| Community Bank System Inc. | 1,535,739 | 114,382 | ||||
| * | Silvergate Capital Corp. Class A | 765,620 | 113,465 | |||
| Jackson Financial Inc. Class A | 2,645,650 | 110,668 | ||||
| FNB Corp. | 9,078,611 | 110,124 | ||||
| Moelis & Co. Class A | 1,733,538 | 108,363 | ||||
| Radian Group Inc. | 5,104,001 | 107,848 | ||||
| Pacific Premier Bancorp Inc. | 2,684,452 | 107,459 | ||||
| BankUnited Inc. | 2,535,673 | 107,284 | ||||
| Shares | Market Value• ($000) | |||||
| Independent Bank Corp. (XNGS) | 1,279,794 | 104,342 | ||||
| Home BancShares Inc. | 4,190,065 | 102,028 | ||||
| Chimera Investment Corp. | 6,731,256 | 101,507 | ||||
| Kemper Corp. | 1,714,796 | 100,813 | ||||
| First Hawaiian Inc. | 3,665,045 | 100,166 | ||||
| Federated Hermes Inc. Class B | 2,617,417 | 98,363 | ||||
| Eastern Bankshares Inc. | 4,781,747 | 96,448 | ||||
| Investors Bancorp Inc. | 6,349,236 | 96,191 | ||||
| Bank of Hawaii Corp. | 1,141,133 | 95,581 | ||||
| Assured Guaranty Ltd. | 1,887,645 | 94,760 | ||||
| Ameris Bancorp | 1,881,890 | 93,492 | ||||
| United Community Banks Inc. | 2,584,316 | 92,880 | ||||
| Hamilton Lane Inc. Class A | 895,240 | 92,765 | ||||
| Navient Corp. | 4,342,323 | 92,144 | ||||
| Virtu Financial Inc. Class A | 3,193,682 | 92,074 | ||||
| Simmons First National Corp. Class A | 3,103,579 | 91,804 | ||||
| American Equity Investment Life Holding Co. | 2,358,312 | 91,785 | ||||
| Associated Banc-Corp | 4,058,866 | 91,690 | ||||
| *,1 | Marathon Digital Holdings Inc. | 2,771,433 | 91,069 | |||
| Cathay General Bancorp | 2,088,588 | 89,788 | ||||
| * | Texas Capital Bancshares Inc. | 1,440,278 | 86,777 | |||
| Piper Sandler Cos. | 483,168 | 86,250 | ||||
| Old National Bancorp | 4,721,695 | 85,557 | ||||
| * | Axos Financial Inc. | 1,524,050 | 85,210 | |||
| Artisan Partners Asset Management Inc. Class A | 1,765,721 | 84,119 | ||||
| CNO Financial Group Inc. | 3,508,722 | 83,648 | ||||
| White Mountains Insurance Group Ltd. | 81,371 | 82,502 | ||||
| BOK Financial Corp. | 781,531 | 82,444 | ||||
| FirstCash Holdings Inc. | 1,089,590 | 81,512 | ||||
| * | Triumph Bancorp Inc. | 678,064 | 80,744 | |||
| First Bancorp (XNYS) | 5,853,909 | 80,667 | ||||
| Shares | Market Value• ($000) | |||||
| Live Oak Bancshares Inc. | 919,156 | 80,233 | ||||
| * | Mr Cooper Group Inc. | 1,918,280 | 79,820 | |||
| CVB Financial Corp. | 3,663,017 | 78,425 | ||||
| Fulton Financial Corp. | 4,593,721 | 78,093 | ||||
| * | Focus Financial Partners Inc. Class A | 1,291,491 | 77,128 | |||
| * | Enstar Group Ltd. | 309,763 | 76,694 | |||
| Atlantic Union Bankshares Corp. | 2,044,466 | 76,238 | ||||
| * | Cannae Holdings Inc. | 2,155,209 | 75,756 | |||
| Independent Bank Group Inc. | 1,037,848 | 74,881 | ||||
| Arbor Realty Trust Inc. | 4,086,847 | 74,871 | ||||
| Santander Consumer USA Holdings Inc. | 1,738,846 | 73,066 | ||||
| Columbia Banking System Inc. | 2,230,435 | 72,980 | ||||
| Flagstar Bancorp Inc. | 1,492,858 | 71,568 | ||||
| *,1 | Riot Blockchain Inc. | 3,130,662 | 69,908 | |||
| International Bancshares Corp. | 1,631,611 | 69,164 | ||||
| * | LendingClub Corp. | 2,839,709 | 68,664 | |||
| WSFS Financial Corp. | 1,354,514 | 67,888 | ||||
| First Midwest Bancorp Inc. | 3,249,439 | 66,549 | ||||
| Goosehead Insurance Inc. Class A | 506,625 | 65,902 | ||||
| PennyMac Financial Services Inc. | 921,384 | 64,294 | ||||
| First Merchants Corp. | 1,533,512 | 64,239 | ||||
| Cohen & Steers Inc. | 685,110 | 63,380 | ||||
| * | Ryan Specialty Group Holdings Inc. Class A | 1,560,631 | 62,971 | |||
| First Financial Bancorp | 2,550,775 | 62,188 | ||||
| Washington Federal Inc. | 1,857,844 | 62,015 | ||||
| Stewart Information Services Corp. | 763,906 | 60,906 | ||||
| Virtus Investment Partners Inc. | 204,227 | 60,676 | ||||
| * | Open Lending Corp. Class A | 2,691,725 | 60,510 | |||
| StepStone Group Inc. Class A | 1,440,674 | 59,889 | ||||
| WesBanco Inc. | 1,710,258 | 59,842 | ||||
| * | PRA Group Inc. | 1,184,720 | 59,485 | |||
| Sandy Spring Bancorp Inc. | 1,233,859 | 59,324 | ||||
| Hilltop Holdings Inc. | 1,680,850 | 59,065 | ||||
| Towne Bank | 1,859,617 | 58,745 | ||||
| Shares | Market Value• ($000) | |||||
| * | Genworth Financial Inc. Class A | 14,438,103 | 58,474 | |||
| Renasant Corp. | 1,508,208 | 57,236 | ||||
| MFA Financial Inc. | 12,539,036 | 57,178 | ||||
| Park National Corp. | 415,805 | 57,094 | ||||
| Two Harbors Investment Corp. | 9,814,212 | 56,628 | ||||
| Banner Corp. | 926,473 | 56,209 | ||||
| Seacoast Banking Corp. of Florida | 1,579,873 | 55,912 | ||||
| * | BRP Group Inc. Class A | 1,536,370 | 55,478 | |||
| Lakeland Financial Corp. | 685,895 | 54,968 | ||||
| Heartland Financial USA Inc. | 1,083,893 | 54,856 | ||||
| Argo Group International Holdings Ltd. | 943,733 | 54,840 | ||||
| * | Customers Bancorp Inc. | 829,452 | 54,221 | |||
| 1 | Rocket Cos. Inc. Class A | 3,828,264 | 53,596 | |||
| Great Western Bancorp Inc. | 1,576,115 | 53,525 | ||||
| * | NMI Holdings Inc. Class A | 2,440,304 | 53,321 | |||
| Veritex Holdings Inc. | 1,334,578 | 53,090 | ||||
| Eagle Bancorp Inc. | 904,631 | 52,776 | ||||
| Apollo Commercial Real Estate Finance Inc. | 3,973,380 | 52,290 | ||||
| Trustmark Corp. | 1,601,426 | 51,982 | ||||
| Meta Financial Group Inc. | 825,250 | 49,234 | ||||
| Compass Diversified Holdings | 1,593,700 | 48,735 | ||||
| Northwest Bancshares Inc. | 3,423,252 | 48,473 | ||||
| iStar Inc. | 1,875,980 | 48,457 | ||||
| Provident Financial Services Inc. | 1,986,157 | 48,105 | ||||
| Hope Bancorp Inc. | 3,255,243 | 47,885 | ||||
| PennyMac Mortgage Investment Trust | 2,755,444 | 47,752 | ||||
| First Bancorp (XNGS) | 1,014,431 | 46,380 | ||||
| Enterprise Financial Services Corp. | 978,006 | 46,054 | ||||
| First Interstate BancSystem Inc. Class A | 1,126,818 | 45,828 | ||||
| Nelnet Inc. Class A | 468,564 | 45,769 | ||||
| PJT Partners Inc. Class A | 616,117 | 45,648 | ||||
| Horace Mann Educators Corp. | 1,171,060 | 45,320 | ||||
| NBT Bancorp Inc. | 1,172,929 | 45,181 | ||||
| Shares | Market Value• ($000) | |||||
| FB Financial Corp. | 1,019,593 | 44,679 | ||||
| * | Palomar Holdings Inc. | 685,031 | 44,369 | |||
| *,1 | Lemonade Inc. | 1,050,809 | 44,250 | |||
| *,1 | Lightwave Logic Inc. | 2,936,371 | 43,693 | |||
| First Commonwealth Financial Corp. | 2,707,427 | 43,562 | ||||
| Stock Yards Bancorp Inc. | 678,700 | 43,355 | ||||
| Redwood Trust Inc. | 3,249,083 | 42,855 | ||||
| BGC Partners Inc. Class A | 9,188,420 | 42,726 | ||||
| Capitol Federal Financial Inc. | 3,724,163 | 42,195 | ||||
| B. Riley Financial Inc. | 472,236 | 41,963 | ||||
| Mercury General Corp. | 787,864 | 41,804 | ||||
| *,1 | Encore Capital Group Inc. | 668,173 | 41,500 | |||
| Westamerica Bancorp | 718,604 | 41,485 | ||||
| First Busey Corp. | 1,494,322 | 40,526 | ||||
| New York Mortgage Trust Inc. | 10,806,302 | 40,199 | ||||
| * | Enova International Inc. | 974,802 | 39,928 | |||
| * | LendingTree Inc. | 320,186 | 39,255 | |||
| ProAssurance Corp. | 1,537,853 | 38,908 | ||||
| Ladder Capital Corp. | 3,222,288 | 38,635 | ||||
| OFG Bancorp | 1,420,708 | 37,734 | ||||
| Southside Bancshares Inc. | 874,150 | 36,557 | ||||
| National Bank Holdings Corp. Class A | 820,912 | 36,071 | ||||
| OceanFirst Financial Corp. | 1,594,500 | 35,398 | ||||
| Berkshire Hills Bancorp Inc. | 1,238,529 | 35,211 | ||||
| * | Bancorp Inc. | 1,382,276 | 34,985 | |||
| Safety Insurance Group Inc. | 405,870 | 34,511 | ||||
| Brookline Bancorp Inc. | 2,101,275 | 34,020 | ||||
| Broadmark Realty Capital Inc. | 3,574,729 | 33,710 | ||||
| S&T Bancorp Inc. | 1,066,198 | 33,607 | ||||
| City Holding Co. | 409,598 | 33,501 | ||||
| ConnectOne Bancorp Inc. | 1,001,268 | 32,751 | ||||
| BancFirst Corp. | 463,100 | 32,676 | ||||
| Premier Financial Corp. | 1,054,389 | 32,591 | ||||
| Federal Agricultural Mortgage Corp. Class C | 262,217 | 32,497 | ||||
| TriCo Bancshares | 755,079 | 32,438 | ||||
| Shares | Market Value• ($000) | |||||
| Employers Holdings Inc. | 759,018 | 31,408 | ||||
| * | Metropolitan Bank Holding Corp. | 287,792 | 30,658 | |||
| * | World Acceptance Corp. | 123,784 | 30,380 | |||
| Dime Community Bancshares Inc. | 862,098 | 30,311 | ||||
| AMERISAFE Inc. | 552,756 | 29,755 | ||||
| Tompkins Financial Corp. | 355,647 | 29,725 | ||||
| Banc of California Inc. | 1,504,580 | 29,520 | ||||
| * | Amerant Bancorp Inc. Class A | 843,985 | 29,160 | |||
| James River Group Holdings Ltd. | 999,441 | 28,794 | ||||
| HomeStreet Inc. | 553,013 | 28,757 | ||||
| TFS Financial Corp. | 1,605,671 | 28,693 | ||||
| Allegiance Bancshares Inc. | 665,894 | 28,107 | ||||
| * | Nicolet Bankshares Inc. | 324,999 | 27,869 | |||
| * | StoneX Group Inc. | 450,490 | 27,593 | |||
| Origin Bancorp Inc. | 638,790 | 27,417 | ||||
| Preferred Bank | 379,480 | 27,243 | ||||
| *,1 | Oscar Health Inc. Class A | 3,469,287 | 27,234 | |||
| First Foundation Inc. | 1,087,378 | 27,032 | ||||
| Cowen Inc. Class A | 736,215 | 26,577 | ||||
| German American Bancorp Inc. | 681,395 | 26,561 | ||||
| BrightSpire Capital Inc. Class A | 2,573,284 | 26,402 | ||||
| State Auto Financial Corp. | 509,902 | 26,357 | ||||
| Lakeland Bancorp Inc. | 1,371,817 | 26,051 | ||||
| Washington Trust Bancorp Inc. | 460,207 | 25,942 | ||||
| Ready Capital Corp. | 1,651,372 | 25,811 | ||||
| Kearny Financial Corp. | 1,928,359 | 25,551 | ||||
| Bryn Mawr Bank Corp. | 566,925 | 25,517 | ||||
| Ellington Financial Inc. | 1,481,380 | 25,317 | ||||
| Brightsphere Investment Group Inc. | 984,365 | 25,200 | ||||
| ARMOUR Residential REIT Inc. | 2,553,805 | 25,053 | ||||
| Heritage Financial Corp. | 1,016,779 | 24,850 | ||||
| Invesco Mortgage Capital Inc. | 8,865,124 | 24,645 | ||||
| * | TriState Capital Holdings Inc. | 803,103 | 24,302 | |||
| Shares | Market Value• ($000) | |||||
| Univest Financial Corp. | 799,960 | 23,935 | ||||
| QCR Holdings Inc. | 421,137 | 23,584 | ||||
| Peoples Bancorp Inc. | 724,102 | 23,034 | ||||
| * | Blucora Inc. | 1,315,554 | 22,785 | |||
| First Bancshares Inc. | 576,125 | 22,250 | ||||
| Horizon Bancorp Inc. | 1,050,994 | 21,913 | ||||
| * | Columbia Financial Inc. | 1,046,664 | 21,833 | |||
| TPG RE Finance Trust Inc. | 1,747,225 | 21,526 | ||||
| Central Pacific Financial Corp. | 762,219 | 21,472 | ||||
| WisdomTree Investments Inc. | 3,504,056 | 21,445 | ||||
| * | Ambac Financial Group Inc. | 1,317,492 | 21,146 | |||
| * | MBIA Inc. | 1,322,743 | 20,886 | |||
| Hanmi Financial Corp. | 867,122 | 20,533 | ||||
| * | SiriusPoint Ltd. | 2,525,100 | 20,529 | |||
| First Mid Bancshares Inc. | 477,568 | 20,435 | ||||
| * | Clearwater Analytics Holdings Inc. Class A | 883,787 | 20,309 | |||
| HarborOne Bancorp Inc. | 1,367,499 | 20,294 | ||||
| Flushing Financial Corp. | 829,044 | 20,146 | ||||
| KKR Real Estate Finance Trust Inc. | 951,886 | 19,828 | ||||
| Great Southern Bancorp Inc. | 332,068 | 19,675 | ||||
| HCI Group Inc. | 233,340 | 19,493 | ||||
| Republic Bancorp Inc. Class A | 383,393 | 19,492 | ||||
| Northfield Bancorp Inc. | 1,206,028 | 19,489 | ||||
| Heritage Commerce Corp. | 1,597,415 | 19,073 | ||||
| Community Trust Bancorp Inc. | 436,138 | 19,020 | ||||
| Camden National Corp. | 392,310 | 18,894 | ||||
| * | MoneyGram International Inc. | 2,359,261 | 18,615 | |||
| Hingham Institution For Savings | 43,253 | 18,161 | ||||
| * | CrossFirst Bankshares Inc. | 1,158,387 | 18,082 | |||
| Granite Point Mortgage Trust Inc. | 1,528,156 | 17,895 | ||||
| Byline Bancorp Inc. | 644,447 | 17,626 | ||||
| Cambridge Bancorp | 187,772 | 17,574 | ||||
| TrustCo Bank Corp. | 526,680 | 17,544 | ||||
| Shares | Market Value• ($000) | |||||
| Diamond Hill Investment Group Inc. | 87,521 | 16,999 | ||||
| Peapack-Gladstone Financial Corp. | 471,663 | 16,697 | ||||
| United Fire Group Inc. | 714,294 | 16,564 | ||||
| Farmers National Banc Corp. | 892,687 | 16,559 | ||||
| 1 | Dynex Capital Inc. | 985,744 | 16,472 | |||
| Bank of Marin Bancorp | 434,472 | 16,175 | ||||
| Victory Capital Holdings Inc. Class A | 440,974 | 16,109 | ||||
| 1 | Orchid Island Capital Inc. | 3,480,164 | 15,661 | |||
| Business First Bancshares Inc. | 549,061 | 15,544 | ||||
| * | eHealth Inc. | 600,680 | 15,317 | |||
| CBTX Inc. | 525,056 | 15,227 | ||||
| 1 | UWM Holdings Corp. Class A | 2,568,383 | 15,205 | |||
| Reliant Bancorp Inc. | 423,923 | 15,049 | ||||
| * | Atlantic Capital Bancshares Inc. | 515,287 | 14,825 | |||
| Equity Bancshares Inc. Class A | 432,117 | 14,662 | ||||
| Financial Institutions Inc. | 450,618 | 14,330 | ||||
| Independent Bank Corp. | 598,641 | 14,290 | ||||
| Mercantile Bank Corp. | 403,858 | 14,147 | ||||
| Midland States Bancorp Inc. | 564,694 | 13,999 | ||||
| * | AssetMark Financial Holdings Inc. | 533,665 | 13,987 | |||
| First Community Bankshares Inc. | 415,227 | 13,877 | ||||
| Metrocity Bankshares Inc. | 499,338 | 13,747 | ||||
| Bank First Corp. | 189,999 | 13,726 | ||||
| Universal Insurance Holdings Inc. | 798,817 | 13,580 | ||||
| Merchants Bancorp | 285,856 | 13,530 | ||||
| * | Blue Foundry Bancorp | 921,106 | 13,476 | |||
| * | Southern First Bancshares Inc. | 215,321 | 13,455 | |||
| First of Long Island Corp. | 622,402 | 13,438 | ||||
| Sculptor Capital Management Inc. Class A | 617,684 | 13,188 | ||||
| * | Franklin BSP Realty Trust Inc. | 878,283 | 13,122 | |||
| Shares | Market Value• ($000) | |||||
| Waterstone Financial Inc. | 600,218 | 13,121 | ||||
| * | Coastal Financial Corp. | 257,862 | 13,053 | |||
| HomeTrust Bancshares Inc. | 417,531 | 12,935 | ||||
| Mid Penn Bancorp Inc. | 407,174 | 12,924 | ||||
| * | Oportun Financial Corp. | 636,646 | 12,892 | |||
| Southern Missouri Bancorp Inc. | 243,725 | 12,715 | ||||
| First Financial Corp. | 280,502 | 12,704 | ||||
| Arrow Financial Corp. | 352,689 | 12,425 | ||||
| West Bancorp Inc. | 399,157 | 12,402 | ||||
| First Internet Bancorp | 263,312 | 12,386 | ||||
| 1st Source Corp. | 247,039 | 12,253 | ||||
| Regional Management Corp. | 211,580 | 12,157 | ||||
| CNB Financial Corp. | 455,730 | 12,077 | ||||
| Bar Harbor Bankshares | 412,183 | 11,924 | ||||
| * | Carter Bankshares Inc. | 742,589 | 11,428 | |||
| RBB Bancorp | 435,114 | 11,400 | ||||
| 1 | GCM Grosvenor Inc. Class A | 1,068,829 | 11,223 | |||
| National Western Life Group Inc. Class A | 52,273 | 11,209 | ||||
| American National Bankshares Inc. | 296,822 | 11,184 | ||||
| MVB Financial Corp. | 267,198 | 11,094 | ||||
| SmartFinancial Inc. | 401,450 | 10,984 | ||||
| 1 | Farmers & Merchants Bancorp Inc. | 333,453 | 10,947 | |||
| Enterprise Bancorp Inc. | 243,685 | 10,946 | ||||
| * | Bridgewater Bancshares Inc. | 610,919 | 10,807 | |||
| Citizens & Northern Corp. | 409,413 | 10,694 | ||||
| Spirit of Texas Bancshares Inc. | 371,555 | 10,693 | ||||
| Sierra Bancorp | 393,731 | 10,690 | ||||
| Shore Bancshares Inc. | 509,859 | 10,631 | ||||
| * | EZCORP Inc. Class A | 1,440,775 | 10,619 | |||
| First Bancorp Inc. | 327,356 | 10,279 | ||||
| Capstar Financial Holdings Inc. | 488,695 | 10,277 | ||||
| Primis Financial Corp. | 682,667 | 10,267 | ||||
| Alerus Financial Corp. | 348,804 | 10,213 | ||||
| Old Second Bancorp Inc. | 798,040 | 10,047 | ||||
| *,1 | Romeo Power Inc. | 2,747,187 | 10,027 | |||
| *,1 | Root Inc. Class A | 3,207,770 | 9,944 | |||
| Shares | Market Value• ($000) | |||||
| Oppenheimer Holdings Inc. Class A | 213,217 | 9,887 | ||||
| Civista Bancshares Inc. | 398,946 | 9,734 | ||||
| Capital City Bank Group Inc. | 359,714 | 9,496 | ||||
| Peoples Financial Services Corp. | 179,285 | 9,447 | ||||
| MidWestOne Financial Group Inc. | 286,575 | 9,276 | ||||
| Guaranty Bancshares Inc. | 245,483 | 9,225 | ||||
| Curo Group Holdings Corp. | 575,636 | 9,216 | ||||
| Summit Financial Group Inc. | 330,919 | 9,084 | ||||
| * | Howard Bancorp Inc. | 413,346 | 9,007 | |||
| Five Star Bancorp | 293,908 | 8,817 | ||||
| Home Bancorp Inc. | 205,685 | 8,538 | ||||
| 1 | Blue Ridge Bankshares Inc. | 456,364 | 8,169 | |||
| Tiptree Inc. Class A | 590,045 | 8,160 | ||||
| South Plains Financial Inc. | 292,506 | 8,135 | ||||
| * | Ocwen Financial Corp. | 201,053 | 8,036 | |||
| * | Citizens Inc. Class A | 1,512,237 | 8,030 | |||
| AFC Gamma Inc. | 351,716 | 8,005 | ||||
| Provident Bancorp Inc. | 429,658 | 7,992 | ||||
| Great Ajax Corp. | 606,670 | 7,984 | ||||
| * | P10 Inc. Class A | 568,705 | 7,950 | |||
| Orrstown Financial Services Inc. | 307,627 | 7,752 | ||||
| Northrim Bancorp Inc. | 176,916 | 7,689 | ||||
| Red River Bancshares Inc. | 141,840 | 7,588 | ||||
| PCSB Financial Corp. | 391,041 | 7,445 | ||||
| Investors Title Co. | 37,598 | 7,412 | ||||
| FS Bancorp Inc. | 219,893 | 7,395 | ||||
| First Bank | 503,770 | 7,310 | ||||
| Northeast Bank | 203,338 | 7,265 | ||||
| ACNB Corp. | 230,161 | 7,199 | ||||
| Independence Holding Co. | 125,453 | 7,111 | ||||
| Marlin Business Services Corp. | 304,596 | 7,091 | ||||
| 1 | PCB Bancorp | 317,360 | 6,969 | |||
| Macatawa Bank Corp. | 784,729 | 6,921 | ||||
| * | GoHealth Inc. Class A | 1,801,058 | 6,826 | |||
| 1st Constitution Bancorp | 263,385 | 6,766 | ||||
| Amalgamated Financial Corp. | 399,627 | 6,702 | ||||
| Shares | Market Value• ($000) | |||||
| First Business Financial Services Inc. | 228,040 | 6,652 | ||||
| BCB Bancorp Inc. | 430,285 | 6,639 | ||||
| LCNB Corp. | 335,339 | 6,549 | ||||
| Meridian Corp. | 177,937 | 6,543 | ||||
| 1 | Fidelity D&D Bancorp Inc. | 110,302 | 6,508 | |||
| Bankwell Financial Group Inc. | 195,386 | 6,416 | ||||
| * | Professional Holding Corp. Class A | 330,335 | 6,329 | |||
| AG Mortgage Investment Trust Inc. | 615,108 | 6,305 | ||||
| National Bankshares Inc. | 173,594 | 6,295 | ||||
| Capital Bancorp Inc. | 238,721 | 6,254 | ||||
| Parke Bancorp Inc. | 290,867 | 6,190 | ||||
| HBT Financial Inc. | 330,067 | 6,182 | ||||
| Donegal Group Inc. Class A | 429,838 | 6,142 | ||||
| Community Financial Corp. | 155,233 | 6,102 | ||||
| Timberland Bancorp Inc. | 219,929 | 6,092 | ||||
| * | FVCBankcorp Inc. | 305,180 | 6,046 | |||
| Richmond Mutual Bancorp Inc. | 362,105 | 5,834 | ||||
| Central Valley Community Bancorp | 277,797 | 5,770 | ||||
| * | Esquire Financial Holdings Inc. | 181,815 | 5,749 | |||
| Territorial Bancorp Inc. | 226,146 | 5,710 | ||||
| Codorus Valley Bancorp Inc. | 262,970 | 5,680 | ||||
| Unity Bancorp Inc. | 216,027 | 5,671 | ||||
| OP Bancorp | 444,270 | 5,669 | ||||
| Ames National Corp. | 229,764 | 5,627 | ||||
| * | Maiden Holdings Ltd. | 1,833,912 | 5,612 | |||
| Crawford & Co. Class B | 746,601 | 5,592 | ||||
| Level One Bancorp Inc. | 139,890 | 5,517 | ||||
| * | BayCom Corp. | 288,027 | 5,403 | |||
| Greenhill & Co. Inc. | 299,465 | 5,369 | ||||
| Evans Bancorp Inc. | 133,161 | 5,366 | ||||
| Colony Bankcorp Inc. | 311,012 | 5,309 | ||||
| * | Consumer Portfolio Services Inc. | 445,159 | 5,275 | |||
| *,1 | Hagerty Inc. Class A | 363,800 | 5,159 | |||
| * | MainStreet Bancshares Inc. | 208,509 | 5,127 | |||
| Norwood Financial Corp. | 197,002 | 5,120 | ||||
| Shares | Market Value• ($000) | |||||
| ChoiceOne Financial Services Inc. | 192,470 | 5,099 | ||||
| * | MetroMile Inc. | 2,327,223 | 5,097 | |||
| C&F Financial Corp. | 99,227 | 5,079 | ||||
| * | NI Holdings Inc. | 266,088 | 5,032 | |||
| * | Greenlight Capital Re Ltd. Class A | 636,481 | 4,990 | |||
| * | First Western Financial Inc. | 163,419 | 4,961 | |||
| Sachem Capital Corp. | 847,514 | 4,949 | ||||
| Investar Holding Corp. | 262,066 | 4,825 | ||||
| Western New England Bancorp Inc. | 541,360 | 4,742 | ||||
| *,1 | Sunlight Financial Holdings Inc. | 984,228 | 4,705 | |||
| Bank of Princeton | 159,711 | 4,684 | ||||
| Pzena Investment Management Inc. Class A | 493,761 | 4,676 | ||||
| Riverview Bancorp Inc. | 608,040 | 4,676 | ||||
| * | Doma Holdings Inc. | 918,684 | 4,667 | |||
| * | Republic First Bancorp Inc. | 1,250,257 | 4,651 | |||
| William Penn Bancorp | 375,356 | 4,534 | ||||
| Virginia National Bankshares Corp. | 122,415 | 4,529 | ||||
| Plumas Bancorp | 133,540 | 4,512 | ||||
| Chemung Financial Corp. | 98,140 | 4,493 | ||||
| * | Trean Insurance Group Inc. | 501,844 | 4,471 | |||
| ESSA Bancorp Inc. | 253,876 | 4,400 | ||||
| First Savings Financial Group Inc. | 165,222 | 4,362 | ||||
| * | Pioneer Bancorp Inc. | 382,436 | 4,329 | |||
| Penns Woods Bancorp Inc. | 183,161 | 4,317 | ||||
| Silvercrest Asset Management Group Inc. Class A | 247,747 | 4,254 | ||||
| FNCB Bancorp Inc. | 465,590 | 4,242 | ||||
| Eagle Bancorp Montana Inc. | 184,128 | 4,231 | ||||
| First Northwest Bancorp | 209,090 | 4,230 | ||||
| 1 | Federal Agricultural Mortgage Corp. Class A | 35,555 | 4,221 | |||
| 1 | Cherry Hill Mortgage Investment Corp. | 510,083 | 4,218 | |||
| Luther Burbank Corp. | 294,907 | 4,140 | ||||
| Heritage Insurance Holdings Inc. | 698,957 | 4,110 | ||||
| Shares | Market Value• ($000) | |||||
| First Community Corp. | 186,158 | 3,865 | ||||
| Franklin Financial Services Corp. | 117,076 | 3,863 | ||||
| * | California Bancorp | 192,397 | 3,856 | |||
| 1 | First National Corp. | 167,836 | 3,835 | |||
| Hawthorn Bancshares Inc. | 147,849 | 3,819 | ||||
| First Capital Inc. | 95,554 | 3,817 | ||||
| * | Medallion Financial Corp. | 650,658 | 3,774 | |||
| Westwood Holdings Group Inc. | 222,721 | 3,773 | ||||
| First Financial Northwest Inc. | 223,305 | 3,611 | ||||
| Citizens Community Bancorp Inc. | 260,601 | 3,588 | ||||
| SB Financial Group Inc. | 183,208 | 3,567 | ||||
| First United Corp. | 188,149 | 3,550 | ||||
| 1 | Angel Oak Mortgage Inc. | 216,030 | 3,539 | |||
| Manning & Napier Inc. Class A | 421,693 | 3,504 | ||||
| Nexpoint Real Estate Finance Inc. | 177,897 | 3,425 | ||||
| * | Arlington Asset Investment Corp. Class A | 964,778 | 3,377 | |||
| Western Asset Mortgage Capital Corp. | 1,575,362 | 3,324 | ||||
| BankFinancial Corp. | 308,169 | 3,288 | ||||
| Seven Hills Realty Trust | 315,585 | 3,276 | ||||
| *,1 | MarketWise Inc. | 433,550 | 3,269 | |||
| Greene County Bancorp Inc. | 88,584 | 3,255 | ||||
| * | HMN Financial Inc. | 133,193 | 3,247 | |||
| CB Financial Services Inc. | 132,867 | 3,202 | ||||
| 1 | Ellington Residential Mortgage REIT | 304,308 | 3,162 | |||
| First Guaranty Bancshares Inc. | 155,128 | 3,162 | ||||
| * | Malvern Bancorp Inc. | 201,577 | 3,159 | |||
| Peoples Bancorp of North Carolina Inc. | 113,193 | 3,123 | ||||
| * | Velocity Financial Inc. | 225,504 | 3,089 | |||
| Salisbury Bancorp Inc. | 58,032 | 3,069 | ||||
| * | ACRES Commercial Realty Corp. | 245,355 | 3,060 | |||
| *,1 | Bakkt Holdings Inc. | 356,200 | 3,031 | |||
| GAMCO Investors Inc. Class A | 121,104 | 3,025 | ||||
| 1 | Partners Bancorp | 305,021 | 2,983 | |||
| Shares | Market Value• ($000) | |||||
| Provident Financial Holdings Inc. | 178,916 | 2,961 | ||||
| *,1 | BM Technologies Inc. | 313,589 | 2,888 | |||
| * | PDL Community Bancorp | 196,447 | 2,876 | |||
| *,1 | Finance of America Cos. Inc. Class A | 716,866 | 2,846 | |||
| * | Hippo Holdings Inc. | 1,005,399 | 2,845 | |||
| Ohio Valley Banc Corp. | 97,749 | 2,840 | ||||
| Lument Finance Trust Inc. | 736,731 | 2,829 | ||||
| Guild Holdings Co. Class A | 200,200 | 2,809 | ||||
| Middlefield Banc Corp. | 111,453 | 2,766 | ||||
| Summit State Bank | 181,958 | 2,742 | ||||
| * | Safeguard Scientifics Inc. | 370,901 | 2,726 | |||
| United Insurance Holdings Corp. | 605,363 | 2,627 | ||||
| United Security Bancshares | 322,421 | 2,618 | ||||
| loanDepot Inc. Class A | 538,648 | 2,586 | ||||
| * | Security National Financial Corp. Class A | 279,866 | 2,575 | |||
| * | SWK Holdings Corp. | 128,875 | 2,530 | |||
| Bank7 Corp. | 109,773 | 2,525 | ||||
| Landmark Bancorp Inc. | 88,296 | 2,516 | ||||
| 1 | Union Bankshares Inc. | 85,053 | 2,472 | |||
| Oak Valley Bancorp | 141,787 | 2,467 | ||||
| * | Elevate Credit Inc. | 793,543 | 2,357 | |||
| Prudential Bancorp Inc. | 169,608 | 2,303 | ||||
| * | Sterling Bancorp Inc. | 370,819 | 2,132 | |||
| IF Bancorp Inc. | 85,645 | 2,127 | ||||
| Associated Capital Group Inc. Class A | 48,920 | 2,104 | ||||
| Northeast Community Bancorp Inc. | 188,155 | 2,094 | ||||
| * | Hallmark Financial Services Inc. | 480,443 | 2,090 | |||
| * | Broadway Financial Corp. | 896,664 | 2,071 | |||
| * | Catalyst Bancorp Inc. | 151,200 | 2,067 | |||
| * | TC Bancshares Inc. | 151,263 | 2,025 | |||
| Randolph Bancorp Inc. | 84,355 | 2,014 | ||||
| * | Heritage Global Inc. | 1,010,347 | 1,879 | |||
| Auburn National Bancorp Inc. | 59,246 | 1,878 | ||||
| * | Nicholas Financial Inc. | 155,984 | 1,839 | |||
| Shares | Market Value• ($000) | |||||
| 1 | Citizens Holding Co. | 97,134 | 1,821 | |||
| 1 | US Global Investors Inc. Class A | 413,658 | 1,820 | |||
| 1 | Cullman Bancorp Inc. | 141,227 | 1,761 | |||
| Sound Financial Bancorp Inc. | 39,057 | 1,718 | ||||
| * | Kingsway Financial Services Inc. | 311,150 | 1,705 | |||
| CF Bankshares Inc. | 74,586 | 1,556 | ||||
| *,1 | OppFi Inc. | 342,288 | 1,554 | |||
| Bank of South Carolina Corp. | 74,261 | 1,498 | ||||
| 1 | Hennessy Advisors Inc. | 136,198 | 1,479 | |||
| * | Great Elm Group Inc. | 700,231 | 1,463 | |||
| * | Limestone Bancorp Inc. | 77,944 | 1,454 | |||
| Elmira Savings Bank | 61,402 | 1,404 | ||||
| Manhattan Bridge Capital Inc. | 253,648 | 1,395 | ||||
| * | LM Funding America Inc. | 286,075 | 1,390 | |||
| * | Midwest Holding Inc. | 79,299 | 1,380 | |||
| * | Bogota Financial Corp. | 133,526 | 1,359 | |||
| AmeriServ Financial Inc. | 345,360 | 1,333 | ||||
| * | USCB Financial Holdings Inc. | 90,208 | 1,301 | |||
| United Bancshares Inc. | 36,068 | 1,100 | ||||
| *,1 | Reliance Global Group Inc. | 159,588 | 1,028 | |||
| * | Rhinebeck Bancorp Inc. | 95,620 | 1,022 | |||
| Kingstone Cos. Inc. | 202,353 | 1,012 | ||||
| First US Bancshares Inc. | 91,843 | 972 | ||||
| * | Ashford Inc. | 56,551 | 942 | |||
| Southern States Bancshares Inc. | 44,692 | 879 | ||||
| Community West Bancshares | 61,904 | 823 | ||||
| Emclaire Financial Corp. | 28,051 | 811 | ||||
| Generations Bancorp NY Inc. | 67,225 | 801 | ||||
| * | FFBW Inc. | 66,391 | 779 | |||
| * | Oxbridge Re Holdings Ltd. | 132,133 | 743 | |||
| *,1 | Patriot National Bancorp Inc. | 47,078 | 732 | |||
| * | Carver Bancorp Inc. | 85,301 | 728 | |||
| * | FedNat Holding Co. | 439,008 | 619 | |||
| *,1 | Biorestorative Therapies Inc. | 138,454 | 591 | |||
| *,1 | SurgePays Inc. | 290,433 | 587 | |||
| Shares | Market Value• ($000) | |||||
| * | Affinity Bancshares Inc. | 35,206 | 542 | |||
| Mid-Southern Bancorp Inc. | 29,996 | 450 | ||||
| * | NeuroOne Medical Technologies Corp. | 209,321 | 406 | |||
| Lake Shore Bancorp Inc. | 25,679 | 387 | ||||
| Pathfinder Bancorp Inc. | 22,868 | 387 | ||||
| * | HV Bancorp Inc. | 14,687 | 326 | |||
| Old Point Financial Corp. | 12,849 | 293 | ||||
| Oconee Federal Financial Corp. | 13,031 | 284 | ||||
| *,2 | Altisource Asset Management Corp. | 15,386 | 275 | |||
| * | Impac Mortgage Holdings Inc. | 244,016 | 271 | |||
| *,1,2 | Contran Corp. CVR | 204,224 | 196 | |||
| * | OptimumBank Holdings Inc. | 48,881 | 194 | |||
| 1895 Bancorp of Wisconsin Inc. | 15,643 | 171 | ||||
| * | Finwise Bancorp | 12,287 | 169 | |||
| Kentucky First Federal Bancorp | 21,331 | 160 | ||||
| * | FG Financial Group Inc. | 34,257 | 127 | |||
| * | PB Bankshares Inc. | 8,966 | 122 | |||
| Atlantic American Corp. | 36,081 | 88 | ||||
| * | First Seacoast Bancorp | 6,207 | 66 | |||
| Village Bank & Trust Financial Corp. | 1,124 | 64 | ||||
| * | Vericity Inc. | 1,036 | 7 | |||
| * | Cincinnati Bancorp Inc. | 400 | 6 | |||
| *,2 | Frontier Financial Corp. | 1 | — | |||
| *,1,2 | Cogent Biosciences Inc. CVR | 400,874 | — | |||
| 148,961,770 | ||||||
| Health Care (12.7%) | ||||||
| UnitedHealth Group Inc. | 26,768,259 | 13,441,414 | ||||
| Johnson & Johnson | 74,819,509 | 12,799,373 | ||||
| Pfizer Inc. | 159,524,035 | 9,419,894 | ||||
| Thermo Fisher Scientific Inc. | 11,199,012 | 7,472,429 | ||||
| Abbott Laboratories | 50,255,433 | 7,072,950 | ||||
| AbbVie Inc. | 50,244,447 | 6,803,098 | ||||
| Eli Lilly & Co. | 24,468,610 | 6,758,719 | ||||
| Danaher Corp. | 18,278,949 | 6,013,957 | ||||
| Merck & Co. Inc. | 71,790,103 | 5,501,993 | ||||
| Shares | Market Value• ($000) | |||||
| Medtronic plc | 38,220,866 | 3,953,949 | ||||
| Bristol-Myers Squibb Co. | 63,083,990 | 3,933,287 | ||||
| * | Intuitive Surgical Inc. | 10,152,895 | 3,647,935 | |||
| Amgen Inc. | 16,008,641 | 3,601,464 | ||||
| Zoetis Inc. | 13,446,588 | 3,281,371 | ||||
| Anthem Inc. | 6,898,478 | 3,197,720 | ||||
| Gilead Sciences Inc. | 35,651,267 | 2,588,638 | ||||
| Stryker Corp. | 9,648,803 | 2,580,283 | ||||
| * | Moderna Inc. | 9,794,908 | 2,487,711 | |||
| * | Edwards Lifesciences Corp. | 17,744,202 | 2,298,761 | |||
| Cigna Corp. | 9,419,683 | 2,163,042 | ||||
| Becton Dickinson & Co. | 8,071,982 | 2,029,942 | ||||
| * | Regeneron Pharmaceuticals Inc. | 2,854,570 | 1,802,718 | |||
| * | Boston Scientific Corp. | 40,504,440 | 1,720,629 | |||
| HCA Healthcare Inc. | 6,630,009 | 1,703,382 | ||||
| Humana Inc. | 3,652,714 | 1,694,348 | ||||
| * | Illumina Inc. | 4,442,272 | 1,690,018 | |||
| * | Vertex Pharmaceuticals Inc. | 7,226,375 | 1,586,912 | |||
| * | IDEXX Laboratories Inc. | 2,409,891 | 1,586,817 | |||
| * | IQVIA Holdings Inc. | 5,429,446 | 1,531,864 | |||
| * | Dexcom Inc. | 2,754,702 | 1,479,137 | |||
| * | Align Technology Inc. | 2,129,039 | 1,399,162 | |||
| Agilent Technologies Inc. | 8,582,701 | 1,370,228 | ||||
| * | Centene Corp. | 16,580,507 | 1,366,234 | |||
| Baxter International Inc. | 14,225,159 | 1,221,088 | ||||
| ResMed Inc. | 4,141,480 | 1,078,773 | ||||
| * | Veeva Systems Inc. Class A | 3,940,625 | 1,006,751 | |||
| * | Biogen Inc. | 4,175,182 | 1,001,710 | |||
| West Pharmaceutical Services Inc. | 2,106,040 | 987,754 | ||||
| * | Laboratory Corp. of America Holdings | 2,720,118 | 854,688 | |||
| Cerner Corp. | 8,361,825 | 776,563 | ||||
| Zimmer Biomet Holdings Inc. | 5,936,467 | 754,169 | ||||
| PerkinElmer Inc. | 3,586,790 | 721,160 | ||||
| * | Horizon Therapeutics plc | 6,446,904 | 694,718 | |||
| STERIS plc | 2,842,718 | 691,946 | ||||
| * | Catalent Inc. | 4,865,719 | 622,958 | |||
| * | Avantor Inc. | 14,723,330 | 620,441 | |||
| Quest Diagnostics Inc. | 3,486,815 | 603,254 | ||||
| * | Seagen Inc. | 3,898,257 | 602,671 | |||
| Cooper Cos. Inc. | 1,401,141 | 586,994 | ||||
| Bio-Techne Corp. | 1,116,839 | 577,785 | ||||
| Shares | Market Value• ($000) | |||||
| * | Alnylam Pharmaceuticals Inc. | 3,399,367 | 576,465 | |||
| * | Hologic Inc. | 7,145,088 | 547,028 | |||
| * | Charles River Laboratories International Inc. | 1,433,990 | 540,299 | |||
| * | Molina Healthcare Inc. | 1,660,183 | 528,071 | |||
| * | Insulet Corp. | 1,959,851 | 521,458 | |||
| Viatris Inc. | 34,371,955 | 465,053 | ||||
| * | BioMarin Pharmaceutical Inc. | 5,215,202 | 460,763 | |||
| * | Bio-Rad Laboratories Inc. Class A | 599,873 | 453,246 | |||
| * | ABIOMED Inc. | 1,228,522 | 441,248 | |||
| Teleflex Inc. | 1,331,492 | 437,368 | ||||
| * | Masimo Corp. | 1,411,792 | 413,344 | |||
| Cardinal Health Inc. | 8,009,929 | 412,431 | ||||
| * | Repligen Corp. | 1,492,969 | 395,398 | |||
| * | Incyte Corp. | 5,333,840 | 391,504 | |||
| * | Exact Sciences Corp. | 4,902,670 | 381,575 | |||
| * | Teladoc Health Inc. | 4,095,311 | 376,031 | |||
| Royalty Pharma plc Class A | 9,156,554 | 364,889 | ||||
| * | Elanco Animal Health Inc. | 12,763,516 | 362,229 | |||
| * | 10X Genomics Inc. Class A | 2,342,973 | 349,009 | |||
| DENTSPLY SIRONA Inc. | 6,212,630 | 346,603 | ||||
| *,1 | Novavax Inc. | 2,148,956 | 307,451 | |||
| * | Henry Schein Inc. | 3,942,001 | 305,623 | |||
| * | Syneos Health Inc. | 2,947,171 | 302,616 | |||
| * | Penumbra Inc. | 1,008,835 | 289,858 | |||
| * | United Therapeutics Corp. | 1,279,182 | 276,406 | |||
| * | Guardant Health Inc. | 2,743,948 | 274,450 | |||
| * | Tandem Diabetes Care Inc. | 1,806,113 | 271,856 | |||
| Universal Health Services Inc. Class B | 1,974,970 | 256,075 | ||||
| * | Tenet Healthcare Corp. | 3,044,017 | 248,666 | |||
| Bruker Corp. | 2,802,014 | 235,117 | ||||
| Chemed Corp. | 437,696 | 231,559 | ||||
| * | Neurocrine Biosciences Inc. | 2,696,301 | 229,644 | |||
| * | Natera Inc. | 2,420,309 | 226,033 | |||
| * | Omnicell Inc. | 1,248,903 | 225,352 | |||
| * | Intellia Therapeutics Inc. | 1,903,875 | 225,114 | |||
| Organon & Co. | 7,206,723 | 219,445 | ||||
| * | Sarepta Therapeutics Inc. | 2,352,043 | 211,801 | |||
| Shares | Market Value• ($000) | |||||
| * | Jazz Pharmaceuticals plc | 1,660,120 | 211,499 | |||
| * | Mirati Therapeutics Inc. | 1,411,972 | 207,122 | |||
| * | Envista Holdings Corp. | 4,581,866 | 206,459 | |||
| * | DaVita Inc. | 1,738,349 | 197,755 | |||
| * | Novocure Ltd. | 2,511,869 | 188,591 | |||
| * | Arrowhead Pharmaceuticals Inc. | 2,822,433 | 187,127 | |||
| Encompass Health Corp. | 2,829,082 | 184,626 | ||||
| * | Blueprint Medicines Corp. | 1,675,544 | 179,468 | |||
| * | Medpace Holdings Inc. | 817,389 | 177,897 | |||
| * | Shockwave Medical Inc. | 953,732 | 170,079 | |||
| * | Inspire Medical Systems Inc. | 737,273 | 169,617 | |||
| * | Exelixis Inc. | 8,985,133 | 164,248 | |||
| * | Globus Medical Inc. Class A | 2,246,780 | 162,218 | |||
| * | Arena Pharmaceuticals Inc. | 1,744,074 | 162,094 | |||
| * | Halozyme Therapeutics Inc. | 4,002,223 | 160,929 | |||
| * | Acadia Healthcare Co. Inc. | 2,557,583 | 155,245 | |||
| * | Ultragenyx Pharmaceutical Inc. | 1,840,757 | 154,789 | |||
| * | Amedisys Inc. | 927,003 | 150,063 | |||
| Perrigo Co. plc | 3,803,940 | 147,973 | ||||
| * | Neogen Corp. | 3,064,508 | 139,159 | |||
| * | Integra LifeSciences Holdings Corp. | 2,046,589 | 137,101 | |||
| * | agilon health Inc. | 5,036,543 | 135,987 | |||
| * | ICU Medical Inc. | 572,034 | 135,767 | |||
| * | Quidel Corp. | 1,004,871 | 135,648 | |||
| Premier Inc. Class A | 3,292,523 | 135,553 | ||||
| * | Fate Therapeutics Inc. | 2,308,055 | 135,044 | |||
| * | Maravai LifeSciences Holdings Inc. Class A | 3,176,722 | 133,105 | |||
| Ensign Group Inc. | 1,488,761 | 124,996 | ||||
| * | STAAR Surgical Co. | 1,353,927 | 123,614 | |||
| * | Pacific Biosciences of California Inc. | 5,957,447 | 121,889 | |||
| CONMED Corp. | 832,025 | 117,948 | ||||
| * | LHC Group Inc. | 855,811 | 117,443 | |||
| * | Option Care Health Inc. | 4,092,536 | 116,392 | |||
| * | Beam Therapeutics Inc. | 1,452,853 | 115,778 | |||
| * | NeoGenomics Inc. | 3,333,311 | 113,733 | |||
| * | Apellis Pharmaceuticals Inc. | 2,351,153 | 111,163 | |||
| Shares | Market Value• ($000) | |||||
| * | Intra-Cellular Therapies Inc. | 2,085,681 | 109,165 | |||
| * | Denali Therapeutics Inc. | 2,430,567 | 108,403 | |||
| * | Alkermes plc | 4,608,352 | 107,190 | |||
| * | HealthEquity Inc. | 2,383,726 | 105,456 | |||
| * | Ionis Pharmaceuticals Inc. | 3,414,345 | 103,899 | |||
| * | Cytokinetics Inc. | 2,269,512 | 103,444 | |||
| * | Oak Street Health Inc. | 3,073,379 | 101,852 | |||
| * | Adaptive Biotechnologies Corp. | 3,609,655 | 101,287 | |||
| * | R1 RCM Inc. | 3,938,522 | 100,393 | |||
| * | Arvinas Inc. | 1,203,052 | 98,819 | |||
| * | Twist Bioscience Corp. | 1,270,246 | 98,304 | |||
| * | Progyny Inc. | 1,930,234 | 97,187 | |||
| * | Merit Medical Systems Inc. | 1,521,467 | 94,787 | |||
| * | iRhythm Technologies Inc. | 797,916 | 93,907 | |||
| * | Vir Biotechnology Inc. | 2,236,431 | 93,639 | |||
| * | Invitae Corp. | 6,115,832 | 93,389 | |||
| * | Insmed Inc. | 3,366,988 | 91,717 | |||
| * | Amicus Therapeutics Inc. | 7,927,222 | 91,559 | |||
| Select Medical Holdings Corp. | 3,052,965 | 89,757 | ||||
| Owens & Minor Inc. | 2,043,366 | 88,886 | ||||
| * | AtriCure Inc. | 1,244,382 | 86,522 | |||
| * | Prestige Consumer Healthcare Inc. | 1,425,649 | 86,466 | |||
| * | Inari Medical Inc. | 927,613 | 84,663 | |||
| * | Veracyte Inc. | 2,025,188 | 83,438 | |||
| * | Karuna Therapeutics Inc. | 632,472 | 82,854 | |||
| * | Certara Inc. | 2,914,923 | 82,842 | |||
| * | Zentalis Pharmaceuticals Inc. | 966,857 | 81,274 | |||
| *,1 | Warby Parker Inc. Class A | 1,739,487 | 80,991 | |||
| * | Integer Holdings Corp. | 939,613 | 80,421 | |||
| * | ACADIA Pharmaceuticals Inc. | 3,430,223 | 80,061 | |||
| * | PTC Therapeutics Inc. | 2,009,126 | 80,023 | |||
| * | Haemonetics Corp. | 1,453,213 | 77,078 | |||
| * | NuVasive Inc. | 1,466,506 | 76,962 | |||
| * | 1Life Healthcare Inc. | 4,343,665 | 76,318 | |||
| * | Nevro Corp. | 939,258 | 76,146 | |||
| *,1 | Apollo Medical Holdings Inc. | 1,029,745 | 75,666 | |||
| * | Kodiak Sciences Inc. | 883,572 | 74,909 | |||
| Patterson Cos. Inc. | 2,491,598 | 73,128 | ||||
| Shares | Market Value• ($000) | |||||
| * | Iovance Biotherapeutics Inc. | 3,795,805 | 72,462 | |||
| * | Pacira BioSciences Inc. | 1,203,762 | 72,430 | |||
| * | Ortho Clinical Diagnostics Holdings plc | 3,365,328 | 71,984 | |||
| * | BioCryst Pharmaceuticals Inc. | 5,110,953 | 70,787 | |||
| * | Nektar Therapeutics | 5,234,921 | 70,724 | |||
| * | Ligand Pharmaceuticals Inc. | 451,729 | 69,774 | |||
| * | TG Therapeutics Inc. | 3,650,851 | 69,366 | |||
| * | CareDx Inc. | 1,493,017 | 67,902 | |||
| *,1 | GoodRx Holdings Inc. Class A | 2,065,809 | 67,511 | |||
| * | Xencor Inc. | 1,666,026 | 66,841 | |||
| * | Sotera Health Co. | 2,818,547 | 66,377 | |||
| *,1 | Doximity Inc. Class A | 1,314,487 | 65,895 | |||
| * | Magellan Health Inc. | 669,987 | 63,642 | |||
| * | MEDNAX Inc. | 2,338,065 | 63,619 | |||
| * | Evolent Health Inc. Class A | 2,285,839 | 63,249 | |||
| * | Surgery Partners Inc. | 1,142,352 | 61,013 | |||
| * | Sage Therapeutics Inc. | 1,424,394 | 60,594 | |||
| * | Emergent BioSolutions Inc. | 1,375,829 | 59,807 | |||
| * | Myriad Genetics Inc. | 2,159,798 | 59,610 | |||
| * | Axonics Inc. | 1,054,121 | 59,031 | |||
| * | Outset Medical Inc. | 1,271,081 | 58,584 | |||
| * | ChemoCentryx Inc. | 1,591,997 | 57,965 | |||
| * | CorVel Corp. | 277,154 | 57,648 | |||
| * | Arcus Biosciences Inc. | 1,398,867 | 56,612 | |||
| * | Relay Therapeutics Inc. | 1,843,411 | 56,611 | |||
| * | SpringWorks Therapeutics Inc. | 910,187 | 56,413 | |||
| * | Glaukos Corp. | 1,260,158 | 56,001 | |||
| * | Kymera Therapeutics Inc. | 875,821 | 55,606 | |||
| *,1 | Fulgent Genetics Inc. | 550,823 | 55,407 | |||
| * | NanoString Technologies Inc. | 1,299,621 | 54,883 | |||
| * | Codexis Inc. | 1,750,892 | 54,750 | |||
| * | Phreesia Inc. | 1,310,009 | 54,575 | |||
| * | IVERIC bio Inc. | 3,257,842 | 54,471 | |||
| * | Travere Therapeutics Inc. | 1,740,106 | 54,013 | |||
| * | Turning Point Therapeutics Inc. | 1,126,183 | 53,719 | |||
| * | Global Blood Therapeutics Inc. | 1,831,287 | 53,602 | |||
| *,1 | Corcept Therapeutics Inc. | 2,701,452 | 53,489 | |||
| * | ModivCare Inc. | 358,575 | 53,173 | |||
| Shares | Market Value• ($000) | |||||
| * | Heska Corp. | 290,734 | 53,056 | |||
| * | Lantheus Holdings Inc. | 1,818,068 | 52,524 | |||
| * | Vericel Corp. | 1,328,158 | 52,197 | |||
| * | Editas Medicine Inc. | 1,946,698 | 51,685 | |||
| * | Celldex Therapeutics Inc. | 1,328,884 | 51,348 | |||
| *,1 | OPKO Health Inc. | 10,656,268 | 51,257 | |||
| * | Avid Bioservices Inc. | 1,743,331 | 50,870 | |||
| * | Agios Pharmaceuticals Inc. | 1,547,236 | 50,858 | |||
| * | AdaptHealth Corp. Class A | 2,065,568 | 50,524 | |||
| * | REVOLUTION Medicines Inc. | 1,995,057 | 50,216 | |||
| * | Health Catalyst Inc. | 1,257,138 | 49,808 | |||
| *,1 | Bridgebio Pharma Inc. | 2,928,886 | 48,854 | |||
| * | Avanos Medical Inc. | 1,370,836 | 47,527 | |||
| * | Cerevel Therapeutics Holdings Inc. | 1,464,021 | 47,464 | |||
| * | Community Health Systems Inc. | 3,550,509 | 47,257 | |||
| *,1 | Cassava Sciences Inc. | 1,075,531 | 47,001 | |||
| * | Ironwood Pharmaceuticals Inc. Class A | 3,940,451 | 45,946 | |||
| * | Dynavax Technologies Corp. | 3,237,203 | 45,547 | |||
| * | ImmunoGen Inc. | 6,076,817 | 45,090 | |||
| *,1 | Multiplan Corp. | 9,973,519 | 44,183 | |||
| * | Addus HomeCare Corp. | 453,076 | 42,367 | |||
| *,1 | Ginkgo Bioworks Holdings Inc. | 5,065,389 | 42,093 | |||
| * | BioLife Solutions Inc. | 1,124,220 | 41,900 | |||
| * | Supernus Pharmaceuticals Inc. | 1,434,233 | 41,822 | |||
| * | Protagonist Therapeutics Inc. | 1,209,862 | 41,377 | |||
| * | Accolade Inc. | 1,517,821 | 40,010 | |||
| * | Quanterix Corp. | 938,819 | 39,806 | |||
| * | Krystal Biotech Inc. | 564,988 | 39,521 | |||
| * | RadNet Inc. | 1,295,210 | 38,999 | |||
| * | Enanta Pharmaceuticals Inc. | 520,311 | 38,909 | |||
| *,1 | Sorrento Therapeutics Inc. | 8,297,730 | 38,584 | |||
| * | Silk Road Medical Inc. | 892,722 | 38,039 | |||
| * | C4 Therapeutics Inc. | 1,174,714 | 37,826 | |||
| Healthcare Services Group Inc. | 2,119,214 | 37,701 | ||||
| * | Atara Biotherapeutics Inc. | 2,388,794 | 37,647 | |||
| * | Sana Biotechnology Inc. | 2,400,453 | 37,159 | |||
| Shares | Market Value• ($000) | |||||
| *,1 | Anavex Life Sciences Corp. | 2,059,527 | 35,712 | |||
| * | Varex Imaging Corp. | 1,122,895 | 35,427 | |||
| US Physical Therapy Inc. | 368,295 | 35,191 | ||||
| *,1 | Recursion Pharmaceuticals Inc. Class A | 2,039,616 | 34,939 | |||
| * | REGENXBIO Inc. | 1,026,682 | 33,572 | |||
| * | Alector Inc. | 1,616,312 | 33,377 | |||
| * | FibroGen Inc. | 2,361,024 | 33,290 | |||
| * | Coherus Biosciences Inc. | 2,074,055 | 33,102 | |||
| * | Nurix Therapeutics Inc. | 1,138,158 | 32,950 | |||
| * | Prometheus Biosciences Inc. | 829,736 | 32,808 | |||
| * | Crinetics Pharmaceuticals Inc. | 1,145,049 | 32,531 | |||
| * | Cano Health Inc. | 3,591,651 | 32,002 | |||
| * | Harmony Biosciences Holdings Inc. | 747,810 | 31,887 | |||
| * | Tivity Health Inc. | 1,205,505 | 31,874 | |||
| * | Revance Therapeutics Inc. | 1,951,068 | 31,841 | |||
| * | Cerus Corp. | 4,614,621 | 31,426 | |||
| *,1 | Seer Inc. Class A | 1,377,013 | 31,410 | |||
| *,1 | Clover Health Investments Corp. Class A | 8,424,736 | 31,340 | |||
| * | Privia Health Group Inc. | 1,208,353 | 31,260 | |||
| * | American Well Corp. Class A | 5,173,369 | 31,247 | |||
| * | Innoviva Inc. | 1,780,193 | 30,708 | |||
| * | Inhibrx Inc. | 700,947 | 30,610 | |||
| *,1 | Senseonics Holdings Inc. | 11,403,178 | 30,446 | |||
| * | Axsome Therapeutics Inc. | 801,063 | 30,264 | |||
| * | Allogene Therapeutics Inc. | 2,017,623 | 30,103 | |||
| *,1 | Inovio Pharmaceuticals Inc. | 6,018,028 | 30,030 | |||
| * | Alignment Healthcare Inc. | 2,121,699 | 29,831 | |||
| *,1 | MannKind Corp. | 6,808,119 | 29,751 | |||
| * | Morphic Holding Inc. | 625,804 | 29,651 | |||
| * | Syndax Pharmaceuticals Inc. | 1,344,301 | 29,427 | |||
| *,1 | Nuvation Bio Inc. | 3,403,381 | 28,929 | |||
| * | Madrigal Pharmaceuticals Inc. | 340,736 | 28,874 | |||
| * | AngioDynamics Inc. | 1,045,325 | 28,830 | |||
| LeMaitre Vascular Inc. | 565,478 | 28,404 | ||||
| Shares | Market Value• ($000) | |||||
| * | Rocket Pharmaceuticals Inc. | 1,289,887 | 28,158 | |||
| * | iTeos Therapeutics Inc. | 601,357 | 27,999 | |||
| * | NextGen Healthcare Inc. | 1,554,908 | 27,662 | |||
| *,1 | Butterfly Network Inc. | 4,127,533 | 27,613 | |||
| * | Joint Corp. | 410,254 | 26,950 | |||
| * | Brookdale Senior Living Inc. | 5,222,431 | 26,948 | |||
| Atrion Corp. | 37,874 | 26,697 | ||||
| * | OptimizeRx Corp. | 429,263 | 26,662 | |||
| * | MacroGenics Inc. | 1,654,155 | 26,549 | |||
| * | Castle Biosciences Inc. | 619,225 | 26,546 | |||
| * | ViewRay Inc. | 4,769,153 | 26,278 | |||
| * | Heron Therapeutics Inc. | 2,877,718 | 26,274 | |||
| *,1 | Berkeley Lights Inc. | 1,438,830 | 26,158 | |||
| * | Zogenix Inc. | 1,602,566 | 26,042 | |||
| * | MaxCyte Inc. | 2,549,425 | 25,979 | |||
| *,1 | Ocugen Inc. | 5,601,885 | 25,489 | |||
| * | Avidity Biosciences Inc. | 1,066,450 | 25,350 | |||
| *,1 | Instil Bio Inc. | 1,465,384 | 25,073 | |||
| * | Kura Oncology Inc. | 1,787,387 | 25,023 | |||
| * | Intersect ENT Inc. | 912,624 | 24,924 | |||
| * | Sangamo Therapeutics Inc. | 3,317,213 | 24,879 | |||
| * | Meridian Bioscience Inc. | 1,218,909 | 24,866 | |||
| * | RAPT Therapeutics Inc. | 672,140 | 24,688 | |||
| * | Aclaris Therapeutics Inc. | 1,679,868 | 24,425 | |||
| National HealthCare Corp. | 354,161 | 24,062 | ||||
| * | Amphastar Pharmaceuticals Inc. | 1,031,005 | 24,012 | |||
| * | Arcturus Therapeutics Holdings Inc. | 644,043 | 23,836 | |||
| * | Keros Therapeutics Inc. | 406,191 | 23,766 | |||
| *,1 | Hims & Hers Health Inc. | 3,614,268 | 23,673 | |||
| * | Endo International plc | 6,284,824 | 23,631 | |||
| *,1 | Bionano Genomics Inc. | 7,879,312 | 23,559 | |||
| * | Pulmonx Corp. | 732,933 | 23,505 | |||
| * | Replimune Group Inc. | 865,293 | 23,449 | |||
| * | Vanda Pharmaceuticals Inc. | 1,492,124 | 23,411 | |||
| * | Vaxcyte Inc. | 980,079 | 23,316 | |||
| * | OrthoPediatrics Corp. | 387,103 | 23,172 | |||
| * | Natus Medical Inc. | 975,293 | 23,144 | |||
| Shares | Market Value• ($000) | |||||
| * | Triple-S Management Corp. Class B | 640,323 | 22,847 | |||
| National Research Corp. | 545,812 | 22,662 | ||||
| * | Inotiv Inc. | 533,245 | 22,434 | |||
| * | CryoLife Inc. | 1,076,564 | 21,908 | |||
| *,1 | Vaxart Inc. | 3,399,097 | 21,312 | |||
| * | Agiliti Inc. | 913,771 | 21,163 | |||
| * | Agenus Inc. | 6,571,688 | 21,161 | |||
| *,1 | Gritstone bio Inc. | 1,642,659 | 21,125 | |||
| * | Cardiovascular Systems Inc. | 1,110,009 | 20,846 | |||
| * | Inogen Inc. | 605,155 | 20,575 | |||
| * | Praxis Precision Medicines Inc. | 1,027,741 | 20,246 | |||
| * | Reata Pharmaceuticals Inc. Class A | 762,202 | 20,099 | |||
| * | Bluebird Bio Inc. | 2,009,410 | 20,074 | |||
| * | Scholar Rock Holding Corp. | 806,635 | 20,037 | |||
| * | Gossamer Bio Inc. | 1,770,683 | 20,026 | |||
| * | Kezar Life Sciences Inc. | 1,193,981 | 19,963 | |||
| * | Alphatec Holdings Inc. | 1,704,060 | 19,477 | |||
| * | PMV Pharmaceuticals Inc. | 838,847 | 19,377 | |||
| *,1 | Day One Biopharmaceuticals Inc. | 1,144,558 | 19,286 | |||
| * | Definitive Healthcare Corp. Class A | 702,947 | 19,212 | |||
| * | SI-BONE Inc. | 862,337 | 19,152 | |||
| * | HealthStream Inc. | 721,647 | 19,023 | |||
| * | AnaptysBio Inc. | 546,451 | 18,989 | |||
| * | Cutera Inc. | 455,291 | 18,813 | |||
| * | Theravance Biopharma Inc. | 1,702,049 | 18,808 | |||
| * | Hanger Inc. | 1,030,939 | 18,691 | |||
| * | Catalyst Pharmaceuticals Inc. | 2,741,908 | 18,563 | |||
| * | Ideaya Biosciences Inc. | 776,655 | 18,360 | |||
| * | Apria Inc. | 555,583 | 18,112 | |||
| * | OraSure Technologies Inc. | 2,069,155 | 17,981 | |||
| * | Arcutis Biotherapeutics Inc. | 842,760 | 17,479 | |||
| * | Collegium Pharmaceutical Inc. | 933,947 | 17,446 | |||
| * | Surmodics Inc. | 359,290 | 17,300 | |||
| * | 2seventy bio Inc. | 667,203 | 17,100 | |||
| * | PetIQ Inc. Class A | 751,753 | 17,072 | |||
| * | Orthofix Medical Inc. | 546,188 | 16,981 | |||
| * | Relmada Therapeutics Inc. | 747,531 | 16,842 | |||
| Shares | Market Value• ($000) | |||||
| * | Organogenesis Holdings Inc. Class A | 1,822,227 | 16,837 | |||
| * | ANI Pharmaceuticals Inc. | 362,290 | 16,694 | |||
| * | Amneal Pharmaceuticals Inc. | 3,483,678 | 16,687 | |||
| * | Pennant Group Inc. | 716,355 | 16,533 | |||
| * | Antares Pharma Inc. | 4,597,597 | 16,413 | |||
| * | Y-mAbs Therapeutics Inc. | 1,012,266 | 16,409 | |||
| *,1 | Adicet Bio Inc. | 921,110 | 16,110 | |||
| * | Atea Pharmaceuticals Inc. | 1,771,846 | 15,840 | |||
| * | NGM Biopharmaceuticals Inc. | 884,464 | 15,664 | |||
| * | Sutro Biopharma Inc. | 1,047,202 | 15,582 | |||
| * | Eagle Pharmaceuticals Inc. | 305,010 | 15,531 | |||
| * | Ocular Therapeutix Inc. | 2,180,451 | 15,198 | |||
| * | Seres Therapeutics Inc. | 1,817,614 | 15,141 | |||
| * | Chinook Therapeutics Inc. | 925,097 | 15,088 | |||
| *,1 | Verve Therapeutics Inc. | 408,759 | 15,071 | |||
| * | Cara Therapeutics Inc. | 1,217,825 | 14,833 | |||
| * | BioAtla Inc. | 754,265 | 14,806 | |||
| * | 4D Molecular Therapeutics Inc. | 673,332 | 14,773 | |||
| * | Bioventus Inc. Class A | 1,014,433 | 14,699 | |||
| * | Personalis Inc. | 1,020,303 | 14,560 | |||
| * | Anika Therapeutics Inc. | 403,039 | 14,441 | |||
| * | Chimerix Inc. | 2,225,657 | 14,311 | |||
| * | Fulcrum Therapeutics Inc. | 807,395 | 14,283 | |||
| * | Treace Medical Concepts Inc. | 756,312 | 14,098 | |||
| * | Kronos Bio Inc. | 1,024,841 | 13,928 | |||
| * | Stoke Therapeutics Inc. | 577,128 | 13,845 | |||
| * | Akero Therapeutics Inc. | 646,709 | 13,678 | |||
| * | UFP Technologies Inc. | 193,826 | 13,618 | |||
| *,1 | ImmunityBio Inc. | 2,231,847 | 13,570 | |||
| *,1 | MiMedx Group Inc. | 2,246,582 | 13,569 | |||
| *,1 | Design Therapeutics Inc. | 633,295 | 13,559 | |||
| * | Rhythm Pharmaceuticals Inc. | 1,356,727 | 13,540 | |||
| * | ORIC Pharmaceuticals Inc. | 912,634 | 13,416 | |||
| Shares | Market Value• ($000) | |||||
| * | Albireo Pharma Inc. | 565,251 | 13,165 | |||
| * | SeaSpine Holdings Corp. | 961,674 | 13,098 | |||
| * | TransMedics Group Inc. | 671,310 | 12,862 | |||
| * | Forma Therapeutics Holdings Inc. | 898,654 | 12,779 | |||
| * | Phathom Pharmaceuticals Inc. | 640,958 | 12,608 | |||
| * | Rigel Pharmaceuticals Inc. | 4,729,555 | 12,533 | |||
| *,1 | Rubius Therapeutics Inc. | 1,273,947 | 12,332 | |||
| * | Apyx Medical Corp. | 945,007 | 12,115 | |||
| * | Mersana Therapeutics Inc. | 1,935,742 | 12,040 | |||
| * | Computer Programs & Systems Inc. | 407,736 | 11,947 | |||
| * | Karyopharm Therapeutics Inc. | 1,844,372 | 11,859 | |||
| * | Accuray Inc. | 2,481,415 | 11,836 | |||
| * | Marinus Pharmaceuticals Inc. | 994,957 | 11,820 | |||
| * | Edgewise Therapeutics Inc. | 771,050 | 11,782 | |||
| * | Curis Inc. | 2,465,760 | 11,737 | |||
| Phibro Animal Health Corp. Class A | 574,011 | 11,721 | ||||
| * | Talaris Therapeutics Inc. | 764,850 | 11,695 | |||
| * | Viridian Therapeutics Inc. | 587,442 | 11,614 | |||
| *,1 | Athira Pharma Inc. | 888,962 | 11,583 | |||
| *,1 | Cullinan Oncology Inc. | 749,484 | 11,565 | |||
| * | Semler Scientific Inc. | 125,100 | 11,465 | |||
| * | Bioxcel Therapeutics Inc. | 558,433 | 11,353 | |||
| * | Kinnate Biopharma Inc. | 637,863 | 11,303 | |||
| * | Deciphera Pharmaceuticals Inc. | 1,154,365 | 11,278 | |||
| * | Akebia Therapeutics Inc. | 4,988,610 | 11,274 | |||
| * | 908 Devices Inc. | 433,283 | 11,209 | |||
| * | Foghorn Therapeutics Inc. | 484,050 | 11,070 | |||
| *,1 | Intercept Pharmaceuticals Inc. | 673,695 | 10,974 | |||
| * | ALX Oncology Holdings Inc. | 510,327 | 10,967 | |||
| * | Precigen Inc. | 2,943,674 | 10,921 | |||
| * | Geron Corp. | 8,897,946 | 10,855 | |||
| * | Spero Therapeutics Inc. | 677,888 | 10,853 | |||
| * | Allovir Inc. | 834,467 | 10,798 | |||
| *,1 | Aadi Bioscience Inc. | 445,926 | 10,769 | |||
| *,1 | Omeros Corp. | 1,670,488 | 10,741 | |||
| Shares | Market Value• ($000) | |||||
| *,1 | VistaGen Therapeutics Inc. | 5,505,056 | 10,735 | |||
| *,1 | Vapotherm Inc. | 516,784 | 10,703 | |||
| * | Verastem Inc. | 5,204,312 | 10,669 | |||
| * | Allakos Inc. | 1,085,554 | 10,628 | |||
| *,1 | Tabula Rasa HealthCare Inc. | 708,021 | 10,620 | |||
| *,1 | Vicarious Surgical Inc. | 989,738 | 10,511 | |||
| *,1 | Arbutus Biopharma Corp. | 2,697,043 | 10,491 | |||
| *,1 | Signify Health Inc. Class A | 728,189 | 10,355 | |||
| *,1 | DermTech Inc. | 653,798 | 10,330 | |||
| * | Kiniksa Pharmaceuticals Ltd. Class A | 868,519 | 10,222 | |||
| *,1 | LifeStance Health Group Inc. | 1,064,164 | 10,131 | |||
| * | Tactile Systems Technology Inc. | 529,858 | 10,083 | |||
| * | Aligos Therapeutics Inc. | 848,752 | 10,075 | |||
| *,1 | Xeris Biopharma Holdings Inc. | 3,373,558 | 9,885 | |||
| *,1 | G1 Therapeutics Inc. | 966,855 | 9,872 | |||
| * | MEI Pharma Inc. | 3,693,414 | 9,861 | |||
| *,1 | Clovis Oncology Inc. | 3,614,712 | 9,796 | |||
| * | Pliant Therapeutics Inc. | 718,287 | 9,697 | |||
| * | Altimmune Inc. | 1,055,590 | 9,669 | |||
| * | Cue Biopharma Inc. | 849,873 | 9,612 | |||
| * | Dyne Therapeutics Inc. | 807,332 | 9,599 | |||
| Utah Medical Products Inc. | 95,438 | 9,544 | ||||
| * | Aveanna Healthcare Holdings Inc. | 1,284,770 | 9,507 | |||
| * | KalVista Pharmaceuticals Inc. | 717,163 | 9,488 | |||
| * | Singular Genomics Systems Inc. | 820,124 | 9,481 | |||
| *,1 | Fluidigm Corp. | 2,407,569 | 9,438 | |||
| * | Immunovant Inc. | 1,107,045 | 9,432 | |||
| * | EyePoint Pharmaceuticals Inc. | 767,993 | 9,400 | |||
| *,1 | 23andMe Holding Co. | 1,401,400 | 9,333 | |||
| * | Precision BioSciences Inc. | 1,254,716 | 9,285 | |||
| * | Aerie Pharmaceuticals Inc. | 1,313,983 | 9,224 | |||
| * | SIGA Technologies Inc. | 1,214,044 | 9,130 | |||
| * | Radius Health Inc. | 1,317,303 | 9,116 | |||
| * | Avita Medical Inc. | 755,807 | 9,055 | |||
| *,1 | Tricida Inc. | 941,938 | 9,005 | |||
| Shares | Market Value• ($000) | |||||
| * | Viking Therapeutics Inc. | 1,956,125 | 8,998 | |||
| *,1 | Esperion Therapeutics Inc. | 1,736,578 | 8,683 | |||
| * | Stereotaxis Inc. | 1,387,817 | 8,604 | |||
| *,1 | CEL-SCI Corp. | 1,193,012 | 8,470 | |||
| * | Olema Pharmaceuticals Inc. | 901,724 | 8,440 | |||
| *,1 | Lineage Cell Therapeutics Inc. | 3,437,446 | 8,422 | |||
| *,1 | Applied Molecular Transport Inc. | 601,000 | 8,402 | |||
| * | Axogen Inc. | 896,295 | 8,398 | |||
| * | Mirum Pharmaceuticals Inc. | 526,006 | 8,390 | |||
| * | Selecta Biosciences Inc. | 2,565,679 | 8,364 | |||
| * | Lexicon Pharmaceuticals Inc. | 2,121,674 | 8,359 | |||
| *,1 | DICE Therapeutics Inc. | 326,204 | 8,256 | |||
| * | iRadimed Corp. | 176,500 | 8,156 | |||
| * | Cymabay Therapeutics Inc. | 2,398,201 | 8,106 | |||
| *,1 | Erasca Inc. | 518,553 | 8,079 | |||
| *,1 | Zomedica Corp. | 26,205,556 | 8,032 | |||
| * | Provention Bio Inc. | 1,417,520 | 7,966 | |||
| * | Jounce Therapeutics Inc. | 950,782 | 7,939 | |||
| * | CytomX Therapeutics Inc. | 1,826,173 | 7,907 | |||
| *,1 | Cogent Biosciences Inc. | 919,181 | 7,887 | |||
| *,1 | KemPharm Inc. | 893,113 | 7,779 | |||
| *,1 | Caribou Biosciences Inc. | 514,146 | 7,758 | |||
| * | Passage Bio Inc. | 1,216,852 | 7,727 | |||
| *,1 | Oyster Point Pharma Inc. | 418,653 | 7,645 | |||
| *,1 | SmileDirectClub Inc. Class A | 3,163,758 | 7,435 | |||
| * | BioDelivery Sciences International Inc. | 2,396,202 | 7,428 | |||
| *,1 | Leap Therapeutics Inc. | 2,289,511 | 7,418 | |||
| * | ADMA Biologics Inc. | 5,232,363 | 7,378 | |||
| *,1 | Cortexyme Inc. | 582,453 | 7,351 | |||
| * | Generation Bio Co. | 1,038,127 | 7,350 | |||
| *,1 | Icosavax Inc. | 319,992 | 7,321 | |||
| * | Akoya Biosciences Inc. | 477,329 | 7,308 | |||
| *,1 | Cardiff Oncology Inc. | 1,200,675 | 7,216 | |||
| *,1 | Asensus Surgical Inc. | 6,477,615 | 7,190 | |||
| * | Vera Therapeutics Inc. Class A | 268,385 | 7,171 | |||
| * | Co-Diagnostics Inc. | 799,651 | 7,141 | |||
| Shares | Market Value• ($000) | |||||
| * | Tarsus Pharmaceuticals Inc. | 317,149 | 7,136 | |||
| XBiotech Inc. | 633,491 | 7,051 | ||||
| * | Shattuck Labs Inc. | 827,230 | 7,040 | |||
| * | InfuSystem Holdings Inc. | 412,131 | 7,019 | |||
| * | Imago Biosciences Inc. | 286,492 | 6,793 | |||
| *,1 | Monte Rosa Therapeutics Inc. | 332,183 | 6,783 | |||
| * | Evolus Inc. | 1,029,390 | 6,701 | |||
| *,1 | Aldeyra Therapeutics Inc. | 1,654,918 | 6,620 | |||
| * | 9 Meters Biopharma Inc. | 6,732,211 | 6,589 | |||
| * | ClearPoint Neuro Inc. | 585,895 | 6,574 | |||
| * | Apollo Endosurgery Inc. | 778,104 | 6,559 | |||
| * | Harvard Bioscience Inc. | 928,940 | 6,549 | |||
| * | IGM Biosciences Inc. | 219,883 | 6,449 | |||
| * | Ikena Oncology Inc. | 511,054 | 6,409 | |||
| * | Alpine Immune Sciences Inc. | 458,029 | 6,344 | |||
| *,1 | ZIOPHARM Oncology Inc. | 5,819,043 | 6,343 | |||
| *,1 | Progenity Inc. | 3,025,977 | 6,324 | |||
| * | Durect Corp. | 6,408,832 | 6,318 | |||
| * | Aeglea BioTherapeutics Inc. | 1,313,273 | 6,238 | |||
| *,1 | PLx Pharma Inc. | 765,283 | 6,130 | |||
| * | Sema4 Holdings Corp. | 1,373,585 | 6,126 | |||
| *,1 | P3 Health Partners Inc. | 866,984 | 6,104 | |||
| * | Finch Therapeutics Group Inc. | 608,599 | 6,068 | |||
| * | Poseida Therapeutics Inc. | 888,597 | 6,051 | |||
| * | Cytek Biosciences Inc. | 370,405 | 6,045 | |||
| * | SomaLogic Inc. | 517,212 | 6,020 | |||
| *,1 | Checkpoint Therapeutics Inc. | 1,935,339 | 6,019 | |||
| *,1 | MyMD Pharmaceuticals Inc. | 986,327 | 5,977 | |||
| * | Nkarta Inc. | 387,394 | 5,946 | |||
| *,1 | Janux Therapeutics Inc. | 300,259 | 5,924 | |||
| *,1 | Sight Sciences Inc. | 337,053 | 5,922 | |||
| *,1 | Harrow Health Inc. | 683,628 | 5,907 | |||
| * | SQZ Biotechnologies Co. | 657,886 | 5,875 | |||
| * | Magenta Therapeutics Inc. | 1,316,086 | 5,830 | |||
| * | Epizyme Inc. | 2,324,103 | 5,810 | |||
| *,1 | Zynex Inc. | 581,990 | 5,802 | |||
| Shares | Market Value• ($000) | |||||
| *,1 | Citius Pharmaceuticals Inc. | 3,762,882 | 5,795 | |||
| *,1 | Tenaya Therapeutics Inc. | 304,397 | 5,768 | |||
| * | Spectrum Pharmaceuticals Inc. | 4,533,639 | 5,758 | |||
| *,1 | Beyond Air Inc. | 607,173 | 5,732 | |||
| *,1 | Atossa Therapeutics Inc. | 3,568,886 | 5,710 | |||
| *,1 | Ventyx Biosciences Inc. | 286,784 | 5,696 | |||
| * | Infinity Pharmaceuticals Inc. | 2,515,625 | 5,660 | |||
| *,1 | Humanigen Inc. | 1,519,387 | 5,652 | |||
| * | Harpoon Therapeutics Inc. | 744,084 | 5,618 | |||
| * | Sierra Oncology Inc. | 257,900 | 5,607 | |||
| *,1 | Accelerate Diagnostics Inc. | 1,071,946 | 5,596 | |||
| *,2 | PDL BioPharma Inc. | 2,258,201 | 5,578 | |||
| *,1 | PAVmed Inc. | 2,267,445 | 5,578 | |||
| * | Paratek Pharmaceuticals Inc. | 1,241,872 | 5,576 | |||
| *,1 | Pulse Biosciences Inc. | 374,900 | 5,552 | |||
| * | Annexon Inc. | 483,043 | 5,550 | |||
| * | Outlook Therapeutics Inc. | 4,078,824 | 5,547 | |||
| * | ChromaDex Corp. | 1,481,140 | 5,539 | |||
| * | Sientra Inc. | 1,494,281 | 5,484 | |||
| *,1 | Tango Therapeutics Inc. | 499,196 | 5,461 | |||
| * | CytoSorbents Corp. | 1,302,216 | 5,456 | |||
| * | CTI BioPharma Corp. | 2,197,729 | 5,450 | |||
| *,1 | Athersys Inc. | 5,996,030 | 5,412 | |||
| * | Viemed Healthcare Inc. | 1,021,301 | 5,331 | |||
| * | Immunic Inc. | 556,586 | 5,327 | |||
| *,1 | Lyell Immunopharma Inc. | 685,335 | 5,304 | |||
| *,1 | aTyr Pharma Inc. | 707,035 | 5,282 | |||
| * | Fortress Biotech Inc. | 2,099,871 | 5,250 | |||
| *,1 | PDS Biotechnology Corp. | 646,702 | 5,238 | |||
| *,1 | Matinas BioPharma Holdings Inc. | 5,178,119 | 5,230 | |||
| *,1 | Graphite Bio Inc. | 419,038 | 5,209 | |||
| * | Eiger BioPharmaceuticals Inc. | 1,002,324 | 5,202 | |||
| * | Akouos Inc. | 600,364 | 5,103 | |||
| * | Oncocyte Corp. | 2,341,973 | 5,082 | |||
| * | Ovid therapeutics Inc. | 1,580,181 | 5,072 | |||
| * | iCAD Inc. | 693,870 | 4,996 | |||
| * | TFF Pharmaceuticals Inc. | 562,689 | 4,991 | |||
| Shares | Market Value• ($000) | |||||
| *,1 | Liquidia Corp. | 1,020,773 | 4,971 | |||
| *,1 | Evelo Biosciences Inc. | 815,953 | 4,953 | |||
| *,1 | Century Therapeutics Inc. | 311,529 | 4,941 | |||
| *,1 | Enochian Biosciences Inc. | 670,400 | 4,887 | |||
| * | CorMedix Inc. | 1,073,491 | 4,884 | |||
| *,1 | Compass Therapeutics Inc. | 1,538,900 | 4,878 | |||
| *,1 | AVEO Pharmaceuticals Inc. | 1,031,672 | 4,839 | |||
| * | Castlight Health Inc. Class B | 3,134,910 | 4,828 | |||
| *,1 | Sesen Bio Inc. | 5,809,404 | 4,735 | |||
| *,1 | Vor BioPharma Inc. | 402,489 | 4,677 | |||
| *,1 | Seelos Therapeutics Inc. | 2,822,580 | 4,601 | |||
| 1 | Forian Inc. | 507,760 | 4,580 | |||
| *,1 | XOMA Corp. | 216,811 | 4,521 | |||
| * | Tonix Pharmaceuticals Holding Corp. | 12,556,859 | 4,492 | |||
| *,1 | Nuvalent Inc. Class A | 235,682 | 4,487 | |||
| *,1 | Taysha Gene Therapies Inc. | 384,710 | 4,482 | |||
| *,1 | PROCEPT BioRobotics Corp. | 178,900 | 4,474 | |||
| * | Molecular Templates Inc. | 1,130,895 | 4,433 | |||
| *,1 | Entrada Therapeutics Inc. | 254,933 | 4,364 | |||
| * | Neoleukin Therapeutics Inc. | 904,596 | 4,360 | |||
| * | 89bio Inc. | 331,274 | 4,330 | |||
| * | Applied Therapeutics Inc. | 474,486 | 4,247 | |||
| *,1 | Oncology Institute Inc. | 432,741 | 4,219 | |||
| * | IntriCon Corp. | 259,528 | 4,197 | |||
| * | Adverum Biotechnologies Inc. | 2,374,987 | 4,180 | |||
| *,1 | Dare Bioscience Inc. | 2,082,157 | 4,164 | |||
| *,1 | TherapeuticsMD Inc. | 11,683,481 | 4,153 | |||
| *,1 | Rain Therapeutics Inc. | 321,219 | ��� 4,137 | |||
| *,1 | Tyra Biosciences Inc. | 293,500 | 4,130 | |||
| * | Alpha Teknova Inc. | 200,207 | 4,100 | |||
| * | AirSculpt Technologies Inc. | 238,200 | 4,095 | |||
| * | Surface Oncology Inc. | 856,153 | 4,092 | |||
| *,1 | Frequency Therapeutics Inc. | 793,072 | 4,068 | |||
| * | Savara Inc. | 3,255,385 | 4,037 | |||
| * | Codiak Biosciences Inc. | 361,652 | 4,029 | |||
| Shares | Market Value• ($000) | |||||
| * | Opiant Pharmaceuticals Inc. | 119,263 | 4,011 | |||
| *,1 | Vincerx Pharma Inc. | 391,380 | 3,988 | |||
| * | Syros Pharmaceuticals Inc. | 1,219,329 | 3,975 | |||
| *,1 | SCYNEXIS Inc. | 648,422 | 3,955 | |||
| *,1 | NRX Pharmaceuticals Inc. | 825,400 | 3,945 | |||
| *,1 | Verrica Pharmaceuticals Inc. | 426,172 | 3,904 | |||
| *,1 | Conformis Inc. | 5,125,262 | 3,902 | |||
| *,1 | BrainStorm Cell Therapeutics Inc. | 951,371 | 3,805 | |||
| * | Clearside Biomedical Inc. | 1,383,654 | 3,805 | |||
| * | Exagen Inc. | 326,266 | 3,794 | |||
| *,1 | Pear Therapeutics Inc. | 609,168 | 3,777 | |||
| * | Avrobio Inc. | 967,934 | 3,727 | |||
| * | Homology Medicines Inc. | 1,018,828 | 3,709 | |||
| * | Synlogic Inc. | 1,521,748 | 3,683 | |||
| *,1 | Xilio Therapeutics Inc. | 227,813 | 3,645 | |||
| * | CareMax Inc. | 471,830 | 3,624 | |||
| *,1 | Viracta Therapeutics Inc. | 991,377 | 3,619 | |||
| * | Celcuity Inc. | 273,679 | 3,610 | |||
| * | Black Diamond Therapeutics Inc. | 670,875 | 3,576 | |||
| * | Silverback Therapeutics Inc. | 536,038 | 3,570 | |||
| * | Larimar Therapeutics Inc. | 328,248 | 3,542 | |||
| * | Mustang Bio Inc. | 2,112,015 | 3,506 | |||
| * | TCR2 Therapeutics Inc. | 751,404 | 3,502 | |||
| *,1 | Theseus Pharmaceuticals Inc. | 275,573 | 3,494 | |||
| *,1 | Bolt Biotherapeutics Inc. | 706,665 | 3,463 | |||
| *,1 | Adagio Therapeutics Inc. | 474,097 | 3,442 | |||
| *,1 | Biomea Fusion Inc. | 456,903 | 3,404 | |||
| *,1 | iBio Inc. | 6,187,128 | 3,397 | |||
| *,1 | Inmune Bio Inc. | 331,277 | 3,379 | |||
| *,1 | Aerovate Therapeutics Inc. | 284,834 | 3,358 | |||
| * | Enzo Biochem Inc. | 1,040,908 | 3,341 | |||
| * | Puma Biotechnology Inc. | 1,097,795 | 3,337 | |||
| *,1 | Actinium Pharmaceuticals Inc. | 552,928 | 3,323 | |||
| * | Werewolf Therapeutics Inc. | 275,778 | 3,285 | |||
| * | Aptinyx Inc. Class A | 1,227,261 | 3,277 | |||
| * | Eargo Inc. | 640,326 | 3,266 | |||
| Shares | Market Value• ($000) | |||||
| *,1 | Zynerba Pharmaceuticals Inc. | 1,129,474 | 3,253 | |||
| * | Absci Corp. | 395,572 | 3,244 | |||
| * | UpHealth Inc. | 1,440,200 | 3,226 | |||
| *,1 | Aquestive Therapeutics Inc. | 818,252 | 3,183 | |||
| *,1 | Retractable Technologies Inc. | 458,342 | 3,176 | |||
| *,1 | Rani Therapeutics Holdings Inc. Class A | 193,116 | 3,157 | |||
| * | Otonomy Inc. | 1,513,558 | 3,148 | |||
| * | Avalo Therapeutics Inc. | 1,844,625 | 3,136 | |||
| *,1 | Athenex Inc. | 2,301,777 | 3,130 | |||
| *,1 | Impel Neuropharma Inc. | 361,867 | 3,123 | |||
| * | CVRx Inc. | 254,646 | 3,114 | |||
| *,1 | Palatin Technologies Inc. | 6,085,329 | 3,113 | |||
| *,1 | Sensei Biotherapeutics Inc. | 534,441 | 3,100 | |||
| *,1 | Brooklyn ImmunoTherapeutics Inc. | 740,159 | 3,086 | |||
| *,1 | Pyxis Oncology Inc. | 281,025 | 3,083 | |||
| �� * | Assembly Biosciences Inc. | 1,320,373 | 3,076 | |||
| *,1 | MediciNova Inc. | 1,146,273 | 3,072 | |||
| *,1 | Oncorus Inc. | 580,797 | 3,061 | |||
| *,1 | eFFECTOR Therapeutics Inc. | 367,012 | 3,039 | |||
| *,1 | PhaseBio Pharmaceuticals Inc. | 1,156,526 | 3,019 | |||
| * | Convey Health Solutions Holdings Inc. | 360,245 | 3,012 | |||
| *,1 | Ardelyx Inc. | 2,730,304 | 3,003 | |||
| * | Neuronetics Inc. | 671,591 | 2,995 | |||
| *,1 | Ampio Pharmaceuticals Inc. | 5,246,099 | 2,990 | |||
| * | Milestone Scientific Inc. | 1,447,898 | 2,983 | |||
| * | Immunome Inc. | 230,150 | 2,983 | |||
| *,1 | Lucira Health Inc. | 343,109 | 2,954 | |||
| * | Innovage Holding Corp. | 566,048 | 2,830 | |||
| * | Oncternal Therapeutics Inc. | 1,243,288 | 2,822 | |||
| *,1 | ContraFect Corp. | 1,071,148 | 2,817 | |||
| *,1 | Surgalign Holdings Inc. | 3,923,007 | 2,810 | |||
| * | Invacare Corp. | 1,023,221 | 2,783 | |||
| * | Nautilus Biotechnology Inc. Class A | 535,900 | 2,776 | |||
| * | Tela Bio Inc. | 216,147 | 2,767 | |||
| Shares | Market Value• ($000) | |||||
| * | Anixa Biosciences Inc. | 927,841 | 2,756 | |||
| *,1 | 180 Life Sciences Corp. | 706,110 | 2,754 | |||
| *,1 | Immuneering Corp. Class A | 168,833 | 2,730 | |||
| * | Assertio Holdings Inc. | 1,244,049 | 2,712 | |||
| * | Aura Biosciences Inc. | 159,493 | 2,708 | |||
| *,1 | RxSight Inc. | 240,275 | 2,703 | |||
| *,1 | Dyadic International Inc. | 596,383 | 2,696 | |||
| *,1 | Optinose Inc. | 1,663,471 | 2,695 | |||
| *,1 | Quantum-Si Inc. | 338,766 | 2,666 | |||
| *,1 | Voyager Therapeutics Inc. | 976,336 | 2,646 | |||
| * | Terns Pharmaceuticals Inc. | 372,824 | 2,636 | |||
| * | NeuBase Therapeutics Inc. | 936,373 | 2,631 | |||
| * | Rapid Micro Biosystems Inc. Class A | 246,671 | 2,625 | |||
| * | Cabaletta Bio Inc. | 686,920 | 2,603 | |||
| *,1 | Trevena Inc. | 4,456,224 | 2,596 | |||
| *,1 | ATI Physical Therapy Inc. | 764,606 | 2,592 | |||
| * | Annovis Bio Inc. | 146,966 | 2,584 | |||
| *,1 | Aspira Women's Health Inc. | 1,457,103 | 2,579 | |||
| *,1 | Prelude Therapeutics Inc. | 205,579 | 2,559 | |||
| * | FONAR Corp. | 169,673 | 2,542 | |||
| * | Repro-Med Systems Inc. | 842,318 | 2,527 | |||
| * | Concert Pharmaceuticals Inc. | 797,343 | 2,512 | |||
| *,1 | Adamis Pharmaceuticals Corp. | 4,096,010 | 2,478 | |||
| *,1 | SAB Biotherapeutics Inc. | 316,200 | 2,470 | |||
| * | Eyenovia Inc. | 617,303 | 2,469 | |||
| *,1 | Eton Pharmaceuticals Inc. | 575,285 | 2,468 | |||
| *,1 | Galectin Therapeutics Inc. | 1,189,409 | 2,462 | |||
| * | GT Biopharma Inc. | 799,666 | 2,439 | |||
| *,1 | Cyteir Therapeutics Inc. | 213,864 | 2,432 | |||
| *,1 | Atreca Inc. Class A | 797,857 | 2,418 | |||
| * | Electromed Inc. | 185,812 | 2,416 | |||
| *,1 | Astria Therapeutics Inc. | 445,544 | 2,401 | |||
| * | Solid Biosciences Inc. | 1,370,035 | 2,398 | |||
| * | scPharmaceuticals Inc. | 473,934 | 2,379 | |||
| Shares | Market Value• ($000) | |||||
| * | Lipocine Inc. | 2,398,282 | 2,377 | |||
| * | Hepion Pharmaceuticals Inc. | 2,070,833 | 2,361 | |||
| * | Acumen Pharmaceuticals Inc. | 348,229 | 2,354 | |||
| *,1 | Clene Inc. | 573,521 | 2,351 | |||
| *,1 | Omega Therapeutics Inc. | 206,410 | 2,339 | |||
| *,1 | SELLAS Life Sciences Group Inc. | 419,071 | 2,317 | |||
| * | Satsuma Pharmaceuticals Inc. | 511,816 | 2,303 | |||
| * | Cidara Therapeutics Inc. | 1,796,543 | 2,282 | |||
| * | IRIDEX Corp. | 373,047 | 2,279 | |||
| * | Cyclerion Therapeutics Inc. | 1,323,224 | 2,276 | |||
| * | Inozyme Pharma Inc. | 329,841 | 2,250 | |||
| * | Decibel Therapeutics Inc. | 483,353 | 2,248 | |||
| *,1 | Novan Inc. | 533,970 | 2,227 | |||
| * | La Jolla Pharmaceutical Co. | 478,002 | 2,223 | |||
| * | Point Biopharma Global Inc. Class A | 389,126 | 2,179 | |||
| * | NextCure Inc. | 362,876 | 2,177 | |||
| *,1 | Surrozen Inc. | 337,956 | 2,176 | |||
| * | Corbus Pharmaceuticals Holdings Inc. | 3,521,570 | 2,168 | |||
| * | NexImmune Inc. | 468,043 | 2,158 | |||
| * | Sensus Healthcare Inc. | 297,679 | 2,149 | |||
| * | F-star Therapeutics Inc. | 427,852 | 2,148 | |||
| *,1 | Heat Biologics Inc. | 705,534 | 2,145 | |||
| * | Equillium Inc. | 570,835 | 2,141 | |||
| *,1 | Humacyte Inc. | 295,041 | 2,139 | |||
| * | Sanara Medtech Inc. | 69,768 | 2,122 | |||
| *,1 | Jasper Therapeutics Inc. | 269,524 | 2,116 | |||
| *,1 | T2 Biosystems Inc. | 4,092,293 | 2,112 | |||
| * | Champions Oncology Inc. | 263,922 | 2,111 | |||
| * | Candel Therapeutics Inc. | 269,900 | 2,111 | |||
| * | Pro-Dex Inc. | 87,581 | 2,091 | |||
| *,1 | Applied Genetic Technologies Corp. | 1,084,366 | 2,060 | |||
| *,1 | IsoPlexis Corp. | 222,915 | 2,049 | |||
| * | Lantern Pharma Inc. | 256,113 | 2,044 | |||
| * | Movano Inc. | 532,959 | 2,025 | |||
| * | Acutus Medical Inc. | 593,445 | 2,024 | |||
| * | Elevation Oncology Inc. | 332,316 | 2,001 | |||
| * | Eliem Therapeutics Inc. | 189,734 | 1,985 | |||
| Shares | Market Value• ($000) | |||||
| *,1 | Gemini Therapeutics Inc. Class A | 681,589 | 1,983 | |||
| * | Eledon Pharmaceuticals Inc. | 447,798 | 1,975 | |||
| * | CASI Pharmaceuticals Inc. | 2,466,927 | 1,974 | |||
| * | GlycoMimetics Inc. | 1,369,767 | 1,972 | |||
| *,1 | Corvus Pharmaceuticals Inc. | 818,011 | 1,971 | |||
| * | Summit Therapeutics Inc. | 731,303 | 1,967 | |||
| *,1 | Tyme Technologies Inc. | 3,251,941 | 1,961 | |||
| * | Recro Pharma Inc. | 1,130,309 | 1,933 | |||
| * | Angion Biomedica Corp. | 665,973 | 1,931 | |||
| * | Protara Therapeutics Inc. | 284,301 | 1,919 | |||
| * | Renovacor Inc. | 247,032 | 1,902 | |||
| * | Codex DNA Inc. | 175,221 | 1,892 | |||
| * | DiaMedica Therapeutics Inc. | 506,271 | 1,888 | |||
| *,1 | BioSig Technologies Inc. | 833,444 | 1,859 | |||
| * | UNITY Biotechnology Inc. | 1,262,875 | 1,844 | |||
| *,1 | Reneo Pharmaceuticals Inc. | 214,913 | 1,838 | |||
| * | NeuroPace Inc. | 180,700 | 1,821 | |||
| *,1 | Delcath Systems Inc. | 234,851 | 1,820 | |||
| * | Rallybio Corp. | 189,993 | 1,813 | |||
| *,1 | SOC Telemed Inc. Class A | 1,411,966 | 1,807 | |||
| * | Greenwich Lifesciences Inc. | 73,763 | 1,795 | |||
| *,1 | Achieve Life Sciences Inc. | 230,562 | 1,794 | |||
| *,1 | AcelRx Pharmaceuticals Inc. | 3,199,151 | 1,792 | |||
| * | Sio Gene Therapies Inc. | 1,382,708 | 1,784 | |||
| *,2 | Alder Biopharmaceuticals Inc. CVR Exp. 12/31/24 | 2,021,007 | 1,778 | |||
| * | Talis Biomedical Corp. | 434,170 | 1,741 | |||
| *,1 | Capricor Therapeutics Inc. | 587,714 | 1,722 | |||
| *,1 | Biolase Inc. | 4,390,729 | 1,712 | |||
| *,1 | Kala Pharmaceuticals Inc. | 1,407,086 | 1,703 | |||
| * | Ocuphire Pharma Inc. | 451,409 | 1,684 | |||
| * | CareCloud Inc. | 266,292 | 1,683 | |||
| * | Orgenesis Inc. | 566,688 | 1,632 | |||
| *,1 | Evofem Biosciences Inc. | 4,334,863 | 1,628 | |||
| Shares | Market Value• ($000) | |||||
| * | Marker Therapeutics Inc. | 1,668,739 | 1,586 | |||
| *,1 | Oragenics Inc. | 3,556,869 | 1,586 | |||
| * | Five Star Senior Living Inc. | 537,058 | 1,584 | |||
| *,1 | Biocept Inc. | 432,578 | 1,566 | |||
| * | Agile Therapeutics Inc. | 3,195,980 | 1,560 | |||
| *,1 | Allena Pharmaceuticals Inc. | 2,621,736 | 1,553 | |||
| * | LENSAR Inc. | 255,116 | 1,520 | |||
| * | Checkmate Pharmaceuticals Inc. | 528,940 | 1,518 | |||
| *,1 | VYNE Therapeutics Inc. | 1,479,066 | 1,509 | |||
| *,1 | Galera Therapeutics Inc. | 328,358 | 1,507 | |||
| *,1 | Genprex Inc. | 1,144,222 | 1,499 | |||
| *,1 | Onconova Therapeutics Inc. | 586,842 | 1,496 | |||
| * | Caladrius Biosciences Inc. | 1,775,055 | 1,494 | |||
| * | Cocrystal Pharma Inc. | 2,296,304 | 1,493 | |||
| * | Processa Pharmaceuticals Inc. | 299,657 | 1,468 | |||
| *,1 | Rezolute Inc. | 305,100 | 1,458 | |||
| *,1 | Biomerica Inc. | 374,536 | 1,457 | |||
| * | Merrimack Pharmaceuticals Inc. | 369,998 | 1,447 | |||
| * | Lannett Co. Inc. | 890,245 | 1,442 | |||
| * | X4 Pharmaceuticals Inc. | 626,285 | 1,434 | |||
| *,1 | Sonida Senior Living Inc. | 50,056 | 1,426 | |||
| * | Thorne HealthTech Inc. | 227,118 | 1,410 | |||
| *,1 | Genocea Biosciences Inc. | 1,214,942 | 1,409 | |||
| *,1 | IsoRay Inc. | 3,609,244 | 1,400 | |||
| *,1 | Second Sight Medical Products Inc. | 856,591 | 1,396 | |||
| *,1 | Aprea Therapeutics Inc. | 482,446 | 1,385 | |||
| * | Venus Concept Inc. | 813,187 | 1,382 | |||
| *,1 | Roivant Sciences Ltd. | 134,798 | 1,359 | |||
| *,1 | Ontrak Inc. | 215,767 | 1,357 | |||
| * | IO Biotech Inc. | 205,200 | 1,348 | |||
| * | Longboard Pharmaceuticals Inc. | 278,227 | 1,347 | |||
| *,1 | Avinger Inc. | 2,983,044 | 1,342 | |||
| *,1 | Predictive Oncology Inc. | 1,385,931 | 1,319 | |||
| *,1 | Celsion Corp. | 2,428,865 | 1,312 | |||
| *,1 | Cumberland Pharmaceuticals Inc. | 280,820 | 1,311 | |||
| Shares | Market Value• ($000) | |||||
| * | Armata Pharmaceuticals Inc. | 237,161 | 1,300 | |||
| * | Lumos Pharma Inc. | 187,322 | 1,300 | |||
| * | Sonendo Inc. | 224,928 | 1,296 | |||
| * | Biodesix Inc. | 240,520 | 1,272 | |||
| * | Aileron Therapeutics Inc. | 2,231,531 | 1,256 | |||
| * | Axcella Health Inc. | 600,853 | 1,256 | |||
| *,1 | Kaleido Biosciences Inc. | 524,178 | 1,253 | |||
| * | Aptevo Therapeutics Inc. | 158,476 | 1,247 | |||
| * | Calithera Biosciences Inc. | 1,858,409 | 1,236 | |||
| * | Myomo Inc. | 180,412 | 1,235 | |||
| *,1 | Jaguar Health Inc. | 1,164,170 | 1,211 | |||
| * | Eloxx Pharmaceuticals Inc. | 1,725,475 | 1,208 | |||
| *,1 | Zosano Pharma Corp. | 2,568,875 | 1,207 | |||
| * | AIM ImmunoTech Inc. | 1,311,599 | 1,207 | |||
| * | Reviva Pharmaceuticals Holdings Inc. | 409,332 | 1,158 | |||
| *,1 | Microbot Medical Inc. | 153,549 | 1,152 | |||
| * | Psychemedics Corp. | 165,415 | 1,148 | |||
| * | Moleculin Biotech Inc. | 616,108 | 1,146 | |||
| *,1 | Chembio Diagnostics Inc. | 999,186 | 1,139 | |||
| * | Tracon Pharmaceuticals Inc. | 406,424 | 1,126 | |||
| *,1 | NanoViricides Inc. | 300,189 | 1,117 | |||
| *,1 | Adial Pharmaceuticals Inc. | 413,497 | 1,116 | |||
| Indaptus Therapeutics Inc. | 194,541 | 1,109 | ||||
| * | Hookipa Pharma Inc. | 470,973 | 1,097 | |||
| *,1 | PolarityTE Inc. | 1,866,000 | 1,095 | |||
| *,1 | NeuroMetrix Inc. | 217,846 | 1,094 | |||
| *,1 | enVVeno Medical Corp. | 160,154 | 1,055 | |||
| * | Precipio Inc. | 662,055 | 1,046 | |||
| *,1 | Tempest Therapeutics Inc. | 196,177 | 1,036 | |||
| * | Minerva Surgical Inc. | 199,982 | 1,028 | |||
| *,1 | Talkspace Inc. | 511,882 | 1,008 | |||
| * | Lucid Diagnostics Inc. | 186,179 | 1,000 | |||
| * | ElectroCore Inc. | 1,693,367 | 986 | |||
| *,1 | cbdMD Inc. | 910,106 | 983 | |||
| *,1 | Spruce Biosciences Inc. | 219,817 | 980 | |||
| *,1 | Aridis Pharmaceuticals Inc. | 419,974 | 979 | |||
| Shares | Market Value• ($000) | |||||
| *,1 | Ensysce Biosciences Inc. | 206,600 | 971 | |||
| * | OpGen Inc. | 968,530 | 969 | |||
| * | Sigilon Therapeutics Inc. | 349,052 | 963 | |||
| * | NantHealth Inc. | 894,058 | 943 | |||
| * | LogicBio Therapeutics Inc. | 404,761 | 935 | |||
| * | Minerva Neurosciences Inc. | 1,156,640 | 926 | |||
| *,1 | HTG Molecular Diagnostics Inc. | 170,349 | 923 | |||
| * | Diffusion Pharmaceuticals Inc. | 3,008,350 | 918 | |||
| *,1,2 | Tobira Therapeutics Inc. CVR Exp. 12/31/28 | 201,001 | 911 | |||
| * | IMARA Inc. | 403,870 | 909 | |||
| *,1 | Vallon Pharmaceuticals Inc. | 148,800 | 890 | |||
| *,1 | Synthetic Biologics Inc. | 3,260,633 | 888 | |||
| *,1 | Rockwell Medical Inc. | 2,138,698 | 877 | |||
| *,1 | Organovo Holdings Inc. | 237,956 | 864 | |||
| *,1 | Allied Healthcare Products Inc. | 147,174 | 857 | |||
| * | TScan Therapeutics Inc. | 189,818 | 854 | |||
| * | Cyclacel Pharmaceuticals Inc. | 220,333 | 853 | |||
| * | Sera Prognostics Inc. Class A | 123,881 | 851 | |||
| *,1 | Virpax Pharmaceuticals Inc. | 247,037 | 847 | |||
| * | Cryo-Cell International Inc. | 72,236 | 838 | |||
| * | Abeona Therapeutics Inc. | 2,478,609 | 835 | |||
| *,1 | Windtree Therapeutics Inc. | 516,220 | 829 | |||
| * | INVO BioScience Inc. | 248,469 | 827 | |||
| *,1 | Biofrontera Inc. | 110,000 | 827 | |||
| * | Vyant Bio Inc. | 600,669 | 811 | |||
| *,1 | Soligenix Inc. | 1,217,959 | 804 | |||
| *,1 | Aytu BioPharma Inc. | 595,596 | 804 | |||
| * | Landos Biopharma Inc. | 167,023 | 802 | |||
| * | Cellectar Biosciences Inc. | 1,204,554 | 800 | |||
| *,1 | Vivos Therapeutics Inc. | 353,118 | 795 | |||
| * | ImmuCell Corp. | 99,344 | 794 | |||
| * | ENDRA Life Sciences Inc. | 1,135,615 | 786 | |||
| * | Strata Skin Sciences Inc. | 526,219 | 774 | |||
| Shares | Market Value• ($000) | |||||
| * | Aravive Inc. | 350,260 | 767 | |||
| * | Catalyst Biosciences Inc. | 826,502 | 755 | |||
| * | Marpai Inc. Class A | 172,000 | 753 | |||
| * | Yumanity Therapeutics Inc. | 253,447 | 750 | |||
| *,1 | Longeveron Inc. | 61,900 | 747 | |||
| *,1 | Better Therapeutics Inc. | 160,300 | 745 | |||
| * | Lyra Therapeutics Inc. | 167,443 | 730 | |||
| * | Ekso Bionics Holdings Inc. | 269,736 | 715 | |||
| *,1 | Bright Health Group Inc. | 203,739 | 701 | |||
| *,1 | Qualigen Therapeutics Inc. | 637,185 | 682 | |||
| * | Miromatrix Medical Inc. | 146,672 | 682 | |||
| *,1 | Bellerophon Therapeutics Inc. | 219,538 | 681 | |||
| * | ReShape Lifesciences Inc. | 411,000 | 674 | |||
| * | Xenetic Biosciences Inc. | 519,743 | 670 | |||
| * | Sonnet BioTherapeutics Holdings Inc. | 1,620,560 | 669 | |||
| * | Augmedix Inc. | 212,392 | 669 | |||
| * | Entasis Therapeutics Holdings Inc. | 304,345 | 667 | |||
| *,1 | Cyclo Therapeutics Inc. | 176,043 | 657 | |||
| * | Forte Biosciences Inc. | 304,501 | 652 | |||
| * | Virios Therapeutics Inc. | 127,068 | 651 | |||
| * | Aethlon Medical Inc. | 342,003 | 636 | |||
| * | Inhibikase Therapeutics Inc. | 424,359 | 624 | |||
| *,1 | vTv Therapeutics Inc. Class A | 625,032 | 622 | |||
| *,1 | Pulmatrix Inc. | 1,418,189 | 621 | |||
| * | Odonate Therapeutics Inc. | 449,600 | 607 | |||
| *,1 | Aditxt Inc. | 1,132,345 | 607 | |||
| *,1 | Sharecare Inc. | 134,370 | 603 | |||
| * | Graybug Vision Inc. | 328,531 | 601 | |||
| *,1 | GeoVax Labs Inc. | 165,070 | 598 | |||
| *,1 | Scopus Biopharma Inc. | 359,481 | 588 | |||
| *,1 | Regulus Therapeutics Inc. | 1,847,824 | 582 | |||
| * | Plus Therapeutics Inc. | 553,702 | 581 | |||
| * | Imac Holdings Inc. | 508,049 | 579 | |||
| *,1 | Cue Health Inc. | 43,191 | 579 | |||
| * | BioVie Inc. Class A | 126,527 | 569 | |||
| * | BioCardia Inc. | 290,342 | 563 | |||
| Shares | Market Value• ($000) | |||||
| * | Paragon 28 Inc. | 30,590 | 541 | |||
| *,1 | ARCA biopharma Inc. | 251,085 | 540 | |||
| *,1 | Salarius Pharmaceuticals Inc. | 1,085,219 | 538 | |||
| * | Daxor Corp. | 47,328 | 534 | |||
| * | Kintara Therapeutics Inc. | 1,026,487 | 524 | |||
| * | Enveric Biosciences Inc. | 563,792 | 524 | |||
| * | Baudax Bio Inc. | 2,337,257 | 512 | |||
| *,1 | TransCode Therapeutics Inc. | 200,117 | 508 | |||
| * | Idera Pharmaceuticals Inc. | 886,117 | 505 | |||
| *,1 | Vaccinex Inc. | 480,726 | 505 | |||
| * | NeuroBo Pharmaceuticals Inc. | 409,413 | 499 | |||
| * | Soleno Therapeutics Inc. | 1,201,052 | 492 | |||
| *,1 | Bellicum Pharmaceuticals Inc. | 330,424 | 492 | |||
| * | Cohbar Inc. | 1,381,105 | 483 | |||
| *,1 | Context Therapeutics Inc. | 180,700 | 481 | |||
| 1 | iSpecimen Inc. | 60,400 | 472 | |||
| * | AgeX Therapeutics Inc. | 426,190 | 465 | |||
| * | Bio-Path Holdings Inc. | 121,084 | 456 | |||
| * | Nephros Inc. | 75,316 | 453 | |||
| * | Navidea Biopharmaceuticals Inc. | 450,277 | 450 | |||
| *,1 | Acorda Therapeutics Inc. | 183,484 | 439 | |||
| * | Kiromic BioPharma Inc. | 281,953 | 431 | |||
| * | Alimera Sciences Inc. | 83,422 | 427 | |||
| * | Brickell Biotech Inc. | 1,853,966 | 424 | |||
| * | OncoSec Medical Inc. | 435,534 | 418 | |||
| *,1 | Evoke Pharma Inc. | 739,706 | 414 | |||
| *,1 | Clarus Therapeutics Holdings Inc. | 166,600 | 405 | |||
| *,1 | Synaptogenix Inc. | 47,303 | 403 | |||
| *,1 | SiNtx Technologies Inc. | 594,838 | 382 | |||
| * | Hoth Therapeutics Inc. | 550,481 | �� 363 | |||
| * | Artelo Biosciences Inc. | 678,172 | 352 | |||
| * | Novo Integrated Sciences Inc. | 255,940 | 351 | |||
| *,1 | Panbela Therapeutics Inc. | 196,590 | 344 | |||
| *,1 | Timber Pharmaceuticals Inc. | 902,107 | 343 | |||
| * | IN8bio Inc. | 77,511 | 340 | |||
| Shares | Market Value• ($000) | |||||
| * | Exicure Inc. | 1,640,265 | 331 | |||
| * | Cognition Therapeutics Inc. | 51,490 | 325 | |||
| *,1 | First Wave BioPharma Inc. | 210,625 | 304 | |||
| * | TRxADE HEALTH Inc. | 128,731 | 301 | |||
| * | Jupiter Wellness Inc. | 334,782 | 298 | |||
| * | CNS Pharmaceuticals Inc. | 421,966 | 296 | |||
| *,1 | Avenue Therapeutics Inc. | 314,396 | 285 | |||
| * | Helius Medical Technologies Inc. Class A | 53,162 | 275 | |||
| * | Aziyo Biologics Inc. Class A | 42,872 | 270 | |||
| * | Palisade Bio Inc. | 196,415 | 255 | |||
| *,2 | Strongbridge Biopharma plc CVR | 1,399,363 | 253 | |||
| * | Acer Therapeutics Inc. | 108,596 | 250 | |||
| *,2 | Aduro Biotech Inc. CVR | 415,255 | 249 | |||
| *,1 | Metacrine Inc. | 368,353 | 248 | |||
| *,1 | Histogen Inc. | 699,522 | 233 | |||
| *,1 | Vaxxinity Inc. Class A | 36,674 | 206 | |||
| * | Nuwellis Inc. | 170,751 | 195 | |||
| * | Tenax Therapeutics Inc. | 178,455 | 186 | |||
| * | ThermoGenesis Holdings Inc. | 182,545 | 184 | |||
| *,2 | Ocera Therapeutics Inc. CVR | 653,477 | 176 | |||
| * | Monopar Therapeutics Inc. | 52,392 | 169 | |||
| * | Protagenic Therapeutics Inc. | 121,310 | 168 | |||
| *,2 | Adamas Pharmaceuticals Inc. CVR | 2,522,158 | 152 | |||
| 1 | Petros Pharmaceuticals Inc. | 43,424 | 145 | |||
| * | Phio Pharmaceuticals Corp. | 141,542 | 142 | |||
| * | HCW Biologics Inc. | 59,200 | 137 | |||
| * | Titan Pharmaceuticals Inc. | 131,533 | 134 | |||
| * | Kiora Pharmaceuticals Inc. | 84,490 | 128 | |||
| * | NanoVibronix Inc. | 119,979 | 125 | |||
| * | Sonoma Pharmaceuticals Inc. | 27,155 | 124 | |||
| *,1 | InVivo Therapeutics Holdings Corp. | 258,651 | 118 | |||
| * | RA Medical Systems Inc. | 70,816 | 110 | |||
| Shares | Market Value• ($000) | |||||
| * | American Shared Hospital Services | 36,338 | 86 | |||
| * | NovaBay Pharmaceuticals Inc. | 218,047 | 82 | |||
| *,2 | OncoMed Pharmaceuticals Inc. CVR | 255,777 | 67 | |||
| * | Unicycive Therapeutics Inc. | 22,695 | 47 | |||
| *,1,2 | Miragen Therapeutics Inc. CVR | 1,753,041 | 35 | |||
| * | Viveve Medical Inc. | 27,095 | 31 | |||
| * | Lixte Biotechnology Holdings Inc. | 25,995 | 31 | |||
| * | Trevi Therapeutics Inc. | 32,341 | 25 | |||
| *,2 | Elanco Animal Health Inc. CVR | 575,457 | 15 | |||
| *,2 | Alexza Pharmaceuticals Inc. CVR | 327,391 | 11 | |||
| *,1,2 | Oncternal Therapeutics Inc. CVR | 8,933 | 9 | |||
| *,2 | F-star Therapeutics Inc. CVR | 61,021 | 4 | |||
| *,2 | Ambit Biosciences Corp. CVR | 201,330 | — | |||
| *,2 | Biosante Pharmaceutical Inc. CVR | 253,823 | — | |||
| *,1,2 | Synergy Pharmaceuticals LLC | 5,148,145 | — | |||
| * | Advaxis Inc. Warrants Exp. 9/11/24 | 157,660 | — | |||
| * | Geron Corp. Warrants Exp. 12/31/25 | 1,202,419 | — | |||
| *,2 | Lantheus Holdings Inc. CVR | 2,319,511 | — | |||
| *,1,2 | Aerpio Pharmaceuticals Inc. CVR | 1,201,352 | �� — | |||
| 174,791,182 | ||||||
| Industrials (12.8%) | ||||||
| Visa Inc. Class A | 47,229,793 | 10,235,168 | ||||
| Mastercard Inc. Class A | 24,931,683 | 8,958,452 | ||||
| Accenture plc Class A | 18,664,148 | 7,737,223 | ||||
| * | PayPal Holdings Inc. | 33,392,235 | 6,297,108 | |||
| Union Pacific Corp. | 18,270,664 | 4,602,928 | ||||
| United Parcel Service Inc. Class B | 20,722,276 | 4,441,613 | ||||
| Honeywell International Inc. | 19,564,783 | 4,079,453 | ||||
| Shares | Market Value• ($000) | |||||
| Raytheon Technologies Corp. | 42,537,683 | 3,660,793 | ||||
| * | Boeing Co. | 16,703,485 | 3,362,746 | |||
| Caterpillar Inc. | 15,374,036 | 3,178,428 | ||||
| Automatic Data Processing Inc. | 11,975,413 | 2,952,897 | ||||
| General Electric Co. | 31,211,377 | 2,948,539 | ||||
| 3M Co. | 16,376,884 | 2,909,026 | ||||
| Deere & Co. | 7,931,030 | 2,719,471 | ||||
| American Express Co. | 16,510,377 | 2,701,098 | ||||
| CSX Corp. | 63,038,002 | 2,370,229 | ||||
| Lockheed Martin Corp. | 6,661,763 | 2,367,657 | ||||
| Sherwin-Williams Co. | 6,706,470 | 2,361,750 | ||||
| Norfolk Southern Corp. | 6,916,283 | 2,059,047 | ||||
| Illinois Tool Works Inc. | 8,027,424 | 1,981,168 | ||||
| Eaton Corp. plc | 11,328,049 | 1,957,713 | ||||
| Fidelity National Information Services Inc. | 17,306,430 | 1,888,997 | ||||
| * | Block Inc. Class A | 11,344,852 | 1,832,307 | |||
| FedEx Corp. | 6,794,454 | 1,757,318 | ||||
| Capital One Financial Corp. | 12,096,860 | 1,755,133 | ||||
| * | Fiserv Inc. | 16,887,417 | 1,752,745 | |||
| Johnson Controls International plc | 20,018,859 | 1,627,733 | ||||
| Emerson Electric Co. | 16,906,920 | 1,571,836 | ||||
| Northrop Grumman Corp. | 4,055,057 | 1,569,591 | ||||
| General Dynamics Corp. | 6,743,839 | 1,405,888 | ||||
| Trane Technologies plc | 6,751,548 | 1,364,015 | ||||
| IHS Markit Ltd. | 10,202,389 | 1,356,102 | ||||
| Carrier Global Corp. | 24,630,695 | 1,335,969 | ||||
| Paychex Inc. | 9,222,161 | 1,258,825 | ||||
| DuPont de Nemours Inc. | 14,725,665 | 1,189,539 | ||||
| L3Harris Technologies Inc. | 5,576,548 | 1,189,143 | ||||
| PPG Industries Inc. | 6,748,909 | 1,163,782 | ||||
| Parker-Hannifin Corp. | 3,652,666 | 1,161,986 | ||||
| Rockwell Automation Inc. | 3,296,059 | 1,149,830 | ||||
| Global Payments Inc. | 8,246,359 | 1,114,743 | ||||
| * | Mettler-Toledo International Inc. | 653,233 | 1,108,674 | |||
| Cintas Corp. | 2,497,931 | 1,107,008 | ||||
| * | Keysight Technologies Inc. | 5,169,026 | 1,067,456 | |||
| Old Dominion Freight Line Inc. | 2,942,095 | 1,054,388 | ||||
| Otis Worldwide Corp. | 12,072,522 | 1,051,154 | ||||
| Shares | Market Value• ($000) | |||||
| Verisk Analytics Inc. | 4,579,618 | 1,047,496 | ||||
| Equifax Inc. | 3,467,700 | 1,015,308 | ||||
| AMETEK Inc. | 6,573,205 | 966,524 | ||||
| * | TransDigm Group Inc. | 1,491,341 | 948,910 | |||
| * | Zebra Technologies Corp. Class A | 1,519,379 | 904,334 | |||
| Cummins Inc. | 4,065,214 | 886,786 | ||||
| Ball Corp. | 9,205,755 | 886,238 | ||||
| Stanley Black & Decker Inc. | 4,634,979 | 874,250 | ||||
| PACCAR Inc. | 8,880,440 | 783,788 | ||||
| Vulcan Materials Co. | 3,771,087 | 782,802 | ||||
| Martin Marietta Materials Inc. | 1,773,738 | 781,367 | ||||
| Dover Corp. | 4,092,079 | 743,122 | ||||
| Fortive Corp. | 9,681,333 | 738,589 | ||||
| Synchrony Financial | 15,555,842 | 721,635 | ||||
| Ingersoll Rand Inc. | 11,584,687 | 716,745 | ||||
| * | Bill.com Holdings Inc. | 2,769,103 | ��� 689,922 | |||
| * | United Rentals Inc. | 2,057,134 | 683,565 | |||
| Expeditors International of Washington Inc. | 4,814,466 | 646,535 | ||||
| * | Waters Corp. | 1,734,705 | 646,351 | |||
| TransUnion | 5,445,186 | 645,690 | ||||
| WW Grainger Inc. | 1,244,771 | 645,090 | ||||
| * | Generac Holdings Inc. | 1,794,052 | 631,363 | |||
| * | Trimble Inc. | 7,132,801 | 621,909 | |||
| Xylem Inc. | 5,125,050 | 614,596 | ||||
| * | Teledyne Technologies Inc. | 1,325,618 | 579,149 | |||
| IDEX Corp. | 2,162,213 | 510,974 | ||||
| Jacobs Engineering Group Inc. | 3,664,261 | 510,175 | ||||
| * | Affirm Holdings Inc. Class A | 5,029,168 | 505,733 | |||
| * | FleetCor Technologies Inc. | 2,192,243 | 490,712 | |||
| JB Hunt Transport Services Inc. | 2,387,451 | 487,995 | ||||
| Masco Corp. | 6,936,294 | 487,067 | ||||
| Textron Inc. | 6,265,189 | 483,673 | ||||
| * | Builders FirstSource Inc. | 5,443,061 | 466,525 | |||
| Westinghouse Air Brake Technologies Corp. | 5,043,281 | 464,537 | ||||
| Quanta Services Inc. | 4,049,178 | 464,279 | ||||
| * | Trex Co. Inc. | 3,272,372 | 441,868 | |||
| Fortune Brands Home & Security Inc. | 3,857,903 | 412,410 | ||||
| Crown Holdings Inc. | 3,634,142 | 402,009 | ||||
| CH Robinson Worldwide Inc. | 3,693,642 | 397,547 | ||||
| Graco Inc. | 4,828,656 | 389,286 | ||||
| Shares | Market Value• ($000) | |||||
| Nordson Corp. | 1,486,269 | 379,400 | ||||
| RPM International Inc. | 3,683,798 | 372,064 | ||||
| Cognex Corp. | 4,773,117 | 371,158 | ||||
| Carlisle Cos. Inc. | 1,485,937 | 368,691 | ||||
| Packaging Corp. of America | 2,700,199 | 367,632 | ||||
| Jack Henry & Associates Inc. | 2,103,072 | 351,192 | ||||
| Howmet Aerospace Inc. | 10,931,721 | 347,957 | ||||
| Pentair plc | 4,700,232 | 343,258 | ||||
| HEICO Corp. Class A | 2,665,500 | 342,570 | ||||
| Allegion plc | 2,549,599 | 337,669 | ||||
| Robert Half International Inc. | 3,005,983 | 335,227 | ||||
| Westrock Co. | 7,533,091 | 334,168 | ||||
| Snap-on Inc. | 1,525,432 | 328,548 | ||||
| Regal Rexnord Corp. | 1,926,389 | 327,833 | ||||
| A O Smith Corp. | 3,787,464 | 325,154 | ||||
| Booz Allen Hamilton Holding Corp. | 3,804,519 | 322,585 | ||||
| Hubbell Inc. Class B | 1,546,059 | 321,998 | ||||
| * | Fair Isaac Corp. | 738,607 | 320,312 | |||
| * | AECOM | 4,040,047 | 312,498 | |||
| * | Middleby Corp. | 1,581,110 | 311,099 | |||
| Lennox International Inc. | 936,314 | 303,703 | ||||
| Toro Co. | 3,022,749 | 302,003 | ||||
| * | GXO Logistics Inc. | 3,261,776 | 296,267 | |||
| Watsco Inc. | 938,802 | 293,732 | ||||
| * | Axon Enterprise Inc. | 1,848,745 | 290,253 | |||
| * | Berry Global Group Inc. | 3,852,739 | 284,255 | |||
| Sealed Air Corp. | 4,209,805 | 284,036 | ||||
| Genpact Ltd. | 5,347,655 | 283,854 | ||||
| * | Mohawk Industries Inc. | 1,540,469 | 280,643 | |||
| * | Sensata Technologies Holding plc | 4,503,652 | 277,830 | |||
| MKS Instruments Inc. | 1,576,179 | 274,523 | ||||
| Tetra Tech Inc. | 1,531,830 | 260,105 | ||||
| * | WillScot Mobile Mini Holdings Corp. | 6,340,007 | 258,926 | |||
| * | Paylocity Holding Corp. | 1,096,274 | 258,896 | |||
| Knight-Swift Transportation Holdings Inc. Class A | 4,243,601 | 258,605 | ||||
| Owens Corning | 2,856,341 | 258,499 | ||||
| * | TopBuild Corp. | 935,830 | 258,205 | |||
| * | Saia Inc. | 748,741 | 252,348 | |||
| ITT Inc. | 2,432,854 | 248,613 | ||||
| Lincoln Electric Holdings Inc. | 1,677,993 | 234,030 | ||||
| Shares | Market Value• ($000) | |||||
| AptarGroup Inc. | 1,869,590 | 228,987 | ||||
| Brunswick Corp. | 2,189,333 | 220,531 | ||||
| Littelfuse Inc. | 699,882 | 220,239 | ||||
| Oshkosh Corp. | 1,919,016 | 216,292 | ||||
| * | Axalta Coating Systems Ltd. | 6,490,779 | 214,975 | |||
| * | XPO Logistics Inc. | 2,773,904 | 214,783 | |||
| Huntington Ingalls Industries Inc. | 1,136,864 | 212,298 | ||||
| Acuity Brands Inc. | 994,559 | 210,568 | ||||
| Donaldson Co. Inc. | 3,512,218 | 208,134 | ||||
| Advanced Drainage Systems Inc. | 1,518,797 | 206,754 | ||||
| Western Union Co. | 11,423,469 | 203,795 | ||||
| AGCO Corp. | 1,702,101 | 197,478 | ||||
| Louisiana-Pacific Corp. | 2,502,062 | 196,037 | ||||
| Landstar System Inc. | 1,083,478 | 193,964 | ||||
| EMCOR Group Inc. | 1,520,272 | 193,667 | ||||
| Eagle Materials Inc. | 1,155,989 | 192,426 | ||||
| * | WESCO International Inc. | 1,435,999 | 188,963 | |||
| Woodward Inc. | 1,703,379 | 186,452 | ||||
| * | Coherent Inc. | 697,186 | 185,828 | |||
| * | Colfax Corp. | 3,959,768 | 182,031 | |||
| nVent Electric plc | 4,776,182 | 181,495 | ||||
| * | WEX Inc. | 1,273,491 | 178,785 | |||
| MDU Resources Group Inc. | 5,790,677 | 178,584 | ||||
| * | ASGN Inc. | 1,406,533 | 173,566 | |||
| Exponent Inc. | 1,479,699 | 172,725 | ||||
| Simpson Manufacturing Co. Inc. | 1,235,164 | 171,774 | ||||
| Graphic Packaging Holding Co. | 8,744,417 | 170,516 | ||||
| * | Euronet Worldwide Inc. | 1,427,296 | 170,091 | |||
| * | Chart Industries Inc. | 1,034,295 | 164,960 | |||
| * | AMN Healthcare Services Inc. | 1,344,408 | 164,461 | |||
| Sonoco Products Co. | 2,794,619 | 161,780 | ||||
| MSA Safety Inc. | 1,058,319 | 159,764 | ||||
| Armstrong World Industries Inc. | 1,346,029 | 156,301 | ||||
| Curtiss-Wright Corp. | 1,115,484 | 154,684 | ||||
| Watts Water Technologies Inc. Class A | 783,571 | 152,146 | ||||
| Valmont Industries Inc. | 602,801 | 151,002 | ||||
| ManpowerGroup Inc. | 1,541,703 | 150,054 | ||||
| * | FTI Consulting Inc. | 973,915 | 149,418 | |||
| Vontier Corp. | 4,796,466 | 147,395 | ||||
| * | MasTec Inc. | 1,583,614 | 146,136 | |||
| * | Atkore Inc. | 1,307,300 | 145,359 | |||
| Crane Co. | 1,420,756 | 144,533 | ||||
| Shares | Market Value• ($000) | |||||
| * | AZEK Co. Inc. Class A | 3,082,118 | 142,517 | |||
| Maximus Inc. | 1,757,834 | 140,047 | ||||
| * | API Group Corp. | 5,426,717 | 139,846 | |||
| John Bean Technologies Corp. | 903,409 | 138,727 | ||||
| Air Lease Corp. Class A | 3,079,310 | 136,198 | ||||
| * | Summit Materials Inc. Class A | 3,371,531 | 135,333 | |||
| * | ExlService Holdings Inc. | 899,778 | 130,261 | |||
| Spirit AeroSystems Holdings Inc. Class A | 2,989,104 | 128,800 | ||||
| BWX Technologies Inc. | 2,620,801 | 125,484 | ||||
| Insperity Inc. | 1,043,148 | 123,206 | ||||
| HB Fuller Co. | 1,495,356 | 121,124 | ||||
| Ryder System Inc. | 1,450,933 | 119,600 | ||||
| Zurn Water Solutions Corp. | 3,275,254 | 119,219 | ||||
| Korn Ferry | 1,549,822 | 117,368 | ||||
| * | ACI Worldwide Inc. | 3,347,791 | 116,168 | |||
| *,1 | TuSimple Holdings Inc. Class A | 3,224,468 | 115,597 | |||
| Triton International Ltd. | 1,898,667 | 114,357 | ||||
| Flowserve Corp. | 3,705,338 | 113,383 | ||||
| Applied Industrial Technologies Inc. | 1,094,480 | 112,403 | ||||
| Herc Holdings Inc. | 717,193 | 112,277 | ||||
| Allison Transmission Holdings Inc. | 2,964,907 | 107,774 | ||||
| Matson Inc. | 1,194,391 | 107,531 | ||||
| * | TriNet Group Inc. | 1,120,880 | 106,775 | |||
| * | Resideo Technologies Inc. | 4,094,970 | 106,592 | |||
| MSC Industrial Direct Co. Inc. Class A | 1,266,375 | 106,451 | ||||
| Franklin Electric Co. Inc. | 1,119,468 | 105,857 | ||||
| GATX Corp. | 1,012,052 | 105,446 | ||||
| SPX FLOW Inc. | 1,193,931 | 103,251 | ||||
| EVERTEC Inc. | 2,045,444 | 102,231 | ||||
| Aerojet Rocketdyne Holdings Inc. | 2,174,785 | 101,693 | ||||
| * | Kirby Corp. | 1,709,818 | 101,597 | |||
| Silgan Holdings Inc. | 2,359,857 | 101,096 | ||||
| * | Fluor Corp. | 4,020,547 | 99,589 | |||
| Comfort Systems USA Inc. | 972,820 | 96,251 | ||||
| Hillenbrand Inc. | 1,847,907 | 96,073 | ||||
| Altra Industrial Motion Corp. | 1,846,144 | 95,206 | ||||
| Shares | Market Value• ($000) | |||||
| AAON Inc. | 1,193,157 | 94,772 | ||||
| Installed Building Products Inc. | 675,765 | 94,418 | ||||
| EnerSys | 1,190,958 | 94,157 | ||||
| Forward Air Corp. | 768,860 | 93,101 | ||||
| Brink's Co. | 1,397,864 | 91,658 | ||||
| HEICO Corp. | 633,416 | 91,351 | ||||
| * | Beacon Roofing Supply Inc. | 1,591,119 | 91,251 | |||
| UniFirst Corp. | 433,130 | 91,131 | ||||
| Alliance Data Systems Corp. | 1,343,728 | 89,452 | ||||
| * | Mercury Systems Inc. | 1,616,053 | 88,980 | |||
| Badger Meter Inc. | 831,418 | 88,596 | ||||
| * | Itron Inc. | 1,291,896 | 88,521 | |||
| Helios Technologies Inc. | 827,484 | 87,026 | ||||
| * | Welbilt Inc. | 3,653,877 | 86,853 | |||
| Kennametal Inc. | 2,380,752 | 85,493 | ||||
| * | Shift4 Payments Inc. Class A | 1,464,755 | 84,853 | |||
| Otter Tail Corp. | 1,183,330 | 84,513 | ||||
| Belden Inc. | 1,282,663 | 84,309 | ||||
| Terex Corp. | 1,887,182 | 82,942 | ||||
| * | Bloom Energy Corp. Class A | 3,780,094 | 82,897 | |||
| ArcBest Corp. | 691,108 | 82,829 | ||||
| Albany International Corp. Class A | 921,488 | 81,506 | ||||
| * | Vicor Corp. | 637,293 | 80,923 | |||
| * | Masonite International Corp. | 673,178 | 79,401 | |||
| *,1 | CryoPort Inc. | 1,331,274 | 78,771 | |||
| Encore Wire Corp. | 548,722 | 78,522 | ||||
| ABM Industries Inc. | 1,913,248 | 78,156 | ||||
| * | Atlas Air Worldwide Holdings Inc. | 824,636 | 77,615 | |||
| * | Hub Group Inc. Class A | 917,291 | 77,273 | |||
| Werner Enterprises Inc. | 1,616,460 | 77,040 | ||||
| * | Dycom Industries Inc. | 815,331 | 76,445 | |||
| Kadant Inc. | 329,785 | 76,009 | ||||
| * | Alight Inc. Class A | 6,977,271 | 75,424 | |||
| Federal Signal Corp. | 1,737,930 | 75,322 | ||||
| *,1 | Virgin Galactic Holdings Inc. | 5,502,184 | 73,619 | |||
| * | SPX Corp. | 1,227,593 | 73,263 | |||
| Trinity Industries Inc. | 2,355,972 | 71,150 | ||||
| Brady Corp. Class A | 1,305,161 | 70,348 | ||||
| * | GMS Inc. | 1,165,355 | 70,049 | |||
| *,1 | Flywire Corp. | 1,822,415 | 69,361 | |||
| * | Hayward Holdings Inc. | 2,637,080 | 69,171 | |||
| Shares | Market Value• ($000) | |||||
| * | Kratos Defense & Security Solutions Inc. | 3,507,712 | 68,050 | |||
| Moog Inc. Class A | 832,398 | 67,399 | ||||
| * | JELD-WEN Holding Inc. | 2,477,693 | 65,312 | |||
| * | Verra Mobility Corp. Class A | 4,199,950 | 64,805 | |||
| Mueller Water Products Inc. Class A | 4,489,020 | 64,642 | ||||
| EnPro Industries Inc. | 586,811 | 64,590 | ||||
| Barnes Group Inc. | 1,368,706 | 63,768 | ||||
| ESCO Technologies Inc. | 704,375 | 63,387 | ||||
| * | Gibraltar Industries Inc. | 929,576 | 61,984 | |||
| * | Allegheny Technologies Inc. | 3,622,393 | 57,705 | |||
| Maxar Technologies Inc. | 1,947,074 | 57,497 | ||||
| ManTech International Corp. Class A | 787,347 | 57,421 | ||||
| *,1 | Nikola Corp. | 5,787,596 | 57,124 | |||
| McGrath RentCorp | 693,820 | 55,686 | ||||
| * | CBIZ Inc. | 1,407,862 | 55,076 | |||
| CSW Industrials Inc. | 448,893 | 54,253 | ||||
| * | Green Dot Corp. Class A | 1,486,868 | 53,884 | |||
| * | O-I Glass Inc. | 4,462,566 | 53,685 | |||
| * | MYR Group Inc. | 475,848 | 52,605 | |||
| ICF International Inc. | 507,074 | 52,000 | ||||
| Patrick Industries Inc. | 644,176 | 51,979 | ||||
| * | NV5 Global Inc. | 371,608 | 51,326 | |||
| * | Ferro Corp. | 2,346,254 | 51,219 | |||
| Greif Inc. Class A | 847,057 | 51,137 | ||||
| Granite Construction Inc. | 1,309,969 | 50,696 | ||||
| * | Montrose Environmental Group Inc. | 712,221 | 50,219 | |||
| Alamo Group Inc. | 338,785 | 49,862 | ||||
| * | Air Transport Services Group Inc. | 1,693,948 | 49,768 | |||
| * | Meritor Inc. | 1,991,598 | 49,352 | |||
| * | Veritiv Corp. | 395,863 | 48,521 | |||
| TTEC Holdings Inc. | 533,420 | 48,301 | ||||
| Lindsay Corp. | 313,571 | 47,663 | ||||
| Shyft Group Inc. | 951,243 | 46,735 | ||||
| * | Gates Industrial Corp. plc | 2,915,593 | 46,387 | |||
| Mesa Laboratories Inc. | 141,153 | 46,311 | ||||
| * | Ranpak Holdings Corp. Class A | 1,231,219 | 46,269 | |||
| TriMas Corp. | 1,220,883 | 45,173 | ||||
| Shares | Market Value• ($000) | |||||
| * | OSI Systems Inc. | 484,350 | 45,141 | |||
| * | Aspen Aerogels Inc. | 889,629 | 44,295 | |||
| Astec Industries Inc. | 613,540 | 42,500 | ||||
| * | AeroVironment Inc. | 671,416 | 41,648 | |||
| * | TaskUS Inc. Class A | 769,449 | 41,519 | |||
| Kforce Inc. | 549,992 | 41,370 | ||||
| Griffon Corp. | 1,448,198 | 41,245 | ||||
| Tennant Co. | 501,408 | 40,634 | ||||
| Greenbrier Cos. Inc. | 884,322 | 40,582 | ||||
| * | Repay Holdings Corp. Class A | 2,189,112 | 39,995 | |||
| * | Proto Labs Inc. | 778,596 | 39,981 | |||
| Schneider National Inc. Class B | 1,479,472 | 39,813 | ||||
| * | ZipRecruiter Inc. Class A | 1,596,231 | 39,810 | |||
| H&E Equipment Services Inc. | 876,394 | 38,798 | ||||
| Deluxe Corp. | 1,206,852 | 38,752 | ||||
| Standex International Corp. | 348,265 | 38,539 | ||||
| * | Donnelley Financial Solutions Inc. | 792,249 | 37,347 | |||
| * | AAR Corp. | 955,752 | 37,303 | |||
| AZZ Inc. | 673,058 | 37,213 | ||||
| * | PGT Innovations Inc. | 1,629,381 | 36,645 | |||
| ADT Inc. | 4,329,244 | 36,409 | ||||
| * | FARO Technologies Inc. | 516,703 | 36,180 | |||
| Columbus McKinnon Corp. | 768,497 | 35,551 | ||||
| Primoris Services Corp. | 1,465,637 | 35,146 | ||||
| Enerpac Tool Group Corp. Class A | 1,731,136 | 35,107 | ||||
| * | Evo Payments Inc. Class A | 1,347,771 | 34,503 | |||
| Kaman Corp. | 792,645 | 34,203 | ||||
| *,1 | Marqeta Inc. Class A | 1,981,835 | 34,028 | |||
| * | CoreCivic Inc. | 3,381,659 | 33,715 | |||
| Apogee Enterprises Inc. | 687,169 | 33,087 | ||||
| * | Triumph Group Inc. | 1,763,023 | 32,669 | |||
| * | Cimpress plc | 445,288 | 31,887 | |||
| Pitney Bowes Inc. | 4,718,356 | 31,283 | ||||
| * | Cornerstone Building Brands Inc. | 1,793,393 | 31,277 | |||
| * | Energy Recovery Inc. | 1,452,044 | 31,204 | |||
| * | Huron Consulting Group Inc. | 622,781 | 31,077 | |||
| *,1 | Aurora Innovation Inc. | 2,739,033 | 30,841 | |||
| * | American Woodmark Corp. | 467,449 | 30,478 | |||
| *,1 | Desktop Metal Inc. Class A | 6,144,196 | 30,414 | |||
| Shares | Market Value• ($000) | |||||
| Marten Transport Ltd. | 1,653,269 | 28,370 | ||||
| * | Cross Country Healthcare Inc. | 1,020,354 | 28,325 | |||
| * | TrueBlue Inc. | 1,020,212 | 28,229 | |||
| * | Great Lakes Dredge & Dock Corp. | 1,766,202 | 27,765 | |||
| * | Core & Main Inc. Class A | 910,395 | 27,621 | |||
| * | Construction Partners Inc. Class A | 938,190 | 27,592 | |||
| Gorman-Rupp Co. | 595,244 | 26,518 | ||||
| * | BlueLinx Holdings Inc. | 275,921 | 26,422 | |||
| Wabash National Corp. | 1,337,469 | 26,107 | ||||
| * | First Advantage Corp. | 1,298,271 | 24,719 | |||
| Heidrick & Struggles International Inc. | 557,140 | 24,364 | ||||
| Douglas Dynamics Inc. | 623,481 | 24,353 | ||||
| * | Conduent Inc. | 4,498,577 | 24,022 | |||
| *,1 | Mirion Technologies Inc. | 2,263,704 | 23,701 | |||
| Quanex Building Products Corp. | 948,578 | 23,506 | ||||
| Heartland Express Inc. | 1,344,573 | 22,616 | ||||
| * | GreenSky Inc. Class A | 1,985,027 | 22,550 | |||
| * | RR Donnelley & Sons Co. | 2,001,431 | 22,536 | |||
| * | BTRS Holdings Inc. Class A | 2,849,883 | 22,286 | |||
| *,1 | PureCycle Technologies Inc. | 2,309,138 | 22,098 | |||
| *,1 | Hyliion Holdings Corp. | 3,471,104 | 21,521 | |||
| Chase Corp. | 215,986 | 21,504 | ||||
| *,1 | Latch Inc. | 2,830,909 | 21,430 | |||
| Insteel Industries Inc. | 533,587 | 21,242 | ||||
| * | BrightView Holdings Inc. | 1,505,101 | 21,192 | |||
| * | Napco Security Technologies Inc. | 422,379 | 21,110 | |||
| Myers Industries Inc. | 1,048,842 | 20,987 | ||||
| *,1 | Danimer Scientific Inc. | 2,434,321 | 20,740 | |||
| * | Sterling Construction Co. Inc. | 778,196 | 20,467 | |||
| * | Forterra Inc. | 837,310 | 19,911 | |||
| * | Titan Machinery Inc. | 579,374 | 19,519 | |||
| * | Forrester Research Inc. | 324,971 | 19,086 | |||
| International Seaways Inc. | 1,285,706 | 18,874 | ||||
| CRA International Inc. | 202,089 | 18,867 | ||||
| Shares | Market Value• ($000) | |||||
| * | Transcat Inc. | 203,630 | 18,822 | |||
| * | SP Plus Corp. | 662,015 | 18,682 | |||
| * | Advantage Solutions Inc. | 2,238,939 | 17,956 | |||
| VSE Corp. | 291,711 | 17,777 | ||||
| * | Manitowoc Co. Inc. | 940,165 | 17,478 | |||
| *,1 | Workhorse Group Inc. | 3,993,175 | 17,410 | |||
| * | Yellow Corp. | 1,367,052 | 17,211 | |||
| * | Loyalty Ventures Inc. | 563,787 | 16,953 | |||
| * | PAE Inc. | 1,706,035 | 16,941 | |||
| * | Enovix Corp. | 619,211 | 16,892 | |||
| *,1 | Custom Truck One Source Inc. | 2,101,525 | 16,812 | |||
| Argan Inc. | 426,094 | 16,486 | ||||
| Kelly Services Inc. Class A | 976,875 | 16,382 | ||||
| * | Thermon Group Holdings Inc. | 953,664 | 16,146 | |||
| Resources Connection Inc. | 902,634 | 16,103 | ||||
| *,1 | Skillsoft Corp. | 1,716,308 | 15,704 | |||
| * | Titan International Inc. | 1,428,714 | 15,659 | |||
| * | Franklin Covey Co. | 337,690 | 15,655 | |||
| * | CIRCOR International Inc. | 567,028 | 15,412 | |||
| Ennis Inc. | 752,051 | 14,688 | ||||
| Cass Information Systems Inc. | 373,170 | 14,673 | ||||
| * | Cantaloupe Inc. | 1,644,546 | 14,604 | |||
| *,1 | Blade Air Mobility Inc. | 1,651,127 | 14,579 | |||
| *,1 | CS Disco Inc. | 406,883 | 14,546 | |||
| * | Ducommun Inc. | 309,233 | 14,463 | |||
| * | Hillman Solutions Corp. | 1,336,584 | 14,368 | |||
| * | Vectrus Inc. | 313,424 | 14,345 | |||
| Barrett Business Services Inc. | 207,068 | 14,300 | ||||
| * | Paya Holdings Inc. | 2,249,605 | 14,262 | |||
| * | Modine Manufacturing Co. | 1,406,735 | 14,194 | |||
| * | Payoneer Global Inc. | 1,927,976 | 14,171 | |||
| * | International Money Express Inc. | 884,570 | 14,118 | |||
| Miller Industries Inc. | 422,123 | 14,099 | ||||
| * | Tutor Perini Corp. | 1,131,073 | 13,991 | |||
| *,1 | Paymentus Holdings Inc. Class A | 399,835 | 13,986 | |||
| * | Babcock & Wilcox Enterprises Inc. | 1,474,680 | 13,302 | |||
| * | Daseke Inc. | 1,310,814 | 13,161 | |||
| *,1 | Velodyne Lidar Inc. | 2,822,003 | 13,094 | |||
| REV Group Inc. | 921,448 | 13,038 | ||||
| Shares | Market Value• ($000) | |||||
| *,1 | AvidXchange Holdings Inc. | 857,701 | 12,917 | |||
| Allied Motion Technologies Inc. | 350,082 | 12,774 | ||||
| Pactiv Evergreen Inc. | 995,789 | 12,627 | ||||
| *,1 | Joby Aviation Inc. | 1,719,513 | 12,552 | |||
| * | Vishay Precision Group Inc. | 335,165 | 12,441 | |||
| National Presto Industries Inc. | 150,334 | 12,332 | ||||
| * | DXP Enterprises Inc. | 478,217 | 12,276 | |||
| * | Atlanticus Holdings Corp. | 171,756 | 12,250 | |||
| 1 | Eagle Bulk Shipping Inc. | 262,857 | 11,960 | |||
| * | IES Holdings Inc. | 235,697 | 11,936 | |||
| * | Willdan Group Inc. | 335,760 | 11,819 | |||
| Hyster-Yale Materials Handling Inc. | 286,209 | 11,763 | ||||
| * | Vivint Smart Home Inc. | 1,177,444 | 11,515 | |||
| Information Services Group Inc. | 1,442,453 | 10,991 | ||||
| * | PFSweb Inc. | 840,934 | 10,831 | |||
| * | HireRight Holdings Corp. | 676,654 | 10,826 | |||
| *,1 | View Inc. | 2,746,998 | 10,741 | |||
| Kronos Worldwide Inc. | 663,432 | 9,958 | ||||
| * | Radiant Logistics Inc. | 1,348,881 | 9,833 | |||
| * | Luna Innovations Inc. | 1,117,437 | 9,431 | |||
| * | ShotSpotter Inc. | 314,458 | 9,283 | |||
| Perella Weinberg Partners Class A | 689,931 | 8,872 | ||||
| *,1 | Eos Energy Enterprises Inc. | 1,146,168 | 8,619 | |||
| *,1 | Sarcos Technology & Robotics Corp. | 827,715 | 8,261 | |||
| *,1 | Proterra Inc. | 934,011 | 8,247 | |||
| * | I3 Verticals Inc. Class A | 360,183 | 8,209 | |||
| * | Sterling Check Corp. | 398,023 | 8,163 | |||
| *,1 | Velo3D Inc. | 1,042,297 | 8,140 | |||
| * | Archer Aviation Inc. Class A | 1,344,181 | 8,119 | |||
| * | Astronics Corp. | 651,406 | 7,817 | |||
| * | DHI Group Inc. | 1,241,409 | 7,746 | |||
| * | Covenant Logistics Group Inc. Class A | 287,706 | 7,604 | |||
| *,1 | Infrastructure & Energy Alternatives Inc. | 818,153 | 7,527 | |||
| * | Atlas Technical Consultants Inc. Class A | 880,011 | 7,410 | |||
| *,1 | Lightning eMotors Inc. | 1,220,193 | 7,333 | |||
| Powell Industries Inc. | 248,614 | 7,332 | ||||
| Shares | Market Value• ($000) | |||||
| Park Aerospace Corp. | 544,146 | 7,183 | ||||
| * | Blue Bird Corp. | 456,096 | 7,133 | |||
| * | Lawson Products Inc. | 129,478 | 7,089 | |||
| *,1 | Rekor Systems Inc. | 1,063,950 | 6,969 | |||
| * | Commercial Vehicle Group Inc. | 850,080 | 6,852 | |||
| * | Acacia Research Corp. | 1,326,212 | 6,803 | |||
| United States Lime & Minerals Inc. | 52,084 | 6,720 | ||||
| *,1 | Ipsidy Inc. | 440,934 | 6,186 | |||
| * | Concrete Pumping Holdings Inc. | 737,042 | 6,044 | |||
| * | AerSale Corp. | 320,692 | 5,689 | |||
| * | Huttig Building Products Inc. | 513,867 | 5,688 | |||
| * | PAM Transportation Services Inc. | 79,803 | 5,667 | |||
| *,1 | Byrna Technologies Inc. | 419,584 | 5,601 | |||
| * | Horizon Global Corp. | 689,607 | 5,503 | |||
| * | CECO Environmental Corp. | 843,032 | 5,252 | |||
| Park-Ohio Holdings Corp. | 239,809 | 5,077 | ||||
| * | INNOVATE Corp. | 1,371,804 | 5,076 | |||
| Hurco Cos. Inc. | 168,308 | 4,999 | ||||
| LSI Industries Inc. | 728,530 | 4,998 | ||||
| * | Iteris Inc. | 1,202,500 | 4,810 | |||
| *,1 | Electric Last Mile Solutions I | 675,715 | 4,750 | |||
| *,1 | Agrify Corp. | 514,560 | 4,734 | |||
| *,1 | Enjoy Technology Inc. | 1,024,765 | 4,734 | |||
| * | USA Truck Inc. | 230,660 | 4,586 | |||
| *,1 | BitNile Holdings Inc. | 3,545,981 | 4,220 | |||
| Preformed Line Products Co. | 64,220 | 4,155 | ||||
| * | EVI Industries Inc. | 132,321 | 4,132 | |||
| * | DLH Holdings Corp. | 198,282 | 4,108 | |||
| * | L B Foster Co. Class A | 298,585 | 4,106 | |||
| *,1 | Biotricity Inc. | 1,017,800 | 4,051 | |||
| BGSF Inc. | 281,551 | 4,040 | ||||
| * | Smith-Midland Corp. | 84,441 | 3,969 | |||
| * | Bowman Consulting Group Ltd. | 186,636 | 3,965 | |||
| * | US Xpress Enterprises Inc. Class A | 673,748 | 3,955 | |||
| * | Hudson Technologies Inc. | 885,055 | 3,930 | |||
| * | Mistras Group Inc. | 526,942 | 3,915 | |||
| *,1 | Orbital Energy Group Inc. | 1,787,249 | 3,914 | |||
| HireQuest Inc. | 187,428 | 3,779 | ||||
| 1 | Cadre Holdings Inc. | 146,800 | 3,732 | |||
| Graham Corp. | 298,776 | 3,717 | ||||
| Shares | Market Value• ($000) | |||||
| *,1 | BlackSky Technology Inc. | 826,929 | 3,713 | |||
| * | Quad/Graphics Inc. | 927,674 | 3,711 | |||
| * | Gencor Industries Inc. | 320,529 | 3,696 | |||
| * | Performant Financial Corp. | 1,516,169 | 3,654 | |||
| *,1 | Xos Inc. | 1,155,900 | 3,641 | |||
| Universal Logistics Holdings Inc. | 190,758 | 3,598 | ||||
| * | Twin Disc Inc. | 326,824 | 3,582 | |||
| ARC Document Solutions Inc. | 1,010,004 | 3,535 | ||||
| * | Berkshire Grey Inc. | 635,053 | 3,493 | |||
| * | Overseas Shipholding Group Inc. Class A | 1,786,833 | 3,359 | |||
| *,1 | Rocket Lab USA Inc. | 272,041 | 3,341 | |||
| *,1 | AEye Inc. | 662,400 | 3,206 | |||
| *,1 | Redwire Corp. | 472,800 | 3,191 | |||
| * | Target Hospitality Corp. | 877,991 | 3,126 | |||
| * | Orion Group Holdings Inc. | 803,756 | 3,030 | |||
| * | Orion Energy Systems Inc. | 832,365 | 3,013 | |||
| Greif Inc. Class B | 49,750 | 2,974 | ||||
| * | Mayville Engineering Co. Inc. | 195,710 | 2,918 | |||
| *,1 | Energous Corp. | 2,204,696 | 2,756 | |||
| * | Hill International Inc. | 1,410,112 | 2,750 | |||
| * | Karat Packaging Inc. | 133,764 | 2,703 | |||
| * | Usio Inc. | 615,890 | 2,685 | |||
| * | ServiceSource International Inc. | 2,687,550 | 2,661 | |||
| *,1 | MICT Inc. | 3,146,889 | 2,612 | |||
| *,1 | Wrap Technologies Inc. | 643,539 | 2,529 | |||
| * | Manitex International Inc. | 396,585 | 2,522 | |||
| *,1 | AgEagle Aerial Systems Inc. | 1,557,699 | 2,446 | |||
| * | CPI Card Group Inc. | 129,785 | 2,407 | |||
| * | Willis Lease Finance Corp. | 62,993 | 2,372 | |||
| *,1 | IZEA Worldwide Inc. | 1,752,080 | 2,348 | |||
| *,1 | Katapult Holdings Inc. | 696,343 | 2,347 | |||
| * | Soluna Holdings Inc. | 214,527 | 2,308 | |||
| * | Frequency Electronics Inc. | 228,179 | 2,250 | |||
| * | Priority Technology Holdings Inc. | 316,750 | 2,243 | |||
| * | Limbach Holdings Inc. | 230,117 | 2,071 | |||
| * | RF Industries Ltd. | 249,088 | 1,993 | |||
| *,1 | Alpha Pro Tech Ltd. | 331,541 | 1,979 | |||
| Shares | Market Value• ($000) | |||||
| Innovative Solutions & Support Inc. | 297,872 | 1,954 | ||||
| *,1 | Spire Global Inc. | 576,233 | 1,948 | |||
| * | Ultralife Corp. | 320,851 | 1,938 | |||
| *,1 | Momentus Inc. | 458,805 | 1,918 | |||
| * | Hudson Global Inc. | 66,317 | 1,911 | |||
| * | VirTra Inc. | 262,879 | 1,840 | |||
| * | StarTek Inc. | 351,627 | 1,835 | |||
| * | Core Molding Technologies Inc. | 209,461 | 1,783 | |||
| * | GEE Group Inc. | 3,039,188 | 1,732 | |||
| * | Lightbridge Corp. | 247,133 | 1,637 | |||
| * | RCM Technologies Inc. | 227,673 | 1,621 | |||
| *,1 | AIkido Pharma Inc. | 2,685,084 | 1,576 | |||
| * | Shapeways Holdings Inc. | 414,937 | 1,539 | |||
| * | LS Starrett Co. Class A | 164,541 | 1,538 | |||
| *,1 | Coda Octopus Group Inc. | 183,570 | 1,469 | |||
| *,1 | LightPath Technologies Inc. Class A | 592,317 | 1,445 | |||
| * | Williams Industrial Services Group Inc. | 468,703 | 1,401 | |||
| * | Paysign Inc. | 865,624 | 1,385 | |||
| *,1 | Astra Space Inc. | 195,910 | 1,358 | |||
| *,1 | Digital Ally Inc. | 1,260,808 | 1,349 | |||
| * | Volt Information Sciences Inc. | 458,889 | 1,335 | |||
| *,1 | Odyssey Marine Exploration Inc. | 246,016 | 1,279 | |||
| *,1 | FreightCar America Inc. | 345,280 | 1,274 | |||
| * | CPI Aerostructures Inc. | 436,753 | 1,192 | |||
| *,1 | GreenBox POS | 281,786 | 1,183 | |||
| * | Armstrong Flooring Inc. | 588,752 | 1,166 | |||
| * | Sono-Tek Corp. | 157,600 | 1,157 | |||
| * | Research Solutions Inc. | 465,675 | 1,146 | |||
| * | Toughbuilt Industries Inc. | 3,109,404 | 1,135 | |||
| *,1 | Evolv Technologies Holdings Inc. | 250,371 | 1,117 | |||
| Where Food Comes From Inc. | 65,820 | 942 | ||||
| * | Team Inc. | 847,688 | 924 | |||
| * | DSS Inc. | 1,373,943 | 923 | |||
| * | IHS Holding Ltd. | 62,141 | 876 | |||
| * | Broadwind Inc. | 453,583 | 853 | |||
| * | Astrotech Corp. | 1,252,495 | 852 | |||
| *,1 | ENGlobal Corp. | 639,421 | 844 | |||
| * | Air T Inc. | 32,860 | 826 | |||
| Shares | Market Value• ($000) | |||||
| * | ClearSign Technologies Corp. | 588,394 | 812 | |||
| 1 | Pioneer Power Solutions Inc. | 107,157 | 804 | |||
| * | Wireless Telecom Group Inc. | 339,257 | 746 | |||
| *,1 | TOMI Environmental Solutions Inc. | 447,022 | 738 | |||
| *,1 | Applied DNA Sciences Inc. | 178,430 | 717 | |||
| *,1 | Fuel Tech Inc. | 509,027 | 713 | |||
| * | Air Industries Group | 747,738 | 678 | |||
| * | Ballantyne Strong Inc. | 226,990 | 656 | |||
| * | Sypris Solutions Inc. | 260,226 | 640 | |||
| *,1 | ALJ Regional Holdings Inc. | 336,903 | 613 | |||
| *,1 | Polar Power Inc. | 161,430 | 578 | |||
| *,1 | Legalzoom.com Inc. | 33,951 | 546 | |||
| * | AmpliTech Group Inc. | 132,700 | 523 | |||
| Espey Manufacturing & Electronics Corp. | 36,520 | 519 | ||||
| Taitron Components Inc. Class A | 126,100 | 507 | ||||
| Autoscope Technologies Corp. | 79,282 | 497 | ||||
| * | Moneylion Inc. | 100,558 | 405 | |||
| *,1 | Markforged Holding Corp. | 65,000 | 349 | |||
| * | Cemtrex Inc. | 375,912 | 308 | |||
| *,1 | Bio-key International Inc. | 138,179 | 303 | |||
| *,1 | OLB Group Inc. | 109,700 | 291 | |||
| * | Jewett-Cameron Trading Co. Ltd. | 32,960 | 278 | |||
| *,1 | SG Blocks Inc. | 122,327 | 230 | |||
| * | Socket Mobile Inc. | 53,500 | 218 | |||
| *,1 | Energy Focus Inc. | 48,431 | 207 | |||
| *,1 | Microvast Holdings Inc. | 32,339 | 183 | |||
| * | LGL Group Inc. | 13,749 | 157 | |||
| *,1 | ShiftPixy Inc. | 114,467 | 134 | |||
| * | P&F Industries Inc. Class A | 19,462 | 119 | |||
| * | Servotronics Inc. | 8,333 | 106 | |||
| *,1 | Staffing 360 Solutions Inc. | 89,436 | 82 | |||
| * | Remitly Global Inc. | 3,469 | 72 | |||
| * | Schmitt Industries Inc. | 5,581 | 31 | |||
| * | LGL Group Inc. Warrants Exp. 12/16/25 | 2,391 | 2 | |||
| Ardagh Group SA Class A | 37 | 1 | ||||
| Shares | Market Value• ($000) | |||||
| * | Electro-Sensors Inc. | 107 | 1 | |||
| *,2 | Patriot National Inc. | 129,819 | — | |||
| 175,828,999 | ||||||
| Real Estate (3.7%) | ||||||
| American Tower Corp. | 12,942,885 | 3,785,794 | ||||
| Prologis Inc. | 21,022,435 | 3,539,337 | ||||
| 1 | Crown Castle International Corp. | 12,282,528 | 2,563,855 | |||
| Equinix Inc. | 2,559,026 | 2,164,527 | ||||
| Public Storage | 4,235,630 | 1,586,498 | ||||
| Simon Property Group Inc. | 9,339,458 | 1,492,165 | ||||
| Digital Realty Trust Inc. | 8,065,235 | 1,426,498 | ||||
| SBA Communications Corp. | 3,091,181 | 1,202,531 | ||||
| Realty Income Corp. | 16,077,913 | 1,151,018 | ||||
| Welltower Inc. | 12,371,004 | 1,061,061 | ||||
| AvalonBay Communities Inc. | 3,970,984 | 1,003,031 | ||||
| Alexandria Real Estate Equities Inc. | 4,402,477 | 981,576 | ||||
| * | CBRE Group Inc. Class A | 9,035,282 | 980,418 | |||
| Equity Residential | 10,124,739 | 916,289 | ||||
| * | CoStar Group Inc. | 11,224,266 | 887,054 | |||
| Weyerhaeuser Co. | 21,285,089 | 876,520 | ||||
| Extra Space Storage Inc. | 3,805,213 | 862,756 | ||||
| Invitation Homes Inc. | 16,955,214 | 768,749 | ||||
| Mid-America Apartment Communities Inc. | 3,272,444 | 750,830 | ||||
| Sun Communities Inc. | 3,394,894 | 712,826 | ||||
| Duke Realty Corp. | 10,819,591 | 710,198 | ||||
| Essex Property Trust Inc. | 1,850,203 | 651,697 | ||||
| Ventas Inc. | 11,345,465 | 579,980 | ||||
| Healthpeak Properties Inc. | 15,317,219 | 552,798 | ||||
| VICI Properties Inc. | 17,870,734 | 538,088 | ||||
| UDR Inc. | 8,785,871 | 527,064 | ||||
| Camden Property Trust | 2,904,470 | 518,971 | ||||
| Boston Properties Inc. | 3,995,277 | 460,176 | ||||
| WP Carey Inc. | 5,291,271 | 434,149 | ||||
| Kimco Realty Corp. | 17,521,186 | 431,897 | ||||
| Iron Mountain Inc. | 8,228,225 | 430,583 | ||||
| Equity LifeStyle Properties Inc. | 4,700,121 | 412,013 | ||||
| Medical Properties Trust Inc. | 16,943,853 | 400,383 | ||||
| Shares | Market Value• ($000) | |||||
| * | Jones Lang LaSalle Inc. | 1,434,325 | 386,321 | |||
| Regency Centers Corp. | 4,865,824 | 366,640 | ||||
| Life Storage Inc. | 2,331,152 | 357,086 | ||||
| * | Host Hotels & Resorts Inc. | 20,297,189 | 352,968 | |||
| CubeSmart | 6,166,887 | 350,958 | ||||
| Rexford Industrial Realty Inc. | 4,303,238 | 349,036 | ||||
| American Homes 4 Rent Class A | 7,585,506 | 330,804 | ||||
| CyrusOne Inc. | 3,607,110 | 323,630 | ||||
| Gaming & Leisure Properties Inc. | 6,430,945 | 312,930 | ||||
| Federal Realty Investment Trust | 2,210,773 | 301,373 | ||||
| Lamar Advertising Co. Class A | 2,467,307 | 299,284 | ||||
| EastGroup Properties Inc. | 1,157,273 | 263,685 | ||||
| Americold Realty Trust | 7,581,846 | 248,609 | ||||
| First Industrial Realty Trust Inc. | 3,699,771 | 244,925 | ||||
| Apartment Income REIT Corp. | 4,457,847 | 243,710 | ||||
| National Retail Properties Inc. | 4,988,762 | 239,810 | ||||
| STORE Capital Corp. | 6,970,840 | 239,797 | ||||
| STAG Industrial Inc. | 4,971,865 | 238,451 | ||||
| American Campus Communities Inc. | 3,960,511 | 226,898 | ||||
| Kilroy Realty Corp. | 3,308,953 | 219,913 | ||||
| Vornado Realty Trust | 5,177,391 | 216,726 | ||||
| Brixmor Property Group Inc. | 8,444,901 | 214,585 | ||||
| Healthcare Trust of America Inc. Class A | 6,279,092 | 209,659 | ||||
| Omega Healthcare Investors Inc. | 6,787,423 | 200,840 | ||||
| * | Zillow Group Inc. Class C | 3,087,747 | 197,153 | |||
| *,1 | Opendoor Technologies Inc. | 13,059,513 | 190,799 | |||
| * | Zillow Group Inc. Class A | 2,961,288 | 184,251 | |||
| Terreno Realty Corp. | 2,128,095 | 181,505 | ||||
| Innovative Industrial Properties Inc. | 679,968 | 178,770 | ||||
| Cousins Properties Inc. | 4,223,411 | 170,119 | ||||
| Spirit Realty Capital Inc. | 3,502,804 | 168,800 | ||||
| Rayonier Inc. | 4,072,394 | 164,362 | ||||
| Douglas Emmett Inc. | 4,738,771 | 158,749 | ||||
| Shares | Market Value• ($000) | |||||
| National Storage Affiliates Trust | 2,283,436 | 158,014 | ||||
| Agree Realty Corp. | 1,982,012 | 141,436 | ||||
| * | Ryman Hospitality Properties Inc. | 1,487,583 | 136,798 | |||
| SL Green Realty Corp. | 1,897,879 | 136,078 | ||||
| Kite Realty Group Trust | 6,231,734 | 135,727 | ||||
| Healthcare Realty Trust Inc. | 4,194,495 | 132,714 | ||||
| Highwoods Properties Inc. | 2,967,406 | 132,317 | ||||
| Hannon Armstrong Sustainable Infrastructure Capital Inc. | 2,407,407 | 127,881 | ||||
| LXP Industrial Trust | 8,039,038 | 125,570 | ||||
| * | DigitalBridge Group Inc. | 14,601,917 | 121,634 | |||
| * | Park Hotels & Resorts Inc. | 6,393,192 | 120,703 | |||
| * | Howard Hughes Corp. | 1,175,042 | 119,596 | |||
| Physicians Realty Trust | 6,245,522 | 117,603 | ||||
| Outfront Media Inc. | 4,142,180 | 111,093 | ||||
| * | Redfin Corp. | 2,848,563 | 109,356 | |||
| PotlatchDeltic Corp. | 1,811,668 | 109,099 | ||||
| Broadstone Net Lease Inc. | 4,360,519 | 108,228 | ||||
| PS Business Parks Inc. | 586,078 | 107,938 | ||||
| Hudson Pacific Properties Inc. | 4,333,699 | 107,086 | ||||
| EPR Properties | 2,125,420 | 100,936 | ||||
| JBG SMITH Properties | 3,506,235 | 100,664 | ||||
| Essential Properties Realty Trust Inc. | 3,455,515 | 99,622 | ||||
| Macerich Co. | 5,755,710 | 99,459 | ||||
| Apple Hospitality REIT Inc. | 6,146,670 | 99,269 | ||||
| Uniti Group Inc. | 6,708,596 | 93,987 | ||||
| * | Cushman & Wakefield plc | 4,128,840 | 91,825 | |||
| Newmark Group Inc. Class A | 4,887,393 | 91,394 | ||||
| Corporate Office Properties Trust | 3,195,388 | 89,375 | ||||
| Sabra Health Care REIT Inc. | 6,505,325 | 88,082 | ||||
| * | Equity Commonwealth | 3,276,634 | 84,865 | |||
| Pebblebrook Hotel Trust | 3,739,527 | 83,653 | ||||
| SITE Centers Corp. | 5,136,302 | 81,308 | ||||
| Shares | Market Value• ($000) | |||||
| Kennedy-Wilson Holdings Inc. | 3,361,218 | 80,266 | ||||
| Independence Realty Trust Inc. | 2,992,647 | 77,300 | ||||
| * | Sunstone Hotel Investors Inc. | 6,272,320 | 73,574 | |||
| National Health Investors Inc. | 1,233,509 | 70,890 | ||||
| RLJ Lodging Trust | 4,725,855 | 65,831 | ||||
| Brandywine Realty Trust | 4,875,048 | 65,423 | ||||
| Piedmont Office Realty Trust Inc. Class A | 3,536,088 | 64,993 | ||||
| Retail Opportunity Investments Corp. | 3,285,719 | 64,400 | ||||
| Four Corners Property Trust Inc. | 2,185,285 | 64,269 | ||||
| eXp World Holdings Inc. | 1,887,048 | 63,575 | ||||
| *,1 | Compass Inc. Class A | 6,933,491 | 63,025 | |||
| CareTrust REIT Inc. | 2,748,091 | 62,739 | ||||
| Washington REIT | 2,406,862 | 62,217 | ||||
| Urban Edge Properties | 3,170,419 | 60,238 | ||||
| * | Xenia Hotels & Resorts Inc. | 3,253,929 | 58,929 | |||
| * | DiamondRock Hospitality Co. | 6,002,990 | 57,689 | |||
| Easterly Government Properties Inc. Class A | 2,445,461 | 56,050 | ||||
| * | Realogy Holdings Corp. | 3,316,695 | 55,754 | |||
| Monmouth Real Estate Investment Corp. | 2,651,459 | 55,707 | ||||
| Acadia Realty Trust | 2,526,011 | 55,143 | ||||
| NexPoint Residential Trust Inc. | 650,732 | 54,551 | ||||
| 1 | Tanger Factory Outlet Centers Inc. | 2,807,251 | 54,124 | |||
| American Assets Trust Inc. | 1,378,443 | 51,733 | ||||
| 1 | InvenTrust Properties Corp. | 1,815,354 | 49,487 | |||
| Alexander & Baldwin Inc. | 1,963,456 | 49,263 | ||||
| St. Joe Co. | 919,548 | 47,862 | ||||
| Industrial Logistics Properties Trust | 1,857,153 | 46,522 | ||||
| Safehold Inc. | 563,820 | 45,021 | ||||
| Global Net Lease Inc. | 2,943,588 | 44,978 | ||||
| Centerspace | 404,611 | 44,871 | ||||
| Paramount Group Inc. | 5,294,861 | 44,159 | ||||
| Shares | Market Value• ($000) | |||||
| Empire State Realty Trust Inc. Class A | 4,907,755 | 43,679 | ||||
| Service Properties Trust | 4,694,523 | 41,265 | ||||
| * | Veris Residential Inc. | 2,204,564 | 40,520 | |||
| LTC Properties Inc. | 1,110,407 | 37,909 | ||||
| * | Marcus & Millichap Inc. | 731,340 | 37,635 | |||
| Getty Realty Corp. | 1,094,835 | 35,133 | ||||
| Office Properties Income Trust | 1,383,251 | 34,360 | ||||
| UMH Properties Inc. | 1,247,888 | 34,105 | ||||
| RPT Realty | 2,411,202 | 32,262 | ||||
| Community Healthcare Trust Inc. | 675,203 | 31,917 | ||||
| American Finance Trust Inc. Class A | 3,482,994 | 31,800 | ||||
| * | Apartment Investment & Management Co. Class A | 4,073,623 | 31,448 | |||
| Gladstone Land Corp. | 924,200 | 31,201 | ||||
| Global Medical REIT Inc. | 1,734,543 | 30,788 | ||||
| Plymouth Industrial REIT Inc. | 938,524 | 30,033 | ||||
| * | Orion Office REIT Inc. | 1,538,897 | 28,731 | |||
| * | Summit Hotel Properties Inc. | 2,881,364 | 28,122 | |||
| * | Radius Global Infrastructure Inc. | 1,738,443 | 27,989 | |||
| Gladstone Commercial Corp. | 1,073,949 | 27,676 | ||||
| Armada Hoffler Properties Inc. | 1,754,632 | 26,705 | ||||
| Preferred Apartment Communities Inc. | 1,430,856 | 25,841 | ||||
| GEO Group Inc. | 3,291,250 | 25,507 | ||||
| City Office REIT Inc. | 1,177,279 | 23,216 | ||||
| NETSTREIT Corp. | 995,124 | 22,788 | ||||
| * | Douglas Elliman Inc. | 1,860,390 | 21,394 | |||
| Diversified Healthcare Trust | 6,890,667 | 21,292 | ||||
| Universal Health Realty Income Trust | 354,893 | 21,105 | ||||
| Bluerock Residential Growth REIT Inc. Class A | 746,308 | 19,695 | ||||
| Saul Centers Inc. | 366,855 | 19,451 | ||||
| Ares Commercial Real Estate Corp. | 1,291,539 | 18,779 | ||||
| * | Chatham Lodging Trust | 1,343,804 | 18,437 | |||
| *,1 | CBL & Associates Properties Inc. | 567,300 | 17,700 | |||
| * | CorePoint Lodging Inc. | 1,090,453 | 17,120 | |||
| Shares | Market Value• ($000) | |||||
| Franklin Street Properties Corp. | 2,758,628 | 16,414 | ||||
| Urstadt Biddle Properties Inc. Class A | 769,274 | 16,386 | ||||
| RE/MAX Holdings Inc. Class A | 518,668 | 15,814 | ||||
| One Liberty Properties Inc. | 445,242 | 15,708 | ||||
| Phillips Edison & Co. Inc. | 473,656 | 15,650 | ||||
| RMR Group Inc. Class A | 442,978 | 15,362 | ||||
| Alexander's Inc. | 58,505 | 15,229 | ||||
| Whitestone REIT | 1,339,431 | 13,568 | ||||
| * | Bridge Investment Group Holdings Inc. Class A | 536,905 | 13,407 | |||
| Farmland Partners Inc. | 1,088,998 | 13,014 | ||||
| * | Tejon Ranch Co. | 633,019 | 12,078 | |||
| CatchMark Timber Trust Inc. Class A | 1,357,461 | 11,823 | ||||
| * | Seritage Growth Properties Class A | 871,418 | 11,564 | |||
| * | Forestar Group Inc. | 506,605 | 11,019 | |||
| CTO Realty Growth Inc. | 164,401 | 10,098 | ||||
| Postal Realty Trust Inc. Class A | 503,103 | 9,961 | ||||
| * | Hersha Hospitality Trust Class A | 1,071,995 | 9,830 | |||
| * | Ashford Hospitality Trust Inc. | 963,193 | 9,247 | |||
| * | FRP Holdings Inc. | 155,398 | 8,982 | |||
| *,1 | Braemar Hotels & Resorts Inc. | 1,751,422 | 8,932 | |||
| *,1 | Offerpad Solutions Inc. | 1,271,837 | 8,140 | |||
| Indus Realty Trust Inc. | 96,347 | 7,810 | ||||
| * | Stratus Properties Inc. | 206,151 | 7,539 | |||
| BRT Apartments Corp. | 311,104 | 7,463 | ||||
| Cedar Realty Trust Inc. | 285,758 | 7,175 | ||||
| * | Power REIT | 84,433 | 5,817 | |||
| Alpine Income Property Trust Inc. | 274,615 | 5,503 | ||||
| * | Vidler Water Resouces Inc. | 444,916 | 5,375 | |||
| * | Fathom Holdings Inc. | 206,487 | 4,225 | |||
| New York City REIT Inc. Class A | 380,218 | 4,034 | ||||
| Clipper Realty Inc. | 405,295 | 4,029 | ||||
| Retail Value Inc. | 594,080 | 3,814 | ||||
| Shares | Market Value• ($000) | |||||
| Urstadt Biddle Properties Inc. | 179,571 | 3,441 | ||||
| CIM Commercial Trust Corp. | 391,836 | 2,880 | ||||
| * | Rafael Holdings Inc. Class B | 531,859 | 2,712 | |||
| * | Maui Land & Pineapple Co. Inc. | 185,158 | 1,844 | |||
| Global Self Storage Inc. | 319,661 | 1,819 | ||||
| * | Pennsylvania REIT | 1,593,485 | 1,625 | |||
| * | Altisource Portfolio Solutions SA | 144,667 | 1,623 | |||
| * | Trinity Place Holdings Inc. | 753,758 | 1,387 | |||
| CorEnergy Infrastructure Trust Inc. | 403,190 | 1,262 | ||||
| * | AMREP Corp. | 73,876 | 1,123 | |||
| *,1 | WeWork Inc. | 120,274 | 1,034 | |||
| * | Comstock Holding Cos. Inc. Class A | 164,051 | 799 | |||
| *,2 | Spirit MTA REIT | 2,854,330 | 764 | |||
| * | Sotherly Hotels Inc. | 337,859 | 706 | |||
| *,1 | Harbor Custom Development Inc. | 238,273 | 627 | |||
| Presidio Property Trust Inc. Class A | 110,319 | 430 | ||||
| * | Avalon GloboCare Corp. | 503,819 | 413 | |||
| * | Alset EHome International Inc. | 486,512 | 271 | |||
| * | Wheeler REIT Inc. | 130,830 | 254 | |||
| *,2 | New York REIT Liquidating LLC | 19,100 | 220 | |||
| * | JW Mays Inc. | 2,922 | 119 | |||
| 50,354,335 | ||||||
| Technology (28.9%) | ||||||
| Apple Inc. | 442,969,284 | 78,658,056 | ||||
| Microsoft Corp. | 213,382,662 | 71,764,857 | ||||
| * | Alphabet Inc. Class A | 8,547,474 | 24,762,374 | |||
| * | Meta Platforms Inc. Class A | 67,251,688 | 22,620,105 | |||
| * | Alphabet Inc. Class C | 7,677,584 | 22,215,780 | |||
| NVIDIA Corp. | 67,499,669 | 19,852,328 | ||||
| * | Adobe Inc. | 13,522,501 | 7,668,069 | |||
| Broadcom Inc. | 11,113,202 | 7,394,836 | ||||
| * | salesforce.com Inc. | 26,432,252 | 6,717,228 | |||
| Intel Corp. | 115,586,332 | 5,952,696 | ||||
| QUALCOMM Inc. | 31,831,280 | 5,820,986 | ||||
| Intuit Inc. | 8,047,618 | 5,176,389 | ||||
| Texas Instruments Inc. | 26,246,724 | 4,946,720 | ||||
| * | Advanced Micro Devices Inc. | 34,321,894 | 4,938,921 | |||
| Oracle Corp. | 46,616,042 | 4,065,385 | ||||
| Applied Materials Inc. | 25,662,203 | 4,038,204 | ||||
| Shares | Market Value• ($000) | |||||
| * | ServiceNow Inc. | 5,655,685 | 3,671,162 | |||
| International Business Machines Corp. | 25,486,833 | 3,406,570 | ||||
| Micron Technology Inc. | 31,792,741 | 2,961,494 | ||||
| Lam Research Corp. | 4,001,637 | 2,877,777 | ||||
| Analog Devices Inc. | 15,273,478 | 2,684,619 | ||||
| * | Snowflake Inc. Class A | 7,696,609 | 2,607,226 | |||
| Marvell Technology Inc. | 23,408,563 | 2,048,015 | ||||
| KLA Corp. | 4,309,336 | 1,853,488 | ||||
| * | Autodesk Inc. | 6,248,264 | 1,756,949 | |||
| * | Snap Inc. Class A | 34,672,068 | 1,630,627 | |||
| * | Synopsys Inc. | 4,335,159 | 1,597,506 | |||
| * | Workday Inc. Class A | 5,484,935 | 1,498,375 | |||
| TE Connectivity Ltd. | 9,273,074 | 1,496,118 | ||||
| Xilinx Inc. | 7,045,984 | 1,493,960 | ||||
| Amphenol Corp. Class A | 16,995,701 | 1,486,444 | ||||
| * | Palo Alto Networks Inc. | 2,663,971 | 1,483,192 | |||
| Roper Technologies Inc. | 2,998,206 | 1,474,698 | ||||
| * | Cadence Design Systems Inc. | 7,876,559 | 1,467,797 | |||
| * | Fortinet Inc. | 3,950,027 | 1,419,640 | |||
| Microchip Technology Inc. | 15,769,912 | 1,372,929 | ||||
| Cognizant Technology Solutions Corp. Class A | 14,926,545 | 1,324,283 | ||||
| * | Twilio Inc. Class A | 4,787,524 | 1,260,747 | |||
| * | Datadog Inc. Class A | 6,944,261 | 1,236,842 | |||
| HP Inc. | 32,755,850 | 1,233,913 | ||||
| * | Crowdstrike Holdings Inc. Class A | 5,557,806 | 1,137,961 | |||
| * | Zoom Video Communications Inc. Class A | 5,852,097 | 1,076,259 | |||
| * | EPAM Systems Inc. | 1,531,523 | 1,023,747 | |||
| * | Match Group Inc. | 7,643,647 | 1,010,872 | |||
| * | ANSYS Inc. | 2,479,931 | 994,750 | |||
| * | MongoDB Inc. | 1,786,875 | 945,882 | |||
| * | Okta Inc. | 4,195,433 | 940,490 | |||
| * | Twitter Inc. | 21,590,638 | 933,147 | |||
| * | Cloudflare Inc. Class A | 7,005,804 | 921,263 | |||
| * | Palantir Technologies Inc. Class A | 48,769,447 | 888,092 | |||
| * | DoorDash Inc. Class A | 5,756,335 | 857,118 | |||
| * | HubSpot Inc. | 1,275,840 | 840,970 | |||
| Shares | Market Value• ($000) | |||||
| * | ON Semiconductor Corp. | 12,242,960 | 831,542 | |||
| Corning Inc. | 21,827,049 | 812,621 | ||||
| * | DocuSign Inc. | 5,311,482 | 808,992 | |||
| CDW Corp. | 3,856,784 | 789,792 | ||||
| * | Zscaler Inc. | 2,388,420 | 767,471 | |||
| Teradyne Inc. | 4,632,698 | 757,585 | ||||
| * | Gartner Inc. | 2,220,463 | 742,345 | |||
| Skyworks Solutions Inc. | 4,700,423 | 729,224 | ||||
| * | Unity Software Inc. | 4,877,423 | 697,423 | |||
| VMware Inc. Class A | 5,963,685 | 691,072 | ||||
| * | VeriSign Inc. | 2,682,908 | 680,976 | |||
| Seagate Technology Holdings plc | 6,011,144 | 679,139 | ||||
| * | Tyler Technologies Inc. | 1,165,104 | 626,768 | |||
| Monolithic Power Systems Inc. | 1,244,669 | 614,033 | ||||
| * | Paycom Software Inc. | 1,450,113 | 602,072 | |||
| * | AppLovin Corp. Class A | 6,283,957 | 592,326 | |||
| Hewlett Packard Enterprise Co. | 37,200,686 | 586,655 | ||||
| NetApp Inc. | 6,353,868 | 584,492 | ||||
| * | Pinterest Inc. Class A | 15,993,055 | 581,348 | |||
| * | Western Digital Corp. | 8,856,320 | 577,521 | |||
| * | Akamai Technologies Inc. | 4,616,252 | 540,286 | |||
| Entegris Inc. | 3,848,894 | 533,380 | ||||
| * | Splunk Inc. | 4,591,778 | 531,361 | |||
| SS&C Technologies Holdings Inc. | 6,137,846 | 503,181 | ||||
| * | Nuance Communications Inc. | 9,073,706 | 501,957 | |||
| * | Qorvo Inc. | 3,132,363 | 489,870 | |||
| * | Dell Technologies Inc. Class C | 7,858,880 | 441,433 | |||
| * | ZoomInfo Technologies Inc. Class A | 6,875,898 | 441,433 | |||
| * | RingCentral Inc. Class A | 2,333,967 | 437,269 | |||
| * | F5 Inc. | 1,740,069 | 425,812 | |||
| NortonLifeLock Inc. | 15,708,364 | 408,103 | ||||
| * | Ceridian HCM Holding Inc. | 3,870,980 | 404,363 | |||
| * | GoDaddy Inc. Class A | 4,723,115 | 400,804 | |||
| * | Wolfspeed Inc. | 3,302,134 | 369,080 | |||
| * | PTC Inc. | 3,014,880 | 365,253 | |||
| * | Zendesk Inc. | 3,436,075 | 358,348 | |||
| Leidos Holdings Inc. | 3,987,935 | 354,527 | ||||
| * | Black Knight Inc. | 4,193,470 | 347,597 | |||
| * | Dynatrace Inc. | 5,666,408 | 341,968 | |||
| Citrix Systems Inc. | 3,544,895 | 335,312 | ||||
| Shares | Market Value• ($000) | |||||
| * | Coupa Software Inc. | 2,105,057 | 332,704 | |||
| * | Synaptics Inc. | 1,116,359 | 323,197 | |||
| * | UiPath Inc. Class A | 7,352,133 | 317,097 | |||
| * | Avalara Inc. | 2,346,835 | 303,000 | |||
| * | Lattice Semiconductor Corp. | 3,892,344 | 299,944 | |||
| * | IAC/InterActiveCorp | 2,264,692 | 296,018 | |||
| * | Aspen Technology Inc. | 1,903,861 | 289,768 | |||
| * | Manhattan Associates Inc. | 1,797,995 | 279,570 | |||
| Bentley Systems Inc. Class B | 5,777,221 | 279,213 | ||||
| * | Guidewire Software Inc. | 2,367,673 | 268,802 | |||
| * | Arrow Electronics Inc. | 1,977,774 | 265,556 | |||
| * | Five9 Inc. | 1,932,451 | 265,364 | |||
| * | Smartsheet Inc. Class A | 3,401,769 | 263,467 | |||
| Jabil Inc. | 3,665,449 | 257,864 | ||||
| * | Elastic NV | 2,093,058 | 257,634 | |||
| * | Pure Storage Inc. Class A | 7,700,113 | 250,639 | |||
| * | Silicon Laboratories Inc. | 1,142,459 | 235,826 | |||
| * | DXC Technology Co. | 7,173,467 | 230,914 | |||
| Azenta Inc. | 2,113,377 | 217,910 | ||||
| Vertiv Holdings Co. Class A | 8,555,371 | 213,628 | ||||
| Concentrix Corp. | 1,191,927 | 212,902 | ||||
| * | II-VI Inc. | 3,016,199 | 206,097 | |||
| * | Dropbox Inc. Class A | 8,366,807 | 205,321 | |||
| * | Ambarella Inc. | 990,274 | 200,917 | |||
| Universal Display Corp. | 1,205,579 | 198,957 | ||||
| * | Nutanix Inc. Class A | 6,008,251 | 191,423 | |||
| KBR Inc. | 3,987,325 | 189,876 | ||||
| * | Anaplan Inc. | 3,947,444 | 180,990 | |||
| * | Rapid7 Inc. | 1,527,907 | 179,819 | |||
| * | CACI International Inc. Class A | 662,615 | 178,383 | |||
| Dolby Laboratories Inc. Class A | 1,848,967 | 176,059 | ||||
| * | Novanta Inc. | 963,242 | 169,848 | |||
| * | IPG Photonics Corp. | 984,734 | 169,512 | |||
| * | New Relic Inc. | 1,487,956 | 163,616 | |||
| * | Semtech Corp. | 1,828,423 | 162,602 | |||
| * | Asana Inc. Class A | 2,163,723 | 161,306 | |||
| * | Blackline Inc. | 1,497,630 | 155,065 | |||
| CMC Materials Inc. | 808,168 | 154,918 | ||||
| Power Integrations Inc. | 1,633,035 | 151,693 | ||||
| * | Digital Turbine Inc. | 2,477,752 | 151,118 | |||
| Shares | Market Value• ($000) | |||||
| * | NCR Corp. | 3,755,566 | 150,974 | |||
| * | Workiva Inc. Class A | 1,155,251 | 150,749 | |||
| * | Cirrus Logic Inc. | 1,624,388 | 149,476 | |||
| * | Varonis Systems Inc. | 3,051,304 | 148,843 | |||
| * | MaxLinear Inc. Class A | 1,963,507 | 148,029 | |||
| National Instruments Corp. | 3,369,834 | 147,161 | ||||
| * | SPS Commerce Inc. | 1,022,451 | 145,546 | |||
| * | Rogers Corp. | 532,404 | 145,346 | |||
| * | Ziff Davis Inc. | 1,301,465 | 144,280 | |||
| * | Tenable Holdings Inc. | 2,591,612 | 142,720 | |||
| * | Onto Innovation Inc. | 1,405,241 | 142,253 | |||
| * | Change Healthcare Inc. | 6,632,838 | 141,810 | |||
| CDK Global Inc. | 3,363,412 | 140,389 | ||||
| TD SYNNEX Corp. | 1,227,199 | 140,342 | ||||
| Science Applications International Corp. | 1,635,873 | 136,743 | ||||
| * | Qualys Inc. | 993,392 | 136,313 | |||
| * | Procore Technologies Inc. | 1,687,511 | 134,950 | |||
| * | Diodes Inc. | 1,217,003 | 133,639 | |||
| Pegasystems Inc. | 1,162,778 | 130,022 | ||||
| * | Sailpoint Technologies Holdings Inc. | 2,646,343 | 127,924 | |||
| * | Dun & Bradstreet Holdings Inc. | 6,128,331 | 125,569 | |||
| * | Fabrinet | 1,052,409 | 124,679 | |||
| * | DigitalOcean Holdings Inc. | 1,551,387 | 124,623 | |||
| * | Teradata Corp. | 2,930,297 | 124,450 | |||
| * | Q2 Holdings Inc. | 1,534,644 | 121,912 | |||
| * | Perficient Inc. | 936,641 | 121,098 | |||
| * | SiTime Corp. | 409,073 | 119,670 | |||
| * | Envestnet Inc. | 1,472,656 | 116,841 | |||
| Avnet Inc. | 2,818,385 | 116,202 | ||||
| * | Mandiant Corp. | 6,480,941 | 113,676 | |||
| * | Upwork Inc. | 3,280,922 | 112,076 | |||
| * | Alarm.com Holdings Inc. | 1,284,885 | 108,971 | |||
| * | MACOM Technology Solutions Holdings Inc. | 1,385,406 | ��� 108,477 | |||
| * | Blackbaud Inc. | 1,370,019 | 108,204 | |||
| * | Box Inc. Class A | 4,093,796 | 107,217 | |||
| * | Altair Engineering Inc. Class A | 1,371,103 | 106,014 | |||
| * | Insight Enterprises Inc. | 991,210 | 105,663 | |||
| * | Alteryx Inc. Class A | 1,702,380 | 102,994 | |||
| * | FormFactor Inc. | 2,222,500 | 101,613 | |||
| *,1 | Fastly Inc. Class A | 2,839,431 | 100,658 | |||
| Advanced Energy Industries Inc. | 1,070,738 | 97,501 | ||||
| Shares | Market Value• ($000) | |||||
| *,1 | MicroStrategy Inc. Class A | 177,758 | 96,787 | |||
| Switch Inc. Class A | 3,266,161 | 93,543 | ||||
| * | Cargurus Inc. Class A | 2,747,355 | 92,421 | |||
| * | Kyndryl Holdings Inc. | 5,100,990 | 92,328 | |||
| * | Rambus Inc. | 3,118,229 | 91,645 | |||
| * | nCino Inc. | 1,650,260 | 90,533 | |||
| * | LiveRamp Holdings Inc. | 1,839,033 | 88,182 | |||
| * | Sprout Social Inc. Class A | 971,971 | 88,148 | |||
| * | Verint Systems Inc. | 1,668,135 | 87,594 | |||
| *,1 | E2open Parent Holdings Inc. | 7,672,934 | 86,397 | |||
| Xerox Holdings Corp. | 3,803,851 | 86,119 | ||||
| * | CommVault Systems Inc. | 1,229,545 | 84,740 | |||
| * | Cerence Inc. | 1,095,655 | 83,971 | |||
| Vishay Intertechnology Inc. | 3,769,844 | 82,446 | ||||
| * | Bumble Inc. Class A | 2,378,024 | 80,520 | |||
| * | Plexus Corp. | 796,606 | 76,387 | |||
| * | Momentive Global Inc. | 3,599,426 | 76,128 | |||
| Shutterstock Inc. | 674,364 | 74,773 | ||||
| * | 3D Systems Corp. | 3,449,500 | 74,302 | |||
| * | Everbridge Inc. | 1,096,784 | 73,846 | |||
| * | Appian Corp. | 1,129,242 | 73,638 | |||
| * | Sanmina Corp. | 1,737,931 | 72,055 | |||
| * | Yelp Inc. Class A | 1,974,474 | 71,555 | |||
| * | Jamf Holding Corp. | 1,860,208 | 70,706 | |||
| * | TechTarget Inc. | 736,966 | 70,498 | |||
| * | Ultra Clean Holdings Inc. | 1,211,602 | 69,497 | |||
| Amkor Technology Inc. | 2,777,609 | 68,857 | ||||
| * | Bottomline Technologies DE Inc. | 1,219,093 | 68,842 | |||
| * | Allegro MicroSystems Inc. | 1,885,975 | 68,235 | |||
| * | Vimeo Inc. | 3,768,402 | 67,680 | |||
| * | PagerDuty Inc. | 1,937,511 | 67,328 | |||
| McAfee Corp. Class A | 2,597,373 | 66,986 | ||||
| * | Axcelis Technologies Inc. | 898,409 | 66,985 | |||
| * | NetScout Systems Inc. | 2,006,252 | 66,367 | |||
| * | LivePerson Inc. | 1,811,535 | 64,708 | |||
| *,1 | C3.ai Inc. Class A | 2,007,747 | 62,742 | |||
| * | Magnite Inc. | 3,577,896 | 62,613 | |||
| * | Duck Creek Technologies Inc. | 2,057,005 | 61,936 | |||
| * | Zuora Inc. Class A | 3,281,732 | 61,303 | |||
| * | Allscripts Healthcare Solutions Inc. | 3,312,490 | 61,115 | |||
| Shares | Market Value• ($000) | |||||
| Progress Software Corp. | 1,241,569 | 59,931 | ||||
| * | Appfolio Inc. Class A | 494,611 | 59,878 | |||
| * | Covetrus Inc. | 2,938,377 | 58,679 | |||
| Xperi Holding Corp. | 2,971,355 | 56,188 | ||||
| * | Qualtrics International Inc. Class A | 1,536,387 | 54,388 | |||
| * | Super Micro Computer Inc. | 1,235,645 | 54,307 | |||
| * | BigCommerce Holdings Inc. | 1,528,086 | 54,048 | |||
| *,1 | SentinelOne Inc. Class A | 1,064,182 | 53,731 | |||
| *,1 | Confluent Inc. Class A | 691,588 | 52,727 | |||
| * | Amplitude Inc. Class A | 994,761 | 52,663 | |||
| * | DoubleVerify Holdings Inc. | 1,575,840 | 52,444 | |||
| * | Schrodinger Inc. | 1,495,382 | 52,084 | |||
| CSG Systems International Inc. | 886,339 | 51,071 | ||||
| * | Cohu Inc. | 1,317,518 | 50,184 | |||
| Methode Electronics Inc. | 1,020,502 | 50,178 | ||||
| * | Impinj Inc. | 555,350 | 49,260 | |||
| * | Ping Identity Holding Corp. | 2,136,826 | 48,891 | |||
| * | SMART Global Holdings Inc. | 658,208 | 46,726 | |||
| * | Grid Dynamics Holdings Inc. | 1,205,205 | 45,762 | |||
| * | Avaya Holdings Corp. | 2,283,601 | 45,215 | |||
| * | TTM Technologies Inc. | 2,795,604 | 41,654 | |||
| * | ePlus Inc. | 767,238 | 41,339 | |||
| * | Veeco Instruments Inc. | 1,435,035 | 40,855 | |||
| * | JFrog Ltd. | 1,369,047 | 40,661 | |||
| *,1 | HashiCorp Inc. Class A | 434,900 | 39,593 | |||
| * | PROS Holdings Inc. | 1,132,944 | 39,075 | |||
| * | Bandwidth Inc. Class A | 541,881 | 38,885 | |||
| * | Domo Inc. Class B | 780,227 | 38,699 | |||
| *,1 | PAR Technology Corp. | 725,024 | 38,260 | |||
| * | Eventbrite Inc. Class A | 2,168,432 | 37,817 | |||
| * | Unisys Corp. | 1,830,240 | 37,648 | |||
| * | Ichor Holdings Ltd. | 809,440 | 37,259 | |||
| * | Sumo Logic Inc. | 2,666,220 | 36,154 | |||
| * | Informatica Inc. Class A | 974,499 | 36,037 | |||
| * | Alpha & Omega Semiconductor Ltd. | 594,018 | 35,974 | |||
| *,1 | Porch Group Inc. | 2,227,645 | 34,729 | |||
| Shares | Market Value• ($000) | |||||
| * | Vroom Inc. | 3,111,294 | 33,571 | |||
| * | Yext Inc. | 3,268,123 | 32,420 | |||
| * | ACM Research Inc. Class A | 377,036 | 32,150 | |||
| * | Olo Inc. Class A | 1,540,826 | 32,065 | |||
| CTS Corp. | 869,853 | 31,941 | ||||
| * | Photronics Inc. | 1,651,619 | 31,133 | |||
| * | Avid Technology Inc. | 955,731 | 31,128 | |||
| * | Parsons Corp. | 875,475 | 29,460 | |||
| A10 Networks Inc. | 1,764,269 | 29,252 | ||||
| * | Model N Inc. | 973,334 | 29,229 | |||
| *,1 | Skillz Inc. Class A | 3,856,288 | 28,691 | |||
| * | PDF Solutions Inc. | 901,002 | 28,643 | |||
| * | Paycor HCM Inc. | 986,913 | 28,433 | |||
| * | nLight Inc. | 1,185,312 | 28,388 | |||
| * | CEVA Inc. | 624,044 | 26,984 | |||
| *,1 | Gitlab Inc. Class A | 304,454 | 26,487 | |||
| * | Consensus Cloud Solutions Inc. | 452,295 | 26,174 | |||
| Benchmark Electronics Inc. | 944,125 | 25,586 | ||||
| * | KnowBe4 Inc. Class A | 1,114,396 | 25,564 | |||
| * | ScanSource Inc. | 724,735 | 25,424 | |||
| * | PubMatic Inc. Class A | 743,572 | 25,319 | |||
| *,1 | Aeva Technologies Inc. | 3,343,540 | 25,277 | |||
| * | Agilysys Inc. | 560,666 | 24,927 | |||
| *,1 | MicroVision Inc. | 4,720,001 | 23,647 | |||
| * | Thoughtworks Holding Inc. | 865,989 | 23,217 | |||
| * | Squarespace Inc. Class A | 774,097 | 22,836 | |||
| *,1 | Samsara Inc. Class A | 795,400 | 22,359 | |||
| American Software Inc. Class A | 850,686 | 22,262 | ||||
| *,1 | Toast Inc. Class A | 635,651 | 22,063 | |||
| * | NeoPhotonics Corp. | 1,432,873 | 22,023 | |||
| *,1 | Freshworks Inc. Class A | 833,937 | 21,899 | |||
| *,1 | Tucows Inc. Class A | 259,269 | 21,732 | |||
| Ebix Inc. | 702,350 | 21,351 | ||||
| *,1 | Matterport Inc. | 1,033,676 | 21,335 | |||
| * | Mitek Systems Inc. | 1,170,254 | 20,772 | |||
| Simulations Plus Inc. | 437,858 | 20,711 | ||||
| * | Telos Corp. | 1,330,133 | 20,511 | |||
| * | Alkami Technology Inc. | 1,002,043 | 20,101 | |||
| * | ChannelAdvisor Corp. | 800,233 | 19,750 | |||
| * | N-able Inc. | 1,764,875 | 19,590 | |||
| *,1 | CCC Intelligent Solutions Holdings Inc. | 1,715,395 | 19,538 | |||
| * | Diebold Nixdorf Inc. | 2,101,000 | 19,014 | |||
| *,1 | Veritone Inc. | 842,495 | 18,939 | |||
| Shares | Market Value• ($000) | |||||
| * | ON24 Inc. | 1,081,630 | 18,766 | |||
| *,1 | Datto Holding Corp. | 694,177 | 18,292 | |||
| *,1 | Digimarc Corp. | 451,405 | 17,821 | |||
| *,1 | Ouster Inc. | 3,414,031 | 17,753 | |||
| * | Braze Inc. Class A | 226,651 | 17,488 | |||
| * | Identiv Inc. | 599,960 | 16,883 | |||
| * | Groupon Inc. | 727,221 | 16,842 | |||
| 1 | Vivid Seats Inc. Class A | 1,527,100 | 16,615 | |||
| *,1 | Aehr Test Systems | 681,104 | 16,469 | |||
| SolarWinds Corp. | 1,148,947 | 16,304 | ||||
| * | OneSpan Inc. | 953,338 | 16,140 | |||
| *,1 | Cyxtera Technologies Inc. | 1,180,626 | 14,888 | |||
| * | Kimball Electronics Inc. | 681,124 | 14,821 | |||
| * | SEMrush Holdings Inc. Class A | 700,407 | 14,603 | |||
| Hackett Group Inc. | 703,805 | 14,449 | ||||
| *,1 | IonQ Inc. | 820,400 | 13,701 | |||
| *,1 | Clear Secure Inc. Class A | 422,535 | 13,255 | |||
| PC Connection Inc. | 305,972 | 13,197 | ||||
| * | Upland Software Inc. | 719,805 | 12,913 | |||
| * | Vertex Inc. Class A | 812,212 | 12,890 | |||
| * | Expensify Inc. Class A | 286,159 | 12,591 | |||
| * | Limelight Networks Inc. | 3,621,469 | 12,422 | |||
| *,1 | Rackspace Technology Inc. | 906,694 | 12,213 | |||
| *,1 | Atomera Inc. | 598,972 | 12,051 | |||
| *,1 | indie Semiconductor Inc. Class A | 959,946 | 11,510 | |||
| NVE Corp. | 166,862 | 11,397 | ||||
| * | Enfusion Inc. Class A | 543,647 | 11,384 | |||
| * | Brightcove Inc. | 1,108,617 | 11,330 | |||
| * | Benefitfocus Inc. | 984,491 | 10,495 | |||
| * | AXT Inc. | 1,158,144 | 10,203 | |||
| * | eGain Corp. | 994,878 | 9,929 | |||
| * | GTY Technology Holdings Inc. | 1,455,833 | 9,754 | |||
| *,1 | Red Violet Inc. | 234,813 | 9,320 | |||
| *,1 | Cleanspark Inc. | 971,716 | 9,251 | |||
| * | MediaAlpha Inc. Class A | 598,704 | 9,244 | |||
| *,1 | Xometry Inc. Class A | 177,983 | 9,122 | |||
| *,1 | Nextdoor Holdings Inc. | 1,140,000 | 8,995 | |||
| * | CyberOptics Corp. | 193,062 | 8,977 | |||
| *,1 | Kopin Corp. | 2,191,200 | 8,962 | |||
| * | Quantum Corp. | 1,620,965 | 8,948 | |||
| * | TrueCar Inc. | 2,596,466 | 8,828 | |||
| * | ForgeRock Inc. Class A | 310,395 | 8,284 | |||
| Shares | Market Value• ($000) | |||||
| *,1 | Alpine 4 Holdings Inc. | 4,269,734 | 8,198 | |||
| * | Rimini Street Inc. | 1,358,208 | 8,108 | |||
| *,1 | SmartRent Inc. Class A | 826,884 | 8,004 | |||
| * | CoreCard Corp. | 205,921 | 7,990 | |||
| * | Sprinklr Inc. Class A | 503,494 | 7,990 | |||
| * | Smith Micro Software Inc. | 1,589,694 | 7,821 | |||
| * | MeridianLink Inc. | 349,328 | 7,538 | |||
| * | Asure Software Inc. | 936,577 | 7,333 | |||
| * | EverQuote Inc. Class A | 463,139 | 7,253 | |||
| *,1 | Intapp Inc. | 272,438 | �� 6,855 | |||
| * | EMCORE Corp. | 978,233 | 6,828 | |||
| * | comScore Inc. | 1,926,362 | 6,434 | |||
| * | Pixelworks Inc. | 1,360,829 | 5,988 | |||
| *,1 | Couchbase Inc. | 236,438 | 5,901 | |||
| *,1 | Phunware Inc. | 2,190,620 | 5,761 | |||
| *,1 | NextNav Inc. | 641,600 | 5,620 | |||
| *,1 | Zeta Global Holdings Corp. Class A | 659,450 | 5,553 | |||
| * | Innodata Inc. | 912,571 | 5,402 | |||
| *,1 | KULR Technology Group Inc. | 1,942,837 | 5,362 | |||
| *,1 | WM Technology Inc. | 893,261 | 5,342 | |||
| * | Immersion Corp. | 927,552 | 5,296 | |||
| * | Daktronics Inc. | 1,034,740 | 5,225 | |||
| * | AvePoint Inc. | 778,650 | 4,898 | |||
| *,1 | KORE Group Holdings Inc. | 719,616 | 4,850 | |||
| *,1 | VirnetX Holding Corp. | 1,835,130 | 4,771 | |||
| *,1 | Greenidge Generation Holdings Inc. | 296,976 | 4,766 | |||
| * | Everspin Technologies Inc. | 420,060 | 4,747 | |||
| * | Synchronoss Technologies Inc. | 1,886,342 | 4,603 | |||
| * | Computer Task Group Inc. | 448,443 | 4,471 | |||
| *,1 | Nuvve Holding Corp. | 321,077 | 4,277 | |||
| * | SecureWorks Corp. Class A | 263,152 | 4,203 | |||
| *,1 | Exela Technologies Inc. | 4,732,805 | 4,153 | |||
| Richardson Electronics Ltd. | 298,587 | 4,037 | ||||
| *,1 | BuzzFeed Inc. | 740,107 | 3,945 | |||
| * | Viant Technology Inc. Class A | 388,628 | 3,772 | |||
| * | Issuer Direct Corp. | 126,490 | 3,725 | |||
| *,1 | SkyWater Technology Inc. | 217,410 | 3,526 | |||
| * | AstroNova Inc. | 250,452 | 3,381 | |||
| * | inTEST Corp. | 262,097 | 3,334 | |||
| * | Intevac Inc. | 685,231 | 3,227 | |||
| Shares | Market Value• ($000) | |||||
| * | Park City Group Inc. | 546,003 | 3,178 | |||
| *,1 | NerdWallet Inc. Class A | 187,176 | 2,911 | |||
| * | Zedge Inc. Class B | 329,626 | 2,802 | |||
| * | Arteris Inc. | 127,965 | 2,701 | |||
| * | TransAct Technologies Inc. | 247,478 | 2,698 | |||
| * | Amtech Systems Inc. | 268,244 | 2,650 | |||
| *,1 | Waitr Holdings Inc. | 3,543,228 | 2,622 | |||
| *,1 | Stronghold Digital Mining Inc. Class A | 199,597 | 2,565 | |||
| *,1 | Remark Holdings Inc. | 2,574,727 | 2,553 | |||
| * | Intellicheck Inc. | 522,431 | 2,414 | |||
| *,1 | eMagin Corp. | 1,840,738 | 2,375 | |||
| *,1 | Inpixon | 3,857,401 | 2,314 | |||
| *,1 | Super League Gaming Inc. | 969,852 | 2,289 | |||
| *,1 | Blend Labs Inc. Class A | 290,885 | 2,135 | |||
| * | GSI Technology Inc. | 460,392 | 2,132 | |||
| *,1 | Boxlight Corp. Class A | 1,524,589 | 2,104 | |||
| * | Mastech Digital Inc. | 119,078 | 2,033 | |||
| *,1 | 1stdibs.com Inc. | 162,021 | 2,027 | |||
| *,1 | Verb Technology Co. Inc. | 1,624,862 | 2,015 | |||
| *,1 | Quantum Computing Inc. | 576,947 | 1,967 | |||
| * | Steel Connect Inc. | 1,313,081 | 1,825 | |||
| *,1 | SeaChange International Inc. | 1,082,170 | 1,731 | |||
| *,1 | American Virtual Cloud Technologies Inc. | 680,707 | 1,654 | |||
| *,1 | IronNet Inc. | 379,700 | 1,595 | |||
| * | QuickLogic Corp. | 305,351 | 1,560 | |||
| *,1 | One Stop Systems Inc. | 314,266 | 1,556 | |||
| * | Key Tronic Corp. | 244,100 | 1,518 | |||
| * | Research Frontiers Inc. | 819,655 | 1,410 | |||
| * | Trio-Tech International | 104,880 | 1,409 | |||
| *,1 | Inuvo Inc. | 2,563,824 | 1,359 | |||
| * | Aware Inc. | 424,390 | 1,337 | |||
| *,1 | Flux Power Holdings Inc. | 305,905 | 1,312 | |||
| *,1 | Cipher Mining Inc. | 282,658 | 1,309 | |||
| * | NetSol Technologies Inc. | 324,880 | 1,280 | |||
| * | AutoWeb Inc. | 349,274 | 1,188 | |||
| *,1 | Creatd Inc. | 554,557 | 1,159 | |||
| * | CSP Inc. | 129,793 | 1,141 | |||
| * | AudioEye Inc. | 162,397 | 1,140 | |||
| * | Kubient Inc. | 377,509 | 1,140 | |||
| * | OMNIQ Corp. | 175,600 | 1,085 | |||
| * | SigmaTron International Inc. | 98,274 | 1,015 | |||
| Shares | Market Value• ($000) | |||||
| * | Qumu Corp. | 459,382 | 974 | |||
| *,1 | Akerna Corp. | 547,065 | 957 | |||
| * | GSE Systems Inc. | 541,861 | 927 | |||
| * | WidePoint Corp. | 231,461 | 910 | |||
| *,1 | Glimpse Group Inc. | 85,600 | 844 | |||
| *,1 | Intrusion Inc. | 244,034 | 839 | |||
| * | Data I/O Corp. | 180,859 | 834 | |||
| * | Streamline Health Solutions Inc. | 536,995 | 789 | |||
| * | Peraso Inc. | 176,997 | 743 | |||
| * | Crown ElectroKinetics Corp. | 184,921 | 738 | |||
| * | Rubicon Technology Inc. | 80,276 | 720 | |||
| * | CVD Equipment Corp. | 165,470 | 682 | |||
| * | EngageSmart Inc. | 27,578 | 665 | |||
| * | RealNetworks Inc. | 675,168 | 662 | |||
| *,1 | PetVivo Holdings Inc. | 173,200 | 653 | |||
| *,1 | CYNGN Inc. | 134,700 | 606 | |||
| * | BTCS Inc. | 176,100 | 553 | |||
| *,1 | BSQUARE Corp. | 299,286 | 512 | |||
| *,1 | Terawulf Inc. | 31,426 | 473 | |||
| * | Bridgeline Digital Inc. | 200,736 | 454 | |||
| SilverSun Technologies Inc. | 99,500 | 443 | ||||
| * | Alfi Inc. | 173,138 | 398 | |||
| *,1 | NXT-ID Inc. | 125,063 | 383 | |||
| *,1 | Weave Communications Inc. | 24,444 | 371 | |||
| * | Oblong Inc. | 351,708 | 362 | |||
| *,1 | Backblaze Inc. Class A | 21,397 | 361 | |||
| * | Summit Wireless Technologies Inc. | 242,859 | 338 | |||
| * | UserTesting Inc. | 34,465 | 290 | |||
| * | VerifyMe Inc. | 84,041 | 268 | |||
| * | CynergisTek Inc. | 158,445 | 228 | |||
| * | Recruiter.com Group Inc. | 71,564 | 187 | |||
| * | Evolving Systems Inc. | 72,375 | 162 | |||
| * | EverCommerce Inc. | 10,223 | 161 | |||
| * | Sigma Labs Inc. | 54,433 | 100 | |||
| * | Creative Realities Inc. | 66,218 | 93 | |||
| *,2 | Media General Inc. CVR | 2,351,648 | 91 | |||
| * | Data Storage Corp. | 24,445 | 75 | |||
| * | Paltalk Inc. | 24,400 | 69 | |||
| * | Duos Technologies Group Inc. | 12,313 | 63 | |||
| * | iPower Inc. | 25,320 | 60 | |||
| Shares | Market Value• ($000) | |||||
| * | Marin Software Inc. | 345 | 1 | |||
| *,2 | Ikonics Corp. CVR | 7,226 | — | |||
| 396,652,125 | ||||||
| Telecommunications (2.6%) | ||||||
| Cisco Systems Inc. | 107,877,184 | 6,836,177 | ||||
| Comcast Corp. Class A | 129,584,186 | 6,521,972 | ||||
| Verizon Communications Inc. | 107,366,928 | 5,578,786 | ||||
| AT&T Inc. | 202,950,408 | 4,992,580 | ||||
| * | Charter Communications Inc. Class A | 3,312,233 | 2,159,477 | |||
| * | T-Mobile US Inc. | 15,974,584 | 1,852,732 | |||
| Motorola Solutions Inc. | 4,799,588 | 1,304,048 | ||||
| * | Arista Networks Inc. | 6,550,193 | 941,590 | |||
| * | Roku Inc. | 3,345,570 | 763,459 | |||
| * | Liberty Broadband Corp. Class C | 4,236,306 | 682,469 | |||
| Lumen Technologies Inc. | 29,108,761 | 365,315 | ||||
| * | Ciena Corp. | 4,402,630 | 338,870 | |||
| Juniper Networks Inc. | 9,254,313 | 330,472 | ||||
| Cable One Inc. | 163,144 | 287,696 | ||||
| * | DISH Network Corp. Class A | 7,020,805 | 227,755 | |||
| * | Lumentum Holdings Inc. | 1,951,849 | 206,447 | |||
| * | Frontier Communications Parent Inc. | 6,955,433 | 205,116 | |||
| * | Vonage Holdings Corp. | 6,823,475 | 141,860 | |||
| * | Iridium Communications Inc. | 3,380,165 | 139,567 | |||
| * | Calix Inc. | 1,546,263 | 123,655 | |||
| * | Viavi Solutions Inc. | 6,757,330 | 119,064 | |||
| * | Altice USA Inc. Class A | 6,105,372 | 98,785 | |||
| Cogent Communications Holdings Inc. | 1,220,138 | 89,290 | ||||
| * | Viasat Inc. | 1,989,088 | 88,594 | |||
| * | Liberty Broadband Corp. Class A | 422,122 | 67,919 | |||
| * | CommScope Holding Co. Inc. | 5,791,443 | 63,938 | |||
| InterDigital Inc. | 872,791 | 62,518 | ||||
| * | Vocera Communications Inc. | 938,903 | 60,878 | |||
| Telephone & Data Systems Inc. | 2,897,229 | 58,379 | ||||
| Shares | Market Value• ($000) | |||||
| * | Extreme Networks Inc. | 3,689,355 | 57,923 | |||
| *,1 | fuboTV Inc. | 3,494,561 | 54,236 | |||
| * | 8x8 Inc. | 3,079,617 | 51,614 | |||
| * | Infinera Corp. | 5,119,042 | 49,092 | |||
| Shenandoah Telecommunications Co. | 1,349,631 | 34,416 | ||||
| * | Plantronics Inc. | 1,153,101 | 33,832 | |||
| * | Harmonic Inc. | 2,748,862 | 32,327 | |||
| * | WideOpenWest Inc. | 1,468,857 | 31,610 | |||
| ADTRAN Inc. | 1,374,161 | 31,372 | ||||
| *,1 | Globalstar Inc. | 25,381,523 | 29,443 | |||
| * | Clearfield Inc. | 329,610 | 27,826 | |||
| * | EchoStar Corp. Class A | 1,051,825 | 27,716 | |||
| * | IDT Corp. Class B | 579,260 | 25,580 | |||
| * | NETGEAR Inc. | 788,783 | 23,040 | |||
| * | Digi International Inc. | 927,075 | 22,778 | |||
| * | Anterix Inc. | 339,768 | 19,965 | |||
| *,1 | Gogo Inc. | 1,407,387 | 19,042 | |||
| Comtech Telecommunications Corp. | 719,972 | 17,056 | ||||
| * | Consolidated Communications Holdings Inc. | 2,144,845 | 16,043 | |||
| *,1 | Inseego Corp. | 2,727,854 | 15,903 | |||
| * | United States Cellular Corp. | 454,355 | 14,321 | |||
| * | Ooma Inc. | 601,899 | 12,303 | |||
| ATN International Inc. | 297,951 | 11,903 | ||||
| * | Ribbon Communications Inc. | 1,859,251 | 11,248 | |||
| *,1 | Akoustis Technologies Inc. | 1,454,053 | 9,713 | |||
| * | Aviat Networks Inc. | 274,106 | 8,793 | |||
| *,1 | AST SpaceMobile Inc. | 1,093,565 | 8,683 | |||
| * | Cambium Networks Corp. | 299,325 | 7,672 | |||
| * | DZS Inc. | 464,747 | 7,538 | |||
| * | CalAmp Corp. | 1,032,612 | 7,290 | |||
| * | Lantronix Inc. | 748,596 | 5,862 | |||
| * | Casa Systems Inc. | 979,691 | 5,555 | |||
| * | Powerfleet Inc. | 919,204 | 4,357 | |||
| Spok Holdings Inc. | 464,693 | 4,336 | ||||
| * | KVH Industries Inc. | 457,474 | 4,204 | |||
| * | Genasys Inc. | �� 1,017,703 | 4,050 | |||
| Bel Fuse Inc. Class B | 300,241 | 3,882 | ||||
| * | Hemisphere Media Group Inc. Class A | 478,622 | 3,480 | |||
| *,1 | Applied Optoelectronics Inc. | 664,868 | 3,417 | |||
| * | Airgain Inc. | 291,442 | 3,098 | |||
| *,1 | Resonant Inc. | 1,683,883 | 2,879 | |||
| Shares | Market Value• ($000) | |||||
| * | PCTEL Inc. | 434,105 | 2,461 | |||
| * | Crexendo Inc. | 343,511 | 1,718 | |||
| *,1 | Airspan Networks Holdings Inc. | 384,800 | 1,458 | |||
| Network-1 Technologies Inc. | 509,201 | 1,436 | ||||
| *,1 | Vislink Technologies Inc. | 1,155,455 | 1,363 | |||
| * | TESSCO Technologies Inc. | 206,685 | 1,279 | |||
| * | Franklin Wireless Corp. | 244,162 | 1,067 | |||
| *,1 | ComSovereign Holding Corp. | 1,404,121 | 1,060 | |||
| 1 | Communications Systems Inc. | 278,558 | 669 | |||
| * | Optical Cable Corp. | 92,325 | 496 | |||
| * | Kaltura Inc. | 89,047 | 300 | |||
| * | ClearOne Inc. | 231,050 | 298 | |||
| *,1 | Sonim Technologies Inc. | 157,205 | 145 | |||
| *,1,2 | FTE Networks Inc. | 84,180 | 126 | |||
| * | ADDvantage Technologies Group Inc. | 47,738 | 83 | |||
| Bel Fuse Inc. Class A | 2,976 | 43 | ||||
| *,1,2 | Ominto Inc. | 101,171 | 42 | |||
| 35,488,850 | ||||||
| Utilities (2.7%) | ||||||
| NextEra Energy Inc. | 55,764,274 | 5,206,153 | ||||
| Duke Energy Corp. | 21,854,432 | 2,292,530 | ||||
| Southern Co. | 30,114,223 | 2,065,233 | ||||
| Waste Management Inc. | 11,888,018 | 1,984,110 | ||||
| Dominion Energy Inc. | 23,016,066 | 1,808,142 | ||||
| Exelon Corp. | 27,757,020 | 1,603,245 | ||||
| American Electric Power Co. Inc. | 14,312,840 | 1,273,413 | ||||
| Sempra Energy | 8,954,402 | 1,184,488 | ||||
| Xcel Energy Inc. | 15,304,357 | 1,036,105 | ||||
| Waste Connections Inc. | 7,403,704 | 1,008,903 | ||||
| American Water Works Co. Inc. | 5,160,405 | 974,594 | ||||
| Public Service Enterprise Group Inc. | 14,373,727 | 959,159 | ||||
| Eversource Energy | 9,772,155 | 889,071 | ||||
| WEC Energy Group Inc. | 8,965,652 | 870,296 | ||||
| Republic Services Inc. | 5,857,568 | 816,838 | ||||
| Edison International | 10,794,013 | 736,691 | ||||
| Consolidated Edison Inc. | 8,554,261 | 729,850 | ||||
| * | PG&E Corp. | 56,007,922 | 679,936 | |||
| Ameren Corp. | 7,258,374 | 646,068 | ||||
| Shares | Market Value• ($000) | |||||
| Entergy Corp. | 5,714,934 | 643,787 | ||||
| FirstEnergy Corp. | 15,472,029 | 643,482 | ||||
| PPL Corp. | 21,339,452 | 641,464 | ||||
| DTE Energy Co. | 4,954,133 | 592,217 | ||||
| CMS Energy Corp. | 8,230,685 | 535,406 | ||||
| CenterPoint Energy Inc. | 17,873,135 | 498,839 | ||||
| Evergy Inc. | 6,450,795 | 442,589 | ||||
| Alliant Energy Corp. | 7,116,559 | 437,455 | ||||
| AES Corp. | 17,988,667 | 437,125 | ||||
| Atmos Energy Corp. | 3,763,642 | 394,317 | ||||
| Essential Utilities Inc. | 6,464,409 | 347,074 | ||||
| Vistra Corp. | 13,721,078 | 312,429 | ||||
| NiSource Inc. | 11,158,664 | 308,091 | ||||
| NRG Energy Inc. | 6,958,091 | 299,755 | ||||
| UGI Corp. | 5,944,590 | 272,916 | ||||
| Pinnacle West Capital Corp. | 3,207,886 | 226,445 | ||||
| OGE Energy Corp. | 5,686,909 | 218,264 | ||||
| * | Sunrun Inc. | 5,589,969 | 191,736 | |||
| National Fuel Gas Co. | 2,589,485 | 165,572 | ||||
| IDACORP Inc. | 1,436,947 | 162,820 | ||||
| * | Evoqua Water Technologies Corp. | 3,428,754 | 160,294 | |||
| * | Stericycle Inc. | 2,609,693 | 155,642 | |||
| * | Clean Harbors Inc. | 1,392,330 | 138,913 | |||
| Portland General Electric Co. | 2,546,506 | 134,761 | ||||
| Black Hills Corp. | 1,817,589 | 128,267 | ||||
| Hawaiian Electric Industries Inc. | 2,955,323 | 122,646 | ||||
| * | Casella Waste Systems Inc. Class A | 1,434,086 | 122,500 | |||
| ONE Gas Inc. | 1,521,161 | 118,027 | ||||
| New Jersey Resources Corp. | 2,731,235 | 112,144 | ||||
| Southwest Gas Holdings Inc. | 1,597,867 | 111,931 | ||||
| PNM Resources Inc. | 2,441,420 | 111,353 | ||||
| Avangrid Inc. | 2,200,369 | 109,754 | ||||
| American States Water Co. | 1,049,827 | 108,594 | ||||
| California Water Service Group | 1,498,101 | 107,654 | ||||
| 1 | Ormat Technologies Inc. | 1,273,967 | 101,026 | |||
| ALLETE Inc. | 1,490,706 | 98,908 | ||||
| Spire Inc. | 1,394,754 | 90,966 | ||||
| NorthWestern Corp. | 1,538,545 | 87,943 | ||||
| Avista Corp. | 2,020,138 | 85,836 | ||||
| MGE Energy Inc. | 1,029,166 | 84,649 | ||||
| South Jersey Industries Inc. | 3,186,187 | 83,223 | ||||
| Clearway Energy Inc. Class C | 2,138,445 | 77,048 | ||||
| Shares | Market Value• ($000) | |||||
| * | Sunnova Energy International Inc. | 2,554,388 | 71,318 | |||
| Chesapeake Utilities Corp. | 475,358 | 69,312 | ||||
| SJW Group | 842,777 | 61,691 | ||||
| Middlesex Water Co. | 470,857 | 56,644 | ||||
| Northwest Natural Holding Co. | 874,533 | 42,660 | ||||
| Clearway Energy Inc. Class A | 1,185,258 | 39,682 | ||||
| * | Harsco Corp. | 2,234,958 | 37,346 | |||
| * | US Ecology Inc. | 886,627 | 28,319 | |||
| Unitil Corp. | 447,308 | 20,572 | ||||
| York Water Co. | 386,277 | 19,229 | ||||
| * | Heritage-Crystal Clean Inc. | 487,014 | 15,594 | |||
| * | Archaea Energy Inc. | 685,300 | 12,527 | |||
| Global Water Resources Inc. | 666,392 | 11,395 | ||||
| Artesian Resources Corp. Class A | 233,644 | 10,825 | ||||
| * | Pure Cycle Corp. | 577,124 | 8,426 | |||
| RGC Resources Inc. | 289,761 | 6,667 | ||||
| * | Aris Water Solution Inc. Class A | 491,258 | 6,362 | |||
| *,1 | Vertex Energy Inc. | 1,350,091 | 6,116 | |||
| Via Renewables Inc. Class A | 367,644 | 4,202 | ||||
| * | Sharps Compliance Corp. | 501,400 | 3,575 | |||
| Genie Energy Ltd. Class B | 635,893 | 3,542 | ||||
| * | Advanced Emissions Solutions Inc. | 447,249 | 2,961 | |||
| *,1 | Cadiz Inc. | 757,002 | 2,922 | |||
| * | Quest Resource Holding Corp. | 392,752 | 2,726 | |||
| *,1 | Aqua Metals Inc. | 1,740,923 | 2,141 | |||
| * | Perma-Fix Environmental Services Inc. | 325,244 | 2,059 | |||
| *,1 | Charah Solutions Inc. | 316,062 | 1,495 | |||
| *,1 | Renovare Environmental Inc. | 612,155 | 429 | |||
| 37,539,424 | ||||||
| Total Common Stocks (Cost $573,421,149) | 1,368,154,052 | |||||
| Preferred Stocks (0.0%) | ||||||
| Meta Materials Inc. Pfd., 1/31/22 | 3,488,956 | 5,268 | ||||
| Shares | Market Value• ($000) | |||||
| Air T Funding Pfd., 8.000%, 6/7/24 | 1,727 | 42 | ||||
| Total Preferred Stocks (Cost $36) | 5,310 | |||||
| Face Amount ($000) | ||||||
| Corporate Bonds (0.0%) | ||||||
| Financials (0.0%) | ||||||
| GAMCO Investors Inc., 4.000%,6/15/23 (Cost $296) | 296 | 293 | ||||
| Shares | ||||||
| Temporary Cash Investments (0.6%) | ||||||
| Money Market Fund (0.6%) | ||||||
| 3,4 | Vanguard Market Liquidity Fund, 0.090% (Cost $8,611,890) | 86,130,993 | 8,612,238 | |||
| Total Investments (100.2%) (Cost $582,033,371) | 1,376,771,893 | |||||
| Other Assets and Liabilities—Net (-0.2%) | (3,359,041) | |||||
| Net Assets (100%) | 1,373,412,852 | |||||
| Cost is in $000. | |
| • | See Note A in Notes to Financial Statements. |
| * | Non-income-producing security. |
| 1 | Includes partial security positions on loan to broker-dealers. The total value of securities on loan is $3,987,307,000. |
| 2 | Security value determined using significant unobservable inputs. |
| 3 | Affiliated money market fund available only to Vanguard funds and certain trusts and accounts managed by Vanguard. Rate shown is the 7-day yield. |
| 4 | Collateral of $4,364,700,000 was received for securities on loan, of which $4,338,017,000 is held in Vanguard Market Liquidity Fund and $26,683,000 is held in cash. |
| CVR—Contingent Value Rights. | |
| REIT—Real Estate Investment Trust. |
| Futures Contracts | ||||
| ($000) | ||||
| Expiration | Number of Long (Short) Contracts | Notional Amount | Value and Unrealized Appreciation (Depreciation) | |
| Long Futures Contracts | ||||
| E-mini Russell 2000 Index | March 2022 | 1,914 | 214,636 | 2,623 |
| E-mini S&P 500 Index | March 2022 | 18,701 | 4,449,435 | 96,842 |
| E-mini S&P Mid-Cap 400 Index | March 2022 | 240 | 68,105 | 1,583 |
| 101,048 | ||||
| Over-the-Counter Total Return Swaps | ||||||
| Reference Entity | Termination Date | Counterparty | Notional Amount ($000) | Floating Interest Rate Received (Paid)1 (%) | Value and Unrealized Appreciation ($000) | Value and Unrealized (Depreciation) ($000) |
| Bandwidth Inc. Class A | 8/31/22 | BOANA | 6,163 | (0.521) | 6 | — |
| Consolidated Edison Inc. | 8/31/22 | BOANA | 116,460 | (0.578) | 12,629 | — |
| New York Community Bancorp Inc. | 8/31/22 | BOANA | 5,391 | (0.623) | 101 | — |
| Popular Inc. | 8/31/22 | BOANA | 10,895 | (0.474) | 643 | — |
| Signature Bank | 8/31/23 | BOANA | 90,978 | (0.834) | 6,034 | — |
| State Street Corp. | 8/31/23 | BOANA | 229,098 | (0.675) | 11,721 | — |
| Visa Inc. Class A | 8/31/22 | BOANA | 43,598 | 0.029 | 5,247 | — |
| Williams Cos. Inc. | 8/31/22 | BOANA | 36,970 | (0.470) | — | (483) |
| 36,381 | (483) | |||||
| 1 | Based on USD Overnight Bank Funding Rate as of the most recent payment date. Floating interest payment received/paid monthly. |
| BOANA—Bank of America, N.A. |
| ($000s, except shares and per-share amounts) | Amount |
| Assets | |
| Investments in Securities, at Value | |
| Unaffiliated Issuers (Cost $573,421,481) | 1,368,159,655 |
| Affiliated Issuers (Cost $8,611,890) | 8,612,238 |
| Total Investments in Securities | 1,376,771,893 |
| Investment in Vanguard | 43,666 |
| Cash | 190,969 |
| Cash Collateral Pledged—Futures Contracts | 247,630 |
| Receivables for Investment Securities Sold | 31,586 |
| Receivables for Accrued Income | 847,968 |
| Receivables for Capital Shares Issued | 788,733 |
| Unrealized Appreciation—Over-the-Counter Swap Contracts | 36,381 |
| Total Assets | 1,378,958,826 |
| Liabilities | |
| Payables for Investment Securities Purchased | 142,980 |
| Collateral for Securities on Loan | 4,364,700 |
| Payables for Capital Shares Redeemed | 999,768 |
| Payables to Vanguard | 24,036 |
| Variation Margin Payable—Futures Contracts | 14,007 |
| Unrealized Depreciation—Over-the-Counter Swap Contracts | 483 |
| Total Liabilities | 5,545,974 |
| Net Assets | 1,373,412,852 |
| Statement of Assets and Liabilities (continued) | |
| At December 31, 2021, net assets consisted of: | |
| ($000s, except shares and per-share amounts) | Amount |
| Paid-in Capital | 591,207,805 |
| Total Distributable Earnings (Loss) | 782,205,047 |
| Net Assets | 1,373,412,852 |
| Investor Shares—Net Assets | |
| Applicable to 1,139,944,671 outstanding $.001 par value shares of beneficial interest (unlimited authorization) | 133,976,597 |
| Net Asset Value Per Share—Investor Shares | $117.53 |
| ETF Shares—Net Assets | |
| Applicable to 1,238,501,714 outstanding $.001 par value shares of beneficial interest (unlimited authorization) | 299,087,859 |
| Net Asset Value Per Share—ETF Shares | $241.49 |
| Admiral Shares—Net Assets | |
| Applicable to 2,906,961,253 outstanding $.001 par value shares of beneficial interest (unlimited authorization) | 341,732,532 |
| Net Asset Value Per Share—Admiral Shares | $117.56 |
| Institutional Shares—Net Assets | |
| Applicable to 2,120,191,912 outstanding $.001 par value shares of beneficial interest (unlimited authorization) | 249,281,850 |
| Net Asset Value Per Share—Institutional Shares | $117.58 |
| Institutional Plus Shares—Net Assets | |
| Applicable to 1,344,965,858 outstanding $.001 par value shares of beneficial interest (unlimited authorization) | 296,554,290 |
| Net Asset Value Per Share—Institutional Plus Shares | $220.49 |
| Institutional Select Shares—Net Assets | |
| Applicable to 228,128,137 outstanding $.001 par value shares of beneficial interest (unlimited authorization) | 52,779,724 |
| Net Asset Value Per Share—Institutional Select Shares | $231.36 |
| Year Ended December 31, 2021 | |
| ($000) | |
| Investment Income | |
| Income | |
| Dividends—Unaffiliated Issuers1 | 16,541,541 |
| Dividends—Affiliated Issuers | — |
| Interest—Unaffiliated Issuers | 54 |
| Interest—Affiliated Issuers | 4,107 |
| Securities Lending—Net | 154,799 |
| Total Income | 16,700,501 |
| Expenses | |
| The Vanguard Group—Note B | |
| Investment Advisory Services | 19,467 |
| Management and Administrative—Investor Shares | 191,795 |
| Management and Administrative—ETF Shares | 60,934 |
| Management and Administrative—Admiral Shares | 109,061 |
| Management and Administrative—Institutional Shares | 55,582 |
| Management and Administrative—Institutional Plus Shares | 45,193 |
| Management and Administrative—Institutional Select Shares | 3,969 |
| Marketing and Distribution—Investor Shares | 7,150 |
| Marketing and Distribution—ETF Shares | 7,604 |
| Marketing and Distribution—Admiral Shares | 8,899 |
| Marketing and Distribution—Institutional Shares | 5,611 |
| Marketing and Distribution—Institutional Plus Shares | 3,061 |
| Marketing and Distribution—Institutional Select Shares | 1 |
| Custodian Fees | 2,032 |
| Auditing Fees | 399 |
| Shareholders’ Reports—Investor Shares | 1,013 |
| Shareholders’ Reports—ETF Shares | 2,476 |
| Shareholders’ Reports—Admiral Shares | 1,265 |
| Shareholders’ Reports—Institutional Shares | 1,151 |
| Shareholders’ Reports—Institutional Plus Shares | 83 |
| Shareholders’ Reports—Institutional Select Shares | — |
| Trustees’ Fees and Expenses | 357 |
| Interest Expense | — |
| Total Expenses | 527,103 |
| Net Investment Income | 16,173,398 |
| Realized Net Gain (Loss) | |
| Capital Gain Distributions Received—Affiliated Issuers | 144 |
| Investment Securities Sold—Unaffiliated Issuers2 | 23,905,095 |
| Investment Securities Sold—Affiliated Issuers | 211 |
| Statement of Operations (continued) | |
| Year Ended December 31, 2021 | |
| ($000) | |
| Futures Contracts | 1,472,639 |
| Swap Contracts | 27,042 |
| Realized Net Gain (Loss) | 25,405,131 |
| Change in Unrealized Appreciation (Depreciation) | |
| Investment Securities—Unaffiliated Issuers | 238,465,157 |
| Investment Securities—Affiliated Issuers | 1,052 |
| Futures Contracts | (6,444) |
| Swap Contracts | 36,234 |
| Change in Unrealized Appreciation (Depreciation) | 238,495,999 |
| Net Increase (Decrease) in Net Assets Resulting from Operations | 280,074,528 |
| 1 | Dividends are net of foreign withholding taxes of $1,369,000. |
| 2 | Includes $21,208,071,000 of net gain (loss) resulting from in-kind redemptions. |
| Year Ended December 31, | ||
| 2021 ($000) | 2020 ($000) | |
| Increase (Decrease) in Net Assets | ||
| Operations | ||
| Net Investment Income | 16,173,398 | 15,540,727 |
| Realized Net Gain (Loss) | 25,405,131 | 3,258,780 |
| Change in Unrealized Appreciation (Depreciation) | 238,495,999 | 170,087,718 |
| Net Increase (Decrease) in Net Assets Resulting from Operations | 280,074,528 | 188,887,225 |
| Distributions | ||
| Investor Shares | (1,676,741) | (2,178,405) |
| ETF Shares | (3,403,927) | (2,643,535) |
| Admiral Shares | (4,103,816) | (4,040,472) |
| Institutional Shares | (2,969,898) | (2,632,899) |
| Institutional Plus Shares | (3,559,330) | (3,283,515) |
| Institutional Select Shares | (647,913) | (503,956) |
| Total Distributions | (16,361,625) | (15,282,782) |
| Capital Share Transactions | ||
| Investor Shares | (51,574,306) | (11,200,923) |
| ETF Shares | 44,386,309 | 32,847,249 |
| Admiral Shares | 1,876,942 | (23,050,842) |
| Institutional Shares | 22,144,976 | (1,802,186) |
| Institutional Plus Shares | 14,016,596 | 1,241,423 |
| Institutional Select Shares | (1,862,868) | 11,449,267 |
| Net Increase (Decrease) from Capital Share Transactions | 28,987,649 | 9,483,988 |
| Total Increase (Decrease) | 292,700,552 | 183,088,431 |
| Net Assets | ||
| Beginning of Period | 1,080,712,300 | 897,623,869 |
| End of Period | 1,373,412,852 | 1,080,712,300 |
| Investor Shares | |||||
| For a Share Outstanding Throughout Each Period | Year Ended December 31, | ||||
| 2021 | 2020 | 2019 | 2018 | 2017 | |
| Net Asset Value, Beginning of Period | $94.71 | $79.66 | $62.08 | $66.70 | $56.06 |
| Investment Operations | |||||
| Net Investment Income1 | 1.284 | 1.284 | 1.279 | 1.275 | 1.086 |
| Capital Gain Distributions Received | .0001,2 | — | — | — | — |
| Net Realized and Unrealized Gain (Loss) on Investments | 22.837 | 15.026 | 17.634 | (4.703) | 10.630 |
| Total from Investment Operations | 24.121 | 16.310 | 18.913 | (3.428) | 11.716 |
| Distributions | |||||
| Dividends from Net Investment Income | (1.301) | (1.260) | (1.333) | (1.192) | (1.076) |
| Distributions from Realized Capital Gains | — | — | — | — | — |
| Total Distributions | (1.301) | (1.260) | (1.333) | (1.192) | (1.076) |
| Net Asset Value, End of Period | $117.53 | $94.71 | $79.66 | $62.08 | $66.70 |
| Total Return3 | 25.59% | 20.87% | 30.65% | -5.26% | 21.05% |
| Ratios/Supplemental Data | |||||
| Net Assets, End of Period (Millions) | $133,977 | $153,845 | $139,686 | $121,266 | $126,766 |
| Ratio of Total Expenses to Average Net Assets | 0.14% | 0.14% | 0.14% | 0.14% | 0.14% |
| Ratio of Net Investment Income to Average Net Assets | 1.20% | 1.62% | 1.78% | 1.86% | 1.77% |
| Portfolio Turnover Rate4 | 4% | 8% | 4% | 3% | 3% |
| 1 | Calculated based on average shares outstanding. |
| 2 | Distribution was less than $.001 per share. |
| 3 | Total returns do not include account service fees that may have applied in the periods shown. Fund prospectuses provide information about any applicable account service fees. |
| 4 | Excludes the value of portfolio securities received or delivered as a result of in-kind purchases or redemptions of the fund’s capital shares, including ETF Creation Units. |
| ETF Shares | |||||
| For a Share Outstanding Throughout Each Period | Year Ended December 31, | ||||
| 2021 | 2020 | 2019 | 2018 | 2017 | |
| Net Asset Value, Beginning of Period | $194.61 | $163.70 | $127.56 | $137.06 | $115.21 |
| Investment Operations | |||||
| Net Investment Income1 | 2.912 | 2.831 | 2.809 | 2.781 | 2.361 |
| Capital Gain Distributions Received | .0001,2 | — | — | — | — |
| Net Realized and Unrealized Gain (Loss) on Investments | 46.898 | 30.848 | 36.236 | (9.676) | 21.832 |
| Total from Investment Operations | 49.810 | 33.679 | 39.045 | (6.895) | 24.193 |
| Distributions | |||||
| Dividends from Net Investment Income | (2.930) | (2.769) | (2.905) | (2.605) | (2.343) |
| Distributions from Realized Capital Gains | — | — | — | — | — |
| Total Distributions | (2.930) | (2.769) | (2.905) | (2.605) | (2.343) |
| Net Asset Value, End of Period | $241.49 | $194.61 | $163.70 | $127.56 | $137.06 |
| Total Return | 25.72% | 20.95% | 30.80% | -5.13% | 21.16% |
| Ratios/Supplemental Data | |||||
| Net Assets, End of Period (Millions) | $299,088 | $202,075 | $138,067 | $94,809 | $91,862 |
| Ratio of Total Expenses to Average Net Assets | 0.03% | 0.03% | 0.03% | 0.03% | 0.04% |
| Ratio of Net Investment Income to Average Net Assets | 1.31% | 1.73% | 1.89% | 1.97% | 1.87% |
| Portfolio Turnover Rate3 | 4% | 8% | 4% | 3% | 3% |
| 1 | Calculated based on average shares outstanding. |
| 2 | Distribution was less than $.001 per share. |
| 3 | Excludes the value of portfolio securities received or delivered as a result of in-kind purchases or redemptions of the fund’s capital shares, including ETF Creation Units. |
| Admiral Shares | |||||
| For a Share Outstanding Throughout Each Period | Year Ended December 31, | ||||
| 2021 | 2020 | 2019 | 2018 | 2017 | |
| Net Asset Value, Beginning of Period | $94.74 | $79.69 | $62.09 | $66.72 | $56.08 |
| Investment Operations | |||||
| Net Investment Income1 | 1.402 | 1.364 | 1.360 | 1.344 | 1.148 |
| Capital Gain Distributions Received | .0001,2 | — | — | — | — |
| Net Realized and Unrealized Gain (Loss) on Investments | 22.833 | 15.025 | 17.646 | (4.711) | 10.633 |
| Total from Investment Operations | 24.235 | 16.389 | 19.006 | (3.367) | 11.781 |
| Distributions | |||||
| Dividends from Net Investment Income | (1.415) | (1.339) | (1.406) | (1.263) | (1.141) |
| Distributions from Realized Capital Gains | — | — | — | — | — |
| Total Distributions | (1.415) | (1.339) | (1.406) | (1.263) | (1.141) |
| Net Asset Value, End of Period | $117.56 | $94.74 | $79.69 | $62.09 | $66.72 |
| Total Return3 | 25.71% | 20.99% | 30.80% | -5.17% | 21.17% |
| Ratios/Supplemental Data | |||||
| Net Assets, End of Period (Millions) | $341,733 | $273,622 | $252,536 | $185,102 | $190,099 |
| Ratio of Total Expenses to Average Net Assets | 0.04% | 0.04% | 0.04% | 0.04% | 0.04% |
| Ratio of Net Investment Income to Average Net Assets | 1.30% | 1.72% | 1.88% | 1.96% | 1.87% |
| Portfolio Turnover Rate4 | 4% | 8% | 4% | 3% | 3% |
| 1 | Calculated based on average shares outstanding. |
| 2 | Distribution was less than $.001 per share. |
| 3 | Total returns do not include account service fees that may have applied in the periods shown. Fund prospectuses provide information about any applicable account service fees. |
| 4 | Excludes the value of portfolio securities received or delivered as a result of in-kind purchases or redemptions of the fund’s capital shares, including ETF Creation Units. |
| Institutional Shares | |||||
| For a Share Outstanding Throughout Each Period | Year Ended December 31, | ||||
| 2021 | 2020 | 2019 | 2018 | 2017 | |
| Net Asset Value, Beginning of Period | $94.75 | $79.70 | $62.10 | $66.73 | $56.09 |
| Investment Operations | |||||
| Net Investment Income1 | 1.416 | 1.374 | 1.365 | 1.354 | 1.153 |
| Capital Gain Distributions Received | .0001,2 | — | — | — | — |
| Net Realized and Unrealized Gain (Loss) on Investments | 22.841 | 15.024 | 17.649 | (4.715) | 10.630 |
| Total from Investment Operations | 24.257 | 16.398 | 19.014 | (3.361) | 11.783 |
| Distributions | |||||
| Dividends from Net Investment Income | (1.427) | (1.348) | (1.414) | (1.269) | (1.143) |
| Distributions from Realized Capital Gains | — | — | — | — | — |
| Total Distributions | (1.427) | (1.348) | (1.414) | (1.269) | (1.143) |
| Net Asset Value, End of Period | $117.58 | $94.75 | $79.70 | $62.10 | $66.73 |
| Total Return | 25.73% | 21.00% | 30.81% | -5.16% | 21.17% |
| Ratios/Supplemental Data | |||||
| Net Assets, End of Period (Millions) | $249,282 | $180,586 | $152,716 | $115,115 | $113,557 |
| Ratio of Total Expenses to Average Net Assets | 0.03% | 0.03% | 0.03% | 0.03% | 0.035% |
| Ratio of Net Investment Income to Average Net Assets | 1.31% | 1.73% | 1.89% | 1.97% | 1.87% |
| Portfolio Turnover Rate3 | 4% | 8% | 4% | 3% | 3% |
| 1 | Calculated based on average shares outstanding. |
| 2 | Distribution was less than $.001 per share. |
| 3 | Excludes the value of portfolio securities received or delivered as a result of in-kind purchases or redemptions of the fund’s capital shares, including ETF Creation Units. |
| Institutional Plus Shares | |||||
| For a Share Outstanding Throughout Each Period | Year Ended December 31, | ||||
| 2021 | 2020 | 2019 | 2018 | 2017 | |
| Net Asset Value, Beginning of Period | $177.69 | $149.47 | $116.46 | $125.14 | $105.18 |
| Investment Operations | |||||
| Net Investment Income1 | 2.672 | 2.591 | 2.575 | 2.555 | 2.182 |
| Capital Gain Distributions Received | .0001,2 | — | — | — | — |
| Net Realized and Unrealized Gain (Loss) on Investments | 42.823 | 28.172 | 33.100 | (8.842) | 19.938 |
| Total from Investment Operations | 45.495 | 30.763 | 35.675 | (6.287) | 22.120 |
| Distributions | |||||
| Dividends from Net Investment Income | (2.695) | (2.543) | (2.665) | (2.393) | (2.160) |
| Distributions from Realized Capital Gains | — | — | — | — | — |
| Total Distributions | (2.695) | (2.543) | (2.665) | (2.393) | (2.160) |
| Net Asset Value, End of Period | $220.49 | $177.69 | $149.47 | $116.46 | $125.14 |
| Total Return | 25.74% | 21.02% | 30.82% | -5.15% | 21.19% |
| Ratios/Supplemental Data | |||||
| Net Assets, End of Period (Millions) | $296,554 | $226,288 | $188,188 | $135,641 | $126,130 |
| Ratio of Total Expenses to Average Net Assets | 0.02% | 0.02% | 0.02% | 0.02% | 0.02% |
| Ratio of Net Investment Income to Average Net Assets | 1.32% | 1.74% | 1.90% | 1.98% | 1.89% |
| Portfolio Turnover Rate3 | 4% | 8% | 4% | 3% | 3% |
| 1 | Calculated based on average shares outstanding. |
| 2 | Distribution was less than $.001 per share. |
| 3 | Excludes the value of portfolio securities received or delivered as a result of in-kind purchases or redemptions of the fund’s capital shares, including ETF Creation Units. |
| Institutional Select Shares | |||||
| For a Share Outstanding Throughout Each Period | Year Ended December 31, | ||||
| 2021 | 2020 | 2019 | 2018 | 2017 | |
| Net Asset Value, Beginning of Period | $186.45 | $156.83 | $122.20 | $131.31 | $110.37 |
| Investment Operations | |||||
| Net Investment Income1 | 2.821 | 2.772 | 2.709 | 2.704 | 2.311 |
| Capital Gain Distributions Received | .0001,2 | — | — | — | — |
| Net Realized and Unrealized Gain (Loss) on Investments | 44.937 | 29.532 | 34.731 | (9.290) | 20.908 |
| Total from Investment Operations | 47.758 | 32.304 | 37.440 | (6.586) | 23.219 |
| Distributions | |||||
| Dividends from Net Investment Income | (2.848) | (2.684) | (2.810) | (2.524) | (2.279) |
| Distributions from Realized Capital Gains | — | — | — | — | — |
| Total Distributions | (2.848) | (2.684) | (2.810) | (2.524) | (2.279) |
| Net Asset Value, End of Period | $231.36 | $186.45 | $156.83 | $122.20 | $131.31 |
| Total Return | 25.75% | 21.03% | 30.84% | -5.14% | 21.20% |
| Ratios/Supplemental Data | |||||
| Net Assets, End of Period (Millions) | $52,780 | $44,296 | $26,431 | $20,262 | $14,163 |
| Ratio of Total Expenses to Average Net Assets | 0.01% | 0.01% | 0.01% | 0.01% | 0.01% |
| Ratio of Net Investment Income to Average Net Assets | 1.33% | 1.76% | 1.91% | 1.99% | 1.90% |
| Portfolio Turnover Rate3 | 4% | 8% | 4% | 3% | 3% |
| 1 | Calculated based on average shares outstanding. |
| 2 | Distribution was less than $.001 per share. |
| 3 | Excludes the value of portfolio securities received or delivered as a result of in-kind purchases or redemptions of the fund’s capital shares, including ETF Creation Units. |
| Level 1 ($000) | Level 2 ($000) | Level 3 ($000) | Total ($000) | |
| Investments | ||||
| Assets | ||||
| Common Stocks | 1,368,142,978 | 1 | 11,073 | 1,368,154,052 |
| Preferred Stocks | 5,310 | — | — | 5,310 |
| Corporate Bonds | — | 293 | — | 293 |
| Temporary Cash Investments | 8,612,238 | — | — | 8,612,238 |
| Total | 1,376,760,526 | 294 | 11,073 | 1,376,771,893 |
| Derivative Financial Instruments | ||||
| Assets | ||||
| Futures Contracts1 | 101,048 | — | — | 101,048 |
| Swap Contracts | — | 36,381 | — | 36,381 |
| Total | 101,048 | 36,381 | — | 137,429 |
| Liabilities | ||||
| Swap Contracts | — | 483 | — | 483 |
| 1 | Includes cumulative appreciation (depreciation) on futures contracts and centrally cleared swaps, if any, as reported in the Schedule of Investments. Only current day’s variation margin is reported within the Statement of Assets and Liabilities. |
| Amount ($000) | |
| Paid-in Capital | 21,210,259 |
| Total Distributable Earnings (Loss) | (21,210,259) |
| Amount ($000) | |
| Undistributed Ordinary Income | 213,319 |
| Undistributed Long-Term Gains | — |
| Capital Loss Carryforwards | (11,733,322) |
| Qualified Late-Year Losses | — |
| Net Unrealized Gains (Losses) | 793,725,050 |
| Year Ended December 31, | ||
| 2021 Amount ($000) | 2020 Amount ($000) | |
| Ordinary Income* | 16,361,625 | 15,282,782 |
| Long-Term Capital Gains | — | — |
| Total | 16,361,625 | 15,282,782 |
| * | Includes short-term capital gains, if any. |
| Amount ($000) | |
| Tax Cost | 583,046,843 |
| Gross Unrealized Appreciation | 823,940,577 |
| Gross Unrealized Depreciation | (30,215,527) |
| Net Unrealized Appreciation (Depreciation) | 793,725,050 |
| Year Ended December 31, | |||||
| 2021 | 2020 | ||||
| Amount ($000) | Shares (000) | Amount ($000) | Shares (000) | ||
| Investor Shares | |||||
| Issued | 496,590 | 4,799 | 14,516,361 | 207,934 | |
| Issued in Lieu of Cash Distributions | 1,676,741 | 15,550 | 2,178,405 | 28,832 | |
| Redeemed | (53,747,637) | (504,787) | (27,895,689) | (365,845) | |
| Net Increase (Decrease)—Investor Shares | (51,574,306) | (484,438) | (11,200,923) | (129,079) | |
| ETF Shares | |||||
| Issued | 69,095,066 | 308,260 | 50,514,859 | 305,434 | |
| Issued in Lieu of Cash Distributions | — | — | — | — | |
| Redeemed | (24,708,757) | (108,100) | (17,667,610) | (110,500) | |
| Net Increase (Decrease)—ETF Shares | 44,386,309 | 200,160 | 32,847,249 | 194,934 | |
| Admiral Shares | |||||
| Issued | 37,025,893 | 347,554 | 32,397,184 | 424,606 | |
| Issued in Lieu of Cash Distributions | 3,424,237 | 31,536 | 3,371,979 | 44,445 | |
| Redeemed | (38,573,188) | (360,387) | (58,820,005) | (749,884) | |
| Net Increase (Decrease)—Admiral Shares | 1,876,942 | 18,703 | (23,050,842) | (280,833) | |
| Institutional Shares | |||||
| Issued | 44,920,917 | 425,435 | 27,070,393 | 360,889 | |
| Issued in Lieu of Cash Distributions | 2,799,517 | 25,726 | 2,476,296 | 32,636 | |
| Redeemed | (25,575,458) | (236,871) | (31,348,875) | (403,732) | |
| Net Increase (Decrease)—Institutional Shares | 22,144,976 | 214,290 | (1,802,186) | (10,207) | |
| Institutional Plus Shares | |||||
| Issued | 27,268,129 | 137,022 | 28,455,775 | 204,305 | |
| Issued in Lieu of Cash Distributions | 3,498,917 | 17,171 | 3,238,183 | 22,739 | |
| Redeemed | (16,750,450) | (82,739) | (30,452,535) | (212,599) | |
| Net Increase (Decrease)—Institutional Plus Shares | 14,016,596 | 71,454 | 1,241,423 | 14,445 | |
| Institutional Select Shares | |||||
| Issued | 5,779,241 | 28,270 | 15,638,742 | 96,623 | |
| Issued in Lieu of Cash Distributions | 647,913 | 3,034 | 503,956 | 3,296 | |
| Redeemed | (8,290,022) | (40,759) | (4,693,431) | (30,863) | |
| Net Increase (Decrease)—Institutional Select Shares | (1,862,868) | (9,455) | 11,449,267 | 69,056 | |
| Current Period Transactions | ||||||||
| Dec. 31, 2020 Market Value ($000) | Purchases at Cost ($000) | Proceeds from Securities Sold1 ($000) | Realized Net Gain (Loss) ($000) | Change in Unrealized App. (Dep.) ($000) | Income ($000) | Capital Gain Distributions Received ($000) | Dec. 31, 2021 Market Value ($000) | |
| 180 Life Sciences Corp. | 2,919 | 3,353 | 5,959 | 3,375 | (934) | — | — | NA2 |
| Avenue Therapeutics Inc. | 4,991 | — | 2,478 | (1,993) | (235) | — | — | NA2 |
| Dare Bioscience Inc. | 3,618 | 2,043 | 3,640 | 1,554 | 589 | — | — | NA2 |
| Lifevantage Corp. | 8,536 | 1,119 | 4,418 | (3,261) | 1,190 | — | — | NA2 |
| Luby's Inc. | NA3 | 5,102 | 7,702 | 2,048 | 588 | — | — | NA2 |
| NeuroMetrix Inc. | — | 3,523 | 506 | (636) | (1,287) | — | — | NA2 |
| Perma-Pipe International Holdings Inc. | 2,860 | 1 | 1,550 | (318) | 1,274 | — | — | NA2 |
| Research Solutions Inc. | 4,035 | 1 | 3,110 | (62) | 282 | — | — | NA2 |
| Vanguard Market Liquidity Fund | 8,699,256 | NA4 | NA4 | (496) | (415) | 4,107 | 144 | 8,612,238 |
| Total | 8,726,215 | 15,142 | 29,363 | 211 | 1,052 | 4,107 | 144 | 8,612,238 |
| 1 | Does not include adjustments related to return of capital. |
| 2 | Not applicable—at December 31, 2021, the security was still held, but the issuer was no longer an affiliated company of the fund. |
| 3 | Not applicable—at December 31, 2020, the issuer was not an affiliated company of the fund. |
| 4 | Not applicable—purchases and sales are for temporary cash investment purposes. |
Philadelphia, Pennsylvania
February 17, 2022
| Matthew Benchener | Thomas M. Rampulla |
| Joseph Brennan | Karin A. Risi |
| Mortimer J. Buckley | Anne E. Robinson |
| Gregory Davis | Michael Rollings |
| John James | Nitin Tandon |
| John T. Marcante | Lauren Valente |
| Chris D. McIsaac |

Who Are Deaf or Hard of Hearing > 800-749-7273
All rights reserved.
U.S. Patent No. 6,879,964.
Vanguard Marketing Corporation, Distributor.
Item 2: Code of Ethics.
The Registrant has adopted a code of ethics that applies to the Registrant’s principal executive officer, principal financial officer, principal accounting officer or controller or persons performing similar functions. The Code of Ethics was amended during the reporting period covered by this report to make certain technical, non-material changes.
Item 3: Audit Committee Financial Expert.
All members of the Audit Committee have been determined by the Registrant’s Board of Trustees to be Audit Committee Financial Experts and to be independent: F. Joseph Loughrey, Mark Loughridge, Sarah Bloom Raskin, and Peter F. Volanakis.
Item 4: Principal Accountant Fees and Services.
(a) Audit Fees.
Audit Fees of the Registrant.
Fiscal Year Ended December 31, 2021: $827,000
Fiscal Year Ended December 31, 2020: $823,000
Aggregate Audit Fees of Registered Investment Companies in the Vanguard Group.
Fiscal Year Ended December 31, 2021: $11,244,694
Fiscal Year Ended December 31, 2020: $10,761,407
Includes fees billed in connection with audits of the Registrant, other registered investment companies in the Vanguard complex, The Vanguard Group, Inc., and Vanguard Marketing Corporation.
(b) Audit-Related Fees.
Fiscal Year Ended December 31, 2021: $2,955,181
Fiscal Year Ended December 31, 2020: $2,915,863
Includes fees billed in connection with assurance and related services provided to the Registrant, other registered investment companies in the Vanguard complex, The Vanguard Group, Inc., and Vanguard Marketing Corporation.
(c) Tax Fees.
Fiscal Year Ended December 31, 2021: $2,047,574
Fiscal Year Ended December 31, 2020: $247,168
Includes fees billed in connection with tax compliance, planning, and advice services provided to the Registrant, other registered investment companies in the Vanguard complex, The Vanguard Group, Inc., and Vanguard Marketing Corporation.
(d) All Other Fees.
Fiscal Year Ended December 31, 2021: $280,000
Fiscal Year Ended December 31, 2020: $115,000
Includes fees billed for services related to tax reported information provided to the Registrant, other registered investment companies in the Vanguard complex, The Vanguard Group, Inc., and Vanguard Marketing Corporation.
(e) (1) Pre-Approval Policies. The policy of the Registrant’s Audit Committee is to consider, and, if appropriate, approve before the principal accountant is engaged for such services, all specific audit and non-audit services provided to: the Registrant, other registered investment companies in the Vanguard complex, The Vanguard Group, Inc., and entities controlled by The Vanguard Group, Inc. that provide ongoing services to the Registrant. In making a determination, the Audit Committee considers whether the services are consistent with maintaining the principal accountant’s independence.
In the event of a contingency situation in which the principal accountant is needed to provide services in between scheduled Audit Committee meetings, the Chairman of the Audit Committee would be called on to consider and, if appropriate, pre-approve audit or permitted non-audit services in an amount sufficient to complete services through the next Audit Committee meeting, and to determine if such services would be consistent with maintaining the accountant’s independence. At the next scheduled Audit Committee meeting, services and fees would be presented to the Audit Committee for formal consideration, and, if appropriate, approval by the entire Audit Committee. The Audit Committee would again consider whether such services and fees are consistent with maintaining the principal accountant’s independence.
The Registrant’s Audit Committee is informed at least annually of all audit and non-audit services provided by the principal accountant to the Vanguard complex, whether such services are provided to: the Registrant, other registered investment companies in the Vanguard complex, The Vanguard Group, Inc., or other entities controlled by The Vanguard Group, Inc. that provide ongoing services to the Registrant.
(2) No percentage of the principal accountant’s fees or services were approved pursuant to the waiver provision of paragraph (c)(7)(i)(C) of Rule 2-01 of Regulation S-X.
(f) For the most recent fiscal year, over 50% of the hours worked under the principal accountant’s engagement were not performed by persons other than full-time, permanent employees of the principal accountant.
(g) Aggregate Non-Audit Fees.
Fiscal Year Ended December 31, 2021: $2,327,574
Fiscal Year Ended December 31, 2020: $362,168
Includes fees billed for non-audit services provided to the Registrant, other registered investment companies in the Vanguard complex, The Vanguard Group, Inc., and Vanguard Marketing Corporation.
(h) For the most recent fiscal year, the Audit Committee has determined that the provision of all non-audit services was consistent with maintaining the principal accountant’s independence.
Item 5: Audit Committee of Listed Registrants.
The Registrant is a listed issuer as defined in rule 10A-3 under the Securities Exchange Act of 1934 (“Exchange Act”). The Registrant has a separately-designated standing audit committee established in accordance with Section 3(a)(58)(A) of the Exchange Act. The Registrant’s audit committee members are: F. Joseph Loughrey, Mark Loughridge, Sarah Bloom Raskin, and Peter F. Volanakis.
Item 6: Investments.
Not applicable. The complete schedule of investments is included as part of the report to shareholders filed under Item 1 of this Form.
Item 7: Disclosure of Proxy Voting Policies and Procedures for Closed-End Management Investment Companies.
Not applicable.
Item 8: Portfolio Managers of Closed-End Management Investment Companies.
Not applicable.
Item 9: Purchase of Equity Securities by Closed-End Management Investment Company and Affiliated Purchasers.
Not applicable.
Item 10: Submission of Matters to a Vote of Security Holders.
Not applicable.
Item 11: Controls and Procedures.
(a) Disclosure Controls and Procedures. The Principal Executive and Financial Officers concluded that the Registrant’s Disclosure Controls and Procedures are effective based on their evaluation of the Disclosure Controls and Procedures as of a date within 90 days of the filing date of this report.
(b) Internal Control Over Financial Reporting. There were no significant changes in the Registrant’s Internal Control Over Financial Reporting or in other factors that could significantly affect this control subsequent to the date of the evaluation, including any corrective actions with regard to significant deficiencies and material weaknesses.
Item 12: Disclosure of Securities Lending Activities for Closed-End Management Investment Companies.
Not applicable.
Item 13: Exhibits.
| (a)(1) | Code of Ethics filed herewith. |
| (a)(2) | Certifications filed herewith. |
| (b) | Certifications field herewith. |
Pursuant to the requirements of the Securities Exchange Act of 1934 and the Investment Company Act of 1940, the registrant has duly caused this report to be signed on its behalf by the undersigned, thereunto duly authorized.
| VANGUARD INDEX FUNDS | ||
| BY: | /s/ MORTIMER J. BUCKLEY* | |
MORTIMER J. BUCKLEY CHIEF EXECUTIVE OFFICER |
Date: February 18, 2022
Pursuant to the requirements of the Securities Exchange Act of 1934 and the Investment Company Act of 1940, this report has been signed below by the following persons on behalf of the registrant and in the capacities and on the dates indicated.
| VANGUARD INDEX FUNDS | ||
| BY: | /s/ MORTIMER J. BUCKLEY* | |
MORTIMER J. BUCKLEY CHIEF EXECUTIVE OFFICER |
Date: February 18, 2022
| VANGUARD INDEX FUNDS | ||
| BY: | /s/ CHRISTINE BUCHANAN* | |
CHRISTINE BUCHANAN CHIEF FINANCIAL OFFICER |
Date: February 18, 2022
| * By: | /s/ Anne E. Robinson |
Anne E. Robinson, pursuant to a Power of Attorney filed on November 29, 2021 (see File Number 33-64845), a Power of Attorney filed on October 12, 2021 (see File Number 33-23444), and a Power of Attorney filed on August 26, 2021 (see file Number 811-02652), Incorporated by Reference.