Table of Contents
Exhibit (99)(b)

QUARTERLY EARNINGS REPORT
APRIL 16, 2007
TABLEOF CONTENTS
| 1 | ||
| 2 | ||
| 3 | ||
| 4 | ||
| 5 | ||
| 6 | ||
| 7 | ||
| 8 | ||
| 9 | ||
| 10 | ||
| 11 | ||
| 12 | ||
| 13-14 | ||
| 15 | ||
Note: World Savings Monthly Financial Highlights are located on Pages 27-28 of the Appendix | ||
| 16-41 | ||
Explanation of Our Use and Reconciliation of Certain Non-GAAP Financial Measures | 42-46 | |
| 47 | ||
| 48 |
READERSAREENCOURAGEDTOREFERTO WACHOVIA’SRESULTSFORTHEYEARENDED DECEMBER 31, 2006,PRESENTEDINACCORDANCEWITH U.S.GENERALLYACCEPTEDACCOUNTINGPRINCIPLES (“GAAP”),WHICHMAYBEFOUNDIN WACHOVIA’S 2006 ANNUAL REPORTON FORM 10-K.
ALLNARRATIVECOMPARISONSAREWITH FOURTH QUARTER 2006UNLESSOTHERWISENOTED.
THEINFORMATIONCONTAINEDHEREININCLUDESCERTAINNON-GAAPFINANCIALMEASURES. PLEASEREFERTOPAGES 42-46FORANIMPORTANTEXPLANATIONOFOURUSEOFNON-GAAPMEASURESANDRECONCILIATIONOFTHOSENON-GAAPMEASURESTO GAAP.
Table of Contents
Wachovia 1Q07 Quarterly Earnings Report
EXPLANATIONOF “COMBINED” RESULTS
CERTAINTABLESANDNARRATIVECOMPARISONSINTHIS QUARTERLY EARNINGS REPORTINCLUDEREFERENCESTO “COMBINED”RESULTSFORFIRSTQUARTER 2006ANDEARLIERPERIODS. “COMBINED”RESULTSFORTHEFIRSTQUARTEROF 2006ANDPRIORQUARTERSREPRESENT WACHOVIA’SACTUALRESULTSPLUSTHEACTUALRESULTSOF GOLDEN WEST. “COMBINED”RESULTSINCLUDEPURCHASEACCOUNTINGANDOTHERCLOSINGADJUSTMENTS (PAA)ASOFTHEACTUALCLOSINGDATEOF OCTOBER 1, 2006; “COMBINED”RESULTSFORPRIORPERIODSINCLUDEAMORTIZATION/ACCRETIONBASEDONPRELIMINARYFAIRVALUEPURCHASEACCOUNTINGADJUSTMENTSFORSECURITIES,LOANS,PREMISESANDEQUIPMENT,DEPOSITS,LONG-TERMDEBTANDDEPOSITBASEINTANGIBLE (DBI). INADDITION, “COMBINED”RESULTSALSOINCLUDEA “FUNDINGCOST”WHICHREPRESENTSINTERESTEXPENSECALCULATEDATARATEOF 5.35%ONTHECASHPORTIONOFTHEPURCHASEPRICEANDMERGER-RELATEDANDRESTRUCTURINGEXPENSES. READERSSHOULDNOTETHATSUCHPURCHASEACCOUNTINGADJUSTMENTSANDFUNDINGCOSTSMAYHAVEBEENDIFFERENTIFTHEMERGERHADBEENCOMPLETEDINPRIORPERIODS,ALTHOUGHFORPURPOSESOFPRESENTINGTHE “COMBINED”RESULTSWEHAVEASSUMEDTHEYWERENOTDIFFERENT.
THE “COMBINED”RESULTSAREFORILLUSTRATIVEPURPOSESONLYANDTHEPRESENTATIONOFRESULTSONTHIS “COMBINED”BASISISNOTAPRESENTATIONTHATCONFORMSWITHGENERALLYACCEPTEDACCOUNTINGPRINCIPLES. READERSAREENCOURAGEDTOREFERTO WACHOVIA’SRESULTSPRESENTEDINACCORDANCEWITHGENERALLYACCEPTEDACCOUNTINGPRINCIPLES,WHICHMAYBEFOUNDINEXHIBIT (99)(C) TO WACHOVIA’SCURRENTREPORTONFORM 8-K,FILEDON APRIL 16, 2007. ALLNARRATIVECOMPARISONSARETOWACHOVIA-ONLYRESULTSFORPRIORPERIODSUNLESSOTHERWISENOTED. SEEALSO “SUPPLEMENTAL ILLUSTRATIVE COMBINED INFORMATION”ONPAGE 48FORAFURTHERDISCUSSIONREGARDINGTHE “COMBINED”PRESENTATION.
IN 4Q06,ASARESULTOFPERFORMINGOUR STAFF ACCOUNTING BULLETIN NO. 108,CONSIDERINGTHE EFFECTSOF PRIOR YEAR MISSTATEMENTSWHENQUANTIFYING MISSTATEMENTSIN CURRENT YEAR FINANCIAL STATEMENTS, (SAB 108)REVIEW,WEELECTEDTORECORDCERTAINIMMATERIAL,PRIORYEARADJUSTMENTSWHICHAREUNRELATEDTO SAB 108ANDWHICHAREFURTHERDISCUSSEDANDOUTLINEDONPAGE 18. THESEADJUSTMENTSAREREFERREDTOAS “4Q06ADJUSTMENTS”ANDINSOMEINSTANCES,OURREPORTEDRESULTSAREDISCUSSEDEXCLUDINGTHEEFFECTOFTHESE 4Q06ADJUSTMENTSTOILLUSTRATETHEEFFECTSONCOREOPERATINGTRENDSWITHOUTSUCHADJUSTMENTS.
ALLNARRATIVECOMPARISONSOF “COMBINED”RESULTSPERTAINTO 1Q07 REPORTEDRESULTSVERSUS 1Q06 “COMBINED”RESULTSUNLESSOTHERWISENOTED. INADDITION, “COMBINED”RESULTSDONOTREFLECTTHEACQUISITIONOF WESTCORPAND WFS FINANCIAL INCCOMPLETEDON MARCH 1, 2006,FORPERIODSPRIORTOTHEACQUISITIONDATE.
FOREASEOFUSE,COMMENTSPERTAININGTO AS REPORTEDOR ACTUALRESULTSAREPRESENTEDINBOLDTYPE.
“COMBINED” SUMMARY
1Q06: | REPORTEDRESULTSPLUS GOLDEN WEST’SRESULTSPLUSTHREEMONTHSOF PAAAND DBIACCRETION/AMORTIZATIONANDFUNDINGCOSTS. |
Page-1
Table of Contents
Wachovia 1Q07 Quarterly Earnings Report
First Quarter 2007 Financial Highlights
| • | Earnings of $2.3 billion flat with 4Q06 and up 33% from 1Q06; EPS of $1.20 flat, and up 10% from 1Q06 |
| — | Excluding net merger-related and restructuring expenses, EPS of $1.20 down 1% from 4Q06 which included $0.02 gain from sale of corporate and institutional trust businesses; up 7% from 1Q06 |
| • | Segment results compared to 4Q06 reflect strength in Capital Management; weaker results in General Bank and Wealth Management, largely reflecting seasonality and environmental headwinds; and lower results in Corporate & Investment Bank from strong 4Q06 levels |
| — | Environmental factors largely mask underlying sales momentum and disciplined execution |
| Segment Earnings | ||||||
| vs. 4Q06 | vs. 1Q06 | |||||
General Bank | -8 | % | +41 | % | ||
Wealth Management | -11 | % | +14 | % | ||
Corporate & Investment Bank | -26 | % | -23 | % | ||
Capital Management | +19 | % | +42 | % | ||
1Q07 vs. Adjusted Reported 4Q06
The following chart adjusts 4Q06 Reported results to illustrate operating trends without the impact of 4Q06 Adjustments; additional detail is included on pages 7, 8 and 18.
(In millions) | A Reported 1Q07 | B Reported 4Q06 | C 4Q06 Adjustments | B+C Adjusted Reported 4Q06 | 1Q07 vs Adj 4Q06 | ||||||||
Net interest income(Tax-equivalent) | $ | 4,497 | 4,612 | (24 | ) | 4,588 | (2 | )% | |||||
Fee and other income | 3,741 | 3,980 | (115 | ) | 3,865 | (3 | ) | ||||||
Total revenue(Tax-equivalent) | 8,238 | 8,592 | (139 | ) | 8,453 | (3 | ) | ||||||
Provision for credit losses | 177 | 206 | — | 206 | (14 | ) | |||||||
Total noninterest expense | 4,588 | 4,931 | (198 | ) | 4,733 | (3 | ) | ||||||
Minority interest in income of consolidated subsidiaries | 136 | 125 | — | 125 | 9 | ||||||||
Pre-tax income from continuing operations(Tax-equivalent) | 3,337 | 3,330 | 59 | 3,389 | (2 | ) | |||||||
Income taxes(Tax-equivalent) | 1,035 | 1,075 | 72 | 1,147 | (10 | ) | |||||||
Income from continuing operations | 2,302 | 2,255 | (13 | ) | 2,242 | 3 | |||||||
Discontinued operations, net of income taxes | — | 46 | — | 46 | — | ||||||||
Net income | $ | 2,302 | 2,301 | (13 | ) | 2,288 | 1 | % | |||||
| • | Revenues down 3% from strong Adjusted 4Q06 levels; up 3% from Combined 1Q06 |
| — | Net interest income down 2% and margin decreased 7 bps to 3.01% from Adjusted 4Q06 of 3.08% |
| • | Results largely reflect growth in lower spread loans and the securitization warehouse and improved retail deposit pricing, lower income from maturing off-balance sheet positions, declines in trading-related net interest income and the effect of FSP 13-2/FIN 48 adoption |
| — | Fee income down 3% from strong Adjusted 4Q06 levels largely due to declines in structured products and principal investing gains somewhat offset by improvement in trading |
| • | Other noninterest expense down $83 million, or 2% from Adjusted 4Q06; up 3% from Combined 1Q06 |
| — | Excluding $93 million of retirement-eligible employee stock compensation expense in 1Q07, noninterest expense down 4% from Adjusted 4Q06 driven largely by lower revenue-based incentives and sundry expense as well as expense discipline |
| • | Average loans up 1% and up 59% from 1Q06;up 9% from Combined 1Q06 |
| • | Average core deposits grew 2% and 27% from 1Q06;up 5% from Combined 1Q06 |
| — | Strong momentum in retail checking account strategies |
| • | Nonperforming assets of $1.8 billion or 40 bps of loans |
| • | Net charge-offs of $155 million or 15 bps of loans |
| — | Provision expense of $177 million largely reflects loan growth including $10 million relating to credit card |
| • | Effective tax rate of 30.99% reflects updated information on certain tax matters |
| • | Tangible equity of 4.7% and leverage ratio of 6.1%; repurchased 5 million shares during the quarter |
Page-2
Table of Contents
Wachovia 1Q07 Quarterly Earnings Report
Earnings Reconciliation
| 2007 | 2006 | 1Q07 EPS | |||||||||||||||||||||||||||
First Quarter | Fourth Quarter | Third Quarter | Second Quarter | First Quarter | vs | vs | |||||||||||||||||||||||
(After-tax in millions, except per share data) | Amount | EPS | Amount | EPS | Amount | EPS | Amount | EPS | Amount | EPS | 4Q06 | 1Q06 | |||||||||||||||||
Net income (GAAP) | $ | 2,302 | 1.20 | 2,301 | 1.20 | 1,877 | 1.17 | 1,885 | 1.17 | 1,728 | 1.09 | — | % | 10 | |||||||||||||||
Net merger-related and restructuring expenses | 6 | — | 29 | 0.01 | 25 | 0.02 | 15 | 0.01 | 46 | 0.03 | (100 | ) | (100 | ) | |||||||||||||||
Earnings excluding merger-related and restructuring expenses | 2,308 | 1.20 | 2,330 | 1.21 | 1,902 | 1.19 | 1,900 | 1.18 | 1,774 | 1.12 | (1 | ) | 7 | ||||||||||||||||
Discontinued operations, net of income taxes | — | — | (46 | ) | (0.02 | ) | �� | — | — | — | — | — | — | — | |||||||||||||||
Earnings excluding merger-related and restructuring expenses, and discontinued operations | 2,308 | 1.20 | 2,284 | 1.19 | 1,902 | 1.19 | 1,900 | 1.18 | 1,774 | 1.12 | 1 | 7 | |||||||||||||||||
Deposit base and other intangible amortization | 76 | 0.04 | 90 | 0.05 | 59 | 0.04 | 64 | 0.04 | 59 | 0.04 | (20 | ) | — | ||||||||||||||||
Earnings excluding merger-related and restructuring expenses, other intangible amortization and discontinued operations | $ | 2,384 | 1.24 | 2,374 | 1.24 | 1,961 | 1.23 | 1,964 | 1.22 | 1,833 | 1.16 | — | % | 7 | |||||||||||||||
KEY POINTS
| • | Expect remaining 2007 intangible amortization of $0.09 per share: 2Q07 $0.03; 3Q07 $0.03; 4Q07 $0.03, based on 1Q07 average diluted shares outstanding of 1,925 million |
Page-3
Table of Contents
Wachovia 1Q07 Quarterly Earnings Report
Earnings Summary
| 2007 | 2006 | 1Q07 vs 4Q06 | 1Q07 vs 1Q06 | Combined | |||||||||||||||||||||
(In millions, except per share data) | First Quarter | Fourth Quarter | Third Quarter | Second Quarter | First Quarter | 1Q06 | 1Q07 vs 1Q06 | ||||||||||||||||||
Net interest income(Tax-equivalent) | $ | 4,497 | 4,612 | 3,578 | 3,675 | 3,539 | (2 | )% | 27 | $ | 4,441 | 1 | % | ||||||||||||
Fee and other income | 3,741 | 3,980 | 3,465 | 3,583 | 3,517 | (6 | ) | 6 | 3,545 | 6 | |||||||||||||||
Total revenue(Tax-equivalent) | 8,238 | 8,592 | 7,043 | 7,258 | 7,056 | (4 | ) | 17 | 7,986 | 3 | |||||||||||||||
Provision for credit losses | 177 | 206 | 108 | 59 | 61 | (14 | ) | 190 | 65 | 172 | |||||||||||||||
Other noninterest expense | 4,460 | 4,741 | 3,915 | 4,139 | 4,079 | (6 | ) | 9 | 4,350 | 3 | |||||||||||||||
Merger-related and restructuring expenses | 10 | 49 | 38 | 24 | 68 | (80 | ) | (85 | ) | 68 | (85 | ) | |||||||||||||
Other intangible amortization | 118 | 141 | 92 | 98 | 92 | (16 | ) | 28 | 131 | (10 | ) | ||||||||||||||
Total noninterest expense | 4,588 | 4,931 | 4,045 | 4,261 | 4,239 | (7 | ) | 8 | 4,549 | 1 | |||||||||||||||
Minority interest in income of consolidated subsidiaries | 136 | 125 | 104 | 90 | 95 | 9 | 43 | 95 | 43 | ||||||||||||||||
Income from continuing operations before income taxes(Tax-equivalent) | 3,337 | 3,330 | 2,786 | 2,848 | 2,661 | — | 25 | 3,277 | 2 | ||||||||||||||||
Income taxes(Tax-equivalent) | 1,035 | 1,075 | 909 | 963 | 933 | (4 | ) | 11 | 1,175 | (12 | ) | ||||||||||||||
Income from continuing operations | 2,302 | 2,255 | 1,877 | 1,885 | 1,728 | 2 | 33 | 2,102 | 10 | ||||||||||||||||
Discontinued operations, net of income taxes | — | 46 | — | — | — | — | — | — | — | ||||||||||||||||
Net income | $ | 2,302 | 2,301 | 1,877 | 1,885 | 1,728 | — | % | 33 | $ | 2,102 | 10 | % | ||||||||||||
Diluted earnings per common share from continuing operations | $ | 1.20 | 1.18 | 1.17 | 1.17 | 1.09 | 2 | % | 10 | ||||||||||||||||
Diluted earnings per common share based on net income | $ | 1.20 | 1.20 | 1.17 | 1.17 | 1.09 | — | 10 | |||||||||||||||||
Dividend payout ratio on common shares | 46.67 | % | 46.67 | 47.86 | 43.59 | 46.79 | — | — | |||||||||||||||||
Return on average common stockholders’ equity | 13.47 | 13.09 | 14.85 | 15.41 | 14.62 | — | — | ||||||||||||||||||
Return on average assets | 1.34 | 1.31 | 1.34 | 1.39 | 1.34 | — | — | ||||||||||||||||||
Overhead efficiency ratio(Tax-equivalent) | 55.70 | % | 57.38 | 57.44 | 58.71 | 60.07 | — | — | 56.96 | % | — | ||||||||||||||
Operating leverage(Tax-equivalent) | $ | (13 | ) | 665 | 1 | 180 | 436 | — | % | — | |||||||||||||||
KEY POINTS
| • | Net interest income decreased 2% as benefits from loan and securitization warehouse growth and improved retail deposit pricing were more than offset by lower income from maturing off-balance sheet positions, 4Q06 Adjustments and trading-related net interest income, as well as the effect of FSP 13-2/FIN 48 adoption |
| — | The positive effect of retail deposit pricing strategies was somewhat negatively impacted by the effect of seasonally lower corporate deposit balances and continued migration to off-balance sheet alternatives |
| — | Net interest income up 1% from Combined 1Q06 reflecting growth in earning assets, including Westcorp, largely offset by a shift in deposit mix to lower spread categories and the impact of the interest rate environment |
(See Appendix, pages 19-23 for further detail)
Page-4
Table of Contents
Wachovia 1Q07 Quarterly Earnings Report
Performance Highlights
| 2007 | 2006 | 1Q07 vs | 1Q07 vs | |||||||||||||||
(Dollars in millions, except per share data) | First Quarter | Fourth Quarter | Third Quarter | Second Quarter | First Quarter | |||||||||||||
Earnings excluding merger-related and restructuring expenses, and discontinued operations (a)(b) | ||||||||||||||||||
Net income | $ | 2,308 | 2,284 | 1,902 | 1,900 | 1,774 | 1 | % | 30 | |||||||||
Return on average assets | 1.35 | % | 1.30 | 1.36 | 1.40 | 1.38 | — | — | ||||||||||
Return on average common stockholders’ equity | 13.50 | 12.98 | 15.02 | 15.52 | 15.01 | — | — | |||||||||||
Overhead efficiency ratio(Tax-equivalent) | 55.57 | 56.81 | 56.90 | 58.39 | 59.10 | — | — | |||||||||||
Overhead efficiency ratio excluding brokerage(Tax-equivalent) | 52.37 | % | 53.55 | 53.29 | 54.85 | 55.20 | — | — | ||||||||||
Operating leverage(Tax-equivalent) | $ | (51 | ) | 675 | 16 | 135 | 446 | — | % | — | ||||||||
Earnings excluding merger-related and restructuring expenses, other intangible amortization and discontinued operations (a)(b) | ||||||||||||||||||
Net income | $ | 2,384 | 2,374 | 1,961 | 1,964 | 1,833 | — | % | 30 | |||||||||
Dividend payout ratio on common shares | 45.16 | % | 45.16 | 45.53 | 41.80 | 43.97 | — | — | ||||||||||
Return on average tangible assets | 1.48 | 1.43 | 1.47 | 1.52 | 1.49 | — | — | |||||||||||
Return on average tangible common stockholders’ equity | 33.27 | 31.58 | 30.79 | 32.63 | 30.64 | — | — | |||||||||||
Overhead efficiency ratio(Tax-equivalent) | 54.15 | 55.17 | 55.60 | 57.03 | 57.81 | — | — | |||||||||||
Overhead efficiency ratio excluding brokerage(Tax-equivalent) | 50.65 | % | 51.61 | 51.73 | 53.21 | 53.63 | — | — | ||||||||||
Operating leverage(Tax-equivalent) | $ | (75 | ) | 725 | 8 | 142 | 444 | — | % | — | ||||||||
Other financial data | ||||||||||||||||||
Net interest margin | 3.01 | % | 3.09 | 3.03 | 3.18 | 3.21 | — | — | ||||||||||
Fee and other income as % of total revenue | 45.41 | 46.32 | 49.20 | 49.37 | 49.84 | — | — | |||||||||||
Effective tax rate (c) | 30.22 | 31.74 | 31.71 | 33.05 | 33.84 | — | — | |||||||||||
Effective tax rate(Tax-equivalent) (c) (d) | 30.99 | % | 32.46 | 32.61 | 33.84 | 35.06 | — | — | ||||||||||
Asset quality | ||||||||||||||||||
Allowance for loan losses as % of loans, net | 0.80 | % | 0.80 | 1.03 | 1.07 | 1.08 | — | — | ||||||||||
Allowance for loan losses as % of nonperforming assets | 194 | 246 | 396 | 421 | 389 | — | — | |||||||||||
Allowance for credit losses as % of loans, net | 0.84 | 0.84 | 1.09 | 1.13 | 1.14 | — | — | |||||||||||
Net charge-offs as % of average loans, net | 0.15 | 0.14 | 0.16 | 0.08 | 0.09 | — | — | |||||||||||
Nonperforming assets as % of loans, net, foreclosed properties and loans held for sale | 0.40 | % | 0.32 | 0.26 | 0.25 | 0.28 | — | — | ||||||||||
Capital adequacy | ||||||||||||||||||
Tier 1 capital ratio (e) | 7.4 | % | 7.4 | 7.7 | 7.8 | 7.9 | — | — | ||||||||||
Tangible capital ratio(including FAS 115/133/158) | 4.4 | 4.5 | 4.9 | 4.5 | 4.8 | — | — | |||||||||||
Tangible capital ratio(excluding FAS 115/133/158) | 4.7 | 4.8 | 5.1 | 5.0 | 5.1 | — | — | |||||||||||
Leverage ratio (e) | 6.1 | % | 6.0 | 6.6 | 6.6 | 6.9 | — | — | ||||||||||
Other | ||||||||||||||||||
Average diluted common shares(In millions) | 1,925 | 1,922 | 1,600 | 1,613 | 1,586 | — | % | 21 | ||||||||||
Actual common shares(In millions) | 1,913 | 1,904 | 1,581 | 1,589 | 1,608 | — | 19 | |||||||||||
Dividends paid per common share | $ | 0.56 | 0.56 | 0.56 | 0.51 | 0.51 | — | 10 | ||||||||||
Book value per common share | 36.47 | 36.61 | 32.37 | 30.75 | 30.95 | — | 18 | |||||||||||
Common stock price | 55.05 | 56.95 | 55.80 | 54.08 | 56.05 | (3 | ) | (2 | ) | |||||||||
Market capitalization | $ | 105,330 | 108,443 | 88,231 | 85,960 | 90,156 | (3 | ) | 17 | |||||||||
Common stock price to book value | 151 | % | 156 | 172 | 176 | 181 | (3 | ) | (17 | ) | ||||||||
FTE employees (f) | 110,369 | 109,460 | 97,060 | 97,316 | 97,134 | 1 | 14 | |||||||||||
Total financial centers/brokerage offices | 4,167 | 4,126 | 3,870 | 3,847 | 3,889 | 1 | 7 | |||||||||||
ATMs | 5,146 | 5,212 | 5,163 | 5,134 | 5,179 | (1 | )% | (1 | ) | |||||||||
| (a) | See tables on page 3, and on pages 42 through 46 for reconciliation to earnings prepared in accordance with GAAP. |
| (b) | See page 3 for the most directly comparable GAAP financial measure and pages 42 through 46 for reconciliation to earnings prepared in accordance with GAAP. |
| (c) | 4Q06 includes taxes on discontinued operations. |
| (d) | The tax-equivalent tax rate applies to fully tax-equivalized revenues. |
| (e) | The first quarter of 2007 is based on estimates. |
| (f) | Amount presented in the fourth quarter of 2006 has been restated to conform with the presentation in 2007. |
KEY POINTS
| • | Cash overhead efficiency ratio declined 102 bps to 54.15% reflecting expense discipline |
| • | Net interest margin declined to 3.01% as benefits of the improved retail deposit pricing were more than offset by growth in lower-spread assets, lower contributions from maturing off-balance sheet positions, lower trading-related net interest income and the continued effect of the yield curve |
| • | Effective tax rate of 30.99% reflects updated information on certain tax matters |
| • | Tangible capital ratio of 4.7% largely reflects the adoption of FSP 13-2/FIN 48 |
| • | Average diluted shares up 3 million reflecting the net effect of employee stock option and restricted share activity somewhat offset by the repurchase of 5 million shares during the quarter at an average cost of $56.72 per share and the ongoing effect of 4Q06 repurchases |
(See Appendix, pages 16-23 for further detail)
Page-5
Table of Contents
Wachovia 1Q07 Quarterly Earnings Report
Average Balance Sheet Data
| 2007 | 2006 | 1Q07 vs | 1Q07 vs | Combined | |||||||||||||||||||
(In millions) | First Quarter | Fourth Quarter | Third Quarter | Second Quarter | First Quarter | 1Q06 | 1Q07 vs 1Q06 | ||||||||||||||||
Assets | |||||||||||||||||||||||
Trading assets | $ | 29,681 | 31,069 | 31,160 | 29,252 | 27,240 | (4 | )% | 9 | $ | 27,240 | 9 | % | ||||||||||
Securities | 108,071 | 108,543 | 122,152 | 124,102 | 117,944 | — | (8 | ) | 119,421 | (10 | ) | ||||||||||||
Commercial loans, net | |||||||||||||||||||||||
General Bank | 95,653 | 92,990 | 90,837 | 88,729 | 85,614 | 3 | 12 | 85,746 | 12 | ||||||||||||||
Corporate and Investment Bank | 40,938 | 41,064 | 39,797 | 37,730 | 36,867 | — | 11 | 36,867 | 11 | ||||||||||||||
Other | 20,697 | 20,252 | 19,932 | 19,882 | 19,988 | 2 | 4 | 20,182 | 3 | ||||||||||||||
Total commercial loans, net | 157,288 | 154,306 | 150,566 | 146,341 | 142,469 | 2 | 10 | 142,795 | 10 | ||||||||||||||
Consumer loans, net | 257,973 | 258,255 | 130,544 | 128,924 | 118,105 | — | 118 | 236,856 | 9 | ||||||||||||||
Total loans, net | 415,261 | 412,561 | 281,110 | 275,265 | 260,574 | 1 | 59 | 379,651 | 9 | ||||||||||||||
Loans held for sale | 16,748 | 11,928 | 12,130 | 9,320 | 8,274 | 40 | 102 | 8,378 | 100 | ||||||||||||||
Other earning assets (a) | 24,552 | 32,792 | 25,587 | 25,293 | 28,495 | (25 | ) | (14 | ) | 32,090 | (23 | ) | |||||||||||
Total earning assets | 594,313 | 596,893 | 472,139 | 463,232 | 442,527 | — | 34 | 566,780 | 5 | ||||||||||||||
Cash | 12,260 | 12,418 | 11,973 | 12,055 | 12,762 | (1 | ) | (4 | ) | 13,217 | (7 | ) | |||||||||||
Other assets | 88,875 | 89,376 | 71,052 | 68,325 | 66,920 | (1 | ) | 33 | 82,850 | 7 | |||||||||||||
Total assets | $ | 695,448 | 698,687 | 555,164 | 543,612 | 522,209 | — | % | 33 | $ | 662,847 | 5 | % | ||||||||||
Liabilities and Stockholders’ Equity | |||||||||||||||||||||||
Core interest-bearing deposits | $ | 308,294 | 299,402 | 227,674 | 226,140 | 225,724 | 3 | % | 37 | $ | 286,746 | 8 | % | ||||||||||
Foreign and other time deposits | 33,605 | 32,953 | 35,133 | 36,300 | 32,616 | 2 | 3 | 32,634 | 3 | ||||||||||||||
Total interest-bearing deposits | 341,899 | 332,355 | 262,807 | 262,440 | 258,340 | 3 | 32 | 319,380 | 7 | ||||||||||||||
Short-term borrowings | 55,669 | 65,239 | 71,030 | 69,069 | 70,014 | (15 | ) | (20 | ) | 76,296 | (27 | ) | |||||||||||
Long-term debt | 141,979 | 139,364 | 80,726 | 71,725 | 56,052 | 2 | 153 | 111,114 | 28 | ||||||||||||||
Total interest-bearing liabilities | 539,547 | 536,958 | 414,563 | 403,234 | 384,406 | — | 40 | 506,790 | 6 | ||||||||||||||
Noninterest-bearing deposits | 60,976 | 63,025 | 63,553 | 65,498 | 64,490 | (3 | ) | (5 | ) | 64,636 | (6 | ) | |||||||||||
Other liabilities | 25,605 | 28,979 | 26,905 | 25,817 | 25,387 | (12 | ) | 1 | 25,861 | (1 | ) | ||||||||||||
Total liabilities | 626,128 | 628,962 | 505,021 | 494,549 | 474,283 | — | 32 | 597,287 | 5 | ||||||||||||||
Stockholders’ equity | 69,320 | 69,725 | 50,143 | 49,063 | 47,926 | (1 | ) | 45 | 65,560 | 6 | |||||||||||||
Total liabilities and stockholders’ equity | $ | 695,448 | 698,687 | 555,164 | 543,612 | 522,209 | — | % | 33 | $ | 662,847 | 5 | % | ||||||||||
(a) Includes interest-bearing bank balances, federal funds sold and securities purchased under resale agreements. |
| ||||||||||||||||||||||
Memoranda | |||||||||||||||||||||||
Low-cost core deposits | $ | 253,008 | 250,569 | 238,875 | 243,249 | 243,905 | 1 | % | 4 | $ | 259,175 | (2 | )% | ||||||||||
Other core deposits | 116,262 | 111,858 | 52,352 | 48,389 | 46,309 | 4 | 151 | 92,207 | 26 | ||||||||||||||
Total core deposits | $ | 369,270 | 362,427 | 291,227 | 291,638 | 290,214 | 2 | % | 27 | $ | 351,382 | 5 | % | ||||||||||
KEY POINTS
| • | Securities relatively stable, down 10% from Combined 1Q06 largely reflecting $13.2 billion of sales relating to the Golden West merger |
| • | Commercial loans increased $3.0 billion, or 2%, as strength in middle-market and business banking, commercial real estate portfolios and foreign loans was somewhat offset by a $1.9 billion decline in leasing including $1.4 billion relating to the adoption of FSP 13-2/FIN 48; up 10% from 1Q06 |
| • | Consumer loans remained relatively stable as growth in real estate-secured and auto was more than offset by the $1.4 billion average effect of securitization and sales; increased $139.9 billion from 1Q06 driven by the addition of Golden West;Consumer loans up 9% from Combined 1Q06 largely reflecting growth in real estate-secured and auto, including the impact of Westcorp, and strength in credit card |
| • | Loans held for sale increased $4.8 billion largely reflecting growth in the commercial mortgage securitization warehouse |
| • | Other earning assets down $8.2 billion driven by lower fed funds sold and repos reflecting temporary excess 4Q06 liquidity related to balance sheet repositioning, including deleveraging, in connection with the Golden West merger |
| • | Long-term debt (original maturity > 12 months) increased $2.6 billion driven by the effect of 1Q07 issuances of $12.4 billion and the continuing effect of 4Q06 issuances of $10.4 billion |
| • | Core deposits increased $6.8 billion, or 2%, reflecting strength in retail CDs, interest-bearing and foreign; up 27% from 1Q06 driven by merger activity |
| — | Up $17.9 billion, or 5%, from Combined 1Q06 driven by strength in retail CDs, NOW and foreign |
(See Appendix, pages 19 - 21 for further detail)
Page-6
Table of Contents
Wachovia 1Q07 Quarterly Earnings Report
Fee and Other Income
| 2007 | 2006 | 1Q07 vs | 1Q07 vs | Combined | |||||||||||||||||||||
(In millions) | First Quarter | Fourth Quarter | Third Quarter | Second Quarter | First Quarter | 1Q06 | 1Q07 vs 1Q06 | ||||||||||||||||||
Service charges | $ | 614 | 646 | 638 | 622 | 574 | (5 | )% | 7 | $ | 576 | 7 | % | ||||||||||||
Other banking fees | 416 | 452 | 427 | 449 | 428 | (8 | ) | (3 | ) | 443 | (6 | ) | |||||||||||||
Commissions | 659 | 633 | 562 | 588 | 623 | 4 | 6 | 630 | 5 | ||||||||||||||||
Fiduciary and asset management fees | 920 | 856 | 823 | 808 | 761 | 7 | 21 | 761 | 21 | ||||||||||||||||
Advisory, underwriting and other investment banking fees | 407 | 433 | 292 | 318 | 302 | (6 | ) | 35 | 302 | 35 | |||||||||||||||
Trading account profits | 168 | 29 | 123 | 164 | 219 | — | (23 | ) | 219 | (23 | ) | ||||||||||||||
Principal investing | 48 | 142 | 91 | 189 | 103 | (66 | ) | (53 | ) | 103 | (53 | ) | |||||||||||||
Securities gains (losses) | 53 | 47 | 94 | 25 | (48 | ) | 13 | — | (48 | ) | — | ||||||||||||||
Other income | 456 | 742 | 415 | 420 | 555 | (39 | ) | (18 | ) | 559 | (18 | ) | |||||||||||||
Total fee and other income | $ | 3,741 | 3,980 | 3,465 | 3,583 | 3,517 | (6 | )% | 6 | $ | 3,545 | 6 | % | ||||||||||||
KEY POINTS
| • | Fee and other income decreased 6%; grew 6% vs. 1Q06 which included $133 million relating to MBNA fee and Archipelago/NYSE gain |
| — | Fee income up 11% from 1Q06 exclusive of the above mentioned one-time fee and gain |
Fee and Other Income
(In millions) | A Reported 1Q07 | B Reported 4Q06 | C 4Q06 | B+C Adjusted Reported 4Q06 | 1Q07 vs Adj 4Q06 | ||||||||
Service charges | $ | 614 | 646 | (22 | ) | 624 | (2 | )% | |||||
Securities gains | 53 | 47 | — | 47 | 13 | ||||||||
Other income | 3,074 | 3,287 | (93 | ) | 3,194 | (4 | ) | ||||||
Total fee and other income | $ | 3,741 | 3,980 | (115 | ) | 3,865 | (3 | )% | |||||
| — | Down 3% vs. strong Adjusted 4Q06 levels which included robust commercial mortgage securitization income and principal investing gains, as well as fiduciary and asset management fees and record advisory and underwriting fees |
| • | Service charges down 5%; rose 7% from 1Q06 |
| — | Service charges decreased 2% vs. Adjusted 4Q06 as strength in commercial was more than offset by seasonally lower consumer volumes |
| • | Other banking fees declined 8% driven by the effect of the HomEq divestiture and declines in consumer and commercial mortgage banking fees as well as seasonally lower interchange fees; down 3% from 1Q06 as strength in interchange was more than offset by lower mortgage banking fees |
| • | Commissions increased 4% and 6% from 1Q06 on strength in retail brokerage transaction activity driven by higher equity syndicate volumes |
| • | Fiduciary and asset management fees grew 7% driven by the addition of European Credit Management (“ECM”) and continued growth in retail brokerage managed account fees; up 21% from 1Q06 |
| — | Results vs. 1Q06 largely reflect strength in retail brokerage managed account fees and the effect of acquisitions |
| • | Advisory, underwriting and other investment banking fees decreased $26 million, or 6%, from robust 4Q06 levels; up 35% from 1Q06 on strength in equities reflecting enhanced CIB/CMG partnership, and growth in high yield and loan syndications |
| • | Trading account profits increased $139 million driven by strength in global rate and credit products |
| • | Principal investing net gains of $48 million decreased $94 million from strong 4Q06 levels |
| • | Other income decreased $286 million driven by $133 million decline in commercial mortgage securitization activity, $93 million relating to 4Q06 Adjustments and $49 million decrease in consumer loan securitization activity |
(See Appendix, pages 22-23 for further detail)
Page-7
Table of Contents
Wachovia 1Q07 Quarterly Earnings Report
Noninterest Expense
Noninterest Expense
| 2007 | 2006 | 1Q07 vs | 1Q07 vs | Combined | |||||||||||||||||||
(In millions) | First Quarter | Fourth Quarter | Third Quarter | Second Quarter | First Quarter | 1Q06 | 1Q07 vs 1Q06 | ||||||||||||||||
Salaries and employee benefits | $ | 2,972 | 3,023 | 2,531 | 2,652 | 2,697 | (2 | )% | 10 | $ | 2,889 | 3 | % | ||||||||||
Occupancy | 312 | 323 | 284 | 291 | 275 | (3 | ) | 13 | 294 | 6 | |||||||||||||
Equipment | 307 | 314 | 291 | 299 | 280 | (2 | ) | 10 | 300 | 2 | |||||||||||||
Advertising | 61 | 47 | 54 | 56 | 47 | 30 | 30 | 52 | 17 | ||||||||||||||
Communications and supplies | 173 | 166 | 158 | 162 | 167 | 4 | 4 | 180 | (4 | ) | |||||||||||||
Professional and consulting fees | 177 | 239 | 200 | 184 | 167 | (26 | ) | 6 | 174 | 2 | |||||||||||||
Sundry expense | 458 | 629 | 397 | 495 | 446 | (27 | ) | 3 | 461 | (1 | ) | ||||||||||||
Other noninterest expense | 4,460 | 4,741 | 3,915 | 4,139 | 4,079 | (6 | ) | 9 | 4,350 | 3 | |||||||||||||
Merger-related and restructuring expenses | 10 | 49 | 38 | 24 | 68 | (80 | ) | (85 | ) | 68 | (85 | ) | |||||||||||
Other intangible amortization | 118 | 141 | 92 | 98 | 92 | (16 | ) | 28 | 131 | (10 | ) | ||||||||||||
Total noninterest expense | $ | 4,588 | 4,931 | 4,045 | 4,261 | 4,239 | (7 | )% | 8 | $ | 4,549 | 1 | % | ||||||||||
KEY POINTS
| • | Other noninterest expense decreased 6%; rose 9% vs. 1Q06 driven by merger activity |
| — | Other noninterest expense down $83 million, or 2%, from Adjusted 4Q06 reflecting expense discipline despite $93 million higher employee stock compensation expense |
Noninterest Expense
(In millions) | A Reported 1Q07 | B Reported 4Q06 | C 4Q06 | B+C Adjusted Reported 4Q06 | 1Q07 vs Adj 4Q06 | ||||||||
Salaries and employee benefits | $ | 2,972 | 3,023 | (99 | ) | 2,924 | 2 | % | |||||
Sundry expense | 458 | 629 | (99 | ) | 530 | (14 | ) | ||||||
Other expense | 1,030 | 1,089 | — | 1,089 | (5 | ) | |||||||
Other noninterest expense | $ | 4,460 | 4,741 | (198 | ) | 4,543 | (2 | )% | |||||
| — | 1Q07 results include $16 million relating to efficiency initiative spending, $31 million associated with de novo expansion and branch consolidations and $26 million relating to credit card |
| • | Salaries and employee benefits decreased 2% and up 10% from 1Q06;up $48 million from Adjusted 4Q06 as $93 million increase in employee stock compensation expense more than offset lower revenue-based incentives |
| • | Professional and consulting fees decreased 26% reflecting discipline and reductions from seasonally high 4Q06 levels |
| • | Sundry expense decreased 27%, down 14% from Adjusted 4Q06 |
| — | 1Q07 sundry expense reflects lower legal costs and expense discipline in travel and entertainment expense and other areas |
(See Appendix, page 23 for further detail)
Page-8
Table of Contents
Wachovia 1Q07 Quarterly Earnings Report
This segment includes Retail and Small Business, and Commercial.
General Bank
Performance Summary
| 2007 | 2006 | 1Q07 vs | 1Q07 vs | Combined | |||||||||||||||||||||
(Dollars in millions) | First Quarter | Fourth Quarter | Third Quarter | Second Quarter | First Quarter | 1Q06 | 1Q07 vs 1Q06 | ||||||||||||||||||
Income statement data | |||||||||||||||||||||||||
Net interest income(Tax-equivalent) | $ | 3,705 | 3,764 | 2,819 | 2,779 | 2,531 | (2 | )% | 46 | $ | 3,483 | 6 | % | ||||||||||||
Fee and other income | 862 | 946 | 891 | 847 | 868 | (9 | ) | (1 | ) | 884 | (2 | ) | |||||||||||||
Intersegment revenue | 48 | 58 | 48 | 48 | 43 | (17 | ) | 12 | 43 | 12 | |||||||||||||||
Total revenue(Tax-equivalent) | 4,615 | 4,768 | 3,758 | 3,674 | 3,442 | (3 | ) | 34 | 4,410 | 5 | |||||||||||||||
Provision for credit losses | 162 | 147 | 122 | 95 | 62 | 10 | — | 62 | 161 | ||||||||||||||||
Noninterest expense | 2,030 | 1,996 | 1,676 | 1,737 | 1,656 | 2 | 23 | 1,901 | 7 | ||||||||||||||||
Income taxes(Tax-equivalent) | 884 | 958 | 715 | 673 | 629 | (8 | ) | 41 | 894 | (1 | ) | ||||||||||||||
Segment earnings | $ | 1,539 | 1,667 | 1,245 | 1,169 | 1,095 | (8 | )% | 41 | $ | 1,553 | (1 | )% | ||||||||||||
Performance and other data | |||||||||||||||||||||||||
Economic profit | $ | 1,159 | 1,283 | 982 | 896 | 854 | (10 | )% | 36 | ||||||||||||||||
Risk adjusted return on capital (RAROC) | 48.22 | % | 51.94 | 57.44 | 54.76 | 58.38 | — | — | |||||||||||||||||
Economic capital, average | $ | 12,622 | 12,439 | 8,384 | 8,218 | 7,308 | 1 | 73 | |||||||||||||||||
Cash overhead efficiency ratio(Tax-equivalent) | 43.98 | % | 41.86 | 44.59 | 47.29 | 48.10 | — | — | 43.13 | % | — | % | |||||||||||||
Lending commitments | $ | 145,326 | 139,940 | 128,380 | 121,181 | 115,788 | 4 | 26 | |||||||||||||||||
Average loans, net | 326,808 | 324,168 | 196,396 | 191,769 | 177,458 | 1 | 84 | $ | 297,145 | 10 | % | ||||||||||||||
Average core deposits | $ | 292,389 | 288,578 | 216,591 | 214,666 | 211,169 | 1 | 38 | $ | 272,263 | 7 | % | |||||||||||||
FTE employees | 57,224 | 56,556 | 45,250 | 44,973 | 44,927 | 1 | % | 27 | |||||||||||||||||
General Bank Key Metrics
| 2007 | 2006 | 1Q07 vs | 1Q07 vs | |||||||||||||
| First Quarter | Fourth Quarter | Third Quarter | Second Quarter | First Quarter | ||||||||||||
Customer overall satisfaction score (a) | 6.63 | 6.64 | 6.62 | 6.61 | 6.62 | — | % | — | ||||||||
New/Lost ratio | 1.26 | 1.29 | 1.30 | 1.31 | 1.27 | (2 | ) | (1 | ) | |||||||
Online active customers(In thousands)(b) | 4,103 | 3,997 | 3,833 | 3,634 | 3,421 | 3 | 20 | |||||||||
Financial centers | 3,399 | 3,375 | 3,133 | 3,109 | 3,159 | 1 | % | 8 | ||||||||
| (a) | Gallup survey measured on a 1-7 scale; 6.4 = “best in class”. |
| (b) | Retail and small business. |
SEGMENTEARNINGSOF $1.5BILLIONDOWN 8%ANDUP 41%FROM 1Q06
| • | Revenue of $4.6 billion down 3%, and up 34% from 1Q06 driven by acquisitions and strong loan and deposit growth |
| — | Net interest income down $59 million, or 2%, largely reflecting $15 million relating to day count, $15 million relating to lower mortgage loans and $29 million due to narrowing spreads on loans and deposits; up 6% from Combined 1Q06 |
| — | Fees down $84 million as lower branch and loan sale gains, seasonally lower consumer service charges and interchange fees more than offset improvement in commercial service charges |
| • | Excluding the 1Q06 $100 million MBNA fee, fees up $94 million, or 12%, driven by strength in consumer and commercial service charges and interchange fees |
| • | Expenses up $34 million, or 2%, as benefits of strong expense control were more than offset by $46 million of higher employee stock compensation expense; up 23% from 1Q06 driven largely by merger activity |
| — | Reflects $31 million due to de novo expansion and branch consolidation costs and $26 million relating to credit card |
| • | Average loans up 1% and up 84% from 1Q06 reflecting merger activity; loans up 10% from Combined 1Q06 |
| — | Commercial loans up 3% on growth in business banking, middle-market and commercial real estate |
| — | Consumer loans flat as strength in credit card and auto offset by decreases in real estate-secured |
| • | Average core deposits up 1% and up 38% from 1Q06 reflecting merger activity |
| — | Core deposits up 7% from Combined 1Q06 driven by growth in retail CDs and commercial deposits |
| — | Retail net new checking account sales up 44% to 270,000 including 38,000 in World Savings network |
| • | Opened 29 de novo branches during the quarter; 21 California branches now branded Wachovia |
(See Appendix, pages 25 - 29 for further discussion of business unit results
Page-9
Table of Contents
Wachovia 1Q07 Quarterly Earnings Report
Wealth Management
Performance Summary
| 2007 | 2006 | 1Q07 vs | 1Q07 vs | |||||||||||||||
(Dollars in millions) | First Quarter | Fourth Quarter | Third Quarter | Second Quarter | First Quarter | |||||||||||||
Income statement data | ||||||||||||||||||
Net interest income(Tax-equivalent) | $ | 146 | 149 | 148 | 149 | 150 | (2 | )% | (3 | ) | ||||||||
Fee and other income | 195 | 200 | 197 | 194 | 188 | (3 | ) | 4 | ||||||||||
Intersegment revenue | 1 | 3 | 1 | 1 | 1 | (67 | ) | — | ||||||||||
Total revenue(Tax-equivalent) | 342 | 352 | 346 | 344 | 339 | (3 | ) | 1 | ||||||||||
Provision for credit losses | — | — | — | 2 | — | — | — | |||||||||||
Noninterest expense | 241 | 236 | 235 | 249 | 248 | 2 | (3 | ) | ||||||||||
Income taxes(Tax-equivalent) | 36 | 43 | 41 | 33 | 34 | (16 | ) | 6 | ||||||||||
Segment earnings | $ | 65 | 73 | 70 | 60 | 57 | (11 | )% | 14 | |||||||||
Performance and other data | ||||||||||||||||||
Economic profit | $ | 46 | 53 | 52 | 41 | 39 | (13 | )% | 18 | |||||||||
Risk adjusted return on capital (RAROC) | 43.63 | % | 47.58 | 46.77 | 40.61 | 39.34 | — | — | ||||||||||
Economic capital, average | $ | 566 | 574 | 568 | 563 | 556 | (1 | ) | 2 | |||||||||
Cash overhead efficiency ratio(Tax-equivalent) | 70.22 | % | 67.38 | 67.85 | 72.30 | 73.25 | — | — | ||||||||||
Lending commitments | $ | 6,686 | 6,504 | 6,481 | 6,285 | 6,229 | 3 | 7 | ||||||||||
Average loans, net | 17,180 | 16,794 | 16,469 | 16,016 | 15,603 | 2 | 10 | |||||||||||
Average core deposits | $ | 14,037 | 14,208 | 13,775 | 14,265 | 14,609 | (1 | ) | (4 | ) | ||||||||
FTE employees | 4,393 | 4,474 | 4,530 | 4,727 | 4,758 | (2 | )% | (8 | ) | |||||||||
| Wealth Management Key Metrics | ||||||||||||||||||
| 2007 | 2006 | 1Q07 vs | 1Q07 vs | |||||||||||||||
(Dollars in millions) | First Quarter | Fourth Quarter | Third Quarter | Second Quarter | First Quarter | |||||||||||||
Investment assets under administration | $ | 135,562 | 143,879 | 138,915 | 135,817 | 134,293 | (6 | )% | 1 | |||||||||
Assets under management (a) | $ | 76,214 | 75,297 | 72,397 | 71,184 | 71,120 | 1 | 7 | ||||||||||
Wealth Management advisors | 940 | 951 | 970 | 996 | 973 | (1 | )% | (3 | ) | |||||||||
| (a) | These assets are managed by and reported in Capital Management. |
SEGMENTEARNINGSOF $65MILLION,DOWN 11%ANDUP 14%FROM 1Q06
| • | Revenue of $342 million decreased 3%; up 1% from 1Q06 |
| — | Net interest income was down 2% reflecting lower core deposits and narrowing spreads which offset loan growth |
| — | Fee and other income decreased 3% from strong 4Q06 levels driven by lower insurance commissions, which more than offset growth in fiduciary and asset management fees |
| • | Expenses up 2% as lower salaries and benefits were more than offset by $8 million in higher employee stock compensation expense; down 3% from 1Q06 driven by lower salaries, benefits and incentives |
| • | Assets under management increased 1%, and 7% from 1Q06, on market gains |
| — | 78% acceptance rate on introduction of new investment platform |
(See Appendix, page 30 for further discussion of business unit results)
Page-10
Table of Contents
Wachovia 1Q07 Quarterly Earnings Report
This segment includes Corporate Lending, Investment Banking, and Treasury and International Trade Finance.
Corporate and Investment Bank
Performance Summary
| 2007 | 2006 | 1Q07 vs | 1Q07 vs | |||||||||||||||||||
(Dollars in millions) | First Quarter | Fourth Quarter | Third Quarter | Second Quarter | First Quarter | |||||||||||||||||
Income statement data | ||||||||||||||||||||||
Net interest income(Tax-equivalent) | $ | 453 | 512 | 450 | 468 | 463 | (12 | )% | (2 | ) | ||||||||||||
Fee and other income | 1,088 | 1,355 | 992 | 1,217 | 1,242 | (20 | ) | (12 | ) | |||||||||||||
Intersegment revenue | (42 | ) | (56 | ) | (43 | ) | (42 | ) | (37 | ) | (25 | ) | 14 | |||||||||
Total revenue(Tax-equivalent) | 1,499 | 1,811 | 1,399 | 1,643 | 1,668 | (17 | ) | (10 | ) | |||||||||||||
Provision for credit losses | — | 5 | (5 | ) | (33 | ) | 1 | — | — | |||||||||||||
Noninterest expense | 903 | 999 | 797 | 886 | 893 | (10 | ) | 1 | ||||||||||||||
Income taxes(Tax-equivalent) | 217 | 294 | 222 | 288 | 283 | (26 | ) | (23 | ) | |||||||||||||
Segment earnings | $ | 379 | 513 | 385 | 502 | 491 | (26 | )% | (23 | ) | ||||||||||||
Performance and other data | ||||||||||||||||||||||
Economic profit | $ | 159 | 290 | 167 | 275 | 301 | (45 | )% | (47 | ) | ||||||||||||
Risk adjusted return on capital (RAROC) | 20.10 | % | 27.14 | 20.88 | 27.98 | 31.15 | — | — | ||||||||||||||
Economic capital, average | $ | 7,088 | 7,117 | 6,707 | 6,499 | 6,066 | — | 17 | ||||||||||||||
Cash overhead efficiency ratio(Tax-equivalent) | 60.20 | % | 55.16 | 57.02 | 53.90 | 53.55 | — | — | ||||||||||||||
Lending commitments | $ | 106,578 | 107,155 | 102,698 | 106,105 | 103,812 | (1 | ) | 3 | |||||||||||||
Average loans, net | 40,946 | 41,069 | 39,801 | 37,733 | 36,871 | — | 11 | |||||||||||||||
Average core deposits | $ | 28,948 | 26,993 | 26,223 | 26,346 | 25,568 | 7 | 13 | ||||||||||||||
FTE employees | 5,959 | 6,040 | 6,049 | 6,227 | 5,994 | (1 | )% | (1 | ) | |||||||||||||
Corporate and Investment Bank
Sub-segment Revenue | ||||||||||||||||||||||
| 2007 | 2006 | 1Q07 vs | 1Q07 vs | |||||||||||||||||||
(In millions) | First Quarter | Fourth Quarter | Third Quarter | Second Quarter | First Quarter | |||||||||||||||||
Investment Banking | $ | 968 | 1,269 | 868 | 1,093 | 1,102 | (24 | )% | (12 | ) | ||||||||||||
Corporate Lending | 282 | 281 | 269 | 285 | 315 | — | (10 | ) | ||||||||||||||
Treasury and International Trade Finance | 249 | 261 | 262 | 265 | 251 | (5 | ) | (1 | ) | |||||||||||||
Total revenue(Tax-equivalent) | $ | 1,499 | 1,811 | 1,399 | 1,643 | 1,668 | (17 | )% | (10 | ) | ||||||||||||
Memoranda | ||||||||||||||||||||||
Total net trading revenue(Tax-equivalent) | $ | 218 | 182 | 225 | 281 | 361 | 20 | % | (40 | ) | ||||||||||||
SEGMENTEARNINGSOF $379MILLION,DOWN 26%AND 23%FROM 1Q06
| • | Revenue of $1.5 billion decreased 17% and 10% from 1Q06 |
| — | Net interest income down 12% driven by lower trading-related net interest income and narrowing spreads |
| — | Fee and other income declined 20% from strong 4Q06 driven by lower results in structured products and M&A from record levels as well as lower principal investing results, somewhat offset by improvement in trading results |
| • | Strong origination revenues and underlying momentum in commercial mortgage securititization activity muted by the effect of higher 4Q06 asymmetrical hedge gains on the warehouse |
| • | Expenses decreased 10% driven by lower revenue-based incentives and professional and consulting fees; up 1% from 1Q06 |
| — | 1Q07 results include $20 million higher employee stock compensation expense |
| • | Average loans were relatively stable; up 11% from 1Q06 |
| • | Average core deposits grew 7% on an increase in lower-spread money market deposits; up 13% from 1Q06 |
| • | Origination pipelines showed continued strong improvement during the quarter |
(See Appendix, pages 31-34 for further discussion of business unit results)
Page-11
Table of Contents
Wachovia 1Q07 Quarterly Earnings Report
This segment includes Asset Management and Retail Brokerage Services.
Capital Management
Performance Summary
| 2007 | 2006 | 1Q07 vs | 1Q07 vs | |||||||||||||||||||
(Dollars in millions) | First Quarter | Fourth Quarter | Third Quarter | Second Quarter | First Quarter | |||||||||||||||||
Income statement data | ||||||||||||||||||||||
Net interest income(Tax-equivalent) | $ | 265 | 259 | 247 | 260 | 250 | 2 | % | 6 | |||||||||||||
Fee and other income | 1,458 | 1,353 | 1,231 | 1,225 | 1,230 | 8 | 19 | |||||||||||||||
Intersegment revenue | (8 | ) | (8 | ) | (8 | ) | (9 | ) | (8 | ) | — | — | ||||||||||
Total revenue(Tax-equivalent) | 1,715 | 1,604 | 1,470 | 1,476 | 1,472 | 7 | 17 | |||||||||||||||
Provision for credit losses | — | — | — | — | — | — | — | |||||||||||||||
Noninterest expense | 1,236 | 1,200 | 1,097 | 1,118 | 1,135 | 3 | 9 | |||||||||||||||
Income taxes(Tax-equivalent) | 175 | 148 | 136 | 131 | 123 | 18 | 42 | |||||||||||||||
Segment earnings | $ | 304 | 256 | 237 | 227 | 214 | 19 | % | 42 | |||||||||||||
Performance and other data | ||||||||||||||||||||||
Economic profit | $ | 261 | 215 | 198 | 187 | 175 | 21 | % | 49 | |||||||||||||
Risk adjusted return on capital (RAROC) | 77.48 | % | 67.52 | 66.78 | 63.64 | 59.88 | — | — | ||||||||||||||
Economic capital, average | $ | 1,592 | 1,504 | 1,410 | 1,428 | 1,450 | 6 | 10 | ||||||||||||||
Cash overhead efficiency ratio(Tax-equivalent) | 72.07 | % | 74.86 | 74.58 | 75.80 | 77.08 | — | — | ||||||||||||||
Lending commitments | $ | 303 | 219 | 263 | 250 | 237 | 38 | 28 | ||||||||||||||
Average loans, net | 1,554 | 1,419 | 1,235 | 1,039 | 856 | 10 | 82 | |||||||||||||||
Average core deposits | $ | 31,683 | 30,100 | 30,114 | 31,827 | 33,583 | 5 | (6 | ) | |||||||||||||
FTE employees | 17,704 | 17,515 | 17,289 | 17,242 | 17,147 | 1 | % | 3 | ||||||||||||||
| Capital Management Key Metrics | ||||||||||||||||||||||
| 2007 | 2006 | 1Q07 vs | 1Q07 vs | |||||||||||||||||||
(Dollars in billions) | First Quarter | Fourth Quarter | Third Quarter | Second Quarter | First Quarter | |||||||||||||||||
Equity assets | $ | 106.3 | 103.6 | 96.4 | 93.5 | 90.1 | 3 | % | 18 | |||||||||||||
Fixed income assets | 144.0 | 114.0 | 106.7 | 101.4 | 106.0 | 26 | 36 | |||||||||||||||
Money market assets | 64.3 | 61.2 | 49.7 | 45.2 | 45.0 | 5 | 43 | |||||||||||||||
Total assets under management (a) | 314.6 | 278.8 | 252.8 | 240.1 | 241.1 | 13 | 30 | |||||||||||||||
Gross fluctuating mutual fund sales | $ | 3.7 | 3.0 | 2.0 | 2.9 | 3.7 | 23 | — | ||||||||||||||
Full-service financial advisors series 7 | 8,166 | 8,091 | 7,972 | 7,973 | 7,926 | 1 | 3 | |||||||||||||||
Financial center advisors series 6 | 2,521 | 2,497 | 2,477 | 2,541 | 2,454 | 1 | 3 | |||||||||||||||
Broker client assets (b) | $ | 773.0 | 760.0 | 729.9 | 704.3 | 689.1 | 2 | 12 | ||||||||||||||
Customer receivables including margin loans | $ | 4.7 | 4.8 | 4.9 | 5.3 | 5.6 | (2 | ) | (16 | ) | ||||||||||||
Traditional brokerage offices | 768 | 751 | 737 | 738 | 730 | 2 | 5 | |||||||||||||||
Banking centers with brokerage services (c) | 1,850 | 1,824 | 1,825 | 1,867 | 1,883 | 1 | % | (2 | ) | |||||||||||||
| (a) | Includes $76 billion in assets managed for Wealth Management, which are also reported in that segment. Beginning in 4Q06, assets under management include assets retained from the divested Corporate and Institutional Trust business, which were reported in the Parent in previous quarters. |
| (b) | Beginning in 2Q06, certain mutual funds assets were added to the overall client asset total. Prior periods have not been restated. |
| (c) | Amounts presented in 2006 have been restated to conform to the presentation in 2007. |
RECORDSEGMENTEARNINGSOF $304MILLION,UP 19%AND 42%FROM 1Q06
| • | Revenue of $1.7 billion grew 7%; up 17% from 1Q06 |
| — | Net interest income increased 2% driven by strong core deposit growth |
| — | Fee and other income rose 8% primarily driven by higher retail brokerage transaction activity and equity syndicate distribution fees, the addition of ECM, and managed account fees |
| • | Results include successful launch of new investment products reflecting strong partnership with Corporate and Investment Bank |
| • | Expenses increased 3% driven by higher commissions, $17 million higher employee stock compensation expense, the addition of ECM, and increased fund distribution costs partially offset by decreases in sundry and equipment expense |
| — | Retail brokerage pre-tax profit margin of 29% |
| • | Assets under management increased 13% driven by the addition of $26.2 billion from ECM and net asset inflows |
| • | Series 7 advisors of 8,166 reflects strong recruiting and retention efforts; net new hires of 75 during the quarter |
(See Appendix, pages 35-36 for further discussion of business unit results)
Page-12
Table of Contents
Wachovia 1Q07 Quarterly Earnings Report
Asset Quality
| 2007 | 2006 | 1Q07 vs | 1Q07 vs | |||||||||||||||||||
(In millions) | First Quarter | Fourth Quarter | Third Quarter | Second Quarter | First Quarter | |||||||||||||||||
Nonperforming assets | ||||||||||||||||||||||
Nonaccrual loans | $ | 1,584 | 1,234 | 578 | 619 | 672 | 28 | % | — | |||||||||||||
Foreclosed properties | 155 | 132 | 181 | 99 | 108 | 17 | 44 | |||||||||||||||
Total nonperforming assets | $ | 1,739 | 1,366 | 759 | 718 | 780 | 27 | % | — | |||||||||||||
as % of loans, net and foreclosed properties | 0.41 | % | 0.32 | 0.26 | 0.25 | 0.28 | 27 | 48 | ||||||||||||||
Nonperforming assets in loans held for sale | $ | 26 | 16 | 23 | 23 | 24 | 63 | % | 8 | |||||||||||||
Total nonperforming assets in loans and in loans held for sale | $ | 1,765 | 1,382 | 782 | 741 | 804 | 28 | % | — | |||||||||||||
as % of loans, net, foreclosed properties and loans held for sale | 0.40 | % | 0.32 | 0.26 | 0.25 | 0.28 | — | — | ||||||||||||||
Allowance for credit losses (a) | ||||||||||||||||||||||
Allowance for loan losses, beginning of period | $ | 3,360 | 3,004 | 3,021 | 3,036 | 2,724 | 12 | % | 23 | |||||||||||||
Balance of acquired entities at purchase date | — | 303 | — | — | 300 | — | — | |||||||||||||||
Net charge-offs | (155 | ) | (140 | ) | (116 | ) | (51 | ) | (59 | ) | 11 | — | ||||||||||
Allowance relating to loans acquired, transferred to loans held for sale or sold | (3 | ) | (18 | ) | (15 | ) | (18 | ) | 12 | (83 | ) | — | ||||||||||
Provision for credit losses related to loans transferred to loans held for sale or sold (b) | 1 | 7 | (4 | ) | 5 | — | (86 | ) | — | |||||||||||||
Provision for credit losses | 175 | 204 | 118 | 49 | 59 | (14 | ) | 197 | ||||||||||||||
Allowance for loan losses, end of period | 3,378 | 3,360 | 3,004 | 3,021 | 3,036 | 1 | 11 | |||||||||||||||
Reserve for unfunded lending commitments, beginning of period | 154 | 159 | 165 | 160 | 158 | (3 | ) | (3 | ) | |||||||||||||
Provision for credit losses | 1 | (5 | ) | (6 | ) | 5 | 2 | — | (50 | ) | ||||||||||||
Reserve for unfunded lending commitments, end of period | 155 | 154 | 159 | 165 | 160 | 1 | (3 | ) | ||||||||||||||
Allowance for credit losses | $ | 3,533 | 3,514 | 3,163 | 3,186 | 3,196 | 1 | % | 11 | |||||||||||||
Allowance for loan losses | ||||||||||||||||||||||
as % of loans, net | 0.80 | % | 0.80 | 1.03 | 1.07 | 1.08 | — | — | ||||||||||||||
as % of nonaccrual and restructured loans (c) | 213 | 272 | 520 | 488 | 452 | — | — | |||||||||||||||
as % of nonperforming assets (c) | 194 | 246 | 396 | 421 | 389 | — | — | |||||||||||||||
Allowance for credit losses | ||||||||||||||||||||||
as % of loans, net | 0.84 | % | 0.84 | 1.09 | 1.13 | 1.14 | — | — | ||||||||||||||
Net charge-offs | $ | 155 | 140 | 116 | 51 | 59 | 11 | % | — | |||||||||||||
Commercial, as % of average commercial loans | 0.07 | % | 0.04 | 0.03 | (0.06 | ) | 0.05 | — | — | |||||||||||||
Consumer, as % of average consumer loans | 0.20 | 0.19 | 0.32 | 0.23 | 0.14 | — | — | |||||||||||||||
Total, as % of average loans, net | 0.15 | % | 0.14 | 0.16 | 0.08 | 0.09 | — | — | ||||||||||||||
Past due loans, 90 days and over, and nonaccrual loans (c) | ||||||||||||||||||||||
Commercial, as a % of loans, net | 0.28 | % | 0.23 | 0.28 | 0.28 | 0.32 | — | — | ||||||||||||||
Consumer, as a % of loans, net | 0.66 | % | 0.59 | 0.61 | 0.64 | 0.62 | — | — | ||||||||||||||
| (a) | The allowance for credit losses is the sum of the allowance for loan losses and the reserve for unfunded lending commitments. |
| (b) | The provision related to loans transferred or sold includes recovery of lower of cost or market losses. |
| (c) | These ratios do not include nonperforming assets included in loans held for sale. |
| • | Total NPAs of $1.8 billion rose $383 million driven by growth in consumer real estate secured and commercial loans; up 8 bps to 40 bps of loans |
| — | World Savings well-collateralized real estate secured portfolio contributed $194 million to nonaccrual loan increase; World Savings foreclosed properties up only $4 million |
| • | Provision expense of $177 million, largely reflecting loan growth and includes $10 million relating to credit card |
| — | Net charge-offs of $155 million, or 15 bps of average loans, increased $15 million driven by growth in commercial reflecting lower recoveries |
| • | Allowance for credit losses of $3.5 billion, or 0.84% of net loans, increased $19 million |
| — | Allowance for commercial credit losses to loans down 3 bps to 1.22% of loans; allowance for consumer credit losses up 1 bp to 0.53% of loans |
| — | Allowance as a percentage of nonaccruals and restructured loans declined to 213% from 272% largely reflecting the historically low loss content of World Savings well-collateralized real estate secured portfolio |
| • | Average LTV of consumer real estate secured nonperforming loans (assets) of 76% |
(See Appendix, pages 38-39 for further detail)
Page-13
Table of Contents
Wachovia 1Q07 Quarterly Earnings Report
World Savings Historical Credit Trends
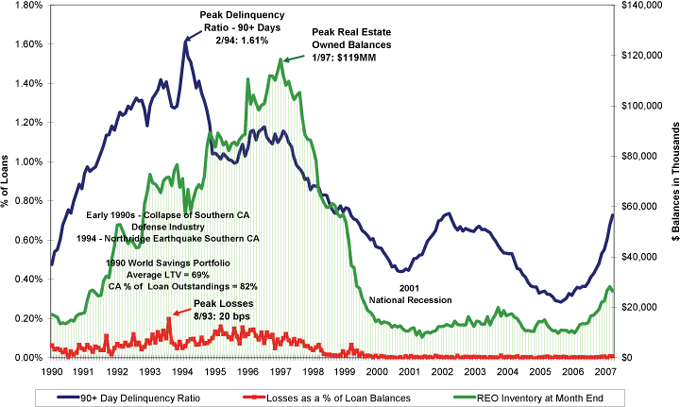
HISTORICALLY, SPIKESIN WORLD SAVINGS NPAS HAVE NOT MANIFESTED AS SIGNIFICANTLY HIGHER LOSSES
PERIOD-END 1Q07
| • | World Savings NPAs of $899 million or 74 bps of total loans |
| — | 74% average LTV on NPAs vs. 71% for the total portfolio |
| • | World Savings foreclosed properties totaled $23 million |
| — | 141 properties |
| — | 77% average LTV |
Page-14
Table of Contents
Wachovia 1Q07 Quarterly Earnings Report
Wachovia 2007 Full-Year Outlook
OVERALL VIEWOF FULL YEAR 2007 EARNINGS REMAINS RELATIVELY UNCHANGED FROM LAST UPDATE
FOR REFERENCE PURPOSES ONLY
ECONOMIC ASSUMPTIONSFOR FULL-YEAR 2007
| ESTIMATE | |||
REAL GDP GROWTH | 2.30 | % | |
FED FUNDS (AT DEC 2007) | 5.00 | % | |
10 YEAR TREASURY BOND (AT DEC 2007) | 4.75 | % |
Denotes update |
(VERSUS FULL-YEAR ADJUSTED COMBINED 2006 UNLESS OTHERWISE NOTED)
ADJUSTED COMBINED 2006# | 2007 OUTLOOK | |||||
NET INTEREST INCOME (TE) | $ 18.1 BILLION | RELATIVELYFLATTO 2%GROWTH | ||||
FEE INCOME | $ 14.5 BILLION | EXPECTLOW-DOUBLE-DIGIT %GROWTH | ||||
NONINTEREST EXPENSE* | $ 18.1BILLION | EXPECTMID-SINGLE-DIGIT %GROWTH;MARGINALLYLOWERTHANREVENUE | ||||
– TARGETINGYEAR-END 2007OVERHEADEFFICIENCYRATIOOF 51.5% – 53.5%** | ||||||
MINORITY INTEREST EXPENSE* | $ 414 MILLION | EXPECTHIGH-SINGLE-DIGIT %GROWTH | ||||
LOANS | $ 398.4 BILLION | EXPECTHIGH-SINGLE-DIGIT %GROWTH | ||||
CONSUMER | $ 249.6 BILLION | MID-SINGLE-DIGIT %GROWTH | ||||
COMMERCIAL | $ 148.8 BILLION | LOW-DOUBLE-DIGIT %GROWTH | ||||
NET CHARGE-OFFS | 8BPS | EXPECTMID-TEENSBPSRANGEOFAVERAGENETLOANS | ||||
PROVISIONMAYBEMODESTLYHIGHER | ||||||
EFFECTIVE TAX RATE (TE) | APPROXIMATELY 33% | |||||
LEVERAGE RATIO | TARGET > 6.0% | |||||
TANGIBLE CAPITAL RATIO (EXCLUDES FAS 115/133ANDPENSION) | TARGET > 4.7% | |||||
DIVIDEND PAYOUT RATIO | 40%–50%OFEARNINGS** | |||||
EXCESS CAPITAL | OPPORTUNISTICALLYREPURCHASESHARES;AUTHORIZATIONFOR 36.5MILLIONSHARESREMAINING | |||||
FINANCIALLYATTRACTIVE,SHAREHOLDERFRIENDLYACQUISITIONS | ||||||
| # | WACHOVIA’S 2006 REPORTED RESULTS AS FOOTNOTED BELOW PLUS GOLDEN WEST’S 3Q06 YTD RESULTS PLUS THE EFFECT OF PURCHASE ACCOUNTING AND INTANGIBLE ACCRETION/AMORTIZATION AND EXCLUDING 4Q06 ADJUSTMENTS AND GOLDEN WEST’S 3Q06 CHARITABLE CONTRIBUTION. |
| * | BEFORE NET MERGER-RELATED AND RESTRUCTURING EXPENSES. |
| ** | BEFORE NET MERGER-RELATED AND RESTRUCTURING EXPENSES, AND OTHER INTANGIBLE AMORTIZATION. |
Page-15
Table of Contents
TABLEOF CONTENTS
| 16 | ||
| 19 | ||
| 22 | ||
| 23 | ||
| 24 | ||
| 25 | ||
| 30 | ||
| 31 | ||
| 35 | ||
| 37 | ||
| 38 | ||
| 40 | ||
Explanation of Our Use of Certain Non-GAAP Financial Measures | 42 | |
| 43 | ||
| 47 | ||
| 48 |
Table of Contents
Wachovia 1Q07 Quarterly Earnings Report
Business segment results are presented excluding (i) merger-related and restructuring expenses, (ii) deposit base intangible and other intangible amortization expense, (iii) amounts presented as discontinued operations, and (iv) the cumulative effect of a change in accounting principle. This is the basis on which we manage and allocate capital to our business segments. We continuously assess assumptions, methodologies and reporting classifications to better reflect the true economics of our business segments.
We continuously update segment information for changes that occur in the management of our businesses. In 1Q07, we moved our cross-border leveraged leases, consisting of our portfolios of Lease-In, Lease-Out and Sale-In, Lease-Out transactions, from the Corporate and Investment Bank to the Parent to reflect the way in which these portfolios are now managed. We have updated information for 2006 to reflect this change. The impact to segment earnings for full year 2006 as a result of this and other changes was a $3 million decrease in the General Bank, a $3 million increase in Capital Management, a $7 million decrease in Wealth Management, a $91 million decrease in the Corporate and Investment Bank and a $98 million increase in the Parent.
In a rising rate environment, Wachovia benefits from a widening spread between deposit costs and wholesale funding costs. However, our funds transfer pricing (“FTP”) system, described below, credits this benefit to deposit-providing business units on a lagged basis. The effect of the FTP system results in rising charges to business units for funding to support predominantly floating-rate assets. This benefit of higher rates earned on floating-rate assets and lagging rates on longer duration deposits is captured in the central money book in the Parent segment.
In order to remove interest rate risk from each core business segment, the management reporting model employs an FTP system. The FTP system matches the duration of the funding used by each segment to the duration of the assets and liabilities contained in each segment. Matching the duration, or the effective term until an instrument can be repriced, allocates interest income and/or interest expense to each segment so its resulting net interest income is insulated from interest rate risk.
On January 1, 2007, we adopted FASB Staff Position FAS 13-2, “Accounting for a Change or Projected Change in the Timing of Cash Flows Relating to Income Taxes Generated by a Leveraged Lease Transaction” (FSP 13-2), FASB Interpretation (FIN) No. 48, “Accounting for Uncertainty in Income Taxes—an amendment of FAS Statement No 109,” SFAS No. 155, “Accounting for Certain Hybrid Financial Instruments—an amendment of FASB Statements No. 133 and 140,” and Emerging Issues Task Force (EITF) Issue No, 06-5, “Accounting for Purchases of Life Insurance—Determining the Amount That Could Be Realized in Accordance with FASB Technical Bulletin No. 85-4, ‘Accounting for Purchases of Life Insurance’”. For all of these new standards, the cumulative effect of adoption is recorded as an adjustment, net of applicable taxes, to beginning retained earnings.
FSP 13-2 amends SFAS 13, “Accounting for Leases,” such that changes that affect the timing of cash flows but not the total net income under a leveraged lease will trigger a recalculation of the lease. FIN 48 clarifies the criteria for recognition of income tax benefits in accordance with SFAS No. 109.
We have two primary classes of leveraged lease transactions that are affected by FSP 13-2: Lease-In, Lease-Out transactions (LILOs) and a second group of transactions that are broadly referred to as Sale-In, Lease-Out transactions (SILOs). SILOs principally include service contract and qualified technological equipment leases. We settled with the IRS in June 2004 on all matters relating to our portfolio of LILOs. On SILOs, we have concluded that it is possible that, upon ultimate resolution of a potential dispute with the IRS, we may not realize all of the income tax benefits originally recorded. On January 1, 2007, we recorded a $1.4 billion after-tax charge to beginning retained earnings entirely related to our portfolio of LILOs and SILOs. The amount of this reduction to beginning retained earnings will be recognized in earnings over the remaining terms of the affected leases, generally 35 years to 40 years. The impact on 2007 results of this charge is a reduction to net income of $98 million after-tax. We remain well capitalized for regulatory capital purposes following the reduction to retained earnings relating to the affected leases. The impact of the adoption of FIN 48 for other matters amounted to a $4 million reduction in beginning retained earnings.
SFAS 155 permits companies to record certain hybrid financial instruments at fair value with corresponding changes in fair value recorded in the results of operations. Hybrid financial instruments are those containing an embedded derivative. SFAS 155 also provides a one-time opportunity to elect to record certain hybrid financial instruments existing on January 1, 2007, at fair value. We did not elect to carry any such financial instruments at fair value, and accordingly, had no cumulative effect adjustment from the adoption.
Page-16
Table of Contents
Wachovia 1Q07 Quarterly Earnings Report
EITF Issue No. 06-5 addresses the accounting for certain corporate and bank-owned life insurance policies. The impact of adoption of this standard amounted to a $4 million reduction in beginning retained earnings.
Please see pages 40-41 of Exhibit (13) to Wachovia’s Annual Report on Form 10-K for a more detailed discussion of these matters.
In September 2006, the FASB issued SFAS 157, “Fair Value Measurement,” (SFAS 157), which establishes a framework for measuring fair value under U.S. GAAP, expands disclosures about fair value measurement and provides new income recognition criteria for certain derivative contracts. SFAS 157 does not establish any new fair value measurements itself, but applies under other accounting standards that require the use of fair value for recognition or disclosure. In February 2007, the FASB issued SFAS 159, “The Fair Value Option for Financial Assets and Financial Liabilities.” SFAS 159 permits companies to elect to carry certain financial instruments at fair value with corresponding changes in fair value recorded in the results of operations. Both SFAS 157 and SFAS 159 are effective January 1, 2008, with early adoption permitted on January 1, 2007. We will adopt these standards on January 1, 2008, and are currently assessing the impact of adoption on our consolidated financial position and results of operations. The effect of adopting SFAS 157 will be recorded either directly to results of operations or as a cumulative effect of a change in accounting principle through an adjustment to beginning retained earnings on January 1, 2008, depending on the nature of the financial instrument to which fair value is being applied. The transition adjustment for SFAS 159 will be recorded as a cumulative effect of a change in accounting principle through an adjustment to beginning retained earnings.
SFAS No. 123R, “Share-Based Payments,” which we adopted on January 1, 2006, requires that compensation costs relating to share-based payment transactions be recognized in income, as has been our accounting policy since January 1, 2002. SFAS 123R, however, also requires a different treatment of awards to retirement-eligible employees in situations where the award automatically vests upon retirement, which is the case for substantially all of our awards. Beginning in 2006, these awards to retirement-eligible employees must be expensed in full at the date of grant, or from the date of grant to the date that an employee will be retirement-eligible, if that is before the end of the stated vesting period. In 1Q07 and in 1Q06 (2Q06 for Capital Management), we made our annual stock grants. Total stock compensation expense was $212 million and $194 million in 1Q07 and 1Q06, respectively, and $101 million in 4Q06. Of these amounts, $93 million in 1Q07 and $98 million in 1Q06 related to awards to retirement-eligible employees. The majority of the linked quarter variance in stock compensation expense in the business units is attributable to the incremental expense for retirement-eligible employees. Note: Unless otherwise noted, references in this document to employee stock compensation expense refer only to the retirement-eligible portion of overall employee stock compensation expense.
In September 2006, the SEC issued Staff Accounting Bulletin No. 108, “Considering the Effects of Prior Year Misstatements when Quantifying Misstatements in Current Year Financial Statements” (SAB 108). SAB 108 requires that both an income statement approach and a balance sheet approach be used when evaluating whether an error is material to an entity’s financial statements, based on all relevant quantitative and qualitative factors. The SEC staff issued SAB 108 to address what they identified as diversity in practice whereby entities were using either an income statement approach or a balance sheet approach, but not both. We have consistently used the income statement approach in prior periods. SAB 108 became effective December 31, 2006, and any material adjustments arising from the adoption of SAB 108 were recorded as a cumulative effect adjustment to beginning retained earnings.
Page-17
Table of Contents
Wachovia 1Q07 Quarterly Earnings Report
In 4Q06, we completed our analysis under SAB 108 using both the income statement and balance sheet approaches, and concluded that we have no prior year misstatements that were material to our financial statements. However, in the process of performing the above review, we elected to record certain prior year adjustments to a number of income statement line items that were not significant on an individual or aggregate basis. We recorded adjustments in 4Q06 to correct these items, which are shown in the table below and are referred to as “4Q06 Adjustments” in these materials.
4Q06 Adjustments
(In millions) | 4Q06 Impact | |||
Interest and fees on loans | $ | 56 | ||
Interest on deposits | (32 | ) | ||
Net interest income | 24 | |||
Service charges | 22 | |||
Other income | 93 | |||
Total fee and other income | 115 | |||
Salaries and employee benefits | (99 | ) | ||
Sundry expense | (99 | ) | ||
Total noninterest expense | (198 | ) | ||
Income before income taxes | (59 | ) | ||
Income taxes on above items | (23 | ) | ||
Income taxes | (49 | ) | ||
Total income taxes | (72 | ) | ||
Net income | $ | 13 | ||
We recorded adjustments to net interest income and service charges to reflect certain items that in the past had been recorded either when billed to the customer or on a lagged basis, but going forward will be recorded as earned. We recorded additional salaries and employee benefits expense to reflect the carryover of prior years’ unused paid time off and additional sundry expense relating to the prior year’s invoices received and processed after year-end, but for which the services had been rendered prior to year-end. We also recorded additional other noninterest income for amounts recorded in other comprehensive income relating to a hedging relationship that had been discontinued in a prior year. In the tax provision, we recorded the tax effect of the above-referenced items and certain other adjustments to current taxes payable. The net after-tax impact of all of these adjustments was a $13 million increase to net income.
On October 1, 2006, we completed the acquisition of Golden West Financial Corporation, a California-based financial services company. Under the purchase accounting method, Golden West is not included in our financial results prior to 4Q06.
In 4Q05, we completed the sale of most of our Corporate and Institutional Trust (CIT) businesses and recognized a pre-tax gain of $447 million ($214 million after-tax). In 4Q06, we recognized an additional pre-tax gain of $76 million ($46 million after-tax) based on the level of business retained in the 12-month period following the completion of the transaction. The gain on sale was presented, net of applicable taxes, as discontinued operations in the consolidated statement of income.
On March 1, 2006, we completed the acquisition of Westcorp and WFS Financial Inc, a California-based auto loan originator business and commercial bank. Financial results for 1Q06 include one month’s results of the acquired Westcorp entities under the purchase accounting method. The ongoing auto loan origination business activity is included in the Commercial sub-segment of the General Bank and the commercial banking business is included in the Retail and Small Business sub-segment of the General Bank.
We entered the credit card market as a direct issuer beginning in January 2006. This coincided with Wachovia terminating our existing joint marketing agreement with MBNA Corporation as a result of the Bank of America/MBNA merger, which closed on January 1, 2006. Upon consummation of that merger, MBNA paid us a $100 million termination fee, which was recorded in other income in 1Q06.
Page-18
Table of Contents
Wachovia 1Q07 Quarterly Earnings Report
(See Table on Page 6)
Net Interest Income Summary
| 2007 | 2006 | 1Q07 vs | 1Q07 vs | Combined | ||||||||||||||||||||
(In millions) | First Quarter | Fourth Quarter | Third Quarter | Second Quarter | First Quarter | 1Q06 | 1Q07 vs 1Q06 | |||||||||||||||||
Average earning assets | $ | 594,313 | 596,893 | 472,139 | 463,232 | 442,527 | — | % | 34 | $ | 566,780 | 5 | % | |||||||||||
Average interest-bearing liabilities | 539,547 | 536,958 | 414,563 | 403,234 | 384,406 | — | 40 | 506,790 | 6 | |||||||||||||||
Interest income(Tax-equivalent) | 10,185 | 10,405 | 7,821 | 7,438 | 6,756 | (2 | ) | 51 | 8,853 | 15 | ||||||||||||||
Interest expense | 5,688 | 5,793 | 4,243 | 3,763 | 3,217 | (2 | ) | 77 | 4,412 | 29 | ||||||||||||||
Net interest income(Tax-equivalent) | $ | 4,497 | 4,612 | 3,578 | 3,675 | 3,539 | (2 | )% | 27 | $ | 4,441 | 1 | % | |||||||||||
Average rate earned | 6.89 | % | 6.95 | 6.60 | 6.43 | 6.15 | — | — | ||||||||||||||||
Equivalent rate paid | 3.88 | 3.86 | 3.57 | 3.25 | 2.94 | — | — | |||||||||||||||||
Net interest margin | 3.01 | % | 3.09 | 3.03 | 3.18 | 3.21 | — | — | 3.14 | % | — | % | ||||||||||||
Net interest income of $4.5 billion decreased 2%, or $115 million, as the benefit of loan and securitization warehouse growth and improved retail deposit pricing were more than offset by lower income relating to 4Q06 Adjustments, the effect of FSP 13-2/FIN 48 adoption, and maturing off-balance sheet positions, as well as lower trading-related net interest income, and the shift in deposits to lower-spread categories. Net interest income grew 27% from 1Q06 driven by the addition of Golden West and Westcorp. Net interest income rose 1% from Combined 1Q06 as growth in earning assets including Westcorp was largely offset by the shift in deposit mix toward lower spread categories and the effect of the inverted yield curve.
Net interest margin of 3.01% decreased 8 bps as the benefit from retail deposit strategies and a reduction in lower-spread short-term investments was more than offset by lower income from maturing off-balance sheet positions, the effect of 4Q06 Adjustments, lower trading-related net interest income, the effect of FSP 13-2/FIN 48 adoption, growth in lower-spread commercial and consumer loans and securitization warehouses, and a continued shift in deposits toward lower-spread categories. The margin decreased 20 bps from 1Q06 on growth in lower-spread consumer and commercial loans and securities, a shift in deposits toward lower-spread categories, and the impact of acquisitions.Net interest margin decreased 13 bps from Combined 1Q06.
Average trading assets decreased $1.4 billion, or 4%. Average VAR increased to $23 million from $19 million in 4Q06.Average securities were down $472 million and decreased $9.9 billion, or 8%, from 1Q06 driven by the sale of $13.2 billion of securities relating to the Golden West merger. The average duration of the securities portfolio remained stable at 3.4 years in 1Q07. Average securities declined $11.4 billion from Combined 1Q06 driven by the above factors.
Average loans rose 1% and 59% from 1Q06 driven by merger activity.Average loans rose 9% from Combined 1Q06 driven by growth in commercial and consumer.Average commercial loans grew $3.0 billion, or 2%, on strength in middle-market and business banking, commercial real estate portfolios and foreign. This growth was somewhat offset by the $1.9 billion decrease in leases reflecting the $1.4 billion average effect of FSP 13-2/FIN 48 adoption and expected paydowns as well as the $400 million average effect of 4Q06 and 1Q07 loan sales. Commercial loans grew 10% from 1Q06.Average consumer loans remained relatively stable, down $282 million as growth in real estate secured and auto was more than offset by the $1.4 billion average effect of 4Q06 and 1Q07 loan sale and securitization activity. In 4Q06 we sold $1.7 billion of student loans and in late 1Q07 we sold or securitized a net $4.3 billion of consumer loans. Consumer loans grew $139.9 billion from 1Q06 largely driven by merger activity as well as growth in real estate secured, auto, student loans and credit card.Average consumer loans grew $21 billion, or 9%, from Combined 1Q06 driven by growth in auto, including the effect of Westcorp, as well as student loans and credit card.Net sale and securitization activity reduced average consumer loans by $8.2 billion from Combined 1Q06 levels.
Page-19
Table of Contents
Wachovia 1Q07 Quarterly Earnings Report
Loans Held for Sale
| 2007 | 2006 | |||||||||||||||
(In millions) | First Quarter | Fourth Quarter | Third Quarter | Second Quarter | First Quarter | |||||||||||
Core business activity, beginning of period | $ | 12,566 | 9,030 | 7,740 | 7,846 | 6,388 | ||||||||||
Balance of acquired entities at purchase date | — | 193 | — | — | — | |||||||||||
Originations/purchases | 17,873 | 18,436 | 16,803 | 13,778 | 13,068 | |||||||||||
Transfers to (from) loans held for sale, net | (180 | ) | 127 | (154 | ) | (238 | ) | (70 | ) | |||||||
Lower of cost or market value adjustments | (3 | ) | — | — | — | — | ||||||||||
Performing loans sold or securitized | (14,745 | ) | (14,936 | ) | (15,137 | ) | (13,357 | ) | (11,397 | ) | ||||||
Other, principally payments | (481 | ) | (284 | ) | (222 | ) | (289 | ) | (143 | ) | ||||||
Core business activity, end of period | 15,030 | 12,566 | 9,030 | 7,740 | 7,846 | |||||||||||
Portfolio management activity, end of period | 2 | 2 | 9 | 10 | 13 | |||||||||||
Total loans held for sale (a) | $ | 15,032 | 12,568 | 9,039 | 7,750 | 7,859 | ||||||||||
| (a) | Nonperforming assets included in loans held for sale at March 31, 2007 and at December 31, September 30, June 30, and March 31, 2006, were $26 million, $16 million, $23 million, $23 million and $24 million, respectively. |
Average loans held for sale increased $4.8 billion driven by growth in the commercial mortgage securitization warehouse. In 1Q07 we sold/securitized $9.5 billion of commercial and $5.2 billion of consumer mortgages out of held for sale. In 1Q07 we originated $18.3 billion of consumer mortgages and delivered $5.2 billion to agencies/privates.
Average other earning assets decreased 25% driven by lower fed funds sold and repos, and were down 14% from 1Q06 reflecting temporary excess 4Q06 liquidity related to balance sheet repositioning, including deleveraging, in connection with the Golden West merger.Average other earning assets decreased $7.5 billion from Combined 1Q06.Total average earning assets were stable and rose 34% from 1Q06 driven by merger activity.Average earning assets increased 5% from Combined 1Q06.
Average core depositsincreased 2% on strength in CDs, interest-bearing checking and foreign deposits somewhat offset by decreases in DDA. Average core deposits grew 27% from 1Q06 driven by merger activity. Average core deposits increased 5% from Combined 1Q06 as growth in retail CDs, NOW, foreign and the effect of Westcorp more than offset declines in savings, DDA and interest checking.
Average short-term borrowings decreased 15% and 20% from 1Q06.
Average long-term debtincreased $2.6 billion and $85.9 billion from 1Q06 driven by merger activity.
The following tables provide additional detail on our consumer loans.
Average Consumer Loans - Total Corporation
| 2007 | 2006 | 1Q07 vs | 1Q07 vs | Combined | |||||||||||||||||||
(In millions) | First Quarter | Fourth Quarter | Third Quarter | Second Quarter | First Quarter | 1Q06 | 1Q07 vs 1Q06 | ||||||||||||||||
Mortgage | $ | 47,736 | 46,653 | 42,506 | 40,111 | 39,323 | 2 | % | 21 | $ | 39,394 | 21 | % | ||||||||||
Pick-A-Pay mortgage | 118,571 | 119,962 | — | — | — | (1 | ) | — | 115,677 | 3 | |||||||||||||
Home equity loans | 31,763 | 32,129 | 31,753 | 31,548 | 30,893 | (1 | ) | 3 | 30,946 | 3 | |||||||||||||
Home equity lines | 27,839 | 28,126 | 25,409 | 25,718 | 25,866 | (1 | ) | 8 | 28,806 | (3 | ) | ||||||||||||
Student | 8,524 | 8,886 | 9,605 | 10,842 | 10,589 | (4 | ) | (20 | ) | 10,589 | (20 | ) | |||||||||||
Auto and other vehicle | 19,866 | 19,203 | 18,425 | 17,867 | 8,731 | 3 | 128 | 8,731 | 128 | ||||||||||||||
Revolving | 2,858 | 2,410 | 1,876 | 1,737 | 1,684 | 19 | 70 | 1,694 | 69 | ||||||||||||||
Other consumer loans | 816 | 886 | 970 | 1,101 | 1,019 | (8 | ) | (20 | ) | 1,019 | (20 | ) | |||||||||||
Total consumer loans | $ | 257,973 | 258,255 | 130,544 | 128,924 | 118,105 | — | % | 118 | $ | 236,856 | 9 | % | ||||||||||
Period-End On-Balance Sheet Consumer Loans In Loans, Securities and Loans Held for Sale
| 2007 | 2006 | 1Q07 vs | 1Q07 vs | |||||||||||||
(In millions) | First Quarter | Fourth Quarter | Third Quarter | Second Quarter | First Quarter | |||||||||||
On-balance sheet loan portfolio | $ | 252,826 | 256,254 | 130,744 | 128,067 | 129,642 | (1 | )% | 95 | |||||||
Securitized loans included in securities | 5,807 | 6,629 | 6,832 | 7,111 | 4,873 | (12 | ) | 19 | ||||||||
Loans held for sale | 4,565 | 3,702 | 3,483 | 4,148 | 4,271 | 23 | 7 | |||||||||
Total consumer loan assets | $ | 263,198 | 266,585 | 141,059 | 139,326 | 138,786 | (1 | )% | 90 | |||||||
We originated $18.3 billion of mortgages in 1Q07 vs. $19.8 billion in 4Q06 and $50.0 billion during 2006. The third-party consumer mortgage servicing portfolio totaled $31.0 billion at the end of 1Q07 and the total consumer mortgage servicing portfolio was $178 billion.
Page-20
Table of Contents
Wachovia 1Q07 Quarterly Earnings Report
The following table provides additional period-end balance sheet data.
Period-End Balance Sheet Data
| 2007 | 2006 | 1Q07 vs | 1Q07 vs | Combined | ||||||||||||||||||||||||
(In millions) | First Quarter | Fourth Quarter | Third Quarter | Second Quarter | First Quarter | 1Q06 | 1Q07 vs 1Q06 | |||||||||||||||||||||
Commercial loans, net | $ | 167,039 | 162,098 | 159,424 | 154,277 | 150,902 | 3 | % | 11 | $ | 151,038 | 11 | % | |||||||||||||||
Consumer loans, net | 254,624 | 258,060 | 131,335 | 128,639 | 130,030 | (1 | ) | 96 | 250,292 | 2 | ||||||||||||||||||
Loans, net | 421,663 | 420,158 | 290,759 | 282,916 | 280,932 | — | 50 | 401,330 | 5 | |||||||||||||||||||
Goodwill and other intangible assets | ||||||||||||||||||||||||||||
Goodwill | 38,838 | 38,379 | 23,535 | 23,550 | 23,443 | 1 | 66 | 38,297 | 1 | |||||||||||||||||||
Deposit base | 796 | 883 | 577 | 631 | 691 | (10 | ) | 15 | 1,100 | (28 | ) | |||||||||||||||||
Customer relationships | 684 | 662 | 688 | 714 | 742 | 3 | (8 | ) | 742 | (8 | ) | |||||||||||||||||
Tradename | 90 | 90 | 90 | 90 | 90 | — | — | 90 | — | |||||||||||||||||||
Total assets | 706,406 | 707,121 | 559,922 | 553,614 | 541,842 | — | 30 | 684,013 | 3 | |||||||||||||||||||
Core deposits | 377,358 | 371,771 | 291,667 | 292,243 | 296,092 | 2 | 27 | 357,932 | 5 | |||||||||||||||||||
Total deposits | 408,148 | 407,458 | 323,298 | 327,614 | 328,564 | — | 24 | 390,421 | 5 | |||||||||||||||||||
Long-term debt | 142,334 | 138,594 | 86,419 | 74,627 | 70,218 | 3 | 103 | 125,593 | 13 | |||||||||||||||||||
Stockholders’ equity | $ | 69,786 | 69,716 | 51,180 | 48,872 | 49,789 | — | % | 40 | $ | 67,595 | 3 | % | |||||||||||||||
Memoranda | ||||||||||||||||||||||||||||
Unrealized gains (losses)(Before income taxes) | ||||||||||||||||||||||||||||
Securities, net | $ | (809 | ) | (970 | ) | (1,081 | ) | (3,315 | ) | (1,785 | ) | |||||||||||||||||
Risk management derivative financial instruments, net | (385 | ) | (367 | ) | (322 | ) | (797 | ) | (480 | ) | ||||||||||||||||||
Unrealized gains (losses), net(Before income taxes) | $ | (1,194 | ) | (1,337 | ) | (1,403 | ) | (4,112 | ) | (2,265 | ) | |||||||||||||||||
PORTFOLIO MANAGEMENT ACTIVITY
In 1Q07, we sold $220 million of commercial loans out of the portfolio which were largely performing loans.
Page-21
Table of Contents
Wachovia 1Q07 Quarterly Earnings Report
(See Table on Page 7)
Fee and other income of $3.7 billion decreased $239 million, or 6%, and increased $224 million, or 6%, from 1Q06. The decline from 4Q06 was driven by a $133 million decline in commercial mortgage securitization activity, a $115 million reduction from 4Q06 Adjustments and lower principal investing results which were partially offset by higher trading account profits as well as growth in fiduciary and asset management fees and commissions. Fee and other income excluding the $115 million in 4Q06 Adjustments was down 3%. Fee and other income growth from 1Q06 was driven by strength in fiduciary and asset management fees, advisory and underwriting and securities gains, somewhat offset by a $133 million decline relating to the 1Q06 MBNA fee and Archipelago/NYSE gain. Fees represented 45% of total revenue in 1Q07 and 46% in 4Q06.Combined fee and other income increased 6% from 1Q06.
Service charges were down 5% from 4Q06, which included $22 million of 4Q06 Adjustments. Excluding the 4Q06 Adjustments, service charges were down $10 million, or 2%, as a 5% decline in seasonally lower consumer service charges more than offset growth in commercial service charges. Excluding the $22 million in 4Q06 Adjustments, commercial service charges were up 4% on strong Treasury Services sales volume. Service charges increased 7% from 1Q06 driven by an 11% increase in consumer service charges due to higher volumes as well as the introduction of tiered pricing, which was coupled with a 2% increase in commercial service charges on higher volumes.
Other banking fees of $416 million declined 8% driven by the divestiture of HomEq in addition to declines in consumer and commercial mortgage banking fees. Other banking fees were down 6% from Combined 1Q06 on lower mortgage banking fees driven by the HomEq divestiture partially offset by higher interchange fees due to higher transaction and sales volumes.
Commissions of $659 million increased 4% and 6% from 1Q06. Growth from 4Q06 was driven by a 6% increase in brokerage commissions on higher retail brokerage transaction activity reflecting strong equity syndicate volumes, which was partially offset by a 4% decline in insurance commissions from strong 4Q06 levels.Commissions increased 5% from Combined 1Q06 on a 6% increase in brokerage commissions.
Fiduciary and asset management fees grew 7% to $920 million driven by the January 31, 2007, acquisition of ECM and growth in retail brokerage managed account fees. Results increased 21% from 1Q06 reflecting higher retail brokerage managed account fees, the impact of acquisitions as well as solid growth in assets under management.
Advisory, underwriting and other investment banking fees of $407 million decreased $26 million from robust 4Q06 levels in structured products and M&A results which were only partially offset by improved high yield origination volumes. Results were up $105 million, or 35%, from 1Q06 driven by strength in equities reflecting enhanced CIB/CMG partnership, and growth in high yield, structured products, and loan syndications.
Trading account profits of $168 million increased $139 million driven by higher results in global rate and credit products. Trading account profits declined $51 million from record 1Q06 results driven by losses in structured products and equities during the quarter.
Principal investing recorded net gains of $48 million, down $94 million from strong 4Q06 levels on lower direct investment gains and lower fund distributions. Net gains were down $55 million from 1Q06.
Securities gains were $53 million vs. $47 million in 4Q06 and losses of $48 million in 1Q06. Impairment losses were $4 million compared with $26 million in impairment losses in 4Q06. Securities losses in 1Q06 included $11 million in impairment losses.
Other Income
| 2007 | 2006 | 1Q07 vs | 1Q07 vs | 2006 vs 2005 | ||||||||||||||||||||
(In millions) | First Quarter | Fourth Quarter | Third Quarter | Second Quarter | First Quarter | 2006 | 2005 | |||||||||||||||||
Consumer loan securitization activity | $ | 69 | 118 | 113 | 67 | 50 | (42 | )% | 38 | $ | 348 | $ | 248 | |||||||||||
Commercial mortgage securitization activity | 99 | 232 | (6 | ) | 53 | 66 | (57 | ) | 50 | 345 | 68 | |||||||||||||
Other income | 288 | 392 | 308 | 300 | 439 | (27 | ) | (34 | ) | 1,439 | 1,022 | |||||||||||||
Total other income | $ | 456 | 742 | 415 | 420 | 555 | (39 | )% | (18 | ) | $ | 2,132 | $ | 1,338 | ||||||||||
Other income of $456 million decreased $286 million. Excluding 4Q06 Adjustments of $93 million, other income was down 30% on lower commercial mortgage securitization activity, as strong underlying securitization momentum was muted by the effect of higher 4Q06 asymmetrical hedge gains on the warehouse, and a $49 million decline in consumer loan securitization and sale income. Affordable housing write-downs of $15 million
Page-22
Table of Contents
Wachovia 1Q07 Quarterly Earnings Report
compared with $27 million in 4Q06. Other income decreased $99 million from 1Q06 results which included the $100 million MBNA fee and $33 million from the NYSE/Archipelago merger, which was more than offset in 1Q07 by higher commercial mortgage securitization activity, corporate investments and higher consumer loan securitization and sale income.
(See Table on Page 8)
Total noninterest expense decreased 7%, or $343 million, from higher 4Q06 levels which included $198 million in 4Q06 Adjustments. Excluding these 4Q06 Adjustments, expenses decreased 3%, reflecting expense discipline including lower sundry expense and lower professional and consulting fees. 1Q07 expense includes $16 million of efficiency initiative costs, $31 million of de novo expansion and branch consolidation costs and $26 million related to our credit card business. Total noninterest expense increased 8% vs. 1Q06 due primarily to Golden West, and increased salaries and revenue-based incentives expense.Total noninterest expense increased 1% from Combined 1Q06.
Salaries and employee benefits expense decreased 2% and grew 10% from 1Q06 on merger activity. Excluding 4Q06 Adjustments, salaries and employee benefits expense increased 2% as $93 million in employee stock compensation expense more than offset lower salaries and revenue-based incentives expense.Salaries and employee benefits expense increased 3% from Combined 1Q06 on other merger activity.Occupancy and equipment expense decreased $18 million largely on lower rental expense.Professional and consulting fees fell $62 million, reflecting 4Q06 seasonality in addition to expense control on project spending.Sundry expense decreased $171 million from 4Q06 levels. Excluding 4Q06 Adjustments, sundry expense was down $72 million, or 14%, on lower legal costs, travel and entertainment, and hiring and relocation expense.Other intangible amortization of $118 million included $83 million in deposit base intangible amortization and $35 million in other intangible amortization.
Page-23
Table of Contents
Wachovia 1Q07 Quarterly Earnings Report
CONSOLIDATED RESULTS - SEGMENT SUMMARY
Wachovia Corporation
Performance Summary
| Three Months Ended March 31, 2007 | |||||||||||||||||
(Dollars in millions) | General Bank | Wealth Management | Corporate and Investment Bank | Capital Management | Parent | Merger- Related and Restructuring Expenses | Total Corporation | ||||||||||
Income statement data | |||||||||||||||||
Total revenue(Tax-equivalent) | $ | 4,615 | 342 | 1,499 | 1,715 | 67 | — | 8,238 | |||||||||
Noninterest expense | 2,030 | 241 | 903 | 1,236 | 168 | 10 | 4,588 | ||||||||||
Minority interest | — | — | — | — | 136 | — | 136 | ||||||||||
Segment earnings from continuing operations | 1,539 | 65 | 379 | 304 | 21 | (6 | ) | 2,302 | |||||||||
Performance and other data | |||||||||||||||||
Economic profit | $ | 1,159 | 46 | 159 | 261 | 35 | — | 1,660 | |||||||||
Risk adjusted return on capital (RAROC) | 48.22 | % | 43.63 | 20.10 | 77.48 | 17.04 | — | 38.72 | |||||||||
Economic capital, average | $ | 12,622 | 566 | 7,088 | 1,592 | 2,418 | — | 24,286 | |||||||||
Cash overhead efficiency ratio | 43.98 | % | 70.22 | 60.20 | 72.07 | 78.63 | — | 54.15 | |||||||||
FTE employees | 57,224 | 4,393 | 5,959 | 17,704 | 25,089 | — | 110,369 | ||||||||||
Business mix/Economic capital | |||||||||||||||||
Based on total revenue | 56.02 | % | 4.15 | 18.20 | 20.82 | ||||||||||||
Based on segment earnings | 66.68 | 2.82 | 16.42 | 13.17 | |||||||||||||
Average economic capital change (1Q07 vs 1Q06) | 73 | % | 2 | 17 | 10 | ||||||||||||
Page-24
Table of Contents
Wachovia 1Q07 Quarterly Earnings Report
This segment consists of the Retail and Small Business, and Commercial operations.
(See Table on Page 9)
RETAILAND SMALL BUSINESS
This sub-segment includes Retail Banking, Small Business Banking, Wachovia Mortgage, Wachovia Home Equity, Wachovia Education Finance and other retail businesses.
Retail and Small Business
Performance Summary
| 2007 | 2006 | 1Q07 vs | 1Q07 vs | Combined | |||||||||||||||||||||
(In millions) | First Quarter | Fourth Quarter | Third Quarter | Second Quarter | First Quarter | 1Q06 | 1Q07 vs 1Q06 | ||||||||||||||||||
Income statement data | |||||||||||||||||||||||||
Net interest income(Tax-equivalent) | $ | 2,613 | 2,647 | 1,723 | 1,708 | 1,658 | (1 | )% | 58 | $ | 2,610 | — | % | ||||||||||||
Fee and other income | 734 | 820 | 770 | 730 | 754 | (10 | ) | (3 | ) | 770 | (5 | ) | |||||||||||||
Intersegment revenue | 12 | 11 | 12 | 13 | 13 | 9 | (8 | ) | 12 | — | |||||||||||||||
Total revenue(Tax-equivalent) | 3,359 | 3,478 | 2,505 | 2,451 | 2,425 | (3 | ) | 39 | 3,392 | (1 | ) | ||||||||||||||
Provision for credit losses | 60 | 57 | 47 | 38 | 40 | 5 | 50 | 40 | 50 | ||||||||||||||||
Noninterest expense | 1,618 | 1,595 | 1,300 | 1,341 | 1,299 | 1 | 25 | 1,544 | 5 | ||||||||||||||||
Income taxes(Tax-equivalent) | 613 | 668 | 422 | 391 | 397 | (8 | ) | 54 | 661 | (7 | ) | ||||||||||||||
Segment earnings | $ | 1,068 | 1,158 | 736 | 681 | 689 | (8 | )% | 55 | $ | 1,147 | (7 | )% | ||||||||||||
Performance and other data | |||||||||||||||||||||||||
Economic profit | $ | 856 | 946 | 648 | 589 | 603 | (10 | )% | 42 | ||||||||||||||||
Risk adjusted return on capital (RAROC) | 58.48 | % | 62.93 | 88.48 | 82.54 | 84.90 | — | — | |||||||||||||||||
Economic capital, average | $ | 7,311 | 7,236 | 3,317 | 3,306 | 3,305 | 1 | — | |||||||||||||||||
Cash overhead efficiency ratio(Tax-equivalent) | 48.17 | % | 45.89 | 51.90 | 54.72 | 53.55 | — | — | 45.54 | % | — | % | |||||||||||||
Average loans, net | $ | 218,384 | 218,412 | 92,845 | 90,800 | 88,789 | — | — | $ | 208,476 | 5 | % | |||||||||||||
Average core deposits | $ | 244,288 | 239,703 | 169,265 | 167,689 | 163,364 | 2 | % | 50 | $ | 224,458 | 9 | % | ||||||||||||
Net interest income decreased 1% as the benefits of improved deposit pricing were more than offset by relatively flat loans, narrowing loan spreads, an unfavorable mix shift in deposits as well as seasonality; up 58% from 1Q06 largely reflecting the addition of Golden West. Average core deposits grew 2% and average loans were relatively flat. Compared with 1Q06, core deposits rose $80.9 billion and loans increased $129.6 billion. Versus Combined 1Q06, net interest income remained relatively flat as narrowing spreads muted the effect of continued loan and deposit growth. Core deposit growth of 9% was driven by increases in CDs and interest checking. Average loans increased 5% and reflected a continued shift from variable rate to fixed rate loans.
Fee and other income decreased 10% driven by lower other income and service charges and decreased 3% from 1Q06, which included the $100 million MBNA fee. 4Q06 other income included higher loan and branch sale gains and higher mortgage banking fees. Fee and other income decreased $36 million from Combined 1Q06, as growth in service charges and interchange fees relating to higher volume and improved pricing were more than offset by the lower other income relating to the 1Q06 $100 million MBNA fee.
Mortgage-related fee and other income of $74 million declined $8 million on lower origination volumes; down $7 million from Combined 1Q06.Mark-to-market valuation losses on the servicing rights portfolio were $7 million higher than 4Q06 while income relating to economic hedges on the servicing rights portfolio increased $8 million from 4Q06.
Provision expense increased $3 million and $20 million from 1Q06 reflecting higher real estate secured losses.
Noninterest expense increased 1% and 25% from 1Q06 largely reflecting the addition of Golden West. Expense growth from 4Q06 reflects $27 million relating to employee stock compensation expense as well as higher sales-based incentives and expansion costs, somewhat offset by lower discretionary spending. 1Q07 included $29 million in de novo and California branch expansion and consolidation expenses as well as $26 million in costs relating to the credit card business. This compares with $28 million in de novo and California branch expansion and branch consolidations expense and $36 million in costs relating to the credit card business in 4Q06. Expenses rose 5% from Combined 1Q06 largely reflecting higher salaries and benefits expense, de novo branch expansion and credit card.
Page-25
Table of Contents
Wachovia 1Q07 Quarterly Earnings Report
GENERAL BANK - RETAILAND SMALL BUSINESS LOAN PRODUCTION
Retail and Small Business
| 2007 | 2006 | 1Q07 vs | 1Q07 vs | ||||||||||||||
(In millions) | First Quarter | Fourth Quarter | Third Quarter | Second Quarter | First Quarter | ||||||||||||
Loan production | |||||||||||||||||
Mortgage (a) | $ | 14,447 | 15,480 | 6,017 | 5,912 | 5,283 | (7 | )% | — | ||||||||
Home equity | 8,132 | 7,784 | 7,742 | 8,325 | 7,999 | 4 | 2 | ||||||||||
Student | 1,141 | 886 | 1,377 | 860 | 1,218 | 29 | (6 | ) | |||||||||
Installment | 177 | 171 | 187 | 195 | 167 | 4 | 6 | ||||||||||
Other retail and small business | 1,616 | 1,342 | 1,325 | 1,487 | 1,169 | 20 | 38 | ||||||||||
Total loan production | $ | 25,513 | 25,663 | 16,648 | 16,779 | 15,836 | (1 | )% | 61 | ||||||||
| (a) | Data prior to fourth quarter 2006 does not include Golden West mortgage production. |
Loan production decreased $150 million driven by declines in real estate secured somewhat offset by growth in small business and student. Loan production increased $9.4 billion from 1Q06 on the addition of Golden West and strength in small business somewhat offset by declines in student loans and home equity.
WACHOVIA.COM
WACHOVIA.COM
| 2007 | 2006 | 1Q07 vs | 1Q07 vs | |||||||||||||
(In thousands) | First Quarter | Fourth Quarter | Third Quarter | Second Quarter | First Quarter | |||||||||||
Online product and service enrollments | ||||||||||||||||
Retail | 11,517 | 11,574 | 10,962 | 10,320 | 10,210 | — | % | 13 | ||||||||
Wholesale | 723 | 732 | 686 | 649 | 591 | (1 | ) | 22 | ||||||||
Total online product and service enrollments | 12,240 | 12,306 | 11,648 | 10,969 | 10,801 | (1 | ) | 13 | ||||||||
Enrollments per quarter | 796 | 691 | 725 | 669 | 697 | 15 | 14 | |||||||||
Dollar value of transactions(In billions) | $ | 47.3 | 38.6 | 34.3 | 33.4 | 30.8 | 23 | % | 54 | |||||||
WACHOVIACONTACTCENTER
Wachovia Contact Center Metrics
| 2007 | 2006 | 1Q07 vs | 1Q07 vs | |||||||||||||
(In millions) | First Quarter | Fourth Quarter | Third Quarter | Second Quarter | First Quarter | |||||||||||
Customer calls to | ||||||||||||||||
Person | 10.7 | 11.5 | 11.4 | 11.8 | 11.5 | (7 | )% | (7 | ) | |||||||
Voice response unit | 48.1 | 45.9 | 46.4 | 47.9 | 51.9 | 5 | (7 | ) | ||||||||
Total calls | 58.8 | 57.4 | 57.8 | 59.7 | 63.4 | 2 | (7 | ) | ||||||||
% of calls handled in 30 seconds or less(Target 70%) | 53 | 62 | 63 | 71 | 60 | — | % | — | ||||||||
Page-26
Table of Contents
Wachovia 1Q07 Quarterly Earnings Report
World Savings March 2007 Monthly Financial Highlights
Note: World Savings quarterly results are reflected in the Retail and Small Business results presented on page 25.
World Saving Financial Highlights(1)
| 2007 | 2006 | |||||||||||||||
(Dollars in millions) | MAR | FEB | JAN | DEC | NOV | OCT | SEP | |||||||||
Loans and MBS | $ | 121,567 | 122,134 | 122,503 | 122,988 | 123,754 | 124,550 | 124,808 | ||||||||
Adjustable Rate Mortgages and MBS | 112,701 | 115,376 | 117,345 | 119,140 | 120,502 | 121,458 | 121,754 | |||||||||
Deferred interest included in Loans and MBS | 1,949 | 1,825 | 1,713 | 1,571 | 1,448 | 1,333 | 1,209 | |||||||||
Loans Originated - Month | $ | 3,607 | 2,996 | 2,742 | 2,982 | 3,224 | 3,585 | 3,617 | ||||||||
Percentage Pick-A-Pay Loans and Other ARMs - Month | 99 | % | 99 | 100 | 99 | 99 | 99 | 99 | ||||||||
Percentage Refinances - Month | 90 | % | 91 | 90 | 88 | 89 | 87 | 87 | ||||||||
Loans Originated - YTD | $ | 9,345 | 5,738 | 2,742 | 44,730 | 41,748 | 38,524 | 34,939 | ||||||||
Percentage Pick-A-Pay Loans and Other ARMs - YTD | 99 | % | 100 | 100 | 99 | 99 | 99 | 99 | ||||||||
Percentage Refinances - YTD | 90 | % | 90 | 90 | 85 | 85 | 85 | 85 | ||||||||
Total Deposits | $ | 72,444 | 69,993 | 69,388 | 69,212 | 68,498 | 68,020 | 66,640 | ||||||||
Total Deposit Net Activity - Month | 2,451 | 605 | 176 | 714 | 478 | 1,380 | 1,215 | |||||||||
Total Deposit Net Activity - YTD | $ | 3,232 | 781 | 176 | 9,054 | 8,340 | 7,862 | 6,482 | ||||||||
Yield on Loan Portfolio | 7.71 | % | 7.74 | 7.74 | 7.72 | 7.68 | 7.59 | 7.46 | ||||||||
Cost of Savings | 4.77 | 4.75 | 4.73 | 4.69 | 4.65 | 4.60 | 4.49 | |||||||||
3-Month LIBOR | 5.35 | % | 5.35 | 5.36 | 5.36 | 5.37 | 5.37 | 5.37 | ||||||||
Loans Sold | $ | — | — | 1 | 22 | 118 | 130 | 95 | ||||||||
Loan and MBS Repayments and Payoffs - Month | $ | 4,266 | 3,540 | 3,563 | 3,873 | 3,846 | 3,751 | 3,349 | ||||||||
As a % of Prior Month Loan Balances ( Annualized) | 42.27 | % | 34.98 | 35.07 | 37.88 | 37.57 | 36.34 | 32.51 | ||||||||
Equivalent Constant Prepayment Rate | 34.97 | 29.88 | 29.95 | 31.95 | 31.73 | 30.86 | 28.08 | |||||||||
Nonperforming Assets and Trouble Debt | ||||||||||||||||
Restructured as 8% of Total Loans & MBS(2) | 0.74 | 0.69 | 0.61 | 0.56 | 0.53 | 0.48 | 0.46 | |||||||||
ARM Index Values: | ||||||||||||||||
COSI - Golden West Cost of Savings Index | 4.750 | 4.730 | 4.690 | 4.650 | 4.600 | 4.490 | 4.340 | |||||||||
CODI - Certificate of Deposit Index | 5.266 | 5.217 | 5.153 | 5.081 | 4.997 | 4.897 | 4.774 | |||||||||
COFI - Eleventh District Cost of Fund Index | 4.392 | % | 4.396 | 4.358 | 4.346 | 4.382 | 4.277 | 4.177 | ||||||||
| (1) | Excludes the effect of purchase accounting adjustments |
| (2) | Nonperforming assets and troubled debt previously reported as a % Total Assets have been restated for prior periods |
Loans and MBS were $121.6 billion compared with $122.1 billion at the end of February reflecting the continued effects of the inverted yield curve.
Loan originations of $3.6 billion increased 20%, including $2.0 billion of Fixed Rate Pick-A-Payment loan product.
Deferred interest was $1.9 billion up from $1.8 billion at the end of February.
Deposits increased $2.5 billion driven by strength in CDs.
Portfolio margin remained relatively stable as the loan portfolio yield decreased 3 bps to 7.71%.
Wholesale borrowings funded $49.4 billion of the loan portfolio, the cost of which remained relatively stable as 3-month LIBOR of 5.35% remained unchanged from the end of February. The Cost of Savings rate of 4.77% funded $72.4 billion of the loan portfolio, which rose 2 bps from the end of February.
Nonperforming assets, including loans classified as nonaccrual by 90 days past due, of $899 million rose 5 bps to 74 bps of total loans and mortgage-backed securities. The average loan-to-collateral value for nonperforming loans was 74%.
Wachovia COSI Index to be launched in mid-April, representing the weighted average interest rate paid on Wachovia Corporation’s (including World Savings) retail Certificates of Deposit. The revised index is expected to perform very similarly to the current index.
Golden West merger integration on track. Originated $480 million of World Savings loans through Wachovia network in 1Q07 vs. $117 million in 4Q06. Originated $245 million of Wachovia loans through the World Savings network in 1Q07 vs. $209 million in 4Q06. World Savings branches began selling Free Checking in February, and net new checking account sales totaled 38,000 during the quarter.
(Table continues on next page)
Page-27
Table of Contents
Wachovia 1Q07 Quarterly Earnings Report
World Savings March 2007 Monthly Financial Highlights (Continued)
World Savings Financial Highlights(1)
| 2006 | |||||||||||||||
(Dollars in millions) | AUG | JUL | JUN | MAY | APR | MAR | |||||||||
Loans and MBS | $ | 124,563 | 124,054 | 123,518 | 123,381 | 122,835 | 122,300 | ||||||||
Adjustable Rate Mortgage and MBS | 121,477 | 120,977 | 120,488 | 120,304 | 119,844 | 119,240 | |||||||||
Deferred interest included in Loans and MBS | 1,107 | 1,013 | 915 | 832 | 738 | 666 | |||||||||
Loans Originated - Month | $ | 4,363 | 3,702 | 3,907 | 3,968 | 3,816 | 4,472 | ||||||||
Percentage Pick-A-Pay Loans and Other ARMs - Month | 99 | % | 99 | 99 | 99 | 99 | 99 | ||||||||
Percentage Refinances - Month | 86 | % | 85 | 84 | 83 | 85 | 85 | ||||||||
Loans Originated - YTD | $ | 31,322 | 26,959 | 23,257 | 19,350 | 15,382 | 11,566 | ||||||||
Percentage Pick-A-Pay Loans and Other ARMs - YTD | 99 | % | 99 | 99 | 99 | 99 | 99 | ||||||||
Percentage Refinances - YTD | 84 | % | 84 | 84 | 84 | 85 | 84 | ||||||||
Total Deposits | $ | 65,425 | 63,114 | 62,234 | 61,650 | 61,063 | 61,583 | ||||||||
Total Deposit Net Activity - Month | 2,311 | 880 | 584 | 587 | (520 | ) | 527 | ||||||||
Total Deposit Net Activity - YTD | $ | 5,267 | 2,956 | 2,076 | 1,492 | 905 | 1,425 | ||||||||
Yield on Loan Portfolio | 7.30 | % | 717 | 7.04 | 6.93 | 6.82 | 6.71 | ||||||||
Cost of Savings | 4.34 | 4.11 | 3.94 | 3.79 | 3.66 | 3.56 | |||||||||
3 Month LIBOR | 5.40 | % | 5.47 | 5.48 | 5.24 | 5.13 | 5.00 | ||||||||
Loans Sold | $ | 121 | 98 | 118 | 118 | 94 | 77 | ||||||||
Loan and MBS Repayments and Payoffs - Month | $ | 3,913 | 3,285 | 3,767 | 3,553 | 3,224 | 3,683 | ||||||||
As a % of Prior Month Loan Balances (Annualized) | 38.13 | % | 32.15 | 36.91 | 34.96 | 31.87 | 36.63 | ||||||||
Equivalent Constant Prepayment Rate | 32.12 | 27.81 | 31.26 | 29.87 | 27.60 | 31.07 | |||||||||
Nonperforming Assets and Troubled Debt | |||||||||||||||
Restructured as a % of Total Loans & MBS(2) | 0.43 | 0.42 | 0.39 | 0.36 | 0.37 | 0.36 | |||||||||
ARM Index Values: | |||||||||||||||
COSI - Golden West Cost of Savings Index | 4.110 | 3.940 | 3.790 | 3.660 | 3.560 | 3.460 | |||||||||
CODI - Certificate of Deposit Index | 4.640 | 4.483 | 4.318 | 4.158 | 3.996 | 3.837 | |||||||||
COFI - Eleventh District Cost of Funds Index | 4.090 | % | 3.884 | 3.759 | 3.624 | 3.604 | 3.347 | ||||||||
| (1) | Excludes the effect of purchase accounting adjustments. |
| (2) | Nonperforming assets and troubled debt previously reported as a % of Total Assets have been restated for prior periods. |
Page-28
Table of Contents
Wachovia 1Q07 Quarterly Earnings Report
COMMERCIAL
This sub-segment includes Business Banking, Middle-Market Commercial, Commercial Real Estate and Government Banking.
Commercial
Performance Summary
| 2007 | 2006 | 1Q07 vs | 1Q07 vs | ||||||||||||||
(In millions) | First Quarter | Fourth Quarter | Third Quarter | Second Quarter | First Quarter | ||||||||||||
Income statement data | |||||||||||||||||
Net interest income(Tax-equivalent) | $ | 1,092 | 1,117 | 1,096 | 1,071 | 873 | (2 | )% | 25 | ||||||||
Fee and other income | 128 | 126 | 121 | 117 | 114 | 2 | 12 | ||||||||||
Intersegment revenue | 36 | 47 | 36 | 35 | 30 | (23 | ) | 20 | |||||||||
Total revenue(Tax-equivalent) | 1,256 | 1,290 | 1,253 | 1,223 | 1,017 | (3 | ) | 24 | |||||||||
Provision for credit losses | 102 | 90 | 75 | 57 | 22 | 13 | — | ||||||||||
Noninterest expense | 412 | 401 | 376 | 396 | 357 | 3 | 15 | ||||||||||
Income taxes(Tax-equivalent) | 271 | 290 | 293 | 282 | 232 | (7 | ) | 17 | |||||||||
Segment earnings | $ | 471 | 509 | 509 | 488 | 406 | (7 | )% | 16 | ||||||||
Performance and other data | |||||||||||||||||
Economic profit | $ | 303 | 337 | 334 | 307 | 251 | (10 | )% | 21 | ||||||||
Risk adjusted return on capital (RAROC) | 34.10 | % | 36.67 | 37.12 | 36.06 | 36.47 | — | — | |||||||||
Economic capital, average | $ | 5,311 | 5,203 | 5,067 | 4,912 | 4,003 | 2 | 33 | |||||||||
Cash overhead efficiency ratio(Tax-equivalent) | 32.77 | % | 31.02 | 29.97 | 32.42 | 35.10 | — | — | |||||||||
Average loans, net | $ | 108,424 | 105,756 | 103,551 | 100,969 | 88,669 | 3 | 22 | |||||||||
Average core deposits | $ | 48,101 | 48,875 | 47,326 | 46,977 | 47,805 | (2 | )% | 1 | ||||||||
Net interest income decreased 2% reflecting growth in lower-spread loans and deposit declines; up 25% from 1Q06 driven by the effect of Westcorp. Loans increased 3%, or $2.7 billion, on growth in business banking and middle-market lending and commercial real estate as well as increases in auto loans. Loans grew 22% from 1Q06 driven by growth in auto loans including the addition of Westcorp, as well as strength in middle-markets and business banking and commercial real estate. Core deposits decreased 2% from seasonally stronger 4Q06 levels which included higher government deposits. Core deposits rose 1% vs. 1Q06 as the addition of Westcorp more than offset declines relating to commercial customers moving deposits to off-balance sheet sweep products. Off-balance sheet sweep products plus core deposits increased 8% from 1Q06.
Fee and other income increased 2% driven by growth in service charges reflecting some seasonality. Fee and other income increased 12% from 1Q06 driven by a 7% increase in commercial service charges resulting from higher volumes, and higher insurance commissions.
Provision expense increased $12 million driven by higher increased losses in commercial.
Noninterest expense increased 3% as $19 million higher employee stock compensation expense more than offset decreases in virtually all other categories reflecting ongoing cost controls. Noninterest expense rose 15% vs. 1Q06 on higher personnel expense driven by the addition of Westcorp, the hiring of additional business bankers, as well as higher volume-based sundry expense.
Page-29
Table of Contents
Wachovia 1Q07 Quarterly Earnings Report
This segment includes Private Banking, Personal Trust, Investment Advisory Services, Charitable Services, Financial Planning and Insurance Brokerage (property and casualty, and high net worth life).
Wealth Management
Performance Summary
| 2007 | 2006 | 1Q07 vs | 1Q07 vs | |||||||||||||||
(Dollars in millions) | First Quarter | Fourth Quarter | Third Quarter | Second Quarter | First Quarter | |||||||||||||
Income statement data | ||||||||||||||||||
Net interest income(Tax-equivalent) | $ | 146 | 149 | 148 | 149 | 150 | (2 | )% | (3 | ) | ||||||||
Fee and other income | 195 | 200 | 197 | 194 | 188 | (3 | ) | 4 | ||||||||||
Intersegment revenue | 1 | 3 | 1 | 1 | 1 | (67 | ) | — | ||||||||||
Total revenue(Tax-equivalent) | 342 | 352 | 346 | 344 | 339 | (3 | ) | 1 | ||||||||||
Provision for credit losses | — | — | — | 2 | — | — | — | |||||||||||
Noninterest expense | 241 | 236 | 235 | 249 | 248 | 2 | (3 | ) | ||||||||||
Income taxes(Tax-equivalent) | 36 | 43 | 41 | 33 | 34 | (16 | ) | 6 | ||||||||||
Segment earnings | $ | 65 | 73 | 70 | 60 | 57 | (11 | )% | 14 | |||||||||
Performance and other data | ||||||||||||||||||
Economic profit | $ | 46 | 53 | 52 | 41 | 39 | (13 | )% | 18 | |||||||||
Risk adjusted return on capital (RAROC) | 43.63 | % | 47.58 | 46.77 | 40.61 | 39.34 | — | — | ||||||||||
Economic capital, average | $ | 566 | 574 | 568 | 563 | 556 | (1 | ) | 2 | |||||||||
Cash overhead efficiency ratio(Tax-equivalent) | 70.22 | % | 67.38 | 67.85 | 72.30 | 73.25 | — | — | ||||||||||
Lending commitments | $ | 6,686 | 6,504 | 6,481 | 6,285 | 6,229 | 3 | 7 | ||||||||||
Average loans, net | 17,180 | 16,794 | 16,469 | 16,016 | 15,603 | 2 | 10 | |||||||||||
Average core deposits | $ | 14,037 | 14,208 | 13,775 | 14,265 | 14,609 | (1 | ) | (4 | ) | ||||||||
FTE employees | 4,393 | 4,474 | 4,530 | 4,727 | 4,758 | (2 | )% | (8 | ) | |||||||||
Net interest income of $146 million decreased 2% as loan growth was offset by lower core deposits and tightening spreads. Net interest income was down 3% from 1Q06, due to lower deposits and tightening spreads which offset loan growth of 10%.
Fee and other income declined $5 million, or 3%, from strong 4Q06 levels which included seasonally higher insurance commissions and gains from the sale of non-strategic insurance accounts, partly offset by higher fiduciary and asset management fees. Fees grew 4% from 1Q06 driven by higher fiduciary and asset management fees, offset by lower commissions partially due to the 4Q06 non-strategic account sales.
Noninterest expense increased 2% driven by higher employee stock compensation expense. The 3% decline from 1Q06 was driven by lower salaries, benefits and incentives.
Wealth Management Key Metrics
| 2007 | 2006 | 1Q07 vs | 1Q07 vs | ||||||||||||||
(Dollars in millions) | First Quarter | Fourth Quarter | Third Quarter | Second Quarter | First Quarter | ||||||||||||
Investment assets under administration | $ | 135,562 | 143,879 | 138,915 | 135,817 | 134,293 | (6 | )% | 1 | ||||||||
Assets under management (a) | $ | 76,214 | 75,297 | 72,397 | 71,184 | 71,120 | 1 | 7 | |||||||||
Wealth Management advisors | 940 | 951 | 970 | 996 | 973 | (1 | )% | (3 | ) | ||||||||
| (a) | These assets are managed by and reported in Capital Management. |
Total assets under management grew 1%, and were up 7% vs. 1Q06, on market gains.
Page-30
Table of Contents
Wachovia 1Q07 Quarterly Earnings Report
This segment includes Corporate Lending, Investment Banking, and Treasury and International Trade Finance.
(See Table on Page 11)
CORPORATE LENDING
This sub-segment includes Large Corporate Lending and Leasing.
Corporate Lending
Performance Summary
| 2007 | 2006 | 1Q07 vs | 1Q07 vs | ||||||||||||||||||
(In millions) | First Quarter | Fourth Quarter | Third Quarter | Second Quarter | First Quarter | ||||||||||||||||
Income statement data | |||||||||||||||||||||
Net interest income(Tax-equivalent) | $ | 154 | 151 | 148 | 164 | 147 | 2 | % | 5 | ||||||||||||
Fee and other income | 122 | 124 | 113 | 114 | 161 | (2 | ) | (24 | ) | ||||||||||||
Intersegment revenue | 6 | 6 | 8 | 7 | 7 | — | (14 | ) | |||||||||||||
Total revenue(Tax-equivalent) | 282 | 281 | 269 | 285 | 315 | — | (10 | ) | |||||||||||||
Provision for credit losses | — | 1 | (5 | ) | (33 | ) | 1 | — | — | ||||||||||||
Noninterest expense | 114 | 113 | 93 | 104 | 102 | 1 | 12 | ||||||||||||||
Income taxes(Tax-equivalent) | 61 | 60 | 67 | 78 | 77 | 2 | (21 | ) | |||||||||||||
Segment earnings | $ | 107 | 107 | 114 | 136 | 135 | — | % | (21 | ) | |||||||||||
Performance and other data | |||||||||||||||||||||
Economic profit | $ | (8 | ) | (15 | ) | (8 | ) | (1 | ) | 30 | — | % | — | ||||||||
Risk adjusted return on capital (RAROC) | 10.05 | % | 9.38 | 10.08 | 10.91 | 14.82 | — | — | |||||||||||||
Economic capital, average | $ | 3,508 | 3,641 | 3,572 | 3,500 | 3,169 | (4 | ) | 11 | ||||||||||||
Cash overhead efficiency ratio(Tax-equivalent) | 40.39 | % | 40.15 | 34.71 | 36.29 | 32.37 | — | — | |||||||||||||
Average loans, net | $ | 25,198 | 25,620 | 25,921 | 25,305 | 24,723 | (2 | ) | 2 | ||||||||||||
Average core deposits | $ | 154 | 170 | 150 | 139 | 158 | (9 | )% | (3 | ) | |||||||||||
Corporate Lending
Loans Outstanding
| 2007 | 2006 | 1Q07 vs | 1Q07 vs | |||||||||||||
(In millions) | First Quarter | Fourth Quarter | Third Quarter | Second Quarter | First Quarter | |||||||||||
Large corporate loans | $ | 16,535 | 16,802 | 17,214 | 16,555 | 16,187 | (2 | )% | 2 | |||||||
Capital finance | 8,663 | 8,818 | 8,707 | 8,750 | 8,536 | (2 | ) | 1 | ||||||||
Total loans outstanding | $ | 25,198 | 25,620 | 25,921 | 25,305 | 24,723 | (2 | )% | 2 | |||||||
Net interest income of $154 million grew 2% due to a $6 million interest recovery on a large corporate loan, which was somewhat offset by a 2% decline in average loans as well as tightening spreads. Net interest income increased 5% from 1Q06, driven by the $6 million interest recovery as well as 2% growth in average loans.
Fee and other income of $122 million decreased 2% as lower leasing fees were partially offset by improved results in credit default swaps held as economic hedges. Fee and other income was down 24% from 1Q06 results which included $25 million in gains ($15 million in securities gains, $10 million in loan sale gains) and higher domestic leasing income.
Noninterest expense increased 1% primarily driven by $4 million in employee stock compensation expense. Noninterest expense increased 12% from 1Q06 due to higher sundry and equipment expense.
Page-31
Table of Contents
Wachovia 1Q07 Quarterly Earnings Report
INVESTMENT BANKING
This sub-segment includes Equity Capital Markets, M&A, Fixed Income Division, Loan Syndications and Principal Investing.
Investment Banking
Performance Summary
| 2007 | 2006 | 1Q07 vs | 1Q07 vs | |||||||||||||||||||
(In millions) | First Quarter | Fourth Quarter | Third Quarter | Second Quarter | First Quarter | |||||||||||||||||
Income statement data | ||||||||||||||||||||||
Net interest income(Tax-equivalent) | $ | 210 | 259 | 205 | 207 | 226 | (19 | )% | (7 | ) | ||||||||||||
Fee and other income | 773 | 1,039 | 681 | 903 | 890 | (26 | ) | (13 | ) | |||||||||||||
Intersegment revenue | (15 | ) | (29 | ) | (18 | ) | (17 | ) | (14 | ) | 48 | 7 | ||||||||||
Total revenue(Tax-equivalent) | 968 | 1,269 | 868 | 1,093 | 1,102 | (24 | ) | (12 | ) | |||||||||||||
Provision for credit losses | — | 4 | — | — | — | — | — | |||||||||||||||
Noninterest expense | 611 | 712 | 541 | 605 | 619 | (14 | ) | (1 | ) | |||||||||||||
Income taxes(Tax-equivalent) | 130 | 202 | 119 | 177 | 178 | (36 | ) | (27 | ) | |||||||||||||
Segment earnings | $ | 227 | 351 | 208 | 311 | 305 | (35 | )% | (26 | ) | ||||||||||||
Performance and other data | ||||||||||||||||||||||
Economic profit | $ | 135 | 263 | 125 | 234 | 235 | (49 | )% | (43 | ) | ||||||||||||
Risk adjusted return on capital (RAROC) | 28.30 | % | 45.17 | 29.30 | 47.25 | 49.75 | — | — | ||||||||||||||
Economic capital, average | $ | 3,166 | 3,051 | 2,724 | 2,588 | 2,459 | 4 | 29 | ||||||||||||||
Cash overhead efficiency ratio(Tax-equivalent) | 63.08 | % | 56.10 | 62.39 | 55.33 | 56.22 | — | — | ||||||||||||||
Average loans, net | $ | 7,482 | 7,386 | 6,091 | 5,155 | 5,033 | 1 | 49 | ||||||||||||||
Average core deposits | $ | 9,196 | 8,978 | 8,498 | 9,237 | 8,959 | 2 | % | 3 | |||||||||||||
| Investment Banking | ||||||||||||||||||||||
| 2007 | 2006 | 1Q07 vs | 1Q07 vs | |||||||||||||||||||
(In millions) | First Quarter | Fourth Quarter | Third Quarter | Second Quarter | First Quarter | |||||||||||||||||
Total revenue | ||||||||||||||||||||||
Fixed income global rate products | $ | 123 | 120 | 119 | 188 | 179 | 3 | % | (31 | ) | ||||||||||||
Fixed income credit products(Excluding loan portfolio) | 206 | 169 | 149 | 140 | 188 | 22 | 10 | |||||||||||||||
Fixed income structured products/other | 454 | 656 | 421 | 497 | 414 | (31 | ) | 10 | ||||||||||||||
Total fixed income | 783 | 945 | 689 | 825 | 781 | (17 | ) | — | ||||||||||||||
Principal investing | 43 | 141 | 93 | 180 | 124 | (70 | ) | (65 | ) | |||||||||||||
Total equities/M&A/other | 142 | 183 | 86 | 88 | 197 | (22 | ) | (28 | ) | |||||||||||||
Total revenue | 968 | 1,269 | 868 | 1,093 | 1,102 | (24 | ) | (12 | ) | |||||||||||||
Trading-related revenue | ||||||||||||||||||||||
Net interest income(Tax-equivalent) | 52 | 84 | 28 | 68 | 60 | (38 | ) | (13 | ) | |||||||||||||
Trading account profits (losses) | 115 | 32 | 122 | 151 | 204 | — | (44 | ) | ||||||||||||||
Other fee income | 51 | 66 | 75 | 62 | 97 | (23 | ) | (47 | ) | |||||||||||||
Total net trading-related revenue(Tax-equivalent) | 218 | 182 | 225 | 281 | 361 | 20 | (40 | ) | ||||||||||||||
Principal investing balances | ||||||||||||||||||||||
Direct investments | 1,029 | 1,029 | 931 | 912 | 843 | — | 22 | |||||||||||||||
Fund investments | 805 | 823 | 852 | 888 | 757 | (2 | ) | 6 | ||||||||||||||
Total principal investing balances | $ | 1,834 | 1,852 | 1,783 | 1,800 | 1,600 | (1 | )% | 15 | |||||||||||||
Net interest income decreased $49 million, or 19%, primarily related to lower trading-related net interest income in global rate products and structured products. Net interest income declined $16 million, or 7%, from 1Q06 on lower-spread assets in the commercial mortgage business and lower trading-related net interest income in most products.
Fee and other income of $773 million decreased 26% from record 4Q06 results. The $266 million decline in fees was driven by $180 million lower results in real estate capital markets, a $93 million decline in principal investing, $56 million lower results in other structured products and a $31 million decline in M&A advisory fees. These results were only partially offset by higher trading profits as well as strong high yield, high grade, and loan syndications results.
The following provides additional detail on the income statement components of the preceding business line discussion.
Other income was down $202 million driven by a $133 million decline relating to commercial mortgage securitization activity. Underlying strength in commercial mortgage securitization deal activity was muted by the 4Q06 effect of asymmetrical hedges on the warehouse. Affordable housing results declined $40 million (resulting tax benefit eliminated in Parent).Principal investing revenues decreased 70% from robust 4Q06 results on both lower direct investments as well as lower fund distributions.Advisory and underwriting revenue declined $46 million from record 4Q06 results primarily due to lower structured products and M&A, somewhat offset by continued strong results in high yield originations, high grade and loan syndications.Trading account profits of $115 million were up $83 million driven by increased results in credit products and structured derivatives as well as the trading-related revenue mix change in global rate products, somewhat offset by higher trading losses in structured products. Fee and other income decreased $117 million, or 13%, from 1Q06 driven by lower principal investing, equities and global rate products results. Results in 1Q06 included $43 million related to the Wachovia WITS issuance eliminated in the Parent.
Page-32
Table of Contents
Wachovia 1Q07 Quarterly Earnings Report
Investment Banking total trading-related revenue of $218 million was up $36 million on strength in credit products.
Noninterest expense decreased 14% on lower revenue-based incentives, partially offset by $10 million in employee stock compensation expense.
Page-33
Table of Contents
Wachovia 1Q07 Quarterly Earnings Report
TREASURYAND INTERNATIONAL TRADE FINANCE
This sub-segment includes Treasury Services, International Correspondent Banking and Trade Finance.
Treasury and International Trade Finance
Performance Summary
| 2007 | 2006 | 1Q07 vs | 1Q07 vs | |||||||||||||||||||
(In millions) | First Quarter | Fourth Quarter | Third Quarter | Second Quarter | First Quarter | |||||||||||||||||
Income statement data | ||||||||||||||||||||||
Net interest income(Tax-equivalent) | $ | 89 | 102 | 97 | 97 | 90 | (13 | )% | (1 | ) | ||||||||||||
Fee and other income | 193 | 192 | 198 | 200 | 191 | 1 | 1 | |||||||||||||||
Intersegment revenue | (33 | ) | (33 | ) | (33 | ) | (32 | ) | (30 | ) | — | 10 | ||||||||||
Total revenue(Tax-equivalent) | 249 | 261 | 262 | 265 | 251 | (5 | ) | (1 | ) | |||||||||||||
Provision for credit losses | — | — | — | — | — | — | — | |||||||||||||||
Noninterest expense | 178 | 174 | 163 | 177 | 172 | 2 | 3 | |||||||||||||||
Income taxes(Tax-equivalent) | 26 | 32 | 36 | 33 | 28 | (19 | ) | (7 | ) | |||||||||||||
Segment earnings | $ | 45 | 55 | 63 | 55 | 51 | (18 | )% | (12 | ) | ||||||||||||
Performance and other data | ||||||||||||||||||||||
Economic profit | $ | 32 | 42 | 50 | 42 | 36 | (24 | )% | (11 | ) | ||||||||||||
Risk adjusted return on capital (RAROC) | 42.52 | % | 49.74 | 58.91 | 52.01 | 44.76 | — | — | ||||||||||||||
Economic capital, average | $ | 414 | 425 | 411 | 411 | 438 | (3 | ) | (5 | ) | ||||||||||||
Cash overhead efficiency ratio(Tax-equivalent) | 71.53 | % | 66.74 | 62.11 | 66.99 | 68.38 | — | — | ||||||||||||||
Average loans, net | $ | 8,266 | 8,063 | 7,789 | 7,273 | 7,115 | 3 | 16 | ||||||||||||||
Average core deposits | $ | 19,598 | 17,845 | 17,575 | 16,970 | 16,451 | 10 | % | 19 | |||||||||||||
Net interest income of $89 million decreased 13% as a 10% increase in average core deposits, primarily lower-spread money market deposits, was more than offset by tightening spreads and increasing deposit costs. Net interest income was down 1% from 1Q06, as the shift to lower-spread money market deposits offset 16% growth in average loans and 19% growth in average core deposits.
Fee and other income of $193 million grew 1% on higher treasury services fees. Fee and other income was also up 1% from 1Q06 driven by increased international trade fees.
Noninterest expense increased 2% on higher salaries and benefits expense including $6 million in employee stock compensation expense, partially offset by lower travel expenses. Noninterest expense increased 3% from 1Q06 due to higher sundry expense, which was partially offset by lower professional and consulting fees.
The Treasury Services business is managed in the Corporate and Investment Bank. Product revenues and earnings are also realized in other business lines within the company, including the General Bank and Wealth Management. Total treasury services product revenues for the company were $661 million in 1Q07 vs. $681 million in 4Q06 and $649 million in 1Q06.
Page-34
Table of Contents
Wachovia 1Q07 Quarterly Earnings Report
This segment includes Retail Brokerage Services and Asset Management.
(See Table on Page 12)
RETAIL BROKERAGE SERVICES
This sub-segment consists of the retail brokerage, and annuity and reinsurance businesses.
Retail Brokerage Services
Performance Summary
| 2007 | 2006 | 1Q07 vs | 1Q07 vs | |||||||||||||||||||
(In millions) | First Quarter | Fourth Quarter | Third Quarter | Second Quarter | First Quarter | |||||||||||||||||
Income statement data | ||||||||||||||||||||||
Net interest income(Tax-equivalent) | $ | 262 | 257 | 245 | 257 | 248 | 2 | % | 6 | |||||||||||||
Fee and other income | 1,176 | 1,096 | 991 | 997 | 1,016 | 7 | 16 | |||||||||||||||
Intersegment revenue | (8 | ) | (8 | ) | (7 | ) | (8 | ) | (8 | ) | — | — | ||||||||||
Total revenue(Tax-equivalent) | 1,430 | 1,345 | 1,229 | 1,246 | 1,256 | 6 | 14 | |||||||||||||||
Provision for credit losses | — | — | — | — | — | — | — | |||||||||||||||
Noninterest expense | 1,010 | 996 | 904 | 935 | 962 | 1 | 5 | |||||||||||||||
Income taxes(Tax-equivalent) | 153 | 127 | 120 | 113 | 107 | 20 | 43 | |||||||||||||||
Segment earnings | $ | 267 | 222 | 205 | 198 | 187 | 20 | % | 43 | |||||||||||||
Performance and other data | ||||||||||||||||||||||
Economic profit | $ | 230 | 187 | 172 | 164 | 153 | 23 | % | 50 | |||||||||||||
Risk adjusted return on capital (RAROC) | 80.81 | % | 68.62 | 68.08 | 64.71 | 60.58 | — | — | ||||||||||||||
Economic capital, average | $ | 1,339 | 1,280 | 1,198 | 1,224 | 1,252 | 5 | 7 | ||||||||||||||
Cash overhead efficiency ratio(Tax-equivalent) | 70.60 | % | 74.07 | 73.64 | 75.03 | 76.54 | — | — | ||||||||||||||
Average loans, net | $ | 1,521 | 1,399 | 1,210 | 1,026 | 828 | 9 | 84 | ||||||||||||||
Average core deposits | $ | 31,405 | 29,849 | 29,866 | 31,582 | 33,325 | 5 | % | (6 | ) | ||||||||||||
Net interest income of $262 million increased 2% driven by higher deposits. Net interest income was up 6% from 1Q06, as wider deposit spreads and the impact of higher transaction activity more than offset a 6% decrease in deposits.
Fee and other income of $1.2 billion grew 7% due to higher brokerage transaction activity and equity syndicate distribution fees as well as strong managed account fees, partially offset by lower valuations on investments used to fund deferred compensation plans. Fee income increased 16% from 1Q06 driven by strength in managed account fees, higher brokerage transaction activity and equity syndicate distribution fees, and growth in other asset-based fees, partially offset by lower valuations on investments used to fund deferred compensation plans.
Noninterest expense increased 1% driven by higher commission expense and $12 million in employee stock compensation expense, partially offset by lower deferred compensation and other expenses. The 5% increase from 1Q06 was due to higher commissions and the timing of employee stock awards, partially offset by lower deferred compensation and litigation expense.
Retail Brokerage Transaction
The Retail Brokerage Services sub-segment results shown in the above table include 100% of the results of the Wachovia Securities retail brokerage transaction, which is the combination of Wachovia and Prudential Financial’s retail brokerage operations. The entity is a consolidated subsidiary of Wachovia Corporation for GAAP purposes. Wachovia Corporation owns 62% of Wachovia Securities retail brokerage and Prudential Financial, Inc. owns 38%. Prudential Financial’s minority interest is included in minority interest reported in the Parent (see page 37) and in Wachovia Corporation’s consolidated statements of income on a GAAP basis, which differs from our segment reporting as noted on pages 3 and 16. For the three months ended March 31, 2007, Prudential Financial’s pre-tax minority interest on a GAAP basis was $114 million.
The Retail Brokerage Services sub-segment results reported in the above table also include our Insurance Services business, as well as additional corporate allocations that are not included in the Wachovia Securities Financial Holdings results.
Page-35
Table of Contents
Wachovia 1Q07 Quarterly Earnings Report
ASSET MANAGEMENT
This sub-segment consists of the mutual fund business and customized investment advisory services, including retirement services.
Asset Management | 2007 | 2006 | 1Q07 vs | 1Q07 vs | ||||||||||||||
Performance Summary (In millions) | First Quarter | Fourth Quarter | Third Quarter | Second Quarter | First Quarter | |||||||||||||
Income statement data | ||||||||||||||||||
Net interest income(Tax-equivalent) | $ | 3 | 2 | 2 | 2 | 2 | 50 | % | 50 | |||||||||
Fee and other income | 284 | 259 | 242 | 231 | 217 | 10 | 31 | |||||||||||
Intersegment revenue | — | — | — | (1 | ) | — | — | — | ||||||||||
Total revenue(Tax-equivalent) | 287 | 261 | 244 | 232 | 219 | 10 | 31 | |||||||||||
Provision for credit losses | — | — | — | — | — | — | — | |||||||||||
Noninterest expense | 231 | 208 | 197 | 188 | 178 | 11 | 30 | |||||||||||
Income taxes(Tax-equivalent) | 21 | 20 | 17 | 16 | 15 | 5 | 40 | |||||||||||
Segment earnings | $ | 35 | 33 | 30 | 28 | 26 | 6 | % | 35 | |||||||||
Performance and other data | ||||||||||||||||||
Economic profit | $ | 29 | 27 | 24 | 22 | 21 | 7 | % | 38 | |||||||||
Risk adjusted return on capital (RAROC) | 56.85 | % | 58.47 | 56.76 | 54.89 | 53.17 | — | — | ||||||||||
Economic capital, average | $ | 253 | 224 | 212 | 204 | 198 | 13 | 28 | ||||||||||
Cash overhead efficiency ratio(Tax-equivalent) | 80.56 | % | 80.03 | 80.42 | 81.06 | 81.33 | — | — | ||||||||||
Average loans, net | $ | 33 | 20 | 25 | 13 | 28 | 65 | 18 | ||||||||||
Average core deposits | $ | 278 | 251 | 248 | 245 | 258 | 11 | % | 8 | |||||||||
Fee and other income of $284 million grew $25 million, or 10%, driven by the addition of ECM. Fees grew $67 million, or 31%, from 1Q06 due to acquisitions and core growth in assets under management.
Noninterest expense increased 11% primarily due to the addition of ECM, $5 million in employee stock compensation expense, and costs associated with the launch of a new investment fund product. Noninterest expense increased 30% from 1Q06 driven primarily by acquisitions and the previously mentioned costs associated with the launch of a new investment fund.
Total Assets Under Management (AUM)
| 2007 | 2006 | 1Q07 vs | 1Q07 vs | |||||||||||||||||||||||||||||||||
| First Quarter | Fourth Quarter | Third Quarter | Second Quarter | First Quarter | ||||||||||||||||||||||||||||||||
(In billions) | Amount | Mix | Amount | Mix | Amount | Mix | Amount | Mix | Amount | Mix | ||||||||||||||||||||||||||
Equity | $ | 106 | 34 | % | $ | 104 | 37 | % | $ | 96 | 38 | % | $ | 94 | 39 | % | $ | 90 | 37 | % | 3 | % | 18 | |||||||||||||
Fixed income | 144 | 45 | 114 | 41 | 107 | 42 | 101 | 42 | 106 | 44 | 26 | 36 | ||||||||||||||||||||||||
Money market | 65 | 21 | 61 | 22 | 50 | 20 | 45 | 19 | 45 | 19 | 5 | 43 | ||||||||||||||||||||||||
Total assets under management (a) | $ | 315 | 100 | % | $ | 279 | 100 | % | $ | 253 | 100 | % | $ | 240 | 100 | % | $ | 241 | 100 | % | 13 | 30 | ||||||||||||||
Securities lending | 56 | — | 57 | — | 50 | — | 60 | — | 60 | — | (2 | ) | (7 | ) | ||||||||||||||||||||||
Total assets under management and securities lending | $ | 371 | — | $ | 336 | — | $ | 303 | — | $ | 300 | — | $ | 301 | — | 10 | % | 23 | ||||||||||||||||||
(a) Includes $76 billion in assets managed for Wealth Management, which are also reported in that segment. |
| |||||||||||||||||||||||||||||||||||
| Mutual Funds (AUM) | 2007 | 2006 | 1Q07 vs | 1Q07 vs | ||||||||||||||||||||||||||||||||
| First Quarter | Fourth Quarter | Third Quarter | Second Quarter | First Quarter | ||||||||||||||||||||||||||||||||
(In billions) | Amount | Fund Mix | Amount | Fund Mix | Amount | Fund Mix | Amount | Fund Mix | Amount | Fund Mix | ||||||||||||||||||||||||||
Equity | $ | 36 | 33 | % | $ | 36 | 33 | % | $ | 33 | 34 | % | $ | 32 | 34 | % | $ | 34 | 36 | % | — | % | 6 | |||||||||||||
Fixed income | 24 | 22 | 23 | 21 | 22 | 23 | 23 | 25 | 23 | 24 | 4 | 4 | ||||||||||||||||||||||||
Money market | 50 | 45 | 49 | 46 | 41 | 43 | 38 | 41 | 38 | 40 | 2 | 32 | ||||||||||||||||||||||||
Total mutual fund assets | $ | 110 | 100 | % | $ | 108 | 100 | % | $ | 96 | 100 | % | $ | 93 | 100 | % | $ | 95 | 100 | % | 2 | % | 16 | |||||||||||||
Total assets under management were up $36 billion, or 13%, driven by $26.2 billion from ECM, net asset inflows, and modest market appreciation. Growth of 30% from 1Q06 was due to $34.9 billion from acquisitions, the retention of $17.8 billion of assets related to the 4Q05 Corporate and Institutional Trust divestiture (previously held in the Parent), as well as net asset inflows and market appreciation.
Capital Management Eliminations
In addition to the above sub-segments, Capital Management results include eliminations among business units. Certain brokerage commissions earned on mutual fund sales by our brokerage sales force are eliminated and deferred in the consolidation of Capital Management reported results. In 1Q07, brokerage revenue and expense eliminations were a reduction of $2 million and $5 million, respectively.
Page-36
Table of Contents
Wachovia 1Q07 Quarterly Earnings Report
This sub-segment includes the central money book, investment portfolio, some consumer real estate and mortgage assets, minority interest in consolidated subsidiaries, businesses being wound down or divested including the Corporate and Institutional Trust businesses, the cross-border leveraged lease portfolio, other intangible amortization and eliminations.
Parent
Performance Summary
| 2007 | 2006 | 1Q07 vs | 1Q07 vs | |||||||||||||||||||
(Dollars in millions) | First Quarter | Fourth Quarter | Third Quarter | Second Quarter | First Quarter | |||||||||||||||||
Income statement data | ||||||||||||||||||||||
Net interest income(Tax-equivalent) | $ | (72 | ) | (72 | ) | (86 | ) | 19 | 145 | — | % | — | ||||||||||
Fee and other income | 138 | 126 | 154 | 100 | (11 | ) | 10 | — | ||||||||||||||
Intersegment revenue | 1 | 3 | 2 | 2 | 1 | (67 | ) | — | ||||||||||||||
Total revenue(Tax-equivalent) | 67 | 57 | 70 | 121 | 135 | 18 | (50 | ) | ||||||||||||||
Provision for credit losses | 15 | 54 | (9 | ) | (5 | ) | (2 | ) | (72 | ) | — | |||||||||||
Noninterest expense | 168 | 451 | 202 | 247 | 239 | (63 | ) | (30 | ) | |||||||||||||
Minority interest | 136 | 124 | 104 | 89 | 95 | 10 | 43 | |||||||||||||||
Income taxes(Tax-equivalent) | (273 | ) | (347 | ) | (192 | ) | (152 | ) | (114 | ) | (21 | ) | 139 | |||||||||
Segment earnings (loss) | $ | 21 | (225 | ) | (35 | ) | (58 | ) | (83 | ) | — | % | — | |||||||||
Performance and other data | ||||||||||||||||||||||
Economic profit | $ | 35 | (197 | ) | (71 | ) | (80 | ) | (108 | ) | — | % | — | |||||||||
Risk adjusted return on capital (RAROC) | 17.04 | % | (15.74 | ) | 1.71 | (0.31 | ) | (4.92 | ) | — | — | |||||||||||
Economic capital, average | $ | 2,418 | 2,922 | 2,964 | 2,886 | 2,757 | (17 | ) | (12 | ) | ||||||||||||
Cash overhead efficiency ratio(Tax-equivalent) | 78.63 | % | 529.55 | 160.17 | 121.94 | 108.96 | — | — | ||||||||||||||
Lending commitments | $ | 610 | 597 | 472 | 473 | 516 | 2 | 18 | ||||||||||||||
Average loans, net | 28,773 | 29,111 | 27,209 | 28,708 | 29,786 | (1 | ) | (3 | ) | |||||||||||||
Average core deposits | $ | 2,213 | 2,548 | 4,524 | 4,534 | 5,285 | (13 | ) | (58 | ) | ||||||||||||
FTE employees | 25,089 | 24,875 | 23,942 | 24,147 | 24,308 | 1 | % | 3 | ||||||||||||||
Net interest income was flat. Results reflect the liability sensitive nature of our securities portfolio and wholesale funding operations, which serves to hedge our asset sensitive core business activities. Net interest income declined $217 million as the benefits to the Parent of wider funds transfer pricing (see page 16 for description) from 1Q06 was more than offset by maturing hedge-related derivatives, growth in wholesale borrowing, compression of spreads in the funding of investment portfolios and lower securities balances.
Provision for credit losses decreased $39 million and increased $17 million from 1Q06 driven by growth in the auto loan, credit card and commercial loan portfolios.
Fee and other income increased $12 million and was up $149 million from 1Q06. Excluding 4Q06 Adjustments of $115 million, fee and other income was up $127 million on higher trading profits and a $52 million decline in affordable housing tax credit eliminations. (Affordable housing results are recorded in Corporate and Investment Bank fee and other income net of the related tax benefit; this tax benefit is eliminated for consolidated reporting purposes in Parent fee and other income.)
Noninterest expense decreased $283 million driven primarily by $198 million in 4Q06 Adjustments, as well as lower legal costs, and professional and consulting fees.
Page-37
Table of Contents
Wachovia 1Q07 Quarterly Earnings Report
(See Table on Page 13)
Net charge-offs in the loan portfolio of $155 million increased $15 million driven by growth in commercial reflecting lower recoveries. Net charge-offs were up $96 million from 1Q06 driven by increases in the auto portfolio including the effect of the Westcorp merger, higher commercial losses driven by lower recoveries and higher real estate secured losses. As a percentage of average net loans, annualized net charge-offs increased 1 bp to 0.15%. Overall, gross charge-offs of $218 million increased $7 million and represented 0.21% of average loans, and were partially offset by recoveries of $63 million which declined from $71 million in 4Q06.
Provision for credit lossesof $177 million reflects growth in our commercial and auto lending portfolios, as well as a $10 million reserve increase relating to growth in our credit card portfolio.
ALLOWANCEFOR CREDIT LOSSES
Allowance for Credit Losses
| 2007 | 2006 | |||||||||||||||||
| First Quarter | Fourth Quarter | Third Quarter | ||||||||||||||||
| (In millions) | Amount | As a % of loans, net | Amount | As a % of loans, net | Amount | As a % of loans, net | ||||||||||||
Allowance for loan losses | ||||||||||||||||||
Commercial | $ | 1,879 | 1.12 | % | $ | 1,867 | 1.15 | % | $ | 1,830 | 1.15 | % | ||||||
Consumer | 1,354 | 0.53 | 1,333 | 0.52 | 1,084 | 0.82 | ||||||||||||
Unallocated | 145 | — | 160 | — | 90 | — | ||||||||||||
Total | 3,378 | 0.80 | 3,360 | 0.80 | 3,004 | 1.03 | ||||||||||||
Reserve for unfunded lending commitments Commercial | 155 | — | 154 | — | 159 | — | ||||||||||||
Allowance for credit losses | $ | 3,533 | 0.84 | % | $ | 3,514 | 0.84 | % | $ | 3,163 | 1.09 | % | ||||||
Memaranda | ||||||||||||||||||
Total commercial(including reserve for unfunded lending commitments) | $ | 2,034 | 1.22 | % | $ | 2,021 | 1.25 | % | $ | 1,989 | 1.25 | % | ||||||
Allowance for credit losses increased $19 million to $3.5 billion, largely resulting from loan growth. The increase in allowance for credit losses was partially offset by a $15 million reduction of unallocated reserves reflecting diminished uncertainty related to the World Savings portfolio. As a percentage of loans, the allowance for loan losses of 0.80% and the allowance for credit losses of 0.84% were unchanged. The reserve for unfunded lending commitments, which includes unfunded loans and standby letters of credit, was $155 million. The allowance for loan losses to nonperforming loans ratio was 213%, down from 272% in 4Q06 and 452% in 1Q06 reflecting the addition of Golden West’s nonperforming real estate secured loans which have historically exhibited a low loss content.
Page-38
Table of Contents
Wachovia 1Q07 Quarterly Earnings Report
NONPERFORMING LOANS
Nonperforming Loans (a)
| 2007 | 2006 | 1Q07 vs | 1Q07 vs | |||||||||||||||||||
(In millions) | First Quarter | Fourth Quarter | Third Quarter | Second Quarter | First Quarter | |||||||||||||||||
Balance, beginning of period | $ | 1,234 | 578 | 619 | 672 | 620 | 113 | % | 174 | |||||||||||||
Commercial nonaccrual loan activity | ||||||||||||||||||||||
Commercial nonaccrual loans, beginning of period | 319 | 355 | 387 | 426 | 392 | (10 | ) | (19 | ) | |||||||||||||
New nonaccrual loans and advances | 196 | 157 | 129 | 188 | 147 | 25 | 33 | |||||||||||||||
Charge-offs | (40 | ) | (42 | ) | (27 | ) | (35 | ) | (34 | ) | (5 | ) | 18 | |||||||||
Transfers (to) from other real estate owned | — | (1 | ) | (2 | ) | (1 | ) | — | — | — | ||||||||||||
Sales | (1 | ) | (81 | ) | (43 | ) | (32 | ) | (2 | ) | (99 | ) | (50 | ) | ||||||||
Other, principally payments | (54 | ) | (69 | ) | (89 | ) | (159 | ) | (77 | ) | (22 | ) | (30 | ) | ||||||||
Net commercial nonaccrual loan activity | 101 | (36 | ) | (32 | ) | (39 | ) | 34 | — | — | ||||||||||||
Commercial nonaccrual loans, end of period | 420 | 319 | 355 | 387 | 426 | 32 | (1 | ) | ||||||||||||||
Consumer nonaccrual loan activity | ||||||||||||||||||||||
Consumer nonaccrual loans, beginning of period | 915 | 223 | 232 | 246 | 228 | — | — | |||||||||||||||
Balance of acquired entity at purchase date | — | 589 | — | — | — | — | — | |||||||||||||||
New nonaccrual loans, advances and other, net | 249 | 103 | (9 | ) | (14 | ) | 18 | — | — | |||||||||||||
Net consumer nonaccrual loan activity | 249 | 692 | (9 | ) | (14 | ) | 18 | (64 | ) | — | ||||||||||||
Consumer nonaccrual loans, end of period | 1,164 | 915 | 223 | 232 | 246 | 27 | — | |||||||||||||||
Balance, end of period | $ | 1,584 | 1,234 | 578 | 619 | 672 | 28 | % | — | |||||||||||||
| (a) | Nonperforming assets included in loans held for sale at March 31, 2007 and at December 31, September 30, June 30, and March 31, 2006, were $26 million, $16 million, $23 million, $23 million and $24 million, respectively |
Nonperforming loans in the loan portfolio of $1.6 billion increased $350 million driven primarily by consumer real estate secured and commercial and rose $912 million from 1Q06 driven by the addition of Golden West and Westcorp.
New commercial nonaccrual inflows were $196 million, up $39 million. Commercial nonaccruals of $420 million increased 32% from 4Q06 and decreased 1% from 1Q06.
Consumer nonaccruals were $1.2 billion, up $249 million, driven by increases in the well-collateralized World Savings consumer real estate secured portfolio and auto.
Foreclosed properties increased $23 million on increases in consumer real estate secured.
Page-39
Table of Contents
Wachovia 1Q07 Quarterly Earnings Report
Estimated Merger Expenses
In connection with the Golden West merger, which closed on October 1, 2006, we began recording certain merger-related and restructuring expenses in our income statement, as well as preliminary purchase accounting adjustments to record Golden West’s assets and liabilities at their respective fair values as of October 1, 2006, and certain exit costs related to Golden West’s businesses. As of March 31, 2007, net merger-related and restructuring expenses were $42 million, and exit cost purchase accounting adjustments were $116 million.
The following table indicates our progress compared with the estimated merger expenses for the transaction.
Golden West Transaction
One-time Costs
(in millions) | Net Merger- Related and Restructuring | Exit Cost Purchase Accounting Adjustments (a) | Total | ||||
Total estimated expenses | $ | 288 | 192 | 480 | |||
Actual expenses | |||||||
First quarter 2007 | $ | 2 | 75 | 77 | |||
Total 2006 | 40 | 41 | 81 | ||||
Total actual expenses | $ | 42 | 116 | 158 | |||
| (a) | These adjustments represent incremental costs related to combining the two companies and are specifically attributable to Golden West’s contributed business. |
Examples include employee termination costs, employee relocation costs, contract cancellations including leases and closing redundant Golden West acquired facilities.
These adjustments are reflected in goodwill and are not charges against income.
The total one-time costs for this transaction are the sum of total merger-related and restructuring expenses as reported in the followingMerger-Related and Restructuring Expenses table and total pre-tax exit cost purchase accounting adjustments (one-time costs) as detailed in theGoodwill and Other Intangiblestable on the following page.
Page-40
Table of Contents
Wachovia 1Q07 Quarterly Earnings Report
MERGER-RELATED AND RESTRUCTURING EXPENSES
Merger-Related and Restructuring Expenses
(Income Statement impact)
| 2007 | 2006 | |||||||||||||||
(In millions) | First Quarter | Fourth Quarter | Third Quarter | Second Quarter | First Quarter | |||||||||||
Total Golden West merger-related and restructuring expenses | $ | 2 | 37 | 3 | — | — | ||||||||||
Total SouthTrust merger-related and restructuring expenses | (2 | ) | — | — | — | 64 | ||||||||||
Total HomEq merger-related and restructuring expenses | — | (2 | ) | 24 | 19 | — | ||||||||||
Other merger-related and restructuring expenses | 10 | 14 | 11 | 5 | 4 | |||||||||||
Net merger-related and restructuring expenses | 10 | 49 | 38 | 24 | 68 | |||||||||||
Income tax (benefit) | (4 | ) | (20 | ) | (13 | ) | (9 | ) | (22 | ) | ||||||
After-tax net merger-related and restructuring expenses | $ | 6 | 29 | 25 | 15 | 46 | ||||||||||
In 1Q07, we recorded $10 million in net merger-related and restructuring expenses.
GOODWILLAND OTHER INTANGIBLES
Under purchase accounting, the assets and liabilities of Golden West were recorded at fair values as of October 1, 2006, as if they had been purchased in the open market. The purchase accounting adjustments associated with Golden West’s assets and liabilities are preliminary and are subject to further refinement. The premiums and discounts that resulted from the purchase accounting adjustments to financial instruments are accreted/amortized into income/expense over the estimated term of the respective assets and liabilities, similar to the purchase of a bond at a premium or discount. This results in a market yield in the income statement for those assets and liabilities. Assuming a stable market environment from the date of purchase, we would expect that as these assets and liabilities mature, they could generally be replaced with instruments of similar yields.
In 1Q07, we recorded $48 million in net after-tax exit costs principally comprising severance and transaction-related costs bringing total net after-tax exit costs to $82 million at March 31, 2007. The after-tax fair value purchase accounting adjustments related to Golden West were $515 million at March 31, 2007. These adjustments are preliminary and subject to further refinement.
Goodwill and Other Intangibles Created by the Golden West Transaction - Preliminary
| 2007 | 2006 | ||||||
(In millions) | First Quarter | Fourth Quarter | |||||
Purchase price less former Golden West ending tangible stockholders’ equity as of October 1, 2006 | $ | 14,543 | 14,543 | ||||
Fair value purchase accounting adjustments (a) | |||||||
Financial assets | 827 | 827 | |||||
Premises and equipment | — | — | |||||
Employee benefit plans | — | — | |||||
Financial liabilities | 107 | 107 | |||||
CRE | (100 | ) | (106 | ) | |||
Other | (6 | ) | 37 | ||||
Income taxes | (313 | ) | (327 | ) | |||
Total fair value purchase accounting adjustments | 515 | 538 | |||||
Exit cost purchase accounting adjustments (b) | |||||||
Personnel and employee termination benefits | 87 | 12 | |||||
Occupancy and equipment | — | — | |||||
Contract cancellations | — | — | |||||
Regulatory mandated branch sales | — | — | |||||
Other | 29 | 29 | |||||
Total pre-tax exit costs | 116 | 41 | |||||
Income taxes | (34 | ) | (7 | ) | |||
Total after-tax exit cost purchase accounting adjustments(One-time costs) | 82 | 34 | |||||
Total purchase intangibles | 15,140 | 15,115 | |||||
Core deposit base and customer relationship intangibles(Net of income taxes) | 259 | 261 | |||||
Goodwill as of March 31, 2007 | $ | 14,881 | 14,854 | ||||
| (a) | These adjustments represent fair value adjustments in compliance with purchase accounting standards and adjust assets and liabilities of the former Golden West to their fair values as of October 1, 2006 |
| (b) | These adjustments represent incremental costs relating to combining the two companies and are specifically attributable to those businesses of the former Golden West. |
Page-41
Table of Contents
Wachovia 1Q07 Quarterly Earnings Report
EXPLANATIONOF OUR USEOF CERTAIN NON-GAAP FINANCIAL MEASURES
In addition to results presented in accordance with GAAP, this quarterly earnings report includes certain non-GAAP financial measures, including those presented on pages 3 and 5 under the captions “Earnings Reconciliation”, and “Other Financial Measures”, with the sub-headings – “Earnings excluding merger-related and restructuring expenses” — “Earnings excluding merger-related and restructuring expenses, and discontinued operations” and — “Earnings excluding merger-related and restructuring expenses, other intangible amortization and discontinued operations”, and which are reconciled to GAAP financial measures on pages 43-46. In addition, in this quarterly earnings report certain designated net interest income amounts are presented on a tax-equivalent basis, including the calculation of the overhead efficiency ratio.
In the fourth quarter of 2006, as a result of performing our review under SAB 108, we identified certain immaterial, prior year adjustments which are unrelated to SAB 108 and which are further discussed and outlined on pages 17-18. These adjustments are referred to as “4Q06 Adjustments” and in some instances herein, our reported results are discussed excluding the effect of these 4Q06 Adjustments to illustrate the effects on core operating trends without such adjustments.
Wachovia believes these non-GAAP financial measures provide information useful to investors in understanding the underlying operational performance of the company, its business and performance trends and facilitates comparisons with the performance of others in the financial services industry. Specifically, Wachovia believes the exclusion of merger-related and restructuring expenses and discontinued operations permits evaluation and a comparison of results for on-going business operations, and it is on this basis that Wachovia’s management internally assesses the company’s performance. Those non-operating items are excluded from Wachovia’s segment measures used internally to evaluate segment performance in accordance with GAAP because management does not consider them particularly relevant or useful in evaluating the operating performance of our business segments. In addition, because of the significant amount of deposit base intangible amortization, Wachovia believes the exclusion of this expense provides investors with consistent and meaningful comparisons to other financial services firms. Wachovia’s management makes recommendations to its board of directors about dividend payments based on reported earnings excluding merger-related and restructuring expenses, other intangible amortization, discontinued operations and the cumulative effect of a change in accounting principle, and has communicated certain dividend payout ratio goals to investors on this basis. Management believes this payout ratio is useful to investors because it provides investors with a better understanding of and permits investors to monitor Wachovia’s dividend payout policy. Wachovia also believes the presentation of net interest income on a tax-equivalent basis ensures comparability of net interest income arising from both taxable and tax-exempt sources and is consistent with industry standards. Wachovia operates one of the largest retail brokerage businesses in our industry, and we have presented an overhead efficiency ratio excluding these brokerage services, which management believes is useful to investors in comparing the performance of our banking business with other banking companies.
Although Wachovia believes the above non-GAAP financial measures enhance investors’ understanding of our business and performance, these non-GAAP financial measures should not be considered an alternative to GAAP basis financial measures.
Page-42
Table of Contents
Wachovia 1Q07 Quarterly Earnings Report
RECONCILIATION OF CERTAIN NON-GAAP FINANCIAL MEASURES
Reconciliation of Certain Non-GAAP Financial Measures
| * | 2007 | 2006 | ||||||||||||||||
(In millions) | First Quarter | Fourth Quarter | Third Quarter | Second Quarter | First Quarter | |||||||||||||
Income from continuing operations | ||||||||||||||||||
Net income(GAAP) | A | $ | 2,302 | 2,301 | 1,877 | 1,885 | 1,728 | |||||||||||
Discontinued operations, net of income taxes(GAAP) | — | (46 | ) | — | — | — | ||||||||||||
Income from continuing operations(GAAP) | 2,302 | 2,255 | 1,877 | 1,885 | 1,728 | |||||||||||||
Merger-related and restructuring expenses(GAAP) | 6 | 29 | 25 | 15 | 46 | |||||||||||||
Earnings excluding merger-related and restructing expenses, and discontinued operations | B | 2,308 | 2,284 | 1,902 | 1,900 | 1,774 | ||||||||||||
Other intangible amortization(GAAP) | 76 | 90 | 59 | 64 | 59 | |||||||||||||
Earnings excluding merger-related and restructing expenses, other intangible amortization and discontinued operations | C | $ | 2,384 | 2,374 | 1,961 | 1,964 | 1,833 | |||||||||||
Return on average common stockholders’ equity | ||||||||||||||||||
Average common stockholders’ equity(GAAP) | D | $ | 69,320 | 69,725 | 50,143 | 49,063 | 47,926 | |||||||||||
Merger-related and restructuring expenses(GAAP) | 1 | 95 | 70 | 50 | 19 | |||||||||||||
Discontinued operations(GAAP) | — | (8 | ) | — | — | — | ||||||||||||
Average common stockholders’ equity, excluding merger-related and restructuring expenses, and discontinued operations | E | 69,321 | 69,812 | 50,213 | 49,113 | 47,945 | ||||||||||||
Average intangible assets(GAAP) | F | (40,263 | ) | (39,979 | ) | (24,943 | ) | (24,972 | ) | (23,689 | ) | |||||||
Average common stockholders’ equity, excluding merger-related and restructuring expenses, other intangible amortization and discontinued operations | G | $ | 29,058 | 29,833 | 25,270 | 24,141 | 24,256 | |||||||||||
Returns on average common stockholders’ equity | ||||||||||||||||||
GAAP | A/D | 13.47 | % | 13.09 | 14.85 | 15.41 | 14.62 | |||||||||||
Excluding merger-related and restructuring expenses, and discontinued operations | B/E | 13.50 | 12.98 | 15.02 | 15.52 | 15.01 | ||||||||||||
Return on average tangible common stockholders’ equity | ||||||||||||||||||
GAAP | A/D+F | 32.14 | 30.68 | 29.55 | 31.38 | 28.91 | ||||||||||||
Excluding merger-related and restructuring expenses, other intangible amortization and discontinued operations | C/G | 33.27 | % | 31.58 | 30.79 | 32.63 | 30.64 | |||||||||||
Table continued on next page.
Page - 43
Table of Contents
Wachovia 1Q07 Quarterly Earnings Report
RECONCILIATION OF CERTAIN NON-GAAP FINANCIAL MEASURES
Reconciliation of Certain Non-GAAP Financial Measures
| 2007 | 2006 | |||||||||||||||||
(In millions) | * | First Quarter | Fourth Quarter | Third Quarter | Second Quarter | First Quarter | ||||||||||||
Return on average assets | ||||||||||||||||||
Average assets(GAAP) | H | $ | 695,448 | 698,687 | 555,164 | 543,612 | 522,209 | |||||||||||
Average intangible assets(GAAP) | (40,263 | ) | (39,979 | ) | (24,943 | ) | (24,972 | ) | (23,689 | ) | ||||||||
Average tangible assets(GAAP) | I | $ | 655,185 | 658,708 | 530,221 | 518,640 | 498,520 | |||||||||||
Average assets(GAAP) | $ | 695,448 | 698,687 | 555,164 | 543,612 | 522,209 | ||||||||||||
Merger-related and restructuring expenses(GAAP) | 1 | 95 | 70 | 50 | 19 | |||||||||||||
Discontinued operations(GAAP) | — | (8 | ) | — | — | — | ||||||||||||
Average assets, excluding merger-related and restructuring expenses, and discontinued operations | J | 695,449 | 698,774 | 555,234 | 543,662 | 522,228 | ||||||||||||
Average intangible assets(GAAP) | (40,263 | ) | (39,979 | ) | (24,943 | ) | (24,972 | ) | (23,689 | ) | ||||||||
Average tangible assets, excluding merger-related and restructuring expenses, and discontinued operations | K | $ | 655,186 | 658,795 | 530,291 | 518,690 | 498,539 | |||||||||||
Return on average assets | ||||||||||||||||||
GAAP | A/H | 1.34 | % | 1.31 | 1.34 | 1.39 | 1.34 | |||||||||||
Excluding merger-related and restructuring expenses, and discontinued operations | B/J | 1.35 | 1.30 | 1.36 | 1.40 | 1.38 | ||||||||||||
Return on average tangible assets | ||||||||||||||||||
GAAP | A/I | 1.43 | 1.39 | 1.40 | 1.46 | 1.41 | ||||||||||||
Excluding merger-related and restructuring expenses, other intangible amortization and discontinued operations | C/K | 1.48 | % | 1.43 | 1.47 | 1.52 | 1.49 | |||||||||||
| * | The letters included in the column are provided to show how the various ratios presented in the tables on pages 43 through 46 are calculated. For example, return on average assets on a GAAP basis is calculated by dividing net income(GAAP) by average assets(GAAP) (i.e., A/H), and annualized where appropriate. |
Page-44
Table of Contents
Wachovia 1Q07 Quarterly Earnings Report
RECONCILIATION OF CERTAIN NON-GAAP FINANCIAL MEASURES
Reconciliation of Certain Non-GAAP Financial Measures
| 2007 | 2006 | |||||||||||||||||
(In millions) | * | First Quarter | Fourth Quarter | Third Quarter | Second Quarter | First Quarter | ||||||||||||
Overhead efficiency ratios | ||||||||||||||||||
Noninterest expense(GAAP) | L | $ | 4,588 | 4,931 | 4,045 | 4,261 | 4,239 | |||||||||||
Merger-related and restructuring expenses(GAAP) | (10 | ) | (49 | ) | (38 | ) | (24 | ) | (68 | ) | ||||||||
Noninterest expense, excluding merger-related and restructuring expenses | M | 4,578 | 4,882 | 4,007 | 4,237 | 4,171 | ||||||||||||
Other intangible amoritization(GAAP) | (118 | ) | (141 | ) | (92 | ) | (98 | ) | (92 | ) | ||||||||
Noninterest expense, excluding merger-related and restructuring expenses, and other intangible amoritization | N | $ | 4,460 | 4,741 | 3,915 | 4,139 | 4,079 | |||||||||||
Net interest income(GAAP) | $ | 4,460 | 4,577 | 3,541 | 3,641 | 3,490 | ||||||||||||
Tax-equivalent adjustment | 37 | 35 | 37 | 34 | 49 | |||||||||||||
Net interest income(Tax-equivalent) | 4,497 | 4,612 | 3,578 | 3,675 | 3,539 | |||||||||||||
Fee and other income(GAAP) | 3,741 | 3,980 | 3,465 | 3,583 | 3,517 | |||||||||||||
Total | O | $ | 8,238 | 8,592 | 7,043 | 7,258 | 7,056 | |||||||||||
Retail Brokerage Services, excluding insurance | ||||||||||||||||||
Noninterest expense(GAAP) | P | $ | 995 | 984 | 893 | 925 | 950 | |||||||||||
Net interest income(GAAP) | $ | 255 | 249 | 240 | 250 | 242 | ||||||||||||
Tax equivalent adjustment | — | — | — | 1 | — | |||||||||||||
Net interest income(Tax-equivalent) | 255 | 249 | 240 | 251 | 242 | |||||||||||||
Fee and other income(GAAP) | 1,140 | 1,065 | 961 | 966 | 980 | |||||||||||||
Total | Q | $ | 1,395 | 1,314 | 1,201 | 1,217 | 1,222 | |||||||||||
Overhead efficiency ratios | ||||||||||||||||||
GAAP | L/O | 55.70 | % | 57.38 | 57.44 | 58.71 | 60.07 | |||||||||||
Excluding merger-related and restructuring expenses | M/O | 55.57 | 56.81 | 56.90 | 58.39 | 59.10 | ||||||||||||
Excluding merger-related and restructuring expenses, and brokerage | M-P/O-Q | 52.37 | 53.55 | 53.29 | 54.85 | 55.20 | ||||||||||||
Excluding merger-related and restructuring expenses, and other intangible amortization | N/O | 54.15 | 55.17 | 55.60 | 57.03 | 57.81 | ||||||||||||
Excluding merger-related and restructuring expenses, other intangible amortization and brokerage | N-P/O-Q | 50.65 | % | 51.61 | 51.73 | 53.21 | 53.63 | |||||||||||
Table continued on next page.
Page-45
Table of Contents
Wachovia 1Q07 Quarterly Earnings Report
RECONCILIATION OF CERTAIN NON-GAAP FINANCIAL MEASURES
Reconciliation of Certain Non- GAAP Financial Measures
| * | 2007 | 2006 | ||||||||||||||||
(In millions, except per share data) | First Quarter | Fourth Quarter | Third Quarter | Second Quarter | First Quarter | |||||||||||||
Operating leverage | ||||||||||||||||||
Operating leverage(GAAP) | $ | (13 | ) | 665 | 1 | 180 | 436 | |||||||||||
Merger-related and restructuring expenses(GAAP) | (38 | ) | 10 | 15 | (45 | ) | 10 | |||||||||||
Operating leverage, excluding merger-related and restructuring expenses | (51 | ) | 675 | 16 | 135 | 446 | ||||||||||||
Other intangible amortization(GAAP) | (24 | ) | 50 | (8 | ) | 7 | (2 | ) | ||||||||||
Operating leverage, excluding merger-related and restructuring expenses, and other intangible amoritization | $ | (75 | ) | 725 | 8 | 142 | 444 | |||||||||||
Dividend payout ratios on common shares | ||||||||||||||||||
Dividends paid per common share | R | $ | 0.56 | 0.56 | 0.56 | 0.51 | 0.51 | |||||||||||
Diluted earnings per common share(GAAP) | S | $ | 1.20 | 1.20 | 1.17 | 1.17 | 1.09 | |||||||||||
Merger-related and restructuring expenses(GAAP) | — | 0.01 | 0.02 | 0.01 | 0.03 | |||||||||||||
Other intangible amortization(GAAP) | 0.04 | 0.05 | 0.04 | 0.04 | 0.04 | |||||||||||||
Discontinued operations(GAAP) | — | (0.02 | ) | — | — | — | ||||||||||||
Diluted earnings per common share, excluding merger- related and restructuring expenses, other intangible amoritization and discontinued operations | T | $ | 1.24 | 1.24 | 1.23 | 1.22 | 1.16 | |||||||||||
Dividend payout ratios | ||||||||||||||||||
GAAP | R/S | 46.67 | % | 46.67 | 47.86 | 43.59 | 46.79 | |||||||||||
Excluding merger-related and restructuring expenses, other intangible amoritization and discontinued operations | R/T | 45.16 | % | 45.16 | 45.53 | 41.80 | 43.97 | |||||||||||
| * | The letters included in the column are provided to show how the various ratios presented in the tables on pages 43 through 46 are calculated. For example, return on average assets on a GAAP basis is calculated by dividing net income (GAAP) by average assets(GAAP) (i.e., A/H), are annualized where appropriate. |
Page-46
Table of Contents
Wachovia 1Q07 Quarterly Earnings Report
The foregoing materials and management��s discussion of them may contain, among other things, certain forward-looking statements with respect to Wachovia, as well as the goals, plans, objectives, intentions, expectations, financial condition, results of operations, future performance and business of Wachovia, including, without limitation, (i) statements relating to certain of Wachovia’s goals and expectations with respect to earnings, earnings per share, revenue, expenses, and the growth rate in such items, as well as other measures of economic performance, including statements relating to estimates of credit quality trends, (ii) statements relating to the benefits of the merger between Wachovia and Golden West Financial Corporation completed October 1, 2006 (the “Golden West Merger”), (iii) statements relating to the benefits of the acquisition by Wachovia of Westcorp and WFS Financial Inc, completed on March 1, 2006 (the “Westcorp Transaction” and together with the Golden West Merger, the “Mergers”), (iv) statements with respect to Wachovia’s plans, objectives, expectations and intentions and other statements that are not historical facts, and (v) statements preceded by, followed by or that include the words “may”, “could”, “would”, “should”, “believes”, “expects”, “anticipates”, “estimates”, “intends”, “plans”, “targets”, “probably”, “potentially”, “projects”, “outlook” or similar expressions. These forward-looking statements involve certain risks and uncertainties that are subject to change based on various factors (many of which are beyond Wachovia’s control). The following factors, among others, could cause Wachovia’s financial performance to differ materially from the goals, plans, objectives, intentions and expectations expressed in such forward-looking statements: (1) the risk that the businesses involved in the Mergers will not be integrated successfully or such integrations may be more difficult, time-consuming or costly than expected; (2) expected revenue synergies and cost savings from the Mergers may not be fully realized or realized within the expected time frame; (3) revenues following the Mergers may be lower than expected; (4) deposit attrition, customer attrition, operating costs, and business disruption following the Mergers, including, without limitation, difficulties in maintaining relationships with employees, may be greater than expected; (5) enforcement actions by governmental agencies that are not currently anticipated; (6) the strength of the United States economy in general and the strength of the local economies in which Wachovia conducts operations may be different than expected resulting in, among other things, a deterioration in credit quality or a reduced demand for credit, including the resultant effect on Wachovia’s loan portfolio and allowance for loan losses; (7) the effects of, and changes in, trade, monetary and fiscal policies and laws, including interest rate policies of the Board of Governors of the Federal Reserve System; (8) inflation, interest rate, market and monetary fluctuations; (9) adverse conditions in the stock market, the public debt market and other capital markets (including changes in interest rate conditions) and the impact of such conditions on Wachovia’s capital markets and capital management activities, including, without limitation, its mergers and acquisition advisory business, equity and debt underwriting activities, private equity investment activities, derivative securities activities, investment and wealth management advisory businesses, and brokerage activities; (10) adverse changes in the financial performance and/or condition of Wachovia’s borrowers which could impact the repayment of such borrowers’ outstanding loans; (11) the impact of changes in accounting principles; and (12) the impact on Wachovia’s businesses, as well as on the risks set forth above, of various domestic or international military or terrorist activities or conflicts. Additional information with respect to factors that may cause actual results to differ materially from those contemplated by such forward-looking statements is included in the reports filed by Wachovia with the Securities and Exchange Commission, including its Current Report on Form 8-K dated April 16, 2007.
Wachovia cautions that the foregoing list of factors is not exclusive. All subsequent written and oral forward-looking statements concerning the Mergers or other matters and attributable to Wachovia or any person acting on its behalf are expressly qualified in their entirety by the cautionary statements above. Wachovia does not undertake any obligation to update any forward-looking statement, whether written or oral.
Page-47
Table of Contents
Wachovia 1Q07 Quarterly Earnings Report
SUPPLEMENTAL ILLUSTRATIVE COMBINED INFORMATION
The Quarterly Earnings Report contains references to certain information previously furnished to the Securities and Exchange Commission in Exhibit (99)(d) to Wachovia’s Current Report on Form 8-K dated January 23, 2007 (such furnished information, the “Supplemental Information”). The Supplemental Information shows (1) certain historical financial data for each of Wachovia and Golden West Financial Corporation and (2) similar combined illustrative information reflecting the merger of Golden West with Wachovia. The historical financial data show the financial results actually achieved by Wachovia and by Golden West for the periods indicated. The “Combined” illustrative information shows the illustrative effect of the merger under the purchase method of accounting hypothetically assuming the merger was consummated as of the applicable prior period, instead of October 1, 2006, the actual merger consummation date. In the case of the “Combined” illustrative information for the full year ended December 31, 2006, the standalone Golden West information represents the period from January 1, 2006 to September 30, 2006.
The “Combined” illustrative information is not prepared in accordance with generally accepted accounting principles (“GAAP”), although both the historical Wachovia and the historical Golden West financial information presented were prepared in accordance with GAAP. Wachovia believes the “Combined” illustrative information is useful to investors in understanding how the financial information of Wachovia and Golden West may have appeared on a combined basis had the two companies actually been merged as of the dates indicated and how the financial information of the General Bank segment and Retail and Small Business sub-segment of the new combined company may have appeared had the two companies actually been merged as of the dates indicated.
The “Combined” illustrative information includes estimated adjustments to record certain assets and liabilities of Golden West at their respective fair values and to record certain exit costs related to Golden West. The estimated adjustments are subject to updates as additional information becomes available and as additional analyses are performed. Certain other assets and liabilities of Golden West will also be subject to adjustment to their respective fair values, including additional intangible assets which may be identified. Pending more detailed analyses, no estimated adjustments are included for these assets and liabilities. Any change in the fair value of the net assets of Golden West will change the amount of the purchase price allocable to goodwill. In addition, the final adjustments may be materially different from the unaudited estimated adjustments presented. The “Combined” illustrative information cannot be reconciled to GAAP because many of the purchase accounting adjustments resulting from the merger are based upon valuations of assets as of the merger date and therefore cannot be ascertained for prior periods.
We anticipate the merger will provide Wachovia with financial benefits that include increased revenue and reduced operating expenses, but these financial benefits are not reflected in the “Combined” illustrative information. Accordingly, the “Combined” illustrative information does not attempt to predict or suggest future results. It also does not necessarily reflect what the historical results of the combined company would have been had our companies been combined during the period presented.
The costs associated with merger integration activities that impact certain Golden West systems, facilities and equipment, personnel and contractual arrangements will be recorded as purchase accounting adjustments when the appropriate plans are in place with potential refinements up to one year after completion of the merger as additional information becomes available. We currently estimate exit cost purchase accounting adjustments will amount to $192 million ($117 million after tax). The costs associated with integrating systems and operations will be recorded as merger-related expenses based on the nature and timing of the related expenses, but generally will be recorded as the expenses are incurred. Restructuring expenses will be recorded based on the nature and timing of the expenses and generally will include merger integration activities that impact Wachovia systems, facilities and equipment, personnel and contractual arrangements. We currently expect merger-related and restructuring expenses will amount to $288 million ($176 million after tax) and will be incurred and reported through 2008.
The information herein is based on historical financial information and related notes that Wachovia and Golden West have respectively presented in prior filings with the Securities and Exchange Commission. Shareholders are encouraged to review the historical financial information and related notes in connection with the “Combined” illustrative information.
Page-48