EXHIBIT 99.1
Financial Overview
Geoff Chatas
Executive Vice President and Chief Financial Officer
Safe Harbor Statement
This document contains forward-looking statements within the meaning of the safe harbor provisions of the Private Securities Litigation Reform Act of 1995. The forward-looking statements involve estimates, projections, goals, forecasts, assumptions, risk and uncertainties that could cause actual results to differ materially from those expressed in the forward-looking statements. Examples of factors that you should consider with respect to any forward-looking statements made in this document include, but are not limited to, the following: the impact of fluid and complex government laws and regulations, including those relating to the environment; the impact of recent events in the energy markets that have increased the level of public and regulatory scrutiny in the energy industry and in the capital markets; deregulation or restructuring in the electric industry that may result in increased competition and unrecovered (stranded) costs; the uncertainty regarding the timing, creation and structure of regional transmission organizations; weather conditions that directly influence the demand for electricity; recurring seasonal fluctuations in demand for electricity; fluctuations in the price of energy commodities and purchased power; economic fluctuations and the corresponding impact on our commercial and industrial customers; the ability of our subsidiaries to pay upstream dividends or distributions to us; the impact on our facilities and our businesses from a terrorist attack; the inherent risks associated with the operation of nuclear facilities, including environmental, health, regulatory and financial risks; the ability to successfully access capital markets on favorable terms; the impact that increases in our leverage may have on us; our ability to maintain our current credit ratings; the impact of derivative contracts used in the normal course of our business; investment performance of pension and benefit plans and the ability to control costs; the outcome availability and use of Internal Revenue Code Section 29 (Section 29) tax credits by synthetic fuel producers, and our continued ability to use Section 29 tax credits related to our coal and synthetic fuels businesses; our ability to successfully integrate newly acquired assets, properties or businesses into our operations as quickly or as profitably as expected; our ability to manage the risks involved with the operation of our nonregulated plants, including dependence on third parties and related counter-party risks, and a lack of operating history; our ability to manage the risks associated with our energy marketing operations; and unanticipated changes in operating expenses and capital expenditures. Many of these risks similarly impact our subsidiaries.
These and other risk factors are detailed from time to time in our SEC reports. All such factors are difficult to predict, contain uncertainties that may materially affect actual results, and may be beyond our ability to control or estimate precisely.
Financial Objectives
Live within our means
Strengthen balance sheet
Maintain access to credit markets
Target earnings growth in upper half of our sector
Reward shareholders with a growing dividend
And…communicate clear, comprehensive and timely financial information
2003 Recap
Increased ongoing earnings 2% over 2002
Sold $580 million of assets
Reduced leverage to 58.9%
Resolved complex issues regarding synthetic fuel investments
Completed build-out of nonregulated portfolio and signed wholesale contracts for output
Continued operational excellence
Increased dividend 16th consecutive year
Themes for 2004
Transition from net income growth to EPS growth
Extract value from our assets
Focus on cost control
Best in class capital expenditure stewardship
Assumptions for 2004
Electric utility base revenue growth of 2%
Clean Air regulatory amortization of $75M
Lower expected off-system sales
No planned asset acquisitions
Equity issuances of ~ $50M
Asset sales of $80 million for Railcar, Ltd.
No synthetic fuel monetization earnings assumed
2004 EPS range of $3.50—$3.65
2004 Earnings Presentation Changes
Segment figures no longer adjusted for tax benefit reallocation from holding company
2003 earnings adjusted for retroactive service company reallocation recorded in Q1 2003
Synthetic fuels now includes all third-party synthetic fuel sales
See Appendix A-1 for detail of changes
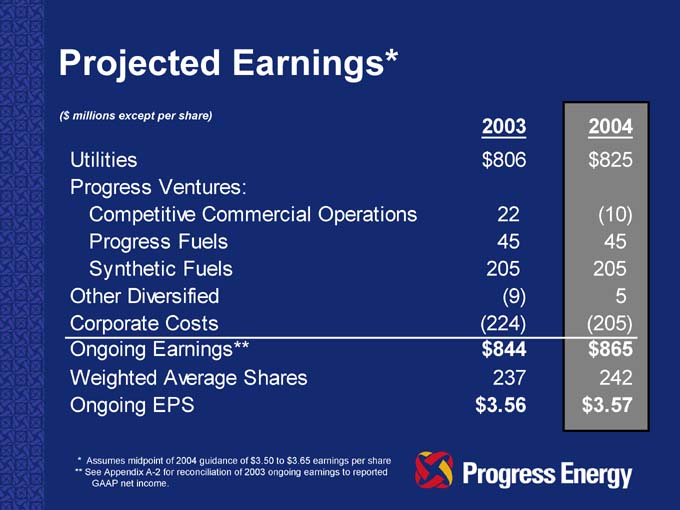
Projected Earnings*
($ millions except per share)
2003 2004
Utilities $ 806 $ 825
Progress Ventures:
Competitive Commercial Operations 22 (10)
Progress Fuels 45 45
Synthetic Fuels 205 205
Other Diversified (9) 5
Corporate Costs (224) (205)
Ongoing Earnings** $ 844 $ 865
Weighted Average Shares 237 242
Ongoing EPS $ 3.56 $ 3.57
* Assumes midpoint of 2004 guidance of $3.50 to $3.65 earnings per share ** See Appendix A-2 for reconciliation of 2003 ongoing earnings to reported GAAP net income.
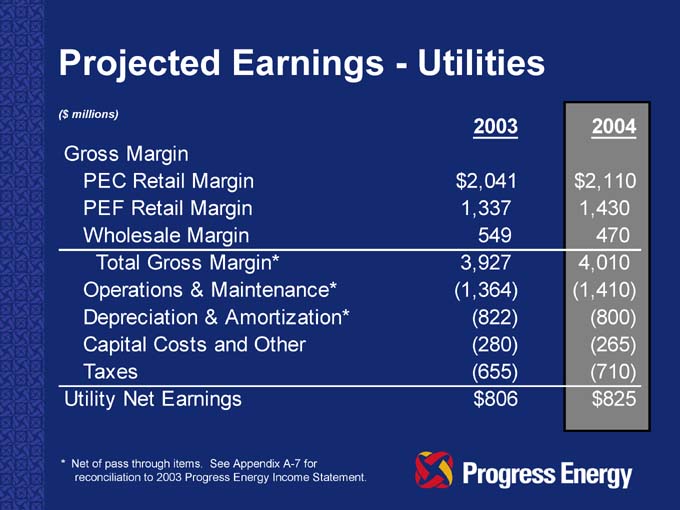
Projected Earnings—Utilities
($ millions)
2003 2004
Gross Margin
PEC Retail Margin 2,041 $ 2,110
PEF Retail Margin 1,337 1,430
Wholesale Margin 549 470
Total Gross Margin* 3,927 4,010
Operations & Maintenance* (1,364) (1,410)
Depreciation & Amortization* (822) (800)
Capital Costs and Other (280) (265)
Taxes (655) (710)
Utility Net Earnings $806 $825
* Net of pass through items. See Appendix A-7 for reconciliation to 2003 Progress Energy Income Statement.
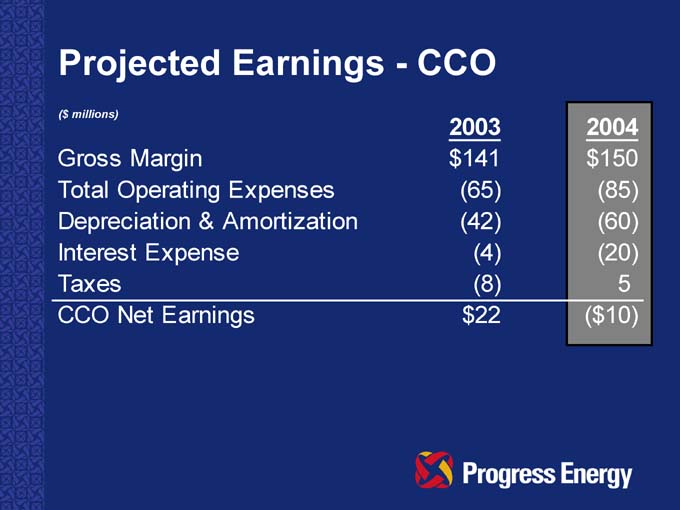
Projected Earnings—CCO
($ millions)
2003 2004
Gross Margin $ 141 $ 150
Total Operating Expenses (65) (85)
Depreciation & Amortization (42) (60)
Interest Expense (4) (20)
Taxes (8) 5
CCO Net Earnings $22 ($ 10)
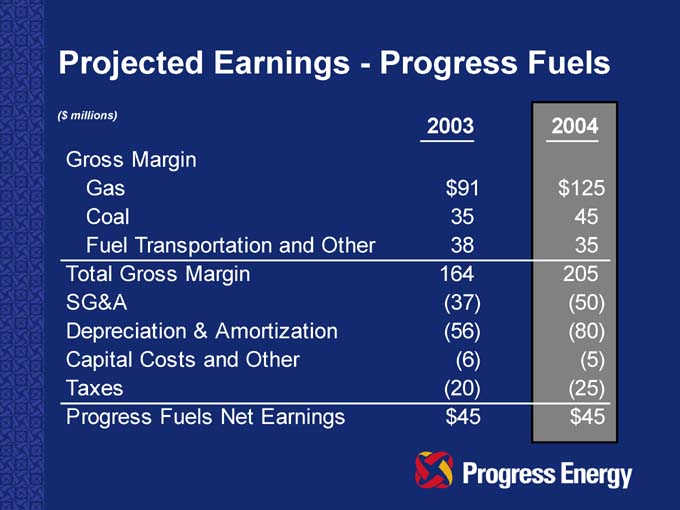
Projected Earnings—Progress Fuels
($ millions) 2003 2004
Gross Margin
Gas $ 91 $ 125
Coal 35 45
Fuel Transportation and Other 38 35
Total Gross Margin 164 205
SG&A (37) (50)
Depreciation & Amortization (56) (80)
Capital Costs and Other (6) (5)
Taxes (20) (25)
Progress Fuels Net Earnings $ 45 $45
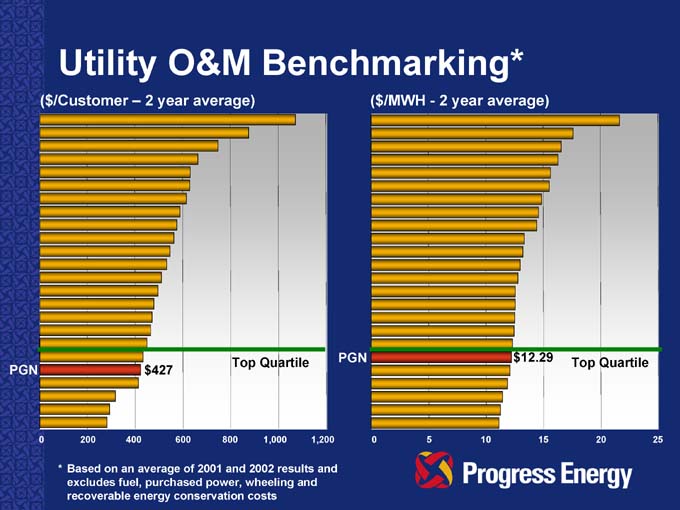
Utility O&M Benchmarking*
($ /Customer – 2 year average)
PGN
$427
Top Quartile
($ /MWH—2 year average)
PGN
$12.29
Top Quartile
* Based on an average of 2001 and 2002 results and excludes fuel, purchased power, wheeling and recoverable energy conservation costs
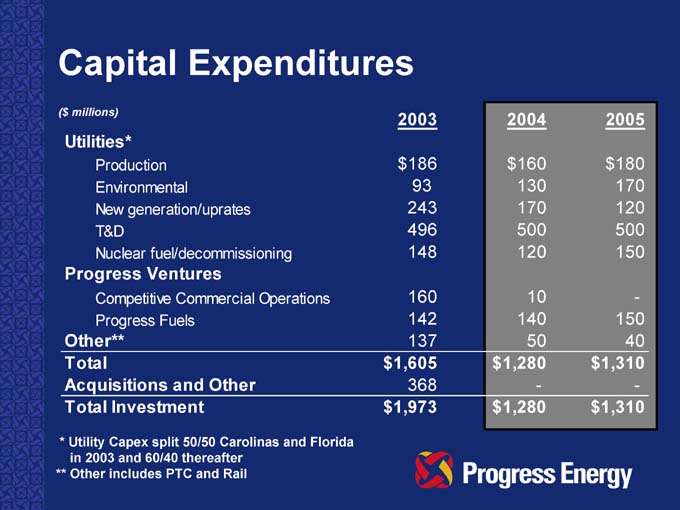
Capital Expenditures
($ millions) 2003 2004 2005
Utilities*
Production $ 186 $ 160 $ 180
Environmental 93 130 170
New generation/uprates 243 170 120
T&D 496 500 500
Nuclear fuel/decommissioning 148 120 150
Progress Ventures
Competitive Commercial Operations 160 10 -
Progress Fuels 142 140 150
Other** 137 50 40
Total $ 1,605 $ 1,280 $ 1,310
Acquisitions and Other 368 - -
Total Investment $ 1,973 $ 1,280 $ 1,310
* Utility Capex split 50/50 Carolinas and Florida in 2003 and 60/40 thereafter
** Other includes PTC and Rail
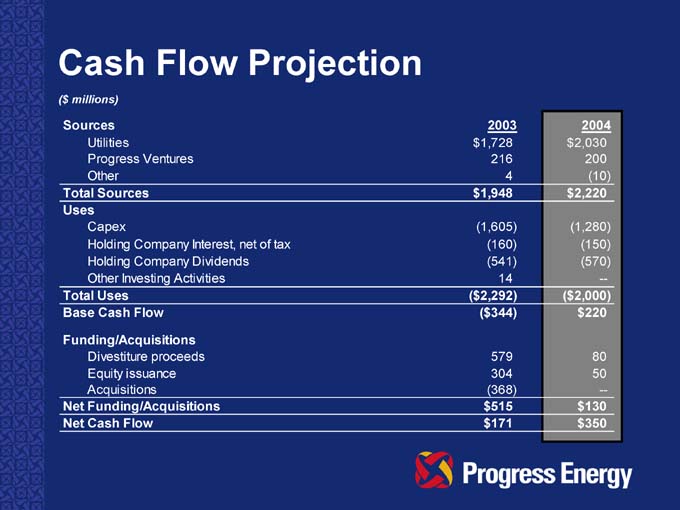
Cash Flow Projection
($ millions)
Sources 2003 2004
Utilities $ 1,728 $ 2,030
Progress Ventures 216 200
Other 4 (10)
Total Sources $ 1,948 $ 2,220
Uses
Capex (1,605) (1,280)
Holding Company Interest, net of tax (160) (150)
Holding Company Dividends (541) (570)
Other Investing Activities 14 —
Total Uses ($ 2,292) ($ 2,000)
Base Cash Flow ($ 344) $ 220
Funding/Acquisitions
Divestiture proceeds 579 80
Equity issuance 304 50
Acquisitions (368) —
Net Funding/Acquisitions $ 515 $ 130
Net Cash Flow $ 171 $ 350

Cash Flow Projection—GAAP
($ millions)
2003 2004
Operating Activities
Utilities $ 1,728 $ 2,030
Progress Ventures 216 200
Other (156) (160)
Total Cash From Operations 1,788 2,070
Investing Activities
Total Investment (1,973) (1,280)
Asset Sales and Other 593 80
Total Cash Used in Investing Activities (1,380) (1,200)
Financing Activities
Issuance of Common Stock, net 304 50
Dividends (541) (570)
Net debt issuances 41 (560)
Total Cash by Financing Activities (196) (1,080)
Net Change in Cash Flow $ 212 ($210)
Beginning Cash 61 273
Ending Cash $ 273 $63
Deleveraging Plan
Reduce Holding Company debt through:
Utilizing cash from operations
Selling selected assets
Issuing minimal equity for benefit plans
Improving working capital management
Growing retained earnings
Target Capital Structure
Two utilities 48-50% leverage
Progress Ventures 35-40% leverage
Overall enterprise 52-55% leverage
Plan to reduce Holding Company debt from $4.8B to $3.0B
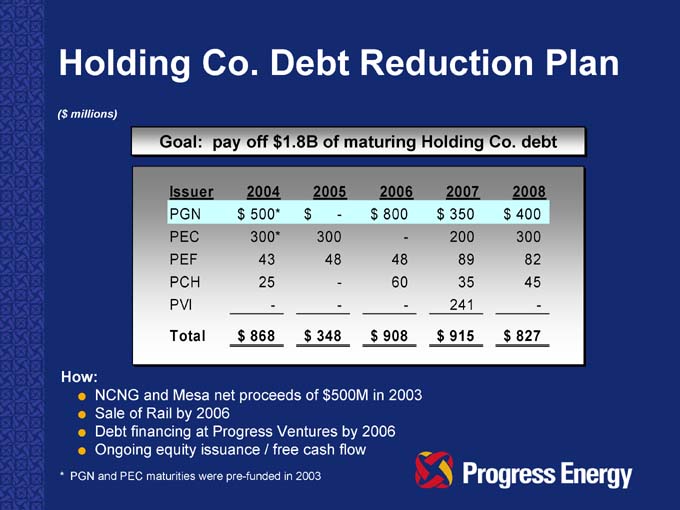
Holding Co. Debt Reduction Plan
($ millions)
Goal: pay off $1.8B of maturing Holding Co. debt
Issuer 2004 2005 2006 2007 2008
PGN $ 500* $ - $ 800 $ 350 $ 400
PEC 300* 300 - 200 300
PEF 43 48 48 89 82
PCH 25 - 60 35 45
PVI - - - 241 -
Total $ 868 $ 348 $ 908 $ 915 $ 827
How:
NCNG and Mesa net proceeds of $500M in 2003
Sale of Rail by 2006
Debt financing at Progress Ventures by 2006
Ongoing equity issuance / free cash flow
* PGN and PEC maturities were pre-funded in 2003
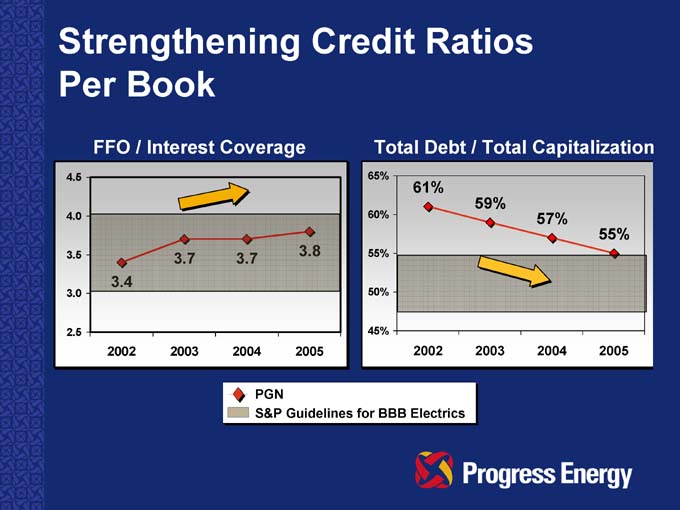
Strengthening Credit Ratios Per Book
FFO / Interest Coverage
3.4
2002
3.7
2003
3.7
2004
3.8
2005
Total Debt / Total Capitalization
61%
2002
59%
2003
57%
2004
55%
2005
PGN
S&P Guidelines for BBB Electrics
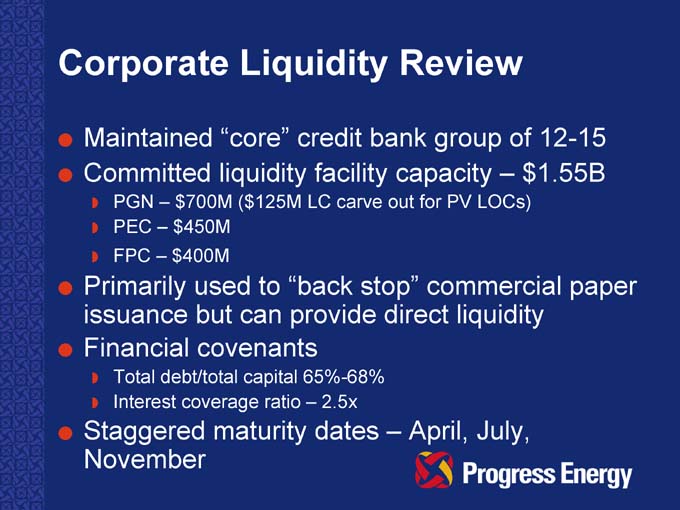
Corporate Liquidity Review
Maintained “core” credit bank group of 12-15
Committed liquidity facility capacity – $1.55B
PGN – $700M ($125M LC carve out for PV LOCs)
PEC – $450M
FPC – $400M
Primarily used to “back stop” commercial paper issuance but can provide direct liquidity
Financial covenants
Total debt/total capital 65%-68%
Interest coverage ratio – 2.5x
Staggered maturity dates – April, July, November
Other Financial Issues
Synthetic fuels program sunset
Pension status
Progress Rail
Progress Telecom

Deferred Tax Credit Utilization Options
Debt reduction
Stock buyback
Reinvest cash
Securitization for earlier access
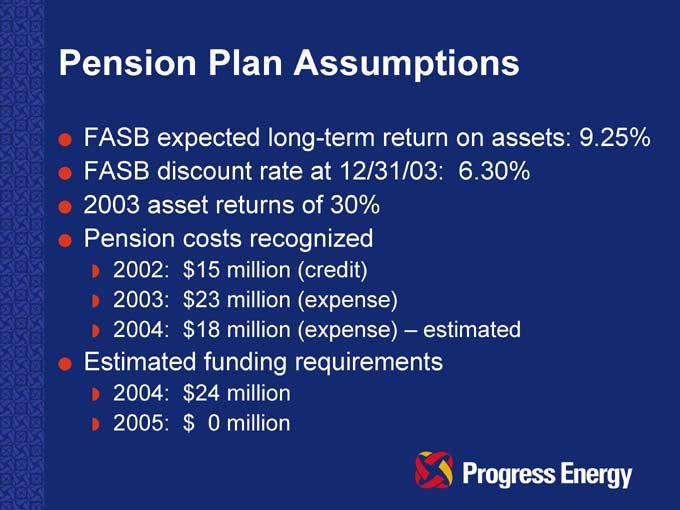
Pension Plan Assumptions
FASB expected long-term return on assets: 9.25%
FASB discount rate at 12/31/03: 6.30%
2003 asset returns of 30%
Pension costs recognized
2002: $15 million (credit)
2003: $23 million (expense)
2004: $18 million (expense) – estimated
Estimated funding requirements
2004: $24 million
2005: $ 0 million
Progress Rail
Locomotive and Railcar Services
Engineering and Trackwork
Finalized Railcar, Ltd. sale in February 2004
Prospects for divestiture
Progress Telecom
Asset contribution with EPIK Communications
55% ownership in new entity, Progress Telecom LLC
Reduced funding requirements
Preserves and stabilizes the value of the telecom assets
Provides future flexibility around these assets
Summary
Growth Transition
What You Heard Today
Operational excellence
Strong service territories
Constructive regulatory relations
Focus on cost management and efficient use of capital
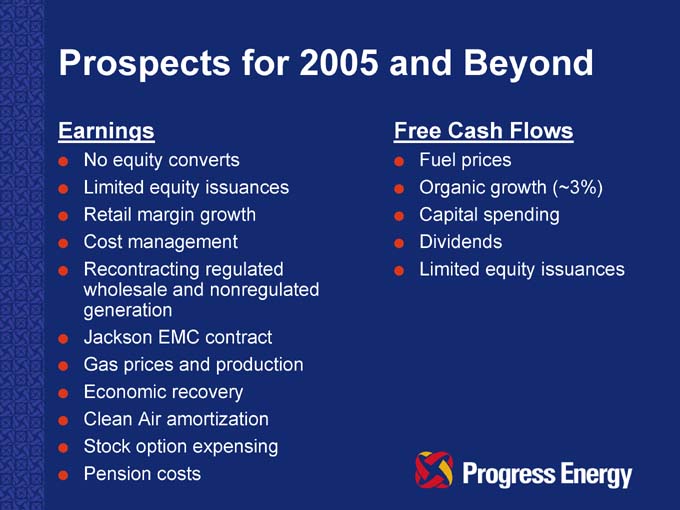
Prospects for 2005 and Beyond
Earnings
No equity converts
Limited equity issuances
Retail margin growth
Cost management
Recontracting regulated wholesale and nonregulated generation
Jackson EMC contract
Gas prices and production
Economic recovery
Clean Air amortization
Stock option expensing
Pension costs
Free Cash Flows
Fuel prices
Organic growth (~3%)
Capital spending
Dividends
Limited equity issuances
Why Invest in Progress Energy?
Two strong electric utilities with solid rate agreements
Historical success in wholesale electricity markets within utilities
Ability to replicate utility wholesale success in Progress Ventures
Strong dividend record—sustainable
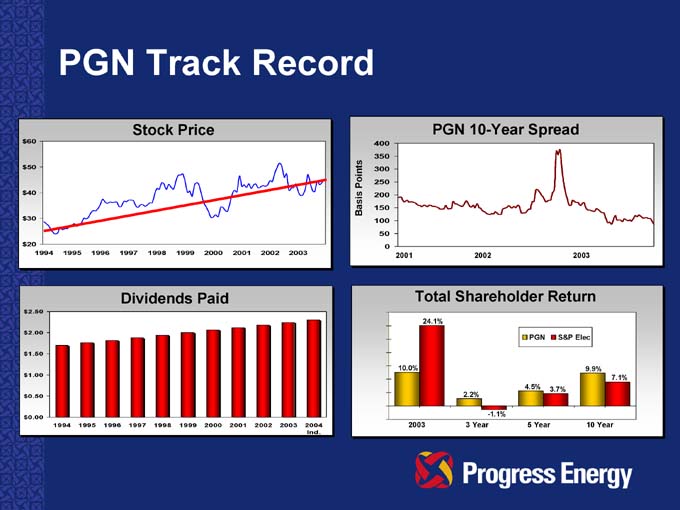
PGN Track Record
Stock Price
Dividends Paid
PGN 10-Year Spread
Total Shareholder Return
24.1%
10.0%
2003
2.2%
-1.1%
3 Year
4.5%
3.7%
5 Year
9.9%
7.1%
10 Year
PGN S&P Elec
Appendix
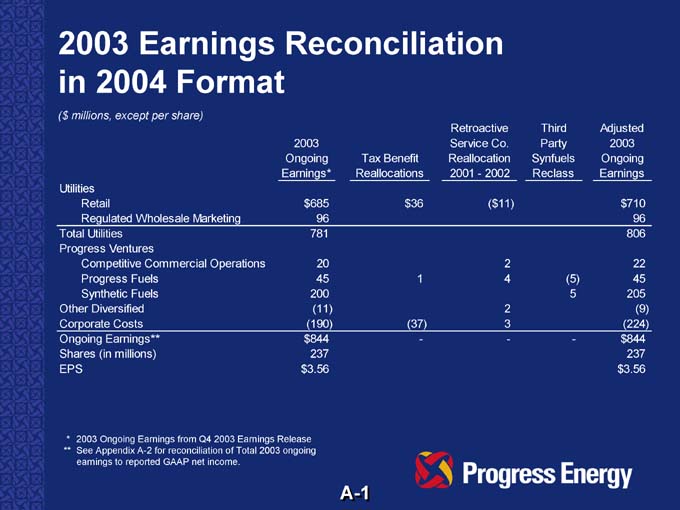
2003 Earnings Reconciliation in 2004 Format
($ millions, except per share)
Retroactive Third Adjusted
2003 Service Co. Party 2003
Ongoing Tax Benefit Reallocation Synfuels Ongoing
Earnings* Reallocations 2001—2002 Reclass Earnings
Utilities
Retail $ 685 $ 36 ($ 11) $ 710
Regulated Wholesale Marketing 96 96
Total Utilities 781 806
Progress Ventures
Competitive Commercial Operations 20 2 22
Progress Fuels 45 1 4 (5) 45
Synthetic Fuels 200 5 205
Other Diversified (11) 2 (9)
Corporate Costs (190) (37) 3 (224)
Ongoing Earnings** $ 844 - - - $ 844
Shares (in millions) 237 237
EPS $ 3.56 $ 3.56
* 2003 Ongoing Earnings from Q4 2003 Earnings Release
** See Appendix A-2 for reconciliation of Total 2003 ongoing earnings to reported GAAP net income.
A-1
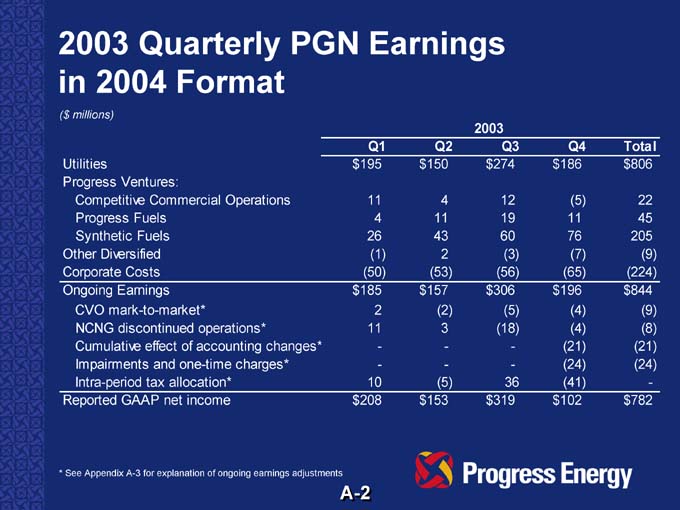
2003 Quarterly PGN Earnings in 2004 Format
($ millions)
2003
Q1 Q2 Q3 Q4 Total
Utilities $ 195 $ 150 $ 274 $ 186 $ 806
Progress Ventures:
Competitive Commercial Operations 11 4 12 (5) 22
Progress Fuels 4 11 19 11 45
Synthetic Fuels 26 43 60 76 205
Other Diversified (1) 2 (3) (7) (9)
Corporate Costs (50) (53) (56) (65) (224)
Ongoing Earnings $ 185 $ 157 $ 306 $ 196 $ 844
CVO mark-to-market* 2 (2) (5) (4) (9)
NCNG discontinued operations* 11 3 (18) (4) (8)
Cumulative effect of accounting changes* - - - (21) (21)
Impairments and one-time charges* - - - (24) (24)
Intra-period tax allocation* 10 (5) 36 (41) -
Reported GAAP net income $ 208 $ 153 $ 319 $ 102 $ 782
* See Appendix A-3 for explanation of ongoing earnings adjustments
A-2
Ongoing Earnings Adjustments
Progress Energy’s management uses ongoing earnings per share to evaluate the operations of the company and to establish goals for management and employees. Management believes this presentation is appropriate and enables investors to compare more accurately the company’s ongoing financial performance over the periods presented. Ongoing earnings as presented here may not be comparable to similarly titled measures used by other companies.Reconciling adjustments from GAAP earnings to ongoing earnings are as follows:
Intraperiod Tax Allocation—Generally accepted accounting principles require companies to apply an effective tax rate to interim periods that is consistent with a company’s estimated annual tax rate. The tax credits generated fromsynthetic fuel operations reduce Progress Energy’s overall effective tax rate. The company’s synthetic fuel sales are not subject to seasonal fluctuations to the same extent as the electric utility earnings. The company projects the effective tax rate for the year and then, based upon projected operating income for each quarter, raises or lowers the tax expense recorded in that quarter to reflect the projected tax rate. On the other hand, operating losses incurred to produce the tax credits are included in the current quarter. Since this adjustment varies by quarter but has no impact on Progress Energy’s annual earnings, management believes this adjustment is not representative of the company’s ongoing quarterly earnings.
Contingent Value Obligation (CVO) Mark-to-Market—In connection with the acquisition of Florida Progress Corporation, Progress Energy issued 98.6 million CVOs. Each CVO represents the right to receive contingent payments based on after-tax cash flows above certain levels of four synthetic fuel facilities purchased by subsidiaries of Florida Progress Corporation in October 1999. The CVOs are debt instruments and, under GAAP, are valued at market value. Unrealized gains and losses from changes in market value are recognized in earningseach quarter. Since changes in the market value of the CVOs do not affect the company’s underlying obligation, management does not consider the adjustment a component of ongoing earnings.
NCNG Discontinued Operations—The operations of NCNG are reported as discontinued operations due to its sale, and therefore management does not believe this activity is representative of the ongoing operations of the company.
Cumulative Effect of Accounting Changes—Progress Energy recorded the cumulative effect of changes in accounting principles due to the adoption of new FASB accounting guidance. The impact to Progress Energy was due primarily to the new FASB guidance related to the accounting for certain contracts. Due to the nonrecurring nature of the adjustment, management believes it is not representative of the 2003 operations of Progress Energy.
Impairments and One-Time Charges—During the fourth quarter of 2003, the company recorded after-tax impairments of its Affordable Housing portfolio and certain assets at the Kentucky May Coal Company. Management does not believe these impairments and one-time charges are representative of the ongoing operations of the company.
A-3
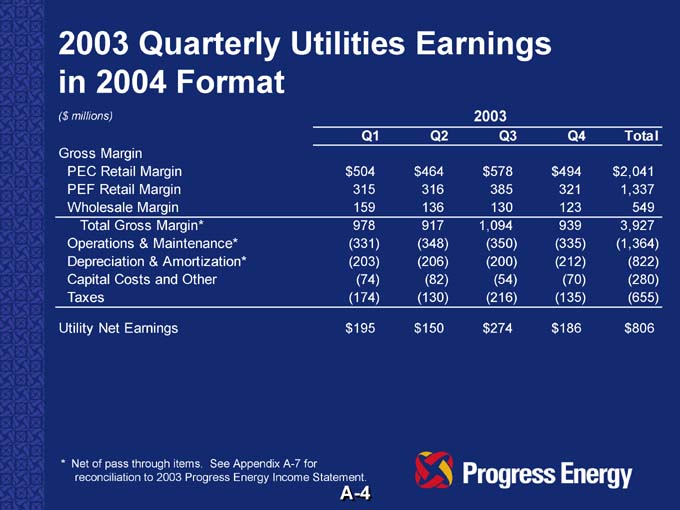
2003 Quarterly Utilities Earnings in 2004 Format
($ millions) 2003
Q1 Q2 Q3 Q4 Total
Gross Margin
PEC Retail Margin $ 504 $ 464 $ 578 $ 494 $ 2,041
PEF Retail Margin 315 316 385 321 1,337
Wholesale Margin 159 136 130 123 549
Total Gross Margin* 978 917 1,094 939 3,927
Operations & Maintenance* (331) (348) (350) (335) (1,364)
Depreciation & Amortization* (203) (206) (200) (212) (822)
Capital Costs and Other (74) (82) (54) (70) (280)
Taxes (174) (130) (216) (135) (655)
Utility Net Earnings $ 195 $ 150 $ 274 $ 186 $806
* Net of pass through items. See Appendix A-7 for reconciliation to 2003 Progress Energy Income Statement.
A-4
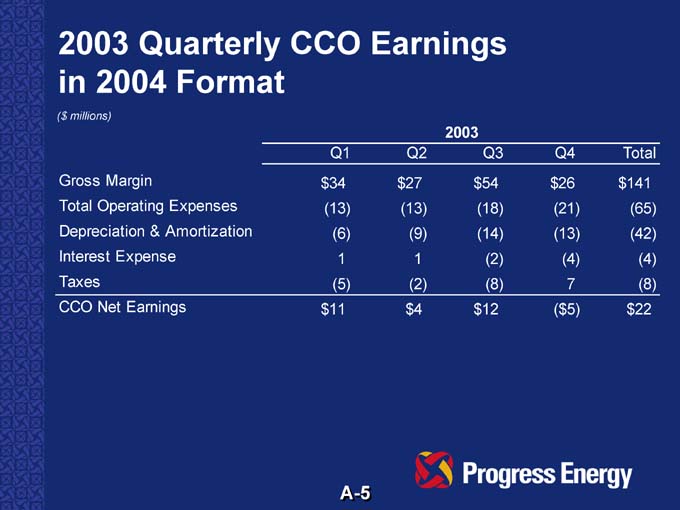
2003 Quarterly CCO Earnings in 2004 Format
($ millions)
2003
Q1 Q2 Q3 Q4 Total
Gross Margin $ 34 $ 27 $ 54 $ 26 $ 141
Total Operating Expenses (13) (13) (18) (21) (65)
Depreciation & Amortization (6) (9) (14) (13) (42)
Interest Expense 1 1 (2) (4) (4)
Taxes (5) (2) (8) 7 (8)
CCO Net Earnings $ 11 $4 $ 12 ( $5) $ 22
A-5
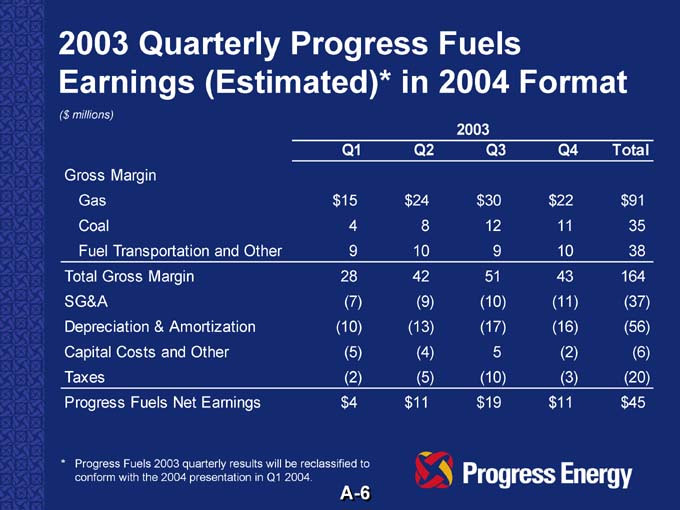
2003 Quarterly Progress Fuels Earnings (Estimated)* in 2004 Format
($ millions)
2003
Q1 Q2 Q3 Q4 Total
Gross Margin
Gas $ 15 $ 24 $ 30 $ 22 $ 91
Coal 4 8 12 11 35
Fuel Transportation and Other 9 10 9 10 38
Total Gross Margin 28 42 51 43 164
SG&A (7) (9) (10) (11) (37)
Depreciation & Amortization (10) (13) (17) (16) (56)
Capital Costs and Other (5) (4) 5 (2) (6)
Taxes (2) (5) (10) (3) (20)
Progress Fuels Net Earnings $4 $ 11 $ 19 $ 11 $ 45
* Progress Fuels 2003 quarterly results will be reclassified to conform with the 2004 presentation in Q1 2004.
A-6
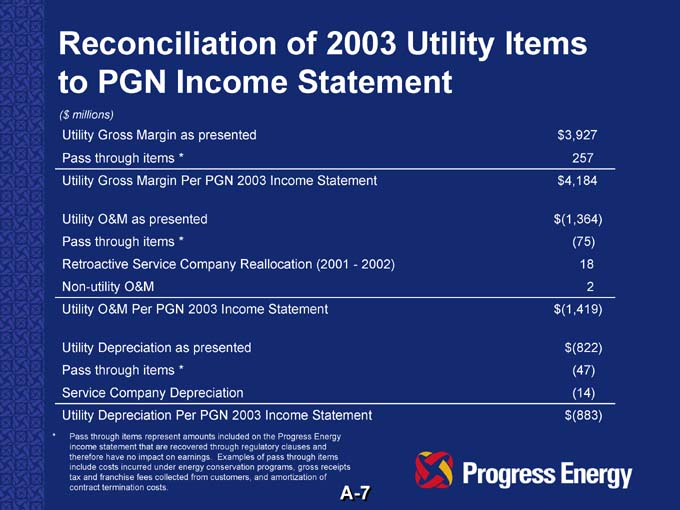
Reconciliation of 2003 Utility Items to PGN Income Statement
($ millions)
Utility Gross Margin as presented $ 3,927
Pass through items * 257
Utility Gross Margin Per PGN 2003 Income Statement $ 4,184
Utility O&M as presented $ (1,364)
Pass through items * (75)
Retroactive Service Company Reallocation (2001—2002) 18
Non-utility O&M 2
Utility O&M Per PGN 2003 Income Statement $ (1,419)
Utility Depreciation as presented $ (822)
Pass through items * (47)
Service Company Depreciation (14)
Utility Depreciation Per PGN 2003 Income Statement $ (883)
* Pass through items represent amounts included on the Progress Energy income statement that are recovered through regulatory clauses and therefore have no impact on earnings. Examples of pass through items include costs incurred under energy conservation programs, gross receipts tax and franchise fees collected from customers, and amortization of contract termination costs.
A-7