EXHIBIT 99.2
Data Book
February 2004
Progress Energy, Inc.
Safe Harbor for Forward-Looking Statements
This document contains forward-looking statements within the meaning of the safe harbor provisions of the Private Securities Litigation Reform Act of 1995. The forward-looking statements involve estimates, projections, goals, forecasts, assumptions, risk and uncertainties that could cause actual results to differ materially from those expressed in the forward-looking statements. Examples of factors that you should consider with respect to any forward looking statements made in this document include, but are not limited to, the following: the impact of fluid and complex government laws and regulations, including those relating to the environment; the impact of recent events in the energy markets that have increased the level of public and regulatory scrutiny in the energy industry and in the capital markets; deregulation or restructuring in the electric industry that may result in increased competition and unrecovered (stranded) costs; the uncertainty regarding the timing, creation and structure of regional transmission organizations; weather conditions that directly influence the demand for electricity and natural gas; recurring seasonal fluctuations in demand for electricity and natural gas; fluctuations in the price of energy commodities and purchased power; economic fluctuations and the corresponding impact on our commercial and industrial customers; the ability of our subsidiaries to pay upstream dividends or distributions to us; the impact on our facilities and our businesses from a terrorist attack; the inherent risks associated with the operation of nuclear facilities, including environmental, health, regulatory and financial risks; the ability to successfully access capital markets on favorable terms; the impact that increases in our leverage may have on us; our ability to maintain our current credit ratings; the impact of derivative contracts used in the normal course of our business; investment performance of pension and benefit plans and the ability to control costs; the availability and use of Internal Revenue Code Section 29 (Section 29) tax credits by synthetic fuel producers, and our continued ability to use Section 29 tax credits related to our coal and synthetic fuels businesses; our ability to successfully integrate newly acquired assets, properties or businesses into our operations as quickly or as profitably as expected; our ability to manage the risks involved with the operation of our nonregulated plants, including dependence on third parties and related counter-party risks, and a lack of operating history; our ability to manage the risks associated with our energy marketing operations; and unanticipated changes in operating expenses and capital expenditures. Many of these risks similarly impact our subsidiaries.
These and other risk factors are detailed from time to time in our SEC reports. All such factors are difficult to predict, contain uncertainties that may materially affect actual results, and may be beyond our ability to control or estimate precisely.
Progress Energy Data Book
The Progress Energy Data Book is only intended to be a summary of certain statistical information with respect to the company. It should be read in conjunction with, and not in lieu of, the company’s reports, including financials and notes to financials, on file with the Securities and Exchange Commission.
Independent auditors have not audited any of the financial and operating statements. Progress Energy disclaims any obligation to provide updated information.
This data book has been prepared to assist security analysts in understanding and evaluating the company. The format of this summary may change in the future as we continue to try to meet the needs of our investors.
This summary is not intended for use in connection with any sale, or offer to sale, or solicitation of any offer to buy securities. Inquiries concerning this summary should be directed to:
Investor Relations
Bob Drennan
Manager of Investor Relations (919) 546-7474
Sherri Daughtridge
Investor Relations Analyst (919) 546-5052
Eric Pompi
Investor Relations Analyst (919) 546-6931
www.progress-energy.com
Contents
Progress Energy at a Glance 3
Corporate Structure 4
Regulatory 5
Progress Energy Financial Overview 8
Energy Supply 22
Energy Delivery 27
Progress Ventures 30
Progress Rail 35
Progress Telecom 36
2
Progress Energy at a Glance
Corporate Profile
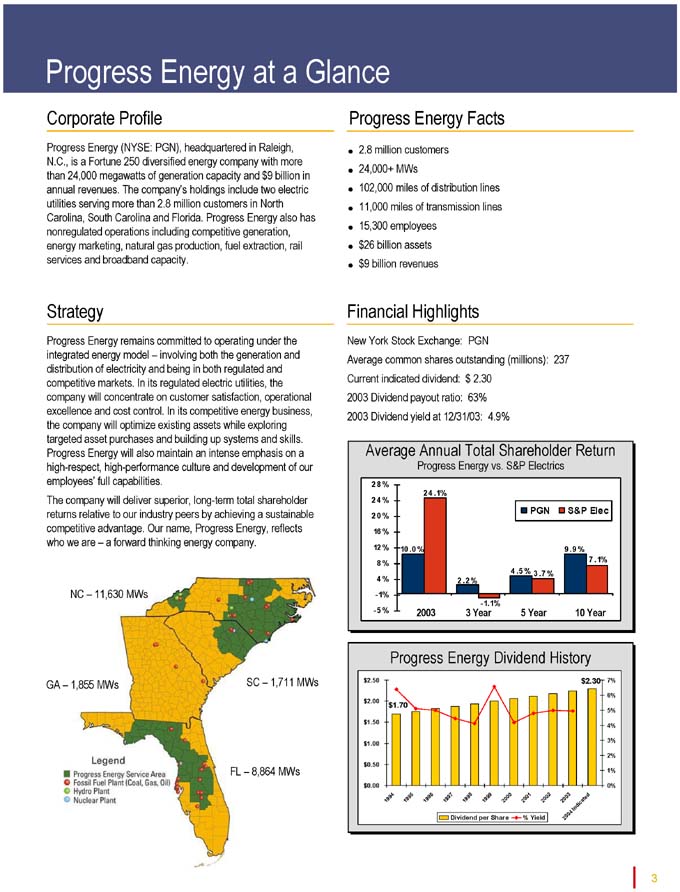
Progress Energy (NYSE: PGN), headquartered in Raleigh, N.C., is a Fortune 250 diversified energy company with more than 24,000 megawatts of generation capacity and $9 billion in annual revenues. The company’s holdings include two electric utilities serving more than 2.8 million customers in North Carolina, South Carolina and Florida. Progress Energy also has nonregulated operations including competitive generation, energy marketing, natural gas production, fuel extraction, rail services and broadband capacity.
Strategy
Progress Energy remains committed to operating under the integrated energy model – involving both the generation and distribution of electricity and being in both regulated and competitive markets. In its regulated electric utilities, the
company will concentrate on customer satisfaction, operational excellence and cost control. In its competitive energy business, the company will optimize existing assets while exploring targeted asset purchases and building up systems and skills. Progress Energy will also maintain an intense emphasis on a high-respect, high-performance culture and development of our employees’ full capabilities. The company will deliver superior, long-term total shareholder returns relative to our industry peers by achieving a sustainable competitive advantage. Our name, Progress Energy, reflects who we are – a forward thinking energy company.
NC – 11,630 MWs
GA – 1,855 MWs
SC – 1,711 MWs
FL – 8,864 MWs
Average Annual Total Shareholder Return
Progress Energy vs. S&P Electrics
2 4 .1%
10 .0 %
2003
2 .2 %
- 1.1%
3 Year
4 .5 %
3 .7 %
5 Year
9 .9 %
7 .1%
10 Year
PGN S&P Elec
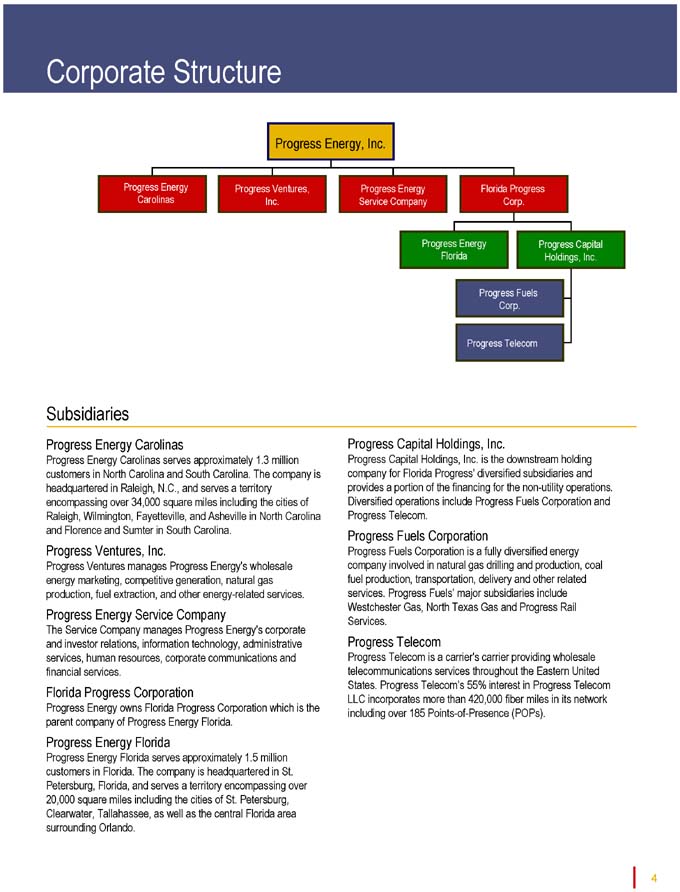
Corporate Structure
Progress Energy, Inc.
Progress Energy Carolinas
Progress Ventures, Inc.
Progress Energy Service Company
Florida Progress Corp.
Progress Energy Florida
Progress Capital Holdings, Inc.
Progress Fuels Corp.
Progress Telecom
Subsidiaries
Progress Energy Carolinas
Progress Energy Carolinas serves approximately 1.3 million customers in North Carolina and South Carolina. The company is headquartered in Raleigh, N.C., and serves a territory encompassing over 34,000 square miles including the cities of Raleigh, Wilmington, Fayetteville, and Asheville in North Carolina and Florence and Sumter in South Carolina.
Progress Ventures, Inc.
Progress Ventures manages Progress Energy’s wholesale energy marketing, competitive generation, natural gas production, fuel extraction, and other energy-related services.
Progress Energy Service Company
The Service Company manages Progress Energy’s corporate and investor relations, information technology, administrative services, human resources, corporate communications and financial services.
Florida Progress Corporation
Progress Energy owns Florida Progress Corporation which is the parent company of Progress Energy Florida.
Progress Energy Florida
Progress Energy Florida serves approximately 1.5 million customers in Florida. The company is headquartered in St. Petersburg, Florida, and serves a territory encompassing over 20,000 square miles including the cities of St. Petersburg, Clearwater, Tallahassee, as well as the central Florida area surrounding Orlando.
Progress Capital Holdings, Inc.
Progress Capital Holdings, Inc. is the downstream holding company for Florida Progress’ diversified subsidiaries and provides a portion of the financing for the non-utility operations. Diversified operations include Progress Fuels Corporation and Progress Telecom.
Progress Fuels Corporation
Progress Fuels Corporation is a fully diversified energy company involved in natural gas drilling and production, coal fuel production, transportation, delivery and other related services. Progress Fuels’ major subsidiaries include Westchester Gas, North Texas Gas and Progress Rail Services.
Progress Telecom
Progress Telecom is a carrier’s carrier providing wholesale telecommunications services throughout the Eastern United States. Progress Telecom’s 55% interest in Progress Telecom LLC incorporates more than 420,000 fiber miles in its network including over 185 Points-of-Presence (POPs).
4
Regulatory
Regulatory Jurisdictions and Commissioners
The company is subject to regulation by the North Carolina Utilities Commission (NCUC), the South Carolina Public Service Commission (SCPSC), and the Florida Public Service Commission (FPSC) which govern retail electric rates, and the Federal Energy Regulatory Commission (FERC), which governs wholesale electric rates.
The Governor appoints members of the NCUC for staggered, eight-year terms, subject to approval by the General Assembly. The Governor appoints the NCUC chairman for a four-year term. Members of the SCPSC are elected by the General Assembly from a list of nominees submitted by an eleven-member Merit Selection Panel. Terms of office are four years and run concurrently. The SCPSC members elect a chairman for a two-year term.
Members of the Florida Public Service Commission are appointed to four-year terms by the Governor and are
confirmed by the Florida Senate. The Chairman of the PSC is elected to a two-year term by majority vote of the Commissioners.
The President of the United States appoints members of the FERC for staggered, five-year terms, subject to confirmation by the U. S. Senate. Minority party representation is required. The President appoints the Chairman.
South Carolina Electric Retail
Fuel rates are set based on projected costs for a future twelvemonth test period. Hearings are held once a year. Any past over or under recovery is reflected in rates for a future twelve-month billing period.
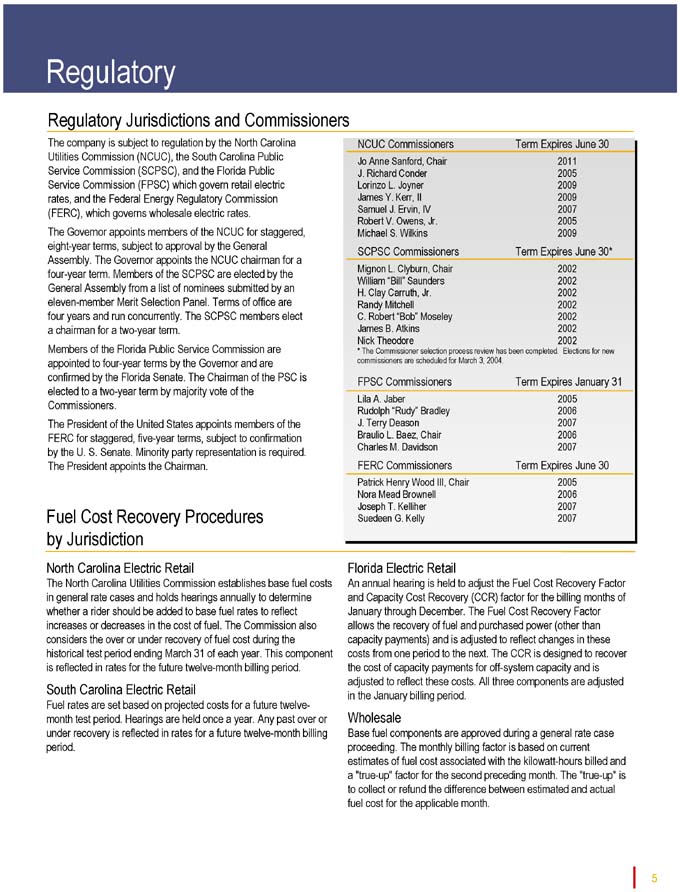
NCUC Commissioners Term Expires June 30
Jo Anne Sanford, Chair 2011
J. Richard Conder 2005
Lorinzo L. Joyner 2009
James Y. Kerr, II 2009
Samuel J. Ervin, IV 2007
Robert V. Owens, Jr. 2005
Michael S. Wilkins 2009
SCPSC Commissioners Term Expires June 30*
Mignon L. Clyburn, Chair 2002
William “Bill” Saunders 2002
H. Clay Carruth, Jr. 2002
Randy Mitchell 2002
C. Robert “Bob” Moseley 2002
James B. Atkins 2002
Nick Theodore 2002
* The Commissioner selection process review has been completed. Elections for new
commissioners are scheduled for March 3, 2004.
FPSC Commissioners Term Expires January 31
Lila A. Jaber 2005
Rudolph “Rudy” Bradley 2006
J. Terry Deason 2007
Braulio L. Baez, Chair 2006
Charles M. Davidson 2007
FERC Commissioners Term Expires June 30
Patrick Henry Wood III, Chair 2005
Nora Mead Brownell 2006
Joseph T. Kelliher 2007
Suedeen G. Kelly 2007
Fuel Cost Recovery Procedures by Jurisdiction
North Carolina Electric Retail
The North Carolina Utilities Commission establishes base fuel costs in general rate cases and holds hearings annually to determine whether a rider should be added to base fuel rates to reflect increases or decreases in the cost of fuel. The Commission also considers the over or under recovery of fuel cost during the historical test period ending March 31 of each year. This component is reflected in rates for the future twelve-month billing period.
Florida Electric Retail
An annual hearing is held to adjust the Fuel Cost Recovery Factor and Capacity Cost Recovery (CCR) factor for the billing months of January through December. The Fuel Cost Recovery Factor allows the recovery of fuel and purchased power (other than capacity payments) and is adjusted to reflect changes in these costs from one period to the next. The CCR is designed to recover the cost of capacity payments for off-system capacity and is adjusted to reflect these costs. All three components are adjusted in the January billing period.
Wholesale
Base fuel components are approved during a general rate case proceeding. The monthly billing factor is based on current estimates of fuel cost associated with the kilowatt-hours billed and a “true-up” factor for the second preceding month. The “true-up” is to collect or refund the difference between estimated and actual fuel cost for the applicable month.
5
Regulatory (continued)
Carolinas Restructuring
Progress Energy Carolinas continues to monitor progress toward a more competitive environment and has actively participated in regulatory reform deliberations in North Carolina and South Carolina. Progress Energy Carolinas expects that both the North Carolina and South Carolina General Assemblies will continue to monitor the experiences of states that have implemented electric restructuring legislation.
Florida Restructuring
Progress Energy Florida continues to monitor progress toward a more competitive environment and has actively participated in regulatory reform deliberations in Florida. Movement toward deregulation in this state has been affected by developments related to deregulation of the electric industry in other states.
In response to a legislative directive, the FPSC and the Florida Department of Environmental Protection submitted a joint report on renewable electric generating technologies for Florida in February 2003. The report assessed the feasibility and potential magnitude of renewable electric capacity for Florida, and summarized the mechanisms other states have adopted to encourage renewable energy. The report did not contain any policy recommendations.
National Energy Policy
A comprehensive energy bill passed the House in 2003 but stalled in the Senate (two votes short) just before Thanksgiving. The bill faces an uncertain future in Congress during 2004, especially given that it’s an election year. It’s possible that Congress may pass a slimmed-down bill or deal with portions of it separately. The outcome is difficult to predict.
Regional Transmission Organization
In early 2000, FERC issued Order 2000 regarding RTOs. This Order set minimum characteristics and functions that RTOs must meet, including independent transmission service. As a result of Order 2000, our electric utilities have responded as follows:
• Progress Energy Carolinas, along with Duke Energy and SCANA, filed an application with FERC for approval of a GridSouth RTO. On July 12, 2001, FERC issued an order provisionally approving GridSouth.
• Progress Energy Florida, along with Florida Power & Light and TECO, filed an application with FERC for approval of a GridFlorida RTO. On March 28, 2001, FERC issued an order provisionally approving GridFlorida.
However, in July 2001, FERC issued orders recommending that companies in the Southeast engage in a mediation to develop a plan for a single RTO for the Southeast. Progress Energy Carolinas and Progress Energy Florida participated in the mediation. FERC has not issued an order specifically on this mediation.
On July 31, 2002, FERC issued its Notice of Proposed Rulemaking in Docket No. RM01-12-000, Remedying Undue Discrimination through Open Access Transmission Service and Standard Electricity Market Design (SMD NOPR). If adopted as proposed, the rules set forth in the SMD NOPR would materially alter the manner in which transmission and generation services are provided and paid for. Progress Energy Carolinas and Progress Energy Florida filed comments on November 15, 2002 and supplemental comments on January 10, 2003. On April 28, 2003, the FERC released a White Paper on the Wholesale Market Platform. The White Paper provides an overview of what the FERC currently intends to include in a final rule in the SMD NOPR docket. The White Paper retains the fundamental and most protested aspects of SMD NOPR, including mandatory RTOs and the FERC’s assertion of jurisdiction over certain aspects of retail service. FERC has not yet issued a final rule on SMD NOPR.
The actual structure of GridSouth, GridFlorida or any alternative combined transmission structure, as well as the date it may become operational, depends upon the resolution of all regulatory approvals and technical issues.
6
$$/SPLIT
Regulatory (continued)
North Carolina Clean Air Legislation
On June 20, 2002, legislation was enacted in North Carolina requiring Progress Energy Carolinas and Duke Power to reduce nitrogen oxide emissions by 56 percent and sulfur dioxide emissions by 74 percent from 2001 levels. These requirements exceed current federal standards. Implementation will be phased, with final compliance to be achieved by 2013.
The bill contains a recovery mechanism for the full capital cost of the necessary upgrades. Progress Energy Carolinas’ total projected capital costs are approximately $813 million and will be recovered over a seven-year period, which includes a five-year retail customer base rate freeze. By the end of the rate freeze on December 31, 2007, Progress Energy Carolinas must record 70% of its projected capital costs, or $570 million, in accelerated amortization. In a single year, Progress Energy Carolinas can record a maximum of $174 million of accelerated amortization. As of December 31, 2003, Progress Energy Carolinas has recorded a total of $74 million of accelerated amortization.
The typical scrubber project will take 36 to 42 months to complete, with the first one scheduled to be on line in 2005. Other projects will follow until the final scrubbers come on line in 2012. O&M will increase due to the additional personnel, materials, and general maintenance associated with adding a scrubber to each unit. O&M increases are not recovered as part of this program.
Progress Energy Florida Rate Case Settlement
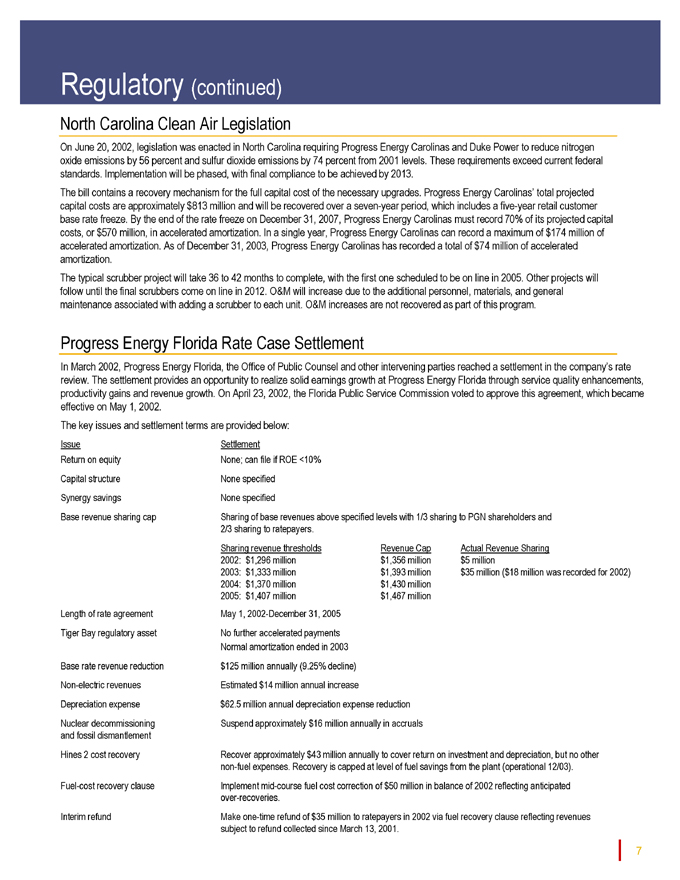
In March 2002, Progress Energy Florida, the Office of Public Counsel and other intervening parties reached a settlement in the company’s rate review. The settlement provides an opportunity to realize solid earnings growth at Progress Energy Florida through service quality enhancements, productivity gains and revenue growth. On April 23, 2002, the Florida Public Service Commission voted to approve this agreement, which became effective on May 1, 2002.
The key issues and settlement terms are provided below:
Issue Settlement
Return on equity None; can file if ROE <10%
Capital structure None specified
Synergy savings None specified
Base revenue sharing cap Sharing of base revenues above specified levels with 1/3 sharing to PGN shareholders and
2/3 sharing to ratepayers.
Sharing revenue thresholds Revenue Cap Actual Revenue Sharing
2002: $1,296 million $1,356 million $5 million
2003: $1,333 million $1,393 million $35 million ($18 million was recorded for 2002)
2004: $1,370 million $1,430 million
2005: $1,407 million $1,467 million
Length of rate agreement May 1, 2002-December 31, 2005
Tiger Bay regulatory asset No further accelerated payments
Normal amortization ended in 2003
Base rate revenue reduction $125 million annually (9.25% decline)
Non-electric revenues Estimated $14 million annual increase
Depreciation expense $62.5 million annual depreciation expense reduction
Nuclear decommissioning Suspend approximately $16 million annually in accruals
and fossil dismantlement
Hines 2 cost recovery Recover approximately $43 million annually to cover return on investment and depreciation, but no other
non-fuel expenses. Recovery is capped at level of fuel savings from the plant (operational 12/03).
Fuel-cost recovery clause Implement mid-course fuel cost correction of $50 million in balance of 2002 reflecting anticipated
over-recoveries.
Interim refund Make one-time refund of $35 million to ratepayers in 2002 via fuel recovery clause reflecting revenues
subject to refund collected since March 13, 2001.
7
Regulatory (continued)
North Carolina Clean Air Legislation
On June 20, 2002, legislation was enacted in North Carolina requiring Progress Energy Carolinas and Duke Power to reduce nitrogen oxide emissions by 56 percent and sulfur dioxide emissions by 74 percent from 2001 levels. These requirements exceed current federal standards. Implementation will be phased, with final compliance to be achieved by 2013.
The bill contains a recovery mechanism for the full capital cost of the necessary upgrades. Progress Energy Carolinas’ total projected capital costs are approximately $813 million and will be recovered over a seven-year period, which includes a five-year retail customer base rate freeze. By the end of the rate freeze on December 31, 2007, Progress Energy Carolinas must record 70% of its projected capital costs, or $570 million, in accelerated amortization. In a single year, Progress Energy Carolinas can record a maximum of $174 million of accelerated amortization. As of December 31, 2003, Progress Energy Carolinas has recorded a total of $74 million of accelerated amortization.
The typical scrubber project will take 36 to 42 months to complete, with the first one scheduled to be on line in 2005. Other projects will follow until the final scrubbers come on line in 2012. O&M will increase due to the additional personnel, materials, and general maintenance associated with adding a scrubber to each unit. O&M increases are not recovered as part of this program.
Progress Energy Florida Rate Case Settlement
In March 2002, Progress Energy Florida, the Office of Public Counsel and other intervening parties reached a settlement in the company’s rate review. The settlement provides an opportunity to realize solid earnings growth at Progress Energy Florida through service quality enhancements, productivity gains and revenue growth. On April 23, 2002, the Florida Public Service Commission voted to approve this agreement, which became effective on May 1, 2002.
The key issues and settlement terms are provided below:
Issue Settlement
Return on equity None; can file if ROE <10% Capital structure None specified Synergy savings None specified
Base revenue sharing cap Sharing of base revenues above specified levels with 1/3 sharing to PGN shareholders and 2/3 sharing to ratepayers.
Sharing revenue thresholds Revenue Cap Actual Revenue Sharing 2002: $1,296 million $1,356 million $5 million
2003: $1,333 million $1,393 million $35 million ($18 million was recorded for 2002) 2004: $1,370 million $1,430 million 2005: $1,407 million $1,467 million Length of rate agreement May 1, 2002-December 31, 2005 Tiger Bay regulatory asset No further accelerated payments Normal amortization ended in 2003 Base rate revenue reduction $125 million annually (9.25% decline) Non-electric revenues Estimated $14 million annual increase Depreciation expense $62.5 million annual depreciation expense reduction Nuclear decommissioning Suspend approximately $16 million annually in accruals and fossil dismantlement Hines 2 cost recovery Recover approximately $43 million annually to cover return on investment and depreciation, but no other non-fuel expenses. Recovery is capped at level of fuel savings from the plant (operational 12/03).
Fuel-cost recovery clause Implement mid-course fuel cost correction of $50 million in balance of 2002 reflecting anticipated over-recoveries.
Interim refund Make one-time refund of $35 million to ratepayers in 2002 via fuel recovery clause reflecting revenues subject to refund collected since March 13, 2001.
7
Progress Energy
Financial and Operating Highlights
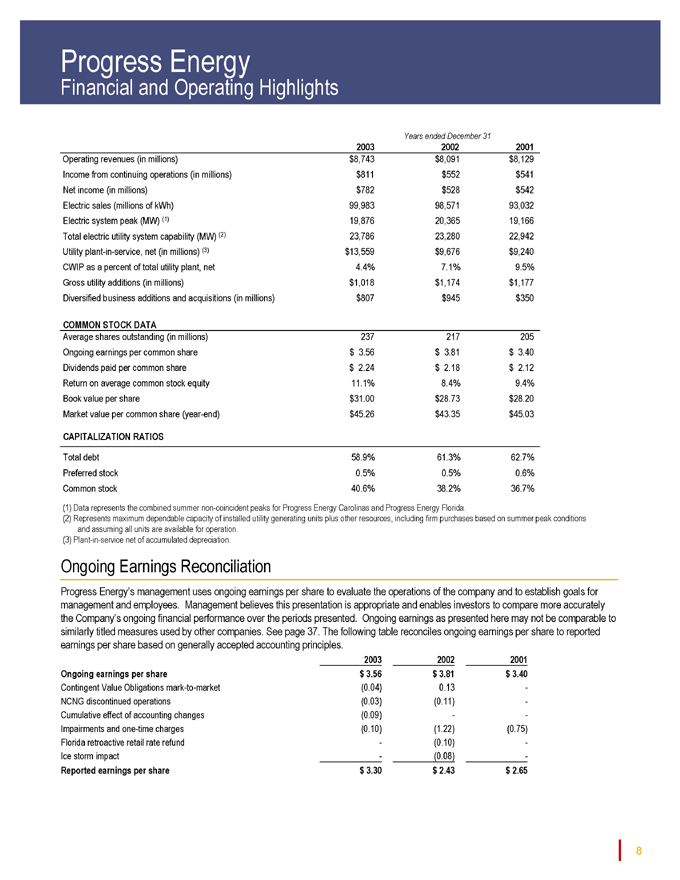
Years ended December 31
2003 2002 2001
Operating revenues (in millions) $8,743 $8,091 $8,129 Income from continuing operations (in millions) $811 $552 $541 Net income (in millions) $782 $528 $542 Electric sales (millions of kWh) 99,983 98,571 93,032 Electric system peak (MW) (1) 19,876 20,365 19,166 Total electric utility system capability (MW) (2) 23,786 23,280 22,942 Utility plant-in-service, net (in millions) (3) $13,559 $9,676 $9,240 CWIP as a percent of total utility plant, net 4.4% 7.1% 9.5% Gross utility additions (in millions) $1,018 $1,174 $1,177 Diversified business additions and acquisitions (in millions) $807 $945 $350
COMMON STOCK DATA
Average shares outstanding (in millions) 237 217 205
Ongoing earnings per common share $ 3.56 $ 3.81 $ 3.40
Dividends paid per common share $ 2.24 $ 2.18 $ 2.12 Return on average common stock equity 11.1% 8.4% 9.4%
Book value per share $31.00 $28.73 $28.20 Market value per common share (year-end) $45.26 $43.35 $45.03
CAPITALIZATION RATIOS
Total debt 58.9% 61.3% 62.7%
Preferred stock 0.5% 0.5% 0.6%
Common stock 40.6% 38.2% 36.7%
(1) Data represents the combined summer non-coincident peaks for Progress Energy Carolinas and Progress Energy Florida.
(2) Represents maximum dependable capacity of installed utility generating units plus other resources, including firm purchases based on summer peak conditions and assuming all units are available for operation.
(3) Plant-in-service net of accumulated depreciation.
Ongoing Earnings Reconciliation
Progress Energy’s management uses ongoing earnings per share to evaluate the operations of the company and to establish goals for management and employees. Management believes this presentation is appropriate and enables investors to compare more accurately the Company’s ongoing financial performance over the periods presented. Ongoing earnings as presented here may not be comparable to similarly titled measures used by other companies. The following table reconciles ongoing earnings per share to reported earnings per share based on generally accepted accounting principles.
2003 2002 2001 Ongoing earnings per share $ 3.56 $ 3.81 $ 3.40
Contingent Value Obligations mark-to-market (0.04) 0.13 -
NCNG discontinued operations (0.03) (0.11) -Cumulative effect of accounting changes (0.09) - -
Impairments and one-time charges (0.10) (1.22) (0.75)
Florida retroactive retail rate refund - (0.10) -
Ice storm impact - (0.08) - -
Reported earnings per share $ 3.30 $ 2.43 $ 2.65 8
Progress Energy
Financial and Operating Highlights (continued)
Credit Ratings
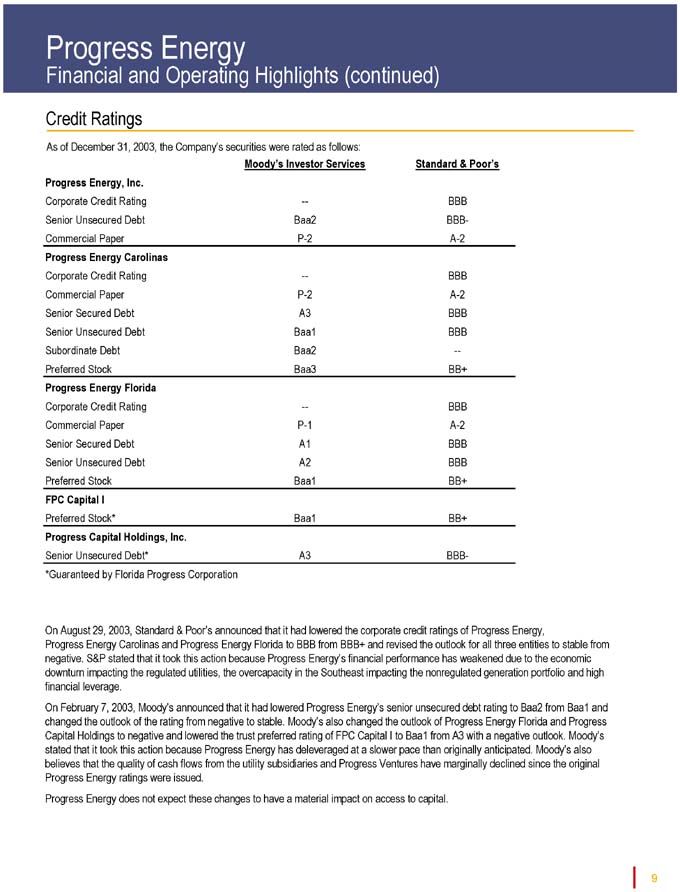
As of December 31, 2003, the Company’s securities were rated as follows:
Moody’s Investor Services Standard & Poor’s
Progress Energy, Inc.
Corporate Credit Rating — BBB
Senior Unsecured Debt Baa2 BBB-
Commercial Paper P-2 A-2
Progress Energy Carolinas
Corporate Credit Rating — BBB
Commercial Paper P-2 A-2
Senior Secured Debt A3 BBB
Senior Unsecured Debt Baa1 BBB
Subordinate Debt Baa2 —
Preferred Stock Baa3 BB+
Progress Energy Florida
Corporate Credit Rating — BBB
Commercial Paper P-1 A-2
Senior Secured Debt A1 BBB
Senior Unsecured Debt A2 BBB
Preferred Stock Baa1 BB+
FPC Capital I
Preferred Stock* Baa1 BB+
Progress Capital Holdings, Inc.
Senior Unsecured Debt* A3 BBB-
*Guaranteed by Florida Progress Corporation
On August 29, 2003, Standard & Poor’s announced that it had lowered the corporate credit ratings of Progress Energy,
Progress Energy Carolinas and Progress Energy Florida to BBB from BBB+ and revised the outlook for all three entities to stable from negative. S&P stated that it took this action because Progress Energy’s financial performance has weakened due to the economic downturn impacting the regulated utilities, the overcapacity in the Southeast impacting the nonregulated generation portfolio and high financial leverage.
On February 7, 2003, Moody’s announced that it had lowered Progress Energy’s senior unsecured debt rating to Baa2 from Baa1 and changed the outlook of the rating from negative to stable. Moody’s also changed the outlook of Progress Energy Florida and Progress Capital Holdings to negative and lowered the trust preferred rating of FPC Capital I to Baa1 from A3 with a negative outlook. Moody’s stated that it took this action because Progress Energy has deleveraged at a slower pace than originally anticipated. Moody’s also believes that the quality of cash flows from the utility subsidiaries and Progress Ventures have marginally declined since the original Progress Energy ratings were issued.
Progress Energy does not expect these changes to have a material impact on access to capital.
9
Progress Energy
Financial and Operating Highlights (continued)
Interest Coverage
(Dollars in millions)
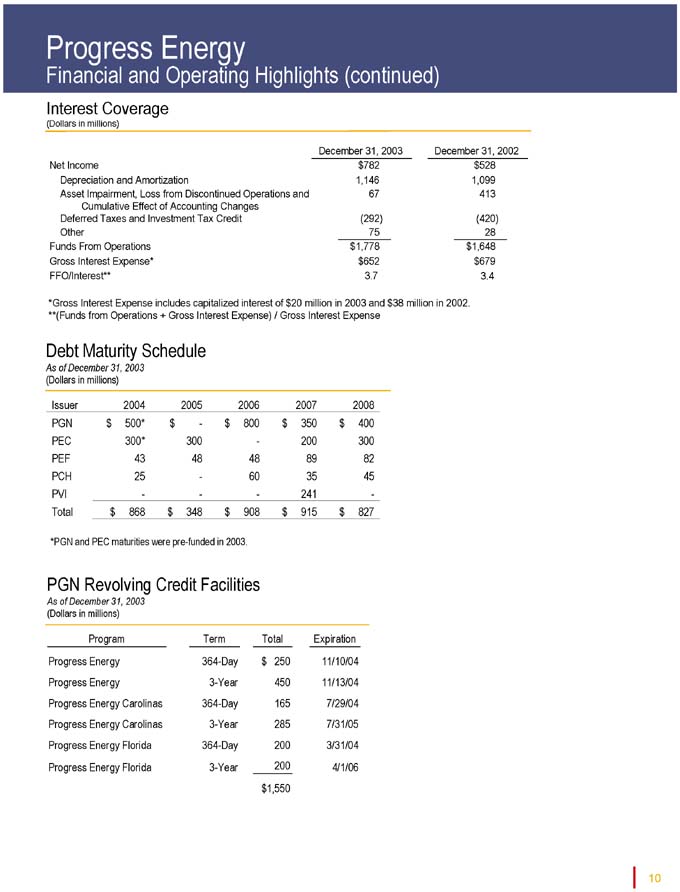
December 31, 2003 December 31, 2002
Net Income $ 782 $ 528
Depreciation and Amortization 1,146 1,099
Asset Impairment, Loss from Discontinued Operations and 67 413
Cumulative Effect of Accounting Changes
Deferred Taxes and Investment Tax Credit (292) (420)
Other 75 28
Funds From Operations $ 1,778 $ 1,648
Gross Interest Expense* $ 652 $ 679
FFO/Interest** 3.7 3.4
*Gross Interest Expense includes capitalized interest of $20 million in 2003 and $38 million in 2002. **(Funds from Operations + Gross Interest Expense) / Gross Interest Expense
Debt Maturity Schedule
As of December 31, 2003
(Dollars in millions)
Issuer 2004 2005 2006 2007 2008
PGN $ 500* $ - $ 800 $ 350 $ 400
PEC 300* 300 - 200 300
PEF 43 48 48 89 82
PCH 25 - 60 35 45
PVI - - - 241 -
Total $ 868 $ 348 $ 908 $ 915 $ 827
*PGN and PEC maturities were pre-funded in 2003.
PGN Revolving Credit Facilities
As of December 31, 2003
(Dollars in millions)
Program Term Total Expiration
Progress Energy 364-Day $ 250 11/10/04
Progress Energy 3-Year 450 11/13/04
Progress Energy Carolinas 364-Day 165 7/29/04
Progress Energy Carolinas 3-Year 285 7/31/05
Progress Energy Florida 364-Day 200 3/31/04
Progress Energy Florida 3-Year 200 4/1/06
$ 1,550
10

Progress Energy
Financial and Operating Highlights (continued)
Consolidated Schedule of Capitalization
At December 31, 2003 and 2002 the Company’s long-term debt consisted of the following (maturities and weighted-average interest rates as of December 31, 2003):
(Dollars in millions) 2003 2002
Progress Energy, Inc.:
Senior unsecured notes, maturing 2004-2031 6.86% $ 4,800 $ 4,800
Unamortized fair value hedge gain, net 19 34
Unamortized premium and discount, net (27) (31)
4,792 4,803
Progress Energy Carolinas:
First mortgage bonds, maturing 2004-2033 6.42% 1,900 1,550
Pollution control obligations, maturing 2010-2024 1.69% 708 708
Unsecured notes, maturing 2012 6.50% 500 500
Medium-term notes, maturing 2008 6.65% 300 300
Miscellaneous notes — 6
Unamortized premium and discount, net (22) (16)
3,386 3,048
Progress Energy Florida:
First mortgage bonds, maturing 2004-2033 5.60% 1,330 810
Pollution control obligations, maturing 2018-2027 1.04% 241 241
Medium-term notes, maturing 2004-2028 6.75% 379 417
Unamortized premium and discount, net (3) (7)
1,947 1,461
Progress Ventures, Inc.:
Variable rate project financing, maturing 2007 3.04% 241 225
Florida Progress Funding Corporation:
Debt to affiliated trust, maturing 2039 7.10% 309 —
Mandatorily redeemable preferred securities, maturing 2039 — 300
Unamortized premium and discount, net (39) (39)
270 261
Progress Capital Holdings, Inc.:
Medium-term notes, maturing 2004-2008 6.78% 165 223
Miscellaneous notes 1 1
166 224
Current portion of long-term debt (868) (275)
Total Long-Term Debt, Net $ 9,934 $ 9,747
At December 31, 2003 and 2002, the Company had $4 million and $695 million, respectively, of outstanding commercial paper and other short-term debt classified as short-term obligations. The weighted-average interest rates of such short-term obligations at December 31, 2003 and 2002 were 2.25% and 1.67%, respectively.
11
Progress Energy
Debt Portfolio Schedule
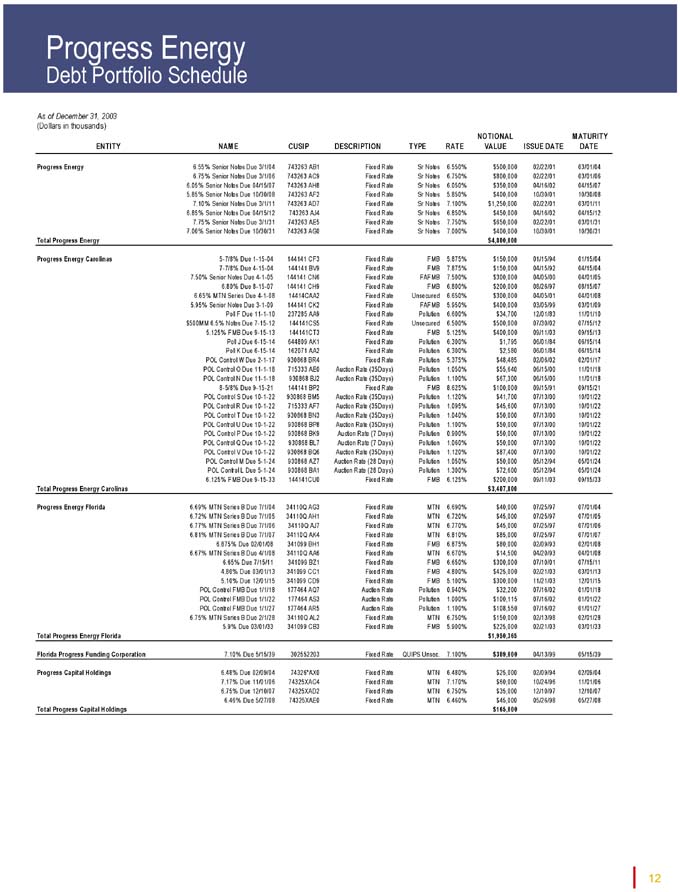
As of December 31, 2003
(Dollars in thousands)
NOTIONAL MATURITY
ENTITY NAME CUSIP DESCRIPTION TYPE RATE VALUE ISSUE DATE DATE
Progress Energy 6.55% Senior Notes Due 3/1/04 743263 AB1 Fixed Rate Sr Notes 6.550% $ 500,000 02/22/01 03/01/04
6.75% Senior Notes Due 3/1/06 743263 AC9 Fixed Rate Sr Notes 6.750% $ 800,000 02/22/01 03/01/06
6.05% Senior Notes Due 04/15/07 743263 AH8 Fixed Rate Sr Notes 6.050% $ 350,000 04/16/02 04/15/07
5.85% Senior Notes Due 10/30/08 743263 AF2 Fixed Rate Sr Notes 5.850% $ 400,000 10/30/01 10/30/08
7.10% Senior Notes Due 3/1/11 743263 AD7 Fixed Rate Sr Notes 7.100% $ 1,250,000 02/22/01 03/01/11
6.85% Senior Notes Due 04/15/12 743263 AJ4 Fixed Rate Sr Notes 6.850% $ 450,000 04/16/02 04/15/12
7.75% Senior Notes Due 3/1/31 743263 AE5 Fixed Rate Sr Notes 7.750% $ 650,000 02/22/01 03/01/31
7.00% Senior Notes Due 10/30/31 743263 AG0 Fixed Rate Sr Notes 7.000% $ 400,000 10/30/01 10/30/31
Total Progress Energy $ 4,800,000
Progress Energy Carolinas 5-7/8% Due 1-15-04 144141 CF3 Fixed Rate FMB 5.875% $ 150,000 01/15/94 01/15/04
7-7/8% Due 4-15-04 144141 BV9 Fixed Rate FMB 7.875% $ 150,000 04/15/92 04/15/04
7.50% Senior Notes Due 4-1-05 144141 CN6 Fixed Rate FAFMB 7.500% $ 300,000 04/05/00 04/01/05
6.80% Due 8-15-07 144141 CH9 Fixed Rate FMB 6.800% $ 200,000 08/26/97 08/15/07
6.65% MTN Series Due 4-1-08 14414CAA2 Fixed Rate Unsecured 6.650% $ 300,000 04/05/01 04/01/08
5.95% Senior Notes Due 3-1-09 144141 CK2 Fixed Rate FAFMB 5.950% $ 400,000 03/05/99 03/01/09
Poll F Due 11-1-10 237285 AA9 Fixed Rate Pollution 6.600% $ 34,700 12/01/83 11/01/10
$500MM 6.5% Notes Due 7-15-12 144141CS5 Fixed Rate Unsecured 6.500% $ 500,000 07/30/02 07/15/12
5.125% FMB Due 9-15-13 144141CT3 Fixed Rate FMB 5.125% $ 400,000 09/11/03 09/15/13
Poll J Due 6-15-14 644809 AK1 Fixed Rate Pollution 6.300% $ 1,795 06/01/84 06/15/14
Poll K Due 6-15-14 162071 AA2 Fixed Rate Pollution 6.300% $ 2,580 06/01/84 06/15/14
POL Control W Due 2-1-17 930868 BR4 Fixed Rate Pollution 5.375% $ 48,485 02/06/02 02/01/17
POL Control O Due 11-1-18 715333 AE0 Auction Rate (35Days) Pollution 1.050% $ 55,640 06/15/00 11/01/18
POL Control N Due 11-1-18 930868 BJ2 Auction Rate (35Days) Pollution 1.100% $ 67,300 06/15/00 11/01/18
8-5/8% Due 9-15-21 144141 BP2 Fixed Rate FMB 8.625% $ 100,000 09/15/91 09/15/21
POL Control S Due 10-1-22 930868 BM5 Auction Rate (35Days) Pollution 1.120% $ 41,700 07/13/00 10/01/22
POL Control R Due 10-1-22 715333 AF7 Auction Rate (35Days) Pollution 1.095% $ 45,600 07/13/00 10/01/22
POL Control T Due 10-1-22 930868 BN3 Auction Rate (35Days) Pollution 1.040% $ 50,000 07/13/00 10/01/22
POL Control U Due 10-1-22 930868 BP8 Auction Rate (35Days) Pollution 1.100% $ 50,000 07/13/00 10/01/22
POL Control P Due 10-1-22 930868 BK9 Auction Rate (7 Days) Pollution 0.900% $ 50,000 07/13/00 10/01/22
POL Control Q Due 10-1-22 930868 BL7 Auction Rate (7 Days) Pollution 1.060% $ 50,000 07/13/00 10/01/22
POL Control V Due 10-1-22 930868 BQ6 Auction Rate (35Days) Pollution 1.120% $ 87,400 07/13/00 10/01/22
POL Control M Due 5-1-24 930868 AZ7 Auction Rate (28 Days) Pollution 1.050% $ 50,000 05/12/94 05/01/24
POL Control L Due 5-1-24 930868 BA1 Auction Rate (28 Days) Pollution 1.300% $ 72,600 05/12/94 05/01/24
6.125% FMB Due 9-15-33 144141CU0 Fixed Rate FMB 6.125% $ 200,000 09/11/03 09/15/33
Total Progress Energy Carolinas $ 3,407,800
Progress Energy Florida 6.69% MTN Series B Due 7/1/04 34110Q AG3 Fixed Rate MTN 6.690% $ 40,000 07/25/97 07/01/04
6.72% MTN Series B Due 7/1/05 34110Q AH1 Fixed Rate MTN 6.720% $ 45,000 07/25/97 07/01/05
6.77% MTN Series B Due 7/1/06 34110Q AJ7 Fixed Rate MTN 6.770% $ 45,000 07/25/97 07/01/06
6.81% MTN Series B Due 7/1/07 34110Q AK4 Fixed Rate MTN 6.810% $ 85,000 07/25/97 07/01/07
6.875% Due 02/01/08 341099 BH1 Fixed Rate FMB 6.875% $ 80,000 02/09/93 02/01/08
6.67% MTN Series B Due 4/1/08 34110Q AA6 Fixed Rate MTN 6.670% $ 14,500 04/20/93 04/01/08
6.65% Due 7/15/11 341099 BZ1 Fixed Rate FMB 6.650% $ 300,000 07/10/01 07/15/11
4.80% Due 03/01/13 341099 CC1 Fixed Rate FMB 4.800% $ 425,000 02/21/03 03/01/13
5.10% Due 12/01/15 341099 CD9 Fixed Rate FMB 5.100% $ 300,000 11/21/03 12/01/15
POL Control FMB Due 1/1/18 177464 AQ7 Auction Rate Pollution 0.940% $ 32,200 07/16/02 01/01/18
POL Control FMB Due 1/1/22 177464 AS3 Auction Rate Pollution 1.000% $ 100,115 07/16/02 01/01/22
POL Control FMB Due 1/1/27 177464 AR5 Auction Rate Pollution 1.100% $ 108,550 07/16/02 01/01/27
6.75% MTN Series B Due 2/1/28 34110Q AL2 Fixed Rate MTN 6.750% $ 150,000 02/13/98 02/01/28
5.9% Due 03/01/33 341099 CB3 Fixed Rate FMB 5.900% $ 225,000 02/21/03 03/01/33
Total Progress Energy Florida $ 1,950,365
Florida Progress Funding Corporation 7.10% Due 5/15/39 302552203 Fixed Rate QUIPS Unsec. 7.100% $ 309,000 04/13/99 05/15/39
Progress Capital Holdings 6.48% Due 02/09/04 74326*AX0 Fixed Rate MTN 6.480% $ 25,000 02/09/94 02/09/04
7.17% Due 11/01/06 74325XAC4 Fixed Rate MTN 7.170% $ 60,000 10/24/96 11/01/06
6.75% Due 12/10/07 74325XAD2 Fixed Rate MTN 6.750% $ 35,000 12/10/97 12/10/07
6.46% Due 5/27/08 74325XAE0 Fixed Rate MTN 6.460% $ 45,000 05/26/98 05/27/08
Total Progress Capital Holdings $ 165,000
12

Progress Energy
Income Statement (unaudited)
Years Ended December 31
(In millions except per share data) 2003 2002 2001
Operating Revenues
Utility $ 6,741 $ 6,601 (f) $ 6,557
Diversified business 2,002 1,490 1,572
Total Operating Revenues 8,743 8,091 8,129
Operating Expenses
Utility
Fuel used in electric generation 1,695 1,586 1,543
Purchased power 862 862 868
Operation and maintenance 1,419 1,390 (g) 1,228
Depreciation and amortization 883 820 1,067
Taxes other than on income 405 386 380
Diversified business
Cost of sales 1,746 1,410 1,589
Depreciation and amortization 157 118 83
Impairment of long-lived assets 17 (a) 364 (h), (i) 43 (j)
Other 197 145 (h) 92 (j)
Total Operating Expenses 7,381 7,081 6,893
Operating Income 1,362 1,010 1,236
Other Income (Expense)
Interest income 11 15 22
Impairment of investments (21) (b) (25) (h) (164) (j)
Other, net (25) (c) 27 (c) (34) (c)
Total Other Income (Expense) (35) 17 (176)
Interest Charges
Net interest charges 632 641 690
Allowance for borrowed funds used during construction (7) (8) (17)
Total Interest Charges, Net 625 633 673
Income from Continuing Operations before Income Tax and
Cumulative Effect of Changes in Accounting Principles 702 394 387
Income Tax Benefit (109) (158) (154)
Income from Continuing Operations before Cumulative Effect of
Changes in Accounting Principles 811 552 541
Discontinued Operations, Net of Tax (8) (d) (24) (d) 1 (d)
Income before Cumulative Effect of Changes in Accounting Principles 803 528 542
Cumulative Effect of Changes in Accounting Principles, Net of Tax (21) (e) - -
Net Income $ 782 $ 528 $ 542
Average Common Shares Outstanding 237 217 205
Basic Earnings per Common Share
Income from Continuing Operations before Cumulative Effect $ 3.42 $ 2.54 $ 2.64
Discontinued Operations, Net of Tax (0.03) (0.11) 0.01
Cumulative Effect of Changes in Accounting Principles, Net of Tax (0.09) - -
Net Income $ 3.30 $ 2.43 $ 2.65
Diluted Earnings per Common Share
Income from Continuing Operations before Cumulative Effect $ 3.40 $ 2.53 $ 2.63
Discontinued Operations, Net of Tax (0.03) (0.11) 0.01
Cumulative Effect of Changes in Accounting Principles, Net of Tax (0.09) - -
Net Income $ 3.28 $ 2.42 $ 2.64
Dividends Declared per Common Share $ 2.26 $ 2.20 $ 2.14
(a) Asset impairments at Kentucky May Coal Company of $17 million pre-tax ($11 million after-tax).
(b) Primarily includes impairments of Affordable Housing portfolio of $21 million pre-tax ($13 million after-tax).
(c) Includes CVO mark-to-market pre-tax and after-tax adjustment of $9 million unrealized loss, $28 million unrealized gain and and $1 million unrealized loss for 2003, 2002 and 2001, respectively.
(d) Discontinued operations of North Carolina Natural Gas (NCNG).
(e) Primarily includes negative fair value adjustment for Broad River purchase power contract.
(f) Includes $35 million pre-tax decrease to revenues for Progress Energy Florida retroactive rate refund in March 2002 ($21 million after-tax). (g) Includes $27 million pre-tax increase in O&M costs for ice storm costs in December 2002 ($17 million after-tax).
(h) Diversified business—Impairment line item includes $305 million pre-tax impairment of PTC and Caronet assets; Diversified business—Other line item includes $25 million pre-tax other one-time charges for PTC and Caronet; Other Income—Impairment of investments line item includes $25 million pre-tax impairment of Interpath investment. Total pre-tax charges of $355 million, $225 million after-tax.
(i) Includes $59 million pre-tax impairment of Railcar Ltd. assets held for sale, $40 million after-tax. (j) Diversified business—Impairment line item includes $43 million pre-tax impairment of SRS assets; Diversified business—Other line item includes $2 million pre-tax other one-time charges for SRS;
Other Income—Impairment of investments line item includes $164 million pre-tax impairment of Interpath investment and lease termination payments. Total pre-tax charges of $209 million, $153 million after-tax.
13
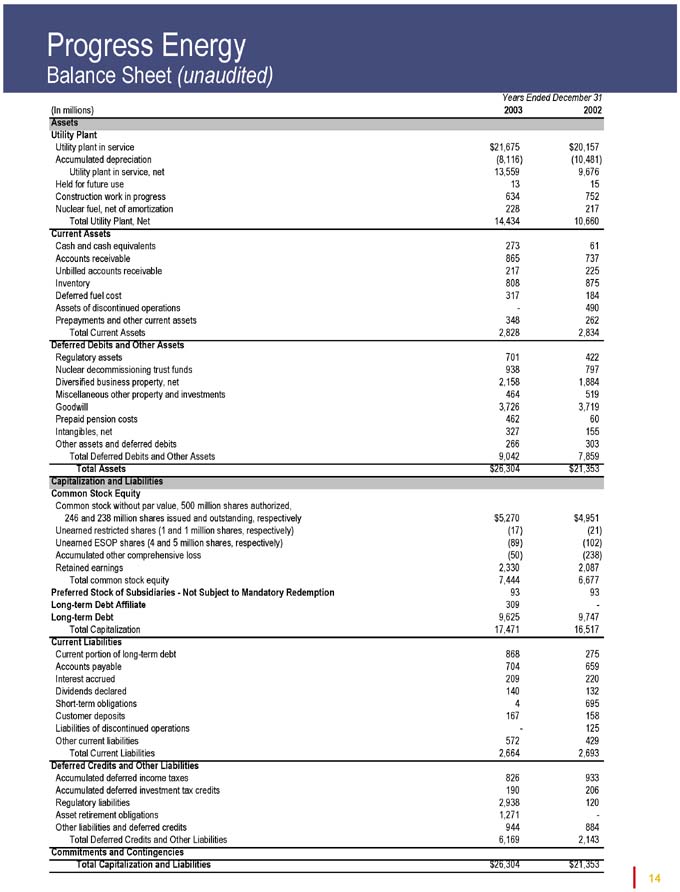
Progress Energy
Balance Sheet (unaudited)
Years Ended December 31
(In millions) 2003 2002
Assets
Utility Plant
Utility plant in service $ 21,675 $ 20,157
Accumulated depreciation (8,116) (10,481)
Utility plant in service, net 13,559 9,676
Held for future use 13 15
Construction work in progress 634 752
Nuclear fuel, net of amortization 228 217
Total Utility Plant, Net 14,434 10,660
Current Assets
Cash and cash equivalents 273 61
Accounts receivable 865 737
Unbilled accounts receivable 217 225
Inventory 808 875
Deferred fuel cost 317 184
Assets of discontinued operations - 490
Prepayments and other current assets 348 262
Total Current Assets 2,828 2,834
Deferred Debits and Other Assets
Regulatory assets 701 422
Nuclear decommissioning trust funds 938 797
Diversified business property, net 2,158 1,884
Miscellaneous other property and investments 464 519
Goodwill 3,726 3,719
Prepaid pension costs 462 60
Intangibles, net 327 155
Other assets and deferred debits 266 303
Total Deferred Debits and Other Assets 9,042 7,859
Total Assets $ 26,304 $ 21,353
Capitalization and Liabilities
Common Stock Equity
Common stock without par value, 500 million shares authorized,
246 and 238 million shares issued and outstanding, respectively $ 5,270 $ 4,951
Unearned restricted shares (1 and 1 million shares, respectively) (17) (21)
Unearned ESOP shares (4 and 5 million shares, respectively) (89) (102)
Accumulated other comprehensive loss (50) (238)
Retained earnings 2,330 2,087
Total common stock equity 7,444 6,677
Preferred Stock of Subsidiaries—Not Subject to Mandatory Redemption 93 93
Long-term Debt Affiliate 309 -
Long-term Debt 9,625 9,747
Total Capitalization 17,471 16,517
Current Liabilities
Current portion of long-term debt 868 275
Accounts payable 704 659
Interest accrued 209 220
Dividends declared 140 132
Short-term obligations 4 695
Customer deposits 167 158
Liabilities of discontinued operations - 125
Other current liabilities 572 429
Total Current Liabilities 2,664 2,693
Deferred Credits and Other Liabilities
Accumulated deferred income taxes 826 933
Accumulated deferred investment tax credits 190 206
Regulatory liabilities 2,938 120
Asset retirement obligations 1,271 -
Other liabilities and deferred credits 944 884
Total Deferred Credits and Other Liabilities 6,169 2,143
Commitments and Contingencies
Total Capitalization and Liabilities $ 26,304 $ 21,353
14
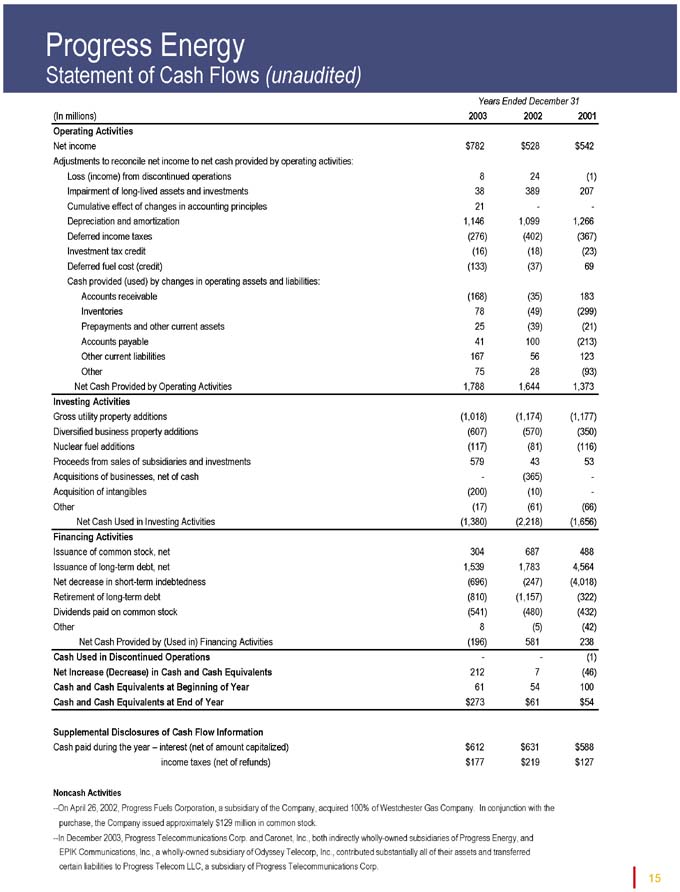
Progress Energy
Statement of Cash Flows (unaudited)
Years Ended December 31
(In millions) 2003 2002 2001
Operating Activities
Net income $ 782 $ 528 $ 542
Adjustments to reconcile net income to net cash provided by operating activities:
Loss (income) from discontinued operations 8 24 (1)
Impairment of long-lived assets and investments 38 389 207
Cumulative effect of changes in accounting principles 21 - -
Depreciation and amortization 1,146 1,099 1,266
Deferred income taxes (276) (402) (367)
Investment tax credit (16) (18) (23)
Deferred fuel cost (credit) (133) (37) 69
Cash provided (used) by changes in operating assets and liabilities:
Accounts receivable (168) (35) 183
Inventories 78 (49) (299)
Prepayments and other current assets 25 (39) (21)
Accounts payable 41 100 (213)
Other current liabilities 167 56 123
Other 75 28 (93)
Net Cash Provided by Operating Activities 1,788 1,644 1,373
Investing Activities
Gross utility property additions (1,018) (1,174) (1,177)
Diversified business property additions (607) (570) (350)
Nuclear fuel additions (117) (81) (116)
Proceeds from sales of subsidiaries and investments 579 43 53
Acquisitions of businesses, net of cash - (365) -
Acquisition of intangibles (200) (10) -
Other (17) (61) (66)
Net Cash Used in Investing Activities (1,380) (2,218) (1,656)
Financing Activities
Issuance of common stock, net 304 687 488
Issuance of long-term debt, net 1,539 1,783 4,564
Net decrease in short-term indebtedness (696) (247) (4,018)
Retirement of long-term debt (810) (1,157) (322)
Dividends paid on common stock (541) (480) (432)
Other 8 (5) (42)
Net Cash Provided by (Used in) Financing Activities (196) 581 238
Cash Used in Discontinued Operations - - (1)
Net Increase (Decrease) in Cash and Cash Equivalents 212 7 (46)
Cash and Cash Equivalents at Beginning of Year 61 54 100
Cash and Cash Equivalents at End of Year $ 273 $ 61 $ 54
Supplemental Disclosures of Cash Flow Information
Cash paid during the year – interest (net of amount capitalized) $ 612 $ 631 $ 588
income taxes (net of refunds) $ 177 $ 219 $ 127
Noncash Activities
—On April 26, 2002, Progress Fuels Corporation, a subsidiary of the Company, acquired 100% of Westchester Gas Company. In conjunction with the purchase, the Company issued approximately $129 million in common stock.
—In December 2003, Progress Telecommunications Corp. and Caronet, Inc., both indirectly wholly-owned subsidiaries of Progress Energy, and EPIK Communications, Inc., a wholly-owned subsidiary of Odyssey Telecorp, Inc., contributed substantially all of their assets and transferred certain liabilities to Progress Telecom LLC, a subsidiary of Progress Telecommunications Corp.
15
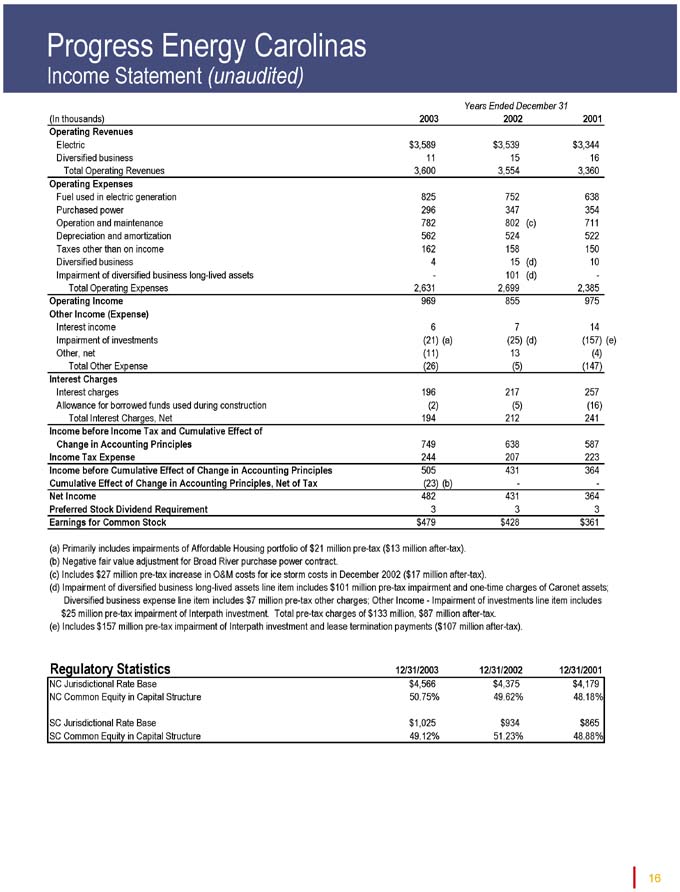
Progress Energy Carolinas
Income Statement (unaudited)
Years Ended December 31
(In thousands) 2003 2002 2001
Operating Revenues
Electric $ 3,589 $ 3,539 $ 3,344
Diversified business 11 15 16
Total Operating Revenues 3,600 3,554 3,360
Operating Expenses
Fuel used in electric generation 825 752 638
Purchased power 296 347 354
Operation and maintenance 782 802 (c) 711
Depreciation and amortization 562 524 522
Taxes other than on income 162 158 150
Diversified business 4 15 (d) 10
Impairment of diversified business long-lived assets - 101 (d) -
Total Operating Expenses 2,631 2,699 2,385
Operating Income 969 855 975
Other Income (Expense)
Interest income 6 7 14
Impairment of investments (21) (a) (25) (d) (157) (e)
Other, net (11) 13 (4)
Total Other Expense (26) (5) (147)
Interest Charges
Interest charges 196 217 257
Allowance for borrowed funds used during construction (2) (5) (16)
Total Interest Charges, Net 194 212 241
Income before Income Tax and Cumulative Effect of
Change in Accounting Principles 749 638 587
Income Tax Expense 244 207 223
Income before Cumulative Effect of Change in Accounting Principles 505 431 364
Cumulative Effect of Change in Accounting Principles, Net of Tax (23) (b) - -
Net Income 482 431 364
Preferred Stock Dividend Requirement 3 3 3
Earnings for Common Stock $479 $428 $361
(a) Primarily includes impairments of Affordable Housing portfolio of $21 million pre-tax ($13 million after-tax). (b) Negative fair value adjustment for Broad River purchase power contract.
(c) Includes $27 million pre-tax increase in O&M costs for ice storm costs in December 2002 ($17 million after-tax).
(d) Impairment of diversified business long-lived assets line item includes $101 million pre-tax impairment and one-time charges of Caronet assets; Diversified business expense line item includes $7 million pre-tax other charges; Other Income—Impairment of investments line item includes $25 million pre-tax impairment of Interpath investment. Total pre-tax charges of $133 million, $87 million after-tax.
(e) Includes $157 million pre-tax impairment of Interpath investment and lease termination payments ($107 million after-tax).
Regulatory Statistics 12/31/2003 12/31/2002 12/31/2001
NC Jurisdictional Rate Base $ 4,566 $ 4,375 $ 4,179
NC Common Equity in Capital Structure 50.75% 49.62% 48.18%
SC Jurisdictional Rate Base $ 1,025 $934 $865
SC Common Equity in Capital Structure 49.12% 51.23% 48.88%
16
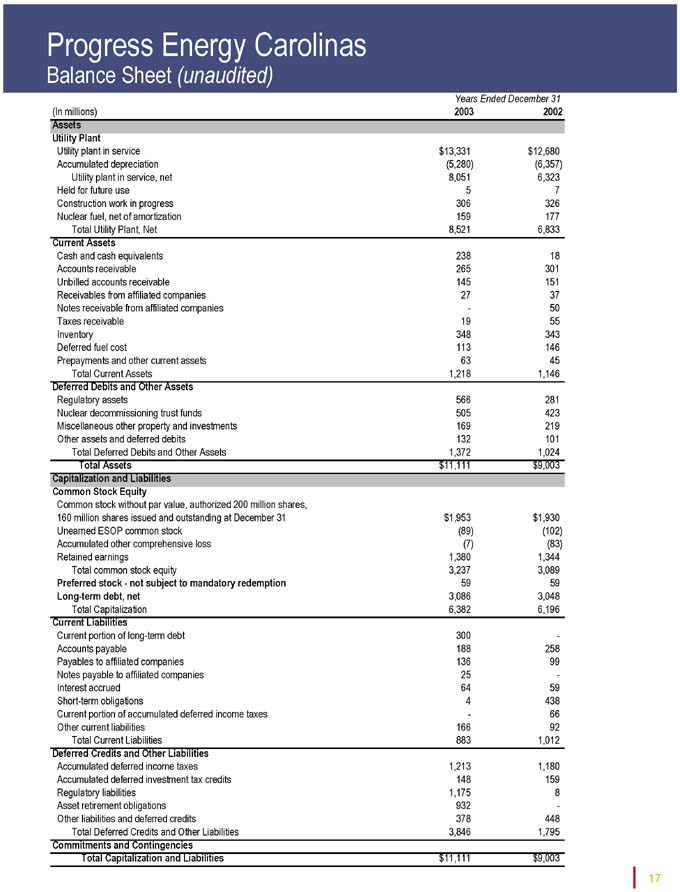
Progress Energy Carolinas
Balance Sheet (unaudited)
Years Ended December 31
(In millions) 2003 2002
Assets
Utility Plant
Utility plant in service $ 13,331 $ 12,680
Accumulated depreciation (5,280) (6,357)
Utility plant in service, net 8,051 6,323
Held for future use 5 7
Construction work in progress 306 326
Nuclear fuel, net of amortization 159 177
Total Utility Plant, Net 8,521 6,833
Current Assets
Cash and cash equivalents 238 18
Accounts receivable 265 301
Unbilled accounts receivable 145 151
Receivables from affiliated companies 27 37
Notes receivable from affiliated companies - 50
Taxes receivable 19 55
Inventory 348 343
Deferred fuel cost 113 146
Prepayments and other current assets 63 45
Total Current Assets 1,218 1,146
Deferred Debits and Other Assets
Regulatory assets 566 281
Nuclear decommissioning trust funds 505 423
Miscellaneous other property and investments 169 219
Other assets and deferred debits 132 101
Total Deferred Debits and Other Assets 1,372 1,024
Total Assets $ 11,111 $ 9,003
Capitalization and Liabilities
Common Stock Equity
Common stock without par value, authorized 200 million shares,
160 million shares issued and outstanding at December 31 $ 1,953 $ 1,930
Unearned ESOP common stock (89) (102)
Accumulated other comprehensive loss (7) (83)
Retained earnings 1,380 1,344
Total common stock equity 3,237 3,089
Preferred stock—not subject to mandatory redemption 59 59
Long-term debt, net 3,086 3,048
Total Capitalization 6,382 6,196
Current Liabilities
Current portion of long-term debt 300 -
Accounts payable 188 258
Payables to affiliated companies 136 99
Notes payable to affiliated companies 25 -
Interest accrued 64 59
Short-term obligations 4 438
Current portion of accumulated deferred income taxes - 66
Other current liabilities 166 92
Total Current Liabilities 883 1,012
Deferred Credits and Other Liabilities
Accumulated deferred income taxes 1,213 1,180
Accumulated deferred investment tax credits 148 159
Regulatory liabilities 1,175 8
Asset retirement obligations 932 -
Other liabilities and deferred credits 378 448
Total Deferred Credits and Other Liabilities 3,846 1,795
Commitments and Contingencies
Total Capitalization and Liabilities $ 11,111 $ 9,003
17
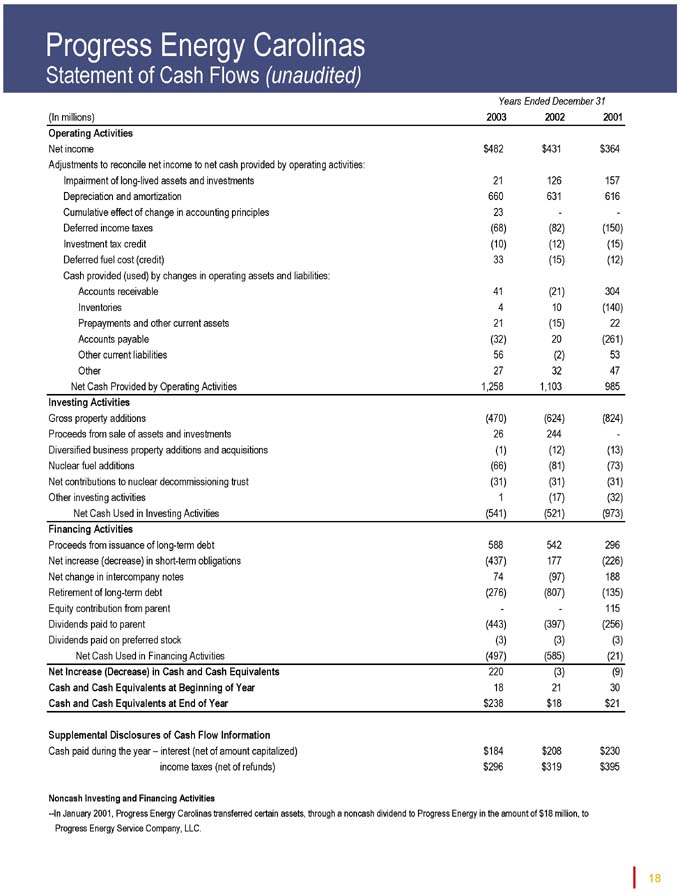
Progress Energy Carolinas
Statement of Cash Flows (unaudited)
Years Ended December 31
(In millions) 2003 2002 2001
Operating Activities
Net income $ 482 $ 431 $ 364
Adjustments to reconcile net income to net cash provided by operating activities:
Impairment of long-lived assets and investments 21 126 157
Depreciation and amortization 660 631 616
Cumulative effect of change in accounting principles 23 - -
Deferred income taxes (68) (82) (150)
Investment tax credit (10) (12) (15)
Deferred fuel cost (credit) 33 (15) (12)
Cash provided (used) by changes in operating assets and liabilities:
Accounts receivable 41 (21) 304
Inventories 4 10 (140)
Prepayments and other current assets 21 (15) 22
Accounts payable (32) 20 (261)
Other current liabilities 56 (2) 53
Other 27 32 47
Net Cash Provided by Operating Activities 1,258 1,103 985
Investing Activities
Gross property additions (470) (624) (824)
Proceeds from sale of assets and investments 26 244 -
Diversified business property additions and acquisitions (1) (12) (13)
Nuclear fuel additions (66) (81) (73)
Net contributions to nuclear decommissioning trust (31) (31) (31)
Other investing activities 1 (17) (32)
Net Cash Used in Investing Activities (541) (521) (973)
Financing Activities
Proceeds from issuance of long-term debt 588 542 296
Net increase (decrease) in short-term obligations (437) 177 (226)
Net change in intercompany notes 74 (97) 188
Retirement of long-term debt (276) (807) (135)
Equity contribution from parent - - 115
Dividends paid to parent (443) (397) (256)
Dividends paid on preferred stock (3) (3) (3)
Net Cash Used in Financing Activities (497) (585) (21)
Net Increase (Decrease) in Cash and Cash Equivalents 220 (3) (9)
Cash and Cash Equivalents at Beginning of Year 18 21 30
Cash and Cash Equivalents at End of Year $ 238 $ 18 $ 21
Supplemental Disclosures of Cash Flow Information
Cash paid during the year – interest (net of amount capitalized) $ 184 $ 208 $ 230
income taxes (net of refunds) $ 296 $ 319 $ 395
Noncash Investing and Financing Activities
—In January 2001, Progress Energy Carolinas transferred certain assets, through a noncash dividend to Progress Energy in the amount of $18 million, to Progress Energy Service Company, LLC.
18
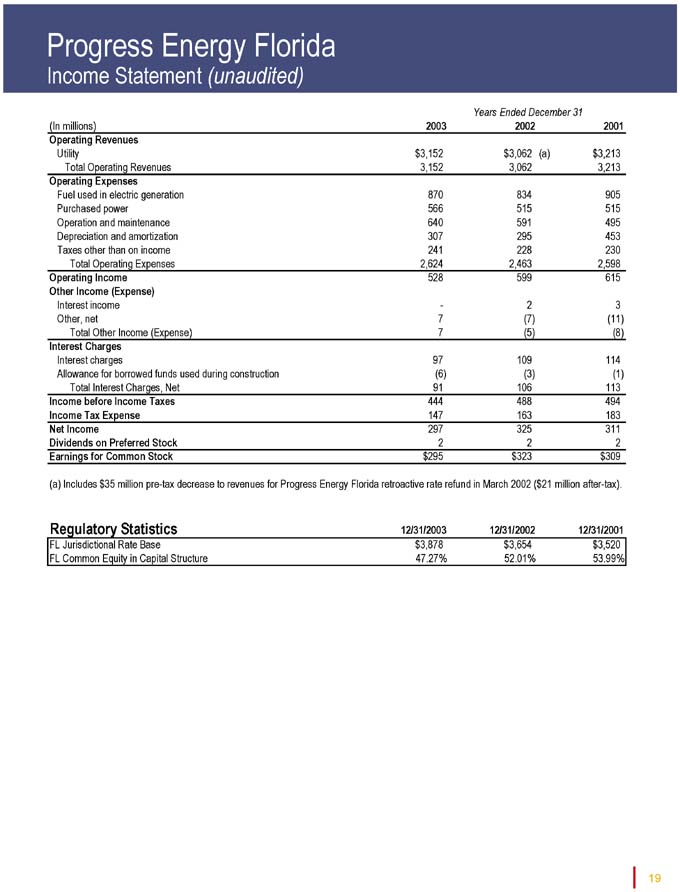
Progress Energy Florida
Income Statement (unaudited)
Years Ended December 31
(In millions) 2003 2002 2001
Operating Revenues
Utility $ 3,152 $ 3,062 (a) $ 3,213
Total Operating Revenues 3,152 3,062 3,213
Operating Expenses
Fuel used in electric generation 870 834 905
Purchased power 566 515 515
Operation and maintenance 640 591 495
Depreciation and amortization 307 295 453
Taxes other than on income 241 228 230
Total Operating Expenses 2,624 2,463 2,598
Operating Income 528 599 615
Other Income (Expense)
Interest income - 2 3
Other, net 7 (7) (11)
Total Other Income (Expense) 7 (5) (8)
Interest Charges
Interest charges 97 109 114
Allowance for borrowed funds used during construction (6) (3) (1)
Total Interest Charges, Net 91 106 113
Income before Income Taxes 444 488 494
Income Tax Expense 147 163 183
Net Income 297 325 311
Dividends on Preferred Stock 2 2 2
Earnings for Common Stock $ 295 $323 $309
(a) Includes $35 million pre-tax decrease to revenues for Progress Energy Florida retroactive rate refund in March 2002 ($21 million after-tax).
Regulatory Statistics 12/31/2003 12/31/2002 12/31/2001
FL Jurisdictional Rate Base $3,878 $3,654 $3,520
FL Common Equity in Capital Structure 47.27% 52.01% 53.99%
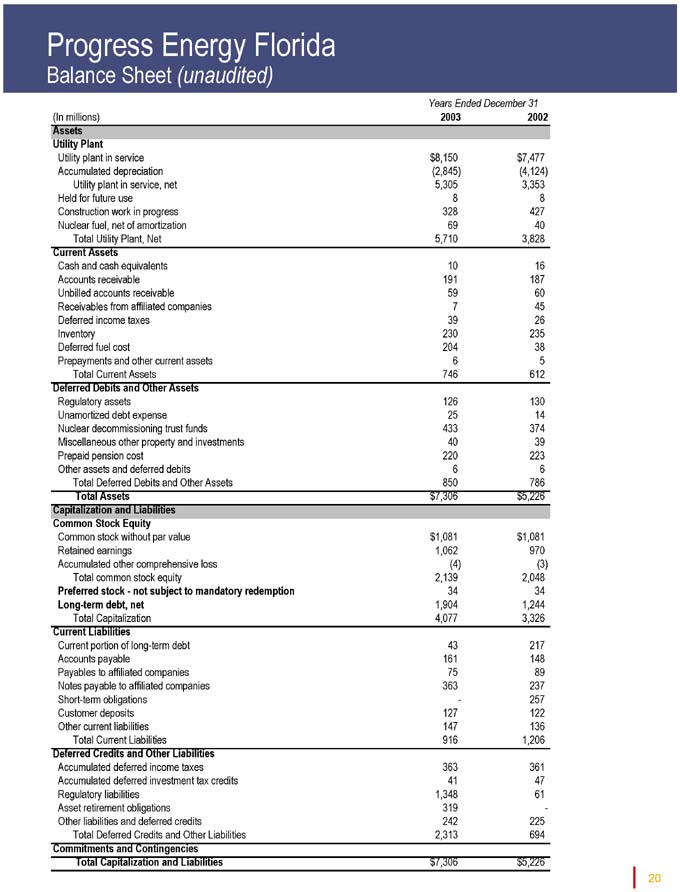
Progress Energy Florida
Balance Sheet (unaudited)
Years Ended December 31
(In millions) 2003 2002
Assets
Utility Plant
Utility plant in service $ 8,150 $ 7,477
Accumulated depreciation (2,845) (4,124)
Utility plant in service, net 5,305 3,353
Held for future use 8 8
Construction work in progress 328 427
Nuclear fuel, net of amortization 69 40
Total Utility Plant, Net 5,710 3,828
Current Assets
Cash and cash equivalents 10 16
Accounts receivable 191 187
Unbilled accounts receivable 59 60
Receivables from affiliated companies 7 45
Deferred income taxes 39 26
Inventory 230 235
Deferred fuel cost 204 38
Prepayments and other current assets 6 5
Total Current Assets 746 612
Deferred Debits and Other Assets
Regulatory assets 126 130
Unamortized debt expense 25 14
Nuclear decommissioning trust funds 433 374
Miscellaneous other property and investments 40 39
Prepaid pension cost 220 223
Other assets and deferred debits 6 6
Total Deferred Debits and Other Assets 850 786
Total Assets $ 7,306 $ 5,226
Capitalization and Liabilities
Common Stock Equity
Common stock without par value $ 1,081 $ 1,081
Retained earnings 1,062 970
Accumulated other comprehensive loss (4) (3)
Total common stock equity 2,139 2,048
Preferred stock—not subject to mandatory redemption 34 34
Long-term debt, net 1,904 1,244
Total Capitalization 4,077 3,326
Current Liabilities
Current portion of long-term debt 43 217
Accounts payable 161 148
Payables to affiliated companies 75 89
Notes payable to affiliated companies 363 237
Short-term obligations - 257
Customer deposits 127 122
Other current liabilities 147 136
Total Current Liabilities 916 1,206
Deferred Credits and Other Liabilities
Accumulated deferred income taxes 363 361
Accumulated deferred investment tax credits 41 47
Regulatory liabilities 1,348 61
Asset retirement obligations 319 -
Other liabilities and deferred credits 242 225
Total Deferred Credits and Other Liabilities 2,313 694
Commitments and Contingencies
Total Capitalization and Liabilities $ 7,306 $ 5,226
20
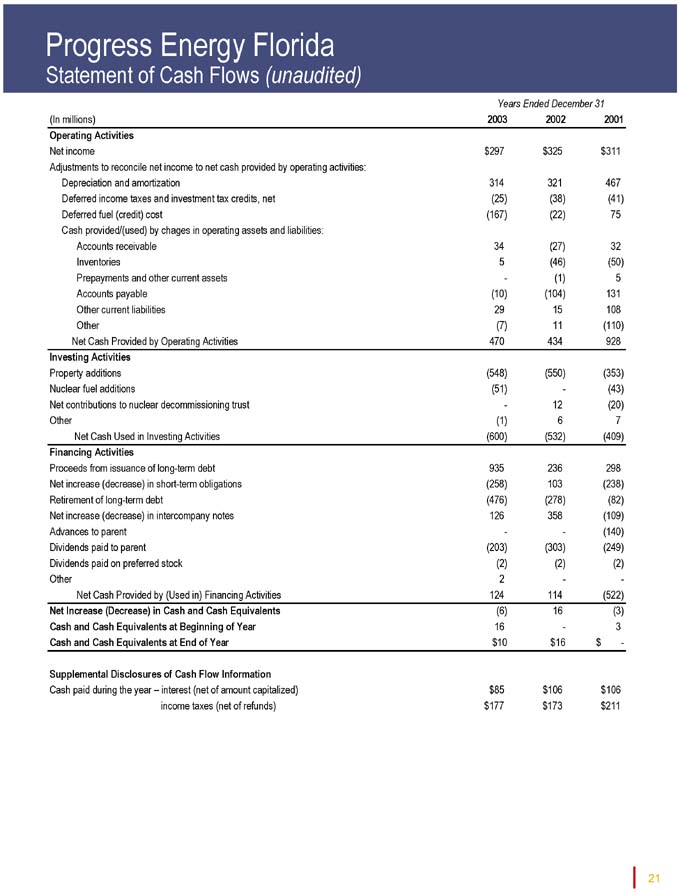
Progress Energy Florida
Statement of Cash Flows (unaudited)
Years Ended December 31
(In millions) 2003 2002 2001
Operating Activities
Net income $ 297 $ 325 $ 311
Adjustments to reconcile net income to net cash provided by operating activities:
Depreciation and amortization 314 321 467
Deferred income taxes and investment tax credits, net (25) (38) (41)
Deferred fuel (credit) cost (167) (22) 75
Cash provided/(used) by chages in operating assets and liabilities:
Accounts receivable 34 (27) 32
Inventories 5 (46) (50)
Prepayments and other current assets - (1) 5
Accounts payable (10) (104) 131
Other current liabilities 29 15 108
Other (7) 11 (110)
Net Cash Provided by Operating Activities 470 434 928
Investing Activities
Property additions (548) (550) (353)
Nuclear fuel additions (51) - (43)
Net contributions to nuclear decommissioning trust - 12 (20)
Other (1) 6 7
Net Cash Used in Investing Activities (600) (532) (409)
Financing Activities
Proceeds from issuance of long-term debt 935 236 298
Net increase (decrease) in short-term obligations (258) 103 (238)
Retirement of long-term debt (476) (278) (82)
Net increase (decrease) in intercompany notes 126 358 (109)
Advances to parent - - (140)
Dividends paid to parent (203) (303) (249)
Dividends paid on preferred stock (2) (2) (2)
Other 2 - -
Net Cash Provided by (Used in) Financing Activities 124 114 (522)
Net Increase (Decrease) in Cash and Cash Equivalents (6) 16 (3)
Cash and Cash Equivalents at Beginning of Year 16 - 3
Cash and Cash Equivalents at End of Year $ 10 $ 16 $ -
Supplemental Disclosures of Cash Flow Information
Cash paid during the year – interest (net of amount capitalized) $ 85 $ 106 $ 106
income taxes (net of refunds) $ 177 $ 173 $ 211
Energy Supply (continued)
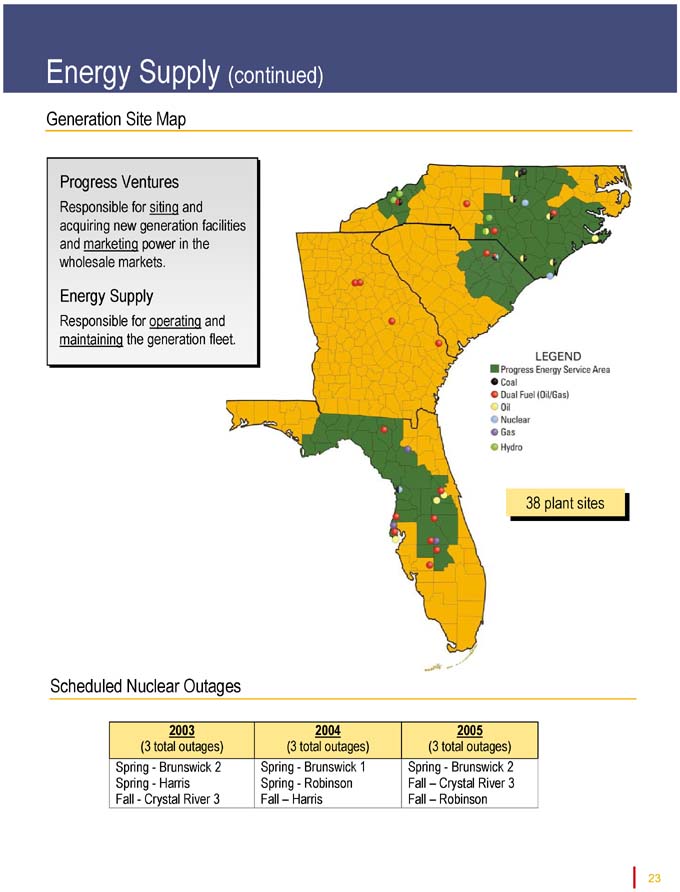
Generation Site Map
Progress Ventures
Responsible for siting and acquiring new generation facilities and marketing power in the wholesale markets.
Energy Supply
Responsible for operating and maintaining the generation fleet.
38 plant sites
Scheduled Nuclear Outages
2003 2004 2005
(3 total outages) (3 total outages) (3 total outages)
Spring—Brunswick 2 Spring—Brunswick 1 Spring—Brunswick 2
Spring—Harris Spring—Robinson Fall – Crystal River 3
Fall—Crystal River 3 Fall – Harris Fall – Robinson
23
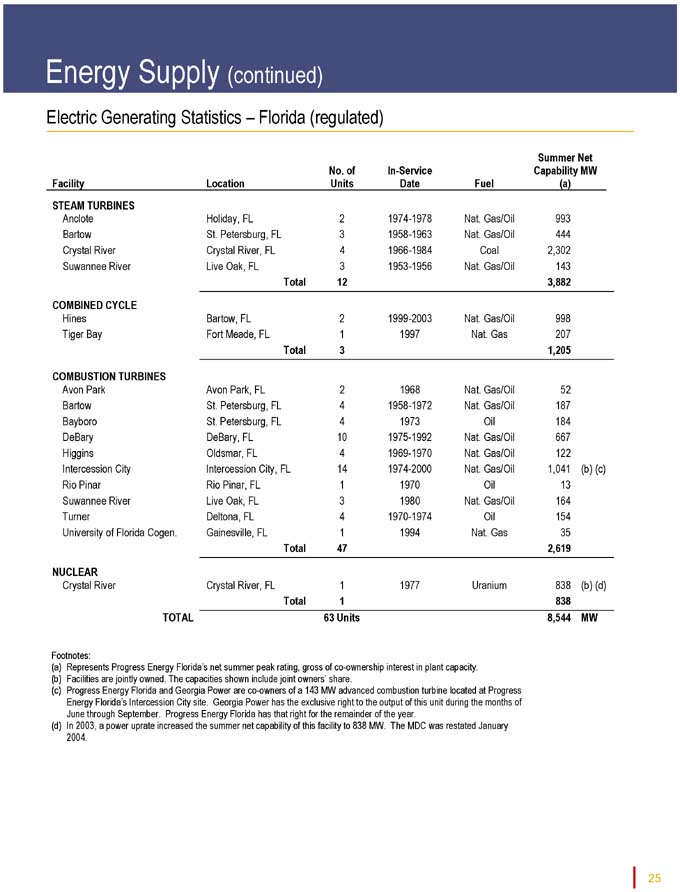
Electric Generating Statistics – Carolinas (regulated)
Summer Net
No. of In-Service Capability (MW)
Facility Location Units Date Fuel (a)
STEAM TURBINES
Asheville Skyland, N.C. 2 1964-1971 Coal 392
Cape Fear Moncure, N.C. 2 1956-1958 Coal 316
Lee Goldsboro, N.C. 3 1952-1962 Coal 407
Mayo Roxboro, N.C. 1 1983 Coal 745 (b)
Robinson Hartsville, S.C. 1 1960 Coal 174
Roxboro Roxboro, N.C. 4 1966-1980 Coal 2,462 (b)
Sutton Wilmington, N.C. 3 1954-1972 Coal 613
Weatherspoon Lumberton, N.C. 3 1949-1952 Coal 176
Total 19 5,285
COMBINED CYCLE
Cape Fear Moncure, N.C. 2 1969 Oil 84
Richmond Hamlet, N.C. 1 2002 Nat. Gas/Oil 472
Total 3 556
COMBUSTION TURBINES
Asheville Skyland, N.C. 2 1999-2000 Nat. Gas/Oil 330
Blewett Lilesville, N.C. 4 1971 Oil 52
Darlington Hartsville, S.C. 13 1974-1997 Nat. Gas/Oil 812
Lee Goldsboro, N.C. 4 1968-1971 Oil 91
Morehead City Morehead City, N.C. 1 1968 Oil 15
Richmond Hamlet, N.C. 5 2001-2002 Nat. Gas/Oil 775
Robinson Hartsville, S.C. 1 1968 Nat. Gas/Oil 15
Roxboro Roxboro, N.C. 1 1968 Oil 15
Sutton Wilmington, N.C. 3 1968-1969 Nat. Gas/Oil 64
Wayne County Goldsboro, N.C. 4 2000 Nat. Gas/Oil 668
Weatherspoon Lumberton, N.C. 4 1970-1971 Nat. Gas/Oil 138
Total 42 2,975
NUCLEAR
Brunswick Southport, N.C. 2 1975-1977 Uranium 1772 (b)(c)
Harris New Hill, N.C. 1 1987 Uranium 900 (b)
Robinson Hartsville, S.C. 1 1971 Uranium 710
Total 4 3,382
HYDRO
Blewett Lilesville, N.C. 6 1912 Water 22
Marshall Marshall, N.C. 2 1910 Water 5
Tillery Mount Gilead, N.C. 4 1928-1960 Water 86
Walters Waterville, N.C. 3 1930 Water 105
Total 15 218
TOTAL 83 Units 12,416 MW
Footnotes:
(a) Represents Progress Energy Carolinas’ net summer peak rating, gross of co-ownership interest in plant capacity.
(b) Facilities are jointly owned by Progress Energy Carolinas and NCEMPA, and the capacity shown includes NCEMPA’s share.
(c) In 2003, a power uprate increased the summer net capability of Unit 2 to 900 MW. The MDC was restated January 2004.
Energy Supply (continued)
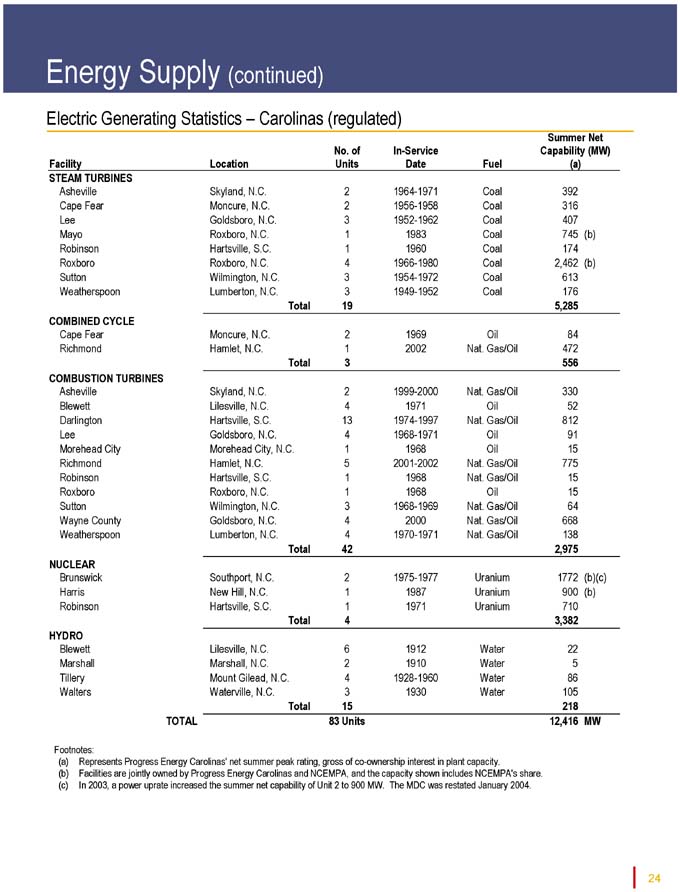
Electric Generating Statistics – Florida (regulated)
Summer Net
No. of In-Service Capability MW
Facility Location Units Date Fuel (a)
STEAM TURBINES
Anclote Holiday, FL 2 1974-1978 Nat. Gas/Oil 993
Bartow St. Petersburg, FL 3 1958-1963 Nat. Gas/Oil 444
Crystal River Crystal River, FL 4 1966-1984 Coal 2,302
Suwannee River Live Oak, FL 3 1953-1956 Nat. Gas/Oil 143
Total 12 3,882
COMBINED CYCLE
Hines Bartow, FL 2 1999-2003 Nat. Gas/Oil 998
Tiger Bay Fort Meade, FL 1 1997 Nat. Gas 207
Total 3 1,205
COMBUSTION TURBINES
Avon Park Avon Park, FL 2 1968 Nat. Gas/Oil 52
Bartow St. Petersburg, FL 4 1958-1972 Nat. Gas/Oil 187
Bayboro St. Petersburg, FL 4 1973 Oil 184
DeBary DeBary, FL 10 1975-1992 Nat. Gas/Oil 667
Higgins Oldsmar, FL 4 1969-1970 Nat. Gas/Oil 122
Intercession City Intercession City, FL 14 1974-2000 Nat. Gas/Oil 1,041 (b) (c)
Rio Pinar Rio Pinar, FL 1 1970 Oil 13
Suwannee River Live Oak, FL 3 1980 Nat. Gas/Oil 164
Turner Deltona, FL 4 1970-1974 Oil 154
University of Florida Cogen. Gainesville, FL 1 1994 Nat. Gas 35
Total 47 2,619
NUCLEAR
Crystal River Crystal River, FL 1 1977 Uranium 838 (b) (d)
Total 1 838
TOTAL 63 Units 8,544 MW
Footnotes:
(a) Represents Progress Energy Florida’s net summer peak rating, gross of co-ownership interest in plant capacity. (b) Facilities are jointly owned. The capacities shown include joint owners’ share.
(c) Progress Energy Florida and Georgia Power are co-owners of a 143 MW advanced combustion turbine located at Progress Energy Florida’s Intercession City site. Georgia Power has the exclusive right to the output of this unit during the months of
June through September. Progress Energy Florida has that right for the remainder of the year.
(d) In 2003, a power uprate increased the summer net capability of this facility to 838 MW. The MDC was restated January
2004.
25
Energy Supply (continued)
Electric Generating Statistics—Progress Ventures
Cumulative T otal
In-service Date Plant Site State T ype MWs
(MWs)
1999 Monroe GA CT 155 155
2001 Monroe GA CT 160
Rowan¹ NC CT 459 774
2002 DeSoto FL CT 320
Walton² GA CT 460 1,554
2003 Rowan NC CC 466
Effingham GA CC 480
Washington² GA CT 600 3,100
¹ This facility w as transferred from Progress Energy Carolinas to Progress Ventures in February 2002. ² LG&E Purchase.
Competitive Generation
Monroe
w 315 MW, CT, gas/oil
Walton
w 460 MW, CT, gas
Washington
w 600 MW, CT, gas
Effingham
w 480 MW, CC, gas
DeSoto
w 320 MW, CT, gas/oil
Rowan
w 459 MW, CT, gas/oil
w 466 MW, CC, gas/oil
3,100 MW in operation
26
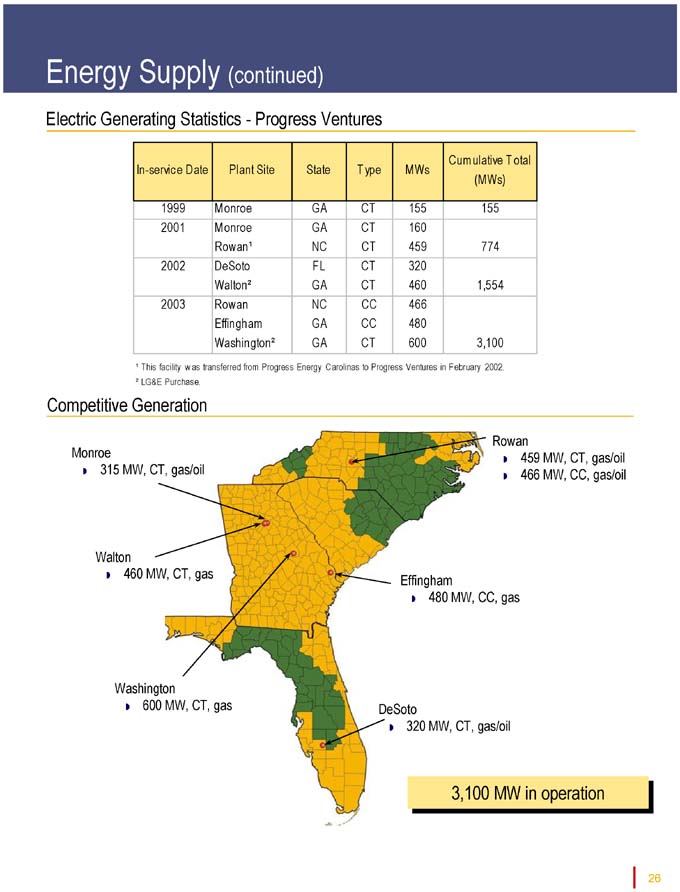
Energy Delivery
Strategies
• Emphasis on operational excellence
• Develop and sustain customer loyalty
• Enhancing communications
• Expanding customer options
• Improving power quality/reliability
• Continue economic development efforts
• Introduce new products and services
Competitive Strengths
• Five-year customer growth rate of 2.4% is nearly 1.3 times the national average
• Four-time winner of the EEI Emergency Response Award
• Constructive regulation
• Service contract opportunities (meter reading, billing, call services, O&M)
Progress Energy Carolinas
Annual Customers
1,183
1998
1,213
1999
1,246
2000
1,276
2001
1,302
2002
1,325
2003
2003 Sales by Customer Segment
Other
2%
Wholesale
27%
Industrial
22%
Commercial
22%
Residential
27%
Progress Energy Florida
Annual Customers
1,341
1998
1,377
1999
1,407
2000
1,443
2001
1,476
2002
1,511
2003
2003 Sales by Customer Segment
Other
7%
Commercial
27%
Wholesale
10%
Industrial
10%
Residential
46%
27
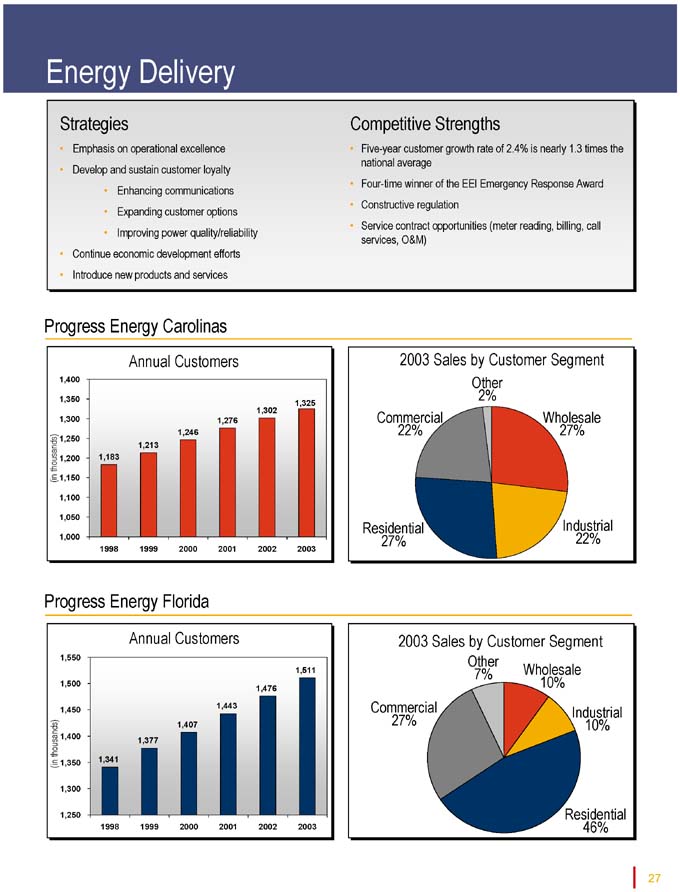
Energy Delivery (continued)
Progress Energy Carolinas
CAGR (%)
1999-2003 2003 2002 2001 2000 1999
Electric operating revenues ($ in millions)
Retail
Residential 4.5% $ 1,259 $ 1,241 $ 1,152 $ 1,113 $ 1,057
Commercial 4.7 850 832 785 741 707
Industrial (2.1) 636 645 654 679 691
Other 1.0 79 78 75 76 76
Wholesale 5.4 687 651 634 577 556
Unbilled — (6) 15 (32) 51 (10)
Miscellaneous — 84 77 76 71 69
Total electric operating revenues 3.3% $ 3,589 $ 3,539 $ 3,344 $ 3,308 $ 3,146
Weather-normalized retail base revenues, excluding fuel ($ in millions)
Residential 3.3% $ 1,051 $ 1,010 $ 991 $ 964 $ 922
Commercial 3.5 666 653 636 618 580
Industrial (3.6) 445 458 482 523 516
Other retail (1.0) 58 58 57 61 60
Total weather-normalized retail base revenues 1.7% $ 2,220 $ 2,179 $ 2,166 $
2,165 $
2,079
Energy sales (millions of kWh)
Retail
Residential 3.4% 15,283 15,239 14,372 14,091 13,348
Commercial 3.2 12,557 12,468 11,972 11,432 11,068
Industrial (3.3) 12,749 13,089 13,332 14,446 14,568
Other 0.9 1,408 1,437 1,423 1,423 1,359
Wholesale 1.7 15,518 15,024 12,996 14,582 14,526
Unbilled — (44) 270 (534) 679 (110)
Total energy sales 1.2% 57,471 57,527 53,561 56,653 54,759
Weather-normalized billed retail sales (millions of kWh)
Residential 3.4% 15,626 14,980 14,487 14,221 13,667
Commercial 3.3 12,638 12,387 11,987 11,455 11,115
Industrial (3.3) 12,749 13,089 13,332 14,446 14,574
Other retail 0.9 1,408 1,437 1,423 1,423 1,359
Total weather-normalized billed retail sales 1.0% 42,421 41,892 41,229 41,545 40,716
Electric customers billed at year-end
Residential 2.2% 1,115,356 1,096,370 1,073,760 1,048,607 1,020,864
Commercial 2.5 202,890 198,648 194,970 189,475 183,914
Industrial (2.8) 4,511 4,603 4,909 4,989 5,045
Governmental (1.1) 2,618 2,653 2,700 2,717 2,731
Wholesale (1.3) 37 36 33 43 39
Total electric customers billed 2.2% 1,325,412 1,302,310 1,276,372 1,245,831 1,212,593
Annual Percent of Total
2003 2002 2001 2000 1999
Weather-normalized retail base revenues, excluding fuel (%)
Residential 47.3 46.4 45.8 44.5 44.4
Commercial 30.0 29.9 29.3 28.6 27.9
Industrial 20.0 21.0 22.2 24.1 24.8
Other retail 2.6 2.7 2.7 2.8 2.9
Total weather-normalized retail base revenues 100% 100% 100% 100% 100%
Weather-normalized billed retail sales (%)
Residential 36.8 35.8 35.1 34.2 33.6
Commercial 29.8 29.6 29.1 27.6 27.3
Industrial 30.1 31.2 32.3 34.8 35.8
Other retail 3.3 3.4 3.5 3.4 3.3
Total weather-normalized billed retail sales 100% 100% 100% 100% 100%
28
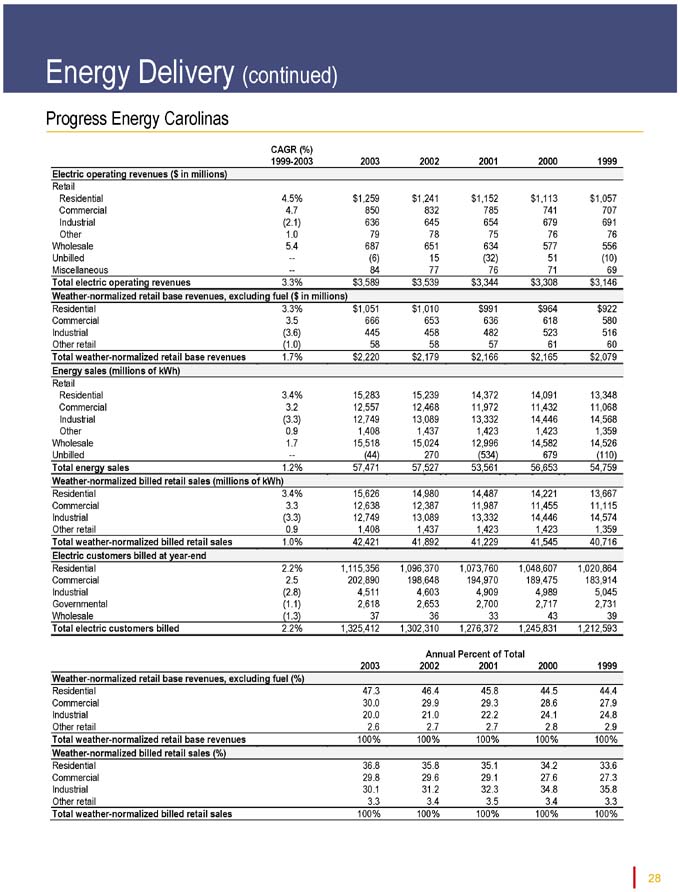
Energy Delivery (continued)
Progress Energy Florida
CAGR (%)
1999-2003 2003 2002 2001 2000 1999
Electric operating revenues ($ in millions)*
Retail
Residential 4.9% $ 1,691 $ 1,645 $ 1,643 $
1,476 $
1,395
Commercial 4.6% 740 731 754 662 617
Industrial 1.3% 219 211 223 212 208
Other 6.3% 181 173 176 152 142
Revenue sharing** (35) (5)
One-time retroactive refund (35)
Wholesale 0.0% 227 230 288 276 228
Unbilled — (2) (3) (22) 18 3
Miscellaneous — 131 115 151 76 56
Total electric operating revenues* 4.4% $ 3,152 $ 3,062 $ 3,213 $
2,872 $
2,649
Weather-normalized retail base revenues, excluding fuel ($ in millions)*
Residential 0.2% $ 833 $ 824 $859 $ 829 $
826
Commercial (0.1) 294 297 312 307 294
Industrial (3.3) 76 76 80 86 86
Other retail 1.3 69 68 70 69 66
Total weather-normalized retail base revenues, pre-refund/sharing* 0.0% $1,271 $
1,265 $
1,322 $
1,290 $
1,272
Revenue sharing** (35) (5)
One-time retroactive refund (35)
Total weather-normalized retail base revenues, post-refund/sharing* (0.7%) $1,236 $
1,226 $
1,322 $
1,290 $
1,272
Energy sales (millions of kWh)
Retail
Residential 4.6% 19,429 18,754 17,604 17,116 16,245
Commercial 2.8 11,553 11,420 11,061 10,813 10,327
Industrial (2.0) 4,000 3,835 3,872 4,249 4,334
Other 4.1 2,974 2,850 2,726 2,654 2,536
Wholesale (2.9) 4,323 4,180 4,719 5,209 4,854
Unbilled — 233 5 (511) 344 251
Total energy sales 2.5% 42,512 41,044 39,471 40,385 38,547
Weather-normalized billed retail sales (millions of kWh)
Residential 3.3% 19,254 18,524 17,952 17,478 16,880
Commercial 2.7 11,639 11,422 11,270 10,968 10,446
Industrial (2.0) 4,001 3,835 3,872 4,249 4,334
Other Retail 3.9 2,990 2,850 2,778 2,691 2,566
Total weather-normalized billed retail sales 2.6% 37,884 36,631 35,873 35,385 34,226
Electric customers billed at year-end
Residential 2.4% 1,332,622 1,301,374 1,272,721 1,240,570 1,213,470
Commercial 2.3 154,384 150,531 146,798 144,190 140,897
Industrial 0.2 2,646 2,532 2,551 2,546 2,629
Governmental 2.5 21,650 21,128 20,712 20,064 19,583
Wholesale 5.1 22 22 20 18 18
Total electric customers billed 2.4% 1,511,324 1,475,587 1,442,802 1,407,388 1,376,597
*9.25% base rate revenue reduction took effect May 1, 2002. **2003 includes $18 million of revenue sharing for 2002.
Annual Percent of Total
2003 2002 2001 2000 1999
Weather-normalized retail base revenues, excluding fuel (%)
Residential 65.5 65.1 65.0 64.2 64.9
Commercial 23.1 23.5 23.6 23.8 23.1
Industrial 6.0 6.0 6.1 6.7 6.8
Other retail 5.4 5.4 5.3 5.3 5.2
Total weather-normalized retail base revenues, pre-refund/sharing 100% 100% 100% 100% 100%
Weather-normalized billed retail sales (%)
Residential 50.8 50.6 50.0 49.4 49.3
Commercial 30.7 31.2 31.4 31.0 30.5
Industrial 10.6 10.5 10.8 12.0 12.7
Other Retail 7.9 7.8 7.8 7.6 7.5
Total weather-normalized billed retail sales 100% 100% 100% 100% 100%
29
Progress Ventures (continued)
Synfuels
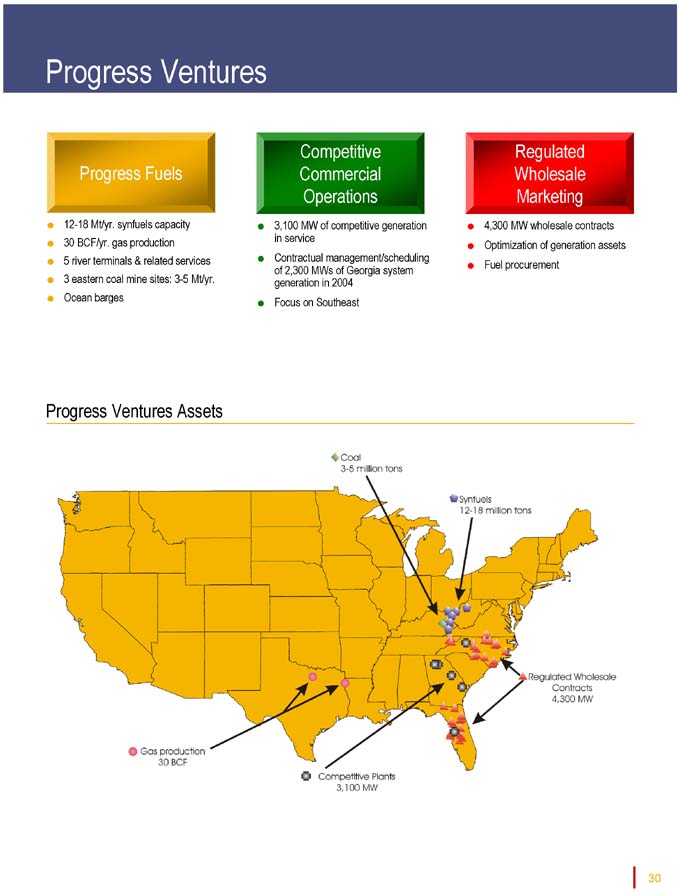
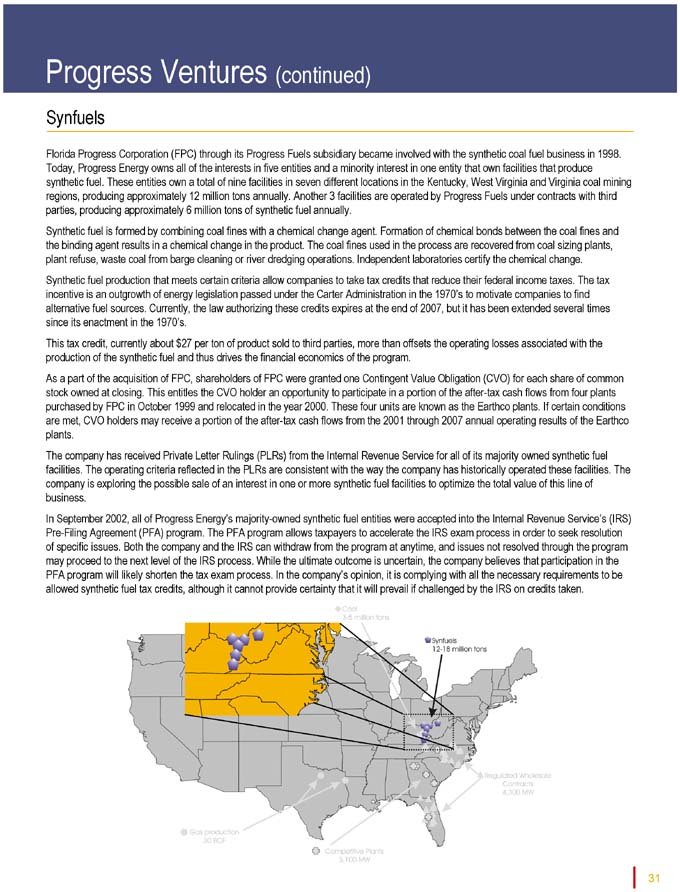
Florida Progress Corporation (FPC) through its Progress Fuels subsidiary became involved with the synthetic coal fuel business in 1998. Today, Progress Energy owns all of the interests in five entities and a minority interest in one entity that own facilities that produce synthetic fuel. These entities own a total of nine facilities in seven different locations in the Kentucky, West Virginia and Virginia coal mining regions, producing approximately 12 million tons annually. Another 3 facilities are operated by Progress Fuels under contracts with third parties, producing approximately 6 million tons of synthetic fuel annually.
Synthetic fuel is formed by combining coal fines with a chemical change agent. Formation of chemical bonds between the coal fines and the binding agent results in a chemical change in the product. The coal fines used in the process are recovered from coal sizing plants, plant refuse, waste coal from barge cleaning or river dredging operations. Independent laboratories certify the chemical change.
Synthetic fuel production that meets certain criteria allow companies to take tax credits that reduce their federal income taxes. The tax incentive is an outgrowth of energy legislation passed under the Carter Administration in the 1970’s to motivate companies to find alternative fuel sources. Currently, the law authorizing these credits expires at the end of 2007, but it has been extended several times since its enactment in the 1970’s.
This tax credit, currently about $27 per ton of product sold to third parties, more than offsets the operating losses associated with the production of the synthetic fuel and thus drives the financial economics of the program.
As a part of the acquisition of FPC, shareholders of FPC were granted one Contingent Value Obligation (CVO) for each share of common stock owned at closing. This entitles the CVO holder an opportunity to participate in a portion of the after-tax cash flows from four plants purchased by FPC in October 1999 and relocated in the year 2000. These four units are known as the Earthco plants. If certain conditions are met, CVO holders may receive a portion of the after-tax cash flows from the 2001 through 2007 annual operating results of the Earthco plants.
The company has received Private Letter Rulings (PLRs) from the Internal Revenue Service for all of its majority owned synthetic fuel facilities. The operating criteria reflected in the PLRs are consistent with the way the company has historically operated these facilities. The company is exploring the possible sale of an interest in one or more synthetic fuel facilities to optimize the total value of this line of business.
In September 2002, all of Progress Energy’s majority-owned synthetic fuel entities were accepted into the Internal Revenue Service’s (IRS) Pre-Filing Agreement (PFA) program. The PFA program allows taxpayers to accelerate the IRS exam process in order to seek resolution of specific issues. Both the company and the IRS can withdraw from the
program at anytime, and issues not resolved through the program may proceed to the next level of the IRS process. While the ultimate outcome is uncertain, the company believes that participation in the PFA program will likely shorten the tax exam process. In the company’s opinion, it is complying with all the necessary requirements to be allowed synthetic fuel tax credits, although it cannot provide certainty that it will prevail if challenged by the IRS on credits taken.
31
Progress Ventures (continued)
Synfuels
Florida Progress Corporation (FPC) through its Progress Fuels subsidiary became involved with the synthetic coal fuel business in 1998. Today, Progress Energy owns all of the interests in five entities and a minority interest in one entity that own facilities that produce synthetic fuel. These entities own a total of nine facilities in seven different locations in the Kentucky, West Virginia and Virginia coal mining regions, producing approximately 12 million tons annually. Another 3 facilities are operated by Progress Fuels under contracts with third parties, producing approximately 6 million tons of synthetic fuel annually.
Synthetic fuel is formed by combining coal fines with a chemical change agent. Formation of chemical bonds between the coal fines and the binding agent results in a chemical change in the product. The coal fines used in the process are recovered from coal sizing plants, plant refuse, waste coal from barge cleaning or river dredging operations. Independent laboratories certify the chemical change.
Synthetic fuel production that meets certain criteria allow companies to take tax credits that reduce their federal income taxes. The tax incentive is an outgrowth of energy legislation passed under the Carter Administration in the 1970’s to motivate companies to find alternative fuel sources. Currently, the law authorizing these credits expires at the end of 2007, but it has been extended several times since its enactment in the 1970’s.
This tax credit, currently about $27 per ton of product sold to third parties, more than offsets the operating losses associated with the production of the synthetic fuel and thus drives the financial economics of the program.
As a part of the acquisition of FPC, shareholders of FPC were granted one Contingent Value Obligation (CVO) for each share of common stock owned at closing. This entitles the CVO holder an opportunity to participate in a portion of the after-tax cash flows from four plants purchased by FPC in October 1999 and relocated in the year 2000. These four units are known as the Earthco plants. If certain conditions are met, CVO holders may receive a portion of the after-tax cash flows from the 2001 through 2007 annual operating results of the Earthco plants.
The company has received Private Letter Rulings (PLRs) from the Internal Revenue Service for all of its majority owned synthetic fuel facilities. The operating criteria reflected in the PLRs are consistent with the way the company has historically operated these facilities. The company is exploring the possible sale of an interest in one or more synthetic fuel facilities to optimize the total value of this line of business.
In September 2002, all of Progress Energy’s majority-owned synthetic fuel entities were accepted into the Internal Revenue Service’s (IRS) Pre-Filing Agreement (PFA) program. The PFA program allows taxpayers to accelerate the IRS exam process in order to seek resolution of specific issues. Both the company and the IRS can withdraw from the program at anytime, and issues not resolved through the program may proceed to the next level of the IRS process. While the ultimate outcome is uncertain, the company believes that participation in the PFA program will likely shorten the tax exam process. In the company’s opinion, it is complying with all the necessary requirements to be allowed synthetic fuel tax credits, although it cannot provide certainty that it will prevail if challenged by the IRS on credits taken. 31
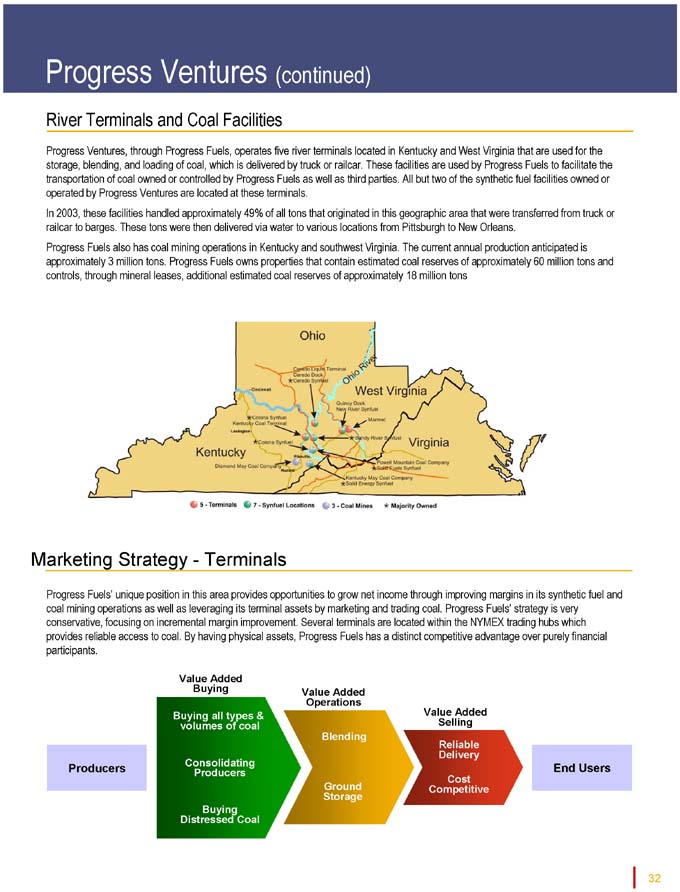
Progress Ventures (continued)
River Terminals and Coal Facilities
Progress Ventures, through Progress Fuels, operates five river terminals located in Kentucky and West Virginia that are used for the storage, blending, and loading of coal, which is delivered by truck or railcar. These facilities are used by Progress Fuels to facilitate the transportation of coal owned or controlled by Progress Fuels as well as third parties. All but two of the synthetic fuel facilities owned or operated by Progress Ventures are located at these terminals.
In 2003, these facilities handled approximately 49% of all tons that originated in this geographic area that were transferred from truck or railcar to barges. These tons were then delivered via water to various locations from Pittsburgh to New Orleans.
Progress Fuels also has coal mining operations in Kentucky and southwest Virginia. The current annual production anticipated is approximately 3 million tons. Progress Fuels owns properties that contain estimated coal reserves of approximately 60 million tons and controls, through mineral leases, additional estimated coal reserves of approximately 18 million tons
Marketing Strategy—Terminals
Progress Fuels’ unique position in this area provides opportunities to grow net income through improving margins in its synthetic fuel and coal mining operations as well as leveraging its terminal assets by marketing and trading coal. Progress Fuels’ strategy is very conservative, focusing on incremental margin improvement. Several terminals are located within the NYMEX trading hubs which provides reliable access to coal. By having physical assets, Progress Fuels has a distinct competitive advantage over purely financial participants.
Producers
Value Added Buying
Buying all types & volumes of coal
Consolidating Producers
Buying Distressed Coal
Value Added Operations
Blending
Ground Storage
Value Added Selling
Reliable Delivery
Cost Competitive
End Users
32
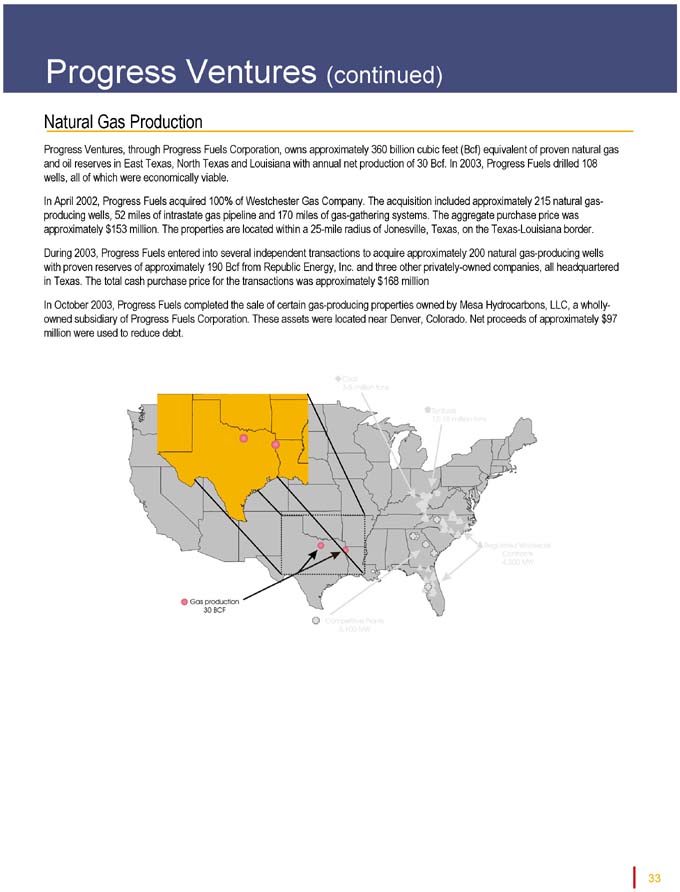
Progress Ventures (continued)
Natural Gas Production
Progress Ventures, through Progress Fuels Corporation, owns approximately 360 billion cubic feet (Bcf) equivalent of proven natural gas and oil reserves in East Texas, North Texas and Louisiana with annual net production of 30 Bcf. In 2003, Progress Fuels drilled 108 wells, all of which were economically viable.
In April 2002, Progress Fuels acquired 100% of Westchester Gas Company. The acquisition included approximately 215 natural gas-producing wells, 52 miles of intrastate gas pipeline and 170 miles of gas-gathering systems. The aggregate purchase price was approximately $153 million. The properties are located within a 25-mile radius of Jonesville, Texas, on the Texas-Louisiana border. During 2003, Progress Fuels entered into several independent transactions to acquire approximately 200 natural gas-producing wells with proven reserves of approximately 190 Bcf from Republic Energy, Inc. and three other privately-owned companies, all headquartered in Texas. The total cash purchase price for the transactions was approximately $168 million In October 2003, Progress Fuels completed the sale of certain gas-producing properties owned by Mesa Hydrocarbons, LLC, a wholly-owned subsidiary of Progress Fuels Corporation. These assets were located near Denver, Colorado. Net proceeds of approximately $97 million were used to reduce debt.
33
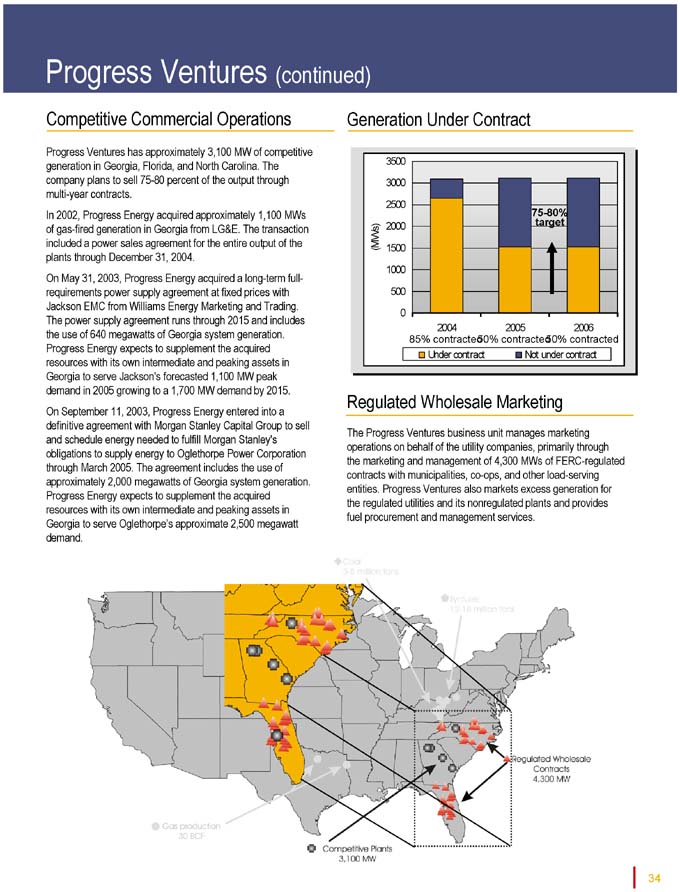
Progress Ventures (continued)
Competitive Commercial Operations
Progress Ventures has approximately 3,100 MW of competitive generation in Georgia, Florida, and North Carolina. The company plans to sell 75-80 percent of the output through multi-year contracts.
In 2002, Progress Energy acquired approximately 1,100 MWs of gas-fired generation in Georgia from LG&E. The transaction included a power sales agreement for the entire output of the plants through December 31, 2004.
On May 31, 2003, Progress Energy acquired a long-term full-requirements power supply agreement at fixed prices with Jackson EMC from Williams Energy Marketing and Trading. The power supply agreement runs through 2015 and includes the use of 640 megawatts of Georgia system generation. Progress Energy expects to supplement the acquired resources with its own intermediate and peaking assets in Georgia to serve Jackson’s forecasted 1,100 MW peak demand in 2005 growing to a 1,700 MW demand by 2015. On September 11, 2003, Progress Energy entered into a definitive agreement with Morgan Stanley Capital Group to sell and schedule energy needed to fulfill Morgan Stanley’s obligations to supply energy to Oglethorpe Power Corporation through March 2005. The agreement includes the use of approximately 2,000 megawatts of Georgia system generation. Progress Energy expects to supplement the acquired resources with its own intermediate and peaking assets in Georgia to serve Oglethorpe’s approximate 2,500 megawatt
Generation Under Contract
2004 2005 2006 85% contracted50% contracted50% contracted Under contract Not under contract
Regulated Wholesale Marketing
The Progress Ventures business unit manages marketing operations on behalf of the utility companies, primarily through the marketing and management of 4,300 MWs of FERC-regulated contracts with municipalities, co-ops, and other load-serving entities. Progress Ventures also markets excess generation for the regulated utilities and its nonregulated plants and provides fuel procurement and management services.
34
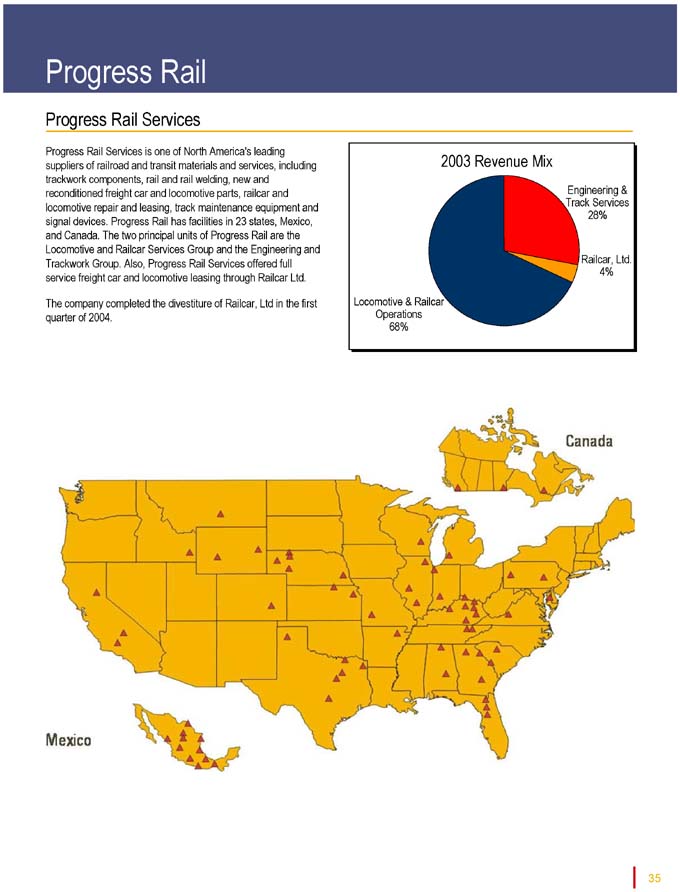
Progress Rail
Progress Rail Services
Progress Rail Services is one of North America’s leading suppliers of railroad and transit materials and services, including trackwork components, rail and rail welding, new and reconditioned freight car and locomotive parts, railcar and locomotive repair and leasing, track maintenance equipment and signal devices. Progress Rail has facilities in 23 states, Mexico, and Canada. The two principal units of Progress Rail are the
Locomotive and Railcar Services Group and the Engineering and Trackwork Group. Also, Progress Rail Services offered full service freight car and locomotive leasing through Railcar Ltd.
The company completed the divestiture of Railcar, Ltd in the first quarter of 2004.
2003 Revenue Mix
Engineering & Track Services 28%
Railcar, Ltd.
4%
Locomotive & Railcar Operations 68%
35
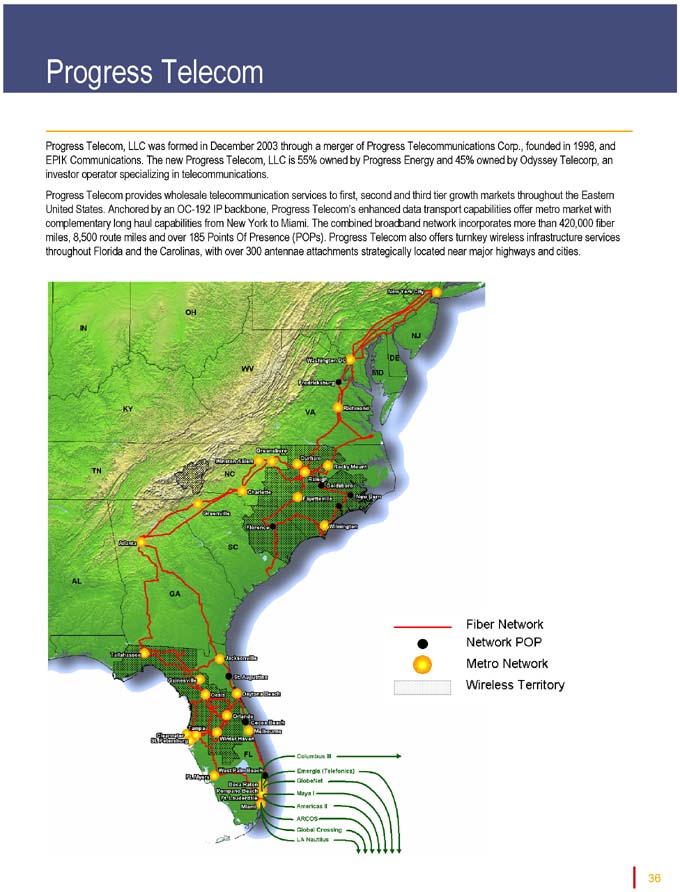
Progress Telecom
Progress Telecom, LLC was formed in December 2003 through a merger of Progress Telecommunications Corp., founded in 1998, and EPIK Communications. The new Progress Telecom, LLC is 55% owned by Progress Energy and 45% owned by Odyssey Telecorp, an investor operator specializing in telecommunications.
Progress Telecom provides wholesale telecommunication services to first, second and third tier growth markets throughout the Eastern United States. Anchored by an OC-192 IP backbone, Progress Telecom’s enhanced data transport capabilities offer metro market with complementary long haul capabilities from New York to Miami. The combined broadband network incorporates more than 420,000 fiber miles, 8,500 route miles and over 185 Points Of Presence (POPs). Progress Telecom also offers turnkey wireless infrastructure services throughout Florida and the Carolinas, with over 300 antennae attachments strategically located near major highways and cities.
36
Ongoing Earnings Adjustments
Contingent Value Obligation (CVO) Mark-to-Market\
In connection with the acquisition of Florida Progress Corporation, Progress Energy issued 98.6 million CVOs. Each CVO represents the right to receive contingent payments based on after-tax cash flows above certain levels of four synthetic fuel facilities purchased by subsidiaries of Florida Progress Corporation in October 1999. The CVOs are debt instruments and, under GAAP, are valued at market value. Unrealized gains and losses from changes in market value are recognized in earnings each quarter. Since changes in the market value of the CVOs do not affect the company’s underlying obligation, management does not consider the adjustment a component of ongoing earnings.
NCNG Discontinued Operations
The operations of NCNG are reported as discontinued operations due to its sale, and therefore management does not believe this activity is representative of the ongoing operations of the company.
Cumulative Effect of Accounting Changes
Progress Energy recorded the cumulative effect of changes in accounting principles due to the adoption of new FASB accounting guidance. The impact to Progress Energy was due primarily to the new FASB guidance related to the accounting for certain contracts. Due to the nonrecurring nature of the adjustment, management believes it is not representative of the 2003 operations of Progress Energy.
Impairments and One-Time Charges
During the fourth quarter of 2003, the company recorded after-tax impairments of its Affordable Housing portfolio and certain assets at the Kentucky May Coal Company. During the fourth quarter of 2002, the company committed to a divestiture plan for Railcar, Ltd., which is primarily engaged in rail car leasing, and recorded an estimated loss on assets held for sale. During the third quarter of 2002, the company recorded an after-tax impairment and one-time charge of Progress Telecom’s and Caronet’s assets. Progress Energy also wrote off the remaining amount of its investment in Interpath. During 2001, the company recorded asset impairment, primarily goodwill, and other one-time charges during the fourth quarter of 2001 related to SRS. Management does not believe these impairments and one-time charges are representative of the ongoing operations of the company.
Ice Storm Impact
During the fourth quarter of 2002, the company experienced a severe ice storm in the Carolinas that caused extensive damage to the distribution system. Due to the extensive costs associated with the storm damage, management believes the restoration costs are not representative of the 2002 ongoing operations of Progress Energy Carolinas.
Progress Energy Florida One-Time Retroactive Refund
The one-time retroactive rate refund under the Progress Energy Florida rate settlement in March 2002 was related to funds collected during the period between March 13, 2001, when the prior rate agreement in Florida expired, and March 27, 2002, the date the parties entered into the settlement agreement. Due to the nonrecurring nature of the refund, management believes it is not representative of the 2002 operations of Progress Energy Florida.
Progress Energy, Inc.
www.progress-energy.com
410 S. Wilmington Street, Raleigh, NC 27601


