Exhibit 99.1
Doing the Right Thing… with Energy
Don L. Blankenship
Chairman, President & CEO
September 26, 2005
1 |
|
Safe Harbor Statement
Statements made in this presentation which are not historical in nature are forward looking statements made pursuant to the safe harbor provisions of the Private Securities Litigation Reform Act of 1995 including, without limitation, forecasts of revenues, earnings estimates, and related information, all of which are based on current factual information and certain assumptions which management believes to be reasonable at this time. However, the company’s actual results for the current and future fiscal periods and corporate developments will depend on a number of economic, competitive and other factors outside the control of the company that could cause the company’s actual results for future periods to differ materially from those expressed in this presentation. Information concerning those factors is available in the company’s Annual Reports on Form 10-K and Quarterly Reports on Form 10-Q. In providing projections and other forward-looking statements, the company does not make, and specifically disclaims, any undertaking or obligation to update them at any time in the future or at all.
2 |
|
Share Repurchase Status/Considerations
3 |
|
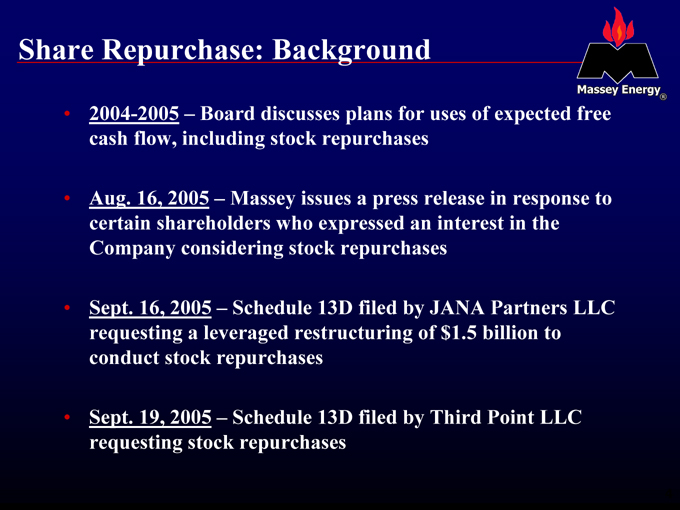
Share Repurchase: Background
2004-2005 – Board discusses plans for uses of expected free cash flow, including stock repurchases
Aug. 16, 2005 – Massey issues a press release in response to certain shareholders who expressed an interest in the Company considering stock repurchases
Sept. 16, 2005 – Schedule 13D filed by JANA Partners LLC requesting a leveraged restructuring of $1.5 billion to conduct stock repurchases
Sept. 19, 2005 – Schedule 13D filed by Third Point LLC requesting stock repurchases
4 |
|

Share Repurchase: Plan Path Forward
Ultimate goal: continue to increase long-term shareholder value
Work with financial and other advisors to evaluate uses of expected free cash flow
Decide on a course of action
Announce decision to shareholders
5 |
|
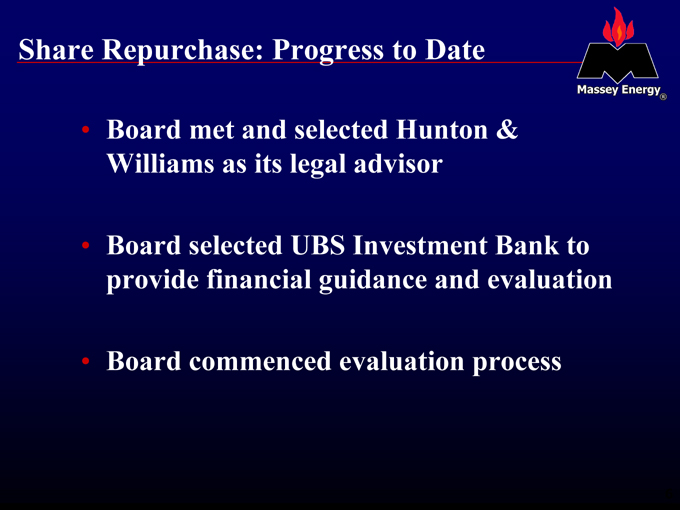
Share Repurchase: Progress to Date
Board met and selected Hunton & Williams as its legal advisor
Board selected UBS Investment Bank to provide financial guidance and evaluation
Board commenced evaluation process
6 |
|
Coal’s Place in the World
7 |
|
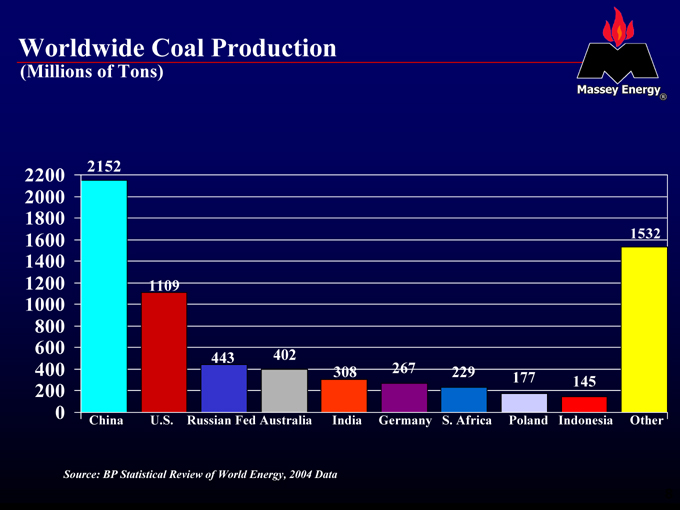
Worldwide Coal Production
(Millions of Tons)
2200 2000 1800 1600 1400 1200 1000 800 600 400 200 0
2152
1109
443
402
308
267
229
177
145
1532
China U.S. Russian Fed Australia India Germany S. Africa Poland Indonesia Other
Source: BP Statistical Review of World Energy, 2004 Data
8 |
|
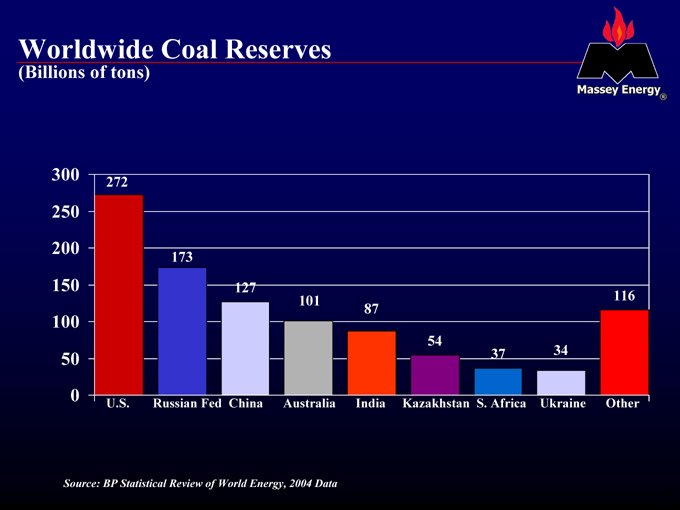
Worldwide Coal Reserves
(Billions of tons)
300
250 200
150 100
50 0
272
173
127
101
87
54
37
34
116
U.S. Russian Fed China Australia India Kazakhstan S. Africa Ukraine Other
Source: BP Statistical Review of World Energy, 2004 Data
9
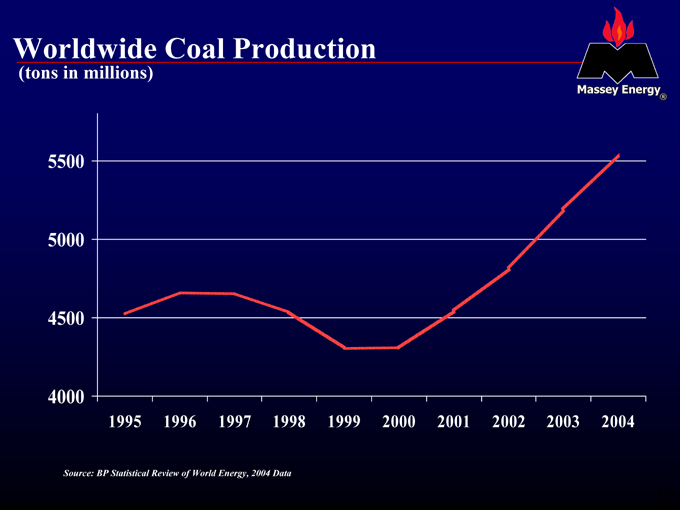
Worldwide Coal Production
(tons in millions)
5500 5000 4500 4000
1995 1996 1997 1998 1999 2000 2001 2002 2003 2004
Source: BP Statistical Review of World Energy, 2004 Data
10
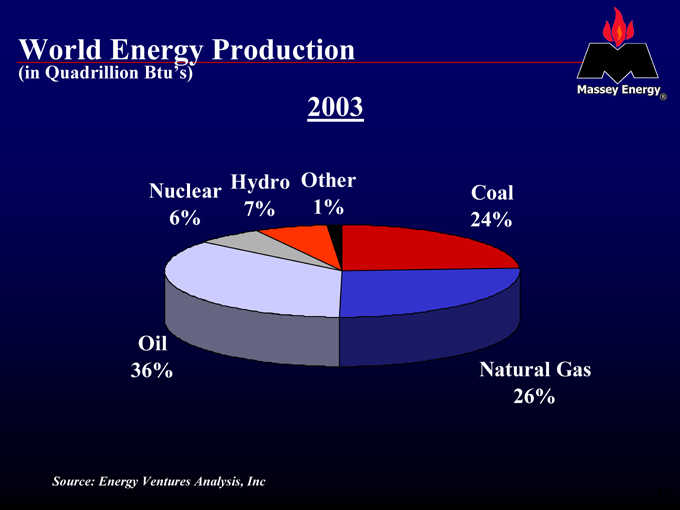
World Energy Production
(in Quadrillion Btu’s)
2003
Nuclear 6%
Hydro 7%
Other 1%
Coal 24%
Oil 36%
Natural Gas 26%
Source: Energy Ventures Analysis, Inc
11
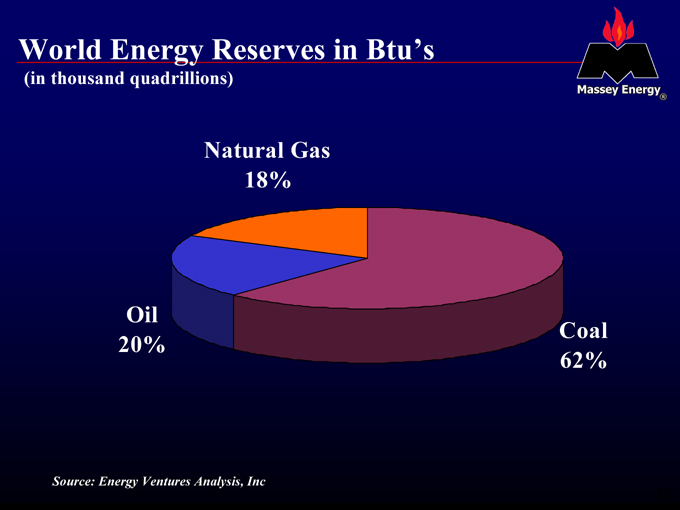
World Energy Reserves in Btu’s
(in thousand quadrillions)
Natural Gas 18%
Oil 20%
Coal 62%
Source: Energy Ventures Analysis, Inc
12
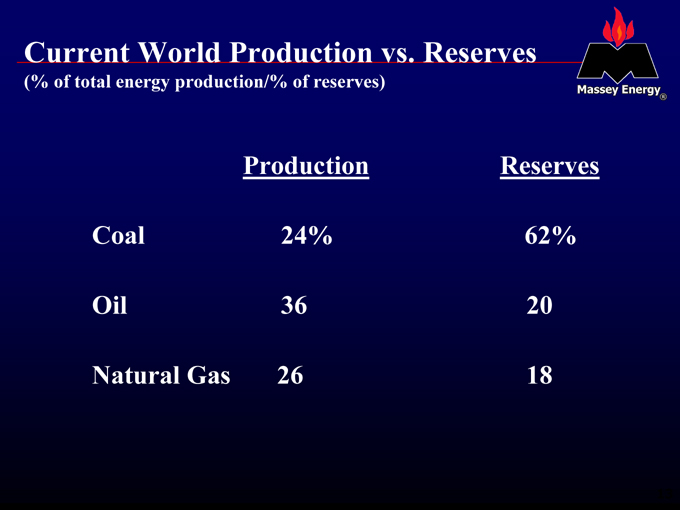
Current World Production vs. Reserves
(% of total energy production/% of reserves)
Production |
| Reserves |
Coal |
| 24% 62% |
Oil |
| 36 20 |
Natural |
| Gas 26 18 |
13
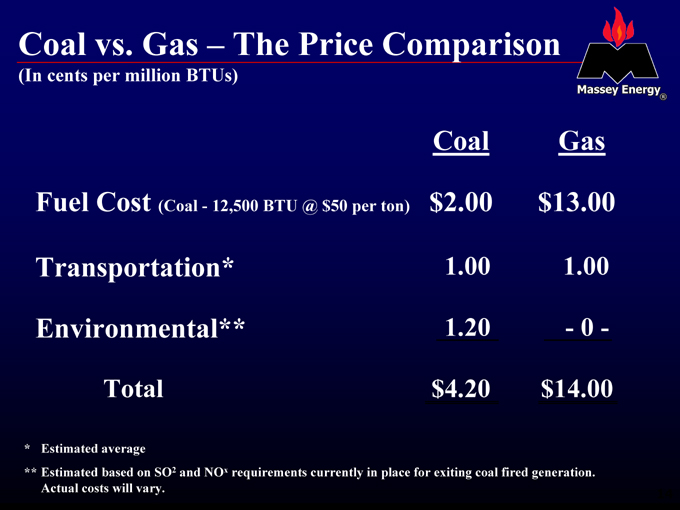
Coal vs. Gas – The Price Comparison
(In cents per million BTUs)
Coal |
| Gas |
Fuel |
| Cost (Coal—12,500 BTU @ $50 per ton) $2.00 $13.00 |
Transportation* |
| 1.00 1.00 |
Environmental** |
| 1.20—0 - |
Total |
| $4.20 $14.00 |
* Estimated average
** Estimated based on SO2 and NOx requirements currently in place for exiting coal fired generation.
Actual costs will vary.
14
U.S. Coal
15

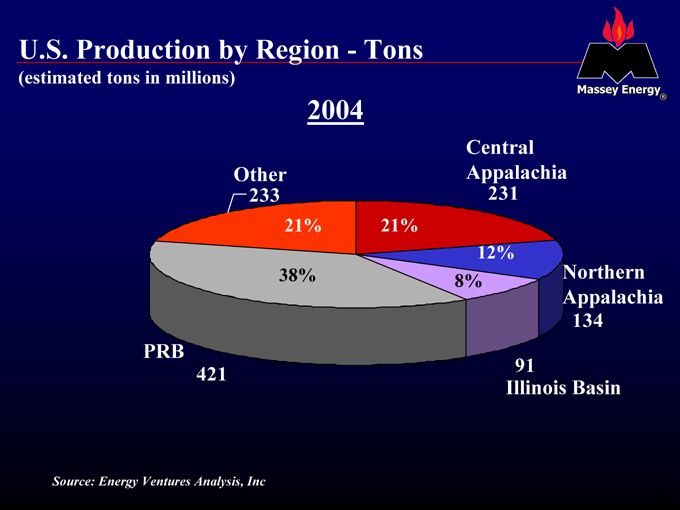
U.S. Production by Region—Tons
(estimated tons in millions)
2004
Other
233
Central Appalachia
231
Northern Appalachia
134
91
Illinois Basin
PRB
421
21%
21%
12%
8%
38%
Source: Energy Ventures Analysis, Inc
16
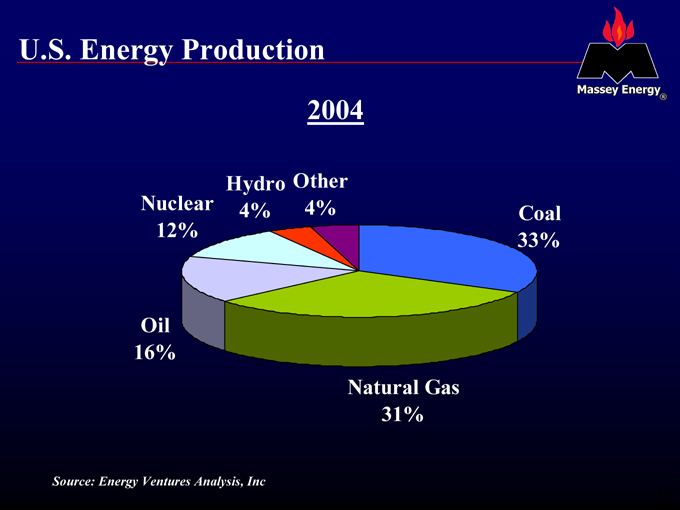
U.S. Energy Production
2004
Nuclear 12%
Hydro 4%
Other 4%
Coal 33%
Oil 16%
Natural Gas 31%
Source: Energy Ventures Analysis, Inc
17
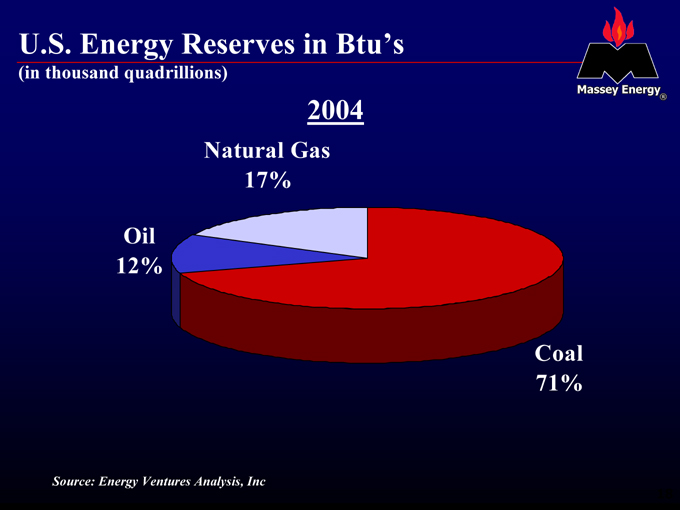
U.S. Energy Reserves in Btu’s
(in thousand quadrillions)
2004
Natural Gas 17%
Oil 12%
Coal 71%
Source: Energy Ventures Analysis, Inc
18
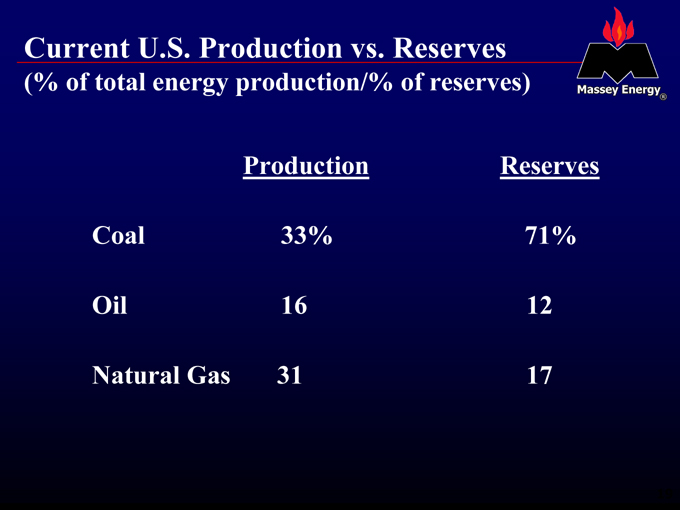
Current U.S. Production vs. Reserves
(% of total energy production/% of reserves)
Production |
| Reserves |
Coal |
| 33% 71% |
Oil |
| 16 12 |
Natural |
| Gas 31 17 |
19
Central Appalachian Coal
20
U.S. Production by Region—Tons
(estimated tons in millions)
2004
Other
233
Central Appalachia
231
Northern Appalachia
134
91
Illinois Basin
PRB
421
21%
21%
12%
8%
38%
Source: Energy Ventures Analysis, Inc
21
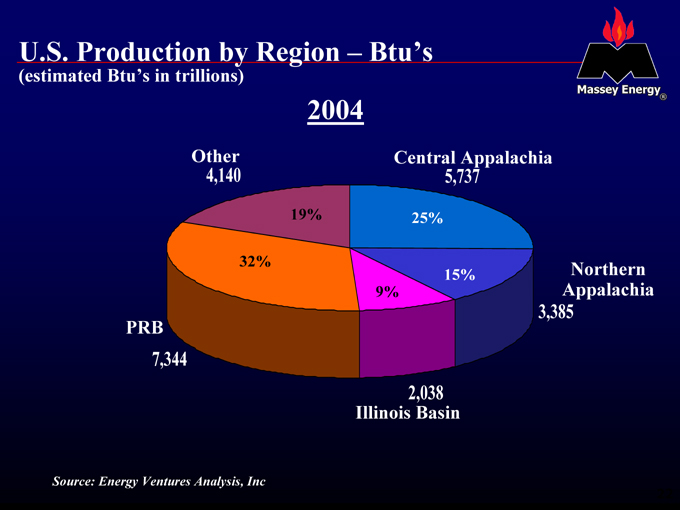
U.S. Production by Region – Btu’s
(estimated Btu’s in trillions)
2004
Other
4,140
Central Appalachia
5,737
Northern Appalachia
3,385
2,038
Illinois Basin
PRB
7,344
32%
19%
25%
15%
9%
Source: Energy Ventures Analysis, Inc
22
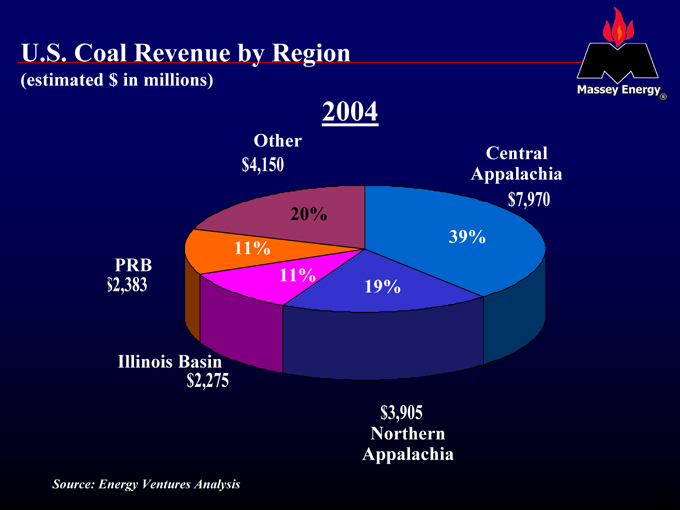
U.S. Coal Revenue by Region
(estimated $ in millions)
2004
Other
$4,150
PRB
$2,383
Illinois Basin
$2,275 $3,905
Northern Appalachia
Central Appalachia
$7,970
20%
11%
11%
19%
39%
Source: Energy Ventures Analysis
23
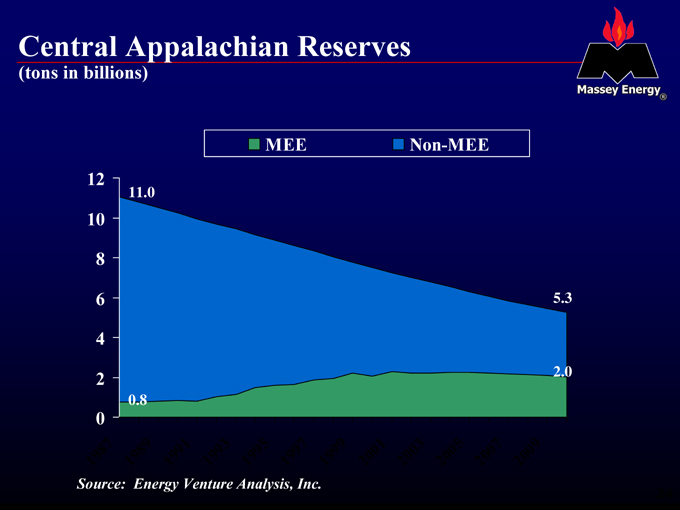
Central Appalachian Reserves
(tons in billions)
MEE Non-MEE
12 10 8 6 4 2 0
11.0
0.8
5.3
2.0
1987 1989 1991 1993 1995 1997 1999 2001 2003 2005 2007 2009
Source: Energy Venture Analysis, Inc.
24
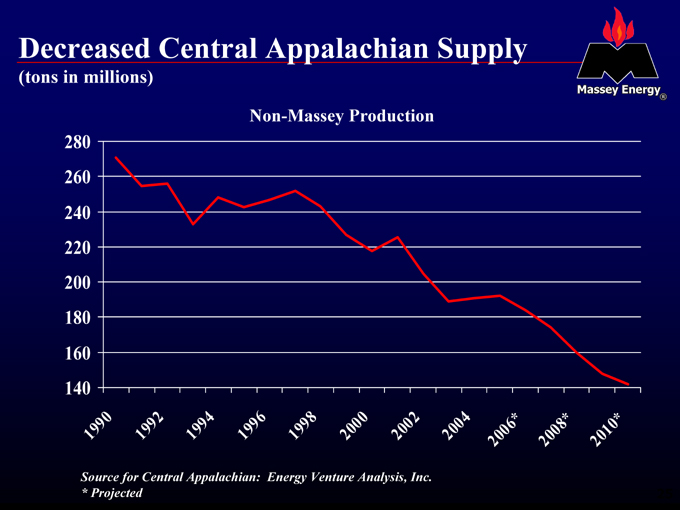
Decreased Central Appalachian Supply
(tons in millions)
Non-Massey Production
280 260 240 220 200 180 160 140
1990
1992 1994
1996
1998 2000 2002 2004 2006*
2008*
2010*
Source for Central Appalachian: Energy Venture Analysis, Inc. * Projected
25
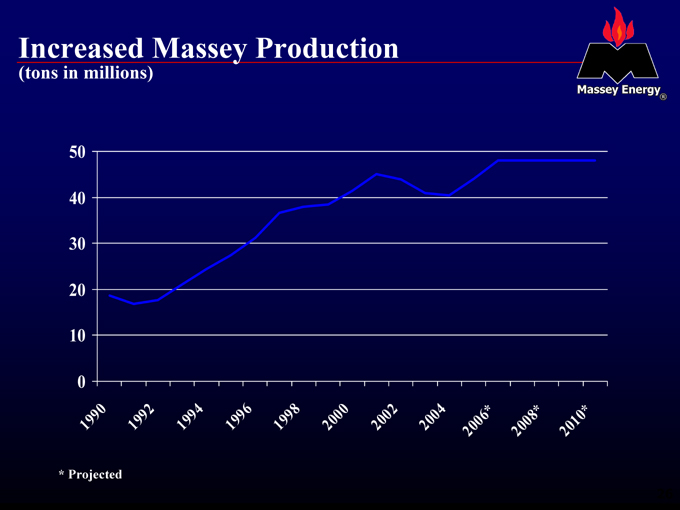
Increased Massey Production
(tons in millions)
50 40 30 20 10 0
1990
1992
1994 1996 1998
2000
2002 2004
2006*
2008*
2010*
* |
| Projected |
26
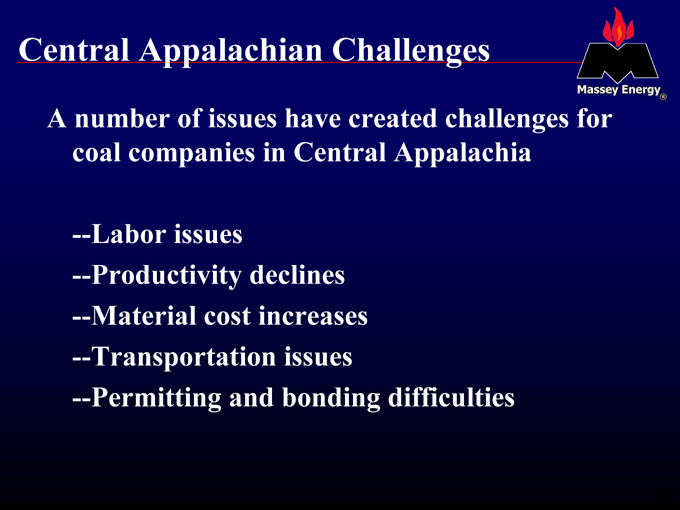
Central Appalachian Challenges
A number of issues have created challenges for coal companies in Central Appalachia
Labor issues Productivity declines Material cost increases Transportation issues
Permitting and bonding difficulties
27
Massey Coal
28
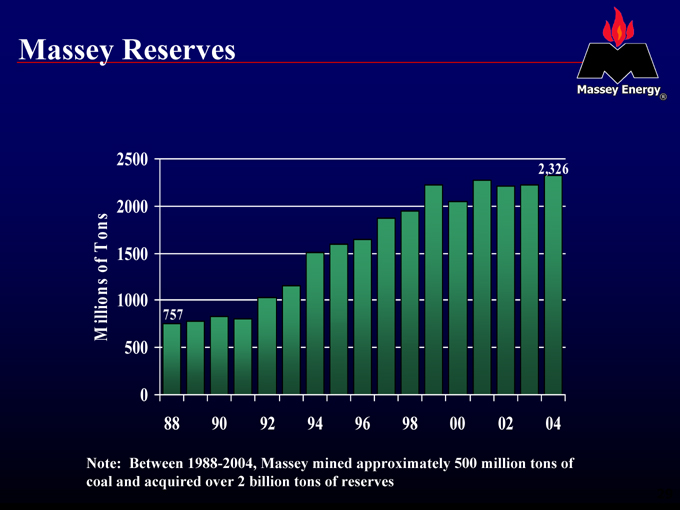
Massey Reserves
Millions of Tons
2500 2000 1500 1000 500 0
757
2,326
88 90 92 94 96 98 00 02 04
Note: Between 1988-2004, Massey mined approximately 500 million tons of coal and acquired over 2 billion tons of reserves
29
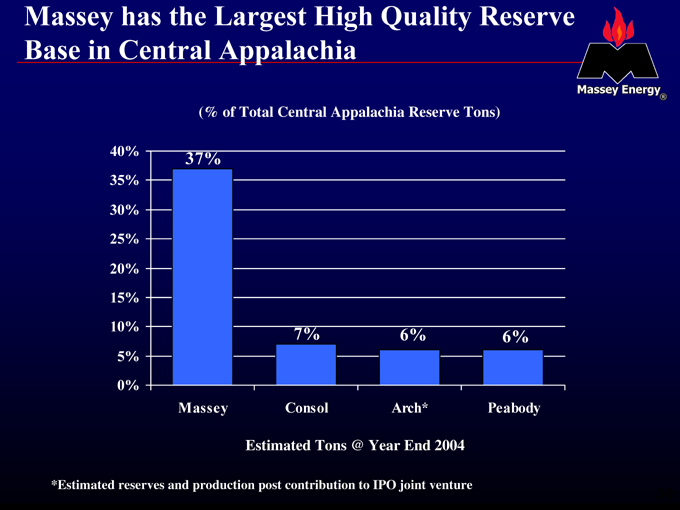
Massey has the Largest High Quality Reserve Base in Central Appalachia
(% of Total Central Appalachia Reserve Tons)
40% 35% 30% 25% 20% 15% 10% 5% 0%
37%
7%
6%
6%
Massey Consol Arch* Peabody
Estimated Tons @ Year End 2004
*Estimated reserves and production post contribution to IPO joint venture
30
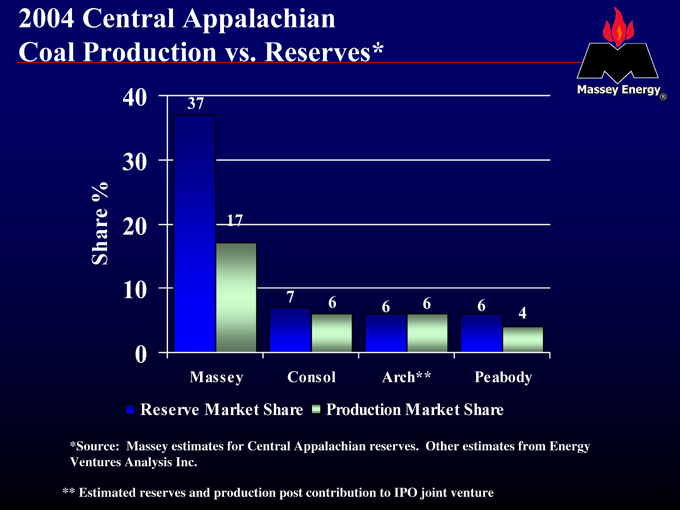
2004 Central Appalachian Coal Production vs. Reserves*
Share %
40 30 20 10 0
37
17
7 |
| 6 6 |
6 |
| 6 4 |
Massey Consol Arch** Peabody
Reserve Market Share Production Market Share
*Source: Massey estimates for Central Appalachian reserves. Other estimates from Energy Ventures Analysis Inc.
** Estimated reserves and production post contribution to IPO joint venture
31
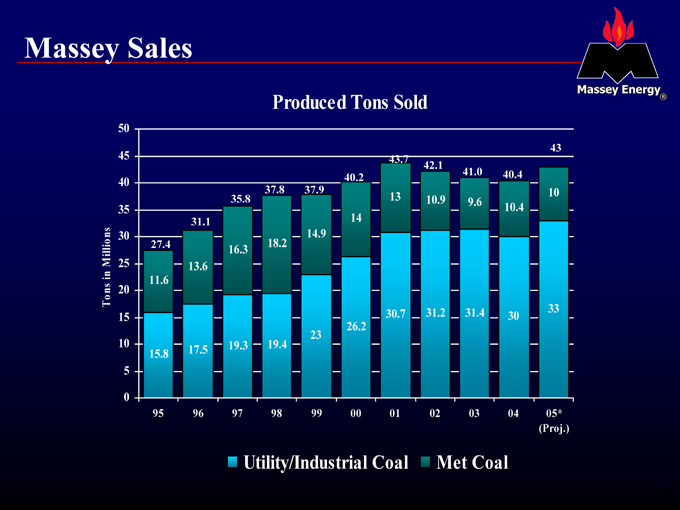
Massey Sales
Produced Tons Sold
Tons in Millions
50 45 40 35 30 25 20 15 10 5 0
27.4
31.1
35.8
37.8
37.9
40.2
43.7
42.1
41.0
40.4
43
11.6
13.6
16.3
18.2
14.9
14
13
10.9
9.6
10.4
10
30.7 31.2 31.4 33 30 26.2 23 17.5 19.3 19.4 15.8
95 96 97 98 99 00 01 02 03 04 05* (Proj.)
Utility/Industrial Coal Met Coal
32
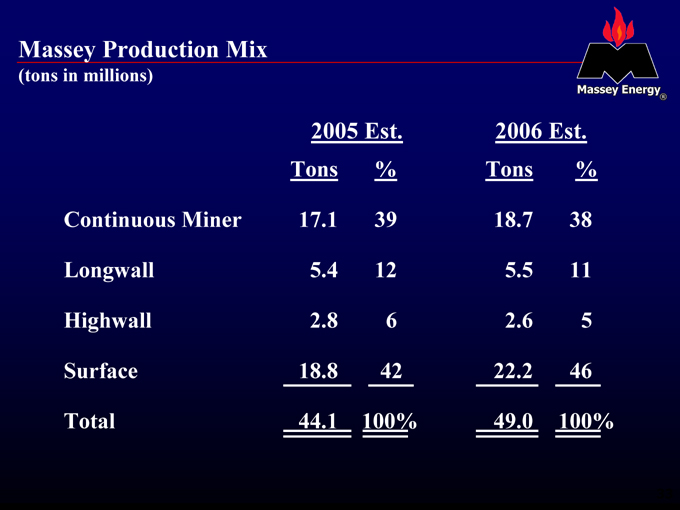
Massey Production Mix
(tons in millions)
2005 |
| Est. 2006 Est. |
Tons |
| % Tons % |
Continuous |
| Miner 17.1 39 18.7 38 |
Longwall |
| 5.4 12 5.5 11 |
Highwall |
| 2.8 6 2.6 5 |
Surface |
| 18.8 42 22.2 46 |
Total |
| 44.1 100% 49.0 100% |
33

Massey Challenges
34
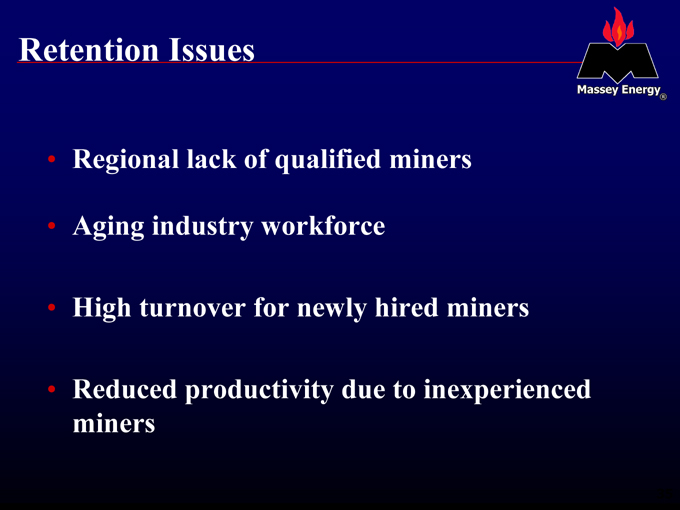
Retention Issues
Regional lack of qualified miners
Aging industry workforce
High turnover for newly hired miners
Reduced productivity due to inexperienced miners
35
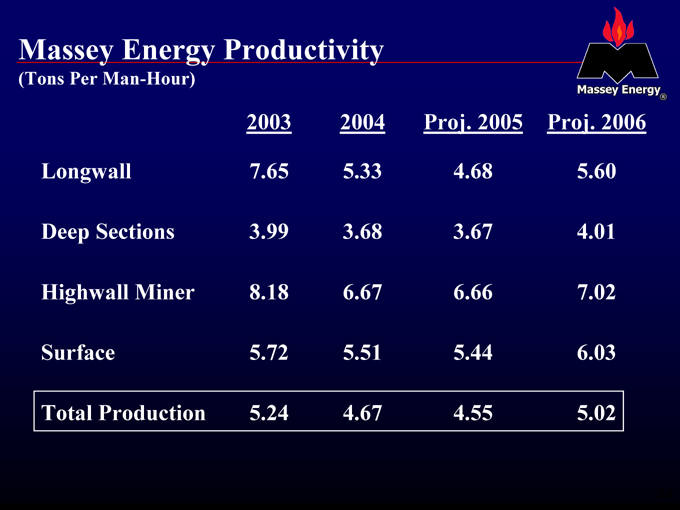
Massey Energy Productivity
(Tons Per Man-Hour)
2003 |
| 2004 Proj. 2005 Proj. 2006 |
Longwall |
| 7.65 5.33 4.68 5.60 |
Deep |
| Sections 3.99 3.68 3.67 4.01 |
Highwall |
| Miner 8.18 6.67 6.66 7.02 |
Surface |
| 5.72 5.51 5.44 6.03 |
Total |
| Production 5.24 4.67 4.55 5.02 |
36
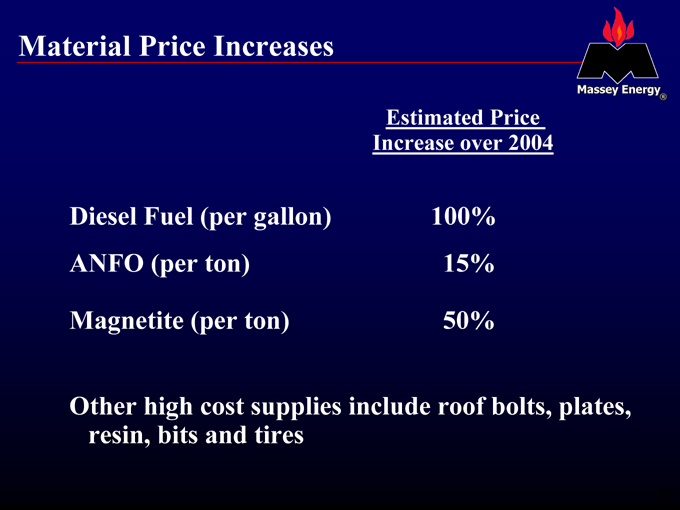
Material Price Increases
Estimated Price
Increase over 2004
Diesel |
| Fuel (per gallon) 100% |
ANFO |
| (per ton) 15% |
Magnetite |
| (per ton) 50% |
Other high cost supplies include roof bolts, plates, resin, bits and tires
37
Massey Energy Guidance
(Revised)
2005 |
| 2006 |
Produced |
| tons sold (in millions) 42 – 44 48 – 50 |
Revenue |
| per ton $42 – 43 $50 |
Cash |
| cost per ton $35 – 36 $36—39 |
38

Massey Strengths
39
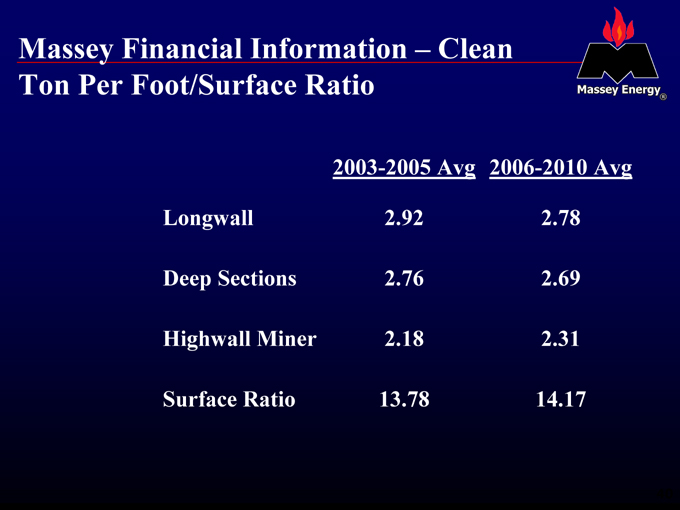
Massey Financial Information – Clean Ton Per Foot/Surface Ratio
2003-2005 |
| Avg 2006-2010 Avg |
Longwall |
| 2.92 2.78 |
Deep |
| Sections 2.76 2.69 |
Highwall |
| Miner 2.18 2.31 |
Surface |
| Ratio 13.78 14.17 |
40
The Tons Produced Are The Rewards Of Mining, Not The Cost
41

Costs Are Driven
By The Distance Mined (Deep)
or Yards Mined (Surface),
Not By
The Tons Of Reward
42
Summary of our Strengths
Highest quality coal in the world
Single largest reserve base in Central Appalachia
Largest met coal producer in the U.S. State of the art equipment Low level of long-term liabilities Strong balance sheet
43
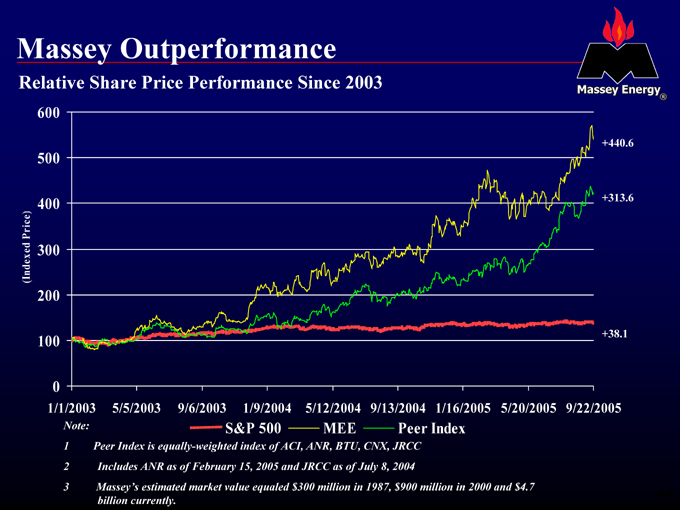
Massey Outperformance
Relative Share Price Performance Since 2003
(Indexed Price)
600 500 400 300 200 100 0
1/1/2003 5/5/2003 9/6/2003 1/9/2004 5/12/2004 9/13/2004 1/16/2005 5/20/2005 9/22/2005
+440.6 +313.6 +38.1
Note: S&P 500 MEE Peer Index
1 |
| Peer Index is equally-weighted index of ACI, ANR, BTU, CNX, JRCC |
2 |
| Includes ANR as of February 15, 2005 and JRCC as of July 8, 2004 |
3 |
| Massey’s estimated market value equaled $300 million in 1987, $900 million in 2000 and $4.7 billion currently. |
44

Doing the Right Thing. with Energy
45