Exhibit 99.8
Utility Sales
John Parker
Senior Vice President – Massey Utility Sales
September 27, 2005
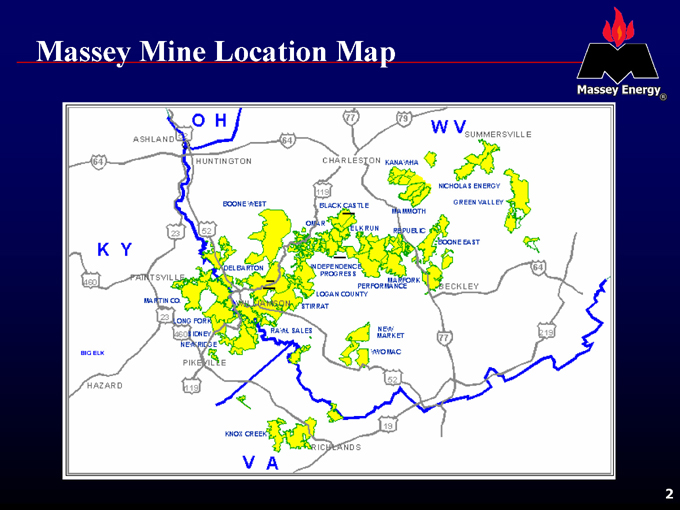
Massey Mine Location Map
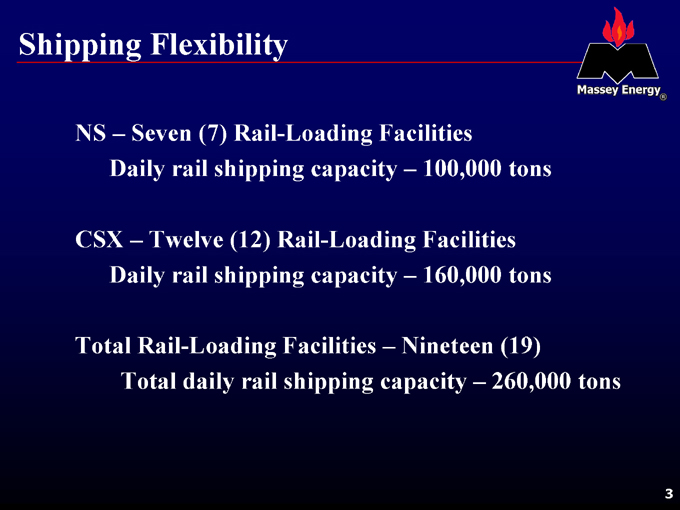
Shipping Flexibility
NS – Seven (7) Rail-Loading Facilities
Daily rail shipping capacity – 100,000 tons
CSX – Twelve (12) Rail-Loading Facilities
Daily rail shipping capacity – 160,000 tons
Total Rail-Loading Facilities – Nineteen (19)
Total daily rail shipping capacity – 260,000 tons
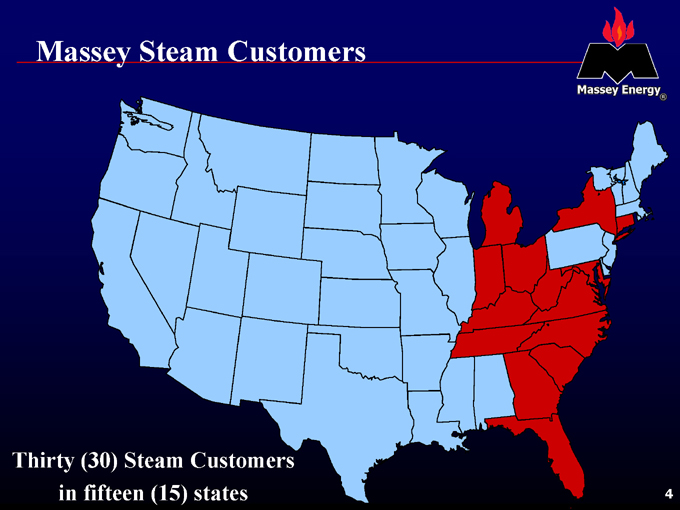
Massey Steam Customers
Thirty (30) Steam Customers in fifteen (15) states
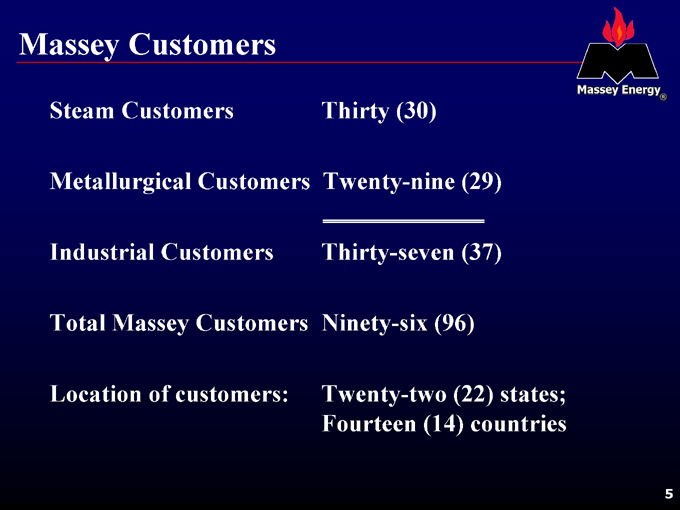
Massey Customers
Steam Customers
Metallurgical Customers
Industrial Customers
Total Massey Customers
Location of customers:
Thirty (30)
Twenty-nine (29)
Thirty-seven (37)
Ninety-six (96)
Twenty-two (22) states; Fourteen (14) countries
Massey Steam Sales Top Five Customers
1. American Electric Power Service – Columbus, OH
2. Detroit Edison Company – Detroit, MI
3. Duke Energy – Charlotte, NC
4. Constellation Power Source – Baltimore, MD
5. Progress Energy Corporation/ Progress – Carolinas, Raleigh, NC
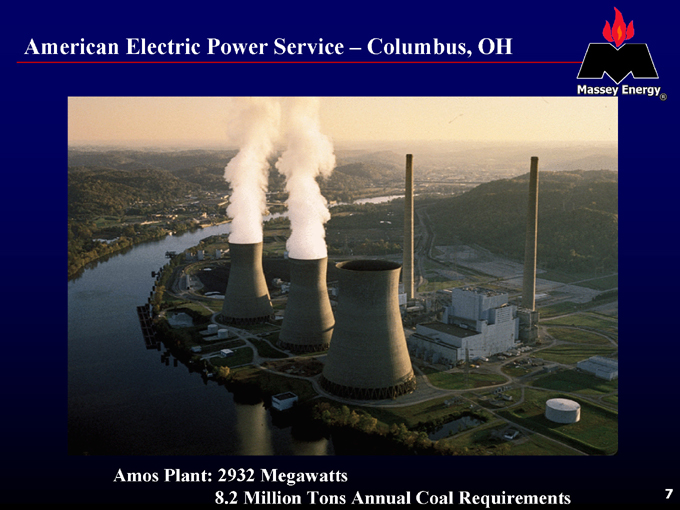
American Electric Power Service – Columbus, OH
Amos Plant: 2932 Megawatts
8.2 Million Tons Annual Coal Requirements

Detroit Edison Power – Detroit, MI
Monroe Power Plant: 3200 Megawatts
9.1 Million Tons Annual Coal Requirements
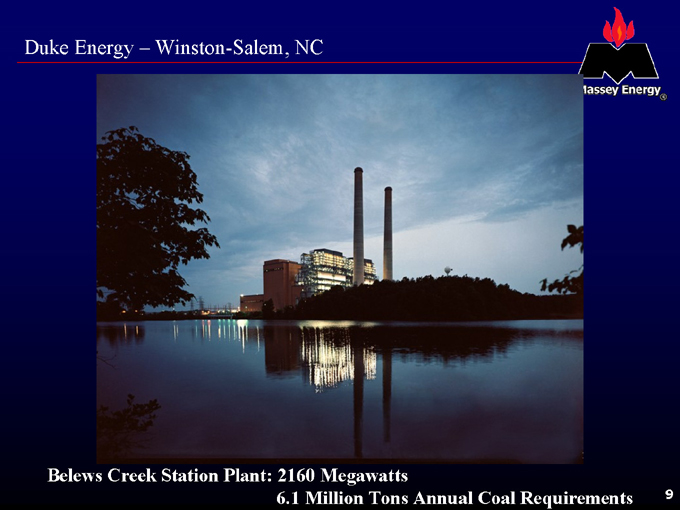
Duke Energy – Winston-Salem, NC
Belews Creek Station Plant: 2160 Megawatts
6.1 Million Tons Annual Coal Requirements
9
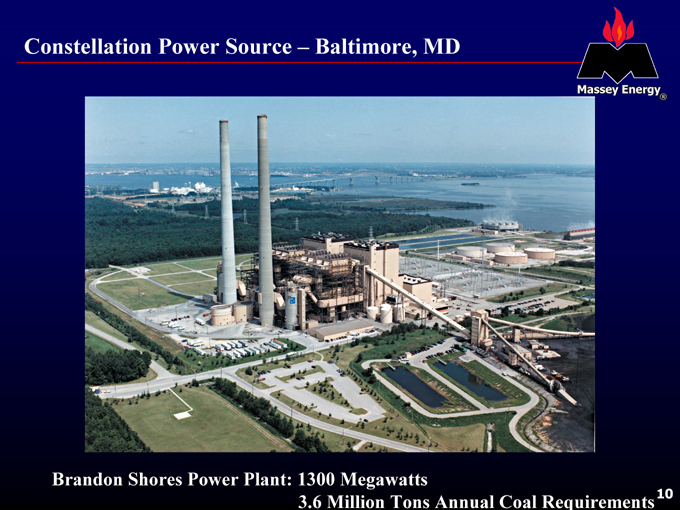
Constellation Power Source – Baltimore, MD
Brandon Shores Power Plant: 1300 Megawatts
3.6 Million Tons Annual Coal Requirements
10
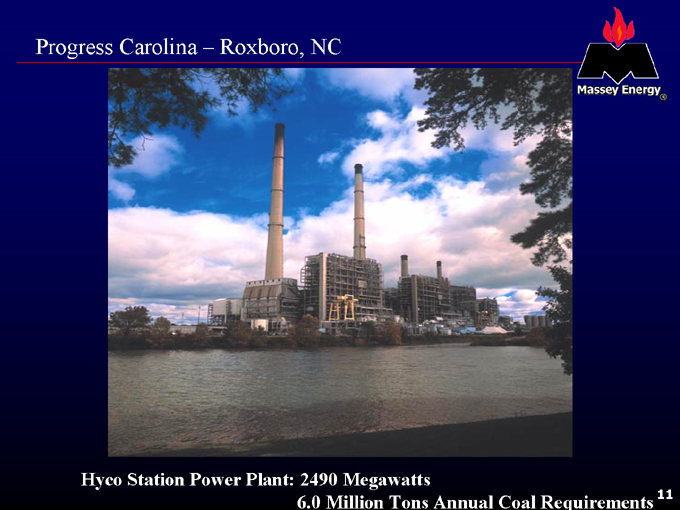
Progress Carolina – Roxboro, NC
Hyco Station Power Plant: 2490 Megawatts
6.0 Million Tons Annual Coal Requirements
11

Progress Energy—Tampa, Florida
Crystal River Power Plant: 2442 Megawatts
6.3 Million Tons Annual Coal Requirements
12

Our Competition
PRB
Illinois Basin
Northern Appalachian
Imports
Transportation issues—Distance Quality requires blending
Fugitive dust problems – Railroad & Plant
Transportation disadvantage—Distance Quality
Supply constraint
Utilized Metallurgical blends
Port constraints Ocean freight volatility
Rail transportation to inland customers
13

New Scrubbers
Most of our customers will stay with Central Appalachia coal
Many Northeastern and Southeastern utilities have concerns with Illinois Basin coal quality.
14
The Steam Market
Markets firm as supply worries continue & inventory levels remain low.
15
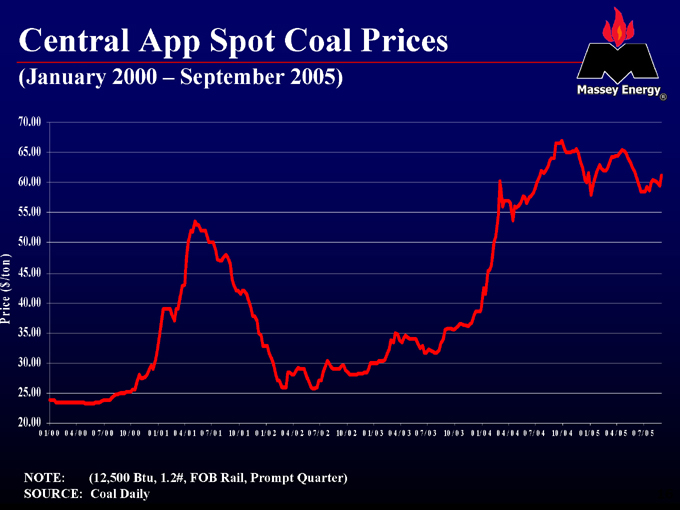
Central App Spot Coal Prices
(January 2000 – September 2005)
Price ($/ton)
70.00 65.00 60.00 55.00 50.00 45.00 40.00 35.00 30.00 25.00 20.00
0 1/ 0 0 0 4 / 0 0 0 7/ 0 0 10 / 0 0 0 1/ 0 1 0 4 / 0 1 0 7/ 0 1 10 / 0 1 0 1/ 0 2 0 4 / 0 2 0 7/ 0 2 10 / 0 2 0 1/ 0 3 0 4 / 0 3 0 7/ 0 3 10 / 0 3 0 1/ 0 4 0 4 / 0 4 0 7/ 0 4 10 / 0 4 0 1/ 0 5 0 4 / 0 5 0 7/ 0 5
NOTE: (12,500 Btu, 1.2#, FOB Rail, Prompt Quarter) SOURCE: Coal Daily
16
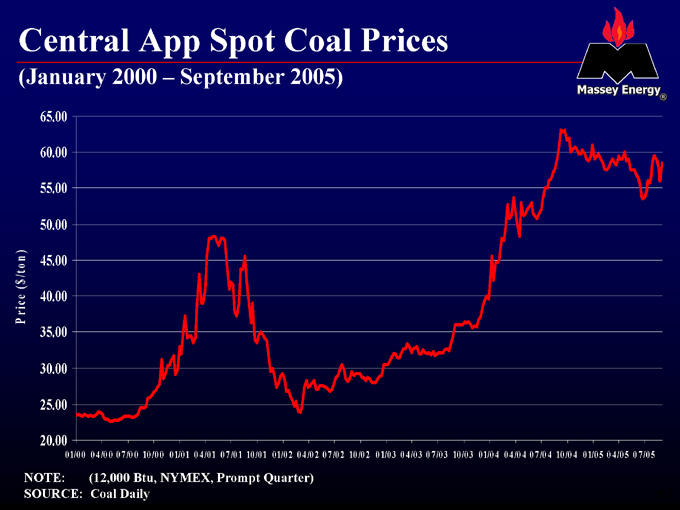
Central App Spot Coal Prices
(January 2000 – September 2005)
Price ($/ton )
65.00 60.00 55.00 50.00 45.00 40.00 35.00 30.00 25.00 20.00
0 1/0 0 0 4 /0 0 0 7 /0 0 10 /0 0 0 1/0 1 0 4 /0 1 0 7 /0 1 10 /0 1 0 1/0 2 0 4 /0 2 0 7 /0 2 10 /0 2 0 1/0 3 0 4 /0 3 0 7 /0 3 10 /0 3 0 1/0 4 0 4 /0 4 0 7 /0 4 10 /0 4 0 1/0 5 0 4 /0 5 0 7 /0 5
NOTE: (12,000 Btu, NYMEX, Prompt Quarter) SOURCE: Coal Daily
17
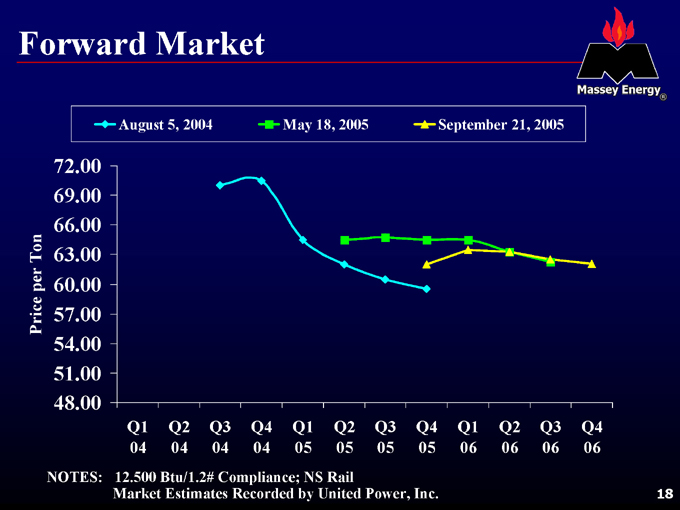
Forward Market
August 5, 2004
May 18, 2005
September 21, 2005
Price per Ton
72.00 69.00 66.00 63.00 60.00 57.00 54.00 51.00 48.00
Q1 Q2 Q3 Q4 Q1 Q2 Q3 Q4 Q1 Q2 Q3 Q4
04 04 04 04 05 05 05 05 06 06 06 06
NOTES: 12.500 Btu/1.2# Compliance; NS Rail
Market Estimates Recorded by United Power, Inc.
18
The Steam Market
Central Appalachia production continues to decrease
Labor, equipment and permits are the major production constraints
19
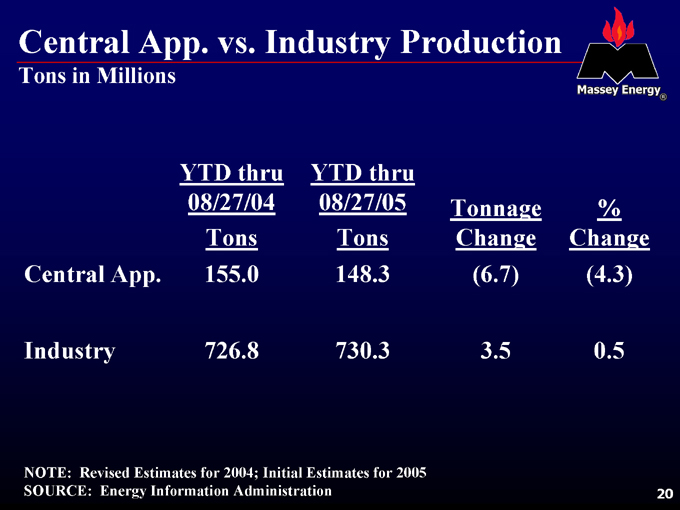
Central App. vs. Industry Production
Tons in Millions
YTD thru 08/27/04 Tons
YTD thru 08/27/05 Tons
Tonnage Change
% Change
Central App.
155.0
148.3
(6.7)
(4.3)
Industry
726.8
730.3
3.5
0.5
NOTE: Revised Estimates for 2004; Initial Estimates for 2005 SOURCE: Energy Information Administration
20

Utilities Buying Practices
Prior to 2002, many utilities had 75 – 80% of their annual burn under long-term agreements (plus 3 years).
In today’s market, most utilities are more inclined to secure 90% of their supply with 1 – 3 year agreements.
Some utilities elect to utilize lower quality coals in off-peak burn periods.
21
Summary
In summary:
Massey has a commanding presence in Central Appalachia
Extensive coal reserves
Multiple shipping sources
Diverse customers – Utility/ Metallurgical/ Industrial
The Central Appalachian coal region produces coals that can serve any market in the world.
22

Doing the Right Thing. with Energy
23