Exhibit 99.10
Financial Overview
Eric Tolbert
Vice President and Chief Financial Officer
September 27, 2005
Financial Review

Recent Financial Results
6 | | mos. 2003 6 mos. 2004 6 mos. 2005 |
Produced coal $628.3 mm $729.2 mm $935.0 mm revenue Tons sold 20.7 mm 20.7 mm 22.3 mm
Average per ton $30.43 $35.16 $41.97 realization EBITDA $88.1 mm $135.5mm $242.2 mm*
*Includes pre-tax gain of $34 million on sale of Big Elk.
Income Statement

Income Statement—Revenue
($ in millions)
Year Ended Dec. 31, 2004 Produced coal revenue $1,457 Freight and handling revenue $ 149 Purchased coal revenue $ 105 Other revenue $ 56 Total revenues $1,767
Other Revenue
“ Other Revenue” includes:
Synfuel operation earnings Gas well revenues Coal handling facility fees Outside coal royalties Non-strategic asset sales Contract buyout payments Other items
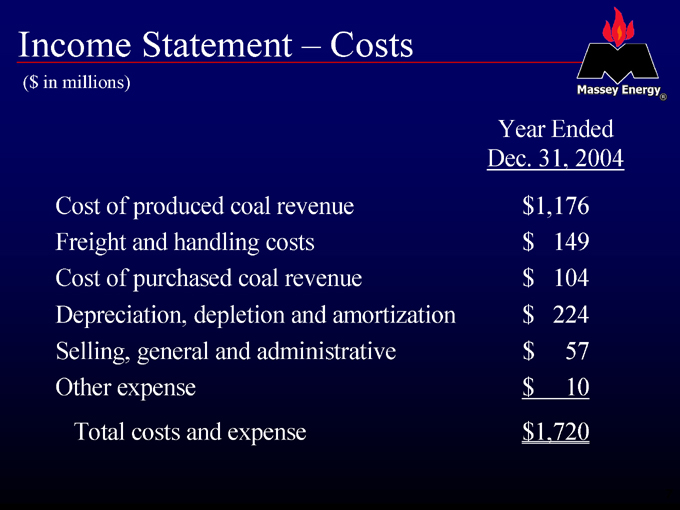
Income Statement – Costs
($ in millions)
Year Ended Dec. 31, 2004 Cost of produced coal revenue $1,176 Freight and handling costs $ 149 Cost of purchased coal revenue $ 104 Depreciation, depletion and amortization $ 224 Selling, general and administrative $ 57 Other expense $ 10 Total costs and expense $1,720
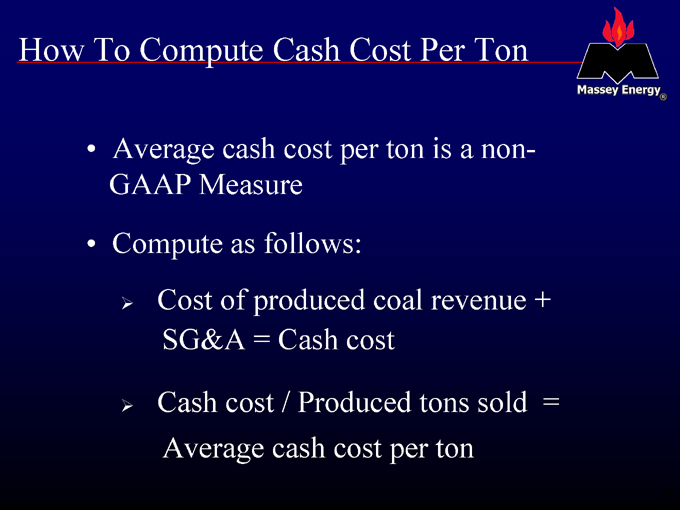
How To Compute Cash Cost Per Ton
Average cash cost per ton is a non-GAAP Measure Compute as follows:
Cost of produced coal revenue + SG&A = Cash cost
Cash cost / Produced tons sold = Average cash cost per ton
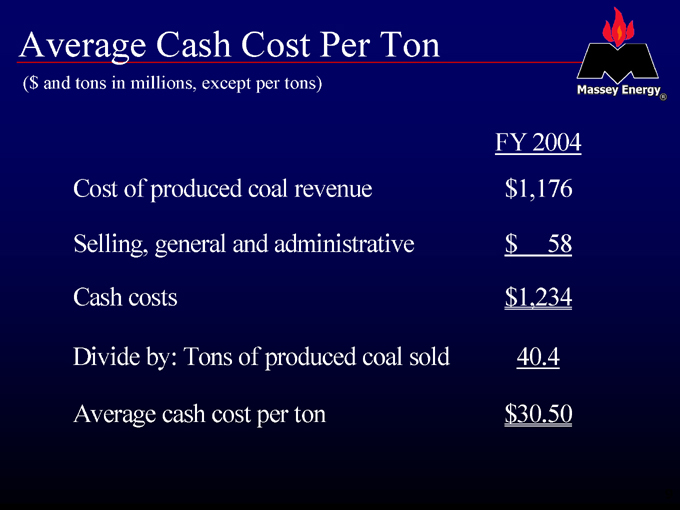
Average cash cost per ton($ and tons in millions, except per tons)
FY 2004 Cost of produced coal revenue $1,176
Selling, general and administrative $ 58 Cash costs $1,234 Divide by: Tons of produced coal sold 40.4 Average cash cost per ton $30.50
9
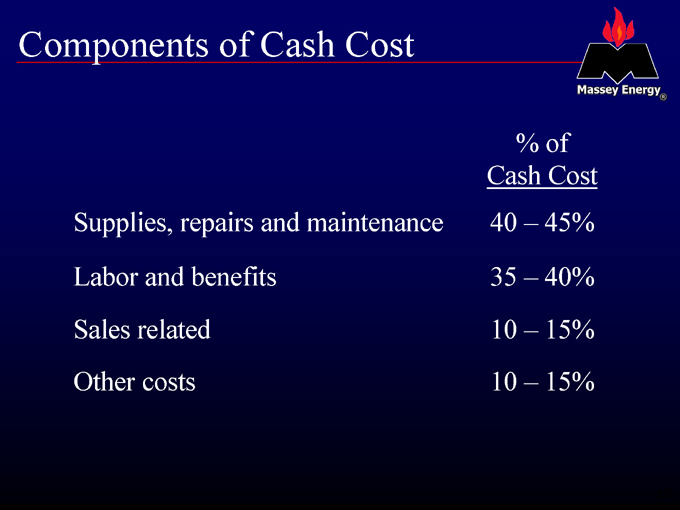
Components of Cash Cost
% of Cash Cost Supplies, repairs and maintenance 40 – 45% Labor and benefits 35 – 40% Sales related 10 – 15% Other costs 10 – 15%
10
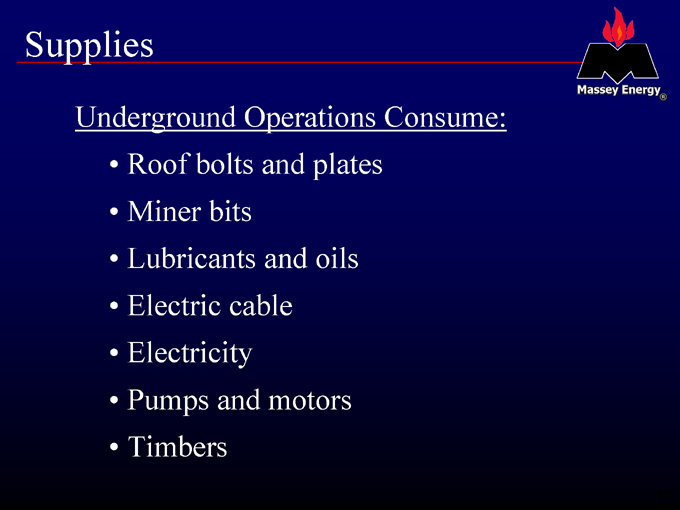
Supplies
Underground Operations Consume:
Roof bolts and plates Miner bits Lubricants and oils Electric cable Electricity Pumps and motors Timbers
11
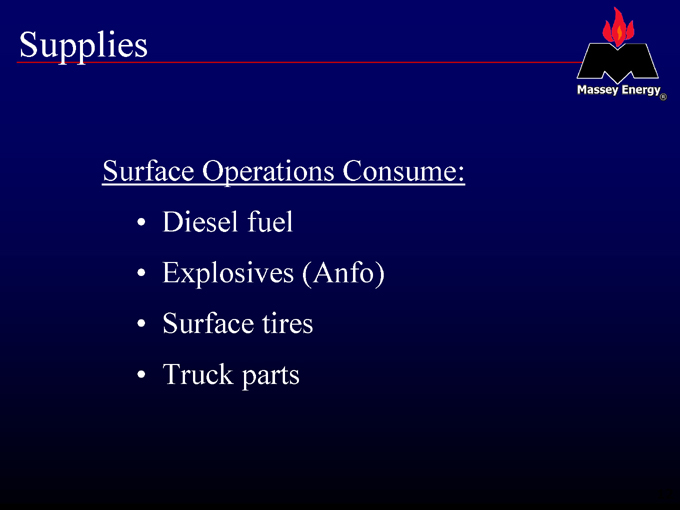
Supplies
Surface Operations Consume:
Diesel fuel Explosives (Anfo) Surface tires Truck parts
12
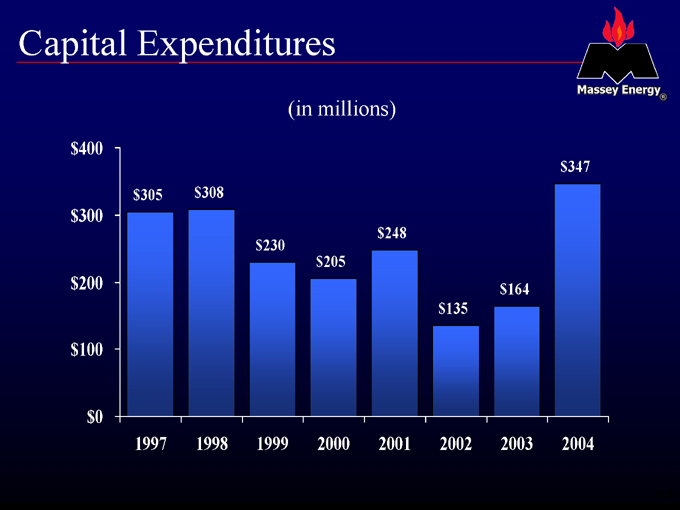
Capital Expenditures
(in millions) $400 $300 $200 $100 $0 $347 $305 $308
$248 $230 $205 $164 $135
1997 1998 1999 2000 2001 2002 2003 2004 13
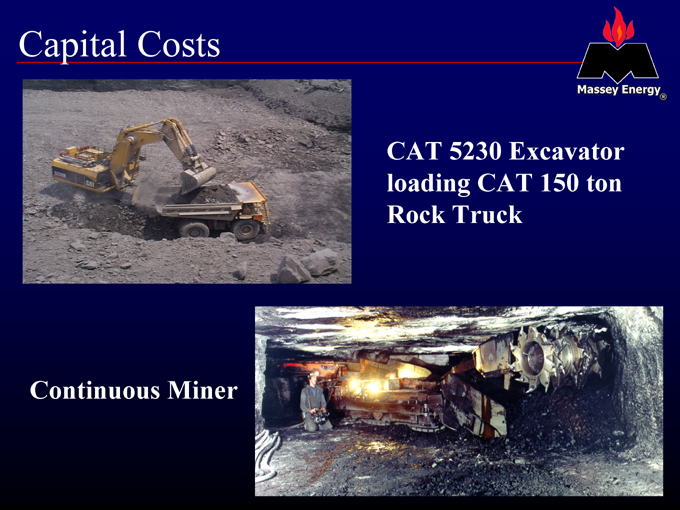
Capital Costs
CAT 5230 Excavator loading CAT 150 ton Rock Truck
Continuous Miner
14
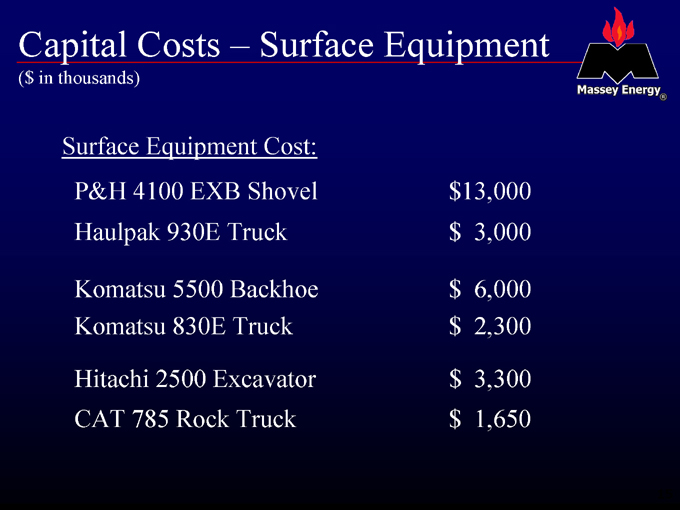
Capital Costs – Surface Equipment
($ in thousands)
Surface Equipment Cost:
P&H 4100 EXB Shovel $13,000 Haulpak 930E Truck $ 3,000
Komatsu 5500 Backhoe $ 6,000 Komatsu 830E Truck $ 2,300
Hitachi 2500 Excavator $ 3,300 CAT 785 Rock Truck $ 1,650
15
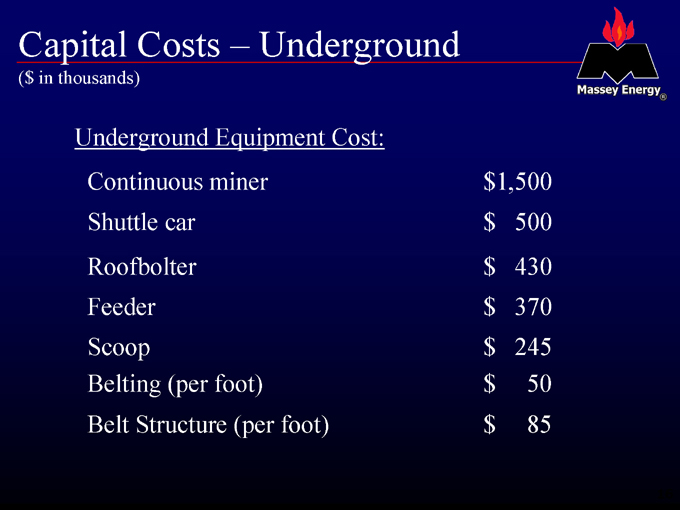
Capital Costs – Underground
($ in thousands)
Underground Equipment Cost:
Continuous miner $1,500 Shuttle car $ 500 Roofbolter $ 430 Feeder $ 370 Scoop $ 245 Belting (per foot) $ 50 Belt Structure (per foot) $ 85
16
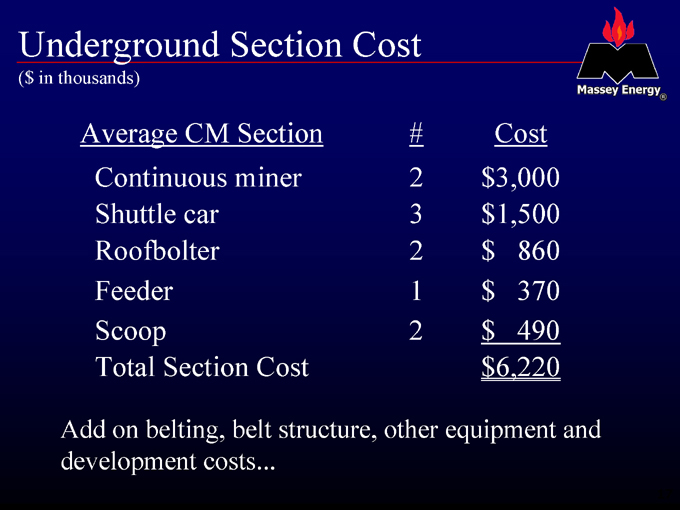
Underground Section Cost
($ in thousands)
Average CM Section # Cost Continuous miner 2 $3,000 Shuttle car 3 $1,500 Roofbolter 2 $ 860 Feeder 1 $ 370 Scoop 2 $ 490 Total Section Cost $6,220
Add on belting, belt structure, other equipment and development costs.
17
Balance Sheet
18
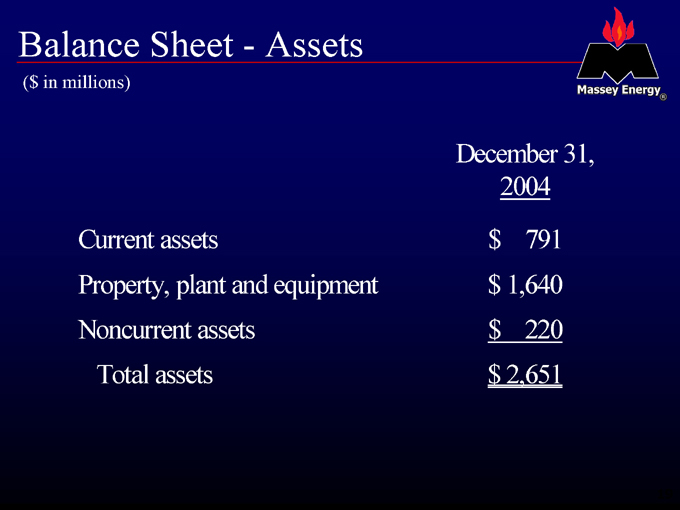
Balance Sheet—Assets
($ in millions)
December 31, 2004 Current assets $ 791 Property, plant and equipment $ 1,640 Noncurrent assets $ 220 Total assets $ 2,651
19
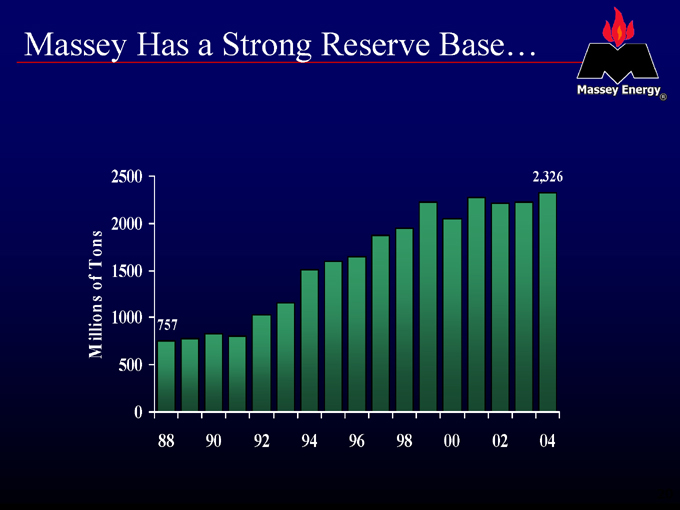
Massey Has a Strong Reserve Base…
M illions of Tons
2500 2000 1500 1000 500 0
757
2,326
88 90 92 94 96 98 00 02 04 20
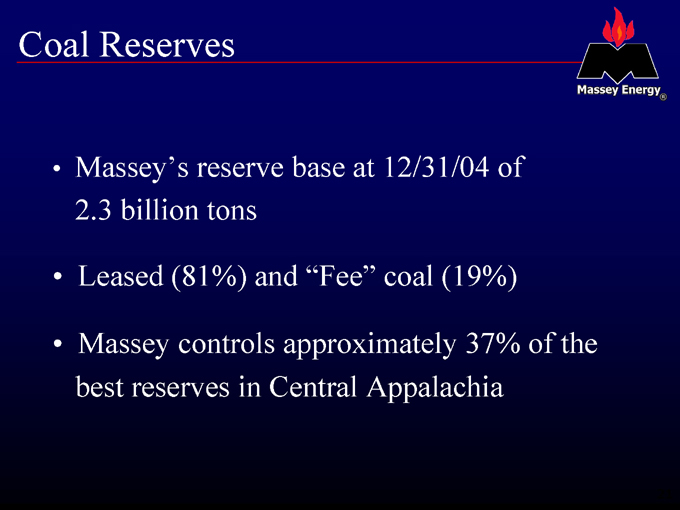
Coal Reserves
Massey’s reserve base at 12/31/04 of 2.3 billion tons
Leased (81%) and “Fee” coal (19%)
Massey controls approximately 37% of the best reserves in Central Appalachia
21
Industry Accounting Concepts
Advance surface mine costs “Pit Coal” Longwall panel costs Mineral rights and mining properties Deferred royalties
22
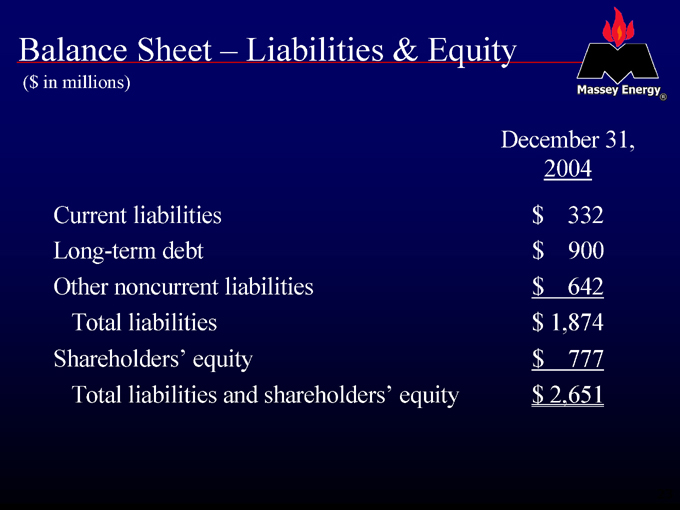
Balance Sheet – Liabilities & Equity
($ in millions)
December 31, 2004 Current liabilities $ 332 Long-term debt $ 900 Other noncurrent liabilities $ 642 Total liabilities $ 1,874 Shareholders’ equity $ 777 Total liabilities and shareholders’ equity $ 2,651
23
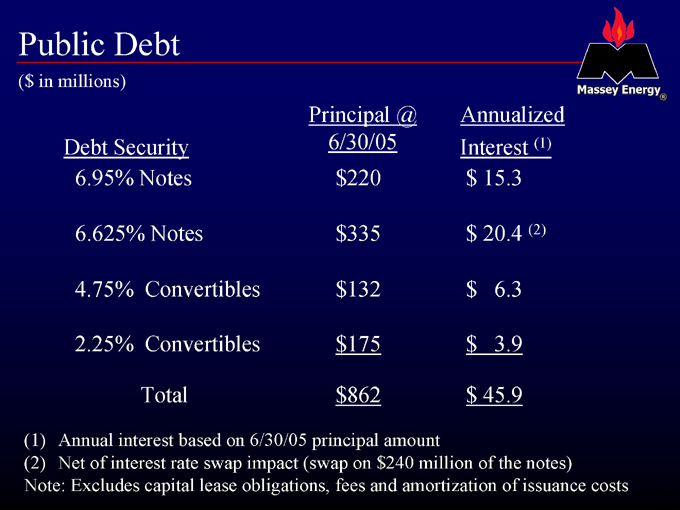
Public Debt
($ in millions)
Principal @ Annualized Debt Security 6/30/05 Interest (1) 6.95% Notes $220 $ 15.3
6.625% Notes $335 $ 20.4 (2) 4.75% Convertibles $132 $ 6.3 2.25% Convertibles $175 $ 3.9 Total $862 $ 45.9
(1) | | Annual interest based on 6/30/05 principal amount |
(2) Net of interest rate swap impact (swap on $240 million of the notes) Note: Excludes capital lease obligations, fees and amortization of issuance costs
24
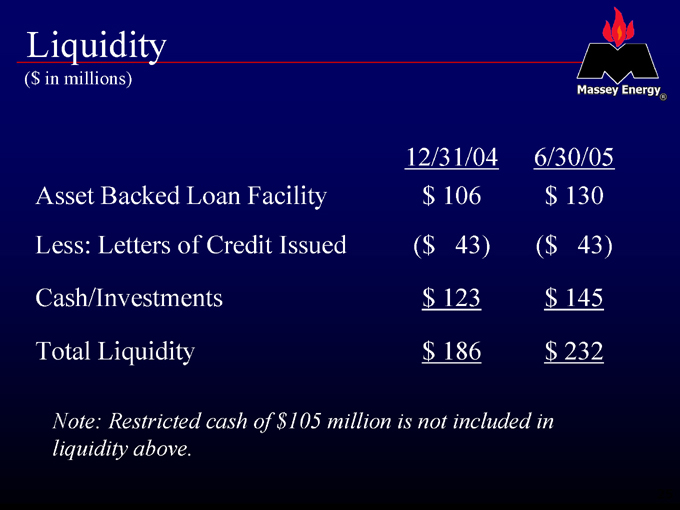
Liquidity
($ in millions)
12/31/04 6/30/05 Asset Backed Loan Facility $ 106 $ 130 Less: Letters of Credit Issued ($ 43) ($ 43) Cash/Investments $ 123 $ 145
Total Liquidity $ 186 $ 232
Note: Restricted cash of $105 million is not included in liquidity above.
25
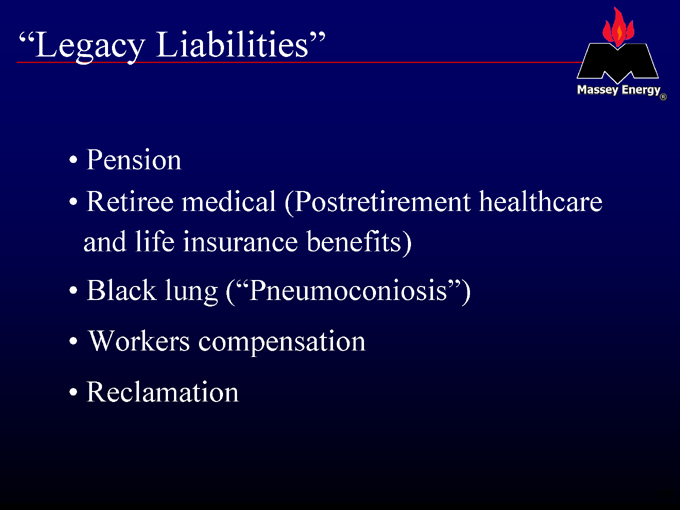
“Legacy Liabilities”
Pension
Retiree medical (Postretirement healthcare and life insurance benefits) Black lung (“Pneumoconiosis”) Workers compensation Reclamation
26
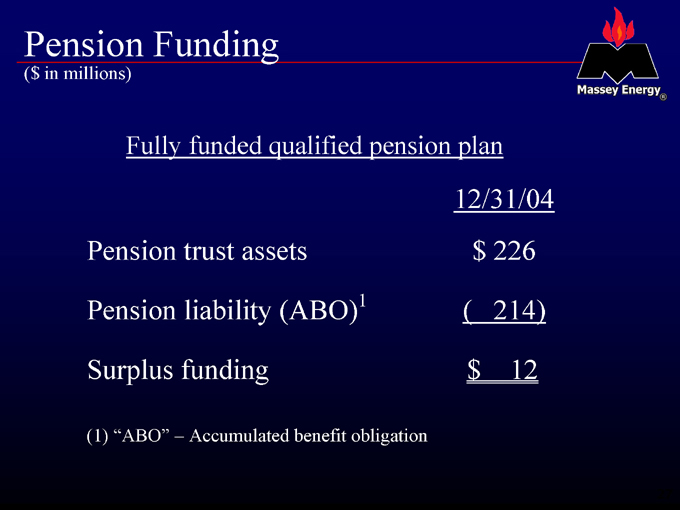
Pension Funding
($ in millions)
Fully funded qualified pension plan
12/31/04 Pension trust assets $ 226
Pension liability (ABO)1 ( 214)
Surplus funding $ 12
(1) | | “ABO” – Accumulated benefit obligation |
27
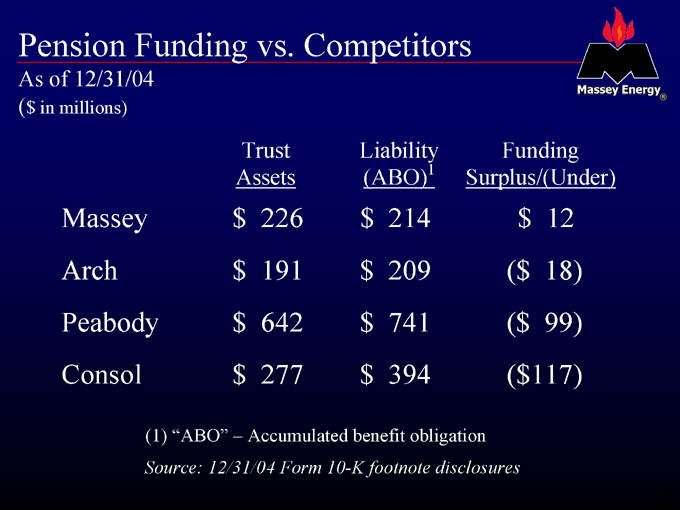
Pension Funding vs. Competitors
As of 12/31/04
($ in millions)
Trust Liability Funding Assets (ABO)1 Surplus/(Under)
Massey $ 226 $ 214 $ 12 Arch $ 191 $ 209 ($ 18) Peabody $ 642 $ 741 ($ 99) Consol $ 277 $ 394 ($117)
(1) | | “ABO” – Accumulated benefit obligation |
Source: 12/31/04 Form 10-K footnote disclosures
28
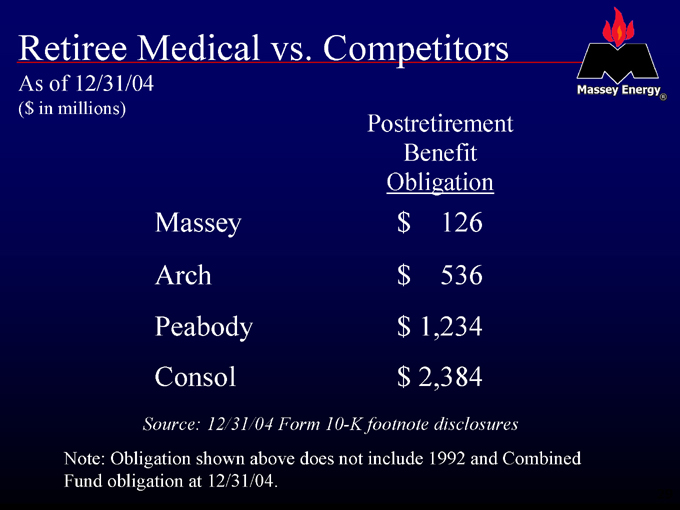
Retiree Medical vs. Competitors
As of 12/31/04
($ in millions)
Postretirement Benefit Obligation
Massey $ 126 Arch $ 536 Peabody $ 1,234 Consol $ 2,384
Source: 12/31/04 Form 10-K footnote disclosures
Note: Obligation shown above does not include 1992 and Combined Fund obligation at 12/31/04.
29
New Accounting Rules
30
Post-Production Surface Mine Costs
EITF Issue No. 04-6 ratified by FASB in Spring of 2005 Overburden and waste material costs (“advance stripping costs”) incurred during surface mine production phase currently are captured as a component of inventory New accounting rule only allows production costs related to extracted coal to be included in inventory cost Advance stripping costs associated with in-process (uncovered) production shall not be recognized in inventory and will be expensed
31
Post-Production Surface Mine Costs
(continued)
Surface mine “advance stripping costs” classified in inventory of $150 million at 6/30/05 Adoption of new rule effective January 1, 2006 by reduction of inventory and adjustment to beginning retained earnings Had adjustment been made on June 30th 2005, would have resulted in a reduction to inventory of $150 mm and to retained earnings of $120 mm (net of approx. 20% tax)
32
Stock Option Expensing – FAS 123(R)
Adoption on January 1, 2006
Impact will include expensing of stock options through income statement FY 2004 basic earnings per share impact of stock option expensing would have been about $0.02 per share (net of tax)
33
Doing the Right Thing. with Energy
34