 F.N.B. Corporation Announces Agreement to Acquire Metro Bancorp, Inc. August 4, 2015 Exhibit 99.2 |
 Cautionary Statement Regarding Forward-Looking Information and Non-GAAP Financial Information This presentation contains "forward-looking statements" within the meaning of the Private Securities Litigation Reform Act, relating to present or future trends or factors affecting the banking industry and, specifically, the financial operations, markets and products of F.N.B. Corporation and Metro Bancorp, Inc. Forward-looking statements are typically identified by words such as “believe”, “plan”, “expect”, “anticipate”, “intend”, “outlook”, “estimate”, “forecast”, “will”, “should”, “project”, “goal”, and other similar words and expressions. These forward-looking statements involve certain risks and uncertainties. In addition to factors previously disclosed in F.N.B. Corporation and Metro Bancorp, Inc. reports filed with the SEC and those identified elsewhere in this filing, the following factors among others, could cause actual results to differ materially from forward-looking statements or historical performance: ability to obtain regulatory approvals in a timely manner and without significant expense or other burdens; meet other closing conditions to the Merger, including approval by F.N.B. Corporation and Metro Bancorp, Inc. shareholders, on the expected terms and schedule; delay in closing the Merger; difficulties and delays in integrating the F.N.B. Corporation and Metro Bancorp, Inc. businesses or fully realizing cost savings and other benefits; business disruption following the Merger; changes in asset quality and credit risk; the inability to sustain revenue and earnings growth; changes in interest rates and capital markets; inflation; customer acceptance of F.N.B. Corporation products and services; customer borrowing, repayment, investment and deposit practices; customer disintermediation; the introduction, withdrawal, success and timing of business initiatives; competitive conditions; the inability to realize cost savings or revenues or to implement integration plans and other consequences associated with mergers, acquisitions and divestitures; economic conditions; and the impact, extent and timing of technological changes, capital management activities, and other actions of the Federal Reserve Board and legislative and regulatory actions and reforms. F.N.B. Corporation and Metro Bancorp, Inc. undertake no obligation to revise these forward-looking statements or to reflect events or circumstances after the date of this presentation. ADDITIONAL INFORMATION ABOUT THE MERGER F.N.B. Corporation and Metro Bancorp, Inc. will file a joint proxy statement/prospectus and other relevant documents with the SEC in connection with the merger. THE RESPECTIVE SHAREHOLDERS OF AND F.N.B. CORPORATION AND METRO BANCORP, INC. ARE ADVISED TO READ THE JOINT PROXY STATEMENT/PROSPECTUS WHEN IT BECOMES AVAILABLE AND ANY OTHER RELEVANT DOCUMENTS FILED WITH THE SEC, AS WELL AS ANY AMENDMENTS OR SUPPLEMENTS TO THOSE DOCUMENTS, BECAUSE THEY WILL CONTAIN IMPORTANT INFORMATION. The proxy statements/prospectuses and other relevant materials (when they become available), and any other documents F.N.B. Corporation and Metro Bancorp, Inc. have filed with the SEC, may be obtained free of charge at the SEC's website at www.sec.gov. In addition, investors and security holders may obtain free copies of the documents F.N.B. Corporation has filed with the SEC by contacting James Orie, Chief Legal Officer, F.N.B. Corporation, One F.N.B. Boulevard, Hermitage, PA 16148, telephone: (724) 983-3317; and free copies of the documents Metro Bancorp, Inc. has filed with the SEC by contacting Investor Relations (Sherry Richart), Metro Bancorp, Inc., 3801 Paxton Street, Harrisburg, PA 17111, telephone: (717) 412-6301. F.N.B. Corporation and Metro Bancorp, Inc. and certain of their directors and executive officers may be deemed to be participants in the solicitation of proxies from shareholders of F.N.B. Corporation and Metro Bancorp, Inc. in connection with the proposed merger. Information concerning such participants' ownership of F.N.B. Corporation and Metro Bancorp, Inc. common shares will be set forth in the joint proxy statements/prospectuses relating to the merger when they become available. This communication does not constitute an offer of any securities for sale. 2 |
 Transaction Rationale 3 Source: SNL Financial, Hoover’s. (1) Based on assets and market capitalization on a pro forma basis. (2) Based on FDIC deposit data as of 6/30/2014. Pro forma for announced acquisition of BoA branches. Custodian banks were excluded from the rankings. (3) Data includes Metro’s markets (Harrisburg, York, Lancaster, Reading, and Lebanon MSAs). (4) Assets and core net income pro forma for LTM 6/30/2015. Core net income represents net income available to common shareholders. Excludes realized gain on securities, amortization of intangibles, goodwill impairment and nonrecurring items. (5) Based on 6/30/2015 GAAP data. (6) Excluding one-time costs. Strategically Compelling FNB will become the largest regional bank and second largest bank based in Pennsylvania (1) Overall Pennsylvania market share increases to #5 with nearly $12 billion in deposits (2) FNB obtains immediate scale and #3 market share in the Harrisburg MSA with $1.4 billion in deposits (2) Attractive demographics with significant retail and commercial opportunities Access to 45 thousand businesses and population of over 2 million with median household income of ~$58 thousand (3) Significant operating scale and leveraging of FNB's risk management infrastructure Pro Forma total assets of ~$20 billion and core net income of ~$180 million (4) Complementary balance sheet and attractive funding profile with 24% demand deposits (5) Financially Attractive Accretive to GAAP EPS by ~4% ($0.04) and cash EPS by ~6% ($0.06) in first full year (6) ~3% dilution to tangible book value ($0.18 per share) with earnback of just under 5 years using the crossover method and less than a 5 month earnback on a pro forma earnings basis Greater than 20% internal rate of return Low Risk Comprehensive due diligence review and conservative credit mark Experienced acquirer and proven market expansion model |
 Overview of Metro Bancorp, Inc. 4 Source: SNL Financial, public filings. (1) As of 6/30/2015. Founded in 1985 and headquartered in Harrisburg, Pennsylvania Formerly Pennsylvania Commerce Bank and was operated as a franchisee or sister company to Commerce Bancorp, Inc. (acquired by TD in 2008) Rebranded to its current name and became independent from Commerce in 2009 Strong customer service orientation and sales culture Strong retail franchise with modern branches in prime locations 32 branches in Harrisburg, York, Lancaster, Reading, and Lebanon MSAs Average of $74 million in deposits per branch (1) |
 0.71% 0.75% 1.05% 1.19% 1.23% 1.36% 1.53% 2009Y 2010Y 2011Y 2012Y 2013Y 2014Y 2Q15 (2) (3) Overview of Metro Bancorp, Inc. (cont.) Source: SNL Financial, public filings. (1) Excludes gain on realized gain on securities and nonrecurring items. (2) Adjusted to exclude one-time increase in consulting fees related to Bank Secrecy Act (BSA) and Office of Foreign Assets Control (OFAC) compliance. (3) Excludes one-time charges due to an accelerated stock-based compensation expense due to the immediate vesting of all outstanding employee stock options triggered by a provision in the Company's Employee Stock Option and Restricted Stock Plan and charges related to Metro’s cost savings initiatives. 5 Core Pre-Provision Net Revenue (1) / Avg. Assets Deposits CAGR: 6.7% Yield: 5.41% 5.36% 5.29% 5.13% 4.80% 4.58% 4.49% $1,456 $1,398 $1,446 $1,544 $1,757 $2,004 $2,076 2009Y 2010Y 2011Y 2012Y 2013Y 2014Y 2Q15 CAGR: 5.0% Cost: 1.02% 0.72% 0.59% 0.37% 0.29% 0.27% 0.26% $1,815 $1,832 $2,072 $2,231 $2,240 $2,381 $2,369 2009Y 2010Y 2011Y 2012Y 2013Y 2014Y 2Q15 CAGR: 6.3% $2,148 $2,234 $2,421 $2,635 $2,781 $2,998 $3,001 2009Y 2010Y 2011Y 2012Y 2013Y 2014Y 2Q15 Assets Loans |
 Pro Forma Franchise Pro Forma Branch Franchise Harrisburg Deposit Market Share 6 Pennsylvania Deposit Market Share Cleveland Northwest Pittsburgh Central Capital Baltimore Rank Company 2014 Branches Deposits ($mm) Market Share 1 M&T 28 $2,138 17.8% 2 PNC 24 1,862 15.5 3 Combined 18 1,428 11.9 3 Metro 15 1,323 11.0 4 Wells Fargo 10 1,163 9.7 5 Orrstown 14 675 5.6 6 BB&T 16 661 5.5 7 Fulton 12 625 5.2 8 Mid Penn 13 569 4.8 9 S&T 4 522 4.4 10 Citizens 11 502 4.2 17 FNB 3 105 0.9 Rank Company 2014 Branches Deposits ($mm) Market Share 1 PNC 453 $75,327 23.7% 2 Wells Fargo 281 32,644 10.3 3 Citizens 360 23,913 7.5 4 TD Bank 97 12,042 3.8 5 Combined 258 11,518 3.6 5 M&T 196 10,689 3.4 6 FNB 226 9,321 2.9 7 BB&T 178 9,106 2.9 8 Banco Santander 159 8,732 2.8 9 Fulton 127 7,747 2.4 10 Bank of America 68 7,220 2.3 21 Metro 32 2,197 0.7 METR (32 branches) FNB (1) (2) (2) Source: SNL Financial. (1) Shaded areas represent FNB’s six regional market areas. (2) Branch deposit data as of 6/30/2014. Pro forma for announced acquisition of BoA branches. Custodian banks were excluded from the rankings. |
 Central Pennsylvania Opportunity Source: SNL Financial, Hoover’s. (1) Includes Baltimore MSA and Montgomery County. (2) Includes Harrisburg, York, Lancaster, Reading, and Lebanon MSAs. (3) Includes counties outside of Pittsburgh MSA, Baltimore Region, Cleveland MSA, and Central Pennsylvania. Number of Businesses (000s) Population (000s) 2015 Median HHI 2015-2020E Population Growth 7 59.5 93.4 51.4 45.0 Pittsburgh MSA Baltimore Region Cleveland MSA Central Pennsylvania (1) (2) 2,361 3,833 2,061 2,087 4,475 Pittsburgh MSA Baltimore Region Cleveland MSA Central Pennsylvania All Other FNB Counties (1) (2) (3) $53,296 $76,933 $48,286 $57,578 $46,569 $53,706 Pittsburgh MSA Baltimore Region Cleveland MSA Central Pennsylvania All Other FNB Counties National (1) (2) (3) 0.4% 4.0% (0.3%) 1.8% (0.9%) 3.5% Pittsburgh MSA Baltimore Region Cleveland MSA Central Pennsylvania All Other FNB Counties National (1) (2) (3) |
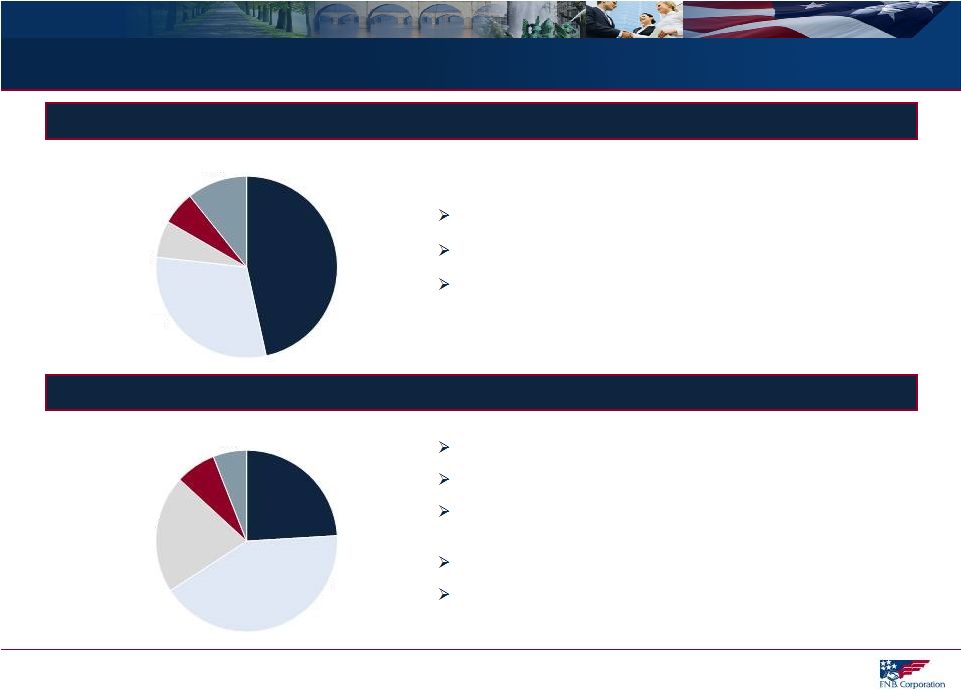 Complementary Balance Sheet Source: SNL Financial, Company data. Based on 6/30/2015 GAAP data. (1) Includes commercial tax-exempt and owner occupied real estate. (2) Includes brokered and time deposits. (3) Includes municipal and school district deposits. (4) Calculated as loans held for investment / total deposits and customer repurchase agreements. Deposits 8 Total loans of $2,076 million Large portion of commercial loans at 46% (1) Loan yield of 4.49% Total deposits of $2,369 million Strong retail franchise Attractive deposit base with granular consumer deposits and demand deposits at 24% Low cost of deposits at 0.26% Complementary balance sheet with loan to deposit ratio of 87% compared to FNB at 92% (4) (1) (2) (3) (3) (3) Noninterest Bearing 24% Interest Checking & Money Market 42% Savings 21% Municipal Time 7% Time 6% Commercial 46% Commercial Real Estate 30% Commercial Construction and Land Development 7% Residential 6% Consumer 11% Loans |
 FNB Acquisitions Position the Company for Long-term Sustainable Organic Growth 9 2005 Total Assets: $5.6 bn Pro Forma 2015 Total Assets: $19.6 bn 12 Acquisitions since 2005 $11.7 billion in total assets $5.6 $6.0 $6.1 $8.4 $8.7 $9.0 $9.8 $12.0 $13.6 $16.1 $19.6 2005Y 2006Y 2007Y 2008Y 2009Y 2010Y 2011Y 2012Y 2013Y 2014Y 2015Y NSD Bancorp Assets: $0.5 bn Legacy Bank Assets: $0.4 bn Iron & Glass Bancorp Assets: $0.3 bn CB &T Assets: $0.6 bn Annapolis Bancorp Assets: $0.4 bn Parkvale Assets: $1.8 bn BCSB Assets: $0.6 bn OBA Assets: $0.4 bn North East Assets: $0.1 bn Omega Assets: $1.8 bn Parkview Assets: $0.8 bn Metro Bancorp, Inc. Assets: $3.0 bn Acquisition History – Total Assets (in $ billions) Source: SNL Financial, Company data. |
 Transaction Overview Consideration $32.72 per Metro Bancorp, Inc. share (1) Fixed 2.373x exchange ratio 100% stock Deal Value Approximately $474 million (1) Gross Credit Mark 4.9% (credit diligence covered over 80% of commercial portfolio) Detailed Due Diligence Completed Required Approvals Customary regulatory F.N.B. Corp. and Metro Bancorp, Inc. shareholders Expected Closing Q1 2016 Key Assumptions Cost savings estimated at 40% of Metro’s non-interest expense base One-time transaction expenses of approximately $49.5 million pre-tax Full impact of Durbin on Metro’s earnings modeled 2.00% core deposit intangible amortized over 10 years Board Seats FNB will appoint one of Metro’s current directors to FNB’s Board of Directors (1) Based on FNB’s closing stock price as of August 3, 2015. 10 |
   Comprehensive Due Diligence 11 FNB / METR (1) BBT / SUSQ (2) Nationwide Transactions (3) (1) Data as of 6/30/2015. (2) In-market Central Pennsylvania transaction. (3) Median values for deals since 2013 with target assets between $2 and $20 billion with stated credit marks. Reviewed over 80% of commercial loans Gross Credit Mark % of Loans 4.9% 4.5% 3.0% Multiple of: NPAs 1.9x 3.8x 1.5x LLR 3.9x 4.4x 2.0x |
 Financial and Capital Impact (1) Excluding one-time costs. (2) FNB and METR capital ratios as of 6/30/2015. (3) FNB / METR pro forma capital ratios at close. (4) Well-capitalized requirements in accordance with Basel III standards for the period ended June 30, 2015. 12 Financial Impact Holdco Capital Impact TCE / TA 6.93% 8.86% 6.74% - Tier 1 Common 9.61 11.82 9.02 6.50% Tier 1 Capital 10.61 11.86 9.81 8.00 Total Capital 12.20 13.02 11.40 10.00 FNB (2) METR (2) FNB / METR (3) Accretive to GAAP EPS by ~4% ($0.04) and cash EPS by ~6% ($0.06) in first full year (1) ~3% dilution to tangible book value ($0.18 per share) with earnback of just under 5 years using the crossover method Additionally, less than a 5 month earnback on a pro forma earnings basis Greater than 20% internal rate of return Well-Capitalized Requirements (4) |
   Transaction Pricing FNB / METR Transaction (1) Mid-Atlantic Comparable Transactions (2) Source: SNL Financial, public filings. (1) Based on FNB’s closing stock price as of August 3, 2015. Data as of 6/30/2015. (2) Median for Mid-Atlantic deals since 2013 with target assets between $750mm and $20bn and NPAs < 3%, excluding mergers of equals. (3) Adjusted for announced fully phased in after-tax cost saves. 13 Price / TBV 1.72x 1.89x Core Deposit Premium 8.7% 9.6% Price / LTM EPS 22.7x 18.8x Price / LTM EPS Including Cost Savings (3) 10.5x 12.0x |
 14 Appendix |
 Metro Bancorp, Inc. Financial Highlights 15 Source: SNL Financial. (1) Core deposits exclude Jumbo CDs. (2) Per SNL Financial definition. Excludes realized gain on securities and nonrecurring items. ($ in millions) Year Ended December 31, 6 Months Ended 2009 2010 2011 2012 2013 2014 6/30/15 Balance Sheet Assets $2,148 $2,234 $2,421 $2,635 $2,781 $2,998 $3,001 Securities 528 688 828 961 891 868 783 Loans 1,456 1,398 1,446 1,544 1,757 2,004 2,076 Deposits 1,815 1,832 2,072 2,231 2,240 2,381 2,369 Core Deposits (1) 1,702 1,699 1,966 2,127 2,134 2,238 2,215 Tangible Common Equity 199 204 219 234 229 265 266 Loans / Deposits 80% 75% 69% 69% 78% 84% 87% Profitability Net Income ($1.9) ($4.3) $0.3 $10.9 $17.3 $21.1 $9.9 Avg. Diluted Shares (mm) 8.2 13.6 13.9 14.1 14.3 14.4 14.4 EPS ($0.24) ($0.33) $0.02 $0.77 $1.20 $1.46 $0.68 Core EPS (2) 0.10 (0.41) 0.21 0.82 1.17 1.46 0.80 ROAA (0.09%) (0.20%) 0.01% 0.44% 0.64% 0.73% 0.66% ROAE (1.3) (2.1) 0.1 4.8 7.4 8.5 7.4 Net Interest Margin 3.96 4.04 3.86 3.87 3.63 3.61 3.68 Efficiency Ratio 85 87 77 74 73 69 72 Noninterest Inc / Avg. Assets 1.20 1.26 1.29 1.20 1.09 1.03 1.07 TBV / Share $14.80 $14.86 $15.51 $16.59 $16.19 $18.60 $18.99 Asset Quality NPAs / Assets 2.1% 2.6% 2.2% 2.1% 2.0% 1.8% 1.7% Reserves / Loans 1.0 1.6 1.5 1.7 1.3 1.3 1.3 Reserves / NPLs 38 41 46 49 44 55 56 NCOs / Avg Loans 1.00 0.97 1.42 0.43 0.55 0.26 0.32 Capital TCE / TA 9.3% 9.1% 9.0% 8.9% 8.2% 8.8% 8.9% Leverage Ratio 11.3 10.7 10.0 9.6 9.4 9.0 9.2 Tier 1 Ratio 13.9 14.6 14.1 14.0 13.4 12.3 11.9 Total Capital Ratio 14.7 15.8 15.4 15.2 14.6 13.4 13.0 |