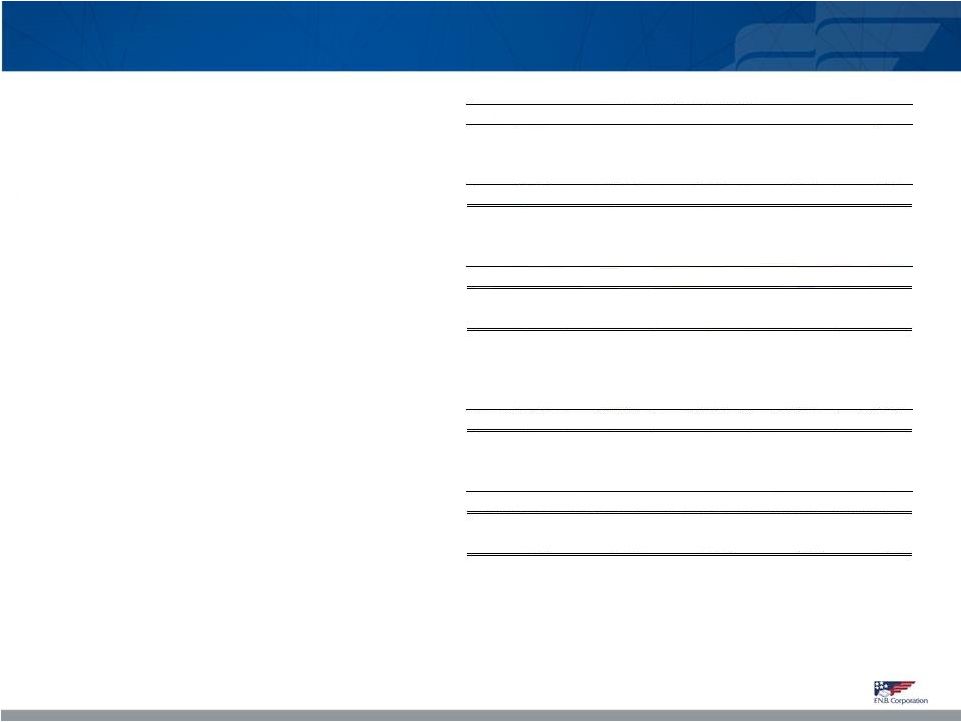
(1) Excludes loan servicing rights. (2) A non-GAAP measure, refer to page 13 in Appendix for more information. $ in thousands 30-Sep-17 30-Jun-17 31-Mar-17 31-Dec-16 30-Sep-16 Return on average tangible common equity (ROATCE) Net income available to common stockholders (annualized) 300,266 $ 290,381 $ 85,042 $ 196,049 $ 199,543 $ Amortization of intangibles, net of tax (annualized) 12,392 12,547 8,166 4,143 9,234 Tangible net income available to common stockholders (annualized) 312,658 $ 302,928 $ 93,208 $ 200,192 $ 208,777 $ Average total stockholders' equity 4,426,980 $ 4,386,438 $ 3,007,853 $ 2,573,768 $ 2,562,693 $ Less: Average preferred stockholders' equity 106,882 106,882 106,882 106,882 106,882 Less: Average intangible assets(1) 2,344,077 2,348,767 1,381,712 1,089,216 1,093,378 Average tangible common equity 1,976,022 $ 1,930,789 $ 1,519,259 $ 1,377,670 $ 1,362,433 $ Return on average tangible common equity (non-GAAP) 15.82% 15.69% 6.14% 14.53% 15.32% Operating ROATCE Operating net income avail. to common stockholders (annualized)(2) 303,825 $ 294,129 $ 220,695 $ 201,253 $ 200,314 $ Amortization of intangibles, net of tax (annualized) 12,392 12,547 8,166 4,143 9,234 Tangible operating net income avail. to common stockholders (annualized) 316,218 $ 306,676 $ 228,861 $ 205,396 $ 209,548 $ Average total stockholders' equity 4,426,980 $ 4,386,438 $ 3,007,853 $ 2,573,768 $ 2,562,693 $ Less: Average preferred stockholders' equity 106,882 106,882 106,882 106,882 106,882 Less: Average intangible assets(1) 2,344,077 2,348,767 1,381,712 1,089,216 1,093,378 Average tangible common equity 1,976,022 $ 1,930,789 $ 1,519,259 $ 1,377,670 $ 1,362,433 $ Operating return on average tangible common equity (non-GAAP) 16.00% 15.88% 15.06% 14.91% 15.38% For The Quarter Ended 14 Non-GAAP to GAAP Reconciliation |