UNITED STATES
SECURITIES AND EXCHANGE COMMISSION
WASHINGTON, D.C. 20549
FORM N-CSR
CERTIFIED SHAREHOLDER REPORT OF REGISTERED
MANAGEMENT INVESTMENT COMPANIES
Investment Company Act file number: 811-02383
AB BOND FUND, INC.
(Exact name of registrant as specified in charter)
1345 Avenue of the Americas, New York, New York 10105
(Address of principal executive offices) (Zip code)
Joseph J. Mantineo
AllianceBernstein L.P.
1345 Avenue of the Americas
New York, New York 10105
(Name and address of agent for service)
Registrant’s telephone number, including area code: (800) 221-5672
Date of fiscal year end: October 31, 2016
Date of reporting period: October 31, 2016
| ITEM 1. | REPORTS TO STOCKHOLDERS. |
OCT 10.31.16

ANNUAL REPORT
AB ALL MARKET REAL RETURN PORTFOLIO
Investment Products Offered
•Are Not FDIC Insured •May Lose Value •Are Not Bank Guaranteed |
Investors should consider the investment objectives, risks, charges and expenses of the Fund carefully before investing. For copies of our prospectus or summary prospectus, which contain this and other information, visit us online at www.abfunds.com or contact your AB representative. Please read the prospectus and/or summary prospectus carefully before investing.
This shareholder report must be preceded or accompanied by the Fund’s prospectus for individuals who are not current shareholders of the Fund.
You may obtain a description of the Fund’s proxy voting policies and procedures, and information regarding how the Fund voted proxies relating to portfolio securities during the most recent 12-month period ended June 30, without charge. Simply visit AB’s website at www.abfunds.com, or go to the Securities and Exchange Commission’s (the “Commission”) website at www.sec.gov, or call AB at (800) 227-4618.
The Fund files its complete schedule of portfolio holdings with the Commission for the first and third quarters of each fiscal year on Form N-Q. The Fund’s Forms N-Q are available on the Commission’s website at www.sec.gov. The Fund’s Forms N-Q may also be reviewed and copied at the Commission’s Public Reference Room in Washington, DC; information on the operation of the Public Reference Room may be obtained by calling (800) SEC-0330. AB publishes full portfolio holdings for the Fund monthly at www.abfunds.com.
AllianceBernstein Investments, Inc. (ABI) is the distributor of the AB family of mutual funds. ABI is a member of FINRA and is an affiliate of AllianceBernstein L.P., the Adviser of the funds.
The [A/B] logo is a registered service mark of AllianceBernstein and AllianceBernstein® is a registered service mark used by permission of the owner, AllianceBernstein L.P.
December 14, 2016
Annual Report
This report provides management’s discussion of fund performance for AB All Market Real Return Portfolio (the “Fund”) for the annual reporting period ended October 31, 2016.
Investment Objective and Policies
The Fund’s investment objective is to maximize real return. Real return is the rate of return after adjusting for inflation. The Fund pursues an aggressive investment strategy involving a variety of asset classes. The Fund invests primarily in instruments that AllianceBernstein L.P. (“the Adviser”) expects to outperform broad equity indices during periods of rising inflation. Under normal circumstances, the Fund expects to invest its assets principally in the following instruments that, in the judgment of the Adviser, are affected directly or indirectly by the level and change in rate of inflation: inflation-indexed fixed-income securities, such as Treasury inflation-protected securities (“TIPS”) and similar bonds issued by governments outside of the United States; commodities; commodity-related equity securities; real estate equity securities; inflation-sensitive equity securities, which the Fund defines as equity securities of companies that the Adviser believes have the ability to pass along increasing costs to consumers and maintain or grow margins in rising inflation environments, including equity securities of utilities and infrastructure-related companies (“inflation-sensitive equities”); securities and derivatives linked to the price of other assets (such as commodities, stock indices and real estate); and currencies. The
Fund expects its investments in fixed-income securities to have a broad range of maturities and quality levels.
The Fund will seek inflation protection from investments around the globe, both in developed- and emerging-market countries. In selecting securities for purchase and sale, the Adviser will utilize its qualitative and quantitative resources to determine overall inflation sensitivity, asset allocation and security selection. The Adviser assesses the securities’ risks and inflation sensitivity as well as the securities’ impact on the overall risks and inflation sensitivity of the Fund. When its analysis indicates that changes are necessary, the Adviser intends to implement them through a combination of changes to underlying positions and the use of inflation swaps and other types of derivatives, such as interest rate swaps.
The Fund anticipates that its targeted investment mix, other than its investments in inflation-indexed fixed-income securities, will focus on commodity-related equity securities, commodities and commodity derivatives, real estate equity securities and inflation-sensitive equities to provide a balance between expected return and inflation protection. The Fund may vary its investment allocations among these asset classes, at times significantly. Its commodities investments will include significant exposure to energy commodities, but will also include agricultural products, and industrial and precious metals, such as gold. The Fund’s investments in real estate equity securities will include real estate investment trusts (“REITs”) and other real estate-related securities.
| AB ALL MARKET REAL RETURN PORTFOLIO • | 1 |
The Fund will invest in both US and non-US dollar-denominated equity or fixed-income securities. The Fund may invest in currencies for hedging or for investment purposes, both in the spot market and through long or short positions in currency-related derivatives. The Fund does not ordinarily expect to hedge its foreign currency exposure because it will be balanced by investments in US dollar-denominated securities, although it may hedge the exposure under certain circumstances. The Fund may invest significantly to the extent permitted by applicable law in derivatives, such as options, futures contracts, forwards, swaps or structured notes. The Fund intends to use leverage for investment purposes through the use of cash made available by derivatives transactions to make other investments in accordance with its investment policies. In determining when and to what extent to employ leverage or enter into derivatives transactions, the Adviser will consider factors such as the relative risks and returns expected of potential investments and the cost of such transactions. The Adviser will consider the impact of derivatives in making its assessments of the Fund’s risks. The resulting exposures to markets, sectors, issuers or specific securities will be continuously monitored by the Adviser.
The Fund may seek to gain exposure to physical commodities traded in the commodities markets through investments in a variety of derivative instruments, including investments in commodity index-linked notes. The Adviser expects that the Fund will seek to gain exposure to commodities and commodity-related instruments
and derivatives primarily through investments in AllianceBernstein Cayman Inflation Strategy, Ltd., a wholly-owned subsidiary of the Fund organized under the laws of the Cayman Islands (the “Subsidiary”). The Subsidiary is advised by the Adviser and has the same investment objective and substantially similar investment policies and restrictions as the Fund except that the Subsidiary, unlike the Fund, may invest, without limitation, in commodities and commodity-related instruments. The Fund will be subject to the risks associated with the commodities, derivatives and other instruments in which the Subsidiary invests, to the extent of its investment in the Subsidiary. The Fund limits its investment in the Subsidiary to no more than 25% of its net assets. Investment in the Subsidiary is expected to provide the Fund with commodity exposure within the limitations of federal tax requirements that apply to the Fund.
The Fund is “non-diversified”, which means that it may concentrate its assets in a smaller number of issuers than a diversified fund.
Investment Results
The table on page 7 shows the Fund’s performance compared to its benchmark, the Morgan Stanley Capital International All Country (“MSCI AC”) World Commodity Producers Index (net), for the six- and 12-month periods ended October 31, 2016.
All share classes of the Fund underperformed the benchmark for both periods, before sales charges. The underperformance during both
| 2 | • AB ALL MARKET REAL RETURN PORTFOLIO |
periods was driven by a strategic exposure to commodity futures, which strongly underperformed relative to the benchmark. The Fund’s strategic allocation to global real estate also detracted from performance over both periods. Allocations to precious metals, security selection and currency management helped returns, whereas overlay positions such as inflation (“CPI”) swaps detracted, and long-dated oil futures detracted over both periods as well.
The Fund utilized derivatives for hedging and investment purposes, including currency forwards and total return swaps, which added to absolute returns during both periods, while purchased options and treasury futures detracted during both periods. Inflation swaps and written options added during the six-month period and detracted during the 12-month period.
Market Review and Investment Strategy
The beginning of the 12-month period ended October 31, 2016, was relatively calm as the markets recovered from concerns surrounding emerging-market growth levels, central bank policies and oil price fluctuations. However, risk assets sold off sharply once again in early 2016, along with commodities such as oil and metals, before bottoming out in February 2016. Commodities were especially damaged by the strengthening US dollar, as markets priced in monetary policy divergence between the US and the rest of the world. Central banks responded as the Bank of Japan enacted negative interest rates and the US Federal
Reserve (the “Fed”) delayed future rate hikes. As a result, markets rebounded very quickly with commodities, TIPS and real estate all moving in parallel with large rallies.
Volatility levels decreased in the spring of 2016 before spiking again in June when the UK decided to leave the European Union in its “Brexit” referendum. However, following the vote, risk levels quickly dropped, and the markets sharply recovered once more. Over the third quarter of 2016, markets were primarily focused on monetary policy. Trading in September was frequently influenced by investors’ anticipation of signals from the Fed about a potential rise in interest rates, which was ultimately delayed. Meanwhile, the Bank of Japan announced new measures to help spur inflation, pledging to keep the interest rate for 10-year government bonds at about zero. In Europe, where economic growth and inflation remained subdued, the European Central Bank appeared likely to maintain its accommodative monetary policy and asset purchase program through 2017.
On November 8, 2016, Donald Trump was elected as the 45th president of the United States, and the Congressional election outcome resulted in the Republican Party maintaining control of both the House of Representatives and the Senate. The Adviser believes that it will take time before the world has a clearer picture of the short- and long-term impact of the elections on the US economy and markets in general. The Adviser continues to monitor the markets, including for potential market volatility.
| AB ALL MARKET REAL RETURN PORTFOLIO • | 3 |
DISCLOSURES AND RISKS
Benchmark Disclosure
The MSCI AC World Commodity Producers Index (net) is unmanaged and does not reflect fees and expenses associated with the active management of a mutual fund portfolio. The MSCI AC World Commodity Producers Index is a free float-adjusted, market capitalization index designed to track the performance of global listed commodity producers, including emerging markets. Net returns include the reinvestment of dividends after deduction of non-US withholding tax. Commodities sectors include: energy, grains, industrial metals, petroleum, precious metals and softs. MSCI makes no express or implied warranties or representations, and shall have no liability whatsoever with respect to any MSCI data contained herein. The MSCI data may not be further redistributed or used as a basis for other indices, any securities or financial products. This report is not approved, reviewed or produced by MSCI. An investor cannot invest directly in an index, and its results are not indicative of the performance for any specific investment, including the Fund.
A Word About Risk
Market Risk: The value of the Fund’s assets will fluctuate as the stock, commodity and bond markets fluctuate. The value of the Fund’s investments may decline, sometimes rapidly and unpredictably, simply because of economic changes or other events that affect large portions of the market.
Credit Risk: An issuer or guarantor of a fixed-income security, or the counterparty to a derivatives or other contract, may be unable or unwilling to make timely payments of interest or principal, or to otherwise honor its obligations. The issuer or guarantor may default, causing a loss of the full principal amount of a security. The degree of risk for a particular security may be reflected in its credit rating. There is the possibility that the credit rating of a fixed-income security may be downgraded after purchase, which may adversely affect the value of the security. Investments in fixed-income securities with lower ratings tend to have a higher probability that an issuer will default or fail to meet its payment obligations.
Interest Rate Risk: Changes in interest rates will affect the value of investments in fixed-income securities. When interest rates rise, the value of investments in fixed-income securities tends to fall and this decrease in value may not be offset by higher income from new investments. The Fund may be subject to a heightened risk of rising interest rates as the current period of historically low rates is beginning to end and rates have begun rising. Interest rate risk is generally greater for fixed-income securities with longer maturities or durations.
Commodity Risk: Investing in commodities and commodity-linked derivative instruments, either directly or through the Subsidiary, may subject the Fund to greater volatility than investments in traditional securities.
(Disclosures, Risks and Note about Historical Performance continued on next page)
| 4 | • AB ALL MARKET REAL RETURN PORTFOLIO |
Disclosures and Risks
DISCLOSURES AND RISKS
(continued from previous page)
The value of commodity-linked derivative instruments may be affected by changes in overall market movements, commodity index volatility, changes in interest rates, or factors affecting a particular industry or commodity, such as drought, floods, weather, livestock disease, embargoes, tariffs and international economic, political and regulatory developments.
Derivatives Risk: Derivatives may be illiquid, difficult to price, and leveraged so that small changes may produce disproportionate losses for the Fund, and may be subject to counterparty risk to a greater degree than more traditional investments.
Leverage Risk: To the extent the Fund uses leveraging techniques, its net asset value (“NAV”) may be more volatile because leverage tends to exaggerate the effect of changes in interest rates and any increase or decrease in the value of the Fund’s investments.
Liquidity Risk: Liquidity risk occurs when certain investments become difficult to purchase or sell. Difficulty in selling less liquid securities may result in sales at disadvantageous prices affecting the value of your investment in the Fund. Causes of liquidity risk may include low trading volumes and large positions. Foreign fixed-income securities may have more liquidity risk because secondary trading markets for these securities may be smaller and less well-developed and the securities may trade less frequently. Liquidity risk may be higher in a rising interest rate environment, when the value and liquidity of fixed-income securities generally go down.
Foreign (Non-US) Risk: Investments in securities of non-US issuers may involve more risk than those of US issuers. These securities may fluctuate more widely in price and may be less liquid due to adverse market, economic, political, regulatory or other factors.
Currency Risk: Fluctuations in currency exchange rates may negatively affect the value of the Fund’s investments or reduce its returns.
Subsidiary Risk: By investing in the Subsidiary, the Fund is indirectly exposed to the risks associated with the Subsidiary’s investments. The derivatives and other investments held by the Subsidiary are generally similar to those that are permitted to be held by the Fund and are subject to the same risks that apply to similar investments if held directly by the Fund. The Subsidiary is not registered under the Investment Company Act of 1940, as amended (the “1940 Act”), and, unless otherwise noted in the Fund’s prospectus, is not subject to all of the investor protections of the 1940 Act. However, the Fund wholly owns and controls the Subsidiary, and the Fund and the Subsidiary are managed by the Adviser, making it unlikely the Subsidiary will take actions contrary to the interests of the Fund or its shareholders.
Real Estate Risk: The Fund’s investments in real estate securities have many of the same risks as direct ownership of real estate, including the
(Disclosures, Risks and Note about Historical Performance continued on next page)
| AB ALL MARKET REAL RETURN PORTFOLIO • | 5 |
Disclosures and Risks
DISCLOSURES AND RISKS
(continued from previous page)
risk that the value of real estate could decline due to a variety of factors that affect the real estate market generally. Investments in REITs may have additional risks. REITs are dependent on the capability of their managers, may have limited diversification, and could be significantly affected by changes in taxes.
Diversification Risk: The Fund may have more risk because it is “non-diversified”, meaning that it can invest more of its assets in a smaller number of issuers and that adverse changes in the value of one security could have a more significant effect on the Fund’s NAV.
Management Risk: The Fund is subject to management risk because it is an actively managed investment fund. The Adviser will apply its investment techniques and risk analyses in making investment decisions, but there is no guarantee that its techniques will produce the intended results.
These risks are fully discussed in the Fund’s prospectus. As with all investments, you may lose money by investing in the Fund.
An Important Note About Historical Performance
The investment return and principal value of an investment in the Fund will fluctuate, so that shares, when redeemed, may be worth more or less than their original cost. Performance shown on the following pages represents past performance and does not guarantee future results. Current performance may be lower or higher than the performance information shown. You may obtain performance information current to the most recent month-end by visiting www.abfunds.com.
Investors should consider the investment objectives, risks, charges and expenses of the Fund carefully before investing. For copies of our prospectus or summary prospectus, which contain this and other information, visit us online at www.abfunds.com. For Class 1 shares, click on “Private Clients”, then “Investments”, then “Stocks” or “Bonds”, then “Prospectuses, SAIs, and Shareholder Reports”. Please read the prospectus and/or summary prospectus carefully before investing.
All fees and expenses related to the operation of the Fund have been deducted. NAV returns do not reflect sales charges; if sales charges were reflected, the Fund’s quoted performance would be lower. SEC returns reflect the applicable sales charges for each share class: a 4.25% maximum front-end sales charge for Class A shares; a 1% 1-year contingent deferred sales charge for Class C shares. Returns for the different share classes will vary due to different expenses associated with each class. Performance assumes reinvestment of distributions and does not account for taxes.
| 6 | • AB ALL MARKET REAL RETURN PORTFOLIO |
Disclosures and Risks
HISTORICAL PERFORMANCE
THE FUND VS. ITS BENCHMARK PERIODS ENDED OCTOBER 31, 2016 (unaudited) | NAV Returns | |||||||||||
| 6 Months | 12 Months | |||||||||||
| AB All Market Real Return Portfolio | ||||||||||||
Class 1*† | 1.38% | 2.95% | ||||||||||
| ||||||||||||
Class 2† | 1.59% | 3.17% | ||||||||||
| ||||||||||||
Class A | 1.35% | 2.75% | ||||||||||
| ||||||||||||
Class C* | 0.86% | 1.95% | ||||||||||
| ||||||||||||
Advisor Class‡ | 1.48% | 3.00% | ||||||||||
| ||||||||||||
Class R*‡ | 1.24% | 2.54% | ||||||||||
| ||||||||||||
Class K‡ | 1.37% | 2.81% | ||||||||||
| ||||||||||||
Class I*‡ | 1.49% | 3.16% | ||||||||||
| ||||||||||||
Class Z‡ | 1.49% | 3.09% | ||||||||||
| ||||||||||||
| MSCI AC World Commodity Producers Index (net) | 2.31% | 10.31% | ||||||||||
| ||||||||||||
* The returns shown are based on net asset values calculated for shareholder transactions and may differ from the returns shown in the Financial Highlights, which reflect adjustments made to the net asset values in accordance with accounting principles generally accepted in the United States of America.
† Class 1 shares are only available to Bernstein Global Wealth Management private client accounts. Class 2 shares are only available to the Adviser’s institutional clients or through other limited arrangements.
‡ Please note that these share classes are for investors purchasing shares through accounts established under certain fee-based programs sponsored and maintained by certain broker-dealers and financial intermediaries, institutional pension plans and/or investment advisory clients of, and certain other persons associated with, the Adviser and its affiliates or the Fund. |
| |||||||||||
See Disclosures, Risks and Note about Historical Performance on pages 4-6.
(Historical Performance continued on next page)
| AB ALL MARKET REAL RETURN PORTFOLIO • | 7 |
Historical Performance
HISTORICAL PERFORMANCE
(continued from previous page)
GROWTH OF A $10,000 INVESTMENT IN THE FUND
3/8/10* TO 10/31/16 (unaudited)
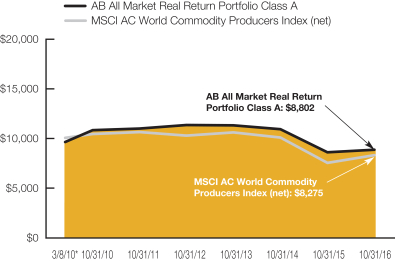
This chart illustrates the total value of an assumed $10,000 investment in AB All Market Real Return Portfolio Class A shares (from 3/8/10* to 10/31/16) as compared to the performance of its benchmark. The chart reflects the deduction of the maximum 4.25% sales charge from the initial $10,000 investment in the Fund and assumes the reinvestment of dividends and capital gains distributions.
| * | Inception date: 3/8/2010. |
See Disclosures, Risks and Note about Historical Performance on pages 4-6.
(Historical Performance continued on next page)
| 8 | • AB ALL MARKET REAL RETURN PORTFOLIO |
Historical Performance
HISTORICAL PERFORMANCE
(continued from previous page)
| AVERAGE ANNUAL RETURNS AS OF OCTOBER 31, 2016 (unaudited) | ||||||||
| NAV Returns | SEC Returns (reflects applicable sales charges) | |||||||
| Class 1 Shares* | ||||||||
1 Year | 2.95 | % | 2.95 | % | ||||
5 Years | -4.11 | % | -4.11 | % | ||||
Since Inception† | -1.19 | % | -1.19 | % | ||||
| Class 2 Shares* | ||||||||
1 Year | 3.17 | % | 3.17 | % | ||||
5 Years | -3.87 | % | -3.87 | % | ||||
Since Inception† | -0.94 | % | -0.94 | % | ||||
| Class A Shares | ||||||||
1 Year | 2.75 | % | -1.60 | % | ||||
5 Years | -4.22 | % | -5.04 | % | ||||
Since Inception† | -1.26 | % | -1.90 | % | ||||
| Class C Shares | ||||||||
1 Year | 1.95 | % | 0.95 | % | ||||
5 Years | -4.91 | % | -4.91 | % | ||||
Since Inception† | -1.99 | % | -1.99 | % | ||||
| Advisor Class Shares‡ | ||||||||
1 Year | 3.00 | % | 3.00 | % | ||||
5 Years | -3.93 | % | -3.93 | % | ||||
Since Inception† | -1.00 | % | -1.00 | % | ||||
| Class R Shares‡ | ||||||||
1 Year | 2.54 | % | 2.54 | % | ||||
5 Years | -4.42 | % | -4.42 | % | ||||
Since Inception† | -1.49 | % | -1.49 | % | ||||
| Class K Shares‡ | ||||||||
1 Year | 2.81 | % | 2.81 | % | ||||
5 Years | -4.17 | % | -4.17 | % | ||||
Since Inception† | -1.23 | % | -1.23 | % | ||||
| Class I Shares‡ | ||||||||
1 Year | 3.16 | % | 3.16 | % | ||||
5 Years | -3.90 | % | -3.90 | % | ||||
Since Inception† | -0.96 | % | -0.96 | % | ||||
| Class Z Shares‡ | ||||||||
1 Year | 3.09 | % | 3.09 | % | ||||
Since Inception† | -7.11 | % | -7.11 | % | ||||
See Disclosures, Risks and Note about Historical Performance on pages 4-6.
(Historical Performance and footnotes continued on next page)
| AB ALL MARKET REAL RETURN PORTFOLIO • | 9 |
Historical Performance
HISTORICAL PERFORMANCE
(continued from previous page)
The Fund’s prospectus fee table shows the Fund’s total annual operating expense ratios as 1.16%, 0.92%, 1.42%, 2.16%, 1.17%, 1.64%, 1.34%, 0.96% and 0.96% for Class 1, Class 2, Class A, Class C, Advisor Class, Class R, Class K, Class I and Class Z shares, respectively, gross of any fee waivers or expense reimbursements. Contractual fee waivers and/or expense reimbursements limit the Fund’s annual operating expense ratios to 1.30%, 1.05%, 1.30%, 2.05%, 1.05%, 1.55%, 1.30%, 1.05% and 1.05% for Class 1, Class 2, Class A, Class C, Advisor Class, Class R, Class K, Class I and Class Z shares, respectively. These waivers/reimbursements may not be terminated before January 29, 2017 and may be extended by the Adviser for additional one-year terms. Absent reimbursements or waivers, performance would have been lower, with the exception of Class 1, Class 2, Class I and Class Z shares, as these share classes are currently operating below their respective contractual expense caps. The Financial Highlights section of this report sets forth expense ratio data for the current reporting period; the expense ratios shown above may differ from the expense ratios in the Financial Highlights sections since they are based on different time periods.
| * | Class 1 shares are only available to Bernstein Global Wealth Management private client accounts. Class 2 shares are only available to the Adviser’s institutional clients or through other limited arrangements. |
| † | Inception dates: 3/8/2010 for all share classes excluding Class Z shares; 1/31/2014 for Class Z shares. |
| ‡ | These share classes are offered at NAV to eligible investors and their SEC returns are the same as their NAV returns. Please note that these share classes are for investors purchasing shares through accounts established under certain fee-based programs sponsored and maintained by certain broker-dealers and financial intermediaries, institutional pension plans and/or investment advisory clients of, and certain other persons associated with, the Adviser and its affiliates or the Fund. |
See Disclosures, Risks and Note about Historical Performance on pages 4-6.
(Historical Performance continued on next page)
| 10 | • AB ALL MARKET REAL RETURN PORTFOLIO |
Historical Performance
HISTORICAL PERFORMANCE
(continued from previous page)
SEC AVERAGE ANNUAL RETURNS AS OF THE MOST RECENT CALENDAR QUARTER-END SEPTEMBER 30, 2016 (unaudited) | ||||
| SEC Returns (reflects applicable sales charges) | ||||
| Class 1 Shares* | ||||
1 Year | 10.50 | % | ||
5 Years | -1.78 | % | ||
Since Inception† | -0.95 | % | ||
| Class 2 Shares* | ||||
1 Year | 10.71 | % | ||
5 Years | -1.53 | % | ||
Since Inception† | -0.70 | % | ||
| Class A Shares | ||||
1 Year | 5.79 | % | ||
5 Years | -2.70 | % | ||
Since Inception† | -1.65 | % | ||
| Class C Shares | ||||
1 Year | 8.54 | % | ||
5 Years | -2.55 | % | ||
Since Inception† | -1.72 | % | ||
| Advisor Class Shares‡ | ||||
1 Year | 10.74 | % | ||
5 Years | -1.59 | % | ||
Since Inception† | -0.74 | % | ||
| Class R Shares‡ | ||||
1 Year | 10.18 | % | ||
5 Years | -2.07 | % | ||
Since Inception† | -1.23 | % | ||
| Class K Shares‡ | ||||
1 Year | 10.45 | % | ||
5 Years | -1.80 | % | ||
Since Inception† | -0.97 | % | ||
| Class I Shares‡ | ||||
1 Year | 10.80 | % | ||
5 Years | -1.53 | % | ||
Since Inception† | -0.70 | % | ||
| Class Z Shares‡ | ||||
1 Year | 10.86 | % | ||
Since Inception† | -6.69 | % | ||
| * | Class 1 shares are only available to Bernstein Global Wealth Management private client accounts. Class 2 shares are only available to the Adviser’s institutional clients or through other limited arrangements. |
| † | Inception dates: 3/8/2010 for all share classes excluding Class Z shares; 1/31/2014 for Class Z shares. |
| ‡ | Please note that these share classes are for investors purchasing shares through accounts established under certain fee-based programs sponsored and maintained by certain broker-dealers and financial intermediaries, institutional pension plans and/or investment advisory clients of, and certain other persons associated with, the Adviser and its affiliates or the Fund. |
See Disclosures, Risks and Note about Historical Performance on pages 4-6.
| AB ALL MARKET REAL RETURN PORTFOLIO • | 11 |
Historical Performance
EXPENSE EXAMPLE
(unaudited)
As a shareholder of a mutual fund, you may incur two types of costs: (1) transaction costs, including sales charges (loads) on purchase payments, contingent deferred sales charges on redemptions and (2) ongoing costs, including management fees; distribution (12b-1) fees; and other fund expenses. This example is intended to help you understand your ongoing costs (in dollars) of investing in the Fund and to compare these costs with the ongoing costs of investing in other mutual funds.
The Example is based on an investment of $1,000 invested at the beginning of the period and held for the entire period as indicated below.
Actual Expenses
The table below provides information about actual account values and actual expenses. You may use the information in this line, together with the amount you invested, to estimate the expenses that you paid over the period. Simply divide your account value by $1,000 (for example, an $8,600 account value divided by $1,000 = 8.6), then multiply the result by the number in the first line under the heading entitled “Expenses Paid During Period” to estimate the expenses you paid on your account during this period.
Hypothetical Example for Comparison Purposes
The table below provides information about hypothetical account values and hypothetical expenses based on the Fund’s actual expense ratio and an assumed annual rate of return of 5% before expenses, which is not the Fund’s actual return. The hypothetical account values and expenses may not be used to estimate the actual ending account balance or expenses you paid for the period. You may use this information to compare the ongoing costs of investing in the Fund and other funds by comparing this 5% hypothetical example with the 5% hypothetical examples that appear in the shareholder reports of other funds.
Please note that the expenses shown in the table are meant to highlight your ongoing costs only and do not reflect any transactional costs, such as sales charges (loads), or contingent deferred sales charges on redemptions. Therefore, the hypothetical example is useful in comparing ongoing costs only, and will not help you determine the relative total costs of owning different funds. In addition, if these transactional costs were included, your costs would have been higher.
| 12 | • AB ALL MARKET REAL RETURN PORTFOLIO |
Expense Example
EXPENSE EXAMPLE
(unaudited)
(continued from previous page)
| Beginning Account Value May 1, 2016 | Ending Account Value October 31, 2016 | Expenses Paid During Period* | Annualized Expense Ratio* | Effective Expenses Paid During Period+ | Effective Annualized Expense Ratio+ | |||||||||||||||||||
| Class A | ||||||||||||||||||||||||
Actual | $ | 1,000 | $ | 1,013.50 | $ | 6.53 | 1.29 | % | $ | 6.73 | 1.33 | % | ||||||||||||
Hypothetical** | $ | 1,000 | $ | 1,018.65 | $ | 6.55 | 1.29 | % | $ | 6.75 | 1.33 | % | ||||||||||||
| Class C | ||||||||||||||||||||||||
Actual | $ | 1,000 | $ | 1,008.60 | $ | 10.30 | 2.04 | % | $ | 10.50 | 2.08 | % | ||||||||||||
Hypothetical** | $ | 1,000 | $ | 1,014.88 | $ | 10.33 | 2.04 | % | $ | 10.53 | 2.08 | % | ||||||||||||
| Advisor Class | ||||||||||||||||||||||||
Actual | $ | 1,000 | $ | 1,014.80 | $ | 5.27 | 1.04 | % | $ | 5.47 | 1.08 | % | ||||||||||||
Hypothetical** | $ | 1,000 | $ | 1,019.91 | $ | 5.28 | 1.04 | % | $ | 5.48 | 1.08 | % | ||||||||||||
| Class R | ||||||||||||||||||||||||
Actual | $ | 1,000 | $ | 1,012.40 | $ | 7.79 | 1.54 | % | $ | 7.99 | 1.58 | % | ||||||||||||
Hypothetical** | $ | 1,000 | $ | 1,017.39 | $ | 7.81 | 1.54 | % | $ | 8.01 | 1.58 | % | ||||||||||||
| Class K | ||||||||||||||||||||||||
Actual | $ | 1,000 | $ | 1,013.70 | $ | 6.53 | 1.29 | % | $ | 6.73 | 1.33 | % | ||||||||||||
Hypothetical** | $ | 1,000 | $ | 1,018.65 | $ | 6.55 | 1.29 | % | $ | 6.75 | 1.33 | % | ||||||||||||
| Class I | ||||||||||||||||||||||||
Actual | $ | 1,000 | $ | 1,014.90 | $ | 4.56 | 0.90 | % | $ | 4.76 | 0.94 | % | ||||||||||||
Hypothetical** | $ | 1,000 | $ | 1,020.61 | $ | 4.57 | 0.90 | % | $ | 4.77 | 0.94 | % | ||||||||||||
| Class 1 | ||||||||||||||||||||||||
Actual | $ | 1,000 | $ | 1,013.80 | $ | 5.77 | 1.14 | % | $ | 5.97 | 1.18 | % | ||||||||||||
Hypothetical** | $ | 1,000 | $ | 1,019.41 | $ | 5.79 | 1.14 | % | $ | 5.99 | 1.18 | % | ||||||||||||
| Class 2 | ||||||||||||||||||||||||
Actual | $ | 1,000 | $ | 1,015.90 | $ | 4.56 | 0.90 | % | $ | 4.76 | 0.94 | % | ||||||||||||
Hypothetical** | $ | 1,000 | $ | 1,020.61 | $ | 4.57 | 0.90 | % | $ | 4.77 | 0.94 | % | ||||||||||||
| Class Z | ||||||||||||||||||||||||
Actual | $ | 1,000 | $ | 1,014.90 | $ | 4.56 | 0.90 | % | $ | 4.76 | 0.94 | % | ||||||||||||
Hypothetical** | $ | 1,000 | $ | 1,020.61 | $ | 4.57 | 0.90 | % | $ | 4.77 | 0.94 | % | ||||||||||||
| * | Expenses are equal to the Portfolio’s annualized expense ratio, multiplied by the average account value over the period, multiplied by 184/366 (to reflect the one-half year period). |
| ** | Assumes 5% annual return before expenses. |
| + | The Portfolio’s investments in affiliated/unaffiliated underlying portfolios incur no direct expenses, but bear proportionate shares of the acquired fund fees (i.e., operating, administrative and investment advisory fee) of the affiliated/unaffiliated underlying portfolios. Currently the Adviser has voluntarily agreed to waive its investment advisory fee from the Portfolio in an amount equal to the Portfolio’s share of the advisory fees of the affiliated underlying portfolios, as borne indirectly by the Portfolio as an acquired fund fee and expense. The Portfolio’s effective expenses are equal to the classes’ annualized expense ratio plus the Portfolio’s pro-rata share of the weighted average expense ratio of the affiliated/unaffiliated underlying portfolios in which it invests, multiplied by the average account value over the period, multiplied by 184/366 (to reflect the one-half year period). |
| AB ALL MARKET REAL RETURN PORTFOLIO • | 13 |
Expense Example
PORTFOLIO SUMMARY
October 31, 2016 (unaudited)
PORTFOLIO STATISTICS
Net Assets ($mil): $573.3
| PORTFOLIO BREAKDOWN* | ||||||||
Commodity Related Derivatives | 48.6 | % | ||||||
Commodity Related Stocks | 29.1 | % | ||||||
Real Estate Stocks | 19.8 | % | ||||||
Other | 2.5 | % | ||||||
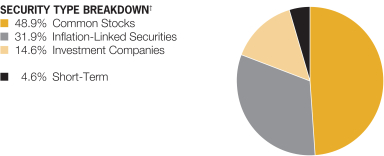
| * | All data are as of October 31, 2016. The portfolio breakdown is expressed as an approximate percentage of the Fund’s net assets inclusive of derivative exposure, based on the Advisor’s internal classification guidelines. |
| † | The Fund’s security type breakdown is expressed as a percentage of total investments and may vary over time. The Fund also enters into derivative transactions, which may be used for hedging or investment purposes (see “Portfolio of Investments” section of the report for additional details). |
| 14 | • AB ALL MARKET REAL RETURN PORTFOLIO |
Portfolio Summary
TEN LARGEST HOLDINGS*
October 31, 2016 (unaudited)
| Company | U.S. $ Value | Percent of Net Assets | ||||||
Japanese Government CPI Linked Bond Series 21 | $ | 50,072,309 | 8.7 | % | ||||
Vanguard REIT ETF | 28,476,436 | 5.0 | ||||||
Vanguard Global ex-U.S. Real Estate ETF | 22,866,391 | 4.0 | ||||||
Royal Dutch Shell PLC – Class A & Class B | 22,334,894 | 3.9 | ||||||
TOTAL SA | 14,739,715 | 2.6 | ||||||
Exxon Mobil Corp. | 13,797,292 | 2.4 | ||||||
VanEck Vectors Gold Miners ETF | 7,842,281 | 1.4 | ||||||
SPDR S&P Dividend ETF | 7,137,339 | 1.2 | ||||||
EOG Resources, Inc. | 6,356,164 | 1.1 | ||||||
iShares MSCI Global Metals & Mining Producers ETF | 6,229,918 | 1.1 | ||||||
| $ | 179,852,739 | 31.4 | % | |||||
| * | Long-term investments. |
| AB ALL MARKET REAL RETURN PORTFOLIO • | 15 |
Ten Largest Holdings
CONSOLIDATED PORTFOLIO OF INVESTMENTS
October 31, 2016
| Company | Shares | U.S. $ Value | ||||||||||
| ||||||||||||
COMMON STOCKS – 48.7% | ||||||||||||
Energy – 20.8% | ||||||||||||
Integrated Oil & Gas – 12.4% | ||||||||||||
BP PLC | 680,220 | $ | 4,021,259 | |||||||||
Chevron Corp. | 48,510 | 5,081,422 | ||||||||||
China Petroleum & Chemical Corp. – Class H | 2,732,000 | 1,975,784 | ||||||||||
Eni SpA | 94,200 | 1,367,055 | ||||||||||
Exxon Mobil Corp. | 165,594 | 13,797,292 | ||||||||||
Galp Energia SGPS SA | 111,630 | 1,513,510 | ||||||||||
LUKOIL PJSC (Sponsored ADR) | 57,450 | 2,792,645 | ||||||||||
Petroleo Brasileiro SA (Preference Shares)(a) | 116,000 | 642,870 | ||||||||||
Petroleo Brasileiro SA (Sponsored ADR)(a) | 93,160 | 1,030,350 | ||||||||||
Royal Dutch Shell PLC (Euronext Amsterdam) – Class A | 307,616 | 7,664,981 | ||||||||||
Royal Dutch Shell PLC – Class A | 164,357 | 4,093,646 | ||||||||||
Royal Dutch Shell PLC – Class B | 410,052 | 10,576,267 | ||||||||||
TOTAL SA | 307,687 | 14,739,715 | ||||||||||
YPF SA (Sponsored ADR) | 103,440 | 1,837,094 | ||||||||||
|
| |||||||||||
| 71,133,890 | ||||||||||||
|
| |||||||||||
Oil & Gas Drilling – 0.3% | ||||||||||||
Helmerich & Payne, Inc. | 24,480 | 1,544,933 | ||||||||||
|
| |||||||||||
Oil & Gas Equipment & Services – 0.8% | ||||||||||||
Aker Solutions ASA(a)(b) | 182,210 | 835,754 | ||||||||||
Halliburton Co. | 34,430 | 1,583,780 | ||||||||||
Petrofac Ltd. | 127,280 | 1,253,521 | ||||||||||
RPC, Inc.(a) | 39,140 | 675,948 | ||||||||||
|
| |||||||||||
| 4,349,003 | ||||||||||||
|
| |||||||||||
Oil & Gas Exploration & Production – 6.3% | ||||||||||||
Aker BP ASA(a) | 114,207 | 1,827,498 | ||||||||||
Anadarko Petroleum Corp. | 56,803 | 3,376,370 | ||||||||||
Canadian Natural Resources Ltd. | 114,977 | 3,649,125 | ||||||||||
CNOOC Ltd. | 2,189,000 | 2,754,362 | ||||||||||
Concho Resources, Inc.(a) | 14,340 | 1,820,320 | ||||||||||
Devon Energy Corp. | 64,150 | 2,430,644 | ||||||||||
EOG Resources, Inc. | 70,296 | 6,356,164 | ||||||||||
Gran Tierra Energy, Inc.(a) | 246,650 | 720,844 | ||||||||||
Hess Corp. | 109,789 | 5,266,578 | ||||||||||
Inpex Corp. | 132,700 | 1,237,927 | ||||||||||
Occidental Petroleum Corp. | 60,325 | 4,398,296 | ||||||||||
SM Energy Co. | 39,430 | 1,326,031 | ||||||||||
Southwestern Energy Co.(a) | 118,690 | 1,233,189 | ||||||||||
|
| |||||||||||
| 36,397,348 | ||||||||||||
|
| |||||||||||
Oil & Gas Refining & Marketing – 1.0% | ||||||||||||
Cosan SA Industria e Comercio | 61,000 | 820,213 | ||||||||||
HollyFrontier Corp. | 38,680 | 965,066 | ||||||||||
JX Holdings, Inc. | 576,300 | 2,277,054 | ||||||||||
Tupras Turkiye Petrol Rafinerileri AS | 79,640 | 1,624,172 | ||||||||||
|
| |||||||||||
| 5,686,505 | ||||||||||||
|
| |||||||||||
| 119,111,679 | ||||||||||||
|
| |||||||||||
| 16 | • AB ALL MARKET REAL RETURN PORTFOLIO |
Consolidated Portfolio of Investments
| Company | Shares | U.S. $ Value | ||||||||||
| ||||||||||||
Materials – 7.6% | ||||||||||||
Copper – 0.7% | ||||||||||||
Antofagasta PLC | 227,970 | $ | 1,516,243 | |||||||||
First Quantum Minerals Ltd. | 169,570 | 1,610,618 | ||||||||||
Lundin Mining Corp.(a) | 229,660 | 898,915 | ||||||||||
|
| |||||||||||
| 4,025,776 | ||||||||||||
|
| |||||||||||
Diversified Chemicals – 0.3% | ||||||||||||
Arkema SA | 18,262 | 1,731,646 | ||||||||||
|
| |||||||||||
Diversified Metals & Mining – 2.4% | ||||||||||||
Boliden AB | 85,240 | 1,975,560 | ||||||||||
Glencore PLC(a) | 1,596,186 | 4,886,094 | ||||||||||
Korea Zinc Co., Ltd. | 3,660 | 1,453,272 | ||||||||||
MMC Norilsk Nickel PJSC (ADR) | 157,780 | 2,386,451 | ||||||||||
Orocobre Ltd.(a) | 107,020 | 311,801 | ||||||||||
Rio Tinto PLC | 65,300 | 2,270,828 | ||||||||||
Syrah Resources Ltd.(a) | 170,230 | 465,428 | ||||||||||
|
| |||||||||||
| 13,749,434 | ||||||||||||
|
| |||||||||||
Fertilizers & Agricultural Chemicals – 1.5% | ||||||||||||
Agrium, Inc. (Toronto) | 6,834 | 627,354 | ||||||||||
Monsanto Co. | 37,243 | 3,752,977 | ||||||||||
Potash Corp. of Saskatchewan, Inc. | 44,576 | 724,821 | ||||||||||
Syngenta AG (REG) | 4,967 | 1,987,624 | ||||||||||
UPL Ltd. | 158,480 | 1,649,378 | ||||||||||
|
| |||||||||||
| 8,742,154 | ||||||||||||
|
| |||||||||||
Forest Products – 0.0% | ||||||||||||
West Fraser Timber Co., Ltd. | 4,011 | 137,318 | ||||||||||
|
| |||||||||||
Gold – 1.2% | ||||||||||||
Agnico Eagle Mines Ltd. | 26,367 | 1,339,089 | ||||||||||
Barrick Gold Corp. | 116,860 | 2,055,568 | ||||||||||
Detour Gold Corp.(a) | 43,320 | 825,835 | ||||||||||
Goldcorp, Inc. | 110,449 | 1,677,362 | ||||||||||
Randgold Resources Ltd. | 10,820 | 960,887 | ||||||||||
Real Gold Mining Ltd.(a)(c)(d) | 124,500 | – 0 | – | |||||||||
|
| |||||||||||
| 6,858,741 | ||||||||||||
|
| |||||||||||
Paper Products – 0.3% | ||||||||||||
Mondi PLC | 20,571 | 401,454 | ||||||||||
Oji Holdings Corp. | 42,000 | 177,584 | ||||||||||
Stora Enso Oyj – Class R | 29,866 | 282,237 | ||||||||||
UPM-Kymmene Oyj | 28,679 | 667,117 | ||||||||||
|
| |||||||||||
| 1,528,392 | ||||||||||||
|
| |||||||||||
Precious Metals & Minerals – 0.2% | ||||||||||||
Industrias Penoles SAB de CV | 30,530 | 738,577 | ||||||||||
|
| |||||||||||
Specialty Chemicals – 0.1% | ||||||||||||
Johnson Matthey PLC | 17,674 | 736,709 | ||||||||||
|
| |||||||||||
Steel – 0.9% | ||||||||||||
Fortescue Metals Group Ltd. | 475,640 | 1,996,083 | ||||||||||
Novolipetsk Steel PJSC (GDR)(b) | 85,270 | 1,381,927 | ||||||||||
| AB ALL MARKET REAL RETURN PORTFOLIO • | 17 |
Consolidated Portfolio of Investments
| Company | Shares | U.S. $ Value | ||||||||||
| ||||||||||||
Severstal PJSC (GDR)(b) | 68,170 | $ | 961,285 | |||||||||
voestalpine AG | 22,350 | 791,772 | ||||||||||
|
| |||||||||||
| 5,131,067 | ||||||||||||
|
| |||||||||||
| 43,379,814 | ||||||||||||
|
| |||||||||||
Equity: Other – 6.2% | ||||||||||||
Diversified/Specialty – 5.1% | ||||||||||||
Alexandria Real Estate Equities, Inc. | 12,293 | 1,325,308 | ||||||||||
Armada Hoffler Properties, Inc. | 69,440 | 932,579 | ||||||||||
Ayala Land, Inc. | 904,060 | 676,230 | ||||||||||
Bumi Serpong Damai Tbk PT | 635,600 | 105,458 | ||||||||||
Buzzi Unicem SpA | 28,700 | 558,149 | ||||||||||
CBRE Group, Inc. – Class A(a) | 21,920 | 564,659 | ||||||||||
Central Pattana PCL | 111,151 | 177,060 | ||||||||||
China Evergrande Group | 439,250 | 289,130 | ||||||||||
Ciputra Development Tbk PT | 931,387 | 112,710 | ||||||||||
East Japan Railway Co. | 6,200 | 545,776 | ||||||||||
Equinix, Inc. | 2,150 | 768,152 | ||||||||||
Fibra Uno Administracion SA de CV | 192,049 | 365,483 | ||||||||||
Four Corners Property Trust, Inc. | 32,420 | 650,994 | ||||||||||
Fukuoka REIT Corp. | 362 | 628,289 | ||||||||||
Gecina SA | 2,990 | 435,946 | ||||||||||
Globe Trade Centre SA(a) | 27,589 | 56,468 | ||||||||||
Goldin Properties Holdings Ltd.(a) | 104,000 | 66,811 | ||||||||||
GPT Group (The) | 271,284 | 959,091 | ||||||||||
Growthpoint Properties Ltd. | 206,521 | 385,110 | ||||||||||
H&R Real Estate Investment Trust | 38,440 | 653,706 | ||||||||||
Hankyu Reit, Inc. | 277 | 394,446 | ||||||||||
Hulic Reit, Inc. | 363 | 635,275 | ||||||||||
ICADE | 11,800 | 847,391 | ||||||||||
IOI Properties Group Bhd | 159,500 | 93,153 | ||||||||||
Kennedy Wilson Europe Real Estate PLC | 43,803 | 543,711 | ||||||||||
KLCCP Stapled Group | 37,300 | 70,974 | ||||||||||
LendLease Group | 97,920 | 1,003,083 | ||||||||||
Lippo Karawaci Tbk PT | 1,566,100 | 108,332 | ||||||||||
Longfor Properties Co., Ltd. | 119,700 | 158,876 | ||||||||||
Mah Sing Group Bhd | 128,950 | 47,031 | ||||||||||
Mapletree Commercial Trust | 463,700 | 509,945 | ||||||||||
Mapletree Greater China Commercial Trust(b) | 154,700 | 115,715 | ||||||||||
Merlin Properties Socimi SA | 110,120 | 1,235,521 | ||||||||||
Mitsubishi Estate Co., Ltd. | 22,000 | 437,246 | ||||||||||
Mitsui Fudosan Co., Ltd. | 88,000 | 2,004,103 | ||||||||||
Monmouth Real Estate Investment Corp. – Class A | 515 | 7,040 | ||||||||||
New World Development Co., Ltd. | 998,683 | 1,241,612 | ||||||||||
Pakuwon Jati Tbk PT | 1,919,000 | 105,879 | ||||||||||
Premier Investment Corp. | 595 | 766,967 | ||||||||||
Pruksa Real Estate PCL | 55,600 | 36,699 | ||||||||||
Quality Houses PCL | 364,483 | 26,036 | ||||||||||
Redefine Properties Ltd. | 331,730 | 283,858 | ||||||||||
Resilient REIT Ltd. | 15,921 | 131,711 | ||||||||||
SA Corporate Real Estate Fund Nominees Pty Ltd. | 741,253 | 304,005 | ||||||||||
| 18 | • AB ALL MARKET REAL RETURN PORTFOLIO |
Consolidated Portfolio of Investments
| Company | Shares | U.S. $ Value | ||||||||||
| ||||||||||||
SM Prime Holdings, Inc. | 640,200 | $ | 355,488 | |||||||||
SP Setia Bhd Group | 74,100 | 61,824 | ||||||||||
Spirit Realty Capital, Inc. | 97,220 | 1,157,890 | ||||||||||
STORE Capital Corp. | 45,900 | 1,252,611 | ||||||||||
Sumitomo Realty & Development Co., Ltd. | 35,000 | 920,003 | ||||||||||
Summarecon Agung Tbk PT | 893,300 | 112,843 | ||||||||||
Sun Hung Kai Properties Ltd. | 100,423 | 1,495,411 | ||||||||||
Sunac China Holdings Ltd. | 144,600 | 98,687 | ||||||||||
Supalai PCL | 50,100 | 34,929 | ||||||||||
TLG Immobilien AG | 13,470 | 282,403 | ||||||||||
UOL Group Ltd. | 265,464 | 1,079,690 | ||||||||||
WHA Corp. PCL(a) | 266,200 | 25,101 | ||||||||||
Wharf Holdings Ltd. (The) | 113,000 | 847,241 | ||||||||||
|
| |||||||||||
| 29,089,839 | ||||||||||||
|
| |||||||||||
Health Care – 0.8% | ||||||||||||
Assura PLC | 392,770 | 282,682 | ||||||||||
Care Capital Properties, Inc. | 36,430 | 967,945 | ||||||||||
HCP, Inc. | 9,920 | 339,760 | ||||||||||
LTC Properties, Inc. | 14,180 | 710,560 | ||||||||||
Ventas, Inc. | 32,460 | 2,199,165 | ||||||||||
Welltower, Inc. | 3,170 | 217,240 | ||||||||||
|
| |||||||||||
| 4,717,352 | ||||||||||||
|
| |||||||||||
Triple Net – 0.3% | ||||||||||||
National Retail Properties, Inc. | 36,768 | 1,677,356 | ||||||||||
|
| |||||||||||
| 35,484,547 | ||||||||||||
|
| |||||||||||
Residential – 4.3% | ||||||||||||
Multi-Family – 3.2% | ||||||||||||
Apartment Investment & Management Co. – Class A | 27,060 | 1,192,534 | ||||||||||
AvalonBay Communities, Inc. | 14,149 | 2,422,026 | ||||||||||
China Overseas Land & Investment Ltd. | 838,140 | 2,572,996 | ||||||||||
China Resources Land Ltd. | 219,908 | 546,148 | ||||||||||
China Vanke Co., Ltd. – Class H | 107,700 | 281,105 | ||||||||||
CIFI Holdings Group Co., Ltd. | 1,414,000 | 415,964 | ||||||||||
Corp. GEO SAB de CV Series B(a) | 236 | 91 | ||||||||||
Country Garden Holdings Co., Ltd. | 594,000 | 308,266 | ||||||||||
Cyrela Brazil Realty SA Empreendimentos e Participacoes | 22,300 | 75,102 | ||||||||||
Desarrolladora Homex SAB de CV(a) | 1,460 | 147 | ||||||||||
Emlak Konut Gayrimenkul Yatirim Ortakligi AS | 712,621 | 728,153 | ||||||||||
Independence Realty Trust, Inc. | 94,270 | 785,269 | ||||||||||
Japan Rental Housing Investments, Inc. | 815 | 630,660 | ||||||||||
Kenedix Residential Investment Corp. | 209 | 593,696 | ||||||||||
Killam Apartment Real Estate Investment Trust | 62,270 | 550,602 | ||||||||||
Mid-America Apartment Communities, Inc. | 13,890 | 1,288,298 | ||||||||||
Milestone Apartments Real Estate Investment Trust | 33,207 | 446,622 | ||||||||||
Mirvac Group | 583,420 | 925,499 | ||||||||||
MRV Engenharia e Participacoes SA | 22,850 | 88,479 | ||||||||||
Shenzhen Investment Ltd. | 238,000 | 103,735 | ||||||||||
Shimao Property Holdings Ltd. | 102,000 | 136,056 | ||||||||||
| AB ALL MARKET REAL RETURN PORTFOLIO • | 19 |
Consolidated Portfolio of Investments
| Company | Shares | U.S. $ Value | ||||||||||
| ||||||||||||
Sino-Ocean Group Holding Ltd. | 296,080 | $ | 122,973 | |||||||||
Sun Communities, Inc. | 19,606 | 1,508,290 | ||||||||||
UNITE Group PLC (The) | 109,843 | 744,053 | ||||||||||
Urbi Desarrollos Urbanos SAB de CV(a) | 120 | 136 | ||||||||||
Vonovia SE | 48,744 | 1,718,464 | ||||||||||
|
| |||||||||||
| 18,185,364 | ||||||||||||
|
| |||||||||||
Self Storage – 0.7% | ||||||||||||
Big Yellow Group PLC | 71,790 | 607,373 | ||||||||||
Extra Space Storage, Inc. | 23,163 | 1,694,374 | ||||||||||
National Storage Affiliates Trust | 87,830 | 1,719,711 | ||||||||||
|
| |||||||||||
| 4,021,458 | ||||||||||||
|
| |||||||||||
Single Family – 0.2% | ||||||||||||
Colony Starwood Homes | 42,050 | 1,219,870 | ||||||||||
|
| |||||||||||
Student Housing – 0.2% | ||||||||||||
Education Realty Trust, Inc. | 33,680 | 1,434,431 | ||||||||||
|
| |||||||||||
| 24,861,123 | ||||||||||||
|
| |||||||||||
Retail – 3.5% | ||||||||||||
Regional Mall – 1.2% | ||||||||||||
BR Malls Participacoes SA(a) | 34,492 | 138,098 | ||||||||||
Multiplan Empreendimentos Imobiliarios SA | 6,180 | 124,200 | ||||||||||
Simon Property Group, Inc. | 28,821 | 5,359,553 | ||||||||||
Taubman Centers, Inc. | 18,930 | 1,371,668 | ||||||||||
|
| |||||||||||
| 6,993,519 | ||||||||||||
|
| |||||||||||
Shopping Center/Other Retail – 2.3% | ||||||||||||
Brixmor Property Group, Inc. | 53,520 | 1,360,478 | ||||||||||
Capitaland Malaysia Mall Trust | 90,200 | 34,403 | ||||||||||
Federal Realty Investment Trust | 12,160 | 1,765,997 | ||||||||||
Fibra Shop Portafolios Inmobiliarios SAPI de CV | 912,534 | 772,475 | ||||||||||
Frontier Real Estate Investment Corp. | 131 | 616,172 | ||||||||||
Hyprop Investments Ltd. | 46,324 | 411,030 | ||||||||||
IGB Real Estate Investment Trust | 136,300 | 52,636 | ||||||||||
Kite Realty Group Trust | 25,884 | 645,288 | ||||||||||
Klepierre | 27,272 | 1,114,546 | ||||||||||
Link REIT | 227,523 | 1,618,584 | ||||||||||
Mercialys SA | 42,060 | 871,286 | ||||||||||
Parque Arauco SA | 181,980 | 450,757 | ||||||||||
Ramco-Gershenson Properties Trust | 65,973 | 1,143,972 | ||||||||||
Retail Opportunity Investments Corp. | 34,867 | 701,175 | ||||||||||
Scentre Group | 425,730 | 1,362,564 | ||||||||||
|
| |||||||||||
| 12,921,363 | ||||||||||||
|
| |||||||||||
| 19,914,882 | ||||||||||||
|
| |||||||||||
Office – 2.6% | ||||||||||||
Office – 2.6% | ||||||||||||
Allied Properties Real Estate Investment Trust | 26,459 | 711,333 | ||||||||||
alstria office REIT-AG(a) | 111,943 | 1,443,978 | ||||||||||
Ascendas India Trust | 56,800 | 43,684 | ||||||||||
Boston Properties, Inc. | 18,283 | 2,202,736 | ||||||||||
Brandywine Realty Trust | 95,570 | 1,481,335 | ||||||||||
CA Immobilien Anlagen AG(a) | 34,961 | 634,330 | ||||||||||
| 20 | • AB ALL MARKET REAL RETURN PORTFOLIO |
Consolidated Portfolio of Investments
| Company | Shares | U.S. $ Value | ||||||||||
| ||||||||||||
CapitaLand Commercial Trust | 1,070,000 | $ | 1,210,837 | |||||||||
Empire State Realty Trust, Inc. – Class A | 68,350 | 1,337,610 | ||||||||||
Equity Commonwealth(a) | 27,940 | 844,067 | ||||||||||
Fabege AB | 50,583 | 854,318 | ||||||||||
Highwoods Properties, Inc. | 23,800 | 1,181,194 | ||||||||||
Inmobiliaria Colonial SA | 78,403 | 552,871 | ||||||||||
Investa Office Fund | 220,320 | 709,631 | ||||||||||
Kenedix Office Investment Corp. – Class A | 90 | 507,470 | ||||||||||
Liberty Property Trust | 3,500 | 141,505 | ||||||||||
MCUBS MidCity Investment Corp. | 143 | 465,001 | ||||||||||
Workspace Group PLC | 110,780 | 852,114 | ||||||||||
|
| |||||||||||
| 15,174,014 | ||||||||||||
|
| |||||||||||
Industrials – 1.7% | ||||||||||||
Industrial Warehouse Distribution – 1.1% | ||||||||||||
DCT Industrial Trust, Inc. | 25,310 | 1,183,243 | ||||||||||
Global Logistic Properties Ltd. | 254,600 | 323,966 | ||||||||||
LaSalle Logiport REIT | 507 | 537,885 | ||||||||||
Macquarie Mexico Real Estate Management SA de CV(a) | 553,715 | 696,648 | ||||||||||
Pure Industrial Real Estate Trust | 142,600 | 571,973 | ||||||||||
Rexford Industrial Realty, Inc. | 68,570 | 1,444,084 | ||||||||||
Segro PLC | 142,580 | 763,667 | ||||||||||
Warehouses De Pauw CVA | 5,758 | 530,508 | ||||||||||
WHA Corp. PCL(a) | 274,400 | 25,874 | ||||||||||
|
| |||||||||||
| 6,077,848 | ||||||||||||
|
| |||||||||||
Mixed Office Industrial – 0.6% | ||||||||||||
Axiare Patrimonio SOCIMI SA | 42,780 | 607,786 | ||||||||||
BR Properties SA | 15,740 | 42,358 | ||||||||||
Goodman Group | 203,574 | 1,049,325 | ||||||||||
Gramercy Property Trust | 153,855 | 1,418,543 | ||||||||||
Kungsleden AB | 93,385 | 588,823 | ||||||||||
|
| |||||||||||
| 3,706,835 | ||||||||||||
|
| |||||||||||
| 9,784,683 | ||||||||||||
|
| |||||||||||
Real Estate – 0.8% | ||||||||||||
Developers – 0.8% | ||||||||||||
Cheung Kong Property Holdings Ltd. | 384,500 | 2,842,477 | ||||||||||
Kaisa Group Holdings Ltd.(a)(c)(d) | 805,000 | 146,353 | ||||||||||
Sino Land Co., Ltd. | 530,000 | 899,908 | ||||||||||
Transurban Group | 63,970 | 504,756 | ||||||||||
|
| |||||||||||
| 4,393,494 | ||||||||||||
|
| |||||||||||
Food Beverage & Tobacco – 0.7% | ||||||||||||
Agricultural Products – 0.6% | ||||||||||||
Archer-Daniels-Midland Co. | 64,227 | 2,798,370 | ||||||||||
Bunge Ltd. | 7,492 | 464,579 | ||||||||||
Wilmar International Ltd. | 99,100 | 235,275 | ||||||||||
|
| |||||||||||
| 3,498,224 | ||||||||||||
|
| |||||||||||
Packaged Foods & Meats – 0.1% | ||||||||||||
Tyson Foods, Inc. – Class A | 11,410 | 808,399 | ||||||||||
|
| |||||||||||
| 4,306,623 | ||||||||||||
|
| |||||||||||
| AB ALL MARKET REAL RETURN PORTFOLIO • | 21 |
Consolidated Portfolio of Investments
| Company | Shares | U.S. $ Value | ||||||||||
| ||||||||||||
Mortgage – 0.3% | ||||||||||||
Mortgage – 0.3% | ||||||||||||
Blackstone Mortgage Trust, Inc. – Class A | 20,090 | $ | 606,718 | |||||||||
Concentradora Hipotecaria SAPI de CV | 512,570 | 731,119 | ||||||||||
First American Financial Corp. | 14,540 | 567,933 | ||||||||||
|
| |||||||||||
| 1,905,770 | ||||||||||||
|
| |||||||||||
Lodging – 0.2% | ||||||||||||
Lodging – 0.2% | ||||||||||||
Chesapeake Lodging Trust | 11,389 | 247,255 | ||||||||||
Summit Hotel Properties, Inc. | 46,280 | 601,177 | ||||||||||
Wyndham Worldwide Corp. | 5,070 | 333,809 | ||||||||||
|
| |||||||||||
| 1,182,241 | ||||||||||||
|
| |||||||||||
Total Common Stocks | 279,498,870 | |||||||||||
|
| |||||||||||
| Principal Amount (000) | ||||||||||||
INFLATION-LINKED SECURITIES – 31.9% | ||||||||||||
United States – 23.2% | ||||||||||||
U.S. Treasury Inflation Index | U.S.$ | 29,701 | 29,868,401 | |||||||||
1.125%, 1/15/21 (TIPS) | 26,791 | 28,471,531 | ||||||||||
1.625%, 1/15/18 (TIPS) | 25,886 | 26,635,287 | ||||||||||
2.375%, 1/15/17 (TIPS)(e) | 30,887 | 31,084,186 | ||||||||||
2.625%, 7/15/17 (TIPS)(e) | 16,125 | 16,581,444 | ||||||||||
|
| |||||||||||
| 132,640,849 | ||||||||||||
|
| |||||||||||
Japan – 8.7% | ||||||||||||
Japanese Government CPI Linked Bond | JPY | 4,960,872 | 50,072,309 | |||||||||
|
| |||||||||||
Total Inflation-Linked Securities | 182,713,158 | |||||||||||
|
| |||||||||||
| Shares | ||||||||||||
INVESTMENT COMPANIES – 14.6% | ||||||||||||
Funds and Investment Trusts – 14.6% | ||||||||||||
BB Progressivo II FII | 7,967 | 326,966 | ||||||||||
iShares MSCI Global Gold Miners ETF | 300,650 | 3,096,695 | ||||||||||
iShares MSCI Global Metals & Mining Producers ETF | 516,149 | 6,229,918 | ||||||||||
Kinea Renda Imobiliaria FII | 7,048 | 326,765 | ||||||||||
SPDR S&P Dividend ETF | 87,650 | 7,137,339 | ||||||||||
SPDR S&P Oil & Gas Exploration & Production ETF | 77,690 | 2,746,342 | ||||||||||
VanEck Vectors Gold Miners ETF | 319,832 | 7,842,281 | ||||||||||
Vanguard Dividend Appreciation ETF | 53,530 | 4,406,054 | ||||||||||
Vanguard Global ex-U.S. Real Estate ETF | 427,809 | 22,866,391 | ||||||||||
Vanguard REIT ETF | 348,293 | 28,476,436 | ||||||||||
|
| |||||||||||
Total Investment Companies | 83,455,187 | |||||||||||
|
| |||||||||||
| 22 | • AB ALL MARKET REAL RETURN PORTFOLIO |
Consolidated Portfolio of Investments
| Company | Shares | U.S. $ Value | ||||||||||
|
|
| ||||||||||
WARRANTS – 0.0% | ||||||||||||
Equity: Other – 0.0% | ||||||||||||
Diversified/Specialty – 0.0% | ||||||||||||
Eastern & Oriental Bhd, | 12,100 | $ | 505 | |||||||||
|
| |||||||||||
Health Care – 0.0% | ||||||||||||
Emaar Properties PJSC, Merrill Lynch Intl & Co., | 88,517 | 167,977 | ||||||||||
|
| |||||||||||
Total Warrants | 168,482 | |||||||||||
|
| |||||||||||
| Contracts | ||||||||||||
OPTIONS PURCHASED – CALLS – 0.0% | ||||||||||||
Options on Funds and Investment Trusts – 0.0% | ||||||||||||
Energy Select Sector SPDR Fund | 2,783 | 68,183 | ||||||||||
iShares U.S. Real Estate ETF | 2,966 | 10,381 | ||||||||||
|
| |||||||||||
Total Options Purchased – Calls | 78,564 | |||||||||||
|
| |||||||||||
| Shares | ||||||||||||
SHORT-TERM INVESTMENTS – 4.6% | ||||||||||||
Investment Companies – 4.6% | ||||||||||||
AB Fixed Income Shares, Inc. – Government Money Market Portfolio – Class AB, 0.26%(g)(h) | 26,405,766 | 26,405,766 | ||||||||||
|
| |||||||||||
Total Investments – 99.8% | 572,320,027 | |||||||||||
Other assets less liabilities – 0.2% | 1,002,772 | |||||||||||
|
| |||||||||||
Net Assets – 100.0% | $ | 573,322,799 | ||||||||||
|
| |||||||||||
FUTURES (see Note D)
| Type | Number of Contracts | Expiration Month | Original Value | Value at October 31, 2016 | Unrealized Appreciation/ (Depreciation) | |||||||||||||||
Purchased Contracts |
| |||||||||||||||||||
Brent Crude Oil Futures | 30 | November 2016 | $ | 1,475,712 | $ | 1,458,300 | $ | (17,412 | ) | |||||||||||
Coffee ‘C’ Futures | 33 | December 2016 | 1,885,472 | 2,031,356 | 145,884 | |||||||||||||||
Copper Futures | 25 | December 2016 | 1,317,687 | 1,378,125 | 60,438 | |||||||||||||||
Gold 100 OZ Futures | 72 | December 2016 | 9,700,617 | 9,166,320 | (534,297 | ) | ||||||||||||||
LME Lead Futures | 27 | December 2016 | 1,362,389 | 1,389,825 | 27,436 | |||||||||||||||
LME Nickel Futures | 44 | December 2016 | 2,750,966 | 2,760,252 | 9,286 | |||||||||||||||
| AB ALL MARKET REAL RETURN PORTFOLIO • | 23 |
Consolidated Portfolio of Investments
| Type | Number of Contracts | Expiration Month | Original Value | Value at October 31, 2016 | Unrealized Appreciation/ (Depreciation) | |||||||||||||||
LME Primary Aluminum Futures | 162 | December 2016 | $ | 6,636,940 | $ | 7,020,675 | $ | 383,735 | ||||||||||||
LME Zinc Futures | 47 | December 2016 | 2,632,806 | 2,888,150 | 255,344 | |||||||||||||||
Platinum Futures | 191 | January 2017 | 9,927,160 | 9,345,630 | (581,530 | ) | ||||||||||||||
Silver Futures | 9 | December 2016 | 892,147 | 800,820 | (91,327 | ) | ||||||||||||||
WTI Crude Futures | 119 | November 2017 | 5,662,728 | 6,088,040 | 425,312 | |||||||||||||||
Sold Contracts | ||||||||||||||||||||
10 Yr Mini Japan Government Bond Futures | 77 | December 2016 | 11,148,740 | 11,137,723 | 11,017 | |||||||||||||||
Coffee Robusta Futures | 91 | January 2017 | 1,910,895 | 1,987,440 | (76,545 | ) | ||||||||||||||
LME Lead Futures | 27 | December 2016 | 1,384,005 | 1,389,825 | (5,820 | ) | ||||||||||||||
LME Nickel Futures | 23 | December 2016 | 1,466,387 | 1,442,859 | 23,528 | |||||||||||||||
LME Primary Aluminum Futures | 129 | December 2016 | 5,186,338 | 5,590,537 | (404,199 | ) | ||||||||||||||
LME Zinc Futures | 36 | December 2016 | 2,101,435 | 2,212,200 | (110,765 | ) | ||||||||||||||
Mini MSCI EAFE Futures | 41 | December 2016 | 3,423,807 | 3,414,685 | 9,122 | |||||||||||||||
Mini MSCI Emerging Market Futures | 27 | December 2016 | 1,213,563 | 1,219,725 | (6,162 | ) | ||||||||||||||
S&P 500 E Mini Futures | 60 | December 2016 | 6,416,339 | 6,360,300 | 56,039 | |||||||||||||||
S&P/TSX 60 Index Futures | 3 | December 2016 | 376,107 | 387,609 | (11,502 | ) | ||||||||||||||
Sugar 11 (World) Futures | 76 | February 2017 | 1,920,160 | 1,836,038 | 84,122 | |||||||||||||||
U.S. T-Note 5 Yr (CBT) Futures | 145 | December 2016 | 17,562,941 | 17,515,547 | 47,394 | |||||||||||||||
WTI Crude Futures | 27 | December 2016 | 1,296,449 | 1,281,420 | 15,029 | |||||||||||||||
|
| |||||||||||||||||||
| $ | (285,873 | ) | ||||||||||||||||||
|
| |||||||||||||||||||
FORWARD CURRENCY EXCHANGE CONTRACTS (see Note D)
| Counterparty | Contracts to Deliver (000) | InExchange For (000) | Settlement Date | Unrealized Appreciation/ (Depreciation) | ||||||||||||||||||||
Bank of America, NA | USD | 11,469 | RUB | 752,738 | 12/15/16 | $ | 275,182 | |||||||||||||||||
Bank of America, NA | USD | 1,605 | RUB | 101,488 | 12/15/16 | (21,151 | ) | |||||||||||||||||
Barclays Bank PLC | CNY | 40,011 | USD | 5,953 | 12/15/16 | 69,800 | ||||||||||||||||||
Barclays Bank PLC | MXN | 15,547 | USD | 839 | 12/15/16 | 20,136 | ||||||||||||||||||
Barclays Bank PLC | USD | 1,786 | CNY | 12,039 | 12/15/16 | (15,556 | ) | |||||||||||||||||
BNP Paribas SA | AUD | 8,078 | USD | 6,057 | 12/15/16 | (80,895 | ) | |||||||||||||||||
BNP Paribas SA | USD | 6,351 | IDR | 83,708,336 | 12/15/16 | 31,188 | ||||||||||||||||||
BNP Paribas SA | USD | 6,100 | JPY | 625,802 | 12/15/16 | (123,042 | ) | |||||||||||||||||
BNP Paribas SA | USD | 910 | MYR | 3,695 | 12/15/16 | (30,976 | ) | |||||||||||||||||
BNP Paribas SA | USD | 716 | TWD | 22,320 | 12/15/16 | (8,490 | ) | |||||||||||||||||
Brown Brothers Harriman & Co. | JPY | 1,672,113 | USD | 16,094 | 12/15/16 | 122,555 | ||||||||||||||||||
Citibank, NA | AUD | 1,681 | USD | 1,292 | 12/15/16 | 14,927 | ||||||||||||||||||
Citibank, NA | CAD | 6,731 | USD | 5,213 | 12/15/16 | 193,062 | ||||||||||||||||||
Citibank, NA | EUR | 23,896 | USD | 27,035 | 12/15/16 | 753,551 | ||||||||||||||||||
| 24 | • AB ALL MARKET REAL RETURN PORTFOLIO |
Consolidated Portfolio of Investments
| Counterparty | Contracts to Deliver (000) | InExchange For (000) | Settlement Date | Unrealized Appreciation/ (Depreciation) | ||||||||||||||||||||
Citibank, NA | GBP | 1,436 | USD | 1,877 | 12/15/16 | $ | 117,100 | |||||||||||||||||
Citibank, NA | HKD | 5,879 | USD | 759 | 12/15/16 | 686 | ||||||||||||||||||
Citibank, NA | RUB | 362,091 | USD | 5,425 | 12/15/16 | (224,712 | ) | |||||||||||||||||
Citibank, NA | RUB | 99,313 | USD | 1,555 | 12/15/16 | 5,699 | ||||||||||||||||||
Citibank, NA | TRY | 5,127 | USD | 1,711 | 12/15/16 | 69,151 | ||||||||||||||||||
Citibank, NA | USD | 2,131 | AUD | 2,795 | 12/15/16 | (7,010 | ) | |||||||||||||||||
Citibank, NA | USD | 1,666 | CAD | 2,200 | 12/15/16 | (24,794 | ) | |||||||||||||||||
Citibank, NA | USD | 1,776 | CHF | 1,709 | 12/15/16 | (45,071 | ) | |||||||||||||||||
Citibank, NA | USD | 3,709 | EUR | 3,314 | 12/15/16 | (64,376 | ) | |||||||||||||||||
Citibank, NA | USD | 1,686 | GBP | 1,299 | 12/15/16 | (93,971 | ) | |||||||||||||||||
Citibank, NA | USD | 2,407 | JPY | 245,453 | 12/15/16 | (62,645 | ) | |||||||||||||||||
Citibank, NA | USD | 3,406 | ZAR | 48,300 | 12/15/16 | 145,540 | ||||||||||||||||||
Credit Suisse International | NOK | 4,493 | USD | 539 | 12/15/16 | (5,253 | ) | |||||||||||||||||
Credit Suisse International | USD | 5,678 | NOK | 45,993 | 12/15/16 | (110,896 | ) | |||||||||||||||||
Deutsche Bank AG | BRL | 4,054 | USD | 1,274 | 11/03/16 | 4,352 | ||||||||||||||||||
Deutsche Bank AG | USD | 1,212 | BRL | 4,054 | 11/03/16 | 58,490 | ||||||||||||||||||
Deutsche Bank AG | USD | 5,439 | JPY | 542,759 | 12/15/16 | (254,733 | ) | |||||||||||||||||
Goldman Sachs Bank USA | JPY | 624,320 | USD | 6,202 | 12/15/16 | 238,816 | ||||||||||||||||||
Goldman Sachs Bank USA | USD | 1,061 | GBP | 796 | 12/15/16 | (86,071 | ) | |||||||||||||||||
Morgan Stanley & Co., Inc. | BRL | 4,054 | USD | 1,289 | 11/03/16 | 18,529 | ||||||||||||||||||
Morgan Stanley & Co., Inc. | USD | 1,274 | BRL | 4,054 | 11/03/16 | (4,352 | ) | |||||||||||||||||
Morgan Stanley & Co., Inc. | USD | 960 | BRL | 3,130 | 12/02/16 | 12,326 | ||||||||||||||||||
Morgan Stanley & Co., Inc. | CHF | 5,377 | USD | 5,513 | 12/15/16 | 65,903 | ||||||||||||||||||
Morgan Stanley & Co., Inc. | JPY | 502,258 | USD | 5,023 | 12/15/16 | 225,205 | ||||||||||||||||||
Morgan Stanley & Co., Inc. | USD | 202 | COP | 584,763 | 12/15/16 | (8,341 | ) | |||||||||||||||||
Morgan Stanley & Co., Inc. | USD | 5,519 | GBP | 4,486 | 12/15/16 | (22,251 | ) | |||||||||||||||||
Morgan Stanley & Co., Inc. | USD | 6,122 | JPY | 622,136 | 12/15/16 | (179,778 | ) | |||||||||||||||||
Morgan Stanley & Co., Inc. | USD | 1,266 | BRL | 4,054 | 1/03/17 | (19,272 | ) | |||||||||||||||||
Nomura Global Financial Products, Inc. | GBP | 5,676 | USD | 7,244 | 12/15/16 | 289,817 | ||||||||||||||||||
Royal Bank of Scotland PLC | USD | 586 | SGD | 788 | 12/15/16 | (19,650 | ) | |||||||||||||||||
Royal Bank of Scotland PLC | USD | 561 | BRL | 1,818 | 1/03/17 | (2,123 | ) | |||||||||||||||||
Standard Chartered Bank | IDR | 76,411,662 | USD | 5,831 | 12/15/16 | 4,710 | ||||||||||||||||||
Standard Chartered Bank | USD | 1,519 | HKD | 11,775 | 12/15/16 | (70 | ) | |||||||||||||||||
Standard Chartered Bank | USD | 5,454 | INR | 367,056 | 12/15/16 | 15,622 | ||||||||||||||||||
Standard Chartered Bank | USD | 131 | KRW | 143,866 | 12/15/16 | (5,581 | ) | |||||||||||||||||
State Street Bank & Trust Co. | JPY | 3,173,416 | USD | 31,326 | 12/15/16 | 1,015,127 | ||||||||||||||||||
State Street Bank & Trust Co. | NZD | 58 | USD | 43 | 12/15/16 | 1,545 | ||||||||||||||||||
State Street Bank & Trust Co. | USD | 1,830 | GBP | 1,478 | 12/15/16 | (19,598 | ) | |||||||||||||||||
State Street Bank & Trust Co. | USD | 335 | SEK | 2,803 | 12/15/16 | (23,807 | ) | |||||||||||||||||
State Street Bank & Trust Co. | USD | 1,426 | THB | 49,675 | 12/15/16 | (7,777 | ) | |||||||||||||||||
UBS AG | JPY | 396,796 | USD | 3,826 | 12/15/16 | 35,550 | ||||||||||||||||||
UBS AG | USD | 4,162 | EUR | 3,748 | 12/15/16 | (39,598 | ) | |||||||||||||||||
|
| |||||||||||||||||||||||
| $ | 2,192,729 | |||||||||||||||||||||||
|
| |||||||||||||||||||||||
PUT OPTIONS WRITTEN (see Note D)
| Description | Contracts | Exercise Price | Expiration Month | Premiums Received | U.S. $ Value | |||||||||||||||
Energy Select Sector SPDR Fund(f) | 2,783 | $ | 66.00 | December 2016 | $ | 310,781 | $ | (374,314 | ) | |||||||||||
iShares U.S. Real Estate ETF(f) | 2,966 | 69.00 | November 2016 | 56,233 | (31,143 | ) | ||||||||||||||
|
|
|
| |||||||||||||||||
| $ | 367,014 | $ | (405,457 | ) | ||||||||||||||||
|
|
|
| |||||||||||||||||
| AB ALL MARKET REAL RETURN PORTFOLIO • | 25 |
Consolidated Portfolio of Investments
INFLATION (CPI) SWAPS (see Note D)
| Rate Type | ||||||||||||||||||||
Swap Counterparty | Notional Amount (000) | Termination Date | Payments made by the Fund | Payments received by the Fund | Unrealized Appreciation/ (Depreciation) | |||||||||||||||
Bank of America, NA | $ | 17,260 | 5/11/19 | 1.640 | % | CPI | # | $ | 169,592 | |||||||||||
Citibank, NA | 57,600 | 10/16/20 | 1.780 | % | CPI | # | 131,218 | |||||||||||||
Deutsche Bank AG | 31,194 | 3/26/25 | 2.170 | % | CPI | # | (229,788 | ) | ||||||||||||
Deutsche Bank AG | 18,987 | 3/26/25 | 2.195 | % | CPI | # | (163,154 | ) | ||||||||||||
Deutsche Bank AG | 38,982 | 3/25/25 | 2.205 | % | CPI | # | (354,680 | ) | ||||||||||||
Deutsche Bank AG | 46,779 | 3/25/25 | 2.205 | % | CPI | # | (425,622 | ) | ||||||||||||
Deutsche Bank AG | 54,500 | 7/30/25 | 2.278 | % | CPI | # | (610,192 | ) | ||||||||||||
JPMorgan Chase Bank, NA | 76,719 | 3/30/25 | 2.170 | % | CPI | # | (554,325 | ) | ||||||||||||
JPMorgan Chase Bank, NA | 76,719 | 4/01/25 | 2.170 | % | CPI | # | (558,422 | ) | ||||||||||||
|
| |||||||||||||||||||
| $ | (2,595,373 | ) | ||||||||||||||||||
|
| |||||||||||||||||||
| # | Variable interest rate based on the rate of inflation as determined by the Consumer Price Index (CPI). |
TOTAL RETURN SWAPS (see Note D)
| Counterparty & Referenced Obligation | # of Shares or Units | Rate Paid/ Received | Notional Amount (000) | Maturity Date | Unrealized Appreciation/ (Depreciation) | |||||||||||||||||||
Receive Total Return on Reference Obligation |
| |||||||||||||||||||||||
JPMorgan Chase Bank, NA Bloomberg Commodity Index 2 Month Forwards | 885,270 | 0.11 | % | USD | 170,124 | 12/15/16 | $ | (2,697,793 | ) | |||||||||||||||
| (a) | Non-income producing security. |
| (b) | Security is exempt from registration under Rule 144A of the Securities Act of 1933. These securities are considered restricted, but liquid and may be resold in transactions exempt from registration, normally to qualified institutional buyers. At October 31, 2016, the aggregate market value of these securities amounted to $3,294,681 or 0.6% of net assets. |
| (c) | Illiquid security. |
| (d) | Fair valued by the Adviser. |
| (e) | Position, or a portion thereof, has been segregated to collateralize OTC derivatives outstanding. |
| (f) | One contract relates to 100 shares. |
| (g) | Investment in affiliated money market mutual fund. The rate shown represents the 7-day yield as of period end. |
| (h) | To obtain a copy of the fund’s financial statements, please go to the Securities and Exchange Commission’s website at www.sec.gov, or call AB at (800) 227-4618. |
| 26 | • AB ALL MARKET REAL RETURN PORTFOLIO |
Consolidated Portfolio of Investments
Currency Abbreviations:
AUD – Australian Dollar
BRL – Brazilian Real
CAD – Canadian Dollar
CHF – Swiss Franc
CNY – Chinese Yuan Renminbi
COP – Colombian Peso
EUR – Euro
GBP – Great British Pound
HKD – Hong Kong Dollar
IDR – Indonesian Rupiah
INR – Indian Rupee
JPY – Japanese Yen
KRW – South Korean Won
MXN – Mexican Peso
MYR – Malaysian Ringgit
NOK – Norwegian Krone
NZD – New Zealand Dollar
RUB – Russian Ruble
SEK – Swedish Krona
SGD – Singapore Dollar
THB – Thailand Baht
TRY – Turkish Lira
TWD – New Taiwan Dollar
USD – United States Dollar
ZAR – South African Rand
Glossary:
| ADR | – American Depositary Receipt |
| CBT | – Chicago Board of Trade |
| CPI | – Consumer Price Index |
| EAFE | – Europe, Australia, and Far East |
| ETF | – Exchange Traded Fund |
GDR – Global Depositary Receipt
LME – London Metal Exchange
MSCI – Morgan Stanley Capital International
PJSC – Public Joint Stock Company
REG – Registered Shares
REIT – Real Estate Investment Trust
SPDR – Standard & Poor’s Depository Receipt
TIPS – Treasury Inflation Protected Security
TSX – Toronto Stock Exchange
WTI – West Texas Intermediate
See notes to consolidated financial statements.
| AB ALL MARKET REAL RETURN PORTFOLIO • | 27 |
Consolidated Portfolio of Investments
CONSOLIDATED STATEMENT OF ASSETS & LIABILITIES
October 31, 2016
| Assets | ||||
Investments in securities, at value | ||||
Unaffiliated issuers (cost $536,474,119) | $ | 545,914,261 | ||
Affiliated issuers (cost $26,405,766) | 26,405,766 | |||
Cash | 8,649 | |||
Cash collateral due from broker | 2,853,784 | |||
Foreign currencies, at value (cost $2,531,202) | 2,522,125 | |||
Unrealized appreciation on forward currency exchange contracts | 3,804,569 | |||
Receivable for investment securities sold and foreign currency transactions | 2,026,762 | |||
Unaffiliated interest and dividends receivable | 991,516 | |||
Receivable for capital stock sold | 710,977 | |||
Unrealized appreciation on inflation swaps | 300,810 | |||
Receivable for variation margin on exchange-traded derivatives | 17,588 | |||
Affiliated dividends receivable | 1,939 | |||
|
| |||
Total assets | 585,558,746 | |||
|
| |||
| Liabilities | ||||
Options written, at value (premiums received $367,014) | 405,457 | |||
Payable for investment securities purchased and foreign currency transactions | 3,380,514 | |||
Unrealized depreciation on inflation swaps | 2,896,183 | |||
Unrealized depreciation on total return swaps | 2,697,793 | |||
Unrealized depreciation on forward currency exchange contracts | 1,611,840 | |||
Payable for capital stock redeemed | 515,617 | |||
Management fee payable | 341,168 | |||
Payable for variation margin on exchange-traded derivatives | 1,182 | |||
Distribution fee payable | 106,265 | |||
Administrative fee payable | 16,391 | |||
Transfer Agent fee payable | 11,416 | |||
Payable for terminated total return swaps | 1,555 | |||
Accrued expenses and other liabilities | 250,566 | |||
|
| |||
Total liabilities | 12,235,947 | |||
|
| |||
Net Assets | $ | 573,322,799 | ||
|
| |||
| Composition of Net Assets | ||||
Capital stock, at par | $ | 70,608 | ||
Additional paid-in capital | 646,143,772 | |||
Undistributed net investment income | 7,325,715 | |||
Accumulated net realized loss on investment | (86,036,720 | ) | ||
Net unrealized appreciation on investments | 5,819,424 | |||
|
| |||
| $ | 573,322,799 | |||
|
|
See notes to consolidated financial statements.
| 28 | • AB ALL MARKET REAL RETURN PORTFOLIO |
Consolidated Statement of Assets & Liabilities
Net Asset Value Per Share—30 billion shares of capital stock authorized, $.001 par value
| Class | Net Assets | Shares Outstanding | Net Asset Value | |||||||||
| ||||||||||||
| A | $ | 13,681,730 | 1,660,914 | $ | 8.24 | * | ||||||
| ||||||||||||
| C | $ | 2,813,832 | 344,580 | $ | 8.17 | |||||||
| ||||||||||||
| Advisor | $ | 25,307,404 | 3,078,266 | $ | 8.22 | |||||||
| ||||||||||||
| R | $ | 200,808 | 24,668 | $ | 8.14 | |||||||
| ||||||||||||
| K | $ | 1,888,160 | 231,723 | $ | 8.15 | |||||||
| ||||||||||||
| I | $ | 15,645,502 | 1,914,626 | $ | 8.17 | |||||||
| ||||||||||||
| 1 | $ | 505,142,857 | 62,295,638 | $ | 8.11 | |||||||
| ||||||||||||
| 2 | $ | 8,288 | 1,000 | $ | 8.29 | |||||||
| ||||||||||||
| Z | $ | 8,634,218 | 1,056,597 | $ | 8.17 | |||||||
| ||||||||||||
| * | The maximum offering price per share for Class A shares was $8.61 which reflects a sales charge of 4.25%. |
See notes to consolidated financial statements.
| AB ALL MARKET REAL RETURN PORTFOLIO • | 29 |
Consolidated Statement of Assets & Liabilities
CONSOLIDATED STATEMENT OF OPERATIONS
Year Ended October 31, 2016
| Investment Income | ||||||||
Dividends | ||||||||
Unaffiliated issuers (net of foreign taxes withheld of $710,437) | $ | 13,113,509 | ||||||
Affiliated issuers | 45,288 | |||||||
Interest | 519,472 | $ | 13,678,269 | |||||
|
| |||||||
| Expenses | ||||||||
Management fee (see Note B) | 4,057,110 | |||||||
Distribution fee—Class A | 34,883 | |||||||
Distribution fee—Class C | 31,451 | |||||||
Distribution fee—Class R | 731 | |||||||
Distribution fee—Class K | 4,177 | |||||||
Distribution fee—Class 1 | 1,185,825 | |||||||
Transfer agency—Class A | 26,774 | |||||||
Transfer agency—Class C | 6,749 | |||||||
Transfer agency—Advisor Class | 53,056 | |||||||
Transfer agency—Class R | 384 | |||||||
Transfer agency—Class K | 3,379 | |||||||
Transfer agency—Class I | 3,231 | |||||||
Transfer agency—Class 1 | 41,520 | |||||||
Transfer agency—Class Z | 1,694 | |||||||
Custodian | 288,248 | |||||||
Audit and tax | 120,588 | |||||||
Registration fees | 114,368 | |||||||
Printing | 64,099 | |||||||
Administrative | 54,912 | |||||||
Legal | 47,766 | |||||||
Directors’ fees | 23,701 | |||||||
Miscellaneous | 77,499 | |||||||
|
| |||||||
Total expenses | 6,242,145 | |||||||
Less: expenses waived and reimbursed by the Adviser (see Note B) | (46,256 | ) | ||||||
|
| |||||||
Net expenses | 6,195,889 | |||||||
|
| |||||||
Net investment income | 7,482,380 | |||||||
|
| |||||||
| Realized and Unrealized Gain (Loss) on Investment and Foreign Currency Transactions | ||||||||
Net realized loss on: | ||||||||
Investment transactions | (26,366,832 | )(a) | ||||||
Futures | (20,948,359 | ) | ||||||
Options written | (2,839,087 | ) | ||||||
Swaps | (571,585 | ) | ||||||
Foreign currency transactions | (911,043 | ) | ||||||
Net change in unrealized appreciation/depreciation of: | ||||||||
Investments | 42,597,858 | (b) | ||||||
Futures | 14,778,186 | |||||||
Options written | (38,443 | ) | ||||||
Swaps | 1,853,254 | |||||||
Foreign currency denominated assets and liabilities | 3,958,206 | |||||||
|
| |||||||
Net gain on investment and foreign currency transactions | 11,512,155 | |||||||
|
| |||||||
Contributions from Affiliates (see Note B) | 4,556 | |||||||
|
| |||||||
Net Increase in Net Assets from Operations | $ | 18,999,091 | ||||||
|
|
| (a) | Net of foreign capital gains taxes of $9,019. |
| (b) | Net of increase in accrued foreign capital gains taxes of $3,079. |
See notes to consolidated financial statements.
| 30 | • AB ALL MARKET REAL RETURN PORTFOLIO |
Consolidated Statement of Operations
CONSOLIDATED STATEMENT OF CHANGES IN NET ASSETS
| Year Ended October 31, 2016 | Year Ended October 31, 2015 | |||||||
| Increase (Decrease) in Net Assets from Operations | ||||||||
Net investment income | $ | 7,482,380 | $ | 4,570,447 | ||||
Net realized loss on investment and foreign currency transactions | (51,636,906 | ) | (92,610,596 | ) | ||||
Net change in unrealized appreciation/depreciation of investments and foreign currency denominated assets and liabilities | 63,149,061 | (48,846,620 | ) | |||||
Contributions from Affiliates (see Note B) | 4,556 | 306 | ||||||
|
|
|
| |||||
Net increase (decrease) in net assets from operations | 18,999,091 | (136,886,463 | ) | |||||
| Dividends to Shareholders from | ||||||||
Net investment income | ||||||||
Class A | (174,718 | ) | (483,613 | ) | ||||
Class C | (11,593 | ) | (100,388 | ) | ||||
Advisor Class | (479,187 | ) | (1,240,758 | ) | ||||
Class R | (1,815 | ) | (4,403 | ) | ||||
Class K | (27,392 | ) | (50,051 | ) | ||||
Class I | (300,575 | ) | (452,178 | ) | ||||
Class 1 | (8,849,158 | ) | (12,070,530 | ) | ||||
Class 2 | (172 | ) | (270 | ) | ||||
Class Z | (162,962 | ) | (254 | ) | ||||
| Capital Stock Transactions | ||||||||
Net increase | 18,834,778 | 64,070,635 | ||||||
|
|
|
| |||||
Total increase (decrease) | 27,826,297 | (87,218,273 | ) | |||||
| Net Assets | ||||||||
Beginning of period | 545,496,502 | 632,714,775 | ||||||
|
|
|
| |||||
End of period (including undistributed net investment income of $7,325,715 and $7,271,555, respectively) | $ | 573,322,799 | $ | 545,496,502 | ||||
|
|
|
| |||||
See notes to consolidated financial statements.
| AB ALL MARKET REAL RETURN PORTFOLIO • | 31 |
Consolidated Statement of Changes in Net Assets
NOTES TO CONSOLIDATED FINANCIAL STATEMENTS
October 31, 2016
NOTE A
Significant Accounting Policies
AB Bond Fund, Inc. (the “Company”) is registered under the Investment Company Act of 1940 as an open-end management investment company. The Company, which is a Maryland corporation, operates as a series company comprised of ten portfolios currently in operation. Each portfolio is considered to be a separate entity for financial reporting and tax purposes. This report relates only to the AB All Market Real Return Portfolio (the “Portfolio”), a diversified portfolio. As part of the Portfolio’s investment strategy, the Portfolio seeks to gain exposure to commodities and commodities-related instruments and derivatives primarily through investments in AllianceBernstein Cayman Inflation Strategy, Ltd., a wholly-owned subsidiary of the Portfolio organized under the laws of the Cayman Islands (the “Subsidiary”). The Portfolio and the Subsidiary commenced operations on March 8, 2010. The Subsidiary was incorporated on February 1, 2010. The Portfolio is the sole shareholder of the Subsidiary and it is intended that the Portfolio will remain the sole shareholder and will continue to control the Subsidiary. Under the Articles of Association of the Subsidiary, shares issued by the Subsidiary confer upon a shareholder the right to receive notice of, to attend and to vote at general meetings of the Subsidiary and shall confer upon the shareholder rights in a winding-up or repayment of capital and the right to participate in the profits or assets of the Subsidiary. As of October 31, 2016, net assets of the Portfolio were $573,322,799, of which $97,514,339, or 17%, represented the Portfolio’s ownership of all issued shares and voting rights of the Subsidiary. This report presents the consolidated financial statements of AB All Market Real Return Portfolio and the Subsidiary. All intercompany transactions and balances have been eliminated in consolidation. The Portfolio has authorized the issuance of Class A, Class B, Class C, Advisor Class, Class R, Class K, Class I, Class 1, Class 2 and Class Z shares. Class B shares are not publically offered. Class 1 shares are sold only to the private clients of Sanford C. Bernstein & Co. LLC by its registered representatives. As of October 31, 2016, AllianceBernstein L.P. (the “Adviser”), was the sole shareholder of Class 2 shares. Class A shares are sold with a front-end sales charge of up to 4.25% for purchases not exceeding $1,000,000. With respect to purchases of $1,000,000 or more, Class A shares redeemed within one year of purchase may be subject to a contingent deferred sales charge of 1%. Class C shares are subject to a contingent deferred sales charge of 1% on redemptions made within the first year after purchase. Class R, Class K, Class 1, and Class Z shares are sold without an initial or contingent deferred sales charge. Advisor Class, Class I, and Class 2 shares are sold without an initial or contingent deferred sales charge and are not subject to ongoing distribution expenses. All ten classes of shares have identical voting, dividend, liquidation and other rights, except that the classes bear different distribution and transfer agency expenses. Each class has exclusive voting rights with respect to its distribution plan. The consolidated financial statements have been prepared in conformity with
| 32 | • AB ALL MARKET REAL RETURN PORTFOLIO |
Notes to Consolidated Financial Statements
U.S. generally accepted accounting principles (“U.S. GAAP”) which require management to make certain estimates and assumptions that affect the reported amounts of assets and liabilities in the consolidated financial statements and amounts of income and expenses during the reporting period. Actual results could differ from those estimates. The Portfolio is an investment company under U.S. GAAP and follows the accounting and reporting guidance applicable to investment companies. The following is a summary of significant accounting policies followed by the Portfolio.
1. Security Valuation
Portfolio securities are valued at their current market value determined on the basis of market quotations or, if market quotations are not readily available or are deemed unreliable, at “fair value” as determined in accordance with procedures established by and under the general supervision of the Company’s Board of Directors (the “Board”).
In general, the market values of securities which are readily available and deemed reliable are determined as follows: securities listed on a national securities exchange (other than securities listed on the NASDAQ Stock Market, Inc. (“NASDAQ”)) or on a foreign securities exchange are valued at the last sale price at the close of the exchange or foreign securities exchange. If there has been no sale on such day, the securities are valued at the last traded price from the previous day. Securities listed on more than one exchange are valued by reference to the principal exchange on which the securities are traded; securities listed only on NASDAQ are valued in accordance with the NASDAQ Official Closing Price; listed or over the counter (“OTC”) market put or call options are valued at the mid level between the current bid and ask prices. If either a current bid or current ask price is unavailable, the Adviser will have discretion to determine the best valuation (e.g. last trade price in the case of listed options); open futures are valued using the closing settlement price or, in the absence of such a price, the most recent quoted bid price. If there are no quotations available for the day of valuation, the last available closing settlement price is used; U.S. Government securities and any other debt instruments having 60 days or less remaining until maturity are generally valued at market by an independent pricing vendor, if a market price is available. If a market price is not available, the securities are valued at amortized cost. This methodology is commonly used for short term securities that have an original maturity of 60 days or less, as well as short term securities that had an original term to maturity that exceeded 60 days. In instances when amortized cost is utilized, the Valuation Committee (the “Committee”) must reasonably conclude that the utilization of amortized cost is approximately the same as the fair value of the security. Such factors the Committee will consider include, but are not limited to, an impairment of the creditworthiness of the issuer or material changes in interest rates. Fixed-income securities, including mortgage-backed and asset-backed securities, may be valued on the basis of prices provided by a pricing service or at a price obtained from one or more of the major broker-dealers. In cases
| AB ALL MARKET REAL RETURN PORTFOLIO • | 33 |
Notes to Consolidated Financial Statements
where broker-dealer quotes are obtained, the Adviser may establish procedures whereby changes in market yields or spreads are used to adjust, on a daily basis, a recently obtained quoted price on a security. Swaps and other derivatives are valued daily, primarily using independent pricing services, independent pricing models using market inputs, as well as third party broker-dealers or counterparties. Open end mutual funds are valued at the closing net asset value per share, while exchange traded funds are valued at the closing market price per share.
Securities for which market quotations are not readily available (including restricted securities) or are deemed unreliable are valued at fair value as deemed appropriate by the Adviser. Factors considered in making this determination may include, but are not limited to, information obtained by contacting the issuer, analysts, analysis of the issuer’s financial statements or other available documents. In addition, the Portfolio may use fair value pricing for securities primarily traded in non-U.S. markets because most foreign markets close well before the Portfolio values its securities at 4:00 p.m., Eastern Time. The earlier close of these foreign markets gives rise to the possibility that significant events, including broad market moves, may have occurred in the interim and may materially affect the value of those securities. To account for this, the Portfolio may frequently value many of its foreign equity securities using fair value prices based on third party vendor modeling tools to the extent available.
2. Fair Value Measurements
In accordance with U.S. GAAP regarding fair value measurements, fair value is defined as the price that the Portfolio would receive to sell an asset or pay to transfer a liability in an orderly transaction between market participants at the measurement date. U.S. GAAP establishes a framework for measuring fair value, and a three-level hierarchy for fair value measurements based upon the transparency of inputs to the valuation of an asset or liability (including those valued based on their market values as described in Note A.1 above). Inputs may be observable or unobservable and refer broadly to the assumptions that market participants would use in pricing the asset or liability. Observable inputs reflect the assumptions market participants would use in pricing the asset or liability based on market data obtained from sources independent of the Portfolio. Unobservable inputs reflect the Portfolio’s own assumptions about the assumptions that market participants would use in pricing the asset or liability based on the best information available in the circumstances. Each investment is assigned a level based upon the observability of the inputs which are significant to the overall valuation. The three-tier hierarchy of inputs is summarized below.
| • | Level 1—quoted prices in active markets for identical investments |
| • | Level 2—other significant observable inputs (including quoted prices for similar investments, interest rates, prepayment speeds, credit risk, etc.) |
| 34 | • AB ALL MARKET REAL RETURN PORTFOLIO |
Notes to Consolidated Financial Statements
| • | Level 3—significant unobservable inputs (including the Portfolio’s own assumptions in determining the fair value of investments) |
The fair value of debt instruments, such as bonds, and over-the-counter derivatives is generally based on market price quotations, recently executed market transactions (where observable) or industry recognized modeling techniques and are generally classified as Level 2. Pricing vendor inputs to Level 2 valuations may include quoted prices for similar investments in active markets, interest rates, coupon rates, yield curves, option adjusted spreads, default rates, credit spreads and other unique security features in order to estimate the relevant cash flows which is then discounted to calculate fair values. If these inputs are unobservable and significant to the fair value, these investments will be classified as Level 3. In addition, non-agency rated investments are classified as Level 3.
Other fixed income investments, including non-U.S. government and corporate debt, are generally valued using quoted market prices, if available, which are typically impacted by current interest rates, maturity dates and any perceived credit risk of the issuer. Additionally, in the absence of quoted market prices, these inputs are used by pricing vendors to derive a valuation based upon industry or proprietary models which incorporate issuer specific data with relevant yield/spread comparisons with more widely quoted bonds with similar key characteristics. Those investments for which there are observable inputs are classified as Level 2. Where the inputs are not observable, the investments are classified as Level 3.
Where readily available market prices or relevant bid prices are not available for certain equity investments, such investments may be valued based on similar publicly traded investments, movements in relevant indices since last available prices or based upon underlying company fundamentals and comparable company data (such as multiples to earnings or other multiples to equity). Where an investment is valued using an observable input, by pricing vendors, such as another publicly traded security, the investment will be classified as Level 2. If management determines that an adjustment is appropriate based on restrictions on resale, illiquidity or uncertainty, and such adjustment is a significant component of the valuation, the investment will be classified as Level 3. An investment will also be classified as Level 3 where management uses company fundamentals and other significant inputs to determine the valuation.
Options are valued using market-based inputs to models, broker or dealer quotations, or alternative pricing sources with reasonable levels of price transparency, where such inputs and models are available. Alternatively the values may be obtained through unobservable management determined inputs and/or management’s proprietary models. Where models are used, the selection of a particular model to value an option depends upon the contractual terms of, and specific risks inherent in, the option as well as the availability of pricing information in the market.
| AB ALL MARKET REAL RETURN PORTFOLIO • | 35 |
Notes to Consolidated Financial Statements
Valuation models require a variety of inputs, including contractual terms, market prices, measures of volatility and correlations of such inputs. Exchange traded options generally will be classified as Level 2. For options that do not trade on exchange but trade in liquid markets, inputs can generally be verified and model selection does not involve significant management judgment. Options are classified within Level 2 on the fair value hierarchy when all of the significant inputs can be corroborated to market evidence. Otherwise such instruments are classified as Level 3.
The following table summarizes the valuation of the Portfolio’s investments by the above fair value hierarchy levels as of October 31, 2016:
Investments in Securities: | Level 1 | Level 2 | Level 3 | Total | ||||||||||||
Assets: |
| |||||||||||||||
Common Stocks: | ||||||||||||||||
Energy | $ | 61,349,174 | $ | 57,762,505 | $ | – 0 | – | $ | 119,111,679 | |||||||
Materials | 16,633,277 | 26,746,537 | – 0 | –(a) | 43,379,814 | |||||||||||
Equity: Other | 15,145,556 | 20,338,991 | – 0 | – | 35,484,547 | |||||||||||
Residential | 14,425,982 | 10,435,141 | – 0 | – | 24,861,123 | |||||||||||
Retail | 13,920,700 | 5,994,182 | – 0 | – | 19,914,882 | |||||||||||
Office | 7,943,464 | 7,230,550 | – 0 | – | 15,174,014 | |||||||||||
Industrials | 5,356,849 | 4,427,834 | – 0 | – | 9,784,683 | |||||||||||
Real Estate | – 0 | – | 4,247,141 | 146,353 | 4,393,494 | |||||||||||
Food Beverage & Tobacco | 4,071,348 | 235,275 | – 0 | – | 4,306,623 | |||||||||||
Mortgage | 1,905,770 | – 0 | – | – 0 | – | 1,905,770 | ||||||||||
Lodging | 1,182,241 | – 0 | – | – 0 | – | 1,182,241 | ||||||||||
Inflation-Linked Securities | – 0 | – | 182,713,158 | – 0 | – | 182,713,158 | ||||||||||
Investment Companies | 83,455,187 | – 0 | – | – 0 | – | 83,455,187 | ||||||||||
Warrants | 505 | 167,977 | – 0 | – | 168,482 | |||||||||||
Options Purchased – Calls | – 0 | – | 78,564 | – 0 | – | 78,564 | ||||||||||
Short-Term Investments | 26,405,766 | – 0 | – | – 0 | – | 26,405,766 | ||||||||||
|
|
|
|
|
|
|
| |||||||||
Total Investments in Securities | 251,795,819 | 320,377,855 | 146,353 | 572,320,027 | ||||||||||||
Other Financial Instruments(b): | ||||||||||||||||
Assets: | ||||||||||||||||
Futures | 1,553,686 | – 0 | – | – 0 | – | 1,553,686 | (c) | |||||||||
Forward Currency Exchange Contracts | – 0 | – | 3,804,569 | – 0 | – | 3,804,569 | ||||||||||
Inflation (CPI) Swaps | – 0 | – | 300,810 | – 0 | – | 300,810 | ||||||||||
Liabilities: | ||||||||||||||||
Futures | (1,839,559 | ) | – 0 | – | – 0 | – | (1,839,559 | )(c) | ||||||||
Forward Currency Exchange Contracts | – 0 | – | (1,611,840 | ) | – 0 | – | (1,611,840 | ) | ||||||||
Put Options Written | – 0 | – | (405,457 | ) | – 0 | – | (405,457 | ) | ||||||||
Inflation (CPI) Swaps | – 0 | – | (2,896,183 | ) | – 0 | – | (2,896,183 | ) | ||||||||
Total Return Swaps | – 0 | – | (2,697,793 | ) | – 0 | – | (2,697,793 | ) | ||||||||
|
|
|
|
|
|
|
| |||||||||
Total(d) | $ | 251,509,946 | $ | 316,871,961 | $ | 146,353 | $ | 568,528,260 | ||||||||
|
|
|
|
|
|
|
| |||||||||
| (a) | The Portfolio held securities with zero market value at period end. |
| (b) | Other financial instruments are derivative instruments, such as futures, forwards and swaps, which are valued at the unrealized appreciation/depreciation on the instrument. Other financial instruments may also include options written which are valued at market value. |
| (c) | Only variation margin receivable/payable at period end is reported within the statement of assets and liabilities. This amount reflects cumulative unrealized appreciation/(depreciation) of exchange-traded derivatives as reported in the portfolio of investments. |
| (d) | There were de minimis transfers under 1% of net assets between Level 1 and Level 2 during the reporting period. |
| 36 | • AB ALL MARKET REAL RETURN PORTFOLIO |
Notes to Consolidated Financial Statements
The Portfolio recognizes all transfers between levels of the fair value hierarchy assuming the financial instruments were transferred at the beginning of the reporting period.
The following is a reconciliation of investments in which significant unobservable inputs (Level 3) were used in determining fair value.
| Common Stocks - Equity: Other | Common Stocks - Materials(a) | Common Stocks - Residential | ||||||||||
Balance as of 10/31/15 | $ | 147,589 | $ | – 0 | – | $ | – 0 | –(b) | ||||
Accrued discounts/(premiums) | – 0 | – | – 0 | – | – 0 | – | ||||||
Realized gain (loss) | – 0 | – | – 0 | – | – 0 | – | ||||||
Change in unrealized appreciation/depreciation | (1,236 | ) | – 0 | – | – 0 | – | ||||||
Purchases | – 0 | – | – 0 | – | – 0 | – | ||||||
Sales | – 0 | – | – 0 | – | – 0 | – | ||||||
Transfers in to Level 3 | – 0 | – | – 0 | – | – 0 | – | ||||||
Transfers out of Level 3 | – 0 | – | – 0 | – | – 0 | –(b) | ||||||
|
|
|
|
|
| |||||||
Balance as of 10/31/16 | $ | 146,353 | $ | – 0 | – | $ | – 0 | – | ||||
|
|
|
|
|
| |||||||
Net change in unrealized appreciation/depreciation from investments held as of | $ | (1,236 | ) | $ | – 0 | – | $ | – 0 | – | |||
|
|
|
|
|
| |||||||
| Total | ||||||||||||
Balance as of 10/31/15 | $ | 147,589 | ||||||||||
Accrued discounts/(premiums) | – 0 | – | ||||||||||
Realized gain (loss) | – 0 | – | ||||||||||
Change in unrealized appreciation/depreciation | (1,236 | ) | ||||||||||
Purchases | – 0 | – | ||||||||||
Sales | – 0 | – | ||||||||||
Transfers in to Level 3 | – 0 | – | ||||||||||
Transfers out of Level 3 | – 0 | –(b) | ||||||||||
|
| |||||||||||
Balance as of 10/31/16 | $ | 146,353 | (d) | |||||||||
|
| |||||||||||
Net change in unrealized appreciation/depreciation from investments held as of | $ | (1,236 | ) | |||||||||
|
| |||||||||||
| (a) | The Portfolio held securities with zero market value at period end. |
| (b) | Amount less than $0.50. |
| (c) | The unrealized appreciation/depreciation is included in net change in unrealized appreciation/depreciation on investments and other financial instruments in the accompanying statement of operations. |
| (d) | There were de minimis transfers under 1% of net assets during the reporting period. |
The Adviser established the Committee to oversee the pricing and valuation of all securities held in the Portfolio. The Committee operates under pricing and valuation policies and procedures established by the
| AB ALL MARKET REAL RETURN PORTFOLIO • | 37 |
Notes to Consolidated Financial Statements
Adviser and approved by the Board, including pricing policies which set forth the mechanisms and processes to be employed on a daily basis to implement these policies and procedures. In particular, the pricing policies describe how to determine market quotations for securities and other instruments. The Committee’s responsibilities include: 1) fair value and liquidity determinations (and oversight of any third parties to whom any responsibility for fair value and liquidity determinations is delegated), and 2) regular monitoring of the Adviser’s pricing and valuation policies and procedures and modification or enhancement of these policies and procedures (or recommendation of the modification of these policies and procedures) as the Committee believes appropriate.
The Committee is also responsible for monitoring the implementation of the pricing policies by the Adviser’s Pricing Group (the “Pricing Group”) and a third party which performs certain pricing functions in accordance with the pricing policies. The Pricing Group is responsible for the oversight of the third party on a day-to-day basis. The Committee and the Pricing Group perform a series of activities to provide reasonable assurance of the accuracy of prices including: 1) periodic vendor due diligence meetings, review of methodologies, new developments and processes at vendors, 2) daily comparison of security valuation versus prior day for all securities that exceeded established thresholds, and 3) daily review of unpriced, stale, and variance reports with exceptions reviewed by senior management and the Committee.
In addition, several processes outside of the pricing process are used to monitor valuation issues including: 1) performance and performance attribution reports are monitored for anomalous impacts based upon benchmark performance, and 2) portfolio managers review all portfolios for performance and analytics (which are generated using the Adviser’s prices).
3. Currency Translation
Assets and liabilities denominated in foreign currencies and commitments under forward currency exchange contracts are translated into U.S. dollars at the mean of the quoted bid and ask prices of such currencies against the U.S. dollar. Purchases and sales of portfolio securities are translated into U.S. dollars at the rates of exchange prevailing when such securities were acquired or sold. Income and expenses are translated into U.S. dollars at rates of exchange prevailing when accrued.
The Portfolio does not isolate that portion of the results of operations resulting from changes in foreign exchange rates on investments from the fluctuations arising from changes in market prices of securities held. Such fluctuations are included with the net realized and unrealized gain or loss from investments.
| 38 | • AB ALL MARKET REAL RETURN PORTFOLIO |
Notes to Consolidated Financial Statements
Net realized gain or loss on foreign currency transactions represents foreign exchange gains and losses from sales and maturities of foreign fixed income investments, foreign currency exchange contracts, holding of foreign currencies, currency gains or losses realized between the trade and settlement dates on foreign investment transactions, and the difference between the amounts of dividends, interest and foreign withholding taxes recorded on the Portfolio’s books and the U.S. dollar equivalent amounts actually received or paid. Net unrealized currency gains and losses from valuing foreign currency denominated assets and liabilities at period end exchange rates are reflected as a component of net unrealized appreciation or depreciation of foreign currency denominated assets and liabilities.
4. Taxes
It is the Portfolio’s policy to meet the requirements of the Internal Revenue Code applicable to regulated investment companies and to distribute all of its investment company taxable income and net realized gains, if any, to shareholders. Therefore, no provisions for federal income or excise taxes are required. The Portfolio may be subject to taxes imposed by countries in which it invests. Such taxes are generally based on income and/or capital gains earned or repatriated. Taxes are accrued and applied to net investment income, net realized gains and net unrealized appreciation/depreciation as such income and/or gains are earned.
If, during a taxable year, the Subsidiary’s taxable losses (and other deductible items) exceed its income and gains, the net loss will not pass through to the Portfolio as a deductible amount for Federal income tax purposes. Note that the loss from the Subsidiary’s contemplated activities also cannot be carried forward to reduce future Subsidiary’s income in subsequent years. However, if the Subsidiary’s taxable gains exceed its losses and other deductible items during a taxable year, the net gain will pass through to the Portfolio as income for Federal income tax purposes.
In accordance with U.S. GAAP requirements regarding accounting for uncertainties in income taxes, management has analyzed the Portfolio’s tax positions taken or expected to be taken on federal and state income tax returns for all open tax years (the current and the prior three tax years) and has concluded that no provision for income tax is required in the Portfolio’s consolidated financial statements.
5. Investment Income and Investment Transactions
Dividend income is recorded on the ex-dividend date or as soon as the Portfolio is informed of the dividend. Interest income is accrued daily. Investment transactions are accounted for on the date the securities are purchased or sold. Investment gains or losses are determined on the identified cost basis. The Portfolio amortizes premiums and accretes discounts as adjustments to interest income.
| AB ALL MARKET REAL RETURN PORTFOLIO • | 39 |
Notes to Consolidated Financial Statements
6. Class Allocations
All income earned and expenses incurred by the Portfolio are borne on a pro-rata basis by each outstanding class of shares, based on the proportionate interest in the Portfolio represented by the net assets of such class, except for class specific expenses which are allocated to the respective class. Expenses of the Company are charged proportionately to each portfolio or based on other appropriate methods. Realized and unrealized gains and losses are allocated among the various share classes based on respective net assets.
7. Dividends and Distributions
Dividends and distributions to shareholders, if any, are recorded on the ex-dividend date. Income dividends and capital gains distributions are determined in accordance with federal tax regulations and may differ from those determined in accordance with U.S. GAAP. To the extent these differences are permanent, such amounts are reclassified within the capital accounts based on their federal tax basis treatment; temporary differences do not require such reclassification.
NOTE B
Management Fee and Other Transactions with Affiliates
Under the terms of the investment advisory agreement, the Portfolio pays the Adviser a management fee at an annual rate of .75% of the Portfolio’s average daily net assets. The Adviser agreed to waive its fees and bear certain expenses to the extent necessary to limit total operating expenses on an annual basis (the “Expense Caps”) to 1.30%, 2.05%, 1.05%, 1.55%, 1.30%, 1.05%, 1.30%, 1.05% and 1.05% of daily average net assets for Class A, Class C, Advisor Class, Class R, Class K, Class I, Class 1, Class 2 and Class Z shares, respectively. Prior to January 29, 2016, the Adviser had agreed to waive its fees and bear certain expenses to the extent necessary to limit total operating expenses on an annual basis to 1.30%, 2.00%, 1.00%, 1.50%, 1.25%, 1.00%, 1.25%, 1.00% and 1.00% of daily average net assets for Class A, Class C, Advisor Class, Class R, Class K, Class I, Class 1, Class 2 and Class Z shares, respectively. This fee waiver and/or expense reimbursement agreement will remain in effect until January 29, 2017. For the year ended October 31, 2016, such reimbursement amounted to $26,910.
The Subsidiary has entered into a separate agreement with the Adviser for the management of the Subsidiary’s portfolio. The Adviser receives no compensation from the Subsidiary for its services under the agreement.
During the years ended October 31, 2016 and October 31, 2015 the Adviser reimbursed the Strategy $4,556 and $306, respectively, for trading losses incurred due to a trade entry error.
| 40 | • AB ALL MARKET REAL RETURN PORTFOLIO |
Notes to Consolidated Financial Statements
Pursuant to the investment advisory agreement, the Portfolio may reimburse the Adviser for certain legal and accounting services provided to the Portfolio by the Adviser. For the year ended October 31, 2016, the reimbursement for such services amounted to $54,912.
The Portfolio compensates AllianceBernstein Investor Services, Inc. (“ABIS”), a wholly-owned subsidiary of the Adviser, under a Transfer Agency Agreement for providing personnel and facilities to perform transfer agency services for the Portfolio. ABIS may make payments to intermediaries that provide omnibus account services, sub-accounting services and/or networking services. Such compensation retained by ABIS amounted to $98,731 for the year ended October 31, 2016.
AllianceBernstein Investments, Inc. (the “Distributor”), a wholly-owned subsidiary of the Adviser, serves as the distributor of the Portfolio’s shares. The Distributor has advised the Portfolio that it has retained front-end sales charges of $288 from the sale of Class A shares and received $0 and $64 in contingent deferred sales charges imposed upon redemptions by shareholders of Class A and Class C shares, respectively, for the year ended October 31, 2016.
The AB Fixed-Income Shares, Inc.—Government STIF Portfolio (the “Government STIF Portfolio”), prior to June 1, 2016, was offered as a cash management option to mutual funds and other institutional accounts of the Adviser, and was not available for direct purchase by members of the public. Prior to June 1, 2016, the Government STIF Portfolio paid no advisory fees but did bear its own expenses. As of June 1, 2016, the Government STIF Portfolio, which was renamed “AB Government Money Market Portfolio” (the “Government Money Market Portfolio”), has a contractual advisory fee rate of .20% and continues to bear its own expenses. In connection with the investment by the Portfolio in the Government Money Market Portfolio, the Adviser has agreed to waive its advisory fee from the Portfolio in an amount equal to the Portfolio’s share of the advisory fees of Government Money Market Portfolio, as borne indirectly by the Portfolio as an acquired fund fee and expense. For the year ended October 31, 2016, such waiver amounted to $19,346. A summary of the Portfolio’s transactions in shares of the Government Money Market Portfolio for the year ended October 31, 2016 is as follows:
Market Value 10/31/15 (000) | Purchases at Cost (000) | Sales Proceeds (000) | Market Value 10/31/16 (000) | Dividend Income (000) | ||||||||||||||
| $ | 49,719 | $ | 437,559 | $ | 460,872 | $ | 26,406 | $ | 45 | |||||||||
| AB ALL MARKET REAL RETURN PORTFOLIO • | 41 |
Notes to Consolidated Financial Statements
Brokerage commissions paid on investment transactions for the year ended October 31, 2016 amounted to $456,170, of which $0 and $0, respectively, was paid to Sanford C. Bernstein & Co. LLC and Sanford C. Bernstein Limited, affiliates of the Adviser.
NOTE C
Distribution Services Agreement
The Portfolio has adopted a Distribution Services Agreement (the “Agreement”) pursuant to Rule 12b-1 under the Investment Company Act of 1940. Under the Agreement, the Portfolio pays distribution and servicing fees to AllianceBernstein Investments, Inc. (the “Distributor”) at an annual rate of up to .30% of the Portfolio’s average daily net assets attributable to Class A shares, 1% of the Portfolio’s average daily net assets attributable to Class C shares, .50% of the Portfolio’s average daily net assets attributable to Class R shares, .25% of the Portfolio’s average daily net assets attributable to Class K shares and .25% of the Portfolio’s average daily net assets attributable to Class 1 shares. There are no distribution and servicing fees on the Advisor Class, Class I, Class 2 and Class Z shares. Effective January 29, 2016, payments under the Plan were limited to .25% of Class A shares’ average daily net assets. The fees are accrued daily and paid monthly. The Agreement provides that the Distributor will use such payments in their entirety for distribution assistance and promotional activities. Since the commencement of the Portfolio’s operations, the Distributor has incurred expenses in excess of the distribution costs reimbursed by the Portfolio in the amounts of $153,922, $15,609, $18,681 and $1,651,946 for Class C, Class R, Class K and Class 1 shares, respectively. While such costs may be recovered from the Portfolio in future periods so long as the Agreement is in effect, the rate of the distribution and servicing fees payable under the Agreement may not be increased without a shareholder vote. In accordance with the Agreement, there is no provision for recovery of unreimbursed distribution costs incurred by the Distributor beyond the current fiscal year for Class A shares. The Agreement also provides that the Adviser may use its own resources to finance the distribution of the Portfolio’s shares.
NOTE D
Investment Transactions
Purchases and sales of investment securities (excluding short-term investments) for the year ended October 31, 2016 were as follows:
| Purchases | Sales | |||||||
Investment securities (excluding | $ | 434,632,964 | $ | 372,425,281 | ||||
U.S. government securities | �� | 104,244,477 | 155,909,614 | |||||
| 42 | • AB ALL MARKET REAL RETURN PORTFOLIO |
Notes to Consolidated Financial Statements
The cost of investments for federal income tax purposes, gross unrealized appreciation and unrealized depreciation (excluding futures, foreign currency, written options and swap transactions) are as follows:
Cost | $ | 707,994,365 | ||
|
| |||
Gross unrealized appreciation | $ | 25,535,941 | ||
Gross unrealized depreciation | (161,872,398 | ) | ||
|
| |||
Net unrealized appreciation | $ | (136,336,457 | ) | |
|
|
1. Derivative Financial Instruments
The Portfolio may use derivatives in an effort to earn income and enhance returns, to replace more traditional direct investments, to obtain exposure to otherwise inaccessible markets (collectively, “investment purposes”), or to hedge or adjust the risk profile of its portfolio.
The principal types of derivatives utilized by the Portfolio, as well as the methods in which they may be used are:
| • | Futures |
The Portfolio may buy or sell futures for investment purposes or for the purpose of hedging its portfolio against adverse effects of potential movements in the market. The Portfolio bears the market risk that arises from changes in the value of these instruments and the imperfect correlation between movements in the price of the futures and movements in the price of the assets, reference rates or indices which they are designed to track. Among other things, the Portfolio may purchase or sell futures for foreign currencies or options thereon for non-hedging purposes as a means of making direct investment in foreign currencies, as described below under “Currency Transactions”.
At the time the Portfolio enters into futures, the Portfolio deposits and maintains as collateral an initial margin with the broker, as required by the exchange on which the transaction is effected. Such amount is shown as cash collateral due from broker on the consolidated statement of assets and liabilities. Pursuant to the contract, the Portfolio agrees to receive from or pay to the broker an amount of cash equal to the daily fluctuation in the value of the contract. Such receipts or payments are known as variation margin and are recorded by the Portfolio as unrealized gains or losses. Risks may arise from the potential inability of a counterparty to meet the terms of the contract. The credit/counterparty risk for exchange-traded futures is generally less than privately negotiated futures, since the clearinghouse, which is the issuer or counterparty to each exchange-traded future, has robust risk mitigation standards, including the requirement to provide initial and variation margin.
| AB ALL MARKET REAL RETURN PORTFOLIO • | 43 |
Notes to Consolidated Financial Statements
When the contract is closed, the Portfolio records a realized gain or loss equal to the difference between the value of the contract at the time it was opened and the time it was closed.
Use of long futures subjects the Portfolio to risk of loss in excess of the amounts shown on the consolidated statement of assets and liabilities, up to the notional value of the futures. Use of short futures subjects the Portfolio to unlimited risk of loss. Under some circumstances, futures exchanges may establish daily limits on the amount that the price of futures can vary from the previous day’s settlement price, which could effectively prevent liquidation of unfavorable positions.
During the year ended October 31, 2016, the Portfolio held futures for hedging and non-hedging purposes.
| • | Forward Currency Exchange Contracts |
The Portfolio may enter into forward currency exchange contracts in order to hedge its exposure to changes in foreign currency exchange rates on its foreign portfolio holdings, to hedge certain firm purchase and sale commitments denominated in foreign currencies and for non-hedging purposes as a means of making direct investments in foreign currencies, as described below under “Currency Transactions”.
A forward currency exchange contract is a commitment to purchase or sell a foreign currency at a future date at a negotiated forward rate. The gain or loss arising from the difference between the original contract and the closing of such contract would be included in net realized gain or loss on foreign currency transactions. Fluctuations in the value of open forward currency exchange contracts are recorded for financial reporting purposes as unrealized appreciation and/or depreciation by the Portfolio. Risks may arise from the potential inability of a counterparty to meet the terms of a contract and from unanticipated movements in the value of a foreign currency relative to the U.S. dollar.
During the year ended October 31, 2016, the Portfolio held forward currency exchange contracts for hedging and non-hedging purposes.
| • | Option Transactions |
For hedging and investment purposes, the Portfolio may purchase and write (sell) put and call options on U.S. and foreign securities, including government securities, and foreign currencies that are traded on U.S. and foreign securities exchanges and over-the-counter markets. Among other things, the Portfolio may use options transactions for non-hedging purposes as a means of
| 44 | • AB ALL MARKET REAL RETURN PORTFOLIO |
Notes to Consolidated Financial Statements
making direct investments in foreign currencies, as described below under “Currency Transactions” and may use options strategies involving the purchase and/or writing of various combinations of call and/or put options, for hedging and investment purposes.
The risk associated with purchasing an option is that the Portfolio pays a premium whether or not the option is exercised. Additionally, the Portfolio bears the risk of loss of the premium and change in market value should the counterparty not perform under the contract. If a put or call option purchased by the Fund were permitted to expire without being sold or exercised, its premium would represent a loss to the Fund. Put and call options purchased are accounted for in the same manner as portfolio securities. The cost of securities acquired through the exercise of call options is increased by premiums paid. The proceeds from securities sold through the exercise of put options are decreased by the premiums paid.
When the Portfolio writes an option, the premium received by the Portfolio is recorded as a liability and is subsequently adjusted to the current market value of the option written. Premiums received from written options which expire unexercised are recorded by the Portfolio on the expiration date as realized gains from options written. The difference between the premium received and the amount paid on effecting a closing purchase transaction, including brokerage commissions, is also treated as a realized gain, or if the premium received is less than the amount paid for the closing purchase transaction, as a realized loss. If a call option is exercised, the premium received is added to the proceeds from the sale of the underlying security or currency in determining whether the Portfolio has realized a gain or loss. If a put option is exercised, the premium received reduces the cost basis of the security or currency purchased by the Portfolio. In writing an option, the Portfolio bears the market risk of an unfavorable change in the price of the security or currency underlying the written option. Exercise of an option written by the Portfolio could result in the Portfolio selling or buying a security or currency at a price different from the current market value.
During the year ended October 31, 2016, the Portfolio held purchased options for hedging and non-hedging purposes.
During the year ended October 31, 2016, the Portfolio held written options for hedging and non-hedging purposes.
| AB ALL MARKET REAL RETURN PORTFOLIO • | 45 |
Notes to Consolidated Financial Statements
For the year ended October 31, 2016, the Portfolio had the following transactions in written options:
| Number of Contracts | Premiums Received | |||||||
Options written outstanding as of 10/31/15 | – 0 | – | $ | – 0 | – | |||
Options written | 44,349,395 | 3,273,373 | ||||||
Options assigned | (21,900,000 | ) | (399,872 | ) | ||||
Options expired | (7,623,646 | ) | (898,517 | ) | ||||
Options bought back | (14,820,000 | ) | (1,607,970 | ) | ||||
Options exercised | – 0 | – | – 0 | – | ||||
|
|
|
| |||||
Options written outstanding as of 10/31/16 | 5,749 | $ | 367,014 | |||||
|
|
|
| |||||
| • | Swaps |
The Portfolio may enter into swaps to hedge its exposure to interest rates, credit risk, equity markets and currencies. The Portfolio may also enter into swaps for non-hedging purposes as a means of gaining market exposures, making direct investments in foreign currencies, as described below under “Currency Transactions” or in order to take a “long” or “short” position with respect to an underlying referenced asset described below under “Total Return Swaps”. A swap is an agreement that obligates two parties to exchange a series of cash flows at specified intervals based upon or calculated by reference to changes in specified prices or rates for a specified amount of an underlying asset. The payment flows are usually netted against each other, with the difference being paid by one party to the other. In addition, collateral may be pledged or received by the Portfolio in accordance with the terms of the respective swaps to provide value and recourse to the Portfolio or its counterparties in the event of default, bankruptcy or insolvency by one of the parties to the swap.
Risks may arise as a result of the failure of the counterparty to the swap to comply with the terms of the swap. The loss incurred by the failure of a counterparty is generally limited to the net interim payment to be received by the Portfolio, and/or the termination value at the end of the contract. Therefore, the Portfolio considers the creditworthiness of each counterparty to a swap in evaluating potential counterparty risk. This risk is mitigated by having a netting arrangement between the Portfolio and the counterparty and by the posting of collateral by the counterparty to the Portfolio to cover the Portfolio’s exposure to the counterparty. Additionally, risks may arise from unanticipated movements in interest rates or in the value of the underlying securities. The Portfolio accrues for the interim payments on swaps on a daily basis, with the net amount recorded within unrealized appreciation/depreciation of swaps on the consolidated statement
| 46 | • AB ALL MARKET REAL RETURN PORTFOLIO |
Notes to Consolidated Financial Statements
of assets and liabilities, where applicable. Once the interim payments are settled in cash, the net amount is recorded as realized gain/(loss) on swaps on the consolidated statement of operations, in addition to any realized gain/(loss) recorded upon the termination of swaps. Upfront premiums paid or received are recognized as cost or proceeds on the consolidated statement of assets and liabilities and are amortized on a straight line basis over the life of the contract. Amortized upfront premiums are included in net realized gain/(loss) from swaps on the consolidated statement of operations. Fluctuations in the value of swaps are recorded as a component of net change in unrealized appreciation/depreciation of swaps on the consolidated statement of operations.
Inflation (CPI) Swaps:
Inflation swap agreements are contracts in which one party agrees to pay the cumulative percentage increase in a price index (the Consumer Price Index with respect to CPI swaps) over the term of the swap (with some lag on the inflation index), and the other pays a compounded fixed rate. Inflation swaps may be used to protect the net asset value, or NAV, of Portfolio against an unexpected change in the rate of inflation measured by an inflation index since the value of these agreements is expected to increase if unexpected inflation increases.
During the year ended October 31, 2016, the Portfolio held inflation (CPI) swaps for hedging and non-hedging purposes.
Total Return Swaps:
The Portfolio may enter into total return swaps in order to take a “long” or “short” position with respect to an underlying referenced asset. The Portfolio is subject to market price volatility of the underlying referenced asset. A total return swap involves commitments to pay interest in exchange for a market linked return based on a notional amount. To the extent that the total return of the security, group of securities or index underlying the transaction exceeds or falls short of the offsetting interest obligation, the Portfolio will receive a payment from or make a payment to the counterparty.
During the year ended October 31, 2016, the Portfolio held total return swaps for hedging and non-hedging purposes.
The Portfolio typically enters into International Swaps and Derivatives Association, Inc. Master Agreements (“ISDA Master Agreement”) or similar master agreements (collectively, “Master Agreements”) with its derivative contract counterparties in order to, among other things,
| AB ALL MARKET REAL RETURN PORTFOLIO • | 47 |
Notes to Consolidated Financial Statements
reduce its credit risk to counterparties. ISDA Master Agreements include provisions for general obligations, representations, collateral and events of default or termination. Under an ISDA Master Agreement, the Portfolio typically may offset with the counterparty certain derivative financial instrument’s payables and/or receivables with collateral held and/or posted and create one single net payment (close-out netting) in the event of default or termination.
Various Master Agreements govern the terms of certain transactions with counterparties, including transactions such as derivative transactions, repurchase and reverse repurchase agreements. These Master Agreements typically attempt to reduce the counterparty risk associated with such transactions by specifying credit protection mechanisms and providing standardization that improves legal certainty. Cross-termination provisions under Master Agreements typically provide that a default in connection with one transaction between the Portfolio and a counterparty gives the non-defaulting party the right to terminate any other transactions in place with the defaulting party to create one single net payment due to/due from the defaulting party. In the event of a default by a Master Agreements counterparty, the return of collateral with market value in excess of the Portfolio’s net liability, held by the defaulting party, may be delayed or denied.
The Portfolio’s Master Agreements may contain provisions for early termination of OTC derivative transactions in the event the net assets of the Portfolio decline below specific levels (“net asset contingent features”). If these levels are triggered, the Portfolio’s counterparty has the right to terminate such transaction and require the Portfolio to pay or receive a settlement amount in connection with the terminated transaction. For additional details, please refer to netting arrangements by counterparty tables below.
| 48 | • AB ALL MARKET REAL RETURN PORTFOLIO |
Notes to Consolidated Financial Statements
During the year ended October 31, 2016, the Portfolio had entered into the following derivatives:
Asset Derivatives | Liability Derivatives | |||||||||||
Derivative Type | Consolidated | Fair Value | Consolidated | Fair Value | ||||||||
Interest rate contracts | Receivable/Payable for variation margin on exchange-traded derivatives | $ | 58,411 | * | ||||||||
Equity contracts | Receivable/Payable for variation margin on exchange-traded derivatives | 65,161 | * | Receivable/Payable for variation margin on exchange-traded derivatives | $ | 17,664 | * | |||||
Commodity contracts | Receivable/Payable for variation margin on exchange-traded derivatives | | 1,430,114 | * | Receivable/Payable for variation margin on exchange-traded derivatives | | 1,821,895 | * | ||||
Foreign exchange contracts | Unrealized appreciation on forward currency exchange contracts | | 3,804,569 | | Unrealized depreciation on forward currency exchange contracts | | 1,611,840 | | ||||
Equity contracts | Investments in securities, at value | 78,564 | ||||||||||
Equity contracts | Options written, at value | 405,457 | ||||||||||
Interest rate contracts | Unrealized appreciation on inflation swaps | | 300,810 | | Unrealized depreciation on inflation swaps | | 2,896,183 | | ||||
Equity contracts | Unrealized depreciation on total return swaps | 2,697,793 | ||||||||||
|
|
|
| |||||||||
Total | $ | 5,737,629 | $ | 9,450,832 | ||||||||
|
|
|
| |||||||||
| * | Only variation margin receivable/payable at period end is reported within the consolidated statement of assets and liabilities. This amount reflects cumulative appreciation/(depreciation) of exchange-traded derivatives as reported in the consolidated portfolio of investments. |
| AB ALL MARKET REAL RETURN PORTFOLIO • | 49 |
Notes to Consolidated Financial Statements
Derivative Type | Location of Gain or (Loss) on Derivatives Within Consolidated Statement of Operations | Realized Gain or (Loss) on Derivatives | Change in Unrealized Appreciation or (Depreciation) | |||||||
Interest rate contracts | Net realized gain (loss) on futures; Net change in unrealized appreciation/depreciation of futures | $ | 1,259 | $ | 58,411 | |||||
Equity contracts | Net realized gain (loss) on futures; Net change in unrealized appreciation/depreciation of futures | (812,892 | ) | 47,497 | ||||||
Commodity contracts | Net realized gain (loss) on futures; Net change in unrealized appreciation/depreciation of futures | (20,136,726 | ) | 14,672,278 | ||||||
Foreign exchange contracts | Net realized gain (loss) on foreign currency transactions; Net change in unrealized appreciation/depreciation of foreign currency denominated assets and liabilities | (278,026 | ) | 3,637,774 | ||||||
Equity contracts | Net realized gain (loss) on investment transactions; Net change in unrealized appreciation/depreciation of investments | (1,429,275 | ) | (250,320 | ) | |||||
Equity contracts | Net realized gain (loss) on options written; Net change in unrealized appreciation/depreciation of options written | (2,839,087 | ) | (38,443 | ) | |||||
Interest rate contracts | Net realized gain (loss) on swaps; Net change in unrealized appreciation/depreciation of swaps | 145,243 | (43,653 | ) | ||||||
Equity contracts | Net realized gain (loss) on swaps; Net change in unrealized appreciation/depreciation of swaps | (716,828 | ) | 1,896,907 | ||||||
|
|
|
| |||||||
Total | $ | (26,066,332 | ) | $ | 19,980,451 | |||||
|
|
|
| |||||||
| 50 | • AB ALL MARKET REAL RETURN PORTFOLIO |
Notes to Consolidated Financial Statements
The following table represents the average monthly volume of the Portfolio’s derivative transactions during the year ended October 31, 2016:
Futures: | ||||
Average original value of buy contracts | $ | 58,898,936 | ||
Average original value of sale contracts | $ | 19,318,809 | ||
Forward Currency Exchange Contracts: | ||||
Average principal amount of buy contracts | $ | 99,383,889 | ||
Average principal amount of sale contracts | $ | 127,945,387 | ||
Purchased Options: | ||||
Average monthly cost | $ | 552,319 | (a) | |
Inflation Swaps: | ||||
Average notional amount | $ | 390,870,769 | ||
Total Return Swaps: | ||||
Average notional amount | $ | 175,780,947 |
| (a) | Positions were open for six months during the year. |
For financial reporting purposes, the Portfolio does not offset derivative assets and derivative liabilities that are subject to netting arrangements in the consolidated statement of assets and liabilities.
All derivatives held at period end were subject to netting arrangements. The following table presents the Portfolio’s derivative assets and liabilities by counterparty net of amounts available for offset under Master Agreements (“MA”) and net of the related collateral received/ pledged by the Portfolio as of October 31, 2016:
All Market Real Return Portfolio
Counterparty | Derivative Assets Subject to a MA | Derivative Available for Offset | Cash Collateral Received | Security Collateral Received | Net Amount of Derivatives Assets | |||||||||||||||
OTC Derivatives: | ||||||||||||||||||||
Bank of America, NA | $ | 444,774 | $ | (21,151 | ) | $ | – 0 | – | $ | – 0 | – | $ | 423,623 | |||||||
Barclays Bank PLC | 89,936 | (15,556 | ) | – 0 | – | – 0 | – | 74,380 | ||||||||||||
BNP Paribas SA | 31,188 | (31,188 | ) | – 0 | – | – 0 | – | – 0 | – | |||||||||||
Brown Brothers Harriman & Co. | 122,555 | – 0 | – | – 0 | – | – 0 | – | 122,555 | ||||||||||||
Citibank, NA | 1,430,934 | (522,579 | ) | – 0 | – | – 0 | – | 908,355 | ||||||||||||
Deutsche Bank AG | 62,842 | (62,842 | ) | – 0 | – | – 0 | – | – 0 | – | |||||||||||
Goldman Sachs Bank USA | 238,816 | (86,071 | ) | – 0 | – | – 0 | – | 152,745 | ||||||||||||
Morgan Stanley & Co., Inc. | 321,963 | (233,994 | ) | – 0 | – | – 0 | – | 87,969 | ||||||||||||
Nomura Global Financial Products, Inc. | 289,817 | – 0 | – | – 0 | – | – 0 | – | 289,817 | ||||||||||||
Standard Chartered Bank | 20,332 | (5,651 | ) | – 0 | – | – 0 | – | 14,681 | ||||||||||||
State Street Bank & Trust Co. | 1,016,672 | (51,182 | ) | – 0 | – | – 0 | – | 965,490 | ||||||||||||
UBS AG | 35,550 | (35,550 | ) | – 0 | – | – 0 | – | – 0 | – | |||||||||||
|
|
|
|
|
|
|
|
|
| |||||||||||
Total | $ | 4,105,379 | $ | (1,065,764 | ) | $ | – 0 | – | $ | – 0 | – | $ | 3,039,615 | ^ | ||||||
|
|
|
|
|
|
|
|
|
| |||||||||||
| AB ALL MARKET REAL RETURN PORTFOLIO • | 51 |
Notes to Consolidated Financial Statements
Counterparty | Derivative Liabilities Subject to a MA | Derivative Available for Offset | Cash Collateral Pledged* | Security Collateral Pledged | Net Amount of Derivatives Liabilities | |||||||||||||||
Exchange-Traded Derivatives: | ||||||||||||||||||||
Morgan Stanley & Co., Inc.** | $ | 1,182 | $ | – 0 | – | $ | (1,182 | ) | $ | – 0 | – | $ | – 0 | – | ||||||
|
|
|
|
|
|
|
|
|
| |||||||||||
Total | $ | 1,182 | $ | – 0 | – | $ | (1,182 | ) | $ | – 0 | – | $ | – 0 | – | ||||||
|
|
|
|
|
|
|
|
|
| |||||||||||
OTC Derivatives: | ||||||||||||||||||||
Bank of America, NA | $ | 21,151 | $ | (21,151 | ) | $ | – 0 | – | $ | – 0 | – | $ | – 0 | – | ||||||
Barclays Bank PLC | 15,556 | (15,556 | ) | – 0 | – | – 0 | – | – 0 | – | |||||||||||
BNP Paribas SA | 243,403 | (31,188 | ) | – 0 | – | – 0 | – | 212,215 | ||||||||||||
Citibank, NA | 522,579 | (522,579 | ) | – 0 | – | – 0 | – | – 0 | – | |||||||||||
Credit Suisse International | 116,149 | – 0 | – | – 0 | – | – 0 | – | 116,149 | ||||||||||||
Deutsche Bank AG | 2,038,169 | (62,842 | ) | – 0 | – | (1,851,313 | ) | 124,014 | ||||||||||||
Goldman Sachs Bank USA | 86,071 | (86,071 | ) | – 0 | – | – 0 | – | – 0 | – | |||||||||||
JPMorgan Chase Bank, NA | 1,112,747 | – 0 | – | – 0 | – | (1,104,955 | ) | 7,792 | ||||||||||||
Morgan Stanley & Co., Inc. | 233,994 | (233,994 | ) | – 0 | – | – 0 | – | – 0 | – | |||||||||||
Royal Bank of Scotland PLC | 19,650 | – 0 | – | – 0 | – | – 0 | – | 19,650 | ||||||||||||
Standard Chartered Bank | 5,651 | (5,651 | ) | – 0 | – | – 0 | – | – 0 | – | |||||||||||
State Street Bank & Trust Co. | 51,182 | (51,182 | ) | – 0 | – | – 0 | – | – 0 | – | |||||||||||
UBS AG | 39,598 | (35,550 | ) | – 0 | – | – 0 | – | 4,048 | ||||||||||||
|
|
|
|
|
|
|
|
|
| |||||||||||
Total | $ | 4,505,900 | $ | (1,065,764 | ) | $ | – 0 | – | $ | (2,956,268 | ) | $ | 483,868 | ^ | ||||||
|
|
|
|
|
|
|
|
|
| |||||||||||
| * | The actual collateral received/pledged is more than the amount reported due to over-collateralization. |
| ** | Cash has been posted for initial margin requirements for exchange-traded derivatives outstanding at October 31, 2016. |
| ^ | Net amount represents the net receivable/payable that would be due from/to the counterparty in the event of default or termination. The net amount from OTC financial derivative instruments can only be netted across transactions governed under the same master agreement with the same counterparty. |
AllianceBernstein Cayman Inflation Strategy, Ltd.
Counterparty | Derivative Assets Subject to a MA | Derivative Available for Offset | Cash Collateral Received | Security Collateral Received | Net Amount of Derivatives Assets | |||||||||||||||
Exchange-Traded Derivatives: | ||||||||||||||||||||
Morgan Stanley & Co., Inc.* | $ | 96,152 | $ | (96,152 | ) | $ | – 0 | – | $ | – 0 | – | $ | – 0 | – | ||||||
|
|
|
|
|
|
|
|
|
| |||||||||||
Total | $ | 96,152 | $ | (96,152 | ) | $ | – 0 | – | $ | – 0 | – | $ | – 0 | – | ||||||
|
|
|
|
|
|
|
|
|
| |||||||||||
Counterparty | Derivative Liabilities Subject to a MA | Derivative Available for Offset | Cash Collateral Pledged** | Security Collateral Pledged** | Net Amount of Derivatives Liabilities | |||||||||||||||
Exchange-Traded Derivatives: | ||||||||||||||||||||
Morgan Stanley & Co., Inc.* | $ | 405,457 | $ | (96,152 | ) | $ | (309,305 | ) | $ | – 0 | – | $ | – 0 | – | ||||||
|
|
|
|
|
|
|
|
|
| |||||||||||
Total | $ | 405,457 | $ | (96,152 | ) | $ | (309,305 | ) | $ | – 0 | – | $ | – 0 | – | ||||||
|
|
|
|
|
|
|
|
|
| |||||||||||
| 52 | • AB ALL MARKET REAL RETURN PORTFOLIO |
Notes to Consolidated Financial Statements
Counterparty | Derivative Liabilities Subject to a MA | Derivative Available for Offset | Cash Collateral Pledged** | Security Collateral Pledged** | Net Amount of Derivatives Liabilities | |||||||||||||||
OTC Derivatives: | ||||||||||||||||||||
JPMorgan Chase Bank, NA | $ | 2,697,793 | $ | – 0 | – | $ | – 0 | – | $ | (2,697,793 | ) | $ | – 0 | – | ||||||
Royal Bank of Scotland PLC | 2,123 | – 0 | – | – 0 | – | – 0 | – | 2,123 | ||||||||||||
|
|
|
|
|
|
|
|
|
| |||||||||||
Total | $ | 2,699,916 | $ | – 0 | – | $ | – 0 | – | $ | (2,697,793 | ) | $ | 2,123 | ^ | ||||||
|
|
|
|
|
|
|
|
|
| |||||||||||
| * | Cash has been posted for initial margin requirements for exchange-traded derivatives outstanding at October 31, 2016. |
| ** | The actual collateral received/pledged is more than the amount reported due to over-collateralization. |
| ^ | Net amount represents the net receivable/payable that would be due from/to the counterparty in the event of default or termination. The net amount from OTC financial derivative instruments can only be netted across transactions governed under the same master agreement with the same counterparty. |
2. Currency Transactions
The Portfolio may invest in non-U.S. Dollar-denominated securities on a currency hedged or unhedged basis. The Portfolio may seek investment opportunities by taking long or short positions in currencies through the use of currency-related derivatives, including forward currency exchange contracts, futures and options on futures, swaps, and other options. The Portfolio may enter into transactions for investment opportunities when it anticipates that a foreign currency will appreciate or depreciate in value but securities denominated in that currency are not held by the Portfolio and do not present attractive investment opportunities. Such transactions may also be used when the Adviser believes that it may be more efficient than a direct investment in a foreign currency-denominated security. The Portfolio may also conduct currency exchange contracts on a spot basis (i.e., for cash at the spot rate prevailing in the currency exchange market for buying or selling currencies).
NOTE E
Capital Stock
Each class consists of 3,000,000,000 authorized shares. Transactions in capital shares for each class were as follows:
| Shares | Amount | |||||||||||||||||||||||
| Year Ended October 31, 2016 | Year Ended October 31, 2015 | Year Ended October 31, 2016 | Year Ended October 31, 2015 | |||||||||||||||||||||
|
| |||||||||||||||||||||||
| Class A | ||||||||||||||||||||||||
Shares sold | 245,481 | 374,648 | $ | 1,819,266 | $ | 3,531,705 | ||||||||||||||||||
| ||||||||||||||||||||||||
Shares issued in reinvestment of dividends | 20,294 | 37,166 | 151,390 | 350,845 | ||||||||||||||||||||
| ||||||||||||||||||||||||
Shares redeemed | (648,018 | ) | (1,070,575 | ) | (5,137,204 | ) | (10,041,550 | ) | ||||||||||||||||
| ||||||||||||||||||||||||
Net decrease | (382,243 | ) | (658,761 | ) | $ | (3,166,548 | ) | $ | (6,159,000 | ) | ||||||||||||||
| ||||||||||||||||||||||||
| AB ALL MARKET REAL RETURN PORTFOLIO • | 53 |
Notes to Consolidated Financial Statements
| Shares | Amount | |||||||||||||||||||||||
| Year Ended October 31, 2016 | Year Ended October 31, 2015 | Year Ended October 31, 2016 | Year Ended October 31, 2015 | |||||||||||||||||||||
|
| |||||||||||||||||||||||
| Class C | ||||||||||||||||||||||||
Shares sold | 15,344 | 37,945 | $ | 113,580 | $ | 351,368 | ||||||||||||||||||
| ||||||||||||||||||||||||
Shares issued in reinvestment of dividends | 1,376 | 9,857 | 10,241 | 92,557 | ||||||||||||||||||||
| ||||||||||||||||||||||||
Shares redeemed | (195,134 | ) | (344,737 | ) | (1,449,254 | ) | (3,093,893 | ) | ||||||||||||||||
| ||||||||||||||||||||||||
Net decrease | (178,414 | ) | (296,935 | ) | $ | (1,325,433 | ) | $ | (2,649,968 | ) | ||||||||||||||
| ||||||||||||||||||||||||
| Advisor Class | ||||||||||||||||||||||||
Shares sold | 577,788 | 1,189,217 | $ | 4,275,690 | $ | 10,830,265 | ||||||||||||||||||
| ||||||||||||||||||||||||
Shares issued in reinvestment of dividends | 51,230 | 98,208 | 380,640 | 925,118 | ||||||||||||||||||||
| ||||||||||||||||||||||||
Shares redeemed | (1,306,062 | ) | (3,060,481 | ) | (10,069,125 | ) | (28,495,992 | ) | ||||||||||||||||
| ||||||||||||||||||||||||
Net decrease | (677,044 | ) | (1,773,056 | ) | $ | (5,412,795 | ) | $ | (16,740,609 | ) | ||||||||||||||
| ||||||||||||||||||||||||
| Class R | ||||||||||||||||||||||||
Shares sold | 9,576 | 7,416 | $ | 75,433 | $ | 63,929 | ||||||||||||||||||
| ||||||||||||||||||||||||
Shares issued in reinvestment of dividends | 246 | 442 | 1,815 | 4,154 | ||||||||||||||||||||
| ||||||||||||||||||||||||
Shares redeemed | (5,298 | ) | (5,045 | ) | (42,319 | ) | (45,082 | ) | ||||||||||||||||
| ||||||||||||||||||||||||
Net increase | 4,524 | 2,813 | $ | 34,929 | $ | 23,001 | ||||||||||||||||||
| ||||||||||||||||||||||||
| Class K | ||||||||||||||||||||||||
Shares sold | 67,241 | 62,469 | $ | 523,121 | $ | 557,586 | ||||||||||||||||||
| ||||||||||||||||||||||||
Shares issued in reinvestment of dividends | 3,711 | 5,336 | 27,392 | 50,051 | ||||||||||||||||||||
| ||||||||||||||||||||||||
Shares redeemed | (45,730 | ) | (68,385 | ) | (346,047 | ) | (611,048 | ) | ||||||||||||||||
| ||||||||||||||||||||||||
Net increase (decrease) | 25,222 | (580 | ) | $ | 204,466 | $ | (3,411 | ) | ||||||||||||||||
| ||||||||||||||||||||||||
| Class I | ||||||||||||||||||||||||
Shares sold | 155,919 | 150,454 | $ | 1,213,236 | $ | 1,362,834 | ||||||||||||||||||
| ||||||||||||||||||||||||
Shares issued in reinvestment of dividends | 40,784 | 48,155 | 300,575 | 452,178 | ||||||||||||||||||||
| ||||||||||||||||||||||||
Shares redeemed | (72,018 | ) | (433,520 | ) | (561,598 | ) | (4,392,159 | ) | ||||||||||||||||
| ||||||||||||||||||||||||
Net increase (decrease) | 124,685 | (234,911 | ) | $ | 952,213 | $ | (2,577,147 | ) | ||||||||||||||||
| ||||||||||||||||||||||||
| 54 | • AB ALL MARKET REAL RETURN PORTFOLIO |
Notes to Consolidated Financial Statements
| Shares | Amount | |||||||||||||||||||||||
| Year Ended October 31, 2016 | Year Ended October 31, 2015 | Year Ended October 31, 2016 | Year Ended October 31, 2015 | |||||||||||||||||||||
|
| |||||||||||||||||||||||
| Class 1 | ||||||||||||||||||||||||
Shares sold | 15,020,515 | 18,003,797 | $ | 111,631,381 | $ | 160,040,128 | ||||||||||||||||||
| ||||||||||||||||||||||||
Shares issued in reinvestment of dividends | 1,068,928 | 1,118,730 | 7,835,240 | 10,437,747 | ||||||||||||||||||||
| ||||||||||||||||||||||||
Shares redeemed | (12,789,170 | ) | (9,227,855 | ) | (97,126,550 | ) | (81,519,998 | ) | ||||||||||||||||
| ||||||||||||||||||||||||
Net increase | 3,300,273 | 9,894,672 | $ | 22,340,071 | $ | 88,957,877 | ||||||||||||||||||
| ||||||||||||||||||||||||
| Class Z | ||||||||||||||||||||||||
Shares sold | 790,016 | 563,425 | $ | 6,161,358 | $ | 4,665,612 | ||||||||||||||||||
| ||||||||||||||||||||||||
Shares issued in reinvestment of dividends | 22,111 | – 0 | – | 162,962 | – 0 | – | ||||||||||||||||||
| ||||||||||||||||||||||||
Shares redeemed | (145,833 | ) | (174,072 | ) | (1,116,445 | ) | (1,445,720 | ) | ||||||||||||||||
| ||||||||||||||||||||||||
Net increase | 666,294 | 389,353 | $ | 5,207,875 | $ | 3,219,892 | ||||||||||||||||||
| ||||||||||||||||||||||||
There were no transactions in capital shares for Class 2 for the years ended October 31, 2016 and October 31, 2015.
NOTE F
Risks Involved in Investing in the Portfolio
Interest Rate Risk and Credit Risk—Interest rate risk is the risk that changes in interest rates will affect the value of the Portfolio’s investments in fixed-income debt securities such as bonds or notes. Increases in interest rates may cause the value of the Portfolio’s investments to decline. Credit risk is the risk that the issuer or guarantor of a debt security, or the counterparty to a derivative contract, will be unable or unwilling to make timely principal and/or interest payments, or to otherwise honor its obligations. The degree of risk for a particular security may be reflected in its credit rating. Credit risk is greater for medium quality and lower-rated securities. Lower-rated debt securities and similar unrated securities (commonly known as “junk bonds”) have speculative elements or are predominantly speculative risks.
Commodity Risk—Investing in commodities and commodity-linked derivative instruments, either directly or through the Subsidiary, may subject the Portfolio to greater volatility than investments in traditional securities. The value of commodity-linked derivative instruments may be affected by changes in overall market movements, commodity index volatility, changes in interest rates, or factors affecting a particular industry or commodity, such as drought, floods, weather, livestock disease, embargoes, tariffs and international economic, political and regulatory developments.
| AB ALL MARKET REAL RETURN PORTFOLIO • | 55 |
Notes to Consolidated Financial Statements
Derivatives Risk—The Portfolio may enter into derivative transactions such as forwards, options, futures and swaps. Derivatives may be illiquid, difficult to price, and leveraged so that small changes may produce disproportionate losses for the Portfolio, and subject to counterparty risk to a greater degree than more traditional investments. Derivatives may result in significant losses, including losses that are far greater than the value of the derivatives reflected on the consolidated statement of assets and liabilities.
Leverage Risk—When the Portfolio borrows money or otherwise leverages its investments, its performance may be volatile because leverage tends to exaggerate the effect of any increase or decrease in the value of the Portfolio’s investments. The Portfolio may create leverage through the use of reverse repurchase arrangements, forward currency exchange contracts, forward commitments, dollar rolls or futures or by borrowing money. The use of derivative instruments by the Portfolio, such as forwards, futures, options and swaps, may also result in a form of leverage. Leverage may result in higher returns to the Portfolio than if the Portfolio were not leveraged, but may also adversely affect returns, particularly if the market is declining.
Liquidity Risk—Liquidity risk occurs when particular investments are difficult to purchase or sell. Difficulty in selling less liquid securities may result in sales at disadvantageous prices affecting the value of your investment in the Portfolio. Causes of liquidity risk may include low trading volumes and large positions. Foreign fixed-income securities may have more liquidity risk because secondary trading markets for these securities may be smaller and less well-developed and the securities may trade less frequently. Liquidity risk may be higher in a rising interest rate environment, when the value and liquidity of fixed-income securities generally go down.
Foreign (Non-U.S.) Risk—Investments in securities of non-U.S. issuers may involve more risk than those of U.S. issuers. These securities may fluctuate more widely in price and may be less liquid due to adverse market, economic, political, regulatory or other factors.
Currency Risk—Fluctuations in currency exchange rates may negatively affect the value of the Portfolio’s investments or reduce its returns.
Subsidiary Risk—By investing in the Subsidiary, the Portfolio is indirectly exposed to the risks associated with the Subsidiary’s investments. The derivatives and other investments held by the Subsidiary are generally similar to those that are permitted to be held by the Portfolio and are subject to the same risks that apply to similar investments if held directly by the Portfolio. The Subsidiary is not registered under the Investment
| 56 | • AB ALL MARKET REAL RETURN PORTFOLIO |
Notes to Consolidated Financial Statements
Company Act of 1940, as amended (the “1940 Act”), and, unless otherwise noted in the Portfolio’s prospectus, is not subject to all of the investor protections of the 1940 Act. However, the Portfolio wholly owns and controls the Subsidiary, and the Portfolio and the Subsidiary are managed by the Adviser, making it unlikely the Subsidiary will take actions contrary to the interests of the Portfolio or its shareholders.
Real Estate Risk—The Portfolio’s investments in the real estate market have many of the same risks as direct ownership of real estate, including the risk that the value of real estate could decline due to a variety of factors that affect the real estate market generally. Investments in REITs may have additional risks. REITs are dependent on the capability of their managers, may have limited diversification, and could be significantly affected by changes in taxes.
Diversification Risk—The Portfolio may have more risk because it is “non-diversified”, meaning that it can invest more of its assets in a smaller number of issuers and that adverse changes in the value of one security could have a more significant effect on the Portfolio’s NAV.
Indemnification Risk—In the ordinary course of business, the Portfolio enters into contracts that contain a variety of indemnifications. The Portfolio’s maximum exposure under these arrangements is unknown. However, the Portfolio has not had prior claims or losses pursuant to these indemnification provisions and expects the risk of loss thereunder to be remote.
NOTE G
Joint Credit Facility
A number of open-end mutual funds managed by the Adviser, including the Portfolio, participate in a $280 million revolving credit facility (the “Facility”) intended to provide short-term financing, if necessary, subject to certain restrictions in connection with abnormal redemption activity. Commitment fees related to the Facility are paid by the participating funds and are included in miscellaneous expenses in the consolidated statement of operations. The Portfolio did not utilize the Facility during the year ended October 31, 2016.
NOTE H
Distributions to Shareholders
The tax character of distributions paid during the fiscal years ended October 31, 2016 and October 31, 2015 were as follows:
| 2016 | 2015 | |||||||
Distributions paid from: | ||||||||
Ordinary income | $ | 10,007,572 | $ | 14,402,445 | ||||
|
|
|
| |||||
Total distributions paid | $ | 10,007,572 | $ | 14,402,445 | ||||
|
|
|
| |||||
| AB ALL MARKET REAL RETURN PORTFOLIO • | 57 |
Notes to Consolidated Financial Statements
As of October 31, 2016, the components of accumulated earnings/(deficit) on a tax basis were as follows:
Undistributed ordinary income | $ | 11,854,542 | ||
Accumulated capital and other losses | (72,085,602 | )(a) | ||
Unrealized appreciation/(depreciation) | (139,166,069 | )(b) | ||
|
| |||
Total accumulated earnings/(deficit) | $ | (199,397,129 | ) | |
|
|
| (a) | On October 31, 2016, the Portfolio had a net capital loss carryforward of $72,085,602. |
| (b) | The differences between book-basis and tax-basis unrealized appreciation/(depreciation) are attributable primarily to the tax deferral of losses on wash sales, the tax treatment of passive foreign investment companies (PFICs), the tax treatment of Treasury inflation-protected securities, the realization for tax purposes of gains/losses on certain derivative instruments, the tax treatment of a corporate restructuring, and the tax treatment of earnings from the Subsidiary. |
For tax purposes, net realized capital losses may be carried over to offset future capital gains, if any. Funds are permitted to carry forward capital losses incurred in taxable years beginning after December 22, 2010 for an indefinite period. These post-December 22, 2010 capital losses must be utilized prior to the earlier capital losses, which are subject to expiration. Post-December 22, 2010 capital loss carryforwards will retain their character as either short-term or long-term capital losses rather than being considered short-term as under previous regulation.
As of October 31, 2016, the Portfolio had a net capital loss carryforward of $72,085,602 which will expire as follows:
Short-Term | Long-Term | Expiration | ||
| $6,012,702 | n/a | 2019 | ||
| $24,234,270 | $41,838,630 | No Expiration |
During the current fiscal year, permanent differences primarily due to the tax treatment of futures, swaps and passive foreign investment companies (PFICs), reclassifications of foreign currency and foreign capital gains tax, the book/tax differences associated with the treatment of earnings from the Subsidiary, the tax treatment of a corporate restructuring, the tax treatment of treasury inflation-protected securities, and the tax treatment of partnership investments and contributions from the Adviser resulted in a net increase in undistributed net investment income, a net decrease in accumulated net realized loss on investment and foreign currency transactions, and a net decrease in additional paid-in capital. These reclassifications had no effect on net assets.
NOTE I
New Accounting Pronouncements
In May 2015, the Financial Accounting Standards Board issued an Accounting Standards Update, ASU 2015-07 (the “ASU”) which removes the requirement to categorize within the fair value hierarchy all
| 58 | • AB ALL MARKET REAL RETURN PORTFOLIO |
Notes to Consolidated Financial Statements
investments for which fair value is measured using the net asset value per share practical expedient. The ASU also removes the requirement to make certain disclosures for investments that are eligible to be measured at fair value using the net asset value per share practical expedient but do not utilize that practical expedient. The ASU is effective for annual periods beginning after December 15, 2015 and interim periods within those annual periods. Management has evaluated the implications of these changes and there will be no impact to the financial statements.
NOTE J
Other
In October 2016, the U.S. Securities and Exchange Commission adopted new rules and amended existing rules (together, “final rules”) intended to modernize the reporting and disclosure of information by registered investment companies. In part, the final rules amend Regulation S-X and require standardized, enhanced disclosure about derivatives in investment company financial statements, as well as other amendments. The compliance date for the amendments to Regulation S-X is August 1, 2017. Management is currently evaluating the impact that the adoption of the amendments to Regulation S-X will have on the financial statements and related disclosures.
NOTE K
Subsequent Events
Management has evaluated subsequent events for possible recognition or disclosure in the consolidated financial statements through the date the consolidated financial statements are issued. Management has determined that there are no material events that would require disclosure in the Portfolio’s consolidated financial statements through this date.
| AB ALL MARKET REAL RETURN PORTFOLIO • | 59 |
Notes to Consolidated Financial Statements
CONSOLIDATED FINANCIAL HIGHLIGHTS
Selected Data For A Share Of Capital Stock Outstanding Throughout Each Period
| Class A | ||||||||||||||||||||
| Year Ended October 31, | ||||||||||||||||||||
| 2016 | 2015 | 2014 | 2013 | 2012 | ||||||||||||||||
|
| |||||||||||||||||||
Net asset value, beginning of period | $ 8.13 | $ 10.52 | $ 11.04 | $ 11.33 | $ 11.05 | |||||||||||||||
|
| |||||||||||||||||||
Income From Investment Operations | ||||||||||||||||||||
Net investment income(a)(b) | .10 | .06 | (c) | .12 | �� | .10 | .11 | |||||||||||||
Net realized and unrealized gain (loss) on investment and foreign currency transactions | .11 | (2.26 | ) | (.50 | ) | (.13 | ) | .25 | ||||||||||||
Contributions from Affiliates | .00 | (c) | .00 | (c) | .00 | (c) | – 0 | – | – 0 | – | ||||||||||
|
| |||||||||||||||||||
Net increase (decrease) in net asset value from operations | .21 | (2.20 | ) | (.38 | ) | (.03 | ) | .36 | ||||||||||||
|
| |||||||||||||||||||
Less: Dividends | ||||||||||||||||||||
Dividends from net investment income | (.10 | ) | (.19 | ) | (.14 | ) | (.26 | ) | (.08 | ) | ||||||||||
|
| |||||||||||||||||||
Net asset value, end of period | $ 8.24 | $ 8.13 | $ 10.52 | $ 11.04 | $ 11.33 | |||||||||||||||
|
| |||||||||||||||||||
Total Return | ||||||||||||||||||||
Total investment return based on net asset value(d) | 2.75 | % | (21.16 | )% | (3.45 | )% | (.27 | )% | 3.36 | % | ||||||||||
Ratios/Supplemental Data | ||||||||||||||||||||
Net assets, end of period (000’s omitted) | $13,682 | $16,611 | $28,434 | $64,800 | $67,989 | |||||||||||||||
Ratio to average net assets of: | ||||||||||||||||||||
Expenses, net of waivers/reimbursements | 1.30 | % | 1.30 | % | 1.23 | % | 1.05 | % | 1.05 | % | ||||||||||
Expenses, before waivers/reimbursements | 1.36 | % | 1.47 | % | 1.30 | % | 1.34 | % | 1.28 | % | ||||||||||
Net investment income(b) | 1.23 | % | .62 | % | 1.03 | % | .86 | % | 1.02 | % | ||||||||||
Portfolio turnover rate | 119 | % | 53 | % | 73 | % | 54 | % | 118 | % | ||||||||||
See footnote summary on page 68.
| 60 | • AB ALL MARKET REAL RETURN PORTFOLIO |
Consolidated Financial Highlights
Selected Data For A Share Of Capital Stock Outstanding Throughout Each Period
| Class C | ||||||||||||||||||||
| Year Ended October 31, | ||||||||||||||||||||
| 2016 | 2015 | 2014 | 2013 | 2012 | ||||||||||||||||
|
| |||||||||||||||||||
Net asset value, beginning of period | $ 8.03 | $ 10.40 | $ 10.90 | $ 11.18 | $ 10.93 | |||||||||||||||
|
| |||||||||||||||||||
Income From Investment Operations | ||||||||||||||||||||
Net investment income (loss)(a)(b) | .04 | (.01 | ) | .04 | .02 | .03 | ||||||||||||||
Net realized and unrealized gain (loss) on investment and foreign currency transactions | .12 | (2.23 | ) | (.49 | ) | (.12 | ) | .25 | ||||||||||||
Contributions from Affiliates | .00 | (c) | .00 | (c) | .00 | (c) | – 0 | – | – 0 | – | ||||||||||
|
| |||||||||||||||||||
Net increase (decrease) in net asset value from operations | .16 | (2.24 | ) | (.45 | ) | (.10 | ) | .28 | ||||||||||||
|
| |||||||||||||||||||
Less: Dividends | ||||||||||||||||||||
Dividends from net investment income | (.02 | ) | (.13 | ) | (.05 | ) | (.18 | ) | (.03 | ) | ||||||||||
|
| |||||||||||||||||||
Net asset value, end of period | $ 8.17 | $ 8.03 | $ 10.40 | $ 10.90 | $ 11.18 | |||||||||||||||
|
| |||||||||||||||||||
Total Return | ||||||||||||||||||||
Total investment return based on net asset value(d)† | 2.07 | % | (21.75 | )% | (4.13 | )% | (.92 | )% | 2.58 | % | ||||||||||
Ratios/Supplemental Data | ||||||||||||||||||||
Net assets, end of period (000’s omitted) | $2,814 | $4,202 | $8,531 | $13,063 | $15,974 | |||||||||||||||
Ratio to average net assets of: | ||||||||||||||||||||
Expenses, net of waivers/reimbursements | 2.03 | % | 2.00 | % | 1.93 | % | 1.75 | % | 1.75 | % | ||||||||||
Expenses, before waivers/reimbursements | 2.11 | % | 2.16 | % | 2.02 | % | 2.04 | % | 1.99 | % | ||||||||||
Net investment income (loss)(b) | .51 | % | (.07 | )% | .34 | % | .16 | % | .32 | % | ||||||||||
Portfolio turnover rate | 119 | % | 53 | % | 73 | % | 54 | % | 118 | % | ||||||||||
See footnote summary on page 68.
| AB ALL MARKET REAL RETURN PORTFOLIO • | 61 |
Consolidated Financial Highlights
Selected Data For A Share Of Capital Stock Outstanding Throughout Each Period
| Advisor Class | ||||||||||||||||||||
| Year Ended October 31, | ||||||||||||||||||||
| 2016 | 2015 | 2014 | 2013 | 2012 | ||||||||||||||||
|
| |||||||||||||||||||
Net asset value, beginning of period | $ 8.13 | $ 10.56 | $ 11.09 | $ 11.37 | $ 11.08 | |||||||||||||||
|
| |||||||||||||||||||
Income From Investment Operations | ||||||||||||||||||||
Net investment income(a)(b) | .12 | .09 | .15 | .13 | .15 | |||||||||||||||
Net realized and unrealized gain (loss) on investment and foreign currency transactions | .11 | (2.27 | ) | (.50 | ) | (.12 | ) | .25 | ||||||||||||
Contributions from Affiliates | .00 | (c) | .00 | (c) | .00 | (c) | – 0 | – | – 0 | – | ||||||||||
|
| |||||||||||||||||||
Net increase (decrease) in net asset value from operations | .23 | (2.18 | ) | (.35 | ) | .01 | .40 | |||||||||||||
|
| |||||||||||||||||||
Less: Dividends | ||||||||||||||||||||
Dividends from net investment income | (.14 | ) | (.25 | ) | (.18 | ) | (.29 | ) | (.11 | ) | ||||||||||
|
| |||||||||||||||||||
Net asset value, end of period | $ 8.22 | $ 8.13 | $ 10.56 | $ 11.09 | $ 11.37 | |||||||||||||||
|
| |||||||||||||||||||
Total Return | ||||||||||||||||||||
Total investment return based on net asset value(d) | 3.00 | % | (20.95 | )% | (3.20 | )% | .12 | % | 3.69 | % | ||||||||||
Ratios/Supplemental Data | ||||||||||||||||||||
Net assets, end of period (000’s omitted) | $25,307 | $30,541 | $58,399 | $64,911 | $72,529 | |||||||||||||||
Ratio to average net assets of: | ||||||||||||||||||||
Expenses, net of waivers/reimbursements | 1.04 | % | 1.00 | % | .94 | % | .75 | % | .75 | % | ||||||||||
Expenses, before waivers/reimbursements | 1.10 | % | 1.17 | % | 1.02 | % | 1.04 | % | .99 | % | ||||||||||
Net investment income(b) | 1.51 | % | .95 | % | 1.33 | % | 1.18 | % | 1.33 | % | ||||||||||
Portfolio turnover rate | 119 | % | 53 | % | 73 | % | 54 | % | 118 | % | ||||||||||
See footnote summary on page 68.
| 62 | • AB ALL MARKET REAL RETURN PORTFOLIO |
Consolidated Financial Highlights
Selected Data For A Share Of Capital Stock Outstanding Throughout Each Period
| Class R | ||||||||||||||||||||
| Year Ended October 31, | ||||||||||||||||||||
| 2016 | 2015 | 2014 | 2013 | 2012 | ||||||||||||||||
|
| |||||||||||||||||||
Net asset value, beginning of period | $ 8.06 | $ 10.51 | $ 11.04 | $ 11.32 | $ 11.02 | |||||||||||||||
|
| |||||||||||||||||||
Income From Investment Operations | ||||||||||||||||||||
Net investment income(a)(b) | .07 | .04 | .15 | .08 | .09 | |||||||||||||||
Net realized and unrealized gain (loss) on investment and foreign currency transactions | .11 | (2.24 | ) | (.55 | ) | (.13 | ) | .26 | ||||||||||||
Contributions from Affiliates | .00 | (c) | .00 | (c) | .00 | (c) | – 0 | – | – 0 | – | ||||||||||
|
| |||||||||||||||||||
Net increase (decrease) in net asset value from operations | .18 | (2.20 | ) | (.40 | ) | (.05 | ) | .35 | ||||||||||||
|
| |||||||||||||||||||
Less: Dividends | ||||||||||||||||||||
Dividends from net investment income | (.10 | ) | (.25 | ) | (.13 | ) | (.23 | ) | (.05 | ) | ||||||||||
|
| |||||||||||||||||||
Net asset value, end of period | $ 8.14 | $ 8.06 | $ 10.51 | $ 11.04 | $ 11.32 | |||||||||||||||
|
| |||||||||||||||||||
Total Return | ||||||||||||||||||||
Total investment return based on net asset value(d)† | 2.41 | % | (21.37 | )% | (3.66 | )% | (.47 | )% | 3.20 | % | ||||||||||
Ratios/Supplemental Data | ||||||||||||||||||||
Net assets, end of period (000’s omitted) | $201 | $162 | $182 | $38 | $17 | |||||||||||||||
Ratio to average net assets of: | ||||||||||||||||||||
Expenses, net of waivers/reimbursements | 1.54 | % | 1.50 | % | 1.44 | % | 1.25 | % | 1.25 | % | ||||||||||
Expenses, before waivers/reimbursements | 1.66 | % | 1.64 | % | 1.55 | % | 1.65 | % | 1.64 | % | ||||||||||
Net investment income(b) | .91 | % | .42 | % | 1.36 | % | .76 | % | .82 | % | ||||||||||
Portfolio turnover rate | 119 | % | 53 | % | 73 | % | 54 | % | 118 | % | ||||||||||
See footnote summary on page 68.
| AB ALL MARKET REAL RETURN PORTFOLIO • | 63 |
Consolidated Financial Highlights
Selected Data For A Share Of Capital Stock Outstanding Throughout Each Period
| Class K | ||||||||||||||||||||
| Year Ended October 31, | ||||||||||||||||||||
| 2016 | 2015 | 2014 | 2013 | 2012 | ||||||||||||||||
|
| |||||||||||||||||||
Net asset value, beginning of period | $ 8.07 | $ 10.50 | $ 11.03 | $ 11.32 | $ 11.05 | |||||||||||||||
|
| |||||||||||||||||||
Income From Investment Operations | ||||||||||||||||||||
Net investment income(a)(b) | .10 | .06 | .12 | .10 | .10 | |||||||||||||||
Net realized and unrealized gain (loss) on investment and foreign currency transactions | .11 | (2.25 | ) | (.49 | ) | (.12 | ) | .27 | ||||||||||||
Contributions from Affiliates | .00 | (c) | .00 | (c) | .00 | (c) | – 0 | – | – 0 | – | ||||||||||
|
| |||||||||||||||||||
Net increase (decrease) in net asset value from operations | .21 | (2.19 | ) | (.37 | ) | (.02 | ) | .37 | ||||||||||||
|
| |||||||||||||||||||
Less: Dividends | ||||||||||||||||||||
Dividends from net investment income | (.13 | ) | (.24 | ) | (.16 | ) | (.27 | ) | (.10 | ) | ||||||||||
|
| |||||||||||||||||||
Net asset value, end of period | $ 8.15 | $ 8.07 | $ 10.50 | $ 11.03 | $ 11.32 | |||||||||||||||
|
| |||||||||||||||||||
Total Return | ||||||||||||||||||||
Total investment return based on net asset value(d) | 2.81 | % | (21.19 | )% | (3.39 | )% | (.19 | )% | 3.43 | % | ||||||||||
Ratios/Supplemental Data | ||||||||||||||||||||
Net assets, end of period (000’s omitted) | $1,888 | $1,668 | $2,174 | $1,684 | $1,286 | |||||||||||||||
Ratio to average net assets of: | ||||||||||||||||||||
Expenses, net of waivers/reimbursements | 1.29 | % | 1.25 | % | 1.19 | % | 1.00 | % | 1.00 | % | ||||||||||
Expenses, before waivers/reimbursements | 1.35 | % | 1.34 | % | 1.24 | % | 1.33 | % | 1.35 | % | ||||||||||
Net investment income(b) | 1.23 | % | .67 | % | 1.10 | % | .95 | % | .89 | % | ||||||||||
Portfolio turnover rate | 119 | % | 53 | % | 73 | % | 54 | % | 118 | % | ||||||||||
See footnote summary on page 68.
| 64 | • AB ALL MARKET REAL RETURN PORTFOLIO |
Consolidated Financial Highlights
Selected Data For A Share Of Capital Stock Outstanding Throughout Each Period
| Class I | ||||||||||||||||||||
| Year Ended October 31, | ||||||||||||||||||||
| 2016 | 2015 | 2014 | 2013 | 2012 | ||||||||||||||||
|
| |||||||||||||||||||
Net asset value, beginning of period | $ 8.11 | $ 10.54 | $ 11.07 | $ 11.36 | $ 11.07 | |||||||||||||||
|
| |||||||||||||||||||
Income From Investment Operations | ||||||||||||||||||||
Net investment income(a) | .12 | (b) | .09 | .15 | .13 | (b) | .14 | (b) | ||||||||||||
Net realized and unrealized gain (loss) on investment and foreign currency transactions | .11 | (2.25 | ) | (.49 | ) | (.13 | ) | .26 | ||||||||||||
Contributions from Affiliates | .00 | (c) | .00 | (c) | .00 | (c) | – 0 | – | – 0 | – | ||||||||||
|
| |||||||||||||||||||
Net increase (decrease) in net asset value from operations | .23 | (2.16 | ) | (.34 | ) | – 0 | – | .40 | ||||||||||||
|
| |||||||||||||||||||
Less: Dividends | ||||||||||||||||||||
Dividends from net investment income | (.17 | ) | (.27 | ) | (.19 | ) | (.29 | ) | (.11 | ) | ||||||||||
|
| |||||||||||||||||||
Net asset value, end of period | $ 8.17 | $ 8.11 | $ 10.54 | $ 11.07 | $ 11.36 | |||||||||||||||
|
| |||||||||||||||||||
Total Return | ||||||||||||||||||||
Total investment return based on net asset value(d)† | 3.03 | % | (20.97 | )% | (3.09 | )% | .04 | % | 3.69 | % | ||||||||||
Ratios/Supplemental Data | ||||||||||||||||||||
Net assets, end of period (000’s omitted) | $15,646 | $14,508 | $21,341 | $19,303 | $18,790 | |||||||||||||||
Ratio to average net assets of: | ||||||||||||||||||||
Expenses, net of waivers/reimbursements | .91 | % | .96 | % | .91 | % | .75 | % | .75 | % | ||||||||||
Expenses, before waivers/reimbursements | .92 | % | .96 | % | .91 | % | .97 | % | .98 | % | ||||||||||
Net investment income | 1.61 | %(b) | .99 | % | 1.37 | % | 1.17 | %(b) | 1.32 | %(b) | ||||||||||
Portfolio turnover rate | 119 | % | 53 | % | 73 | % | 54 | % | 118 | % | ||||||||||
See footnote summary on page 68.
| AB ALL MARKET REAL RETURN PORTFOLIO • | 65 |
Consolidated Financial Highlights
Selected Data For A Share Of Capital Stock Outstanding Throughout Each Period
| Class 1 | ||||||||||||||||||||
| Year Ended October 31, | ||||||||||||||||||||
| 2016 | 2015 | 2014 | 2013 | 2012 | ||||||||||||||||
|
| |||||||||||||||||||
Net asset value, beginning of period | $ 8.05 | $ 10.46 | $ 11.00 | $ 11.29 | $ 11.01 | |||||||||||||||
|
| |||||||||||||||||||
Income From Investment Operations | ||||||||||||||||||||
Net investment income(a) | .11 | (b) | .07 | .13 | .10 | (b) | .12 | (b) | ||||||||||||
Net realized and unrealized gain (loss) on investment and foreign currency transactions | .10 | (2.24 | ) | (.50 | ) | (.12 | ) | .25 | ||||||||||||
Contributions from Affiliates | .00 | (c) | .00 | (c) | .00 | (c) | – 0 | – | – 0 | – | ||||||||||
|
| |||||||||||||||||||
Net increase (decrease) in net asset value from operations | .21 | (2.17 | ) | (.37 | ) | (.02 | ) | .37 | ||||||||||||
|
| |||||||||||||||||||
Less: Dividends | ||||||||||||||||||||
Dividends from net investment income | (.15 | ) | (.24 | ) | (.17 | ) | (.27 | ) | (.09 | ) | ||||||||||
|
| |||||||||||||||||||
Net asset value, end of period | $ 8.11 | $ 8.05 | $ 10.46 | $ 11.00 | $ 11.29 | |||||||||||||||
|
| |||||||||||||||||||
Total Return | ||||||||||||||||||||
Total investment return based on net asset value(d)† | 2.82 | % | (21.12 | )% | (3.35 | )% | (.19 | )% | 3.47 | % | ||||||||||
Ratios/Supplemental Data | ||||||||||||||||||||
Net assets, end of period (000’s omitted) | $505,143 | $474,631 | $513,633 | $420,593 | $221,971 | |||||||||||||||
Ratio to average net assets of: | ||||||||||||||||||||
Expenses, net of waivers/reimbursements | 1.15 | % | 1.16 | % | 1.14 | % | 1.00 | % | 1.00 | % | ||||||||||
Expenses, before waivers/reimbursements | 1.16 | % | 1.16 | % | 1.14 | % | 1.16 | % | 1.21 | % | ||||||||||
Net investment income | 1.38 | %(b) | .79 | % | 1.16 | % | .95 | %(b) | 1.07 | %(b) | ||||||||||
Portfolio turnover rate | 119 | % | 53 | % | 73 | % | 54 | % | 118 | % | ||||||||||
See footnote summary on page 68.
| 66 | • AB ALL MARKET REAL RETURN PORTFOLIO |
Consolidated Financial Highlights
Selected Data For A Share Of Capital Stock Outstanding Throughout Each Period
| Class 2 | ||||||||||||||||||||
| Year Ended October 31, | ||||||||||||||||||||
| 2016 | 2015 | 2014 | 2013 | 2012 | ||||||||||||||||
|
| |||||||||||||||||||
Net asset value, beginning of period | $ 8.22 | $ 10.68 | $ 11.19 | $ 11.48 | $ 11.07 | |||||||||||||||
|
| |||||||||||||||||||
Income From Investment Operations | ||||||||||||||||||||
Net investment income(a) | .13 | (b) | .09 | .15 | .13 | (b) | .15 | (b) | ||||||||||||
Net realized and unrealized gain (loss) on investment and foreign currency transactions | .11 | (2.28 | ) | (.50 | ) | (.12 | ) | .26 | ||||||||||||
Contributions from Affiliates | .00 | (c) | .00 | (c) | .00 | (c) | – 0 | – | – 0 | – | ||||||||||
|
| |||||||||||||||||||
Net increase (decrease) in net asset value from operations | .24 | (2.19 | ) | (.35 | ) | .01 | .41 | |||||||||||||
|
| |||||||||||||||||||
Less: Dividends | ||||||||||||||||||||
Dividends from net investment income | (.17 | ) | (.27 | ) | (.16 | ) | (.30 | ) | – 0 | – | ||||||||||
|
| |||||||||||||||||||
Net asset value, end of period | $ 8.29 | $ 8.22 | $ 10.68 | $ 11.19 | $ 11.48 | |||||||||||||||
|
| |||||||||||||||||||
Total Return | ||||||||||||||||||||
Total investment return based on net asset value(d) | 3.17 | % | (20.85 | )% | (3.12 | )% | .05 | % | 3.70 | % | ||||||||||
Ratios/Supplemental Data | ||||||||||||||||||||
Net assets, end of period (000’s omitted) | $8 | $8 | $11 | $11 | $11 | |||||||||||||||
Ratio to average net assets of: | ||||||||||||||||||||
Expenses, net of waivers/reimbursements | .90 | % | .92 | % | .89 | % | .75 | % | .75 | % | ||||||||||
Expenses, before waivers/reimbursements | .90 | % | .92 | % | .89 | % | 1.93 | % | .96 | % | ||||||||||
Net investment income | 1.60 | %(b) | .92 | % | 1.36 | % | 1.16 | %(b) | 1.32 | %(b) | ||||||||||
Portfolio turnover rate | 119 | % | 53 | % | 73 | % | 54 | % | 118 | % | ||||||||||
See footnote summary on page 68.
| AB ALL MARKET REAL RETURN PORTFOLIO • | 67 |
Consolidated Financial Highlights
Selected Data For A Share Of Capital Stock Outstanding Throughout Each Period
| Class Z | ||||||||||||
| Year Ended October 31, | January 31, 2014(e) to October 31, 2014 | |||||||||||
| 2016 | 2015 | |||||||||||
|
| |||||||||||
Net asset value, beginning of period | $ 8.11 | $ 10.55 | $ 10.53 | |||||||||
|
| |||||||||||
Income From Investment Operations | ||||||||||||
Net investment income(a) | .12 | (b) | .07 | .13 | ||||||||
Net realized and unrealized gain (loss) on investment and foreign currency transactions | .11 | (2.24 | ) | (.11 | ) | |||||||
Contributions from Affiliates(c) | .00 | .00 | .00 | |||||||||
|
| |||||||||||
Net increase (decrease) in net asset value from operations | .23 | (2.17 | ) | .02 | ||||||||
|
| |||||||||||
Less: Dividends | ||||||||||||
Dividends from net investment income | (.17 | ) | (.27 | ) | – 0 | – | ||||||
|
| |||||||||||
Net asset value, end of period | $ 8.17 | $ 8.11 | $ 10.55 | |||||||||
|
| |||||||||||
Total Return | ||||||||||||
Total investment return based on net asset value(d) | 3.09 | % | (20.94 | )% | .19 | % | ||||||
Ratios/Supplemental Data | ||||||||||||
Net assets, end of period (000’‘s omitted) | $8,634 | $3,166 | $10 | |||||||||
Ratio to average net assets of: | ||||||||||||
Expenses, net of waivers/reimbursements | .92 | % | .96 | % | .88 | %^ | ||||||
Expenses, before waivers/reimbursements | .92 | % | .96 | % | .88 | %^ | ||||||
Net investment income | 1.56 | %(b) | .92 | % | 1.59 | %^ | ||||||
Portfolio turnover rate | 119 | % | 53 | % | 73 | % | ||||||
| (a) | Based on average shares outstanding. |
| (b) | Net of fees and expenses waived/reimbursed by the Adviser. |
| (c) | Amount is less than $.005. |
| (d) | Total investment return is calculated assuming an initial investment made at the net asset value at the beginning of the period, reinvestment of all dividends and distributions at net asset value during the period, and redemption on the last day of the period. Initial sales charges or contingent deferred sales charges are not reflected in the calculation of total investment return. Total return does not reflect the deduction of taxes that a shareholder would pay on fund distributions or the redemption of fund shares. Total investment return calculated for a period of less than one year is not annualized. |
| (e) | Commencement of distributions. |
| ^ | Annualized. |
| † | The net asset value and total return include adjustments in accordance with accounting principles generally accepted in the United States of America for financial reporting purposes. As such, the net asset value and total return for shareholder transactions may differ from financial statements. |
See notes to consolidated financial statements.
| 68 | • AB ALL MARKET REAL RETURN PORTFOLIO |
Consolidated Financial Highlights
REPORT OF INDEPENDENT REGISTERED
PUBLIC ACCOUNTING FIRM
To the Board of Directors and Shareholders of the AB All Market Real Return Portfolio
We have audited the accompanying consolidated statement of assets and liabilities, including the consolidated portfolio of investments, of AB All Market Real Return Portfolio (the “Fund”), one of the portfolios constituting AB Bond Fund, Inc., as of October 31, 2016, and the related consolidated statement of operations for the year then ended, the consolidated statements of changes in net assets for each of the two years in the period then ended and the consolidated financial highlights for each of the periods indicated therein. These financial statements and financial highlights are the responsibility of the Fund’s management. Our responsibility is to express an opinion on these financial statements and financial highlights based on our audits.
We conducted our audits in accordance with the standards of the Public Company Accounting Oversight Board (United States). Those standards require that we plan and perform the audit to obtain reasonable assurance about whether the financial statements and financial highlights are free of material misstatement. We were not engaged to perform an audit of the Fund’s internal control over financial reporting. Our audit included consideration of internal control over financial reporting as a basis for designing audit procedures that are appropriate in the circumstances, but not for the purpose of expressing an opinion on the effectiveness of the Fund’s internal control over financial reporting. Accordingly, we express no such opinion. An audit also includes examining, on a test basis, evidence supporting the amounts and disclosures in the financial statements and financial highlights, assessing the accounting principles used and significant estimates made by management, and evaluating the overall financial statement presentation. Our procedures included confirmation of securities owned as of October 31, 2016, by correspondence with the custodian and others or by other appropriate auditing procedures where replies from others were not received. We believe that our audits provide a reasonable basis for our opinion.
In our opinion, the financial statements and financial highlights referred to above present fairly, in all material respects, the consolidated financial position of AB All Market Real Return Portfolio, one of the portfolios constituting the AB Bond Fund, Inc., at October 31, 2016, the consolidated results of its operations for the year then ended, the consolidated changes in its net assets for each of the two years in the period then ended and the consolidated financial highlights for each of the periods indicated therein, in conformity with U.S. generally accepted accounting principles.

New York, New York
December 30, 2016
| AB ALL MARKET REAL RETURN PORTFOLIO • | 69 |
Report of Independent Registered Public Accounting Firm
2016 FEDERAL TAX INFORMATION
(unaudited)
For Federal income tax purposes, the following information is furnished with respect to the distributions paid by the Portfolio during the taxable year ended October 31, 2016. For corporate shareholders, 27.29% of dividends paid qualify for the dividends received deduction.
For the taxable year ended October 31, 2016, the Portfolio designates $8,934,496 as the maximum amount that may be considered qualified dividend income for individual shareholders.
Shareholders should not use the above information to prepare their income tax returns. The information necessary to complete your income tax returns will be included with your Form 1099-DIV which will be sent to you separately in January 2017.
| 70 | • AB ALL MARKET REAL RETURN PORTFOLIO |
BOARD OF DIRECTORS
Marshall C. Turner, Jr.(1), Chairman John H. Dobkin(1) Michael J. Downey(1) William H. Foulk, Jr.(1) D. James Guzy(1) Nancy P. Jacklin(1) | Robert M. Keith, President and Chief Executive Officer Carol C. McMullen(1) Garry L. Moody(1) Earl D. Weiner(1) |
OFFICERS
Philip L. Kirstein, Senior Vice President and Independent Compliance Officer Daniel J. Loewy(2), Vice President Vinod Chathlani(2), Vice President Vadim Zlotnikov(2), Vice President | Emilie D. Wrapp, Secretary Joseph J. Mantineo, Treasurer and Chief Financial Officer Phyllis J. Clarke, Controller Vincent S. Noto, Chief Compliance Officer |
Custodian and Accounting Agent State Street Bank and Trust Company State Street Corporation CCB/5 1 Iron Street Boston, MA 02210
Principal Underwriter AllianceBernstein Investments, Inc. 1345 Avenue of the Americas New York, NY 10105
Transfer Agent AllianceBernstein Investor Services, Inc. P.O. Box 786003 San Antonio, TX 78278-6003 Toll-Free (800) 221-5672 | Independent Registered Public Ernst & Young LLP 5 Times Square New York, NY 10036
Legal Counsel Seward & Kissel LLP One Battery Park Plaza New York, NY 10004 |
| (1) | Member of the Audit Committee, the Governance and Nominating Committee, and the Independent Directors Committee. |
| (2) | The day-to-day management of, and investment decisions for, the Fund’s portfolio are made by the Adviser’s All Market Real Return Portfolio Team. Messrs. Loewy, Chathlani and Zlotnikov are the investment professionals with the most significant responsibility for the day-to-day management of the Fund’s portfolio. |
| AB ALL MARKET REAL RETURN PORTFOLIO • | 71 |
Board of Directors
MANAGEMENT OF THE FUND
Board of Directors Information
The business and affairs of the Strategy are managed under the direction of the Board of Directors. Certain information concerning the Strategy’s Directors is set forth below.
| NAME, ADDRESS*, AGE, (YEAR FIRST ELECTED**) | PRINCIPAL OCCUPATION(S) DURING PAST FIVE YEARS AND OTHER INFORMATION*** | PORTFOLIOS IN FUND COMPLEX DIRECTOR | OTHER PUBLIC COMPANY | |||||
| INTERESTED DIRECTOR | ||||||||
Robert M. Keith, # 1345 Avenue of the Americas (2010) | Senior Vice President of AllianceBernstein L.P. (the “Adviser”) and the head of AllianceBernstein Investments, Inc. (“ABI”) since July 2008; Director of ABI and President of the AB Mutual Funds. Previously, he served as Executive Managing Director of ABI from December 2006 to June 2008. Prior to joining ABI in 2006, Executive Managing Director of Bernstein Global Wealth Management, and prior thereto, Senior Managing Director and Global Head of Client Service and Sales of the Adviser’s institutional investment management business since 2004. Prior thereto, he was Managing Director and Head of North American Client Service and Sales in the Adviser’s institutional investment management business, with which he had been associated since prior to 2004. | 108 | None | |||||
| 72 | • AB ALL MARKET REAL RETURN PORTFOLIO |
Management of the Fund
| NAME, ADDRESS*, AGE, (YEAR FIRST ELECTED**) | PRINCIPAL OCCUPATION(S) DURING PAST FIVE YEARS AND OTHER INFORMATION*** | PORTFOLIOS IN FUND COMPLEX DIRECTOR | OTHER PUBLIC COMPANY | |||||
| DISINTERESTED DIRECTORS | ||||||||
Marshall C. Turner, Jr., ## Chairman of the Board 75 (2005) | Private Investor since prior to 2011. Former Chairman and CEO of Dupont Photomasks, Inc. (components of semi- conductor manufacturing). He has extensive operating leadership, and venture capital investing experience, including five interim or full-time CEO roles, and prior service as general partner of institutional venture capital partnerships. He also has extensive non-profit board leadership experience, and currently serves on the boards of two education and science-related non-profit organizations. He has served as a director of one AB Fund since 1992, and director or trustee of multiple AB Funds since 2005. He has been Chairman of the AB Funds since January 2014, and the Chairman of the Independent Directors Committees of such AB Funds since February 2014. | 108 | Xilinx, Inc. (programmable logic semi- conductors) since 2007 | |||||
John H. Dobkin, ## 74 (1998) | Independent Consultant since prior to 2011. Formerly, President of Save Venice, Inc. (preservation organization) from 2001-2002; Senior Advisor from June 1999-June 2000 and President of Historic Hudson Valley (historic preservation) from December 1989-May 1999. Previously, Director of the National Academy of Design. He has served as a director or trustee of various AB Funds since 1992 and as Chairman of the Audit Committees of a number of such AB Funds from 2001-2008. | 108 | None | |||||
| AB ALL MARKET REAL RETURN PORTFOLIO • | 73 |
Management of the Fund
| NAME, ADDRESS*, AGE, (YEAR FIRST ELECTED**) | PRINCIPAL OCCUPATION(S) DURING PAST FIVE YEARS AND OTHER INFORMATION*** | PORTFOLIOS IN FUND COMPLEX DIRECTOR | OTHER PUBLIC COMPANY | |||||
DISINTERESTED DIRECTORS (continued) | ||||||||
Michael J. Downey, ## 72 (2005) | Private Investor since prior to 2011. Formerly, managing partner of Lexington Capital, LLC (investment advisory firm) from December 1997 until December 2003. He served as a Director of Prospect Acquisition Corp. (financial services) from 2007 until 2009. From 1987 until 1993, Chairman and CEO of Prudential Mutual Fund Management, director of the Prudential mutual funds, and member of the Executive Committee of Prudential Securities Inc. He has served as a director or trustee of the AB Funds since 2005 and is a director and Chairman of one other registered investment company. | 108 | Asia Pacific Fund, Inc. (registered investment company) since prior to 2011 | |||||
William H. Foulk, Jr., ## 84 (1998) | Investment Adviser and an Independent Consultant since prior to 2011. Previously, he was Senior Manager of Barrett Associates, Inc., a registered investment adviser. He was formerly Deputy Comptroller and Chief Investment Officer of the State of New York and, prior thereto, Chief Investment Officer of the New York Bank for Savings. He has served as a director or trustee of various AB Funds since 1983, and was Chairman of the Independent Directors Committees of the AB Funds from 2003 until early February 2014. He served as Chairman of such AB Funds from 2003 through December 2013. He is also active in a number of mutual fund related organizations and committees. | 108 | None | |||||
| 74 | • AB ALL MARKET REAL RETURN PORTFOLIO |
Management of the Fund
| NAME, ADDRESS*, AGE, (YEAR FIRST ELECTED**) | PRINCIPAL OCCUPATION(S) DURING PAST FIVE YEARS AND OTHER INFORMATION*** | PORTFOLIOS IN FUND COMPLEX DIRECTOR | OTHER PUBLIC COMPANY | |||||
DISINTERESTED DIRECTORS (continued) | ||||||||
D. James Guzy, ## 80 (2005) | Chairman of the Board of SRC Computers, Inc. (semi-conductors), with which he has been associated since prior to 2011. He served as Chairman of the Board of PLX Technology (semi-conductors) since prior to 2011 until November 2013. He was a Director of Intel Corporation (semi-conductors) from 1969 until 2008, and served as Chairman of the Finance Committee of such company for several years until May 2008. He has served as a director or trustee of one or more of the AB Funds since 1982. | 108 | None | |||||
Nancy P. Jacklin, ## 68 (2006) | Private Investor since prior to 2011. Professorial Lecturer at the Johns Hopkins School of Advanced International Studies (2008-2015); U.S. Executive Director of the International Monetary Fund (which is responsible for ensuring the stability of the international monetary system), (December 2002-May 2006); Partner, Clifford Chance ( 1992-2002); Sector Counsel, International Banking and Finance, and Associate General Counsel, Citicorp (1985-1992); Assistant General Counsel (International), Federal Reserve Board of Governors (1982-1985); and Attorney Advisor, U.S. Department of the Treasury (1973-1982). Member of the Bar of the District of Columbia and of New York; and member of the Council on Foreign Relations. She has served as a director or trustee of the AB Funds since 2006 and has been Chairman of the Governance and Nominating Committees of the AB Funds since August 2014. | 108 | None | |||||
| AB ALL MARKET REAL RETURN PORTFOLIO • | 75 |
Management of the Fund
| NAME, ADDRESS*, AGE, (YEAR FIRST ELECTED**) | PRINCIPAL OCCUPATION(S) DURING PAST FIVE YEARS AND OTHER INFORMATION*** | PORTFOLIOS IN FUND COMPLEX DIRECTOR | OTHER PUBLIC COMPANY | |||||
DISINTERESTED DIRECTORS (continued) | ||||||||
Carol C. McMullen, ## 61 (2016) | Managing Director of Slalom Consulting (consulting) since 2014 and private investor; Director of Norfolk & Dedham Group (mutual property and casualty insurance) since 2011; and Director of Partners Community Physicians Organization (healthcare) since 2014. Formerly, Managing Director of The Crossland Group (consulting) from 2012 to 2013. She has held a number of senior positions in the asset and wealth management industries, including at Eastern Bank (where her roles included President of Eastern Wealth Management), Thomson Financial (Global Head of Sales for Investment Management), and Putnam Investments (where her roles included Head of Global Investment Research). She has served on a number of private company and nonprofit boards, and as a director or trustee of the AB Funds since June 2016. | 108 | None | |||||
| 76 | • AB ALL MARKET REAL RETURN PORTFOLIO |
Management of the Fund
| NAME, ADDRESS*, AGE, (YEAR FIRST ELECTED**) | PRINCIPAL OCCUPATION(S) DURING PAST FIVE YEARS AND OTHER INFORMATION*** | PORTFOLIOS IN FUND COMPLEX DIRECTOR | OTHER PUBLIC COMPANY | |||||
DISINTERESTED DIRECTORS (continued) | ||||||||
Garry L. Moody, ## 64 (2008) | Independent Consultant. Formerly, Partner, Deloitte & Touche LLP (1995-2008) where he held a number of senior positions, including Vice Chairman, and U.S. and Global Investment Management Practice Managing Partner; President, Fidelity Accounting and Custody Services Company (1993-1995), where he was responsible for accounting, pricing, custody and reporting for the Fidelity mutual funds; and Partner, Ernst & Young LLP (1975- 1993), where he served as the National Director of Mutual Fund Tax Services and Managing Partner of its Chicago Office Tax department. He is a member of the Trustee Advisory Board of BoardIQ, a biweekly publication focused on issues and news affecting directors of mutual funds. He has served as a director or trustee, and as Chairman of the Audit Committees of the AB Funds since 2008. | 108 | None | |||||
Earl D. Weiner, ## 77 (2007) | Of Counsel, and Partner prior to January 2007, of the law firm Sullivan & Cromwell LLP, and is a former member of the ABA Federal Regulation of Securities Committee Task Force to draft editions of the Fund Director’s Guidebook. He also serves as a director or trustee of various non-profit organizations and has served as Chairman or Vice Chairman of a number of them. He has served as a director or trustee of the AB Funds since 2007 and served as Chairman of the Governance and Nominating Committees of the AB Funds from 2007 until August 2014. | 108 | None | |||||
| AB ALL MARKET REAL RETURN PORTFOLIO • | 77 |
Management of the Fund
| * | The address for each of the Strategy’s disinterested Directors is c/o AllianceBernstein L.P., Attention: Philip L. Kirstein, 1345 Avenue of the Americas, New York, NY 10105. |
| ** | There is no stated term of office for the Strategy’s Directors. |
| *** | The information above includes each Director’s principal occupation during the last five years and other information relating to the experience, attributes and skills relevant to each Director’s qualifications to serve as a Director, which led to the conclusion that each Director should serve as a Director for the Strategy. |
| # | Mr. Keith is an “interested person” of the Strategy as defined in the “40 Act”, due to his position as a Senior Vice President of the Adviser. |
| ## | Member of the Audit Committee, the Governance and Nominating Committee and the Independent Directors Committee. |
| 78 | • AB ALL MARKET REAL RETURN PORTFOLIO |
Management of the Fund
Officer Information
Certain information concerning the Strategy’s Officers is listed below.
| NAME, ADDRESS* AND AGE | PRINCIPAL POSITION(S) HELD WITH FUND | PRINCIPAL OCCUPATION DURING PAST 5 YEARS | ||
Robert M. Keith 56 | President and Chief Executive Officer | See biography above. | ||
Philip L. Kirstein 71 | Senior Vice President and Independent Compliance Officer | Senior Vice President and Independent Compliance Officer of the AB Funds, with which he has been associated since October 2004. Prior thereto, he was Of Counsel to Kirkpatrick & Lockhart, LLP from October 2003 to October 2004, and General Counsel of Merrill Lynch Investment Managers, L.P. since prior to March 2003. | ||
Daniel J. Loewy 42 | Senior Vice President | Senior Vice President of the Adviser,** with which he has been associated since prior to 2011. | ||
Vadim Zlotnikov 54 | Senior Vice President | Senior Vice President of the Adviser,** with which he has been associated since prior to 2011. | ||
Vinod Chathlani 33 | Vice President | Vice President of the Adviser,** with which he has been associated since December 2013. Prior thereto, he was a risk analyst at Oppenheimer Funds and a corporate investment strategist at Reliance Communications since prior to 2011. | ||
Emilie D. Wrapp 61 | Secretary | Senior Vice President, Assistant General Counsel and Assistant Secretary of ABI,** with which she has been associated since prior to 2011. | ||
Joseph J. Mantineo 57 | Treasurer and Chief Financial Officer | Senior Vice President of AllianceBernstein Investor Services, Inc, (“ABIS”),** with which he has been associated since prior to 2011. | ||
Phyllis J. Clarke 55 | Controller | Vice President of ABIS,** with which she has been associated since prior to 2011. | ||
Vincent S. Noto 52 | Chief Compliance Officer | Senior Vice President since 2015 and Mutual Fund Chief Compliance Officer of the Adviser** since 2014. Prior thereto, he was Vice President and Director of Mutual Fund Compliance of the Adviser** since prior to 2011. |
| * | The address for each of the Fund’s Officers is 1345 Avenue of the Americas, New York, NY 10105. |
| ** | The Adviser, ABI and ABIS are affiliates of the Strategy. |
| The Fund’s Statement of Additional Information (“SAI”) has additional information about the Strategy’s Directors and Officers and is available without charge upon request. Contact your financial representative or AB at 1-800-227-4618, or visit www.abfunds.com, for a free prospectus or SAI. |
| AB ALL MARKET REAL RETURN PORTFOLIO • | 79 |
Management of the Fund
Information Regarding the Review and Approval of the Portfolio’s Investment Advisory Contract
The disinterested directors (the “directors”) of AB Bond Fund, Inc. (the “Fund”) unanimously approved the continuance of the Fund’s Investment Advisory Contract (the “Advisory Agreement”) with the Adviser in respect of AB All Market Real Return Portfolio (formerly AllianceBernstein Real Asset Strategy) (the “Portfolio”) at a meeting held on November 3-5, 2015.
Prior to approval of the continuance of the Advisory Agreement in respect of the Portfolio, the directors had requested from the Adviser, and received and evaluated, extensive materials. They reviewed the proposed continuance of the Advisory Agreement with the Adviser and with experienced counsel who are independent of the Adviser, who advised on the relevant legal standards. The directors also reviewed an independent evaluation prepared by the Fund’s Senior Officer (who is also the Fund’s Independent Compliance Officer) of the reasonableness of the advisory fee, in which the Senior Officer concluded that the contractual fee for the Portfolio was reasonable. The directors also discussed the proposed continuance in private sessions with counsel and the Fund’s Senior Officer.
The directors considered their knowledge of the nature and quality of the services provided by the Adviser to the Portfolio gained from their experience as directors or trustees of most of the registered investment companies advised by the Adviser, their overall confidence in the Adviser’s integrity and competence they have gained from that experience, the Adviser’s initiative in identifying and raising potential issues with the directors and its responsiveness, frankness and attention to concerns raised by the directors in the past, including the Adviser’s willingness to consider and implement organizational and operational changes designed to improve investment results and the services provided to the AB Funds. The directors noted that they have four regular meetings each year, at each of which they receive presentations from the Adviser on the investment results of the Portfolio and review extensive materials and information presented by the Adviser.
The directors also considered all other factors they believed relevant, including the specific matters discussed below. In their deliberations, the directors did not identify any particular information that was all-important or controlling, and different directors may have attributed different weights to the various factors. The directors determined that the selection of the Adviser to manage the Portfolio and the overall arrangements between the Portfolio and the Adviser, as provided in the Advisory Agreement, including the advisory fee, were fair and reasonable in light of the services performed, expenses incurred and such other matters as the directors considered relevant in the exercise of their business judgment.
| 80 | • AB ALL MARKET REAL RETURN PORTFOLIO |
The material factors and conclusions that formed the basis for the directors’ determinations included the following:
Nature, Extent and Quality of Services Provided
The directors considered the scope and quality of services provided by the Adviser under the Advisory Agreement, including the quality of the investment research capabilities of the Adviser and the other resources it has dedicated to performing services for the Portfolio. They noted the professional experience and qualifications of the Portfolio’s portfolio management team and other senior personnel of the Adviser. The directors also considered that the Advisory Agreement provides that the Portfolio will reimburse the Adviser for the cost to it of providing certain clerical, accounting, administrative and other services to the Portfolio by employees of the Adviser or its affiliates. Requests for these reimbursements are made on a quarterly basis and subject to approval by the directors. Reimbursements, to the extent requested and paid, result in a higher rate of total compensation from the Portfolio to the Adviser than the fee rate stated in the Portfolio’s Advisory Agreement. The directors noted that the methodology used to determine the reimbursement amounts had been reviewed by an independent consultant retained by the Fund’s Senior Officer. The quality of administrative and other services, including the Adviser’s role in coordinating the activities of the Portfolio’s other service providers, also was considered. The directors concluded that, overall, they were satisfied with the nature, extent and quality of services provided to the Portfolio under the Advisory Agreement.
Costs of Services Provided and Profitability
The directors reviewed a schedule of the revenues, expenses and related notes indicating the profitability of the Portfolio to the Adviser for calendar years 2013 and 2014 that had been prepared with an expense allocation methodology arrived at in consultation with an independent consultant retained by the Fund’s Senior Officer. The directors noted the assumptions and methods of allocation used by the Adviser in preparing fund-specific profitability data and understood that there are a number of potentially acceptable allocation methodologies for information of this type. The directors noted that the profitability information reflected all revenues and expenses of the Adviser’s relationship with the Portfolio, including those relating to its subsidiaries that provide transfer agency, distribution and brokerage services to the Portfolio. The directors recognized that it is difficult to make comparisons of the profitability of the Advisory Agreement with the profitability of advisory contracts for unaffiliated funds because comparative information is not generally publicly available and is affected by numerous factors. The directors focused on the profitability of the Adviser’s relationship with the Portfolio before taxes and distribution expenses. The directors were satisfied that the Adviser’s level of profitability from its relationship with the Portfolio was not unreasonable.
| AB ALL MARKET REAL RETURN PORTFOLIO • | 81 |
Fall-Out Benefits
The directors considered the other benefits to the Adviser and its affiliates from their relationships with the Portfolio, including, but not limited to, benefits relating to soft dollar arrangements (whereby the Adviser receives brokerage and research services from brokers that execute transactions for certain clients, including the Portfolio); 12b-1 fees and sales charges received by the Fund’s principal underwriter (which is a wholly owned subsidiary of the Adviser) in respect of certain classes of the Portfolio’s shares; transfer agency fees paid by the Portfolio to a wholly owned subsidiary of the Adviser; and brokerage commissions paid by the Portfolio to certain brokers affiliated with the Adviser. The directors recognized that the Adviser’s profitability would be somewhat lower without these benefits. The directors understood that the Adviser also might derive reputational and other benefits from its association with the Portfolio.
Investment Results
In addition to the information reviewed by the directors in connection with the meeting, the directors receive detailed performance information for the Portfolio at each regular Board meeting during the year. At the November 2015 meeting, the directors reviewed information prepared by Broadridge showing the performance of the Class A Shares of the Portfolio as compared with that of a group of similar funds selected by Broadridge (the “Performance Group”) and as compared with that of a broad array of funds selected by Broadridge (the “Performance Universe”), and information prepared by the Adviser showing performance of the Class A Shares as compared with the Morgan Stanley Capital International All Country World Commodity Producers Index (the “MSCI AC Index”) and the All Market Real Return Portfolio Benchmark (composed of equal weightings of the MSCI AC Index, the Financial Times Stock Exchange European Public Real Estate Association/National Association of Real Estate Investment Trusts Global Index and the Dow Jones-UBS Commodity Index) (the “All Market Benchmark”), in each case for the 1-, 3- and 5-year periods ended July 31, 2015 and (in the case of comparisons with the benchmarks) the period since inception (March 2010 inception). The directors noted that the Portfolio was in the 5th quintile of the Performance Group and the Performance Universe for all periods. The Portfolio outperformed the MSCI AC Index in all periods (although all returns were negative) except in the 3-year period. It lagged the All Market Benchmark in all periods. Based on their review and their discussion with the Adviser of the reasons for the Portfolio’s performance, the directors retained confidence in the Adviser’s ability to manage the Portfolio’s assets.
Advisory Fees and Other Expenses
The directors considered the advisory fee rate paid by the Portfolio to the Adviser and information prepared by Broadridge concerning advisory fee rates paid by other funds in the same Broadridge category as the Portfolio at
| 82 | • AB ALL MARKET REAL RETURN PORTFOLIO |
a common asset level. The directors recognized that it is difficult to make comparisons of advisory fees because there are variations in the services that are included in the fees paid by other funds. The directors noted that, at the Portfolio’s current size, its contractual advisory fee rate of 75 basis points, plus the 1 basis point impact of the administrative expense reimbursement in the latest fiscal year, was lower than the Expense Group median.
The directors also considered the Adviser’s fee schedule for non-fund clients pursuing a similar investment style. For this purpose, they reviewed the relevant advisory fee information from the Adviser’s Form ADV and the evaluation from the Fund’s Senior Officer. The directors noted that the institutional fee schedule started at a rate equal to the Portfolio’s flat rate but had breakpoints. The application of the institutional fee schedule to the Portfolio’s net assets would result in a fee rate lower than the rate at the same asset level provided in the Portfolio’s Advisory Agreement. The directors noted that the Adviser may, in some cases, agree to fee rates with large institutional clients that are lower than those reviewed by the directors and that they had previously discussed with the Adviser its policies in respect of such arrangements.
The Adviser reviewed with the directors the significantly greater scope of the services it provides to the Portfolio relative to institutional clients. The Adviser also noted that because mutual funds are constantly issuing and redeeming shares, they are more difficult to manage than an institutional account, where the assets tend to be relatively stable. In light of the substantial differences in services rendered by the Adviser to institutional clients as compared to funds such as the Portfolio, the directors considered these fee comparisons inapt and did not place significant weight on them in their deliberations.
The directors noted that the Portfolio invests in shares of exchange-traded funds (“ETFs”), subject to restrictions and limitations of the Investment Company Act of 1940 as these may be varied as a result of exemptive orders issued by the SEC. The directors noted that ETFs pay advisory fees pursuant to their advisory contracts, and that the Adviser had provided, and they had reviewed, information about the expense ratios of the relevant ETFs. The directors concluded, based on the Adviser’s explanation of how it uses ETFs when they are the most cost-effective way to obtain desired exposures for a fund or to temporarily “equitize” cash inflows pending purchases of underlying securities, that the advisory fee for the Portfolio would be paid for services that would be in addition to, rather than duplicative of, the services to be provided under the advisory contracts of the ETFs.
The directors also considered the total expense ratio of the Class A shares of the Portfolio in comparison to the fees and expenses of funds within two comparison groups created by Broadridge: an Expense Group and an
| AB ALL MARKET REAL RETURN PORTFOLIO • | 83 |
Expense Universe. Broadridge described an Expense Group as a representative sample of funds similar to the Portfolio and an Expense Universe as a broader group than the Expense Group, consisting of all funds in the investment classification/objective with a similar load type as the Portfolio. The Class A expense ratio of the Portfolio was based on the Portfolio’s latest fiscal year and the information included the pro forma expense ratio to reflect a reduction in the 12b-1 fee effective February 1, 2016. The directors noted that it was likely that the expense ratios of some of the other funds in the Portfolio’s Broadridge category were lowered by waivers or reimbursements by those funds’ investment advisers, which in some cases might be voluntary or temporary. The directors view the expense ratio information as relevant to their evaluation of the Adviser’s services because the Adviser is responsible for coordinating services provided to the Portfolio by others.
The directors noted that the Portfolio’s pro forma total expense ratio, which had been capped by the Adviser (although the pro forma expense ratio was currently lower than the cap), was lower than the Expense Group and the Expense Universe medians. The directors concluded that the Portfolio’s pro forma expense ratio was satisfactory.
Economies of Scale
The directors noted that the advisory fee schedule for the Portfolio does not contain breakpoints and that they had discussed their strong preference, and that of the Senior Officer, for breakpoints in advisory contracts with the Adviser. The directors took into consideration prior presentations by an independent consultant on economies of scale in the mutual fund industry and for the AB Funds, and by the Adviser concerning certain of its views on economies of scale. The directors also had requested and received from the Adviser certain updates on economies of scale at the May 2015 meeting. The directors believe that economies of scale may be realized (if at all) by the Adviser across a variety of products and services, and not only in respect of a single fund. The directors noted that there is no established methodology for setting breakpoints that give effect to the fund-specific services provided by a fund’s adviser and to the economies of scale that an adviser may realize in its overall mutual fund business or those components of it which directly or indirectly affect a fund’s operations. The directors observed that in the mutual fund industry as a whole, as well as among funds similar to the Portfolio, there is no uniformity or pattern in the fees and asset levels at which breakpoints (if any) apply. The directors also noted that the advisory agreements for many funds do not have breakpoints at all. The directors informed the Adviser that they would monitor the Portfolio’s assets and its profitability to the Adviser and anticipated revisiting the question of breakpoints in the future if circumstances warranted doing so.
| 84 | • AB ALL MARKET REAL RETURN PORTFOLIO |
THIS PAGE IS NOT PART OF THE SHAREHOLDER REPORT OR THE FINANCIAL STATEMENTS
AB FAMILY OF FUNDS
US EQUITY
US Core
Core Opportunities Fund
Select US Equity Portfolio
US Growth
Concentrated Growth Fund
Discovery Growth Fund
Growth Fund
Large Cap Growth Fund
Small Cap Growth Portfolio
US Value
Discovery Value Fund
Equity Income Fund
Growth & Income Fund
Small Cap Value Portfolio
Value Fund
INTERNATIONAL/ GLOBAL EQUITY
International/Global Core
Global Core Equity Portfolio
Global Equity & Covered Call Strategy Fund
International Portfolio
International Strategic Core Portfolio
Sustainable Global Thematic Fund*
Tax-Managed International Portfolio
International/Global Growth
International Growth Fund
International/Global Value
Asia ex-Japan Equity Portfolio
International Value Fund
FIXED INCOME
Municipal
High Income Municipal Portfolio
Intermediate California Municipal Portfolio
Intermediate Diversified Municipal Portfolio
Intermediate New York Municipal Portfolio
FIXED INCOME (continued)
Municipal Bond Inflation Strategy
Tax-Aware Fixed Income Portfolio
National Portfolio
Arizona Portfolio
California Portfolio
Massachusetts Portfolio
Michigan Portfolio
Minnesota Portfolio
New Jersey Portfolio
New York Portfolio
Ohio Portfolio
Pennsylvania Portfolio
Virginia Portfolio
Taxable
Bond Inflation Strategy
Global Bond Fund
High Income Fund
High Yield Portfolio
Income Fund
Intermediate Bond Portfolio
Limited Duration High Income Portfolio
Short Duration Portfolio
ALTERNATIVES
All Market Real Return Portfolio
Credit Long/Short Portfolio
Global Real Estate Investment Fund
Long/Short Multi-Manager Fund
Multi-Manager Alternative Strategies Fund
Select US Long/Short Portfolio
Unconstrained Bond Fund
MULTI-ASSET
All Market Income Portfolio
Emerging Markets Multi-Asset Portfolio
Global Risk Allocation Fund
MULTI-ASSET (continued)
Target-Date
Multi-Manager Select Retirement Allocation Fund
Multi-Manager Select 2010 Fund
Multi-Manager Select 2015 Fund
Multi-Manager Select 2020 Fund
Multi-Manager Select 2025 Fund
Multi-Manager Select 2030 Fund
Multi-Manager Select 2035 Fund
Multi-Manager Select 2040 Fund
Multi-Manager Select 2045 Fund
Multi-Manager Select 2050 Fund
Multi-Manager Select 2055 Fund
Wealth Strategies
Balanced Wealth Strategy
Conservative Wealth Strategy
Wealth Appreciation Strategy
Tax-Managed Balanced Wealth Strategy
Tax-Managed Wealth Appreciation Strategy
CLOSED-END FUNDS
AB Multi-Manager Alternative Fund
Alliance California Municipal Income Fund
AllianceBernstein Global High Income Fund
AllianceBernstein National Municipal Income Fund
We also offer Government Exchange Reserves, which serves as the money market fund exchange vehicle for the AB mutual funds. An investment in Government Exchange Reserves is not a deposit in a bank and is not insured or guaranteed by the Federal Deposit Insurance Corporation or any other government agency. Although the Fund seeks to preserve the value of your investment at $1.00 per share, it is possible to lose money by investing in the Fund.
Investors should consider the investment objectives, risks, charges and expenses of the Fund carefully before investing. For copies of our prospectus or summary prospectus, which contain this and other information, visit us online at www.abfunds.com or contact your AB representative. Please read the prospectus and/or summary prospectus carefully before investing.
* Prior to November 1, 2016, the Fund was named Global Thematic Growth Fund.
| AB ALL MARKET REAL RETURN PORTFOLIO • | 85 |
AB Family of Funds
NOTES
| 86 | • AB ALL MARKET REAL RETURN PORTFOLIO |
NOTES
| AB ALL MARKET REAL RETURN PORTFOLIO • | 87 |
NOTES
| 88 | • AB ALL MARKET REAL RETURN PORTFOLIO |
NOTES
| AB ALL MARKET REAL RETURN PORTFOLIO • | 89 |
NOTES
| 90 | • AB ALL MARKET REAL RETURN PORTFOLIO |
NOTES
| AB ALL MARKET REAL RETURN PORTFOLIO • | 91 |
NOTES
| 92 | • AB ALL MARKET REAL RETURN PORTFOLIO |
AB ALL MARKET REAL RETURN PORTFOLIO
1345 Avenue of the Americas
New York, NY 10105
800.221.5672
AMRR-0151-1016 
OCT 10.31.16

ANNUAL REPORT
AB BOND INFLATION STRATEGY
Investment Products Offered
•Are Not FDIC Insured •May Lose Value •Are Not Bank Guaranteed |
Investors should consider the investment objectives, risks, charges and expenses of the Fund carefully before investing. For copies of our prospectus or summary prospectus, which contain this and other information, visit us online at www.abfunds.com or contact your AB representative. Please read the prospectus and/or summary prospectus carefully before investing.
This shareholder report must be preceded or accompanied by the Fund’s prospectus for individuals who are not current shareholders of the Fund.
You may obtain a description of the Fund’s proxy voting policies and procedures, and information regarding how the Fund voted proxies relating to portfolio securities during the most recent 12-month period ended June 30, without charge. Simply visit AB’s website at www.abfunds.com, or go to the Securities and Exchange Commission’s (the “Commission”) website at www.sec.gov, or call AB at (800) 227-4618.
The Fund files its complete schedule of portfolio holdings with the Commission for the first and third quarters of each fiscal year on Form N-Q. The Fund’s Forms N-Q are available on the Commission’s website at www.sec.gov. The Fund’s Forms N-Q may also be reviewed and copied at the Commission’s Public Reference Room in Washington, DC; information on the operation of the Public Reference Room may be obtained by calling (800) SEC-0330. AB publishes full portfolio holdings for the Fund monthly at www.abfunds.com.
AllianceBernstein Investments, Inc. (ABI) is the distributor of the AB family of mutual funds. ABI is a member of FINRA and is an affiliate of AllianceBernstein L.P., the Adviser of the funds.
The [A/B] logo is a registered service mark of AllianceBernstein and AllianceBernstein® is a registered service mark used by permission of the owner, AllianceBernstein L.P.
December 14, 2016
Annual Report
This report provides management’s discussion of fund performance for AB Bond Inflation Strategy (the “Strategy”) for the annual reporting period ended October 31, 2016.
Investment Objectives and Policies
The Strategy seeks to maximize real return without assuming what AllianceBernstein L.P. (the “Adviser”) considers to be undue risk. Real return is the rate of return after adjusting for inflation. The Strategy pursues its objective by investing principally in inflation-indexed securities (such as Treasury inflation-protected securities (“TIPS”) or inflation-indexed securities from issuers other than the US Treasury) or by gaining inflation protection through derivatives transactions, such as inflation Consumer Price Index (“CPI”) swaps or total return swaps linked to TIPS. In deciding whether to purchase inflation-indexed securities or use inflation-linked derivatives transactions, the Adviser will consider the relative costs and efficiency of each method. In addition, in seeking to maximize real return, the Strategy may also invest in other fixed-income investments, such as US and non-US government securities, corporate fixed-income securities and mortgage-related securities, as well as derivatives linked to such securities.
Under normal circumstances, the Strategy invests at least 80% of its
net assets in fixed-income securities. While the Strategy expects to invest principally in investment-grade securities, it may invest up to 15% of its total assets in fixed-income securities rated BB or B or the equivalent by at least one national rating agency (or deemed by the Adviser to be of comparable credit quality), which are not investment-grade (“junk bonds”).
Inflation-indexed securities are fixed-income securities structured to provide protection against inflation. Their principal value and/or the interest paid on them are adjusted to reflect official inflation measures. The inflation measure for TIPS is the Consumer Price Index for Urban Consumers. The Strategy may also invest in other inflation-indexed securities, issued by both US and non-US issuers, and in derivative instruments linked to these securities.
The Strategy may invest in derivatives, such as options, futures, forwards or swaps. The Strategy intends to use leverage for investment purposes. To do this, the Strategy expects to enter into (i) reverse repurchase agreement transactions and use the cash made available from these transactions to make additional investments in fixed-income securities in accordance with the Strategy’s investment policies and (ii) total return swaps. In determining when and to what extent to employ leverage or enter into derivatives transactions, the Adviser will consider factors such as
| AB BOND INFLATION STRATEGY • | 1 |
the relative risks and returns expected of potential investments and the costs of such transactions. The Adviser will consider the impact of reverse repurchase agreements, swaps and other derivatives in making its assessments of the Strategy’s risks. The resulting exposures to markets, sectors, issuers or specific securities will be continuously monitored by the Adviser.
The Adviser selects securities for purchase or sale based on its assessment of the securities’ risk and return characteristics as well as the securities’ impact on the overall risk and return characteristics of the Strategy. In making this assessment, the Adviser takes into account various factors, including the credit quality and sensitivity to interest rates of the securities under consideration and of the Strategy’s other holdings.
The Strategy may also invest in loan participations, structured securities, asset-backed securities, variable, floating, and inverse floating-rate instruments, and preferred stock, and may use other investment techniques. The Strategy may invest in fixed-income securities of any maturity and duration. If the rating of a fixed-income security falls below investment-grade, the Strategy will not be obligated to sell the security and may continue to hold it if, in the Adviser’s opinion, the investment is appropriate under the circumstances.
Investment Results
The table on page 8 shows the Strategy’s performance compared to its benchmark, the Bloomberg Barclays 1-10 Year TIPS Index, and to the Lipper Inflation Protected Bond Funds Average (the “Lipper Average”), for the six- and 12-month periods ended October 31, 2016. Funds in the Lipper Average have generally similar investment objectives to the Strategy, although some of the funds may have different investment policies and sales and management fees and fund expenses.
All share classes outperformed the benchmark in both periods, before sales charges, and also outperformed the Lipper Average. During both periods, holdings in TIPS performed strongly in absolute terms and also outperformed relative to Treasuries, as oil and commodity prices stabilized, which contributed to performance. Sector allocation contributed to performance, relative to the benchmark, primarily due to gains from the Strategy’s exposures to investment-grade corporates, commercial mortgage-backed securities, asset-backed securities and non-agency mortgages, which did well in both periods. Currency investments also helped returns in both periods. In the six-month period, gains from underweight positions in the Canadian dollar and British pound (a laggard due to Brexit-induced volatility) more than offset losses from an overweight in the Mexican peso, which suffered
| 2 | • AB BOND INFLATION STRATEGY |
because of political uncertainty surrounding elections in the US. In the 12-month period, an overweight to the Japanese yen—one of the best performing currencies in the period—contributed to performance.
During both periods, the Strategy utilized derivatives including currency forwards and options to hedge currency risk and actively manage currency positions. Credit default swaps were utilized for hedging and investment purposes, which had an immaterial impact on performance during both periods. Treasury futures, and interest rate and CPI swaps, were utilized to manage duration, inflation protection, country exposure and yield-curve positioning.
Market Review and Investment Strategy
Bond markets generally increased in absolute terms over the 12-month period ended October 31, 2016, as global growth trends and central bank action in the world’s largest economies continued to diverge. After declining through the end of 2015 and beginning of 2016, oil prices rebounded through much of the period on the back of decreased global supply—which contributed to a rally in emerging-market debt sectors—though prices moved downward in October on the market’s rising skepticism that OPEC would reach a deal to limit crude production. Emerging-market sentiment was further boosted on positive political developments in Argentina and Brazil toward the end of the period.
In December 2015, the US Federal Reserve (the “Fed”) hiked rates for the first time in over nine years—a move that had been well-telegraphed and widely anticipated, and was generally accepted smoothly by bond investors. After some slower-than-expected US economic data through the first half of 2016, the Fed’s tone turned more hawkish in September (despite rates remaining unchanged) on the back of continued strengthening in the US labor market and growth in economic activity. In October, third quarter US GDP posted its best quarterly gain in two years (largely because of a surge in agricultural exports).
Central banks around the globe cut rates during the annual period, with some, including the Bank of Japan and the European Central Bank, dipping into negative rate territory. Volatility in Europe (and globally) spiked sharply in June after the UK voted to leave the European Union, a decision that was largely a surprise to investors. While investors initially responded by selling risk-sensitive assets, markets outside Europe quickly recovered. European markets began to stabilize as well, helped by the Bank of England’s first rate cut in seven years—to an historic low—and an aggressive asset-purchase program. Elsewhere, central banks in Australia and New Zealand also moved rates to record lows, while fiscal and monetary policy developments in Japan disappointed investors, who were expecting rate cuts or additional quantitative easing.
| AB BOND INFLATION STRATEGY • | 3 |
Yields in most developed markets fell in the 12-month period, with UK yields reaching historic lows in the months following the Brexit referendum in June. At the end of the period, trillions of dollars’ worth of government debt around the world lingered in negative territory. Developed-market treasuries generally outperformed emerging-market local-currency government bonds and investment-grade credit securities, but lagged the rally in global high yield. Energy and basics were among the top performing sectors in each period, largely due to positive oil price action, while
consumer-related sectors lagged the rising market.
On November 8, 2016, Donald Trump was elected as the 45th president of the United States, and the Congressional election outcome resulted in the Republican Party maintaining control of both the House of Representatives and the Senate. The Adviser believes that it will take time before the world has a clearer picture of the short- and long-term impact of the elections on the US economy and markets in general. The Adviser continues to monitor the markets, including for potential market volatility.
| 4 | • AB BOND INFLATION STRATEGY |
DISCLOSURES AND RISKS
Benchmark Disclosure
The Bloomberg Barclays 1-10 Year TIPS Index is unmanaged and does not reflect fees and expenses associated with the active management of a mutual fund portfolio. The Bloomberg Barclays 1-10 Year TIPS Index represents the performance of inflation-protected securities issued by the US Treasury. An investor cannot invest directly in an index, and its results are not indicative of the performance for any specific investment, including the Strategy.
A Word About Risk
Market Risk: The value of the Strategy’s assets will fluctuate as the bond market fluctuates. The value of the Strategy’s investments may decline, sometimes rapidly and unpredictably, simply because of economic changes or other events that affect large portions of the market.
Credit Risk: An issuer or guarantor of a fixed-income security, or the counterparty to a derivatives or other contract, may be unable or unwilling to make timely payments of interest or principal, or to otherwise honor its obligations. The issuer or guarantor may default, causing a loss of the full principal amount of a security. The degree of risk for a particular security may be reflected in its credit rating. There is the possibility that the credit rating of a fixed-income security may be downgraded after purchase, which may adversely affect the value of the security. Investments in fixed-income securities with lower ratings tend to have a higher probability that an issuer will default or fail to meet its payment obligations.
Interest Rate Risk: Changes in interest rates will affect the value of investments in fixed-income securities. When interest rates rise, the value of investments in fixed-income securities tends to fall and this decrease in value may not be offset by higher income from new investments. The Strategy may be subject to a heightened risk of rising interest rates as the current period of historically low rates is beginning to end and rates have begun rising. Interest rate risk is generally greater for fixed-income securities with longer maturities or durations.
Duration Risk: Duration is a measure that relates the expected price volatility of a fixed-income security to changes in interest rates. The duration of a fixed-income security may be shorter than or equal to full maturity of a fixed-income security. Fixed-income securities with longer durations have more risk and will decrease in price as interest rates rise. For example, a fixed-income security with a duration of three years will decrease in value by approximately 3% if interest rates increase by 1%.
Inflation Risk: This is the risk that the value of assets or income from investments will be less in the future as inflation decreases the value of money. As inflation increases, the value of the Strategy’s assets can decline as can the value of the Strategy’s distributions. This risk is significantly greater for fixed-income securities with longer maturities.
(Disclosures, Risks and Note about Historical Performance continued on next page)
| AB BOND INFLATION STRATEGY • | 5 |
Disclosures and Risks
DISCLOSURES AND RISKS
(continued from previous page)
Although the Strategy invests principally in inflation-indexed securities, the value of its securities may be vulnerable to changes in expectations of inflation or interest rates.
Derivatives Risk: Derivatives may be illiquid, difficult to price, and leveraged so that small changes may produce disproportionate losses for the Strategy, and may be subject to counterparty risk to a greater degree than more traditional investments.
Foreign (Non-US) Risk: Investments in securities of non-US issuers may involve more risk than those of US issuers. These securities may fluctuate more widely in price and may be less liquid due to adverse market, economic, political, regulatory or other factors.
Currency Risk: Fluctuations in currency exchange rates may negatively affect the value of the Strategy’s investments or reduce its returns.
Leverage Risk: To the extent the Strategy uses leveraging techniques, its net asset value (“NAV”) may be more volatile because leverage tends to exaggerate the effect of changes in interest rates and any increase or decrease in the value of the Strategy’s investments.
Liquidity Risk: Liquidity risk occurs when certain investments become difficult to purchase or sell. Difficulty in selling less liquid securities may result in sales at disadvantageous prices affecting the value of your investment in the Strategy. Causes of liquidity risk may include low trading volumes, large positions and heavy redemptions of Strategy shares. Over recent years liquidity risk has also increased because the capacity of dealers in the secondary market for fixed-income securities to make markets in these securities has decreased, even as the overall bond market has grown significantly, due to, among other things, structural changes, additional regulatory requirements and capital and risk restraints that have led to reduced inventories. Liquidity risk may be higher in a rising interest rate environment, when the value and liquidity of fixed-income securities generally go down.
Management Risk: The Strategy is subject to management risk because it is an actively managed investment fund. The Adviser will apply its investment techniques and risk analyses in making investment decisions, but there is no guarantee that its techniques will produce the intended results.
These risks are fully discussed in the Strategy’s prospectus. As with all investments, you may lose money by investing in the Strategy.
An Important Note About Historical Performance
The investment return and principal value of an investment in the Strategy will fluctuate, so that shares, when redeemed, may be worth more or less than their original cost. Performance shown on the following pages represents past performance and does not guarantee
(Disclosures, Risks and Note about Historical Performance continued on next page)
| 6 | • AB BOND INFLATION STRATEGY |
Disclosures and Risks
DISCLOSURES AND RISKS
(continued from previous page)
future results. Current performance may be lower or higher than the performance information shown. You may obtain performance information current to the most recent month-end by visiting www.abfunds.com. For Class 1 shares, click on “Private Clients”, then “Investments”, then “Stocks” or “Bonds”, then “Mutual Fund Performance at a Glance”.
All fees and expenses related to the operation of the Strategy have been deducted. NAV returns do not reflect sales charges; if sales charges were reflected, the Strategy’s quoted performance would be lower. SEC returns reflect the applicable sales charges for each share class: a 4.25% maximum front-end sales charge for Class A shares; a 1% 1-year contingent deferred sales charge for Class C shares. Class 1 and Class 2 shares do not carry sales charges. Returns for the different share classes will vary due to different expenses associated with each class. Performance assumes reinvestment of distributions and does not account for taxes.
| AB BOND INFLATION STRATEGY • | 7 |
Disclosures and Risks
HISTORICAL PERFORMANCE
THE STRATEGY VS. ITS BENCHMARK PERIODS ENDED OCTOBER 31, 2016 (unaudited) | NAV Returns | |||||||||||
| 6 Months | 12 Months | |||||||||||
| AB Bond Inflation Strategy | ||||||||||||
Class 1* | 2.70% | 6.89% | ||||||||||
| ||||||||||||
Class 2* | 2.71% | 6.92% | ||||||||||
| ||||||||||||
Class A | 2.66% | 6.63% | ||||||||||
| ||||||||||||
Class C | 2.16% | 5.86% | ||||||||||
| ||||||||||||
Advisor Class† | 2.75% | 6.87% | ||||||||||
| ||||||||||||
Class R† | 2.45% | 6.41% | ||||||||||
| ||||||||||||
Class K† | 2.57% | 6.66% | ||||||||||
| ||||||||||||
Class I† | 2.80% | 6.98% | ||||||||||
| ||||||||||||
Class Z† | 2.71% | 6.89% | ||||||||||
| ||||||||||||
| Bloomberg Barclays 1-10 Year TIPS Index | 1.51% | 4.67% | ||||||||||
| ||||||||||||
| Lipper Inflation Protected Bond Funds Average | 1.88% | 4.91% | ||||||||||
| ||||||||||||
* Class 1 shares are only available to Bernstein Global Wealth Management private client accounts. Class 2 shares are only available to large Bernstein Global Wealth Management private client accounts and the Adviser’s institutional clients or through other limited arrangements.
† Please note that these share classes are for investors purchasing shares through accounts established under certain fee-based programs sponsored and maintained by certain broker-dealers and financial intermediaries, institutional pension plans and/or investment advisory clients of, and certain other persons associated with, the Adviser and its affiliates or the Strategy. |
| |||||||||||
See Disclosures, Risks and Note about Historical Performance on pages 5-7.
(Historical Performance continued on next page)
| 8 | • AB BOND INFLATION STRATEGY |
Historical Performance
HISTORICAL PERFORMANCE
(continued from previous page)
GROWTH OF A $10,000 INVESTMENT IN THE STRATEGY
1/26/10* TO 10/31/16 (unaudited)
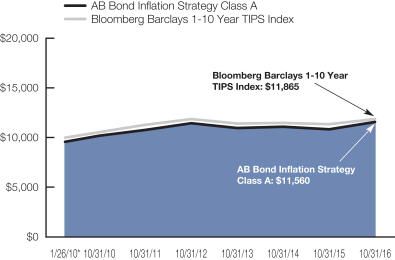
This chart illustrates the total value of an assumed $10,000 investment in AB Bond Inflation Strategy Class A shares (from 1/26/10* to 10/31/16) as compared to the performance of the Strategy’s benchmark. The chart reflects the deduction of the maximum 4.25% sales charge from the initial $10,000 investment in the Strategy and assumes the reinvestment of dividends and capital gains distributions.
| * | Inception date: 1/26/2010. |
See Disclosures, Risks and Note about Historical Performance on pages 5-7.
(Historical Performance continued on next page)
| AB BOND INFLATION STRATEGY • | 9 |
Historical Performance
HISTORICAL PERFORMANCE
(continued from previous page)
| AVERAGE ANNUAL RETURNS AS OF OCTOBER 31, 2016 (unaudited) | ||||||||||||
| NAV Returns | SEC Returns (reflects applicable sales charges) | SEC Yields* | ||||||||||
| Class 1 Shares† | 0.66 | % | ||||||||||
1 Year | 6.89 | % | 6.89 | % | ||||||||
5 Years | 1.66 | % | 1.66 | % | ||||||||
Since Inception‡ | 3.04 | % | 3.04 | % | ||||||||
| Class 2 Shares† | 0.73 | % | ||||||||||
1 Year | 6.92 | % | 6.92 | % | ||||||||
5 Years | 1.75 | % | 1.75 | % | ||||||||
Since Inception‡ | 3.12 | % | 3.12 | % | ||||||||
| Class A Shares | 0.33 | % | ||||||||||
1 Year | 6.63 | % | 2.14 | % | ||||||||
5 Years | 1.46 | % | 0.58 | % | ||||||||
Since Inception‡ | 2.82 | % | 2.17 | % | ||||||||
| Class C Shares | -0.41 | % | ||||||||||
1 Year | 5.86 | % | 4.86 | % | ||||||||
5 Years | 0.72 | % | 0.72 | % | ||||||||
Since Inception‡ | 2.08 | % | 2.08 | % | ||||||||
| Advisor Class Shares^ | 0.55 | % | ||||||||||
1 Year | 6.87 | % | 6.87 | % | ||||||||
5 Years | 1.72 | % | 1.72 | % | ||||||||
Since Inception‡ | 3.11 | % | 3.11 | % | ||||||||
| Class R Shares^ | 0.02 | % | ||||||||||
1 Year | 6.41 | % | 6.41 | % | ||||||||
5 Years | 1.24 | % | 1.24 | % | ||||||||
Since Inception‡ | 2.62 | % | 2.62 | % | ||||||||
| Class K Shares^ | 0.33 | % | ||||||||||
1 Year | 6.66 | % | 6.66 | % | ||||||||
5 Years | 1.50 | % | 1.50 | % | ||||||||
Since Inception‡ | 2.86 | % | 2.86 | % | ||||||||
| Class I Shares^ | 0.65 | % | ||||||||||
1 Year | 6.98 | % | 6.98 | % | ||||||||
5 Years | 1.76 | % | 1.76 | % | ||||||||
Since Inception‡ | 3.14 | % | 3.14 | % | ||||||||
| Class Z Shares^ | 0.76 | % | ||||||||||
1 Year | 6.89 | % | 6.89 | % | ||||||||
Since Inception‡ | 3.12 | % | 3.12 | % | ||||||||
See Disclosures, Risks and Note about Historical Performance on pages 5-7.
(Historical Performance continued on next page)
| 10 | • AB BOND INFLATION STRATEGY |
Historical Performance
HISTORICAL PERFORMANCE
(continued from previous page)
The Strategy’s prospectus fee table shows the Strategy’s total annual operating expense ratios as 0.87%, 0.77%, 1.31%, 2.07%, 1.06%, 1.50%, 1.17%, 0.76% and 0.84% for Class 1, Class 2, Class A, Class C, Advisor Class, Class R, Class K, Class I and Class Z shares, respectively, gross of any fee waivers or expense reimbursements. Contractual fee waivers and/or expense reimbursements limit the Strategy’s annual operating expenses (exclusive of interest expense) to 0.60%, 0.50%, 0.75%, 1.50%, 0.50%, 1.00%, 0.75%, 0.50% and 0.50% for Class 1, Class 2, Class A, Class C, Advisor Class, Class R, Class K, Class I and Class Z shares, respectively. These waivers/reimbursements may not be terminated before January 29, 2017 and may be extended by the Adviser for additional one-year terms. Absent reimbursements or waivers, performance would have been lower. The Financial Highlights section of this report sets forth expense ratio data for the current reporting period; the expense ratios shown above may differ from the expense ratios in the Financial Highlights sections since they are based on different time periods.
| * | SEC yields are calculated based on SEC guidelines for the 30-day period ended October 31, 2016. |
| † | Class 1 shares are only available to Bernstein Global Wealth Management private client accounts. Class 2 shares are only available to large Bernstein Global Wealth Management private client accounts and the Adviser’s institutional clients or through other limited arrangements. These share classes do not carry front-end sales charges; therefore their respective NAV and SEC returns are the same. |
| ‡ | Inception date for all share classes excluding Class Z: 1/26/2010; 12/11/2014 for Class Z shares. |
| ^ | These share classes are offered at NAV to eligible investors and their SEC returns are the same as their NAV returns. Please note that these share classes are for investors purchasing shares through accounts established under certain fee-based programs sponsored and maintained by certain broker-dealers and financial intermediaries, institutional pension plans and/or investment advisory clients of, and certain other persons associated with, the Adviser and its affiliates or the Strategy. |
See Disclosures, Risks and Note about Historical Performance on pages 5-7.
(Historical Performance continued on next page)
| AB BOND INFLATION STRATEGY • | 11 |
Historical Performance
HISTORICAL PERFORMANCE
(continued from previous page)
SEC AVERAGE ANNUAL RETURNS AS OF THE MOST RECENT CALENDAR QUARTER-END SEPTEMBER 30, 2016 (unaudited) | ||
| SEC Returns (reflects applicable sales charges) | ||||
| Class 1 Shares* | ||||
1 Year | 6.96 | % | ||
5 Years | 1.94 | % | ||
Since Inception† | 3.06 | % | ||
| Class 2 Shares* | ||||
1 Year | 7.07 | % | ||
5 Years | 2.05 | % | ||
Since Inception† | 3.15 | % | ||
| Class A Shares | ||||
1 Year | 2.34 | % | ||
5 Years | 0.87 | % | ||
Since Inception† | 2.18 | % | ||
| Class C Shares | ||||
1 Year | 5.01 | % | ||
5 Years | 1.05 | % | ||
Since Inception† | 2.12 | % | ||
| Advisor Class Shares‡ | ||||
1 Year | 7.16 | % | ||
5 Years | 2.05 | % | ||
Since Inception† | 3.15 | % | ||
| Class R Shares‡ | ||||
1 Year | 6.68 | % | ||
5 Years | 1.57 | % | ||
Since Inception† | 2.66 | % | ||
| Class K Shares‡ | ||||
1 Year | 6.79 | % | ||
5 Years | 1.80 | % | ||
Since Inception† | 2.89 | % | ||
| Class I Shares‡ | ||||
1 Year | 7.05 | % | ||
5 Years | 2.06 | % | ||
Since Inception† | 3.16 | % | ||
| Class Z Shares‡ | ||||
1 Year | 7.15 | % | ||
Since Inception† | 3.24 | % | ||
See Disclosures, Risks and Note about Historical Performance on pages 5-7.
(Historical Performance continued on next page)
| 12 | • AB BOND INFLATION STRATEGY |
Historical Performance
HISTORICAL PERFORMANCE
(continued from previous page)
| * | Class 1 shares are only available to Bernstein Global Wealth Management private client accounts. Class 2 shares are only available to large Bernstein Global Wealth Management private client accounts and the Adviser’s institutional clients or through other limited arrangements. |
| † | Inception date for all share classes excluding Class Z: 1/26/2010; 12/11/2014 for Class Z shares. |
| ‡ | These share classes are offered at NAV to eligible investors and their SEC returns are the same as their NAV returns. Please note that these share classes are for investors purchasing shares through accounts established under certain fee-based programs sponsored and maintained by certain broker-dealers and financial intermediaries, institutional pension plans and/or investment advisory clients of, and certain other persons associated with, the Adviser and its affiliates or the Strategy. |
See Disclosures, Risks and Note about Historical Performance on pages 5-7.
| AB BOND INFLATION STRATEGY • | 13 |
Historical Performance
EXPENSE EXAMPLE
(unaudited)
As a shareholder of a mutual fund, you may incur two types of costs: (1) transaction costs, including sales charges (loads) on purchase payments, contingent deferred sales charges on redemptions and (2) ongoing costs, including management fees; distribution (12b-1) fees; and other fund expenses. This example is intended to help you understand your ongoing costs (in dollars) of investing in the Fund and to compare these costs with the ongoing costs of investing in other mutual funds.
The Example is based on an investment of $1,000 invested at the beginning of the period and held for the entire period as indicated below.
Actual Expenses
The table below provides information about actual account values and actual expenses. You may use the information in this line, together with the amount you invested, to estimate the expenses that you paid over the period. Simply divide your account value by $1,000 (for example, an $8,600 account value divided by $1,000 = 8.6), then multiply the result by the number in the first line under the heading entitled “Expenses Paid During Period” to estimate the expenses you paid on your account during this period.
Hypothetical Example for Comparison Purposes
The table below provides information about hypothetical account values and hypothetical expenses based on the Fund’s actual expense ratio and an assumed annual rate of return of 5% before expenses, which is not the Fund’s actual return. The hypothetical account values and expenses may not be used to estimate the actual ending account balance or expenses you paid for the period. You may use this information to compare the ongoing costs of investing in the Fund and other funds by comparing this 5% hypothetical example with the 5% hypothetical examples that appear in the shareholder reports of other funds.
Please note that the expenses shown in the table are meant to highlight your ongoing costs only and do not reflect any transactional costs, such as sales charges (loads), or contingent deferred sales charges on redemptions. Therefore, the hypothetical example is useful in comparing ongoing costs only, and will not help you determine the relative total costs of owning different funds. In addition, if these transactional costs were included, your costs would have been higher.
| Beginning Account Value May 1, 2016 | Ending Account Value October 31, 2016 | Expenses Paid During Period* | Annualized Expense Ratio* | |||||||||||||
| Class A | ||||||||||||||||
Actual | $ | 1,000 | $ | 1,026.60 | $ | 5.15 | 1.01 | % | ||||||||
Hypothetical** | $ | 1,000 | $ | 1,020.06 | $ | 5.13 | 1.01 | % | ||||||||
| Class C | ||||||||||||||||
Actual | $ | 1,000 | $ | 1,021.60 | $ | 8.94 | 1.76 | % | ||||||||
Hypothetical** | $ | 1,000 | $ | 1,016.29 | $ | 8.92 | 1.76 | % | ||||||||
| 14 | • AB BOND INFLATION STRATEGY |
Expense Example
EXPENSE EXAMPLE
(unaudited)
| Beginning Account Value May 1, 2016 | Ending Account Value October 31, 2016 | Expenses Paid During Period* | Annualized Expense Ratio* | |||||||||||||
| Advisor Class | ||||||||||||||||
Actual | $ | 1,000 | $ | 1,027.50 | $ | 3.87 | 0.76 | % | ||||||||
Hypothetical** | $ | 1,000 | $ | 1,021.32 | $ | 3.86 | 0.76 | % | ||||||||
| Class R | ||||||||||||||||
Actual | $ | 1,000 | $ | 1,024.50 | $ | 6.36 | 1.25 | % | ||||||||
Hypothetical** | $ | 1,000 | $ | 1,018.85 | $ | 6.34 | 1.25 | % | ||||||||
| Class K | ||||||||||||||||
Actual | $ | 1,000 | $ | 1,025.70 | $ | 5.14 | 1.01 | % | ||||||||
Hypothetical** | $ | 1,000 | $ | 1,020.06 | $ | 5.13 | 1.01 | % | ||||||||
| Class I | ||||||||||||||||
Actual | $ | 1,000 | $ | 1,028.00 | $ | 3.87 | 0.76 | % | ||||||||
Hypothetical** | $ | 1,000 | $ | 1,021.32 | $ | 3.86 | 0.76 | % | ||||||||
| Class 1 | ||||||||||||||||
Actual | $ | 1,000 | $ | 1,027.00 | $ | 4.38 | 0.86 | % | ||||||||
Hypothetical** | $ | 1,000 | $ | 1,020.81 | $ | 4.37 | 0.86 | % | ||||||||
| Class 2 | ||||||||||||||||
Actual | $ | 1,000 | $ | 1,027.10 | $ | 3.87 | 0.76 | % | ||||||||
Hypothetical** | $ | 1,000 | $ | 1,021.32 | $ | 3.86 | 0.76 | % | ||||||||
| Class Z | ||||||||||||||||
Actual | $ | 1,000 | $ | 1,027.10 | $ | 3.87 | 0.76 | % | ||||||||
Hypothetical** | $ | 1,000 | $ | 1,021.32 | $ | 3.86 | 0.76 | % | ||||||||
| * | Expenses are equal to each classes’ annualized expense ratios, multiplied by the average account value over the period, multiplied by 184/366 (to reflect the one-half year period). |
| ** | Assumes 5% annual return before expenses. |
| AB BOND INFLATION STRATEGY • | 15 |
Expense Example
PORTFOLIO SUMMARY
October 31, 2016 (unaudited)
PORTFOLIO STATISTICS
Net Assets ($mil): $326.8
Total Investments ($mil): $458.2
| INFLATION PROTECTION BREAKDOWN* | ||||
U.S. Inflation-Protected Exposure | 100.7 | % | ||
Non-U.S. | — | |||
Non-Inflation Exposure | (0.7 | ) | ||
|
| |||
| 100.0 | % | |||
| SECTOR BREAKDOWN OF NET PORTFOLIO ASSETS, EXCLUDING TREASURY SECURITIES, TIPS, INTEREST RATE DERIVATIVES AND NET CASH EQUIVALENTS* | ||||
Corporates – Investment Grade | 11.8 | % | ||
Commercial Mortgage-Backed Securities | 9.4 | % | ||
Asset-Backed Securities | 7.5 | % | ||
Collateralized Mortgage Obligations | 6.3 | % | ||
Corporates – Non-Investment Grade | 1.7 | % | ||
Governments – Sovereign Agencies | 0.6 | % | ||
Quasi-Sovereigns | 0.5 | % | ||
Emerging Markets – Corporate Bonds | 0.4 | % | ||
Governments – Sovereign Bonds | 0.2 | % | ||
Common Stocks | 0.1 | % | ||
| SECTOR BREAKDOWN OF TOTAL PORTFOLIO INVESTMENTS, EXCLUDING DERIVATIVES† | ||||
Inflation-Linked Securities | 62.6 | % | ||
Corporates – Investment Grade | 11.7 | % | ||
Commercial Mortgage-Backed Securities | 6.1 | % | ||
Governments – Treasuries | 5.5 | % | ||
Asset-Backed Securities | 5.4 | % | ||
Collateralized Mortgage Obligations | 4.5 | % | ||
Corporates – Non-Investment Grade | 2.3 | % | ||
Emerging Markets – Treasuries | 0.7 | % | ||
Governments – Sovereign Agencies | 0.4 | % | ||
Quasi-Sovereigns | 0.3 | % | ||
Emerging Markets – Corporate Bonds | 0.3 | % | ||
Governments – Sovereign Bonds | 0.1 | % | ||
Common Stocks | 0.1 | % | ||
| * | All data are as of October 31, 2016. The Strategy’s sector and inflation protection exposure breakdowns are expressed as an approximate percentage of the Strategy’s total net assets (and may vary over time) inclusive of derivative exposure except as noted, based on the Adviser’s internal classification. |
| † | The Strategy’s sector breakdown is expressed, based on the Adviser’s internal classification, as a percentage of total investments and may vary over time. The Strategy also enters into derivative transactions (not reflected in the table), which may be used for hedging or investment purposes or to adjust the risk profile or exposures of the Strategy (see “Portfolio of Investments” section of the report for additional details). Derivative transactions may result in a form of leverage for the Strategy. The Strategy uses leverage for investment purposes by entering into reverse repurchase agreements. As a result, the Strategy’s total investments will generally exceed its net assets. |
| 16 | • AB BOND INFLATION STRATEGY |
Portfolio Summary
PORTFOLIO OF INVESTMENTS
October 31, 2016
| Principal Amount (000) | U.S. $ Value | |||||||||||
| ||||||||||||
INFLATION-LINKED SECURITIES – 87.7% | ||||||||||||
United States – 87.7% | ||||||||||||
U.S. Treasury Inflation Index | U.S.$ | 1,541 | $ | 1,555,357 | ||||||||
0.125%, 4/15/19-7/15/24 (TIPS)(a) | 97,391 | 98,991,321 | ||||||||||
0.25%, 1/15/25 (TIPS)(a) | 29,274 | 29,661,946 | ||||||||||
0.375%, 7/15/23 (TIPS)(a)(b) | 18,862 | 19,497,612 | ||||||||||
0.375%, 7/15/25 (TIPS)(a) | 29,471 | 30,252,394 | ||||||||||
0.625%, 7/15/21 (TIPS)(a) | 36,774 | 38,572,652 | ||||||||||
0.625%, 1/15/24 (TIPS) | 19,326 | 20,189,363 | ||||||||||
1.375%, 1/15/20 (TIPS) | 9,395 | 9,962,467 | ||||||||||
2.00%, 1/15/26 (TIPS) | 9,670 | 11,272,854 | ||||||||||
2.125%, 1/15/19 (TIPS) | 17,173 | 18,248,793 | ||||||||||
2.375%, 1/15/27 (TIPS) | 6,978 | 8,483,812 | ||||||||||
|
| |||||||||||
Total Inflation-Linked Securities | 286,688,571 | |||||||||||
|
| |||||||||||
CORPORATES – INVESTMENT | ||||||||||||
Industrial – 10.5% | ||||||||||||
Basic – 0.7% | ||||||||||||
Barrick Gold Corp. | 47 | 50,524 | ||||||||||
Dow Chemical Co. (The) | 67 | 78,068 | ||||||||||
Eastman Chemical Co. | 300 | 312,093 | ||||||||||
International Paper Co. | 592 | 657,495 | ||||||||||
LyondellBasell Industries NV | 405 | 473,588 | ||||||||||
Minsur SA | 314 | 328,017 | ||||||||||
Sociedad Quimica y Minera de Chile SA | 393 | 390,052 | ||||||||||
|
| |||||||||||
| 2,289,837 | ||||||||||||
|
| |||||||||||
Capital Goods – 0.2% | ||||||||||||
General Electric Co. | 191 | 202,345 | ||||||||||
Yamana Gold, Inc. | 403 | 413,881 | ||||||||||
|
| |||||||||||
| 616,226 | ||||||||||||
|
| |||||||||||
Communications - Media – 1.2% | ||||||||||||
21st Century Fox America, Inc. | 115 | 142,756 | ||||||||||
CBS Corp. | 300 | 308,667 | ||||||||||
| AB BOND INFLATION STRATEGY • | 17 |
Portfolio of Investments
| Principal Amount (000) | U.S. $ Value | |||||||||||
| ||||||||||||
5.75%, 4/15/20 | U.S.$ | 325 | $ | 364,258 | ||||||||
Cox Communications, Inc. | 163 | 158,286 | ||||||||||
Discovery Communications LLC | 323 | 322,260 | ||||||||||
NBCUniversal Enterprise, Inc. | 409 | 435,708 | ||||||||||
RELX Capital, Inc. | 460 | 523,978 | ||||||||||
S&P Global, Inc. | 611 | 677,508 | ||||||||||
Time Warner Cable LLC | 235 | 220,990 | ||||||||||
5.00%, 2/01/20 | 35 | 37,758 | ||||||||||
8.75%, 2/14/19 | 25 | 28,714 | ||||||||||
Time Warner, Inc. | 537 | 556,268 | ||||||||||
Viacom, Inc. | 336 | 309,117 | ||||||||||
|
| |||||||||||
| 4,086,268 | ||||||||||||
|
| |||||||||||
Communications - | ||||||||||||
AT&T, Inc. | 1,255 | 1,272,771 | ||||||||||
3.80%, 3/15/22 | 274 | 288,425 | ||||||||||
Rogers Communications, Inc. | CAD | 55 | 45,156 | |||||||||
Sprint Spectrum Co. LLC/Sprint Spectrum | U.S.$ | 344 | 344,860 | |||||||||
Verizon Communications, Inc. | 602 | 604,464 | ||||||||||
|
| |||||||||||
| 2,555,676 | ||||||||||||
|
| |||||||||||
Consumer Cyclical - Automotive – 0.5% | ||||||||||||
Ford Motor Credit Co. LLC | 400 | 404,187 | ||||||||||
5.875%, 8/02/21 | 640 | 726,738 | ||||||||||
General Motors Co. | 425 | 436,337 | ||||||||||
|
| |||||||||||
| 1,567,262 | ||||||||||||
|
| |||||||||||
Consumer Cyclical - Retailers – 0.4% | ||||||||||||
Kohl’s Corp. | 415 | 402,529 | ||||||||||
Walgreens Boots Alliance, Inc. | 935 | 983,313 | ||||||||||
|
| |||||||||||
| 1,385,842 | ||||||||||||
|
| |||||||||||
Consumer Non-Cyclical – 3.1% | ||||||||||||
AbbVie, Inc. | 455 | 463,978 | ||||||||||
| 18 | • AB BOND INFLATION STRATEGY |
Portfolio of Investments
| Principal Amount (000) | U.S. $ Value | |||||||||||
| ||||||||||||
Actavis Funding SCS | U.S.$ | 803 | $ | 833,365 | ||||||||
3.85%, 6/15/24 | 278 | 289,177 | ||||||||||
Agilent Technologies, Inc. | 7 | 7,737 | ||||||||||
Altria Group, Inc. | 930 | 956,723 | ||||||||||
Baxalta, Inc. | 700 | 729,056 | ||||||||||
Bunge Ltd. Finance Corp. | 81 | 94,389 | ||||||||||
Celgene Corp. | 520 | 544,753 | ||||||||||
Gilead Sciences, Inc. | 335 | 351,161 | ||||||||||
Grupo Bimbo SAB de CV | 648 | 673,629 | ||||||||||
Laboratory Corp. of America Holdings | 275 | 284,424 | ||||||||||
Medtronic, Inc. | 895 | 949,664 | ||||||||||
Newell Brands, Inc. | 814 | 847,601 | ||||||||||
3.85%, 4/01/23 | 238 | 252,568 | ||||||||||
Perrigo Finance Unlimited Co. | 217 | 224,046 | ||||||||||
3.90%, 12/15/24 | 310 | 313,543 | ||||||||||
Teva Pharmaceutical Finance Netherlands III BV | 599 | 589,441 | ||||||||||
3.15%, 10/01/26 | 400 | 389,014 | ||||||||||
Thermo Fisher Scientific, Inc. | 363 | 390,953 | ||||||||||
Tyson Foods, Inc. | 199 | 203,430 | ||||||||||
3.95%, 8/15/24 | 650 | 689,922 | ||||||||||
|
| |||||||||||
| 10,078,574 | ||||||||||||
|
| |||||||||||
Energy – 2.4% | ||||||||||||
Energy Transfer Partners LP | 510 | 558,953 | ||||||||||
6.125%, 2/15/17 | 145 | 146,930 | ||||||||||
EnLink Midstream Partners LP | 352 | 313,743 | ||||||||||
Enterprise Products Operating LLC | 771 | 786,334 | ||||||||||
5.20%, 9/01/20 | 335 | 373,246 | ||||||||||
Hess Corp. | 563 | 560,476 | ||||||||||
Kinder Morgan Energy Partners LP | 846 | 885,816 | ||||||||||
4.15%, 3/01/22 | 104 | 109,405 | ||||||||||
| AB BOND INFLATION STRATEGY • | 19 |
Portfolio of Investments
| Principal Amount (000) | U.S. $ Value | |||||||||||
| ||||||||||||
Marathon Petroleum Corp. | U.S.$ | 280 | $ | 310,193 | ||||||||
Noble Energy, Inc. | 491 | 504,818 | ||||||||||
4.15%, 12/15/21 | 127 | 134,721 | ||||||||||
8.25%, 3/01/19 | 387 | 440,418 | ||||||||||
Plains All American Pipeline LP/PAA Finance Corp. | 621 | 612,014 | ||||||||||
Regency Energy Partners LP/Regency Energy Finance Corp. | 115 | 117,461 | ||||||||||
Schlumberger Holdings Corp. | 845 | 876,788 | ||||||||||
Spectra Energy Capital LLC | 8 | 9,171 | ||||||||||
Valero Energy Corp. | 476 | 537,556 | ||||||||||
Williams Partners LP | 350 | 349,076 | ||||||||||
4.125%, 11/15/20 | 300 | 313,028 | ||||||||||
|
| |||||||||||
| 7,940,147 | ||||||||||||
|
| |||||||||||
Technology – 1.2% | ||||||||||||
Diamond 1 Finance Corp./Diamond 2 Finance Corp. | 805 | 841,794 | ||||||||||
Fidelity National Information Services, Inc. | 112 | 116,613 | ||||||||||
5.00%, 10/15/25 | 2 | 2,251 | ||||||||||
KLA-Tencor Corp. | 639 | 698,445 | ||||||||||
Lam Research Corp. | 250 | 254,557 | ||||||||||
Micron Technology, Inc. | 209 | 230,684 | ||||||||||
Motorola Solutions, Inc. | 483 | 576,277 | ||||||||||
Seagate HDD Cayman | 398 | 379,294 | ||||||||||
Total System Services, Inc. | 259 | 260,686 | ||||||||||
Western Digital Corp. | 447 | 488,906 | ||||||||||
|
| |||||||||||
| 3,849,507 | ||||||||||||
|
| |||||||||||
| 34,369,339 | ||||||||||||
|
| |||||||||||
Financial Institutions – 5.3% | ||||||||||||
Banking – 3.8% | ||||||||||||
ABN AMRO Bank NV | 200 | 210,098 | ||||||||||
| 20 | • AB BOND INFLATION STRATEGY |
Portfolio of Investments
| Principal Amount (000) | U.S. $ Value | |||||||||||
| ||||||||||||
Bank of America Corp. | EUR | 900 | $ | 988,104 | ||||||||
Barclays Bank PLC | 101 | 134,462 | ||||||||||
Barclays PLC | U.S.$ | 294 | 288,658 | |||||||||
BNP Paribas SA | EUR | 300 | 325,961 | |||||||||
BPCE SA | U.S.$ | 213 | 230,779 | |||||||||
Capital One Financial Corp. | 150 | 151,834 | ||||||||||
Citigroup, Inc. | 655 | 670,591 | ||||||||||
Cooperatieve Rabobank UA | 396 | 417,071 | ||||||||||
Credit Agricole SA | 320 | 326,602 | ||||||||||
Credit Suisse Group Funding Guernsey Ltd. | 485 | 489,706 | ||||||||||
Goldman Sachs Group, Inc. (The) | 382 | 379,960 | ||||||||||
2.429% (LIBOR 3 Month + 1.60%), | 406 | 411,640 | ||||||||||
JPMorgan Chase & Co. | 322 | 322,252 | ||||||||||
4.25%, 10/15/20 | 55 | 59,395 | ||||||||||
Lloyds Banking Group PLC | 400 | 411,545 | ||||||||||
4.65%, 3/24/26 | 318 | 327,310 | ||||||||||
Mizuho Financial Group Cayman 3 Ltd. | 816 | 886,051 | ||||||||||
Morgan Stanley | 456 | 517,613 | ||||||||||
Murray Street Investment Trust I | 52 | 52,626 | ||||||||||
Nationwide Building Society | 820 | 808,501 | ||||||||||
PNC Bank NA | 940 | 1,007,308 | ||||||||||
Santander Bank, NA | 890 | 886,235 | ||||||||||
Santander Issuances SAU | 400 | 414,407 | ||||||||||
Santander UK PLC | 505 | 523,141 | ||||||||||
| AB BOND INFLATION STRATEGY • | 21 |
Portfolio of Investments
| Principal Amount (000) | U.S. $ Value | |||||||||||
| ||||||||||||
Societe Generale SA | U.S.$ | 325 | $ | 323,784 | ||||||||
UBS AG/Stamford CT | 465 | 538,819 | ||||||||||
UBS Group Funding Jersey Ltd. | 453 | 472,545 | ||||||||||
|
| |||||||||||
| 12,576,998 | ||||||||||||
|
| |||||||||||
Finance – 0.2% | ||||||||||||
AerCap Aviation Solutions BV | 200 | 205,250 | ||||||||||
International Lease Finance Corp. | 294 | 315,956 | ||||||||||
|
| |||||||||||
| 521,206 | ||||||||||||
|
| |||||||||||
Insurance – 0.9% | ||||||||||||
American International Group, Inc. | 625 | 697,987 | ||||||||||
Coventry Health Care, Inc. | 415 | 469,589 | ||||||||||
Hartford Financial Services Group, Inc. (The) | 535 | 605,362 | ||||||||||
5.50%, 3/30/20 | 24 | 26,670 | ||||||||||
6.10%, 10/01/41 | 165 | 197,415 | ||||||||||
Lincoln National Corp. | 175 | 204,022 | ||||||||||
MetLife, Inc. | 90 | 109,599 | ||||||||||
Nationwide Financial Services, Inc. | 360 | 400,400 | ||||||||||
Nationwide Mutual Insurance Co. | 125 | 191,102 | ||||||||||
|
| |||||||||||
| 2,902,146 | ||||||||||||
|
| |||||||||||
REITS – 0.4% | ||||||||||||
Host Hotels & Resorts LP | 175 | 193,247 | ||||||||||
Welltower, Inc. | 965 | 1,010,379 | ||||||||||
|
| |||||||||||
| 1,203,626 | ||||||||||||
|
| |||||||||||
| 17,203,976 | ||||||||||||
|
| |||||||||||
Utility – 0.6% | ||||||||||||
Electric – 0.6% | ||||||||||||
Berkshire Hathaway Energy Co. | 340 | 444,913 | ||||||||||
CMS Energy Corp. | 144 | 162,865 | ||||||||||
Constellation Energy Group, Inc. | 91 | 100,649 | ||||||||||
| 22 | • AB BOND INFLATION STRATEGY |
Portfolio of Investments
| Principal Amount (000) | U.S. $ Value | |||||||||||
| ||||||||||||
Entergy Corp. | U.S.$ | 607 | $ | 652,738 | ||||||||
Exelon Generation Co. LLC | 416 | 442,798 | ||||||||||
|
| |||||||||||
| 1,803,963 | ||||||||||||
|
| |||||||||||
Natural Gas – 0.0% | ||||||||||||
NiSource Finance Corp. | 75 | 83,092 | ||||||||||
|
| |||||||||||
| 1,887,055 | ||||||||||||
|
| |||||||||||
Total Corporates – Investment Grade | 53,460,370 | |||||||||||
|
| |||||||||||
COMMERCIAL MORTGAGE-BACKED SECURITIES – 8.5% | ||||||||||||
Non-Agency Fixed Rate CMBS – 6.9% | ||||||||||||
Banc of America Commercial Mortgage Trust | 258 | 263,768 | ||||||||||
Bear Stearns Commercial Mortgage Securities Trust | 107 | 107,428 | ||||||||||
BHMS Mortgage Trust | 1,070 | 1,101,378 | ||||||||||
CGRBS Commercial Mortgage Trust | 885 | 932,443 | ||||||||||
Citigroup Commercial Mortgage Trust | 486 | 454,677 | ||||||||||
Series 2013-GC11, Class D | 420 | 383,928 | ||||||||||
Series 2015-GC27, Class A5 | 707 | 732,252 | ||||||||||
COBALT CMBS Commercial Mortgage Trust | 395 | 402,347 | ||||||||||
Commercial Mortgage Trust | 204 | 204,524 | ||||||||||
Series 2007-GG9, Class AM | 598 | 600,482 | ||||||||||
Series 2013-SFS, Class A1 | 318 | 316,829 | ||||||||||
Credit Suisse Commercial Mortgage Trust | 5 | 4,807 | ||||||||||
| AB BOND INFLATION STRATEGY • | 23 |
Portfolio of Investments
| Principal Amount (000) | U.S. $ Value | |||||||||||
| ||||||||||||
Series 2007-C3, Class AM | U.S.$ | 463 | $ | 468,216 | ||||||||
CSAIL Commercial Mortgage Trust | 631 | 679,806 | ||||||||||
DBUBS Mortgage Trust | 368 | 390,316 | ||||||||||
GS Mortgage Securities Corp. II | 752 | 767,923 | ||||||||||
GS Mortgage Securities Trust | 530 | 535,532 | ||||||||||
Series 2012-GC6, Class D | 416 | 410,235 | ||||||||||
Series 2013-G1, Class A1 | 563 | 553,000 | ||||||||||
Series 2014-GC18, Class D | 581 | 483,116 | ||||||||||
JP Morgan Chase Commercial Mortgage Securities Trust | 250 | 249,664 | ||||||||||
Series 2006-LDP9, Class AM | 370 | 370,801 | ||||||||||
Series 2007-CB19, Class AM | 295 | 299,401 | ||||||||||
Series 2007-LD12, Class AM | 245 | 252,548 | ||||||||||
Series 2007-LDPX, Class A1A | 1,457 | 1,466,900 | ||||||||||
Series 2007-LDPX, Class A3 | 179 | 179,881 | ||||||||||
Series 2011-C5, Class D | 266 | 272,987 | ||||||||||
JPMBB Commercial Mortgage Securities Trust | 670 | 722,611 | ||||||||||
Series 2015-C32, Class C | 545 | 504,590 | ||||||||||
LB-UBS Commercial Mortgage Trust | 256 | 238,320 | ||||||||||
Series 2007-C1, Class A4 | 379 | 379,917 | ||||||||||
Series 2007-C1, Class AM | 290 | 291,531 | ||||||||||
LSTAR Commercial Mortgage Trust | 512 | 514,228 | ||||||||||
| 24 | • AB BOND INFLATION STRATEGY |
Portfolio of Investments
| Principal Amount (000) | U.S. $ Value | |||||||||||
| ||||||||||||
Series 2015-3, Class A2 | U.S.$ | 680 | $ | 687,546 | ||||||||
Merrill Lynch Mortgage Trust | 23 | 22,681 | ||||||||||
ML-CFC Commercial Mortgage Trust | 109 | 111,939 | ||||||||||
Morgan Stanley Capital I Trust | 320 | 324,287 | ||||||||||
SG Commercial Mortgage Securities Trust | 377 | 381,551 | ||||||||||
UBS-Barclays Commercial Mortgage Trust | ||||||||||||
Series 2012-C3, Class A4 | 277 | 289,183 | ||||||||||
Series 2012-C4, Class A5 | 2,309 | 2,385,673 | ||||||||||
UBS-Citigroup Commercial Mortgage Trust | 229 | 248,724 | ||||||||||
Wachovia Bank Commercial Mortgage Trust | 47 | 46,722 | ||||||||||
Wells Fargo Commercial Mortgage Trust | 525 | 515,894 | ||||||||||
WF-RBS Commercial Mortgage Trust | 327 | 319,918 | ||||||||||
Series 2013-C14, Class A5 | 862 | 913,641 | ||||||||||
Series 2014-C20, Class A2 | 648 | 670,361 | ||||||||||
|
| |||||||||||
| 22,454,506 | ||||||||||||
|
| |||||||||||
Non-Agency Floating Rate CMBS – 1.6% | ||||||||||||
CGBAM Commercial Mortgage Trust | 328 | 328,000 | ||||||||||
Series 2016-IMC, Class C | 184 | 184,203 | ||||||||||
H/2 Asset Funding NRE | 644 | 637,469 | ||||||||||
| AB BOND INFLATION STRATEGY • | 25 |
Portfolio of Investments
| Principal Amount (000) | U.S. $ Value | |||||||||||
| ||||||||||||
JP Morgan Chase Commercial Mortgage Securities Trust | U.S.$ | 1,068 | $ | 1,065,677 | ||||||||
Series 2015-SGP, Class A | 853 | 855,647 | ||||||||||
Morgan Stanley Capital I Trust | 241 | 240,491 | ||||||||||
Series 2015-XLF2, Class SNMA | 241 | 242,296 | ||||||||||
Resource Capital Corp., Ltd. | 228 | 225,590 | ||||||||||
Starwood Retail Property Trust | 1,084 | 1,073,432 | ||||||||||
Wells Fargo Commercial Mortgage Trust | 537 | 539,347 | ||||||||||
|
| |||||||||||
| 5,392,152 | ||||||||||||
|
| |||||||||||
Total Commercial Mortgage-Backed Securities | 27,846,658 | |||||||||||
|
| |||||||||||
GOVERNMENTS – TREASURIES – 7.8% | ||||||||||||
Japan – 7.8% | ||||||||||||
Japan Government Ten Year Bond | JPY | 2,626,100 | 25,414,848 | |||||||||
|
| |||||||||||
ASSET-BACKED SECURITIES – 7.5% | ||||||||||||
Autos - Fixed Rate – 4.4% | ||||||||||||
Ally Auto Receivables Trust | U.S.$ | 341 | 341,836 | |||||||||
Ally Master Owner Trust | 707 | 709,073 | ||||||||||
Americredit Automobile Receivables Trust | 655 | 654,763 | ||||||||||
| 26 | • AB BOND INFLATION STRATEGY |
Portfolio of Investments
| Principal Amount (000) | U.S. $ Value | |||||||||||
| ||||||||||||
ARI Fleet Lease Trust | U.S.$ | 56 | $ | 55,684 | ||||||||
Avis Budget Rental Car Funding AESOP LLC | 420 | 421,272 | ||||||||||
Series 2013-2A, Class A | 289 | 294,240 | ||||||||||
Bank of The West Auto Trust | 706 | 706,664 | ||||||||||
California Republic Auto Receivables Trust | 850 | 852,164 | ||||||||||
Series 2015-2, Class A3 | 516 | 515,939 | ||||||||||
Capital Auto Receivables Asset Trust | 200 | 200,682 | ||||||||||
Chrysler Capital Auto Receivables Trust | 857 | 860,612 | ||||||||||
CPS Auto Receivables Trust | 214 | 214,115 | ||||||||||
Series 2014-B, Class A | 95 | 94,311 | ||||||||||
Enterprise Fleet Financing LLC | 49 | 48,756 | ||||||||||
Series 2015-1, Class A2 | 414 | 413,913 | ||||||||||
Exeter Automobile Receivables Trust | 250 | 266,306 | ||||||||||
Series 2016-3A, Class A | 350 | 349,637 | ||||||||||
Flagship Credit Auto Trust | 325 | 345,950 | ||||||||||
Series 2016-4, Class D | 330 | 329,945 | ||||||||||
Ford Credit Auto Owner Trust | 225 | 224,788 | ||||||||||
Series 2014-2, Class A | 728 | 742,491 | ||||||||||
GM Financial Automobile Leasing Trust | 798 | 801,626 | ||||||||||
| AB BOND INFLATION STRATEGY • | 27 |
Portfolio of Investments
| Principal Amount (000) | U.S. $ Value | |||||||||||
| ||||||||||||
GMF Floorplan Owner Revolving Trust | U.S.$ | 599 | $ | 600,503 | ||||||||
Harley-Davidson Motorcycle Trust | 292 | 292,205 | ||||||||||
Hertz Vehicle Financing II LP | 508 | 506,031 | ||||||||||
Hertz Vehicle Financing LLC | 368 | 361,514 | ||||||||||
Series 2016-1A, Class A | 322 | 322,896 | ||||||||||
Hyundai Auto Lease Securitization Trust | 46 | 45,582 | ||||||||||
Series 2015-B, Class A3 | 557 | 558,406 | ||||||||||
Mercedes-Benz Auto Lease Trust | 318 | 318,596 | ||||||||||
Nissan Auto Lease Trust | 587 | 588,020 | ||||||||||
Santander Drive Auto Receivables Trust | 750 | 758,930 | ||||||||||
Series 2015-3, Class A2A | 8 | 8,098 | ||||||||||
Series 2015-4,Class A2A | 64 | 64,421 | ||||||||||
Series 2016-3, Class A2 | 352 | 351,865 | ||||||||||
TCF Auto Receivables Owner Trust | 28 | 27,741 | ||||||||||
Westlake Automobile Receivables Trust | 143 | 142,812 | ||||||||||
|
| |||||||||||
| 14,392,387 | ||||||||||||
|
| |||||||||||
Other ABS - Fixed Rate – 1.1% | ||||||||||||
Citi Held For Asset Issuance | 278 | 283,180 | ||||||||||
CNH Equipment Trust | 493 | 498,027 | ||||||||||
| 28 | • AB BOND INFLATION STRATEGY |
Portfolio of Investments
| Principal Amount (000) | U.S. $ Value | |||||||||||
| ||||||||||||
Dell Equipment Finance Trust | U.S.$ | 247 | $ | 247,151 | ||||||||
Series 2015-2, Class A2A | 208 | 208,603 | ||||||||||
Marlette Funding Trust | 266 | 266,929 | ||||||||||
SBA Tower Trust | 851 | 870,573 | ||||||||||
SoFi Consumer Loan Program LLC | 358 | 359,255 | ||||||||||
Sofi Consumer Loan Program LLC | 482 | 481,990 | ||||||||||
Taco Bell Funding LLC | 481 | 487,615 | ||||||||||
|
| |||||||||||
| 3,703,323 | ||||||||||||
|
| |||||||||||
Autos - Floating Rate – 1.1% | ||||||||||||
BMW Floorplan Master Owner Trust | 1,037 | 1,038,825 | ||||||||||
Ford Credit Floorplan Master Owner Trust | 692 | 692,550 | ||||||||||
Hertz Fleet Lease Funding LP | 240 | 239,986 | ||||||||||
Volkswagen Credit Auto Master Trust | 330 | 329,361 | ||||||||||
Wells Fargo Dealer Floorplan Master Note Trust | 534 | 534,320 | ||||||||||
Series 2015-1, Class A | 620 | 618,613 | ||||||||||
|
| |||||||||||
| 3,453,655 | ||||||||||||
|
| |||||||||||
Credit Cards - Fixed Rate – 0.6% | ||||||||||||
Synchrony Credit Card Master Note Trust | 1,084 | 1,100,735 | ||||||||||
| AB BOND INFLATION STRATEGY • | 29 |
Portfolio of Investments
| Principal Amount (000) | U.S. $ Value | |||||||||||
| ||||||||||||
Series 2016-1, Class A | U.S.$ | 209 | $ | 211,466 | ||||||||
World Financial Network Credit Card Master | 373 | 374,437 | ||||||||||
Series 2016-B, Class A | 313 | 313,035 | ||||||||||
|
| |||||||||||
| 1,999,673 | ||||||||||||
|
| |||||||||||
Credit Cards - Floating Rate – 0.3% | ||||||||||||
Cabela’s Credit Card Master Note Trust | 600 | 600,000 | ||||||||||
World Financial Network Credit Card Master Trust | 403 | 403,849 | ||||||||||
|
| |||||||||||
| 1,003,849 | ||||||||||||
|
| |||||||||||
Total Asset-Backed Securities | 24,552,887 | |||||||||||
|
| |||||||||||
COLLATERALIZED MORTGAGE OBLIGATIONS – 6.3% | ||||||||||||
Risk Share Floating Rate – 5.0% | ||||||||||||
Bellemeade Re II Ltd. | 272 | 274,743 | ||||||||||
Bellemeade Re Ltd. | 90 | 90,269 | ||||||||||
Federal Home Loan Mortgage Corp. Structured | 1,030 | 1,084,479 | ||||||||||
Series 2014-DN3, Class M3 | 1,055 | 1,101,443 | ||||||||||
Series 2014-HQ3, Class M3 | 323 | 340,426 | ||||||||||
Series 2015-DNA1, Class M3 | 260 | 266,534 | ||||||||||
Series 2015-DNA2, Class M2 | 1,046 | 1,059,879 | ||||||||||
| 30 | • AB BOND INFLATION STRATEGY |
Portfolio of Investments
| Principal Amount (000) | U.S. $ Value | |||||||||||
| ||||||||||||
Series 2015-DNA3, Class M3 | U.S.$ | 281 | $ | 296,277 | ||||||||
Series 2015-HQ1, Class M2 | 410 | 414,677 | ||||||||||
Series 2015-HQA1, Class M2 | 770 | 783,339 | ||||||||||
Series 2015-HQA2, Class M2 | 294 | 301,589 | ||||||||||
Series 2015-HQA2, Class M3 | 276 | 292,936 | ||||||||||
Series 2016-DNA1, Class M3 | 324 | 349,849 | ||||||||||
Series 2016-DNA2, Class M3 5.184% (LIBOR 1 Month + 4.65%), | 299 | 311,789 | ||||||||||
Series 2016-DNA4, Class M3 4.334% (LIBOR 1 Month + 3.80%), | 277 | 274,084 | ||||||||||
Series 2016-HQA1, Class M3 | 600 | 669,928 | ||||||||||
Federal National Mortgage Association | 142 | 142,345 | ||||||||||
Series 2014-C04, Class 1M2 | 528 | 564,296 | ||||||||||
Series 2014-C04, Class 2M2 | 195 | 208,578 | ||||||||||
Series 2015-C01, Class 1M2 | 450 | 466,576 | ||||||||||
Series 2015-C01, Class 2M2 | 509 | 529,371 | ||||||||||
Series 2015-C02, Class 1M2 | 571 | 589,612 | ||||||||||
| AB BOND INFLATION STRATEGY • | 31 |
Portfolio of Investments
| Principal Amount (000) | U.S. $ Value | |||||||||||
| ||||||||||||
Series 2015-C02, Class 2M2 | U.S.$ | 445 | $ | 458,977 | ||||||||
Series 2015-C03, Class 1M1 | 158 | 157,930 | ||||||||||
Series 2015-C03, Class 1M2 | 691 | 735,607 | ||||||||||
Series 2015-C03, Class 2M2 | 679 | 722,625 | ||||||||||
Series 2015-C04, Class 1M2 | 204 | 218,191 | ||||||||||
Series 2015-C04, Class 2M2 | 620 | 659,494 | ||||||||||
Series 2016-C01, Class 1M2 | 587 | 656,475 | ||||||||||
Series 2016-C01, Class 2M2 | 446 | 500,490 | ||||||||||
Series 2016-C02, Class 1M2 | 505 | 554,205 | ||||||||||
Series 2016-C03, Class 1M2 | 86 | 91,906 | ||||||||||
Series 2016-C03, Class 2M2 | 414 | 445,796 | ||||||||||
Series 2016-C05, Class 2M2 | 211 | 216,724 | ||||||||||
Wells Fargo Credit Risk Transfer Securities Trust | 160 | 160,375 | ||||||||||
Series 2015-WF1, Class 2M1 | 225 | 225,114 | ||||||||||
|
| |||||||||||
| 16,216,928 | ||||||||||||
|
| |||||||||||
Agency Floating Rate – 1.2% | ||||||||||||
Federal Home Loan Mortgage Corp. REMICs | 1,682 | 350,345 | ||||||||||
| 32 | • AB BOND INFLATION STRATEGY |
Portfolio of Investments
| Principal Amount (000) | U.S. $ Value | |||||||||||
| ||||||||||||
Series 4593, Class SA | U.S.$ | 1,926 | $ | 470,541 | ||||||||
Federal National Mortgage Association REMICs | 1,748 | 431,068 | ||||||||||
Series 2015-66, Class AS | 2,249 | 447,233 | ||||||||||
Series 2016-11, Class SG | 2,322 | 470,573 | ||||||||||
Series 2016-22, Class ST | 2,271 | 429,477 | ||||||||||
Series 2016-79, Class JS | 1,744 | 393,531 | ||||||||||
Government National Mortgage Association | 2,245 | 459,087 | ||||||||||
Series 2016-108, Class SM | 1,885 | 513,121 | ||||||||||
|
| |||||||||||
| 3,964,976 | ||||||||||||
|
| |||||||||||
Agency Fixed Rate – 0.1% | ||||||||||||
Federal National Mortgage Association REMICs | 2,310 | 458,393 | ||||||||||
|
| |||||||||||
Total Collateralized Mortgage Obligations | 20,640,297 | |||||||||||
|
| |||||||||||
CORPORATES – NON-INVESTMENT GRADE – 3.2% | ||||||||||||
Industrial – 2.1% |
| |||||||||||
Capital Goods – 0.1% |
| |||||||||||
SPX FLOW, Inc. | 106 | 107,458 | ||||||||||
5.875%, 8/15/26(c) | 106 | 107,590 | ||||||||||
|
| |||||||||||
| 215,048 | ||||||||||||
|
| |||||||||||
Communications - Media – 0.2% | ||||||||||||
CSC Holdings LLC | 145 | 152,613 | ||||||||||
Ziggo Secured Finance BV | 485 | 478,937 | ||||||||||
|
| |||||||||||
| 631,550 | ||||||||||||
|
| |||||||||||
| AB BOND INFLATION STRATEGY • | 33 |
Portfolio of Investments
| Principal Amount (000) | U.S. $ Value | |||||||||||
| ||||||||||||
Communications - | ||||||||||||
CenturyLink, Inc. | U.S.$ | 233 | $ | 248,728 | ||||||||
Series Y | 213 | 221,786 | ||||||||||
SFR Group SA | EUR | 231 | 264,431 | |||||||||
Sprint Capital Corp. | U.S.$ | 1,000 | 1,052,500 | |||||||||
Wind Acquisition Finance SA | 340 | 341,700 | ||||||||||
|
| |||||||||||
| 2,129,145 | ||||||||||||
|
| |||||||||||
Consumer Cyclical - Automotive – 0.1% | ||||||||||||
Adient Global Holdings Ltd. | 321 | 315,736 | ||||||||||
Allison Transmission, Inc. | 197 | 200,940 | ||||||||||
|
| |||||||||||
| 516,676 | ||||||||||||
|
| |||||||||||
Consumer Cyclical - Other – 0.4% | ||||||||||||
International Game Technology PLC | 360 | 381,600 | ||||||||||
6.50%, 2/15/25(c) | 460 | 497,858 | ||||||||||
KB Home | 345 | 352,762 | ||||||||||
|
| |||||||||||
| 1,232,220 | ||||||||||||
|
| |||||||||||
Consumer Cyclical - Retailers – 0.1% | ||||||||||||
Hanesbrands, Inc. | 200 | 203,375 | ||||||||||
|
| |||||||||||
Consumer Non-Cyclical – 0.1% | ||||||||||||
Valeant Pharmaceuticals International, Inc. | 385 | 304,150 | ||||||||||
|
| |||||||||||
Energy – 0.3% | ||||||||||||
Cenovus Energy, Inc. | 33 | 32,074 | ||||||||||
5.70%, 10/15/19 | 159 | 171,814 | ||||||||||
Diamond Offshore Drilling, Inc. | 350 | 256,389 | ||||||||||
Sabine Pass Liquefaction LLC | 418 | 425,315 | ||||||||||
SM Energy Co. | 41 | 40,795 | ||||||||||
|
| |||||||||||
| 926,387 | ||||||||||||
|
| |||||||||||
Technology – 0.1% | ||||||||||||
Diamond 1 Finance Corp./Diamond 2 Finance Corp. | 325 | 356,023 | ||||||||||
|
| |||||||||||
| 34 | • AB BOND INFLATION STRATEGY |
Portfolio of Investments
| Principal Amount (000) | U.S. $ Value | |||||||||||
| ||||||||||||
Transportation - Services – 0.1% | ||||||||||||
Avis Budget Car Rental LLC/Avis Budget Finance, Inc. | U.S.$ | 270 | $ | 256,500 | ||||||||
|
| |||||||||||
| 6,771,074 | ||||||||||||
|
| |||||||||||
Financial Institutions – 1.0% | ||||||||||||
Banking – 0.9% | ||||||||||||
Bank of America Corp. | 233 | 252,805 | ||||||||||
Barclays Bank PLC | 137 | 159,119 | ||||||||||
7.75%, 4/10/23 | 372 | 390,600 | ||||||||||
Credit Agricole SA | 260 | 280,800 | ||||||||||
Intesa Sanpaolo SpA | 689 | 639,379 | ||||||||||
Royal Bank of Scotland Group PLC | 480 | 477,600 | ||||||||||
Series U | 100 | 97,000 | ||||||||||
Royal Bank of Scotland PLC (The) | 29 | 29,747 | ||||||||||
Societe Generale SA | 115 | 116,095 | ||||||||||
Standard Chartered PLC | 400 | 388,500 | ||||||||||
|
| |||||||||||
| 2,831,645 | ||||||||||||
|
| |||||||||||
Finance – 0.1% | ||||||||||||
Navient Corp. | 415 | 418,112 | ||||||||||
7.25%, 1/25/22 | 54 | 54,540 | ||||||||||
|
| |||||||||||
| 472,652 | ||||||||||||
|
| |||||||||||
| 3,304,297 | ||||||||||||
|
| |||||||||||
Non Corporate Sectors – 0.1% | ||||||||||||
Agencies - Not Government Guaranteed – 0.1% | ||||||||||||
NOVA Chemicals Corp. | 391 | 398,331 | ||||||||||
|
| |||||||||||
Total Corporates – Non-Investment Grade | 10,473,702 | |||||||||||
|
| |||||||||||
EMERGING MARKETS – TREASURIES – 1.0% | ||||||||||||
Brazil – 1.0% | ||||||||||||
Brazil Notas do Tesouro Nacional | BRL | 10,530 | 3,149,965 | |||||||||
|
| |||||||||||
| AB BOND INFLATION STRATEGY • | 35 |
Portfolio of Investments
| Principal Amount (000) | U.S. $ Value | |||||||||||
| ||||||||||||
GOVERNMENTS – SOVEREIGN AGENCIES – 0.6% | ||||||||||||
Brazil – 0.2% | ||||||||||||
Petrobras Global Finance BV | U.S.$ | 693 | $ | 715,176 | ||||||||
|
| |||||||||||
Colombia – 0.1% | ||||||||||||
Ecopetrol SA | 292 | 258,420 | ||||||||||
|
| |||||||||||
Israel – 0.2% | ||||||||||||
Israel Electric Corp. Ltd. | 620 | 667,740 | ||||||||||
|
| |||||||||||
United Kingdom – 0.1% | ||||||||||||
Royal Bank of Scotland Group PLC | 345 | 316,538 | ||||||||||
|
| |||||||||||
Total Governments – Sovereign Agencies | 1,957,874 | |||||||||||
|
| |||||||||||
QUASI-SOVEREIGNS – 0.5% | ||||||||||||
Quasi-Sovereign Bonds – 0.5% | ||||||||||||
Chile – 0.1% | ||||||||||||
Empresa de Transporte de Pasajeros Metro SA | 358 | 392,084 | ||||||||||
|
| |||||||||||
Mexico – 0.2% | ||||||||||||
Petroleos Mexicanos | 657 | 655,226 | ||||||||||
|
| |||||||||||
South Korea – 0.2% | ||||||||||||
Korea National Oil Corp. | 450 | 453,230 | ||||||||||
|
| |||||||||||
Total Quasi-Sovereigns | 1,500,540 | |||||||||||
|
| |||||||||||
EMERGING MARKETS – CORPORATE BONDS – 0.4% | ||||||||||||
Industrial – 0.4% | ||||||||||||
Capital Goods – 0.1% | ||||||||||||
Odebrecht Finance Ltd. | 426 | 203,947 | ||||||||||
7.125%, 6/26/42(c) | 368 | 182,160 | ||||||||||
|
| |||||||||||
| 386,107 | ||||||||||||
|
| |||||||||||
Communications - Telecommunications – 0.1% | ||||||||||||
MTN Mauritius Investment Ltd. | 328 | 330,348 | ||||||||||
|
| |||||||||||
| 36 | • AB BOND INFLATION STRATEGY |
Portfolio of Investments
| Principal Amount (000) | U.S. $ Value | |||||||||||
| ||||||||||||
Consumer Non-Cyclical – 0.1% | ||||||||||||
Minerva Luxembourg SA | U.S.$ | 218 | $ | 212,223 | ||||||||
Virgolino de Oliveira Finance SA | 655 | 46,178 | ||||||||||
|
| |||||||||||
| 258,401 | ||||||||||||
|
| |||||||||||
Energy – 0.1% | ||||||||||||
Ultrapar International SA | 330 | 334,917 | ||||||||||
|
| |||||||||||
Total Emerging Markets – Corporate Bonds | 1,309,773 | |||||||||||
|
| |||||||||||
GOVERNMENTS – SOVEREIGN BONDS – 0.2% | ||||||||||||
Mexico – 0.1% | ||||||||||||
Mexico Government International Bond | 168 | 185,640 | ||||||||||
|
| |||||||||||
Qatar – 0.1% | ||||||||||||
Qatar Government International Bond | 537 | 539,014 | ||||||||||
|
| |||||||||||
Total Governments – Sovereign Bonds | 724,654 | |||||||||||
|
| |||||||||||
| Shares | ||||||||||||
COMMON STOCKS – 0.1% | ||||||||||||
Financials – 0.1% | ||||||||||||
Insurance – 0.1% | ||||||||||||
Mt. Logan Re Ltd. | 415 | 429,612 | ||||||||||
|
| |||||||||||
| Notional Amount (000) | ||||||||||||
OPTIONS PURCHASED – CALLS – 0.0% | ||||||||||||
Swaptions – 0.0% | ||||||||||||
IRS RTR Swaption, Citibank, NA Expiration: Jan 2017, | 7,300 | 17,666 | ||||||||||
|
| |||||||||||
Total Investments – 140.2% | 458,167,417 | |||||||||||
Other assets less liabilities – (40.2)% | (131,411,909 | ) | ||||||||||
|
| |||||||||||
Net Assets – 100.0% | $ | 326,755,508 | ||||||||||
|
| |||||||||||
| AB BOND INFLATION STRATEGY • | 37 |
Portfolio of Investments
FUTURES (see Note D)
| Type | Number of Contracts | Expiration Month | Original Value | Value at October 31, 2016 | Unrealized Appreciation/ (Depreciation) | |||||||||||||||
Purchased Contracts |
| |||||||||||||||||||
U.S. T-Note | 25 | December 2016 | $ | 3,015,076 | $ | 3,019,922 | $ | 4,846 | ||||||||||||
U.S. Ultra Bond | 12 | December 2016 | 2,226,215 | 2,111,250 | (114,965 | ) | ||||||||||||||
Sold Contracts |
| |||||||||||||||||||
Euro-BOBL Futures | 77 | December 2016 | 11,145,960 | 11,082,305 | 63,655 | |||||||||||||||
U.S. T-Note | 31 | December 2016 | 4,043,029 | 4,018,375 | 24,654 | |||||||||||||||
|
| |||||||||||||||||||
| $ | (21,810 | ) | ||||||||||||||||||
|
| |||||||||||||||||||
FORWARD CURRENCY EXCHANGE CONTRACTS (see Note D)
| Counterparty | Contracts to Deliver (000) | In Exchange For (000) | Settlement Date | Unrealized Appreciation/ (Depreciation) | ||||||||||||||||
BNP Paribas SA | CAD | 5,765 | USD | 4,491 | 11/10/16 | $ | 192,775 | |||||||||||||
Citibank, NA | MXN | 13,604 | USD | 728 | 11/22/16 | 9,584 | ||||||||||||||
Citibank, NA | USD | 2,288 | MXN | 44,799 | 11/22/16 | 77,215 | ||||||||||||||
Citibank, NA | JPY | 2,667,260 | USD | 25,625 | 12/09/16 | 156,499 | ||||||||||||||
Citibank, NA | INR | 48,785 | USD | 724 | 12/15/16 | (2,754 | ) | |||||||||||||
Citibank, NA | USD | 1,438 | INR | 97,358 | 12/15/16 | 12,480 | ||||||||||||||
Goldman Sachs Bank USA | BRL | 5,150 | USD | 1,120 | 1/04/17 | (463,376 | ) | |||||||||||||
Morgan Stanley & Co. | BRL | 2,465 | USD | 775 | 11/03/16 | 2,646 | ||||||||||||||
Morgan Stanley & Co. | USD | 786 | BRL | 2,465 | 11/03/16 | (13,339 | ) | |||||||||||||
Morgan Stanley & Co. | BRL | 2,465 | USD | 779 | 12/02/16 | 13,115 | ||||||||||||||
Royal Bank of Scotland PLC | EUR | 3,822 | USD | 4,270 | 11/15/16 | 72,685 | ||||||||||||||
Standard Chartered Bank | BRL | 2,465 | USD | 754 | 11/03/16 | (18,593 | ) | |||||||||||||
Standard Chartered Bank | USD | 775 | BRL | 2,465 | 11/03/16 | (2,646 | ) | |||||||||||||
Standard Chartered Bank | INR | 47,706 | USD | 707 | 12/15/16 | (3,450 | ) | |||||||||||||
State Street Bank & Trust Co. | EUR | 873 | USD | 953 | 11/15/16 | (6,396 | ) | |||||||||||||
State Street Bank & Trust Co. | GBP | 100 | USD | 130 | 11/16/16 | 7,387 | ||||||||||||||
State Street Bank & Trust Co. | SGD | 4,365 | USD | 3,206 | 12/14/16 | 67,497 | ||||||||||||||
State Street Bank & Trust Co. | AUD | 321 | USD | 245 | 1/19/17 | 1,206 | ||||||||||||||
|
| |||||||||||||||||||
| $ | 102,535 | |||||||||||||||||||
|
| |||||||||||||||||||
INTEREST RATE SWAPTIONS WRITTEN (see Note D)
| Description | Index | Counterparty | Strike Rate | Expiration Date | Notional Amount (000) | Premiums Received | Market Value | |||||||||||||||||||||
Open | 3 Month LIBOR | Citibank, NA | 2.15 | % | 1/12/17 | $ | 7,300 | $ | 13,870 | $ | (9,883 | ) | ||||||||||||||||
| 38 | • AB BOND INFLATION STRATEGY |
Portfolio of Investments
CENTRALLY CLEARED CREDIT DEFAULT SWAPS (see Note D)
| Clearing Broker/(Exchange) & Referenced Obligation | Fixed Rate (Pay) Receive | Implied Credit Spread at October 31, 2016 | Notional Amount (000) | Market Value | Unrealized Appreciation/ (Depreciation) | |||||||||||||||
Buy Contracts | ||||||||||||||||||||
Citigroup Global Markets, Inc./(INTRCONX) | ||||||||||||||||||||
CDX-NAHY Series 21, | (5.00 | )% | 2.06 | % | $ | 3,379 | $ | (225,064 | ) | $ | (122,699 | ) | ||||||||
Morgan Stanley & Co., LLC/(INTRCONX) | ||||||||||||||||||||
CDX-NAIG Series 23, | (1.00 | ) | 0.57 | 18,250 | (260,897 | ) | (78,093 | ) | ||||||||||||
|
|
|
| |||||||||||||||||
| $ | (485,961 | ) | $ | (200,792 | ) | |||||||||||||||
|
|
|
| |||||||||||||||||
| * | Termination date |
CENTRALLY CLEARED INTEREST RATE SWAPS (see Note D)
| Rate Type | ||||||||||||||||
| Clearing Broker/ (Exchange) | Notional Amount (000) | Termination Date | Payments made by the Fund | Payments received by the Fund | Unrealized Appreciation/ (Depreciation) | |||||||||||
Citigroup Global Markets, Inc./(CME Group) | $ | 2,850 | 10/04/21 | 1.195% | 3 Month LIBOR | $ | 20,220 | |||||||||
Citigroup Global Markets, Inc./(LCH Group) | NOK | 11,080 | 8/04/18 | 1.008% | 6 Month NIBOR | 5,921 | ||||||||||
Morgan Stanley & Co., LLC/(CME Group) | $ | 23,060 | 5/18/17 | 0.811% | 3 Month LIBOR | (31,400 | ) | |||||||||
Morgan Stanley & Co., LLC/(CME Group) | NOK | 190,780 | 5/12/18 | 0.954% | 6 Month NIBOR | 107,920 | ||||||||||
Morgan Stanley & Co., LLC/(CME Group) | 62,880 | 5/19/18 | 1.007% | 6 Month NIBOR | 29,477 | |||||||||||
Morgan Stanley & Co., LLC/(CME Group) | NZD | 41,440 | 7/28/18 | 2.050% | 3 Month BKBM | (120,509 | ) | |||||||||
Morgan Stanley & Co., LLC/(CME Group) | $ | 6,980 | 10/31/19 | 3 Month LIBOR | 1.747% | 118,943 | ||||||||||
| AB BOND INFLATION STRATEGY • | 39 |
Portfolio of Investments
| Rate Type | ||||||||||||||||
| Clearing Broker/ (Exchange) | Notional Amount (000) | Termination Date | Payments made by the Fund | Payments received by the Fund | Unrealized Appreciation/ (Depreciation) | |||||||||||
Morgan Stanley & Co., LLC/(CME Group) | $ | 6,420 | 8/11/20 | 3 Month LIBOR | 1.712% | $ | 123,980 | |||||||||
Morgan Stanley & Co., LLC/(CME Group) | 8,020 | 4/27/21 | 3 Month LIBOR | 1.341% | 12,928 | |||||||||||
Morgan Stanley & Co., LLC/(CME Group) | 6,620 | 8/31/21 | 1.256% | 3 Month LIBOR | 21,019 | |||||||||||
Morgan Stanley & Co., LLC/(CME Group) | 2,610 | 1/14/24 | 2.980% | 3 Month LIBOR | (282,264 | ) | ||||||||||
Morgan Stanley & Co., LLC/(CME Group) | 2,300 | 2/14/24 | 2.889% | 3 Month LIBOR | (225,884 | ) | ||||||||||
Morgan Stanley & Co., LLC/(CME Group) | 3,280 | 4/28/24 | 2.817% | 3 Month LIBOR | (296,696 | ) | ||||||||||
Morgan Stanley & Co., LLC/(CME Group) | 4,670 | 5/06/24 | 2.736% | 3 Month LIBOR | (448,436 | ) | ||||||||||
Morgan Stanley & Co., LLC/(CME Group) | 1,890 | 5/29/24 | 3 Month LIBOR | 2.628% | 163,562 | |||||||||||
Morgan Stanley & Co., LLC/(CME Group) | 3,330 | 7/02/24 | 2.632% | 3 Month LIBOR | (284,655 | ) | ||||||||||
Morgan Stanley & Co., LLC/(CME Group) | 2,370 | 7/10/24 | 2.674% | 3 Month LIBOR | (209,833 | ) | ||||||||||
Morgan Stanley & Co., LLC/(CME Group) | 1,160 | 6/09/25 | 2.488% | 3 Month LIBOR | (90,490 | ) | ||||||||||
Morgan Stanley & Co., LLC/(CME Group) | 2,106 | 8/04/25 | 2.293% | 3 Month LIBOR | (120,722 | ) | ||||||||||
| 40 | • AB BOND INFLATION STRATEGY |
Portfolio of Investments
| Rate Type | ||||||||||||||||||||
| Clearing Broker/ (Exchange) | Notional Amount (000) | Termination Date | Payments made by the Fund | Payments received by the Fund | Unrealized Appreciation/ (Depreciation) | |||||||||||||||
Morgan Stanley & Co., LLC/(CME Group) | NZD | 4,470 | 7/28/26 | 3 Month BKBM | 2.473% | $ | (73,995 | ) | ||||||||||||
Morgan Stanley & Co., LLC/(CME Group) | $ | 5,400 | 10/04/26 | 1.487% | 3 Month LIBOR | 115,152 | ||||||||||||||
Morgan Stanley & Co., LLC/(CME Group) | 3,550 | 10/11/26 | 1.615% | 3 Month LIBOR | 33,936 | |||||||||||||||
Morgan Stanley & Co., LLC/(CME Group) | 3,750 | 10/14/26 | 1.649% | 3 Month LIBOR | 23,820 | |||||||||||||||
Morgan Stanley & Co., LLC/(CME Group) | 1,490 | 11/10/35 | 2.631% | 3 Month LIBOR | (171,278 | ) | ||||||||||||||
Morgan Stanley & Co., LLC/(CME Group) | 490 | 8/06/45 | 2.692% | 3 Month LIBOR | (71,257 | ) | ||||||||||||||
Morgan Stanley & Co., LLC/(LCH Group) | NOK | 42,730 | 8/01/18 | 0.960% | 6 Month NIBOR | 26,323 | ||||||||||||||
Morgan Stanley & Co., LLC/(LCH Group) | 47,470 | 8/11/18 | 1.076% | 6 Month NIBOR | 18,347 | |||||||||||||||
Morgan Stanley & Co., LLC/(LCH Group) | 31,650 | 8/12/18 | 1.128% | 6 Month NIBOR | 8,885 | |||||||||||||||
|
| |||||||||||||||||||
| $ | (1,596,986 | ) | ||||||||||||||||||
|
| |||||||||||||||||||
CREDIT DEFAULT SWAPS (see Note D)
| Swap Counterparty & Referenced Obligation | Fixed Rate (Pay) Receive | Implied Credit Spread at October 31, 2016 | Notional Amount (000) | Market Value | Upfront Premiums Paid (Received) | Unrealized Appreciation/ (Depreciation) | ||||||||||||||||||
Buy Contracts | ||||||||||||||||||||||||
Citibank, NA | ||||||||||||||||||||||||
Advanced Micro Devices, Inc., 7.75%, 8/01/20, 3/20/19* | (5.00 | )% | 1.32 | % | $ | 280 | $ | (25,344 | ) | $ | 11,927 | $ | (37,271 | ) | ||||||||||
| AB BOND INFLATION STRATEGY • | 41 |
Portfolio of Investments
| Swap Counterparty & Referenced Obligation | Fixed Rate (Pay) Receive | Implied Credit Spread at October 31, 2016 | Notional Amount (000) | Market Value | Upfront Premiums Paid (Received) | Unrealized Appreciation/ (Depreciation) | ||||||||||||||||||
Sprint Communications, Inc., | (5.00 | )% | 2.70 | % | $ | 466 | $ | (28,283 | ) | $ | (15,079 | ) | $ | (13,204 | ) | |||||||||
Sprint Communications, Inc., | (5.00 | ) | 2.70 | 534 | (32,409 | ) | (17,916 | ) | (14,493 | ) | ||||||||||||||
Sale Contracts | ||||||||||||||||||||||||
Bank of America, NA |
| |||||||||||||||||||||||
CDX-NAIG | 1.00 | 0.18 | 3,200 | 33,668 | 694 | 32,974 | ||||||||||||||||||
Credit Suisse International | ||||||||||||||||||||||||
CDX-CMBX.NA.BBB Series 6, 5/11/63* | 3.00 | 4.66 | 471 | (38,301 | ) | (32,677 | ) | (5,624 | ) | |||||||||||||||
CDX-CMBX.NA.BBB Series 6, 5/11/63* | 3.00 | 4.66 | 138 | (11,221 | ) | (10,232 | ) | (989 | ) | |||||||||||||||
CDX-CMBX.NA.BBB Series 6, 5/11/63* | 3.00 | 4.66 | 130 | (10,571 | ) | (11,306 | ) | 735 | ||||||||||||||||
CDX-CMBX.NA.BBB Series 6, 5/11/63* | 3.00 | 4.66 | 169 | (13,742 | ) | (15,010 | ) | 1,268 | ||||||||||||||||
CDX-CMBX.NA.BBB | 3.00 | 4.66 | 326 | (26,510 | ) | (33,357 | ) | 6,847 | ||||||||||||||||
Deutsche Bank AG | ||||||||||||||||||||||||
Anadarko Petroleum Corp., | 1.00 | 0.36 | 440 | 2,961 | (2,739 | ) | 5,700 | |||||||||||||||||
CDX-CMBX.NA.BBB | 3.00 | 4.66 | 436 | (35,454 | ) | (33,545 | ) | (1,909 | ) | |||||||||||||||
CDX-CMBX.NA.BBB | 3.00 | 4.66 | 662 | (53,831 | ) | (49,757 | ) | (4,074 | ) | |||||||||||||||
CDX-CMBX.NA.BBB | 3.00 | 4.66 | 714 | (58,060 | ) | (43,952 | ) | (14,108 | ) | |||||||||||||||
|
|
|
|
|
| |||||||||||||||||||
| $ | (297,097 | ) | $ | (252,949 | ) | $ | (44,148 | ) | ||||||||||||||||
|
|
|
|
|
| |||||||||||||||||||
| * | Termination date |
| 42 | • AB BOND INFLATION STRATEGY |
Portfolio of Investments
INFLATION (CPI) SWAPS (see Note D)
| Rate Type | ||||||||||||||||
| Swap Counterparty | Notional Amount (000) | Termination Date | Payments made by the Fund | Payments received by the Fund | Unrealized Appreciation/ (Depreciation) | |||||||||||
Barclays Bank PLC | $ | 2,570 | 7/15/19 | 1.370% | CPI# | $ | 23,504 | |||||||||
Barclays Bank PLC | 20,750 | 7/15/20 | 1.527% | CPI# | 159,106 | |||||||||||
Barclays Bank PLC | 6,950 | 1/15/21 | 1.490% | CPI# | 50,963 | |||||||||||
Deutsche Bank AG | 3,460 | 7/15/18 | 1.440% | CPI# | 13,149 | |||||||||||
JPMorgan Chase Bank, NA | 8,710 | 1/15/20 | 1.795% | CPI# | (38,965 | ) | ||||||||||
|
| |||||||||||||||
| $ | 207,757 | |||||||||||||||
|
| |||||||||||||||
| # | Variable interest rate based on the rate of inflation as determined by the Consumer Price Index (CPI). |
INTEREST RATE SWAPS (see Note D)
| Rate Type | ||||||||||||||||||
| Swap Counterparty | Notional Amount (000) | Termination Date | Payments made by the Fund | Payments received by the Fund | Unrealized Appreciation/ (Depreciation) | |||||||||||||
Morgan Stanley Capital Services LLC | $ | 1,100 | 2/21/42 | 2.813 | % | 3 Month LIBOR | $ | (185,228 | ) | |||||||||
Morgan Stanley Capital Services LLC | 830 | 3/06/42 | 2.804 | % | 3 Month LIBOR | (137,752 | ) | |||||||||||
|
| |||||||||||||||||
| $ | (322,980 | ) | ||||||||||||||||
|
| |||||||||||||||||
REVERSE REPURCHASE AGREEMENTS (see Note D)
| Broker | Interest Rate | Maturity | U.S. $ Value at October 31, 2016 | |||||||||
Bank of America NA | 0.60 | % | 11/08/16 | $ | 5,581,901 | |||||||
HSBC Bank USA | 0.56 | % | — | 39,803,107 | ||||||||
HSBC Bank USA | 0.56 | % | — | 4,984,065 | ||||||||
HSBC Bank USA | 0.78 | % | 1/10/17 | 17,689,662 | ||||||||
HSBC Bank USA | 0.80 | % | 1/09/17 | 36,485,769 | ||||||||
HSBC Bank USA | 0.80 | % | 1/10/17 | 10,508,631 | ||||||||
JPMorgan Chase Bank | 0.48 | % | 11/17/16 | 16,489,343 | ||||||||
JPMorgan Chase Bank | (0.24 | )% | 11/01/16 | 13,641,480 | ||||||||
JPMorgan Chase Bank | 0.60 | % | 11/01/18 | 3,142,500 | ||||||||
|
| |||||||||||
| $ | 148,326,458 | |||||||||||
|
| |||||||||||
| AB BOND INFLATION STRATEGY • | 43 |
Portfolio of Investments
The type of underlying collateral and the remaining maturity of open reverse repurchase agreements in relation to the reverse repurchase agreements on the statements of assets and liabilities is as follows:
| Overnight and Continuous | Up to 30 Days | 31-90 Days | Greater than 90 Days | Total | ||||||||||||||||
Inflation-Linked Securities | $ | 44,787,172 | $ | 35,712,724 | $ | 64,684,062 | $ | 3,142,500 | $ | 148,326,458 | ||||||||||
|
|
|
|
|
|
|
|
|
| |||||||||||
Total | $ | 44,787,172 | $ | 35,712,724 | $ | 64,684,062 | $ | 3,142,500 | $ | 148,326,458 | ||||||||||
|
|
|
|
|
|
|
|
|
| |||||||||||
| (a) | Position, or a portion thereof, has been segregated to collateralize reverse repurchase agreements. |
| (b) | Position, or a portion thereof, has been segregated to collateralize OTC derivatives outstanding. |
| (c) | Security is exempt from registration under Rule 144A of the Securities Act of 1933. These securities are considered restricted, but liquid and may be resold in transactions exempt from registration, normally to qualified institutional buyers. At October 31, 2016, the aggregate market value of these securities amounted to $46,060,731 or 14.1% of net assets. |
| (d) | Securities are perpetual and, thus, do not have a predetermined maturity date. The date shown, if applicable, reflects the next call date. |
| (e) | Floating Rate Security. Stated interest/floor rate was in effect at October 31, 2016. |
| (f) | Security is exempt from registration under Rule 144A of the Securities Act of 1933. These securities, which represent 0.39% of net assets as of October 31, 2016, are considered illiquid and restricted. Additional information regarding such securities follows: |
| 144A/Restricted & Illiquid Securities | Acquisition Date | Cost | Market Value | Percentage of Net Assets | ||||||||||||
Bellemeade Re II Ltd. | 4/29/16 | $ | 271,519 | $ | 274,743 | 0.08 | % | |||||||||
Bellemeade Re Ltd. | 7/27/15 | 89,876 | 90,269 | 0.03 | % | |||||||||||
H/2 Asset Funding NRE | 6/19/15 | 643,908 | 637,469 | 0.20 | % | |||||||||||
Virgolino de Oliveira Finance SA | 1/24/14 | 363,153 | 46,178 | 0.01 | % | |||||||||||
Wells Fargo Credit Risk Transfer Securities Trust | 9/28/15 | 225,058 | 225,114 | 0.07 | % | |||||||||||
| (g) | Variable rate coupon, rate shown as of October 31, 2016. |
| (h) | Inverse interest only security. |
| (i) | IO – Interest Only. |
| (j) | Non-income producing security. |
| (k) | Defaulted. |
| (l) | Restricted and illiquid security. |
| Restricted & Illiquid Securities | Acquisition Date | Cost | Market Value | Percentage of Net Assets | ||||||||||||
Mt. Logan Re Ltd. (Preference Shares) | 12/30/15 | $ | 415,000 | $ | 429,612 | 0.13 | % | |||||||||
| 44 | • AB BOND INFLATION STRATEGY |
Portfolio of Investments
| (m) | The security is subject to a 12 month lock-up period, after which semi-annual redemptions are permitted. |
| (n) | Effective prepayment date of April 2017. |
Currency Abbreviations:
AUD – Australian Dollar
BRL – Brazilian Real
CAD – Canadian Dollar
EUR – Euro
GBP – Great British Pound
INR – Indian Rupee
JPY – Japanese Yen
MXN – Mexican Peso
NOK – Norwegian Krone
NZD – New Zealand Dollar
SGD – Singapore Dollar
USD – United States Dollar
Glossary:
ABS – Asset-Backed Securities
BKBM – Bank Bill Benchmark (New Zealand)
BOBL – Bundesobligationen
CBT – Chicago Board of Trade
CDX-CMBX.NA – North American Commercial Mortgage-Backed Index
CDX-NAHY – North American High Yield Credit Default Swap Index
CDX-NAIG – North American Investment Grade Credit Default Swap Index
CMBS – Commercial Mortgage-Backed Securities
CME – Chicago Mercantile Exchange
EURIBOR – Euro Interbank Offered Rate
INTRCONX – Inter-Continental Exchange
IRS – Interest Rate Swaption
LCH – London Clearing House
LIBOR – London Interbank Offered Rates
NIBOR – Norwegian Interbank Offered Rate
REIT – Real Estate Investment Trust
REMICs – Real Estate Mortgage Investment Conduits
RTR – Right To Receive
TIPS – Treasury Inflation Protected Security
See notes to financial statements.
| AB BOND INFLATION STRATEGY • | 45 |
Portfolio of Investments
STATEMENT OF ASSETS & LIABILITIES
October 31, 2016
| Assets | ||||
Investments in securities, at value (cost $450,422,038) | $ | 458,167,417 | ||
Cash | 3,342,760 | |||
Cash collateral due from broker | 1,525,214 | |||
Receivable for investment securities sold | 12,195,059 | |||
Interest receivable | 1,496,244 | |||
Unrealized appreciation on forward currency exchange contracts | 613,089 | |||
Receivable for capital stock sold | 443,889 | |||
Unrealized appreciation on inflation swaps | 246,722 | |||
Unrealized appreciation on credit default swaps | 47,524 | |||
Upfront premium paid on credit default swaps | 12,621 | |||
Receivable for variation margin on exchange-traded derivatives | 6,967 | |||
Affiliated dividends receivable | 1,016 | |||
|
| |||
Total assets | 478,098,522 | |||
|
| |||
| Liabilities | ||||
Swaptions written, at value (premiums received $13,870) | 9,883 | |||
Payable for reverse repurchase agreements | 148,326,458 | |||
Payable for investment securities purchased | 975,570 | |||
Unrealized depreciation on forward currency exchange contracts | 510,554 | |||
Payable for capital stock redeemed | 444,760 | |||
Unrealized depreciation on interest rate swaps | 322,980 | |||
Upfront premium received on credit default swaps | 265,570 | |||
Unrealized depreciation on credit default swaps | 91,672 | |||
Advisory fee payable | 80,540 | |||
Unrealized depreciation on inflation swaps | 38,965 | |||
Payable for variation margin on exchange-traded derivatives | 33,361 | |||
Distribution fee payable | 23,392 | |||
Administrative fee payable | 16,840 | |||
Transfer Agent fee payable | 7,549 | |||
Accrued expenses | 194,920 | |||
|
| |||
Total liabilities | 151,343,014 | |||
|
| |||
Net Assets | $ | 326,755,508 | ||
|
| |||
| Composition of Net Assets | ||||
Capital stock, at par | $ | 30,214 | ||
Additional paid-in capital | 332,370,487 | |||
Undistributed net investment income | 574,964 | |||
Accumulated net realized loss on investment | (12,100,956 | ) | ||
Net unrealized appreciation on investments | 5,880,799 | |||
|
| |||
| $ | 326,755,508 | |||
|
|
See notes to financial statements.
| 46 | • AB BOND INFLATION STRATEGY |
Statement of Assets & Liabilities
Net Asset Value Per Share—27 billion shares of capital stock authorized, $.001 par value
| Shares | Net Asset | |||||||||||
| Class | Net Assets | Outstanding | Value | |||||||||
| ||||||||||||
| A | $ | 16,712,038 | 1,530,553 | $ | 10.92 | * | ||||||
| ||||||||||||
| C | $ | 2,504,409 | 233,798 | $ | 10.71 | |||||||
| ||||||||||||
| Advisor | $ | 29,186,161 | 2,669,834 | $ | 10.93 | |||||||
| ||||||||||||
| R | $ | 408,098 | 37,460 | $ | 10.89 | |||||||
| ||||||||||||
| K | $ | 2,408,522 | 221,113 | $ | 10.89 | |||||||
| ||||||||||||
| I | $ | 345,177 | 31,855 | $ | 10.84 | |||||||
| ||||||||||||
| 1 | $ | 226,407,438 | 20,970,836 | $ | 10.80 | |||||||
| ||||||||||||
| 2 | $ | 37,207,306 | 3,448,193 | $ | 10.79 | |||||||
| ||||||||||||
| Z | $ | 11,576,359 | 1,069,864 | $ | 10.82 | |||||||
| ||||||||||||
| * | The maximum offering price per share for Class A shares was $11.40 which reflects a sales charge of 4.25%. |
See notes to financial statements.
| AB BOND INFLATION STRATEGY • | 47 |
Statement of Assets & Liabilities
STATEMENT OF OPERATIONS
Year Ended October 31, 2016
| Investment Income | ||||||||
Interest | $ | 8,723,434 | ||||||
Dividends | ||||||||
Unaffiliated issuers | 37,898 | |||||||
Affiliated issuers | 15,703 | |||||||
Other income | 2,429 | $ | 8,779,464 | |||||
|
| |||||||
| Expenses | ||||||||
Advisory fee (see Note B) | 1,628,417 | |||||||
Distribution fee—Class A | 33,538 | |||||||
Distribution fee—Class C | 24,967 | |||||||
Distribution fee—Class R | 591 | |||||||
Distribution fee—Class K | 4,533 | |||||||
Distribution fee—Class 1 | 234,992 | |||||||
Transfer agency—Class A | 30,473 | |||||||
Transfer agency—Class C | 6,206 | |||||||
Transfer agency—Advisor Class | 48,965 | |||||||
Transfer agency—Class R | 308 | |||||||
Transfer agency—Class K | 3,402 | |||||||
Transfer agency—Class I | 329 | |||||||
Transfer agency—Class 1 | 34,485 | |||||||
Transfer agency—Class 2 | 6,335 | |||||||
Transfer agency—Class Z | 1,878 | |||||||
Custodian | 209,131 | |||||||
Registration fees | 119,545 | |||||||
Audit and tax | 106,652 | |||||||
Printing | 60,798 | |||||||
Administrative | 50,862 | |||||||
Legal | 46,494 | |||||||
Directors’ fees | 24,152 | |||||||
Miscellaneous | 16,628 | |||||||
|
| |||||||
Total expenses before interest expense | 2,693,681 | |||||||
Interest expense | 720,599 | |||||||
|
| |||||||
Total expenses | 3,414,280 | |||||||
Less: expenses waived and reimbursed by the Adviser (see Note B) | (770,945 | ) | ||||||
|
| |||||||
Net expenses | 2,643,335 | |||||||
|
| |||||||
Net investment income | 6,136,129 | |||||||
|
|
See notes to financial statements.
| 48 | • AB BOND INFLATION STRATEGY |
Statement of Operations
| Realized and Unrealized Gain (Loss) on Investment and Foreign Currency Transactions | ||||||
Net realized gain (loss) on: | ||||||
Investment transactions | $ | (167,463 | ) | |||
Futures | (758,181 | ) | ||||
Options written | 18,888 | |||||
Swaps | (397,959 | ) | ||||
Foreign currency transactions | (334,636 | ) | ||||
Net change in unrealized appreciation/depreciation of: | ||||||
Investments | 16,422,691 | |||||
Futures | 164,576 | |||||
Options written | (6,744 | ) | ||||
Swaptions written | 3,987 | |||||
Swaps | 11,871 | |||||
Foreign currency denominated assets and liabilities | 12,071 | |||||
|
| |||||
Net gain on investment and foreign currency transactions | 14,969,101 | |||||
|
| |||||
Net Increase in Net Assets from Operations | $ | 21,105,230 | ||||
|
|
See notes to financial statements.
| AB BOND INFLATION STRATEGY • | 49 |
Statement of Operations
STATEMENT OF CHANGES IN NET ASSETS
| Year Ended October 31, 2016 | Year Ended October 31, 2015 | |||||||
| Increase (Decrease) in Net Assets from Operations | ||||||||
Net investment income | $ | 6,136,129 | $ | 3,460,793 | ||||
Net realized loss on investment and foreign currency transactions | (1,639,351 | ) | (2,331,606 | ) | ||||
Net change in unrealized appreciation/depreciation of investments and foreign currency denominated assets and liabilities | 16,608,452 | (8,188,466 | ) | |||||
|
|
|
| |||||
Net increase (decrease) in net assets from operations | 21,105,230 | (7,059,279 | ) | |||||
| Dividends to Shareholders from | ||||||||
Net investment income | ||||||||
Class A | (246,245 | ) | (135,111 | ) | ||||
Class C | (36,966 | ) | (18,189 | ) | ||||
Advisor Class | (470,470 | ) | (203,846 | ) | ||||
Class R | (2,681 | ) | (1,105 | ) | ||||
Class K | (38,246 | ) | (20,282 | ) | ||||
Class I | (7,136 | ) | (7,362 | ) | ||||
Class 1 | (5,652,787 | ) | (3,672,680 | ) | ||||
Class 2 | (1,101,775 | ) | (556,237 | ) | ||||
Class Z(a) | (255,907 | ) | (14,356 | ) | ||||
| Capital Stock Transactions | ||||||||
Net decrease | (21,240,298 | ) | (28,377,535 | ) | ||||
|
|
|
| |||||
Total decrease | (7,947,281 | ) | (40,065,982 | ) | ||||
| Net Assets | ||||||||
Beginning of period | 334,702,789 | 374,768,771 | ||||||
|
|
|
| |||||
End of period (including undistributed net investment income of $574,964 and $2,604,789, respectively) | $ | 326,755,508 | $ | 334,702,789 | ||||
|
|
|
| |||||
| (a) | Commenced distributions on December 11, 2014. |
See notes to financial statements.
| 50 | • AB BOND INFLATION STRATEGY |
Statement of Changes in Net Assets
STATEMENT OF CASH FLOWS
For the Year Ended October 31, 2016
| Cash Flows from Operating Activities | ||||||||
Net increase in net assets from operations | $ | 21,105,230 | ||||||
| Reconciliation of Net Increase in Net Assets from Operations to Net Decrease in Cash from Operating Activities: | ||||||||
Purchases of long-term investments | $ | (214,412,726 | ) | |||||
Proceeds from disposition of long-term investments | 199,709,099 | |||||||
Purchases of short-term investments | (243,531,120 | ) | ||||||
Proceeds from disposition of short-term investments | 254,570,553 | |||||||
Increase in receivable for investments sold | (11,975,189 | ) | ||||||
Increase in interest receivable | (226,744 | ) | ||||||
Increase in affiliated dividends receivable | (517 | ) | ||||||
Increase in cash collateral due from broker | (304,759 | ) | ||||||
Increase in payable for investments purchased | 807,165 | |||||||
Increase in advisory fee payable | 4,660 | |||||||
Increase in accrued expenses | 23,537 | |||||||
Proceeds from options written, net | 8,813 | |||||||
Proceeds from swaptions written, net | 13,870 | |||||||
Proceeds on swaps, net | 155,347 | |||||||
Payments for exchange-traded derivatives settlements | (1,210,294 | ) | ||||||
Net realized loss on investment transactions and foreign currency transactions | 1,639,351 | |||||||
Net change in unrealized appreciation/depreciation of investments and foreign currency denominated assets and liabilities | (16,608,452 | ) | ||||||
Net accretion of bond discount and amortization of bond premium | 1,430,029 | |||||||
Inflation index adjustment | (2,803,917 | ) | ||||||
|
| |||||||
Total adjustments | (32,711,294 | ) | ||||||
|
| |||||||
Net decrease in cash from operating activities | $ | (11,606,064 | ) | |||||
|
| |||||||
| Cash Flows from Financing Activities | ||||||||
Redemptions of capital stock, net | (27,010,863 | ) | ||||||
Decrease in due to custodian | (94,834 | ) | ||||||
Cash dividends paid (net of dividend reinvestments)* | (1,367,216 | ) | ||||||
Increase in reverse repurchase agreements | 34,950,769 | |||||||
|
| |||||||
Net increase in cash from financing activities | 6,477,856 | |||||||
Effect of exchange rate on cash | (234,869 | ) | ||||||
|
| |||||||
Net decrease in cash | (5,363,077 | ) | ||||||
Net change in cash | ||||||||
Cash at beginning of year | 8,705,837 | |||||||
|
| |||||||
Cash at end of year | $ | 3,342,760 | ||||||
|
| |||||||
* Reinvestment of dividends | $ | 6,444,997 | ||||||
Supplemental disclosure of cash flow information: | ||||||||
Interest expense paid during the year | $ | 683,576 |
In accordance with U.S. GAAP, the Strategy has included a Statement of Cash Flows as a result of its significant investments in reverse repurchase agreements throughout the year.
See notes to financial statements.
| AB BOND INFLATION STRATEGY • | 51 |
Statement of Cash Flows
NOTES TO FINANCIAL STATEMENTS
October 31, 2016
NOTE A
Significant Accounting Policies
AB Bond Fund, Inc. (the “Company”) is registered under the Investment Company Act of 1940 as an open-end management investment company. The Company, which is a Maryland corporation, operates as a series company comprised of ten portfolios currently in operation. Each portfolio is considered to be a separate entity for financial reporting and tax purposes. This report relates only to the AB Bond Inflation Strategy Portfolio (the “Strategy”), a diversified portfolio. The Strategy has authorized the issuance of Class A, Class B, Class C, Advisor Class, Class R, Class K, Class I, Class 1, Class 2 and Class Z shares. Effective December 11, 2014, the Strategy commenced offering of Class Z shares. Class B shares are not currently offered. Class 1 shares are sold only to the private clients of Sanford C. Bernstein & Co. LLC by its registered representatives. Class A shares are sold with a front-end sales charge of up to 4.25% for purchases not exceeding $1,000,000. With respect to purchases of $1,000,000 or more, Class A shares redeemed within one year of purchase may be subject to a contingent deferred sales charge of 1%. Class C shares are subject to a contingent deferred sales charge of 1% on redemptions made within the first year after purchase. Class R, Class K, and Class 1 shares are sold without an initial or contingent deferred sales charge. Advisor Class, Class I, Class 2 and Class Z shares are sold without an initial or contingent deferred sales charge and are not subject to ongoing distribution expenses. All ten classes of shares have identical voting, dividend, liquidation and other rights, except that the classes bear different distribution and transfer agency expenses. Each class has exclusive voting rights with respect to its distribution plan. The financial statements have been prepared in conformity with U.S. generally accepted accounting principles (“U.S. GAAP”) which require management to make certain estimates and assumptions that affect the reported amounts of assets and liabilities in the financial statements and amounts of income and expenses during the reporting period. Actual results could differ from those estimates. The Strategy is an investment company under U.S. GAAP and follows the accounting and reporting guidance applicable to investment companies. The following is a summary of significant accounting policies followed by the Strategy.
1. Security Valuation
Portfolio securities are valued at their current market value determined on the basis of market quotations or, if market quotations are not readily available or are deemed unreliable, at “fair value” as determined in accordance with procedures established by and under the general supervision of the Company’s Board of Directors (the “Board”).
| 52 | • AB BOND INFLATION STRATEGY |
Notes to Financial Statements
In general, the market values of securities which are readily available and deemed reliable are determined as follows: securities listed on a national securities exchange (other than securities listed on the NASDAQ Stock Market, Inc. (“NASDAQ”)) or on a foreign securities exchange are valued at the last sale price at the close of the exchange or foreign securities exchange. If there has been no sale on such day, the securities are valued at the last traded price from the previous day. Securities listed on more than one exchange are valued by reference to the principal exchange on which the securities are traded; securities listed only on NASDAQ are valued in accordance with the NASDAQ Official Closing Price; listed or over the counter (“OTC”) market put or call options are valued at the mid level between the current bid and ask prices. If either a current bid or current ask price is unavailable, AllianceBernstein L.P. (the “Adviser”) will have discretion to determine the best valuation (e.g. last trade price in the case of listed options); open futures are valued using the closing settlement price or, in the absence of such a price, the most recent quoted bid price. If there are no quotations available for the day of valuation, the last available closing settlement price is used; U.S. Government securities and any other debt instruments having 60 days or less remaining until maturity are generally valued at market by an independent pricing vendor, if a market price is available. If a market price is not available, the securities are valued at amortized cost. This methodology is commonly used for short term securities that have an original maturity of 60 days or less, as well as short term securities that had an original term to maturity that exceeded 60 days. In instances when amortized cost is utilized, the Valuation Committee (the “Committee”) must reasonably conclude that the utilization of amortized cost is approximately the same as the fair value of the security. Such factors the Committee will consider include, but are not limited to, an impairment of the creditworthiness of the issuer or material changes in interest rates. Fixed-income securities, including mortgage-backed and asset-backed securities, may be valued on the basis of prices provided by a pricing service or at a price obtained from one or more of the major broker-dealers. In cases where broker-dealer quotes are obtained, the Adviser may establish procedures whereby changes in market yields or spreads are used to adjust, on a daily basis, a recently obtained quoted price on a security. Swaps and other derivatives are valued daily, primarily using independent pricing services, independent pricing models using market inputs, as well as third party broker-dealers or counterparties. Open end mutual funds are valued at the closing net asset value per share, while exchange traded funds are valued at the closing market price per share.
Securities for which market quotations are not readily available (including restricted securities) or are deemed unreliable are valued at fair value as deemed appropriate by the Adviser. Factors considered in making this
| AB BOND INFLATION STRATEGY • | 53 |
Notes to Financial Statements
determination may include, but are not limited to, information obtained by contacting the issuer, analysts, analysis of the issuer’s financial statements or other available documents. In addition, the Strategy may use fair value pricing for securities primarily traded in non-U.S. markets because most foreign markets close well before the Strategy values its securities at 4:00 p.m., Eastern Time. The earlier close of these foreign markets gives rise to the possibility that significant events, including broad market moves, may have occurred in the interim and may materially affect the value of those securities. To account for this, the Strategy may frequently value many of its foreign equity securities using fair value prices based on third party vendor modeling tools to the extent available.
2. Fair Value Measurements
In accordance with U.S. GAAP regarding fair value measurements, fair value is defined as the price that the Strategy would receive to sell an asset or pay to transfer a liability in an orderly transaction between market participants at the measurement date. U.S. GAAP establishes a framework for measuring fair value, and a three-level hierarchy for fair value measurements based upon the transparency of inputs to the valuation of an asset or liability (including those valued based on their market values as described in Note A.1 above). Inputs may be observable or unobservable and refer broadly to the assumptions that market participants would use in pricing the asset or liability. Observable inputs reflect the assumptions market participants would use in pricing the asset or liability based on market data obtained from sources independent of the Strategy. Unobservable inputs reflect the Strategy’s own assumptions about the assumptions that market participants would use in pricing the asset or liability based on the best information available in the circumstances. Each investment is assigned a level based upon the observability of the inputs which are significant to the overall valuation. The three-tier hierarchy of inputs is summarized below.
| • | Level 1—quoted prices in active markets for identical investments |
| • | Level 2—other significant observable inputs (including quoted prices for similar investments, interest rates, prepayment speeds, credit risk, etc.) |
| • | Level 3—significant unobservable inputs (including the Strategy’s own assumptions in determining the fair value of investments) |
The fair value of debt instruments, such as bonds, and over-the-counter derivatives is generally based on market price quotations, recently executed market transactions (where observable) or industry recognized modeling techniques and are generally classified as Level 2. Pricing vendor inputs to
| 54 | • AB BOND INFLATION STRATEGY |
Notes to Financial Statements
Level 2 valuations may include quoted prices for similar investments in active markets, interest rate curves, coupon rates, currency rates, yield curves, option adjusted spreads, default rates, credit spreads and other unique security features in order to estimate the relevant cash flows which are then discounted to calculate fair values. If these inputs are unobservable and significant to the fair value, these investments will be classified as Level 3. In addition, non-agency rated investments are classified as Level 3.
Where readily available market prices or relevant bid prices are not available for certain equity investments, such investments may be valued based on similar publicly traded investments, movements in relevant indices since last available prices or based upon underlying company fundamentals and comparable company data (such as multiples to earnings or other multiples to equity). Where an investment is valued using an observable input, such as another publicly traded security, the investment will be classified as Level 2. If management determines that an adjustment is appropriate based on restrictions on resale, illiquidity or uncertainty, and such adjustment is a significant component of the valuation, the investment will be classified as Level 3. An investment will also be classified as Level 3 where management uses company fundamentals and other significant inputs to determine the valuation.
Valuations of mortgage-backed or other asset-backed securities, by pricing vendors, are based on both proprietary and industry recognized models and discounted cash flow techniques. Significant inputs to the valuation of these instruments are value of the collateral, the rates and timing of delinquencies, the rates and timing of prepayments, and default and loss expectations, which are driven in part by housing prices for residential mortgages. Significant inputs are determined based on relative value analyses, which incorporate comparisons to instruments with similar collateral and risk profiles, including relevant indices. Mortgage and asset-backed securities for which management has collected current observable data through pricing services are generally categorized within Level 2. Those investments for which current observable data has not been provided are classified as Level 3.
Other fixed income investments, including non-U.S. government and corporate debt, are generally valued using quoted market prices, if available, which are typically impacted by current interest rates, maturity dates and any perceived credit risk of the issuer. Additionally, in the absence of quoted market prices, these inputs are used by pricing vendors to derive a valuation based upon industry or proprietary models which incorporate issuer specific data with relevant yield/spread comparisons with more widely quoted bonds with similar key characteristics. Those investments for which there are observable inputs are classified as Level 2. Where the inputs are not observable, the investments are classified as Level 3.
| AB BOND INFLATION STRATEGY • | 55 |
Notes to Financial Statements
The following table summarizes the valuation of the Strategy’s investments by the above fair value hierarchy levels as of October 31, 2016:
Investments in | Level 1 | Level 2 | Level 3 | Total | ||||||||||||
Assets: | ||||||||||||||||
Inflation-Linked Securities | $ | – 0 | – | $ | 286,688,571 | $ | – 0 | – | $ | 286,688,571 | ||||||
Corporates – Investment Grade | – 0 | – | 53,460,370 | – 0 | – | 53,460,370 | ||||||||||
Commercial Mortgage-Backed Securities | – 0 | – | 18,398,259 | 9,448,399 | 27,846,658 | |||||||||||
Governments – Treasuries | – 0 | – | 25,414,848 | – 0 | – | 25,414,848 | ||||||||||
Asset-Backed Securities | – 0 | – | 21,803,345 | 2,749,542 | 24,552,887 | |||||||||||
Collateralized Mortgage Obligations | – 0 | – | 19,881,754 | 758,543 | 20,640,297 | |||||||||||
Corporates – Non-Investment Grade | – 0 | – | 10,473,702 | – 0 | – | 10,473,702 | ||||||||||
Emerging Markets – Treasuries | – 0 | – | 3,149,965 | – 0 | – | 3,149,965 | ||||||||||
Governments – Sovereign Agencies | – 0 | – | 1,957,874 | – 0 | – | 1,957,874 | ||||||||||
Quasi-Sovereigns | – 0 | – | 1,500,540 | – 0 | – | 1,500,540 | ||||||||||
Emerging Markets – Corporate Bonds | – 0 | – | 1,309,773 | – 0 | – | 1,309,773 | ||||||||||
Governments – Sovereign Bonds | – 0 | – | 724,654 | – 0 | – | 724,654 | ||||||||||
Common Stocks | – 0 | – | – 0 | – | 429,612 | 429,612 | ||||||||||
Options Purchased – Calls | – 0 | – | 17,666 | – 0 | – | 17,666 | ||||||||||
|
|
|
|
|
|
|
| |||||||||
Total Investments in Securities | – 0 | – | 444,781,321 | 13,386,096 | 458,167,417 | |||||||||||
Other Financial Instruments(a): | ||||||||||||||||
Assets: | ||||||||||||||||
Futures | 93,155 | – 0 | – | – 0 | – | 93,155 | (b) | |||||||||
Forward Currency Exchange Contracts | – 0 | – | 613,089 | – 0 | – | 613,089 | ||||||||||
Centrally Cleared Interest Rate Swaps | – 0 | – | 830,433 | – 0 | – | 830,433 | (b) | |||||||||
Credit Default Swaps | – 0 | – | 47,524 | – 0 | – | 47,524 | ||||||||||
Inflation (CPI) Swaps | – 0 | – | 246,722 | – 0 | – | 246,722 | ||||||||||
Liabilities: | ||||||||||||||||
Futures | (114,965 | ) | – 0 | – | – 0 | – | (114,965 | )(b) | ||||||||
Forward Currency Exchange Contracts | – 0 | – | (510,554 | ) | – 0 | – | (510,554 | ) | ||||||||
Interest Rate Swaptions Written | – 0 | – | (9,883 | ) | – 0 | – | (9,883 | ) | ||||||||
Centrally Cleared Credit Default Swaps | – 0 | – | (200,792 | ) | – 0 | – | (200,792 | )(b) | ||||||||
Centrally Cleared Interest Rate Swaps | – 0 | – | (2,427,419 | ) | – 0 | – | (2,427,419 | )(b) | ||||||||
Credit Default Swaps | – 0 | – | (91,672 | ) | – 0 | – | (91,672 | ) | ||||||||
Inflation (CPI) Swaps | – 0 | – | (38,965 | ) | – 0 | – | (38,965 | ) | ||||||||
Interest Rate Swaps | – 0 | – | (322,980 | ) | – 0 | – | (322,980 | ) | ||||||||
|
|
|
|
|
|
|
| |||||||||
Total(c) | $ | (21,810 | ) | $ | 442,916,824 | $ | 13,386,096 | $ | 456,281,110 | |||||||
|
|
|
|
|
|
|
| |||||||||
| (a) | Other financial instruments are derivative instruments, such as futures, forwards and swaps, which are valued at the unrealized appreciation/depreciation on the instrument. Other financial instruments may also include swaptions written which are valued at market value. |
| (b) | Only variation margin receivable/payable at period end is reported within the statement of assets and liabilities. This amount reflects cumulative unrealized appreciation/(depreciation) of exchange-traded derivatives as reported in the portfolio of investments. |
| (c) | There were no transfers between Level 1 and Level 2 during the reporting period. |
| 56 | • AB BOND INFLATION STRATEGY |
Notes to Financial Statements
The Strategy recognizes all transfers between levels of the fair value hierarchy assuming the financial instruments were transferred at the beginning of the reporting period.
The following is a reconciliation of investments in which significant unobservable inputs (Level 3) were used in determining fair value.
| Commercial Mortgage-Backed Securities | Asset-Backed Securities | Collateralized Mortgage Obligations | ||||||||||
Balance as of 10/31/15 | $ | 7,333,784 | $ | 3,725,747 | $ | 9,306,859 | ||||||
Accrued discounts/(premiums) | (10,172 | ) | 64 | – 0 | – | |||||||
Realized gain (loss) | (92,788 | ) | 1,504 | – 0 | – | |||||||
Change in unrealized appreciation/depreciation | (68,049 | ) | 30,456 | 3,617 | ||||||||
Purchases/Payups | 3,745,377 | 2,259,409 | 665,050 | |||||||||
Sales/Paydowns | (2,120,227 | ) | (2,242,179 | ) | (404,789 | ) | ||||||
Transfers in to Level 3 | 660,474 | – 0 | – | – 0 | – | |||||||
Transfers out of Level 3 | – 0 | – | (1,025,459 | ) | (8,812,194 | ) | ||||||
|
|
|
|
|
| |||||||
Balance as of 10/31/16 | $ | 9,448,399 | $ | 2,749,542 | $ | 758,543 | ||||||
|
|
|
|
|
| |||||||
Net change in unrealized appreciation/depreciation from investments held as of 10/31/16(a) | $ | (96,464 | ) | $ | 33,491 | $ | 3,617 | |||||
|
|
|
|
|
| |||||||
| Common Stocks | Total | |||||||||||
Balance as of 10/31/15 | $ | 530,735 | $ | 20,897,125 | ||||||||
Accrued discounts/(premiums) | – 0 | – | (10,108 | ) | ||||||||
Realized gain (loss) | (395 | ) | (91,679 | ) | ||||||||
Change in unrealized appreciation/depreciation | (16,123 | ) | (50,099 | ) | ||||||||
Purchases/Payups | – 0 | – | 6,669,836 | |||||||||
Sales/Paydowns | (84,605 | ) | (4,851,800 | ) | ||||||||
Transfers in to Level 3 | – 0 | – | 660,474 | (b) | ||||||||
Transfers out of Level 3 | – 0 | – | (9,837,653 | )(c) | ||||||||
|
|
|
| |||||||||
Balance as of 10/31/16 | $ | 429,612 | $ | 13,386,096 | ||||||||
|
|
|
| |||||||||
Net change in unrealized appreciation/depreciation from investments held as of 10/31/16(a) | $ | (16,123 | ) | $ | (75,479 | ) | ||||||
|
|
|
| |||||||||
| (a) | The unrealized appreciation/depreciation is included in net change in unrealized appreciation/depreciation on investments and other financial instruments in the accompanying statement of operations. |
| (b) | There were de minimis transfers from Level 2 to Level 3 during the reporting period. |
| (c) | An amount of $9,837,653 was transferred out of Level 3 into Level 2 as improved transparency of price inputs has increased the observability of such inputs during the reporting period. |
As of October 31, 2016, all Level 3 securities were priced i) at net asset value or ii) by third party vendors.
| AB BOND INFLATION STRATEGY • | 57 |
Notes to Financial Statements
The Adviser established the Committee to oversee the pricing and valuation of all securities held in the Strategy. The Committee operates under pricing and valuation policies and procedures established by the Adviser and approved by the Board, including pricing policies which set forth the mechanisms and processes to be employed on a daily basis to implement these policies and procedures. In particular, the pricing policies describe how to determine market quotations for securities and other instruments. The Committee’s responsibilities include: 1) fair value and liquidity determinations (and oversight of any third parties to whom any responsibility for fair value and liquidity determinations is delegated), and 2) regular monitoring of the Adviser’s pricing and valuation policies and procedures and modification or enhancement of these policies and procedures (or recommendation of the modification of these policies and procedures) as the Committee believes appropriate.
The Committee is also responsible for monitoring the implementation of the pricing policies by the Adviser’s Pricing Group (the “Pricing Group”) and a third party which performs certain pricing functions in accordance with the pricing policies. The Pricing Group is responsible for the oversight of the third party on a day-to-day basis. The Committee and the Pricing Group perform a series of activities to provide reasonable assurance of the accuracy of prices including: 1) periodic vendor due diligence meetings, review of methodologies, new developments and processes at vendors, 2) daily comparison of security valuation versus prior day for all securities that exceeded established thresholds, and 3) daily review of unpriced, stale, and variance reports with exceptions reviewed by senior management and the Committee.
In addition, several processes outside of the pricing process are used to monitor valuation issues including: 1) performance and performance attribution reports are monitored for anomalous impacts based upon benchmark performance, and 2) portfolio managers review all portfolios for performance and analytics (which are generated using the Adviser’s prices).
3. Currency Translation
Assets and liabilities denominated in foreign currencies and commitments under forward currency exchange contracts are translated into U.S. dollars at the mean of the quoted bid and ask prices of such currencies against the U.S. dollar. Purchases and sales of portfolio securities are translated into U.S. dollars at the rates of exchange prevailing when such securities were acquired or sold. Income and expenses are translated into U.S. dollars at rates of exchange prevailing when accrued.
The Strategy does not isolate that portion of the results of operations resulting from changes in foreign exchange rates on investments from the
| 58 | • AB BOND INFLATION STRATEGY |
Notes to Financial Statements
fluctuations arising from changes in market prices of securities held. Such fluctuations are included with the net realized and unrealized gain or loss from investments.
Net realized gain or loss on foreign currency transactions represents foreign exchange gains and losses from sales and maturities of foreign fixed income investments, foreign currency exchange contracts, holding of foreign currencies, currency gains or losses realized between the trade and settlement dates on foreign investment transactions, and the difference between the amounts of dividends, interest and foreign withholding taxes recorded on the Strategy’s books and the U.S. dollar equivalent amounts actually received or paid. Net unrealized currency gains and losses from valuing foreign currency denominated assets and liabilities at period end exchange rates are reflected as a component of net unrealized appreciation or depreciation of foreign currency denominated assets and liabilities.
4. Taxes
It is the Strategy’s policy to meet the requirements of the Internal Revenue Code applicable to regulated investment companies and to distribute all of its investment company taxable income and net realized gains, if any, to shareholders. Therefore, no provisions for federal income or excise taxes are required. The Strategy may be subject to taxes imposed by countries in which it invests. Such taxes are generally based on income and/or capital gains earned or repatriated. Taxes are accrued and applied to net investment income, net realized gains and net unrealized appreciation/depreciation as such income and/or gains are earned.
In accordance with U.S. GAAP requirements regarding accounting for uncertainties in income taxes, management has analyzed the Strategy’s tax positions taken or expected to be taken on federal and state income tax returns for all open tax years (the current and the prior three tax years) and has concluded that no provision for income tax is required in the Strategy’s financial statements.
5. Investment Income and Investment Transactions
Dividend income is recorded on the ex-dividend date or as soon as the Strategy is informed of the dividend. Interest income is accrued daily. Investment transactions are accounted for on the date the securities are purchased or sold. Investment gains or losses are determined on the identified cost basis. The Strategy amortizes premiums and accretes discounts as adjustments to interest income.
6. Class Allocations
All income earned and expenses incurred by the Strategy are borne on a pro-rata basis by each outstanding class of shares, based on the propor-
| AB BOND INFLATION STRATEGY • | 59 |
Notes to Financial Statements
tionate interest in the Strategy represented by the net assets of such class, except for class specific expenses which are allocated to the respective class. Expenses of the Company are charged proportionately to each portfolio or based on other appropriate methods. Realized and unrealized gains and losses are allocated among the various share classes based on respective net assets.
7. Dividends and Distributions
Dividends and distributions to shareholders, if any, are recorded on the ex-dividend date. Income dividends and capital gains distributions are determined in accordance with federal tax regulations and may differ from those determined in accordance with U.S. GAAP. To the extent these differences are permanent, such amounts are reclassified within the capital accounts based on their federal tax basis treatment; temporary differences do not require such reclassification.
NOTE B
Advisory Fee and Other Transactions with Affiliates
Under the terms of the investment advisory agreement, the Strategy pays the Adviser an advisory fee at an annual rate of .50% of the first $2.5 billion, ..45% of the next $2.5 billion and .40% in excess of $5 billion, of the Strategy’s average daily net assets. The Adviser has agreed to waive its fees and bear certain expenses to the extent necessary to limit total operating expenses on an annual basis (“Expense Caps”) to .75%, 1.50%, .50%, 1.00%, .75%, .50%, .60%, .50% and .50% of the daily average net assets for the Class A, Class C, Advisor Class, Class R, Class K, Class I, Class 1, Class 2, and Class Z shares, respectively. Prior to January 29, 2016, the Expense Cap was .80% of the daily average net assets for the Class A. This fee waiver and/or expense reimbursement agreement will remain in effect until January 29, 2017 and then may be extended for additional one-year terms. For the year ended October 31, 2016, such reimbursement amounted to $766,643.
Pursuant to the investment advisory agreement, the Strategy may reimburse the Adviser for certain legal and accounting services provided to the Strategy by the Adviser. For the year ended October 31, 2016, the reimbursement for such services amounted to $50,862.
The Strategy compensates AllianceBernstein Investor Services, Inc. (“ABIS”), a wholly-owned subsidiary of the Adviser, under a Transfer Agency Agreement for providing personnel and facilities to perform transfer agency services for the Strategy. ABIS may make payments to intermediaries that provide omnibus account services, sub-accounting services and/or networking services. Such compensation retained by ABIS amounted to $94,471 for the year ended October 31, 2016.
| 60 | • AB BOND INFLATION STRATEGY |
Notes to Financial Statements
AllianceBernstein Investments, Inc. (the “Distributor”), a wholly-owned subsidiary of the Adviser, serves as the distributor of the Strategy’s shares. The Distributor has advised the Strategy that it has retained front-end sales charges of $1,142 from the sale of Class A shares and received $23 and $109 in contingent deferred sales charges imposed upon redemptions by shareholders of Class A and Class C shares, respectively, for the year ended October 31, 2016.
The AB Fixed-Income Shares, Inc.—Government STIF Portfolio (the “Government STIF Portfolio”), prior to June 1, 2016, was offered as a cash management option to mutual funds and other institutional accounts of the Adviser, and was not available for direct purchase by members of the public. Prior to June 1, 2016, the Government STIF Portfolio paid no advisory fees but did bear its own expenses. As of June 1, 2016, the Government STIF Portfolio, which was renamed “AB Government Money Market Portfolio” (the “Government Money Market Portfolio”), has a contractual advisory fee rate of .20% and continues to bear its own expenses. In connection with the investment by the Strategy in the Government Money Market Portfolio, the Adviser has agreed to waive its advisory fee from the Strategy in an amount equal to the Strategy’s share of the advisory fees of Government Money Market Portfolio, as borne indirectly by the Strategy as an acquired fund fee and expense. For the year ended October 31, 2016, such waiver amounted to $4,302. A summary of the Strategy’s transactions in shares of the Government Money Market Portfolio for the year ended October 31, 2016 is as follows:
Market Value 10/31/15 (000) | Purchases at Cost (000) | Sales Proceeds (000) | Market Value 10/31/16 (000) | Dividend Income (000) | ||||||||||||||
| $ | 2,524 | $ | 227,339 | $ | 229,863 | $ | – 0 | – | $ | 16 | ||||||||
Brokerage commissions paid on investment transactions for the year ended October 31, 2016 amounted to $3,694, of which $0 and $0, respectively, was paid to Sanford C. Bernstein & Co. LLC and Sanford C. Bernstein Limited, affiliates of the Adviser.
NOTE C
Distribution Services Agreement
The Strategy has adopted a Distribution Services Agreement (the “Agreement”) pursuant to Rule 12b-1 under the Investment Company Act of 1940. Under the Agreement, the Strategy pays distribution and servicing fees to the Distributor at an annual rate of up to .30% of the Strategy’s average daily net assets attributable to Class A shares, 1% of the Strategy’s average daily net assets attributable to Class C shares, .50% of the Strategy’s average daily net assets attributable to Class R shares .25% of the Strategy’s average daily net assets attributable to Class K shares and .10% of the Strategy’s average daily net assets attributable to Class 1
| AB BOND INFLATION STRATEGY • | 61 |
Notes to Financial Statements
shares. There are no distribution and servicing fees on the Advisor Class, Class I, Class 2 and Class Z shares. Effective January 29, 2016, payments under the Agreement in respect of Class A shares are limited to an annual rate of .25% of Class A shares’ average daily net assets. The fees are accrued daily and paid monthly. The Agreement provides that the Distributor will use such payments in their entirety for distribution assistance and promotional activities. Since the commencement of the Strategy’s operations, the Distributor has incurred expenses in excess of the distribution costs reimbursed by the Strategy in the amounts of $238,086, $18,893, $19,837 and $1,480,773 for Class C, Class R, Class K and Class 1 shares, respectively. While such costs may be recovered from the Strategy in future periods so long as the Agreement is in effect, the rate of the distribution and servicing fees payable under the Agreement may not be increased without a shareholder vote. In accordance with the Agreement, there is no provision for recovery of unreimbursed distribution costs incurred by the Distributor beyond the current fiscal year for Class A shares. The Agreement also provides that the Adviser may use its own resources to finance the distribution of the Strategy’s shares.
NOTE D
Investment Transactions
Purchases and sales of investment securities (excluding short-term investments) for the year ended October 31, 2016 were as follows:
| Purchases | Sales | |||||||
Investment securities (excluding | $ | 66,446,339 | $ | 55,781,428 | ||||
U.S. government securities | 147,966,387 | 125,876,294 | ||||||
The cost of investments for federal income tax purposes, gross unrealized appreciation and unrealized depreciation (excluding futures, foreign currency and swap transactions) are as follows:
Cost | $ | 451,010,810 | ||
|
| |||
Gross unrealized appreciation | $ | 10,180,004 | ||
Gross unrealized depreciation | (3,023,397 | ) | ||
|
| |||
Net unrealized appreciation | $ | 7,156,607 | ||
|
|
1. Derivative Financial Instruments
The Strategy may use derivatives in an effort to earn income and enhance returns, to replace more traditional direct investments, to obtain exposure to otherwise inaccessible markets (collectively, “investment purposes”), or to hedge or adjust the risk profile of its portfolio.
| 62 | • AB BOND INFLATION STRATEGY |
Notes to Financial Statements
The principal types of derivatives utilized by the Strategy, as well as the methods in which they may be used are:
| • | Futures |
The Strategy may buy or sell futures for investment purposes or for the purpose of hedging its portfolio against adverse effects of potential movements in the market. The Strategy bears the market risk that arises from changes in the value of these instruments and the imperfect correlation between movements in the price of the futures and movements in the price of the assets, reference rates or indices which they are designed to track. Among other things, the Strategy may purchase or sell futures for foreign currencies or options thereon for non-hedging purposes as a means of making direct investment in foreign currencies, as described below under “Currency Transactions”.
At the time the Strategy enters into futures, the Strategy deposits and maintains as collateral an initial margin with the broker, as required by the exchange on which the transaction is effected. Such amount is shown as cash collateral due from broker on the statement of assets and liabilities. Pursuant to the contract, the Strategy agrees to receive from or pay to the broker an amount of cash equal to the daily fluctuation in the value of the contract. Such receipts or payments are known as variation margin and are recorded by the Strategy as unrealized gains or losses. Risks may arise from the potential inability of a counterparty to meet the terms of the contract. The credit/counterparty risk for exchange-traded futures is generally less than privately negotiated futures, since the clearinghouse, which is the issuer or counterparty to each exchange-traded future, has robust risk mitigation standards, including the requirement to provide initial and variation margin. When the contract is closed, the Strategy records a realized gain or loss equal to the difference between the value of the contract at the time it was opened and the time it was closed.
Use of long futures subjects the Strategy to risk of loss in excess of the amounts shown on the statement of assets and liabilities, up to the notional value of the futures. Use of short futures subjects the Strategy to unlimited risk of loss. Under some circumstances, futures exchanges may establish daily limits on the amount that the price of futures can vary from the previous day’s settlement price, which could effectively prevent liquidation of unfavorable positions.
During the year ended October 31, 2016, the Strategy held futures for hedging and non-hedging purposes.
| • | Forward Currency Exchange Contracts |
The Strategy may enter into forward currency exchange contracts
| AB BOND INFLATION STRATEGY • | 63 |
Notes to Financial Statements
in order to hedge its exposure to changes in foreign currency exchange rates on its foreign portfolio holdings, to hedge certain firm purchase and sale commitments denominated in foreign currencies and for non-hedging purposes as a means of making direct investments in foreign currencies, as described below under “Currency Transactions”.
A forward currency exchange contract is a commitment to purchase or sell a foreign currency at a future date at a negotiated forward rate. The gain or loss arising from the difference between the original contract and the closing of such contract would be included in net realized gain or loss on foreign currency transactions. Fluctuations in the value of open forward currency exchange contracts are recorded for financial reporting purposes as unrealized appreciation and/or depreciation by the Strategy. Risks may arise from the potential inability of a counterparty to meet the terms of a contract and from unanticipated movements in the value of a foreign currency relative to the U.S. dollar.
During the year ended October 31, 2016, the Strategy held forward currency exchange contracts for hedging and non-hedging purposes.
| • | Option Transactions |
For hedging and investment purposes, the Strategy may purchase and write (sell) put and call options on U.S. and foreign securities, including government securities, and foreign currencies that are traded on U.S. and foreign securities exchanges and over-the-counter markets. Among other things, the Strategy may use options transactions for non-hedging purposes as a means of making direct investments in foreign currencies, as described below under “Currency Transactions” and may use options strategies involving the purchase and/or writing of various combinations of call and/or put options, for hedging and investment purposes.
The risk associated with purchasing an option is that the Strategy pays a premium whether or not the option is exercised. Additionally, the Strategy bears the risk of loss of the premium and change in market value should the counterparty not perform under the contract. If a put or call option purchased by the Fund were permitted to expire without being sold or exercised, its premium would represent a loss to the Fund. Put and call options purchased are accounted for in the same manner as portfolio securities. The cost of securities acquired through the exercise of call options is increased by premiums paid. The proceeds from securities sold through the exercise of put options are decreased by the premiums paid.
| 64 | • AB BOND INFLATION STRATEGY |
Notes to Financial Statements
When the Strategy writes an option, the premium received by the Strategy is recorded as a liability and is subsequently adjusted to the current market value of the option written. Premiums received from written options which expire unexercised are recorded by the Strategy on the expiration date as realized gains from options written. The difference between the premium received and the amount paid on effecting a closing purchase transaction, including brokerage commissions, is also treated as a realized gain, or if the premium received is less than the amount paid for the closing purchase transaction, as a realized loss. If a call option is exercised, the premium received is added to the proceeds from the sale of the underlying security or currency in determining whether the Strategy has realized a gain or loss. If a put option is exercised, the premium received reduces the cost basis of the security or currency purchased by the Strategy. In writing an option, the Strategy bears the market risk of an unfavorable change in the price of the security or currency underlying the written option. Exercise of an option written by the Strategy could result in the Strategy selling or buying a security or currency at a price different from the current market value.
The Strategy may also invest in options on swap agreements, also called “swaptions”. A swaption is an option that gives the buyer the right, but not the obligation, to enter into a swap on a future date in exchange for paying a market-based “premium”. A receiver swaption gives the owner the right to receive the total return of a specified asset, reference rate, or index. A payer swaption gives the owner the right to pay the total return on a specified asset, reference rate, or index. Swaptions also include options that allow an existing swap to be terminated or extended by one of the counterparties.
During the year ended October 31, 2016, the Strategy held purchased options, written options and written swaptions for hedging purposes.
For the year ended October 31, 2016, the Strategy had the following transactions in written options:
| Number of Contracts | Premiums Received | |||||||
Options written outstanding as of 10/31/15 | 508,218,000 | $ | 10,075 | |||||
Options written | 281,397,000 | 36,253 | ||||||
Options assigned | (281,394,000 | ) | (12,553 | ) | ||||
Options expired | (508,219,500 | ) | (22,675 | ) | ||||
Options bought back | (1,500 | ) | (11,100 | ) | ||||
Options exercised | – 0 | – | – 0 | – | ||||
|
|
|
| |||||
Options written outstanding as of 10/31/16 | – 0 | – | $ | – 0 | – | |||
|
|
|
| |||||
| AB BOND INFLATION STRATEGY • | 65 |
Notes to Financial Statements
| Notional Amount | Premiums Received | |||||||
Swaptions written outstanding as of 10/31/15 | $ | – 0 | – | $ | – 0 | – | ||
Swaptions written | 7,300,000 | 13,870 | ||||||
Swaptions expired | – 0 | – | – 0 | – | ||||
Swaptions bought back | – 0 | – | – 0 | – | ||||
Swaptions exercised | – 0 | – | – 0 | – | ||||
|
|
|
| |||||
Swaptions written outstanding as of 10/31/16 | $ | 7,300,000 | $ | 13,870 | ||||
|
|
|
| |||||
| • | Swaps |
The Strategy may enter into swaps to hedge its exposure to interest rates, credit risk or currency. The Strategy may also enter into swaps for non-hedging purposes as a means of gaining market exposures, including by making direct investments in foreign currencies, as described below under “Currency Transactions”. A swap is an agreement that obligates two parties to exchange a series of cash flows at specified intervals based upon or calculated by reference to changes in specified prices or rates for a specified amount of an underlying asset. The payment flows are usually netted against each other, with the difference being paid by one party to the other. In addition, collateral may be pledged or received by the Strategy in accordance with the terms of the respective swaps to provide value and recourse to the Strategy or its counterparties in the event of default, bankruptcy or insolvency by one of the parties to the swap.
Risks may arise as a result of the failure of the counterparty to the swap to comply with the terms of the swap. The loss incurred by the failure of a counterparty is generally limited to the net interim payment to be received by the Strategy, and/or the termination value at the end of the contract. Therefore, the Strategy considers the creditworthiness of each counterparty to a swap in evaluating potential counterparty risk. This risk is mitigated by having a netting arrangement between the Strategy and the counterparty and by the posting of collateral by the counterparty to the Strategy to cover the Strategy’s exposure to the counterparty. Additionally, risks may arise from unanticipated movements in interest rates or in the value of the underlying securities. The Strategy accrues for the interim payments on swaps on a daily basis, with the net amount recorded within unrealized appreciation/depreciation of swaps on the statement of assets and liabilities, where applicable. Once the interim payments are settled in cash, the net amount is recorded as realized gain/(loss) on swaps on the statement of operations, in addition to any realized gain/(loss) recorded upon the termination of swaps. Upfront premiums paid or received are recognized as cost or proceeds on the statement of assets and liabilities and are amortized on a straight line basis over the life of
| 66 | • AB BOND INFLATION STRATEGY |
Notes to Financial Statements
the contract. Amortized upfront premiums are included in net realized gain/(loss) from swaps on the statement of operations. Fluctuations in the value of swaps are recorded as a component of net change in unrealized appreciation/depreciation of swaps on the statement of operations.
Certain standardized swaps, including certain interest rate swaps and credit default swaps, are (or soon will be) subject to mandatory central clearing. Cleared swaps are transacted through futures commission merchants (“FCMs”) that are members of central clearinghouses, with the clearinghouse serving as central counterparty, similar to transactions in futures contracts. Centralized clearing will be required for additional categories of swaps on a phased-in basis based on requirements published by the Securities and Exchange Commission and Commodity Futures Trading Commission.
At the time the Strategy enters into a centrally cleared swap, the Strategy deposits and maintains as collateral an initial margin with the broker, as required by the clearinghouse on which the transaction is effected. Such amount is shown as cash collateral due from broker on the statement of assets and liabilities. Pursuant to the contract, the Strategy agrees to receive from or pay to the broker an amount of cash equal to the daily fluctuation in the value of the contract. Such receipts or payments are known as variation margin and are recorded by the Strategy as unrealized gains or losses. Risks may arise from the potential of a counterparty to meet the terms of the contract. The credit/counterparty risk for centrally cleared swaps is generally less than non-centrally cleared swaps, since the clearinghouse, which is the issuer or counterparty to each centrally cleared swap, has robust risk mitigation standards, including the requirement to provide initial and variation margin. When the contract is closed, the Strategy records a realized gain or loss equal to the difference between the value of the contract at the time it was opened and the time it was closed.
Interest Rate Swaps:
The Strategy is subject to interest rate risk exposure in the normal course of pursuing its investment objectives. Because the Strategy holds fixed rate bonds, the value of these bonds may decrease if interest rates rise. To help hedge against this risk and to maintain its ability to generate income at prevailing market rates, the Strategy may enter into interest rate swaps. Interest rate swaps are agreements between two parties to exchange cash flows based on a notional amount. The Strategy may elect to pay a fixed rate and receive a floating rate, or, receive a fixed rate and pay a floating rate on a notional amount.
| AB BOND INFLATION STRATEGY • | 67 |
Notes to Financial Statements
In addition, the Strategy may also enter into interest rate swap transactions to preserve a return or spread on a particular investment or portion of its portfolio, or protecting against an increase in the price of securities the Strategy anticipates purchasing at a later date. Interest rate swaps involve the exchange by a Strategy with another party of their respective commitments to pay or receive interest (e.g., an exchange of floating rate payments for fixed rate payments) computed based on a contractually-based principal (or “notional”) amount. Interest rate swaps are entered into on a net basis (i.e., the two payment streams are netted out, with the Strategy receiving or paying, as the case may be, only the net amount of the two payments).
During the year ended October 31, 2016, the Strategy held interest rate swaps for hedging and non-hedging purposes.
Inflation (CPI) Swaps:
Inflation swaps are contracts in which one party agrees to pay the cumulative percentage increase in a price index (the Consumer Price Index with respect to CPI swaps) over the term of the swap (with some lag on the inflation index), and the other pays a compounded fixed rate. Inflation swaps may be used to protect the net asset value, or NAV, of a Strategy against an unexpected change in the rate of inflation measured by an inflation index since the value of these agreements is expected to increase if unexpected inflation increases.
During the year ended October 31, 2016, the Strategy held inflation (CPI) swaps for hedging and non-hedging purposes.
Credit Default Swaps:
The Strategy may enter into credit default swaps, including to manage its exposure to the market or certain sectors of the market, to reduce its risk exposure to defaults by corporate and sovereign issuers held by the Strategy, or to create exposure to corporate or sovereign issuers to which it is not otherwise exposed. The Strategy may purchase credit protection (“Buy Contract”) or provide credit protection (“Sale Contract”) on the referenced obligation of the credit default swap. During the term of the swap, the Strategy receives/(pays) fixed payments from/(to) the respective counterparty, calculated at the agreed upon rate applied to the notional amount. If the Strategy is a buyer/(seller) of protection and a credit event occurs, as defined under the terms of the swap, the Strategy will either (i) receive from the seller/(pay to the buyer) of protection an amount equal to the notional amount of the swap (the “Maximum Payout Amount”) and deliver/(take delivery of) the referenced obligation or (ii) receive/(pay) a net
| 68 | • AB BOND INFLATION STRATEGY |
Notes to Financial Statements
settlement amount in the form of cash or securities equal to the notional amount of the swap less the recovery value of the referenced obligation.
In certain circumstances Maximum Payout Amounts may be partially offset by recovery values of the respective referenced obligations, upfront premium received upon entering into the agreement, or net amounts received from settlement of buy protection credit default swaps entered into by the Strategy for the same reference obligation with the same counterparty. As of October 31, 2016, the Strategy did not have Buy Contracts outstanding with respect to the same referenced obligations and same counterparty for its Sale Contracts outstanding.
Credit default swaps may involve greater risks than if a Strategy had invested in the referenced obligation directly. Credit default swaps are subject to general market risk, liquidity risk, counterparty risk and credit risk. If the Strategy is a buyer of protection and no credit event occurs, it will lose the payments it made to its counterparty. If the Strategy is a seller of protection and a credit event occurs, the value of the referenced obligation received by the Strategy coupled with the periodic payments previously received, may be less than the Maximum Payout Amount it pays to the buyer, resulting in a net loss to the Strategy.
Implied credit spreads over U.S. Treasuries of comparable maturity utilized in determining the market value of credit default swaps on issuers as of period end are disclosed in the portfolio of investments. The implied spreads serve as an indicator of the current status of the payment/performance risk and typically reflect the likelihood of default by the issuer of the referenced obligation. The implied credit spread of a particular reference obligation also reflects the cost of buying/selling protection and may reflect upfront payments required to be made to enter into the agreement. Widening credit spreads typically represent a deterioration of the referenced obligation’s credit soundness and greater likelihood of default or other credit event occurring as defined under the terms of the agreement. A credit spread identified as “Defaulted” indicates a credit event has occurred for the referenced obligation.
During the year ended October 31, 2016, the Strategy held credit default swaps for hedging and non-hedging purposes.
The Strategy typically enters into International Swaps and Derivatives Association, Inc. Master Agreements (“ISDA Master Agreement”) or similar master agreements (collectively, “Master Agreements”) with its
| AB BOND INFLATION STRATEGY • | 69 |
Notes to Financial Statements
derivative contract counterparties in order to, among other things, reduce its credit risk to counterparties. ISDA Master Agreements include provisions for general obligations, representations, collateral and events of default or termination. Under an ISDA Master Agreement, the Strategy typically may offset with the counterparty certain derivative financial instrument’s payables and/or receivables with collateral held and/or posted and create one single net payment (close-out netting) in the event of default or termination.
Various Master Agreements govern the terms of certain transactions with counterparties, including transactions such as derivative transactions, repurchase and reverse repurchase agreements. These Master Agreements typically attempt to reduce the counterparty risk associated with such transactions by specifying credit protection mechanisms and providing standardization that improves legal certainty. Cross-termination provisions under Master Agreements typically provide that a default in connection with one transaction between the Strategy and a counterparty gives the non-defaulting party the right to terminate any other transactions in place with the defaulting party to create one single net payment due to/due from the defaulting party. In the event of a default by a Master Agreements counterparty, the return of collateral with market value in excess of the Strategy’s net liability, held by the defaulting party, may be delayed or denied.
The Strategy’s Master Agreements may contain provisions for early termination of OTC derivative transactions in the event the net assets of the Strategy decline below specific levels (“net asset contingent features”). If these levels are triggered, the Strategy’s counterparty has the right to terminate such transaction and require the Strategy to pay or receive a settlement amount in connection with the terminated transaction. For additional details, please refer to netting arrangements by counterparty tables below.
During the year ended October 31, 2016, the Strategy had entered into the following derivatives:
Asset Derivatives | Liability Derivatives | |||||||||||
Derivative Type | Statement of Assets and Liabilities Location | Fair Value | Statement of Assets and Liabilities Location | Fair Value | ||||||||
Interest rate contracts | Receivable/Payable for variation margin on exchange-traded derivatives | $ | 923,588 | * | Receivable/Payable for variation margin on exchange-traded derivatives | $ | 2,542,384 | * | ||||
Credit contracts | Receivable/Payable for variation margin on exchange-traded derivatives | Receivable/Payable for variation margin on exchange-traded derivatives | 200,792 | * | ||||||||
| 70 | • AB BOND INFLATION STRATEGY |
Notes to Financial Statements
Asset Derivatives | Liability Derivatives | |||||||||||
Derivative Type | Statement of Assets and Liabilities Location | Fair Value | Statement of Assets and Liabilities Location | Fair Value | ||||||||
Foreign exchange contracts | Unrealized appreciation on forward currency exchange contracts | $ | 613,089 |
| Unrealized depreciation on forward currency exchange contracts | $ | 510,554 |
| ||||
Interest rate contracts | Investments in securities, at value |
| 17,666 |
| ||||||||
Interest rate contracts | Swaptions written, at value |
| 9,883 |
| ||||||||
Interest rate contracts | Unrealized depreciation on interest rate swaps |
| 322,980 |
| ||||||||
Interest rate contracts | Unrealized appreciation on inflation swaps |
| 246,722 |
| Unrealized depreciation on inflation swaps |
| 38,965 |
| ||||
Credit contracts | Unrealized appreciation on credit default swaps | 47,524 | Unrealized depreciation on credit default swaps | 91,672 | ||||||||
|
|
|
| |||||||||
Total | $ | 1,848,589 | $ | 3,717,230 | ||||||||
|
|
|
| |||||||||
| * | Only variation margin receivable/payable at period end is reported within the statement of assets and liabilities. This amount reflects cumulative appreciation/(depreciation) of exchange-traded derivatives as reported in the portfolio of investments. |
Derivative Type | Location of Gain | Realized Gain or (Loss) on Derivatives | Change in Unrealized Appreciation or (Depreciation) | |||||||
Interest rate contracts | Net realized gain (loss) on futures; Net change in unrealized appreciation/depreciation of futures | $ | (758,181 | ) | $ | 164,576 | ||||
Foreign exchange contracts | Net realized gain (loss) on foreign currency transactions; Net change in unrealized appreciation/depreciation of foreign currency denominated assets and liabilities |
| (386,213 | ) |
| (87,696 | ) | |||
| AB BOND INFLATION STRATEGY • | 71 |
Notes to Financial Statements
Derivative Type | Location of Gain | Realized Gain or (Loss) on Derivatives | Change in Unrealized Appreciation or (Depreciation) | |||||||
Interest rate contracts | Net realized gain (loss) on investment transactions; Net change in unrealized appreciation/depreciation of investments | $ | – 0 | – | $ | (16,462 | ) | |||
Equity contracts | Net realized gain (loss) on investment transactions; Net change in unrealized appreciation/depreciation of investments | (18,525 | ) | – 0 | – | |||||
Interest rate contracts | Net realized gain (loss) on swaptions written; Net change in unrealized appreciation/depreciation of swaptions written | 3,987 | ||||||||
Foreign exchange contracts | Net realized gain (loss) on options written; Net change in unrealized appreciation/depreciation of options written |
| 9,888 |
|
| (6,744 | ) | |||
Equity contracts | Net realized gain (loss) on options written; Net change in unrealized appreciation/depreciation of options written | 9,000 | – 0 | – | ||||||
Interest rate contracts | Net realized gain (loss) on swaps; Net change in unrealized appreciation/depreciation of swaps | 172,034 | 124,281 | |||||||
Credit contracts | Net realized gain (loss) on swaps; Net change in unrealized appreciation/depreciation of swaps | (569,993 | ) | (112,410 | ) | |||||
|
|
|
| |||||||
Total | $ | (1,541,990 | ) | $ | 69,532 | |||||
|
|
|
| |||||||
| 72 | • AB BOND INFLATION STRATEGY |
Notes to Financial Statements
The following table represents the average monthly volume of the Strategy’s derivative transactions during the year ended October 31, 2016:
Futures: | ||||
Average original value of buy contracts | $ | 8,422,114 | ||
Average original value of sale contracts | $ | 20,626,191 | ||
Forward Currency Exchange Contracts: | ||||
Average principal amount of buy contracts | $ | 8,437,130 | ||
Average principal amount of sale contracts | $ | 29,948,377 | ||
Purchased Options: | ||||
Average monthly cost | $ | 35,139 | (a) | |
Interest Rate Swaps: | ||||
Average notional amount | $ | 1,930,000 | ||
Inflation Swaps: | ||||
Average notional amount | $ | 52,017,692 | ||
Centrally Cleared Interest Rate Swaps: | ||||
Average notional amount | $ | 186,251,571 | ||
Credit Default Swaps: | ||||
Average notional amount of buy contracts | $ | 1,280,000 | ||
Average notional amount of sale contracts | $ | 4,089,308 | ||
Centrally Cleared Credit Default Swaps: | ||||
Average notional amount of buy contracts | $ | 24,841,508 | ||
Average notional amount of sale contracts | $ | 3,488,000 | (a) |
| (a) | Positions were open for two months during the year. |
For financial reporting purposes, the Strategy does not offset derivative assets and derivative liabilities that are subject to netting arrangements in the statement of assets and liabilities.
All derivatives held at period end were subject to netting arrangements. The following table presents the Strategy’s derivative assets and liabilities by counterparty net of amounts available for offset under Master Agreements (“MA”) and net of the related collateral received/pledged by the Strategy as of October 31, 2016:
Counterparty | Derivative Assets Subject to a MA | Derivative Available for Offset | Cash Collateral Received | Security Collateral Received | Net Amount of Derivatives Assets | |||||||||||||||
Exchange-Traded Derivatives: | ||||||||||||||||||||
Goldman Sachs & Co.* | $ | 6,967 | $ | – 0 | – | $ | – 0 | – | $ | – 0 | – | $ | 6,967 | |||||||
|
|
|
|
|
|
|
|
|
| |||||||||||
Total | $ | 6,967 | $ | – 0 | – | $ | – 0 | – | $ | – 0 | – | $ | 6,967 | |||||||
|
|
|
|
|
|
|
|
|
| |||||||||||
OTC Derivatives: | ||||||||||||||||||||
Bank of America, NA | $ | 33,668 | $ | – 0 | – | $ | – 0 | – | $ | – 0 | – | $ | 33,668 | |||||||
Barclays Bank PLC | 233,573 | – 0 | – | – 0 | – | – 0 | – | 233,573 | ||||||||||||
BNP Paribas SA | 192,775 | – 0 | – | – 0 | – | – 0 | – | 192,775 | ||||||||||||
Citibank, NA | 273,444 | (98,673 | ) | – 0 | – | – 0 | – | 174,771 | ||||||||||||
Deutsche Bank AG | 16,110 | (16,110 | ) | – 0 | – | – 0 | – | – 0 | – | |||||||||||
| AB BOND INFLATION STRATEGY • | 73 |
Notes to Financial Statements
Counterparty | Derivative Assets Subject to a MA | Derivative Available for Offset | Cash Collateral Received | Security Collateral Received | Net Amount of Derivatives Assets | |||||||||||||||
Morgan Stanley & Co./Morgan Stanley Capital Services LLC | $ | 15,761 | $ | (15,761 | ) | $ | – 0 | – | $ | – 0 | – | $ | – 0 | – | ||||||
Royal Bank of Scotland PLC | 72,685 | – 0 | – | – 0 | – | – 0 | – | 72,685 | ||||||||||||
State Street Bank & Trust Co. | 76,090 | (6,396 | ) | – 0 | – | – 0 | – | 69,694 | ||||||||||||
|
|
|
|
|
|
|
|
|
| |||||||||||
Total | $ | 914,106 | $ | (136,940 | ) | $ | – 0 | – | $ | – 0 | – | $ | 777,166 | ^ | ||||||
|
|
|
|
|
|
|
|
|
| |||||||||||
Counterparty | Derivative Liabilities Subject to a MA | Derivative Available for Offset | Cash Collateral Pledged** | Security Collateral Pledged** | Net Amount of Derivatives Liabilities | |||||||||||||||
Exchange-Traded Derivatives: | ||||||||||||||||||||
Citigroup Global Markets, Inc.* | $ | 433 | $ | – 0 | – | $ | (433 | ) | $ | – 0 | – | $ | – 0 | – | ||||||
Morgan Stanley & Co., LLC* | 32,928 | – 0 | – | (32,928 | ) | – 0 | – | – 0 | – | |||||||||||
|
|
|
|
|
|
|
|
|
| |||||||||||
Total | $ | 33,361 | $ | – 0 | – | $ | (33,361 | ) | $ | – 0 | – | $ | – 0 | – | ||||||
|
|
|
|
|
|
|
|
|
| |||||||||||
OTC Derivatives: | ||||||||||||||||||||
Citibank, NA | $ | 98,673 | $ | (98,673 | ) | $ | – 0 | – | $ | – 0 | – | $ | – 0 | – | ||||||
Credit Suisse International | 100,345 | – 0 | – | – 0 | – | – 0 | – | 100,345 | ||||||||||||
Deutsche Bank AG | 147,345 | (16,110 | ) | – 0 | – | – 0 | – | 131,235 | ||||||||||||
Goldman Sachs Bank USA | 463,376 | – 0 | – | – 0 | – | – 0 | – | 463,376 | ||||||||||||
JPMorgan Chase Bank, NA | 38,965 | – 0 | – | – 0 | – | – 0 | – | 38,965 | ||||||||||||
Morgan Stanley & Co./Morgan Stanley Capital Services LLC | 336,319 | (15,761 | ) | – 0 | – | (320,558 | ) | – 0 | – | |||||||||||
Standard Chartered Bank | 24,689 | – 0 | – | – 0 | – | – 0 | – | 24,689 | ||||||||||||
State Street Bank & Trust Co. | 6,396 | (6,396 | ) | – 0 | – | – 0 | – | – 0 | – | |||||||||||
|
|
|
|
|
|
|
|
|
| |||||||||||
Total | $ | 1,216,108 | $ | (136,940 | ) | $ | – 0 | – | $ | (320,558 | ) | $ | 758,610 | ^ | ||||||
|
|
|
|
|
|
|
|
|
| |||||||||||
| * | Cash has been posted for initial margin requirements for exchange-traded derivatives outstanding at October 31, 2016. |
| ** | The actual collateral received/pledged is more than the amount reported due to over-collateralization. |
| ^ | Net amount represents the net receivable/payable that would be due from/to the counterparty in the event of default or termination. The net amount from OTC financial derivative instruments can only be netted across transactions governed under the same master agreement with the same counterparty. |
See Note D.4 for additional disclosure of netting arrangements regarding reverse repurchase agreements.
| 74 | • AB BOND INFLATION STRATEGY |
Notes to Financial Statements
2. Currency Transactions
The Strategy may invest in non-U.S. Dollar-denominated securities on a currency hedged or unhedged basis. The Strategy may seek investment opportunities by taking long or short positions in currencies through the use of currency-related derivatives, including forward currency exchange contracts, futures and options on futures, swaps, and other options. The Strategy may enter into transactions for investment opportunities when it anticipates that a foreign currency will appreciate or depreciate in value but securities denominated in that currency are not held by the Strategy and do not present attractive investment opportunities. Such transactions may also be used when the Adviser believes that it may be more efficient than a direct investment in a foreign currency-denominated security. The Strategy may also conduct currency exchange contracts on a spot basis (i.e., for cash at the spot rate prevailing in the currency exchange market for buying or selling currencies).
3. TBA and Dollar Rolls
The Strategy may invest in TBA mortgage-backed securities. A TBA, or “To Be Announced”, trade represents a contract for the purchase or sale of mortgage-backed securities to be delivered at a future agree-upon date; however, the specific mortgage pool numbers or the number of pools that will be delivered to fulfill the trade obligation or terms of the contract are unknown at the time of the trade. Mortgage pools (including fixed-rate or variable-rate mortgages) guaranteed by the Government National Mortgage Association, or GNMA, the Federal National Mortgage Association, or FNMA, or the Federal Home Loan Mortgage Corporation, or FHLMC, are subsequently allocated to the TBA transactions.
The Strategy may enter into dollar rolls. Dollar rolls involve sales by the Strategy of securities for delivery in the current month and the Strategy’s simultaneously contracting to repurchase substantially similar (same type and coupon) securities on a specified future date. During the roll period, the Strategy forgoes principal and interest paid on the securities. The Strategy is compensated by the difference between the current sales price and the lower forward price for the future purchase (often referred to as the “drop”) as well as by the interest earned on the cash proceeds of the initial sale. Dollar rolls involve the risk that the market value of the securities the Strategy is obligated to repurchase under the agreement may decline below the repurchase price. Dollar rolls are speculative techniques. During the year ended October 31, 2016, the Strategy had no transactions in dollar rolls.
4. Reverse Repurchase Agreements
The Strategy may enter into reverse repurchase transactions (“RVP”) in accordance with the terms of a Master Repurchase Agreement (“MRA”), under which the Strategy sells securities and agrees to repurchase them at a mutually agreed upon date and price. At the time the Strategy enters
| AB BOND INFLATION STRATEGY • | 75 |
Notes to Financial Statements
into a reverse repurchase agreement, it will establish a segregated account with the custodian containing liquid assets having a value comparable to the repurchase price. Under the MRA and other Master Agreements, the Strategy is permitted to offset payables and/or receivables with collateral held and/or posted to the counterparty and create one single net payment due to or from the Strategy in the event of a default. In the event of a default by a MRA counterparty, the Strategy may be considered an unsecured creditor with respect to any excess collateral (collateral with a market value in excess of the repurchase price) held by and/or posted to the counterparty, and as such the return of such excess collateral may be delayed or denied. For the year ended October 31, 2016, the average amount of reverse repurchase agreements outstanding was $123,352,180 and the daily weighted average interest rate was .57%. At October 31, 2016, the Strategy had reverse repurchase agreements outstanding in the amount of $148,326,458 as reported on the statement of assets and liabilities.
The following table presents the Strategy’s RVP liabilities by counterparty net of the related collateral pledged by the Strategy as of October 31, 2016:
Counterparty | RVP Liabilities Subject to a MRA | Securities Collateral Pledged†* | Net Amount of RVP Liabilities | |||||||||
Bank of America NA | $ | 5,581,901 | $ | (5,581,901 | ) | $ | – 0 – | |||||
HSBC Bank USA | 109,471,234 | (109,471,234 | ) | – 0 – | ||||||||
JPMorgan Chase Bank | 33,273,323 | (33,273,323 | ) | – 0 – | ||||||||
|
|
|
|
|
| |||||||
Total | $ | 148,326,458 | $ | (148,326,458 | ) | $ | – 0 – | |||||
|
|
|
|
|
| |||||||
| † | Including accrued interest. |
| * | The actual collateral pledged may be more than the amount reported due to overcollateralization. |
NOTE E
Capital Stock
Each class consists of 3,000,000,000 authorized shares. Transactions in capital shares for each class were as follows:
| Shares | Amount | |||||||||||||||||||||||
| Year Ended October 31, 2016 | Year Ended October 31, 2015 | Year Ended October 31, 2016 | Year Ended 2015 | |||||||||||||||||||||
|
| |||||||||||||||||||||||
| Class A | ||||||||||||||||||||||||
Shares sold | 616,312 | 169,441 | $ | 6,657,179 | $ | 1,801,811 | ||||||||||||||||||
| ||||||||||||||||||||||||
Shares issued in reinvestment of dividends | 20,509 | 11,466 | 218,687 | 120,842 | ||||||||||||||||||||
| ||||||||||||||||||||||||
Shares redeemed | (414,835 | ) | (344,463 | ) | (4,371,321 | ) | (3,652,268 | ) | ||||||||||||||||
| ||||||||||||||||||||||||
Net increase (decrease) | 221,986 | (163,556 | ) | $ | 2,504,545 | $ | (1,729,615 | ) | ||||||||||||||||
| ||||||||||||||||||||||||
| 76 | • AB BOND INFLATION STRATEGY |
Notes to Financial Statements
| Shares | Amount | |||||||||||||||||||||||
| Year Ended October 31, 2016 | Year Ended October 31, 2015 | Year Ended October 31, 2016 | Year Ended 2015 | |||||||||||||||||||||
|
| |||||||||||||||||||||||
| Class C | ||||||||||||||||||||||||
Shares sold | 40,692 | 44,035 | $ | 430,613 | $ | 461,102 | ||||||||||||||||||
| ||||||||||||||||||||||||
Shares issued in reinvestment of dividends | 2,983 | 1,497 | 31,208 | 15,586 | ||||||||||||||||||||
| ||||||||||||||||||||||||
Shares redeemed | (70,612 | ) | (122,764 | ) | (739,753 | ) | (1,282,056 | ) | ||||||||||||||||
| ||||||||||||||||||||||||
Net decrease | (26,937 | ) | (77,232 | ) | $ | (277,932 | ) | $ | (805,368 | ) | ||||||||||||||
| ||||||||||||||||||||||||
| Advisor Class | ||||||||||||||||||||||||
Shares sold | 1,412,206 | 513,914 | $ | 15,223,605 | $ | 5,473,679 | ||||||||||||||||||
| ||||||||||||||||||||||||
Shares issued in reinvestment of dividends | 40,289 | 17,717 | 431,827 | 186,880 | ||||||||||||||||||||
| ||||||||||||||||||||||||
Shares redeemed | (536,555 | ) | (273,750 | ) | (5,711,476 | ) | (2,917,777 | ) | ||||||||||||||||
| ||||||||||||||||||||||||
Net increase | 915,940 | 257,881 | $ | 9,943,956 | $ | 2,742,782 | ||||||||||||||||||
| ||||||||||||||||||||||||
| Class R | ||||||||||||||||||||||||
Shares sold | 35,469 | 2,736 | $ | 382,901 | $ | 29,226 | ||||||||||||||||||
| ||||||||||||||||||||||||
Shares issued in reinvestment of dividends | 248 | 104 | 2,681 | 1,105 | ||||||||||||||||||||
| ||||||||||||||||||||||||
Shares redeemed | (194 | ) | (22,219 | ) | (2,101 | ) | (237,039 | ) | ||||||||||||||||
| ||||||||||||||||||||||||
Net increase (decrease) | 35,523 | (19,379 | ) | $ | 383,481 | $ | (206,708 | ) | ||||||||||||||||
| ||||||||||||||||||||||||
| Class K | ||||||||||||||||||||||||
Shares sold | 100,455 | 42,242 | $ | 1,078,846 | $ | 449,842 | ||||||||||||||||||
| ||||||||||||||||||||||||
Shares issued in reinvestment of dividends | 3,579 | 1,925 | 38,246 | 20,281 | ||||||||||||||||||||
| ||||||||||||||||||||||||
Shares redeemed | (37,944 | ) | (95,208 | ) | (402,583 | ) | (1,009,773 | ) | ||||||||||||||||
| ||||||||||||||||||||||||
Net increase (decrease) | 66,090 | (51,041 | ) | $ | 714,509 | $ | (539,650 | ) | ||||||||||||||||
| ||||||||||||||||||||||||
| Class I | ||||||||||||||||||||||||
Shares sold | 7,138 | 28,559 | $ | 75,774 | $ | 302,454 | ||||||||||||||||||
| ||||||||||||||||||||||||
Shares issued in reinvestment of dividends | 671 | 688 | 7,136 | 7,241 | ||||||||||||||||||||
| ||||||||||||||||||||||||
Shares redeemed | (1,489 | ) | (82,025 | ) | (15,768 | ) | (865,824 | ) | ||||||||||||||||
| ||||||||||||||||||||||||
Net increase (decrease) | 6,320 | (52,778 | ) | $ | 67,142 | $ | (556,129 | ) | ||||||||||||||||
| ||||||||||||||||||||||||
| AB BOND INFLATION STRATEGY • | 77 |
Notes to Financial Statements
| Shares | Amount | |||||||||||||||||||||||
| Year Ended October 31, 2016 | Year Ended October 31, 2015 | Year Ended October 31, 2016 | Year Ended 2015 | |||||||||||||||||||||
|
| |||||||||||||||||||||||
| Class 1 | ||||||||||||||||||||||||
Shares sold | 3,022,337 | 3,177,028 | $ | 31,867,232 | $ | 33,474,332 | ||||||||||||||||||
| ||||||||||||||||||||||||
Shares issued in reinvestment of dividends | 428,634 | 276,081 | 4,530,676 | 2,888,583 | ||||||||||||||||||||
| ||||||||||||||||||||||||
Shares redeemed | (6,952,120 | ) | (5,915,647 | ) | (72,934,157 | ) | (62,348,456 | ) | ||||||||||||||||
| ||||||||||||||||||||||||
Net decrease | (3,501,149 | ) | (2,462,538 | ) | $ | (36,536,249 | ) | $ | (25,985,541 | ) | ||||||||||||||
| ||||||||||||||||||||||||
| Class 2 | ||||||||||||||||||||||||
Shares sold | 1,627,909 | 1,143,181 | $ | 16,977,155 | $ | 12,002,916 | ||||||||||||||||||
| ||||||||||||||||||||||||
Shares issued in reinvestment of dividends | 87,936 | 43,283 | 928,629 | 452,514 | ||||||||||||||||||||
| ||||||||||||||||||||||||
Shares redeemed | (2,217,803 | ) | (1,654,114 | ) | (23,295,763 | ) | (17,603,900 | ) | ||||||||||||||||
| ||||||||||||||||||||||||
Net decrease | (501,958 | ) | (467,650 | ) | $ | (5,389,979 | ) | $ | (5,148,470 | ) | ||||||||||||||
| ||||||||||||||||||||||||
| Class Z(a) | ||||||||||||||||||||||||
Shares sold | 1,015,987 | 407,576 | $ | 10,731,967 | $ | 4,264,298 | ||||||||||||||||||
| ||||||||||||||||||||||||
Shares issued in reinvestment of dividends | 24,013 | 1,367 | 255,907 | 14,242 | ||||||||||||||||||||
| ||||||||||||||||||||||||
Shares redeemed | (338,366 | ) | (40,713 | ) | (3,637,645 | ) | (427,376 | ) | ||||||||||||||||
| ||||||||||||||||||||||||
Net increase | 701,634 | 368,230 | $ | 7,350,229 | $ | 3,851,164 | ||||||||||||||||||
| ||||||||||||||||||||||||
| (a) | Commenced distributions on December 11, 2014. |
NOTE F
Risks Involved in Investing in the Strategy
Interest Rate Risk and Credit Risk—Interest rate risk is the risk that changes in interest rates will affect the value of the Strategy’s investments in fixed-income debt securities such as bonds or notes. Increases in interest rates may cause the value of the Strategy’s investments to decline. Credit risk is the risk that the issuer or guarantor of a debt security, or the counterparty to a derivative contract, will be unable or unwilling to make timely principal and/or interest payments, or to otherwise honor its obligations. The degree of risk for a particular security may be reflected in its credit rating. Credit risk is greater for medium quality and lower-rated securities. Lower-rated debt securities and similar unrated securities (commonly known as “junk bonds”) have speculative elements or are predominantly speculative risks.
Duration Risk—Duration is a measure that relates the expected price volatility of a fixed-income security to changes in interest rates. The duration of a fixed-income security may be shorter than or equal to full maturity of a fixed-income security. Fixed-income securities with longer
| 78 | • AB BOND INFLATION STRATEGY |
Notes to Financial Statements
durations have more risk and will decrease in price as interest rates rise. For example, a fixed-income security with a duration of three years will decrease in value by approximately 3% if interest rates increase by 1%.
Inflation Risk—This is the risk that the value of assets or income from investments will be less in the future as inflation decreases the value of money. As inflation increases, the value of the Strategy’s assets can decline as can the value of the Strategy’s distributions. The risk is significantly greater for fixed-income securities with longer maturites. Although the Strategy invests principally in inflation-indexed securities, the value of its securities may be vulnerable to changes in expectations of inflation or interest rates.
Derivatives Risk—The Strategy may enter into derivative transactions such as forwards, options, futures and swaps. Derivatives may be illiquid, difficult to price, and leveraged so that small changes may produce disproportionate losses for the Strategy, and subject to counterparty risk to a greater degree than more traditional investments. Derivatives may result in significant losses, including losses that are far greater than the value of the derivatives reflected on the statement of assets and liabilities.
Foreign (Non-U.S.) Risk—Investments in securities of non-U.S. issuers may involve more risk than those of U.S. issuers. These securities may fluctuate more widely in price and may be less liquid due to adverse market, economic, political, regulatory or other factors.
Currency Risk—Fluctuations in currency exchange rates may negatively affect the value of the Strategy’s investments or reduce its returns.
Leverage Risk—When the Strategy borrows money or otherwise leverages its investments, its performance may be volatile because leverage tends to exaggerate the effect of any increase or decrease in the value of the Strategy’s investments. The Strategy may create leverage through the use of reverse repurchase arrangements, forward currency exchange contracts, forward commitments, dollar rolls or futures or by borrowing money. The use of derivative instruments by the Strategy, such as forwards, futures, options and swaps, may also result in a form of leverage. Leverage may result in higher returns to the Strategy than if the Strategy were not leveraged, but may also adversely affect returns, particularly if the market is declining.
Liquidity Risk—Liquidity risk occurs when certain investments become difficult to purchase or sell. Difficulty in selling less liquid securities may result in sales at disadvantageous prices affecting the value of your investment in the Strategy. Causes of liquidity risk may include low trading volumes, large positions and heavy redemptions of fund shares. Over
| AB BOND INFLATION STRATEGY • | 79 |
Notes to Financial Statements
recent years, liquidity risk has also increased because the capacity of dealers in the secondary market for fixed-income securities to make markets in these securities has decreased, even as the overall bond market has grown significantly, due to, among other things, structural changes, additional regulatory requirements and capital and risk restraints that have led to reduced inventories. Liquidity risk may be higher in a rising interest rate environment, when the value and liquidity of fixed-income securities generally go down.
Indemnification Risk—In the ordinary course of business, the Strategy enters into contracts that contain a variety of indemnifications. The Strategy’s maximum exposure under these arrangements is unknown. However, the Strategy has not had prior claims or losses pursuant to these indemnification provisions and expects the risk of loss thereunder to be remote. Therefore, the Strategy has not accrued any liability in connection with these indemnification provisions.
NOTE G
Joint Credit Facility
A number of open-end mutual funds managed by the Adviser, including the Strategy, participate in a $280 million revolving credit facility (the “Facility”) intended to provide short-term financing, if necessary, subject to certain restrictions in connection with abnormal redemption activity. Commitment fees related to the Facility are paid by the participating funds and are included in miscellaneous expenses in the statement of operations. The Strategy did not utilize the Facility during the year ended October 31, 2016.
NOTE H
Distributions to Shareholders
The tax character of distributions paid during the fiscal years ended October 31, 2016 and October 31, 2015 were as follows:
| 2016 | 2015 | |||||||
Distributions paid from: | ||||||||
Ordinary income | $ | 7,812,213 | $ | 4,629,168 | ||||
|
|
|
| |||||
Total taxable distributions | $ | 7,812,213 | $ | 4,629,168 | ||||
|
|
|
| |||||
As of October 31, 2016, the components of accumulated earnings/(deficit) on a tax basis were as follows:
Undistributed ordinary income | $ | 290,882 | ||
Accumulated capital and other losses | (11,554,039 | )(a) | ||
Unrealized appreciation/(depreciation) | 5,818,203 | (b) | ||
|
| |||
Total accumulated earnings/(deficit) | (5,444,954 | )(c) | ||
|
|
| (a) | At October 31, 2016, the Strategy had a net capital loss carryforward of $11,554,039. |
| 80 | • AB BOND INFLATION STRATEGY |
Notes to Financial Statements
| (b) | The differences between book-basis and tax-basis unrealized appreciation/(depreciation) are attributable primarily to the tax deferral of losses on wash sales, the tax treatment of swaps and passive foreign investment companies (PFICs), the realization for tax purposes of gains/losses on certain derivative instruments, and the tax treatment of Treasury inflation-protected securities. |
| (c) | The difference between book-basis and tax-basis components of accumulated earnings/(deficit) is attributable primarily to the tax treatment of defaulted securities. |
For tax purposes, net realized capital losses may be carried over to offset future capital gains, if any. Funds are permitted to carry forward capital losses for an indefinite period, and such losses will retain their character as either short-term or long-term capital losses. As of October 31, 2016, the Fund had a net short-term capital loss carryforward of $3,659,537 and a net long-term capital loss carryforward of $7,894,502, which may be carried forward for an indefinite period.
During the current fiscal year, permanent differences primarily due to the tax treatment of futures, option and swaps, reclassifications of foreign currency and paydown gain/losses, the tax treatment of Treasury inflation-protected securities resulted in a net decrease in undistributed net investment income, and a net decrease in accumulated net realized loss on investment and foreign currency transactions. This reclassification had no effect on net assets.
NOTE I
New Accounting Pronouncements
In May 2015, the Financial Accounting Standards Board issued an Accounting Standards Update, ASU 2015-07 (the “ASU”) which removes the requirement to categorize within the fair value hierarchy all investments for which fair value is measured using the net asset value per share practical expedient. The ASU also removes the requirement to make certain disclosures for investments that are eligible to be measured at fair value using the net asset value per share practical expedient but do not utilize that practical expedient. The ASU is effective for annual periods beginning after December 15, 2015 and interim periods within those annual periods. Management has evaluated the implications of these changes and there will be no impact to the financial statements.
In October 2016, the U.S. Securities and Exchange Commission adopted new rules and amended existing rules (together, “final rules”) intended to modernize the reporting and disclosure of information by registered investment companies. In part, the final rules amend Regulation S-X and require standardized, enhanced disclosure about derivatives in investment company financial statements, as well as other amendments. The compliance date for the amendments to Regulation S-X is August 1, 2017. Management is currently evaluating the impact that the adoption of the amendments to Regulation S-X will have on the financial statements and related disclosures.
| AB BOND INFLATION STRATEGY • | 81 |
Notes to Financial Statements
NOTE J
Subsequent Events
Management has evaluated subsequent events for possible recognition or disclosure in the financial statements through the date the financial statements are issued. Management has determined that there are no material events that would require disclosure in the Strategy’s financial statements through this date.
| 82 | • AB BOND INFLATION STRATEGY |
Notes to Financial Statements
FINANCIAL HIGHLIGHTS
Selected Data For A Share Of Capital Stock Outstanding Throughout Each Period
| Class A | ||||||||||||||||||||
| Year Ended October 31, | ||||||||||||||||||||
| 2016 | 2015 | 2014 | 2013 | 2012 | ||||||||||||||||
|
| |||||||||||||||||||
Net asset value, beginning of period | $ 10.44 | $ 10.77 | $ 10.81 | $ 11.36 | $ 10.81 | |||||||||||||||
|
| |||||||||||||||||||
Income From Investment Operations | ||||||||||||||||||||
Net investment | .18 | .08 | .17 | .09 | .13 | |||||||||||||||
Net realized and unrealized gain (loss) on investment and foreign currency transactions | .51 | (.31 | ) | (.04 | ) | (.57 | ) | .56 | ||||||||||||
|
| |||||||||||||||||||
Net increase (decrease) in net asset value from operations | .69 | (.23 | ) | .13 | (.48 | ) | .69 | |||||||||||||
|
| |||||||||||||||||||
Less: Dividends and Distributions | ||||||||||||||||||||
Dividends from net investment income | (.21 | ) | (.10 | ) | (.17 | ) | (.07 | ) | (.14 | ) | ||||||||||
Distributions from net realized gain on investment transactions | – 0 | – | – 0 | – | – 0 | – | .00 | (c) | – 0 | – | ||||||||||
|
| |||||||||||||||||||
Total dividends and distributions | (.21 | ) | (.10 | ) | (.17 | ) | (.07 | ) | (.14 | ) | ||||||||||
|
| |||||||||||||||||||
Net asset value, end of period | $ 10.92 | $ 10.44 | $ 10.77 | $ 10.81 | $ 11.36 | |||||||||||||||
|
| |||||||||||||||||||
Total Return | ||||||||||||||||||||
Total investment return based on net asset value(d) | 6.63 | % | (2.18 | )% | 1.16 | % | (4.23 | )% | 6.41 | % | ||||||||||
Ratios/Supplemental Data | ||||||||||||||||||||
Net assets, end of period (000’s omitted) | $16,712 | $13,660 | $15,860 | $23,358 | $17,627 | |||||||||||||||
Ratio to average net assets of: | ||||||||||||||||||||
Expenses, net of waivers/reimbursements(e) | .98 | % | .88 | % | .81 | % | .80 | % | .81 | % | ||||||||||
Expenses, before waivers/reimbursements(e) | 1.42 | % | 1.36 | % | 1.15 | % | 1.18 | % | 1.25 | % | ||||||||||
Net investment income(b) | 1.71 | % | .75 | % | 1.57 | % | .80 | % | 1.20 | % | ||||||||||
Portfolio turnover rate** | 41 | % | 51 | % | 77 | % | 93 | % | 32 | % | ||||||||||
See footnote summary on page 92.
| AB BOND INFLATION STRATEGY • | 83 |
Financial Highlights
Selected Data For A Share Of Capital Stock Outstanding Throughout Each Period
| Class C | ||||||||||||||||||||
| Year Ended October 31, | ||||||||||||||||||||
| 2016 | 2015 | 2014 | 2013 | 2012 | ||||||||||||||||
|
| |||||||||||||||||||
Net asset value, beginning of period | $ 10.27 | $ 10.64 | $ 10.71 | $ 11.28 | $ 10.78 | |||||||||||||||
|
| |||||||||||||||||||
Income From Investment Operations | ||||||||||||||||||||
Net investment | .10 | .00 | (c) | .07 | .00 | (c) | .04 | |||||||||||||
Net realized and unrealized gain (loss) on investment and foreign currency transactions | .50 | (.31 | ) | (.01 | ) | (.56 | ) | .56 | ||||||||||||
|
| |||||||||||||||||||
Net increase (decrease) in net asset value from operations | .60 | (.31 | ) | .06 | (.56 | ) | .60 | |||||||||||||
|
| |||||||||||||||||||
Less: Dividends and Distributions | ||||||||||||||||||||
Dividends from net investment income | (.16 | ) | (.06 | ) | (.13 | ) | (.01 | ) | (.10 | ) | ||||||||||
Distributions from net realized gain on investment transactions | – 0 | – | – 0 | – | – 0 | – | (.00 | )(c) | – 0 | – | ||||||||||
|
| |||||||||||||||||||
Total dividends and distributions | (.16 | ) | (.06 | ) | (.13 | ) | (.01 | ) | (.10 | ) | ||||||||||
|
| |||||||||||||||||||
Net asset value, end of period | $ 10.71 | $ 10.27 | $ 10.64 | $ 10.71 | $ 11.28 | |||||||||||||||
|
| |||||||||||||||||||
Total Return | ||||||||||||||||||||
Total investment return based on net asset value(d) | 5.86 | % | (2.93 | )% | .50 | % | (4.98 | )% | 5.61 | % | ||||||||||
Ratios/Supplemental Data | ||||||||||||||||||||
Net assets, end of period (000’s omitted) | $2,505 | $2,679 | $3,596 | $5,845 | $7,991 | |||||||||||||||
Ratio to average net assets of: | ||||||||||||||||||||
Expenses, net of waivers/reimbursements(e) | 1.72 | % | 1.58 | % | 1.51 | % | 1.51 | % | 1.51 | % | ||||||||||
Expenses, before waivers/reimbursements(e) | 2.16 | % | 2.07 | % | 1.86 | % | 1.86 | % | 1.96 | % | ||||||||||
Net investment income(b) | .96 | % | .06 | % | .70 | % | .01 | % | .39 | % | ||||||||||
Portfolio turnover rate** | 41 | % | 51 | % | 77 | % | 93 | % | 32 | % | ||||||||||
See footnote summary on page 92.
| 84 | • AB BOND INFLATION STRATEGY |
Financial Highlights
Selected Data For A Share Of Capital Stock Outstanding Throughout Each Period
| Advisor Class | ||||||||||||||||||||
| Year Ended October 31, | ||||||||||||||||||||
| 2016 | 2015 | 2014 | 2013 | 2012 | ||||||||||||||||
|
| |||||||||||||||||||
Net asset value, beginning of period | $ 10.46 | $ 10.79 | $ 10.82 | $ 11.39 | $ 10.83 | |||||||||||||||
|
| |||||||||||||||||||
Income From Investment Operations | ||||||||||||||||||||
Net investment | .22 | .13 | .19 | .06 | .16 | |||||||||||||||
Net realized and unrealized gain (loss) on investment and foreign currency transactions | .49 | (.33 | ) | (.03 | ) | (.52 | ) | .56 | ||||||||||||
|
| |||||||||||||||||||
Net increase (decrease) in net asset value from operations | .71 | (.20 | ) | .16 | (.46 | ) | .72 | |||||||||||||
|
| |||||||||||||||||||
Less: Dividends and Distributions | ||||||||||||||||||||
Dividends from net investment income | (.24 | ) | (.13 | ) | (.19 | ) | (.11 | ) | (.16 | ) | ||||||||||
Distributions from net realized gain on investment transactions | – 0 | – | – 0 | – | – 0 | – | .00 | (c) | – 0 | – | ||||||||||
|
| |||||||||||||||||||
Total dividends and distributions | (.24 | ) | (.13 | ) | (.19 | ) | (.11 | ) | (.16 | ) | ||||||||||
|
| |||||||||||||||||||
Net asset value, end of period | $ 10.93 | $ 10.46 | $ 10.79 | $ 10.82 | $ 11.39 | |||||||||||||||
|
| |||||||||||||||||||
Total Return | ||||||||||||||||||||
Total investment return based on net asset value(d) | 6.87 | % | (1.90 | )% | 1.50 | % | (4.06 | )% | 6.69 | % | ||||||||||
Ratios/Supplemental Data | ||||||||||||||||||||
Net assets, end of period (000’s omitted) | $29,186 | $18,343 | $16,144 | $7,969 | $5,499 | |||||||||||||||
Ratio to average net assets of: | ||||||||||||||||||||
Expenses, net of waivers/reimbursements(e) | .73 | % | .58 | % | .52 | % | .51 | % | .51 | % | ||||||||||
Expenses, before waivers/reimbursements(e) | 1.16 | % | 1.06 | % | .86 | % | .87 | % | .95 | % | ||||||||||
Net investment income(b) | 2.04 | % | 1.23 | % | 1.77 | % | .54 | % | 1.52 | % | ||||||||||
Portfolio turnover rate** | 41 | % | 51 | % | 77 | % | 93 | % | 32 | % | ||||||||||
See footnote summary on page 92.
| AB BOND INFLATION STRATEGY • | 85 |
Financial Highlights
Selected Data For A Share Of Capital Stock Outstanding Throughout Each Period
| Class R | ||||||||||||||||||||
| Year Ended October 31, | ||||||||||||||||||||
| 2016 | 2015 | 2014 | 2013 | 2012 | ||||||||||||||||
|
| |||||||||||||||||||
Net asset value, beginning of period | $ 10.44 | $ 10.78 | $ 10.81 | $ 11.34 | $ 10.79 | |||||||||||||||
|
| |||||||||||||||||||
Income From Investment Operations | ||||||||||||||||||||
Net investment | .29 | (.08 | ) | .14 | .06 | .11 | ||||||||||||||
Net realized and unrealized gain (loss) on investment and foreign currency transactions | .37 | (.19 | ) | (.02 | ) | (.57 | ) | .55 | ||||||||||||
|
| |||||||||||||||||||
Net increase (decrease) in net asset value from operations | .66 | (.27 | ) | .12 | (.51 | ) | .66 | |||||||||||||
|
| |||||||||||||||||||
Less: Dividends and Distributions | ||||||||||||||||||||
Dividends from net investment income | (.21 | ) | (.07 | ) | (.15 | ) | (.02 | ) | (.11 | ) | ||||||||||
Distributions from net realized gain on investment transactions | – 0 | – | – 0 | – | – 0 | – | .00 | (c) | – 0 | – | ||||||||||
|
| |||||||||||||||||||
Total dividends and distributions | (.21 | ) | (.07 | ) | (.15 | ) | (.02 | ) | (.11 | ) | ||||||||||
|
| |||||||||||||||||||
Net asset value, end of period | $ 10.89 | $ 10.44 | $ 10.78 | $ 10.81 | $ 11.34 | |||||||||||||||
|
| |||||||||||||||||||
Total Return | ||||||||||||||||||||
Total investment return based on net asset value(d) | 6.41 | % | (2.49 | )% | 1.10 | % | (4.51 | )% | 6.18 | % | ||||||||||
Ratios/Supplemental Data | ||||||||||||||||||||
Net assets, end of period (000’s omitted) | $408 | $20 | $230 | $209 | $539 | |||||||||||||||
Ratio to average net assets of: | ||||||||||||||||||||
Expenses, net of waivers/reimbursements(e) | 1.24 | % | 1.06 | % | 1.01 | % | 1.01 | % | 1.01 | % | ||||||||||
Expenses, before waivers/reimbursements(e) | 1.71 | % | 1.50 | % | 1.40 | % | 1.44 | % | 1.60 | % | ||||||||||
Net investment | 2.71 | % | (.68 | )% | 1.26 | % | .49 | % | .98 | % | ||||||||||
Portfolio turnover rate** | 41 | % | 51 | % | 77 | % | 93 | % | 32 | % | ||||||||||
See footnote summary on page 92.
| 86 | • AB BOND INFLATION STRATEGY |
Financial Highlights
Selected Data For A Share Of Capital Stock Outstanding Throughout Each Period
| Class K | ||||||||||||||||||||
| Year Ended October 31, | ||||||||||||||||||||
| 2016 | 2015 | 2014 | 2013 | 2012 | ||||||||||||||||
|
| |||||||||||||||||||
Net asset value, beginning of period | $ 10.42 | $ 10.77 | $ 10.80 | $ 11.35 | $ 10.79 | |||||||||||||||
|
| |||||||||||||||||||
Income From Investment Operations | ||||||||||||||||||||
Net investment | .20 | .07 | .17 | .09 | .13 | |||||||||||||||
Net realized and unrealized gain (loss) on investment and foreign currency transactions | .49 | (.31 | ) | (.03 | ) | (.57 | ) | .57 | ||||||||||||
|
| |||||||||||||||||||
Net increase (decrease) in net asset value from operations | .69 | (.24 | ) | .14 | (.48 | ) | .70 | |||||||||||||
|
| |||||||||||||||||||
Less: Dividends and Distributions | ||||||||||||||||||||
Dividends from net investment income | (.22 | ) | (.11 | ) | (.17 | ) | (.07 | ) | (.14 | ) | ||||||||||
Distributions from net realized gain on investment transactions | – 0 | – | – 0 | – | – 0 | – | .00 | (c) | – 0 | – | ||||||||||
|
| |||||||||||||||||||
Total dividends and distributions | (.22 | ) | (.11 | ) | (.17 | ) | (.07 | ) | (.14 | ) | ||||||||||
|
| |||||||||||||||||||
Net asset value, end of period | $ 10.89 | $ 10.42 | $ 10.77 | $ 10.80 | $ 11.35 | |||||||||||||||
|
| |||||||||||||||||||
Total Return | ||||||||||||||||||||
Total investment return based on net asset value(d) | 6.66 | % | (2.24 | )% | 1.31 | % | (4.26 | )% | 6.51 | % | ||||||||||
Ratios/Supplemental Data | ||||||||||||||||||||
Net assets, end of period (000’s omitted) | $2,409 | $1,616 | $2,219 | $1,981 | $2,007 | |||||||||||||||
Ratio to average net assets of: | ||||||||||||||||||||
Expenses, net of waivers/reimbursements(e) | .98 | % | .83 | % | .76 | % | .76 | % | .77 | % | ||||||||||
Expenses, before waivers/reimbursements(e) | 1.36 | % | 1.17 | % | 1.07 | % | 1.12 | % | 1.27 | % | ||||||||||
Net investment income(b) | 1.87 | % | .70 | % | 1.57 | % | .80 | % | 1.19 | % | ||||||||||
Portfolio turnover rate** | 41 | % | 51 | % | 77 | % | 93 | % | 32 | % | ||||||||||
See footnote summary on page 92.
| AB BOND INFLATION STRATEGY • | 87 |
Financial Highlights
Selected Data For A Share Of Capital Stock Outstanding Throughout Each Period
| Class I | ||||||||||||||||||||
| Year Ended October 31, | ||||||||||||||||||||
| 2016 | 2015 | 2014 | 2013 | 2012 | ||||||||||||||||
|
| |||||||||||||||||||
Net asset value, beginning of period | $ 10.38 | $ 10.73 | $ 10.77 | $ 11.33 | $ 10.78 | |||||||||||||||
|
| |||||||||||||||||||
Income From Investment Operations | ||||||||||||||||||||
Net investment | .22 | (.06 | ) | .22 | .10 | .18 | ||||||||||||||
Net realized and unrealized gain (loss) on investment and foreign currency transactions | .50 | (.14 | ) | (.06 | ) | (.55 | ) | .53 | ||||||||||||
|
| |||||||||||||||||||
Net increase (decrease) in net asset value from operations | .72 | (.20 | ) | .16 | (.45 | ) | .71 | |||||||||||||
|
| |||||||||||||||||||
Less: Dividends and Distributions | ||||||||||||||||||||
Dividends from net investment income | (.26 | ) | (.15 | ) | (.20 | ) | (.11 | ) | (.16 | ) | ||||||||||
Distributions from net realized gain on investment transactions | – 0 | – | – 0 | – | – 0 | – | .00 | (c) | – 0 | – | ||||||||||
|
| |||||||||||||||||||
Total dividends and distributions | (.26 | ) | (.15 | ) | (.20 | ) | (.11 | ) | (.16 | ) | ||||||||||
|
| |||||||||||||||||||
Net asset value, end of period | $ 10.84 | $ 10.38 | $ 10.73 | $ 10.77 | $ 11.33 | |||||||||||||||
|
| |||||||||||||||||||
Total Return | ||||||||||||||||||||
Total investment return based on net asset value(d) | 6.98 | % | (1.88 | )% | 1.52 | % | (4.00 | )% | 6.65 | % | ||||||||||
Ratios/Supplemental Data | ||||||||||||||||||||
Net assets, end of period (000’s omitted) | $345 | $265 | $841 | $2,631 | $267 | |||||||||||||||
Ratio to average net assets of: | ||||||||||||||||||||
Expenses, net of waivers/reimbursements(e) | .72 | % | .57 | % | .51 | % | .50 | % | .52 | % | ||||||||||
Expenses, before waivers/reimbursements(e) | 1.03 | % | .76 | % | .69 | % | .83 | % | .95 | % | ||||||||||
Net investment | 2.08 | % | (.50 | )% | 2.06 | % | 1.10 | % | 1.54 | % | ||||||||||
Portfolio turnover rate** | 41 | % | 51 | % | 77 | % | 93 | % | 32 | % | ||||||||||
See footnote summary on page 92.
| 88 | • AB BOND INFLATION STRATEGY |
Financial Highlights
Selected Data For A Share Of Capital Stock Outstanding Throughout Each Period
| Class 1 | ||||||||||||||||||||
| Year Ended October 31, | ||||||||||||||||||||
| 2016 | 2015 | 2014 | 2013 | 2012 | ||||||||||||||||
|
| |||||||||||||||||||
Net asset value, beginning of period | $ 10.35 | $ 10.71 | $ 10.76 | $ 11.33 | $ 10.78 | |||||||||||||||
|
| |||||||||||||||||||
Income From Investment Operations | ||||||||||||||||||||
Net investment | .20 | .10 | .19 | .12 | .16 | |||||||||||||||
Net realized and unrealized gain (loss) on investment and foreign currency transactions | .51 | (.32 | ) | (.04 | ) | (.58 | ) | .55 | ||||||||||||
|
| |||||||||||||||||||
Net increase (decrease) in net asset value from operations | .71 | (.22 | ) | .15 | (.46 | ) | .71 | |||||||||||||
|
| |||||||||||||||||||
Less: Dividends and Distributions | ||||||||||||||||||||
Dividends from net investment income | (.26 | ) | (.14 | ) | (.20 | ) | (.11 | ) | (.16 | ) | ||||||||||
Distributions from net realized gain on investment transactions | – 0 | – | – 0 | – | – 0 | – | .00 | (c) | – 0 | – | ||||||||||
|
| |||||||||||||||||||
Total dividends and distributions | (.26 | ) | (.14 | ) | (.20 | ) | (.11 | ) | (.16 | ) | ||||||||||
|
| |||||||||||||||||||
Net asset value, end of period | $ 10.80 | $ 10.35 | $ 10.71 | $ 10.76 | $ 11.33 | |||||||||||||||
|
| |||||||||||||||||||
Total Return | ||||||||||||||||||||
Total investment return based on net asset value(d) | 6.89 | % | (2.04 | )% | 1.38 | % | (4.08 | )% | 6.63 | % | ||||||||||
Ratios/Supplemental Data | ||||||||||||||||||||
Net assets, end of period (000’s omitted) | $226,408 | $253,402 | $288,565 | $315,187 | $193,864 | |||||||||||||||
Ratio to average net assets of: | ||||||||||||||||||||
Expenses, net of waivers/reimbursements(e) | .82 | % | .68 | % | .61 | % | .60 | % | .61 | % | ||||||||||
Expenses, before waivers/reimbursements(e) | 1.03 | % | .87 | % | .77 | % | .81 | % | .96 | % | ||||||||||
Net investment income(b) | 1.86 | % | .98 | % | 1.75 | % | 1.05 | % | 1.41 | % | ||||||||||
Portfolio turnover rate** | 41 | % | 51 | % | 77 | % | 93 | % | 32 | % | ||||||||||
See footnote summary on page 92.
| AB BOND INFLATION STRATEGY • | 89 |
Financial Highlights
Selected Data For A Share Of Capital Stock Outstanding Throughout Each Period
| Class 2 | ||||||||||||||||||||
| Year Ended October 31, | ||||||||||||||||||||
| 2016 | 2015 | 2014 | 2013 | 2012 | ||||||||||||||||
|
| |||||||||||||||||||
Net asset value, beginning of period | $ 10.35 | $ 10.71 | $ 10.75 | $ 11.33 | $ 10.77 | |||||||||||||||
|
| |||||||||||||||||||
Income From Investment Operations | ||||||||||||||||||||
Net investment | .20 | .11 | .20 | .12 | .14 | |||||||||||||||
Net realized and unrealized gain (loss) on investment and foreign currency transactions | .51 | (.32 | ) | (.03 | ) | (.58 | ) | .59 | ||||||||||||
|
| |||||||||||||||||||
Net increase (decrease) in net asset value from operations | .71 | (.21 | ) | .17 | (.46 | ) | .73 | |||||||||||||
|
| |||||||||||||||||||
Less: Dividends and Distributions | ||||||||||||||||||||
Dividends from net investment income | (.27 | ) | (.15 | ) | (.21 | ) | (.12 | ) | (.17 | ) | ||||||||||
Distributions from net realized gain on investment transactions | – 0 | – | – 0 | – | – 0 | – | (.00 | )(c) | – 0 | – | ||||||||||
|
| |||||||||||||||||||
Total dividends and distributions | (.27 | ) | (.15 | ) | (.21 | ) | (.12 | ) | (.17 | ) | ||||||||||
|
| |||||||||||||||||||
Net asset value, end of period | $ 10.79 | $ 10.35 | $ 10.71 | $ 10.75 | $ 11.33 | |||||||||||||||
|
| |||||||||||||||||||
Total Return | ||||||||||||||||||||
Total investment return based on net asset value(d) | 6.92 | % | (1.95 | )% | 1.55 | % | (4.06 | )% | 6.80 | % | ||||||||||
Ratios/Supplemental Data | ||||||||||||||||||||
Net assets, end of period (000’s omitted) | $37,207 | $40,897 | $47,314 | $46,554 | $47,200 | |||||||||||||||
Ratio to average net assets of: | ||||||||||||||||||||
Expenses, net of waivers/reimbursements(e) | .72 | % | .58 | % | .51 | % | .51 | % | .51 | % | ||||||||||
Expenses, before waivers/reimbursements(e) | .93 | % | .77 | % | .67 | % | .71 | % | .86 | % | ||||||||||
Net investment income(b) | 1.93 | % | 1.09 | % | 1.87 | % | 1.05 | % | 1.36 | % | ||||||||||
Portfolio turnover rate** | 41 | % | 51 | % | 77 | % | 93 | % | 32 | % | ||||||||||
See footnote summary on page 92.
| 90 | • AB BOND INFLATION STRATEGY |
Financial Highlights
Selected Data For A Share Of Capital Stock Outstanding Throughout Each Period
| Class Z | ||||||||
| Year Ended October 31, 2016 | December 11, 2014(f) to October 31, | |||||||
|
| |||||||
Net asset value, beginning of period | $ 10.38 | $ 10.62 | ||||||
|
| |||||||
Income From Investment Operations | ||||||||
Net investment income(a)(b) | .25 | .19 | ||||||
Net realized and unrealized gain (loss) on investment and foreign currency transactions | .46 | (.28 | ) | |||||
|
| |||||||
Net increase (decrease) in net asset value from operations | .71 | (.09 | ) | |||||
|
| |||||||
Less: Dividends | ||||||||
Dividends from net investment income | (.27 | ) | (.15 | ) | ||||
|
| |||||||
Net asset value, end of period | $ 10.82 | $ 10.38 | ||||||
|
| |||||||
Total Return | ||||||||
Total investment return based on net asset value(d) | 6.89 | % | (.86 | )% | ||||
Ratios/Supplemental Data | ||||||||
Net assets, end of period (000’‘s omitted) | $11,576 | $3,821 | ||||||
Ratio to average net assets of: | ||||||||
Expenses, net of waivers/reimbursements(e) | .73 | % | .61 | %^ | ||||
Expenses, before waivers/reimbursements(e) | .95 | % | .84 | %^ | ||||
Net investment income(b) | 2.40 | % | 2.09 | %^ | ||||
Portfolio turnover rate** | 41 | % | 51 | % | ||||
See footnote summary on page 92.
| AB BOND INFLATION STRATEGY • | 91 |
Financial Highlights
| (a) | Based on average shares outstanding. |
| (b) | Net of fees and expenses waived/reimbursed by the Adviser. |
| (c) | Amount is less than $.005. |
| (d) | Total investment return is calculated assuming an initial investment made at the net asset value at the beginning of the period, reinvestment of all dividends and distributions at net asset value during the period, and redemption on the last day of the period. Initial sales charges or contingent deferred sales charges are not reflected in the calculation of total investment return. Total return does not reflect the deduction of taxes that a shareholder would pay on fund distributions or the redemption of fund shares. Total investment return calculated for a period of less than one year is not annualized. |
| (e) | The expense ratios presented below exclude interest expense: |
| Year Ended October 31, | ||||||||||||||||||||
| 2016 | 2015 | 2014 | 2013 | 2012 | ||||||||||||||||
|
| |||||||||||||||||||
Class A | ||||||||||||||||||||
Net of waivers/reimbursements | .76 | % | .80 | % | .79 | % | .75 | % | .75 | % | ||||||||||
Before waivers/reimbursements | 1.20 | % | 1.28 | % | 1.13 | % | 1.12 | % | 1.18 | % | ||||||||||
Class C | ||||||||||||||||||||
Net of waivers/reimbursements | 1.50 | % | 1.50 | % | 1.48 | % | 1.45 | % | 1.45 | % | ||||||||||
Before waivers/reimbursements | 1.94 | % | 1.99 | % | 1.84 | % | 1.81 | % | 1.90 | % | ||||||||||
Advisor Class | ||||||||||||||||||||
Net of waivers/reimbursements | .50 | % | .50 | % | .49 | % | .45 | % | .45 | % | ||||||||||
Before waivers/reimbursements | .93 | % | .98 | % | .84 | % | .82 | % | .89 | % | ||||||||||
Class R | ||||||||||||||||||||
Net of waivers/reimbursements | 1.00 | % | 1.00 | % | .99 | % | .95 | % | .95 | % | ||||||||||
Before waivers/reimbursements | 1.47 | % | 1.44 | % | 1.38 | % | 1.39 | % | 1.54 | % | ||||||||||
Class K | ||||||||||||||||||||
Net of waivers/reimbursements | .75 | % | .75 | % | .74 | % | .70 | % | .70 | % | ||||||||||
Before waivers/reimbursements | 1.13 | % | 1.09 | % | 1.05 | % | 1.06 | % | 1.21 | % | ||||||||||
Class I | ||||||||||||||||||||
Net of waivers/reimbursements | .50 | % | .50 | % | .49 | % | .45 | % | .45 | % | ||||||||||
Before waivers/reimbursements | .81 | % | .69 | % | .67 | % | .78 | % | .89 | % | ||||||||||
Class 1 | ||||||||||||||||||||
Net of waivers/reimbursements | .60 | % | .60 | % | .59 | % | .55 | % | .55 | % | ||||||||||
Before waivers/reimbursements | .81 | % | .79 | % | .74 | % | .76 | % | .89 | % | ||||||||||
Class 2 | ||||||||||||||||||||
Net of waivers/reimbursements | .50 | % | .50 | % | .49 | % | .45 | % | .45 | % | ||||||||||
Before waivers/reimbursements | .71 | % | .69 | % | .64 | % | .66 | % | .80 | % | ||||||||||
Class Z(g) | ||||||||||||||||||||
Net of waivers/reimbursements | .50 | % | .50 | %^ | ||||||||||||||||
Before waivers/reimbursements | .72 | % | .73 | %^ | ||||||||||||||||
| (f) | Commencement of distribution. |
| (g) | Commenced distribution on December 11, 2014. |
| ^ | Annualized. |
| ** | The Strategy accounts for dollar roll transactions as purchases and sales. |
See notes to financial statements.
| 92 | • AB BOND INFLATION STRATEGY |
Financial Highlights
REPORT OF INDEPENDENT REGISTERED
PUBLIC ACCOUNTING FIRM
To the Board of Directors and Shareholders of AB Bond Inflation Strategy Portfolio
We have audited the accompanying statement of assets and liabilities, including the portfolio of investments, of AB Bond Inflation Strategy Portfolio (the “Fund”), one of the portfolios constituting the AB Bond Fund, Inc. as of October 31, 2016, and the related statements of operations and cash flows for the year then ended, the statements of changes in net assets for each of the two years in the period then ended, and the financial highlights for each of the periods included therein. These financial statements and financial highlights are the responsibility of the Fund’s management. Our responsibility is to express an opinion on these financial statements and financial highlights based on our audits.
We conducted our audits in accordance with the standards of the Public Company Accounting Oversight Board (United States). Those standards require that we plan and perform the audit to obtain reasonable assurance about whether the financial statements and financial highlights are free of material misstatement. We were not engaged to perform an audit of the Fund’s internal control over financial reporting. Our audits included consideration of internal control over financial reporting as a basis for designing audit procedures that are appropriate in the circumstances, but not for the purpose of expressing an opinion on the effectiveness of the Fund’s internal control over financial reporting. Accordingly, we express no such opinion. An audit also includes examining, on a test basis, evidence supporting the amounts and disclosures in the financial statements and financial highlights, assessing the accounting principles used and significant estimates made by management, and evaluating the overall financial statement presentation. Our procedures included confirmation of securities owned as of October 31, 2016, by correspondence with the custodian and others, or by other appropriate auditing procedures where replies from others were not received. We believe that our audits provide a reasonable basis for our opinion.
In our opinion, the financial statements and financial highlights referred to above present fairly, in all material respects, the financial position of AB Bond Inflation Strategy Portfolio, one of the portfolios constituting the AB Bond Fund, Inc., at October 31, 2016, the results of its operations and its cash flows for the year then ended, the changes in its net assets for each of the two years in the period then ended, and the financial highlights for each of the periods included therein, in conformity with U.S. generally accepted accounting principles.

New York, New York
December 30, 2016
| AB BOND INFLATION STRATEGY • | 93 |
Report of Independent Registered Public Accounting Firm
2016 FEDERAL TAX INFORMATION
(unaudited)
For Federal income tax purposes, the following information is furnished with respect to the distributions paid by the Strategy during the taxable year ended October 31, 2016. For foreign shareholders, 85.14% of ordinary income dividends paid may be considered to be qualifying to be taxed as interest-related dividends.
For the taxable year ended October 31, 2016, the Strategy designates $2,561 as the maximum amount that may be considered qualified dividend income for individual shareholders.
Shareholders should not use the above information to prepare their income tax returns. The information necessary to complete your income tax returns will be included with your Form 1099-DIV which will be sent to you separately in January 2017.
| 94 | • AB BOND INFLATION STRATEGY |
BOARD OF DIRECTORS
Marshall C. Turner, Jr.(1), Chairman John H. Dobkin(1) Michael J. Downey(1) William H. Foulk, Jr.(1) D. James Guzy(1) | Nancy P. Jacklin(1) Robert M. Keith, President and Chief Executive Officer Carol C. McMullen(1) Garry L. Moody(1) Earl D. Weiner(1) |
OFFICERS
Philip L. Kirstein, Senior Vice President and Independent Compliance Officer Michael S. Canter(2), Vice President Paul J. DeNoon(2), Vice President Shawn E. Keegan(2) , Vice President | Greg J. Wilensky(2), Vice President Emilie D. Wrapp, Secretary Joseph J. Mantineo, Treasurer and Chief Financial Officer Phyllis J. Clarke, Controller Vincent S. Noto, Chief Compliance Officer |
Custodian and Accounting Agent State Street Bank and Trust Company State Street Corporation CCB/5 1 Iron Street Boston, MA 02210
Principal Underwriter AllianceBernstein Investments, Inc. 1345 Avenue of the Americas New York, NY 10105
Transfer Agent AllianceBernstein Investor Services, Inc. P.O. Box 786003 San Antonio, TX 78278-6003 Toll-Free (800) 221-5672 | Independent Registered Public Ernst & Young LLP 5 Times Square New York, NY 10036
Legal Counsel Seward & Kissel LLP One Battery Park Plaza New York, NY 10004 |
| (1) | Member of the Audit Committee, the Governance and Nominating Committee, and the Independent Directors Committee. |
| (2) | The day-to-day management of, and investment decisions for, the Strategy’s portfolio are made by the Adviser’s U.S. Core Fixed-Income Team. Mr. Michael S. Canter, Mr. Paul J. DeNoon, Mr. Shawn E. Keegan and Mr. Greg J. Wilensky are the investment professionals with the most significant responsibility for the day-to-day management of the Strategy’s portfolio. |
| AB BOND INFLATION STRATEGY • | 95 |
Board of Directors
MANAGEMENT OF THE FUND
Board of Directors Information
The business and affairs of the Strategy are managed under the direction of the Board of Directors. Certain information concerning the Strategy’s Directors is set forth below.
| NAME, ADDRESS*, AGE, (YEAR FIRST ELECTED**) | PRINCIPAL AND OTHER INFORMATION*** | PORTFOLIOS DIRECTOR | OTHER DIRECTOR | |||||
| INTERESTED DIRECTOR | ||||||||
Robert M. Keith, # 1345 Avenue of the Americas New York, NY 10105 56 (2010) | Senior Vice President of AllianceBernstein L.P. (the “Adviser”) and the head of AllianceBernstein Investments, Inc. (“ABI”) since July 2008; Director of ABI and President of the AB Mutual Funds. Previously, he served as Executive Managing Director of ABI from December 2006 to June 2008. Prior to joining ABI in 2006, Executive Managing Director of Bernstein Global Wealth Management, and prior thereto, Senior Managing Director and Global Head of Client Service and Sales of the Adviser’s institutional investment management business since 2004. Prior thereto, he was Managing Director and Head of North American Client Service and Sales in the Adviser’s institutional investment management business, with which he had been associated since prior to 2004. | 108 | None | |||||
| 96 | • AB BOND INFLATION STRATEGY |
Management of the Fund
| NAME, ADDRESS*, AGE, (YEAR FIRST ELECTED**) | PRINCIPAL AND OTHER INFORMATION*** | PORTFOLIOS DIRECTOR | OTHER DIRECTOR | |||||
| DISINTERESTED DIRECTORS | ||||||||
Marshall C. Turner, Jr., ## Chairman of the Board 75 (2005) | Private Investor since prior to 2011. Former Chairman and CEO of Dupont Photomasks, Inc. (components of semi-conductor manufacturing). He has extensive operating leadership, and venture capital investing experience, including five interim or full-time CEO roles, and prior service as general partner of institutional venture capital partnerships. He also has extensive non-profit board leadership experience, and currently serves on the boards of two education and science-related non-profit organizations. He has served as a director of one AB Fund since 1992, and director or trustee of multiple AB Funds since 2005. He has been Chairman of the AB Funds since January 2014, and the Chairman of the Independent Directors Committees of such AB Funds since February 2014. | 108 | Xilinx, Inc. (programmable logic semi-conductors) since 2007 | |||||
John H. Dobkin, ## 74 (1998) | Independent Consultant since prior to 2011. Formerly, President of Save Venice, Inc. (preservation organization) from 2001-2002; Senior Advisor from June 1999-June 2000 and President of Historic Hudson Valley (historic preservation) from December 1989-May 1999. Previously, Director of the National Academy of Design. He has served as a director or trustee of various AB Funds since 1992 and as Chairman of the Audit Committees of a number of such AB Funds from 2001-2008. | 108 | None | |||||
| AB BOND INFLATION STRATEGY • | 97 |
Management of the Fund
| NAME, ADDRESS*, AGE, (YEAR FIRST ELECTED**) | PRINCIPAL AND OTHER INFORMATION*** | PORTFOLIOS DIRECTOR | OTHER DIRECTOR | |||||
| DISINTERESTED DIRECTORS (continued) | ||||||||
Michael J. Downey, ## 72 (2005) | Private Investor since prior to 2011. Formerly, managing partner of Lexington Capital, LLC (investment advisory firm) from December 1997 until December 2003. He served as a Director of Prospect Acquisition Corp. (financial services) from 2007 until 2009. From 1987 until 1993, Chairman and CEO of Prudential Mutual Fund Management, director of the Prudential mutual funds, and member of the Executive Committee of Prudential Securities Inc. He has served as a director or trustee of the AB Funds since 2005 and is a director and Chairman of one other registered investment company. | 108 | Asia Pacific Fund, Inc. (registered investment company) since prior to 2011 | |||||
William H. Foulk, Jr., ## 84 (1998) | Investment Adviser and an Independent Consultant since prior to 2011. Previously, he was Senior Manager of Barrett Associates, Inc., a registered investment adviser. He was formerly Deputy Comptroller and Chief Investment Officer of the State of New York and, prior thereto, Chief Investment Officer of the New York Bank for Savings. He has served as a director or trustee of various AB Funds since 1983, and was Chairman of the Independent Directors Committees of the AB Funds from 2003 until early February 2014. He served as Chairman of such AB Funds from 2003 through December 2013. He is also active in a number of mutual fund related organizations and committees. | 108 | None | |||||
| 98 | • AB BOND INFLATION STRATEGY |
Management of the Fund
| NAME, ADDRESS*, AGE, (YEAR FIRST ELECTED**) | PRINCIPAL AND OTHER INFORMATION*** | PORTFOLIOS DIRECTOR | OTHER DIRECTOR | |||||
| DISINTERESTED DIRECTORS (continued) | ||||||||
D. James Guzy, ## 80 (2005) | Chairman of the Board of SRC Computers, Inc. (semi-conductors), with which he has been associated since prior to 2011. He served as Chairman of the Board of PLX Technology (semi-conductors) since prior to 2011 until November 2013. He was a Director of Intel Corporation (semi-conductors) from 1969 until 2008, and served as Chairman of the Finance Committee of such company for several years until May 2008. He has served as a director or trustee of one or more of the AB Funds since 1982. | 108 | None | |||||
Nancy P. Jacklin, ## 68 (2006) | Private Investor since prior to 2011. Professorial Lecturer at the Johns Hopkins School of Advanced International Studies (2008-2015); U.S. Executive Director of the International Monetary Fund (which is responsible for ensuring the stability of the international monetary system), (December 2002-May 2006); Partner, Clifford Chance (1992-2002); Sector Counsel, International Banking and Finance, and Associate General Counsel, Citicorp (1985-1992); Assistant General Counsel (International), Federal Reserve Board of Governors (1982-1985); and Attorney Advisor, U.S. Department of the Treasury (1973-1982). Member of the Bar of the District of Columbia and of New York; and member of the Council on Foreign Relations. She has served as a director or trustee of the AB Funds since 2006 and has been Chairman of the Governance and Nominating Committees of the AB Funds since August 2014. | 108 | None | |||||
| AB BOND INFLATION STRATEGY • | 99 |
Management of the Fund
| NAME, ADDRESS*, AGE, (YEAR FIRST ELECTED**) | PRINCIPAL AND OTHER INFORMATION*** | PORTFOLIOS DIRECTOR | OTHER DIRECTOR | |||||
| DISINTERESTED DIRECTORS (continued) | ||||||||
Carol C. McMullen, ## 61 (2016) | Managing Director of Slalom Consulting (consulting) since 2014 and private investor; Director of Norfolk & Dedham Group (mutual property and casualty insurance) since 2011; and Director of Partners Community Physicians Organization (healthcare) since 2014. Formerly, Managing Director of The Crossland Group (consulting) from 2012 to 2013. She has held a number of senior positions in the asset and wealth management industries, including at Eastern Bank (where her roles included President of Eastern Wealth Management), Thomson Financial (Global Head of Sales for Investment Management), and Putnam Investments (where her roles included Head of Global Investment Research). She has served on a number of private company and nonprofit boards, and as a director or trustee of the AB Funds since June 2016. | 108 | None | |||||
| 100 | • AB BOND INFLATION STRATEGY |
Management of the Fund
| NAME, ADDRESS*, AGE, (YEAR FIRST ELECTED**) | PRINCIPAL AND OTHER INFORMATION*** | PORTFOLIOS DIRECTOR | OTHER DIRECTOR | |||||
| DISINTERESTED DIRECTORS (continued) | ||||||||
Garry L. Moody, ## 64 (2008) | Independent Consultant. Formerly, Partner, Deloitte & Touche LLP (1995-2008) where he held a number of senior positions, including Vice Chairman, and U.S. and Global Investment Management Practice Managing Partner; President, Fidelity Accounting and Custody Services Company (1993-1995), where he was responsible for accounting, pricing, custody and reporting for the Fidelity mutual funds; and Partner, Ernst & Young LLP (1975-1993), where he served as the National Director of Mutual Fund Tax Services and Managing Partner of its Chicago Office Tax department. He is a member of the Trustee Advisory Board of BoardIQ, a biweekly publication focused on issues and news affecting directors of mutual funds. He has served as a director or trustee, and as Chairman of the Audit Committees of the AB Funds since 2008. | 108 | None | |||||
Earl D. Weiner, ## 77 (2007) | Of Counsel, and Partner prior to January 2007, of the law firm Sullivan & Cromwell LLP, and is a former member of the ABA Federal Regulation of Securities Committee Task Force to draft editions of the Fund Director’s Guidebook. He also serves as a director or trustee of various non-profit organizations and has served as Chairman or Vice Chairman of a number of them. He has served as a director or trustee of the AB Funds since 2007 and served as Chairman of the Governance and Nominating Committees of the AB Funds from 2007 until August 2014. | 108 | None | |||||
| AB BOND INFLATION STRATEGY • | 101 |
Management of the Fund
| * | The address for each of the Strategy’s disinterested Directors is c/o AllianceBernstein L.P., Attention: Philip L. Kirstein, 1345 Avenue of the Americas, New York, NY 10105. |
| ** | There is no stated term of office for the Strategy’s Directors. |
| *** | The information above includes each Director’s principal occupation during the last five years and other information relating to the experience, attributes and skills relevant to each Director’s qualifications to serve as a Director, which led to the conclusion that each Director should serve as a Director for the Strategy. |
| # | Mr. Keith is an “interested person” of the Strategy as defined in the “40 Act”, due to his position as a Senior Vice President of the Adviser. |
| ## | Member of the Audit Committee, the Governance and Nominating Committee and the Independent Directors Committee. |
| 102 | • AB BOND INFLATION STRATEGY |
Management of the Fund
Officer Information
Certain information concerning the Strategy’s Officers is listed below.
| NAME, ADDRESS* AND AGE | PRINCIPAL HELD WITH FUND | PRINCIPAL OCCUPATION DURING PAST 5 YEARS | ||
| Robert M. Keith 56 | President and Chief Executive Officer | See biography above. | ||
| Philip L. Kirstein 71 | Senior Vice President and Independent Compliance Officer | Senior Vice President and Independent Compliance Officer of the AB Funds, with which he has been associated since October 2004. Prior thereto, he was Of Counsel to Kirkpatrick & Lockhart, LLP from October 2003 to October 2004, and General Counsel of Merrill Lynch Investment Managers, L.P. since prior to March 2003. | ||
Michael S Canter 47 | Vice President | Senior Vice President of the Adviser,** with which he has been associated since prior to 2011. | ||
Paul J. DeNoon 54 | Vice President | Senior Vice President of the Adviser,** with which he has been associated since prior to 2011. | ||
Shawn E. Keegan 45 | Vice President | Senior Vice President of the Adviser,** with which he has been associated since prior to 2011. | ||
Douglas J. Peebles 51 | Vice President | Senior Vice President of the Adviser,** with which he has been associated since prior to 2011. | ||
Greg J. Wilensky 49 | Vice President | Senior Vice President of the Adviser,** with which he has been associated since prior to 2011. | ||
| Emilie D. Wrapp 61 | Secretary | Senior Vice President, Assistant General Counsel and Assistant Secretary of ABI,** with which she has been associated since prior to 2011. | ||
| Joseph J. Mantineo 57 | Treasurer and Chief Financial Officer | Senior Vice President of AllianceBernstein Investor Services, Inc. (“ABIS”),** with which he has been associated since prior to 2011. | ||
| Phyllis J. Clarke 55 | Controller | Vice President of ABIS,** with which she has been associated since prior to 2011. | ||
| Vincent S. Noto 52 | Chief Compliance Officer | Senior Vice President since 2015 and Mutual Fund Chief Compliance Officer of the Adviser** since 2014. Prior thereto, he was Vice President and Director of Mutual Fund Compliance of the Adviser** since prior to 2011. |
| * | The address for each of the Fund’s Officers is 1345 Avenue of the Americas, New York, NY 10105. |
| ** | The Adviser, ABI and ABIS are affiliates of the Strategy. |
| The Fund’s Statement of Additional Information (“SAI”) has additional information about the Strategy’s Directors and Officers and is available without charge upon request. Contact your financial representative or AB at 1-800-227-4618, or visit www.abfunds.com, for a free prospectus or SAI. |
| AB BOND INFLATION STRATEGY • | 103 |
Management of the Fund
Information Regarding the Review and Approval of the Portfolio’s Investment Advisory Contract
The disinterested directors (the “directors”) of AB Bond Fund, Inc. (the “Fund”) unanimously approved the continuance of the Fund’s Investment Advisory Contract (the “Advisory Agreement”) with the Adviser in respect of AB Bond Inflation Strategy (the “Portfolio”) at a meeting held on November 3-5, 2015.
Prior to approval of the continuance of the Advisory Agreement in respect of the Portfolio, the directors had requested from the Adviser, and received and evaluated, extensive materials. They reviewed the proposed continuance of the Advisory Agreement with the Adviser and with experienced counsel who are independent of the Adviser, who advised on the relevant legal standards. The directors also reviewed an independent evaluation prepared by the Fund’s Senior Officer (who is also the Fund’s Independent Compliance Officer) of the reasonableness of the advisory fee, in which the Senior Officer concluded that the contractual fee for the Portfolio was reasonable. The directors also discussed the proposed continuance in private sessions with counsel and the Fund’s Senior Officer.
The directors considered their knowledge of the nature and quality of the services provided by the Adviser to the Portfolio gained from their experience as directors or trustees of most of the registered investment companies advised by the Adviser, their overall confidence in the Adviser’s integrity and competence they have gained from that experience, the Adviser’s initiative in identifying and raising potential issues with the directors and its responsiveness, frankness and attention to concerns raised by the directors in the past, including the Adviser’s willingness to consider and implement organizational and operational changes designed to improve investment results and the services provided to the AB Funds. The directors noted that they have four regular meetings each year, at each of which they receive presentations from the Adviser on the investment results of the Portfolio and review extensive materials and information presented by the Adviser.
The directors also considered all other factors they believed relevant, including the specific matters discussed below. In their deliberations, the directors did not identify any particular information that was all-important or controlling, and different directors may have attributed different weights to the various factors. The directors determined that the selection of the Adviser to manage the Portfolio and the overall arrangements between the Portfolio and the Adviser, as provided in the Advisory Agreement, including the advisory fee, were fair and reasonable in light of the services performed, expenses incurred and such other matters as the directors considered relevant in the exercise of their business judgment. The material factors and conclusions that formed the basis for the directors’ determinations included the following:
| 104 | • AB BOND INFLATION STRATEGY |
Nature, Extent and Quality of Services Provided
The directors considered the scope and quality of services provided by the Adviser under the Advisory Agreement, including the quality of the investment research capabilities of the Adviser and the other resources it has dedicated to performing services for the Portfolio. They noted the professional experience and qualifications of the Portfolio’s portfolio management team and other senior personnel of the Adviser. The directors also considered that the Advisory Agreement provides that the Portfolio will reimburse the Adviser for the cost to it of providing certain clerical, accounting, administrative and other services to the Portfolio by employees of the Adviser or its affiliates. Requests for these reimbursements are made on a quarterly basis and subject to approval by the directors. Reimbursements, to the extent requested and paid, result in a higher rate of total compensation from the Portfolio to the Adviser than the fee rate stated in the Portfolio’s Advisory Agreement. The directors noted that the methodology used to determine the reimbursement amounts had been reviewed by an independent consultant retained by the Fund’s Senior Officer. The quality of administrative and other services, including the Adviser’s role in coordinating the activities of the Portfolio’s other service providers, also was considered. The directors concluded that, overall, they were satisfied with the nature, extent and quality of services provided to the Portfolio under the Advisory Agreement.
Costs of Services Provided and Profitability
The directors reviewed a schedule of the revenues, expenses and related notes indicating the profitability of the Portfolio to the Adviser for calendar years 2013 and 2014 that had been prepared with an expense allocation methodology arrived at in consultation with an independent consultant retained by the Fund’s Senior Officer. The directors noted the assumptions and methods of allocation used by the Adviser in preparing fund-specific profitability data and understood that there are a number of potentially acceptable allocation methodologies for information of this type. The directors noted that the profitability information reflected all revenues and expenses of the Adviser’s relationship with the Portfolio, including those relating to its subsidiaries that provide transfer agency and distribution services to the Portfolio. The directors recognized that it is difficult to make comparisons of the profitability of the Advisory Agreement with the profitability of advisory contracts for unaffiliated funds because comparative information is not generally publicly available and is affected by numerous factors. The directors focused on the profitability of the Adviser’s relationship with the Portfolio before taxes and distribution expenses. The directors noted that the Adviser’s relationship with the Portfolio was not profitable to it in 2013. The directors were satisfied that the Adviser’s level of profitability from its relationship with the Portfolio in 2014 was not unreasonable.
| AB BOND INFLATION STRATEGY • | 105 |
Fall-Out Benefits
The directors considered the other benefits to the Adviser and its affiliates from their relationships with the Portfolio, including, but not limited to, benefits relating to 12b-1 fees and sales charges received by the Fund’s principal underwriter (which is a wholly owned subsidiary of the Adviser) in respect of certain classes of the Portfolio’s shares and transfer agency fees paid by the Portfolio to a wholly owned subsidiary of the Adviser. The directors recognized that the Adviser’s profitability would be somewhat lower without these benefits. The directors understood that the Adviser also might derive reputational and other benefits from its association with the Portfolio.
Investment Results
In addition to the information reviewed by the directors in connection with the meeting, the directors receive detailed performance information for the Portfolio at each regular Board meeting during the year. At the November 2015 meeting, the directors reviewed information prepared by Broadridge showing the performance of the Class A Shares of the Portfolio as compared with that of a group of similar funds selected by Broadridge (the “Performance Group”) and as compared with that of a broad array of funds selected by Broadridge (the “Performance Universe”), and information prepared by the Adviser showing performance of the Class A Shares as compared with the Barclays 1-10 Year Treasury Inflation Protected Securities (TIPS) Index (the “Index”), in each case for the 1-, 3- and 5-year periods ended July 31, 2015 and (in the case of comparisons with the Index) the period since inception (January 2010 inception). The directors noted that the Portfolio was in the 3rd quintile of the Performance Group and 4th quintile of the Performance Universe for the 1-year period, in the 1st quintile of the Performance Group and the Performance Universe for the 3-year period, and in the 4th quintile of the Performance Group and the Performance Universe for the 5-year period. The Portfolio lagged the Index in the 1- and 5-year periods and outperformed it in the 3-year period and the period since inception. Based on their review, the directors concluded that the Portfolio’s performance was acceptable.
Advisory Fees and Other Expenses
The directors considered the advisory fee rate paid by the Portfolio to the Adviser and information prepared by Broadridge concerning advisory fee rates paid by other funds in the same Broadridge category as the Portfolio at a common asset level. The directors recognized that it is difficult to make comparisons of advisory fees because there are variations in the services that are included in the fees paid by other funds. The directors noted that, at the Portfolio’s current size, its contractual effective advisory fee rate of 50 basis points was higher than the Expense Group median and that the administrative expense reimbursement was 1.2 basis points in the Portfolio’s latest fiscal year.
| 106 | • AB BOND INFLATION STRATEGY |
The directors also considered the Adviser’s fee schedule for non-fund clients pursuing a similar investment style. For this purpose, they reviewed the relevant advisory fee information from the Adviser’s Form ADV and the evaluation from the Fund’s Senior Officer. The directors noted that the institutional fee schedule and the Portfolio’s fee schedule started at the same rate and that the institutional fee schedule had breakpoints at lower asset levels. The application of the institutional fee schedule to the Portfolio’s net assets would result in a fee rate lower than the rate at the same asset level provided in the Portfolio’s Advisory Agreement. The directors noted that the Adviser may, in some cases, agree to fee rates with large institutional clients that are lower than those reviewed by the directors and that they had previously discussed with the Adviser its policies in respect of such arrangements. The directors also reviewed information that indicated that the Portfolio’s fee rate is higher than the sub-advisory fee rate earned by the Adviser for sub-advising a registered investment company with a similar investment style.
The Adviser reviewed with the directors the significantly greater scope of the services it provides to the Portfolio relative to institutional clients and sub-advised funds. The Adviser also noted that because mutual funds are constantly issuing and redeeming shares, they are more difficult to manage than an institutional account, where the assets tend to be relatively stable. In light of the substantial differences in services rendered by the Adviser to institutional clients as compared to funds such as the Portfolio, the directors considered these fee comparisons inapt and did not place significant weight on them in their deliberations.
The directors also considered the total expense ratio of the Class A shares of the Portfolio in comparison to the fees and expenses of funds within two comparison groups created by Broadridge: an Expense Group and an Expense Universe. Broadridge described an Expense Group as a representative sample of funds similar to the Portfolio and an Expense Universe as a broader group than the Expense Group, consisting of all funds in the investment classification/objective with a similar load type as the Portfolio. The Class A expense ratio of the Portfolio was based on the Portfolio’s latest fiscal year and the information included the pro forma expense ratio to reflect a reduction in the 12b-1 fee effective February 1, 2016. The pro forma expense ratio of the Portfolio reflected fee waivers and/or expense reimbursements as a result of an undertaking by the Adviser. The directors noted that it was likely that the expense ratios of some of the other funds in the Portfolio’s Broadridge category also were lowered by waivers or reimbursements by those funds’ investment advisers, which in some cases might be voluntary or temporary. The directors view the expense ratio information as relevant to their evaluation of the Adviser’s services because the Adviser is responsible for coordinating services provided to the Portfolio by others.
| AB BOND INFLATION STRATEGY • | 107 |
The directors noted that the Portfolio’s pro forma total expense ratio, giving effect to a cap by the Adviser, was lower than the Expense Group and the Expense Universe medians. The directors concluded that the Portfolio’s pro forma expense ratio was satisfactory.
Economies of Scale
The directors noted that the advisory fee schedule for the Portfolio contains breakpoints that reduce the fee rates on assets above specified levels. The directors took into consideration prior presentations by an independent consultant on economies of scale in the mutual fund industry and for the AB Funds, and by the Adviser concerning certain of its views on economies of scale. The directors also had requested and received from the Adviser certain updates on economies of scale at the May 2015 meetings. The directors believe that economies of scale may be realized (if at all) by the Adviser across a variety of products and services, and not only in respect of a single fund. The directors noted that there is no established methodology for setting breakpoints that give effect to fund-specific services provided by a fund’s adviser and to the economies of scale that an adviser may realize in its overall mutual fund business or those components of it which directly or indirectly affect a fund’s operations. The directors observed that in the mutual fund industry as a whole, as well as among funds similar to the Portfolio, there is no uniformity or pattern in the fees and asset levels at which breakpoints (if any) apply. The directors also noted that the advisory agreements for many funds do not have breakpoints at all. Having taken these factors into account, the directors concluded that the Portfolio’s shareholders would benefit from a sharing of economies of scale in the event the Portfolio’s net assets exceed a breakpoint in the future.
| 108 | • AB BOND INFLATION STRATEGY |
THIS PAGE IS NOT PART OF THE SHAREHOLDER REPORT OR THE FINANCIAL STATEMENTS
AB FAMILY OF FUNDS
US EQUITY
US Core
Core Opportunities Fund
Select US Equity Portfolio
US Growth
Concentrated Growth Fund
Discovery Growth Fund
Growth Fund
Large Cap Growth Fund
Small Cap Growth Portfolio
US Value
Discovery Value Fund
Equity Income Fund
Growth & Income Fund
Small Cap Value Portfolio
Value Fund
INTERNATIONAL/ GLOBAL EQUITY
International/Global Core
Global Core Equity Portfolio
Global Equity & Covered Call Strategy Fund
International Portfolio
International Strategic Core Portfolio
Sustainable Global Thematic Fund*
Tax-Managed International Portfolio
International/Global Growth
International Growth Fund
International/Global Value
Asia ex-Japan Equity Portfolio
International Value Fund
FIXED INCOME
Municipal
High Income Municipal Portfolio
Intermediate California Municipal Portfolio
Intermediate Diversified Municipal Portfolio
Intermediate New York Municipal Portfolio
FIXED INCOME (continued)
Municipal Bond Inflation Strategy
Tax-Aware Fixed Income Portfolio
National Portfolio
Arizona Portfolio
California Portfolio
Massachusetts Portfolio
Michigan Portfolio
Minnesota Portfolio
New Jersey Portfolio
New York Portfolio
Ohio Portfolio
Pennsylvania Portfolio
Virginia Portfolio
Taxable
Bond Inflation Strategy
Global Bond Fund
High Income Fund
High Yield Portfolio
Income Fund
Intermediate Bond Portfolio
Limited Duration High Income Portfolio
Short Duration Portfolio
ALTERNATIVES
All Market Real Return Portfolio
Credit Long/Short Portfolio
Global Real Estate Investment Fund
Long/Short Multi-Manager Fund
Multi-Manager Alternative Strategies Fund
Select US Long/Short Portfolio
Unconstrained Bond Fund
MULTI-ASSET
All Market Income Portfolio
Emerging Markets Multi-Asset Portfolio
Global Risk Allocation Fund
MULTI-ASSET (continued)
Target-Date
Multi-Manager Select Retirement Allocation Fund
Multi-Manager Select 2010 Fund
Multi-Manager Select 2015 Fund
Multi-Manager Select 2020 Fund
Multi-Manager Select 2025 Fund
Multi-Manager Select 2030 Fund
Multi-Manager Select 2035 Fund
Multi-Manager Select 2040 Fund
Multi-Manager Select 2045 Fund
Multi-Manager Select 2050 Fund
Multi-Manager Select 2055 Fund
Wealth Strategies
Balanced Wealth Strategy
Conservative Wealth Strategy
Wealth Appreciation Strategy
Tax-Managed Balanced Wealth Strategy
Tax-Managed Wealth Appreciation Strategy
CLOSED-END FUNDS
AB Multi-Manager Alternative Fund
Alliance California Municipal Income Fund
AllianceBernstein Global High Income Fund
AllianceBernstein National Municipal Income Fund
We also offer Government Exchange Reserves, which serves as the money market fund exchange vehicle for the AB mutual funds. An investment in Government Exchange Reserves is not a deposit in a bank and is not insured or guaranteed by the Federal Deposit Insurance Corporation or any other government agency. Although the Fund seeks to preserve the value of your investment at $1.00 per share, it is possible to lose money by investing in the Fund.
Investors should consider the investment objectives, risks, charges and expenses of the Fund carefully before investing. For copies of our prospectus or summary prospectus, which contain this and other information, visit us online at www.abfunds.com or contact your AB representative. Please read the prospectus and/or summary prospectus carefully before investing.
* Prior to November 1, 2016, the Fund was named Global Thematic Growth Fund.
| AB BOND INFLATION STRATEGY • | 109 |
AB Family of Funds
NOTES
| 110 | • AB BOND INFLATION STRATEGY |
NOTES
| AB BOND INFLATION STRATEGY • | 111 |
NOTES
| 112 | • AB BOND INFLATION STRATEGY |
NOTES
| AB BOND INFLATION STRATEGY • | 113 |
NOTES
| 114 | • AB BOND INFLATION STRATEGY |
NOTES
| AB BOND INFLATION STRATEGY • | 115 |
NOTES
| 116 | • AB BOND INFLATION STRATEGY |
AB BOND INFLATION STRATEGY
1345 Avenue of the Americas
New York, NY 10105
800.221.5672
BIS-0151-1016 
OCT 10.31.16

ANNUAL REPORT
AB CREDIT LONG/SHORT PORTFOLIO
Investment Products Offered
•Are Not FDIC Insured •May Lose Value •Are Not Bank Guaranteed |
Investors should consider the investment objectives, risks, charges and expenses of the Fund carefully before investing. For copies of our prospectus or summary prospectus, which contain this and other information, visit us online at www.abfunds.com or contact your AB representative. Please read the prospectus and/or summary prospectus carefully before investing.
This shareholder report must be preceded or accompanied by the Fund’s prospectus for individuals who are not current shareholders of the Fund.
You may obtain a description of the Fund’s proxy voting policies and procedures, and information regarding how the Fund voted proxies relating to portfolio securities during the most recent 12-month period ended June 30, without charge. Simply visit AB’s website at www.abfunds.com, or go to the Securities and Exchange Commission’s (the “Commission”) website at www.sec.gov, or call AB at (800) 227-4618.
The Fund files its complete schedule of portfolio holdings with the Commission for the first and third quarters of each fiscal year on Form N-Q. The Fund’s Forms N-Q are available on the Commission’s website at www.sec.gov. The Fund’s Forms N-Q may also be reviewed and copied at the Commission’s Public Reference Room in Washington, DC; information on the operation of the Public Reference Room may be obtained by calling (800) SEC-0330. AB publishes full portfolio holdings for the Fund monthly at www.abfunds.com.
AllianceBernstein Investments, Inc. (ABI) is the distributor of the AB family of mutual funds. ABI is a member of FINRA and is an affiliate of AllianceBernstein L.P., the Adviser of the funds.
The [A/B] logo is a registered service mark of AllianceBernstein and AllianceBernstein® is a registered service mark used by permission of the owner, AllianceBernstein L.P.
December 15, 2016
Annual Report
This report provides management’s discussion of fund performance for AB Credit Long/Short Portfolio (the “Fund”) for the annual reporting period ended October 31, 2016.
Investment Objectives and Policies
The Fund’s investment objective is to seek absolute return over a full market cycle. At least 80% of the Fund’s net assets will under normal circumstances be invested in long and short positions in credit-related instruments. For purposes of this 80% requirement, credit-related instruments will include any type of fixed-income security, such as corporate bonds, convertible fixed-income securities, preferred stocks, US government and agency securities, securities of foreign governments and supranational entities, mortgage-related and asset-backed securities and loan participations. It is expected that a substantial portion of the Fund’s long and short positions will relate to fixed-income securities rated below investment-grade (commonly known as “junk bonds”).
In selecting securities for purchase or sale by the Fund and securities for the Fund to take short positions in, AllianceBernstein L.P. (the “Adviser”) will attempt to take advantage of inefficiencies that it believes exist in the global debt markets. These inefficiencies arise from investor behavior, market complexity and the investment limitations to which investors are
subject. The Adviser will combine quantitative analysis with fundamental credit and economic research in seeking to exploit these inefficiencies.
Under normal market conditions, the net exposure of the Fund (long exposure minus short exposure) will range between 150% and -150%. For example, the Fund may hold long positions in fixed-income securities with a value equal to 95% of its net assets and hold short positions equal to 75% of its net assets, resulting in 20% net long exposure. The Fund may also take long and short positions in equity securities.
Short positions may be effectuated through derivative instruments or through conventional short sales. When the Fund sells securities short, it sells a security that it does not own (but has borrowed) at its current market price in anticipation that the price of the security will decline. To complete, or close out, the short sale transaction, the Fund buys the same security in the market at a later date and returns it to the lender. The Adviser expects that the Fund’s long positions will be effectuated both through derivatives and actual purchases of fixed-income securities. The Fund may invest in fixed-income securities with a range of maturities from short- to long-term, and expects to maintain a weighted average duration of between -3 and 6 years. The Fund would have a negative duration when the Adviser expects the value of the Fund’s assets to increase as interest rates rise.
| AB CREDIT LONG/SHORT PORTFOLIO • | 1 |
While the Fund’s investments will be focused on US dollar-denominated securities, the Fund may invest to a lesser extent in securities denominated in foreign currencies. Fluctuations in currency exchange rates can have a dramatic impact on the returns of fixed-income securities. While the Adviser may hedge the foreign currency exposure resulting from the Fund’s security positions through the use of currency-related derivatives, it is not required to do so. The Fund may take long and short positions in currencies (or related derivatives) independent of any such security positions, including taking a position in a currency when it does not hold any securities denominated in that currency.
The Fund expects to use derivatives, such as options, futures contracts, forwards and swaps, to a significant extent. Derivatives may provide a more efficient and economical exposure to market segments than direct investments, and may also be a more efficient way to alter the Fund’s exposure. The Fund may, for example, use credit default, interest rate and total return swaps to establish exposure to the fixed-income markets or particular fixed-income securities and, as noted above, may use currency derivatives to hedge foreign currency exposure.
The Fund may borrow money and enter into transactions such as reverse repurchase agreements that are similar to borrowings (in addition to the borrowing of securities inherent in short sale transactions) for investment purposes.
As a result of these borrowing transactions and the use of derivatives, the Fund will at times be highly leveraged, with aggregate exposure (long and short) substantially in excess of its net assets.
The Fund is “non-diversified”, which means that it may concentrate its assets in a smaller number of issuers than a diversified fund.
Investment Results
The table on page 7 shows the Fund’s performance compared to its benchmark, the Bank of America Merrill Lynch (“BofA ML”) 3-Month US Treasury Bill Index, for the six- and 12-month periods ended October 31, 2016.
During the 12-month period, all share classes of the Fund outperformed the benchmark, before sales charges. The Fund benefited from capital structure relative value trades, whereby the Fund owns one instrument in an issuer’s capital structure and sells short another instrument in the same issuer’s capital structure. The Fund also benefited from appreciation in single name longs in a variety of issuers. Partially offsetting these gains were outright shorts in cyclical sectors, such as chemicals and automotive. Overall, the Fund benefited from the differentiation in returns across credit instruments.
During the six-month period, all share classes of the Fund underperformed the benchmark, before sales charges. Underperformance was a result of losses from
| 2 | • AB CREDIT LONG/SHORT PORTFOLIO |
the Fund’s cyclical credit short positions, partially offset by capital structure relative value positions, particularly in commodity names, and outright long positions. During the six-month period, there was a broad rally in the credit markets, with little differentiation across non-commodity sectors. The lack of relative movements between credit instruments resulted in few alpha opportunities for the Fund.
During both periods, the Fund utilized derivatives including currency forwards to hedge currency exposure as well as to manage active currency risk. Currency positioning modestly detracted from performance during the six-month period and modestly contributed in the 12-month period; yield curve positioning had no material impact during either period. Purchased and written equity options were also used to hedge market exposure and for investment purposes. Total return swaps were used to hedge and take active risk. Credit default swaps, both single name and index, were used to hedge credit risk as well as to take active credit risk. Treasury futures were used for both hedging and investment purposes. Interest rate swaps were used for hedging purposes, specifically to manage duration.
Market Review and Investment Strategy
During the 12-month period, duration-sensitive securities rallied while global credit markets experienced a sell-off and subsequent rally. Risk markets were concerned about the increasing potential for a
global economic downturn, punctuated by dramatic moves in commodity prices. The partial recovery in commodity prices and the demonstrated ability of issuers to navigate the lower commodity environment led to the subsequent rally. During this turmoil, the Fund was able to take advantage of dislocations in the markets. Post-rally, the Fund has been positioned relatively conservatively, with a broadly neutral risk position and a focus on idiosyncratic relative value opportunities.
In the second half of the period, duration-sensitive securities rallied and then gave back much of its gains, while global credit markets rallied. Global central bank policy was the main story during this period, with investors searching for less crowded sources of income. With stretched valuations and potential uncertainty from the US presidential election, the Fund was positioned with a broadly neutral risk allocation.
On November 8, 2016, Donald Trump was elected as the 45th president of the United States, and the Congressional election outcome resulted in the Republican Party maintaining control of both the House of Representatives and the Senate. The Adviser believes that it will take time before the world has a clearer picture of the short- and long-term impact of the elections on the US economy and markets in general. The Adviser continues to monitor the markets, including for potential market volatility.
| AB CREDIT LONG/SHORT PORTFOLIO • | 3 |
DISCLOSURES AND RISKS
Benchmark Disclosure
The Bank of America Merrill Lynch® 3-Month US Treasury Bill Index is unmanaged and does not reflect fees and expenses associated with the active management of a mutual fund portfolio. The BofA ML 3-Month US Treasury Bill Index measures the performance of Treasury securities maturing in 90 days. An investor cannot invest directly in an index, and its results are not indicative of the performance for any specific investment, including the Fund.
A Word About Risk
Market Risk: The value of the Fund’s assets will fluctuate as the bond or stock market fluctuates. The value of its investments may decline, sometimes rapidly and unpredictably, simply because of economic changes or other events that affect large portions of the market.
Interest Rate Risk: Changes in interest rates will affect the value of investments in fixed-income securities. When interest rates rise, the value of investments in fixed-income securities tends to fall and this decrease in value may not be offset by higher income from new investments. The Fund may be subject to a greater risk of rising interest rates as the recent period of historically low rates is beginning to end and rates have begun rising. Interest rate risk is generally greater for fixed-income securities with longer maturities or durations.
Credit Risk: An issuer or guarantor of a fixed-income security, or the counterparty to a derivatives or other contract, may be unable or unwilling to make timely payments of interest or principal, or to otherwise honor its obligations. The issuer or guarantor may default, causing a loss of the full principal amount of a security and accrued interest. The degree of risk for a particular security may be reflected in its credit rating. There is the possibility that the credit rating of a fixed-income security may be downgraded after purchase, which may adversely affect the value of the security.
Below Investment Grade Securities Risk: Investments in fixed-income securities with lower ratings (commonly known as “junk bonds”) are subject to a higher probability that an issuer will default or fail to meet its payment obligations. These securities may be subject to greater price volatility due to such factors as specific corporate developments, negative perceptions of the junk bond market generally and less secondary market liquidity.
Duration Risk: Duration is a measure that relates the expected price volatility of a fixed-income security to changes in interest rates. The duration of a fixed-income security may be shorter than or equal to full maturity of a fixed-income security. Fixed-income securities with longer durations have more risk and will decrease in price as interest rates rise. For example, a fixed-income security with a duration of three years will decrease in value by approximately 3% if interest rates increase by 1%.
(Disclosures, Risks and Note about Historical Performance continued on next page)
| 4 | • AB CREDIT LONG/SHORT PORTFOLIO |
Disclosures and Risks
DISCLOSURES AND RISKS
(continued from previous page)
Inflation Risk: This is the risk that the value of assets or income from investments will be less in the future as inflation decreases the value of money. As inflation increases, the value of the Fund’s assets can decline as can the value of the Fund’s distributions. This risk is significantly greater if the Fund invests a significant portion of its assets in fixed-income securities with longer maturities.
Derivatives Risk: Derivatives may be illiquid, difficult to price, and leveraged so that small changes may produce disproportionate losses for the Fund, and may be subject to counterparty risk to a greater degree than more traditional investments.
Leverage Risk: To the extent the Fund uses leveraging techniques, its net asset value (“NAV”) may be more volatile because leverage tends to exaggerate the effect of changes in interest rates and any increase or decrease in the value of the Fund’s investments.
Short Sale Risk: Short sales involve the risk that the Fund will incur a loss by subsequently buying a security at a higher price than the price at which it sold the security. The amount of such loss is theoretically unlimited, as it will be based on the increase in value of the security sold short. In contrast, the risk of loss from a long position is limited to the Fund’s investment in the security, because the price of the security cannot fall below zero. The Fund may not always be able to close out a short position on favorable terms.
Foreign (Non-US) Risk: Investments in securities of non-US issuers may involve more risk than those of US issuers. These securities may fluctuate more widely in price and may be less liquid due to adverse market, economic, political, regulatory or other factors.
Emerging Market Risk: Investments in emerging-market countries may have more risk because the markets are less developed and less liquid, and because these investments may be subject to increased economic, political, regulatory or other uncertainties.
Currency Risk: Fluctuations in currency exchange rates may negatively affect the value of the Fund’s investments or reduce its returns.
Diversification Risk: The Fund may have more risk because it is “non-diversified”, meaning that it can invest more of its assets in a smaller number of issuers. Accordingly, changes in the value of a single security may have a more significant effect, either negative or positive, on the Fund’s NAV.
Liquidity Risk: Liquidity risk occurs when certain investments become difficult to purchase or sell. Difficulty in selling less liquid securities may result in sales at disadvantageous prices affecting the value of your investment in the Fund. Causes of liquidity risk may include low trading
(Disclosures, Risks and Note about Historical Performance continued on next page)
| AB CREDIT LONG/SHORT PORTFOLIO • | 5 |
Disclosures and Risks
DISCLOSURES AND RISKS
(continued from previous page)
volumes, large positions and heavy redemptions of Fund shares. Over recent years liquidity risk has also increased because the capacity of dealers in the secondary market for fixed-income securities to make markets in these securities has decreased, even as the overall bond market has grown significantly, due to, among other things, structural changes, additional regulatory requirements and capital and risk restraints that have led to reduced inventories. Liquidity risk may be higher in a rising interest rate environment, when the value and liquidity of fixed-income securities generally decline.
Management Risk: The Fund is subject to management risk because it is an actively managed investment fund. The Adviser will apply its investment techniques and risk analyses in making investment decisions, but there is no guarantee that its techniques will produce the intended results.
These risks are fully discussed in the Fund’s prospectus. As with all investments, you may lose money by investing in the Fund.
An Important Note About Historical Performance
The investment return and principal value of an investment in the Fund will fluctuate, so that shares, when redeemed, may be worth more or less than their original cost. Performance shown on the following pages represents past performance and does not guarantee future results. Current performance may be lower or higher than the performance information shown. You may obtain performance information current to the most recent month-end by visiting www.abfunds.com.
All fees and expenses related to the operation of the Fund have been deducted. NAV returns do not reflect sales charges; if sales charges were reflected, the Fund’s quoted performance would be lower. SEC returns reflect the applicable sales charges for each share class: a 4.25% maximum front-end sales charge for Class A shares and a 1% 1-year contingent deferred sales charge for Class C shares. Returns for the different share classes will vary due to different expenses associated with each class. Performance assumes reinvestment of distributions and does not account for taxes.
| 6 | • AB CREDIT LONG/SHORT PORTFOLIO |
Disclosures and Risks
HISTORICAL PERFORMANCE
THE FUND VS. ITS BENCHMARK PERIODS ENDED OCTOBER 31, 2016 (unaudited) | NAV Returns | |||||||||||
| 6 Months | 12 Months | |||||||||||
| AB Credit Long/Short Portfolio* | ||||||||||||
Class A | -0.10% | 3.18% | ||||||||||
| ||||||||||||
Class C | -0.40% | 2.49% | ||||||||||
| ||||||||||||
Advisor Class† | 0.10% | 3.48% | ||||||||||
| ||||||||||||
| BofA ML 3-Month US Treasury Bill Index | 0.17% | 0.31% | ||||||||||
| ||||||||||||
* The returns shown are based on net asset values calculated for shareholder transactions and may differ from the returns shown in the Financial Highlights, which reflects adjustments made to the net asset values in accordance with accounting principles generally accepted in the United States of America.
† Please note that Advisor Class shares are for investors purchasing shares through accounts established under certain fee-based programs sponsored and maintained by certain broker-dealers and financial intermediaries, institutional pension plans and/or investment advisory clients of, and certain other persons associated with, the Adviser and its affiliates or the Fund. |
| |||||||||||
GROWTH OF A $10,000 INVESTMENT IN THE FUND
5/7/14* TO 10/31/16 (unaudited)
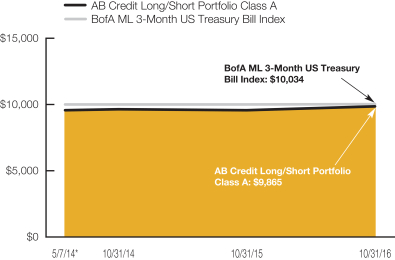
This chart illustrates the total value of an assumed $10,000 investment in AB Credit Long/Short Portfolio Class A shares (from 5/7/14 to 10/31/16) as compared to the performance of the Fund’s benchmark. The chart reflects the deduction of the maximum 4.25% sales charge from the initial $10,000 investment in the Strategy and assumes the reinvestment of dividends and capital gains distributions.
| * | Inception date: 5/7/2014. |
See Disclosures, Risks and Note about Historical Performance on pages 4-6.
(Historical Performance continued on next page)
| AB CREDIT LONG/SHORT PORTFOLIO • | 7 |
Historical Performance
HISTORICAL PERFORMANCE
(continued from previous page)
| AVERAGE ANNUAL RETURNS AS OF OCTOBER 31, 2016 (unaudited) | ||||||||||||
| NAV Returns | SEC Returns (reflects applicable sales charges) | SEC Yields* | ||||||||||
| Class A Shares | -3.54 | % | ||||||||||
1 Year | 3.18 | % | -1.23 | % | ||||||||
Since Inception† | 1.20 | % | -0.54 | % | ||||||||
| Class C Shares | -4.46 | % | ||||||||||
1 Year | 2.49 | % | 1.49 | % | ||||||||
Since Inception† | 0.45 | % | 0.45 | % | ||||||||
| Advisor Class Shares‡ | -3.46 | % | ||||||||||
1 Year | 3.48 | % | 3.48 | % | ||||||||
Since Inception† | 1.45 | % | 1.45 | % | ||||||||
| SEC AVERAGE ANNUAL RETURNS AS OF THE MOST RECENT CALENDAR QUARTER-END SEPTEMBER 30, 2016 (unaudited) | ||||||||
SEC Returns sales charges) | ||||||||
| Class A Shares | ||||||||
1 Year | -1.33 | % | ||||||
Since Inception† | -0.77 | % | ||||||
| Class C Shares | ||||||||
1 Year | 1.29 | % | ||||||
Since Inception† | 0.30 | % | ||||||
| Advisor Class Shares‡ | ||||||||
1 Year | 3.29 | % | ||||||
Since Inception† | 1.29 | % | ||||||
See Disclosures, Risks and Note about Historical Performance on pages 4-6.
(Historical Performance and footnotes continued on next page)
| 8 | • AB CREDIT LONG/SHORT PORTFOLIO |
Historical Performance
HISTORICAL PERFORMANCE
(continued from previous page)
The Fund’s prospectus fee table shows the Fund’s total annual operating expense ratios as 7.28%, 8.08% and 6.91% for Class A, Class C and Advisor Class shares, respectively, gross of any fee waivers or expense reimbursements. Contractual fee waivers and/or expense reimbursements limit the Fund’s annual operating expense ratios exclusive of interest expense, taxes, dividend expense, borrowing costs and brokerage expense on securities sold short to 1.35%, 2.10% and 1.10% for Class A, Class C and Advisor Class shares, respectively. These waivers/reimbursements may not be terminated before January 31, 2017 and may be extended by the Adviser for additional one-year terms. Any fees waived and expenses borne by the Adviser may be reimbursed by the Fund until the end of the third fiscal year after the fiscal period in which the fee was waived or the expense was borne, provided that no reimbursement payment will be made that would cause the Fund’s total annual fund operating expenses to exceed the expense limitations. Absent reimbursements or waivers, performance would have been lower. The Financial Highlights section of this report sets forth expense ratio data for the current reporting period; the expense ratios shown above may differ from the expense ratios in the Financial Highlights sections since they are based on different time periods.
| * | SEC yields are calculated based on SEC guidelines for the 30-day period ended October 31, 2016. |
| † | Inception date: 5/7/2014. |
| ‡ | Advisor Class shares are offered at NAV to eligible investors and their SEC returns are the same as their NAV returns. Please note that Advisor Class shares are for investors purchasing shares through accounts established under certain fee-based programs sponsored and maintained by certain broker-dealers and financial intermediaries, institutional pension plans and/or investment advisory clients of, and certain other persons associated with, the Adviser and its affiliates or the Fund. |
See Disclosures, Risks and Note about Historical Performance on pages 4-6.
| AB CREDIT LONG/SHORT PORTFOLIO • | 9 |
Historical Performance
EXPENSE EXAMPLE
(unaudited)
As a shareholder of a mutual fund, you may incur two types of costs: (1) transaction costs, including sales charges (loads) on purchase payments, contingent deferred sales charges on redemptions and (2) ongoing costs, including management fees; distribution (12b-1) fees; and other fund expenses. This example is intended to help you understand your ongoing costs (in dollars) of investing in the Fund and to compare these costs with the ongoing costs of investing in other mutual funds.
The Example is based on an investment of $1,000 invested at the beginning of the period and held for the entire period as indicated below.
Actual Expenses
The table below provides information about actual account values and actual expenses. You may use the information in this line, together with the amount you invested, to estimate the expenses that you paid over the period. Simply divide your account value by $1,000 (for example, an $8,600 account value divided by $1,000 = 8.6), then multiply the result by the number in the first line under the heading entitled “Expenses Paid During Period” to estimate the expenses you paid on your account during this period.
Hypothetical Example for Comparison Purposes
The table below provides information about hypothetical account values and hypothetical expenses based on the Fund’s actual expense ratio and an assumed annual rate of return of 5% before expenses, which is not the Fund’s actual return. The hypothetical account values and expenses may not be used to estimate the actual ending account balance or expenses you paid for the period. You may use this information to compare the ongoing costs of investing in the Fund and other funds by comparing this 5% hypothetical example with the 5% hypothetical examples that appear in the shareholder reports of other funds.
Please note that the expenses shown in the table are meant to highlight your ongoing costs only and do not reflect any transactional costs, such as sales charges (loads), or contingent deferred sales charges on redemptions. Therefore, the hypothetical example is useful in comparing ongoing costs only, and will not help you determine the relative total costs of owning different funds. In addition, if these transactional costs were included, your costs would have been higher.
| 10 | • AB CREDIT LONG/SHORT PORTFOLIO |
Expense Example
| Beginning Account Value 5/1/16 | Ending Account Value 10/31/16 | Expenses Paid During Period* | Annualized Expense Ratio* | Effective Expenses Paid During Period+ | Effective Annualized Expense Ratio+ | |||||||||||||||||||
| Class A | ||||||||||||||||||||||||
Actual | $ | 1,000 | $ | 999.00 | $ | 35.83 | 7.13 | % | $ | 36.13 | 7.19 | % | ||||||||||||
Hypothetical** | $ | 1,000 | $ | 989.29 | $ | 35.65 | 7.13 | % | $ | 35.95 | 7.19 | % | ||||||||||||
| Class C | ||||||||||||||||||||||||
Actual | $ | 1,000 | $ | 996.00 | $ | 39.54 | 7.88 | % | $ | 39.84 | 7.94 | % | ||||||||||||
Hypothetical** | $ | 1,000 | $ | 985.52 | $ | 39.33 | 7.88 | % | $ | 39.62 | 7.94 | % | ||||||||||||
| Advisor Class | ||||||||||||||||||||||||
Actual | $ | 1,000 | $ | 1,001.00 | $ | 34.55 | 6.87 | % | $ | 34.86 | 6.93 | % | ||||||||||||
Hypothetical** | $ | 1,000 | $ | 990.60 | $ | 34.38 | 6.87 | % | $ | 34.67 | 6.93 | % | ||||||||||||
| * | Expenses are equal to the classes’ annualized expense ratios multiplied by the average account value over the period, multiplied by 184/366 (to reflect the one-half year period). |
| ** | Assumes 5% annual return before expenses. |
| + | The Portfolio’s investments in affiliated/unaffiliated underlying portfolios incur no direct expenses, but bears proportionate shares of the acquired fund fees (i.e., operating, administrative and investment advisory fee) of the affiliated/unaffiliated underlying portfolios. Currently the Adviser has voluntarily agreed to waive its investment advisory fee from the Portfolio in an amount equal to the Portfolio’s share of the advisory fees of the affiliated underlying portfolios, as borne indirectly by the Portfolio as an acquired fund fee and expense. The Portfolio’s effective expenses are equal to the classes’ annualized expense ratio plus the Portfolio’s pro-rata share of the weighted average expense ratio of the affiliated/unaffiliated underlying portfolios in which it invests, multiplied by the average account value over the period, multiplied by 184/366 (to reflect the one-half year period). |
| AB CREDIT LONG/SHORT PORTFOLIO • | 11 |
Expense Example
PORTFOLIO SUMMARY
October 31, 2016 (unaudited)
PORTFOLIO STATISTICS
Net Assets ($mil): $21.2
SECTOR BREAKDOWN*
| Long | Short | |||||||
Asset-Backed Securities | 1.0 | % | — | % | ||||
Bank Loans | 1.0 | — | ||||||
Collateralized Mortgage Obligations | 1.1 | — | ||||||
Common Stocks | 2.8 | — | ||||||
Corporates – Investment Grade | 11.8 | -15.9 | ||||||
Corporates – Non-Investment Grade | 24.3 | -56.4 | ||||||
Emerging Markets – Corporate Bonds | 2.3 | -1.8 | ||||||
Emerging Markets – Sovereigns | 1.1 | -0.9 | ||||||
Emerging Markets – Treasuries | 1.5 | — | ||||||
Governments – Sovereign Agencies | 1.9 | -1.1 | ||||||
Governments – Treasuries | 0.5 | — | ||||||
Investment Companies | 2.5 | — | ||||||
Options Purchased – Puts | 0.1 | — | ||||||
Preferred Stocks | 0.2 | — | ||||||
Quasi-Sovereigns | 1.0 | -0.7 | ||||||
Warrants | 0.2 | — | ||||||
NET COUNTRY EXPOSURE (TOP THREE)*
Long | ||||
France | 3.3 | % | ||
Brazil | 3.0 | |||
Denmark | 0.6 | |||
Short
| ||||
United States | -17.0 | % | ||
Netherlands | -3.6 | |||
United Kingdom | -3.0 | |||
TEN LARGEST HOLDINGS*
| Long | ||||
Company | ||||
BNP Paribas SA | 3.4 | % | ||
Societe Generale SA | 3.3 | |||
Cooperatieve Rabobank UA | 3.3 | |||
Odebrecht Finance Ltd. | 2.3 | |||
Transocean, Inc. | 1.9 | |||
HCA, Inc. | 1.6 | |||
Wells Fargo Income Opportunities Fund | 1.5 | |||
Brazil Notas do Tesouro Nacional | 1.5 | |||
Laureate Education, Inc. | 1.3 | |||
Venezuela Government International Bond | 1.1 | |||
| Short | ||||
Company
| ||||
NXP BV/NXP Funding LLC | -3.9 | % | ||
Cooperatieve Rabobank UA | -3.1 | |||
Lear Corp. | -3.0 | |||
First Data Corp. | -3.0 | |||
Jaguar Land Rover Automotive PLC | -2.9 | |||
Ashland LLC | -2.9 | |||
BNP Paribas SA | -2.9 | |||
Berry Plastics Corp. | -2.8 | |||
Societe Generale SA | -2.6 | |||
HCA, Inc. | -2.5 | |||
| * | Holdings are expressed as a percentage of total net assets and may vary over time. The Portfolio also enters into derivative transactions, which may be used for hedging or investment purposes (see “Portfolio of Investments” section of the report for additional details). |
| 12 | • AB CREDIT LONG/SHORT PORTFOLIO |
Portfolio Summary and Ten Largest Holdings
PORTFOLIO OF INVESTMENTS
October 31, 2016
| Principal Amount (000) | U.S. $ Value | |||||||||||
| ||||||||||||
CORPORATES – NON-INVESTMENT GRADE – 24.3% | ||||||||||||
Industrial – 17.8% | ||||||||||||
Basic – 0.4% | ||||||||||||
Magnetation LLC/Mag Finance Corp. | U.S.$ | 35 | $ | 42 | ||||||||
Peabody Energy Corp. | 178 | 78,765 | ||||||||||
|
| |||||||||||
| 78,807 | ||||||||||||
|
| |||||||||||
Communications - Media – 1.9% | ||||||||||||
CSC Holdings LLC | 60 | 56,100 | ||||||||||
DISH DBS Corp. | 66 | 66,454 | ||||||||||
iHeartCommunications, Inc. | 104 | 80,600 | ||||||||||
9.00%, 12/15/19-9/15/22 | 142 | 103,111 | ||||||||||
Univision Communications, Inc. | 88 | 88,220 | ||||||||||
|
| |||||||||||
| 394,485 | ||||||||||||
|
| |||||||||||
Communications - | ||||||||||||
SFR Group SA | 200 | 202,000 | ||||||||||
|
| |||||||||||
Consumer Cyclical - Automotive – 0.3% | ||||||||||||
Meritor, Inc. | 45 | 58,444 | ||||||||||
|
| |||||||||||
Consumer Cyclical - Other – 1.3% | ||||||||||||
MDC Holdings, Inc. | 5 | 5,262 | ||||||||||
6.00%, 1/15/43 | 125 | 110,625 | ||||||||||
PulteGroup, Inc. | 140 | 139,300 | ||||||||||
7.875%, 6/15/32 | 19 | 21,660 | ||||||||||
|
| |||||||||||
| 276,847 | ||||||||||||
|
| |||||||||||
Consumer Non-Cyclical – 3.5% | ||||||||||||
BI-LO LLC/BI-LO Finance Corp. | 33 | 20,790 | ||||||||||
9.25%, 2/15/19(d) | 88 | 76,340 | ||||||||||
CHS/Community Health Systems, Inc. | 170 | 129,625 | ||||||||||
Concordia International Corp. | 128 | 78,720 | ||||||||||
HCA, Inc. | 326 | 338,225 | ||||||||||
| AB CREDIT LONG/SHORT PORTFOLIO • | 13 |
Portfolio of Investments
| Principal Amount (000) | U.S. $ Value | |||||||||||
| ||||||||||||
Valeant Pharmaceuticals International, Inc. | U.S.$ | 125 | $ | 98,750 | ||||||||
|
| |||||||||||
| 742,450 | ||||||||||||
|
| |||||||||||
Energy – 6.1% | ||||||||||||
Berry Petroleum Co. LLC | 125 | 68,750 | ||||||||||
Cenovus Energy, Inc. | 135 | 118,335 | ||||||||||
CHC Helicopter SA | 172 | 84,661 | ||||||||||
9.375%, 6/01/21(a)(b)(h) | 65 | 19,012 | ||||||||||
Cobalt International Energy, Inc. | 64 | 29,440 | ||||||||||
Denbury Resources, Inc. | 17 | 12,367 | ||||||||||
EP Energy LLC/Everest Acquisition Finance, Inc. | 14 | 9,520 | ||||||||||
9.375%, 5/01/20 | 86 | 67,510 | ||||||||||
Global Partners LP/GLP Finance Corp. | 200 | 191,000 | ||||||||||
Hilcorp Energy I LP/Hilcorp Finance Co. | 24 | 24,060 | ||||||||||
Noble Holding International Ltd. | 200 | 134,750 | ||||||||||
SandRidge Energy, Inc. | 9 | 11,069 | ||||||||||
8.125%, 10/15/22(b)(l) | 150 | 0 | ||||||||||
8.75%, 6/01/20(b)(l) | 40 | 0 | ||||||||||
Tervita Corp. | 6 | 345 | ||||||||||
10.875%, 2/15/18(a)(b)(d) | 190 | 10,925 | ||||||||||
Transocean, Inc. | 150 | 128,250 | ||||||||||
6.80%, 3/15/38 | 600 | 394,500 | ||||||||||
|
| |||||||||||
| 1,304,494 | ||||||||||||
|
| |||||||||||
Other Industrial – 1.3% | ||||||||||||
Laureate Education, Inc. | 297 | 274,725 | ||||||||||
Modular Space Corp. | 17 | 7,310 | ||||||||||
|
| |||||||||||
| 282,035 | ||||||||||||
|
| |||||||||||
Technology – 1.8% | ||||||||||||
Avaya, Inc. | 105 | 85,313 | ||||||||||
10.50%, 3/01/21(d) | 177 | 58,410 | ||||||||||
Diamond 1 Finance Corp./Diamond 2 | 172 | 188,418 | ||||||||||
| 14 | • AB CREDIT LONG/SHORT PORTFOLIO |
Portfolio of Investments
| Principal Amount (000) | U.S. $ Value | |||||||||||
| ||||||||||||
General Cable Corp. | U.S.$ | 85 | $ | 54,772 | ||||||||
|
| |||||||||||
| 386,913 | ||||||||||||
|
| |||||||||||
Transportation - Services – 0.3% | ||||||||||||
XPO CNW, Inc. | 75 | 60,000 | ||||||||||
|
| |||||||||||
| 3,786,475 | ||||||||||||
|
| |||||||||||
Financial Institutions – 6.4% | ||||||||||||
Banking – 4.3% | ||||||||||||
Barclays Bank PLC | 73 | 84,786 | ||||||||||
Royal Bank of Scotland Group PLC | 100 | 97,000 | ||||||||||
Royal Bank of Scotland PLC (The) | 24 | 24,618 | ||||||||||
Societe Generale SA | 700 | 707,000 | ||||||||||
|
| |||||||||||
| 913,404 | ||||||||||||
|
| |||||||||||
Finance – 1.0% | ||||||||||||
Artsonig Pty Ltd. | 180 | 14,416 | ||||||||||
Enova International, Inc. | 96 | 90,000 | ||||||||||
TMX Finance LLC/TitleMax Finance Corp. | 129 | 96,750 | ||||||||||
|
| |||||||||||
| 201,166 | ||||||||||||
|
| |||||||||||
Other Finance – 1.1% | ||||||||||||
International Personal Finance PLC | EUR | 200 | 199,791 | |||||||||
iPayment, Inc. | U.S.$ | 13 | 12,593 | |||||||||
Speedy Group Holdings Corp. | 55 | 27,225 | ||||||||||
|
| |||||||||||
| 239,609 | ||||||||||||
|
| |||||||||||
| 1,354,179 | ||||||||||||
|
| |||||||||||
Utility – 0.1% | ||||||||||||
Electric – 0.1% | ||||||||||||
Calpine Corp. | 22 | 23,073 | ||||||||||
|
| |||||||||||
Total Corporates – Non-Investment Grade | 5,163,727 | |||||||||||
|
| |||||||||||
| AB CREDIT LONG/SHORT PORTFOLIO • | 15 |
Portfolio of Investments
| Principal Amount (000) | U.S. $ Value | |||||||||||
| ||||||||||||
CORPORATES – INVESTMENT GRADE – 11.8% | ||||||||||||
Financial Institutions – 10.1% | ||||||||||||
Banking – 10.1% | ||||||||||||
Bank of America Corp. | U.S.$ | 200 | $ | 210,142 | ||||||||
BNP Paribas SA | 700 | 731,500 | ||||||||||
BPCE SA | 200 | 216,693 | ||||||||||
Citigroup, Inc. | 200 | 208,712 | ||||||||||
Cooperatieve Rabobank UA | EUR | 600 | 703,833 | |||||||||
Danske Bank A/S | GBP | 56 | 69,230 | |||||||||
|
| |||||||||||
| 2,140,110 | ||||||||||||
|
| |||||||||||
Industrial – 1.7% | ||||||||||||
Communications - | ||||||||||||
Sprint Spectrum Co. LLC/Sprint Spectrum Co. II LLC/Sprint Spectrum Co. III LLC | U.S.$ | 200 | 200,500 | |||||||||
|
| |||||||||||
Services – 0.7% | ||||||||||||
Amazon.com, Inc. | 135 | 157,522 | ||||||||||
|
| |||||||||||
Technology – 0.1% | ||||||||||||
Hewlett Packard Enterprise Co. | 17 | 17,583 | ||||||||||
|
| |||||||||||
| 375,605 | ||||||||||||
|
| |||||||||||
Total Corporates – Investment Grade | 2,515,715 | |||||||||||
|
| |||||||||||
| Shares | ||||||||||||
COMMON STOCKS – 2.8% | ||||||||||||
Consumer Discretionary – 1.4% | ||||||||||||
Automobiles – 0.3% | ||||||||||||
General Motors Co. | 1,700 | 53,720 | ||||||||||
|
| |||||||||||
Hotels, Restaurants & Leisure – 0.5% | ||||||||||||
eDreams ODIGEO SA(b) | 10,643 | 32,387 | ||||||||||
Eldorado Resorts, Inc.(b) | 2,665 | 32,247 | ||||||||||
International Game Technology PLC | 1,678 | 48,192 | ||||||||||
|
| |||||||||||
| 112,826 | ||||||||||||
|
| |||||||||||
Household Durables – 0.3% | ||||||||||||
Hovnanian Enterprises, Inc. – Class A(b) | 2,224 | 3,469 | ||||||||||
MDC Holdings, Inc. | 1,466 | 34,759 | ||||||||||
Taylor Morrison Home Corp. – Class A(b) | 1,700 | 29,002 | ||||||||||
|
| |||||||||||
| 67,230 | ||||||||||||
|
| |||||||||||
| 16 | • AB CREDIT LONG/SHORT PORTFOLIO |
Portfolio of Investments
| Company | Shares | U.S. $ Value | ||||||||||
| ||||||||||||
Media – 0.3% | ||||||||||||
Clear Channel Outdoor Holdings, Inc. – Class A | 4,650 | $ | 26,737 | |||||||||
DISH Network Corp. – Class A(b) | 400 | 23,424 | ||||||||||
Townsquare Media, Inc. – Class A(b) | 2,620 | 21,956 | ||||||||||
|
| |||||||||||
| 72,117 | ||||||||||||
|
| |||||||||||
| 305,893 | ||||||||||||
|
| |||||||||||
Telecommunication Services – 0.4% | ||||||||||||
Diversified Telecommunication | ||||||||||||
Koninklijke KPN NV | 6,700 | 21,847 | ||||||||||
TDC A/S(b) | 9,400 | 51,827 | ||||||||||
|
| |||||||||||
| 73,674 | ||||||||||||
|
| |||||||||||
Energy – 0.3% | ||||||||||||
Oil, Gas & Consumable Fuels – 0.3% | ||||||||||||
Chesapeake Energy Corp.(b) | 3,397 | 18,717 | ||||||||||
EP Energy Corp. – Class A(b) | 1,809 | 6,440 | ||||||||||
Halcon Resources Corp.(b) | 879 | 7,867 | ||||||||||
Peabody Energy Corp.(b) | 484 | 4,235 | ||||||||||
SandRidge Energy, Inc.(b) | 719 | 16,559 | ||||||||||
Whiting Petroleum Corp.(b) | 2,110 | 17,386 | ||||||||||
|
| |||||||||||
| 71,204 | ||||||||||||
|
| |||||||||||
Information Technology – 0.2% | ||||||||||||
IT Services – 0.2% | ||||||||||||
Travelport Worldwide Ltd. | 2,303 | 32,518 | ||||||||||
|
| |||||||||||
Software – 0.0% | ||||||||||||
Dell Technologies, Inc. – VMware, Inc. – Class V(b) | 162 | 7,953 | ||||||||||
|
| |||||||||||
| 40,471 | ||||||||||||
|
| |||||||||||
Industrials – 0.2% | ||||||||||||
Machinery – 0.2% | ||||||||||||
Navistar International Corp.(b) | 1,396 | 31,131 | ||||||||||
|
| |||||||||||
Trading Companies & Distributors – 0.0% | ||||||||||||
Emeco Holdings Ltd.(b) | 92,500 | 4,890 | ||||||||||
|
| |||||||||||
| 36,021 | ||||||||||||
|
| |||||||||||
Health Care – 0.1% | ||||||||||||
Health Care Providers & Services – 0.1% | ||||||||||||
Community Health Systems, Inc.(b) | 3,214 | 16,970 | ||||||||||
Quorum Health Corp.(b) | 322 | 1,301 | ||||||||||
|
| |||||||||||
| 18,271 | ||||||||||||
|
| |||||||||||
Pharmaceuticals – 0.0% | ||||||||||||
Endo International PLC(b) | 673 | 12,619 | ||||||||||
|
| |||||||||||
| 30,890 | ||||||||||||
|
| |||||||||||
Materials – 0.1% | ||||||||||||
Chemicals – 0.1% | ||||||||||||
LyondellBasell Industries NV – Class A | 230 | 18,297 | ||||||||||
|
| |||||||||||
| AB CREDIT LONG/SHORT PORTFOLIO • | 17 |
Portfolio of Investments
| Company | Shares | U.S. $ Value | ||||||||||
| ||||||||||||
Metals & Mining – 0.0% | ||||||||||||
Cliffs Natural Resources, Inc.(b) | 1,756 | $ | 9,693 | |||||||||
|
| |||||||||||
| 27,990 | ||||||||||||
|
| |||||||||||
Financials – 0.1% | ||||||||||||
Consumer Finance – 0.1% | ||||||||||||
Enova International, Inc.(b) | 1,000 | 9,400 | ||||||||||
|
| |||||||||||
Diversified Financial Services – 0.0% | ||||||||||||
iPayment, Inc.(b)(k)(l) | 714 | 2,355 | ||||||||||
|
| |||||||||||
| 11,755 | ||||||||||||
|
| |||||||||||
Total Common Stocks | 597,898 | |||||||||||
|
| |||||||||||
INVESTMENT COMPANIES – 2.5% | ||||||||||||
Funds and Investment Trusts – 2.5% | ||||||||||||
BlackRock Debt Strategies Fund, Inc. | 61,300 | 221,906 | ||||||||||
Wells Fargo Income Opportunities Fund | 39,092 | 319,382 | ||||||||||
|
| |||||||||||
Total Investment Companies | 541,288 | |||||||||||
|
| |||||||||||
| Principal Amount (000) | ||||||||||||
EMERGING MARKETS – CORPORATE | ||||||||||||
Industrial – 2.3% | ||||||||||||
Capital Goods – 2.3% | ||||||||||||
Odebrecht Finance Ltd. | U.S.$ | 1,000 | 485,000 | |||||||||
|
| |||||||||||
GOVERNMENTS – SOVEREIGN | ||||||||||||
Brazil – 1.0% | ||||||||||||
Petrobras Global Finance BV | 250 | 221,487 | ||||||||||
|
| |||||||||||
United Kingdom – 0.9% | ||||||||||||
Royal Bank of Scotland Group PLC | 205 | 188,088 | ||||||||||
|
| |||||||||||
Total Governments – Sovereign Agencies | 409,575 | |||||||||||
|
| |||||||||||
EMERGING MARKETS – TREASURIES – 1.5% | ||||||||||||
Brazil – 1.5% | ||||||||||||
Brazil Notas do Tesouro Nacional | BRL | 340 | 314,602 | |||||||||
|
| |||||||||||
| 18 | • AB CREDIT LONG/SHORT PORTFOLIO |
Portfolio of Investments
| Principal Amount (000) | U.S. $ Value | |||||||||||
| ||||||||||||
EMERGING MARKETS – SOVEREIGNS – 1.1% | ||||||||||||
Venezuela – 1.1% | ||||||||||||
Venezuela Government International Bond | U.S.$ | 450 | $ | 225,450 | ||||||||
|
| |||||||||||
COLLATERALIZED MORTGAGE OBLIGATIONS – 1.1% | ||||||||||||
Non-Agency Fixed Rate – 1.1% | ||||||||||||
Alternative Loan Trust | 65 | 58,107 | ||||||||||
Countrywide Home Loan Mortgage Pass-Through Trust | 68 | 58,761 | ||||||||||
GSR Mortgage Loan Trust | 34 | 28,666 | ||||||||||
Morgan Stanley Mortgage Loan Trust | 80 | 54,646 | ||||||||||
Wells Fargo Mortgage Backed Securities Trust | 25 | 24,409 | ||||||||||
|
| |||||||||||
Total Collateralized Mortgage Obligations | 224,589 | |||||||||||
|
| |||||||||||
QUASI-SOVEREIGNS – 1.0% | ||||||||||||
Quasi-Sovereign Bonds – 1.0% | ||||||||||||
Venezuela – 1.0% | ||||||||||||
Petroleos de Venezuela SA | 500 | 222,625 | ||||||||||
|
| |||||||||||
ASSET-BACKED SECURITIES – 1.0% | ||||||||||||
Other ABS - Fixed Rate – 1.0% | ||||||||||||
Taco Bell Funding LLC | 210 | 212,888 | ||||||||||
|
| |||||||||||
BANK LOANS – 1.0% | ||||||||||||
Industrial – 1.0% | ||||||||||||
Basic – 0.0% | ||||||||||||
Magnetation LLC | 42 | 5,508 | ||||||||||
|
| |||||||||||
| AB CREDIT LONG/SHORT PORTFOLIO • | 19 |
Portfolio of Investments
| Principal Amount (000) | U.S. $ Value | |||||||||||
| ||||||||||||
Energy – 1.0% | ||||||||||||
California Resources Corporation | U.S.$ | 191 | $ | 204,684 | ||||||||
|
| |||||||||||
Total Bank Loans | 210,192 | |||||||||||
|
| |||||||||||
GOVERNMENTS – TREASURIES – 0.5% | ||||||||||||
Mexico – 0.5% | ||||||||||||
Mexican Bonos Series M | MXN | 1,990 | 101,556 | |||||||||
|
| |||||||||||
| Shares | ||||||||||||
WARRANTS – 0.2% | ||||||||||||
Energy – 0.1% | ||||||||||||
Oil, Gas & Consumable Fuels – 0.1% | ||||||||||||
Midstates Petroleum Co., Inc., | 1,429 | 7,860 | ||||||||||
SandRidge Energy, Inc.-A-CW22, | 2,538 | 12,309 | ||||||||||
SandRidge Energy, Inc.-B-CW22, | 122 | 555 | ||||||||||
|
| |||||||||||
| 20,724 | ||||||||||||
|
| |||||||||||
Consumer Discretionary – 0.1% | ||||||||||||
Automobiles – 0.1% | ||||||||||||
Peugeot SA, expiring 4/29/17(b) | 4,850 | 13,395 | ||||||||||
|
| |||||||||||
Financials – 0.0% | ||||||||||||
Diversified Financial Services – 0.0% | ||||||||||||
iPayment Holdings, Inc., | 13,856 | 7,344 | ||||||||||
|
| |||||||||||
Total Warrants | 41,463 | |||||||||||
|
| |||||||||||
PREFERRED STOCKS – 0.2% | ||||||||||||
Industrial – 0.2% | ||||||||||||
Energy – 0.2% | ||||||||||||
Sanchez Energy Corp. | 1,550 | 39,044 | ||||||||||
|
| |||||||||||
| Contracts | ||||||||||||
OPTIONS PURCHASED – PUTS – 0.1% | ||||||||||||
Options on Equities – 0.1% | ||||||||||||
DIEBOLD, Inc. | 62 | 7,285 | ||||||||||
| 20 | • AB CREDIT LONG/SHORT PORTFOLIO |
Portfolio of Investments
| Company | Contracts | U.S. $ Value | ||||||||||
| ||||||||||||
Tesla Motors, Inc. | 16 | $ | 2,336 | |||||||||
|
| |||||||||||
| 9,621 | ||||||||||||
|
| |||||||||||
Options on Funds and Investment Trusts – 0.0% | ||||||||||||
iShares US Preferred Stock ETF | 127 | 5,715 | ||||||||||
SPDR S&P 500 ETF Trust | 24 | 3,708 | ||||||||||
|
| |||||||||||
| 9,423 | ||||||||||||
|
| |||||||||||
| Notional Amount (000) | ||||||||||||
Swaptions – 0.0% | ||||||||||||
CDX-NAHY Series 27, 5 Year Index RTP, Citibank, NA (Buy Protection) | 1,710 | 5,227 | ||||||||||
|
| |||||||||||
Total Options Purchased – Puts | 24,271 | |||||||||||
|
| |||||||||||
| Principal Amount (000) | ||||||||||||
SHORT-TERM INVESTMENTS – 44.7% | ||||||||||||
U.S. Treasury Bills – 23.1% | ||||||||||||
U.S. Treasury Bill | U.S.$ | 2,900 | 2,899,136 | |||||||||
Zero Coupon, 12/15/16(o) | 2,000 | 1,999,294 | ||||||||||
|
| |||||||||||
Total U.S. Treasury Bills | 4,898,430 | |||||||||||
|
| |||||||||||
| Shares | ||||||||||||
Investment Companies – 21.6% | ||||||||||||
AB Fixed Income Shares, Inc. – Government Money Market Portfolio – Class AB, 0.26%(p)(q) | 4,594,500 | 4,594,500 | ||||||||||
|
| |||||||||||
Total Short-Term Investments | 9,492,930 | |||||||||||
|
| |||||||||||
Total Investments Before Securities Sold Short – 98.0% | 20,822,813 | |||||||||||
|
| |||||||||||
| AB CREDIT LONG/SHORT PORTFOLIO • | 21 |
Portfolio of Investments
| Principal Amount (000) | U.S. $ Value | |||||||||||
| ||||||||||||
SECURITIES SOLD SHORT – (76.8)% | ||||||||||||
CORPORATES – NON-INVESTMENT GRADE – (56.4)% | ||||||||||||
Industrial – (46.5)% | ||||||||||||
Basic – (8.5)% | ||||||||||||
Ashland LLC | U.S.$ | (600 | ) | $ | (619,872 | ) | ||||||
Chemours Co. (The) | (400 | ) | (388,000 | ) | ||||||||
INEOS Group Holdings SA | (400 | ) | (396,500 | ) | ||||||||
Lundin Mining Corp. | (200 | ) | (212,500 | ) | ||||||||
Platform Specialty Products Corp. | (200 | ) | (194,000 | ) | ||||||||
|
| |||||||||||
| (1,810,872 | ) | |||||||||||
|
| |||||||||||
Capital Goods – (6.3)% | ||||||||||||
Berry Plastics Corp. | (564 | ) | (586,560 | ) | ||||||||
CNH Industrial Finance Europe SA | EUR | (300 | ) | (342,498 | ) | |||||||
United Rentals North America, Inc. | U.S.$ | (400 | ) | (415,000 | ) | |||||||
|
| |||||||||||
| (1,344,058 | ) | |||||||||||
|
| |||||||||||
Communications - Media – (3.0)% | ||||||||||||
Lamar Media Corp. | (400 | ) | (419,000 | ) | ||||||||
5.875%, 2/01/22 | (200 | ) | (207,000 | ) | ||||||||
|
| |||||||||||
| (626,000 | ) | |||||||||||
|
| |||||||||||
Consumer Cyclical - Automotive – (4.9)% | ||||||||||||
American Axle & Manufacturing, Inc. | (400 | ) | (422,000 | ) | ||||||||
Jaguar Land Rover Automotive PLC | (600 | ) | (620,712 | ) | ||||||||
|
| |||||||||||
| (1,042,712 | ) | |||||||||||
|
| |||||||||||
Consumer Cyclical - Other – (2.0)% | ||||||||||||
Scientific Games International, Inc. | (400 | ) | (425,440 | ) | ||||||||
|
| |||||||||||
Consumer Cyclical - Retailers – (1.0)% | ||||||||||||
Gap, Inc. (The) | (200 | ) | (214,507 | ) | ||||||||
|
| |||||||||||
Consumer Non-Cyclical – (6.3)% | ||||||||||||
ACCO Brands Corp. | (200 | ) | (210,500 | ) | ||||||||
| 22 | • AB CREDIT LONG/SHORT PORTFOLIO |
Portfolio of Investments
| Principal Amount (000) | U.S. $ Value | |||||||||||
| ||||||||||||
HCA, Inc. | U.S.$ | (497 | ) | $ | (527,287 | ) | ||||||
Spectrum Brands, Inc. | (400 | ) | (433,000 | ) | ||||||||
Tops Holding LLC/Tops Markets II Corp. | (200 | ) | (176,000 | ) | ||||||||
|
| |||||||||||
| (1,346,787 | ) | |||||||||||
|
| |||||||||||
Energy – (3.7)% | ||||||||||||
Cenovus Energy, Inc. | (200 | ) | (197,240 | ) | ||||||||
Continental Resources, Inc./OK | (400 | ) | (392,000 | ) | ||||||||
Southwestern Energy Co. | (200 | ) | (190,500 | ) | ||||||||
|
| |||||||||||
| (779,740 | ) | |||||||||||
|
| |||||||||||
Services – (1.9)% | ||||||||||||
Realogy Group LLC/Realogy Co-Issuer Corp. | (200 | ) | (207,500 | ) | ||||||||
4.875%, 6/01/23(d) | (200 | ) | (200,000 | ) | ||||||||
|
| |||||||||||
| (407,500 | ) | |||||||||||
|
| |||||||||||
Technology – (8.9)% | ||||||||||||
First Data Corp. | (600 | ) | (628,500 | ) | ||||||||
MSCI, Inc. | (400 | ) | (420,000 | ) | ||||||||
NXP BV/NXP Funding LLC | (800 | ) | (832,000 | ) | ||||||||
|
| |||||||||||
| (1,880,500 | ) | |||||||||||
|
| |||||||||||
| (9,878,116 | ) | |||||||||||
|
| |||||||||||
Financial Institutions – (8.4)% | ||||||||||||
Banking – (3.7)% | ||||||||||||
Bankia SA | EUR | (200 | ) | (234,535 | ) | |||||||
Societe Generale SA | U.S.$ | (600 | ) | (551,220 | ) | |||||||
|
| |||||||||||
| (785,755 | ) | |||||||||||
|
| |||||||||||
Finance – (2.8)% | ||||||||||||
Fly Leasing Ltd. | (200 | ) | (204,500 | ) | ||||||||
Provident Funding Associates LP/PFG Finance Corp. | (400 | ) | (402,000 | ) | ||||||||
|
| |||||||||||
| (606,500 | ) | |||||||||||
|
| |||||||||||
Other Finance – (1.9)% | ||||||||||||
International Personal Finance PLC | EUR | (400 | ) | (399,581 | ) | |||||||
|
| |||||||||||
| (1,791,836 | ) | |||||||||||
|
| |||||||||||
| AB CREDIT LONG/SHORT PORTFOLIO • | 23 |
Portfolio of Investments
| Principal Amount (000) | U.S. $ Value | |||||||||||
| ||||||||||||
Utility – (1.5)% | ||||||||||||
Electric – (1.5)% | ||||||||||||
Calpine Corp. | U.S.$ | (189 | ) | $ | (197,564 | ) | ||||||
Enel SpA | EUR | (100 | ) | (118,956 | ) | |||||||
|
| |||||||||||
| (316,520 | ) | |||||||||||
|
| |||||||||||
Total Corporates – Non-Investment Grade | (11,986,472 | ) | ||||||||||
|
| |||||||||||
CORPORATES – INVESTMENT GRADE – (15.9)% | ||||||||||||
Financial Institutions – (8.7)% | ||||||||||||
Banking – (6.9)% | ||||||||||||
BNP Paribas SA | U.S.$ | (600 | ) | (615,750 | ) | |||||||
Cooperatieve Rabobank UA | EUR | (600 | ) | (662,769 | ) | |||||||
Intesa Sanpaolo SpA | U.S.$ | (150 | ) | (193,632 | ) | |||||||
|
| |||||||||||
| (1,472,151 | ) | |||||||||||
|
| |||||||||||
Insurance – (1.8)% | ||||||||||||
Chubb Corp. (The) | (400 | ) | (377,000 | ) | ||||||||
|
| |||||||||||
| (1,849,151 | ) | |||||||||||
|
| |||||||||||
Industrial – (7.2)% | ||||||||||||
Consumer Cyclical - Automotive – (3.0)% | ||||||||||||
Lear Corp. | (595 | ) | (635,906 | ) | ||||||||
|
| |||||||||||
Energy – (1.2)% | ||||||||||||
Repsol International Finance BV | EUR | (200 | ) | (252,056 | ) | |||||||
|
| |||||||||||
Services – (1.0)% | ||||||||||||
Amazon.com, Inc. | U.S.$ | (200 | ) | (218,909 | ) | |||||||
|
| |||||||||||
Technology – (2.0)% | ||||||||||||
Hewlett Packard Enterprise Co. | (400 | ) | (430,863 | ) | ||||||||
|
| |||||||||||
| (1,537,734 | ) | |||||||||||
|
| |||||||||||
Total Corporates – Investment Grade | (3,386,885 | ) | ||||||||||
|
| |||||||||||
| 24 | • AB CREDIT LONG/SHORT PORTFOLIO |
Portfolio of Investments
| Principal Amount (000) | U.S. $ Value | |||||||||||
| ||||||||||||
EMERGING MARKETS – CORPORATE BONDS – (1.8)% | ||||||||||||
Industrial – (1.8)% | ||||||||||||
Capital Goods – (1.8)% | ||||||||||||
Odebrecht Finance Ltd. | U.S.$ | (800 | ) | $ | (383,000 | ) | ||||||
|
| |||||||||||
GOVERNMENTS – SOVEREIGN AGENCIES – (1.1)% | ||||||||||||
Colombia – (1.1)% | ||||||||||||
Ecopetrol SA | (200 | ) | (228,340 | ) | ||||||||
|
| |||||||||||
EMERGING MARKETS – SOVEREIGNS – (0.9)% | ||||||||||||
Venezuela – (0.9)% | ||||||||||||
Venezuela Government International Bond | (400 | ) | (185,600 | ) | ||||||||
|
| |||||||||||
QUASI-SOVEREIGNS – (0.7)% | ||||||||||||
Venezuela – (0.7)% | ||||||||||||
Petroleos de Venezuela SA | (400 | ) | (150,000 | ) | ||||||||
|
| |||||||||||
Total Securities Sold Short | (16,320,297 | ) | ||||||||||
|
| |||||||||||
Total Investments – 21.2% | 4,502,516 | |||||||||||
Other assets less liabilities – 78.8% | 16,738,700 | |||||||||||
|
| |||||||||||
Net Assets – 100.0% | $ | 21,241,216 | ||||||||||
|
| |||||||||||
FUTURES (see Note D)
| Type | Number of Contracts | Expiration Month | Original Value | Value at October 31, 2016 | Unrealized Appreciation/ (Depreciation) | |||||||||||||||
Purchased Contracts |
| |||||||||||||||||||
Euro STOXX 50 Index Futures | 4 | December 2016 | $ | 131,844 | $ | 134,057 | $ | 2,213 | ||||||||||||
U.S. T-Note 10 Yr (CBT) Futures | 1 | December 2016 | 130,424 | 129,625 | (799 | ) | ||||||||||||||
| AB CREDIT LONG/SHORT PORTFOLIO • | 25 |
Portfolio of Investments
| Type | Number of Contracts | Expiration Month | Original Value | Value at October 31, 2016 | Unrealized Appreciation/ (Depreciation) | |||||||||||||||
Sold Contracts | ||||||||||||||||||||
Euro-BOBL Futures | 15 | December 2016 | $ | 2,172,378 | $ | 2,158,891 | $ | 13,487 | ||||||||||||
Euro-Bund Futures | 7 | December 2016 | 1,267,300 | 1,246,155 | 21,145 | |||||||||||||||
Euro-OAT Futures | 7 | December 2016 | 1,230,317 | 1,201,049 | 29,268 | |||||||||||||||
S&P 500 E Mini Futures | 2 | December 2016 | 215,249 | 212,010 | 3,239 | |||||||||||||||
U.S. Long Bond (CBT) Futures | 2 | December 2016 | 341,824 | 325,437 | 16,387 | |||||||||||||||
|
| |||||||||||||||||||
| $ | 84,940 | |||||||||||||||||||
|
| |||||||||||||||||||
FORWARD CURRENCY EXCHANGE CONTRACTS (see Note D)
| Counterparty | Contracts to (000) | In Exchange For (000) | Settlement Date | Unrealized Appreciation/ (Depreciation) | ||||||||||||||||||||
Citibank, NA | USD | 1,380 | EUR | 1,235 | 11/15/16 | $ | (23,918 | ) | ||||||||||||||||
Citibank, NA | KRW | 253,714 | USD | 228 | 12/15/16 | 6,201 | ||||||||||||||||||
Credit Suisse International | GBP | 174 | USD | 226 | 11/16/16 | 12,584 | ||||||||||||||||||
Deutsche Bank AG | CNY | 1,369 | USD | 203 | 12/15/16 | 1,468 | ||||||||||||||||||
Goldman Sachs Bank USA | BRL | 602 | USD | 184 | 11/03/16 | (4,200 | ) | |||||||||||||||||
Goldman Sachs Bank USA | USD | 189 | BRL | 602 | 11/03/16 | (646 | ) | |||||||||||||||||
JPMorgan Chase Bank, NA | TWD | 6,987 | USD | 223 | 12/08/16 | 1,657 | ||||||||||||||||||
Morgan Stanley Capital Services, Inc. | BRL | 602 | USD | 189 | 11/03/16 | 646 | ||||||||||||||||||
Morgan Stanley Capital Services, Inc. | USD | 192 | BRL | 602 | 11/03/16 | (3,255 | ) | |||||||||||||||||
Morgan Stanley Capital Services, Inc. | BRL | 602 | USD | 190 | 12/02/16 | 3,201 | ||||||||||||||||||
State Street Bank & Trust Co. | CAD | 143 | USD | 111 | 11/10/16 | 4,809 | ||||||||||||||||||
State Street Bank & Trust Co. | EUR | 154 | USD | 170 | 11/15/16 | 1,612 | ||||||||||||||||||
State Street Bank & Trust Co. | EUR | 6 | USD | 7 | 11/15/16 | (52 | ) | |||||||||||||||||
State Street Bank & Trust Co. | USD | 153 | GBP | 118 | 11/16/16 | (8,701 | ) | |||||||||||||||||
State Street Bank & Trust Co. | MXN | 1,850 | USD | 99 | 11/22/16 | 1,108 | ||||||||||||||||||
State Street Bank & Trust Co. | USD | 98 | MXN | 1,924 | 11/22/16 | 3,573 | ||||||||||||||||||
State Street Bank & Trust Co. | DKK | 363 | USD | 55 | 12/07/16 | 940 | ||||||||||||||||||
State Street Bank & Trust Co. | USD | 210 | SEK | 1,762 | 12/07/16 | (14,175 | ) | |||||||||||||||||
State Street Bank & Trust Co. | JPY | 11,417 | USD | 111 | 12/09/16 | 1,724 | ||||||||||||||||||
State Street Bank & Trust Co. | SGD | 296 | USD | 218 | 12/14/16 | 4,583 | ||||||||||||||||||
|
| |||||||||||||||||||||||
| $ | (10,841 | ) | ||||||||||||||||||||||
|
| |||||||||||||||||||||||
PUT OPTIONS WRITTEN (see Note D)
| Description | Contracts | Exercise Price | Expiration Month | Premiums Received | U.S. $ Value | |||||||||||||||
SPDR S&P 500 ETF Trust(n) | 24 | $ | 197.00 | November 2016 | $ | 719 | $ | (1,008 | ) | |||||||||||
Tesla Motors, Inc.(n) | 16 | 170.00 | November 2016 | 1,807 | (904 | ) | ||||||||||||||
|
|
|
| |||||||||||||||||
| $ | 2,526 | $ | (1,912 | ) | ||||||||||||||||
|
|
|
| |||||||||||||||||
| 26 | • AB CREDIT LONG/SHORT PORTFOLIO |
Portfolio of Investments
CENTRALLY CLEARED CREDIT DEFAULT SWAPS (see Note D)
| Clearing Broker/(Exchange) & Referenced Obligation | Fixed Rate (Pay) Receive | Implied Credit Spread at October 31, 2016 | Notional Amount (000) | Market Value | Unrealized Appreciation/ (Depreciation) | |||||||||||||||
Buy Contracts | ||||||||||||||||||||
Morgan Stanley & Co. LLC/(INTRCONX) | ||||||||||||||||||||
CDX-NAHY Series 23, | (5.00 | )% | 2.69 | % | $ | 495 | $ | (36,488 | ) | $ | (7,775 | ) | ||||||||
CDX-NAHY Series 26, | (5.00 | ) | 3.93 | 542 | (26,512 | ) | (2,652 | ) | ||||||||||||
CDX-NAHY Series 26, | (5.00 | ) | 3.93 | 528 | (25,827 | ) | (2,267 | ) | ||||||||||||
CDX-NAHY Series 27, | (5.00 | ) | 4.21 | 880 | (35,290 | ) | (6,249 | ) | ||||||||||||
CDX-NAHY Series 27, | (5.00 | ) | 4.21 | 210 | (8,421 | ) | 357 | |||||||||||||
CDX-NAIG Series 23, | (1.00 | ) | 0.57 | 2,500 | (35,740 | ) | (6,006 | ) | ||||||||||||
iTraxx-XOVER Series 25, | (5.00 | ) | 3.15 | EUR | 18 | (1,631 | ) | (256 | ) | |||||||||||
Sale Contracts | ||||||||||||||||||||
Morgan Stanley & Co. LLC/(CME) | ||||||||||||||||||||
CDX-NAHY Series 23, | 5.00 | 2.69 | $ | 495 | 36,487 | 11,503 | ||||||||||||||
Morgan Stanley & Co. LLC/(INTRCONX) | ||||||||||||||||||||
CDX-NAHY Series 26, | 5.00 | 3.93 | 1,070 | 52,340 | 5,481 | |||||||||||||||
iTraxx-XOVER Series 23, | 5.00 | 2.56 | EUR | 114 | 11,085 | 1,895 | ||||||||||||||
|
|
|
| |||||||||||||||||
| $ | (69,997 | ) | $ | (5,969 | ) | |||||||||||||||
|
|
|
| |||||||||||||||||
| * | Termination date |
CENTRALLY CLEARED INTEREST RATE SWAPS (see Note D)
| Rate Type | ||||||||||||||||||||
| Clearing Broker/ (Exchange) | Notional Amount (000) | Termination Date | Payments Fund | Payments received by the Fund | Unrealized Appreciation/ (Depreciation) | |||||||||||||||
Morgan Stanley & Co. LLC/(CME) | $ | 250 | 5/09/19 | 1.732 | % | 3 Month LIBOR | $ | (5,348 | ) | |||||||||||
| AB CREDIT LONG/SHORT PORTFOLIO • | 27 |
Portfolio of Investments
CREDIT DEFAULT SWAPS (see Note D)
| Swap Counterparty & Referenced Obligation | Fixed Rate (Pay) Receive | Implied Credit Spread at October 31, 2016 | Notional Amount (000) | Market Value | Upfront Premiums Paid (Received) | Unrealized Appreciation/ (Depreciation) | ||||||||||||||||||
Buy Contracts |
| |||||||||||||||||||||||
Barclays Bank PLC | ||||||||||||||||||||||||
Brazilian Government International Bond, | (1.00 | )% | 2.69 | % | $ | 400 | $ | 31,460 | $ | 32,135 | $ | (675 | ) | |||||||||||
Colombia Government International Bond, | (1.00 | ) | 1.74 | 600 | 20,784 | 20,541 | 243 | |||||||||||||||||
Iceland Bondco PLC, | (5.00 | ) | 5.77 | EUR | 400 | 11,983 | 8,765 | 3,218 | ||||||||||||||||
Indonesia Government International Bond, | (1.00 | ) | 1.53 | $ | 600 | 14,592 | 14,744 | (152 | ) | |||||||||||||||
Repsol International Finance BV, | (1.00 | ) | 1.28 | EUR | 200 | 2,841 | 6,553 | (3,712 | ) | |||||||||||||||
Republic of South Africa Government International Bond, | (1.00 | ) | 2.40 | $ | 300 | 19,702 | 21,755 | (2,053 | ) | |||||||||||||||
Russian Foreign Bond – Eurobond, | (1.00 | ) | 2.21 | 400 | 22,632 | 21,192 | 1,440 | |||||||||||||||||
Turkey Government International Bond, | (1.00 | ) | 2.53 | 300 | 21,447 | 21,625 | (178 | ) | ||||||||||||||||
Citibank, NA | ||||||||||||||||||||||||
Arconic, Inc., | (1.00 | ) | 2.50 | 200 | 13,955 | 15,283 | (1,328 | ) | ||||||||||||||||
Dell, Inc., | (1.00 | ) | 3.03 | 200 | 18,638 | 20,585 | (1,947 | ) | ||||||||||||||||
Quest Diagnostics, Inc., | (1.00 | ) | 0.40 | 500 | (12,710 | ) | (1,559 | ) | (11,151 | ) | ||||||||||||||
Renault SA, 5.625%, 3/22/17, 12/20/19* | (1.00 | ) | 0.54 | EUR | 160 | (2,741 | ) | – 0 | – | (2,741 | ) | |||||||||||||
Transocean, Inc., | (5.00 | ) | 5.55 | $ | 1,000 | 19,145 | 77,957 | (58,812 | ) | |||||||||||||||
| 28 | • AB CREDIT LONG/SHORT PORTFOLIO |
Portfolio of Investments
| Swap Counterparty & Referenced Obligation | Fixed Rate (Pay) Receive | Implied Credit Spread at October 31, 2016 | Notional Amount (000) | Market Value | Upfront Premiums Paid (Received) | Unrealized Appreciation/ (Depreciation) | ||||||||||||||||||
Credit Suisse International |
| |||||||||||||||||||||||
BellSouth LLC, | (1.00 | )% | 0.45 | % | $ | 1,000 | $ | (16,266 | ) | $ | (14,144 | ) | $ | (2,122 | ) | |||||||||
ConAgra Foods, Inc., | (1.00 | ) | 0.77 | 600 | (7,662 | ) | (4,452 | ) | (3,210 | ) | ||||||||||||||
Deutsche Bank AG | ||||||||||||||||||||||||
Lloyds Bank PLC, | (1.00 | ) | 0.60 | EUR | 470 | (7,191 | ) | (8,108 | ) | 917 | ||||||||||||||
Goldman Sachs International | ||||||||||||||||||||||||
Amkor Technology, Inc., | (5.00 | ) | 1.79 | $ | 100 | (14,416 | ) | (4,654 | ) | (9,762 | ) | |||||||||||||
Boyd Gaming Corp., | (5.00 | ) | 2.58 | 200 | (24,277 | ) | (23,275 | ) | (1,002 | ) | ||||||||||||||
iHeartCommunications, Inc., | (5.00 | ) | 29.96 | 49 | 1,366 | 2,336 | (970 | ) | ||||||||||||||||
Teck Resources Ltd., | (1.00 | ) | 0.53 | 250 | (1,845 | ) | 3,304 | (5,149 | ) | |||||||||||||||
Transocean, Inc., | (5.00 | ) | 7.78 | 320 | 35,458 | 51,047 | (15,589 | ) | ||||||||||||||||
Transocean, Inc., | (1.00 | ) | 7.78 | 300 | 85,028 | 98,658 | (13,630 | ) | ||||||||||||||||
Yum! Brands, Inc., | (1.00 | ) | 1.23 | 200 | 2,153 | 12,708 | (10,555 | ) | ||||||||||||||||
JPMorgan Chase Bank, NA | ||||||||||||||||||||||||
Kohl’s Corp., | (1.00 | ) | 0.17 | 400 | (2,597 | ) | (1,102 | ) | (1,495 | ) | ||||||||||||||
Morgan Stanley Capital Services LLC | ||||||||||||||||||||||||
British Telecommunications PLC, | (1.00 | ) | 0.57 | EUR | 960 | (19,935 | ) | (8,606 | ) | (11,329 | ) | |||||||||||||
Koninklijke KPN NV, | (1.00 | ) | 0.58 | 350 | (7,156 | ) | (467 | ) | (6,689 | ) | ||||||||||||||
| AB CREDIT LONG/SHORT PORTFOLIO • | 29 |
Portfolio of Investments
| Swap Counterparty & Referenced Obligation | Fixed Rate (Pay) Receive | Implied Credit Spread at October 31, 2016 | Notional Amount (000) | Market Value | Upfront Premiums Paid (Received) | Unrealized Appreciation/ (Depreciation) | ||||||||||||||||||
Noble Holding International Ltd., | (1.00 | )% | 5.70 | % | $ | 150 | $ | 29,532 | $ | 31,348 | $ | (1,816 | ) | |||||||||||
Sale Contracts | ||||||||||||||||||||||||
Bank of America, NA | ||||||||||||||||||||||||
Genworth Holdings, Inc., | 5.00 | 5.77 | 20 | (419 | ) | 642 | (1,061 | ) | ||||||||||||||||
Barclays Bank PLC | ||||||||||||||||||||||||
Assured Guaranty Municipal Corp., | 5.00 | 1.01 | 20 | 2,905 | 1,147 | 1,758 | ||||||||||||||||||
iHeartCommunications, Inc., | 5.00 | 38.40 | 35 | (23,074 | ) | (22,904 | ) | (170 | ) | |||||||||||||||
Citibank, NA | ||||||||||||||||||||||||
Nabors Industries, Inc., | 1.00 | 2.45 | 20 | (1,014 | ) | (1,743 | ) | 729 | ||||||||||||||||
Safeway, Inc., | 1.00 | 1.58 | 20 | (437 | ) | (1,271 | ) | 834 | ||||||||||||||||
Staples, Inc., | 1.00 | 1.55 | 20 | (428 | ) | (620 | ) | 192 | ||||||||||||||||
Transocean, Inc., | 1.00 | 5.55 | 1,200 | (186,345 | ) | (218,921 | ) | 32,576 | ||||||||||||||||
Unitymedia GmbH, | 5.00 | 1.39 | EUR | 90 | 13,264 | 12,023 | 1,241 | |||||||||||||||||
Weatherford International Ltd., | 1.00 | 4.92 | $ | 20 | (2,619 | ) | (1,350 | ) | (1,269 | ) | ||||||||||||||
Credit Suisse International | ||||||||||||||||||||||||
AT&T, Inc., | 1.00 | 0.47 | 1,000 | 15,867 | 16,418 | (551 | ) | |||||||||||||||||
Avon Products, Inc., | 1.00 | 3.07 | 20 | (1,557 | ) | (2,693 | ) | 1,136 | ||||||||||||||||
CDX-CMBX.NA.BB Series, | 5.00 | 8.47 | 65 | (9,973 | ) | (8,469 | ) | (1,504 | ) | |||||||||||||||
| 30 | • AB CREDIT LONG/SHORT PORTFOLIO |
Portfolio of Investments
| Swap Counterparty & Referenced Obligation | Fixed Rate (Pay) Receive | Implied Credit Spread at October 31, 2016 | Notional Amount (000) | Market Value | Upfront Premiums Paid (Received) | Unrealized Appreciation/ (Depreciation) | ||||||||||||||||||
Freeport-McMoRan, Inc., | 1.00 | % | 2.88 | % | $ | 20 | $ | (1,385 | ) | $ | (1,104 | ) | $ | (281 | ) | |||||||||
Teck Resources Ltd., | 1.00 | 1.67 | 20 | (519 | ) | (1,173 | ) | 654 | ||||||||||||||||
Transocean, Inc., | 1.00 | 5.55 | 20 | (3,106 | ) | (3,287 | ) | 181 | ||||||||||||||||
Goldman Sachs International | ||||||||||||||||||||||||
CDX-CMBX.NA.BB | 5.00 | 8.47 | 252 | (38,664 | ) | (42,656 | ) | 3,992 | ||||||||||||||||
CDX-CMBX.NA.BB | 5.00 | 8.47 | 138 | (21,173 | ) | (18,168 | ) | (3,005 | ) | |||||||||||||||
iHeartCommunications, Inc., | 5.00 | 38.40 | 75 | (49,447 | ) | (60,375 | ) | 10,928 | ||||||||||||||||
iHeartCommunications, Inc., | 5.00 | 37.82 | 50 | (33,531 | ) | (31,942 | ) | (1,589 | ) | |||||||||||||||
Teck Resources Ltd., | 1.00 | 1.67 | 200 | (5,192 | ) | (14,841 | ) | 9,649 | ||||||||||||||||
|
|
|
|
|
| |||||||||||||||||||
| $ | (112,927 | ) | $ | (7,118 | ) | $ | (105,809 | ) | ||||||||||||||||
|
|
|
|
|
| |||||||||||||||||||
| * | Termination date |
TOTAL RETURN SWAPS (see Note D)
| Counterparty & Referenced Obligation | # of Shares or Units | Rate Paid/ Received | Notional Amount (000) | Maturity Date | Unrealized Appreciation/ (Depreciation) | |||||||||||||||
Receive Total Return on Reference Obligation |
| |||||||||||||||||||
Bank of America, NA | ||||||||||||||||||||
iBoxx $ Liquid High Yield Index | 61,000 | LIBOR | $ | 61 | 12/20/16 | $ | 512 | |||||||||||||
iBoxx $ Liquid High Yield Index | 61,000 | LIBOR | 61 | 12/20/16 | 293 | |||||||||||||||
Citibank, NA | ||||||||||||||||||||
iBoxx $ Liquid High Yield Index | 152,000 | LIBOR | 152 | 12/20/16 | 1,276 | |||||||||||||||
iBoxx $ Liquid High Yield Index | 96,000 | LIBOR | 96 | 12/20/16 | 707 | |||||||||||||||
iBoxx $ Liquid High Yield Index | 56,000 | LIBOR | 56 | 12/20/16 | 413 | |||||||||||||||
iBoxx $ Liquid High Yield Index | 1,070,000 | LIBOR | 1,070 | 12/20/16 | (2,441 | ) | ||||||||||||||
Goldman Sachs International | ||||||||||||||||||||
iBoxx $ Liquid High Yield Index | 152,000 | LIBOR | 152 | 12/20/16 | 1,432 | |||||||||||||||
iBoxx $ Liquid High Yield Index | 153,000 | LIBOR | 153 | 12/20/16 | 658 | |||||||||||||||
iBoxx $ Liquid High Yield Index | 152,000 | LIBOR | 152 | 12/20/16 | 36 | |||||||||||||||
| AB CREDIT LONG/SHORT PORTFOLIO • | 31 |
Portfolio of Investments
| Counterparty & Referenced Obligation | # of Shares or Units | Rate Paid/ Received | Notional Amount (000) | Maturity Date | Unrealized Appreciation/ (Depreciation) | |||||||||||||||
JPMorgan Chase Bank, NA | ||||||||||||||||||||
iBoxx $ Liquid High Yield Index | 153,000 | LIBOR | $ | 153 | 12/20/16 | $ | 1,599 | |||||||||||||
iBoxx $ Liquid High Yield Index | 153,000 | LIBOR | 153 | 12/20/16 | 892 | |||||||||||||||
iBoxx $ Liquid High Yield Index | 76,000 | LIBOR | 76 | 12/20/16 | 638 | |||||||||||||||
iBoxx $ Liquid High Yield Index | 76,000 | LIBOR | 76 | 12/20/16 | 482 | |||||||||||||||
iBoxx $ Liquid High Yield Index | 76,000 | LIBOR | 76 | 12/20/16 | 342 | |||||||||||||||
iBoxx $ Liquid High Yield Index | 44,000 | LIBOR | 44 | 12/20/16 | 279 | |||||||||||||||
Morgan Stanley Capital Services LLC | ||||||||||||||||||||
iBoxx $ Liquid High Yield Index | 76,000 | LIBOR | 76 | 12/20/16 | 435 | |||||||||||||||
Pay Total Return on Reference Obligation |
| |||||||||||||||||||
Goldman Sachs International | ||||||||||||||||||||
iBoxx $ Liquid High Yield Index | 542,000 | LIBOR | 542 | 12/20/16 | 542 | |||||||||||||||
|
| |||||||||||||||||||
| $ | 8,095 | |||||||||||||||||||
|
| |||||||||||||||||||
| (a) | Defaulted. |
| (b) | Non-income producing security. |
| (c) | Security is exempt from registration under Rule 144A of the Securities Act of 1933. These securities, which represent 0.22% of net assets as of October 31, 2016, are considered illiquid and restricted. Additional information regarding such securities follows: |
| 144A/Restricted & Illiquid Securities | Acquisition Date | Cost | Market Value | Percentage of Net Assets | ||||||||||||
iPayment, Inc. | 12/29/14-2/27/15 | $ | 12,492 | $ | 12,593 | 0.06 | % | |||||||||
Magnetation LLC/Mag Finance Corp. | 2/19/15 | 21,438 | 42 | 0.00 | % | |||||||||||
Modular Space Corp. | 8/10/16-8/14/16 | 7,267 | 7,310 | 0.03 | % | |||||||||||
Speedy Group Holdings Corp. | 6/16/15 | 52,701 | 27,225 | 0.13 | % | |||||||||||
| (d) | Security is exempt from registration under Rule 144A of the Securities Act of 1933. These securities are considered restricted, but liquid and may be resold in transactions exempt from registration, normally to qualified institutional buyers. At October 31, 2016, the aggregate market value of these securities amounted to $(4,099,504) or (19.3)% of net assets. |
| (e) | Convertible security. |
| (f) | Variable rate coupon, rate shown as of October 31, 2016. |
| (g) | Pay-In-Kind Payments (PIK). The issuer may pay cash interest and/or interest in additional debt securities. Rates shown are the rates in effect at October 31, 2016. |
| (h) | Restricted and illiquid security. |
| Restricted & Illiquid Securities | Acquisition Date | Cost | Market Value | Percentage of Net Assets | ||||||||||||
CHC Helicopter SA | 3/04/16 | $ | 64,892 | $ | 84,661 | 0.40 | % | |||||||||
CHC Helicopter SA | 2/19/16 | 4,550 | 19,012 | 0.09 | % | |||||||||||
| (i) | Coupon rate adjusts periodically based upon a predetermined schedule. Stated interest rate in effect at October 31, 2016. |
| (j) | Securities are perpetual and, thus, do not have a predetermined maturity date. The date shown, if applicable, reflects the next call date. |
| 32 | • AB CREDIT LONG/SHORT PORTFOLIO |
Portfolio of Investments
| (k) | Illiquid security. |
| (l) | Fair valued by the Adviser. |
| (m) | The stated coupon rate represents the greater of the LIBOR or the LIBOR floor rate plus a spread at October 31, 2016. |
| (n) | One contract relates to 100 shares. |
| (o) | Position, or a portion thereof, has been segregated to collateralize OTC derivatives outstanding. |
| (p) | To obtain a copy of the fund’s financial statements, please go to the Securities and Exchange Commission’s website at www.sec.gov, or call AB at (800) 227-4618. |
| (q) | Investment in affiliated money market mutual fund. The rate shown represents the 7-day yield as of period end. |
Currency Abbreviations:
BRL – Brazilian Real
CAD – Canadian Dollar
CNY – Chinese Yuan Renminbi
DKK – Danish Krone
EUR – Euro
GBP – Great British Pound
JPY – Japanese Yen
KRW – South Korean Won
MXN – Mexican Peso
SEK – Swedish Krona
SGD – Singapore Dollar
TWD – New Taiwan Dollar
USD – United States Dollar
Glossary:
ABS – Asset-Backed Securities
BOBL – Bundesobligationen
CBT – Chicago Board of Trade
CDX-CMBX.NA – North American Commercial Mortgage-Backed Index
CDX-NAHY – North American High Yield Credit Default Swap Index
CDX-NAIG – North American Investment Grade Credit Default Swap Index
CME – Chicago Mercantile Exchange
ETF – Exchange Traded Fund
INTRCONX – Inter-Continental Exchange
LIBOR – London Interbank Offered Rates
OAT – Obligations Assimilables du Trésor
RTP – Right to Pay
SPDR – Standard & Poor’s Depository Receipt
See notes to financial statements.
| AB CREDIT LONG/SHORT PORTFOLIO • | 33 |
Portfolio of Investments
STATEMENT OF ASSETS & LIABILITIES
October 31, 2016
| Assets | ||||
Investments in securities, at value | ||||
Unaffiliated issuers (cost $15,953,937) | $ | 16,228,313 | ||
Affiliated issuers (cost $4,594,500) | 4,594,500 | |||
Cash | 616 | |||
Cash collateral due from broker | 426,399 | |||
Foreign currencies, at value (cost $9,995) | 10,150 | |||
Deposit at broker for securities sold short | 16,700,263 | |||
Receivable for investment securities sold | 517,350 | |||
Upfront premium paid on credit default swaps | 490,766 | |||
Unaffiliated interest and dividends receivable | 161,142 | |||
Unrealized appreciation on credit default swaps | 69,688 | |||
Unrealized appreciation on forward currency exchange contracts | 44,106 | |||
Unrealized appreciation on total return swaps | 10,536 | |||
Receivable due from Adviser | 7,584 | |||
Affiliated dividends receivable | 864 | |||
Receivable for variation margin on exchange-traded derivatives | 164 | |||
Receivable for terminated credit default swaps | 16 | |||
|
| |||
Total assets | 39,262,457 | |||
|
| |||
| Liabilities | ||||
Options written, at value (premiums received $2,526) | 1,912 | |||
Payable for securities sold short, at value (proceeds received $16,293,109) | 16,320,297 | |||
Upfront premium received on credit default swaps | 497,884 | |||
Payable for investment securities purchased | 477,902 | |||
Interest expense payable | 294,525 | |||
Unrealized depreciation on credit default swaps | 175,497 | |||
Unrealized depreciation on forward currency exchange contracts | 54,947 | |||
Payable for variation margin on exchange-traded derivatives | 2,601 | |||
Unrealized depreciation on total return swaps | 2,441 | |||
Transfer Agent fee payable | 1,483 | |||
Payable for newly entered total return swaps | 542 | |||
Distribution fee payable | 159 | |||
Accrued expenses | 191,051 | |||
|
| |||
Total liabilities | 18,021,241 | |||
|
| |||
Net Assets | $ | 21,241,216 | ||
|
| |||
| Composition of Net Assets | ||||
Capital stock, at par | $ | 2,090 | ||
Additional paid-in capital | 20,838,204 | |||
Undistributed net investment income | 49,326 | |||
Accumulated net realized gain on investment | 138,426 | |||
Net unrealized appreciation on investments | 213,170 | |||
|
| |||
| $ | 21,241,216 | |||
|
|
See notes to financial statements.
| 34 | • AB CREDIT LONG/SHORT PORTFOLIO |
Statement of Assets & Liabilities
Net Asset Value Per Share—30 billion shares of capital stock authorized, $.001 par value
| Class | Net Assets | Shares Outstanding | Net Asset Value | |||||||||
| ||||||||||||
| A | $ | 182,489 | 18,040 | $ | 10.12 | * | ||||||
| ||||||||||||
| C | $ | 155,732 | 15,628 | $ | 9.97 | |||||||
| ||||||||||||
| Advisor | $ | 20,902,995 | 2,056,247 | $ | 10.17 | |||||||
| ||||||||||||
| * | The maximum offering price per share for Class A shares was $10.57 which reflects a sales charge of 4.25%. |
See notes to financial statements.
| AB CREDIT LONG/SHORT PORTFOLIO • | 35 |
Statement of Assets & Liabilities
STATEMENT OF OPERATIONS
Year Ended October 31, 2016
| Investment Income | ||||||||
Interest | $ | 1,146,053 | ||||||
Dividends | ||||||||
Unaffiliated issuers (net of foreign taxes withheld of $122) | 95,299 | |||||||
Affiliated issuers | 8,862 | $ | 1,250,214 | |||||
|
| |||||||
| Expenses | ||||||||
Advisory fee (see Note B) | 190,094 | |||||||
Distribution fee—Class A | 460 | |||||||
Distribution fee—Class C | 1,297 | |||||||
Transfer agency—Class A | 179 | |||||||
Transfer agency—Class C | 146 | |||||||
Transfer agency—Advisor Class | 20,162 | |||||||
Custodian | 139,847 | |||||||
Audit and tax | 125,184 | |||||||
Administrative | 55,954 | |||||||
Legal | 47,602 | |||||||
Registration fees | 47,373 | |||||||
Directors’ fees | 23,721 | |||||||
Printing | 15,342 | |||||||
Miscellaneous | 39,925 | |||||||
|
| |||||||
Total operating expenses (see Note B) | 707,286 | |||||||
Interest expense | 968,148 | |||||||
Dividend expense on securities sold short | 17,100 | |||||||
Broker fee on securities sold short | 167,503 | |||||||
|
| |||||||
Total expenses | 1,860,037 | |||||||
Less: expenses waived and reimbursed by the Adviser (see Note B) | (475,616 | ) | ||||||
|
| |||||||
Net expenses | 1,384,421 | |||||||
|
| |||||||
Net investment loss | (134,207 | ) | ||||||
|
| |||||||
Realized and Unrealized Gain (Loss) on Investment and Foreign Currency Transactions | ||||||||
Net realized gain (loss) on: | ||||||||
Investment transactions | (337,526 | ) | ||||||
Securities sold short | 854,629 | |||||||
Futures | (113,724 | ) | ||||||
Options written | 70,960 | |||||||
Swaptions written | 18,214 | |||||||
Swaps | (146,655 | ) | ||||||
Foreign currency transactions | 33,406 | |||||||
Net change in unrealized appreciation/depreciation of: | ||||||||
Investments | 1,455,329 | |||||||
Securities sold short | (960,645 | ) | ||||||
Futures | 64,927 | |||||||
Options written | (26,380 | ) | ||||||
Swaptions written | (802 | ) | ||||||
Swaps | (68,284 | ) | ||||||
Foreign currency denominated assets and liabilities | 1,306 | |||||||
|
| |||||||
Net gain on investment and foreign currency transactions | 844,755 | |||||||
|
| |||||||
Net Increase in Net Assets from Operations | $ | 710,548 | ||||||
|
|
See notes to financial statements.
| 36 | • AB CREDIT LONG/SHORT PORTFOLIO |
Statement of Operations
STATEMENT OF CHANGES IN NET ASSETS
| Year Ended October 31, 2016 | Year Ended October 31, 2015 | |||||||
Increase (Decrease) in Net Assets from Operations | ||||||||
Net investment income (loss) | $ | (134,207 | ) | $ | 252,434 | |||
Net realized gain (loss) on investment and foreign currency transactions | 379,304 | (214,225 | ) | |||||
Net change in unrealized appreciation/depreciation of investments and foreign currency denominated assets and liabilities | 465,451 | (126,745 | ) | |||||
Contributions from Affiliates (see Note B) | – 0 | – | 1,338 | |||||
|
|
|
| |||||
Net increase (decrease) in net assets from operations | 710,548 | (87,198 | ) | |||||
Dividends and Distributions to Shareholders from | ||||||||
Net investment income | ||||||||
Class A | – 0 | – | (1,069 | ) | ||||
Class C | – 0 | – | (363 | ) | ||||
Advisor Class | – 0 | – | (201,440 | ) | ||||
Net realized gain on investment transactions | ||||||||
Class A | (686 | ) | – 0 | – | ||||
Class C | (427 | ) | – 0 | – | ||||
Advisor Class | (88,969 | ) | – 0 | – | ||||
| Capital Stock Transactions | ||||||||
Net increase (decrease) | (632,280 | ) | 522,726 | |||||
|
|
|
| |||||
Total increase (decrease) | (11,814 | ) | 232,656 | |||||
| Net Assets | ||||||||
Beginning of period | 21,253,030 | 21,020,374 | ||||||
|
|
|
| |||||
End of period (including undistributed net investment income of $49,326 and $48,954, respectively) | $ | 21,241,216 | $ | 21,253,030 | ||||
|
|
|
| |||||
See notes to financial statements.
| AB CREDIT LONG/SHORT PORTFOLIO • | 37 |
Statement of Changes in Net Assets
NOTES TO FINANCIAL STATEMENTS
October 31, 2016
NOTE A
Significant Accounting Policies
AB Bond Fund, Inc. (the “Company”) is registered under the Investment Company Act of 1940 as an open-end management investment company. The Company, which is a Maryland corporation, operates as a series company comprised of ten portfolios currently in operation. Each portfolio is considered to be a separate entity for financial reporting and tax purposes. This report relates only to the AB Credit Long/Short Portfolio (the “Portfolio”), a non-diversified portfolio. The Portfolio have authorized the issuance of Class A, Class B, Class C, Advisor Class, Class R, Class K, Class I, Class Z, Class 1 and Class 2 shares. Class B, Class R, Class K, Class I, Class Z, Class 1 and Class 2 shares are not currently offered. Class A shares are sold with a front-end sales charge of up to 4.25% for purchases not exceeding $1,000,000. With respect to purchases of $1,000,000 or more, Class A shares redeemed within one year of purchase may be subject to a contingent deferred sales charge of 1%. Class C shares are subject to a contingent deferred sales charge of 1% on redemptions made within the first year after purchase. Advisor Class shares are sold without any initial or contingent deferred sales charge and are not subject to ongoing distribution expenses. All ten classes of shares have identical voting, dividend, liquidation and other rights, except that the classes bear different distribution and transfer agency expenses. Each class has exclusive voting rights with respect to its distribution plan. The financial statements have been prepared in conformity with U.S. generally accepted accounting principles (“U.S. GAAP”) which require management to make certain estimates and assumptions that affect the reported amounts of assets and liabilities in the financial statements and amounts of income and expenses during the reporting period. Actual results could differ from those estimates. The Portfolio is an investment company under U.S. GAAP and follows the accounting and reporting guidance applicable to investment companies. The following is a summary of significant accounting policies followed by the Portfolio.
1. Security Valuation
Portfolio securities are valued at their current market value determined on the basis of market quotations or, if market quotations are not readily available or are deemed unreliable, at “fair value” as determined in accordance with procedures established by and under the general supervision of the Company’s Board of Directors (the “Board”).
In general, the market values of securities which are readily available and deemed reliable are determined as follows: securities listed on a national securities exchange (other than securities listed on the NASDAQ Stock Market, Inc. (“NASDAQ”)) or on a foreign securities exchange are valued at the last sale price at the close of the exchange or foreign securities
| 38 | • AB CREDIT LONG/SHORT PORTFOLIO |
Notes to Financial Statements
exchange. If there has been no sale on such day, the securities are valued at the last traded price from the previous day. Securities listed on more than one exchange are valued by reference to the principal exchange on which the securities are traded; securities listed only on NASDAQ are valued in accordance with the NASDAQ Official Closing Price; listed or over the counter (“OTC”) market put or call options are valued at the mid level between the current bid and ask prices. If either a current bid or current ask price is unavailable, AllianceBernstein L.P. (the “Adviser”) will have discretion to determine the best valuation (e.g. last trade price in the case of listed options); open futures are valued using the closing settlement price or, in the absence of such a price, the most recent quoted bid price. If there are no quotations available for the day of valuation, the last available closing settlement price is used; U.S. Government securities and any other debt instruments having 60 days or less remaining until maturity are generally valued at market by an independent pricing vendor, if a market price is available. If a market price is not available, the securities are valued at amortized cost. This methodology is commonly used for short term securities that have an original maturity of 60 days or less, as well as short term securities that had an original term to maturity that exceeded 60 days. In instances when amortized cost is utilized, the Valuation Committee (the “Committee”) must reasonably conclude that the utilization of amortized cost is approximately the same as the fair value of the security. Such factors the Committee will consider include, but are not limited to, an impairment of the creditworthiness of the issuer or material changes in interest rates. Fixed-income securities, including mortgage-backed and asset-backed securities, may be valued on the basis of prices provided by a pricing service or at a price obtained from one or more of the major broker-dealers. In cases where broker-dealer quotes are obtained, the Adviser may establish procedures whereby changes in market yields or spreads are used to adjust, on a daily basis, a recently obtained quoted price on a security. Swaps and other derivatives are valued daily, primarily using independent pricing services, independent pricing models using market inputs, as well as third party broker-dealers or counterparties. Open end mutual funds are valued at the closing net asset value per share, while exchange traded funds are valued at the closing market price per share.
Securities for which market quotations are not readily available (including restricted securities) or are deemed unreliable are valued at fair value as deemed appropriate by the Adviser. Factors considered in making this determination may include, but are not limited to, information obtained by contacting the issuer, analysts, analysis of the issuer’s financial statements or other available documents. In addition, the Portfolio may use fair value pricing for securities primarily traded in non-U.S. markets because most foreign markets close well before the Portfolio value it’s
| AB CREDIT LONG/SHORT PORTFOLIO • | 39 |
Notes to Financial Statements
securities at 4:00 p.m., Eastern Time. The earlier close of these foreign markets gives rise to the possibility that significant events, including broad market moves, may have occurred in the interim and may materially affect the value of those securities. To account for this, the Portfolio may frequently value many of its foreign equity securities using fair value prices based on third party vendor modeling tools to the extent available.
2. Fair Value Measurements
In accordance with U.S. GAAP regarding fair value measurements, fair value is defined as the price that the Portfolio would receive to sell an asset or pay to transfer a liability in an orderly transaction between market participants at the measurement date. U.S. GAAP establishes a framework for measuring fair value, and a three-level hierarchy for fair value measurements based upon the transparency of inputs to the valuation of an asset or liability (including those valued based on their market values as described in Note A.1 above). Inputs may be observable or unobservable and refer broadly to the assumptions that market participants would use in pricing the asset or liability. Observable inputs reflect the assumptions market participants would use in pricing the asset or liability based on market data obtained from sources independent of the Portfolio. Unobservable inputs reflect the Portfolio’s own assumptions about the assumptions that market participants would use in pricing the asset or liability based on the best information available in the circumstances. Each investment is assigned a level based upon the observability of the inputs which are significant to the overall valuation. The three-tier hierarchy of inputs is summarized below.
| • | Level 1—quoted prices in active markets for identical investments |
| • | Level 2—other significant observable inputs (including quoted prices for similar investments, interest rates, prepayment speeds, credit risk, etc.) |
| • | Level 3—significant unobservable inputs (including the Portfolio’s own assumptions in determining the fair value of investments) |
The fair value of debt instruments, such as bonds, and over-the-counter derivatives is generally based on market price quotations, recently executed market transactions (where observable) or industry recognized modeling techniques and are generally classified as Level 2. Pricing vendor inputs to Level 2 valuations may include quoted prices for similar investments in active markets, interest rate curves, coupon rates, currency rates, yield curves, option adjusted spreads, default rates, credit spreads and other unique security features in order to estimate the relevant cash flows which are then discounted to calculate fair values. If these inputs are unobservable and significant to the fair value, these investments will be classified as Level 3. In addition, non-agency rated investments are classified as Level 3.
| 40 | • AB CREDIT LONG/SHORT PORTFOLIO |
Notes to Financial Statements
Where readily available market prices or relevant bid prices are not available for certain equity investments, such investments may be valued based on similar publicly traded investments, movements in relevant indices since last available prices or based upon underlying company fundamentals and comparable company data (such as multiples to earnings or other multiples to equity). Where an investment is valued using an observable input, such as another publicly traded security, the investment will be classified as Level 2. If management determines that an adjustment is appropriate based on restrictions on resale, illiquidity or uncertainty, and such adjustment is a significant component of the valuation, the investment will be classified as Level 3. An investment will also be classified as Level 3 where management uses company fundamentals and other significant inputs to determine the valuation.
Options are valued using market-based inputs to models, broker or dealer quotations, or alternative pricing sources with reasonable levels of price transparency, where such inputs and models are available. Alternatively the values may be obtained through unobservable management determined inputs and/or management’s proprietary models. Where models are used, the selection of a particular model to value an option depends upon the contractual terms of, and specific risks inherent in, the option as well as the availability of pricing information in the market. Valuation models require a variety of inputs, including contractual terms, market prices, measures of volatility and correlations of such inputs. Exchange traded options generally will be classified as Level 2. For options that do not trade on exchange but trade in liquid markets, inputs can generally be verified and model selection does not involve significant management judgment. Options are classified within Level 2 on the fair value hierarchy when all of the significant inputs can be corroborated to market evidence. Otherwise such instruments are classified as Level 3.
The following table summarizes the valuation of the Portfolio’s investments by the above fair value hierarchy levels as of October 31, 2016:
Investments in Securities: | Level 1 | Level 2 | Level 3 | Total | ||||||||||||
Assets: |
| |||||||||||||||
Corporates – Non-Investment Grade | $ | – 0 | – | $ | 5,152,658 | $ | 11,069 | (a) | $ | 5,163,727 | ||||||
Corporates – Investment Grade | – 0 | – | 2,515,715 | – 0 | – | 2,515,715 | ||||||||||
Common Stocks | 563,156 | 32,387 | 2,355 | 597,898 | ||||||||||||
Investment Companies | 541,288 | – 0 | – | – 0 | – | 541,288 | ||||||||||
Emerging Markets – Corporate Bonds | – 0 | – | 485,000 | – 0 | – | 485,000 | ||||||||||
Governments – Sovereign Agencies | – 0 | – | 409,575 | – 0 | – | 409,575 | ||||||||||
Emerging Markets – Treasuries | – 0 | – | 314,602 | – 0 | – | 314,602 | ||||||||||
Emerging Markets – Sovereigns | – 0 | – | 225,450 | – 0 | – | 225,450 | ||||||||||
Collateralized Mortgage Obligations | – 0 | – | 224,589 | – 0 | – | 224,589 | ||||||||||
Quasi-Sovereigns | – 0 | – | 222,625 | – 0 | – | 222,625 | ||||||||||
Asset-Backed Securities | – 0 | – | – 0 | – | 212,888 | 212,888 | ||||||||||
Bank Loans | – 0 | – | 204,684 | 5,508 | 210,192 | |||||||||||
| AB CREDIT LONG/SHORT PORTFOLIO • | 41 |
Notes to Financial Statements
Investments in Securities: | Level 1 | Level 2 | Level 3 | Total | ||||||||||||
Governments – Treasuries | $ | – 0 | – | $ | 101,556 | $ | – 0 | – | $ | 101,556 | ||||||
Warrants | 26,259 | – 0 | – | 15,204 | 41,463 | |||||||||||
Preferred Stocks | – 0 | – | 39,044 | – 0 | – | 39,044 | ||||||||||
Options Purchased – Puts | – 0 | – | 24,271 | – 0 | – | 24,271 | ||||||||||
Short-Term Investments: | ||||||||||||||||
U.S. Treasury Bills | – 0 | – | 4,898,430 | – 0 | – | 4,898,430 | ||||||||||
Investment Companies | 4,594,500 | – 0 | – | – 0 | – | 4,594,500 | ||||||||||
Liabilities: | ||||||||||||||||
Corporates – Non-Investment Grade | – 0 | – | (11,986,472 | ) | – 0 | – | (11,986,472 | ) | ||||||||
Corporates – Investment Grade | – 0 | – | (3,386,885 | ) | – 0 | – | (3,386,885 | ) | ||||||||
Emerging Markets – Corporate Bonds | – 0 | – | (383,000 | ) | – 0 | – | (383,000 | ) | ||||||||
Governments – Sovereign Agencies | – 0 | – | (228,340 | ) | – 0 | – | (228,340 | ) | ||||||||
Emerging Markets – Sovereigns | – 0 | – | (185,600 | ) | – 0 | – | (185,600 | ) | ||||||||
Quasi-Sovereigns | – 0 | – | (150,000 | ) | – 0 | – | (150,000 | ) | ||||||||
|
|
|
|
|
|
|
| |||||||||
Total Investments in Securities | 5,725,203 | (1,469,711 | ) | 247,024 | 4,502,516 | |||||||||||
Other Financial Instruments(b): | ||||||||||||||||
Assets: | ||||||||||||||||
Futures | 83,526 | 2,213 | – 0 | – | 85,739 | (c) | ||||||||||
Forward Currency Exchange Contracts | – 0 | – | 44,106 | – 0 | – | 44,106 | ||||||||||
Centrally Cleared Credit Default Swaps | – 0 | – | 19,236 | – 0 | – | 19,236 | (c) | |||||||||
Credit Default Swaps | – 0 | – | 69,688 | – 0 | – | 69,688 | ||||||||||
Total Return Swaps | – 0 | – | 10,536 | – 0 | – | 10,536 | ||||||||||
Liabilities: | ||||||||||||||||
Futures | (799 | ) | – 0 | – | – 0 | – | (799 | )(c) | ||||||||
Forward Currency Exchange Contracts | – 0 | – | (54,947 | ) | – 0 | – | (54,947 | ) | ||||||||
Put Options Written | – 0 | – | (1,912 | ) | – 0 | – | (1,912 | ) | ||||||||
Centrally Cleared Credit Default Swaps | – 0 | – | (25,205 | ) | – 0 | – | (25,205 | )(c) | ||||||||
Centrally Cleared Interest Rate Swaps | – 0 | – | (5,348 | ) | – 0 | – | (5,348 | )(c) | ||||||||
Credit Default Swaps | – 0 | – | (175,497 | ) | – 0 | – | (175,497 | ) | ||||||||
Total Return Swaps | – 0 | – | (2,441 | ) | – 0 | – | (2,441 | ) | ||||||||
|
|
|
|
|
|
|
| |||||||||
Total(d) | $ | 5,807,930 | $ | (1,589,282 | ) | $ | 247,024 | $ | 4,465,672 | |||||||
|
|
|
|
|
|
|
| |||||||||
| (a) | The Portfolio held securities with zero market value at period end. |
| (b) | Other financial instruments are derivative instruments, such as futures, forwards and swaps, which are valued at the unrealized appreciation/depreciation on the instrument. Other financial instruments may also include options written which are valued at market value. |
| (c) | Only variation margin receivable/payable at period end is reported within the statement of assets and liabilities. This amount reflects cumulative unrealized appreciation/(depreciation) of exchange-traded derivatives as reported in the portfolio of investments. |
| (d) | There were de minimis transfers under 1% of net assets between Level 1 and Level 2 during the reporting period. |
The Portfolio recognizes all transfers between levels of the fair value hierarchy assuming the financial instruments were transferred at the beginning of the reporting period.
| 42 | • AB CREDIT LONG/SHORT PORTFOLIO |
Notes to Financial Statements
The following is a reconciliation of investments in which significant unobservable inputs (Level 3) were used in determining fair value.
| Corporates - Non- Investment Grade(a) | Common Stocks | Collateralized Mortgage Obligations | ||||||||||
Balance as of 10/31/15 | $ | 120,900 | $ | 3,675 | $ | 358,384 | ||||||
Accrued discounts/(premiums) | (370 | ) | – 0 | – | 4 | |||||||
Realized gain (loss) | 10,265 | – 0 | – | 1,800 | ||||||||
Change in unrealized appreciation/depreciation | 2,327 | (1,320 | ) | (611 | ) | |||||||
Purchases/Payups | 9,047 | – 0 | – | – 0 | – | |||||||
Sales/Paydowns | (131,100 | ) | – 0 | – | (68,962 | ) | ||||||
Transfers in to Level 3 | – 0 | – | – 0 | – | – 0 | – | ||||||
Transfers out of Level 3 | – 0 | – | – 0 | – | (290,615 | ) | ||||||
|
|
|
|
|
| |||||||
Balance as of 10/31/16 | $ | 11,069 | $ | 2,355 | $ | – 0 | – | |||||
|
|
|
|
|
| |||||||
Net change in unrealized appreciation/depreciation from investments held as of 10/31/16(b) | $ | 2,022 | $ | (1,320 | ) | $ | – 0 | – | ||||
|
|
|
|
|
| |||||||
| Asset-Backed Securities | Bank Loans | Warrants | ||||||||||
Balance as of 10/31/15 | $ | – 0 | – | $ | 133,325 | $ | 13,856 | |||||
Accrued discounts/(premiums) | – 0 | – | 597 | – 0 | – | |||||||
Realized gain (loss) | – 0 | – | 122 | – 0 | – | |||||||
Change in unrealized appreciation/depreciation | 2,888 | (33,596 | ) | (7,941 | ) | |||||||
Purchases/Payups | 210,000 | 4,810 | 9,289 | |||||||||
Sales/Paydowns | – 0 | – | (99,750 | ) | – 0 | – | ||||||
Transfers in to Level 3 | – 0 | – | – 0 | – | – 0 | – | ||||||
Transfers out of Level 3 | – 0 | – | – 0 | – | – 0 | – | ||||||
|
|
|
|
|
| |||||||
Balance as of 10/31/16 | $ | 212,888 | $ | 5,508 | $ | 15,204 | ||||||
|
|
|
|
|
| |||||||
Net change in unrealized appreciation/depreciation from investments held as of 10/31/16(b) | $ | 2,888 | $ | (33,427 | ) | $ | (7,941 | ) | ||||
|
|
|
|
|
| |||||||
| Total | ||||||||||||
Balance as of 10/31/15 | $ | 630,140 | ||||||||||
Accrued discounts/(premiums) | 231 | |||||||||||
Realized gain (loss) | 12,187 | |||||||||||
Change in unrealized appreciation/depreciation | (38,253 | ) | ||||||||||
Purchases/Payups | 233,146 | |||||||||||
Sales/Paydowns | (299,812 | ) | ||||||||||
Transfers in to Level 3 | – 0 | – | ||||||||||
Transfers out of Level 3 | (290,615 | )(c) | ||||||||||
|
| |||||||||||
Balance as of 10/31/16 | $ | 247,024 | ||||||||||
|
| |||||||||||
Net change in unrealized appreciation/depreciation from investments held as of 10/31/16(b) | $ | (37,778 | ) | |||||||||
|
| |||||||||||
| (a) | The Portfolio held securities with zero market value at period end. |
| (b) | The unrealized appreciation/depreciation is included in net change in unrealized appreciation/depreciation on investments and other financial instruments in the accompanying statement of operations. |
| (c) | An amount of $290,615 was transferred out of Level 3 into Level 2 as improved transparency of price inputs has increased the observability of such inputs during the reporting period. |
| AB CREDIT LONG/SHORT PORTFOLIO • | 43 |
Notes to Financial Statements
The following presents information about significant unobservable inputs related to the Portfolio’s Level 3 investments at October 31, 2016. Securities priced i) by third party vendors, or ii) using prior transaction prices, which approximates fair value, are excluded from the following table.
Quantitative Information about Level 3 Fair Value Measurements
| Fair Value at 10/31/16 | Valuation Technique | Unobservable Input | Input | |||||||
Common Stocks | $ | 2,355 | Market Approach | EBITDA* Projection EBITDA* Multiples | $94.0MM 8.5X | |||||
Bank Loans | $ | 5,508 | Recovery Analysis | Liquidation / New Financing Probability And Assigned Discounted Market Values | 85% Probability of Liquidation, Using a Value of $10 15% Probability of New Financing, Using a Value of $30 | |||||
Warrants | $ | 7,344 | Option Price Modeling | Exercise Price Expiration Date EV Volatility% | $6.64 June, 2019 50% | |||||
| * | Earnings before Interest, Taxes, Depreciation and Amortization. |
Generally, a change in the assumptions used in any input in isolation may be accompanied by a change in another input. Significant changes in any of the unobservable inputs may significantly impact the fair value measurement. Significant increases (decreases) in EBITDA Projection, Liquidation/New Financing, Probability, Assigned Discounted Market Values and Exercise Price in isolation would be expected to result in a significantly higher (lower) fair value measurement. A significant increase (decrease) in EV Volatility % in isolation would be expected to result in a significant lower (higher) fair value measurement.
The Adviser established the Committee to oversee the pricing and valuation of all securities held in the Portfolio. The Committee operates under pricing and valuation policies and procedures established by the Adviser and approved by the Board, including pricing policies which set forth the mechanisms and processes to be employed on a daily basis to implement these policies and procedures. In particular, the pricing policies describe how to determine market quotations for securities and other instruments. The Committee’s responsibilities include: 1) fair value and liquidity determinations (and oversight of any third parties to whom any responsibility for fair value and liquidity determinations is delegated), and 2) regular monitoring of the Adviser’s pricing and valuation policies and procedures and modification or enhancement of these policies and procedures (or recommendation of the modification of these policies and procedures) as the Committee believes appropriate.
| 44 | • AB CREDIT LONG/SHORT PORTFOLIO |
Notes to Financial Statements
The Committee is also responsible for monitoring the implementation of the pricing policies by the Adviser’s Pricing Group (the “Pricing Group”) and a third party which performs certain pricing functions in accordance with the pricing policies. The Pricing Group is responsible for the oversight of the third party on a day-to-day basis. The Committee and the Pricing Group perform a series of activities to provide reasonable assurance of the accuracy of prices including: 1) periodic vendor due diligence meetings, review of methodologies, new developments and processes at vendors, 2) daily comparison of security valuation versus prior day for all securities that exceeded established thresholds, and 3) daily review of unpriced, stale, and variance reports with exceptions reviewed by senior management and the Committee.
In addition, several processes outside of the pricing process are used to monitor valuation issues including: 1) performance and performance attribution reports are monitored for anomalous impacts based upon benchmark performance, and 2) portfolio managers review all portfolios for performance and analytics (which are generated using the Adviser’s prices).
3. Currency Translation
Assets and liabilities denominated in foreign currencies and commitments under forward currency exchange contracts are translated into U.S. dollars at the mean of the quoted bid and ask prices of such currencies against the U.S. dollar. Purchases and sales of portfolio securities are translated into U.S. dollars at the rates of exchange prevailing when such securities were acquired or sold. Income and expenses are translated into U.S. dollars at rates of exchange prevailing when accrued.
The Portfolio does not isolate that portion of the results of operations resulting from changes in foreign exchange rates on investments from the fluctuations arising from changes in market prices of securities held. Such fluctuations are included with the net realized and unrealized gain or loss from investments.
Net realized gain or loss on foreign currency transactions represents foreign exchange gains and losses from sales and maturities of foreign fixed income investments, foreign currency exchange contracts, holding of foreign currencies, currency gains or losses realized between the trade and settlement dates on foreign investment transactions, and the difference between the amounts of dividends, interest and foreign withholding taxes recorded on the Portfolio’s books and the U.S. dollar equivalent amounts actually received or paid. Net unrealized currency gains and losses from valuing foreign currency denominated assets and liabilities at period end exchange rates are reflected as a component of net unrealized appreciation or depreciation of foreign currency denominated assets and liabilities.
| AB CREDIT LONG/SHORT PORTFOLIO • | 45 |
Notes to Financial Statements
4. Taxes
It is the Portfolio’s policy to meet the requirements of the Internal Revenue Code applicable to regulated investment companies and to distribute all of its investment company taxable income and net realized gains, if any, to shareholders. Therefore, no provisions for federal income or excise taxes are required. The Portfolio may be subject to taxes imposed by countries in which it invests. Such taxes are generally based on income and/or capital gains earned or repatriated. Taxes are accrued and applied to net investment income, net realized gains and net unrealized appreciation/depreciation as such income and/or gains are earned.
In accordance with U.S. GAAP requirements regarding accounting for uncertainties in income taxes, management has analyzed the Portfolio’s tax positions taken or expected to be taken on federal and state income tax returns for all open tax years (the current and the prior tax years) and has concluded that no provision for income tax is required in the Portfolio’s financial statements.
5. Investment Income and Investment Transactions
Dividend income (or dividend expense) is recorded on the ex-dividend date or as soon as the Portfolio is informed of the dividend. Interest income (or interest expense) is accrued daily. Investment transactions are accounted for on the date the securities are purchased or sold. Investment gains or losses are determined on the identified cost basis. The Portfolio amortizes premiums and accretes discounts as adjustments to interest income.
6. Class Allocations
All income earned and expenses incurred by the Portfolio are borne on a pro-rata basis by each outstanding class of shares, based on the proportionate interest in the Portfolio represented by the net assets of such class, except for class specific expenses which are allocated to the respective class. Expenses of the Company are charged proportionately to each portfolio or based on other appropriate methods. Realized and unrealized gains and losses are allocated among the various share classes based on respective net assets.
7. Dividends and Distributions
Dividends and distributions to shareholders, if any, are recorded on the ex-dividend date. Income dividends and capital gains distributions are determined in accordance with federal tax regulations and may differ from those determined in accordance with U.S. GAAP. To the extent these differences are permanent, such amounts are reclassified within the capital accounts based on their federal tax basis treatment; temporary differences do not require such reclassification.
| 46 | • AB CREDIT LONG/SHORT PORTFOLIO |
Notes to Financial Statements
NOTE B
Advisory Fee and Other Transactions with Affiliates
Under the terms of the investment advisory agreement, the Portfolio pays the Adviser an advisory fee at an annual rate of .90% of the Portfolio’s average daily net assets. The fee is accrued daily and paid monthly. The Adviser has agreed to waive its fees and bear certain expenses to the extent necessary to limit total operating expenses (excluding expenses associated with securities sold short, acquired fund fees and expenses other than the advisory fees of any AB Mutual Funds in which the Fund may invest, interest expense, taxes, extraordinary expenses, and brokerage commissions and other transaction costs), on an annual basis (the “Expense Caps”) to 1.35%, 2.10%, and 1.10% of daily average net assets for Class A, Class C, and Advisor Class shares, respectively. Any fees waived and expenses borne by the Adviser through October 31, 2014 are subject to repayment by the Portfolio until October 31, 2017; any fees waived and expense borne by the Adviser from November 1, 2014 to May 6, 2015 are subject to repayment by the Portfolio until October 31, 2018; such waivers that are subject to repayment amounted to $252,520 and $212,257, respectively. In any case, no repayment will be made that would cause the Portfolio’s total annual operating expenses to exceed the net fee percentage set forth above. The Expense Caps may not be terminated by the Adviser before January 31, 2017. For the year ended October 31, 2016, such reimbursements/waivers amounted to $417,052.
During the year ended October 31, 2015, the Adviser reimbursed the Portfolio $1,338 for trading losses incurred due to a trade entry error.
Pursuant to the investment advisory agreement, the Portfolio may reimburse the Adviser for certain legal and accounting services provided to the Portfolio by the Adviser. For the year ended October 31, 2016, the Adviser voluntarily agreed to waive such fees amounting to $55,954.
The Portfolio compensates AllianceBernstein Investor Services, Inc. (“ABIS”), a wholly-owned subsidiary of the Adviser, under a Transfer Agency Agreement for providing personnel and facilities to perform transfer agency services for the Portfolio. ABIS may make payments to intermediaries that provide omnibus account services, sub-accounting services and/or networking services. Such compensation retained by ABIS amounted to $18,070 for the year ended October 31, 2016.
AllianceBernstein Investments, Inc. (the “Distributor”), a wholly-owned subsidiary of the Adviser, serves as the distributor of the Portfolio’s shares. The Distributor has advised the Portfolio that it has retained front-end sales charges of $11 from the sale of Class A shares and received $0 in contingent deferred sales charges imposed upon redemptions by shareholders of Class C shares for the year ended October 31, 2016.
| AB CREDIT LONG/SHORT PORTFOLIO • | 47 |
Notes to Financial Statements
The AB Fixed-Income Shares, Inc.—Government STIF Portfolio (the “Government STIF Portfolio”), prior to June 1, 2016, was offered as a cash management option to mutual funds and other institutional accounts of the Adviser, and was not available for direct purchase by members of the public. Prior to June 1, 2016, the Government STIF Portfolio paid no advisory fees but did bear its own expenses. As of June 1, 2016, the Government STIF Portfolio, which was renamed “AB Government Money Market Portfolio” (the “Government Money Market Portfolio”), has a contractual advisory fee rate of .20% and continues to bear its own expenses. In connection with the investment by the Portfolio in the Government Money Market Portfolio, the Adviser has agreed to waive its advisory fee from the Portfolio in an amount equal to the Portfolio’s share of the advisory fees of Government Money Market Portfolio, as borne indirectly by the Portfolio as an acquired fund fee and expense. For the year ended October 31, 2016, such waiver amounted to $2,610. A summary of the Portfolio’s transactions in shares of the Government Money Market Portfolio for the year ended October 31, 2016 is as follows:
Market Value 10/31/15 (000) | Purchases at Cost (000) | Sales Proceeds (000) | Market Value 10/31/16 (000) | Dividend Income (000) | ||||||||||||
| $ 2,653 | $ | 27,799 | $ | 25,857 | $ | 4,595 | $ | 9 | ||||||||
Brokerage commissions paid on investment transactions for the year ended October 31, 2016 amounted to $8,320, of which $0 and $0, respectively, was paid to Sanford C. Bernstein & Co. LLC and Sanford C. Bernstein Limited, affiliates of the Adviser.
NOTE C
Distribution Services Agreement
The Portfolio has adopted a Distribution Services Agreement (the “Agreement”) pursuant to Rule 12b-1 under the Investment Company Act of 1940. Under the Agreement, the Portfolio pays distribution and servicing fees to the Distributor at an annual rate of up to .25% of the Portfolio’s average daily net assets attributable to Class A shares, 1% of the Portfolio’s average daily net assets attributable to Class C shares. There are no distribution and servicing fees on the Advisor Class shares. The fees are accrued daily and paid monthly. The Agreement provides that the Distributor will use such payments in their entirety for distribution assistance and promotional activities. Since the commencement of the Portfolio’s operations, the Distributor has incurred expenses in excess of the distribution costs reimbursed by the Portfolio in the amount of $609 for Class C shares. While such costs may be recovered from the Portfolio in future periods so long as the Agreement is in effect, the rate of the distribution and servicing fees payable under the Agreement may not be increased without a shareholder vote. In accordance with the Agreement, there is no provision for recovery of unreimbursed distribution costs
| 48 | • AB CREDIT LONG/SHORT PORTFOLIO |
Notes to Financial Statements
incurred by the Distributor beyond the current fiscal year for Class A shares. The Agreement also provides that the Adviser may use its own resources to finance the distribution of the Portfolio’s shares.
NOTE D
Investment Transactions
Purchases and sales of investment securities (excluding short-term investments) for the year ended October 31, 2016, were as follows:
Purchases | Sales | Securities Sold Short | Covers on Securities Sold Short | |||||||||
| $ 27,339,880 | $ | 41,329,926 | $ | 35,245,108 | $ | 26,050,225 | ||||||
During the year ended October 31, 2016, there were no purchases or sales of U.S. Government Securities.
The cost of investments for federal income tax purposes, gross unrealized appreciation and unrealized depreciation are as follows:
| Gross Unrealized | Net Unrealized Appreciation on Investments | Net Unrealized (Depreciation) on Securities Sold Short | Net Unrealized Appreciation | |||||||||||||||||||
| Cost of Investments | Appreciation on Investments | Depreciation on Investments | ||||||||||||||||||||
| $ | 20,565,864 | $ | 824,647 | $ | (567,698 | ) | $ | 256,949 | $ | (27,188 | )(a) | $ | 229,761 | |||||||||
| (a) | Gross unrealized appreciation was $413,460 and gross unrealized depreciation ($440,648), resulting in net unrealized depreciation of ($27,188). |
1. Derivative Financial Instruments
The Portfolio may use derivatives in an effort to earn income and enhance returns, to replace more traditional direct investments, to obtain exposure to otherwise inaccessible markets (collectively, “investment purposes”), or to hedge or adjust the risk profile of its portfolio.
The principal types of derivatives utilized by the Portfolio, as well as the methods in which they may be used are:
| • | Futures |
The Portfolio may buy or sell futures for investment purposes or for the purpose of hedging its portfolio against adverse effects of potential movements in the market. The Portfolio bears the market risk that arises from changes in the value of these instruments and the imperfect correlation between movements in the price of the futures and movements in the price of the assets, reference rates or indices which they are designed to track. Among other things, the Portfolio may purchase or sell futures for foreign currencies or options thereon for non-hedging purposes as a means of making direct investment in foreign currencies, as described below under “Currency Transactions”.
| AB CREDIT LONG/SHORT PORTFOLIO • | 49 |
Notes to Financial Statements
At the time the Portfolio enters into futures, the Portfolio deposits and maintains as collateral an initial margin with the broker, as required by the exchange on which the transaction is effected. Such amount is shown as cash collateral due from broker on the statement of assets and liabilities. Pursuant to the contract, the Portfolio agrees to receive from or pay to the broker an amount of cash equal to the daily fluctuation in the value of the contract. Such receipts or payments are known as variation margin and are recorded by the Portfolio as unrealized gains or losses. Risks may arise from the potential inability of a counterparty to meet the terms of the contract. The credit/counterparty risk for exchange-traded futures is generally less than privately negotiated futures, since the clearinghouse, which is the issuer or counterparty to each exchange-traded future, has robust risk mitigation standards, including the requirement to provide initial and variation margin. When the contract is closed, the Portfolio records a realized gain or loss equal to the difference between the value of the contract at the time it was opened and the time it was closed.
Use of long futures subjects the Portfolio to risk of loss in excess of the amounts shown on the statement of assets and liabilities, up to the notional value of the futures. Use of short futures subjects the Portfolio to unlimited risk of loss. Under some circumstances, futures exchanges may establish daily limits on the amount that the price of futures can vary from the previous day’s settlement price, which could effectively prevent liquidation of unfavorable positions.
During the year ended October 31, 2016, the Portfolio held futures for hedging and non-hedging purposes.
| • | Forward Currency Exchange Contracts |
The Portfolio may enter into forward currency exchange contracts in order to hedge its exposure to changes in foreign currency exchange rates on its foreign portfolio holdings, to hedge certain firm purchase and sale commitments denominated in foreign currencies and for non-hedging purposes as a means of making direct investments in foreign currencies, as described below under “Currency Transactions”.
A forward currency exchange contract is a commitment to purchase or sell a foreign currency at a future date at a negotiated forward rate. The gain or loss arising from the difference between the original contract and the closing of such contract would be included in net realized gain or loss on foreign currency transactions. Fluctuations in the value of open forward currency exchange contracts are recorded for financial reporting purposes as unrealized appreciation and/or depreciation by the Portfolio. Risks
| 50 | • AB CREDIT LONG/SHORT PORTFOLIO |
Notes to Financial Statements
may arise from the potential inability of a counterparty to meet the terms of a contract and from unanticipated movements in the value of a foreign currency relative to the U.S. dollar.
During the year ended October 31, 2016, the Portfolio held forward currency exchange contracts for hedging and non-hedging purposes.
| • | Option Transactions |
For hedging and investment purposes, the Portfolio may purchase and write (sell) put and call options on U.S. and foreign securities and foreign currencies that are traded on U.S. and foreign securities exchanges and over-the-counter markets. Among other things, the Portfolio may also use options transactions for non-hedging purposes as a means of making direct investments in foreign currencies, as described below under “Currency Transactions” and may use options strategies involving the purchase and/or writing of various combinations of call and/or put options, for hedging and investment purposes.
The risk associated with purchasing an option is that the Portfolio pays a premium whether or not the option is exercised. Additionally, the Portfolio bears the risk of loss of the premium and change in market value should the counterparty not perform under the contract. Put and call options purchased are accounted for in the same manner as portfolio securities. The cost of securities acquired through the exercise of call options is increased by premiums paid. The proceeds from securities sold through the exercise of put options are decreased by the premiums paid.
When the Portfolio writes an option, the premium received by the Portfolio is recorded as a liability and is subsequently adjusted to the current market value of the option written. Premiums received from written options which expire unexercised are recorded by the Portfolio on the expiration date as realized gains from options written. The difference between the premium received and the amount paid on effecting a closing purchase transaction, including brokerage commissions, is also treated as a realized gain, or if the premium received is less than the amount paid for the closing purchase transaction, as a realized loss. If a call option is exercised, the premium received is added to the proceeds from the sale of the underlying security or currency in determining whether the Portfolio has realized a gain or loss. If a put option is exercised, the premium received reduces the cost basis of the security or currency purchased by the Portfolio. In writing an option, the Portfolio bears the market risk of an unfavorable change in the price of the security or currency underlying the written option. Exercise of an
| AB CREDIT LONG/SHORT PORTFOLIO • | 51 |
Notes to Financial Statements
option written by the Portfolio could result in the Portfolio selling or buying a security or currency at a price different from the current market value.
At October 31, 2016, the Portfolio had maximum payments for written put options amounting to $744,800. In certain circumstances maximum payout amounts may be partially offset by recovery values of the respective referenced assets and upfront premiums received upon entering into the contract.
The Portfolio may also invest in options on swap agreements, also called “swaptions”. A swaption is an option that gives the buyer the right, but not the obligation, to enter into a swap on a future date in exchange for paying a market-based “premium”. A receiver swaption gives the owner the right to receive the total return of a specified asset, reference rate, or index. A payer swaption gives the owner the right to pay the total return on a specified asset, reference rate, or index. Swaptions also include options that allow an existing swap to be terminated or extended by one of the counterparties.
During the year ended October 31, 2016, the Portfolio held purchased options for hedging and non-hedging purposes. During the year ended October 31, 2016, the Portfolio held written options for hedging and non-hedging purposes.
During the year ended October 31, 2016, the Portfolio held written swaptions for hedging and non-hedging purposes.
For the year ended October 31, 2016, the Portfolio had the following transactions in written options:
| Number of Contracts | Premiums Received | |||||||
Options written outstanding as of 10/31/15 | 212 | $ | 43,821 | |||||
Options written | 1,286 | 67,294 | ||||||
Options assigned | (17 | ) | (4,557 | ) | ||||
Options expired | (1,140 | ) | (88,003 | ) | ||||
Options bought back | (301 | ) | (16,029 | ) | ||||
Options exercised | – 0 | – | – 0 | – | ||||
|
|
|
| |||||
Options written outstanding as of 10/31/16 | 40 | $ | 2,526 | |||||
|
|
|
| |||||
| Notional Amount | Premiums Received | |||||||
Swaptions written outstanding as of 10/31/15 | $ | 1,670,000 | $ | 1,197 | ||||
Swaptions written | 8,845,000 | 26,235 | ||||||
Swaptions expired | (6,815,000 | ) | (9,916 | ) | ||||
Swaptions bought back | (3,700,000 | ) | (17,516 | ) | ||||
Swaptions exercised | – 0 | – | – 0 | – | ||||
|
|
|
| |||||
Swaptions written outstanding as of 10/31/16 | $ | – 0 | – | $ | – 0 | – | ||
|
|
|
| |||||
| 52 | • AB CREDIT LONG/SHORT PORTFOLIO |
Notes to Financial Statements
| • | Swaps |
The Portfolio may enter into swaps to hedge its exposure to interest rates, credit risk, or currencies. The Portfolio may also enter into swaps for non-hedging purposes as a means of gaining market exposures, including by making direct investments in foreign currencies, as described below under “Currency Transactions” or in order to take a “long” or “short” position with respect to an underlying referenced asset described below under “Total Return Swaps”. A swap is an agreement that obligates two parties to exchange a series of cash flows at specified intervals based upon or calculated by reference to changes in specified prices or rates for a specified amount of an underlying asset. The payment flows are usually netted against each other, with the difference being paid by one party to the other. In addition, collateral may be pledged or received by the Portfolio in accordance with the terms of the respective swaps to provide value and recourse to the Portfolio or its counterparties in the event of default, bankruptcy or insolvency by one of the parties to the swap.
Risks may arise as a result of the failure of the counterparty to the swap to comply with the terms of the swap. The loss incurred by the failure of a counterparty is generally limited to the net interim payment to be received by the Portfolio, and/or the termination value at the end of the contract. Therefore, the Portfolio considers the creditworthiness of each counterparty to a swap in evaluating potential counterparty risk. This risk is mitigated by having a netting arrangement between the Portfolio and the counterparty and by the posting of collateral by the counterparty to the Portfolio to cover the Portfolio’s exposure to the counterparty. Additionally, risks may arise from unanticipated movements in interest rates or in the value of the underlying securities. The Portfolio accrues for the interim payments on swaps on a daily basis, with the net amount recorded within unrealized appreciation/depreciation of swaps on the statement of assets and liabilities, where applicable. Once the interim payments are settled in cash, the net amount is recorded as realized gain/(loss) on swaps on the statement of operations, in addition to any realized gain/(loss) recorded upon the termination of swaps. Upfront premiums paid or received are recognized as cost or proceeds on the statement of assets and liabilities and are amortized on a straight line basis over the life of the contract. Amortized upfront premiums are included in net realized gain/(loss) from swaps on the statement of operations. Fluctuations in the value of swaps are recorded as a component of net change in unrealized appreciation/depreciation of swaps on the statement of operations.
| AB CREDIT LONG/SHORT PORTFOLIO • | 53 |
Notes to Financial Statements
Certain standardized swaps, including certain interest rate swaps and credit default swaps, are (or soon will be) subject to mandatory central clearing. Cleared swaps are transacted through futures commission merchants (“FCMs”) that are members of central clearinghouses, with the clearinghouse serving as central counterparty, similar to transactions in futures contracts. Centralized clearing will be required for additional categories of swaps on a phased-in basis based on requirements published by the Securities and Exchange Commission and Commodity Futures Trading Commission.
At the time the Portfolio enters into a centrally cleared swap, the Portfolio deposits and maintains as collateral an initial margin with the broker, as required by the clearinghouse on which the transaction is effected. Such amount is shown as cash collateral due from broker on the statement of assets and liabilities. Pursuant to the contract, the Portfolio agrees to receive from or pay to the broker an amount of cash equal to the daily fluctuation in the value of the contract. Such receipts or payments are known as variation margin and are recorded by the Portfolio as unrealized gains or losses. Risks may arise from the potential inability of a counterparty to meet the terms of the contract. The credit/counterparty risk for centrally cleared swaps is generally less than non-centrally cleared swaps, since the clearinghouse, which is the issuer or counterparty to each centrally cleared swap, has robust risk mitigation standards, including the requirement to provide initial and variation margin. When the contract is closed, the Portfolio records a realized gain or loss equal to the difference between the value of the contract at the time it was opened and the time it was closed.
Interest Rate Swaps:
The Portfolio is subject to interest rate risk exposure in the normal course of pursuing its investment objectives. Because the Portfolio holds fixed rate bonds, the value of these bonds may decrease if interest rates rise. To help hedge against this risk and to maintain its ability to generate income at prevailing market rates, the Portfolio may enter into interest rate swaps. Interest rate swaps are agreements between two parties to exchange cash flows based on a notional amount. The Portfolio may elect to pay a fixed rate and receive a floating rate, or, receive a fixed rate and pay a floating rate on a notional amount.
In addition, the Portfolio may also enter into interest rate swap transactions to preserve a return or spread on a particular investment or portion of its portfolio, or protecting against an
| 54 | • AB CREDIT LONG/SHORT PORTFOLIO |
Notes to Financial Statements
increase in the price of securities the Portfolio anticipates purchasing at a later date. Interest rate swaps involve the exchange by a Portfolio with another party of their respective commitments to pay or receive interest (e.g., an exchange of floating rate payments for fixed rate payments) computed based on a contractually-based principal (or “notional”) amount. Interest rate swaps are entered into on a net basis (i.e., the two payment streams are netted out, with the Portfolio receiving or paying, as the case may be, only the net amount of the two payments).
During the year ended October 31, 2016, the Portfolio held interest rate swaps for hedging purposes.
Credit Default Swaps:
The Portfolio may enter into credit default swaps, including to manage its exposure to the market or certain sectors of the market, to reduce its risk exposure to defaults by corporate and sovereign issuers held by the Portfolio, or to create exposure to corporate or sovereign issuers to which it is not otherwise exposed. The Portfolio may purchase credit protection (“Buy Contract”) or provide credit protection (“Sale Contract”) on the referenced obligation of the credit default swap. During the term of the swap, the Portfolio receives/(pays) fixed payments from/(to) the respective counterparty, calculated at the agreed upon rate applied to the notional amount. If the Portfolio is a buyer/(seller) of protection and a credit event occurs, as defined under the terms of the swap, the Portfolio will either (i) receive from the seller/(pay to the buyer) of protection an amount equal to the notional amount of the swap (the “Maximum Payout Amount”) and deliver/(take delivery of) the referenced obligation or (ii) receive/(pay) a net settlement amount in the form of cash or securities equal to the notional amount of the swap less the recovery value of the referenced obligation.
In certain circumstances Maximum Payout Amounts may be partially offset by recovery values of the respective referenced obligations, upfront premium received upon entering into the agreement, or net amounts received from settlement of buy protection credit default swaps entered into by the Portfolio for the same reference obligation with the same counterparty. As of October 31, 2016, the Portfolio had Buy Contracts outstanding with respect to the same referenced obligation and same counterparty for its Sales Contracts which may partially offset the Maximum Payout Amount in the amount of $2,813,700.
Credit default swaps may involve greater risks than if a Portfolio had invested in the referenced obligation directly. Credit default
| AB CREDIT LONG/SHORT PORTFOLIO • | 55 |
Notes to Financial Statements
swaps are subject to general market risk, liquidity risk, counterparty risk and credit risk. If the Portfolio is a buyer of protection and no credit event occurs, it will lose the payments it made to its counterparty. If the Portfolio is a seller of protection and a credit event occurs, the value of the referenced obligation received by the Portfolio coupled with the periodic payments previously received, may be less than the Maximum Payout Amount it pays to the buyer, resulting in a net loss to the Portfolio.
Implied credit spreads over U.S. Treasuries of comparable maturity utilized in determining the market value of credit default swaps on issuers as of period end are disclosed in the portfolio of investments. The implied spreads serve as an indicator of the current status of the payment/performance risk and typically reflect the likelihood of default by the issuer of the referenced obligation. The implied credit spread of a particular reference obligation also reflects the cost of buying/selling protection and may reflect upfront payments required to be made to enter into the agreement. Widening credit spreads typically represent a deterioration of the referenced obligation’s credit soundness and greater likelihood of default or other credit event occurring as defined under the terms of the agreement. A credit spread identified as “Defaulted” indicates a credit event has occurred for the referenced obligation.
During the year ended October 31, 2016, the Portfolio held credit default swaps for hedging and non-hedging purposes.
Total Return Swaps:
The Portfolio may enter into total return swaps in order take a “long” or “short” position with respect to an underlying referenced asset. The Portfolio is subject to market price volatility of the underlying referenced asset. A total return swap involves commitments to pay interest in exchange for a market linked return based on a notional amount. To the extent that the total return of the security, group of securities or index underlying the transaction exceeds or falls short of the offsetting interest obligation, the Portfolio will receive a payment from or make a payment to the counterparty.
During the year ended October 31, 2016, the Portfolio held total return swaps for hedging and non-hedging purposes.
The Portfolio typically enters into International Swaps and Derivatives Association, Inc. Master Agreements (“ISDA Master Agreement”) or similar master agreements (collectively, “Master Agreements”) with its derivative contract counterparties in order to, among other things,
| 56 | • AB CREDIT LONG/SHORT PORTFOLIO |
Notes to Financial Statements
reduce its credit risk to counterparties. ISDA Master Agreements include provisions for general obligations, representations, collateral and events of default or termination. Under an ISDA Master Agreement, the Portfolio typically may offset with the counterparty certain derivative financial instrument’s payables and/or receivables with collateral held and/or posted and create one single net payment (close-out netting) in the event of default or termination.
Various Master Agreements govern the terms of certain transactions with counterparties, including transactions such as derivative transactions, repurchase and reverse repurchase agreements. These Master Agreements typically attempt to reduce the counterparty risk associated with such transactions by specifying credit protection mechanisms and providing standardization that improves legal certainty. Cross-termination provisions under Master Agreements typically provide that a default in connection with one transaction between the Portfolio and a counterparty gives the non-defaulting party the right to terminate any other transactions in place with the defaulting party to create one single net payment due to/due from the defaulting party. In the event of a default by a Master Agreements counterparty, the return of collateral with market value in excess of the Portfolio’s net liability, held by the defaulting party, may be delayed or denied.
The Portfolio’s Master Agreements may contain provisions for early termination of OTC derivative transactions in the event the net assets of the Portfolio decline below specific levels (“net asset contingent features”). If these levels are triggered, the Portfolio’s counterparty has the right to terminate such transaction and require the Portfolio to pay or receive a settlement amount in connection with the terminated transaction. For additional details, please refer to netting arrangements by counterparty tables below.
During the year ended October 31, 2016, the Portfolio had entered into the following derivatives:
Asset Derivatives | Liability Derivatives | |||||||||||
Derivative Type | Statement of | Fair Value | Statement of | Fair Value | ||||||||
Interest rate |
Receivable/Payable for variation margin on exchange-traded derivatives | $ | 80,287 | * |
Receivable/Payable for variation margin on exchange-traded derivatives | $ | 6,147 | * | ||||
Credit contracts | Receivable/Payable for variation margin on exchange-traded derivatives | 19,236 | * | Receivable/Payable for variation margin on exchange-traded derivatives | 25,205 | * | ||||||
| AB CREDIT LONG/SHORT PORTFOLIO • | 57 |
Notes to Financial Statements
Asset Derivatives | Liability Derivatives | |||||||||||
Derivative Type | Statement of | Fair Value | Statement of | Fair Value | ||||||||
Equity contracts | Receivable/Payable for variation margin on exchange-traded derivatives | $ | 5,452 | * | ||||||||
Foreign exchange contracts | Unrealized appreciation on forward currency exchange contracts |
| 44,106 |
|
Unrealized depreciation on forward currency exchange contracts | $ | 54,947 |
| ||||
Credit contracts | Investments in securities, at value | 5,227 | ||||||||||
Equity contracts | Investments in securities, at value | 19,044 | ||||||||||
Equity contracts | Options written, at value | 1,912 | ||||||||||
Credit contracts | Unrealized appreciation on credit default swaps | 69,688 | Unrealized depreciation on credit default swaps | 175,497 | ||||||||
Equity contracts | Unrealized appreciation on total return swaps | 10,536 | Unrealized depreciation on total return swaps | 2,441 | ||||||||
|
|
|
| |||||||||
Total | $ | 253,576 | $ | 266,149 | ||||||||
|
|
|
| |||||||||
| * | Only variation margin receivable/payable at period end is reported within the statement of assets and liabilities. This amount reflects cumulative appreciation/(depreciation) of exchange-traded derivatives as reported in the portfolio of investments. |
Derivative Type | Location of Gain or (Loss) on | Realized Gain or (Loss) on Derivatives | Change in Unrealized Appreciation or (Depreciation) | |||||||
Interest rate contracts | Net realized gain (loss) on futures; Net change in unrealized appreciation/depreciation of futures | $ | (108,139 | ) | $ | 60,137 | ||||
Equity contracts | Net realized gain (loss) on futures; Net change in unrealized appreciation/depreciation of futures | (5,585 | ) | 4,790 | ||||||
Foreign exchange contracts | Net realized gain (loss) on foreign currency transactions; Net change in unrealized appreciation/depreciation of foreign currency denominated assets and liabilities | (84,086 | ) | 1,053 | ||||||
| 58 | • AB CREDIT LONG/SHORT PORTFOLIO |
Notes to Financial Statements
Derivative Type | Location of Gain or (Loss) on | Realized Gain or (Loss) on Derivatives | Change in Unrealized Appreciation or (Depreciation) | |||||||
Interest rate contracts | Net realized gain (loss) on investment transactions; Net change in unrealized appreciation/depreciation of investments | $ | (2,046 | ) | $ | – 0 | – | |||
Credit contracts | Net realized gain (loss) on investment transactions; Net change in unrealized appreciation/depreciation of investments | (17,980 | ) | 2,977 | ||||||
Equity contracts | Net realized gain (loss) on investment transactions; Net change in unrealized appreciation/depreciation of investments | (154,953 | ) | 37,519 | ||||||
Credit contracts | Net realized gain (loss) on swaptions written; Net change in unrealized appreciation/depreciation of swaptions written | 18,214 | (802 | ) | ||||||
Interest rate contracts | Net realized gain (loss) on options written; Net change in unrealized appreciation/depreciation of options written | 3,392 | – 0 | – | ||||||
Equity contracts | Net realized gain (loss) on options written; Net change in unrealized appreciation/depreciation of options written | 67,568 | (26,380 | ) | ||||||
Interest rate contracts | Net realized gain (loss) on swaps; Net change in unrealized appreciation/depreciation of swaps | (3,311 | ) | 997 | ||||||
Credit contracts | Net realized gain (loss) on swaps; Net change in unrealized appreciation/depreciation of swaps | (408,446 | ) | (72,866 | ) | |||||
Equity contracts | Net realized gain (loss) on swaps; Net change in unrealized appreciation/depreciation of swaps | 265,102 | 3,585 | |||||||
|
|
|
| |||||||
Total | $ | (430,270 | ) | $ | 11,010 | |||||
|
|
|
| |||||||
| AB CREDIT LONG/SHORT PORTFOLIO • | 59 |
Notes to Financial Statements
The following table represents the average monthly volume of the Portfolio’s derivative transactions during the year ended October 31, 2016:
Futures: | ||||
Average original value of buy contracts | $ | 528,907 | ||
Average original value of sale contracts | $ | 2,879,266 | ||
Forward Currency Exchange Contracts: | ||||
Average principal amount of buy contracts | $ | 3,366,378 | ||
Average principal amount of sale contracts | $ | 1,706,394 | ||
Purchased Options: | ||||
Average monthly cost | $ | 43,003 | ||
Centrally Cleared Interest Rate Swaps: | ||||
Average notional amount | $ | 250,000 | ||
Credit Default Swaps: | ||||
Average notional amount of buy contracts | $ | 13,556,205 | ||
Average notional amount of sale contracts | $ | 3,903,666 | ||
Centrally Cleared Credit Default Swaps: | ||||
Average notional amount of buy contracts | $ | 5,565,585 | ||
Average notional amount of sale contracts | $ | 2,937,950 | ||
Total Return Swaps: | ||||
Average notional amount | $ | 3,046,077 |
For financial reporting purposes, the Portfolio does not offset derivative assets and derivative liabilities that are subject to netting arrangements in the statement of assets and liabilities.
All derivatives held at period end were subject to netting arrangements. The following table presents the Portfolio’s derivative assets and liabilities by counterparty net of amounts available for offset under Master Agreements (“MA”) and net of the related collateral received/pledged by the Portfolio as of October 31, 2016:
Counterparty | Derivative Assets Subject to a MA | Derivative Available for Offset | Cash Collateral Received | Security Collateral Received | Net Amount of Derivatives Assets | |||||||||||||||
Exchange-Traded Derivatives: | ||||||||||||||||||||
Morgan Stanley & Co. LLC/Morgan Stanley & Co., Inc.* | $ | 19,208 | $ | (4,513 | ) | $ | – 0 | – | $ | – 0 | – | $ | 14,695 | |||||||
|
|
|
|
|
|
|
|
|
| |||||||||||
Total | $ | 19,208 | $ | (4,513 | ) | $ | – 0 | – | $ | – 0 | – | $ | 14,695 | |||||||
|
|
|
|
|
|
|
|
|
| |||||||||||
OTC Derivatives: | ||||||||||||||||||||
Bank of America, NA | $ | 805 | $ | (419 | ) | $ | – 0 | – | $ | – 0 | – | $ | 386 | |||||||
Barclays Bank PLC | 148,346 | (23,074 | ) | – 0 | – | – 0 | – | 125,272 | ||||||||||||
Citibank, NA | 78,826 | (78,826 | ) | – 0 | – | – 0 | – | – 0 | – | |||||||||||
Credit Suisse International | 28,451 | (28,451 | ) | – 0 | – | – 0 | – | – 0 | – | |||||||||||
Deutsche Bank AG | 1,468 | (1,468 | ) | – 0 | – | – 0 | – | – 0 | – | |||||||||||
Goldman Sachs International | 126,673 | (126,673 | ) | – 0 | – | – 0 | – | – 0 | – | |||||||||||
| 60 | • AB CREDIT LONG/SHORT PORTFOLIO |
Notes to Financial Statements
Counterparty | Derivative Assets Subject to a MA | Derivative Available for Offset | Cash Collateral Received | Security Collateral Received | Net Amount of Derivatives Assets | |||||||||||||||
JPMorgan Chase Bank, NA | $ | 5,889 | $ | (2,597 | ) | $ | – 0 | – | $ | – 0 | – | $ | 3,292 | |||||||
Morgan Stanley Capital Services LLC/Morgan Stanley Capital Services, Inc. | 33,814 | (30,346 | ) | – 0 | – | – 0 | – | 3,468 | ||||||||||||
State Street Bank & Trust Co. | 18,349 | (18,349 | ) | – 0 | – | – 0 | – | – 0 | – | |||||||||||
|
|
|
|
|
|
|
|
|
| |||||||||||
Total | $ | 442,621 | $ | (310,203 | ) | $ | – 0 | – | $ | – 0 | – | $ | 132,418 | ^ | ||||||
|
|
|
|
|
|
|
|
|
| |||||||||||
Counterparty | Derivative Liabilities Subject to a MA | Derivative Available for Offset | Cash Collateral Pledged | Security Collateral Pledged | Net Amount of Derivatives Liabilities | |||||||||||||||
Exchange-Traded Derivatives: | ||||||||||||||||||||
Morgan Stanley & Co. LLC/Morgan Stanley & Co., Inc.* | $ | 4,513 | $ | (4,513 | ) | $ | – 0 | – | $ | – 0 | – | $ | – 0 | – | ||||||
|
|
|
|
|
|
|
|
|
| |||||||||||
Total | $ | 4,513 | $ | (4,513 | ) | $ | – 0 | – | $ | – 0 | – | $ | – 0 | – | ||||||
|
|
|
|
|
|
|
|
|
| |||||||||||
OTC Derivatives: | ||||||||||||||||||||
Bank of America, NA | $ | 419 | $ | (419 | ) | $ | – 0 | – | $ | – 0 | – | $ | – 0 | – | ||||||
Barclays Bank PLC | 23,074 | (23,074 | ) | – 0 | – | – 0 | – | – 0 | – | |||||||||||
Citibank, NA | 232,653 | (78,826 | ) | – 0 | – | (69,985 | ) | 83,842 | ||||||||||||
Credit Suisse International | 40,468 | (28,451 | ) | – 0 | – | – 0 | – | 12,017 | ||||||||||||
Deutsche Bank AG | 7,191 | (1,468 | ) | – 0 | – | – 0 | – | 5,723 | ||||||||||||
Goldman Sachs Bank USA/Goldman Sachs International | 193,391 | (126,673 | ) | – 0 | – | – 0 | – | 66,718 | ||||||||||||
JPMorgan Chase Bank, NA | 2,597 | (2,597 | ) | – 0 | – | – 0 | – | – 0 | – | |||||||||||
Morgan Stanley Capital Services LLC/Morgan Stanley Capital Services, Inc. | 30,346 | (30,346 | ) | – 0 | – | – 0 | – | – 0 | – | |||||||||||
State Street Bank & Trust Co. | 22,928 | (18,349 | ) | – 0 | – | – 0 | – | 4,579 | ||||||||||||
|
|
|
|
|
|
|
|
|
| |||||||||||
Total | $ | 553,067 | $ | (310,203 | ) | $ | – 0 | – | $ | (69,985 | ) | $ | 172,879 | ^ | ||||||
|
|
|
|
|
|
|
|
|
| |||||||||||
| * | Cash has been posted for initial margin requirements for exchange-traded derivatives outstanding at October 31, 2016. |
| ^ | Net amount represents the net receivable/payable that would be due from/to the counterparty in the event of default or termination. The net amount from OTC financial derivative instruments can only be netted across transactions governed under the same master agreement with the same counterparty. |
2. Currency Transactions
The Portfolio may invest in non-U.S. Dollar-denominated securities on a currency hedged or unhedged basis. The Portfolio may seek investment
| AB CREDIT LONG/SHORT PORTFOLIO • | 61 |
Notes to Financial Statements
opportunities by taking long or short positions in currencies through the use of currency-related derivatives, including forward currency exchange contracts, futures and options on futures, swaps, and other options. The Portfolio may enter into transactions for investment opportunities when it anticipates that a foreign currency will appreciate or depreciate in value but securities denominated in that currency are not held by the Portfolio and do not present attractive investment opportunities. Such transactions may also be used when the Adviser believes that it may be more efficient than a direct investment in a foreign currency-denominated security. The Portfolio may also conduct currency exchange contracts on a spot basis (i.e., for cash at the spot rate prevailing in the currency exchange market for buying or selling currencies).
3. Short Sales
The Portfolio may sell securities short. A short sale is a transaction in which the Portfolio sells securities it does not own, but has borrowed, in anticipation of a decline in the market price of the securities. The Portfolio is obligated to replace the borrowed securities at their market price at the time of settlement. The Portfolio’s obligation to replace the securities borrowed in connection with a short sale will be fully secured by collateral deposited with the broker. The Portfolio is liable to the buyer for any dividends/interest payable on securities while those securities are in a short position. These dividends/interest are recorded as an expense of the Portfolio. Short sales by the Portfolio involve certain risks and special considerations. Possible losses from short sales differ from losses that could be incurred from a purchase of a security because losses from short sales may be unlimited, whereas losses from purchases cannot exceed the total amount invested.
NOTE E
Capital Stock
Each class consists of 3,000,000,000 authorized shares. Transactions in capital shares for each class were as follows:
| Shares | Amount | |||||||||||||||||||||||
Year Ended 2016 | Year Ended October 31, 2015 | Year Ended October 31, 2016 | Year Ended 2015 | |||||||||||||||||||||
|
| |||||||||||||||||||||||
| Class A | ||||||||||||||||||||||||
Shares sold | 6,854 | 11,548 | $ | 67,378 | $ | 113,733 | ||||||||||||||||||
| ||||||||||||||||||||||||
Shares issued in reinvestment of dividends and distributions | 66 | 100 | 644 | 984 | ||||||||||||||||||||
| ||||||||||||||||||||||||
Shares redeemed | (7,812 | ) | (1,128 | ) | (76,892 | ) | (11,052 | ) | ||||||||||||||||
| ||||||||||||||||||||||||
Net increase (decrease) | (892 | ) | 10,520 | $ | (8,870 | ) | $ | 103,665 | ||||||||||||||||
| ||||||||||||||||||||||||
| 62 | • AB CREDIT LONG/SHORT PORTFOLIO |
Notes to Financial Statements
| Shares | Amount | |||||||||||||||||||||||
Year Ended 2016 | Year Ended October 31, 2015 | Year Ended October 31, 2016 | Year Ended 2015 | |||||||||||||||||||||
|
| |||||||||||||||||||||||
| Class C | ||||||||||||||||||||||||
Shares sold | 6,709 | 5,701 | $ | 65,523 | $ | 56,054 | ||||||||||||||||||
| ||||||||||||||||||||||||
Shares issued in reinvestment of dividends and distributions | 40 | 31 | 385 | 308 | ||||||||||||||||||||
| ||||||||||||||||||||||||
Shares redeemed | (1,312 | ) | – 0 | – | (12,650 | ) | – 0 | – | ||||||||||||||||
| ||||||||||||||||||||||||
Net increase | 5,437 | 5,732 | $ | 53,258 | $ | 56,362 | ||||||||||||||||||
| ||||||||||||||||||||||||
| Advisor Class | ||||||||||||||||||||||||
Shares sold | 4,752 | 120,616 | $ | 47,706 | $ | 1,189,631 | ||||||||||||||||||
| ||||||||||||||||||||||||
Shares issued in reinvestment of dividends and distributions | 540 | 1,369 | 5,253 | 13,427 | ||||||||||||||||||||
| ||||||||||||||||||||||||
Shares redeemed | (73,073 | ) | (85,608 | ) | (729,627 | ) | (840,359 | ) | ||||||||||||||||
| ||||||||||||||||||||||||
Net increase (decrease) | (67,781 | ) | 36,377 | $ | (676,668 | ) | $ | 362,699 | ||||||||||||||||
| ||||||||||||||||||||||||
NOTE F
Risks Involved in Investing in the Portfolio
Interest Rate Risk and Credit Risk—Interest rate risk is the risk that changes in interest rates will affect the value of the Portfolio’s investments in fixed-income debt securities such as bonds or notes. Increases in interest rates may cause the value of the Portfolio’s investments to decline. Credit risk is the risk that the issuer or guarantor of a debt security, or the counterparty to a derivative contract, will be unable or unwilling to make timely principal and/or interest payments, or to otherwise honor its obligations. The degree of risk for a particular security may be reflected in its credit rating. Credit risk is greater for medium quality and lower-rated securities. Lower-rated debt securities and similar unrated securities (commonly known as “junk bonds”) have speculative elements or are predominantly speculative risks.
Below Investment Grade Securities Risk—Investments in fixed-income securities with lower ratings (commonly known as “junk bonds”) are subject to a higher probability that an issuer will default or fail to meet its payment obligations. These securities may be subject to greater price volatility due to such factors as specific corporate developments, negative perceptions of the junk bond market generally and less secondary market liquidity.
Duration Risk—Duration is a measure that relates the expected price volatility of a fixed-income security to changes in interest rates. The
| AB CREDIT LONG/SHORT PORTFOLIO • | 63 |
Notes to Financial Statements
duration of a fixed-income security may be shorter than or equal to full maturity of a fixed-income security. Fixed-income securities with longer durations have more risk and will decrease in price as interest rates rise. For example, a fixed-income security with a duration of three years will decrease in value by approximately 3% if interest rates increase by 1%.
Inflation Risk—This is the risk that the value of assets or income from investments will be less in the future as inflation decreases the value of money. As inflation increases, the value of the Portfolio’s assets can decline as can the value of the Portfolio’s distributions. This risk is significantly greater if the Portfolio invests a significant portion of its assets in fixed-income securities with longer maturities.
Foreign (Non-U.S.) Risk—Investments in securities of non-U.S. issuers may involve more risk than those of U.S. issuers. These securities may fluctuate more widely in price and may be less liquid due to adverse market, economic, political, regulatory or other factors.
Emerging Market Risk—Investments in emerging market countries may have more risk because the markets are less developed and less liquid, and because these investments may be subject to increased economic, political, regulatory, or other uncertainties.
Currency Risk—Fluctuations in currency exchange rates may negatively affect the value of the Portfolio’s investments or reduce its returns.
Leverage Risk—When the Portfolio borrows money or otherwise leverages its investments, its performance may be volatile because leverage tends to exaggerate the effect of any increase or decrease in the value of the Portfolio’s investments. The Portfolio may create leverage through the use of reverse repurchase arrangements, forward currency exchange contracts, forward commitments, dollar rolls or futures or by borrowing money. The use of derivative instruments by the Portfolio, such as forwards, futures, options and swaps, may also result in a form of leverage. Leverage may result in higher returns to the Portfolio than if the Portfolio were not leveraged, but may also adversely affect returns, particularly if the market is declining.
Short Sales Risk—Short sales involve the risk that the Portfolio will incur a loss by subsequently buying a security at a higher price than the price at which it sold the security. The amount of such loss is theoretically unlimited, as it will be based on the increase in value of the security sold short. In contrast, the risk of loss from a long position is limited to the Portfolio’s investment in the security, because the price of the security cannot fall below zero. The Portfolio may not always be able to close out a short position on favorable terms.
| 64 | • AB CREDIT LONG/SHORT PORTFOLIO |
Notes to Financial Statements
Derivatives Risk—The Portfolio may enter into derivative transactions such as forwards, options, futures and swaps. Derivatives may be illiquid, difficult to price, and leveraged so that small changes may produce disproportionate losses for the Portfolio, and subject to counterparty risk to a greater degree than more traditional investments. Derivatives may result in significant losses, including losses that are far greater than the value of the derivatives reflected on the statement of assets and liabilities.
Diversification Risk—The Portfolio may have more risk because it is “non-diversified”, meaning that it can invest more of its assets in a smaller number of issuers. Accordingly, changes in the value of a single security may have a more significant effect, either negative or positive, on the Portfolio’s NAV.
Liquidity Risk—Liquidity risk occurs when certain investments become difficult to purchase or sell. Difficulty in selling less liquid securities may result in sales at disadvantageous prices affecting the value of your investment in the Portfolio. Causes of liquidity risk may include low trading volumes, large positions and heavy redemptions of fund shares. Over recent years, liquidity risk has also increased because the capacity of dealers in the secondary market for fixed-income securities to make markets in these securities has decreased, even as the overall bond market has grown significantly, due to, among other things, structural changes, additional regulatory requirements and capital and risk restraints that have led to reduced inventories. Liquidity risk may be higher in a rising interest rate environment, when the value and liquidity of fixed-income securities generally decline.
Indemnification Risk—In the ordinary course of business, the Portfolio enter into contracts that contain a variety of indemnifications. The Portfolio’s maximum exposure under these arrangements is unknown. However, the Portfolio has not had prior claims or losses pursuant to these indemnification provisions and expect the risk of loss thereunder to be remote. Therefore, the Portfolio has not accrued any liability in connection with these indemnification provisions.
NOTE G
Joint Credit Facility
A number of open-end mutual funds managed by the Adviser, including the Portfolio, participate in a $280 million revolving credit facility (the “Facility”) intended to provide short-term financing, if necessary, subject to certain restrictions in connection with abnormal redemption activity. Commitment fees related to the Facility are paid by the participating funds and are included in miscellaneous expenses in the statement of operations. The Portfolio did not utilize the Facility during the year ended October 31, 2016.
| AB CREDIT LONG/SHORT PORTFOLIO • | 65 |
Notes to Financial Statements
NOTE H
Distributions to Shareholders
The tax character of distributions paid during the fiscal years ended October 31, 2016 and October 31, 2015 were as follows:
| 2016 | 2015 | |||||||
Distributions paid from: | ||||||||
Ordinary income | $ | 90,082 | $ | 202,872 | ||||
|
|
|
| |||||
Total distributions paid | $ | 90,082 | $ | 202,872 | ||||
|
|
|
| |||||
As of October 31, 2016, the components of accumulated earnings/(deficit) on a tax basis were as follows:
Undistributed ordinary income | $ | 240,793 | ||
Unrealized appreciation/(depreciation) | 240,738 | (a) | ||
|
| |||
Total accumulated earnings/(deficit) | $ | 481,531 | (b) | |
|
|
| (a) | The differences between book-basis and tax-basis unrealized appreciation/(depreciation) are attributable primarily to the tax deferral of losses on wash sales, the tax treatment of swaps and the realization for tax purposes of gains/losses on certain derivative instruments. |
| (b) | The difference between book-basis and tax-basis components of accumulated earnings/(deficit) is attributable primarily to the tax treatment of defaulted securities. |
For tax purposes, net realized capital losses may be carried over to offset future capital gains, if any. Funds are permitted to carry forward capital losses for an indefinite period, and such losses will retain their character as either short-term or long-term capital losses. As of October 31, 2016, the Portfolio did not have any capital loss carryforwards.
During the current fiscal year, permanent differences primarily due to the foreign currency reclassifications, the tax treatment of proceeds from the sale of defaulted securities, the offset of a net operating loss against capital gain, the tax treatment of short dividend expenses associated with positions held for 45 days or less, and the tax treatment of swaps and swap clearing fees resulted in a net decrease in distributions in excess of net investment income, a net decrease in accumulated net realized gain on investment and foreign currency transactions. These reclassifications had no effect on net assets.
NOTE I
New Accounting Pronouncements
In May 2015, the Financial Accounting Standards Board issued an Accounting Standards Update, ASU 2015-07 (the “ASU”) which removes the requirement to categorize within the fair value hierarchy all investments for which fair value is measured using the net asset value per share practical expedient. The ASU also removes the requirement to make certain disclosures for investments that are eligible to be measured
| 66 | • AB CREDIT LONG/SHORT PORTFOLIO |
Notes to Financial Statements
at fair value using the net asset value per share practical expedient but do not utilize that practical expedient. The ASU is effective for annual periods beginning after December 15, 2015 and interim periods within those annual periods. Management has evaluated the implications of these changes and there will be no impact to the financial statements.
NOTE J
Other
In October 2016, the U.S. Securities and Exchange Commission adopted new rules and amended existing rules (together, “final rules”) intended to modernize the reporting and disclosure of information by registered investment companies. In part, the final rules amend Regulation S-X and require standardized, enhanced disclosure about derivatives in investment company financial statements, as well as other amendments. The compliance date for the amendments to Regulation S-X is August 1, 2017. Management is currently evaluating the impact that the adoption of the amendments to Regulation S-X will have on the financial statements and related disclosures.
NOTE K
Subsequent Events
Management has evaluated subsequent events for possible recognition or disclosure in the financial statements through the date the financial statements are issued. Management has determined that there are no material events that would require disclosure in the Portfolio’s financial statements through this date.
| AB CREDIT LONG/SHORT PORTFOLIO • | 67 |
Notes to Financial Statements
FINANCIAL HIGHLIGHTS
Selected Data For A Share Of Capital Stock Outstanding Throughout Each Period
| Class A | ||||||||||||
| Year Ended October 31, | May 7, 2014(a) to October 31, 2014 | |||||||||||
| 2016 | 2015 | |||||||||||
|
| |||||||||||
Net asset value, beginning of period | $ 9.85 | $ 10.00 | $ 10.00 | |||||||||
|
| |||||||||||
Income From Investment Operations | ||||||||||||
Net investment income (loss)(b)(c) | (.09 | ) | .09 | .08 | ||||||||
Net realized and unrealized gain (loss) on investment and foreign currency transactions | .40 | (.16 | ) | (.03 | ) | |||||||
Contributions from Affiliates | – 0 | – | .00 | (d) | – 0 | – | ||||||
|
| |||||||||||
Net increase (decrease) in net asset value from operations | .31 | (.07 | ) | .05 | ||||||||
|
| |||||||||||
Less: Dividends and Distributions | ||||||||||||
Dividends from net investment income | – 0 | – | (.08 | ) | (.05 | ) | ||||||
Distributions from net realized gain on investment transactions | (.04 | ) | – 0 | – | – 0 | – | ||||||
|
| |||||||||||
Total dividends and distributions | (.04 | ) | (.08 | ) | (.05 | ) | ||||||
|
| |||||||||||
Net asset value, end of period | $ 10.12 | $ 9.85 | $ 10.00 | |||||||||
|
| |||||||||||
Total Return | ||||||||||||
Total investment return based on net asset value(e)(f) | 3.18 | % | (.65 | )% | .57 | % | ||||||
Ratios/Supplemental Data | ||||||||||||
Net assets, end of period (000’s omitted) | $182 | $186 | $84 | |||||||||
Ratio to average net assets of: | ||||||||||||
Expenses, net of waivers/reimbursements(g) | 6.81 | %(h) | 5.02 | % | 3.56 | %^ | ||||||
Expenses, before waivers/reimbursements(g) | 9.07 | %(h) | 7.28 | % | 4.29 | %^ | ||||||
Net investment income (loss)(c) | (.91 | )% | .88 | % | 1.79 | %^ | ||||||
Portfolio turnover rate | 201 | % | 163 | % | 69 | % | ||||||
Portfolio turnover rate (including securities sold short) | 182 | % | 147 | % | 102 | % | ||||||
See footnote summary on page 71.
| 68 | • AB CREDIT LONG/SHORT PORTFOLIO |
Financial Highlights
Selected Data For A Share Of Capital Stock Outstanding Throughout Each Period
| Class C | ||||||||||||
| Year Ended October 31, | May 7, 2014 | |||||||||||
| 2016 | 2015 | |||||||||||
|
| |||||||||||
Net asset value, beginning of period | $ 9.77 | $ 9.97 | $ 10.00 | |||||||||
|
| |||||||||||
Income From Investment Operations | ||||||||||||
Net investment income (loss)(b)(c) | (.18 | ) | .01 | .06 | ||||||||
Net realized and unrealized gain (loss) on investment and foreign currency transactions | .42 | (.15 | ) | (.05 | ) | |||||||
Contributions from Affiliates | – 0 | – | .00 | (d) | – 0 | – | ||||||
|
| |||||||||||
Net increase (decrease) in net asset value from operations | .24 | (.14 | ) | .01 | ||||||||
|
| |||||||||||
Less: Dividends and Distributions | ||||||||||||
Dividends from net investment income | – 0 | – | (.06 | ) | (.04 | ) | ||||||
Distributions from net realized gain on investment transactions | (.04 | ) | – 0 | – | – 0 | – | ||||||
|
| |||||||||||
Total dividends and distributions | (.04 | ) | (.06 | ) | (.04 | ) | ||||||
|
| |||||||||||
Net asset value, end of period | $ 9.97 | $ 9.77 | $ 9.97 | |||||||||
|
| |||||||||||
Total Return | ||||||||||||
Total investment return based on net asset value(e)(f) | 2.49 | % | (1.45 | )% | .21 | % | ||||||
Ratios/Supplemental Data | ||||||||||||
Net assets, end of period (000’s omitted) | $156 | $100 | $44 | |||||||||
Ratio to average net assets of: | ||||||||||||
Expenses, net of waivers/reimbursements(g) | 7.61 | %(h) | 5.78 | % | 4.18 | %^ | ||||||
Expenses, before waivers/reimbursements(g) | 9.87 | %(h) | 8.08 | % | 6.31 | %^ | ||||||
Net investment income (loss)(c) | (1.88 | )% | .10 | % | 1.21 | %^ | ||||||
Portfolio turnover rate | 201 | % | 163 | % | 69 | % | ||||||
Portfolio turnover rate (including securities sold short) | 182 | % | 147 | % | 102 | % | ||||||
See footnote summary on page 71.
| AB CREDIT LONG/SHORT PORTFOLIO • | 69 |
Financial Highlights
Selected Data For A Share Of Capital Stock Outstanding Throughout Each Period
| Advisor Class | ||||||||||||
| Year Ended October 31, | May 7, 2014 | |||||||||||
| 2016 | 2015 | |||||||||||
|
| |||||||||||
Net asset value, beginning of period | $ 9.87 | $ 10.01 | $ 10.00 | |||||||||
|
| |||||||||||
Income From Investment Operations | ||||||||||||
Net investment income (loss)(b)(c) | (.06 | ) | .12 | .10 | ||||||||
Net realized and unrealized gain (loss) on investment and foreign currency transactions | .40 | (.17 | ) | (.04 | ) | |||||||
Contributions from Affiliates | – 0 | – | .00 | (d) | – 0 | – | ||||||
|
| |||||||||||
Net increase (decrease) in net asset value from operations | .34 | (.05 | ) | .06 | ||||||||
|
| |||||||||||
Less: Dividends and Distributions | ||||||||||||
Dividends from net investment income | – 0 | – | (.09 | ) | (.05 | ) | ||||||
Distributions from net realized gain on investment transactions | (.04 | ) | – 0 | – | – 0 | – | ||||||
|
| |||||||||||
Total dividends and distributions | (.04 | ) | (.09 | ) | (.05 | ) | ||||||
|
| |||||||||||
Net asset value, end of period | $ 10.17 | $ 9.87 | $ 10.01 | |||||||||
|
| |||||||||||
Total Return | ||||||||||||
Total investment return based on net asset value(e)(f) | 3.48 | % | (.45 | )% | .70 | % | ||||||
Ratios/Supplemental Data | ||||||||||||
Net assets, end of period (000’s omitted) | $20,903 | $20,967 | $20,892 | |||||||||
Ratio to average net assets of: | ||||||||||||
Expenses, net of waivers/reimbursements(g) | 6.55 | %(h) | 4.67 | % | 2.79 | %^ | ||||||
Expenses, before waivers/reimbursements(g) | 8.80 | %(h) | 6.91 | % | 5.37 | %^ | ||||||
Net investment income (loss)(c) | (.63 | )% | 1.20 | % | 2.01 | %^ | ||||||
Portfolio turnover rate | 201 | % | 163 | % | 69 | % | ||||||
Portfolio turnover rate (including securities sold short) | 182 | % | 147 | % | 102 | % | ||||||
See footnote summary on page 71.
| 70 | • AB CREDIT LONG/SHORT PORTFOLIO |
Financial Highlights
| (a) | Commencement of operations. |
| (b) | Based on average shares outstanding. |
| (c) | Net of fees and expenses waived/reimbursed by the Adviser. |
| (d) | Amount is less than $.005. |
| (e) | Total investment return is calculated assuming an initial investment made at the net asset value at the beginning of the period, reinvestment of all dividends and distributions at net asset value during the period, and redemption on the last day of the period. Initial sales charges or contingent deferred sales charges are not reflected in the calculation of total investment return. Total return does not reflect the deduction of taxes that a shareholder would pay on fund distributions or the redemption of fund shares. Total investment return calculated for a period of less than one year is not annualized. |
| (f) | The net asset value and total return include adjustments in accordance with accounting principals generally accepted within the Unites States of America for financial reporting purposes. As such, the net asset value and total return for shareholder transactions may differ from financial statements. |
| (g) | The expense ratios presented below exclude expenses on securities sold short: |
| Year Ended October 31, | May 7, 2014(a) to October 31, 2014 | |||||||||||
| 2016 | 2015 | |||||||||||
Class A | ||||||||||||
Net of waivers/reimbursements | 1.34 | % | 1.35 | % | 1.35 | %^ | ||||||
Before waivers/reimbursements | 3.59 | % | 3.61 | % | 2.08 | %^ | ||||||
Class C | ||||||||||||
Net of waivers/reimbursements | 2.09 | % | 2.10 | % | 2.10 | %^ | ||||||
Before waivers/reimbursements | 4.35 | % | 4.40 | % | 4.24 | %^ | ||||||
Advisor Class | ||||||||||||
Net of waivers/reimbursements | 1.09 | % | 1.10 | % | 1.10 | %^ | ||||||
Before waivers/reimbursements | 3.34 | % | 3.34 | % | 3.68 | %^ | ||||||
| (h) | Expense ratios do not include expenses of the AB mutual funds in which the Portfolio invests. For the period shown below, the acquired fund fees of the AB mutual funds was as follows: |
| Year Ended October 31, 2016 | ||||
| .01 | % | |||
| ^ | Annualized. |
See notes to financial statements.
| AB CREDIT LONG/SHORT PORTFOLIO • | 71 |
Financial Highlights
REPORT OF INDEPENDENT REGISTERED
PUBLIC ACCOUNTING FIRM
To the Board of Directors and Shareholders of AB Credit Long/Short Portfolio
We have audited the accompanying statement of assets and liabilities, including the portfolio of investments, of AB Credit Long/Short Portfolio (the “Fund”), (one of the portfolios constituting the AB Bond Fund, Inc.), as of October 31, 2016, the related statement of operations for the year then ended, the statements of changes in net assets for each of the two years in the period then ended, and financial highlights for each of the two years in the period then ended and the period May 7, 2014 (commencement of operations) to October 31, 2014. These financial statements and financial highlights are the responsibility of the Fund’s management. Our responsibility is to express an opinion on these financial statements and financial highlights based on our audits.
We conducted our audits in accordance with the standards of the Public Company Accounting Oversight Board (United States). Those standards require that we plan and perform the audit to obtain reasonable assurance about whether the financial statements and financial highlights are free of material misstatement. We were not engaged to perform an audit of the Fund’s internal control over financial reporting. Our audit included consideration of internal control over financial reporting as a basis for designing audit procedures that are appropriate in the circumstances, but not for the purpose of expressing an opinion on the effectiveness of the Fund’s internal control over financial reporting. Accordingly, we express no such opinion. An audit also includes examining, on a test basis, evidence supporting the amounts and disclosures in the financial statements and financial highlights, assessing the accounting principles used and significant estimates made by management, and evaluating the overall financial statement presentation. Our procedures included confirmation of securities owned as of October 31, 2016, by correspondence with the custodian and others or by other appropriate auditing procedures where replies from others were not received. We believe that our audits provide a reasonable basis for our opinion.
In our opinion, the financial statements and financial highlights referred to above present fairly, in all material respects, the financial position of AB Credit Long/Short Portfolio (one of the portfolios constituting the AB Bond Fund, Inc.) at October 31, 2016, the results of its operations for the year then ended, the statements of changes in net assets for each of the two years in the period then ended, and financial highlights for each of the two years in the period then ended and the period May 7, 2014 (commencement of operations) to October 31, 2014, in conformity with U.S. generally accepted accounting principles.

New York, New York
December 29, 2016
| 72 | • AB CREDIT LONG/SHORT PORTFOLIO |
Report of Independent Registered Public Accounting Firm
2016 FEDERAL TAX INFORMATION
(unaudited)
For Federal income tax purposes, the following information is furnished with respect to the distributions paid by the Portfolio during the taxable year ended October 31, 2016. For corporate shareholders, 17.28% of dividends paid qualify for the dividends received deduction. For foreign shareholders, 22.82% of ordinary dividends paid may be considered to be qualifying to be taxed as interest-related dividends.
For the taxable year ended October 31, 2016, the Portfolio designates $17,869 as the maximum amount that may be considered qualified dividend income for individual shareholders.
Shareholders should not use the above information to prepare their income tax returns. The information necessary to complete your income tax returns will be included with your form 1099-DIV which will be sent to you separately in January 2017.
| AB CREDIT LONG/SHORT PORTFOLIO • | 73 |
BOARD OF DIRECTORS
Marshall C. Turner, Jr.(1), Chairman John H. Dobkin(1) Michael J. Downey(1) William H. Foulk, Jr.(1) D. James Guzy(1) | Nancy P. Jacklin(1) Robert M. Keith, President and Chief Executive Officer Carol C. McMullen(1) Garry L. Moody(1) Earl D. Weiner(1) |
OFFICERS
Philip L. Kirstein, Senior Vice President and Independent Compliance Officer Gershon M. Distenfeld(2), Vice President Sherif M. Hamid(2), Vice President Ivan Rudolph-Shabinsky(2), Vice President Robert Schwartz(2), Vice President | Ashish C. Shah(2), Vice President Joseph J. Mantineo, Treasurer and Chief Financial Officer Emilie D. Wrapp, Secretary Phyllis J. Clarke, Controller Vincent S. Noto, Chief Compliance Officer |
Custodian and Accounting Agent State Street Bank and Trust Company State Street Corporation CCB/5 1 Iron Street Boston, MA 02210
Principal Underwriter AllianceBernstein Investments, Inc. 1345 Avenue of the Americas New York, NY 10105
Transfer Agent AllianceBernstein Investor Services, Inc. P.O. Box 786003 San Antonio, TX 78278-6003 Toll-Free (800) 221-5672 | Independent Registered Public Accounting Firm Ernst & Young LLP 5 Times Square New York, NY 10036
Legal Counsel Seward & Kissel LLP One Battery Park Plaza New York, NY 10004 |
| (1) | Member of the Audit Committee, the Governance and Nominating Committee and the Independent Directors Committee. |
| (2) | The day-to-day management of, and investment decisions for, the Fund are made by the Credit Long/Short Investment Team. Messrs. Distenfeld, Hamid, Rudolph-Shabinksy, Schwartz and Shah are the investment professionals with the most significant responsibility for the day-to-day management of the Fund’s portfolio. |
| 74 | • AB CREDIT LONG/SHORT PORTFOLIO |
Board of Directors
MANAGEMENT OF THE FUND
| NAME, ADDRESS*, AGE, (YEAR FIRST ELECTED**) | PRINCIPAL OCCUPATION(S) DURING PAST FIVE YEARS AND OTHER INFORMATION*** | PORTFOLIOS IN FUND COMPLEX OVERSEEN BY DIRECTOR | OTHER PUBLIC COMPANY DIRECTORSHIPS CURRENTLY HELD | |||||
| INTERESTED DIRECTOR | ||||||||
Robert M. Keith, + 1345 Avenue of the Americas New York, NY 10105 56 | Senior Vice President of AllianceBernstein L.P. (the “Adviser”) and the head of AllianceBernstein Investments, Inc. (“ABI”) since July 2008; Director of ABI and President of the AB Mutual Funds. Previously, he served as Executive Managing Director of ABI from December 2006 to June 2008. Prior to joining ABI in 2006, Executive Managing Director of Bernstein Global Wealth Management, and prior thereto, Senior Managing Director and Global Head of Client Service and Sales of the Adviser’s institutional investment management business since 2004. Prior thereto, he was Managing Director and Head of North American Client Service and Sales in the Adviser’s institutional investment management business, with which he had been associated since prior to 2004. | 108 | None | |||||
| AB CREDIT LONG/SHORT PORTFOLIO • | 75 |
Management of the Fund
| NAME, ADDRESS*, AGE, (YEAR FIRST ELECTED**) | PRINCIPAL OCCUPATION(S) DURING PAST FIVE YEARS AND OTHER INFORMATION*** | PORTFOLIOS IN FUND COMPLEX OVERSEEN BY DIRECTOR | OTHER PUBLIC COMPANY DIRECTORSHIPS CURRENTLY HELD | |||||
| DISINTERESTED DIRECTORS | ||||||||
Marshall C. Turner, Jr., # Chairman of the Board 75 | Private Investor since prior to 2011. Former Chairman and CEO of Dupont Photomasks, Inc. (components of semi-conductor manufacturing). He has extensive operating leadership and venture capital investing experience, including five interim or full-time CEO roles, and prior service as general partner of institutional venture capital partnerships. He also has extensive non-profit board leadership experience, and currently serves on the boards of two education and science-related non-profit organizations. He has served as a director of one AB Fund since 1992, and director or trustee of multiple AB Funds since 2005. He has been Chairman of the AB Funds since January 2014, and the Chairman of the Independent Directors Committees of such AB Funds since February 2014. | 108 | Xilinx, Inc. (programmable logic semi-conductors) since 2007 | |||||
John H. Dobkin, # 74 | Independent Consultant since prior to 2011. Formerly, President of Save Venice, Inc. (preservation organization) from 2001-2002; Senior Advisor from June 1999-June 2000 and President of Historic Hudson Valley (historic preservation) from December 1989-May 1999. Previously, Director of the National Academy of Design. He has served as a director or trustee of various AB Funds since 1992, and as Chairman of the Audit Committees of a number of such AB Funds from 2001-2008. | 108 | None | |||||
| 76 | • AB CREDIT LONG/SHORT PORTFOLIO |
Management of the Fund
| NAME, ADDRESS*, AGE, (YEAR FIRST ELECTED**) | PRINCIPAL OCCUPATION(S) DURING PAST FIVE YEARS AND OTHER INFORMATION *** | PORTFOLIOS IN FUND COMPLEX OVERSEEN BY DIRECTOR | OTHER PUBLIC COMPANY DIRECTORSHIPS CURRENTLY HELD | |||||
DISINTERESTED DIRECTORS (continued) | ||||||||
Michael J. Downey, # 72 | Private Investor since prior to 2011. Formerly, managing partner of Lexington Capital, LLC (investment advisory firm) from December 1997 until December 2003. He served as a Director of Prospect Acquisition Corp. (financial services) from 2007 until 2009. From 1987 until 1993, Chairman and CEO of Prudential Mutual Fund Management, director of the Prudential mutual funds, and member of the Executive Committee of Prudential Securities Inc. He has served as a director or trustee of the AB Funds since 2005 and is a director and Chairman of one other registered investment company. | 108 | Asia Pacific Fund, Inc. (registered investment company) since prior to 2011 | |||||
William H. Foulk, Jr., # 84 | Investment Adviser and an Independent Consultant since prior to 2011. Previously, he was Senior Manager of Barrett Associates, Inc., a registered investment adviser. He was formerly Deputy Comptroller and Chief Investment Officer of the State of New York and, prior thereto, Chief Investment Officer of the New York Bank for Savings. He has served as a director or trustee of various AB Funds since 1983, and was Chairman of the Independent Directors Committees of the AB Funds from 2003 until early February 2014. He served as Chairman of such AB Funds from 2003 through December 2013. He is also active in a number of mutual fund related organizations and committees. | 108 | None | |||||
| AB CREDIT LONG/SHORT PORTFOLIO • | 77 |
Management of the Fund
| NAME, ADDRESS*, AGE, (YEAR FIRST ELECTED**) | PRINCIPAL OCCUPATION(S) DURING PAST FIVE YEARS AND OTHER INFORMATION*** | PORTFOLIOS IN FUND COMPLEX OVERSEEN BY DIRECTOR | OTHER PUBLIC COMPANY DIRECTORSHIPS CURRENTLY HELD | |||||
DISINTERESTED DIRECTORS (continued) | ||||||||
D. James Guzy, # 80 | Chairman of the Board of SRC Computers, Inc. (semi-conductors), with which he has been associated since prior to 2011. He served as Chairman of the Board of PLX Technology (semi-conductors) since prior to 2011 until November 2013. He was a director of Intel Corporation (semi-conductors) from 1969 until 2008, and served as Chairman of the Finance Committee of such company for several years until May 2008. He has served as a director or trustee of one or more of the AB Funds since 1982. | 108 | None | |||||
Nancy P. Jacklin, # 68 | Private Investor since prior to 2011. Professorial Lecturer at the Johns Hopkins School of Advanced International Studies (2008-2015) U.S. Executive Director of the International Monetary Fund (which is responsible for ensuring the stability of the international monetary system), (December 2002-May 2006); Partner, Clifford Chance (1992-2002); Sector Counsel, International Banking and Finance, and Associate General Counsel, Citicorp (1985-1992); Assistant General Counsel (International), Federal Reserve Board of Governors (1982-1985); and Attorney Advisor, U.S. Department of the Treasury (1973-1982). Member of the Bar of the District of Columbia and of New York; and member of the Council on Foreign Relations. She has served as a director or trustee of the AB Funds since 2006 and has been Chairman of the Governance and Nominating Committees of the AB Funds since August 2014. | 108 | None | |||||
| 78 | • AB CREDIT LONG/SHORT PORTFOLIO |
Management of the Fund
| NAME, ADDRESS*, AGE, (YEAR FIRST ELECTED**) | PRINCIPAL OCCUPATION(S) DURING PAST FIVE YEARS AND OTHER INFORMATION*** | PORTFOLIOS IN FUND COMPLEX OVERSEEN BY DIRECTOR | OTHER PUBLIC COMPANY DIRECTORSHIPS CURRENTLY HELD | |||||
DISINTERESTED DIRECTORS (continued) | ||||||||
Carol C. McMullen, # 61 (2016) | Managing Director of Slalom Consulting (consulting) since 2014 and private investor; Director of Norfolk & Dedham Group (mutual property and casualty insurance) since 2011; and Director of Partners Community Physicians Organization (healthcare) since 2014. Formerly, Managing Director of The Crossland Group (consulting) from 2012 to 2013. She has held a number of senior positions in the asset and wealth management industries, including at Eastern Bank (where her roles included President of Eastern Wealth Management), Thomson Financial (Global Head of Sales for Investment Management), and Putnam Investments (where her roles included Head of Global Investment Research). She has served on a number of private company and nonprofit boards, and as a director or trustee of the AB Funds since June 2016. | 108 | None | |||||
| AB CREDIT LONG/SHORT PORTFOLIO • | 79 |
Management of the Fund
| NAME, ADDRESS*, AGE, (YEAR FIRST ELECTED**) | PRINCIPAL OCCUPATION(S) DURING PAST FIVE YEARS AND OTHER INFORMATION*** | PORTFOLIOS IN FUND COMPLEX OVERSEEN BY DIRECTOR | OTHER PUBLIC COMPANY DIRECTORSHIPS CURRENTLY HELD | |||||
DISINTERESTED DIRECTORS (continued) | ||||||||
Garry L. Moody, # 64 (2014) | Independent Consultant. Formerly, Partner, Deloitte & Touche LLP (1995-2008) where he held a number of senior positions, including Vice Chairman, and U.S. and Global Investment Management Practice Managing Partner; President, Fidelity Accounting and Custody Services Company (1993-1995), where he was responsible for accounting, pricing, custody and reporting for the Fidelity mutual funds; and Partner, Ernst & Young LLP (1975-1993), where he served as the National Director of Mutual Fund Tax Services and Managing Partner of its Chicago Office Tax department. He is a member of the Trustee Advisory Board of BoardIQ, a biweekly publication focused on issues and news affecting directors of mutual funds. He has served as a director or trustee and as Chairman of the Audit Committees of the AB Funds since 2008. | 108 | None | |||||
Earl D. Weiner, # 77 (2014) | Of Counsel, and Partner prior to January 2007, of the law firm Sullivan & Cromwell LLP and is a former member of the ABA Federal Regulation of Securities Committee Task Force to draft editions of the Fund Director’s Guidebook. He also serves as a director or trustee of various non-profit organizations and has served as Chairman or Vice Chairman of a number of them. He has served as a director or trustee of the AB Funds since 2007 and served as Chairman of the Governance and Nominating Committees of the AB Funds from 2007 until August 2014. | 108 | None | |||||
| 80 | • AB CREDIT LONG/SHORT PORTFOLIO |
Management of the Fund
| * | The address for each of the Fund’s disinterested Directors is c/o AllianceBernstein L.P., Attention: Philip L. Kirstein, 1345 Avenue of the Americas, New York, NY 10105. |
| ** | There is no stated term of office for the Fund’s Directors. |
| *** | The information above includes each Director’s principal occupation during the last five years and other information relating to the experience, attributes and skills relevant to each Director’s qualifications to serve as a Director, which led to the conclusion that each Director should serve as a Director for the Fund. |
| + | Mr. Keith is an “interested person” of the Portfolio as defined in the Investment Company Act of 1940, due to his position as a Senior Vice President of the Adviser. |
| # | Member of the Audit Committee, the Governance and Nominating Committee and the Independent Directors Committee. |
| AB CREDIT LONG/SHORT PORTFOLIO • | 81 |
Management of the Fund
Officer Information
Certain information concerning the Fund’s Officers is listed below.
NAME, ADDRESS*, AND AGE | POSITION(S) HELD WITH FUND | PRINCIPAL OCCUPATION DURING PAST 5 YEARS | ||
Robert M. Keith 56 | President and Chief Executive Officer | See biography above. | ||
Philip L. Kirstein 71 | Senior Vice President and Independent Compliance Officer | Senior Vice President and Independent Compliance Officer of the AB Funds, with which he has been associated since October 2004. Prior thereto, he was Of Counsel to Kirkpatrick & Lockhart, LLP from October 2003 to October 2004, and General Counsel of Merrill Lynch Investment Managers, L.P. since prior to March 2003. | ||
Gershon M. Distenfeld 41 | Vice President | Senior Vice President of the Adviser**, with which he has been associated since prior to 2011. | ||
Sherif M. Hamid 40 | Vice President | Senior Vice President of the Adviser**, with which he has been associated since 2013. Prior thereto, he was head of European Credit Strategy at Barclays Capital from 2011 to 2013. | ||
Robert Schwartz 44 | Vice President | Senior Vice President of the Adviser**, with which he has been associated since 2012. Prior thereto, he was a senior credit analyst at Bell Point Capital Management since prior to 2011. | ||
Ivan Rudolph-Shabinsky 52 | Vice President | Senior Vice President of the Adviser**, with which he has been associated since prior to 2011. | ||
Ashish C. Shah 46 | Vice President | Senior Vice President of the Adviser** with which he has been associated since prior to 2011. | ||
Emilie D. Wrapp 61 | Secretary | Senior Vice President, Assistant General Counsel and Assistant Secretary of ABI**, with which she has been associated since prior to 2011. | ||
| 82 | • AB CREDIT LONG/SHORT PORTFOLIO |
Management of the Fund
NAME, ADDRESS*, AND AGE | POSITION(S) HELD WITH FUND | PRINCIPAL OCCUPATION DURING PAST 5 YEARS | ||
Joseph J. Mantineo 57 | Treasurer and Chief Financial Officer | Senior Vice President of ABIS**, with which he has been associated since prior to 2011. | ||
Vincent S. Noto 52 | Chief Compliance Officer | Senior Vice President since 2015 and Mutual Fund Chief Compliance Officer of the Adviser** since 2014. Prior thereto, he was Vice President and Director of Mutual Fund Compliance of the Adviser** since 2011. | ||
Phyllis J. Clarke 55 | Controller | Vice President of ABIS**, with which she has been associated since prior to 2011. |
| * | The address for each of the Fund’s Officers is 1345 Avenue of the Americas, New York, NY 10105. |
| ** | The Adviser, ABI and ABIS are affiliates of the Fund. |
| The Fund’s Statement of Additional Information (“SAI”) has additional information about the Fund’s Directors and Officers and is available without charge upon request. Contact your financial representative or AB at 1-(800) 227-4618, or visit www.abfunds.com, for a free prospectus or SAI. |
| AB CREDIT LONG/SHORT PORTFOLIO • | 83 |
Management of the Fund
Information Regarding the Review and Approval of the Portfolio’s Investment Advisory Contract
The disinterested directors (the “directors”) of AB Bond Fund, Inc. (the “Fund”) unanimously approved the continuance of the Fund’s Investment Advisory Contract (the “Advisory Agreement”) with the Adviser in respect of AB Credit Long/Short Portfolio (the “Portfolio”) at a meeting held on November 3-5, 2015.
Prior to approval of the continuance of the Advisory Agreement in respect of the Portfolio, the directors had requested from the Adviser, and received and evaluated, extensive materials. They reviewed the proposed continuance of the Advisory Agreement with the Adviser and with experienced counsel who are independent of the Adviser, who advised on the relevant legal standards. The directors also reviewed an independent evaluation prepared by the Fund’s Senior Officer (who is also the Fund’s Independent Compliance Officer) of the reasonableness of the advisory fee, in which the Senior Officer concluded that the contractual fee for the Portfolio was reasonable. The directors also discussed the proposed continuance in private sessions with counsel and the Fund’s Senior Officer.
The directors considered their knowledge of the nature and quality of the services provided by the Adviser to the Portfolio gained from their experience as directors or trustees of most of the registered investment companies advised by the Adviser, their overall confidence in the Adviser’s integrity and competence they have gained from that experience, the Adviser’s initiative in identifying and raising potential issues with the directors and its responsiveness, frankness and attention to concerns raised by the directors in the past, including the Adviser’s willingness to consider and implement organizational and operational changes designed to improve investment results and the services provided to the AB Funds. The directors noted that they have four regular meetings each year, at each of which they receive presentations from the Adviser on the investment results of the Portfolio and review extensive materials and information presented by the Adviser.
The directors also considered all other factors they believed relevant, including the specific matters discussed below. In their deliberations, the directors did not identify any particular information that was all-important or controlling, and different directors may have attributed different weights to the various factors. The directors determined that the selection of the Adviser to manage the Portfolio, and the overall arrangements between the Portfolio and the Adviser, as provided in the Advisory Agreement, including the advisory fee, were fair and reasonable in light of the services performed, expenses incurred and such other matters as the directors considered relevant in the exercise of their
| 84 | • AB CREDIT LONG/SHORT PORTFOLIO |
business judgment. The material factors and conclusions that formed the basis for the directors’ determinations included the following:
Nature, Extent and Quality of Services Provided
The directors considered the scope and quality of services provided by the Adviser under the Advisory Agreement, including the quality of the investment research capabilities of the Adviser and the other resources it has dedicated to performing services for the Portfolio. They also noted the professional experience and qualifications of the Portfolio’s portfolio management team and other senior personnel of the Adviser. The directors also considered that the Advisory Agreement provides that the Portfolio will reimburse the Adviser for the cost to it of providing certain clerical, accounting, administrative and other services to the Portfolio by employees of the Adviser or its affiliates. Requests for these reimbursements are made on a quarterly basis and subject to approval by the directors. Reimbursements, to the extent requested and paid, result in a higher rate of total compensation from the Portfolio to the Adviser than the fee rate stated in the Portfolio’s Advisory Agreement. The directors noted that the methodology used to determine the reimbursement amounts had been reviewed by an independent consultant retained by the Fund’s Senior Officer. The quality of administrative and other services, including the Adviser’s role in coordinating the activities of the Portfolio’s other service providers, also was considered. The directors concluded that, overall, they were satisfied with the nature, extent and quality of services provided to the Portfolio under the Advisory Agreement.
Costs of Services Provided and Profitability
The directors reviewed a schedule of the revenues, expenses and related notes indicating the profitability of the Portfolio to the Adviser for the period ended December 31, 2014 that had been prepared with an expense limitation methodology arrived at in consultation with an independent consultant retained by the Fund’s Senior Officer. The directors noted the assumptions and methods of allocation used by the Adviser in preparing fund-specific profitability data and understood that there are a number of potentially acceptable allocation methodologies for information of this type. The directors noted that the profitability information reflected all revenues and expenses of the Adviser’s relationship with the Portfolio, including those relating to its subsidiaries that provide transfer agency and distribution services to the Portfolio. The directors recognized that it is difficult to make comparisons of the profitability of the Advisory Agreement with the profitability of advisory contracts for unaffiliated funds because comparative information is not generally publicly available and is affected by numerous factors. The directors focused on the profitability of the Adviser’s relationship with
| AB CREDIT LONG/SHORT PORTFOLIO • | 85 |
the Portfolio before taxes and distribution expenses. The directors noted that the Adviser’s relationship with the Portfolio was not profitable to it in 2014.
Fall-Out Benefits
The directors considered the other benefits to the Adviser and its affiliates from their relationships with the Portfolio, including, but not limited to, benefits relating to 12b-1 fees and sales charges received by the Fund’s principal underwriter (which is a wholly owned subsidiary of the Adviser) in respect of certain classes of the Portfolio’s shares and transfer agency fees paid by the Portfolio to a wholly owned subsidiary of the Adviser. The directors recognized that the Portfolio’s unprofitability to the Adviser would be exacerbated without these benefits. The directors also understood that the Adviser also might derive reputational and other benefits from its association with the Portfolio.
Investment Results
In addition to the information reviewed by the directors in connection with the meeting, the directors receive detailed performance information for the Portfolio at each regular Board meeting during the year. At the November 2015 meeting, the directors reviewed information prepared by Broadridge showing the performance of the Class A Shares of the Portfolio as compared with that of a group of similar funds selected by Broadridge (the “Performance Group”) and as compared with that of a broad array of funds selected by Broadridge (the “Performance Universe”), and information prepared by the Adviser showing the performance of the Class A Shares as compared with the Bank of America Merrill Lynch 3 Month U.S. Treasury Bill Index (the “Index”), in each case for the 1-year period ended July 31, 2015 and (in the case of comparisons with the Index) the period since inception (May 2014 inception). The directors noted that the Portfolio was in the 3rd quintile of the Performance Group and the Performance Universe for the 1-year period. The Portfolio lagged the Index in the 1-year period and the period since inception. Based on their review, the directors concluded that the Portfolio’s performance was satisfactory.
Advisory Fees and Other Expenses
The directors considered the advisory fee rate paid by the Portfolio to the Adviser and information prepared by Broadridge concerning advisory fee rates paid by other funds in the same Broadridge category as the Portfolio at a common asset level. The directors recognized that it is difficult to make comparisons of advisory fees because there are variations in the services that are included in the fees paid by other funds. The directors noted that, at the Portfolio’s current size, its contractual advisory fee rate of 90 basis points was lower than the Expense Group median. The directors noted that the expense reimbursement was 19 basis points in the
| 86 | • AB CREDIT LONG/SHORT PORTFOLIO |
Portfolio’s latest fiscal period, and that as a result the rate of total compensation received by the Adviser pursuant to the Advisory Agreement was more than the Expense Group median.
The directors also considered the Adviser’s fee schedule for non-fund clients pursuing a similar investment style. For this purpose, they reviewed the relevant advisory fee information from the Adviser’s Form ADV and the evaluation from the Fund’s Senior Officer. The directors noted that the institutional fee schedule started at a rate equal to the Portfolio’s flat rate but had breakpoints. The assets of the Portfolio were lower than the first breakpoint in the institutional fee schedule so application of that fee schedule to the Portfolio’s net assets would result in a fee rate the same as that under the Portfolio’s Advisory Agreement. The directors noted that the Adviser may, in some cases, agree to fee rates with large institutional clients that are lower than those reviewed by the directors and that they had previously discussed with the Adviser its policies in respect of such arrangements.
The Adviser reviewed with the directors the significantly greater scope of the services it provides to the Portfolio relative to institutional clients. The Adviser also noted that because mutual funds are constantly issuing and redeeming shares, they are more difficult to manage than an institutional account, where the assets tend to be relatively stable. In light of the substantial differences in services rendered by the Adviser to institutional clients as compared to funds such as the Portfolio, the directors considered these fee comparisons inapt and did not place significant weight on them in their deliberations.
The directors noted that the Portfolio invests in shares of exchange-traded funds (“ETFs”), subject to the restrictions and limitations of the Investment Company Act of 1940 as these may be varied as a result of exemptive orders issued by the SEC. The directors also noted that ETFs pay advisory fees pursuant to their advisory contracts, and that the Adviser had provided, and they had reviewed, information about the expense ratio of the relevant ETFs. The directors concluded, based on the Adviser’s explanation of how it uses ETFs when they are the most cost-effective way to obtain desired exposures for a fund or to temporarily “equitize” cash inflows pending purchases of underlying securities, that the advisory fee for the Portfolio would be paid for services that would be in addition to, rather than duplicative of, the services to be provided under the advisory contracts of the ETFs.
The directors also considered the total expense ratio of the Class A shares of the Portfolio in comparison to the fees and expenses of funds within two comparison groups created by Broadridge: an Expense Group and an
| AB CREDIT LONG/SHORT PORTFOLIO • | 87 |
Expense Universe. Broadridge described an Expense Group as a representative sample of funds similar to the Portfolio and an Expense Universe as a broader group than the Expense Group, consisting of all funds in the investment classification/objective with a similar load type as the Portfolio. The Class A expense ratio of the Portfolio was based on the Portfolio’s latest fiscal period and reflected fee waivers and/or expense reimbursements as a result of an expense limitation agreement between the Adviser and the Fund in respect of the Portfolio. The directors noted that it was likely that the expense ratios of some of the other funds in the Portfolio’s Broadridge category also were lowered by waivers or reimbursements by those funds’ investment advisers, which in some cases might be voluntary or temporary. The directors view the expense ratio information as relevant to their evaluation of the Adviser’s services because the Adviser is responsible for coordinating services provided to the Portfolio by others.
The directors noted that the Portfolio’s total expense ratio, reflecting a cap by the Adviser, was lower than the Expense Group median and higher than the Expense Universe median. The directors concluded that the Portfolio’s expense ratio was satisfactory.
Economies of Scale
The directors noted that the advisory fee schedule for the Portfolio does not contain breakpoints and that they had discussed their strong preference, and that of the Senior Officer, for breakpoints in advisory contracts with the Adviser. The directors took into consideration prior presentations by an independent consultant on economies of scale in the mutual fund industry and for the AB Funds, and by the Adviser concerning certain of its views on economies of scale. The directors also had requested and received from the Adviser certain updates on economies of scale at the May 2015 meetings. The directors believe that economies of scale may be realized (if at all) by the Adviser across a variety of products and services, and not only in respect of a single fund. The directors noted that there is no established methodology for setting breakpoints that give effect to the fund-specific services provided by a fund’s adviser and to the economies of scale that an adviser may realize in its overall mutual fund business or those components of it which directly or indirectly affect a fund’s operations. The directors observed that in the mutual fund industry as a whole, as well as among funds similar to the Portfolio, there is no uniformity or pattern in the fees and asset levels at which breakpoints (if any) apply. The directors also noted that the advisory agreements for many funds do not have breakpoints at all. The directors informed the Adviser that they would monitor the Portfolio’s assets (which were well below the level at which they would anticipate adding an initial breakpoint) and its profitability to the Adviser (currently unprofitable) and anticipated revisiting the question of breakpoints in the future if circumstances warranted doing so.
| 88 | • AB CREDIT LONG/SHORT PORTFOLIO |
THIS PAGE IS NOT PART OF THE SHAREHOLDER REPORT OR THE FINANCIAL STATEMENTS
AB FAMILY OF FUNDS
US EQUITY
US Core
Core Opportunities Fund
Select US Equity Portfolio
US Growth
Concentrated Growth Fund
Discovery Growth Fund
Growth Fund
Large Cap Growth Fund
Small Cap Growth Portfolio
US Value
Discovery Value Fund
Equity Income Fund
Growth & Income Fund
Small Cap Value Portfolio
Value Fund
INTERNATIONAL/ GLOBAL EQUITY
International/Global Core
Global Core Equity Portfolio
Global Equity & Covered Call Strategy Fund
International Portfolio
International Strategic Core Portfolio
Sustainable Global Thematic Fund*
Tax-Managed International Portfolio
International/Global Growth
International Growth Fund
International/Global Value
Asia ex-Japan Equity Portfolio
International Value Fund
FIXED INCOME
Municipal
High Income Municipal Portfolio
Intermediate California Municipal Portfolio
Intermediate Diversified Municipal Portfolio
Intermediate New York Municipal Portfolio
FIXED INCOME (continued)
Municipal Bond Inflation Strategy
Tax-Aware Fixed Income Portfolio
National Portfolio
Arizona Portfolio
California Portfolio
Massachusetts Portfolio
Michigan Portfolio
Minnesota Portfolio
New Jersey Portfolio
New York Portfolio
Ohio Portfolio
Pennsylvania Portfolio
Virginia Portfolio
Taxable
Bond Inflation Strategy
Global Bond Fund
High Income Fund
High Yield Portfolio
Income Fund
Intermediate Bond Portfolio
Limited Duration High Income Portfolio
Short Duration Portfolio
ALTERNATIVES
All Market Real Return Portfolio
Credit Long/Short Portfolio
Global Real Estate Investment Fund
Long/Short Multi-Manager Fund
Multi-Manager Alternative Strategies Fund
Select US Long/Short Portfolio
Unconstrained Bond Fund
MULTI-ASSET
All Market Income Portfolio
Emerging Markets Multi-Asset Portfolio
Global Risk Allocation Fund
MULTI-ASSET (continued)
Target-Date
Multi-Manager Select Retirement Allocation Fund
Multi-Manager Select 2010 Fund
Multi-Manager Select 2015 Fund
Multi-Manager Select 2020 Fund
Multi-Manager Select 2025 Fund
Multi-Manager Select 2030 Fund
Multi-Manager Select 2035 Fund
Multi-Manager Select 2040 Fund
Multi-Manager Select 2045 Fund
Multi-Manager Select 2050 Fund
Multi-Manager Select 2055 Fund
Wealth Strategies
Balanced Wealth Strategy
Conservative Wealth Strategy
Wealth Appreciation Strategy
Tax-Managed Balanced Wealth Strategy
Tax-Managed Wealth Appreciation Strategy
CLOSED-END FUNDS
AB Multi-Manager Alternative Fund
Alliance California Municipal Income Fund
AllianceBernstein Global High Income Fund
AllianceBernstein National Municipal Income Fund
We also offer Government Exchange Reserves, which serves as the money market fund exchange vehicle for the AB mutual funds. An investment in Government Exchange Reserves is not a deposit in a bank and is not insured or guaranteed by the Federal Deposit Insurance Corporation or any other government agency. Although the Fund seeks to preserve the value of your investment at $1.00 per share, it is possible to lose money by investing in the Fund.
Investors should consider the investment objectives, risks, charges and expenses of the Fund carefully before investing. For copies of our prospectus or summary prospectus, which contain this and other information, visit us online at www.abfunds.com or contact your AB representative. Please read the prospectus and/or summary prospectus carefully before investing.
* Prior to November 1, 2016, the Fund was named Global Thematic Growth Fund.
| AB CREDIT LONG/SHORT PORTFOLIO • | 89 |
AB Family of Funds
NOTES
| 90 | • AB CREDIT LONG/SHORT PORTFOLIO |
NOTES
| AB CREDIT LONG/SHORT PORTFOLIO • | 91 |
NOTES
| 92 | • AB CREDIT LONG/SHORT PORTFOLIO |
AB CREDIT LONG/SHORT PORTFOLIO
1345 Avenue of the Americas
New York, NY 10105
800.221.5672
CLS-0151-1016 
OCT 10.31.16

ANNUAL REPORT
AB HIGH YIELD PORTFOLIO
Investment Products Offered
•Are Not FDIC Insured •May Lose Value •Are Not Bank Guaranteed |
Investors should consider the investment objectives, risks, charges and expenses of the Fund carefully before investing. For copies of our prospectus or summary prospectus, which contain this and other information, visit us online at www.abfunds.com or contact your AB representative. Please read the prospectus and/or summary prospectus carefully before investing.
This shareholder report must be preceded or accompanied by the Fund’s prospectus for individuals who are not current shareholders of the Fund.
You may obtain a description of the Fund’s proxy voting policies and procedures, and information regarding how the Fund voted proxies relating to portfolio securities during the most recent 12-month period ended June 30, without charge. Simply visit AB’s website at www.abfunds.com, or go to the Securities and Exchange Commission’s (the “Commission”) website at www.sec.gov, or call AB at (800) 227-4618.
The Fund files its complete schedule of portfolio holdings with the Commission for the first and third quarters of each fiscal year on Form N-Q. The Fund’s Forms N-Q are available on the Commission’s website at www.sec.gov. The Fund’s Forms N-Q may also be reviewed and copied at the Commission’s Public Reference Room in Washington, DC; information on the operation of the Public Reference Room may be obtained by calling (800) SEC-0330. AB publishes full portfolio holdings for the Fund monthly at www.abfunds.com.
AllianceBernstein Investments, Inc. (ABI) is the distributor of the AB family of mutual funds. ABI is a member of FINRA and is an affiliate of AllianceBernstein L.P., the Adviser of the funds.
The [A/B] logo is a registered service mark of AllianceBernstein and AllianceBernstein® is a registered service mark used by permission of the owner, AllianceBernstein L.P.
December 15, 2016
Annual Report
This report provides management’s discussion of fund performance for AB High Yield Portfolio (the “Fund”) for the annual reporting period ended October 31, 2016.
The performance information discussed below reflects in part the historical performance of the High Yield Portfolio, a series of The AB Pooling Portfolios (the “Accounting Survivor”), and is based on the net asset value (“NAV”) per share of the Accounting Survivor prior to the reorganization of the Accounting Survivor into the Fund at the close of business July 26, 2016 (the “Reorganization”) and the Fund thereafter. Upon completion of the Reorganization, Class A, Class C, Advisor Class, Class R, Class K, Class I and Class Z shares of the Fund assumed the performance, financial and other historical information of the Accounting Survivor, and the Fund adopted the fiscal year end of the Accounting Survivor, August 31. The Fund subsequently changed its fiscal year end to October 31. Performance information of Class A, Class C, Advisor Class, Class R, Class K and Class I shares for periods prior to the Reorganization is the performance of the Fund’s Class Z shares, which is based on the Accounting Survivor’s performance, and is adjusted to reflect the respective expense ratios of the Class A, Class C, Advisor Class, Class R, Class K and Class I shares. The Accounting Survivor and the Fund have substantially similar investment objectives and strategies.
Disclosure differences between the investment objectives and strategies for the Accounting Survivor and the Fund have not resulted in substantial differences in the actual management of the Funds, and the Reorganization is not expected to result in substantial changes in the actual management of the Fund. The portfolio managers of the Accounting Survivor are members of the portfolio management team of the Fund. The Fund has higher expenses than the Accounting Survivor (including a management fee, transfer agency and shareholder servicing fees). The Accounting Survivor’s performance would have been lower than that shown had it operated at the Fund’s current expense levels.
Investment Objectives and Policies
The Fund’s investment objective is to seek to maximize total return consistent with prudent investment management. At least 80% of the Fund’s net assets will, under normal circumstances, be invested in fixed-income securities rated Ba1 or lower by Moody’s Investors Service or BB+ or lower by Standard & Poor’s Ratings Services or Fitch Ratings (commonly known as “junk bonds”), unrated securities considered by AllianceBernstein L.P. (the “Adviser”) to be of comparable quality, and related derivatives. The Fund may invest in fixed-income securities with a range of maturities from short- to long-term. The Fund may also invest in equity securities.
| AB HIGH YIELD PORTFOLIO • | 1 |
In selecting securities for purchase or sale by the Fund, the Adviser attempts to take advantage of inefficiencies that it believes exist in the global debt markets. These inefficiencies arise from investor behavior, market complexity, and the investment limitations to which investors are subject. The Adviser combines quantitative analysis with fundamental credit and economic research in seeking to exploit these inefficiencies.
The Fund will most often invest in securities of US issuers, but may also purchase fixed-income securities of foreign issuers, including securities denominated in foreign currencies. Fluctuations in currency exchange rates can have a dramatic impact on the returns of fixed-income securities denominated in foreign currencies. The Adviser may or may not hedge any foreign currency exposure through the use of currency-related derivatives.
The Fund expects to use derivatives, such as options, futures, forwards and swaps, to a significant extent. Derivatives may provide a more efficient and economical exposure to market segments than direct investments, and may also be a more efficient way to alter the Fund’s exposure. The Fund may, for example, use credit default and interest rate swaps to gain exposure to the fixed-income markets or particular fixed-income securities and, as noted above, may use currency derivatives. The Adviser may use derivatives to effectively leverage the
Fund by creating aggregate market exposure substantially in excess of the Fund’s net assets.
Investment Results
The table on page 8 shows the Fund’s performance compared to its benchmark, the Bloomberg Barclays US Corporate High Yield (“HY”) 2% Issuer Capped Index, for the two-, six- and 12-month periods ended October 31, 2016.
All share classes underperformed the benchmark in all three periods, before sales charges. Industry allocation detracted in all three periods, relative to the benchmark, largely due to overweights in the energy and basics sectors. An overweight to the financials sector also detracted. An overweight position in non-government guaranteed agencies contributed in the six- and 12-month periods, while an exposure to commercial mortgage-backed securities proved beneficial in the two-month period. Security selection weighed on performance in the six- and 12-month periods, because of losses from selection in the energy, consumer non-cyclicals and other industrials sectors. Security selection in basics detracted in the six-month period. In the 12-month period, security selection within telecommunications detracted, while selection in basics had a positive impact on returns. In the two-month period, security selection contributed to performance, as gains from selection within the basics, automotive and technology sectors outweighed negative returns from
| 2 | • AB HIGH YIELD PORTFOLIO |
selection in consumer non-cyclicals and energy. Yield-curve positioning had an immaterial impact on performance in the two-month period, but contributed in the six- and 12-month periods, due to an underweight to five-year maturities and overweight in the 20- and 30-year parts of the curve.
During the three periods, the Fund utilized currency forwards to hedge currency exposure as well as to manage active currency risk. Purchased and written equity options were also used for hedging and non-hedging purposes. Total return swaps and credit default swaps (both single name and index), were used to hedge credit risk as well as to take active credit and growth risk. Treasury futures and interest rate swaps were used to manage duration, country exposure and yield-curve positioning. Swaptions were used to take active risk in an effort to add alpha.
Market Review and Investment Strategy
Bond markets generally increased in absolute terms over the 12-month period ended October 31, 2016, as global growth trends and central bank action in the world’s largest economies continued to diverge. After declining through the end of 2015 and beginning of 2016, oil prices rebounded through much of the period on the back of decreased global supply—which contributed to a rally in emerging-market debt sectors—though prices moved downward in October on the
market’s rising skepticism that OPEC would reach a deal to limit crude production. Emerging-market sentiment was further boosted on positive political developments in Argentina and Brazil toward the end of the period.
In December 2015, the US Federal Reserve (the “Fed”) hiked rates for the first time in over nine years—a move that had been well-telegraphed and widely anticipated, and was generally accepted smoothly by bond investors. After some slower-than-expected US economic data through the first half of 2016, the Fed’s tone turned more hawkish in September (despite rates remaining unchanged) on the back of continued strengthening in the US labor market and growth in economic activity. In October, third quarter US GDP posted its best quarterly gain in two years (largely because of a surge in agricultural exports).
Central banks around the globe cut rates during the annual period, with some, including the Bank of Japan and the European Central Bank, dipping into negative rate territory. Volatility in Europe (and globally) spiked sharply in June after the UK voted to leave the European Union, a decision that was largely a surprise to investors. While investors initially responded by selling risk-sensitive assets, markets outside Europe quickly recovered. European markets began to stabilize as well, helped by the Bank of England’s first rate cut in seven years—to an
| AB HIGH YIELD PORTFOLIO • | 3 |
historic low—and an aggressive asset-purchase program. Elsewhere, central banks in Australia and New Zealand also moved rates to record lows, while fiscal and monetary policy developments in Japan disappointed investors, who were expecting rate cuts or additional quantitative easing.
Yields in most developed markets fell in the six- and 12-month periods, with UK yields reaching historic lows in the months following the Brexit referendum in June, but generally rose in the two-month period. At the end of the 12-month period, trillions of dollars’ worth of government debt around the world lingered in negative territory. In the six- and 12-month periods, developed-market treasuries generally outperformed emerging-market local-currency government bonds and investment-grade credit securities, but lagged the rally in global high yield. In the two-month period,
developed-market treasuries generally underperformed investment-grade and emerging-market local government bonds, which themselves trailed the rebound in global high-yield markets. Energy and basics were among the top performing sectors in all three periods, largely due to positive oil price action, while consumer-related sectors lagged the rising market.
On November 8, 2016, Donald Trump was elected as the 45th president of the United States, and the Congressional election outcome resulted in the Republican Party maintaining control of both the House of Representatives and the Senate. The Adviser believes that it will take time before the world has a clearer picture of the short- and long-term impact of the elections on the US economy and markets in general. The Adviser continues to monitor the markets, including for potential market volatility.
| 4 | • AB HIGH YIELD PORTFOLIO |
DISCLOSURES AND RISKS
Benchmark Disclosure
The Bloomberg Barclays US Corporate HY 2% Issuer Capped Index is unmanaged and does not reflect fees and expenses associated with the active management of a mutual fund portfolio. The Bloomberg Barclays US Corporate HY 2% Issuer Capped Index is the 2% Issuer Capped component of the US Corporate High Yield Index. The Bloomberg Barclays US Corporate HY Index represents the performance of fixed-income securities having a maximum quality rating of Ba1, a minimum amount outstanding of $150 million and at least one year to maturity. An investor cannot invest directly in an index or average, and their results are not indicative of the performance for any specific investment, including the Fund.
A Word About Risk
Market Risk: The value of the Fund’s assets will fluctuate as the bond or stock market fluctuates. The value of its investments may decline, sometimes rapidly and unpredictably, simply because of economic changes or other events that affect large portions of the market.
Interest Rate Risk: Changes in interest rates will affect the value of investments in fixed-income securities. When interest rates rise, the value of investments in fixed-income securities tends to fall and this decrease in value may not be offset by higher income from new investments. The Fund may be subject to a greater risk of rising interest rates as the recent period of historically low rates is beginning to end and rates have begun rising. Interest rate risk is generally greater for fixed-income securities with longer maturities or durations.
Credit Risk: An issuer or guarantor of a fixed-income security, or the counterparty to a derivatives or other contract, may be unable or unwilling to make timely payments of interest or principal, or to otherwise honor its obligations. The issuer or guarantor may default, causing a loss of the full principal amount of a security and accrued interest. The degree of risk for a particular security may be reflected in its credit rating. There is the possibility that the credit rating of a fixed-income security may be downgraded after purchase, which may adversely affect the value of the security.
Below Investment Grade Securities Risk: Investments in fixed-income securities with lower ratings (commonly known as “junk bonds”) are subject to a higher probability that an issuer will default or fail to meet its payment obligations. These securities may be subject to greater price volatility, due to such factors as specific corporate developments, negative perceptions of the junk bond market generally and less secondary market liquidity.
(Disclosures, Risks and Note about Historical Performance continued on next page)
| AB HIGH YIELD PORTFOLIO • | 5 |
Disclosures and Risks
DISCLOSURES AND RISKS
(continued from previous page)
Duration Risk: Duration is a measure that relates the expected price volatility of a fixed-income security to changes in interest rates. The duration of a fixed-income security may be shorter than or equal to full maturity of a fixed-income security. Fixed-income securities with longer durations have more risk and will decrease in price as interest rates rise. For example, a fixed-income security with a duration of three years will decrease in value by approximately 3% if interest rates increase by 1%.
Inflation Risk: This is the risk that the value of assets or income from investments will be less in the future as inflation decreases the value of money. As inflation increases, the value of the Fund’s assets can decline as can the value of the Fund’s distributions. This risk is significantly greater if the Fund invests a significant portion of its assets in fixed-income securities with longer maturities.
Derivatives Risk: Derivatives may be illiquid, difficult to price, and leveraged so that small changes may produce disproportionate losses for the Fund, and may be subject to counterparty risk to a greater degree than more traditional investments.
Leverage Risk: To the extent the Fund uses leveraging techniques, its NAV may be more volatile because leverage tends to exaggerate the effect of changes in interest rates and any increase or decrease in the value of the Fund’s investments.
Foreign (Non-US) Risk: Investments in securities of non-US issuers may involve more risk than those of US issuers. These securities may fluctuate more widely in price and may be less liquid due to adverse market, economic, political, regulatory or other factors.
Emerging Market Risk: Investments in emerging-market countries may have more risk because the markets are less developed and less liquid, and because these investments may be subject to increased economic, political, regulatory or other uncertainties.
Currency Risk: Fluctuations in currency exchange rates may negatively affect the value of the Fund’s investments or reduce its returns.
Diversification Risk: The Fund may have more risk because it is “non-diversified”, meaning that it can invest more of its assets in a smaller number of issuers. Accordingly, changes in the value of a single security may have a more significant effect, either negative or positive, on the Fund’s NAV.
Liquidity Risk: Liquidity risk occurs when certain investments become difficult to purchase or sell. Difficulty in selling less liquid securities may result in sales at disadvantageous prices affecting the value of your investment in the Fund. Causes of liquidity risk may include low trading volumes, large positions and heavy redemptions of Fund shares.
(Disclosures, Risks and Note about Historical Performance continued on next page)
| 6 | • AB HIGH YIELD PORTFOLIO |
Disclosures and Risks
DISCLOSURES AND RISKS
(continued from previous page)
Over recent years liquidity risk has also increased because the capacity of dealers in the secondary market for fixed-income securities to make markets in these securities has decreased, even as the overall bond market has grown significantly, due to, among other things, structural changes, additional regulatory requirements and capital and risk restraints that have led to reduced inventories. Liquidity risk may be higher in a rising interest rate environment, when the value and liquidity of fixed-income securities generally decline.
Management Risk: The Fund is subject to management risk because it is an actively managed investment fund. The Adviser will apply its investment techniques and risk analyses in making investment decisions, but there is no guarantee that its techniques will produce the intended results.
These risks are fully discussed in the Fund’s prospectus. As with all investments, you may lose money by investing in the Fund.
An Important Note About Historical Performance
The investment return and principal value of an investment in the Fund will fluctuate, so that shares, when redeemed, may be worth more or less than their original cost. Performance shown on the following pages represents past performance and does not guarantee future results. Current performance may be lower or higher than the performance information shown. You may obtain performance information current to the most recent month-end by visiting www.abfunds.com.
All fees and expenses related to the operation of the Fund have been deducted. NAV returns do not reflect sales charges; if sales charges were reflected, the Fund’s quoted performance would be lower. SEC returns reflect the applicable sales charges for each share class: a 4.25% maximum front-end sales charge for Class A shares and a 1% 1-year contingent deferred sales charge for Class C shares. Returns for the different share classes will vary due to different expenses associated with each class. Performance assumes reinvestment of distributions and does not account for taxes.
| AB HIGH YIELD PORTFOLIO • | 7 |
Disclosures and Risks
HISTORICAL PERFORMANCE
THE FUND VS. ITS BENCHMARK PERIODS ENDED OCTOBER 31, 2016 (unaudited) | NAV Returns | |||||||||||||||
| 2 Months | 6 Months | 12 Months | ||||||||||||||
| AB High Yield Portfolio* | ||||||||||||||||
Class A | 0.80% | 6.02% | 7.71% | |||||||||||||
| ||||||||||||||||
Class C | 0.67% | 5.62% | 6.91% | |||||||||||||
| ||||||||||||||||
Advisor Class† | 0.84% | 6.15% | 7.98% | |||||||||||||
| ||||||||||||||||
Class R† | 0.75% | 5.89% | 7.44% | |||||||||||||
| ||||||||||||||||
Class K† | 0.80% | 6.03% | 7.72% | |||||||||||||
| ||||||||||||||||
Class I† | 0.84% | 6.15% | 7.98% | |||||||||||||
| ||||||||||||||||
Class Z† | 0.84% | 6.04% | 7.87% | |||||||||||||
| ||||||||||||||||
| Bloomberg Barclays US Corporate HY 2% Issuer Capped Index | 1.06% | 7.59% | 10.16% | |||||||||||||
| ||||||||||||||||
* Performance is based on the NAV per share of the Accounting Survivor prior to the Reorganization. Includes the impact of proceeds received and credited to the Fund resulting from class-action settlements, which enhanced the performance of the Fund for the two-, six- and 12-month periods ended October 31, 2016, by 0.00%, 0.02% and 0.02%, respectively. The returns shown are based on net asset values calculated for shareholder transactions and may differ from the returns shown in the Financial Highlights, which reflect adjustments made to the net asset values in accordance with accounting principles generally accepted in the United States of America.
† Please note that these share classes are for investors purchasing shares through accounts established under certain fee-based programs sponsored and maintained by certain broker-dealers and financial intermediaries, institutional pension plans and/or investment advisory clients of, and certain other persons associated with, the Adviser and its affiliates or the Fund. |
| |||||||||||||||
See Disclosures, Risks and Note about Historical Performance on pages 5-7.
(Historical Performance continued on next page)
| 8 | • AB HIGH YIELD PORTFOLIO |
Historical Performance
HISTORICAL PERFORMANCE
(continued from previous page)
GROWTH OF A $10,000 INVESTMENT IN THE FUND
10/31/06 TO 10/31/16 (unaudited)
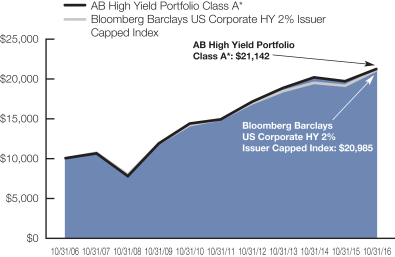
This chart illustrates the total value of an assumed $10,000 investment in AB High Yield Portfolio Class A shares (from 10/31/06 to 10/31/16) as compared to the performance of the Fund’s benchmark. The chart assumes the reinvestment of dividends and capital gains distributions.
| * | Performance is based on the NAV per share of the Accounting Survivor prior to the Reorganization. |
See Disclosures, Risks and Note about Historical Performance on pages 5-7.
(Historical Performance continued on next page)
| AB HIGH YIELD PORTFOLIO • | 9 |
Historical Performance
HISTORICAL PERFORMANCE
(continued from previous page)
| AVERAGE ANNUAL RETURNS AS OF OCTOBER 31, 2016 (unaudited) | ||||||||||||
| NAV Returns | SEC Returns* (reflects applicable sales charges) | SEC Yields† | ||||||||||
| Class A Shares | 1.26 | % | ||||||||||
1 Year | 7.71 | % | 3.16 | % | ||||||||
5 Years | 7.29 | % | 6.37 | % | ||||||||
10 Years | 7.77 | % | 7.31 | % | ||||||||
| Class C Shares | 0.06 | % | ||||||||||
1 Year | 6.91 | % | 5.94 | % | ||||||||
5 Years | 6.49 | % | 6.49 | % | ||||||||
10 Years | 6.97 | % | 6.97 | % | ||||||||
| Advisor Class Shares‡ | 1.45 | % | ||||||||||
1 Year | 7.98 | % | 7.98 | % | ||||||||
5 Years | 7.56 | % | 7.56 | % | ||||||||
10 Years | 8.04 | % | 8.04 | % | ||||||||
| Class R Shares‡ | 1.20 | % | ||||||||||
1 Year | 7.44 | % | 7.44 | % | ||||||||
5 Years | 7.02 | % | 7.02 | % | ||||||||
10 Years | 7.51 | % | 7.51 | % | ||||||||
| Class K Shares‡ | 1.58 | % | ||||||||||
1 Year | 7.72 | % | 7.72 | % | ||||||||
5 Years | 7.29 | % | 7.29 | % | ||||||||
10 Years | 7.78 | % | 7.78 | % | ||||||||
| Class I Shares‡ | 1.94 | % | ||||||||||
1 Year | 7.98 | % | 7.98 | % | ||||||||
5 Years | 7.56 | % | 7.56 | % | ||||||||
10 Years | 8.04 | % | 8.04 | % | ||||||||
| Class Z Shares‡ | 1.96 | % | ||||||||||
1 Year | 7.87 | % | 7.87 | % | ||||||||
5 Years | 7.53 | % | 7.53 | % | ||||||||
10 Years | 8.03 | % | 8.03 | % | ||||||||
See Disclosures, Risks and Note about Historical Performance on pages 5-7.
(Historical Performance continued on next page)
| 10 | • AB HIGH YIELD PORTFOLIO |
Historical Performance
HISTORICAL PERFORMANCE
(continued from previous page)
The Fund’s prospectus fee table shows the Fund’s total annual operating expense ratios as 1.77%, 2.55%, 1.52%, 1.83%, 1.57%, 1.29% and 1.29% for Class A, Class C, Advisor Class, Class R, Class K, Class I and Class Z shares, respectively, gross of any fee waivers or expense reimbursements. Contractual fee waivers and/or expense reimbursements limit the Fund’s annual operating expense ratios exclusive of acquired fund fees and expenses other than the advisory fees of any AB mutual funds in which the Fund may invest, interest expense, taxes, extraordinary expenses, and brokerage commissions and other transaction costs to 1.05%, 1.80%, 0.80%, 1.30%, 1.05%, 0.80% and 0.80% for Class A, Class C, Advisor Class, Class R, Class K, Class I and Class Z shares, respectively. These waivers/reimbursements may not be terminated before January 31, 2018 and may be extended by the Adviser for additional one-year terms. Any fees waived and expenses borne by the Adviser prior to July 15, 2015 may be reimbursed by the Fund until the end of the third fiscal year after the fiscal period in which the fee was waived or the expense was borne, provided that no reimbursement payment will be made that would cause the Fund’s total annual fund operating expenses to exceed the expense limitations. Absent reimbursements or waivers, performance would have been lower. The Financial Highlights section of this report sets forth expense ratio data for the current reporting period; the expense ratios shown above may differ from the expense ratios in the Financial Highlights sections since they are based on different time periods.
| * | Performance is based on the NAV per share of the Accounting Survivor prior to the Reorganization. |
| † | SEC yields are calculated based on SEC guidelines for the 30-day period ended October 31, 2016. |
| ‡ | These share classes are offered at NAV to eligible investors and their SEC returns are the same as their NAV returns. Please note that these share classes are for investors purchasing shares through accounts established under certain fee-based programs sponsored and maintained by certain broker-dealers and financial intermediaries, institutional pension plans and/or investment advisory clients of, and certain other persons associated with, the Adviser and its affiliates or the Fund. |
See Disclosures, Risks and Note about Historical Performance on pages 5-7.
(Historical Performance continued on next page)
| AB HIGH YIELD PORTFOLIO • | 11 |
Historical Performance
HISTORICAL PERFORMANCE
(continued from previous page)
SEC AVERAGE ANNUAL RETURNS AS OF THE MOST RECENT CALENDAR QUARTER-END SEPTEMBER 30, 2016 (unaudited) | ||||
SEC Returns* (reflects applicable | ||||
| Class A Shares | ||||
1 Year | 5.44 | % | ||
5 Years | 7.44 | % | ||
10 Years | 7.41 | % | ||
| Class C Shares | ||||
1 Year | 8.26 | % | ||
5 Years | 7.56 | % | ||
10 Years | 7.08 | % | ||
| Advisor Class Shares† | ||||
1 Year | 10.46 | % | ||
5 Years | 8.66 | % | ||
10 Years | 8.16 | % | ||
| Class R Shares† | ||||
1 Year | 9.80 | % | ||
5 Years | 8.10 | % | ||
10 Years | 7.61 | % | ||
| Class K Shares† | ||||
1 Year | 10.08 | % | ||
5 Years | 8.37 | % | ||
10 Years | 7.88 | % | ||
| Class I Shares† | ||||
1 Year | 10.47 | % | ||
5 Years | 8.66 | % | ||
10 Years | 8.16 | % | ||
| Class Z Shares† | ||||
1 Year | 10.35 | % | ||
5 Years | 8.64 | % | ||
10 Years | 8.15 | % | ||
| * | Performance is based on the NAV per share of the Accounting Survivor prior to the Reorganization. |
| † | These share classes are offered at NAV to eligible investors and their SEC returns are the same as their NAV returns. Please note that these share classes are for investors purchasing shares through accounts established under certain fee-based programs sponsored and maintained by certain broker-dealers and financial intermediaries, institutional pension plans and/or investment advisory clients of, and certain other persons associated with, the Adviser and its affiliates or the Fund. |
See Disclosures, Risks and Note about Historical Performance on pages 5-7.
| 12 | • AB HIGH YIELD PORTFOLIO |
Historical Performance
EXPENSE EXAMPLE
(unaudited)
As a shareholder of the Fund, you incur two types of costs: (1) transaction costs, including sales charges (loads) on purchase payments, contingent deferred sales charges on redemptions and (2) ongoing costs, including management fees; distribution (12b-1) fees; and other Fund expenses. This example is intended to help you understand your ongoing costs (in dollars) of investing in the Fund and to compare these costs with the ongoing costs of investing in other mutual funds.
The Example is based on an investment of $1,000 invested at the beginning of the period and held for the entire period as indicated below.
Actual Expenses
The first line of the table below provides information about actual account values and actual expenses. You may use the information in this line, together with the amount you invested, to estimate the expenses that you paid over the period. Simply divide your account value by $1,000 (for example, an $8,600 account value divided by $1,000 = 8.6), then multiply the result by the number in the first line under the heading entitled “Expenses Paid During Period” to estimate the expenses you paid on your account during this period.
Hypothetical Example for Comparison Purposes
The second line of the table below provides information about hypothetical account values and hypothetical expenses based on the Fund’s actual expense ratio and an assumed annual rate of return of 5% before expenses, which is not the Fund’s actual return. The hypothetical account values and expenses may not be used to estimate the actual ending account balance or expenses you paid for the period. You may use this information to compare the ongoing costs of investing in the Fund and other funds by comparing this 5% hypothetical example with the 5% hypothetical examples that appear in the shareholder reports of other funds.
| Beginning Account Value 5/1/2016 | Ending Account Value 10/31/2016 | Expenses Paid During Period* | Annualized Expense Ratio* | Effective Expenses Paid During Period+ | Effective Annualized Expenses Ratio+ | |||||||||||||||||||
| Class A | ||||||||||||||||||||||||
Actual | $ | 1,000 | $ | 1,021.30 | $ | 2.79 | * | 1.03 | %* | $ | 2.85 | 1.05 | % | |||||||||||
Hypothetical** | $ | 1,000 | $ | 1,010.66 | $ | 2.78 | * | 1.03 | %* | $ | 2.83 | 1.05 | % | |||||||||||
| Class C | ||||||||||||||||||||||||
Actual | $ | 1,000 | $ | 1,019.30 | $ | 4.83 | * | 1.78 | %* | $ | 4.88 | 1.80 | % | |||||||||||
Hypothetical** | $ | 1,000 | $ | 1,008.65 | $ | 4.80 | * | 1.78 | %* | $ | 4.85 | 1.80 | % | |||||||||||
| Advisor Class | ||||||||||||||||||||||||
Actual | $ | 1,000 | $ | 1,022.00 | $ | 2.12 | * | 0.78 | %* | $ | 2.17 | 0.80 | % | |||||||||||
Hypothetical** | $ | 1,000 | $ | 1,011.33 | $ | 2.11 | * | 0.78 | %* | $ | 2.16 | 0.80 | % | |||||||||||
| Class R | ||||||||||||||||||||||||
Actual | $ | 1,000 | $ | 1,020.60 | $ | 3.47 | * | 1.28 | %* | $ | 3.53 | 1.30 | % | |||||||||||
Hypothetical** | $ | 1,000 | $ | 1,009.99 | $ | 3.45 | * | 1.28 | %* | $ | 3.51 | 1.30 | % | |||||||||||
| AB HIGH YIELD PORTFOLIO • | 13 |
Expense Example
EXPENSE EXAMPLE
(unaudited)
| Beginning Account Value 5/1/2016 | Ending Account Value 10/31/2016 | Expenses Paid During Period* | Annualized Expense Ratio* | Effective Expenses Paid During Period+ | Effective Annualized Expenses Ratio+ | |||||||||||||||||||
| Class K | ||||||||||||||||||||||||
Actual | $ | 1,000 | $ | 1,021.40 | $ | 2.80 | * | 1.03 | %* | $ | 2.85 | 1.05 | % | |||||||||||
Hypothetical** | $ | 1,000 | $ | 1,010.66 | $ | 2.78 | * | 1.03 | %* | $ | 2.83 | 1.05 | % | |||||||||||
| Class I | ||||||||||||||||||||||||
Actual | $ | 1,000 | $ | 1,022.00 | $ | 2.12 | * | 0.78 | %* | $ | 2.17 | 0.80 | % | |||||||||||
Hypothetical** | $ | 1,000 | $ | 1,011.33 | $ | 2.11 | * | 0.78 | %* | $ | 2.16 | 0.80 | % | |||||||||||
| Class Z | ||||||||||||||||||||||||
Actual | $ | 1,000 | $ | 1,060.40 | $ | 3.74 | *** | 0.72 | %*** | $ | 3.79 | 0.73 | % | |||||||||||
Hypothetical** | $ | 1,000 | $ | 1,021.58 | $ | 3.67 | *** | 0.72 | %*** | $ | 3.72 | 0.73 | % | |||||||||||
| * | Expenses are equal to each classes’ annualized expense ratios, multiplied by the average account value over the period, multiplied by 98/365 (to reflect the since inception period). |
| ** | Assumes 5% annual return before expenses. |
| *** | Expenses are equal to the classes’ annualized expense ratios multiplied by the average account value over the period, multiplied by 184/365 (to reflect the one-half year period). |
| + | The Portfolio’s investment in affiliated underlying portfolios incur no direct expenses, but bears proportionate shares of the acquired fund fees (i.e., operating, administrative and investment advisory fee) of the affiliated underlying portfolios. Currently the Adviser has voluntarily agreed to waive its investment advisory fee from the Portfolio in an amount equal to the Portfolio’s share of the advisory fees of the affiliated underlying portfolios, as borne indirectly by the Portfolio as an acquired fund fee and expense. The Portfolio’s effective expenses are equal to the classes’ annualized expense ratio plus the Portfolio’s pro-rata share of the weighted average expense ratio of the affiliated underlying portfolios in which it invests, multiplied by the average account value over the period, multiplied by 184/365 (to reflect the one-half year period). |
| 14 | • AB HIGH YIELD PORTFOLIO |
Expense Example
PORTFOLIO SUMMARY
October 31, 2016 (unaudited)
PORTFOLIO STATISTICS
Net Assets ($mil): $86.4
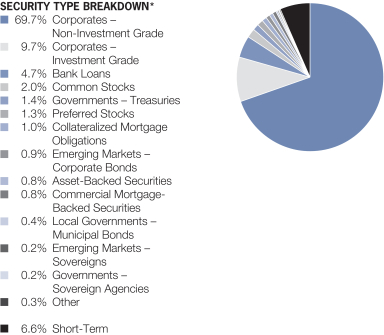
| * | All data are as of October 31, 2016. The Fund’s security type breakdown is expressed as a percentage of total investments and may vary over time. The Fund also enters into derivative transactions, which may be used for hedging or investment purposes (see “Portfolio of Investments” section of the report for additional details). “Other” security type weightings represent 0.2% or less in the following types: Investment Companies, Options Purchased – Puts and Warrants. |
| AB HIGH YIELD PORTFOLIO • | 15 |
Portfolio Summary
PORTFOLIO OF INVESTMENTS
October 31, 2016
| Principal Amount (000) | U.S. $ Value | |||||||||||
| ||||||||||||
CORPORATES – NON-INVESTMENT GRADE – 69.4% | ||||||||||||
Industrial – 58.7% | ||||||||||||
Basic – 4.8% | ||||||||||||
AK Steel Corp. | U.S.$ | 87 | $ | 86,565 | ||||||||
Aleris International, Inc. | 60 | 60,000 | ||||||||||
Anglo American Capital PLC | EUR | 80 | 91,089 | |||||||||
ArcelorMittal | U.S.$ | 143 | 152,210 | |||||||||
7.75%, 3/01/41 | 80 | 84,000 | ||||||||||
8.00%, 10/15/39 | 258 | 277,350 | ||||||||||
Arconic Inc | 244 | 260,995 | ||||||||||
Axalta Coating Systems LLC | 150 | 152,250 | ||||||||||
Cliffs Natural Resources, Inc. | 63 | 53,078 | ||||||||||
8.00%, 9/30/20(a) | 34 | 34,000 | ||||||||||
8.25%, 3/31/20(a) | 102 | 110,797 | ||||||||||
Consolidated Energy Finance SA | 290 | 290,000 | ||||||||||
First Quantum Minerals Ltd. | 185 | 177,137 | ||||||||||
FMG Resources (August 2006) Pty Ltd. | 40 | 46,400 | ||||||||||
Freeport-McMoRan, Inc. | 104 | 102,700 | ||||||||||
3.875%, 3/15/23 | 378 | 341,145 | ||||||||||
4.55%, 11/14/24 | 95 | 87,162 | ||||||||||
5.40%, 11/14/34 | 51 | 43,924 | ||||||||||
5.45%, 3/15/43 | 173 | 143,590 | ||||||||||
Jefferson Smurfit Corp./US | 166 | 83 | ||||||||||
Joseph T Ryerson & Son, Inc. | 47 | 51,348 | ||||||||||
Lecta SA | EUR | 119 | 131,382 | |||||||||
Lundin Mining Corp. | U.S.$ | 35 | 37,800 | |||||||||
Magnetation LLC/Mag Finance Corp. | 206 | 247 | ||||||||||
Momentive Performance Materials, Inc. | 161 | 143,290 | ||||||||||
8.875%, 10/15/20(b)(d)(g) | 161 | – 0 | – | |||||||||
| 16 | • AB HIGH YIELD PORTFOLIO |
Portfolio of Investments
| Principal Amount (000) | U.S. $ Value | |||||||||||
| ||||||||||||
Novelis Corp. | U.S.$ | 78 | $ | 78,975 | ||||||||
6.25%, 8/15/24(a) | 200 | 208,000 | ||||||||||
Peabody Energy Corp. | 411 | 181,867 | ||||||||||
PQ Corp. | 60 | 64,725 | ||||||||||
Smurfit Kappa Treasury Funding Ltd. | 15 | 17,850 | ||||||||||
Smurfit-Stone Container Enterprises, Inc. | 172 | 86 | ||||||||||
Steel Dynamics, Inc. | 15 | 15,638 | ||||||||||
6.125%, 8/15/19 | 117 | 121,095 | ||||||||||
Teck Resources Ltd. | 50 | 47,281 | ||||||||||
5.20%, 3/01/42 | 124 | 111,910 | ||||||||||
5.40%, 2/01/43 | 111 | 100,177 | ||||||||||
6.25%, 7/15/41 | 22 | 21,780 | ||||||||||
8.00%, 6/01/21(a) | 11 | 12,018 | ||||||||||
8.50%, 6/01/24(a) | 14 | 16,205 | ||||||||||
Thompson Creek Metals Co., Inc. | 125 | 125,725 | ||||||||||
United States Steel Corp. | 72 | 76,500 | ||||||||||
W.R. Grace & Co.-Conn | 32 | 34,640 | ||||||||||
|
| |||||||||||
| 4,193,014 | ||||||||||||
|
| |||||||||||
Capital Goods – 5.2% | ||||||||||||
American Builders & Contractors Supply Co., Inc. | 45 | 46,913 | ||||||||||
Apex Tool Group LLC | 118 | 107,675 | ||||||||||
ARD Finance SA | 205 | 202,950 | ||||||||||
Ardagh Packaging Finance PLC/Ardagh Holdings USA, Inc. | 60 | 60,600 | ||||||||||
6.00%, 6/30/21(a) | 170 | 174,250 | ||||||||||
7.25%, 5/15/24(a) | 10 | 10,550 | ||||||||||
Ball Corp. | 124 | 132,060 | ||||||||||
Berry Plastics Corp. | 33 | 33,578 | ||||||||||
| AB HIGH YIELD PORTFOLIO • | 17 |
Portfolio of Investments
| Principal Amount (000) | U.S. $ Value | |||||||||||
| ||||||||||||
Bombardier, Inc. | U.S.$ | 55 | $ | 47,741 | ||||||||
7.50%, 3/15/25(a) | 441 | 394,695 | ||||||||||
Clean Harbors, Inc. | 170 | 174,037 | ||||||||||
5.25%, 8/01/20 | 18 | 18,360 | ||||||||||
CNH Industrial Capital LLC | 88 | 88,825 | ||||||||||
3.625%, 4/15/18 | 60 | 60,525 | ||||||||||
3.875%, 7/16/18 | 99 | 99,866 | ||||||||||
EnPro Industries, Inc. | 86 | 89,440 | ||||||||||
Gardner Denver, Inc. | 88 | 86,240 | ||||||||||
GFL Environmental, Inc. | 24 | 25,140 | ||||||||||
9.875%, 2/01/21(a) | 141 | 154,395 | ||||||||||
Herc Rentals, Inc. | 166 | 166,830 | ||||||||||
KLX, Inc. | 85 | 86,504 | ||||||||||
Manitowoc Foodservice, Inc. | 22 | 25,273 | ||||||||||
Masco Corp. | 60 | 68,288 | ||||||||||
7.125%, 3/15/20 | 30 | 34,350 | ||||||||||
Owens-Brockway Glass Container, Inc. | 67 | 70,099 | ||||||||||
Owens-Illinois, Inc. | 25 | 27,000 | ||||||||||
Pactiv LLC | 141 | 154,042 | ||||||||||
Reynolds Group Issuer, Inc./Reynolds Group Issuer LLC/Reynolds Group Issuer Lu | 150 | 153,984 | ||||||||||
7.00%, 7/15/24(a) | 51 | 54,506 | ||||||||||
8.25%, 2/15/21 | 269 | 281,038 | ||||||||||
9.875%, 8/15/19 | 100 | 102,500 | ||||||||||
Sealed Air Corp. | 184 | 197,800 | ||||||||||
SPX FLOW, Inc. | 26 | 26,358 | ||||||||||
5.875%, 8/15/26(a) | 27 | 27,405 | ||||||||||
Standard Industries, Inc./NJ | 71 | 74,550 | ||||||||||
6.00%, 10/15/25(a) | 105 | 111,825 | ||||||||||
TA MFG. Ltd. | EUR | 100 | 108,076 | |||||||||
| 18 | • AB HIGH YIELD PORTFOLIO |
Portfolio of Investments
| Principal Amount (000) | U.S. $ Value | |||||||||||
| ||||||||||||
TransDigm, Inc. | U.S.$ | 250 | $ | 255,650 | ||||||||
Travis Perkins PLC | GBP | 100 | 121,668 | |||||||||
United Rentals North America, Inc. | U.S.$ | 257 | 255,715 | |||||||||
5.75%, 11/15/24 | 51 | 52,912 | ||||||||||
|
| |||||||||||
| 4,464,213 | ||||||||||||
|
| |||||||||||
Communications - Media – 8.7% | ||||||||||||
Altice Financing SA | 429 | 441,870 | ||||||||||
7.50%, 5/15/26(a) | 200 | 206,000 | ||||||||||
Arqiva Broadcast Finance PLC | GBP | 75 | 98,915 | |||||||||
CCO Holdings LLC/CCO Holdings Capital Corp. | U.S.$ | 177 | 183,195 | |||||||||
5.25%, 9/30/22 | 21 | 21,866 | ||||||||||
5.375%, 5/01/25(a) | 42 | 43,155 | ||||||||||
5.75%, 1/15/24 | 3 | 3,173 | ||||||||||
5.875%, 4/01/24-5/01/27(a) | 73 | 76,518 | ||||||||||
Cequel Communications Holdings I LLC/Cequel Capital Corp. | 180 | 177,300 | ||||||||||
Clear Channel Worldwide Holdings, Inc. | 139 | 139,695 | ||||||||||
Series B | 77 | 78,425 | ||||||||||
CSC Holdings LLC | 115 | 107,525 | ||||||||||
6.625%, 10/15/25(a) | 9 | 9,765 | ||||||||||
6.75%, 11/15/21 | 35 | 36,838 | ||||||||||
7.625%, 7/15/18 | 172 | 184,470 | ||||||||||
10.125%, 1/15/23(a) | 333 | 375,457 | ||||||||||
DISH DBS Corp. | 130 | 132,437 | ||||||||||
5.00%, 3/15/23 | 40 | 39,400 | ||||||||||
5.125%, 5/01/20 | 41 | 42,435 | ||||||||||
5.875%, 11/15/24 | 549 | 552,774 | ||||||||||
6.75%, 6/01/21 | 69 | 74,132 | ||||||||||
7.875%, 9/01/19 | 62 | 69,130 | ||||||||||
Gray Television, Inc. | 85 | 84,575 | ||||||||||
Hughes Satellite Systems Corp. | 121 | 132,646 | ||||||||||
iHeartCommunications, Inc. | 395 | 306,125 | ||||||||||
9.00%, 12/15/19-9/15/22 | 260 | 191,571 | ||||||||||
| AB HIGH YIELD PORTFOLIO • | 19 |
Portfolio of Investments
| Principal Amount (000) | U.S. $ Value | |||||||||||
| ||||||||||||
Intelsat Jackson Holdings SA | U.S.$ | 422 | $ | 279,575 | ||||||||
8.00%, 2/15/24(a) | 35 | 35,175 | ||||||||||
9.50%, 9/30/22(a) | 105 | 116,222 | ||||||||||
Intelsat Luxembourg SA | 299 | 97,175 | ||||||||||
Lamar Media Corp. | 20 | 20,700 | ||||||||||
McGraw-Hill Global Education Holdings LLC/McGraw-Hill Global Education Finance | 137 | 148,302 | ||||||||||
Mediacom Broadband LLC/Mediacom Broadband Corp. | 162 | 168,480 | ||||||||||
National CineMedia LLC | 47 | 48,410 | ||||||||||
Netflix, Inc. | 116 | 114,115 | ||||||||||
Nexstar Broadcasting, Inc. | 17 | 17,616 | ||||||||||
Nielsen Co. Luxembourg SARL (The) | 96 | 100,080 | ||||||||||
Nielsen Finance LLC/Nielsen Finance Co. | 166 | 169,320 | ||||||||||
Radio One, Inc. | 126 | 126,630 | ||||||||||
9.25%, 2/15/20(a) | 161 | 144,900 | ||||||||||
Sinclair Television Group, Inc. | 43 | 43,538 | ||||||||||
6.125%, 10/01/22 | 58 | 61,265 | ||||||||||
Starz LLC/Starz Finance Corp. | 138 | 139,725 | ||||||||||
TEGNA, Inc. | 156 | 162,630 | ||||||||||
5.50%, 9/15/24(a) | 17 | 17,425 | ||||||||||
Time, Inc. | 303 | 291,637 | ||||||||||
Townsquare Media, Inc. | 23 | 23,029 | ||||||||||
Unitymedia Hessen GmbH & Co. KG/Unitymedia NRW GmbH | 107 | 110,879 | ||||||||||
Univision Communications, Inc. | 364 | 365,360 | ||||||||||
Videotron Ltd. | 64 | 66,800 | ||||||||||
Virgin Media Finance PLC | 8 | 6,883 | ||||||||||
| 20 | • AB HIGH YIELD PORTFOLIO |
Portfolio of Investments
| Principal Amount (000) | U.S. $ Value | |||||||||||
| ||||||||||||
Virgin Media Secured Finance PLC | GBP | 133 | $ | 159,129 | ||||||||
Wave Holdco LLC/Wave Holdco Corp. | U.S.$ | 45 | 45,103 | |||||||||
WideOpenWest Finance LLC/WideOpenWest Capital Corp. | 194 | 203,700 | ||||||||||
Ziggo Bond Finance BV | 62 | 61,535 | ||||||||||
Ziggo Secured Finance BV | 378 | 373,275 | ||||||||||
|
| |||||||||||
| 7,528,005 | ||||||||||||
|
| |||||||||||
Communications - Telecommunications – 8.2% | ||||||||||||
Altice Luxembourg SA | EUR | 81 | 94,253 | |||||||||
CenturyLink, Inc. | U.S.$ | 81 | 82,215 | |||||||||
Series U | 55 | 48,950 | ||||||||||
Series W | 116 | 119,190 | ||||||||||
Cincinnati Bell, Inc. | 87 | 91,133 | ||||||||||
Columbus Cable Barbados Ltd. | 229 | 245,030 | ||||||||||
CommScope, Inc. | 74 | 75,665 | ||||||||||
Communications Sales & Leasing, Inc./CSL Capital LLC | 84 | 87,150 | ||||||||||
8.25%, 10/15/23 | 205 | 216,275 | ||||||||||
Embarq Corp. | 198 | 200,970 | ||||||||||
Frontier Communications Corp. | 207 | 196,650 | ||||||||||
7.125%, 3/15/19-1/15/23 | 257 | 250,249 | ||||||||||
7.625%, 4/15/24 | 188 | 167,320 | ||||||||||
7.875%, 1/15/27 | 44 | 38,610 | ||||||||||
8.125%, 10/01/18 | 15 | 16,313 | ||||||||||
9.00%, 8/15/31 | 105 | 91,350 | ||||||||||
10.50%, 9/15/22 | 31 | 32,240 | ||||||||||
11.00%, 9/15/25 | 276 | 282,596 | ||||||||||
Level 3 Communications, Inc. | 26 | 26,780 | ||||||||||
| AB HIGH YIELD PORTFOLIO • | 21 |
Portfolio of Investments
| Principal Amount (000) | U.S. $ Value | |||||||||||
| ||||||||||||
Level 3 Financing, Inc. | U.S.$ | 232 | $ | 235,480 | ||||||||
Sable International Finance Ltd. | 144 | 149,040 | ||||||||||
SFR Group SA | 283 | 290,166 | ||||||||||
7.375%, 5/01/26(a) | 185 | 186,850 | ||||||||||
SoftBank Group Corp. | 257 | 264,067 | ||||||||||
Sprint Capital Corp. | 229 | 232,435 | ||||||||||
Sprint Communications, Inc. | 170 | 158,420 | ||||||||||
9.00%, 11/15/18(a) | 334 | 367,400 | ||||||||||
Sprint Corp. | 106 | 99,640 | ||||||||||
7.25%, 9/15/21 | 168 | 171,990 | ||||||||||
7.625%, 2/15/25 | 487 | 471,172 | ||||||||||
7.875%, 9/15/23 | 85 | 84,150 | ||||||||||
T-Mobile USA, Inc. | 609 | 634,121 | ||||||||||
6.375%, 3/01/25 | 161 | 172,573 | ||||||||||
6.50%, 1/15/24-1/15/26 | 214 | 229,635 | ||||||||||
Telecom Italia Capital SA | 192 | 196,704 | ||||||||||
7.20%, 7/18/36 | 112 | 120,960 | ||||||||||
7.721%, 6/04/38 | 96 | 105,840 | ||||||||||
WaveDivision Escrow LLC/WaveDivision Escrow Corp. | 10 | 10,425 | ||||||||||
Wind Acquisition Finance SA | 180 | 180,900 | ||||||||||
6.50%, 4/30/20(a) | 110 | 114,675 | ||||||||||
Windstream Services LLC | 143 | 126,555 | ||||||||||
7.50%, 4/01/23 | 120 | 112,500 | ||||||||||
|
| |||||||||||
| 7,078,637 | ||||||||||||
|
| |||||||||||
Consumer Cyclical - Automotive – 1.7% | ||||||||||||
Adient Global Holdings Ltd. | 200 | 196,720 | ||||||||||
Allison Transmission, Inc. | 85 | 86,700 | ||||||||||
BCD Acquisition, Inc. | 128 | 132,160 | ||||||||||
Commercial Vehicle Group, Inc. | 186 | 183,210 | ||||||||||
Cooper-Standard Automotive, Inc. | 52 | 52,260 | ||||||||||
| 22 | • AB HIGH YIELD PORTFOLIO |
Portfolio of Investments
| Principal Amount (000) | U.S. $ Value | |||||||||||
| ||||||||||||
Dana Financing Luxembourg Sarl | U.S.$ | 104 | $ | 110,630 | ||||||||
Dana, Inc. | 97 | 100,577 | ||||||||||
Exide Technologies | 279 | 150,409 | ||||||||||
11.00%, 4/30/20(g)(h) | 104 | 83,034 | ||||||||||
Gates Global LLC/Gates Global Co. | 61 | 57,645 | ||||||||||
IHO Verwaltungs GmbH | 200 | 204,750 | ||||||||||
Meritor, Inc. | 79 | 102,601 | ||||||||||
Navistar International Corp. | 23 | 22,511 | ||||||||||
|
| |||||||||||
| 1,483,207 | ||||||||||||
|
| |||||||||||
Consumer Cyclical - Entertainment – 0.5% | ||||||||||||
AMC Entertainment Holdings, Inc. | 27 | 27,135 | ||||||||||
AMC Entertainment, Inc. | 103 | 103,258 | ||||||||||
Carlson Travel Holdings, Inc. | 104 | 101,400 | ||||||||||
ClubCorp Club Operations, Inc. | 41 | 43,665 | ||||||||||
Pinnacle Entertainment, Inc. | 129 | 129,967 | ||||||||||
Royal Caribbean Cruises Ltd. | 15 | 16,050 | ||||||||||
|
| |||||||||||
| 421,475 | ||||||||||||
|
| |||||||||||
Consumer Cyclical - Other – 4.2% | ||||||||||||
Beazer Homes USA, Inc. | 50 | 51,625 | ||||||||||
7.50%, 9/15/21 | 40 | 40,400 | ||||||||||
8.75%, 3/15/22(a) | 33 | 35,063 | ||||||||||
Caesars Entertainment Operating Co., Inc. | 217 | 142,677 | ||||||||||
Caesars Entertainment Resort Properties LLC/Caesars Entertainment Resort Prope | 112 | 116,200 | ||||||||||
Caesars Growth Properties Holdings LLC/Caesars Growth Properties Finance, Inc. | 120 | 127,500 | ||||||||||
| AB HIGH YIELD PORTFOLIO • | 23 |
Portfolio of Investments
| Principal Amount (000) | U.S. $ Value | |||||||||||
| ||||||||||||
CalAtlantic Group, Inc. | U.S.$ | 26 | $ | 27,755 | ||||||||
6.25%, 12/15/21 | 78 | 85,897 | ||||||||||
8.375%, 5/15/18 | 212 | 231,080 | ||||||||||
Diamond Resorts International, Inc. | 85 | 83,300 | ||||||||||
Eldorado Resorts, Inc. | 30 | 31,875 | ||||||||||
GLP Capital LP/GLP Financing II, Inc. | 20 | 21,050 | ||||||||||
4.875%, 11/01/20 | 26 | 27,723 | ||||||||||
5.375%, 11/01/23-4/15/26 | 50 | 53,376 | ||||||||||
International Game Technology | 71 | 78,810 | ||||||||||
International Game Technology PLC | 158 | 167,480 | ||||||||||
6.50%, 2/15/25(a) | 250 | 270,575 | ||||||||||
Isle of Capri Casinos, Inc. | 9 | 9,360 | ||||||||||
K. Hovnanian Enterprises, Inc. | 146 | 102,200 | ||||||||||
7.25%, 10/15/20(a) | 43 | 38,700 | ||||||||||
KB Home | 92 | 94,070 | ||||||||||
7.00%, 12/15/21 | 76 | 81,510 | ||||||||||
7.50%, 9/15/22 | 35 | 37,887 | ||||||||||
8.00%, 3/15/20 | 20 | 22,200 | ||||||||||
Lennar Corp. | 209 | 220,234 | ||||||||||
4.75%, 11/15/22 | 28 | 29,120 | ||||||||||
MDC Holdings, Inc. | 20 | 21,050 | ||||||||||
6.00%, 1/15/43 | 123 | 108,855 | ||||||||||
Meritage Homes Corp. | 73 | 77,015 | ||||||||||
7.00%, 4/01/22 | 15 | 16,740 | ||||||||||
MGM Growth Properties Operating Partnership LP/MGP Finance Co-Issuer, Inc. | 26 | 27,674 | ||||||||||
MGM Resorts International | 155 | 173,891 | ||||||||||
NAI Entertainment Holdings/NAI Entertainment Holdings Finance Corp. | 25 | 25,250 | ||||||||||
PulteGroup, Inc. | 30 | 29,775 | ||||||||||
6.00%, 2/15/35 | 183 | 182,085 | ||||||||||
7.875%, 6/15/32 | 36 | 41,040 | ||||||||||
| 24 | • AB HIGH YIELD PORTFOLIO |
Portfolio of Investments
| Principal Amount (000) | U.S. $ Value | |||||||||||
| ||||||||||||
Shea Homes LP/Shea Homes Funding Corp. | U.S.$ | 25 | $ | 24,563 | ||||||||
6.125%, 4/01/25(a) | 206 | 202,910 | ||||||||||
Taylor Morrison Communities, Inc./Monarch Communities, Inc. | 107 | 111,012 | ||||||||||
5.875%, 4/15/23(a) | 81 | 85,455 | ||||||||||
Toll Brothers Finance Corp. | 51 | 52,657 | ||||||||||
Wynn Las Vegas LLC/Wynn Las Vegas Capital Corp. | 79 | 81,074 | ||||||||||
5.50%, 3/01/25(a) | 73 | 73,182 | ||||||||||
|
| |||||||||||
| 3,561,895 | ||||||||||||
|
| |||||||||||
Consumer Cyclical - Restaurants – 0.4% | ||||||||||||
1011778 BC ULC/New Red Finance, Inc. | 132 | 137,940 | ||||||||||
Pizzaexpress Financing 1 PLC | GBP | 3 | 3,398 | |||||||||
Pizzaexpress Financing 2 PLC | 7 | 8,421 | ||||||||||
Stonegate Pub Co. Financing PLC | 130 | 163,019 | ||||||||||
|
| |||||||||||
| 312,778 | ||||||||||||
|
| |||||||||||
Consumer Cyclical - Retailers – 1.3% | ||||||||||||
American Tire Distributors, Inc. | U.S.$ | 134 | 123,197 | |||||||||
Brighthouse Group PLC | GBP | 130 | 95,074 | |||||||||
CST Brands, Inc. | U.S.$ | 28 | 29,400 | |||||||||
Group 1 Automotive, Inc. | 138 | 137,655 | ||||||||||
JC Penney Corp., Inc. | 7 | 7,211 | ||||||||||
6.375%, 10/15/36 | 21 | 17,850 | ||||||||||
L Brands, Inc. | 128 | 135,680 | ||||||||||
7.00%, 5/01/20 | 150 | 171,000 | ||||||||||
Levi Strauss & Co. | 15 | 15,750 | ||||||||||
Neiman Marcus Group Ltd. LLC | 83 | 65,311 | ||||||||||
PetSmart, Inc. | 219 | 229,129 | ||||||||||
| AB HIGH YIELD PORTFOLIO • | 25 |
Portfolio of Investments
| Principal Amount (000) | U.S. $ Value | |||||||||||
| ||||||||||||
Rite Aid Corp. | U.S.$ | 81 | $ | 85,455 | ||||||||
Serta Simmons Bedding LLC | 12 | 12,466 | ||||||||||
Sonic Automotive, Inc. | 15 | 14,662 | ||||||||||
|
| |||||||||||
| 1,139,840 | ||||||||||||
|
| |||||||||||
Consumer Non-Cyclical – 10.0% | ||||||||||||
Air Medical Group Holdings, Inc. | 197 | 187,642 | ||||||||||
Albertsons Cos. LLC/Safeway, Inc./New Albertson’s, Inc./Albertson’s LLC | 84 | 82,924 | ||||||||||
6.625%, 6/15/24(a) | 86 | 89,225 | ||||||||||
Alere, Inc. | 27 | 27,810 | ||||||||||
Aramark Services, Inc. | 23 | 24,093 | ||||||||||
BI-LO LLC/BI-LO Finance Corp. | 135 | 85,050 | ||||||||||
9.25%, 2/15/19(a) | 224 | 194,320 | ||||||||||
Boparan Finance PLC | GBP | 21 | 25,102 | |||||||||
5.50%, 7/15/21(a) | 25 | 27,923 | ||||||||||
Cerberus Nightingale 1 SARL | EUR | 92 | 103,266 | |||||||||
CHS/Community Health Systems, Inc. | U.S.$ | 654 | 498,675 | |||||||||
Concordia International Corp. | 18 | 10,350 | ||||||||||
9.50%, 10/21/22(a) | 279 | 171,585 | ||||||||||
Constellation Brands, Inc. | 72 | 76,126 | ||||||||||
4.25%, 5/01/23 | 20 | 21,154 | ||||||||||
7.25%, 5/15/17 | 248 | 256,060 | ||||||||||
Endo Finance LLC | 163 | 146,700 | ||||||||||
Endo Finance LLC/Endo Finco, Inc. | 25 | 23,688 | ||||||||||
Endo Ltd./Endo Finance LLC/Endo Finco, Inc. | 247 | 214,890 | ||||||||||
6.50%, 2/01/25(a)(k) | 63 | 53,077 | ||||||||||
First Quality Finance Co., Inc. | 329 | 330,234 | ||||||||||
Galaxy Bidco Ltd. | GBP | 15 | 18,795 | |||||||||
| 26 | • AB HIGH YIELD PORTFOLIO |
Portfolio of Investments
| Principal Amount (000) | U.S. $ Value | |||||||||||
| ||||||||||||
HCA, Inc. | U.S.$ | 342 | $ | 349,695 | ||||||||
4.25%, 10/15/19 | 636 | 659,850 | ||||||||||
6.50%, 2/15/20 | 235 | 260,262 | ||||||||||
Hill-Rom Holdings, Inc. | 25 | 26,250 | ||||||||||
Horizon Pharma, Inc. | 114 | 107,587 | ||||||||||
Horizon Pharma, Inc./Horizon Pharma USA, Inc. | 182 | 184,730 | ||||||||||
HRG Group, Inc. | 157 | 164,457 | ||||||||||
IASIS Healthcare LLC/IASIS Capital Corp. | 98 | 93,345 | ||||||||||
Kinetic Concepts, Inc./KCI USA, Inc. | 16 | 17,240 | ||||||||||
9.625%, 10/01/21(a) | 288 | 278,280 | ||||||||||
Mallinckrodt International Finance SA | 98 | 97,265 | ||||||||||
Mallinckrodt International Finance SA/Mallinckrodt CB LLC | 84 | 77,700 | ||||||||||
5.625%, 10/15/23(a) | 110 | 103,400 | ||||||||||
5.75%, 8/01/22(a) | 118 | 111,805 | ||||||||||
MEDNAX, Inc. | 34 | 35,530 | ||||||||||
MPH Acquisition Holdings LLC | 81 | 86,662 | ||||||||||
NBTY, Inc. | 84 | 82,110 | ||||||||||
Post Holdings, Inc. | 132 | 128,040 | ||||||||||
6.00%, 12/15/22(a) | 19 | 20,045 | ||||||||||
7.75%, 3/15/24(a) | 10 | 11,052 | ||||||||||
8.00%, 7/15/25(a) | 51 | 58,140 | ||||||||||
Revlon Consumer Products Corp. | 45 | 46,350 | ||||||||||
RSI Home Products, Inc. | 302 | 320,120 | ||||||||||
Smithfield Foods, Inc. | 89 | 89,667 | ||||||||||
5.875%, 8/01/21(a) | 162 | 168,885 | ||||||||||
6.625%, 8/15/22 | 20 | 21,075 | ||||||||||
7.75%, 7/01/17 | 213 | 220,721 | ||||||||||
Spectrum Brands, Inc. | 37 | 39,660 | ||||||||||
Synlab Bondco PLC | EUR | 64 | 75,884 | |||||||||
| AB HIGH YIELD PORTFOLIO • | 27 |
Portfolio of Investments
| Principal Amount (000) | U.S. $ Value | |||||||||||
| ||||||||||||
Tenet Healthcare Corp. | U.S.$ | 25 | $ | 25,000 | ||||||||
5.50%, 3/01/19 | 118 | 115,345 | ||||||||||
6.75%, 6/15/23 | 18 | 16,538 | ||||||||||
6.875%, 11/15/31 | 339 | 272,047 | ||||||||||
8.00%, 8/01/20 | 365 | 361,350 | ||||||||||
8.125%, 4/01/22 | 118 | 115,345 | ||||||||||
Valeant Pharmaceuticals International, Inc. | 215 | 168,775 | ||||||||||
5.875%, 5/15/23(a) | 372 | 293,880 | ||||||||||
6.125%, 4/15/25(a) | 658 | 519,820 | ||||||||||
6.75%, 8/15/18(a) | 129 | 125,904 | ||||||||||
Valvoline, Inc. | 24 | 25,320 | ||||||||||
Vizient, Inc. | 30 | 33,450 | ||||||||||
|
| |||||||||||
| 8,677,270 | ||||||||||||
|
| |||||||||||
Energy – 7.8% | ||||||||||||
Antero Resources Corp. | 123 | 123,922 | ||||||||||
Berry Petroleum Co. LLC | 333 | 183,150 | ||||||||||
California Resources Corp. | 34 | 21,080 | ||||||||||
5.50%, 9/15/21 | 64 | 37,760 | ||||||||||
6.00%, 11/15/24 | 17 | 9,350 | ||||||||||
8.00%, 12/15/22(a) | 154 | 103,950 | ||||||||||
Cenovus Energy, Inc. | 18 | 17,495 | ||||||||||
3.80%, 9/15/23 | 8 | 7,890 | ||||||||||
4.45%, 9/15/42 | 106 | 92,915 | ||||||||||
5.70%, 10/15/19 | 33 | 35,660 | ||||||||||
6.75%, 11/15/39 | 5 | 5,581 | ||||||||||
CHC Helicopter SA | 432 | 212,760 | ||||||||||
9.375%, 6/01/21(b)(e)(g) | 90 | 26,237 | ||||||||||
Cheniere Corpus Christi Holdings LLC | 100 | 106,000 | ||||||||||
Chesapeake Energy Corp. | 13 | 11,895 | ||||||||||
6.875%, 11/15/20 | 267 | 251,647 | ||||||||||
8.00%, 12/15/22(a) | 5 | 5,072 | ||||||||||
Cobalt International Energy, Inc. | 138 | 63,480 | ||||||||||
Continental Resources, Inc./OK | 9 | 8,280 | ||||||||||
4.50%, 4/15/23 | 41 | 39,053 | ||||||||||
4.90%, 6/01/44 | 87 | 74,059 | ||||||||||
| 28 | • AB HIGH YIELD PORTFOLIO |
Portfolio of Investments
| Principal Amount (000) | U.S. $ Value | |||||||||||
| ||||||||||||
DCP Midstream Operating LP | U.S.$ | 19 | $ | 18,478 | ||||||||
5.60%, 4/01/44 | 91 | 85,312 | ||||||||||
Denbury Resources, Inc. | 54 | 39,285 | ||||||||||
5.50%, 5/01/22 | 67 | 52,930 | ||||||||||
Diamond Offshore Drilling, Inc. | 176 | 128,927 | ||||||||||
Energy Transfer Equity LP | 215 | 234,350 | ||||||||||
Ensco PLC | 23 | 18,400 | ||||||||||
5.20%, 3/15/25 | 266 | 216,375 | ||||||||||
EP Energy LLC/Everest Acquisition Finance, Inc. | 26 | 17,680 | ||||||||||
7.75%, 9/01/22 | 91 | 61,880 | ||||||||||
9.375%, 5/01/20 | 113 | 88,705 | ||||||||||
Global Partners LP/GLP Finance Corp. | 290 | 276,950 | ||||||||||
7.00%, 6/15/23 | 40 | 38,200 | ||||||||||
Halcon Resources Corp. | 47 | 47,940 | ||||||||||
Hilcorp Energy I LP/Hilcorp Finance Co. | 41 | 41,102 | ||||||||||
Hornbeck Offshore Services, Inc. | 173 | 111,585 | ||||||||||
Linn Energy LLC/Linn Energy Finance Corp. | 342 | 113,715 | ||||||||||
Murphy Oil Corp. | 72 | 67,500 | ||||||||||
6.875%, 8/15/24 | 13 | 13,714 | ||||||||||
Noble Holding International Ltd. | 62 | 47,585 | ||||||||||
7.20%, 4/01/25(j) | 68 | 55,420 | ||||||||||
8.20%, 4/01/45 | 90 | 60,637 | ||||||||||
Oasis Petroleum, Inc. | 11 | 10,931 | ||||||||||
6.875%, 3/15/22-1/15/23 | 78 | 77,040 | ||||||||||
Pacific Drilling SA | 141 | 40,185 | ||||||||||
Paragon Offshore PLC | 70 | 14,000 | ||||||||||
7.25%, 8/15/24(a)(b)(e) | 291 | 58,200 | ||||||||||
PHI, Inc. | 287 | 276,237 | ||||||||||
Precision Drilling Corp. | 79 | 76,334 | ||||||||||
| AB HIGH YIELD PORTFOLIO • | 29 |
Portfolio of Investments
| Principal Amount (000) | U.S. $ Value | |||||||||||
| ||||||||||||
QEP Resources, Inc. | U.S.$ | 7 | $ | 6,878 | ||||||||
5.375%, 10/01/22 | 115 | 113,850 | ||||||||||
6.875%, 3/01/21 | 2 | 2,105 | ||||||||||
Range Resources Corp. | 88 | 84,085 | ||||||||||
Rowan Cos., Inc. | 121 | 85,305 | ||||||||||
Sabine Pass Liquefaction LLC | 207 | 210,622 | ||||||||||
5.625%, 2/01/21(j) | 300 | 315,750 | ||||||||||
5.75%, 5/15/24 | 100 | 105,750 | ||||||||||
5.875%, 6/30/26(a) | 85 | 91,604 | ||||||||||
6.25%, 3/15/22 | 165 | 180,675 | ||||||||||
SandRidge Energy, Inc. | 15 | 17,987 | ||||||||||
7.50%, 2/15/23(b)(d) | 98 | – 0 | – | |||||||||
8.125%, 10/15/22(b)(d) | 160 | – 0 | – | |||||||||
8.75%, 6/01/20(b)(d) | 65 | – 0 | – | |||||||||
SM Energy Co. | 65 | 60,450 | ||||||||||
5.625%, 6/01/25 | 34 | 32,385 | ||||||||||
6.75%, 9/15/26 | 25 | 25,625 | ||||||||||
Southern Star Central Corp. | 120 | 122,100 | ||||||||||
Targa Resources Partners LP/Targa Resources Partners Finance Corp. | 187 | 175,780 | ||||||||||
Tervita Corp. | 183 | 181,170 | ||||||||||
9.75%, 11/01/19(a)(b)(e) | 5 | 288 | ||||||||||
10.875%, 2/15/18(a)(b)(e) | 475 | 27,313 | ||||||||||
Transocean Phoenix 2 Ltd. | 93 | 97,069 | ||||||||||
Transocean, Inc. | 192 | 164,160 | ||||||||||
6.80%, 3/15/38 | 332 | 218,290 | ||||||||||
9.00%, 7/15/23(a) | 84 | 82,057 | ||||||||||
Vantage Drilling International | 157 | – 0 | – | |||||||||
10.00%, 12/31/20(c) | 4 | 3,610 | ||||||||||
10.00%, 12/31/20(f) | 3 | 2,708 | ||||||||||
Weatherford International Ltd. | 135 | 128,250 | ||||||||||
5.95%, 4/15/42 | 29 | 21,895 | ||||||||||
6.50%, 8/01/36 | 97 | 76,630 | ||||||||||
6.75%, 9/15/40 | 11 | 8,718 | ||||||||||
7.00%, 3/15/38 | 112 | 92,400 | ||||||||||
| 30 | • AB HIGH YIELD PORTFOLIO |
Portfolio of Investments
| Principal Amount (000) | U.S. $ Value | |||||||||||
| ||||||||||||
Whiting Petroleum Corp. | U.S.$ | 95 | $ | 79,681 | ||||||||
5.00%, 3/15/19 | 32 | 30,400 | ||||||||||
WPX Energy, Inc. | 66 | 62,700 | ||||||||||
6.00%, 1/15/22 | 48 | 47,880 | ||||||||||
|
| |||||||||||
| 6,783,003 | ||||||||||||
|
| |||||||||||
Other Industrial – 0.6% | ||||||||||||
Algeco Scotsman Global Finance PLC | 44 | 39,930 | ||||||||||
B456 Systems, Inc. | 71 | 2,840 | ||||||||||
Belden, Inc. | 27 | 27,607 | ||||||||||
5.50%, 4/15/23(a) | EUR | 21 | 24,436 | |||||||||
General Cable Corp. | U.S.$ | 66 | 62,370 | |||||||||
Laureate Education, Inc. | 291 | 269,175 | ||||||||||
Modular Space Corp. | 109 | 46,870 | ||||||||||
New Enterprise Stone & Lime Co., Inc. | 22 | 21,780 | ||||||||||
|
| |||||||||||
| 495,008 | ||||||||||||
|
| |||||||||||
Services – 1.0% | ||||||||||||
ADT Corp. (The) | 80 | 75,800 | ||||||||||
4.125%, 6/15/23 | 89 | 87,025 | ||||||||||
APX Group, Inc. | 34 | 35,063 | ||||||||||
7.875%, 12/01/22 | 123 | 129,459 | ||||||||||
8.75%, 12/01/20 | 74 | 71,595 | ||||||||||
GEO Group, Inc. (The) | 13 | 11,326 | ||||||||||
5.875%, 1/15/22-10/15/24 | 55 | 50,938 | ||||||||||
6.00%, 4/15/26 | 14 | 12,075 | ||||||||||
IHS Markit Ltd. | 93 | 98,347 | ||||||||||
Prime Security Services Borrower LLC/Prime Finance, Inc. | 265 | 281,562 | ||||||||||
|
| |||||||||||
| 853,190 | ||||||||||||
|
| |||||||||||
Technology – 3.2% | ||||||||||||
Avaya, Inc. | 216 | 175,500 | ||||||||||
10.50%, 3/01/21(a) | 367 | 121,110 | ||||||||||
| AB HIGH YIELD PORTFOLIO • | 31 |
Portfolio of Investments
| Principal Amount (000) | U.S. $ Value | |||||||||||
| ||||||||||||
BMC Software Finance, Inc. | U.S.$ | 290 | $ | 265,350 | ||||||||
BMC Software, Inc. | 2 | 1,990 | ||||||||||
Ceridian HCM Holding, Inc. | 78 | 82,095 | ||||||||||
Dell, Inc. | 179 | 172,735 | ||||||||||
Diamond 1 Finance Corp./Diamond 2 Finance Corp. | 110 | 115,935 | ||||||||||
7.125%, 6/15/24(a) | 203 | 222,377 | ||||||||||
EMC Corp. | 313 | 308,668 | ||||||||||
First Data Corp. | 84 | 85,260 | ||||||||||
7.00%, 12/01/23(a) | 106 | 111,035 | ||||||||||
General Cable Corp. | 101 | 65,082 | ||||||||||
Goodman Networks, Inc. | 205 | 87,638 | ||||||||||
Infor Software Parent LLC/Infor Software Parent, Inc. | 52 | 52,650 | ||||||||||
Infor US, Inc. | 99 | 102,341 | ||||||||||
Iron Mountain Europe PLC | GBP | 75 | 95,243 | |||||||||
Iron Mountain, Inc. | U.S.$ | 70 | 72,275 | |||||||||
6.00%, 10/01/20(a) | 25 | 26,469 | ||||||||||
Micron Technology, Inc. | 30 | 29,400 | ||||||||||
5.50%, 2/01/25 | 213 | 208,806 | ||||||||||
Nokia Oyj | 15 | 16,050 | ||||||||||
6.625%, 5/15/39 | 48 | 51,840 | ||||||||||
Sanmina Corp. | 125 | 130,313 | ||||||||||
Solera LLC/Solera Finance, Inc. | 32 | 35,770 | ||||||||||
Sophia LP/Sophia Finance, Inc. | 26 | 27,300 | ||||||||||
Western Digital Corp. | 124 | 143,220 | ||||||||||
|
| |||||||||||
| 2,806,452 | ||||||||||||
|
| |||||||||||
| 32 | • AB HIGH YIELD PORTFOLIO |
Portfolio of Investments
| Principal Amount (000) | U.S. $ Value | |||||||||||
| ||||||||||||
Transportation - Services – 1.1% | ||||||||||||
Avis Budget Car Rental LLC/Avis Budget Finance, Inc. | U.S.$ | 93 | $ | 88,350 | ||||||||
5.50%, 4/01/23 | 37 | 36,630 | ||||||||||
CEVA Group PLC | 75 | 48,656 | ||||||||||
Europcar Groupe SA | EUR | 24 | 27,509 | |||||||||
Hertz Corp. (The) | U.S.$ | 365 | 354,378 | |||||||||
5.875%, 10/15/20 | 101 | 103,778 | ||||||||||
XPO CNW, Inc. | 121 | 96,800 | ||||||||||
7.25%, 1/15/18 | 43 | 44,505 | ||||||||||
XPO Logistics, Inc. | 9 | 9,259 | ||||||||||
6.50%, 6/15/22(a) | 101 | 105,040 | ||||||||||
|
| |||||||||||
| 914,905 | ||||||||||||
|
| |||||||||||
| 50,712,892 | ||||||||||||
|
| |||||||||||
| Financial Institutions – 8.3% | ||||||||||||
Banking – 4.4% | ||||||||||||
Ally Financial, Inc. | 101 | 101,252 | ||||||||||
4.125%, 3/30/20 | 416 | 422,760 | ||||||||||
4.75%, 9/10/18 | 192 | 197,301 | ||||||||||
8.00%, 12/31/18-11/01/31 | 363 | 414,617 | ||||||||||
Barclays Bank PLC | 50 | 58,073 | ||||||||||
7.75%, 4/10/23 | 239 | 250,950 | ||||||||||
BBVA International Preferred SAU | EUR | 29 | 27,759 | |||||||||
1.649%, 12/20/16(a)(l)(m) | 50 | 50,220 | ||||||||||
Citigroup, Inc. | U.S.$ | 178 | 184,675 | |||||||||
Countrywide Capital III | 159 | 199,302 | ||||||||||
Credit Agricole SA | GBP | 150 | 201,960 | |||||||||
HT1 Funding GmbH | EUR | 258 | 280,812 | |||||||||
Lloyds Bank PLC | 50 | 59,143 | ||||||||||
Lloyds Banking Group PLC | U.S.$ | 75 | 83,438 | |||||||||
| AB HIGH YIELD PORTFOLIO • | 33 |
Portfolio of Investments
| Principal Amount (000) | U.S. $ Value | |||||||||||
| ||||||||||||
Royal Bank of Scotland Group PLC | EUR | 178 | $ | 194,062 | ||||||||
8.00%, 8/10/25(l) | U.S.$ | 110 | 104,500 | |||||||||
8.625%, 8/15/21(l) | 400 | 398,000 | ||||||||||
Series U | 300 | 291,000 | ||||||||||
Societe Generale SA | 132 | 133,257 | ||||||||||
8.00%, 9/29/25(a)(l) | 108 | 109,080 | ||||||||||
Zions Bancorporation | 48 | 49,118 | ||||||||||
|
| |||||||||||
| 3,811,279 | ||||||||||||
|
| |||||||||||
Brokerage – 0.1% | ||||||||||||
Lehman Brothers Holdings, Inc. | 1,453 | 86,454 | ||||||||||
|
| |||||||||||
Finance – 2.8% | ||||||||||||
Artsonig Pty Ltd. | 232 | 18,539 | ||||||||||
CIT Group, Inc. | 20 | 20,306 | ||||||||||
5.25%, 3/15/18 | 178 | 184,347 | ||||||||||
5.50%, 2/15/19(a) | 622 | 654,655 | ||||||||||
Creditcorp | 114 | 54,150 | ||||||||||
Enova International, Inc. | 230 | 215,625 | ||||||||||
Navient Corp. | 144 | 146,071 | ||||||||||
4.875%, 6/17/19 | 353 | 356,089 | ||||||||||
5.00%, 10/26/20 | 162 | 159,975 | ||||||||||
5.875%, 3/25/21 | 2 | 2,002 | ||||||||||
6.125%, 3/25/24 | 9 | 8,235 | ||||||||||
7.25%, 1/25/22 | 44 | 44,440 | ||||||||||
8.00%, 3/25/20 | 335 | 363,475 | ||||||||||
TMX Finance LLC/TitleMax Finance Corp. | 323 | 242,250 | ||||||||||
|
| |||||||||||
| 2,470,159 | ||||||||||||
|
| |||||||||||
Insurance – 0.4% | ||||||||||||
American Equity Investment Life Holding Co. | 30 | 31,350 | ||||||||||
Genworth Holdings, Inc. | 30 | 24,450 | ||||||||||
Liberty Mutual Group, Inc. | 237 | 278,475 | ||||||||||
|
| |||||||||||
| 334,275 | ||||||||||||
|
| |||||||||||
| 34 | • AB HIGH YIELD PORTFOLIO |
Portfolio of Investments
| Principal Amount (000) | U.S. $ Value | |||||||||||
| ||||||||||||
Other Finance – 0.5% | ||||||||||||
CNG Holdings, Inc. | U.S.$ | 39 | $ | 25,545 | ||||||||
iPayment, Inc. | 207 | 208,614 | ||||||||||
Lincoln Finance Ltd. | EUR | 88 | 104,948 | |||||||||
Speedy Cash Intermediate Holdings Corp. | U.S.$ | 6 | 4,755 | |||||||||
Speedy Group Holdings Corp. | 167 | 82,665 | ||||||||||
|
| |||||||||||
| 426,527 | ||||||||||||
|
| |||||||||||
REITS – 0.1% | ||||||||||||
FelCor Lodging LP | 68 | 70,550 | ||||||||||
VEREIT Operating Partnership LP | 27 | 28,379 | ||||||||||
|
| |||||||||||
| 98,929 | ||||||||||||
|
| |||||||||||
| 7,227,623 | ||||||||||||
|
| |||||||||||
Utility – 2.4% | ||||||||||||
Electric – 2.4% | ||||||||||||
AES Corp./VA | 110 | 109,141 | ||||||||||
7.375%, 7/01/21 | 174 | 196,185 | ||||||||||
Calpine Corp. | 15 | 14,625 | ||||||||||
5.75%, 1/15/25 | 283 | 275,217 | ||||||||||
7.875%, 1/15/23(a) | 37 | 38,804 | ||||||||||
DPL, Inc. | 86 | 89,225 | ||||||||||
Dynegy, Inc. | 26 | 23,281 | ||||||||||
6.75%, 11/01/19 | 111 | 112,342 | ||||||||||
7.375%, 11/01/22 | 177 | 170,694 | ||||||||||
7.625%, 11/01/24 | 23 | 22,022 | ||||||||||
Emera, Inc. | 86 | 95,030 | ||||||||||
FirstEnergy Corp. | 20 | 20,232 | ||||||||||
Series B | 29 | 30,765 | ||||||||||
Series C | 147 | 191,133 | ||||||||||
GenOn Energy, Inc. | 152 | 124,640 | ||||||||||
| AB HIGH YIELD PORTFOLIO • | 35 |
Portfolio of Investments
| Principal Amount (000) | U.S. $ Value | |||||||||||
| ||||||||||||
NRG Energy, Inc. | U.S.$ | 184 | $ | 179,812 | ||||||||
7.875%, 5/15/21 | 33 | 34,485 | ||||||||||
Talen Energy Supply LLC | 114 | 93,412 | ||||||||||
6.50%, 5/01/18-6/01/25 | 105 | 98,812 | ||||||||||
Texas Competitive/tceh | 201 | – 0 | – | |||||||||
Viridian Group FundCo II Ltd. | EUR | 114 | 132,652 | |||||||||
|
| |||||||||||
| 2,052,509 | ||||||||||||
|
| |||||||||||
Total Corporates – Non-Investment Grade | 59,993,024 | |||||||||||
|
| |||||||||||
CORPORATES – INVESTMENT | ||||||||||||
Financial Institutions – 5.3% | ||||||||||||
Banking – 2.7% | ||||||||||||
BNP Paribas SA | U.S.$ | 200 | 209,000 | |||||||||
BPCE SA | 282 | 305,538 | ||||||||||
Danske Bank A/S | GBP | 80 | 98,899 | |||||||||
Deutsche Bank AG | U.S.$ | 173 | 170,213 | |||||||||
HSBC Capital Funding Dollar1 LP | 64 | 97,111 | ||||||||||
JPMorgan Chase & Co. | 166 | 166,130 | ||||||||||
Series V | 16 | 15,680 | ||||||||||
Lloyds Banking Group PLC | 200 | 205,773 | ||||||||||
Nationwide Building Society | 250 | 246,494 | ||||||||||
Royal Bank of Scotland Group PLC | 200 | 195,812 | ||||||||||
Santander UK Group Holdings PLC | 200 | 199,056 | ||||||||||
Standard Chartered PLC | 200 | 199,074 | ||||||||||
UBS Group Funding Jersey Ltd. | 220 | 218,822 | ||||||||||
|
| |||||||||||
| 2,327,602 | ||||||||||||
|
| |||||||||||
| 36 | • AB HIGH YIELD PORTFOLIO |
Portfolio of Investments
| Principal Amount (000) | U.S. $ Value | |||||||||||
| ||||||||||||
Brokerage – 0.2% | ||||||||||||
E*TRADE Financial Corp. | U.S.$ | 15 | $ | 16,033 | ||||||||
GFI Group, Inc. | 117 | 125,482 | ||||||||||
|
| |||||||||||
| 141,515 | ||||||||||||
|
| |||||||||||
Finance – 0.5% | ||||||||||||
AerCap Aviation Solutions BV | 100 | 102,625 | ||||||||||
HSBC Finance Corp. | 80 | 91,308 | ||||||||||
International Lease Finance Corp. | 57 | 58,416 | ||||||||||
8.875%, 9/01/17 | 221 | 232,879 | ||||||||||
|
| |||||||||||
| 485,228 | ||||||||||||
|
| |||||||||||
Insurance – 1.2% | ||||||||||||
Aetna, Inc. | 369 | 372,348 | ||||||||||
Allstate Corp. (The) | 36 | 42,300 | ||||||||||
Nationwide Mutual Insurance Co. | 106 | 162,055 | ||||||||||
Progressive Corp. (The) | 157 | 155,037 | ||||||||||
Prudential Financial, Inc. | 240 | 258,000 | ||||||||||
XLIT Ltd. | 12 | 11,599 | ||||||||||
Series E | 38 | 29,141 | ||||||||||
|
| |||||||||||
| 1,030,480 | ||||||||||||
|
| |||||||||||
REITS – 0.7% | ||||||||||||
DDR Corp. | 40 | 47,680 | ||||||||||
EPR Properties | 166 | 192,372 | ||||||||||
HCP, Inc. | 170 | 178,857 | ||||||||||
Senior Housing Properties Trust | 30 | 34,224 | ||||||||||
Welltower, Inc. | 113 | 124,407 | ||||||||||
|
| |||||||||||
| 577,540 | ||||||||||||
|
| |||||||||||
| 4,562,365 | ||||||||||||
|
| |||||||||||
Industrial – 4.1% | ||||||||||||
Basic – 0.2% | ||||||||||||
Glencore Finance Canada Ltd. | 16 | 16,080 | ||||||||||
| AB HIGH YIELD PORTFOLIO • | 37 |
Portfolio of Investments
| Principal Amount (000) | U.S. $ Value | |||||||||||
| ||||||||||||
Glencore Funding LLC | U.S.$ | 17 | $ | 16,745 | ||||||||
4.625%, 4/29/24(a) | 27 | 27,451 | ||||||||||
Rio Tinto Finance USA Ltd. | 132 | 139,636 | ||||||||||
|
| |||||||||||
| 199,912 | ||||||||||||
|
| |||||||||||
Capital Goods – 0.2% | ||||||||||||
General Electric Co. | 172 | 182,217 | ||||||||||
|
| |||||||||||
Communications - Media – 0.2% | ||||||||||||
Charter Communications Operating LLC/Charter Communications Operating Capital | 111 | 119,719 | ||||||||||
|
| |||||||||||
Communications - Telecommunications – 0.5% | ||||||||||||
Qwest Corp. | 173 | 191,814 | ||||||||||
6.875%, 9/15/33 | 38 | 37,607 | ||||||||||
Sprint Spectrum Co. LLC/Sprint Spectrum Co. II LLC/Sprint Spectrum Co. III LLC | 229 | 229,572 | ||||||||||
|
| |||||||||||
| 458,993 | ||||||||||||
|
| |||||||||||
Consumer Cyclical - Automotive – 0.1% | ||||||||||||
General Motors Financial Co., Inc. | 90 | 91,582 | ||||||||||
|
| |||||||||||
Consumer Cyclical - Other – 0.3% | ||||||||||||
DR Horton, Inc. | 152 | 158,563 | ||||||||||
Seminole Tribe of Florida, Inc. | 94 | 94,470 | ||||||||||
|
| |||||||||||
| 253,033 | ||||||||||||
|
| |||||||||||
Consumer Non-Cyclical – 1.2% | ||||||||||||
AbbVie, Inc. | 436 | 436,036 | ||||||||||
Anheuser-Busch InBev Finance, Inc. | 129 | 131,930 | ||||||||||
Forest Laboratories LLC | 10 | 11,163 | ||||||||||
Newell Brands, Inc. | 297 | 309,260 | ||||||||||
Teva Pharmaceutical Finance Netherlands III BV 1.70%, 7/19/19 | 132 | 130,976 | ||||||||||
|
| |||||||||||
| 1,019,365 | ||||||||||||
|
| |||||||||||
| 38 | • AB HIGH YIELD PORTFOLIO |
Portfolio of Investments
| Principal Amount (000) | U.S. $ Value | |||||||||||
| ||||||||||||
Energy – 1.0% | ||||||||||||
Enterprise Products Operating LLC | U.S.$ | 14 | $ | 13,318 | ||||||||
Kinder Morgan, Inc./DE | 39 | 47,693 | ||||||||||
Marathon Oil Corp. | 34 | 31,887 | ||||||||||
Regency Energy Partners LP/Regency Energy Finance Corp. | 10 | 10,214 | ||||||||||
5.00%, 10/01/22 | 53 | 56,871 | ||||||||||
5.50%, 4/15/23 | 107 | 110,194 | ||||||||||
Shell International Finance BV | 390 | 395,120 | ||||||||||
Williams Partners LP | 134 | 133,262 | ||||||||||
5.10%, 9/15/45 | 76 | 73,033 | ||||||||||
|
| |||||||||||
| 871,592 | ||||||||||||
|
| |||||||||||
Technology – 0.4% | ||||||||||||
Hewlett Packard Enterprise Co. | 12 | 12,412 | ||||||||||
Micron Technology, Inc. | 61 | 67,329 | ||||||||||
Seagate HDD Cayman | 96 | 91,488 | ||||||||||
4.875%, 6/01/27 | 26 | 23,491 | ||||||||||
Western Digital Corp. | 123 | 134,531 | ||||||||||
|
| |||||||||||
| 329,251 | ||||||||||||
|
| |||||||||||
| 3,525,664 | ||||||||||||
|
| |||||||||||
Utility – 0.3% | ||||||||||||
Electric – 0.1% | ||||||||||||
PPL Capital Funding, Inc. | 119 | 106,208 | ||||||||||
|
| |||||||||||
Natural Gas – 0.2% | ||||||||||||
Empresa de Energia de Bogota SA ESP | 150 | 155,312 | ||||||||||
|
| |||||||||||
| 261,520 | ||||||||||||
|
| |||||||||||
Total Corporates – Investment Grade | 8,349,549 | |||||||||||
|
| |||||||||||
| AB HIGH YIELD PORTFOLIO • | 39 |
Portfolio of Investments
| Principal Amount (000) | U.S. $ Value | |||||||||||
| ||||||||||||
BANK LOANS – 4.6% | ||||||||||||
Industrial – 4.3% | ||||||||||||
Basic – 0.4% | ||||||||||||
FMG Resources (August 2006) Pty LTD | U.S.$ | 126 | $ | 125,769 | ||||||||
Ineos US Finance LLC | 161 | 161,997 | ||||||||||
Magnetation LLC | 254 | 33,041 | ||||||||||
|
| |||||||||||
| 320,807 | ||||||||||||
|
| |||||||||||
Capital Goods – 0.2% | ||||||||||||
Serta Simmons Holdings LLC | 176 | 177,214 | ||||||||||
|
| |||||||||||
Consumer Cyclical - Automotive – 0.2% | ||||||||||||
CS Intermediate Holdco 2 LLC | 87 | 86,605 | ||||||||||
Navistar, Inc. | 110 | 110,434 | ||||||||||
|
| |||||||||||
| 197,039 | ||||||||||||
|
| |||||||||||
Consumer Cyclical - Entertainment – 0.3% | ||||||||||||
ClubCorp Club Operations, Inc. | 136 | 137,082 | ||||||||||
Seaworld Parks & Entertainment, Inc. | 87 | 86,828 | ||||||||||
|
| |||||||||||
| 223,910 | ||||||||||||
|
| |||||||||||
Consumer Cyclical - Other – 0.6% | ||||||||||||
Beazer Homes USA, Inc. | 12 | 11,596 | ||||||||||
CityCenter Holdings, LLC | 193 | 193,994 | ||||||||||
La Quinta Intermediate Holdings L.L.C. | 136 | 135,515 | ||||||||||
Scientific Games International, Inc. | 91 | 90,984 | ||||||||||
| 40 | • AB HIGH YIELD PORTFOLIO |
Portfolio of Investments
| Principal Amount (000) | U.S. $ Value | |||||||||||
| ||||||||||||
Station Casinos LLC | U.S.$ | 93 | $ | 93,022 | ||||||||
|
| |||||||||||
| 525,111 | ||||||||||||
|
| |||||||||||
Consumer Cyclical - Retailers – 0.5% | ||||||||||||
Harbor Freight Tools Usa, Inc. | 113 | 113,871 | ||||||||||
J.C. Penney Corporation, Inc. | 85 | 85,954 | ||||||||||
Petco Animal Supplies, Inc. | 250 | 252,222 | ||||||||||
|
| |||||||||||
| 452,047 | ||||||||||||
|
| |||||||||||
Consumer Non-Cyclical – 0.6% | ||||||||||||
Acadia Healthcare Company, Inc. | 7 | 6,891 | ||||||||||
Air Medical Group Holdings, Inc. | 75 | 74,212 | ||||||||||
Arbor Pharmaceuticals, LLC | 133 | 134,054 | ||||||||||
DJO Finance LLC | 87 | 85,739 | ||||||||||
Grifols Worldwide Operations Limited | 61 | 61,782 | ||||||||||
Immucor, Inc. (fka IVD Acquisition Corporation) 5.00% (LIBOR 6 Month + 3.75%), | 83 | 81,400 | ||||||||||
Mallinckrodt International Finance S.A. | 103 | 103,209 | ||||||||||
Ortho-Clinical Diagnostics Holdings | 9 | 9,107 | ||||||||||
Vizient, Inc. | 7 | 6,667 | ||||||||||
|
| |||||||||||
| 563,061 | ||||||||||||
|
| |||||||||||
| AB HIGH YIELD PORTFOLIO • | 41 |
Portfolio of Investments
| Principal Amount (000) | U.S. $ Value | |||||||||||
| ||||||||||||
Energy – 0.2% | ||||||||||||
California Resources Corporation | U.S.$ | 159 | $ | 170,569 | ||||||||
Chesapeake Energy Corporation | 47 | 50,156 | ||||||||||
|
| |||||||||||
| 220,725 | ||||||||||||
|
| |||||||||||
Other Industrial – 0.5% | ||||||||||||
Gardner Denver, Inc. | 77 | 74,560 | ||||||||||
Gates Global LLC | 52 | 51,435 | ||||||||||
Manitowoc Foodservice, Inc. | 2 | 1,830 | ||||||||||
Sedgwick Claims Management Services, Inc. 3.75% (LIBOR 3 Month + 2.75%), | 85 | 84,728 | ||||||||||
Travelport Finance (Luxembourg) S.Ã r.l. | 130 | 130,407 | ||||||||||
Unifrax Holding Co. | EUR | 63 | 68,666 | |||||||||
|
| |||||||||||
| 411,626 | ||||||||||||
|
| |||||||||||
Technology – 0.8% | ||||||||||||
Avago Technologies Cayman Holdings Ltd. | U.S.$ | 58 | 58,633 | |||||||||
BMC Software Finance Inc. | 127 | 124,788 | ||||||||||
MTS Systems Corporation | 93 | 93,554 | ||||||||||
Smart Modular Technologies (Global), Inc. | 74 | 55,461 | ||||||||||
Solera, LLC (Solera Finance, Inc.) | 208 | 210,225 | ||||||||||
Veritas US Inc. | 145 | 135,320 | ||||||||||
|
| |||||||||||
| 677,981 | ||||||||||||
|
| |||||||||||
| 3,769,521 | ||||||||||||
|
| |||||||||||
| 42 | • AB HIGH YIELD PORTFOLIO |
Portfolio of Investments
| Principal Amount (000) | U.S. $ Value | |||||||||||
| ||||||||||||
Financial Institutions – 0.2% | ||||||||||||
Finance – 0.2% | ||||||||||||
Delos Finance S.Ã r.l. | U.S.$ | 151 | $ | 151,446 | ||||||||
|
| |||||||||||
Utilities – 0.1% | ||||||||||||
Natural Gas – 0.1% | ||||||||||||
EP Energy LLC | 90 | 92,025 | ||||||||||
|
| |||||||||||
Total Bank Loans | 4,012,992 | |||||||||||
|
| |||||||||||
| Shares | ||||||||||||
COMMON STOCKS – 2.0% | ||||||||||||
Consumer Discretionary – 1.0% | ||||||||||||
Auto Components – 0.0% | ||||||||||||
Exide Technologies(b) | 3,472 | 5,208 | ||||||||||
|
| |||||||||||
Automobiles – 0.2% | ||||||||||||
General Motors Co. | 3,720 | 117,552 | ||||||||||
|
| |||||||||||
Hotels, Restaurants & Lei sure – 0.4% | ||||||||||||
eDreams ODIGEO SA(b) | 41,613 | 126,631 | ||||||||||
Eldorado Resorts, Inc.(b) | 6,619 | 80,090 | ||||||||||
International Game Technology PLC | 5,800 | 166,576 | ||||||||||
|
| |||||||||||
| 373,297 | ||||||||||||
|
| |||||||||||
Household Durables – 0.2% | ||||||||||||
Hovnanian Enterprises, Inc. – Class A(b) | 11,241 | 17,536 | ||||||||||
MDC Holdings, Inc. | 3,081 | 73,051 | ||||||||||
Taylor Morrison Home Corp. – Class A(b) | 4,800 | 81,888 | ||||||||||
|
| |||||||||||
| 172,475 | ||||||||||||
|
| |||||||||||
Media – 0.2% | ||||||||||||
Clear Channel Outdoor Holdings, Inc. – Class A | 10,500 | 60,375 | ||||||||||
DISH Network Corp. – Class A(b) | 860 | 50,362 | ||||||||||
Townsquare Media, Inc. – Class A(b) | 8,330 | 69,805 | ||||||||||
|
| |||||||||||
| 180,542 | ||||||||||||
|
| |||||||||||
| 849,074 | ||||||||||||
|
| |||||||||||
Materials – 0.3% | ||||||||||||
Chemicals – 0.1% | ||||||||||||
LyondellBasell Industries NV – Class A | 606 | 48,207 | ||||||||||
|
| |||||||||||
Metals & Mining – 0.2% | ||||||||||||
ArcelorMittal (New York)(b) | 7,589 | 51,074 | ||||||||||
Cliffs Natural Resources, Inc.(b) | 4,358 | 24,056 | ||||||||||
| AB HIGH YIELD PORTFOLIO • | 43 |
Portfolio of Investments
| Company | Shares | U.S. $ Value | ||||||||||
| ||||||||||||
Constellium NV – Class A(b) | 8,704 | $ | 45,696 | |||||||||
Neenah Enterprises, Inc.(b)(c)(d) | 15,377 | 57,049 | ||||||||||
|
| |||||||||||
| 177,875 | ||||||||||||
|
| |||||||||||
| 226,082 | ||||||||||||
|
| |||||||||||
Energy – 0.2% | ||||||||||||
Oil, Gas & Consumable Fuels – 0.2% | ||||||||||||
Chesapeake Energy Corp.(b) | 10,350 | 57,028 | ||||||||||
EP Energy Corp. – Class A(b) | 8,583 | 30,555 | ||||||||||
Halcon Resources Corp.(b) | 946 | 8,467 | ||||||||||
Peabody Energy Corp.(b) | 2,002 | 17,518 | ||||||||||
SandRidge Energy, Inc.(b) | 1,203 | 27,705 | ||||||||||
Triangle Petroleum Corp.(b) | 10,455 | 2,413 | ||||||||||
Vantage Drilling International(b)(c) | 282 | 23,688 | ||||||||||
Whiting Petroleum Corp.(b) | 7,108 | 58,570 | ||||||||||
|
| |||||||||||
| 225,944 | ||||||||||||
|
| |||||||||||
Health Care – 0.2% | ||||||||||||
Health Care Providers & Services – 0.2% | ||||||||||||
Community Health Systems, Inc.(b) | 8,093 | 42,731 | ||||||||||
LifePoint Health, Inc.(b) | 1,419 | 84,927 | ||||||||||
Quorum Health Corp.(b) | 646 | 2,610 | ||||||||||
|
| |||||||||||
| 130,268 | ||||||||||||
|
| |||||||||||
Pharmaceuticals – 0.0% | ||||||||||||
Endo International PLC(b) | 1,388 | 26,025 | ||||||||||
|
| |||||||||||
| 156,293 | ||||||||||||
|
| |||||||||||
Information Technology – 0.2% | ||||||||||||
IT Services – 0.2% | ||||||||||||
Travelport Worldwide Ltd. | 9,513 | 134,324 | ||||||||||
|
| |||||||||||
Software – 0.0% | ||||||||||||
Dell Technologies, Inc. – VMware, Inc. – Class V(b) | 412 | 20,225 | ||||||||||
|
| |||||||||||
| 154,549 | ||||||||||||
|
| |||||||||||
Industrials – 0.1% | ||||||||||||
Consumer Cyclical - Automotive – 0.0% | ||||||||||||
Exide Corp.(b)(g) | 1,755 | 2,633 | ||||||||||
|
| |||||||||||
Machinery – 0.1% | ||||||||||||
Navistar International Corp.(b) | 3,851 | 85,877 | ||||||||||
|
| |||||||||||
Trading Companies & Distributors – 0.0% | ||||||||||||
Emeco Holdings Ltd.(b) | 55,000 | 2,908 | ||||||||||
|
| |||||||||||
| 91,418 | ||||||||||||
|
| |||||||||||
Financials – 0.0% | ||||||||||||
Diversified Financial Services – 0.0% | ||||||||||||
iPayment, Inc.(b)(c)(d) | 12,411 | 40,956 | ||||||||||
|
| |||||||||||
Total Common Stocks | 1,744,316 | |||||||||||
|
| |||||||||||
| 44 | • AB HIGH YIELD PORTFOLIO |
Portfolio of Investments
| Company | Principal Amount (000) | U.S. $ Value | ||||||||||
| ||||||||||||
GOVERNMENTS – TREASURIES – 1.4% | ||||||||||||
Mexico – 0.3% | ||||||||||||
Mexican Bonos | MXN | 4,125 | $ | 210,511 | ||||||||
|
| |||||||||||
United States – 1.1% | ||||||||||||
U.S. Treasury Bonds | U.S.$ | 464 | 515,667 | |||||||||
U.S. Treasury Notes | 440 | 449,350 | ||||||||||
|
| |||||||||||
| 965,017 | ||||||||||||
|
| |||||||||||
Total Governments – Treasuries | 1,175,528 | |||||||||||
|
| |||||||||||
| Shares | ||||||||||||
PREFERRED STOCKS – 1.3% | ||||||||||||
Financial Institutions – 1.1% | ||||||||||||
Banking – 0.2% | ||||||||||||
GMAC Capital Trust I | 2,875 | 73,399 | ||||||||||
US Bancorp | 3,625 | 106,394 | ||||||||||
|
| |||||||||||
| 179,793 | ||||||||||||
|
| |||||||||||
REITS – 0.9% | ||||||||||||
Sovereign Real Estate Investment Trust | 624 | 799,500 | ||||||||||
|
| |||||||||||
| 979,293 | ||||||||||||
|
| |||||||||||
Industrial – 0.1% | ||||||||||||
Consumer Cyclical - Other – 0.0% | ||||||||||||
Hovnanian Enterprises, Inc. | 1,680 | 7,560 | ||||||||||
|
| |||||||||||
Energy – 0.1% | ||||||||||||
Sanchez Energy Corp. | 3,300 | 83,127 | ||||||||||
|
| |||||||||||
| 90,687 | ||||||||||||
|
| |||||||||||
Utility – 0.1% | ||||||||||||
Electric – 0.1% | ||||||||||||
SCE Trust III | 1,450 | 41,615 | ||||||||||
|
| |||||||||||
Total Preferred Stocks | 1,111,595 | |||||||||||
|
| |||||||||||
| AB HIGH YIELD PORTFOLIO • | 45 |
Portfolio of Investments
| Principal Amount (000) | U.S. $ Value | |||||||||||
| ||||||||||||
COLLATERALIZED MORTGAGE OBLIGATIONS – 1.0% | ||||||||||||
Risk Share Floating Rate – 0.9% | ||||||||||||
Federal Home Loan Mortgage Corp. Structured | U.S.$ | 50 | $ | 58,709 | ||||||||
Series 2013-DN2, Class M2 | 180 | 189,521 | ||||||||||
Series 2014-DN1, Class M3 | 125 | 135,372 | ||||||||||
Series 2014-HQ2, Class M3 | 185 | 188,644 | ||||||||||
Federal National Mortgage Association Connecticut Avenue Securities | 50 | 55,006 | ||||||||||
Series 2014-C01, Class M2 | 93 | 98,118 | ||||||||||
Series 2015-C03, Class 1M2 | 25 | 26,633 | ||||||||||
Series 2015-C03, Class 2M2 | 10 | 10,638 | ||||||||||
|
| |||||||||||
| 762,641 | ||||||||||||
|
| |||||||||||
Non-Agency Fixed Rate – 0.1% | ||||||||||||
Alternative Loan Trust | 25 | 20,625 | ||||||||||
CSMC Mortgage-Backed Trust | 46 | 39,003 | ||||||||||
|
| |||||||||||
| 59,628 | ||||||||||||
|
| |||||||||||
Total Collateralized Mortgage Obligations | 822,269 | |||||||||||
|
| |||||||||||
EMERGING MARKETS – CORPORATE BONDS – 0.9% | ||||||||||||
Industrial – 0.9% | ||||||||||||
Capital Goods – 0.2% | ||||||||||||
Odebrecht Finance Ltd. | 325 | 160,875 | ||||||||||
|
| |||||||||||
| 46 | • AB HIGH YIELD PORTFOLIO |
Portfolio of Investments
| Principal Amount (000) | U.S. $ Value | |||||||||||
| ||||||||||||
Communications - Telecommunications – 0.1% | ||||||||||||
Digicel Ltd. | U.S.$ | 125 | $ | 112,150 | ||||||||
|
| |||||||||||
Consumer Cyclical - Retailers – 0.0% | ||||||||||||
Edcon Ltd. | EUR | 81 | 18,673 | |||||||||
|
| |||||||||||
Consumer Non-Cyclical – 0.6% | ||||||||||||
Arcelik AS | U.S.$ | 98 | 96,653 | |||||||||
Minerva Luxembourg SA | 200 | 194,700 | ||||||||||
Tonon Luxembourg SA | 20 | 3,739 | ||||||||||
USJ Acucar e Alcool SA | 200 | 169,250 | ||||||||||
Virgolino de Oliveira Finance SA | 330 | 23,265 | ||||||||||
|
| |||||||||||
| 487,607 | ||||||||||||
|
| |||||||||||
Transportation - Airlines – 0.0% | ||||||||||||
Guanay Finance Ltd. | 29 | 29,230 | ||||||||||
|
| |||||||||||
Total Emerging Markets – Corporate Bonds | 808,535 | |||||||||||
|
| |||||||||||
ASSET-BACKED SECURITIES – 0.8% | ||||||||||||
Home Equity Loans - Floating Rate – 0.6% | ||||||||||||
CWABS Asset-Backed Certificates Trust | 197 | 195,184 | ||||||||||
GSAA Home Equity Trust | 294 | 149,823 | ||||||||||
Lehman XS Trust | 159 | 220,686 | ||||||||||
|
| |||||||||||
| 565,693 | ||||||||||||
|
| |||||||||||
Other ABS - Fixed Rate – 0.2% | ||||||||||||
Taco Bell Funding LLC | 55 | 56,595 | ||||||||||
| AB HIGH YIELD PORTFOLIO • | 47 |
Portfolio of Investments
| Principal Amount (000) | U.S. $ Value | |||||||||||
| ||||||||||||
Series 2016-1A, Class A2I | U.S.$ | 100 | $ | 101,376 | ||||||||
|
| |||||||||||
| 157,971 | ||||||||||||
|
| |||||||||||
Total Asset-Backed Securities | 723,664 | |||||||||||
|
| |||||||||||
COMMERCIAL MORTGAGE-BACKED SECURITIES – 0.8% | ||||||||||||
Non-Agency Fixed Rate CMBS – 0.8% | ||||||||||||
Bear Stearns Commercial Mortgage Securities Trust | 8 | 7,998 | ||||||||||
Citigroup Commercial Mortgage Trust | 50 | 42,066 | ||||||||||
GS Mortgage Securities Trust | 100 | 83,138 | ||||||||||
JPMBB Commercial Mortgage Securities Trust | 100 | 91,650 | ||||||||||
LB-UBS Commercial Mortgage Trust | 360 | 360,485 | ||||||||||
ML-CFC Commercial Mortgage Trust | 71 | 70,609 | ||||||||||
|
| |||||||||||
Total Commercial Mortgage-Backed Securities | 655,946 | |||||||||||
|
| |||||||||||
LOCAL GOVERNMENTS – MUNICIPAL BONDS – 0.4% | ||||||||||||
United States – 0.4% | ||||||||||||
State of California | 85 | 133,553 | ||||||||||
7.95%, 3/01/36 | 185 | 220,137 | ||||||||||
|
| |||||||||||
Total Local Governments – Municipal Bonds | 353,690 | |||||||||||
|
| |||||||||||
EMERGING MARKETS – SOVEREIGNS – 0.2% | ||||||||||||
Argentina – 0.1% | ||||||||||||
Argentine Republic Government International Bond | 123 | 127,182 | ||||||||||
|
| |||||||||||
| 48 | • AB HIGH YIELD PORTFOLIO |
Portfolio of Investments
| Principal Amount (000) | U.S. $ Value | |||||||||||
| ||||||||||||
Venezuela – 0.1% | ||||||||||||
Venezuela Government International Bond | U.S.$ | 134 | $ | 67,134 | ||||||||
|
| |||||||||||
Total Emerging Markets – Sovereigns | 194,316 | |||||||||||
|
| |||||||||||
GOVERNMENTS – SOVEREIGN AGENCIES – 0.2% | ||||||||||||
Brazil – 0.1% | ||||||||||||
Petrobras Global Finance BV | 119 | 105,428 | ||||||||||
|
| |||||||||||
Colombia – 0.1% | ||||||||||||
Ecopetrol SA | 52 | 46,020 | ||||||||||
|
| |||||||||||
Total Governments – Sovereign Agencies | 151,448 | |||||||||||
|
| |||||||||||
| Shares | ||||||||||||
WARRANTS – 0.1% | ||||||||||||
Energy – 0.1% | ||||||||||||
Oil, Gas & Consumable Fuels – 0.1% | ||||||||||||
Midstates Petroleum Co., Inc., | 2,950 | 16,225 | ||||||||||
SandRidge Energy, Inc.-A-CW22, | 6,778 | 32,873 | ||||||||||
SandRidge Energy, Inc.-B-CW22, | 2,849 | 12,963 | ||||||||||
|
| |||||||||||
| 62,061 | ||||||||||||
|
| |||||||||||
Financials – 0.0% | ||||||||||||
Diversified Financial Services – 0.0% | ||||||||||||
iPayment Holdings, Inc., | 73,570 | 38,992 | ||||||||||
|
| |||||||||||
Consumer Discretionary – 0.0% | ||||||||||||
Automobiles – 0.0% | ||||||||||||
Peugeot SA, | 8,520 | 23,532 | ||||||||||
|
| |||||||||||
Materials – 0.0% | ||||||||||||
Communications Equipment – 0.0% | ||||||||||||
FairPoint Communications, Inc., | 3,340 | 33 | ||||||||||
|
| |||||||||||
Total Warrants | 124,618 | |||||||||||
|
| |||||||||||
| AB HIGH YIELD PORTFOLIO • | 49 |
Portfolio of Investments
| Company | Shares | U.S. $ Value | ||||||||||
| ||||||||||||
INVESTMENT COMPANIES – 0.1% | ||||||||||||
Funds and Investment Trusts – 0.1% | ||||||||||||
iShares Russell 2000 ETF | 834 | $ | 98,829 | |||||||||
|
| |||||||||||
| Notional Amount (000) | ||||||||||||
OPTIONS PURCHASED – PUTS – 0.0% | ||||||||||||
Swaptions – 0.0% | ||||||||||||
CDX-NAHY Series 27, 5 Year Index RTP, Citibank, NA (Buy Protection) | 7,050 | 21,550 | ||||||||||
|
| |||||||||||
| Contracts | ||||||||||||
Options on Funds and Investment Trusts – 0.0% | ||||||||||||
SPDR S&P 500 ETF Trust | 101 | 15,604 | ||||||||||
|
| |||||||||||
Total Options Purchased – Puts | 37,154 | |||||||||||
|
| |||||||||||
| Shares | ||||||||||||
SHORT-TERM INVESTMENTS – 6.6% | ||||||||||||
Investment Companies – 6.2% | ||||||||||||
AB Fixed Income Shares, Inc. – Government Money Market Portfolio – Class AB, | 5,337,994 | 5,337,994 | ||||||||||
|
| |||||||||||
| Principal Amount (000) | ||||||||||||
U.S. Treasury Bills – 0.4% | ||||||||||||
U.S. Treasury Bill | U.S.$ | 350 | 349,866 | |||||||||
|
| |||||||||||
Total Short-Term Investments | 5,687,860 | |||||||||||
|
| |||||||||||
Total Investments – 99.5% | 86,045,333 | |||||||||||
Other assets less liabilities – 0.5% | 394,810 | |||||||||||
|
| |||||||||||
Net Assets – 100.0% | $ | 86,440,143 | ||||||||||
|
| |||||||||||
| 50 | • AB HIGH YIELD PORTFOLIO |
Portfolio of Investments
| FUTURES (see Note D) |
| Type | Number of Contracts | Expiration Month | Original Value | Value at October 31, 2016 | Unrealized Appreciation/ (Depreciation) | |||||||||||||||
Purchased Contracts | ||||||||||||||||||||
Euro STOXX 50 Index Futures | 13 | December 2016 | $ | 428,493 | $ | 435,686 | $ | 7,193 | ||||||||||||
U.S. T-Note 10 Yr (CBT) Futures | 31 | December 2016 | 4,043,119 | 4,018,375 | (24,744 | ) | ||||||||||||||
Sold Contracts | ||||||||||||||||||||
Russell 2000 E Mini Futures | 3 | December 2016 | 376,764 | 356,790 | 19,974 | |||||||||||||||
S&P 500 E Mini Futures | 6 | December 2016 | 643,195 | 636,030 | 7,165 | |||||||||||||||
|
| |||||||||||||||||||
| $ | 9,588 | |||||||||||||||||||
|
| |||||||||||||||||||
FORWARD CURRENCY EXCHANGE CONTRACTS (see Note D)
| Counterparty | Contracts to Deliver (000) | In Exchange For (000) | Settlement Date | Unrealized Appreciation/ (Depreciation) | ||||||||||||||||||||
Citibank, NA | GBP | 925 | USD | 1,201 | 11/16/16 | $ | 68,380 | |||||||||||||||||
Citibank, NA | KRW | 502,334 | USD | 451 | 12/15/16 | 12,236 | ||||||||||||||||||
Deutsche Bank AG | CNY | 2,709 | USD | 402 | 12/15/16 | 3,977 | ||||||||||||||||||
Goldman Sachs Bank USA | BRL | 1,070 | USD | 336 | 11/03/16 | 1,148 | ||||||||||||||||||
Goldman Sachs Bank USA | USD | 328 | BRL | 1,070 | 11/03/16 | 7,467 | ||||||||||||||||||
JPMorgan Chase Bank | TWD | 14,162 | USD | 452 | 12/08/16 | 3,618 | ||||||||||||||||||
Morgan Stanley Capital Services, Inc. | BRL | 1,070 | USD | 341 | 11/03/16 | 5,788 | ||||||||||||||||||
Morgan Stanley Capital Services, Inc. | USD | 336 | BRL | 1,070 | 11/03/16 | (1,148 | ) | |||||||||||||||||
Morgan Stanley Capital Services, Inc. | USD | 256 | PEN | 862 | 11/29/16 | (1,001 | ) | |||||||||||||||||
Morgan Stanley Capital Services, Inc. | USD | 338 | BRL | 1,070 | 12/02/16 | (5,691 | ) | |||||||||||||||||
State Street Bank & Trust Co. | CAD | 571 | USD | 445 | 11/10/16 | 19,250 | ||||||||||||||||||
State Street Bank & Trust Co. | EUR | 1,887 | USD | 2,122 | 11/15/16 | 49,364 | ||||||||||||||||||
State Street Bank & Trust Co. | EUR | 111 | USD | 121 | 11/15/16 | (507 | ) | |||||||||||||||||
State Street Bank & Trust Co. | GBP | 32 | USD | 39 | 11/16/16 | 44 | ||||||||||||||||||
State Street Bank & Trust Co. | USD | 37 | GBP | 31 | 11/16/16 | 38 | ||||||||||||||||||
State Street Bank & Trust Co. | MXN | 3,516 | USD | 188 | 11/22/16 | 2,107 | ||||||||||||||||||
State Street Bank & Trust Co. | USD | 185 | MXN | 3,633 | 11/22/16 | 6,745 | ||||||||||||||||||
State Street Bank & Trust Co. | USD | 236 | SEK | 1,981 | 12/07/16 | (15,937 | ) | |||||||||||||||||
State Street Bank & Trust Co. | JPY | 45,814 | USD | 444 | 12/09/16 | 6,918 | ||||||||||||||||||
State Street Bank & Trust Co. | SGD | 584 | USD | 429 | 12/14/16 | 9,037 | ||||||||||||||||||
|
| |||||||||||||||||||||||
| $ | 171,833 | |||||||||||||||||||||||
|
| |||||||||||||||||||||||
PUT OPTIONS WRITTEN (see Note D)
| Description | Contracts | Exercise Price | Expiration Month | Premiums Received | U.S. $ Value | |||||||||||||||
SPDR S&P 500 ETF Trust(q) | 101 | $ | 197.00 | November 2016 | $ | 3,026 | $ | (4,242 | ) | |||||||||||
| AB HIGH YIELD PORTFOLIO • | 51 |
Portfolio of Investments
CENTRALLY CLEARED CREDIT DEFAULT SWAPS (see Note D)
| Clearing Broker/(Exchange) & Referenced Obligation | Fixed Rate (Pay) Receive | Implied Credit Spread at October 31, 2016 | Notional Amount (000) | Market Value | Unrealized Appreciation/ (Depreciation) | |||||||||||||||||||
Buy Contracts | ||||||||||||||||||||||||
Citigroup Global Markets, Inc./(INTRCONX) | ||||||||||||||||||||||||
CDX-NAHY Series 26, | (5.00 | )% | 3.93 | % | $ | 494 | $ | (24,164 | ) | $ | (12,777 | ) | ||||||||||||
iTraxx-XOVER Series 25, | (5.00 | ) | 3.15 | EUR | 14 | (1,274 | ) | (358 | ) | |||||||||||||||
Morgan Stanley & Co., LLC/(INTRCONX) | ||||||||||||||||||||||||
CDX-NAHY Series 26, | (5.00 | ) | 3.93 | $ | 1,091 | (53,366 | ) | (4,685 | ) | |||||||||||||||
CDX-NAHY Series 26, | (5.00 | ) | 3.93 | 1,119 | (54,736 | ) | (5,475 | ) | ||||||||||||||||
CDX-NAHY Series 27, | (5.00 | ) | 4.21 | 4,050 | (162,417 | ) | (28,761 | ) | ||||||||||||||||
CDX-NAHY Series 27, | (5.00 | ) | 4.21 | 890 | (35,692 | ) | 1,511 | |||||||||||||||||
CDX-NAHY Series 27, | (5.00 | ) | 4.21 | 2,210 | (88,628 | ) | 9,967 | |||||||||||||||||
CDX-NAHY Series 27, | (5.00 | ) | 4.21 | 440 | (17,645 | ) | 2,007 | |||||||||||||||||
CDX-NAHY Series 27, | (5.00 | ) | 4.21 | 3,420 | (137,152 | ) | 12,139 | |||||||||||||||||
CDX-NAIG Series 20, | (1.00 | ) | 0.27 | 227 | (2,979 | ) | (1,946 | ) | ||||||||||||||||
CDX-NAIG Series 23, | (1.00 | ) | 0.57 | 3,279 | (46,833 | ) | (24,615 | ) | ||||||||||||||||
iTraxx-XOVER Series 21, | (5.00 | ) | 1.21 | EUR | – 0 | –** | (14 | ) | (42 | ) | ||||||||||||||
iTraxx-XOVER Series 25, | (5.00 | ) | 3.15 | 46 | (4,187 | ) | (1,201 | ) | ||||||||||||||||
Sale Contracts | ||||||||||||||||||||||||
Citigroup Global Markets, Inc./(INTRCONX) | ||||||||||||||||||||||||
CDX-NAHY Series 23, | 5.00 | 2.69 | $ | 485 | 35,772 | 8,947 | ||||||||||||||||||
CDX-NAHY Series 24, | 5.00 | 3.03 | 481 | 34,365 | 13,143 | |||||||||||||||||||
Morgan Stanley & Co., LLC/(INTRCONX) | ||||||||||||||||||||||||
CDX-NAHY Series 21, | 5.00 | 2.06 | 5,309 | 353,580 | 20,744 | |||||||||||||||||||
CDX-NAHY Series 23, | 5.00 | 2.69 | 1,814 | 133,788 | 36,896 | |||||||||||||||||||
CDX-NAHY Series 26, | 5.00 | 3.93 | 2,724 | 133,244 | 23,493 | |||||||||||||||||||
|
|
|
| |||||||||||||||||||||
| $ | 61,662 | $ | 48,987 | |||||||||||||||||||||
|
|
|
| |||||||||||||||||||||
| * | Termination date |
| 52 | • AB HIGH YIELD PORTFOLIO |
Portfolio of Investments
CENTRALLY CLEARED INTEREST RATE SWAPS (see Note D)
| Rate Type | ||||||||||||||||||||
Clearing Broker /(Exchange) | Notional Amount (000) | Termination Date | Payments by the Fund | Payments by the Fund | Unrealized Appreciation/ (Depreciation) | |||||||||||||||
Citigroup Global Markets, Inc./(CME Group) | $ | 300 | 1/15/26 | 1.978% | 3 Month LIBOR | $ | (9,473 | ) | ||||||||||||
Citigroup Global Markets, Inc./(CME Group) | 170 | 2/16/26 | 1.625% | 3 Month LIBOR | 609 | |||||||||||||||
Citigroup Global Markets, Inc./(CME Group) | 150 | 3/31/26 | 1.693% | 3 Month LIBOR | (155 | ) | ||||||||||||||
Citigroup Global Markets, Inc./(CME Group) | 100 | 5/03/26 | 1.770% | 3 Month LIBOR | (1,368 | ) | ||||||||||||||
Morgan Stanley & Co., LLC/(CME Group) | 2,835 | 9/02/25 | 2.248% | 3 Month LIBOR | (147,481 | ) | ||||||||||||||
Morgan Stanley & Co., LLC/(CME Group) | 661 | 1/15/26 | 1.978% | 3 Month LIBOR | (20,945 | ) | ||||||||||||||
Morgan Stanley & Co., LLC/(CME Group) | 481 | 2/16/26 | 1.625% | 3 Month LIBOR | 1,723 | |||||||||||||||
Morgan Stanley & Co., LLC/(CME Group) | 800 | 6/01/26 | 1.714% | 3 Month LIBOR | (5,524 | ) | ||||||||||||||
|
| |||||||||||||||||||
| $ | (182,614 | ) | ||||||||||||||||||
|
| |||||||||||||||||||
CREDIT DEFAULT SWAPS (see Note D)
| Swap Counterparty & Referenced Obligation | Fixed Rate (Pay) Receive | Implied 2016 | Notional Amount (000) | Market Value | Upfront Premiums Paid (Received) | Unrealized Appreciation/ (Depreciation) | ||||||||||||||||||
Buy Contracts | ||||||||||||||||||||||||
Barclays Bank PLC | ||||||||||||||||||||||||
K. Hovnanian Enterprises, Inc., 8.625%, 1/15/17, 3/20/17* | (5.00 | )% | 4.26 | % | $ | 269 | $ | (2,011 | ) | $ | (2,121 | ) | $ | 110 | ||||||||||
Citibank, NA | ||||||||||||||||||||||||
Bombardier, Inc., 7.45%, 5/01/34, 3/20/17* | (5.00 | ) | 1.71 | 151 | (2,816 | ) | (1,996 | ) | (820 | ) | ||||||||||||||
Bombardier, Inc., 7.45%, 5/01/34, 3/20/17* | (5.00 | ) | 1.71 | 150 | (2,797 | ) | (2,047 | ) | (750 | ) | ||||||||||||||
United States Steel Corp., 6.65%, 6/01/37, 3/20/17* | (5.00 | ) | 0.58 | 278 | (6,131 | ) | (2,856 | ) | (3,275 | ) | ||||||||||||||
Deutsche Bank AG | ||||||||||||||||||||||||
iHeartCommunications, Inc., | (5.00 | ) | 33.39 | 14 | 5,412 | 656 | 4,756 | |||||||||||||||||
Goldman Sachs Bank USA |
| |||||||||||||||||||||||
Community Health Systems, Inc., | (5.00 | ) | 2.42 | 299 | (4,667 | ) | (3,673 | ) | (994 | ) | ||||||||||||||
| AB HIGH YIELD PORTFOLIO • | 53 |
Portfolio of Investments
| Swap Counterparty & Referenced Obligation | Fixed Rate (Pay) Receive | Implied 2016 | Notional Amount (000) | Market Value | Upfront Premiums Paid (Received) | Unrealized Appreciation/ (Depreciation) | ||||||||||||||||||
Dell, Inc., | (1.00 | ) % | 0.47 | % | $ | 271 | $ | (879 | ) | $ | 821 | $ | (1,700 | ) | ||||||||||
Nine West Holdings, Inc., | (5.00 | ) | 74.94 | 277 | 63,045 | (3,064 | ) | 66,109 | ||||||||||||||||
Goldman Sachs International |
| |||||||||||||||||||||||
British Telecommunications PLC, | (1.00 | ) | 0.49 | EUR | 170 | (3,602 | ) | (4,501 | ) | 899 | ||||||||||||||
British Telecommunications PLC, | (1.00 | ) | 0.49 | 880 | (18,648 | ) | (17,132 | ) | (1,516 | ) | ||||||||||||||
iHeartCommunications, Inc., | (5.00 | ) | 29.96 | $ | 103 | 2,872 | 4,910 | (2,038 | ) | |||||||||||||||
Morgan Stanley Capital Services LLC | ||||||||||||||||||||||||
Clear Channel Communications, Inc., | (5.00 | ) | 33.39 | 17 | 6,184 | 749 | 5,435 | |||||||||||||||||
Sale Contracts | ||||||||||||||||||||||||
Barclays Bank PLC | ||||||||||||||||||||||||
Altice Finco SA, | 5.00 | 2.98 | EUR | 40 | 3,753 | 1,730 | 2,023 | |||||||||||||||||
CCO Holdings, LLC, | 5.00 | 0.72 | $ | 153 | 17,741 | 9,075 | 8,666 | |||||||||||||||||
iHeartCommunications, Inc., | 5.00 | 38.40 | 63 | (41,531 | ) | (41,226 | ) | (305 | ) | |||||||||||||||
K. Hovnanian Enterprises, Inc., | 5.00 | 23.01 | 117 | (52,190 | ) | (25,885 | ) | (26,305 | ) | |||||||||||||||
K. Hovnanian Enterprises, Inc., | 5.00 | 23.01 | 47 | (20,965 | ) | (10,415 | ) | (10,550 | ) | |||||||||||||||
Unitymedia GmbH, | 5.00 | 1.59 | EUR | 70 | 11,095 | 11,125 | (30 | ) | ||||||||||||||||
| 54 | • AB HIGH YIELD PORTFOLIO |
Portfolio of Investments
| Swap Counterparty & Referenced Obligation | Fixed Rate (Pay) Receive | Implied 2016 | Notional Amount (000) | Market Value | Upfront Premiums Paid (Received) | Unrealized Appreciation/ (Depreciation) | ||||||||||||||||||
Citibank, NA | ||||||||||||||||||||||||
Advanced Micro Devices, Inc., | 5.00 | % | 2.56 | % | $ | 20 | $ | 1,817 | $ | (4,587 | ) | $ | 6,404 | |||||||||||
Advanced Micro Devices, Inc., | 5.00 | 2.56 | 71 | 6,450 | (13,452 | ) | 19,902 | |||||||||||||||||
United States Steel Corp., | 5.00 | 3.87 | 201 | 5,103 | 3,187 | 1,916 | ||||||||||||||||||
Credit Suisse International | ||||||||||||||||||||||||
Altice Finco SA, | 5.00 | 2.98 | EUR | 100 | 9,384 | 4,292 | 5,092 | |||||||||||||||||
CDX-CMBX.NA.BB | 5.00 | 8.47 | $ | 29 | (4,450 | ) | (3,792 | ) | (658 | ) | ||||||||||||||
CDX-CMBX.NA.BB | 5.00 | 8.47 | 69 | (10,586 | ) | (8,372 | ) | (2,214 | ) | |||||||||||||||
CDX-CMBX.NA.BB | 5.00 | 8.47 | 338 | (51,858 | ) | (43,044 | ) | (8,814 | ) | |||||||||||||||
SFR Group SA, | 5.00 | 2.69 | EUR | 80 | 8,541 | 6,735 | 1,806 | |||||||||||||||||
Goldman Sachs Bank USA | ||||||||||||||||||||||||
Community Health Systems, Inc., | 5.00 | 8.56 | $ | 201 | (14,596 | ) | 7,989 | (22,585 | ) | |||||||||||||||
iHeartCommunications, Inc., | 5.00 | 38.40 | 66 | (43,514 | ) | (53,130 | ) | 9,616 | ||||||||||||||||
K. Hovnanian Enterprises, Inc., 8.625%, 1/15/17, 9/20/20* | 5.00 | 23.01 | 42 | (18,735 | ) | (8,755 | ) | (9,980 | ) | |||||||||||||||
Nine West Holdings, Inc., 6.875%, 3/15/19, 3/20/19* | 5.00 | 84.21 | 201 | (155,067 | ) | 3,185 | �� | (158,252 | ) | |||||||||||||||
Goldman Sachs International | ||||||||||||||||||||||||
Avis Budget Car Rental LLC, 5.25%, 3/15/25, 12/20/21* | 5.00 | 4.29 | 15 | 572 | 607 | (35 | ) | |||||||||||||||||
| AB HIGH YIELD PORTFOLIO • | 55 |
Portfolio of Investments
| Swap Counterparty & Referenced Obligation | Fixed Rate (Pay) Receive | Implied 2016 | Notional Amount (000) | Market Value | Upfront Premiums Paid (Received) | Unrealized Appreciation/ (Depreciation) | ||||||||||||||||||
Avis Budget Car Rental LLC, 5.25%, 3/15/25, 12/20/21* | 5.00 | % | 4.29 | % | $ | 13 | $ | 496 | $ | 612 | $ | (116 | ) | |||||||||||
Avis Budget Car Rental LLC, 5.25%, 3/15/25, 12/20/21* | 5.00 | 4.29 | 22 | 839 | 1,035 | (196 | ) | |||||||||||||||||
Avis Budget Car Rental LLC, 5.25%, 3/15/25, 12/20/21* | 5.00 | 4.29 | 20 | 763 | 809 | (46 | ) | |||||||||||||||||
Avis Budget Car Rental LLC, 5.25%, 3/15/25, 12/20/21* | 5.00 | 4.29 | 30 | 1,145 | 1,548 | (403 | ) | |||||||||||||||||
CDX-CMBX.NA.BB Series , 5/11/63* | 5.00 | 8.47 | 60 | (9,206 | ) | (7,928 | ) | (1,278 | ) | |||||||||||||||
CDX-CMBX.NA.BB Series , 5/11/63* | 5.00 | 8.47 | 35 | (5,370 | ) | (4,755 | ) | (615 | ) | |||||||||||||||
CDX-CMBX.NA.BB Series , 5/11/63* | 5.00 | 8.47 | 35 | (5,370 | ) | (4,630 | ) | (740 | ) | |||||||||||||||
CDX-CMBX.NA.BB Series , 5/11/63* | 5.00 | 8.47 | 42 | (6,427 | ) | (5,273 | ) | (1,154 | ) | |||||||||||||||
CDX-CMBX.NA.BB Series , 5/11/63* | 5.00 | 8.47 | 226 | (34,674 | ) | (29,753 | ) | (4,921 | ) | |||||||||||||||
CDX-CMBX.NA.BB Series , 5/11/63* | 5.00 | 8.47 | 227 | (34,828 | ) | (30,741 | ) | (4,087 | ) | |||||||||||||||
CDX-CMBX.NA.BB Series , 5/11/63* | 5.00 | 8.47 | 227 | (34,829 | ) | (29,939 | ) | (4,890 | ) | |||||||||||||||
CDX-CMBX.NA.BB Series , 5/11/63* | 5.00 | 8.47 | 278 | (42,655 | ) | (34,908 | ) | (7,747 | ) | |||||||||||||||
iHeartCommunications, Inc., 6.875%, 6/15/18, 12/20/20* | 5.00 | 38.40 | 15 | (9,888 | ) | (11,346 | ) | 1,458 | ||||||||||||||||
iHeartCommunications, Inc., 6.875%, 6/15/18, 6/20/21* | 5.00 | 37.82 | 20 | (13,412 | ) | (13,241 | ) | (171 | ) | |||||||||||||||
iHeartCommunications, Inc., 6.875%, 6/15/18, 6/20/21* | 5.00 | 37.82 | 70 | (46,944 | ) | (44,719 | ) | (2,225 | ) | |||||||||||||||
| 56 | • AB HIGH YIELD PORTFOLIO |
Portfolio of Investments
| Swap Counterparty & Referenced Obligation | Fixed Rate (Pay) Receive | Implied 2016 | Notional Amount (000) | Market Value | Upfront Premiums Paid (Received) | Unrealized Appreciation/ (Depreciation) | ||||||||||||||||||
K Hovnanian Enterprises, Inc., 8.625%, 1/15/17, 9/20/20* | 5.00 | % | 23.01 | % | $ | 10 | $ | (4,460 | ) | $ | (2,527 | ) | $ | (1,933 | ) | |||||||||
Wind Acquisition Finance SA, 7.00%, 4/23/21, 9/20/20* | 5.00 | 2.21 | EUR | 30 | 3,603 | 3,258 | 345 | |||||||||||||||||
JPMorgan Chase Bank, NA | ||||||||||||||||||||||||
Virgin Media Finance PLC, 7.00%, 4/15/23, 9/20/19* | 5.00 | 1.49 | 60 | 6,905 | 7,058 | (153 | ) | |||||||||||||||||
Wind Acquisition Finance SA, 11.75%, 7/15/17, 9/20/19* | 5.00 | 1.66 | 20 | 2,185 | 1,691 | 494 | ||||||||||||||||||
Morgan Stanley & Co. International PLC | ||||||||||||||||||||||||
AK Steel Corp., 7.625%, 5/15/20, 9/20/19* | 5.00 | 4.57 | $ | 30 | 326 | 344 | (18 | ) | ||||||||||||||||
United States Steel Corp., 6.65%, 6/01/37, 9/20/19* | 5.00 | 4.92 | 20 | 31 | 1,070 | (1,039 | ) | |||||||||||||||||
Morgan Stanley Capital Services LLC | ||||||||||||||||||||||||
United States Steel Corp., 6.65%, 6/01/37, 9/20/19* | 5.00 | 4.92 | 38 | 58 | 1,166 | (1,108 | ) | |||||||||||||||||
United States Steel Corp., 6.65%, 6/01/37, 9/20/19* | 5.00 | 4.92 | 56 | 86 | 1,826 | (1,740 | ) | |||||||||||||||||
|
|
|
|
|
| |||||||||||||||||||
| $ | (544,700 | ) | $ | (394,330 | ) | $ | (150,370 | ) | ||||||||||||||||
|
|
|
|
|
| |||||||||||||||||||
| * | Termination date |
TOTAL RETURN SWAPS (see Note D)
| Counterparty & Referenced Obligation | # of Shares | Rate Paid/ Received | Notional Amount (000) | Maturity Date | Unrealized Appreciation/ (Depreciation) | |||||||||||||
Receive Total Return on Reference Obligation |
| |||||||||||||||||
Bank of America, NA |
| |||||||||||||||||
iBoxx $ Liquid | 71,000 | LIBOR | $ | 71 | 12/20/16 | $ | 596 | |||||||||||
iBoxx $ Liquid | 72,000 | LIBOR | 72 | 12/20/16 | 346 | |||||||||||||
Citibank, NA |
| |||||||||||||||||
iBoxx $ Liquid | 177,000 | LIBOR | 177 | 12/20/16 | 1,485 | |||||||||||||
| AB HIGH YIELD PORTFOLIO • | 57 |
Portfolio of Investments
| Counterparty & Referenced Obligation | # of Shares | Rate Paid/ Received | Notional Amount (000) | Maturity Date | Unrealized Appreciation/ (Depreciation) | |||||||||||||||
iBoxx $ Liquid | 113,000 | LIBOR | $ | 113 | 12/20/16 | $ | 832 | |||||||||||||
iBoxx $ Liquid | 65,000 | LIBOR | 65 | 12/20/16 | 479 | |||||||||||||||
iBoxx $ Liquid | 2,230,000 | LIBOR | 2,230 | 12/20/16 | (5,088 | ) | ||||||||||||||
Goldman Sachs International |
| |||||||||||||||||||
iBoxx $ Liquid | 177,000 | LIBOR | 177 | 12/20/16 | 1,667 | |||||||||||||||
iBoxx $ Liquid | 179,000 | LIBOR | 179 | 12/20/16 | 770 | |||||||||||||||
iBoxx $ Liquid | 179,000 | LIBOR | 179 | 12/20/16 | 43 | |||||||||||||||
JPMorgan Chase Bank, NA |
| |||||||||||||||||||
iBoxx $ Liquid | 177,000 | LIBOR | 177 | 12/20/16 | 1,850 | |||||||||||||||
iBoxx $ Liquid | 177,000 | LIBOR | 177 | 12/20/16 | 1,032 | |||||||||||||||
iBoxx $ Liquid | 89,000 | LIBOR | 89 | 12/20/16 | 747 | |||||||||||||||
iBoxx $ Liquid | 89,000 | LIBOR | 89 | 12/20/16 | 564 | |||||||||||||||
iBoxx $ Liquid | 89,000 | LIBOR | 89 | 12/20/16 | 401 | |||||||||||||||
iBoxx $ Liquid | 53,000 | LIBOR | 53 | 12/20/16 | 336 | |||||||||||||||
Morgan Stanley & Co. International PLC |
| |||||||||||||||||||
iBoxx $ Liquid | 89,000 | LIBOR | 89 | 12/20/16 | 510 | |||||||||||||||
Pay Total Return on Reference |
| |||||||||||||||||||
Goldman Sachs International | ||||||||||||||||||||
iBoxx $ Liquid | 1,129,000 | LIBOR | 1,129 | 12/20/16 | 941 | |||||||||||||||
|
| |||||||||||||||||||
| $ | 7,511 | |||||||||||||||||||
|
| |||||||||||||||||||
| ** | Notional amount less than $500. |
| (a) | Security is exempt from registration under Rule 144A of the Securities Act of 1933. These securities are considered restricted, but liquid and may be resold in transactions exempt from registration, normally to qualified institutional buyers. At October 31, 2016, the aggregate market value of these securities amounted to $29,824,611 or 34.5% of net assets. |
| (b) | Non-income producing security. |
| (c) | Illiquid security. |
| (d) | Fair valued by the Adviser. |
| (e) | Defaulted. |
| (f) | Security is exempt from registration under Rule 144A of the Securities Act of 1933. These securities, which represent 0.51% of net assets as of October 31, 2016, are considered illiquid and restricted. Additional information regarding such securities follows: |
| 144A/Restricted & Illiquid Securities | Acquisition Date | Cost | Market Value | Percentage of Net Assets | ||||||||||||
Creditcorp | 6/28/13 – 7/21/14 | $ | 113,899 | $ | 54,150 | 0.06 | % | |||||||||
Edcon Ltd. | 3/13/15 | 63,880 | 18,673 | 0.02 | % | |||||||||||
iPayment, Inc. | 12/29/14 – 2/27/15 | 207,096 | 208,614 | 0.24 | % | |||||||||||
Magnetation LLC/Mag Finance Corp. | 7/17/14 – 2/19/15 | 143,266 | 247 | 0.00 | % | |||||||||||
| 58 | • AB HIGH YIELD PORTFOLIO |
Portfolio of Investments
| 144A/Restricted & Illiquid Securities | Acquisition Date | Cost | Market Value | Percentage of Net Assets | ||||||||||||
Modular Space Corp. | 8/10/16 | $ | 81,510 | $ | 46,870 | 0.05 | % | |||||||||
Speedy Cash Intermediate Holdings Corp. | 1/06/16 | 3,829 | 4,755 | 0.01 | % | |||||||||||
Speedy Group Holdings Corp. | 7/17/14 | 167,000 | 82,665 | 0.10 | % | |||||||||||
Vantage Drilling International | 6/17/16 | 2,908 | 2,708 | 0.00 | % | |||||||||||
Virgolino de Oliveira Finance SA | 2/13/13 | 335,079 | 23,265 | 0.03 | % | |||||||||||
| (g) | Restricted and illiquid security. |
| Restricted & Illiquid Securities | Acquisition Date | Cost | Market Value | Percentage of Net Assets | ||||||||||||
CHC Helicopter SA | 2/25/15 – 3/04/16 | $ | 183,114 | $ | 212,760 | 0.25 | % | |||||||||
CHC Helicopter SA | 2/19/16 – 2/23/16 | 6,094 | 26,237 | 0.03 | % | |||||||||||
Exide Corp. | 4/30/15 | 3,329 | 2,633 | 0.00 | % | |||||||||||
Exide Technologies | 4/30/15 – 6/01/15 | 97,823 | 83,034 | 0.10 | % | |||||||||||
Momentive Performance Materials, Inc. | 7/16/14 – 10/24/14 | – 0 | – | – 0 | – | 0.00 | % | |||||||||
| (h) | Pay-In-Kind Payments (PIK). The issuer may pay cash interest and/or interest in additional debt securities. Rates shown are the rates in effect at October 31, 2016. |
| (i) | Convertible security. |
| (j) | Variable rate coupon, rate shown as of October 31, 2016. |
| (k) | Coupon rate adjusts periodically based upon a predetermined schedule. Stated interest rate in effect at October 31, 2016. |
| (l) | Securities are perpetual and, thus, do not have a predetermined maturity date. The date shown, if applicable, reflects the next call date. |
| (m) | Floating Rate Security. Stated interest/floor rate was in effect at October 31, 2016. |
| (n) | Defaulted matured security. |
| (o) | The stated coupon rate represents the greater of the LIBOR or the LIBOR floor rate plus a spread at October 31, 2016. |
| (p) | This position or a portion of this position represents an unsettled loan purchase. The coupon rate will be determined at the time of settlement and will be based upon the London-Interbank Offered Rate (“LIBOR”) plus a premium which was determined at the time of purchase. |
| (q) | One contract relates to 100 shares. |
| (r) | To obtain a copy of the fund’s financial statements, please go to the Securities and Exchange Commission’s website at www.sec.gov, or call AB at (800) 227-4618. |
| (s) | Investment in affiliated money market mutual fund. The rate shown represents the 7-day yield as of period end. |
Currency Abbreviations:
BRL – Brazilian Real
CAD – Canadian Dollar
CNY – Chinese Yuan Renminbi
EUR – Euro
GBP – Great British Pound
JPY – Japanese Yen
KRW – South Korean Won
MXN – Mexican Peso
PEN – Peruvian Sol
SEK – Swedish Krona
SGD – Singapore Dollar
TWD – New Taiwan Dollar
USD – United States Dollar
| AB HIGH YIELD PORTFOLIO • | 59 |
Portfolio of Investments
Glossary:
ABS – Asset-Backed Securities
CBT – Chicago Board of Trade
CDX-CMBX.NA – North American Commercial Mortgage-Backed Index
CDX-NAHY – North American High Yield Credit Default Swap Index
CDX-NAIG – North American Investment Grade Credit Default Swap Index
CMBS – Commercial Mortgage-Backed Securities
CME – Chicago Mercantile Exchange
ETF – Exchange Traded Fund
EURIBOR – Euro Interbank Offered Rate
INTRCONX – Inter-Continental Exchange
LIBOR – London Interbank Offered Rates
REIT – Real Estate Investment Trust
RTP – Right to Pay
SPDR – Standard & Poor’s Depository Receipt
See notes to financial statements.
| 60 | • AB HIGH YIELD PORTFOLIO |
Portfolio of Investments
STATEMENT OF ASSETS & LIABILITIES
October 31, 2016
| Assets | ||||
Investments in securities, at value | ||||
Unaffiliated issuers (cost $81,731,419) | $ | 80,707,339 | ||
Affiliated issuers (cost $5,337,994) | 5,337,994 | |||
Cash | 34,491 | |||
Cash collateral due from broker | 742,163 | |||
Unaffiliated interest and dividends receivable | 1,189,760 | |||
Receivable for investment securities sold | 376,930 | |||
Receivable for capital stock sold | 250,113 | |||
Unrealized appreciation on forward currency exchange contracts | 196,117 | |||
Unrealized appreciation on credit default swaps | 135,031 | |||
Receivable due from Adviser | 112,825 | |||
Upfront premium paid on credit default swaps | 75,478 | |||
Due from custodian | 28,861 | |||
Unrealized appreciation on total return swaps | 12,599 | |||
Receivable for variation margin on exchange-traded derivatives | 13,089 | |||
Affiliated dividends receivable | 1,629 | |||
Receivable for newly entered total return swaps | 1,102 | |||
|
| |||
Total assets | 89,215,521 | |||
|
| |||
| Liabilities | ||||
Options written, at value (premiums received $3,026) | 4,242 | |||
Payable for investment securities purchased | 1,399,428 | |||
Upfront premium received on credit default swaps | 469,808 | |||
Payable for capital stock redeemed | 295,096 | |||
Unrealized depreciation on credit default swaps | 285,401 | |||
Dividends payable | 65,798 | |||
Unrealized depreciation on forward currency exchange contracts | 24,284 | |||
Unrealized depreciation on total return swaps | 5,088 | |||
Transfer Agent fee payable | 4,525 | |||
Payable for variation margin on exchange-traded derivatives | 1,133 | |||
Distribution fee payable | 507 | |||
Accrued expenses and other liabilities | 220,068 | |||
|
| |||
Total liabilities | 2,775,378 | |||
|
| |||
Net Assets | $ | 86,440,143 | ||
|
| |||
| Composition of Net Assets | ||||
Capital stock, at par | $ | 9,144 | ||
Additional paid-in capital | 110,607,631 | |||
Distributions in excess of net investment income | (351,254 | ) | ||
Accumulated net realized loss on investment | (22,702,268 | ) | ||
Net unrealized depreciation on investments | (1,123,110 | ) | ||
|
| |||
| $ | 86,440,143 | |||
|
|
See notes to financial statements.
| AB HIGH YIELD PORTFOLIO • | 61 |
Statement of Assets & Liabilities
Net Asset Value Per Share—30 billion shares of capital stock authorized, $.001 par value
| Class | Net Assets | Shares Outstanding | Net Asset Value | |||||||||
| ||||||||||||
| A | $ | 1,185,607 | 125,372 | $ | 9.46 | * | ||||||
| ||||||||||||
| C | $ | 367,623 | 38,871 | $ | 9.46 | |||||||
| ||||||||||||
| Advisor | $ | 2,732,866 | 288,892 | $ | 9.46 | |||||||
| ||||||||||||
| R | $ | 31,056 | 3,283 | $ | 9.46 | |||||||
| ||||||||||||
| K | $ | 9,461 | 1,000 | $ | 9.46 | |||||||
| ||||||||||||
| I | $ | 16,936,261 | 1,790,331 | $ | 9.46 | |||||||
| ||||||||||||
| Z | $ | 65,177,269 | 6,895,852 | $ | 9.45 | |||||||
| ||||||||||||
| * | The maximum offering price per share for Class A shares was $9.87 which reflects a sales charge of 4.25%. |
See notes to financial statements.
| 62 | • AB HIGH YIELD PORTFOLIO |
Statement of Assets & Liabilities
STATEMENT OF OPERATIONS
| September 1, 2016 to October 31, 2016(a) | Year Ended August 31, 2016 | |||||||
| Investment Income | ||||||||
Interest | $ | 763,946 | $ | 13,800,626 | ||||
Dividends | ||||||||
Unaffiliated issuers | 43,145 | 387,737 | ||||||
Affiliated issuers | 3,523 | 45,587 | ||||||
Other income | 29,449 | (b) | 24,398 | |||||
|
|
|
| |||||
Total income | 840,063 | 14,258,348 | ||||||
|
|
|
| |||||
| Expenses | ||||||||
Advisory fee (see Note B) | 87,716 | 51,996 | ||||||
Distribution fee—Class A | 449 | 243 | ||||||
Distribution fee—Class C | 392 | 184 | ||||||
Distribution fee—Class R | 26 | 15 | ||||||
Distribution fee—Class K | 4 | 2 | ||||||
Transfer agency—Class A | 1,173 | 385 | ||||||
Transfer agency—Class C | 290 | 76 | ||||||
Transfer agency—Advisor Class | 2,559 | 639 | ||||||
Transfer agency—Class R | 13 | 5 | ||||||
Transfer agency—Class K | 1 | – 0 | – | |||||
Transfer agency—Class I | 566 | 331 | ||||||
Transfer agency—Class Z | 2,236 | 1,344 | ||||||
Audit and tax | 127,932 | 136,894 | ||||||
Custodian | 38,120 | 209,627 | ||||||
Legal | 53,526 | 42,488 | ||||||
Administrative | 13,497 | 57,020 | ||||||
Directors’ fees | 3,676 | 23,117 | ||||||
Printing | 13,369 | 11,515 | ||||||
Registration fees | 3,258 | 20,116 | ||||||
Miscellaneous | 5,584 | 107,872 | ||||||
|
|
|
| |||||
Total expenses before interest expense | 354,387 | 663,869 | ||||||
Interest expense | – 0 | – | 3,316 | |||||
|
|
|
| |||||
Total expenses | 354,387 | 667,185 | ||||||
Less: expenses waived and reimbursed by the Adviser (see Note B) | (239,242 | ) | (113,218 | ) | ||||
|
|
|
| |||||
Net expenses | 115,145 | 553,967 | ||||||
|
|
|
| |||||
Net investment income | 724,918 | 13,704,381 | ||||||
|
|
|
| |||||
See notes to financial statements.
| AB HIGH YIELD PORTFOLIO • | 63 |
Statement of Operations
| September 1, 2016 to October 31, 2016(a) | Year Ended August 31, 2016 | |||||||
| Realized and Unrealized Gain (Loss) on Investment and Foreign Currency Transactions | ||||||||
Net realized gain (loss) on: | ||||||||
Investment transactions | 174,470 | (21,404,879 | )(c) | |||||
Futures | (8,974 | ) | 259,983 | |||||
Options written | 25,156 | 486,183 | ||||||
Swaptions written | 5,586 | 176,138 | ||||||
Swaps | (59,060 | ) | (1,535,086 | ) | ||||
Foreign currency transactions | (94,830 | ) | (1,883,460 | ) | ||||
Net change in unrealized appreciation/depreciation of: | ||||||||
Investments | (390,832 | ) | 15,102,800 | |||||
Futures | 2,605 | 83,256 | ||||||
Options written | (9,479 | ) | (169,015 | ) | ||||
Swaptions written | 679 | (8,218 | ) | |||||
Swaps | 251,007 | (475,143 | ) | |||||
Foreign currency denominated assets and liabilities | 211,268 | (44,920 | ) | |||||
|
|
|
| |||||
Net gain (loss) on investment and foreign currency transactions | 107,596 | (9,412,361 | ) | |||||
|
|
|
| |||||
Net Increase in Net Assets from Operations | $ | 832,514 | $ | 4,292,020 | ||||
|
|
|
| |||||
| (a) | The Portfolio changed its fiscal year end from August 31 to October 31. |
| (b) | Other income includes a non-recurring refund for overbilling of prior years’ custody out-of-pocket fees. |
| (c) | On May 16, 2016, the Portfolio had a redemption-in-kind with total proceeds in the amount of $172,896,381. The realized loss of $(14,670,661), resulting from redemption-in-kind, will not be recognized for tax purposes. |
See notes to financial statements.
| 64 | • AB HIGH YIELD PORTFOLIO |
Statement of Operations
STATEMENT OF CHANGES IN NET ASSETS
| September 1, 2016 to October 31, 2016(a) | Year Ended August 31, 2016 | Year Ended August 31, 2015 | ||||||||||
| Increase (Decrease) in Net Assets from Operations | ||||||||||||
Net investment income | $ | 724,918 | $ | 13,704,381 | $ | 22,450,149 | ||||||
Net realized gain (loss) on investment and foreign currency transactions | 42,348 | (23,901,121 | ) | 3,015,460 | ||||||||
Net change in unrealized appreciation/depreciation of investments and foreign currency denominated assets and liabilities | 65,248 | 14,488,760 | (33,458,218 | ) | ||||||||
|
|
|
|
|
| |||||||
Net increase (decrease) in net assets from operations | 832,514 | 4,292,020 | (7,992,609 | ) | ||||||||
| Dividends to Shareholders from | ||||||||||||
Net investment income | ||||||||||||
Class A | (7,490 | ) | (4,614 | ) | – 0 | – | ||||||
Class C | (1,328 | ) | (736 | ) | – 0 | – | ||||||
Advisor Class | (16,712 | ) | (8,493 | ) | – 0 | – | ||||||
Class R | (198 | ) | (133 | ) | – 0 | – | ||||||
Class K | (65 | ) | (45 | ) | – 0 | – | ||||||
Class I | (123,447 | ) | (82,698 | ) | – 0 | – | ||||||
Class Z | (487,477 | ) | (17,643,339 | ) | (24,694,123 | ) | ||||||
| Capital Stock Transactions | ||||||||||||
Net decrease | (1,725,148 | ) | (221,421,717 | ) | (9,408,030 | ) | ||||||
|
|
|
|
|
| |||||||
Total decrease | (1,529,351 | ) | (234,869,755 | ) | (42,094,762 | ) | ||||||
| Net Assets | ||||||||||||
Beginning of period | 87,969,494 | 322,839,249 | 364,934,011 | |||||||||
|
|
|
|
|
| |||||||
End of period (including distributions in excess of net investment income of ($351,254) and undistributed net investment income of $942,963, respectively) | $ | 86,440,143 | $ | 87,969,494 | $ | 322,839,249 | ||||||
|
|
|
|
|
| |||||||
| (a) | The Portfolio changed its fiscal year end from August 31 to October 31. |
See notes to financial statements.
| AB HIGH YIELD PORTFOLIO • | 65 | �� |
Statement of Changes in Net Assets
NOTES TO FINANCIAL STATEMENTS
October 31, 2016
NOTE A
Significant Accounting Policies
AB Bond Fund, Inc. (the “Company”) is registered under the Investment Company Act of 1940 as an open-end management investment company. The Company, which is a Maryland corporation, operates as a series company comprised of ten portfolios currently in operation. Each Portfolio is considered to be a separate entity for financial reporting and tax purposes. This report relates only to the AB High Yield Portfolio (the “Portfolio”), a non-diversified portfolio. The Portfolio acquired the assets and liabilities of AB High-Yield Portfolio, a series of AB Pooling Portfolios (the “Accounting Survivor”), in a reorganization that was effective at the close of business July 26, 2016 (the “Reorganization”). The Reorganization was approved by the Accounting Survivor’s Board of Trustees and shareholders pursuant to an Agreement and Plan of Acquisition and Dissolution (the “Reorganization Agreement”) (see Note I for additional information). Upon completion of the Reorganization, the Portfolio assumed the performance, financial and other historical accounting information of the Accounting Survivor, including the adoption of the Accounting Survivor’s fiscal year end of August 31. As such, the financial statements and the Class Z shares financial highlights reflect the financial information of the Accounting Survivor through July 26, 2016. The fiscal year end of the Portfolio was subsequently changed to October 31. The Portfolio has authorized the issuance of Class A, Class B, Class C, Advisor Class, Class R, Class K, Class I, Class Z, Class 1 and Class 2 shares. Class B, Class 1 and Class 2 shares are not currently offered. As of October 31, 2016, AllianceBernstein L.P. (the “Adviser”), was the sole shareholder of Class K and Class I shares. Class A shares are sold with a front-end sales charge of up to 4.25% for purchases not exceeding $1,000,000. With respect to purchases of $1,000,000 or more, Class A shares redeemed within one year of purchase may be subject to a contingent deferred sales charge of 1%. Class C shares are subject to a contingent deferred sales charge of 1% on redemptions made within the first year after purchase. Class R and Class K shares are sold without an initial or contingent deferred sales charge. Advisor Class, Class I and Class Z shares are sold without an initial or contingent deferred sales charge and are not subject to ongoing distribution expenses. All seven classes of shares have identical voting, dividend, liquidation and other rights, except that the classes bear different distribution and transfer agency expenses. Each class has exclusive voting rights with respect to its distribution plan. The financial statements have been prepared in conformity with U.S. generally accepted accounting principles (“U.S. GAAP”) which require management to make certain estimates and assumptions that affect the reported amounts of assets and liabilities in the financial statements and amounts of income and expenses during the reporting period. Actual results could differ from those estimates. The Portfolio is an investment company under U.S. GAAP and follows the accounting and reporting guidance applicable to investment companies. The following is a summary of significant accounting policies followed by the Portfolio.
| 66 | • AB HIGH YIELD PORTFOLIO |
Notes to Financial Statements
1. Security Valuation
Portfolio securities are valued at their current market value determined on the basis of market quotations or, if market quotations are not readily available or are deemed unreliable, at “fair value” as determined in accordance with procedures established by and under the general supervision of the Company’s Board of Directors (the “Board”).
In general, the market values of securities which are readily available and deemed reliable are determined as follows: securities listed on a national securities exchange (other than securities listed on the NASDAQ Stock Market, Inc. (“NASDAQ”)) or on a foreign securities exchange are valued at the last sale price at the close of the exchange or foreign securities exchange. If there has been no sale on such day, the securities are valued at the last traded price from the previous day. Securities listed on more than one exchange are valued by reference to the principal exchange on which the securities are traded; securities listed only on NASDAQ are valued in accordance with the NASDAQ Official Closing Price; listed or over the counter (“OTC”) market put or call options are valued at the mid level between the current bid and ask prices. If either a current bid or current ask price is unavailable, the Adviser will have discretion to determine the best valuation (e.g. last trade price in the case of listed options); open futures are valued using the closing settlement price or, in the absence of such a price, the most recent quoted bid price. If there are no quotations available for the day of valuation, the last available closing settlement price is used; U.S. Government securities and any other debt instruments having 60 days or less remaining until maturity are generally valued at market by an independent pricing vendor, if a market price is available. If a market price is not available, the securities are valued at amortized cost. This methodology is commonly used for short term securities that have an original maturity of 60 days or less, as well as short term securities that had an original term to maturity that exceeded 60 days. In instances when amortized cost is utilized, the Valuation Committee (the “Committee”) must reasonably conclude that the utilization of amortized cost is approximately the same as the fair value of the security. Such factors the Committee will consider include, but are not limited to, an impairment of the creditworthiness of the issuer or material changes in interest rates. Fixed-income securities, including mortgage-backed and asset-backed securities, may be valued on the basis of prices provided by a pricing service or at a price obtained from one or more of the major broker-dealers. In cases where broker-dealer quotes are obtained, the Adviser may establish procedures whereby changes in market yields or spreads are used to adjust, on a daily basis, a recently obtained quoted price on a security. Swaps and other derivatives are valued daily, primarily using independent pricing services, independent pricing models using market inputs, as well as third party broker-dealers or counterparties. Open end mutual funds are valued at the closing net asset value per share, while exchange traded funds are valued at the closing market price per share.
| AB HIGH YIELD PORTFOLIO • | 67 |
Notes to Financial Statements
Securities for which market quotations are not readily available (including restricted securities) or are deemed unreliable are valued at fair value as deemed appropriate by the Adviser. Factors considered in making this determination may include, but are not limited to, information obtained by contacting the issuer, analysts, analysis of the issuer’s financial statements or other available documents. In addition, the Portfolio may use fair value pricing for securities primarily traded in non-U.S. markets because most foreign markets close well before the Portfolio values its securities at 4:00 p.m., Eastern Time. The earlier close of these foreign markets gives rise to the possibility that significant events, including broad market moves, may have occurred in the interim and may materially affect the value of those securities. To account for this, the Portfolio may frequently value many of its foreign equity securities using fair value prices based on third party vendor modeling tools to the extent available.
2. Fair Value Measurements
In accordance with U.S. GAAP regarding fair value measurements, fair value is defined as the price that the Portfolio would receive to sell an asset or pay to transfer a liability in an orderly transaction between market participants at the measurement date. U.S. GAAP establishes a framework for measuring fair value, and a three-level hierarchy for fair value measurements based upon the transparency of inputs to the valuation of an asset or liability (including those valued based on their market values as described in Note A.1 above). Inputs may be observable or unobservable and refer broadly to the assumptions that market participants would use in pricing the asset or liability. Observable inputs reflect the assumptions market participants would use in pricing the asset or liability based on market data obtained from sources independent of the Portfolio. Unobservable inputs reflect the Portfolio’s own assumptions about the assumptions that market participants would use in pricing the asset or liability based on the best information available in the circumstances. Each investment is assigned a level based upon the observability of the inputs which are significant to the overall valuation. The three-tier hierarchy of inputs is summarized below.
| • | Level 1—quoted prices in active markets for identical investments |
| • | Level 2—other significant observable inputs (including quoted prices for similar investments, interest rates, prepayment speeds, credit risk, etc.) |
| • | Level 3—significant unobservable inputs (including the Portfolio’s own assumptions in determining the fair value of investments) |
The fair value of debt instruments, such as bonds, and over-the-counter derivatives is generally based on market price quotations, recently executed market transactions (where observable) or industry recognized
| 68 | • AB HIGH YIELD PORTFOLIO |
Notes to Financial Statements
modeling techniques and are generally classified as Level 2. Pricing vendor inputs to Level 2 valuations may include quoted prices for similar investments in active markets, interest rate curves, coupon rates, currency rates, yield curves, option adjusted spreads, default rates, credit spreads and other unique security features in order to estimate the relevant cash flows which are then discounted to calculate fair values. If these inputs are unobservable and significant to the fair value, these investments will be classified as Level 3. In addition, non-agency rated investments are classified as Level 3.
Options are valued using market-based inputs to models, broker or dealer quotations, or alternative pricing sources with reasonable levels of price transparency, where such inputs and models are available. Alternatively the values may be obtained through unobservable management determined inputs and/or management’s proprietary models. Where models are used, the selection of a particular model to value an option depends upon the contractual terms of, and specific risks inherent in, the option as well as the availability of pricing information in the market. Valuation models require a variety of inputs, including contractual terms, market prices, measures of volatility and correlations of such inputs. Exchange traded options generally will be classified as Level 2. For options that do not trade on exchange but trade in liquid markets, inputs can generally be verified and model selection does not involve significant management judgment. Options are classified within Level 2 on the fair value hierarchy when all of the significant inputs can be corroborated to market evidence. Otherwise such instruments are classified as Level 3.
Valuations of mortgage-backed or other asset-backed securities, by pricing vendors, are based on both proprietary and industry recognized models and discounted cash flow techniques. Significant inputs to the valuation of these instruments are value of the collateral, the rates and timing of delinquencies, the rates and timing of prepayments, and default and loss expectations, which are driven in part by housing prices for residential mortgages. Significant inputs are determined based on relative value analyses, which incorporate comparisons to instruments with similar collateral and risk profiles, including relevant indices. Mortgage and asset-backed securities for which management has collected current observable data through pricing services are generally categorized within Level 2. Those investments for which current observable data has not been provided are classified as Level 3.
Bank loan prices are provided by third party pricing services and consist of a composite of the quotes received by the vendor into a consensus price. Certain bank loans are classified as Level 3, as significant input used in the fair value measurement of these instruments is the market quotes that are received by the vendor and these inputs are not observable.
| AB HIGH YIELD PORTFOLIO • | 69 |
Notes to Financial Statements
Other fixed income investments, including non-U.S. government and corporate debt, are generally valued using quoted market prices, if available, which are typically impacted by current interest rates, maturity dates and any perceived credit risk of the issuer. Additionally, in the absence of quoted market prices, these inputs are used by pricing vendors to derive a valuation based upon industry or proprietary models which incorporate issuer specific data with relevant yield/spread comparisons with more widely quoted bonds with similar key characteristics. Those investments for which there are observable inputs are classified as Level 2. Where the inputs are not observable, the investments are classified as Level 3.
The following table summarizes the valuation of the Portfolio’s investments by the above fair value hierarchy levels as of October 31, 2016:
Investments in | Level 1 | Level 2 | Level 3 | Total | ||||||||||||
Assets: | ||||||||||||||||
Corporates – Non-Investment Grade | $ | – 0 | – | $ | 59,606,542 | $ | 386,482 | (a) | $ | 59,993,024 | ||||||
Corporates – Investment Grade | – 0 | – | 8,349,549 | – 0 | – | 8,349,549 | ||||||||||
Bank Loans | – 0 | – | 3,817,510 | 195,482 | 4,012,992 | |||||||||||
Common Stocks | 1,511,839 | 126,631 | 105,846 | 1,744,316 | ||||||||||||
Governments – Treasuries | – 0 | – | 1,175,528 | – 0 | – | 1,175,528 | ||||||||||
Preferred Stocks | 228,968 | 882,627 | – 0 | – | 1,111,595 | |||||||||||
Collateralized Mortgage Obligations | – 0 | – | 822,269 | – 0 | – | 822,269 | ||||||||||
Emerging Markets – Corporate Bonds | – 0 | – | 804,796 | 3,739 | 808,535 | |||||||||||
Asset-Backed Securities | – 0 | – | – 0 | – | 723,664 | 723,664 | ||||||||||
Commercial Mortgage-Backed Securities | – 0 | – | – 0 | – | 655,946 | 655,946 | ||||||||||
Local Governments – Municipal Bonds | – 0 | – | 353,690 | – 0 | – | 353,690 | ||||||||||
Emerging Markets – Sovereigns | – 0 | – | 194,316 | – 0 | – | 194,316 | ||||||||||
Governments – Sovereign Agencies | – 0 | – | 151,448 | – 0 | – | 151,448 | ||||||||||
Warrants | 69,401 | – 0 | – | 55,217 | 124,618 | |||||||||||
Investment Companies | 98,829 | – 0 | – | – 0 | – | 98,829 | ||||||||||
Options Purchased – Puts | – 0 | – | 37,154 | – 0 | – | 37,154 | ||||||||||
Short-Term Investments: | ||||||||||||||||
Investment Companies | 5,337,994 | – 0 | – | – 0 | – | 5,337,994 | ||||||||||
U.S. Treasury Bills | – 0 | – | 349,866 | – 0 | – | 349,866 | ||||||||||
|
|
|
|
|
|
|
| |||||||||
Total Investments in Securities | 7,247,031 | 76,671,926 | 2,126,376 | 86,045,333 | ||||||||||||
Other Financial Instruments(b): | ||||||||||||||||
Assets: | ||||||||||||||||
Futures | 27,139 | 7,193 | – 0 | – | 34,332 | (c) | ||||||||||
Forward Currency Exchange Contracts | – 0 | – | 196,117 | – 0 | – | 196,117 | ||||||||||
Centrally Cleared Credit Default Swaps | – 0 | – | 128,847 | – 0 | – | 128,847 | (c) | |||||||||
Centrally Cleared Interest Rate Swaps | – 0 | – | 2,332 | – 0 | – | 2,332 | (c) | |||||||||
Credit Default Swaps | – 0 | – | 135,031 | – 0 | – | 135,031 | ||||||||||
Total Return Swaps | – 0 | – | 12,599 | – 0 | – | 12,599 | ||||||||||
| 70 | • AB HIGH YIELD PORTFOLIO |
Notes to Financial Statements
Investments in | Level 1 | Level 2 | Level 3 | Total | ||||||||||||
Liabilities: | ||||||||||||||||
Futures | $ | (24,744 | ) | $ | – 0 | – | $ | – 0 | – | $ | (24,744 | )(c) | ||||
Forward Currency Exchange Contracts | – 0 | – | (24,284 | ) | – 0 | – | (24,284 | ) | ||||||||
Put Options Written | – 0 | – | (4,242 | ) | – 0 | – | (4,242 | ) | ||||||||
Centrally Cleared Credit Default Swaps | – 0 | – | (79,860 | ) | – 0 | – | (79,860 | )(c) | ||||||||
Centrally Cleared Interest Rate Swaps | – 0 | – | (184,946 | ) | – 0 | – | (184,946 | )(c) | ||||||||
Credit Default Swaps | – 0 | – | (285,401 | ) | – 0 | – | (285,401 | ) | ||||||||
Total Return Swaps | – 0 | – | (5,088 | ) | – 0 | – | (5,088 | ) | ||||||||
|
|
|
|
|
|
|
| |||||||||
Total(d) | $ | 7,249,426 | $ | 76,570,224 | $ | 2,126,376 | $ | 85,946,026 | ||||||||
|
|
|
|
|
|
|
| |||||||||
| (a) | The Portfolio held securities with zero market value at period end. |
| (b) | Other financial instruments are derivative instruments, such as futures, forwards and swaps, which are valued at the unrealized appreciation/(depreciation) on the instrument. Other financial instruments may also include options written which are valued at market value. |
| (c) | Only variation margin receivable/payable at period end is reported within the statement of assets and liabilities. This amount reflects cumulative unrealized appreciation/(depreciation) of exchange-traded derivatives as reported in the portfolio of investments. |
| (d) | There were de minimis transfers under 1% of net assets between Level 1 and Level 2 during the reporting period. |
The Portfolio recognizes all transfers between levels of the fair value hierarchy assuming the financial instruments were transferred at the beginning of the reporting period.
The following is a reconciliation of investments in which significant unobservable inputs (Level 3) were used in determining fair value.
| Corporates - Non-Investment Grade(a) | Bank Loans | Common Stocks | ||||||||||
Balance as of 8/31/16 | $ | 317,077 | $ | 683,083 | $ | 138,752 | ||||||
Accrued discounts/(premiums) | 579 | 242 | – 0 | – | ||||||||
Realized gain (loss) | (1 | ) | 324 | – 0 | – | |||||||
Change in unrealized appreciation/depreciation | 152,965 | (6,558 | ) | (32,906 | ) | |||||||
Purchases/Payups | 14,737 | – 0 | – | – 0 | – | |||||||
Sales/Paydowns | (228,250 | ) | (11,348 | ) | – 0 | – | ||||||
Transfers in to Level 3 | 129,375 | 1,887 | – 0 | – | ||||||||
Transfers out of Level 3 | – 0 | – | (472,148 | ) | – 0 | – | ||||||
|
|
|
|
|
| |||||||
Balance as of 10/31/16 | $ | 386,482 | $ | 195,482 | $ | 105,846 | ||||||
|
|
|
|
|
| |||||||
Net change in unrealized appreciation/depreciation from investments held as of 10/31/16(b) | $ | 15,920 | $ | (6,272 | ) | $ | (32,906 | ) | ||||
|
|
|
|
|
| |||||||
| AB HIGH YIELD PORTFOLIO • | 71 |
Notes to Financial Statements
| Emerging Markets - Corporate Bonds | Asset-Backed Securities | Commercial Mortgage- Backed Securities | ||||||||||
Balance as of 8/31/16 | $ | 2,263 | $ | 714,938 | $ | 676,502 | ||||||
Accrued discounts/(premiums) | – 0 | – | 1,501 | 95 | ||||||||
Realized gain (loss) | – 0 | – | 2,535 | – 0 | – | |||||||
Change in unrealized appreciation/depreciation | 1,476 | 2,699 | (3,767 | ) | ||||||||
Purchases/Payups | – 0 | – | – 0 | – | – 0 | – | ||||||
Sales/Paydowns | – 0 | – | 1,991 | (16,884 | ) | |||||||
Transfers in to Level 3 | – 0 | – | – 0 | – | – 0 | – | ||||||
Transfers out of Level 3 | – 0 | – | – 0 | – | – 0 | – | ||||||
|
|
|
|
|
| |||||||
Balance as of 10/31/16 | $ | 3,739 | $ | 723,664 | $ | 655,946 | ||||||
|
|
|
|
|
| |||||||
Net change in unrealized appreciation/depreciation from investments held as of 10/31/16(b) | $ | 1,476 | $ | 2,699 | $ | (3,767 | ) | |||||
|
|
|
|
|
| |||||||
| Warrants | Total | |||||||||||
Balance as of 8/31/16 | $ | 38,992 | $ | 2,571,607 | ||||||||
Accrued discounts/(premiums) | – 0 | – | 2,417 | |||||||||
Realized gain (loss) | – 0 | – | 2,858 | |||||||||
Change in unrealized appreciation/depreciation | (2,950 | ) | 110,959 | |||||||||
Purchases/Payups | 19,175 | 33,912 | ||||||||||
Sales/Paydowns | – 0 | – | (254,491 | ) | ||||||||
Transfers in to Level 3 | – 0 | – | 131,262 | |||||||||
Transfers out of Level 3 | – 0 | – | (472,148 | ) | ||||||||
|
|
|
| |||||||||
Balance as of 10/31/16 | $ | 55,217 | $ | 2,126,376 | (c) | |||||||
|
|
|
| |||||||||
Net change in unrealized appreciation/depreciation from investments held as of 10/31/16(b) | $ | (2,950 | ) | $ | (25,800 | ) | ||||||
|
|
|
| |||||||||
| (a) | The Portfolio held securities with zero market value at period end. |
| (b) | The unrealized appreciation/(depreciation) is included in net change in unrealized appreciation/(depreciation) on investments and other financial instruments in the accompanying statement of operations. |
| (c) | There were de minimis transfers under 1% of net assets during the reporting period. |
| 72 | • AB HIGH YIELD PORTFOLIO |
Notes to Financial Statements
The following presents information about significant unobservable inputs related to the Portfolio’s Level 3 investments at October 31, 2016. Securities priced by i) third party vendors or ii) using prior transaction prices, which approximates fair value, are excluded from the following table.
Quantitative Information about Level 3 Fair Value Measurements
| Fair Value at 10/31/16 | Valuation Technique | Unobservable Input | Input | |||||||
Bank Loans | $ | 33,041 |
| Recovery Analysis | Liquidation / New | 85% Probability of Liquidation, Using a Value of $10 15% Probability of New Financing, Using a Value of $30 | ||||
Common Stocks | $ | 57,049 |
| Market Approach | EBITDA* Projection | $36.5MM 5.7X | ||||
| $ | 40,956 | Market Approach | EBITDA* Projection EBITDA* Multiples | $94.0MM 8.5X | ||||||
|
| |||||||||
| $ | 98,005 | |||||||||
|
| |||||||||
Warrants | $ | 38,992 | Option Price Modeling | Exercise Price Expiration Date EV Volatility% | $6.64 June 2019 50% | |||||
| * | Earnings before Interest, Taxes, Depreciation and Amortization. |
Generally, a change in the assumptions used in any input in isolation may be accompanied by a change in another input. Significant changes in any of the unobservable inputs may significantly impact the fair value measurement. Significant increases (decreases) in New Financing Probability, Assigned Discount Market Values, Exercise Price, Expiration Date, EBITDA Projections and EBITDA Multiple in isolation would be expected to result in a significantly higher (lower) fair value measurement. A significant increase (decrease) in Liquidation Probability and EV Volatility % in isolation would be expected to result in a significant lower (higher) fair value measurement.
The Adviser established the Committee to oversee the pricing and valuation of all securities held in the Portfolio. The Committee operates under pricing and valuation policies and procedures established by the Adviser and approved by the Board, including pricing policies which set forth the mechanisms and processes to be employed on a daily basis to implement these policies and procedures. In particular, the pricing policies describe how to determine market quotations for securities and other instruments. The Committee’s responsibilities include: 1) fair value and liquidity determinations (and oversight of any third parties to whom any
| AB HIGH YIELD PORTFOLIO • | 73 |
Notes to Financial Statements
responsibility for fair value and liquidity determinations is delegated), and 2) regular monitoring of the Adviser’s pricing and valuation policies and procedures and modification or enhancement of these policies and procedures (or recommendation of the modification of these policies and procedures) as the Committee believes appropriate.
The Committee is also responsible for monitoring the implementation of the pricing policies by the Adviser’s Pricing Group (the “Pricing Group”) and a third party which performs certain pricing functions in accordance with the pricing policies. The Pricing Group is responsible for the oversight of the third party on a day-to-day basis. The Committee and the Pricing Group perform a series of activities to provide reasonable assurance of the accuracy of prices including: 1) periodic vendor due diligence meetings, review of methodologies, new developments and processes at vendors, 2) daily comparison of security valuation versus prior day for all securities that exceeded established thresholds, and 3) daily review of unpriced, stale, and variance reports with exceptions reviewed by senior management and the Committee.
In addition, several processes outside of the pricing process are used to monitor valuation issues including: 1) performance and performance attribution reports are monitored for anomalous impacts based upon benchmark performance, and 2) portfolio managers review all portfolios for performance and analytics (which are generated using the Adviser’s prices).
3. Currency Translation
Assets and liabilities denominated in foreign currencies and commitments under forward currency exchange contracts are translated into U.S. dollars at the mean of the quoted bid and ask prices of such currencies against the U.S. dollar. Purchases and sales of portfolio securities are translated into U.S. dollars at the rates of exchange prevailing when such securities were acquired or sold. Income and expenses are translated into U.S. dollars at rates of exchange prevailing when accrued.
The Portfolio does not isolate that portion of the results of operations resulting from changes in foreign exchange rates on investments from the fluctuations arising from changes in market prices of securities held. Such fluctuations are included with the net realized and unrealized gain or loss from investments.
Net realized gain or loss on foreign currency transactions represents foreign exchange gains and losses from sales and maturities of foreign fixed income investments, foreign currency exchange contracts, holding of foreign currencies, currency gains or losses realized between the trade and settlement dates on foreign investment transactions, and the difference between the amounts of dividends, interest and foreign withholding taxes
| 74 | • AB HIGH YIELD PORTFOLIO |
Notes to Financial Statements
recorded on the Portfolio’s books and the U.S. dollar equivalent amounts actually received or paid. Net unrealized currency gains and losses from valuing foreign currency denominated assets and liabilities at period end exchange rates are reflected as a component of net unrealized appreciation or depreciation of foreign currency denominated assets and liabilities.
4. Taxes
It is the Portfolio’s policy to meet the requirements of the Internal Revenue Code applicable to regulated investment companies and to distribute all of its investment company taxable income and net realized gains, if any, to shareholders. Therefore, no provisions for federal income or excise taxes are required. The Portfolio may be subject to taxes imposed by countries in which it invests. Such taxes are generally based on income and/or capital gains earned or repatriated. Taxes are accrued and applied to net investment income, net realized gains and net unrealized appreciation/depreciation as such income and/or gains are earned.
In accordance with U.S. GAAP requirements regarding accounting for uncertainties in income taxes, management has analyzed the Portfolio’s tax positions taken or expected to be taken on federal and state income tax returns for all open tax years (the current and the prior four tax years) and has concluded that no provision for income tax is required in the Portfolio’s financial statements.
5. Investment Income and Investment Transactions
Dividend income (or dividend expense) is recorded on the ex-dividend date or as soon as the Portfolio is informed of the dividend.
Interest income (or interest expense) is accrued daily. Investment transactions are accounted for on the date the securities are purchased or sold. Investment gains or losses are determined on the identified cost basis. The Portfolio amortizes premiums and accretes discounts as adjustments to interest income.
6. Class Allocations
All income earned and expenses incurred by the Portfolio are borne on a pro-rata basis by each outstanding class of shares, based on the proportionate interest in the Portfolio represented by the net assets of such class, except for class specific expenses which are allocated to the respective class.
Expenses of the Company are charged proportionately to each portfolio or based on other appropriate methods. Realized and unrealized gains and losses are allocated among the various share classes based on respective net assets.
7. Dividends and Distributions
Dividends and distributions to shareholders, if any, are recorded on the ex-dividend date. Income dividends and capital gains distributions are
| AB HIGH YIELD PORTFOLIO • | 75 |
Notes to Financial Statements
determined in accordance with federal tax regulations and may differ from those determined in accordance with U.S. GAAP. To the extent these differences are permanent, such amounts are reclassified within the capital accounts based on their federal tax basis treatment; temporary differences do not require such reclassification.
NOTE B
Advisory Fee and Other Transactions with Affiliates
Under the terms of the investment advisory agreement, the Portfolio pays the Adviser an advisory fee at an annual rate of .60% of first $2.5 billion, .55% of the next $2.5 billion and .50% in excess of $5 billion, of the Portfolio’s average daily net assets. The fee is accrued daily and paid monthly. The Adviser has agreed to waive its fees and bear certain expenses to the extent necessary to limit total operating expenses (excluding expenses associated with acquired fund fees and expenses other than the advisory fees of any AB Mutual Funds in which the Portfolio may invest, interest expense, taxes, extraordinary expenses, and brokerage commissions and other transaction costs), on an annual basis (the “Expense Caps”) to 1.05%, 1.80%, .80%, 1.30%, 1.05%, .80% and .80% of daily average net assets for Class A, Class C, Advisor Class, Class R, Class K, Class I and Class Z shares, respectively. Any fees waived and expenses borne by the Adviser through October 31, 2014 are subject to repayment by the Portfolio until October 31, 2017; any fees waived and expenses borne by the Adviser from November 1, 2014 to July 14, 2015, are subject to repayment by the Portfolio until October 31, 2018; such waivers that are subject to repayment amounted to $189,698 and $288,388, respectively. In any case, no repayment will be made that would cause the Portfolio’s total annual operating expenses to exceed the net fee percentage set forth above. The Expense Caps may not be terminated by the Adviser before January 31, 2018. The Accounting Survivor did not have Expense Caps. For the year ended August 31, 2016, such reimbursements/waivers amounted to $101,767. Prior to July 27, 2016, the Accounting Survivor did not pay an advisory fee. For the period ended October 31, 2016, such reimbursements/waivers amounted to $223,065.
Pursuant to the investment advisory agreement, the Portfolio may reimburse the Adviser for certain legal and accounting services provided to the Portfolio by the Adviser. Prior to the Reorganization, the reimbursement for such services provided to the Accounting Survivor amounted to $48,550. Subsequent to the Reorganization, for the year ended August 31, 2016, the Adviser voluntarily agreed to waive such fees amounting to $8,470. For the period ended October 31, 2016, the Adviser voluntarily agreed to waive such fees amounting to $13,497.
The Portfolio compensates AllianceBernstein Investor Services, Inc. (“ABIS”), a wholly-owned subsidiary of the Adviser, under a Transfer
| 76 | • AB HIGH YIELD PORTFOLIO |
Notes to Financial Statements
Agency Agreement for providing personnel and facilities to perform transfer agency services for the Portfolio. ABIS may make payments to intermediaries that provide omnibus account services, sub-accounting services and/or networking services. Such compensation retained by ABIS amounted to $1,915 and $3,465 for the year ended August 31, 2016 and period ended October 31, 2016, respectively.
AllianceBernstein Investments, Inc. (the “Distributor”), a wholly-owned subsidiary of the Adviser, serves as the distributor of the Portfolio’s shares. The Distributor has advised the Portfolio that it has retained front-end sales charges of $384 from the sale of Class A shares and received $0 and $14 in contingent deferred sales charges imposed upon redemptions by shareholders of Class A and Class C shares, respectively, for the year ended August 31, 2016. The Distributor has advised the Portfolio that it has retained front-end sales charges of $627 from the sale of Class A shares and received $0 and $0 in contingent deferred sales charges imposed upon redemptions by shareholders of Class A and Class C shares, respectively, for the period ended October 31, 2016.
The AB Fixed-Income Shares, Inc.—Government STIF Portfolio (the “Government STIF Portfolio”), prior to June 1, 2016, was offered as a cash management option to mutual funds and other institutional accounts of the Adviser, and was not available for direct purchase by members of the public. Prior to June 1, 2016, the Government STIF Portfolio paid no advisory fees but did bear its own expenses. As of June 1, 2016, the Government STIF Portfolio, which was renamed “AB Government Money Market Portfolio” (the “Government Money Market Portfolio”), has a contractual advisory fee rate of .20% and continues to bear its own expenses. In connection with the investment by the Portfolio in the Government Money Market Portfolio, the Adviser has agreed to waive its investment advisory fee from the Portfolio in an amount equal to the Portfolio’s share of the advisory fees of Government Money Market Portfolio, as borne indirectly by the Portfolio as an acquired fund fee and expense. For the year ended August 31, 2016, such waiver amounted to $2,981. For the period ended October 31, 2016, such waiver amounted to $2,680. A summary of the Portfolio’s transactions in shares of the Government Money Market Portfolio for the period ended October 31, 2016 is as follows:
Market Value 08/31/16 (000) | Purchases at Cost (000) | Sales Proceeds (000) | Market Value 10/31/16 (000) | Dividend Income (000) | ||||||||||||||
| $ | 8,108 | $ | 5,388 | $ | 8,158 | $ | 5,338 | $ | 4 | |||||||||
| (a) | For the year ended August 31, 2016, the Portfolio received dividend income of $45,587. |
Brokerage commissions paid on investment transactions for the period ended October 31, 2016 amounted to $1,810, of which $0 and $0, respectively, was paid to Sanford C. Bernstein & Co. LLC and Sanford C. Bernstein Limited, affiliates of the Adviser.
| AB HIGH YIELD PORTFOLIO • | 77 |
Notes to Financial Statements
NOTE C
Distribution Services Agreement
The Portfolio has adopted a Distribution Services Agreement (the “Agreement”) pursuant to Rule 12b-1 under the Investment Company Act of 1940. Under the Agreement, the Portfolio pays distribution and servicing fees to the Distributor at an annual rate of up to .25% of the Portfolio’s average daily net assets attributable to Class A shares, 1% of the Portfolio’s average daily net assets attributable to Class C shares, ..50% of the Portfolio’s average daily net assets attributable to Class R shares and .25% of the Portfolio’s average daily net assets attributable to Class K shares. There are no distribution and servicing fees on the Advisor Class, Class I and Class Z shares. The fees are accrued daily and paid monthly. The Agreement provides that the Distributor will use such payments in their entirety for distribution assistance and promotional activities. Since the commencement of the Portfolio’s operations, the Distributor has incurred expenses in excess of the distribution costs reimbursed by the Portfolio in the amounts of $2,534, $111 and $0 for Class C, Class R and Class K shares, respectively. While such costs may be recovered from the Portfolio in future periods so long as the Agreement is in effect, the rate of the distribution and servicing fees payable under the Agreement may not be increased without a shareholder vote. In accordance with the Agreement, there is no provision for recovery of unreimbursed distribution costs incurred by the Distributor beyond the current fiscal year for Class A shares. The Agreement also provides that the Adviser may use its own resources to finance the distribution of the Portfolio’s shares.
NOTE D
Purchases and sales of investment securities (excluding short-term investments) for the period ended October 31, 2016 were as follows:
| Purchases | Sales | |||||||
Investment securities (excluding | $ | 8,418,575 | $ | 7,217,643 | ||||
U.S. government securities | – 0 | – | – 0 | – | ||||
Investment Transactions
The cost of investments for federal income tax purposes, gross unrealized appreciation and unrealized depreciation (excluding futures, foreign currency, written options and swap transactions) are as follows:
Cost | $ | 87,226,750 | ||
|
| |||
Gross unrealized appreciation | $ | 4,002,550 | ||
Gross unrealized depreciation | (5,183,967 | ) | ||
|
| |||
Net unrealized appreciation | $ | (1,181,417 | ) | |
|
|
| 78 | • AB HIGH YIELD PORTFOLIO |
Notes to Financial Statements
1. Derivative Financial Instruments
The Portfolio may use derivatives in an effort to earn income and enhance returns, to replace more traditional direct investments, to obtain exposure to otherwise inaccessible markets (collectively, “investment purposes”), or to hedge or adjust the risk profile of its portfolio.
The principal types of derivatives utilized by the Portfolio, as well as the methods in which they may be used are:
| • | Futures |
The Portfolio may buy or sell futures for investment purposes or for the purpose of hedging its portfolio against adverse effects of potential movements in the market. The Portfolio bears the market risk that arises from changes in the value of these instruments and the imperfect correlation between movements in the price of the futures and movements in the price of the assets, reference rates or indices which they are designed to track. Among other things, the Portfolio may purchase or sell futures for foreign currencies or options thereon for non-hedging purposes as a means of making direct investment in foreign currencies, as described below under “Currency Transactions”.
At the time the Portfolio enters into futures, the Portfolio deposits and maintains as collateral an initial margin with the broker, as required by the exchange on which the transaction is effected. Such amount is shown as cash collateral due from broker on the statement of assets and liabilities. Pursuant to the contract, the Portfolio agrees to receive from or pay to the broker an amount of cash equal to the daily fluctuation in the value of the contract. Such receipts or payments are known as variation margin and are recorded by the Portfolio as unrealized gains or losses. Risks may arise from the potential inability of a counterparty to meet the terms of the contract. The credit/counterparty risk for exchange-traded futures is generally less than privately negotiated futures, since the clearinghouse, which is the issuer or counterparty to each exchange-traded future, has robust risk mitigation standards, including the requirement to provide initial and variation margin. When the contract is closed, the Portfolio records a realized gain or loss equal to the difference between the value of the contract at the time it was opened and the time it was closed.
Use of long futures subjects the Portfolio to risk of loss in excess of the amounts shown on the statement of assets and liabilities, up to the notional value of the futures. Use of short futures subjects the Portfolio to unlimited risk of loss. Under some circumstances, futures exchanges may establish daily limits on the amount that the
| AB HIGH YIELD PORTFOLIO • | 79 |
Notes to Financial Statements
price of futures can vary from the previous day’s settlement price, which could effectively prevent liquidation of unfavorable positions.
During the period ended October 31, 2016, the Portfolio held futures for hedging and non-hedging purposes.
| • | Forward Currency Exchange Contracts |
The Portfolio may enter into forward currency exchange contracts in order to hedge its exposure to changes in foreign currency exchange rates on its foreign portfolio holdings, to hedge certain firm purchase and sale commitments denominated in foreign currencies and for non-hedging purposes as a means of making direct investments in foreign currencies, as described below under “Currency Transactions”.
A forward currency exchange contract is a commitment to purchase or sell a foreign currency at a future date at a negotiated forward rate. The gain or loss arising from the difference between the original contract and the closing of such contract would be included in net realized gain or loss on foreign currency transactions. Fluctuations in the value of open forward currency exchange contracts are recorded for financial reporting purposes as unrealized appreciation and/or depreciation by the Portfolio. Risks may arise from the potential inability of a counterparty to meet the terms of a contract and from unanticipated movements in the value of a foreign currency relative to the U.S. dollar.
During the period ended October 31, 2016, the Portfolio held forward currency exchange contracts for hedging and non-hedging purposes.
| • | Option Transactions |
For hedging and investment purposes, the Portfolio may purchase and write (sell) put and call options on U.S. and foreign securities, including government securities, and foreign currencies that are traded on U.S. and foreign securities exchanges and over-the-counter markets. Among other things, the Portfolio may use options transactions for non-hedging purposes as a means of making direct investments in foreign currencies, as described below under “Currency Transactions” and may use options strategies involving the purchase and/or writing of various combinations of call and/or put options, for hedging and investment purposes.
The risk associated with purchasing an option is that the Portfolio pays a premium whether or not the option is exercised. Additionally, the Portfolio bears the risk of loss of the premium and change in market value should the counterparty not perform
| 80 | • AB HIGH YIELD PORTFOLIO |
Notes to Financial Statements
under the contract. Put and call options purchased are accounted for in the same manner as portfolio securities. The cost of securities acquired through the exercise of call options is increased by premiums paid. The proceeds from securities sold through the exercise of put options are decreased by the premiums paid.
When the Portfolio writes an option, the premium received by the Portfolio is recorded as a liability and is subsequently adjusted to the current market value of the option written. Premiums received from written options which expire unexercised are recorded by the Portfolio on the expiration date as realized gains from options written. The difference between the premium received and the amount paid on effecting a closing purchase transaction, including brokerage commissions, is also treated as a realized gain, or if the premium received is less than the amount paid for the closing purchase transaction, as a realized loss. If a call option is exercised, the premium received is added to the proceeds from the sale of the underlying security or currency in determining whether the Portfolio has realized a gain or loss. If a put option is exercised, the premium received reduces the cost basis of the security or currency purchased by the Portfolio. In writing an option, the Portfolio bears the market risk of an unfavorable change in the price of the security or currency underlying the written option. Exercise of an option written by the Portfolio could result in the Portfolio selling or buying a security or currency at a price different from the current market value.
At October 31, 2016, the maximum payments for written put options amounted to $1,989,700. In certain circumstances maximum payout amounts may be partially offset by recovery values of the respective referenced assets and upfront premium received upon entering into the contract.
The Portfolio may also invest in options on swap agreements, also called “swaptions”. A swaption is an option that gives the buyer the right, but not the obligation, to enter into a swap on a future date in exchange for paying a market-based “premium”. A receiver swaption gives the owner the right to receive the total return of a specified asset, reference rate, or index. A payer swaption gives the owner the right to pay the total return on a specified asset, reference rate, or index. Swaptions also include options that allow an existing swap to be terminated or extended by one of the counterparties.
During the period ended October 31, 2016, the Portfolio held purchased options for hedging and non-hedging purposes. During the period ended October 31, 2016, the Portfolio held written
| AB HIGH YIELD PORTFOLIO • | 81 |
Notes to Financial Statements
options for hedging and non-hedging purposes. During the period ended October 31, 2016, the Portfolio held written swaptions for non-hedging purposes. During the period ended October 31, 2016, the Portfolio held purchased swaptions for non-hedging purposes.
For the period ended October 31, 2016, the Portfolio had the following transactions in written options:
| Number of Contracts | Premiums Received | |||||||
Options written outstanding as of 8/31/16 | 441 | $ | 10,914 | |||||
Options written | 381 | 17,268 | ||||||
Options assigned | – 0 | – | – 0 | – | ||||
Options expired | (721 | ) | (25,156 | ) | ||||
Options bought back | – 0 | – | – 0 | – | ||||
Options exercised | – 0 | – | – 0 | – | ||||
|
|
|
| |||||
Options written outstanding as of 10/31/16 | 101 | $ | 3,026 | |||||
|
|
|
| |||||
| Notional Amount | Premiums Received | |||||||
Swaptions written outstanding as of 8/31/16 | 3,990,000 | $ | 5,586 | |||||
Swaptions written | – 0 | – | – 0 | – | ||||
Swaptions expired | (3,990,000 | ) | (5,586 | ) | ||||
Swaptions bought back | – 0 | – | – 0 | – | ||||
Swaptions exercised | – 0 | – | – 0 | – | ||||
|
|
|
| |||||
Swaptions written outstanding as of 10/31/16 | – 0 | – | $ | – 0 | – | |||
|
|
|
| |||||
| • | Swaps |
The Portfolio may enter into swaps to hedge its exposure to interest rates, credit risk, equity markets, or currencies. The Portfolio may also enter into swaps for non-hedging purposes as a means of gaining market exposures, including by making direct investments in foreign currencies, as described below under “Currency Transactions” or in order to take a “long” or “short” position with respect to an underlying referenced asset described below under “Total Return Swaps”. A swap is an agreement that obligates two parties to exchange a series of cash flows at specified intervals based upon or calculated by reference to changes in specified prices or rates for a specified amount of an underlying asset. The payment flows are usually netted against each other, with the difference being paid by one party to the other. In addition, collateral may be pledged or received by the Portfolio in accordance with the terms of the respective swaps to provide value and recourse to the Portfolio or its counterparties in the event of default, bankruptcy or insolvency by one of the parties to the swap.
Risks may arise as a result of the failure of the counterparty to the swap to comply with the terms of the swap. The loss incurred by the failure of a counterparty is generally limited to the net interim payment to be received by the Portfolio, and/or the termination
| 82 | • AB HIGH YIELD PORTFOLIO |
Notes to Financial Statements
value at the end of the contract. Therefore, the Portfolio considers the creditworthiness of each counterparty to a swap in evaluating potential counterparty risk. This risk is mitigated by having a netting arrangement between the Portfolio and the counterparty and by the posting of collateral by the counterparty to the Portfolio to cover the Portfolio’s exposure to the counterparty. Additionally, risks may arise from unanticipated movements in interest rates or in the value of the underlying securities. The Portfolio accrues for the interim payments on swaps on a daily basis, with the net amount recorded within unrealized appreciation/depreciation of swaps on the statement of assets and liabilities, where applicable. Once the interim payments are settled in cash, the net amount is recorded as realized gain/(loss) on swaps on the statement of operations, in addition to any realized gain/(loss) recorded upon the termination of swaps. Upfront premiums paid or received are recognized as cost or proceeds on the statement of assets and liabilities and are amortized on a straight line basis over the life of the contract. Amortized upfront premiums are included in net realized gain/(loss) from swaps on the statement of operations. Fluctuations in the value of swaps are recorded as a component of net change in unrealized appreciation/depreciation of swaps on the statement of operations.
Certain standardized swaps, including certain interest rate swaps and credit default swaps, are (or soon will be) subject to mandatory central clearing. Cleared swaps are transacted through futures commission merchants (“FCMs”) that are members of central clearinghouses, with the clearinghouse serving as central counterparty, similar to transactions in futures contracts. Centralized clearing will be required for additional categories of swaps on a phased-in basis based on requirements published by the Securities and Exchange Commission and Commodity Futures Trading Commission.
At the time the Portfolio enters into a centrally cleared swap, the Portfolio deposits and maintains as collateral an initial margin with the broker, as required by the clearinghouse on which the transaction is effected. Such amount is shown as cash collateral due from broker on the statement of assets and liabilities. Pursuant to the contract, the Portfolio agrees to receive from or pay to the broker an amount of cash equal to the daily fluctuation in the value of the contract. Such receipts or payments are known as variation margin and are recorded by the Portfolio as unrealized gains or losses. Risks may arise from the potential inability of a counterparty to meet the terms of the contract. The credit/counterparty risk for centrally cleared swaps is generally less than
| AB HIGH YIELD PORTFOLIO • | 83 |
Notes to Financial Statements
non-centrally cleared swaps, since the clearinghouse, which is the issuer or counterparty to each centrally cleared swap, has robust risk mitigation standards, including the requirement to provide initial and variation margin. When the contract is closed, the Portfolio records a realized gain or loss equal to the difference between the value of the contract at the time it was opened and the time it was closed.
Interest Rate Swaps:
The Portfolio is subject to interest rate risk exposure in the normal course of pursuing its investment objectives. Because the Portfolio holds fixed rate bonds, the value of these bonds may decrease if interest rates rise. To help hedge against this risk and to maintain its ability to generate income at prevailing market rates, the Portfolio may enter into interest rate swaps. Interest rate swaps are agreements between two parties to exchange cash flows based on a notional amount. The Portfolio may elect to pay a fixed rate and receive a floating rate, or, receive a fixed rate and pay a floating rate on a notional amount.
In addition, the Portfolio may also enter into interest rate swap transactions to preserve a return or spread on a particular investment or portion of its portfolio, or protecting against an increase in the price of securities the Portfolio anticipates purchasing at a later date. Interest rate swaps involve the exchange by a Portfolio with another party of their respective commitments to pay or receive interest (e.g., an exchange of floating rate payments for fixed rate payments) computed based on a contractually-based principal (or “notional”) amount. Interest rate swaps are entered into on a net basis (i.e., the two payment streams are netted out, with the Portfolio receiving or paying, as the case may be, only the net amount of the two payments).
During the period ended October 31, 2016, the Portfolio held interest rate swaps for hedging and non-hedging purposes.
Credit Default Swaps:
The Portfolio may enter into credit default swaps, including to manage its exposure to the market or certain sectors of the market, to reduce its risk exposure to defaults by corporate and sovereign issuers held by the Portfolio, or to create exposure to corporate or sovereign issuers to which it is not otherwise exposed. The Portfolio may purchase credit protection (“Buy Contract”) or provide credit protection (“Sale Contract”) on the referenced obligation of the credit default swap. During the term of the swap, the Portfolio receives/(pays) fixed payments from/(to) the respective counterparty, calculated at the agreed upon rate applied
| 84 | • AB HIGH YIELD PORTFOLIO |
Notes to Financial Statements
to the notional amount. If the Portfolio is a buyer/(seller) of protection and a credit event occurs, as defined under the terms of the swap, the Portfolio will either (i) receive from the seller/(pay to the buyer) of protection an amount equal to the notional amount of the swap (the “Maximum Payout Amount”) and deliver/(take delivery of) the referenced obligation or (ii) receive/(pay) a net settlement amount in the form of cash or securities equal to the notional amount of the swap less the recovery value of the referenced obligation.
In certain circumstances Maximum Payout Amounts may be partially offset by recovery values of the respective referenced obligations, upfront premium received upon entering into the agreement, or net amounts received from settlement of buy protection credit default swaps entered into by the Portfolio for the same reference obligation with the same counterparty. As of October 31, 2016, the Portfolio had Buy Contracts outstanding with respect to the same referenced obligation and same counterparty for its Sales Contracts which may partially offset the Maximum Payout Amount in the amount of $3,080,000.
Credit default swaps may involve greater risks than if a Portfolio had invested in the referenced obligation directly. Credit default swaps are subject to general market risk, liquidity risk, counterparty risk and credit risk. If the Portfolio is a buyer of protection and no credit event occurs, it will lose the payments it made to its counterparty. If the Portfolio is a seller of protection and a credit event occurs, the value of the referenced obligation received by the Portfolio coupled with the periodic payments previously received, may be less than the Maximum Payout Amount it pays to the buyer, resulting in a net loss to the Portfolio.
Implied credit spreads over U.S. Treasuries of comparable maturity utilized in determining the market value of credit default swaps on issuers as of period end are disclosed in the portfolio of investments. The implied spreads serve as an indicator of the current status of the payment/performance risk and typically reflect the likelihood of default by the issuer of the referenced obligation. The implied credit spread of a particular reference obligation also reflects the cost of buying/selling protection and may reflect upfront payments required to be made to enter into the agreement. Widening credit spreads typically represent a deterioration of the referenced obligation’s credit soundness and greater likelihood of default or other credit event occurring as defined under the terms of the agreement. A credit spread identified as “Defaulted” indicates a credit event has occurred for the referenced obligation.
| AB HIGH YIELD PORTFOLIO • | 85 |
Notes to Financial Statements
During the period ended October 31, 2016, the Portfolio held credit default swaps for hedging and non-hedging purposes.
Total Return Swaps:
The Portfolio may enter into total return swaps in order take a “long” or “short” position with respect to an underlying referenced asset. The Portfolio is subject to market price volatility of the underlying referenced asset. A total return swap involves commitments to pay interest in exchange for a market linked return based on a notional amount. To the extent that the total return of the security, group of securities or index underlying the transaction exceeds or falls short of the offsetting interest obligation, the Portfolio will receive a payment from or make a payment to the counterparty.
During the period ended October 31, 2016, the Portfolio held total return swaps for hedging and non-hedging purposes.
The Portfolios typically enter into International Swaps and Derivatives Association, Inc. Master Agreements (“ISDA Master Agreement”) or similar master agreements (collectively, “Master Agreements”) with its derivative contract counterparties in order to, among other things, reduce its credit risk to counterparties. ISDA Master Agreements include provisions for general obligations, representations, collateral and events of default or termination. Under an ISDA Master Agreement, the Portfolio typically may offset with the counterparty certain derivative financial instrument’s payables and/or receivables with collateral held and/or posted and create one single net payment (close-out netting) in the event of default or termination.
Various Master Agreements govern the terms of certain transactions with counterparties, including transactions such as derivative transactions, repurchase and reverse repurchase agreements. These Master Agreements typically attempt to reduce the counterparty risk associated with such transactions by specifying credit protection mechanisms and providing standardization that improves legal certainty. Cross-termination provisions under Master Agreements typically provide that a default in connection with one transaction between the Portfolio and a counterparty gives the non-defaulting party the right to terminate any other transactions in place with the defaulting party to create one single net payment due to/due from the defaulting party. In the event of a default by a Master Agreements counterparty, the return of collateral with market value in excess of the Portfolio’s net liability, held by the defaulting party, may be delayed or denied.
The Portfolio Master Agreements may contain provisions for early termination of OTC derivative transactions in the event the net assets of the
| 86 | • AB HIGH YIELD PORTFOLIO |
Notes to Financial Statements
Portfolio decline below specific levels (“net asset contingent features”). If these levels are triggered, the Portfolio counterparty has the right to terminate such transaction and require the Portfolio to pay or receive a settlement amount in connection with the terminated transaction. For additional details, please refer to netting arrangements by counterparty tables below.
During the period ended October 31, 2016, the Portfolio had entered into the following derivatives:
Asset Derivatives | Liability Derivatives | |||||||||||
Derivative Type | Statement of | Fair Value | Statement of | Fair Value | ||||||||
Interest rate contracts | Receivable/Payable for variation margin on exchange-traded derivatives | $ | 2,332 | * | Receivable/Payable for variation margin on exchange-traded derivatives | $ | 209,690 | * | ||||
Credit contracts | Receivable/Payable for variation margin on exchange-traded derivatives | 128,847 | * | Receivable/Payable for variation margin on exchange-traded derivatives | 79,860 | * | ||||||
Equity contracts | Receivable/Payable for variation margin on exchange-traded derivatives | 34,332 | * | |||||||||
Foreign exchange contracts | Unrealized appreciation on forward currency exchange contracts |
| 196,117 |
| Unrealized depreciation on forward currency exchange contracts |
| 24,284 |
| ||||
Credit contracts | Investments in securities, at value |
| 21,550 |
| ||||||||
Equity contracts | Investments in securities, at value | 15,604 | ||||||||||
Equity contracts | Options written, at value | 4,242 | ||||||||||
Credit contracts | Unrealized appreciation on credit default swaps | 135,031 | Unrealized depreciation on credit default swaps | 285,401 | ||||||||
Equity contracts | Unrealized appreciation on total return swaps | 12,599 | Unrealized depreciation on total return swaps | 5,088 | ||||||||
|
|
|
| |||||||||
Total | $ | 546,412 | $ | 608,565 | ||||||||
|
|
|
| |||||||||
| * | Only variation margin receivable/payable at period end is reported within the statement of assets and liabilities. This amount reflects cumulative appreciation/(depreciation) of exchange-traded derivatives as reported in the portfolio of investments. |
| AB HIGH YIELD PORTFOLIO • | 87 |
Notes to Financial Statements
Derivative Type | Location of | Realized Gain or (Loss) on Derivatives | Change in Unrealized Appreciation or (Depreciation) | |||||||
Interest rate contracts | Net realized gain (loss) on futures; Net change in unrealized appreciation/depreciation of futures | $ | – 0 | – | $ | (40,203 | ) | |||
Equity contracts | Net realized gain (loss) on futures; Net change in unrealized appreciation/depreciation of futures | (8,974 | ) | 42,808 | ||||||
Foreign exchange contracts | Net realized gain (loss) on foreign currency transactions; Net change in unrealized appreciation/depreciation of foreign currency denominated assets and liabilities | (25,978 | ) | 211,666 | ||||||
Interest rate contracts | Net realized gain (loss) on investment transactions; Net change in unrealized appreciation/depreciation of investments | (8,514 | ) | 6,565 | ||||||
Credit contracts | Net realized gain (loss) on investment transactions; Net change in unrealized appreciation/depreciation of investments | (23,940 | ) | 4,310 | ||||||
Equity contracts | Net realized gain (loss) on investment transactions; Net change in unrealized appreciation/depreciation of investments | (75,611 | ) | 34,365 | ||||||
Credit contracts | Net realized gain (loss) on swaptions written; Net change in unrealized appreciation/depreciation of swaptions written | 5,586 | 679 | |||||||
| 88 | • AB HIGH YIELD PORTFOLIO |
Notes to Financial Statements
Derivative Type | Location of | Realized Gain or (Loss) on Derivatives | Change in Unrealized Appreciation or (Depreciation) | |||||||
Equity contracts | Net realized gain (loss) on options written; Net change in unrealized appreciation/depreciation of options written | $ | 25,156 | $ | (9,479 | ) | ||||
Interest rate contracts | Net realized gain (loss) on swaps; Net change in unrealized appreciation/depreciation of swaps | (25,253 | ) | 147,605 | ||||||
Credit contracts | Net realized gain (loss) on swaps; Net change in unrealized appreciation/depreciation of swaps | (120,767 | ) | 197,866 | ||||||
Equity contracts | Net realized gain (loss) on swaps; Net change in unrealized appreciation/depreciation of swaps | 86,960 | (94,464 | ) | ||||||
|
|
|
| |||||||
Total | $ | (171,335 | ) | $ | 501,718 | |||||
|
|
|
| |||||||
The following table represents the average monthly volume of the Portfolio’s derivative transactions during the period ended October 31, 2016:
Futures: | ||||
Average original value of buy contracts | $ | 4,472,919 | ||
Average original value of sale contracts | $ | 1,302,160 | ||
Forward Currency Exchange Contracts: | ||||
Average principal amount of buy contracts | $ | 2,152,675 | ||
Average principal amount of sale contracts | $ | 7,218,646 | ||
Purchased Options: | ||||
Average monthly cost | $ | 61,949 | ||
Centrally Cleared Interest Rate Swaps: | ||||
Average notional amount | $ | 5,497,000 | ||
Credit Default Swaps: | ||||
Average notional amount of buy contracts | $ | 4,127,458 | ||
Average notional amount of sale contracts | $ | 4,722,890 | ||
Centrally Cleared Credit Default Swaps: | ||||
Average notional amount of buy contracts | $ | 11,736,941 | ||
Average notional amount of sale contracts | $ | 6,365,680 | ||
Total Return Swaps: | ||||
Average notional amount | $ | 4,744,000 |
| AB HIGH YIELD PORTFOLIO • | 89 |
Notes to Financial Statements
For financial reporting purposes, the Portfolio does not offset derivative assets and derivative liabilities that are subject to netting arrangements in the statement of assets and liabilities.
All derivatives held at period end were subject to netting arrangements. The following table presents the Portfolio’s derivative assets and liabilities by counterparty net of amounts available for offset under Master Agreements (“MA”) and net of the related collateral received/pledged by the Portfolio as of October 31, 2016:
Counterparty | Derivative Assets Subject to a MA | Derivative Available for Offset | Cash Collateral Received | Security Collateral Received | Net Amount of Derivatives Assets | |||||||||||||||
Exchange-Traded Derivatives: | ||||||||||||||||||||
Morgan Stanley & Co., Inc./Morgan Stanley & Co., LLC* | $ | 28,693 | $ | (4,242 | ) | $ | – 0 | – | $ | – 0 | – | $ | 24,451 | |||||||
|
|
|
|
|
|
|
|
|
| |||||||||||
Total | $ | 28,693 | $ | (4,242 | ) | $ | – 0 | – | $ | – 0 | – | $ | 24,451 | |||||||
|
|
|
|
|
|
|
|
|
| |||||||||||
OTC Derivatives: | ||||||||||||||||||||
Bank of America, NA | $ | 942 | $ | – 0 | – | $ | – 0 | – | – 0 | – | $ | 942 | ||||||||
Barclays Bank PLC | 32,589 | (32,589 | ) | – 0 | – | – 0 | – | – 0 | – | |||||||||||
Citibank, NA | 118,332 | (16,832 | ) | – 0 | – | – 0 | – | 101,500 | ||||||||||||
Credit Suisse International | 17,925 | (17,925 | ) | – 0 | – | – 0 | – | – 0 | – | |||||||||||
Deutsche Bank AG | 9,389 | – 0 | – | – 0 | – | – 0 | – | 9,389 | ||||||||||||
Goldman Sachs Bank USA/Goldman Sachs International | 85,371 | (85,371 | ) | – 0 | – | – 0 | – | – 0 | – | |||||||||||
JPMorgan Chase Bank/JPMorgan Chase Bank, NA | 17,638 | – 0 | – | – 0 | – | – 0 | – | 17,638 | ||||||||||||
Morgan Stanley Capital Services, Inc./Morgan Stanley & Co. International PLC/Morgan Stanley Capital Services LLC | 12,983 | (7,840 | ) | – 0 | – | – 0 | – | 5,143 | ||||||||||||
State Street Bank & Trust Co. | 93,503 | (16,444 | ) | – 0 | – | – 0 | – | 77,059 | ||||||||||||
|
|
|
|
|
|
|
|
|
| |||||||||||
Total | $ | 388,672 | $ | (177,001 | ) | $ | – 0 | – | $ | – 0 | – | $ | 211,671 | ^ | ||||||
|
|
|
|
|
|
|
|
|
| |||||||||||
| 90 | • AB HIGH YIELD PORTFOLIO |
Notes to Financial Statements
Counterparty | Derivative Liabilities Subject to a MA | Derivative Available for Offset | Cash Collateral Pledged** | Security Collateral Pledged | Net Amount of Derivatives Liabilities | |||||||||||||||
Exchange-Traded Derivatives: | ||||||||||||||||||||
Citigroup Global Markets, Inc.* | $ | 1,133 | $ | – 0 | – | $ | (1,133 | ) | $ | – 0 | – | $ | – 0 | – | ||||||
Morgan Stanley & Co., Inc./Morgan Stanley & Co., LLC* | 4,242 | (4,242 | ) | – 0 | – | – 0 | – | – 0 | – | |||||||||||
|
|
|
|
|
|
|
|
|
| |||||||||||
Total | $ | 5,375 | $ | (4,242 | ) | $ | (1,133 | ) | $ | – 0 | – | $ | – 0 | – | ||||||
|
|
|
|
|
|
|
|
|
| |||||||||||
OTC Derivatives: | ||||||||||||||||||||
Barclays Bank PLC | $ | 116,697 | $ | (32,589 | ) | $ | – 0 | – | $ | – 0 | – | $ | 84,108 | |||||||
Citibank, NA | 16,832 | (16,832 | ) | – 0 | – | – 0 | – | – 0 | – | |||||||||||
Credit Suisse International | 66,894 | (17,925 | ) | – 0 | – | – 0 | – | 48,969 | ||||||||||||
Goldman Sachs Bank USA/Goldman Sachs International | 507,771 | (85,371 | ) | – 0 | – | – 0 | – | 422,400 | ||||||||||||
Morgan Stanley Capital Services, Inc./Morgan Stanley & Co. International PLC/Morgan Stanley Capital Services LLC | 7,840 | (7,840 | ) | – 0 | – | – 0 | – | – 0 | – | |||||||||||
State Street Bank & Trust Co. | 16,444 | (16,444 | ) | – 0 | – | – 0 | – | – 0 | – | |||||||||||
|
|
|
|
|
|
|
|
|
| |||||||||||
Total | $ | 732,478 | $ | (177,001 | ) | $ | – 0 | – | $ | – 0 | – | $ | 555,477 | ^ | ||||||
|
|
|
|
|
|
|
|
|
| |||||||||||
| * | Cash has been posted for initial margin requirements for exchange-traded derivatives outstanding at October 31, 2016. |
| ** | The actual collateral received/pledged is more than the amount reported due to over-collateralization. |
| ^ | Net amount represents the net receivable/payable that would be due from/to the counterparty in the event of default or termination. The net amount from OTC financial derivative instruments can only be netted across transactions governed under the same master agreement with the same counterparty. |
2. Currency Transactions
The Portfolio may invest in non-U.S. Dollar-denominated securities on a currency hedged or unhedged basis. The Portfolio may seek investment opportunities by taking long or short positions in currencies through the use of currency-related derivatives, including forward currency exchange contracts, futures and options on futures, swaps, and other options. The Portfolio may enter into transactions for investment opportunities when it anticipates that a foreign currency will appreciate or depreciate in value but securities denominated in that currency are not held by the Portfolio
| AB HIGH YIELD PORTFOLIO • | 91 |
Notes to Financial Statements
and do not present attractive investment opportunities. Such transactions may also be used when the Adviser believes that it may be more efficient than a direct investment in a foreign currency-denominated security. The Portfolio may also conduct currency exchange contracts on a spot basis (i.e., for cash at the spot rate prevailing in the currency exchange market for buying or selling currencies).
3. Reverse Repurchase Agreements
The Portfolio may enter into reverse repurchase transactions (“RVP”) in accordance with the terms of a Master Repurchase Agreement (“MRA”), under which the Portfolio sells securities and agrees to repurchase them at a mutually agreed upon date and price. At the time the Portfolio enters into a reverse repurchase agreement, it will establish a segregated account with the custodian containing liquid assets having a value comparable to the repurchase price. Under the MRA and other Master Agreements, the Portfolio is permitted to offset payables and/or receivables with collateral held and/or posted to the counterparty and create one single net payment due to or from the Portfolio in the event of a default. In the event of a default by a MRA counterparty, the Portfolio may be considered an unsecured creditor with respect to any excess collateral (collateral with a market value in excess of the repurchase price) held by and/or posted to the counterparty, and as such the return of such excess collateral may be delayed or denied. During the period ended October 31, 2016, the Portfolio had no transactions in reverse repurchase agreements.
4. Loan Participations and Assignments
The Portfolio may invest in direct debt instruments which are interests in amounts owed to lenders or lending syndicates by corporate, governmental, or other borrowers, either in the form of participations at the time the loan is originated (“Participations”) or by buying an interest in the loan in the secondary market from a financial institution or institutional investor (“Assignments”). A loan is often administered by a bank or other financial institution (the “Lender”) that acts as agent for all holders. The agent administers the term of the loan as specified in the loan agreement. When investing in Participations, the Portfolio generally has no right to enforce compliance with the terms of the loan agreement with the borrower. In addition, when investing in Participations, the Portfolio has the right to receive payments of principal, interest and any fees to which it is entitled only from the Lender and only upon receipt of payments by the Lender from the borrower. As a result, the Portfolio may be subject to the credit risk of both the borrower and the Lender. When the Portfolio purchases Assignments from Lenders, it will typically acquire direct rights against the borrower on the loan. These loans may include participations in “bridge loans”, which are loans taken out by borrowers for a short period (typically less than six months) pending
| 92 | • AB HIGH YIELD PORTFOLIO |
Notes to Financial Statements
arrangement of more permanent financing through, for example, the issuance of bonds, frequently high-yield bonds issued for the purpose of acquisitions. The Portfolio may also participate in unfunded loan commitments, which are contractual obligations for investing in future Participations, may receive a commitment fee based on the amount of the commitment. Under these arrangements, the Portfolio may receive a fixed rate commitment fee and, if and to the extent the borrower borrows under the facility, the Portfolio may receive an additional funding fee. Unfunded loan commitments and funded loans are marked to market daily.
During the period ended October 31, 2016, the Portfolio had no commitments outstanding and received no commitment fees or additional funding fees.
NOTE E
Capital Stock
Each class consists of 3,000,000,000 authorized shares. Transactions in capital shares for each class were as follows:
| Shares | Amount | |||||||||||||||||||||||||||||||
| September 1, 2016 to October 31, 2016(a) | Year Ended 2016 | Year Ended August 31, 2015 | September 1, 2016 to October 31, 2016(a) | Year Ended August 31, 2016 | Year Ended August 31, 2015 | |||||||||||||||||||||||||||
|
| |||||||||||||||||||||||||||||||
| Class A(b) | ||||||||||||||||||||||||||||||||
Shares sold | 39,040 | 106,432 | – 0 | – | $ | 368,413 | $ | 996,211 | $ | – 0 | – | |||||||||||||||||||||
| ||||||||||||||||||||||||||||||||
Shares issued in reinvestment of dividends | 585 | 630 | – 0 | – | 5,529 | 5,916 | – 0 | – | ||||||||||||||||||||||||
| ||||||||||||||||||||||||||||||||
Shares redeemed | (20,179 | ) | (1,136 | ) | – 0 | – | (191,313 | ) | (10,687 | ) | – 0 | – | ||||||||||||||||||||
| ||||||||||||||||||||||||||||||||
Net increase | 19,446 | 105,926 | – 0 | – | $ | 182,629 | $ | 991,440 | $ | – 0 | – | |||||||||||||||||||||
| ||||||||||||||||||||||||||||||||
| Class C(b) | ||||||||||||||||||||||||||||||||
Shares sold | 18,904 | 19,881 | – 0 | – | $ | 179,153 | $ | 186,096 | $ | – 0 | – | |||||||||||||||||||||
| ||||||||||||||||||||||||||||||||
Shares issued in reinvestment of dividends | 105 | 87 | – 0 | – | 997 | 816 | – 0 | – | ||||||||||||||||||||||||
| ||||||||||||||||||||||||||||||||
Shares redeemed | (106 | ) | – 0 | – | – 0 | – | (995 | ) | – 0 | – | – 0 | – | ||||||||||||||||||||
| ||||||||||||||||||||||||||||||||
Net increase | 18,903 | 19,968 | – 0 | – | $ | 179,155 | $ | 186,912 | $ | – 0 | – | |||||||||||||||||||||
| ||||||||||||||||||||||||||||||||
| AB HIGH YIELD PORTFOLIO • | 93 |
Notes to Financial Statements
| Shares | Amount | |||||||||||||||||||||||||||||||
| September 1, 2016 to October 31, 2016(a) | Year Ended 2016 | Year Ended August 31, 2015 | September 1, 2016 to October 31, 2016(a) | Year Ended August 31, 2016 | Year Ended August 31, 2015 | |||||||||||||||||||||||||||
|
| |||||||||||||||||||||||||||||||
| Advisor Class(b) | ||||||||||||||||||||||||||||||||
Shares sold | 73,845 | 217,581 | – 0 | – | $ | 699,053 | $ | 2,039,971 | $ | – 0 | – | |||||||||||||||||||||
| ||||||||||||||||||||||||||||||||
Shares issued in reinvestment of dividends | 1,480 | 1,146 | – 0 | – | 13,990 | 10,763 | – 0 | – | ||||||||||||||||||||||||
| ||||||||||||||||||||||||||||||||
Shares redeemed | (4,951 | ) | (209 | ) | – 0 | – | (46,563 | ) | (1,957 | ) | – 0 | – | ||||||||||||||||||||
| ||||||||||||||||||||||||||||||||
Net increase | 70,374 | 218,518 | – 0 | – | $ | 666,480 | $ | 2,048,777 | $ | – 0 | – | |||||||||||||||||||||
| ||||||||||||||||||||||||||||||||
| Class R(b) | ||||||||||||||||||||||||||||||||
Shares sold | 59 | 3,196 | – 0 | – | $ | 560 | $ | 29,918 | $ | – 0 | – | |||||||||||||||||||||
| ||||||||||||||||||||||||||||||||
Shares issued in reinvestment of dividends | 14 | 14 | – 0 | – | 137 | 130 | – 0 | – | ||||||||||||||||||||||||
| ||||||||||||||||||||||||||||||||
Net increase | 73 | 3,210 | – 0 | – | $ | 697 | $ | 30,048 | $ | – 0 | – | |||||||||||||||||||||
| ||||||||||||||||||||||||||||||||
| Class K(b) | ||||||||||||||||||||||||||||||||
Shares sold | – 0 | – | 1,000 | – 0 | – | $ | – 0 | – | $ | 9,364 | $ | – 0 | – | |||||||||||||||||||
| ||||||||||||||||||||||||||||||||
Net increase | – 0 | – | 1,000 | – 0 | – | $ | – 0 | – | $ | 9,364 | $ | – 0 | – | |||||||||||||||||||
| ||||||||||||||||||||||||||||||||
| Class I(b) | ||||||||||||||||||||||||||||||||
Shares sold | – 0 | – | 1,790,331 | – 0 | – | $ | – 0 | – | $ | 16,762,629 | $ | – 0 | – | |||||||||||||||||||
| ||||||||||||||||||||||||||||||||
Net increase | – 0 | – | 1,790,331 | – 0 | – | $ | 0 | $ | 16,762,629 | $ | – 0 | – | ||||||||||||||||||||
| ||||||||||||||||||||||||||||||||
| Class Z | ||||||||||||||||||||||||||||||||
Shares sold | – 0 | – | 247,023 | 611,033 | $ | – 0 | – | $ | 2,284,326 | $ | 6,358,714 | |||||||||||||||||||||
| ||||||||||||||||||||||||||||||||
Shares issued in reinvestment of dividends | 51,603 | 1,887,844 | 2,387,311 | 487,381 | 17,643,285 | 24,694,123 | ||||||||||||||||||||||||||
| ||||||||||||||||||||||||||||||||
Shares issued in connection with the Reorganization | – 0 | – | 7,289,875 | – 0 | – | $ | – 0 | – | $ | 68,233,326 | $ | – 0 | – | |||||||||||||||||||
| ||||||||||||||||||||||||||||||||
Shares redeemed | (342,633 | ) | (34,787,674 | ) | (3,925,769 | ) | (3,241,490 | ) | (329,611,824 | ) | (40,460,867 | ) | ||||||||||||||||||||
| ||||||||||||||||||||||||||||||||
Net decrease | (291,030 | ) | (25,362,932 | ) | (927,425 | ) | $ | (2,754,109 | ) | $ | (241,450,887 | ) | $ | (9,408,030 | ) | |||||||||||||||||
| ||||||||||||||||||||||||||||||||
| (a) | The Portfolio changed its fiscal year end from August 31 to October 31. |
| (b) | Inception date of July 26, 2016. |
NOTE F
Risks Involved in Investing in the Portfolio
Interest Rate Risk and Credit Risk—Interest rate risk is the risk that changes in interest rates will affect the value of the Portfolio’s investments in fixed-income debt securities such as bonds or notes. Increases in interest
| 94 | • AB HIGH YIELD PORTFOLIO |
Notes to Financial Statements
rates may cause the value of the Portfolio’s investments to decline. Credit risk is the risk that the issuer or guarantor of a debt security, or the counterparty to a derivative contract, will be unable or unwilling to make timely principal and/or interest payments, or to otherwise honor its obligations. The degree of risk for a particular security may be reflected in its credit rating. Credit risk is greater for medium quality and lower-rated securities. Lower-rated debt securities and similar unrated securities (commonly known as “junk bonds”) have speculative elements or are predominantly speculative risks.
Below Investment Grade Securities Risk—Investments in fixed-income securities with lower ratings (commonly known as “junk bonds”) are subject to a higher probability that an issuer will default or fail to meet its payment obligations. These securities may be subject to greater price volatility due to such factors as specific corporate developments, negative perceptions of the junk bond market generally and less secondary market liquidity.
Duration Risk—Duration is a measure that relates the expected price volatility of a fixed-income security to changes in interest rates. The duration of a fixed-income security may be shorter than or equal to full maturity of a fixed-income security. Fixed-income securities with longer durations have more risk and will decrease in price as interest rates rise. For example, a fixed-income security with a duration of three years will decrease in value by approximately 3% if interest rates increase by 1%.
Inflation Risk—This is the risk that the value of assets or income from investments will be less in the future as inflation decreases the value of money. As inflation increases, the value of the Portfolio’s assets can decline as can the value of the Portfolio’s distributions. This risk is significantly greater for fixed-income securities with longer maturities.
Derivatives Risk—The Portfolio may enter into derivative transactions such as forwards, options, futures and swaps. Derivatives may be illiquid, difficult to price, and leveraged so that small changes may produce disproportionate losses for the Portfolio, and subject to counterparty risk to a greater degree than more traditional investments. Derivatives may result in significant losses, including losses that are far greater than the value of the derivatives reflected on the statement of assets and liabilities.
Leverage Risk—When the Portfolio borrows money or otherwise leverages its investments, its performance may be volatile because leverage tends to exaggerate the effect of any increase or decrease in the value of the Portfolio’s investments. The Portfolio may create leverage through the use of reverse repurchase arrangements, forward currency exchange contracts, forward commitments, dollar rolls or futures or by borrowing
| AB HIGH YIELD PORTFOLIO • | 95 |
Notes to Financial Statements
money. The use of derivative instruments by the Portfolio, such as forwards, futures, options and swaps, may also result in a form of leverage. Leverage may result in higher returns to the Portfolio than if the Portfolio were not leveraged, but may also adversely affect returns, particularly if the market is declining.
Foreign (Non-U.S.) Risk—Investments in securities of non-U.S. issuers may involve more risk than those of U.S. issuers. These securities may fluctuate more widely in price and may be less liquid due to adverse market, economic, political, regulatory or other factors.
Emerging Market Risk—Investments in emerging market countries may have more risk because the markets are less developed and less liquid, and because these investments may be subject to increased economic, political, regulatory, or other uncertainties.
Currency Risk—Fluctuations in currency exchange rates may negatively affect the value of the Portfolio’s investments or reduce its returns.
Diversification Risk—The Portfolio may have more risk because it is “non-diversified”, meaning that it can invest more of its assets in a smaller number of issuers. Accordingly, changes in the value of a single security may have a more significant effect, either negative or positive, on the Portfolio’s NAV.
Liquidity Risk—Liquidity risk occurs when certain investments become difficult to purchase or sell. Difficulty in selling less liquid securities may result in sales at disadvantageous prices affecting the value of your investment in the Portfolio. Causes of liquidity risk may include low trading volumes, large positions and heavy redemptions of Portfolio shares. Over recent years, liquidity risk has also increased because the capacity of dealers in the secondary market for fixed-income securities to make markets in these securities has decreased, even as the overall bond market has grown significantly, due to, among other things, structural changes, additional regulatory requirements and capital and risk restraints that have led to reduced inventories. Liquidity risk may be higher in a rising interest rate environment, when the value and liquidity of fixed-income securities generally decline.
Indemnification Risk—In the ordinary course of business, the Portfolio enters into contracts that contain a variety of indemnifications. The Portfolio’s maximum exposure under these arrangements is unknown. However, the Portfolio has not had prior claims or losses pursuant to these indemnification provisions and expects the risk of loss thereunder to be remote. Therefore, the Portfolio has not accrued any liability in connection with these indemnification provisions.
| 96 | • AB HIGH YIELD PORTFOLIO |
Notes to Financial Statements
NOTE G
Joint Credit Facility
A number of open-end mutual funds managed by the Adviser, including the Portfolio, participate in a $280 million revolving credit facility (the “Facility”) intended to provide short-term financing, if necessary, subject to certain restrictions in connection with abnormal redemption activity. Commitment fees related to the Facility are paid by the participating funds and are included in miscellaneous expenses in the statement of operations. The Portfolio did not utilize the Facility during the period ended October 31, 2016.
NOTE H
Distributions to Shareholders
The tax character of distributions paid during the fiscal period ended October 31, 2016, year ended August 31, 2016 and year ended August 31, 2015 were as follows:
| October 2016 | August 2016 | August 2015 | ||||||||||
Distributions paid from: | ||||||||||||
Ordinary income | $ | 636,717 | $ | 17,740,058 | $ | 24,694,123 | ||||||
|
|
|
|
|
| |||||||
Total taxable distributions paid | $ | 636,717 | $ | 17,740,058 | $ | 24,694,123 | ||||||
|
|
|
|
|
| |||||||
As of October 31, 2016, the components of accumulated earnings/(deficit) on a tax basis were as follows:
Undistributed ordinary income | $ | 211,079 | ||
Accumulated capital and other losses | (22,535,343 | )(a) | ||
Unrealized appreciation/(depreciation) | (1,332,781 | )(b) | ||
|
| |||
Total accumulated earnings/(deficit) | $ | (23,657,045 | )(c) | |
|
|
| (a) | As of October 31, 2016, the Portfolio had net capital loss carryforward of $22,535,343. |
| (b) | The differences between book-basis and tax-basis unrealized appreciation/(depreciation) are attributable primarily to the tax deferral of losses on wash sales, the tax treatment of swaps and the realization for tax purposes of gains/losses on certain derivative instruments. |
| (c) | The differences between book-basis and tax-basis components of accumulated earnings/ (deficit) are attributable primarily to the tax treatment of defaulted securities and dividends payable. |
For tax purposes, net capital losses may be carried over to offset future capital gains, if any. Funds are permitted to carry forward capital losses incurred in taxable years beginning after December 22, 2010 for an indefinite period. These postenactment capital losses must be utilized prior to the pre-enactment capital losses, which are subject to expiration. Post-enactment capital loss carryforwards will retain their character as either short-term or long-term capital losses rather than being considered short-term as under previous regulation. As of October 31, 2016, the Portfolio had a net short-term capital loss carryforward of $6,348,256, and a net long-term capital loss of $3,720,194 which may be carried forward for an indefinite period. The utilization of some of these losses could potentially be subject to merger related limitations under the Internal Revenue Code. The fund also has a net pre-enactment short term capital loss carryforward of $12,466,893 which will expire in 2017.
| AB HIGH YIELD PORTFOLIO • | 97 |
Notes to Financial Statements
During the current fiscal year, permanent differences primarily due to the tax treatment of swaps, reclassifications of foreign currency and paydown gains/losses, and the tax treatment of proceeds from the sale of defaulted securities resulted in a net decrease in undistributed net investment income, a net decrease in accumulated net realized loss on investment and foreign currency transactions, and a net decrease in additional paid-in capital. These reclassifications had no effect on net assets.
NOTE I
Merger and Reorganization
At a meeting held May 3-5, 2016, the Board, on behalf of the Portfolio, and the Board of Trustees of the Accounting Survivor, approved the Reorganization Agreement providing for the tax-free acquisition by the Portfolio of the assets and liabilities of the Accounting Survivor. The acquisition was completed at the close of business July 26, 2016. The Portfolio’s fiscal year end changed to October 31, effective in 2016. Pursuant to the Reorganization Agreement, the assets and liabilities of the Accounting Survivor’s shares were transferred in exchange for the Portfolio’s Class Z shares, in a tax-free exchange as follows:
| Shares outstanding before the Reorganization | Shares outstanding immediately after the Reorganization | Aggregate net assets before the Reorganization | Aggregate net assets immediately after the Reorganization | |||||||||||||
Accounting Survivor | 7,254,378 | – 0 | – | $ | 68,233,326 | + | $ | – 0 | – | |||||||
The Portfolio | 2,097,920 | 9,387,795 | $ | 19,642,348 | ++ | $ | 87,875,674 | |||||||||
| + | Includes undistributed net investment income of $404,396 and unrealized depreciation on investments of $1,497,163, with a fair value of $60,408,577 and identified cost of $61,905,740. |
| ++ | Includes unrealized depreciation of $370,906. |
For financial reporting purposes, assets received and shares issued by the Portfolio were recorded at fair value; however, the cost basis of the investments received from the Accounting Survivor was carried forward to align ongoing reporting of the Portfolio’s realized and unrealized gains and losses with amounts distributable to shareholders for tax purposes.
NOTE J
New Accounting Pronouncements
In May 2015, the Financial Accounting Standards Board issued an Accounting Standards Update, ASU 2015-07 (the “ASU”) which removes the requirement to categorize within the fair value hierarchy all investments for which fair value is measured using the net asset value per share practical expedient. The ASU also removes the requirement to make certain disclosures for investments that are eligible to be measured
| 98 | • AB HIGH YIELD PORTFOLIO |
Notes to Financial Statements
at fair value using the net asset value per share practical expedient but do not utilize that practical expedient. The ASU is effective for annual periods beginning after December 15, 2015 and interim periods within those annual periods. Management has evaluated the implications of these changes and there will be no impact to the financial statements.
NOTE K
Other
In October 2016, the U.S. Securities and Exchange Commission adopted new rules and amended existing rules (together, “final rules”) intended to modernize the reporting and disclosure of information by registered investment companies. In part, the final rules amend Regulation S-X and require standardized, enhanced disclosure about derivatives in investment company financial statements, as well as other amendments. The compliance date for the amendments to Regulation S-X is August 1, 2017. Management is currently evaluating the impact that the adoption of the amendments to Regulation S-X will have on the financial statements and related disclosures.
NOTE L
Subsequent Events
Management has evaluated subsequent events for possible recognition or disclosure in the financial statements through the date the financial statements are issued. Management has determined that there are no material events that would require disclosure in the Portfolio’s financial statements through this date.
| AB HIGH YIELD PORTFOLIO • | 99 |
Notes to Financial Statements
FINANCIAL HIGHLIGHTS
Selected Data For A Share Of Capital Stock Outstanding Throughout Each Period
| Class A | ||||||||
| September 1, 2016 to October 31, 2016(a) | July 26, 2016(b) to August 31, 2016 | |||||||
|
| |||||||
Net asset value, beginning of period | $ 9.44 | $ 9.36 | ||||||
|
| |||||||
Income From Investment Operations | ||||||||
Net investment income(c)(d) | .08 | # | .05 | |||||
Net realized and unrealized gain on investment and foreign currency transactions | .01 | .07 | † | |||||
|
| |||||||
Net increase in net asset value from operations | .09 | .12 | ||||||
|
| |||||||
Less: Dividends | ||||||||
Dividends from net investment income | (.07 | ) | (.04 | ) | ||||
|
| |||||||
Net asset value, end of period | $ 9.46 | $ 9.44 | ||||||
|
| |||||||
Total Return | ||||||||
Total investment return based on net asset value(e) | 0.90 | %# | 1.33 | % | ||||
Ratios/Supplemental Data | ||||||||
Net assets, end of period (000’s omitted) | $1,186 | $1,000 | ||||||
Ratio to average net assets of: | ||||||||
Expenses, net of waivers/reimbursements(f)^ | 1.03 | %(g) | 1.06 | % | ||||
Expenses, before waivers/reimbursements(f)^ | 3.25 | %(g) | 2.71 | % | ||||
Net investment income(d)^ | 4.81 | %# | 5.13 | % | ||||
Portfolio turnover rate | 9 | % | 44 | % | ||||
See footnote summary on pages 107-108.
| 100 | • AB HIGH YIELD PORTFOLIO |
Financial Highlights
Selected Data For A Share Of Capital Stock Outstanding Throughout Each Period
| Class C | ||||||||
September 1, 2016 to October 31, 2016(a) | July 26, 2016(b) to August 31, 2016 | |||||||
|
| |||||||
Net asset value, beginning of period | $ 9.44 | $ 9.36 | ||||||
|
| |||||||
Income From Investment Operations | ||||||||
Net investment income(c)(d) | .06 | # | .04 | |||||
Net realized and unrealized gain on investment and foreign currency transactions | .01 | .08 | † | |||||
|
| |||||||
Net increase in net asset value from operations | .07 | .12 | ||||||
|
| |||||||
Less: Dividends | ||||||||
Dividends from net investment income | (.05 | ) | (.04 | ) | ||||
|
| |||||||
Net asset value, end of period | $ 9.46 | $ 9.44 | ||||||
|
| |||||||
Total Return | ||||||||
Total investment return based on net asset value(e) | .78 | %# | 1.25 | % | ||||
Ratios/Supplemental Data | ||||||||
Net assets, end of period (000’s omitted) | $368 | $188 | ||||||
Ratio to average net assets of: | ||||||||
Expenses, net of waivers/reimbursements(f)^ | 1.78 | %(g) | 1.81 | % | ||||
Expenses, before waivers/reimbursements(f)^ | 4.29 | %(g) | 3.47 | % | ||||
Net investment income(d)^ | 4.15 | %# | 4.36 | % | ||||
Portfolio turnover rate | 9 | % | 44 | % | ||||
See footnote summary on pages 107-108.
| AB HIGH YIELD PORTFOLIO • | 101 |
Financial Highlights
Selected Data For A Share Of Capital Stock Outstanding Throughout Each Period
| Advisor Class | ||||||||
September 1, 2016 to October 31, 2016(a) | July 26, 2016(b) to August 31, 2016 | |||||||
|
| |||||||
Net asset value, beginning of period | $ 9.44 | $ 9.36 | ||||||
|
| |||||||
Income From Investment Operations | ||||||||
Net investment income(c)(d) | .08 | # | .05 | |||||
Net realized and unrealized gain on investment and foreign currency transactions | .01 | .08 | † | |||||
|
| |||||||
Net increase in net asset value from operations | .09 | .13 | ||||||
|
| |||||||
Less: Dividends | ||||||||
Dividends from net investment income | (.07 | ) | (.05 | ) | ||||
|
| |||||||
Net asset value, end of period | $ 9.46 | $ 9.44 | ||||||
|
| |||||||
Total Return | ||||||||
Total investment return based on net asset value(e) | .94 | %‡# | 1.35 | % | ||||
Ratios/Supplemental Data | ||||||||
Net assets, end of period (000’s omitted) | $2,733 | $2,063 | ||||||
Ratio to average net assets of: | ||||||||
Expenses, net of waivers/reimbursements(f)^ | .78 | %(g) | .81 | % | ||||
Expenses, before waivers/reimbursements(f)^ | 3.18 | %(g) | 2.41 | % | ||||
Net investment income(d)^ | 4.90 | %# | 5.30 | % | ||||
Portfolio turnover rate | 9 | % | 44 | % | ||||
See footnote summary on pages 107-108.
| 102 | • AB HIGH YIELD PORTFOLIO |
Financial Highlights
Selected Data For A Share Of Capital Stock Outstanding Throughout Each Period
| Class R | ||||||||
| September 1, 2016 to October 31, 2016(a) | July 26, 2016(b) to August 31, 2016 | |||||||
|
| |||||||
Net asset value, beginning of period | $ 9.44 | $ 9.36 | ||||||
|
| |||||||
Income From Investment Operations | ||||||||
Net investment income(c)(d) | .07 | # | .04 | |||||
Net realized and unrealized gain on investment and foreign currency transactions | .01 | .08 | † | |||||
|
| |||||||
Net increase in net asset value from operations | .08 | .12 | ||||||
|
| |||||||
Less: Dividends | ||||||||
Dividends from net investment income | (.06 | ) | (.04 | ) | ||||
|
| |||||||
Net asset value, end of period | $ 9.46 | $ 9.44 | ||||||
|
| |||||||
Total Return | ||||||||
Total investment return based on net asset value(e) | .86 | %‡# | 1.30 | % | ||||
Ratios/Supplemental Data | ||||||||
Net assets, end of period (000’s omitted) | $31 | $30 | ||||||
Ratio to average net assets of: | ||||||||
Expenses, net of waivers/reimbursements(f)^ | 1.28 | %(g) | 1.30 | % | ||||
Expenses, before waivers/reimbursements(f)^ | 3.14 | %(g) | 2.70 | % | ||||
Net investment income(d)^ | 4.48 | %# | 4.80 | % | ||||
Portfolio turnover rate | 9 | % | 44 | % | ||||
See footnote summary on pages 107-108.
| AB HIGH YIELD PORTFOLIO • | 103 |
Financial Highlights
Selected Data For A Share Of Capital Stock Outstanding Throughout Each Period
| Class K | ||||||||
| September 1, 2016 to October 31, 2016(a) | July 26, 2016(b) to August 31, 2016 | |||||||
|
| |||||||
Net asset value, beginning of period | $ 9.44 | $ 9.36 | ||||||
|
| |||||||
Income From Investment Operations | ||||||||
Net investment income(c)(d) | .08 | # | .05 | |||||
Net realized and unrealized gain on investment and foreign currency transactions | .01 | .07 | † | |||||
|
| |||||||
Net increase in net asset value from operations | .09 | .12 | ||||||
|
| |||||||
Less: Dividends | ||||||||
Dividends from net investment income | (.07 | ) | (.04 | ) | ||||
|
| |||||||
Net asset value, end of period | $ 9.46 | $ 9.44 | ||||||
|
| |||||||
Total Return | ||||||||
Total investment return based on net asset value(e) | .91 | %‡# | 1.33 | % | ||||
Ratios/Supplemental Data | ||||||||
Net assets, end of period (000’s omitted) | $9 | $9 | ||||||
Ratio to average net assets of: | ||||||||
Expenses, net of waivers/reimbursements(f)^ | 1.03 | %(g) | 1.05 | % | ||||
Expenses, before waivers/reimbursements(f)^ | 2.67 | %(g) | 2.38 | % | ||||
Net investment income(d)^ | 4.74 | %# | 5.12 | % | ||||
Portfolio turnover rate | 9 | % | 44 | % | ||||
See footnote summary on pages 107-108.
| 104 | • AB HIGH YIELD PORTFOLIO |
Financial Highlights
Selected Data For A Share Of Capital Stock Outstanding Throughout Each Period
| Class I | ||||||||
September 1, 2016 to October 31, 2016(a) | July 26, 2016(b) to August 31, 2016 | |||||||
|
| |||||||
Net asset value, beginning of period | $ 9.44 | $ 9.36 | ||||||
|
| |||||||
Income From Investment Operations | ||||||||
Net investment income(c)(d) | .08 | # | .05 | |||||
Net realized and unrealized gain on investment and foreign currency transactions | .01 | .08 | † | |||||
|
| |||||||
Net increase in net asset value from operations | .09 | .13 | ||||||
|
| |||||||
Less: Dividends | ||||||||
Dividends from net investment income | (.07 | ) | (.05 | ) | ||||
|
| |||||||
Net asset value, end of period | $ 9.46 | $ 9.44 | ||||||
|
| |||||||
Total Return | ||||||||
Total investment return based on net asset value(e) | .94 | %‡# | 1.35 | % | ||||
Ratios/Supplemental Data | ||||||||
Net assets, end of period (000’s omitted) | $16,936 | $16,899 | ||||||
Ratio to average net assets of: | ||||||||
Expenses, net of waivers/reimbursements(f)^ | .78 | %(g) | .81 | % | ||||
Expenses, before waivers/reimbursements(f)^ | 2.39 | %(g) | 2.06 | % | ||||
Net investment income(d)^ | 4.97 | %# | 5.38 | % | ||||
Portfolio turnover rate | 9 | % | 44 | % | ||||
See footnote summary on pages 107-108.
| AB HIGH YIELD PORTFOLIO • | 105 |
Financial Highlights
Selected Data For A Share Of Capital Stock Outstanding Throughout Each Period
| Class Z | ||||||||||||||||||||||||
September 1, 2016 to October 31, 2016(a) | Year Ended August 31, | |||||||||||||||||||||||
| 2016(h) | 2015(h) | 2014(h) | 2013(h) | 2012(h) | ||||||||||||||||||||
|
| |||||||||||||||||||||||
Net asset value, beginning of period | $ 9.43 | $ 9.87 | $ 10.85 | $ 10.33 | $ 10.26 | $ 9.66 | ||||||||||||||||||
|
| |||||||||||||||||||||||
Income From Investment Operations | ||||||||||||||||||||||||
Net investment income(c) | .08 | (d)# | .60 | (d) | .67 | .72 | .75 | .76 | ||||||||||||||||
Net realized and unrealized gain (loss) on investment and foreign currency transactions | .01 | (.04 | ) | (.91 | )† | .53 | † | .18 | † | .53 | † | |||||||||||||
|
| |||||||||||||||||||||||
Net increase (decrease) in net asset value from operations | .09 | .56 | (.24 | ) | 1.25 | .93 | 1.29 | |||||||||||||||||
|
| |||||||||||||||||||||||
Less: Dividends | ||||||||||||||||||||||||
Dividends from net investment income | (.07 | ) | (1.00 | ) | (.74 | ) | (.73 | ) | (.86 | ) | (.69 | ) | ||||||||||||
|
| |||||||||||||||||||||||
Net asset value, end of period | $ 9.45 | $ 9.43 | $ 9.87 | $ 10.85 | $ 10.33 | $ 10.26 | ||||||||||||||||||
|
| |||||||||||||||||||||||
Total Return | ||||||||||||||||||||||||
Total investment return based on net asset value(e) | .94 | %‡# | 6.19 | %* | (2.27 | )%* | 12.44 | % | 9.24 | % | 13.95 | % | ||||||||||||
Ratios/Supplemental Data | ||||||||||||||||||||||||
Net assets, end of period (000’s omitted) | $65,177 | $67,780 | $322,839 | $364,934 | $366,553 | $397,208 | ||||||||||||||||||
Ratio to average net assets of: | ||||||||||||||||||||||||
Expenses, net of waivers/reimbursements | .78 | %(f)(g)^ | .25 | %(f) | .13 | % | .11 | % | .09 | %(f) | .07 | % | ||||||||||||
Expenses, before waivers/reimbursements | 2.39 | %(f)(g)^ | .30 | %(f) | .13 | % | .11 | % | .09 | %(f) | .07 | % | ||||||||||||
Net investment income | 4.96 | %(d)^# | 6.41 | %(d) | 6.45 | % | 6.68 | % | 7.15 | % | 7.87 | % | ||||||||||||
Portfolio turnover rate | 9 | % | 44 | % | 51 | % | 54 | % | 63 | % | 57 | % | ||||||||||||
See footnote summary on pages 107-108.
| 106 | • AB HIGH YIELD PORTFOLIO |
Financial Highlights
| (a) | The Portfolio changed its fiscal year end from August 31 to October 31. |
| (b) | Inception date. |
| (c) | Based on average shares outstanding. |
| (d) | Net of fees and expenses waived and reimbursed by the Adviser. |
| (e) | Total investment return is calculated assuming an initial investment made at the net asset value at the beginning of the period, reinvestment of all dividends and distributions at net asset value during the period, and redemption on the last day of the period. Initial sales charges or contingent deferred sales charges are not reflected in the calculation of total investment return. Total return does not reflect the deduction of taxes that a shareholder would pay on fund distributions or the redemption of fund shares. Total investment return calculated for a period of less than one year is not annualized. |
| (f) | The expense ratios presented below exclude interest expense: |
| September 1, 2016 to October 31, 2016(a) | Year Ended August 31, | |||||||||||||||||||||||
| 2016 | 2015 | 2014 | 2013 | 2012 | ||||||||||||||||||||
Class A | ||||||||||||||||||||||||
Net of waivers/reimbursements^ | N/A | 1.05 | % | |||||||||||||||||||||
Before waivers/reimbursements^ | N/A | 2.70 | % | |||||||||||||||||||||
Class C | ||||||||||||||||||||||||
Net of waivers/reimbursements^ | N/A | 1.80 | % | |||||||||||||||||||||
Before waivers/reimbursements^ | N/A | 3.46 | % | |||||||||||||||||||||
Advisor Class | ||||||||||||||||||||||||
Net of waivers/reimbursements^ | N/A | .80 | % | |||||||||||||||||||||
Before waivers/reimbursements^ | N/A | 2.40 | % | |||||||||||||||||||||
Class R | ||||||||||||||||||||||||
Net of waivers/reimbursements^ | N/A | 1.30 | % | |||||||||||||||||||||
Before waivers/reimbursements^ | N/A | 2.70 | % | |||||||||||||||||||||
Class K | ||||||||||||||||||||||||
Net of waivers/reimbursements^ | N/A | 1.05 | % | |||||||||||||||||||||
Before waivers/reimbursements^ | N/A | 2.38 | % | |||||||||||||||||||||
Class I | ||||||||||||||||||||||||
Net of waivers/reimbursements^ | N/A | .80 | % | |||||||||||||||||||||
Before waivers/reimbursements^ | N/A | 2.06 | % | |||||||||||||||||||||
Class Z | ||||||||||||||||||||||||
Net of waivers/reimbursements | N/A | .25 | % | N/A | N/A | .09 | % | N/A | ||||||||||||||||
Before waivers/reimbursements | N/A | .29 | % | N/A | N/A | .09 | % | N/A | ||||||||||||||||
| AB HIGH YIELD PORTFOLIO • | 107 |
Financial Highlights
| (g) | Expense ratios do not include expenses of the AB mutual funds in which the Portfolio invests. For the period shown below, the acquired fund fees of the AB mutual funds was as follow: |
September 1, 2016 to October 31, 2016(a) |
.02% |
| (h) | On the date of Reorganization, the accounting and performance history of the Accounting Survivor was retained as that of the Portfolio (see Note A). As a result, the per share table has been adjusted for the prior periods presented to reflect the transaction. The conversion ratio used was 1.00489316, as the Accounting Survivor’s NAV was $9.4058 while the Portfolio’s NAV was $9.36 on the date of Reorganization. |
| † | Due to timing of sales and repurchase of capital shares, the net realized and unrealized gain (loss) per share is not in accord with the Portfolio’s change in net realized and unrealized gain (loss) on investment transactions for the period. |
| ^ | Annualized. |
| * | Includes the impact of proceeds received and credited to the Portfolio resulting from class action settlements, which enhanced the Portfolio’s performance for the years ended August 31, 2016 and August 31, 2015 by 0.02% and 0.09%, respectively. |
| ‡ | The net asset value and total return include adjustments in accordance with accounting principles generally accepted in the United States of America for financial reporting purposes. As such, the net asset value and total return for shareholder transactions may differ from financial statements. |
| # | For the period ended October 31, 2016 the amount includes a non-recurring refund for overbilling of prior years’ custody out of pocket fees as follows: |
Net Investment | Net Investment | Total | ||
$.003 | .20% | .03% |
See notes to financial statements.
| 108 | • AB HIGH YIELD PORTFOLIO |
Financial Highlights
REPORT OF INDEPENDENT REGISTERED
PUBLIC ACCOUNTING FIRM
To the Board of Directors and Shareholders of AB High Yield Portfolio
We have audited the accompanying statement of assets and liabilities, including the portfolio of investments, of AB High Yield Portfolio (the “Fund”), one of the portfolios constituting the AB Bond Fund, Inc., as of October 31, 2016, and the related statements of operations for the period September 1, 2016 to October 31, 2016 and the year ended August 31, 2016, the statements of changes in net assets for the period September 1, 2016 to October 31, 2016 and each of the two years in the period ended August 31, 2016, and the financial highlights for each of the periods indicated therein. These financial statements and financial highlights are the responsibility of the Fund’s management. Our responsibility is to express an opinion on these financial statements and financial highlights based on our audit.
We conducted our audit in accordance with the standards of the Public Company Accounting Oversight Board (United States). Those standards require that we plan and perform the audit to obtain reasonable assurance about whether the financial statements and financial highlights are free of material misstatement. We were not engaged to perform an audit of the Fund’s internal control over financial reporting. Our audit included consideration of internal control over financial reporting as a basis for designing audit procedures that are appropriate in the circumstances, but not for the purpose of expressing an opinion on the effectiveness of the Fund’s internal control over financial reporting. Accordingly, we express no such opinion. An audit also includes examining, on a test basis, evidence supporting the amounts and disclosures in the financial statements and financial highlights, assessing the accounting principles used and significant estimates made by management, and evaluating the overall financial statement presentation. Our procedures included confirmation of securities owned as of October 31, 2016, by correspondence with the custodian and others or by other appropriate auditing procedures where replies from others were not received. We believe that our audit provides a reasonable basis for our opinion.
In our opinion, the financial statements and financial highlights referred to above present fairly, in all material respects, the financial position of AB High Yield Portfolio, one of the portfolios constituting the AB Bond Fund, Inc., at October 31, 2016, and the results of its operations for the period September 1, 2016 to October 31, 2016 and the year ended August 31, 2016, the changes in its net assets for the period September 1, 2016 to October 31, 2016 and each of the two years in the period ended August 31, 2016, and the financial highlights for each of the periods indicated therein, in conformity with U.S. generally accepted accounting principles.

New York, New York
December 30, 2016
| AB HIGH YIELD PORTFOLIO • | 109 |
Report of Independent Registered Public Accounting Firm
2016 FEDERAL TAX INFORMATION
(unaudited)
For Federal income tax purposes, the following information is furnished with respect to the distributions paid by the Portfolio during the taxable year ended October 31, 2016. For corporate shareholders, 1.38% of dividends paid qualify for the dividends received deduction. For foreign shareholders, 66.89% of ordinary income dividends paid may be considered to be qualifying to be taxed as interest-related dividends.
For the taxable year ended October 31, 2016, the Portfolio designates $29,740 as the maximum amount that may be considered qualified dividend income for individual shareholders.
Shareholders should not use the above information to prepare their income tax returns. The information necessary to complete your income tax returns will be included with your Form 1099-DIV which will be sent to you separately in January 2017.
| 110 | • AB HIGH YIELD PORTFOLIO |
BOARD OF DIRECTORS
Marshall C. Turner, Jr.(1) , Chairman John H. Dobkin(1) Michael J. Downey(1) William H. Foulk, Jr.(1) D. James Guzy(1) | Nancy P. Jacklin(1) Robert M. Keith, President and Chief Executive Officer Carol C. McMullen(1) Garry L. Moody(1) Earl D. Weiner(1) |
OFFICERS
Philip L. Kirstein, Senior Vice President and Independent Compliance Officer Gershon M. Distenfeld(2) , Vice President Sherif M. Hamid(2) , Vice President Douglas J. Peebles(2) , Vice President | Ivan Rudolph-Shabinsky(2), Vice President Ashish C. Shah(2), Vice President Joseph J. Mantineo, Treasurer and Chief Financial Officer Emilie D. Wrapp, Secretary Stephen M. Woetzel, Controller Vincent S. Noto, Chief Compliance Officer |
Custodian and Accounting Agent Brown Brothers Harriman & Co. 50 Post Office Square Boston, MA 02110
Principal Underwriter AllianceBernstein Investments, Inc. 1345 Avenue of the Americas New York, NY 10105
Transfer Agent AllianceBernstein Investor Services, Inc. P.O. Box 786003 San Antonio, TX 78278-6003 Toll-Free (800) 221-5672 | Independent Registered Public Accounting Firm Ernst & Young LLP 5 Times Square New York, NY 10036
Legal Counsel Seward & Kissel LLP One Battery Park Plaza New York, NY 10004 |
| (1) | Member of the Audit Committee, the Governance and Nominating Committee and the Independent Directors Committee. |
| (2) | The day-to-day management of, and investment decisions for, the Fund are made by the High Yield Investment Team. Messrs. Distenfeld, Hamid, Peebles, Rudolph-Shabinksy and Shah are the investment professionals with the most significant responsibility for the day-to-day management of the Fund’s portfolio. |
| AB HIGH YIELD PORTFOLIO • | 111 |
Board of Directors
MANAGEMENT OF THE FUND
NAME, ADDRESS*, AGE, (YEAR FIRST ELECTED**) | PRINCIPAL OCCUPATION(S) DURING PAST FIVE YEARS AND OTHER INFORMATION*** | PORTFOLIOS IN FUND COMPLEX OVERSEEN BY DIRECTOR | OTHER PUBLIC DIRECTORSHIP CURRENTLY HELD BY DIRECTOR | |||||
| INTERESTED DIRECTOR | ||||||||
Robert M. Keith, + 1345 Avenue of the Americas New York, NY 10105 56 (2014) | Senior Vice President of AllianceBernstein L.P. (the “Adviser”) and the head of AllianceBernstein Investments, Inc. (“ABI”) since July 2008; Director of ABI and President of the AB Mutual Funds. Previously, he served as Executive Managing Director of ABI from December 2006 to June 2008. Prior to joining ABI in 2006, Executive Managing Director of Bernstein Global Wealth Management, and prior thereto, Senior Managing Director and Global Head of Client Service and Sales of the Adviser’s institutional investment management business since 2004. Prior thereto, he was Managing Director and Head of North American Client Service and Sales in the Adviser’s institutional investment management business, with which he had been associated since prior to 2004. | 108 | None | |||||
| 112 | • AB HIGH YIELD PORTFOLIO |
Management of the Fund
NAME, ADDRESS*, AGE, (YEAR FIRST ELECTED**) | PRINCIPAL OCCUPATION(S) DURING PAST FIVE YEARS AND OTHER | PORTFOLIOS IN FUND COMPLEX OVERSEEN BY DIRECTOR | OTHER PUBLIC DIRECTORSHIP CURRENTLY HELD BY DIRECTOR | |||||
| DISINTERESTED DIRECTORS | ||||||||
Marshall C. Turner, Jr.# Chairman of the Board 75 (2014) | Private Investor since prior to 2011. Former Chairman and CEO of Dupont Photomasks, Inc. (components of semi-conductor manufacturing). He has extensive operating leadership and venture capital investing experience, including five interim or full-time CEO roles, and prior service as general partner of institutional venture capital partnerships. He also has extensive non-profit board leadership experience, and currently serves on the boards of two education and science-related non-profit organizations. He has served as a director of one AB Fund since 1992, and director or trustee of multiple AB Funds since 2005. He has been Chairman of the AB Funds since January 2014, and the Chairman of the Independent Directors Committees of such AB Funds since February 2014. | 108 | Xilinx, Inc. (programmable logic semi- conductors) since 2007 | |||||
John H. Dobkin, # 74 (2014) | Independent Consultant since prior to 2011. Formerly, President of Save Venice, Inc. (preservation organization) from 2001–2002; Senior Advisor from June 1999-June 2000 and President of Historic Hudson Valley (historic preservation) from December 1989-May 1999. Previously, Director of the National Academy of Design. He has served as a director or trustee of various AB Funds since 1992, and as Chairman of the Audit Committees of a number of such AB Funds from 2001-2008. | 108 | None | |||||
| AB HIGH YIELD PORTFOLIO • | 113 |
Management of the Fund
NAME, ADDRESS*, AGE, (YEAR FIRST ELECTED**) | PRINCIPAL OCCUPATION(S) DURING PAST FIVE YEARS AND OTHER | PORTFOLIOS IN FUND COMPLEX OVERSEEN BY DIRECTOR | OTHER PUBLIC DIRECTORSHIP CURRENTLY DIRECTOR | |||||
| DISINTERESTED DIRECTORS (continued) | ||||||||
Michael J. Downey, # 72 (2014) | Private Investor since prior to 2011. Formerly, managing partner of Lexington Capital, LLC (investment advisory firm) from December 1997 until December 2003. He served as a Director of Prospect Acquisition Corp. (financial services) from 2007 until 2009. From 1987 until 1993, Chairman and CEO of Prudential Mutual Fund Management, director of the Prudential mutual funds, and member of the Executive Committee of Prudential Securities Inc. He has served as a director or trustee of the AB Funds since 2005 and is a director and Chairman of one other registered investment company. | 108 | Asia Pacific Fund, Inc. (registered investment company) since prior to 2011 | |||||
William H. Foulk, Jr., # 84 (2014) | Investment Adviser and an Independent Consultant since prior to 2011. Previously, he was Senior Manager of Barrett Associates, Inc., a registered investment adviser. He was formerly Deputy Comptroller and Chief Investment Officer of the State of New York and, prior thereto, Chief Investment Officer of the New York Bank for Savings. He has served as a director or trustee of various AB Funds since 1983, and was Chairman of the Independent Directors Committees of the AB Funds from 2003 until early February 2014. He served as Chairman of such AB Funds from 2003 through December 2013. He is also active in a number of mutual fund related organizations and committees. | 108 | None | |||||
| 114 | • AB HIGH YIELD PORTFOLIO |
Management of the Fund
NAME, ADDRESS*, AGE, (YEAR FIRST ELECTED**) | PRINCIPAL OCCUPATION(S) DURING PAST FIVE YEARS AND OTHER | PORTFOLIOS IN FUND COMPLEX OVERSEEN BY DIRECTOR | OTHER PUBLIC DIRECTORSHIP CURRENTLY HELD BY DIRECTOR | |||||
| DISINTERESTED DIRECTORS (continued) | ||||||||
D. James Guzy, # 80 (2014) | Chairman of the Board of SRC Computers, Inc. (semi-conductors), with which he has been associated since prior to 2011. He served as Chairman of the Board of PLX Technology (semi-conductors) since prior to 2011 until November 2013. He was a director of Intel Corporation (semi-conductors) from 1969 until 2008, and served as Chairman of the Finance Committee of such company for several years until May 2008. He has served as a director or trustee of one or more of the AB Funds since 1982. | 108 | None | |||||
Nancy P. Jacklin, # 68 (2014) | Private Investor since prior to 2011. Professorial Lecturer at the Johns Hopkins School of Advanced International Studies (2008-2015). U.S. Executive Director of the International Monetary Fund (which is responsible for ensuring the stability of the international monetary system), (December 2002-May 2006); Partner, Clifford Chance (1992-2002); Sector Counsel, International Banking and Finance, and Associate General Counsel, Citicorp (1985-1992); Assistant General Counsel (International), Federal Reserve Board of Governors (1982-1985); and Attorney Advisor, U.S. Department of the Treasury (1973-1982). Member of the Bar of the District of Columbia and of New York; and member of the Council on Foreign Relations. She has served as a director or trustee of the AB Funds since 2006 and has been Chairman of the Governance and Nominating Committees of the AB Funds since August 2014. | 108 | None | |||||
| AB HIGH YIELD PORTFOLIO • | 115 |
Management of the Fund
NAME, ADDRESS*, AGE, (YEAR FIRST ELECTED**) | PRINCIPAL OCCUPATION(S) DURING PAST FIVE YEARS AND OTHER | PORTFOLIOS IN FUND COMPLEX OVERSEEN BY DIRECTOR | OTHER PUBLIC DIRECTORSHIP CURRENTLY HELD BY DIRECTOR | |||||
| DISINTERESTED DIRECTORS (continued) | ||||||||
Carol C. McMullen, # 61 (2016) | Managing Director of Slalom Consulting (consulting) since 2014 and private investor; Director of Norfolk & Dedham Group (mutual property and casualty insurance) since 2011; and Director of Partners Community Physicians Organization (healthcare) since 2014. Formerly, Managing Director of The Crossland Group (consulting) from 2012 to 2013. She has held a number of senior positions in the asset and wealth management industries, including at Eastern Bank (where her roles included President of Eastern Wealth Management), Thomson Financial (Global Head of Sales for Investment Management), and Putnam Investments (where her roles included Head of Global Investment Research). She has served on a number of private company and nonprofit boards, and as a director or trustee of the AB Funds since June 2016. | 108 | None | |||||
| 116 | • AB HIGH YIELD PORTFOLIO |
Management of the Fund
NAME, ADDRESS*, AGE, (YEAR FIRST ELECTED**) | PRINCIPAL OCCUPATION(S) DURING PAST FIVE YEARS AND OTHER INFORMATION*** | PORTFOLIOS IN FUND COMPLEX OVERSEEN BY DIRECTOR | OTHER PUBLIC DIRECTORSHIP CURRENTLY HELD BY DIRECTOR | |||||
| DISINTERESTED DIRECTORS (continued) | ||||||||
Garry L. Moody, # 64 (2014) | Independent Consultant. Formerly, Partner, Deloitte & Touche LLP (1995-2008) where he held a number of senior positions, including Vice Chairman, and U.S. and Global Investment Management Practice Managing Partner; President, Fidelity Accounting and Custody Services Company (1993-1995) where he was responsible for accounting, pricing, custody and reporting for the Fidelity mutual funds; and Partner, Ernst & Young LLP (1975-1993), where he served as the National Director of Mutual Fund Tax Services and Managing Partner of its Chicago Office Tax department. He is a member of the Trustee Advisory Board of BoardIQ, a biweekly publication focused on issues and news affecting directors of mutual funds. He has served as a director or trustee, and as Chairman of the Audit Committees, of the AB Funds since 2008. | 108 | None | |||||
Earl D. Weiner, # 77 (2014) | Of Counsel, and Partner prior to January 2007, of the law firm Sullivan & Cromwell LLP and is a former member of the ABA Federal Regulation of Securities Committee Task Force to draft editions of the Fund Director’s Guidebook. He also serves as a director or trustee of various non-profit organizations and has served as Chairman or Vice Chairman of a number of them. He has served as a director or trustee of the AB Funds since 2007 and served as Chairman of the Governance and Nominating Committees of the AB Funds from 2007 until August 2014. | 108 | None | |||||
| AB HIGH YIELD PORTFOLIO • | 117 |
Management of the Fund
| * | The address for each of the Fund’s disinterested Directors is c/o AllianceBernstein L.P., Attention: Philip L. Kirstein, 1345 Avenue of the Americas, New York, NY 10105. |
| ** | There is no stated term of office for the Fund’s Directors. |
| *** | The information above includes each Director’s principal occupation during the last five years and other information relating to the experience, attributes and skills relevant to each Director’s qualifications to serve as a Director, which led to the conclusion that each Director should serve as a Director for the Fund. |
| + | Mr. Keith is an “interested person” of the Portfolio as defined in the Investment Company Act of 1940, due to his position as a Senior Vice President of the Adviser. |
| # | Member of the Audit Committee, the Governance and Nominating Committee and the Independent Directors Committee. |
| 118 | • AB HIGH YIELD PORTFOLIO |
Management of the Fund
Officer Information
Certain information concerning the Fund’s Officers is listed below.
| NAME, ADDRESS*, AND AGE | POSITION(S) HELD WITH FUND | PRINCIPAL OCCUPATION DURING PAST 5 YEARS | ||
Robert M. Keith 56 | President and Chief Executive Officer | See biography above. | ||
Philip L. Kirstein 71 | Senior Vice President and Independent Compliance Officer | Senior Vice President and Independent Compliance Officer of the AB Funds, with which he has been associated since October 2004. Prior thereto, he was Of Counsel to Kirkpatrick & Lockhart, LLP from October 2003 to October 2004, and General Counsel of Merrill Lynch Investment Managers, L.P. since prior to March 2003. | ||
Gershon M. Distenfeld 41 | Vice President | Senior Vice President of the Adviser**, with which he has been associated since prior to 2011. | ||
Sherif M. Hamid 41 | Vice President | Senior Vice President of the Adivser**, which he has been associated since 2013. Prior thereto, he served as head of European Credit Strategy for Barclays Capital since prior to 2011. | ||
Douglas J. Peebles, 51 | Vice President | Senior Vice President of the Adviser,** with which he has been associated since 2011. | ||
Ivan Rudolph-Shabinsky 52 | Vice President | Senior Vice President of the Adviser**, with which he has been associated since prior to 2011. | ||
Ashish C. Shah 46 | Vice President | Senior Vice President of the Adviser**, with which he has been associated since prior to 2011. | ||
Emilie D. Wrapp 61 | Secretary | Senior Vice President, Assistant General Counsel and Assistant Secretary of ABI**, with which she has been associated since prior to 2011. | ||
Joseph J. Mantineo 57 | Treasurer and Chief Financial Officer | Senior Vice President of ABIS**, with which he has been associated since prior to 2011. | ||
Vincent S. Noto 52 | Chief Compliance Officer | Senior Vice President since 2015 and Mutual Fund Chief Compliance Officer of the Adviser** since 2014. Prior thereto, he was Vice President and Director of Mutual Fund Compliance of the Adviser** since prior to 2011. | ||
Stephen M. Woetzel 45 | Controller | Vice President of ABIS**, with which he has been associated since prior to 2011. |
| AB HIGH YIELD PORTFOLIO • | 119 |
Management of the Fund
| * | The address for each of the Fund’s Officers is 1345 Avenue of the Americas, New York, NY 10105. |
| ** | The Adviser, ABI and ABIS are affiliates of the Fund. |
| The Fund’s Statement of Additional Information (“SAI”) has additional information about the Fund’s Directors and Officers and is available without charge upon request. Contact your financial representative or AB at 1-(800) 227-4618, or visit www.ABfunds.com, for a free prospectus or SAI. |
| 120 | • AB HIGH YIELD PORTFOLIO |
Management of the Fund
Information Regarding the Review and Approval of the Portfolio’s Investment Advisory Contract
The disinterested directors (the “directors”) of AB Bond Fund, Inc. (the “Fund”) unanimously approved the continuance of the Fund’s Investment Advisory Contract (the “Advisory Agreement”) with the Adviser in respect of AB High Yield Portfolio (the “Portfolio”) at a meeting held on November 3-5, 2015.
Prior to approval of the continuance of the Advisory Agreement in respect of the Portfolio, the directors had requested from the Adviser, and received and evaluated, extensive materials. They reviewed the proposed continuance of the Advisory Agreement with the Adviser and with experienced counsel who are independent of the Adviser, who advised on the relevant legal standards. The directors also reviewed an independent evaluation prepared by the Fund’s Senior Officer (who is also the Fund’s Independent Compliance Officer) of the reasonableness of the advisory fee, in which the Senior Officer concluded that the contractual fee for the Portfolio was reasonable. The directors also discussed the proposed continuance in private sessions with counsel and the Fund’s Senior Officer.
The directors considered their knowledge of the nature and quality of the services provided by the Adviser to the Portfolio gained from their experience as directors or trustees of most of the registered investment companies advised by the Adviser, their overall confidence in the Adviser’s integrity and competence they have gained from that experience, the Adviser’s initiative in identifying and raising potential issues with the directors and its responsiveness, frankness and attention to concerns raised by the directors in the past, including the Adviser’s willingness to consider and implement organizational and operational changes designed to improve investment results and the services provided to the AB Funds. The directors noted that they have four regular meetings each year, at each of which they receive presentations from the Adviser on the investment results of the Portfolio and review extensive materials and information presented by the Adviser.
The directors also considered all other factors they believed relevant, including the specific matters discussed below. In their deliberations, the directors did not identify any particular information that was all-important or controlling, and different directors may have attributed different weights to the various factors. The directors determined that the selection of the Adviser to manage the Portfolio, and the overall arrangements between the Portfolio and the Adviser, as provided in the Advisory Agreement, including the advisory fee, were fair and reasonable in light of the services performed, expenses incurred and such other matters as the directors considered relevant in the exercise of their business judgment. The material factors and conclusions that formed the basis for the directors’ determinations included the following:
Nature, Extent and Quality of Services Provided
The directors considered the scope and quality of services provided by the Adviser under the Advisory Agreement, including the quality of the
| AB HIGH YIELD PORTFOLIO • | 121 |
investment research capabilities of the Adviser and the other resources it has dedicated to performing services for the Portfolio. They also noted the professional experience and qualifications of the Portfolio’s portfolio management team and other members of the investment team and other senior personnel of the Adviser. The directors also considered that the Advisory Agreement provides that the Portfolio will reimburse the Adviser for the cost to it of providing certain clerical, accounting, administrative and other services to the Portfolio by employees of the Adviser or its affiliates. Requests for these reimbursements are made on a quarterly basis and subject to approval by the directors. Reimbursements, to the extent requested and paid, result in a higher rate of total compensation from the Portfolio to the Adviser than the fee rate stated in the Portfolio’s Advisory Agreement. The directors noted that the methodology used to determine the reimbursement amounts had been reviewed by an independent consultant retained by the Fund’s Senior Officer. The quality of administrative and other services, including the Adviser’s role in coordinating the activities of the Portfolio’s other service providers, also was considered. The directors concluded that, overall, they were satisfied with the nature, extent and quality of services provided to the Portfolio under the Advisory Agreement.
Costs of Services Provided and Profitability
The directors reviewed a schedule of the revenues, expenses and related notes indicating the profitability of the Portfolio to the Adviser for the period ended December 31, 2014 that had been prepared with an expense limitation methodology arrived at in consultation with an independent consultant retained by the Fund’s Senior Officer. The directors noted the assumptions and methods of allocation used by the Adviser in preparing fund-specific profitability data and understood that there are a number of potentially acceptable allocation methodologies for information of this type. The directors noted that the profitability information reflected all revenues and expenses of the Adviser’s relationship with the Portfolio, including those relating to its subsidiaries that provide transfer agency and distribution services to the Portfolio. The directors recognized that it is difficult to make comparisons of the profitability of the Advisory Agreement with the profitability of advisory contracts for unaffiliated funds because comparative information is not generally publicly available and is affected by numerous factors. The directors focused on the profitability of the Adviser’s relationship with the Portfolio before taxes and distribution expenses. The directors noted that the Adviser’s relationship with the Portfolio was not profitable to it in 2014.
Fall-Out Benefits
The directors considered the other benefits to the Adviser and its affiliates from their relationships with the Portfolio, including, but not limited to,
| 122 | • AB HIGH YIELD PORTFOLIO |
benefits relating to 12b-1 fees and sales charges received by the Fund’s principal underwriter (which is a wholly owned subsidiary of the Adviser) in respect of certain classes of the Portfolio’s shares and transfer agency fees paid by the Portfolio to a wholly owned subsidiary of the Adviser. The directors recognized that the Portfolio’s unprofitability to the Adviser would be exacerbated without these benefits. The directors also understood that the Adviser also might derive reputational and other benefits from its association with the Portfolio.
Investment Results
In addition to the information reviewed by the directors in connection with the meeting, the directors receive detailed performance information for the Portfolio at each regular Board meeting during the year. At the November 2015 meeting, the directors reviewed information prepared by Broadridge showing the performance of the Class A Shares of the Portfolio as compared with that of a group of similar funds selected by Broadridge (the “Performance Group”) and as compared with that of a broad array of funds selected by Broadridge (the “Performance Universe”), and information prepared by the Adviser showing the performance of the Class A Shares as compared with the Barclays U.S. High Yield Index (2% Issuer Cap) (the “Index”), in each case for the 1-year period ended July 31, 2015 and (in the case of comparisons with the Index) the period since inception (July 2014 inception). The directors noted that the Portfolio was in the 2nd quintile of the Performance Group and 3rd quintile of the Performance Universe for the 1-year period. The Portfolio lagged the Index in the 1-year period and outperformed the Index in the period since inception. Based on their review, the directors concluded that the Portfolio’s performance was satisfactory.
Advisory Fees and Other Expenses
The directors considered the advisory fee rate paid by the Portfolio to the Adviser and information prepared by Broadridge concerning advisory fee rates paid by other funds in the same Broadridge category as the Portfolio at a common asset level. The directors recognized that it is difficult to make comparisons of advisory fees because there are variations in the services that are included in the fees paid by other funds. The directors noted that, at the Portfolio’s current size, its contractual effective advisory fee rate of 60 basis points was lower than the Expense Group median. The directors noted that the expense reimbursement was 10 basis points in the Portfolio’s latest fiscal period, and that as a result the rate of total compensation received by the Adviser pursuant to the Advisory Agreement was more than the Expense Group median.
The directors also considered the advisory fees the Adviser charges non-fund clients pursuing a similar investment style. For this purpose, they
| AB HIGH YIELD PORTFOLIO • | 123 |
reviewed the relevant advisory fee information from the Adviser’s Form ADV and the evaluation from the Fund’s Senior Officer. The directors noted that the institutional fee schedule and the Portfolio’s fee schedule started at different rates and that the institutional fee schedule had breakpoints at lower asset levels. The application of the institutional fee schedule to the Portfolio’s net assets would result in a fee rate lower than the rate at the same asset level provided in the Portfolio’s Advisory Agreement. The directors noted that the Adviser may, in some cases, agree to fee rates with large institutional clients that are lower than those on the schedule reviewed by the directors and that they had previously discussed with the Adviser its policies in respect of such arrangements.
The Adviser reviewed with the directors the significantly greater scope of the services it provides to the AB Funds relative to institutional clients. The Adviser also noted that because mutual funds are constantly issuing and redeeming shares, they are more difficult to manage than an institutional account, where the assets tend to be relatively stable. In light of the substantial differences in services rendered by the Adviser to institutional clients as compared to funds such as the Portfolio, as well as the difference in fee structure, the directors considered these fee comparisons inapt and did not place significant weight on them in their deliberations.
The directors noted that the Portfolio invests in shares of exchange-traded funds (“ETFs”), subject to the restrictions and limitations of the Investment Company Act of 1940 as these may be varied as a result of exemptive orders issued by the SEC. The directors also noted that ETFs pay advisory fees pursuant to their advisory contracts, and that the Adviser had provided, and they had reviewed, information about the expense ratios of the relevant ETFs. The directors concluded, based on the Adviser’s explanation of how it uses ETFs when they are the most cost-effective way to obtain desired exposures for a fund or to temporarily “equitize” cash inflows pending purchases of underlying securities, that the advisory fee for the Portfolio would be paid for services that would be in addition to, rather than duplicative of, the services to be provided under the advisory contracts of the ETFs.
The directors also considered the total expense ratio of the Class A shares of the Portfolio in comparison to the fees and expenses of funds within two comparison groups created by Broadridge: an Expense Group and an Expense Universe. Broadridge described an Expense Group as a representative sample of funds similar to the Portfolio and an Expense Universe as a broader group than the Expense Group, consisting of all funds in the investment classification/objective with a similar load type as the Portfolio. The Class A expense ratio of the Portfolio was based on the Portfolio’s latest fiscal period and reflected fee waivers and/or expense
| 124 | • AB HIGH YIELD PORTFOLIO |
reimbursements as a result of an expense limitation agreement between the Adviser and the Fund in respect of the Portfolio. The directors noted that it was likely that the expense ratios of some of the other funds in the Portfolio’s Broadridge category also were lowered by waivers or reimbursements by those funds’ investment advisers, which in some cases might be voluntary or temporary. The directors view the expense ratio information as relevant to their evaluation of the Adviser’s services because the Adviser is responsible for coordinating services provided to the Portfolio by others.
The directors noted that the Portfolio’s total expense ratio, reflecting a cap by the Adviser, was lower than the Expense Group median and the same as the Expense Universe median. The directors concluded that the Portfolio’s expense ratio was satisfactory.
Economies of Scale
The directors noted that the advisory fee schedule for the Portfolio contains breakpoints that reduce the fee rates on assets above specified levels. The directors took into consideration prior presentations by an independent consultant on economies of scale in the mutual fund industry and for the AB Funds, and by the Adviser concerning certain of its views on economies of scale. The directors also had requested and received from the Adviser certain updates on economies of scale at the May 2015 meetings. The directors believe that economies of scale may be realized (if at all) by the Adviser across a variety of products and services, and not only in respect of a single fund. The directors noted that there is no established methodology for setting breakpoints that give effect to the fund-specific services provided by a fund’s adviser and to the economies of scale that an adviser may realize in its overall mutual fund business or those components of it which directly or indirectly affect a fund’s operations. The directors observed that in the mutual fund industry as a whole, as well as among funds similar to the Portfolio, there is no uniformity or pattern in the fees and asset levels at which breakpoints (if any) apply. The directors also noted that the advisory agreements for many funds do not have breakpoints at all. Having taken these factors into account, the directors concluded that the Portfolio’s shareholders would benefit from a sharing of economies of scale in the event the Portfolio’s net assets exceed a breakpoint in the future.
| AB HIGH YIELD PORTFOLIO • | 125 |
THIS PAGE IS NOT PART OF THE SHAREHOLDER REPORT OR THE FINANCIAL STATEMENTS
AB FAMILY OF FUNDS
US EQUITY
US Core
Core Opportunities Fund
Select US Equity Portfolio
US Growth
Concentrated Growth Fund
Discovery Growth Fund
Growth Fund
Large Cap Growth Fund
Small Cap Growth Portfolio
US Value
Discovery Value Fund
Equity Income Fund
Growth & Income Fund
Small Cap Value Portfolio
Value Fund
INTERNATIONAL/ GLOBAL EQUITY
International/Global Core
Global Core Equity Portfolio
Global Equity & Covered Call Strategy Fund
International Portfolio
International Strategic Core Portfolio
Sustainable Global Thematic Fund*
Tax-Managed International Portfolio
International/Global Growth
International Growth Fund
International/Global Value
Asia ex-Japan Equity Portfolio
International Value Fund
FIXED INCOME
Municipal
High Income Municipal Portfolio
Intermediate California Municipal Portfolio
Intermediate Diversified Municipal Portfolio
Intermediate New York Municipal Portfolio
FIXED INCOME (continued)
Municipal Bond Inflation Strategy
Tax-Aware Fixed Income Portfolio
National Portfolio
Arizona Portfolio
California Portfolio
Massachusetts Portfolio
Michigan Portfolio
Minnesota Portfolio
New Jersey Portfolio
New York Portfolio
Ohio Portfolio
Pennsylvania Portfolio
Virginia Portfolio
Taxable
Bond Inflation Strategy
Global Bond Fund
High Income Fund
High Yield Portfolio
Income Fund
Intermediate Bond Portfolio
Limited Duration High Income Portfolio
Short Duration Portfolio
ALTERNATIVES
All Market Real Return Portfolio
Credit Long/Short Portfolio
Global Real Estate Investment Fund
Long/Short Multi-Manager Fund
Multi-Manager Alternative Strategies Fund
Select US Long/Short Portfolio
Unconstrained Bond Fund
MULTI-ASSET
All Market Income Portfolio
Emerging Markets Multi-Asset Portfolio
Global Risk Allocation Fund
MULTI-ASSET (continued)
Target-Date
Multi-Manager Select Retirement Allocation Fund
Multi-Manager Select 2010 Fund
Multi-Manager Select 2015 Fund
Multi-Manager Select 2020 Fund
Multi-Manager Select 2025 Fund
Multi-Manager Select 2030 Fund
Multi-Manager Select 2035 Fund
Multi-Manager Select 2040 Fund
Multi-Manager Select 2045 Fund
Multi-Manager Select 2050 Fund
Multi-Manager Select 2055 Fund
Wealth Strategies
Balanced Wealth Strategy
Conservative Wealth Strategy
Wealth Appreciation Strategy
Tax-Managed Balanced Wealth Strategy
Tax-Managed Wealth Appreciation Strategy
CLOSED-END FUNDS
AB Multi-Manager Alternative Fund
Alliance California Municipal Income Fund
AllianceBernstein Global High Income Fund
AllianceBernstein National Municipal Income Fund
We also offer Government Exchange Reserves, which serves as the money market fund exchange vehicle for the AB mutual funds. An investment in Government Exchange Reserves is not a deposit in a bank and is not insured or guaranteed by the Federal Deposit Insurance Corporation or any other government agency. Although the Fund seeks to preserve the value of your investment at $1.00 per share, it is possible to lose money by investing in the Fund.
Investors should consider the investment objectives, risks, charges and expenses of the Fund carefully before investing. For copies of our prospectus or summary prospectus, which contain this and other information, visit us online at www.abfunds.com or contact your AB representative. Please read the prospectus and/or summary prospectus carefully before investing.
* Prior to November 1, 2016, the Fund was named Global Thematic Growth Fund.
| 126 | • AB HIGH YIELD PORTFOLIO |
AB Family of Funds
NOTES
| AB SHORT DURATION PORTFOLIO • | 127 |
NOTES
| 128 | • AB HIGH YIELD PORTFOLIO |
NOTES
| AB HIGH YIELD PORTFOLIO • | 129 |
NOTES
| 130 | • AB HIGH YIELD PORTFOLIO |
NOTES
| AB HIGH YIELD PORTFOLIO • | 131 |
NOTES
| 132 | • AB HIGH YIELD PORTFOLIO |
AB HIGH YIELD PORTFOLIO
1345 Avenue of the Americas
New York, NY 10105
800.221.5672
HY-0151-1016 
OCT 10.31.16

ANNUAL REPORT
AB INCOME FUND
Investment Products Offered
•Are Not FDIC Insured •May Lose Value •Are Not Bank Guaranteed |
Investors should consider the investment objectives, risks, charges and expenses of the Fund carefully before investing. For copies of our prospectus or summary prospectus, which contain this and other information, visit us online at www.abfunds.com or contact your AB representative. Please read the prospectus and/or summary prospectus carefully before investing.
This shareholder report must be preceded or accompanied by the Fund’s prospectus for individuals who are not current shareholders of the Fund.
You may obtain a description of the Fund’s proxy voting policies and procedures, and information regarding how the Fund voted proxies relating to portfolio securities during the most recent 12-month period ended June 30, without charge. Simply visit AB’s website at www.abfunds.com, or go to the Securities and Exchange Commission’s (the “Commission”) website at www.sec.gov, or call AB at (800) 227-4618.
The Fund files its complete schedule of portfolio holdings with the Commission for the first and third quarters of each fiscal year on Form N-Q. The Fund’s Forms N-Q are available on the Commission’s website at www.sec.gov. The Fund’s Forms N-Q may also be reviewed and copied at the Commission’s Public Reference Room in Washington, DC; information on the operation of the Public Reference Room may be obtained by calling (800) SEC-0330. AB publishes full portfolio holdings for the Fund monthly at www.abfunds.com.
AllianceBernstein Investments, Inc. (ABI) is the distributor of the AB family of mutual funds. ABI is a member of FINRA and is an affiliate of AllianceBernstein L.P., the Adviser of the funds.
The [A/B] logo is a registered service mark of AllianceBernstein and AllianceBernstein® is a registered service mark used by permission of the owner, AllianceBernstein L.P.
December 16, 2016
Annual Report
This report provides management’s discussion of fund performance for AB Income Fund (the “Fund”) for the annual reporting period ended October 31, 2016.
The Fund is newly organized. The Fund acquired the assets and liabilities of AllianceBernstein Income Fund, Inc., a closed-end fund (the “Predecessor Fund”), on April 22, 2016 (the “Reorganization”). AllianceBernstein L.P. (the “Adviser”) was the investment adviser for the Predecessor Fund, and the day-to-day management of, and investment decisions for, the Fund and the Predecessor Fund are made by the same portfolio managers. The Fund has the same investment objective as the Predecessor Fund and similar investment strategies and policies except as noted. Like the Predecessor Fund, the Fund has a principal investment strategy to normally invest at least 80% of its net assets in income-producing securities. The Fund differs from the Predecessor Fund in that the Fund has a non-fundamental policy of normally investing at least 65% of its total assets in securities of US and foreign governments, and repurchase agreements relating to US government securities, while the Predecessor Fund had a fundamental policy of investing at least 65% of its total assets in securities of the US government, and repurchase agreements relating thereto. The Fund invests at least 65% of its total assets in securities denominated in US dollars. In addition, the Fund has higher expenses
(including transfer agency and shareholder servicing fees), and a different advisory fee arrangement than the Predecessor Fund. The Fund is expected to be managed with somewhat less leverage and somewhat higher cash balances than the Predecessor Fund due to differences between an open-end fund and a closed-end fund.
Investment Objectives and Policies
The investment objective of the Fund is to seek high current income consistent with preservation of capital. The Fund pursues its objective by investing, under normal circumstances, at least 80% of its net assets in income-producing securities. The Fund also normally invests at least 65% of its total assets in securities of US and foreign governments, their agencies or instrumentalities and repurchase agreements relating to US government securities.
The Fund normally invests at least 65% of its total assets in US dollar-denominated securities. The Fund may also invest up to 35% of its total assets in non-government fixed-income securities, including corporate debt securities, non-government mortgage-backed and other asset-backed securities, certificates of deposit and commercial paper. The Fund may invest up to 35% of its net assets in below investment-grade securities (commonly known as “junk bonds”). The Fund may invest no more than 25% of its total assets in securities of issuers in any one country other than the US. The
| AB INCOME FUND • | 1 |
Fund’s investments in foreign securities may include investments in securities of emerging-market countries or of issuers in emerging markets.
The Adviser selects securities for purchase or sale based on its assessment of the securities’ risks and return characteristics as well as the securities’ impact on the overall risks and return characteristics of the Fund. In making this assessment, the Adviser takes into account various factors, including the credit quality and sensitivity to interest rates of the securities under consideration and of the Fund’s other holdings. The Fund may invest in fixed-income securities with any maturity or duration.
The Fund expects to utilize derivatives, such as options, futures contracts, forwards and swaps to a significant extent. The Fund may, for example, use credit default, interest rate and total return swaps to establish exposure to the fixed-income markets or particular fixed-income securities. Derivatives may provide a more efficient and economical exposure to market segments than direct investments, and may also be a more efficient way to alter the Fund’s exposure. The Fund may also enter into transactions such as reverse repurchase agreements that are similar to borrowings for investment purposes. The Fund’s use of derivatives and these borrowing transactions may create aggregate exposure that is substantially in excess of its net assets, effectively leveraging the Fund.
Investment Results
The table on page 8 provides performance data for the Fund and its benchmark, the Bloomberg Barclays US Aggregate Bond Index, for the six- and 12-month periods ended October 31, 2016 for Advisor Class shares; Class A and Class C shares are shown for the six-month period and period since inception ended October 31, 2016.
All share classes of the Fund outperformed the benchmark for all three periods, before sales charges. Sector allocation contributed most to relative performance in the three periods, due to an overweight position in high-yield corporates and exposures to agency risk-sharing transactions, non-agency mortgages and emerging-market corporate bonds. An overweight in US Treasuries and underweight to investment-grade corporates detracted in the three periods. Currency selection contributed in all three periods, as long positions in the Brazilian real and South African rand and an underweight in the British pound more than offset losses from a long position in the Swedish krona. In the 12-month period, a long position in the Russian ruble also contributed, while a short in the Canadian dollar detracted; in the six-month period a long in the Mexican peso also detracted.
Country allocation added modestly to relative performance in the three periods, primarily because of an overweight to Brazil. Security selection detracted in the 12-month
| 2 | • AB INCOME FUND |
period because of selections within investment-grade corporates and commercial mortgage-backed securities. Security selection contributed during the six-month period, because of selection within investment-grade corporates. Yield-curve positioning detracted in the three periods, with losses from underweights in the short and long parts of the curve, though gains from overweights to five- and 10-year maturities added to performance.
During the three periods, the Fund utilized derivatives including Treasury futures and interest rate swaps to manage the overall duration positioning of the Fund. Credit default swaps were utilized for hedging and investment purposes. The Fund utilized currency forwards to manage active currency positions as well as for hedging purposes. Purchased and written options and inflation swaps were used for hedging and non-hedging purposes.
Market Review and Investment Strategy
The Bloomberg Barclays US Aggregate Bond Index increased in absolute terms over the 12-month period ended October 31, 2016, as global growth trends and central bank action in the world’s largest economies continued to diverge. After declining through the end of 2015 and beginning of 2016, oil prices rebounded through much of the period on the back of decreased global supply—which contributed to
a rally in emerging-market debt sectors—though prices moved downward in October on the market’s rising skepticism that OPEC would reach a deal to limit crude production. Emerging-market sentiment was further boosted on positive political developments in Argentina and Brazil toward the end of the period.
In December 2015, the US Federal Reserve (the “Fed”) hiked rates for the first time in over nine years—a move that had been well-telegraphed and widely anticipated, and was generally accepted smoothly by bond investors. After some slower-than-expected US economic data through the first half of 2016, the Fed’s tone turned more hawkish in September (despite rates remaining unchanged) on the back of continued strengthening in the US labor market and growth in economic activity. In October, third quarter US GDP posted its best quarterly gain in two years (largely because of a surge in agricultural exports).
Central banks around the globe cut rates during the annual period, with some, including the Bank of Japan and the European Central Bank, dipping into negative rate territory. Volatility in Europe (and globally) spiked sharply in June after the UK voted to leave the European Union, a decision that was largely a surprise to investors. While investors initially responded by selling risk-sensitive assets, markets outside Europe quickly recovered. European markets began to stabilize as well,
| AB INCOME FUND • | 3 |
helped by the Bank of England’s first rate cut in seven years—to an historic low—and an aggressive asset-purchase program. Elsewhere, central banks in Australia and New Zealand also moved rates to record lows, while fiscal and monetary policy developments in Japan disappointed investors, who were expecting rate cuts or additional quantitative easing.
Yields in most developed markets fell in the 12-month period, with UK yields reaching historic lows in the months following the Brexit referendum in June. At the end of the period, trillions of dollars’ worth of government debt around the world lingered in negative territory. Developed-market treasuries generally outperformed emerging-market local-currency government bonds and investment-grade credit
securities, but lagged the rally in global high yield. Energy and basics were among the top performing sectors in each period, largely due to positive oil price action, while consumer-related sectors lagged the rising market.
On November 8, 2016, Donald Trump was elected as the 45th president of the United States, and the Congressional election outcome resulted in the Republican Party maintaining control of both the House of Representatives and the Senate. The Adviser believes that it will take time before the world has a clearer picture of the short- and long-term impact of the elections on the US economy and markets in general. The Adviser continues to monitor the markets, including for potential market volatility.
| 4 | • AB INCOME FUND |
DISCLOSURES AND RISKS
Benchmark Disclosure
The Bloomberg Barclays US Aggregate Bond Index is unmanaged and does not reflect fees and expenses associated with the active management of a mutual fund portfolio. The Bloomberg Barclays US Aggregate Bond Index represents the performance of securities within the US investment-grade fixed-rate bond market, with index components for government and corporate securities, mortgage pass-through securities, asset-backed securities, and commercial mortgage-backed securities. The Index is not leveraged, whereas the Fund utilizes leverage. An investor cannot invest directly in an index, and its results are not indicative of the performance for any specific investment, including the Fund.
A Word About Risk
Market Risk: The value of the Fund’s assets will fluctuate as the bond market fluctuates. The value of the Fund’s investments may decline, sometimes rapidly and unpredictably, simply because of economic changes or other events that affect large portions of the market.
Credit Risk: An issuer or guarantor of a fixed-income security, or the counterparty to a derivatives or other contract, may be unable or unwilling to make timely payments of interest or principal, or to otherwise honor its obligations. The issuer or guarantor may default, causing a loss of the full principal amount of a security. The degree of risk for a particular security may be reflected in its credit rating. There is the possibility that the credit rating of a fixed-income security may be downgraded after purchase, which may adversely affect the value of the security.
Below Investment Grade Securities Risk: Investments in fixed-income securities with lower ratings (often referred to as “junk bonds”) are subject to higher probability that an issuer will default or fail to meet its payment obligations. These securities may be subject to greater price volatility due to such factors as specific corporate developments, negative perceptions of the junk bond market generally and less secondary market liquidity. These securities are often able to be “called” or repurchased by the issuer prior to their maturity date, forcing the Fund to reinvest the proceeds, possibly at a lower rate of return.
Interest Rate Risk: Changes in interest rates will affect the value of investments in fixed-income securities. When interest rates rise, the value of existing investments in fixed-income securities tends to fall and this decrease in value may not be offset by higher income from new investments. The Fund may be subject to a heightened risk of rising rates as the current period of historically low interest rates ends. Interest rate risk is generally greater for fixed-income securities with longer maturities or durations.
Duration Risk: Duration is a measure that relates the expected price volatility of a fixed-income security to changes in interest rates. The duration of a fixed-income security may be shorter than or equal to the full
(Disclosures, Risks and Note about Historical Performance continued on next page)
| AB INCOME FUND • | 5 |
Disclosures and Risks
DISCLOSURES AND RISKS
(continued from previous page)
maturity of a fixed-income security. Fixed-income securities with longer durations have more risk and will decrease in price as interest rates rise. For example, a fixed-income security with a duration of three years will decrease in value by approximately 3% if interest rates increase by 1%.
Inflation Risk: This is the risk that the value of assets or income from investments will be less in the future as inflation decreases the value of money. As inflation increases, the value of the Fund’s assets can decline, as can the value of the Fund’s distributions. This risk is significantly greater for fixed-income securities with longer maturities.
Foreign (Non-US) Risk: Investments in securities of non-US issuers may involve more risk than those of US issuers. These securities may fluctuate more widely in price and may be less liquid due to adverse market, economic, political, regulatory or other factors.
Emerging Market Risk: Investments in emerging-market countries may have more risk because the markets are less developed and less liquid as well as being subject to increased economic, political, regulatory or other uncertainties.
Leverage Risk: To the extent the Fund uses leveraging techniques, its net asset value (“NAV”) may be more volatile because leverage tends to exaggerate the effect of changes in interest rates and any increase or decrease in the value of the Fund’s investments.
Currency Risk: Fluctuations in currency exchange rates may negatively affect the value of the Fund’s investments or reduce its returns.
Liquidity Risk: Liquidity risk occurs when certain investments become difficult to purchase or sell. Difficulty in selling less liquid securities may result in sales at disadvantageous prices affecting the value of your investment in the Fund. Causes of liquidity risk may include low trading volumes, large positions and heavy redemptions of Fund shares. Over recent years, liquidity risk has also increased because the capacity of dealers in the secondary market for fixed-income securities to make markets in these securities has decreased, even as the overall bond market has grown significantly, due to, among other things, structural changes, additional regulatory requirements and capital and risk restraints that have led to reduced inventories. Liquidity risk may be higher in a rising interest rate environment, when the value and liquidity of fixed-income securities generally decline.
Mortgage-Backed and/or Other Asset-Backed Securities Risk: Investments in mortgage-backed and other asset-backed securities are subject to certain additional risks. The value of these securities may be particularly sensitive to changes in interest rates. These risks include “extension risk”, which is the risk that, in periods of rising interest rates, issuers may delay the payment of principal, and “prepayment risk”, which is the risk that in periods of falling
(Disclosures, Risks and Note about Historical Performance continued on next page)
| 6 | • AB INCOME FUND |
Disclosures and Risks
DISCLOSURES AND RISKS
(continued from previous page)
interest rates, issuers may pay principal sooner than expected, exposing the Fund to a lower rate of return upon reinvestment of principal. Mortgage-backed securities offered by non-governmental issuers and other asset-backed securities may be subject to other risks, such as higher rates of default in the mortgages or assets backing the securities or risks associated with the nature and servicing of mortgages or assets backing the securities.
Derivatives Risk: Derivatives may be illiquid, difficult to price, and leveraged so that small changes may produce disproportionate losses for the Fund, and may be subject to counterparty risk to a greater degree than more traditional investments.
Management Risk: The Fund is subject to management risk because it is an actively managed investment fund. The Adviser will apply its investment techniques and risk analyses in making investment decisions, but there is no guarantee that its techniques will produce the intended results.
These risks are fully discussed in the Fund’s prospectus. As with all investments, you may lose money by investing in the Fund.
An Important Note About Historical Performance
The investment return and principal value of an investment in the Fund will fluctuate, so that shares, when redeemed, may be worth more or less than their original cost. Performance shown on the following pages represents past performance and does not guarantee future results. Current performance may be lower or higher than the performance information shown. You may obtain performance information current to the most recent month-end by visiting www.abfunds.com.
All fees and expenses related to the operation of the Fund have been deducted. NAV returns do not reflect sales charges; if sales charges were reflected, the Fund’s quoted performance would be lower. SEC returns reflect the applicable sales charges for each share class: a 4.25% maximum front-end sales charge for Class A shares and a 1% 1-year contingent deferred sales charge for Class C shares. Returns for the different share classes will vary due to different expenses associated with each class. Performance assumes reinvestment of distributions and does not account for taxes.
The information shown on the following pages for Advisor Class shares reflects the historical performance of the Predecessor Fund based on its NAV. The performance information shown on the following pages is for the Predecessor Fund and may not be representative of performance of the Fund. The Predecessor Fund’s performance would have been lower than that shown had it operated as an open-end fund under the Fund’s current investment strategies and policies and expense levels.
| AB INCOME FUND • | 7 |
Disclosures and Risks
HISTORICAL PERFORMANCE
THE FUND VS. ITS BENCHMARK PERIODS ENDED OCTOBER 31, 2016 | NAV Returns | |||||||||||||||
| 6 Months | Since Inception* | 12 Months | ||||||||||||||
| AB Income Fund | ||||||||||||||||
Class A | 2.67% | 3.14% | — | |||||||||||||
| ||||||||||||||||
Class C | 2.40% | 2.85% | — | |||||||||||||
| ||||||||||||||||
Advisor Class† | 2.93% | — | 5.06% | |||||||||||||
| ||||||||||||||||
| Bloomberg Barclays US Aggregate Bond Index | 1.51% | 1.86% | 4.37% | |||||||||||||
| ||||||||||||||||
* Inception date: 4/21/2016.
† With respect to the Advisor Class, performance returns for the periods prior to April 21, 2016 are based on the NAV per share of the Predecessor Fund. Please note that Advisor Class shares are for investors purchasing shares through accounts established under certain fee-based programs sponsored and maintained by certain broker-dealers and financial intermediaries, institutional pension plans and/or investment advisory clients of, and certain other persons associated with, the Adviser and its affiliates or the Fund, or through other limited or special arrangements approved by the Adviser, such as purchases by shareholders of the Fund’s Predecessor Fund. |
| |||||||||||||||
See Disclosures, Risks and Note about Historical Performance on pages 5-7.
(Historical Performance continued on next page)
| 8 | • AB INCOME FUND |
Historical Performance
HISTORICAL PERFORMANCE
(continued from previous page)
GROWTH OF A $10,000 INVESTMENT IN THE FUND
10/31/06 TO 10/31/16 (unaudited)
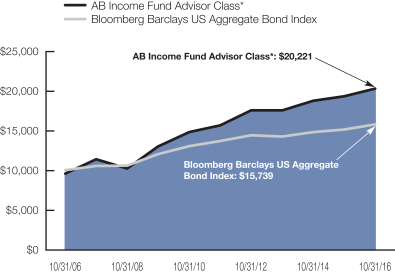
This chart illustrates the total value of an assumed $10,000 investment in AB Income Fund Advisor Class shares (from 10/31/06 to 10/31/16) as compared to the performance of the Fund’s benchmark. The chart reflects the deduction of the maximum 4.25% sales charge from the initial $10,000 investment in the Fund and assumes the reinvestment of dividends and capital gains distributions.
| * | With respect to the Advisor Class, performance returns for the periods prior to April 21, 2016 are based on the NAV per share of the Predecessor Fund. |
See Disclosures, Risks and Note about Historical Performance on pages 5-7.
(Historical Performance continued on next page)
| AB INCOME FUND • | 9 |
Historical Performance
HISTORICAL PERFORMANCE
(continued from previous page)
| AVERAGE ANNUAL RETURNS AS OF OCTOBER 31, 2016 (unaudited) | ||||||||
| NAV Returns | SEC Returns (reflects applicable sales charges)* | |||||||
| Class A Shares | ||||||||
Since Inception† | 3.14 | % | -1.19 | % | ||||
| Class C Shares | ||||||||
Since Inception† | 2.85 | % | 1.85 | % | ||||
| Advisor Class Shares‡ | ||||||||
1 Year | 5.06 | % | 5.06 | % | ||||
5 Years | 5.30 | % | 5.30 | % | ||||
10 Years | 7.30 | % | 7.30 | % | ||||
The Fund’s current prospectus fee table shows the Fund’s total annual operating expense ratios as 1.21%, 1.98% and 0.96% for Class A, Class C and Advisor Class shares, respectively, gross of any fee waivers or expense reimbursements. Contractual fee waivers and/or expense reimbursements limit the Fund’s annual operating expense ratios exclusive of expenses associated with securities sold short, acquired fund fees and expenses other than the advisory fees of any AB mutual funds in which the Fund may invest, interest expense, taxes, extraordinary expenses and brokerage commissions and other transaction costs to 0.88%, 1.63% and 0.63% for Class A, Class C and Advisor Class shares, respectively. These waivers/reimbursements may not be terminated before April 22, 2018. Any fees waived and expense borne by the Adviser may be reimbursed by the Fund until the end of the third fiscal year after the fiscal period in which the fee was waived or the expense was borne, provided that no reimbursement payment will be made that would cause the Fund’s total annual fund operating expenses to exceed the expense reimbursement. Absent reimbursements or waivers, performance would have been lower. The Financial Highlights section of this report sets forth expense ratio data for the current reporting period; the expense ratios shown above may differ from the expense ratios in the Financial Highlights section since they are based on different time periods.
| * | The Fund imposed a 0.75% redemption fee on redemption and exchanges of Advisor Class shares. This fee was retained by the Fund and was included in the Financial Statements as a component of additional paid-in capital. This fee was effective from April 25, 2016 until July 22, 2016. |
| † | Inception date: 4/21/2016. |
| ‡ | Advisor Class shares are offered at NAV to eligible investors; their SEC returns include a redemption fee as noted above. With respect to the Advisor Class, performance returns for the periods prior to April 21, 2016 are based on the NAV per share of the Predecessor Fund. Please note that Advisor Class shares are for investors purchasing shares through accounts established under certain fee-based programs sponsored and maintained by certain broker-dealers and financial intermediaries, institutional pension plans and/or investment advisory clients of, and certain other persons associated with, the Adviser and its affiliates or the Fund, or through other limited or special arrangements approved by the Adviser, such as purchases by shareholders of the Fund’s Predecessor Fund. |
See Disclosures, Risks and Note about Historical Performance on pages 5-7.
(Historical Performance continued on next page)
| 10 | • AB INCOME FUND |
Historical Performance
HISTORICAL PERFORMANCE
(continued from previous page)
SEC AVERAGE ANNUAL RETURNS AS OF THE MOST RECENT CALENDAR QUARTER-END SEPTEMBER 30, 2016 (unaudited) | ||||
| SEC Returns (reflects applicable sales charges)* | ||||
| Class A Shares | ||||
Since Inception† | -0.91 | % | ||
| Class C Shares | ||||
Since Inception† | 2.20 | % | ||
| Advisor Class Shares‡ | ||||
1 Year | 5.66 | % | ||
5 Years | 5.61 | % | ||
10 Years | 7.49 | % | ||
| * | The Fund imposed a 0.75% redemption fee on redemption and exchanges of Advisor Class shares. This fee was retained by the Fund and was included in the Financial Statements as a component of additional paid-in capital. This fee was effective from April 25, 2016 until July 22, 2016. |
| † | Inception date: 4/22/2016. |
| ‡ | With respect to the Advisor Class, performance returns for the periods prior to April 21, 2016 are based on the NAV per share of the Predecessor Fund. Please note that Advisor Class shares are for investors purchasing shares through accounts established under certain fee-based programs sponsored and maintained by certain broker-dealers and financial intermediaries, institutional pension plans and/or investment advisory clients of, and certain other persons associated with, the Adviser and its affiliates or the Fund, or through other limited or special arrangements approved by the Adviser, such as purchases by shareholders of the Fund’s Predecessor Fund. |
See Disclosures, Risks and Note about Historical Performance on pages 5-7.
| AB INCOME FUND • | 11 |
Historical Performance
EXPENSE EXAMPLE
(unaudited)
As a shareholder of the Fund, you incur two types of costs: (1) transaction costs, including sales charges (loads) on purchase payments, contingent deferred sales charges on redemptions and (2) ongoing costs, including management fees; distribution (12b-1) fees; and other Fund expenses. This example is intended to help you understand your ongoing costs (in dollars) of investing in the Fund and to compare these costs with the ongoing costs of investing in other mutual funds.
The Example is based on an investment of $1,000 invested at the beginning of the period and held for the entire period as indicated below.
Actual Expenses
The first line of the table below provides information about actual account values and actual expenses. You may use the information in this line, together with the amount you invested, to estimate the expenses that you paid over the period. Simply divide your account value by $1,000 (for example, an $8,600 account value divided by $1,000 = 8.6), then multiply the result by the number in the first line under the heading entitled “Expenses Paid During Period” to estimate the expenses you paid on your account during this period.
Hypothetical Example for Comparison Purposes
The second line of the table below provides information about hypothetical account values and hypothetical expenses based on the Fund’s actual expense ratio and an assumed annual rate of return of 5% before expenses, which is not the Fund’s actual return. The hypothetical account values and expenses may not be used to estimate the actual ending account balance or expenses you paid for the period. You may use this information to compare the ongoing costs of investing in the Fund and other funds by comparing this 5% hypothetical example with the 5% hypothetical examples that appear in the shareholder reports of other funds.
| Beginning Account Value 5/1/2016 | Ending Account Value 10/31/2016 | Expenses Paid During Period* | Annualized Expense Ratio* | Effective Expenses Paid During Period+ | Effective Annualized Expense Ratio+ | |||||||||||||||||||
| Class A | ||||||||||||||||||||||||
Actual | $ | 1,000 | $ | 1,026.70 | $ | 5.86 | 1.15 | % | $ | 5.91 | 1.16 | % | ||||||||||||
Hypothetical** | $ | 1,000 | $ | 1,019.36 | $ | 5.84 | 1.15 | % | $ | 5.89 | 1.16 | % | ||||||||||||
| Class C | ||||||||||||||||||||||||
Actual | $ | 1,000 | $ | 1,024.00 | $ | 9.62 | 1.89 | % | $ | 9.67 | 1.90 | % | ||||||||||||
Hypothetical** | $ | 1,000 | $ | 1,015.63 | $ | 9.58 | 1.89 | % | $ | 9.63 | 1.90 | % | ||||||||||||
| Advisor Class | ||||||||||||||||||||||||
Actual | $ | 1,000 | $ | 1,029.30 | $ | 4.49 | 0.88 | % | $ | 4.49 | 0.88 | % | ||||||||||||
Hypothetical** | $ | 1,000 | $ | 1,020.71 | $ | 4.47 | 0.88 | % | $ | 4.47 | 0.88 | % | ||||||||||||
| * | Expenses are equal to the classes’ annualized expense ratios multiplied by the average account value over the period, multiplied by 184/366 (to reflect the one-half year period). |
| ** | Assumes 5% annual return before expenses. |
| 12 | • AB INCOME FUND |
Expense Example
| + | The Fund’s investments in affiliated/unaffiliated underlying portfolios incur no direct expenses, but bear proportionate shares of the acquired fund fees (i.e., operating, administrative and investment advisory fee) of the affiliated/unaffiliated underlying portfolios. Currently the Adviser has voluntarily agreed to waive its investment advisory fee from the Fund in an amount equal to the Fund’s share of the advisory fees of the affiliated underlying portfolios, as borne indirectly by the Fund as an acquired fund fee and expense. The Fund’s effective expenses are equal to the classes’ annualized expense ratio plus the Fund’s pro-rata share of the weighted average expense ratio of the affiliated/unaffiliated underlying portfolios in which it invests, multiplied by the average account value over the period, multiplied by 184/366 (to reflect the one-half year period). |
| AB INCOME FUND • | 13 |
Expense Example
PORTFOLIO SUMMARY
October 31, 2016 (unaudited)
PORTFOLIO STATISTICS
Net Assets ($mil): $919.0
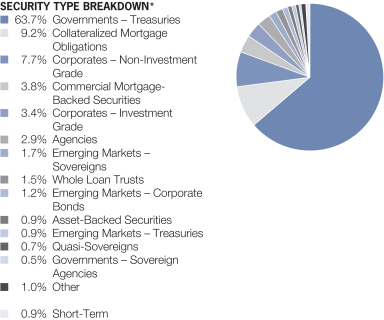
| * | All data are as of October 31, 2016. The Fund’s security type breakdown is expressed as a percentage of total investments and may vary over time. The Fund also enters into derivative transactions, which may be used for hedging or investment purposes (see “Portfolio of Investments” section of the report for additional details). “Other” security type weightings represent 0.5% or less in the following types: Bank Loans, Common Stocks, Governments – Sovereign Bonds, Investment Companies, Local Governments – Municipal Bonds, Local Governments – Regional Bonds, Mortgage Pass-Throughs, Options Purchased – Puts and Warrants. |
| 14 | • AB INCOME FUND |
Portfolio Summary
PORTFOLIO SUMMARY
October 31, 2016 (unaudited)
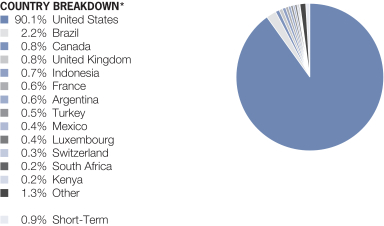
| * | All data are as of October 31, 2016. The Fund’s country breakdown is expressed as a percentage of total investments and may vary over time. The Fund also enters into derivative transactions, which may be used for hedging or investment purposes (see “Portfolio of Investments” section of the report for additional details). “Other” country weightings represent 0.2% or less in the following countries: Angola, Barbados, Cayman Islands, Colombia, Dominican Republic, Italy, Ivory Coast, Jamaica, Netherlands, Nigeria, Norway, Peru, Suriname and Zambia. |
| AB INCOME FUND • | 15 |
Portfolio Summary
PORTFOLIO OF INVESTMENTS
October 31, 2016
| Principal Amount (000) | U.S. $ Value | |||||||||||
| ||||||||||||
GOVERNMENTS – TREASURIES – 95.4% | ||||||||||||
United States – 95.4% | ||||||||||||
U.S. Treasury Bonds | U.S.$ | 70,188 | $ | 78,078,675 | ||||||||
6.25%, 5/15/30(a) | 143,000 | 215,231,731 | ||||||||||
6.375%, 8/15/27(a) | 103,724 | 149,200,543 | ||||||||||
6.50%, 11/15/26(a) | 37,276 | 53,247,909 | ||||||||||
7.125%, 2/15/23 | 10,600 | 14,173,769 | ||||||||||
8.00%, 11/15/21 | 27,000 | 35,728,587 | ||||||||||
8.75%, 8/15/20 | 22,350 | 28,636,809 | ||||||||||
U.S. Treasury Notes | 20,000 | 19,973,440 | ||||||||||
2.125%, 8/31/20(a)(b) | 99,039 | 102,512,987 | ||||||||||
2.125%, 9/30/21 | 34,672 | 35,938,325 | ||||||||||
2.375%, 12/31/20 | 23,080 | 24,141,149 | ||||||||||
3.125%, 5/15/21 | 57,725 | 62,345,251 | ||||||||||
3.50%, 5/15/20(a)(b) | 16,168 | 17,491,755 | ||||||||||
3.625%, 2/15/21(b)(c) | 36,605 | 40,216,889 | ||||||||||
|
| |||||||||||
Total Governments – Treasuries | 876,917,819 | |||||||||||
|
| |||||||||||
COLLATERALIZED MORTGAGE OBLIGATIONS – 13.9% | ||||||||||||
Risk Share Floating Rate – 10.1% | ||||||||||||
Bellemeade Re II Ltd. | 3,018 | 3,045,862 | ||||||||||
Bellemeade Re Ltd. | 927 | 931,527 | ||||||||||
Federal Home Loan Mortgage Corp. Structured Agency Credit Risk Debt Notes | 3,250 | 3,816,098 | ||||||||||
Series 2013-DN2, Class M2 | 5,605 | 5,901,459 | ||||||||||
Series 2014-DN1, Class M2 | 4,085 | 4,173,779 | ||||||||||
Series 2014-DN1, Class M3 | 4,455 | 4,824,673 | ||||||||||
| 16 | • AB INCOME FUND |
Portfolio of Investments
| Principal Amount (000) | U.S. $ Value | |||||||||||
| ||||||||||||
Series 2014-DN2, Class M3 | U.S.$ | 4,170 | $ | 4,297,316 | ||||||||
Series 2014-DN3, Class M3 | 5,065 | 5,287,969 | ||||||||||
Series 2014-DN4, Class M3 | 700 | 740,269 | ||||||||||
Series 2014-HQ2, Class M3 | 1,010 | 1,029,893 | ||||||||||
Series 2015-DNA1, Class M3 | 505 | 517,690 | ||||||||||
Series 2015-DNA2, Class B | 1,500 | 1,532,529 | ||||||||||
Series 2015-DNA2, Class M2 | 4,856 | 4,921,181 | ||||||||||
Series 2015-DNA3, Class M3 | 976 | 1,027,910 | ||||||||||
Series 2015-HQA1, Class B | 1,590 | 1,604,492 | ||||||||||
Series 2015-HQA1, Class M3 | 1,845 | 1,927,864 | ||||||||||
Series 2015-HQA2, Class M3 | 666 | 707,255 | ||||||||||
Series 2016-DNA1, Class M2 | 1,228 | 1,264,614 | ||||||||||
Series 2016-DNA3, Class M3 | 7,783 | 8,242,874 | ||||||||||
Series 2016-DNA4, Class M3 | 634 | 625,876 | ||||||||||
Series 2016-HQA1, Class M3 | 1,776 | 1,983,265 | ||||||||||
Federal National Mortgage Association Connecticut Avenue Securities | 1,606 | 1,700,938 | ||||||||||
| AB INCOME FUND • | 17 |
Portfolio of Investments
| Principal Amount (000) | U.S. $ Value | |||||||||||
| ||||||||||||
Series 2014-C04, Class 1M2 | U.S.$ | 6,100 | $ | 6,519,332 | ||||||||
Series 2015-C01, Class 1M2 | 4,520 | 4,686,492 | ||||||||||
Series 2015-C02, Class 2M2 | 916 | 944,808 | ||||||||||
Series 2015-C03, Class 1M2 | 1,221 | 1,301,121 | ||||||||||
Series 2015-C03, Class 2M2 | 2,720 | 2,893,480 | ||||||||||
Series 2015-C04, Class 1M2 | 1,810 | 1,937,498 | ||||||||||
Series 2015-C04, Class 2M2 | 2,007 | 2,136,224 | ||||||||||
Series 2016-C02, Class 1M2 | 3,755 | 4,120,871 | ||||||||||
Series 2016-C04, Class 1M2 | 1,494 | 1,516,399 | ||||||||||
Series 2016-C05, Class 2M2 | 1,897 | 1,950,443 | ||||||||||
JP Morgan Madison Avenue Securities Trust | 1,886 | 1,866,570 | ||||||||||
Series 2015-CH1, Class M2 | 2,228 | 2,172,509 | ||||||||||
Wells Fargo Credit Risk Transfer Securities Trust | 935 | 938,084 | ||||||||||
|
| |||||||||||
| 93,089,164 | ||||||||||||
|
| |||||||||||
Non-Agency Fixed Rate – 2.7% | ||||||||||||
Alternative Loan Trust | 198 | 173,037 | ||||||||||
| 18 | • AB INCOME FUND |
Portfolio of Investments
| Principal Amount (000) | U.S. $ Value | |||||||||||
| ||||||||||||
Series 2006-19CB, Class A24 | U.S.$ | 127 | $ | 110,780 | ||||||||
Series 2006-24CB, Class A15 | 1,925 | 1,655,161 | ||||||||||
Series 2006-41CB, Class 2A13 | 1,594 | 1,289,677 | ||||||||||
Series 2007-13, Class A2 | 2,426 | 1,968,070 | ||||||||||
BCAP LLC Trust | 826 | 655,582 | ||||||||||
BNPP Mortgage Securities LLC Trust | 1,219 | 913,544 | ||||||||||
Citigroup Mortgage Loan Trust | 3,339 | 3,107,659 | ||||||||||
Series 2007-AR4, Class 1A1A | 485 | 430,979 | ||||||||||
Series 2010-3, Class 2A2 | 713 | 617,244 | ||||||||||
Countrywide Home Loan Mortgage Pass-Through Trust | 1,227 | 1,106,249 | ||||||||||
Series 2007-3, Class A30 | 1,299 | 1,102,309 | ||||||||||
Series 2007-HY4, Class 1A1 | 735 | 650,655 | ||||||||||
Credit Suisse Mortgage Trust | 183 | 129,239 | ||||||||||
Series 2010-9R, Class 1A5 | 938 | 920,117 | ||||||||||
CSMC Mortgage-Backed Trust | 1,107 | 944,228 | ||||||||||
First Horizon Alternative Mortgage Securities Trust | 1,936 | 1,565,770 | ||||||||||
Morgan Stanley Mortgage Loan Trust | 790 | 703,919 | ||||||||||
Series 2007-10XS, Class A2 | 1,068 | 728,619 | ||||||||||
Nomura Resecuritization Trust | 1,937 | 1,539,966 | ||||||||||
| AB INCOME FUND • | 19 |
Portfolio of Investments
| Principal Amount (000) | U.S. $ Value | |||||||||||
| ||||||||||||
Wells Fargo Mortgage Backed Securities Trust | U.S.$ | 3,459 | $ | 3,171,911 | ||||||||
Series 2007-AR8, Class A1 | 1,409 | 1,252,185 | ||||||||||
|
| |||||||||||
| 24,736,900 | ||||||||||||
|
| |||||||||||
Agency Fixed Rate – 1.0% | ||||||||||||
Federal National Mortgage Association REMICs | 10,866 | 1,069,658 | ||||||||||
Government National Mortgage Association | 43,952 | 7,860,732 | ||||||||||
|
| |||||||||||
| 8,930,390 | ||||||||||||
|
| |||||||||||
Non-Agency Floating Rate – 0.1% | ||||||||||||
First Horizon Alternative Mortgage Securities Trust | 764 | 345,987 | ||||||||||
Lehman XS Trust | 877 | 227,898 | ||||||||||
|
| |||||||||||
| 573,885 | ||||||||||||
|
| |||||||||||
Total Collateralized Mortgage Obligations | 127,330,339 | |||||||||||
|
| |||||||||||
CORPORATES – NON-INVESTMENT GRADE – 11.6% | ||||||||||||
Industrial – 8.5% | ||||||||||||
Basic – 0.4% | ||||||||||||
ArcelorMittal | 1,846 | 1,984,450 | ||||||||||
CF Industries, Inc. | 492 | 408,181 | ||||||||||
Cliffs Natural Resources, Inc. | 879 | 954,814 | ||||||||||
Magnetation LLC/Mag Finance Corp. | 1,407 | 1,688 | ||||||||||
Novelis Corp. | 420 | 425,250 | ||||||||||
Teck Resources Ltd. | 103 | 112,528 | ||||||||||
8.50%, 6/01/24(f) | 151 | 174,783 | ||||||||||
|
| |||||||||||
| 4,061,694 | ||||||||||||
|
| |||||||||||
| 20 | • AB INCOME FUND |
Portfolio of Investments
| Principal Amount (000) | U.S. $ Value | |||||||||||
| ||||||||||||
Capital Goods – 0.6% | ||||||||||||
Apex Tool Group LLC | U.S.$ | 975 | $ | 889,687 | ||||||||
Bombardier, Inc. | 1,720 | 1,711,400 | ||||||||||
Sealed Air Corp. | 746 | 801,950 | ||||||||||
United Rentals North America, Inc. | 2,293 | 2,281,535 | ||||||||||
|
| |||||||||||
| 5,684,572 | ||||||||||||
|
| |||||||||||
Communications - Media – 1.4% | ||||||||||||
CCO Holdings LLC/CCO Holdings Capital Corp. | 1,039 | 1,081,859 | ||||||||||
5.50%, 5/01/26(f) | 1,722 | 1,763,982 | ||||||||||
DISH DBS Corp. | 3,303 | 3,325,708 | ||||||||||
Intelsat Jackson Holdings SA | 2,111 | 1,701,994 | ||||||||||
Netflix, Inc. | 1,250 | 1,229,687 | ||||||||||
Univision Communications, Inc. | 1,645 | 1,669,675 | ||||||||||
Virgin Media Finance PLC | 2,246 | 2,010,170 | ||||||||||
|
| |||||||||||
| 12,783,075 | ||||||||||||
|
| |||||||||||
Communications - Telecommunications – 1.2% | ||||||||||||
Altice Luxembourg SA | 1,342 | 1,401,551 | ||||||||||
Columbus Cable Barbados Ltd. | 1,932 | 2,067,240 | ||||||||||
Frontier Communications Corp. | 1,500 | 1,425,000 | ||||||||||
Sable International Finance Ltd. | 657 | 679,995 | ||||||||||
SFR Group SA | 766 | 765,517 | ||||||||||
Sprint Corp. | 1,315 | 1,272,263 | ||||||||||
T-Mobile USA, Inc. | 1,452 | 1,591,682 | ||||||||||
Windstream Services LLC | 1,000 | 937,500 | ||||||||||
7.75%, 10/01/21(a) | 1,070 | 1,060,638 | ||||||||||
|
| |||||||||||
| 11,201,386 | ||||||||||||
|
| |||||||||||
| AB INCOME FUND • | 21 |
Portfolio of Investments
| Principal Amount (000) | U.S. $ Value | |||||||||||
| ||||||||||||
Consumer Cyclical - Automotive – 0.5% | ||||||||||||
Cooper-Standard Automotive, Inc. | U.S.$ | 565 | $ | 567,825 | ||||||||
Exide Technologies | 2,423 | 1,308,400 | ||||||||||
11.00%, 4/30/20(m)(n) | 2,842 | 2,266,116 | ||||||||||
|
| |||||||||||
| 4,142,341 | ||||||||||||
|
| |||||||||||
Consumer Cyclical - Entertainment – 0.2% | ||||||||||||
AMC Entertainment Holdings, Inc. | 1,880 | 1,889,400 | ||||||||||
|
| |||||||||||
Consumer Cyclical - Other – 0.4% | ||||||||||||
International Game Technology PLC | 1,923 | 2,081,263 | ||||||||||
Shea Homes LP/Shea Homes Funding Corp. | 697 | 686,545 | ||||||||||
Taylor Morrison Communities, Inc./Monarch Communities, Inc. | 1,008 | 1,063,440 | ||||||||||
|
| |||||||||||
| 3,831,248 | ||||||||||||
|
| |||||||||||
Consumer Cyclical - Retailers – 0.3% | ||||||||||||
American Tire Distributors, Inc. | 1,312 | 1,206,227 | ||||||||||
Neiman Marcus Group Ltd. LLC | 852 | 670,417 | ||||||||||
PetSmart, Inc. | 519 | 543,004 | ||||||||||
|
| |||||||||||
| 2,419,648 | ||||||||||||
|
| |||||||||||
Consumer Non-Cyclical – 1.3% | ||||||||||||
BI-LO LLC/BI-LO Finance Corp. | 780 | 491,400 | ||||||||||
CHS/Community Health Systems, Inc. | 1,646 | 1,255,075 | ||||||||||
Endo Ltd./Endo Finance LLC/Endo Finco, Inc. | 1,521 | 1,323,270 | ||||||||||
6.50%, 2/01/25(f)(o) | 213 | 179,453 | ||||||||||
Horizon Pharma, Inc./Horizon Pharma USA, Inc. | 566 | 574,490 | ||||||||||
Mallinckrodt International Finance SA/Mallinckrodt CB LLC | 535 | 494,875 | ||||||||||
5.625%, 10/15/23(f) | 118 | 110,920 | ||||||||||
| 22 | • AB INCOME FUND |
Portfolio of Investments
| Principal Amount (000) | U.S. $ Value | |||||||||||
| ||||||||||||
Post Holdings, Inc. | U.S.$ | 3,971 | $ | 3,851,870 | ||||||||
Valeant Pharmaceuticals International, Inc. | EUR | 1,800 | 1,507,650 | |||||||||
6.125%, 4/15/25(f) | U.S.$ | 2,277 | 1,798,830 | |||||||||
Valvoline, Inc. | 381 | 401,955 | ||||||||||
|
| |||||||||||
| 11,989,788 | ||||||||||||
|
| |||||||||||
Energy – 1.7% | ||||||||||||
Berry Petroleum Co. LLC | 3,107 | 1,708,850 | ||||||||||
Denbury Resources, Inc. | 332 | 241,530 | ||||||||||
5.50%, 5/01/22 | 2,118 | 1,673,220 | ||||||||||
Energy Transfer Equity LP | 1,104 | 1,122,078 | ||||||||||
Golden Energy Offshore Services AS | NOK | 14,977 | 489,410 | |||||||||
NGL Energy Partners LP/NGL Energy Finance Corp. | U.S.$ | 718 | 719,795 | |||||||||
Paragon Offshore PLC | 849 | 169,800 | ||||||||||
7.25%, 8/15/24(f)(i)(j) | 3,230 | 646,000 | ||||||||||
Sabine Pass Liquefaction LLC | 1,749 | 1,850,704 | ||||||||||
SandRidge Energy, Inc. | 1,259 | – 0 | – | |||||||||
SM Energy Co. 5.625%, 6/01/25 | 946 | 901,065 | ||||||||||
6.50%, 1/01/23 | 731 | 727,345 | ||||||||||
Tervita Corp. | 1,327 | 1,313,730 | ||||||||||
Transocean, Inc. | 2,375 | 2,320,078 | ||||||||||
Vantage Drilling International | 3,068 | – 0 | – | |||||||||
10.00%, 12/31/20(k) | 91 | 82,128 | ||||||||||
10.00%, 12/31/20(d) | 77 | 69,493 | ||||||||||
Whiting Petroleum Corp. | 165 | 156,750 | ||||||||||
WPX Energy, Inc. | 1,154 | 1,096,300 | ||||||||||
8.25%, 8/01/23 | 250 | 270,000 | ||||||||||
|
| |||||||||||
| 15,558,276 | ||||||||||||
|
| |||||||||||
Technology – 0.3% | ||||||||||||
Avaya, Inc. | 1,245 | 1,011,562 | ||||||||||
Energizer Holdings, Inc. | 936 | 947,700 | ||||||||||
| AB INCOME FUND • | 23 |
Portfolio of Investments
| Principal Amount (000) | U.S. $ Value | |||||||||||
| ||||||||||||
Infor Software Parent LLC/Infor Software Parent, Inc. | U.S.$ | 819 | $ | 829,238 | ||||||||
|
| |||||||||||
| 2,788,500 | ||||||||||||
|
| |||||||||||
Transportation - Services – 0.2% | ||||||||||||
XPO CNW, Inc. | 2,134 | 1,707,200 | ||||||||||
XPO Logistics, Inc. | 144 | 149,760 | ||||||||||
|
| |||||||||||
| 1,856,960 | ||||||||||||
|
| |||||||||||
| 78,206,888 | ||||||||||||
|
| |||||||||||
Financial Institutions – 2.8% | ||||||||||||
Banking – 2.5% | ||||||||||||
Barclays Bank PLC | 656 | 761,911 | ||||||||||
7.625%, 11/21/22 | 654 | 730,028 | ||||||||||
Citigroup, Inc. | 2,055 | 2,132,063 | ||||||||||
Series P | 1,850 | 1,889,405 | ||||||||||
Credit Agricole SA | 2,414 | 2,447,688 | ||||||||||
Credit Suisse Group AG | 2,066 | 2,140,892 | ||||||||||
Intesa Sanpaolo SpA | 1,462 | 1,356,708 | ||||||||||
Lloyds Banking Group PLC | 1,862 | 1,917,860 | ||||||||||
Royal Bank of Scotland Group PLC | 2,200 | 2,134,000 | ||||||||||
Royal Bank of Scotland PLC (The) | 596 | 611,357 | ||||||||||
Societe Generale SA | 1,821 | 1,839,210 | ||||||||||
8.25%, 11/29/18(f)(q) | 1,824 | 1,876,440 | ||||||||||
Standard Chartered PLC | 300 | 291,375 | ||||||||||
7.50%, 4/02/22(f)(q) | 895 | 901,153 | ||||||||||
UBS Group AG | 1,557 | 1,592,033 | ||||||||||
|
| |||||||||||
| 22,622,123 | ||||||||||||
|
| |||||||||||
Finance – 0.1% | ||||||||||||
Creditcorp | 2,000 | 950,000 | ||||||||||
|
| |||||||||||
| 24 | • AB INCOME FUND |
Portfolio of Investments
| Principal Amount (000) | U.S. $ Value | |||||||||||
| ||||||||||||
Other Finance – 0.2% | ||||||||||||
iPayment, Inc. | U.S.$ | 1,852 | $ | 1,863,081 | ||||||||
|
| |||||||||||
| 25,435,204 | ||||||||||||
|
| |||||||||||
Utility – 0.3% | ||||||||||||
Electric – 0.3% | ||||||||||||
Dynegy, Inc. | 1,445 | 1,393,522 | ||||||||||
GenOn Energy, Inc. | 1,047 | 840,217 | ||||||||||
Talen Energy Supply LLC | 965 | 790,721 | ||||||||||
|
| |||||||||||
| 3,024,460 | ||||||||||||
|
| |||||||||||
Total Corporates – Non-Investment Grade | 106,666,552 | |||||||||||
|
| |||||||||||
COMMERCIAL MORTGAGE-BACKED SECURITIES – 5.7% | ||||||||||||
Non-Agency Fixed Rate CMBS – 5.1% | ||||||||||||
Banc of America Commercial Mortgage Trust | 1,181 | 1,199,201 | ||||||||||
Citigroup Commercial Mortgage Trust | 6,525 | 5,854,991 | ||||||||||
Commercial Mortgage Trust | 3,219 | 2,767,752 | ||||||||||
Series 2014-LC17, Class D | 3,549 | 2,744,109 | ||||||||||
Series 2014-UBS5, Class D | 1,041 | 770,513 | ||||||||||
Series 2015-DC1, Class D | 2,730 | 2,110,903 | ||||||||||
CSAIL Commercial Mortgage Trust | 4,091 | 2,984,319 | ||||||||||
GS Mortgage Securities Trust | 2,652 | 2,614,509 | ||||||||||
Series 2013-GC13, Class D | 9,440 | 8,434,785 | ||||||||||
JP Morgan Chase Commercial Mortgage Securities Trust | 1,863 | 1,880,840 | ||||||||||
| AB INCOME FUND • | 25 |
Portfolio of Investments
| Principal Amount (000) | U.S. $ Value | |||||||||||
| ||||||||||||
JPMBB Commercial Mortgage Securities Trust | U.S.$ | 1,300 | $ | 1,203,831 | ||||||||
LB-UBS Commercial Mortgage Trust | 1,750 | 1,771,066 | ||||||||||
Morgan Stanley Bank of America Merrill Lynch Trust | 1,194 | 882,626 | ||||||||||
Wells Fargo Commercial Mortgage Trust | 3,781 | 2,920,613 | ||||||||||
Series 2015-LC20, Class D | 4,000 | 3,030,550 | ||||||||||
WF-RBS Commercial Mortgage Trust | 4,000 | 3,852,463 | ||||||||||
Series 2014-C23, Class D | 2,699 | 2,227,246 | ||||||||||
|
| |||||||||||
| 47,250,317 | ||||||||||||
|
| |||||||||||
Non-Agency Floating Rate CMBS – 0.6% | ||||||||||||
CGBAM Commercial Mortgage Trust | 1,613 | 1,613,034 | ||||||||||
Great Wolf Trust | 4,138 | 4,148,401 | ||||||||||
|
| |||||||||||
| 5,761,435 | ||||||||||||
|
| |||||||||||
Agency CMBS – 0.0% | ||||||||||||
Government National Mortgage Association | 459 | 287 | ||||||||||
|
| |||||||||||
Total Commercial Mortgage-Backed Securities | 53,012,039 | |||||||||||
|
| |||||||||||
CORPORATES – INVESTMENT GRADE – 5.1% | ||||||||||||
Financial Institutions – 2.8% | ||||||||||||
Banking – 0.5% | ||||||||||||
BNP Paribas SA | 500 | 564,375 | ||||||||||
Cooperatieve Rabobank UA | EUR | 600 | 703,833 | |||||||||
| 26 | • AB INCOME FUND |
Portfolio of Investments
| Principal Amount (000) | U.S. $ Value | |||||||||||
| ||||||||||||
JPMorgan Chase & Co. | U.S.$ | 2,998 | $ | 3,327,780 | ||||||||
|
| |||||||||||
| 4,595,988 | ||||||||||||
|
| |||||||||||
Insurance – 2.3% | ||||||||||||
AIG Life Holdings, Inc. | 509 | 679,515 | ||||||||||
American International Group, Inc. | 2,525 | 3,381,977 | ||||||||||
Fairfax Financial Holdings Ltd. | 5,000 | 6,030,690 | ||||||||||
Great-West Life & Annuity Insurance Capital LP II | 2,707 | 2,158,833 | ||||||||||
MetLife, Inc. | 3,345 | 3,746,400 | ||||||||||
Pacific Life Insurance Co. | 1,500 | 2,293,839 | ||||||||||
Transatlantic Holdings, Inc. | 2,122 | 2,837,235 | ||||||||||
|
| |||||||||||
| 21,128,489 | ||||||||||||
|
| |||||||||||
| 25,724,477 | ||||||||||||
|
| |||||||||||
Industrial – 1.9% | ||||||||||||
Basic – 0.5% | ||||||||||||
Braskem Finance Ltd. | 1,204 | 1,273,230 | ||||||||||
GTL Trade Finance, Inc. | 2,711 | 2,690,329 | ||||||||||
7.25%, 4/16/44(f) | 274 | 261,670 | ||||||||||
Minsur SA | 285 | 297,722 | ||||||||||
|
| |||||||||||
| 4,522,951 | ||||||||||||
|
| |||||||||||
Capital Goods – 0.1% | ||||||||||||
General Electric Co. | 1,166 | 1,235,260 | ||||||||||
|
| |||||||||||
Communications - Media – 0.1% | ||||||||||||
Myriad International Holdings BV | 683 | 724,034 | ||||||||||
|
| |||||||||||
Communications - Telecommunications – 0.6% | ||||||||||||
Qwest Corp. | 1,275 | 1,261,816 | ||||||||||
Sprint Spectrum Co. LLC/Sprint Spectrum Co. II LLC/Sprint Spectrum Co. III LLC | 1,215 | 1,218,038 | ||||||||||
| AB INCOME FUND • | 27 |
Portfolio of Investments
| Principal Amount (000) | U.S. $ Value | |||||||||||
| ||||||||||||
Verizon Communications, Inc. | U.S.$ | 3,089 | $ | 3,071,797 | ||||||||
|
| |||||||||||
| 5,551,651 | ||||||||||||
|
| |||||||||||
Consumer Cyclical - Retailers – 0.2% | ||||||||||||
Kohl’s Corp. | 2,000 | 1,939,900 | ||||||||||
|
| |||||||||||
Energy – 0.2% | ||||||||||||
Kinder Morgan, Inc./DE | 1,367 | 1,671,710 | ||||||||||
|
| |||||||||||
Technology – 0.0% | ||||||||||||
Hewlett Packard Enterprise Co. | 336 | 347,516 | ||||||||||
|
| |||||||||||
Transportation - Airlines – 0.2% | ||||||||||||
Delta Air Lines Pass-Through Trust | 1,165 | 1,387,552 | ||||||||||
|
| |||||||||||
| 17,380,574 | ||||||||||||
|
| |||||||||||
Utility – 0.4% | ||||||||||||
Electric – 0.4% | ||||||||||||
ComEd Financing III | 3,462 | 3,589,156 | ||||||||||
|
| |||||||||||
Total Corporates – Investment Grade | 46,694,207 | |||||||||||
|
| |||||||||||
AGENCIES – 4.3% | ||||||||||||
Agency Debentures – 4.3% | ||||||||||||
Federal Home Loan Banks | 8,695 | 12,217,240 | ||||||||||
Federal Home Loan Mortgage Corp. | 15,000 | 22,152,465 | ||||||||||
Residual Funding Corp. Principal Strip | 5,277 | 5,021,103 | ||||||||||
|
| |||||||||||
Total Agencies | 39,390,808 | |||||||||||
|
| |||||||||||
EMERGING MARKETS – SOVEREIGNS – 2.5% | ||||||||||||
Angola – 0.3% | ||||||||||||
Angolan Government International Bond | 2,615 | 2,562,700 | ||||||||||
|
| |||||||||||
| 28 | • AB INCOME FUND |
Portfolio of Investments
| Principal Amount (000) | U.S. $ Value | |||||||||||
| ||||||||||||
Argentina – 0.4% | ||||||||||||
Argentine Republic Government International Bond | U.S.$ | 332 | $ | 351,920 | ||||||||
6.875%, 4/22/21(f) | 2,180 | 2,358,760 | ||||||||||
7.50%, 4/22/26(f) | 870 | 950,475 | ||||||||||
|
| |||||||||||
| 3,661,155 | ||||||||||||
|
| |||||||||||
Dominican Republic – 0.2% | ||||||||||||
Dominican Republic International Bond | 1,873 | 2,079,030 | ||||||||||
|
| |||||||||||
Ivory Coast – 0.3% | ||||||||||||
Ivory Coast Government International Bond | 2,440 | 2,545,481 | ||||||||||
|
| |||||||||||
Kenya – 0.3% | ||||||||||||
Kenya Government International Bond | 2,715 | 2,808,559 | ||||||||||
|
| |||||||||||
Suriname – 0.0% | ||||||||||||
Republic of Suriname | 266 | 277,970 | ||||||||||
|
| |||||||||||
Turkey – 0.8% | ||||||||||||
Turkey Government International Bond | 2,500 | 2,492,500 | ||||||||||
7.00%, 6/05/20 | 4,400 | 4,836,145 | ||||||||||
|
| |||||||||||
| 7,328,645 | ||||||||||||
|
| |||||||||||
Zambia – 0.2% | ||||||||||||
Zambia Government International Bond | 1,553 | 1,511,240 | ||||||||||
|
| |||||||||||
Total Emerging Markets – Sovereigns | 22,774,780 | |||||||||||
|
| |||||||||||
WHOLE LOAN TRUSTS – 2.3% | ||||||||||||
Performing Asset – 2.3% | ||||||||||||
Alpha Credit Debt Fund LLC | 735 | 735,189 | ||||||||||
16.00%, 1/01/21(k)(p) | MXN | 32,620 | 1,725,835 | |||||||||
AlphaCredit Capital, SA de CV | 11,077 | 586,036 | ||||||||||
Cara Aircraft Leasing 28548, Inc. | U.S.$ | 152 | 151,696 | |||||||||
Cara Aircraft Leasing 28563, Inc. | 349 | 349,225 | ||||||||||
Cara Aircraft Leasing 28868, Inc. | 176 | 175,929 | ||||||||||
| AB INCOME FUND • | 29 |
Portfolio of Investments
| Principal Amount (000) | U.S. $ Value | |||||||||||
| ||||||||||||
Deutsche Bank Mexico SA | MXN | 43,143 | $ | 1,587,091 | ||||||||
8.00%, 10/31/34(k)(p) | 26,981 | 992,548 | ||||||||||
Flexpath Wh I LLC | U.S.$ | 1,157 | 1,032,429 | |||||||||
Recife Funding Ltd. | 2,884 | 2,956,806 | ||||||||||
Sheridan Auto Loan Holdings I LLC | 935 | 813,532 | ||||||||||
10.00%, 9/30/21(k)(p) | 1,955 | 1,892,268 | ||||||||||
Sheridan Consumer Finance Trust | 8,146 | 7,706,152 | ||||||||||
|
| |||||||||||
Total Whole Loan Trusts | 20,704,736 | |||||||||||
|
| |||||||||||
EMERGING MARKETS – CORPORATE BONDS – 1.8% | ||||||||||||
Industrial – 1.8% | ||||||||||||
Basic – 0.3% | ||||||||||||
Elementia SAB de CV | 1,039 | 1,057,702 | ||||||||||
Suzano Austria GmbH | 1,883 | 1,859,463 | ||||||||||
|
| |||||||||||
| 2,917,165 | ||||||||||||
|
| |||||||||||
Capital Goods – 0.6% | ||||||||||||
Odebrecht Finance Ltd. | 6,760 | 3,278,600 | ||||||||||
5.25%, 6/27/29(f) | 2,103 | 1,006,811 | ||||||||||
Servicios Corporativos Javer SAB de CV | 884 | 919,360 | ||||||||||
|
| |||||||||||
| 5,204,771 | ||||||||||||
|
| |||||||||||
Communications - Telecommunications – 0.3% | ||||||||||||
Digicel Ltd. | 700 | 626,290 | ||||||||||
6.75%, 3/01/23(f) | 385 | 345,422 | ||||||||||
Ihs Netherlands Holdco BV | 500 | 516,150 | ||||||||||
MTN Mauritius Investment Ltd. | 1,500 | 1,510,737 | ||||||||||
|
| |||||||||||
| 2,998,599 | ||||||||||||
|
| |||||||||||
Consumer Non-Cyclical – 0.4% | ||||||||||||
Marfrig Holdings Europe BV | 2,420 | 2,498,650 | ||||||||||
Tonon Luxembourg SA | 2,354 | 447,328 | ||||||||||
| 30 | • AB INCOME FUND |
Portfolio of Investments
| Principal Amount (000) | U.S. $ Value | |||||||||||
| ||||||||||||
Virgolino de Oliveira Finance SA | U.S.$ | 4,738 | $ | 334,029 | ||||||||
10.875%, 1/13/20(d)(i)(j) | 750 | 195,000 | ||||||||||
11.75%, 2/09/22(d)(i)(j) | 1,690 | 109,850 | ||||||||||
|
| |||||||||||
| 3,584,857 | ||||||||||||
|
| |||||||||||
Transportation - Airlines – 0.2% | ||||||||||||
TAM Capital 3, Inc. | 1,503 | 1,535,315 | ||||||||||
|
| |||||||||||
Total Emerging Markets – Corporate Bonds | 16,240,707 | |||||||||||
|
| |||||||||||
ASSET-BACKED SECURITIES – 1.3% | ||||||||||||
Autos - Fixed Rate – 0.9% | ||||||||||||
CPS Auto Receivables Trust | 2,500 | 2,603,937 | ||||||||||
Exeter Automobile Receivables Trust | 1,220 | 1,299,574 | ||||||||||
Series 2016-3A, Class D | 1,090 | 1,086,144 | ||||||||||
Flagship Credit Auto Trust | 1,500 | 1,596,692 | ||||||||||
Hertz Vehicle Financing LLC | 2,169 | 2,130,774 | ||||||||||
|
| |||||||||||
| 8,717,121 | ||||||||||||
|
| |||||||||||
Other ABS - Floating Rate – 0.2% | ||||||||||||
BlueMountain CLO Ltd. | 2,000 | 1,977,000 | ||||||||||
|
| |||||||||||
Other ABS - Fixed Rate – 0.2% | ||||||||||||
Atlas Ltd. | 1,563 | 1,545,021 | ||||||||||
|
| |||||||||||
Total Asset-Backed Securities | 12,239,142 | |||||||||||
|
| |||||||||||
EMERGING MARKETS – TREASURIES – 1.3% | ||||||||||||
Argentina – 0.3% | ||||||||||||
Argentine Bonos del Tesoro | ARS | 12,266 | 812,642 | |||||||||
16.00%, 10/17/23 | 24,676 | 1,635,479 | ||||||||||
|
| |||||||||||
| 2,448,121 | ||||||||||||
|
| |||||||||||
| AB INCOME FUND • | 31 |
Portfolio of Investments
| Principal Amount (000) | U.S. $ Value | |||||||||||
| ||||||||||||
Brazil – 1.0% | ||||||||||||
Brazil Notas do Tesouro Nacional | BRL | 32,570 | $ | 9,528,309 | ||||||||
|
| |||||||||||
Total Emerging Markets – Treasuries | 11,976,430 | |||||||||||
|
| |||||||||||
QUASI-SOVEREIGNS – 1.0% | ||||||||||||
Quasi-Sovereign Bonds – 1.0% | ||||||||||||
Indonesia – 0.9% | ||||||||||||
Majapahit Holding BV | U.S.$ | 6,188 | 7,997,990 | |||||||||
|
| |||||||||||
South Africa – 0.1% | ||||||||||||
Eskom Holdings SOC Ltd. | 1,070 | 1,107,065 | ||||||||||
|
| |||||||||||
Total Quasi-Sovereigns | 9,105,055 | |||||||||||
|
| |||||||||||
GOVERNMENTS – SOVEREIGN AGENCIES – 0.8% | ||||||||||||
Brazil – 0.5% | ||||||||||||
Petrobras Global Finance BV | 5,000 | 4,951,000 | ||||||||||
|
| |||||||||||
Colombia – 0.1% | ||||||||||||
Ecopetrol SA | 716 | 767,910 | ||||||||||
|
| |||||||||||
United Kingdom – 0.2% | ||||||||||||
Royal Bank of Scotland Group PLC | 1,819 | 1,885,439 | ||||||||||
|
| |||||||||||
Total Governments – Sovereign Agencies | 7,604,349 | |||||||||||
|
| |||||||||||
LOCAL GOVERNMENTS – MUNICIPAL BONDS – 0.8% | ||||||||||||
United States – 0.8% | ||||||||||||
State of Illinois | 3,330 | 3,733,862 | ||||||||||
Texas Transportation Commission State Highway Fund | 2,560 | 3,205,146 | ||||||||||
|
| |||||||||||
Total Local Governments – Municipal Bonds | 6,939,008 | |||||||||||
|
| |||||||||||
| 32 | • AB INCOME FUND |
Portfolio of Investments
| Principal Amount (000) | U.S. $ Value | |||||||||||
| ||||||||||||
LOCAL GOVERNMENTS – REGIONAL BONDS – 0.2% | ||||||||||||
Argentina – 0.2% | ||||||||||||
Provincia de Buenos Aires/Argentina | U.S.$ | 1,430 | $ | 1,465,750 | ||||||||
Provincia de Cordoba | 493 | 510,255 | ||||||||||
|
| |||||||||||
Total Local Governments – Regional Bonds | 1,976,005 | |||||||||||
|
| |||||||||||
| Shares | ||||||||||||
COMMON STOCKS – 0.2% | ||||||||||||
Consumer Discretionary – 0.1% | ||||||||||||
Media – 0.1% | ||||||||||||
Ion Media Networks, Inc. – Class A(i)(k)(p) | 2,512 | 995,732 | ||||||||||
|
| |||||||||||
Energy – 0.1% | ||||||||||||
Oil, Gas & Consumable Fuels – 0.1% | ||||||||||||
SandRidge Energy, Inc.(i) | 2,859 | 65,843 | ||||||||||
Vantage Drilling International(i)(k) | 5,303 | 445,452 | ||||||||||
|
| |||||||||||
| 511,295 | ||||||||||||
|
| |||||||||||
Financials – 0.0% | ||||||||||||
Diversified Financial Services – 0.0% | ||||||||||||
iPayment, Inc.(i)(k)(p) | 110,385 | 364,270 | ||||||||||
|
| |||||||||||
Industrials – 0.0% | ||||||||||||
Consumer Cyclical - Automotive – 0.0% | ||||||||||||
Exide Corp.(i)(n) | 45,970 | 68,955 | ||||||||||
|
| |||||||||||
Total Common Stocks | 1,940,252 | |||||||||||
|
| |||||||||||
| Principal Amount (000) | ||||||||||||
GOVERNMENTS – SOVEREIGN BONDS – 0.1% | ||||||||||||
Indonesia – 0.1% | ||||||||||||
Indonesia Government International Bond | U.S.$ | 801 | 1,184,909 | |||||||||
|
| |||||||||||
| Shares | ||||||||||||
INVESTMENT COMPANIES – 0.1% | ||||||||||||
Funds and Investment Trusts – 0.1% | ||||||||||||
OCL Opportunities Fund II(k)(p)(s) | 6,916 | 1,184,586 | ||||||||||
|
| |||||||||||
| AB INCOME FUND • | 33 |
Portfolio of Investments
| Contracts | U.S. $ Value | |||||||||||
| ||||||||||||
OPTIONS PURCHASED – PUTS – 0.0% | ||||||||||||
Options on Forward Contracts – 0.0% | ||||||||||||
USD/BRL | 1,500,000 | $ | 163,770 | |||||||||
USD/JPY | 24,200,000 | 75,722 | ||||||||||
USD/MXN | 5,193,000 | 182,601 | ||||||||||
|
| |||||||||||
Total Options Purchased – Puts | 422,093 | |||||||||||
|
| |||||||||||
| Principal Amount (000) | ||||||||||||
BANK LOANS – 0.0% | ||||||||||||
Industrial – 0.0% | ||||||||||||
Basic – 0.0% | ||||||||||||
Magnetation LLC | U.S.$ | 1,753 | 227,922 | |||||||||
|
| |||||||||||
MORTGAGE PASS-THROUGHS – 0.0% | ||||||||||||
Agency Fixed Rate 30-Year – 0.0% | ||||||||||||
Federal National Mortgage Association | 22 | 26,227 | ||||||||||
Series 1998 | 15 | 17,573 | ||||||||||
|
| |||||||||||
Total Mortgage Pass-Throughs | 43,800 | |||||||||||
|
| |||||||||||
WARRANTS – 0.0% | ||||||||||||
Flexpath Capital, Inc., | 17,195 | – 0 | – | |||||||||
SandRidge Energy, Inc. -A-CW22, | 2,475 | 12,004 | ||||||||||
SandRidge Energy, Inc. -B-CW22, | 1,042 | 4,741 | ||||||||||
|
| |||||||||||
Total Warrants | 16,745 | |||||||||||
|
| |||||||||||
| 34 | • AB INCOME FUND |
Portfolio of Investments
| Company | Shares | U.S. $ Value | ||||||||||
| ||||||||||||
SHORT-TERM INVESTMENTS – 1.4% | ||||||||||||
Investment Companies – 1.4% | ||||||||||||
AB Fixed Income Shares, Inc. – | 12,471,125 | $ | 12,471,125 | |||||||||
|
| |||||||||||
Total Investments – 149.8% | 1,377,063,408 | |||||||||||
Other assets less liabilities – (49.8)% | (458,049,102 | ) | ||||||||||
|
| |||||||||||
Net Assets – 100.0% | $ | 919,014,306 | ||||||||||
|
| |||||||||||
FUTURES (see Note D)
| Type | Number of Contracts | Expiration Month | Original Value | Value at October 31, 2016 | Unrealized Appreciation/ (Depreciation) | |||||||||||||||
Sold Contracts |
| |||||||||||||||||||
Euro-BOBL Futures | 402 | December 2016 | $ | 58,190,499 | $ | 57,858,267 | $ | 332,232 | ||||||||||||
U.S. Long Bond (CBT) Futures | 1,518 | December 2016 | 258,819,413 | 247,007,063 | 11,812,350 | |||||||||||||||
U.S. T-Note 10 Yr (CBT) Futures | 584 | December 2016 | 75,937,741 | 75,701,000 | 236,741 | |||||||||||||||
|
| |||||||||||||||||||
| $ | 12,381,323 | |||||||||||||||||||
|
| |||||||||||||||||||
FORWARD CURRENCY EXCHANGE CONTRACTS (see Note D)
| Counterparty | Contracts to Deliver (000) | In Exchange For (000) | Settlement Date | Unrealized Appreciation/ (Depreciation) | ||||||||||||||||
Bank of America, NA | CAD | 24,718 | USD | 19,258 | 11/10/16 | $ | 827,956 | |||||||||||||
Barclays Bank PLC | INR | 65,394 | USD | 968 | 12/15/16 | (6,452 | ) | |||||||||||||
Barclays Bank PLC | USD | 8,487 | INR | 574,656 | 12/15/16 | 76,796 | ||||||||||||||
BNP Paribas SA | USD | 278 | ARS | 4,842 | 1/26/17 | 25,441 | ||||||||||||||
BNP Paribas SA | USD | 278 | ARS | 4,870 | 1/31/17 | 26,231 | ||||||||||||||
BNP Paribas SA | USD | 278 | ARS | 4,898 | 2/03/17 | 27,434 | ||||||||||||||
BNP Paribas SA | USD | 1,120 | ARS | 19,737 | 2/13/17 | 105,955 | ||||||||||||||
BNP Paribas SA | USD | 845 | ARS | 14,969 | 2/16/17 | 83,354 | ||||||||||||||
BNP Paribas SA | USD | 563 | ARS | 10,026 | 2/17/17 | 58,168 | ||||||||||||||
BNP Paribas SA | USD | 1,690 | ARS | 30,416 | 2/21/17 | 191,678 | ||||||||||||||
BNP Paribas SA | USD | 282 | ARS | 5,126 | 2/23/17 | 35,114 | ||||||||||||||
BNP Paribas SA | USD | 537 | ARS | 9,826 | 2/24/17 | 69,960 | ||||||||||||||
BNP Paribas SA | USD | 841 | ARS | 15,645 | 2/27/17 | 123,737 | ||||||||||||||
BNP Paribas SA | USD | 441 | ARS | 8,276 | 2/28/17 | 68,756 | ||||||||||||||
BNP Paribas SA | USD | 441 | ARS | 8,386 | 3/01/17 | 75,300 | ||||||||||||||
BNP Paribas SA | USD | 486 | ARS | 9,473 | 3/02/17 | 97,557 | ||||||||||||||
| AB INCOME FUND • | 35 |
Portfolio of Investments
| Counterparty | Contracts to Deliver (000) | In Exchange For (000) | Settlement Date | Unrealized Appreciation/ (Depreciation) | ||||||||||||||||
Citibank, NA | EUR | 20,251 | USD | 22,634 | 11/15/16 | $ | 392,162 | |||||||||||||
Citibank, NA | USD | 9,791 | GBP | 7,544 | 11/16/16 | (554,049 | ) | |||||||||||||
Citibank, NA | NOK | 11,971 | USD | 1,466 | 12/07/16 | 17,106 | ||||||||||||||
Citibank, NA | SEK | 19,586 | USD | 2,269 | 12/07/16 | 96,538 | ||||||||||||||
Credit Suisse International | SEK | 173,844 | EUR | 17,650 | 11/15/16 | 126,809 | ||||||||||||||
Goldman Sachs Bank USA | BRL | 23,799 | USD | 7,508 | 11/03/16 | 51,815 | ||||||||||||||
Goldman Sachs Bank USA | USD | 5,779 | BRL | 18,868 | 11/03/16 | 131,715 | ||||||||||||||
Goldman Sachs Bank USA | USD | 1,550 | BRL | 4,932 | 11/03/16 | (5,294 | ) | |||||||||||||
Goldman Sachs Bank USA | USD | 15,632 | MXN | 308,395 | 11/22/16 | 649,304 | ||||||||||||||
Goldman Sachs Bank USA | USD | 9,968 | RUB | 625,824 | 11/22/16 | (146,840 | ) | |||||||||||||
Goldman Sachs Bank USA | BRL | 29,545 | USD | 9,205 | 12/02/16 | 26,859 | ||||||||||||||
Goldman Sachs Bank USA | USD | 12,914 | SEK | 108,457 | 12/07/16 | (886,782 | ) | |||||||||||||
JPMorgan Chase Bank, NA | AUD | 4,016 | USD | 3,073 | 1/19/17 | 24,229 | ||||||||||||||
Morgan Stanley & Co., Inc. | BRL | 13,936 | USD | 4,441 | 11/03/16 | 75,413 | ||||||||||||||
Morgan Stanley & Co., Inc. | USD | 4,381 | BRL | 13,936 | 11/03/16 | (14,960 | ) | |||||||||||||
Morgan Stanley & Co., Inc. | USD | 4,403 | BRL | 13,936 | 12/02/16 | (74,149 | ) | |||||||||||||
Morgan Stanley & Co., Inc. | SEK | 21,745 | USD | 2,577 | 12/07/16 | 165,883 | ||||||||||||||
Morgan Stanley & Co., Inc. | USD | 11,864 | SEK | 101,642 | 12/07/16 | (592,313 | ) | |||||||||||||
Royal Bank of Scotland PLC | CAD | 6,335 | USD | 4,810 | 11/10/16 | 86,948 | ||||||||||||||
Royal Bank of Scotland PLC | USD | 2,315 | CAD | 3,046 | 11/10/16 | (44,201 | ) | |||||||||||||
Royal Bank of Scotland PLC | GBP | 9,451 | USD | 11,630 | 11/16/16 | 58,089 | ||||||||||||||
Royal Bank of Scotland PLC | MXN | 110,043 | USD | 5,693 | 11/22/16 | (117,141 | ) | |||||||||||||
Standard Chartered Bank | SGD | 8,698 | USD | 6,388 | 12/14/16 | 133,792 | ||||||||||||||
Standard Chartered Bank | USD | 1,505 | SGD | 2,097 | 12/14/16 | 3,325 | ||||||||||||||
Standard Chartered Bank | USD | 4,971 | IDR | 65,147,571 | 12/15/16 | (4,015 | ) | |||||||||||||
State Street Bank & Trust Co. | EUR | 657 | USD | 716 | 11/15/16 | (5,373 | ) | |||||||||||||
State Street Bank & Trust Co. | USD | 10,013 | TRY | 30,229 | 11/28/16 | (299,133 | ) | |||||||||||||
|
| |||||||||||||||||||
| $ | 1,182,722 | |||||||||||||||||||
|
| |||||||||||||||||||
CENTRALLY CLEARED CREDIT DEFAULT SWAPS (see Note D)
| Clearing Broker/(Exchange) & Referenced Obligation | Fixed Rate (Pay) Receive | Implied Credit Spread at October 31, 2016 | Notional Amount (000) | Market Value | Unrealized Appreciation/ (Depreciation) | |||||||||||||||
Buy Contracts | ||||||||||||||||||||
Citigroup Global Markets, Inc./(INTRCONX) | ||||||||||||||||||||
CDX-NAHY Series 26, 5 Year Index, 6/20/21* | (5.00 | )% | 3.93 | % | $ | 6,792 | $ | (332,230 | ) | $ | 25,248 | |||||||||
CDX-NAHY Series 26, 5 Year Index, 6/20/21* | (5.00 | ) | 3.93 | 7,252 | (354,730 | ) | 9,344 | |||||||||||||
CDX-NAHY Series 26, 5 Year Index, 6/20/21* | (5.00 | ) | 3.93 | 3,084 | (150,854 | ) | 4,140 | |||||||||||||
CDX-NAHY Series 26, 5 Year Index, 6/20/21* | (5.00 | ) | 3.93 | 2,053 | (100,422 | ) | 7,582 | |||||||||||||
CDX-NAHY Series 26, 5 Year Index, 6/20/21* | (5.00 | ) | 3.93 | 4,311 | (210,872 | ) | (6,975 | ) | ||||||||||||
CDX-NAHY Series 26, 5 Year Index, 6/20/21* | (5.00 | ) | 3.93 | 2,053 | (100,422 | ) | 5,644 | |||||||||||||
CDX-NAHY Series 26, 5 Year Index, 6/20/21* | (5.00 | ) | 3.93 | 1,540 | (75,329 | ) | 3,469 | |||||||||||||
| 36 | • AB INCOME FUND |
Portfolio of Investments
| Clearing Broker/(Exchange) & Referenced Obligation | Fixed Rate (Pay) Receive | Implied Credit Spread at October 31, 2016 | Notional Amount (000) | Market Value | Unrealized Appreciation/ (Depreciation) | |||||||||||||||
CDX-NAHY Series 26, 5 Year Index, 6/20/21* | (5.00 | )% | 3.93 | % | $ | 1,950 | $ | (95,384 | ) | $ | (2,842 | ) | ||||||||
CDX-NAHY Series 26, 5 Year Index, 6/20/21* | (5.00 | ) | 3.93 | 2,012 | (98,417 | ) | (5,620 | ) | ||||||||||||
CDX-NAHY Series 27, 5 Year Index, 12/20/21* | (5.00 | ) | 4.21 | 18,450 | (739,900 | ) | (37,157 | ) | ||||||||||||
Sale Contracts | ||||||||||||||||||||
Citigroup Global Markets, Inc./(INTRCONX) | ||||||||||||||||||||
CDX-NAHY Series 21, 5 Year Index, 12/20/18* | 5.00 | 2.06 | 12,323 | 820,716 | 396,609 | |||||||||||||||
CDX-NAHY Series 26, 5 Year Index, 6/20/21* | 5.00 | 3.93 | 31,047 | 1,517,696 | 552,514 | |||||||||||||||
CDX-NAHY Series 27, 5 Year Index, 12/20/21* | 5.00 | 4.21 | 1,808 | 72,506 | 3,560 | |||||||||||||||
CDX-NAHY Series 27, 5 Year Index, 12/20/21* | 5.00 | 4.21 | 1,767 | 70,862 | 881 | |||||||||||||||
CDX-NAHY Series 27, 5 Year Index, 12/20/21* | 5.00 | 4.21 | 1,397 | 56,024 | (4,391 | ) | ||||||||||||||
CDX-NAHY Series 27, 5 Year Index, 12/20/21* | 5.00 | 4.21 | 1,849 | 74,150 | (6,731 | ) | ||||||||||||||
CDX-NAHY Series 27, 5 Year Index, 12/20/21* | 5.00 | 4.21 | 1,849 | 74,151 | (8,477 | ) | ||||||||||||||
CDX-NAHY Series 27, 5 Year Index, 12/20/21* | 5.00 | 4.21 | 3,883 | 155,720 | 3,031 | |||||||||||||||
CDX-NAHY Series 27, 5 Year Index, 12/20/21* | 5.00 | 4.21 | 2,778 | 111,406 | (6,476 | ) | ||||||||||||||
CDX-NAHY Series 27, 5 Year Index, 12/20/21* | 5.00 | 4.21 | 6,284 | 251,782 | 5,985 | |||||||||||||||
CDX-NAHY Series 27, 5 Year Index, 12/20/21* | 5.00 | 4.21 | 6,597 | 264,559 | (14,326 | ) | ||||||||||||||
CDX-NAHY Series 27, 5 Year Index, 12/20/21* | 5.00 | 4.21 | 5,768 | 231,314 | (27,281 | ) | ||||||||||||||
|
|
|
| |||||||||||||||||
| $ | 1,442,326 | $ | 897,731 | |||||||||||||||||
|
|
|
| |||||||||||||||||
| * | Termination date |
CENTRALLY CLEARED INTEREST RATE SWAPS (see Note D)
| Rate Type | ||||||||||||||||||||
| Clearing Broker/ (Exchange) | Notional Amount (000) | Termination Date | Payments made by the Fund | Payments received by the Fund | Unrealized Appreciation/ (Depreciation) | |||||||||||||||
Citigroup Global Markets, Inc./(CME Group) | $ 30,755 | 2/10/25 | 2.034% | 3 Month LIBOR | $ | (1,091,557 | ) | |||||||||||||
Citigroup Global Markets, Inc./(CME Group) | 6,010 | 6/09/25 | 2.491% | 3 Month LIBOR | (470,638 | ) | ||||||||||||||
Citigroup Global Markets, Inc./(LCH Group) | 46,860 | 4/02/24 | 2.851% | 3 Month LIBOR | (4,468,905 | ) | ||||||||||||||
|
| |||||||||||||||||||
| $ | (6,031,100 | ) | ||||||||||||||||||
|
| |||||||||||||||||||
| AB INCOME FUND • | 37 |
Portfolio of Investments
CREDIT DEFAULT SWAPS (see Note D)
| Swap Counterparty & Referenced Obligation | Fixed Rate (Pay) Receive | Implied Credit Spread at October 31, 2016 | Notional Amount (000) | Market Value | Upfront Premiums Paid (Received) | Unrealized Appreciation/ (Depreciation) | ||||||||||||||||||
Sale Contracts | ||||||||||||||||||||||||
Barclays Bank PLC | ||||||||||||||||||||||||
CDX-CMBX.NA.BB Series 6, 5/11/63* | 5.00 | % | 8.47 | % | $ | 5,000 | $ | (767,139 | ) | $ | (133,883 | ) | $ | (633,256 | ) | |||||||||
Credit Suisse International | ||||||||||||||||||||||||
CDX-CMBX.NA.BB Series 6, 5/11/63* | 5.00 | 8.47 | 4,000 | (613,711 | ) | 50,079 | (663,790 | ) | ||||||||||||||||
CDX-CMBX.NA.BBB Series 6, 5/11/63* | 3.00 | 4.66 | 660 | (53,669 | ) | (9,303 | ) | (44,366 | ) | |||||||||||||||
Goldman Sachs International | ||||||||||||||||||||||||
CDX-CMBX.NA.BB Series 6, 5/11/63* | 5.00 | 8.47 | 6,500 | (997,281 | ) | (1,033,026 | ) | 35,745 | ||||||||||||||||
CDX-CMBX.NA.BB Series 6, 5/11/63* | 5.00 | 8.47 | 5,000 | (767,139 | ) | (755,179 | ) | (11,960 | ) | |||||||||||||||
CDX-CMBX.NA.BB Series 6, 5/11/63* | 5.00 | 8.47 | 5,000 | (767,139 | ) | (133,883 | ) | (633,256 | ) | |||||||||||||||
CDX-CMBX.NA.BBB Series 6, 5/11/63* | 3.00 | 4.66 | 2,000 | (162,634 | ) | (28,186 | ) | (134,448 | ) | |||||||||||||||
CDX-CMBX.NA.BBB Series 6, 5/11/63* | 3.00 | 4.66 | 2,000 | (162,633 | ) | (28,186 | ) | (134,447 | ) | |||||||||||||||
CDX-CMBX.NA.BBB Series 6, 5/11/63* | 3.00 | 4.66 | 4,400 | (357,793 | ) | (51,753 | ) | (306,040 | ) | |||||||||||||||
|
|
|
|
|
| |||||||||||||||||||
| $ | (4,649,138 | ) | $ | (2,123,320 | ) | $ | (2,525,818 | ) | ||||||||||||||||
|
|
|
|
|
| |||||||||||||||||||
| * | Termination date |
INTEREST RATE SWAPS (see Note D)
| Rate Type | ||||||||||||||||||||||||
| Swap Counterparty | Notional Amount (000) | Termination Date | Payments made by the Fund | Payments received by the Fund | Unrealized Appreciation/ (Depreciation) | |||||||||||||||||||
Bank of America, NA | BRL | 49,500 | 1/02/19 | CDI | 11.260% | $ | (49,198 | ) | ||||||||||||||||
Bank of America, NA | 24,500 | 1/02/19 | CDI | 11.280% | (21,402 | ) | ||||||||||||||||||
Bank of America, NA | 19,000 | 1/02/25 | 10.820% | CDI | 57,727 | |||||||||||||||||||
Bank of America, NA | 9,500 | 1/02/25 | 10.837% | CDI | 27,109 | |||||||||||||||||||
|
| |||||||||||||||||||||||
| $ | 14,236 | |||||||||||||||||||||||
|
| |||||||||||||||||||||||
| 38 | • AB INCOME FUND |
Portfolio of Investments
REVERSE REPURCHASE AGREEMENTS (see Note D)
| Broker | Interest Rate | Maturity | U.S. $ Value at October 31, 2016 | |||||||||
Barclays Capital, Inc.+ | (0.50 | )%* | — | $ | 961,377 | |||||||
Credit Suisse Securities (USA) LLC+ | 0.00 | % | — | 1,071,338 | ||||||||
HSBC Bank USA+ | 0.53 | % | — | 275,493,304 | ||||||||
HSBC Bank USA+ | 0.55 | % | — | | 36,476,246 | | ||||||
JP Morgan Chase Bank+ | 0.45 | % | — | 50,477,012 | ||||||||
JP Morgan Chase Bank+ | 0.45 | % | — | 105,768,878 | ||||||||
|
| |||||||||||
| $ | 470,248,155 | |||||||||||
|
| |||||||||||
| + | The reverse repurchase agreement matures on demand. Interest rate resets daily and the rate shown is the rate in effect on October 31, 2016 |
| * | Interest payment due from counterparty. |
The type of underlying collateral and the remaining maturity of open reverse repurchase agreements in relation to the reverse repurchase agreements on the statements of assets and liabilities is as follows:
Remaining Contracted Maturity of the Agreements
Reverse Repurchase Agreements
Overnight and Continuous | Up to 30 Days | 31-90 Days | Greater than 90 Days | Total | ||||||||||||||||
Corporates – Non-Investment Grade | $ | 2,032,715 | $ | – 0 | – | $ | – 0 | – | $ | $ | 2,032,715 | |||||||||
Quasi-Sovereigns | 468,215,430 | — | — | 468,215,430 | ||||||||||||||||
|
|
|
|
|
|
|
|
|
| |||||||||||
Total | $ | 470,248,145 | $ | – 0 | – | $ | – 0 | – | $ | $ | 470,248,145 | |||||||||
|
|
|
|
|
|
|
|
|
| |||||||||||
| (a) | Position, or a portion thereof, has been segregated to collateralize reverse repurchase agreements. |
| (b) | Position, or a portion thereof, has been segregated to collateralize OTC derivatives outstanding. |
| (c) | Position, or a portion thereof, has been segregated to collateralize margin requirements for open futures contracts. |
| (d) | Security is exempt from registration under Rule 144A of the Securities Act of 1933. These securities, which represent 1.16% of net assets as of October 31, 2016, are considered illiquid and restricted. Additional information regarding such securities follows: |
| 144A/Restricted & Illiquid Securities | Acquisition Date | Cost | Market Value | Percentage of Net Assets | ||||||||||||
Bellemeade Re II Ltd. Series 2016-1A, Class M2A | 4/29/16 | $ | 3,017,572 | $ | 3,045,862 | 0.33 | % | |||||||||
Bellemeade Re Ltd. Series 2015-1A, Class M1 | 7/27/15 | 927,470 | 931,527 | 0.10 | % | |||||||||||
Creditcorp | 6/28/13 | 1,992,498 | 950,000 | 0.10 | % | |||||||||||
Golden Energy Offshore Services AS | 5/14/14-12/04/15 | 1,843,728 | 489,410 | 0.05 | % | |||||||||||
| AB INCOME FUND • | 39 |
Portfolio of Investments
| 144A/Restricted & Illiquid Securities | Acquisition Date | Cost | Market Value | Percentage of Net Assets | ||||||||||||
JP Morgan Madison Avenue Securities Trust Series 2014-CH1, Class M2 | 11/06/15 | $ | 1,860,285 | $ | 1,866,570 | 0.20 | % | |||||||||
Magnetation LLC/Mag Finance Corp. | 2/19/15 | 861,787 | 1,688 | 0.00 | % | |||||||||||
Vantage Drilling International | 6/17/16 | 71,836 | 69,493 | 0.01 | % | |||||||||||
Virgolino de Oliveira Finance SA | 6/13/13-1/27/14 | 3,510,948 | 334,029 | 0.04 | % | |||||||||||
Virgolino de Oliveira Finance SA | 6/09/14 | 745,965 | 195,000 | 0.02 | % | |||||||||||
Virgolino de Oliveira Finance SA | 12/29/14-2/03/14 | 916,308 | 109,850 | 0.01 | % | |||||||||||
Wells Fargo Credit Risk Transfer Securities Trust Series 2015-WF1, Class 1M2 | 9/06/16 | 949,000 | 938,084 | 0.10 | % | |||||||||||
iPayment, Inc. | 12/29/14-2/27/15 | 1,849,647 | 1,863,081 | 0.20 | % | |||||||||||
| (e) | Floating Rate Security. Stated interest/floor rate was in effect at October 31, 2016. |
| (f) | Security is exempt from registration under Rule 144A of the Securities Act of 1933. These securities are considered restricted, but liquid and may be resold in transactions exempt from registration, normally to qualified institutional buyers. At October 31, 2016, the aggregate market value of these securities amounted to $174,766,616 or 19.0% of net assets. |
| (g) | IO – Interest Only. |
| (h) | Inverse interest only security. |
| (i) | Non-income producing security. |
| (j) | Defaulted. |
| (k) | Illiquid security. |
| (l) | Convertible security. |
| (m) | Pay-In-Kind Payments (PIK). The issuer may pay cash interest and/or interest in additional debt securities. Rates shown are the rates in effect at October 31, 2016. |
| (n) | Restricted and illiquid security. |
| Restricted & Illiquid Securities | Acquisition Date | Cost | Market Value | Percentage of Net Assets | ||||||||||||
Exide Corp. | 4/30/15 | $ | 87,194 | $ | 68,955 | 0.01 | % | |||||||||
Exide Technologies Series AI | 5/05/13-5/07/14 | 2,688,651 | 2,266,116 | 0.25 | % | |||||||||||
| (o) | Coupon rate adjusts periodically based upon a predetermined schedule. Stated interest rate in effect at October 31, 2016. |
| (p) | Fair valued by the Adviser. |
| 40 | • AB INCOME FUND |
Portfolio of Investments
| (q) | Securities are perpetual and, thus, do not have a predetermined maturity date. The date shown, if applicable, reflects the next call date. |
| (r) | Variable rate coupon, rate shown as of October 31, 2016. |
| (s) | The company invests on a global basis in multiple asset classes including (but not limited to) private equity debt securities, property-related assets and private equity securities including warrants and preferred stock. |
| (t) | The stated coupon rate represents the greater of the LIBOR or the LIBOR floor rate plus a spread at October 31, 2016. |
| (u) | To obtain a copy of the fund’s financial statements, please go to the Securities and Exchange Commission’s website at www.sec.gov, or call AB at (800) 227-4618. |
| (v) | Investment in affiliated money market mutual fund. The rate shown represents the 7-day yield as of period end. |
Currency Abbreviations:
ARS – Argentine Peso AUD – Australian Dollar BRL – Brazilian Real CAD – Canadian Dollar EUR – Euro GBP – Great British Pound IDR – Indonesian Rupiah INR – Indian Rupee MXN – Mexican Peso NOK – Norwegian Krone RUB – Russian Ruble SEK – Swedish Krona SGD – Singapore Dollar TRY – Turkish Lira USD – United States Dollar |
Glossary:
ABS – Asset-Backed Securities
BOBL – Bundesobligationen
CBT – Chicago Board of Trade
CDI – Brazil CETIP Interbank Deposit Rate
CDX-CMBX.NA – North American Commercial Mortgage-Backed Index
CDX-NAHY – North American High Yield Credit Default Swap Index
CMBS – Commercial Mortgage-Backed Securities
CME – Chicago Mercantile Exchange
INTRCONX – Inter-Continental Exchange
LCH – London Clearing House
LIBOR – London Interbank Offered Rates
REMICs – Real Estate Mortgage Investment Conduits
See notes to financial statements.
| AB INCOME FUND • | 41 |
Portfolio of Investments
STATEMENT OF ASSETS & LIABILITIES
October 31, 2016
| Assets | ||||
Investments in securities, at value | ||||
Unaffiliated issuers (cost $1,330,759,505) | $ | 1,364,592,283 | ||
Affiliated issuers (cost $12,471,125) | 12,471,125 | |||
Cash collateral due from broker | 4,375,585 | |||
Cash | 1,296,524 | |||
Due from custodian | 317,253 | |||
Foreign currencies, at value (cost $137,042) | 135,657 | |||
Interest receivable | 15,891,673 | |||
Receivable for investment securities sold | 13,221,583 | |||
Unrealized appreciation on forward currency exchange contracts | 3,933,424 | |||
Receivable for capital stock sold | 308,787 | |||
Unrealized appreciation on interest rate swaps | 84,836 | |||
Upfront premium paid on credit default swaps | 50,079 | |||
Unrealized appreciation on credit default swaps | 35,745 | |||
Affiliated dividends receivable | 5,457 | |||
|
| |||
Total assets | 1,416,720,011 | |||
|
| |||
| Liabilities | ||||
Payable for reverse repurchase agreements | 470,248,155 | |||
Payable for investment securities purchased | 15,368,596 | |||
Unrealized depreciation on forward currency exchange contracts | 2,750,702 | |||
Unrealized depreciation on credit default swaps | 2,561,563 | |||
Payable for capital stock repurchased | 2,260,309 | |||
Upfront premium received on credit default swaps | 2,173,399 | |||
Payable for variation margin on exchange-traded derivatives | 886,436 | |||
Dividends payable | 806,737 | |||
Advisory fee payable | 214,443 | |||
Unrealized depreciation on interest rate swaps | 70,600 | |||
Transfer Agent fee payable | 39,352 | |||
Administrative fee payable | 22,720 | |||
Distribution fee payable | 1,191 | |||
Accrued expenses | 301,502 | |||
|
| |||
Total liabilities | 497,705,705 | |||
|
| |||
Net Assets | $ | 919,014,306 | ||
|
| |||
| Composition of Net Assets | ||||
Capital stock, at par | $ | 113,617 | ||
Additional paid-in capital | 956,156,127 | |||
Distributions in excess of net investment income | (704,342 | ) | ||
Accumulated net realized loss on investment and foreign currency transactions | (76,219,275 | ) | ||
Net unrealized appreciation on investments and foreign currency denominated assets and liabilities | 39,668,179 | |||
|
| |||
| $ | 919,014,306 | |||
|
|
Net Asset Value Per Share—30 billion shares of capital stock authorized, $.001 par value
| Class | Net Assets | Shares Outstanding | Net Asset Value | |||||||||
| ||||||||||||
| A | $ | 2,104,405 | 260,302 | $ | 8.08 | * | ||||||
| ||||||||||||
| C | $ | 1,132,865 | 139,989 | $ | 8.09 | |||||||
| ||||||||||||
| Advisor | $ | 915,777,036 | 113,216,270 | $ | 8.09 | |||||||
| ||||||||||||
| * | The maximum offering price per share for Class A shares was $8.44 which reflects a sales charge of 4.25%. |
See notes to financial statements.
| 42 | • AB INCOME FUND |
Statement of Assets & Liabilities
STATEMENT OF OPERATIONS
| For the Period January 1, 2016 to October 31, 2016(a) | Year Ended December 31, 2015 | |||||||
| Investment Income | ||||||||
Interest (net of foreign taxes withheld of $6,755 and $11,419, respectively) | $ | 62,340,759 | $ | 96,143,365 | ||||
Dividends | ||||||||
Unaffiliated issuers | 1,628,234 | 331,360 | ||||||
Affiliated issuers | 183,152 | 72,367 | ||||||
Other income | 327,167 | (b) | 60,717 | |||||
|
|
|
| |||||
Total income | 64,479,312 | 96,607,809 | ||||||
|
|
|
| |||||
| Expenses | ||||||||
Advisory fee (see Note B) | 6,979,775 | 8,908,641 | ||||||
Distribution fee—Class A | 1,010 | – 0 | – | |||||
Distribution fee—Class C | 1,828 | – 0 | – | |||||
Transfer agency—Class A | 544 | – 0 | – | |||||
Transfer agency—Class C | 297 | – 0 | – | |||||
Transfer agency—Advisor Class | 616,077 | 116,242 | ||||||
Registration fees | 276,652 | 217,039 | ||||||
Custodian | 190,723 | 276,061 | ||||||
Audit and tax | 147,372 | 152,148 | ||||||
Printing | 131,745 | 883,747 | ||||||
Legal | 104,362 | 279,305 | ||||||
Administrative | 58,970 | 63,721 | ||||||
Directors’ fees | 20,241 | 21,161 | ||||||
Miscellaneous | 94,066 | 156,482 | ||||||
|
|
|
| |||||
Total expenses before interest expense | 8,623,662 | 11,074,547 | ||||||
Interest expense | 3,404,843 | 2,622,406 | ||||||
|
|
|
| |||||
Total expenses | 12,028,505 | 13,696,953 | ||||||
Less: expenses waived and reimbursed by the Adviser (see Note B) | (1,007,078 | ) | – 0 | – | ||||
|
|
|
| |||||
Net expenses | 11,021,427 | 13,696,953 | ||||||
|
|
|
| |||||
Net investment income | 53,457,885 | 82,910,856 | ||||||
|
|
|
| |||||
| Realized and Unrealized Gain (Loss) on Investment and Foreign Currency Transactions | ||||||||
Net realized gain (loss) on: | ||||||||
Investment transactions | 52,062,051 | 44,482,755 | ||||||
Futures | (62,992,173 | ) | (22,468,647 | ) | ||||
Options written | 839,322 | 647,736 | ||||||
Swaptions written | – 0 | – | 169,290 | |||||
Swaps | 1,661,378 | (12,387,670 | ) | |||||
Foreign currency transactions | (5,526,847 | ) | 14,125,240 | |||||
Net change in unrealized appreciation/depreciation of: | ||||||||
Investments | 58,888,002 | (134,192,070 | ) | |||||
Futures | 11,282,603 | 18,118,579 | ||||||
Options written | – 0 | – | (44,134 | ) | ||||
Swaps | (1,323,160 | ) | 4,438,126 | |||||
Foreign currency denominated assets and liabilities | (3,902,924 | ) | 2,371,013 | |||||
|
|
|
| |||||
Net gain (loss) on transactions | 50,988,252 | (84,739,782 | ) | |||||
|
|
|
| |||||
Net Increase (Decrease) in Net Assets from Operations | $ | 104,446,137 | $ | (1,828,926 | ) | |||
|
|
|
| |||||
| (a) | AllianceBernstein Income Fund’s (the “Predecessor Fund”) fiscal year end was December 31 and the Fund’s fiscal year end is October 31. |
| (b) | Other income includes a non-recurring refund for overbilling of prior years’ custody out-of-pocket fees. |
See notes to financial statements.
| AB INCOME FUND • | 43 |
Statement of Operations
STATEMENT OF CHANGES IN NET ASSETS
| For the Period January 1, 2016 to October 31, 2016(a) | Year Ended December 31, 2015 | Year Ended December 31, 2014 | ||||||||||
| Increase (Decrease) in Net Assets from Operations | ||||||||||||
Net investment income | $ | 53,457,885 | $ | 82,910,856 | $ | 100,504,848 | ||||||
Net realized gain (loss) on investment and foreign currency transactions | (13,956,269 | ) | 24,568,704 | (14,555,797 | ) | |||||||
Net change in unrealized appreciation/depreciation of investments and foreign currency denominated assets and liabilities | 64,944,521 | (109,308,486 | ) | 60,564,273 | ||||||||
|
|
|
|
|
| |||||||
Net increase (decrease) in net assets from operations | 104,446,137 | (1,828,926 | ) | 146,513,324 | ||||||||
| Dividends and Distributions to Shareholders from | ||||||||||||
Net investment income | ||||||||||||
Class A | (15,961 | ) | – 0 | – | – 0 | – | ||||||
Class C | (5,811 | ) | – 0 | – | – 0 | – | ||||||
Advisor Class | (53,017,830 | ) | (101,719,576 | ) | (107,988,728 | ) | ||||||
Net realized gain on investment transactions | ||||||||||||
Advisor Class | – 0 | – | (9,712,602 | ) | – 0 | – | ||||||
| Capital Stock Transactions | ||||||||||||
Net decrease | (828,348,508 | ) | – 0 | – | – 0 | – | ||||||
| Common Stock (see Note E) | ||||||||||||
Repurchase of Shares (12,172,242 and 14,903,847 shares, respectively) | – 0 | – | (92,499,158 | ) | (112,501,549 | ) | ||||||
|
|
|
|
|
| |||||||
Total decrease | 776,941,973 | (205,760,262 | ) | (73,976,953 | ) | |||||||
| Net Assets | ||||||||||||
Beginning of period | 1,695,956,279 | 1,901,716,541 | 1,975,693,494 | |||||||||
|
|
|
|
|
| |||||||
End of period (including distributions in excess of net investment income of ($704,342) and ($3,296,673), respectively) | $ | 919,014,306 | $ | 1,695,956,279 | $ | 1,901,716,541 | ||||||
|
|
|
|
|
| |||||||
| (a) | The Predecessor Fund’s fiscal year end was December 31 and the Fund’s fiscal year end is October 31. |
See notes to financial statements.
| 44 | • AB INCOME FUND |
Statement of Changes in Net Assets
STATEMENT OF CASH FLOWS
For the Period January 1, 2016 to October 31, 2016(a)
| Cash Flows from Operating Activities | ||||||||
Net increase in net assets from operations | $ | 104,446,137 | ||||||
| Reconciliation of Net Increase in Net Assets from Operations to Net Increase in Cash from Operating Activities: | ||||||||
Purchases of long-term investments | $ | (290,846,904 | ) | |||||
Purchases of short-term investments | (729,231,720 | ) | ||||||
Proceeds from disposition of long-term investments | 1,558,301,566 | |||||||
Proceeds from disposition of short-term investments | 794,545,989 | |||||||
Net realized loss on investment transactions and foreign currency transactions | 13,956,269 | |||||||
Net change in unrealized appreciation/depreciation of investments and foreign currency denominated assets and liabilities | (64,944,521 | ) | ||||||
Net accretion of bond discount and amortization of bond premium | 16,073,891 | |||||||
Increase in receivable for investments sold | (13,005,745 | ) | ||||||
Decrease in interest receivable | 12,555,825 | |||||||
Decrease in affiliated dividends receivable | 6,952 | |||||||
Decrease in due from custodian | (317,253 | ) | ||||||
Decrease in cash collateral due from broker | 3,693,362 | |||||||
Increase in payable for investments purchased | 13,903,093 | |||||||
Decrease in advisory fee payable | (576,729 | ) | ||||||
Decrease in accrued expenses | (527,965 | ) | ||||||
Proceeds from options written, net | 859,689 | |||||||
Proceeds on swaps, net | 805,424 | |||||||
Payments for exchange-traded derivatives settlements | (51,785,963 | ) | ||||||
|
| |||||||
Total adjustments | 1,263,465,260 | |||||||
|
| |||||||
Net increase in cash from operating activities | $ | 1,367,911,397 | ||||||
|
| |||||||
Cash Flows from Financing Activities | ||||||||
Repurchase of Shares | (839,022,141 | ) | ||||||
Increase in due to custodian | 1,398 | |||||||
Cash dividends paid (net of dividend reinvestments)* | (68,974,869 | ) | ||||||
Repayment of reverse repurchase agreements | (466,065,455 | ) | ||||||
|
| |||||||
Net decrease in cash from financing activities | (1,374,061,067 | ) | ||||||
Effect of exchange rate on cash | (5,432,508 | ) | ||||||
|
| |||||||
Net decrease in cash | (11,582,178 | ) | ||||||
Net change in cash | ||||||||
Cash at beginning of year | 11,717,835 | |||||||
|
| |||||||
Cash at end of year | $ | 135,657 | ||||||
|
| |||||||
* Reinvestment of dividends | $ | 12,625,155 | ||||||
Supplemental disclosure of cash flow information: | ||||||||
Interest expense paid during the year | $ | 3,653,581 |
| (a) | AllianceBernstein Income Fund’s (the “Predecessor Fund”) fiscal year end was December 31 and the Fund’s fiscal year end is October 31. |
In accordance with U.S. GAAP, the Fund has included a Statement of Cash Flows as a result of its significant investments in reverse repurchase agreements throughout the year.
See notes to financial statements.
| AB INCOME FUND • | 45 |
Statement of Cash Flows
NOTES TO FINANCIAL STATEMENTS
October 31, 2016
NOTE A
Significant Accounting Policies
AB Bond Fund, Inc. (the “Company”) is registered under the Investment Company Act of 1940 as an open-end management investment company. The Company, which is a Maryland corporation, operates as a series company comprised of ten portfolios currently in operation. Each Portfolio is considered to be a separate entity for financial reporting and tax purposes. This report relates only to the AB Income Fund, Inc. (the “Fund”), a diversified portfolio. The fund acquired the assets and liabilities of the AllianceBernstein Income Fund, Inc., a closed-end fund (the “Predecessor Fund”) that was effective at the close of business April 21, 2016 (the “Reorganization”). The Reorganization was approved by the Predecessor Fund’s Board of Directors (the “Board”) and shareholders pursuant to an Agreement and Plan of Acquisition and Dissolution (the “Reorganization Agreement”), see Note I for additional information. The Predecessor Fund was the accounting survivor in the Reorganization and as such, the financial statements and the Advisor Class shares financial highlights reflect the financial information of the Predecessor Fund through April 21, 2016. The Fund has authorized the issuance of Class A, Class B, Class C, Advisor Class, Class R, Class K, Class I, Class Z, Class 1 and Class 2 shares. Class B, Class R, Class I, Class Z, Class 1 and Class 2 shares are not currently offered. Class A shares are sold with a front-end sales charge of up to 4.25% for purchases not exceeding $1,000,000. With respect to purchases of $1,000,000 or more, Class A shares redeemed within one year of purchase may be subject to a contingent deferred sales charge of 1%. Class C shares are subject to a contingent deferred sales charge of 1% on redemptions made within the first year after purchase. Advisor Class shares are sold without any initial or contingent deferred sales charge and are not subject to ongoing distribution expenses. All ten classes of shares have identical voting, dividend, liquidation and other rights, except that the classes bear different distribution and transfer agency expenses. Each class has exclusive voting rights with respect to its distribution plan. The financial statements have been prepared in conformity with U.S. generally accepted accounting principles (“U.S. GAAP”) which require management to make certain estimates and assumptions that affect the reported amounts of assets and liabilities in the financial statements and amounts of income and expenses during the reporting period. Actual results could differ from those estimates. The Fund is an investment company under U.S. GAAP and follows the accounting and reporting guidance applicable to investment companies. The following is a summary of significant accounting policies followed by the Fund.
1. Security Valuation
Portfolio securities are valued at their current market value determined on the basis of market quotations or, if market quotations are not readily
| 46 | • AB INCOME FUND |
Notes to Financial Statements
available or are deemed unreliable, at “fair value” as determined in accordance with procedures established by and under the general supervision of the Company’s Board of Directors (the “Board”).
In general, the market values of securities which are readily available and deemed reliable are determined as follows: securities listed on a national securities exchange (other than securities listed on the NASDAQ Stock Market, Inc. (“NASDAQ”)) or on a foreign securities exchange are valued at the last sale price at the close of the exchange or foreign securities exchange. If there has been no sale on such day, the securities are valued at the last traded price from the previous day. Securities listed on more than one exchange are valued by reference to the principal exchange on which the securities are traded; securities listed only on NASDAQ are valued in accordance with the NASDAQ Official Closing Price; listed or over the counter (“OTC”) market put or call options are valued at the mid level between the current bid and ask prices. If either a current bid or current ask price is unavailable, AllianceBernstein L.P. (the “Adviser”) will have discretion to determine the best valuation (e.g. last trade price in the case of listed options); open futures are valued using the closing settlement price or, in the absence of such a price, the most recent quoted bid price. If there are no quotations available for the day of valuation, the last available closing settlement price is used; U.S. Government securities and any other debt instruments having 60 days or less remaining until maturity are generally valued at market by an independent pricing vendor, if a market price is available. If a market price is not available, the securities are valued at amortized cost. This methodology is commonly used for short term securities that have an original maturity of 60 days or less, as well as short term securities that had an original term to maturity that exceeded 60 days. In instances when amortized cost is utilized, the Valuation Committee (the “Committee”) must reasonably conclude that the utilization of amortized cost is approximately the same as the fair value of the security. Such factors the Committee will consider include, but are not limited to, an impairment of the creditworthiness of the issuer or material changes in interest rates. Fixed-income securities, including mortgage-backed and asset-backed securities, may be valued on the basis of prices provided by a pricing service or at a price obtained from one or more of the major broker-dealers. In cases where broker-dealer quotes are obtained, the Adviser may establish procedures whereby changes in market yields or spreads are used to adjust, on a daily basis, a recently obtained quoted price on a security. Swaps and other derivatives are valued daily, primarily using independent pricing services, independent pricing models using market inputs, as well as third party broker-dealers or counterparties. Open end mutual funds are valued at the closing net asset value per share, while exchange traded funds are valued at the closing market price per share.
| AB INCOME FUND • | 47 |
Notes to Financial Statements
Securities for which market quotations are not readily available (including restricted securities) or are deemed unreliable are valued at fair value as deemed appropriate by the Adviser. Factors considered in making this determination may include, but are not limited to, information obtained by contacting the issuer, analysts, analysis of the issuer’s financial statements or other available documents. In addition, the Fund may use fair value pricing for securities primarily traded in non-U.S. markets because most foreign markets close well before the Fund values its securities at 4:00 p.m., Eastern Time. The earlier close of these foreign markets gives rise to the possibility that significant events, including broad market moves, may have occurred in the interim and may materially affect the value of those securities. To account for this, the Fund may frequently value many of its foreign equity securities using fair value prices based on third party vendor modeling tools to the extent available.
2. Fair Value Measurements
In accordance with U.S. GAAP regarding fair value measurements, fair value is defined as the price that the Fund would receive to sell an asset or pay to transfer a liability in an orderly transaction between market participants at the measurement date. U.S. GAAP establishes a framework for measuring fair value, and a three-level hierarchy for fair value measurements based upon the transparency of inputs to the valuation of an asset or liability (including those valued based on their market values as described in Note A.1 above). Inputs may be observable or unobservable and refer broadly to the assumptions that market participants would use in pricing the asset or liability. Observable inputs reflect the assumptions market participants would use in pricing the asset or liability based on market data obtained from sources independent of the Fund. Unobservable inputs reflect the Fund’s own assumptions about the assumptions that market participants would use in pricing the asset or liability based on the best information available in the circumstances. Each investment is assigned a level based upon the observability of the inputs which are significant to the overall valuation. The three-tier hierarchy of inputs is summarized below.
| • | Level 1—quoted prices in active markets for identical investments |
| • | Level 2—other significant observable inputs (including quoted prices for similar investments, interest rates, prepayment speeds, credit risk, etc.) |
| • | Level 3—significant unobservable inputs (including the Fund’s own assumptions in determining the fair value of investments) |
The fair value of debt instruments, such as bonds, and over-the-counter derivatives is generally based on market price quotations, recently executed market transactions (where observable) or industry recognized
| 48 | • AB INCOME FUND |
Notes to Financial Statements
modeling techniques and are generally classified as Level 2. Pricing vendor inputs to Level 2 valuations may include quoted prices for similar investments in active markets, interest rate curves, coupon rates, currency rates, yield curves, option adjusted spreads, default rates, credit spreads and other unique security features in order to estimate the relevant cash flows which are then discounted to calculate fair values. If these inputs are unobservable and significant to the fair value, these investments will be classified as Level 3. In addition, non-agency rated investments are classified as Level 3.
Where readily available market prices or relevant bid prices are not available for certain equity investments, such investments may be valued based on similar publicly traded investments, movements in relevant indices since last available prices or based upon underlying company fundamentals and comparable company data (such as multiples to earnings or other multiples to equity). Where an investment is valued using an observable input, such as another publicly traded security, the investment will be classified as Level 2. If management determines that an adjustment is appropriate based on restrictions on resale, illiquidity or uncertainty, and such adjustment is a significant component of the valuation, the investment will be classified as Level 3. An investment will also be classified as Level 3 where management uses company fundamentals and other significant inputs to determine the valuation.
Valuations of mortgage-backed or other asset-backed securities, by pricing vendors, are based on both proprietary and industry recognized models and discounted cash flow techniques. Significant inputs to the valuation of these instruments are value of the collateral, the rates and timing of delinquencies, the rates and timing of prepayments, and default and loss expectations, which are driven in part by housing prices for residential mortgages. Significant inputs are determined based on relative value analyses, which incorporate comparisons to instruments with similar collateral and risk profiles, including relevant indices. Mortgage and asset-backed securities for which management has collected current observable data through pricing services are generally categorized within Level 2. Those investments for which current observable data has not been provided are classified as Level 3.
Bank loan prices are provided by third party pricing services and consist of a composite of the quotes received by the vendor into a consensus price. Certain bank loans are classified as Level 3, as significant input used in the fair value measurement of these instruments is the market quotes that are received by the vendor and these inputs are not observable.
Other fixed income investments, including non-U.S. government and corporate debt, are generally valued using quoted market prices, if available, which are typically impacted by current interest rates, maturity dates and any perceived credit risk of the issuer.
| AB INCOME FUND • | 49 |
Notes to Financial Statements
Additionally, in the absence of quoted market prices, these inputs are used by pricing vendors to derive a valuation based upon industry or proprietary models which incorporate issuer specific data with relevant yield/spread comparisons with more widely quoted bonds with similar key characteristics. Those investments for which there are observable inputs are classified as Level 2. Where the inputs are not observable, the investments are classified as Level 3.
The following table summarizes the valuation of the Fund’s investments by the above fair value hierarchy levels as of October 31, 2016:
Investments in | Level 1 | Level 2 | Level 3 | Total | ||||||||||||
Assets: | ||||||||||||||||
Governments – Treasuries | $ | – 0 | – | $ | 876,917,819 | $ | – 0 | – | $ | 876,917,819 | ||||||
Collateralized Mortgage Obligations | – 0 | – | 123,352,950 | 3,977,389 | 127,330,339 | |||||||||||
Corporates – Non-Investment Grade | – 0 | – | 102,451,005 | 4,215,547 | (a) | 106,666,552 | ||||||||||
Commercial Mortgage-Backed Securities | – 0 | – | 4,148,688 | 48,863,351 | 53,012,039 | |||||||||||
Corporates – Investment Grade | – 0 | – | 46,694,207 | – 0 | – | 46,694,207 | ||||||||||
Agencies | – 0 | – | 39,390,808 | – 0 | – | 39,390,808 | ||||||||||
Emerging Markets – Sovereigns | – 0 | – | 22,774,780 | – 0 | – | 22,774,780 | ||||||||||
Whole Loan Trusts | – 0 | – | – 0 | – | 20,704,736 | 20,704,736 | ||||||||||
Emerging Markets – Corporate Bonds | – 0 | – | 15,793,379 | 447,328 | 16,240,707 | |||||||||||
Asset-Backed Securities | – 0 | – | 8,717,121 | 3,522,021 | 12,239,142 | |||||||||||
Emerging Markets – Treasuries | – 0 | – | 11,976,430 | – 0 | – | 11,976,430 | ||||||||||
Quasi-Sovereigns | – 0 | – | 9,105,055 | – 0 | – | 9,105,055 | ||||||||||
Governments – Sovereign Agencies | – 0 | – | 7,604,349 | – 0 | – | 7,604,349 | ||||||||||
Local Governments – Municipal Bonds | – 0 | – | 6,939,008 | – 0 | – | 6,939,008 | ||||||||||
Local Governments – Regional Bonds | – 0 | – | 1,976,005 | – 0 | – | 1,976,005 | ||||||||||
Common Stocks | 511,295 | – 0 | – | 1,428,957 | 1,940,252 | |||||||||||
Governments – Sovereign Bonds | – 0 | – | 1,184,909 | – 0 | – | 1,184,909 | ||||||||||
Options Purchased – Puts | – 0 | – | 422,093 | – 0 | – | 422,093 | ||||||||||
Bank Loans | – 0 | – | – 0 | – | 227,922 | 227,922 | ||||||||||
Mortgage Pass-Throughs | – 0 | – | 43,800 | – 0 | – | 43,800 | ||||||||||
Warrants | 16,745 | – 0 | – | – 0 | –(a) | 16,745 | ||||||||||
Short-Term Investments | 12,471,125 | – 0 | – | – 0 | – | 12,471,125 | ||||||||||
Investments valued at NAV(b) | 1,184,586 | |||||||||||||||
|
|
|
|
|
|
|
| |||||||||
Total Investments in Securities | 12,999,165 | 1,279,492,406 | 83,387,251 | 1,377,063,408 | ||||||||||||
|
|
|
|
|
|
|
| |||||||||
| 50 | • AB INCOME FUND |
Notes to Financial Statements
Investments in | Level 1 | Level 2 | Level 3 | Total | ||||||||||||
Other Financial Instruments(c): | ||||||||||||||||
Assets: | ||||||||||||||||
Futures | $ | 12,381,323 | $ | – 0 | – | $ | – 0 | – | $ | 12,381,323 | (d) | |||||
Forward Currency Exchange Contracts | – 0 | – | 3,933,424 | – 0 | – | 3,933,424 | ||||||||||
Centrally Cleared Credit Default Swaps | – 0 | – | 1,018,007 | – 0 | – | 1,018,007 | (d) | |||||||||
Credit Default Swaps | – 0 | – | 35,745 | – 0 | – | 35,745 | ||||||||||
Interest Rate Swaps | – 0 | – | 84,836 | – 0 | – | 84,836 | ||||||||||
Liabilities: | ||||||||||||||||
Forward Currency Exchange Contracts | – 0 | – | (2,750,702 | ) | – 0 | – | (2,750,702 | ) | ||||||||
Centrally Cleared Credit Default Swaps | – 0 | – | (120,276 | ) | – 0 | – | (120,276 | )(d) | ||||||||
Centrally Cleared Interest Rate Swaps | – 0 | – | (6,031,100 | ) | – 0 | – | (6,031,100 | )(d) | ||||||||
Credit Default Swaps | – 0 | – | (2,561,563 | ) | – 0 | – | (2,561,563 | ) | ||||||||
Interest Rate Swaps | – 0 | – | (70,600 | ) | – 0 | – | (70,600 | ) | ||||||||
|
|
|
|
|
|
|
| |||||||||
Total(e) | $ | 25,380,488 | $ | 1,273,030,177 | $ | 83,387,251 | $ | 1,382,982,502 | ||||||||
|
|
|
|
|
|
|
| |||||||||
| (a) | The Fund held securities with zero market value at period end. |
| (b) | In May 2015, the Financial Accounting Standards Board issued an Accounting Standards Update, ASU 2015-07 (the “ASU”) which removes the requirement to categorize within the fair value hierarchy all investments for which fair value is measured using the net asset value per share practical expedient. The ASU is effective for annual periods beginning after December 15, 2015 and interim periods within those annual periods, with application of the amendments noted above retrospectively to all periods presented. The retrospective approach requires that an investment for which fair value is measured using the net asset value per share practical expedient be removed from the fair value hierarchy in all periods presented herein. Accordingly, the total investments with a fair value of $1,184,586 have not been categorized in the fair value hierarchy. |
| (c) | Other financial instruments are derivative instruments, such as futures, forwards and swaps, which are valued at the unrealized appreciation/depreciation on the instrument. |
| (d) | Only variation margin receivable/payable at period end is reported within the statement of assets and liabilities. This amount reflects cumulative unrealized appreciation/(depreciation) of exchange-traded derivatives as reported in the portfolio of investments. |
| (e) | There were no transfers between Level 1 and Level 2 during the reporting period. |
The Fund recognizes all transfers between levels of the fair value hierarchy assuming the financial instruments were transferred at the beginning of the reporting period.
| AB INCOME FUND • | 51 |
Notes to Financial Statements
The following is a reconciliation of investments in which significant unobservable inputs (Level 3) were used in determining fair value.
| Collateralized Mortgage Obligations | Corporates - Non-Investment Grade(a) | Commercial Mortgage- Backed Securities | ||||||||||
Balance as of 12/31/15 | $ | 97,375,665 | $ | 7,013,931 | $ | 60,751,150 | ||||||
Accrued discounts/(premiums) | 759 | 325,244 | 119,266 | |||||||||
Realized gain (loss) | (326,578 | ) | (356,765 | ) | (609,939 | ) | ||||||
Change in unrealized appreciation/depreciation | 173,882 | (857,592 | ) | 187,026 | ||||||||
Purchases/Payups | 3,017,572 | 431,810 | 1,613,034 | |||||||||
Sales/Paydowns | (3,925,673 | ) | (2,341,081 | ) | (13,197,186 | ) | ||||||
Transfers in to Level 3 | – 0 | – | – 0 | – | – 0 | – | ||||||
Transfers out of Level 3 | (92,338,238 | ) | – 0 | – | – 0 | – | ||||||
|
|
|
|
|
| |||||||
Balance as of 10/31/16 | $ | 3,977,389 | $ | 4,215,547 | $ | 48,863,351 | ||||||
|
|
|
|
|
| |||||||
Net change in unrealized appreciation/depreciation from investments held as of 10/31/16(b) | $ | 58,997 | $ | (857,592 | ) | $ | (441,547 | ) | ||||
|
|
|
|
|
| |||||||
| Whole Loan Trusts | Emerging Markets - Corporate Bonds | Asset-Backed Securities | ||||||||||
Balance as of 12/31/15 | $ | 26,950,760 | $ | – 0 | – | $ | 1,744,238 | |||||
Accrued discounts/(premiums) | 45,945 | (1,818 | ) | – 0 | – | |||||||
Realized gain (loss) | (1,191,005 | ) | – 0 | – | – 0 | – | ||||||
Change in unrealized appreciation/depreciation | (950,547 | ) | 213,710 | 8,983 | ||||||||
Purchases/Payups | 2,887,526 | – 0 | – | 1,977,000 | ||||||||
Sales/Paydowns | (7,037,943 | ) | – 0 | – | (208,200 | ) | ||||||
Transfers in to Level 3 | – 0 | – | 235,436 | – 0 | – | |||||||
Transfers out of Level 3 | – 0 | – | – 0 | – | – 0 | – | ||||||
|
|
|
|
|
| |||||||
Balance as of 10/31/16 | $ | 20,704,736 | $ | 447,328 | $ | 3,522,021 | ||||||
|
|
|
|
|
| |||||||
Net change in unrealized appreciation/depreciation from investments held as of 10/31/16(b) | $ | (948,693 | ) | $ | 213,710 | $ | 8,983 | |||||
|
|
|
|
|
| |||||||
| Common Stocks | Bank Loans | Warrants(a) | ||||||||||
Balance as of 12/31/15 | $ | 22,554,552 | $ | 4,226,990 | $ | – 0 | – | |||||
Accrued discounts/(premiums) | – 0 | – | 13,014 | – 0 | – | |||||||
Realized gain (loss) | (228,625 | ) | (414,302 | ) | – 0 | – | ||||||
Change in unrealized appreciation/depreciation | (1,649,595 | ) | (531,306 | ) | – 0 | – | ||||||
Purchases/Payups | – 0 | – | 150,334 | – 0 | – | |||||||
Sales/Paydowns | (19,247,375 | ) | (3,216,808 | ) | – 0 | – | ||||||
Transfers in to Level 3 | – 0 | – | – 0 | – | – 0 | – | ||||||
Transfers out of Level 3 | – 0 | – | – 0 | – | – 0 | – | ||||||
|
|
|
|
|
| |||||||
Balance as of 10/31/16 | $ | 1,428,957 | $ | 227,922 | $ | – 0 | – | |||||
|
|
|
|
|
| |||||||
Net change in unrealized appreciation/depreciation from investments held as of 10/31/16(b) | $ | (280,892 | ) | $ | (1,016,905 | ) | $ | – 0 | – | |||
|
|
|
|
|
| |||||||
| 52 | • AB INCOME FUND |
Notes to Financial Statements
| Total | ||||||||||||
Balance as of 12/31/15 | $ | 220,617,286 | ||||||||||
Accrued discounts/(premiums) | 502,410 | |||||||||||
Realized gain (loss) | (3,127,214 | ) | ||||||||||
Change in unrealized appreciation/depreciation | (3,405,439 | ) | ||||||||||
Purchases/Payups | 10,077,276 | |||||||||||
Sales/Paydowns | (49,174,266 | ) | ||||||||||
Transfers in to Level 3 | 235,436 | (c) | ||||||||||
Transfers out of Level 3 | (92,338,238 | )(d) | ||||||||||
|
| |||||||||||
Balance as of 10/31/16 | $ | 83,387,251 | ||||||||||
|
| |||||||||||
Net change in unrealized appreciation/depreciation from investments held as of 10/31/16(b) | $ | (3,263,939 | ) | |||||||||
|
| |||||||||||
| (a) | The Fund held securities with zero market value at period end. |
| (b) | The unrealized appreciation/depreciation is included in net change in unrealized appreciation/depreciation on investments and other financial instruments in the accompanying statement of operations. |
| (c) | There were de minimis transfers under 1% of net assets from Level 2 to Level 3 during the reporting period. |
| (d) | An amount of $92,388,238 was transferred out of Level 3 into Level 2 as improved transparency of price inputs has increased the observability of such inputs during the reporting period. |
The following presents information about significant unobservable inputs related to the Fund’s Level 3 investments at October 31, 2016. Securities priced i) by third party vendors, or ii) using prior transaction prices, which approximates fair value, are excluded from the following table.
Quantitative Information about Level 3 Fair Value Measurements
| Fair Value at 10/31/16 | Valuation | Unobservable | Input | |||||||
Whole Loan Trusts | $ | 2,461,024 | Recovery Analysis | Deliquency Rate | <4% | |||||
| $ | 586,036 | Recovery Analysis | Deliquency Rate Collateralization | <5% >1.1X | ||||||
| $ | 151,696 | Recovery Analysis | Pro-Rata Appraisal Value of Collateral | $489,724 | ||||||
| $ | 349,225 | Recovery Analysis | Pro-Rata Appraisal Value of Collateral | $631,883 | ||||||
| $ | 175,929 | Recovery Analysis | Pro-Rata Appraisal Value of Collateral | $464,192 | ||||||
| $ | 2,579,639 | Discounted Cashflow | Level Yield Discount Rate | 13.45% 13.45% | ||||||
| $ | 1,032,429 | Discounted Cashflow | Cash Flow Yield Discount Rate | 89.22% 12.99% | ||||||
| $ | 2,956,806 | Market- Approach | Underlying NAV of the collateral | $102.54 | ||||||
| $ | 813,532 | Recovery Analysis | Cumulative Loss | <22.00% | ||||||
| $ | 1,892,268 | Recovery Analysis | Cumulative Loss | <20.00% | ||||||
| AB INCOME FUND • | 53 |
Notes to Financial Statements
| Fair Value at 10/31/16 | Valuation | Unobservable | Input | |||||||
| $ | 7,706,152 | Discounted Cashflow | Level Yield Discount Rate | 94.60% 7.47% | ||||||
|
| |||||||||
| $ | 20,704,736 | |||||||||
|
| |||||||||
Common Stocks | $ | 364,270 | Market- Approach | EBITDA* Projection EBITDA* Multiples | $94MM 8.5X | |||||
| $ | 995,732 | Market- Approach | EBITDA* Projection EBITDA* Multiples | $207.0MM 8.0X | ||||||
|
| |||||||||
| $ | 1,360,002 | |||||||||
|
| |||||||||
Bank Loans | $ | 227,922 | Recovery Analysis | Liquidation / New Financing Probability and Assigned Discounted Market Values | 85% Probability of Liquidation, Using a Value of $10 15% Probability of New Financing, Using a Value of $30 | |||||
| * | Earnings before Interest, Taxes, Depreciation and Amortization. |
Generally, a change in the assumptions used in any input in isolation may be accompanied by a change in another input. Significant changes in any of the unobservable inputs may significantly impact the fair value measurement. Significant increases (decreases) in discount rate, level yield, cumulative loss and delinquency rate in isolation would be expected to result in a significantly lower (higher) fair value measurement. A significant increase (decrease) in appraisal value and EBITDA projections/multiples in insolation would be expected to result in a significant higher (lower) fair value measurement.
The Adviser established the Committee to oversee the pricing and valuation of all securities held in the Fund. The Committee operates under pricing and valuation policies and procedures established by the Adviser and approved by the Board, including pricing policies which set forth the mechanisms and processes to be employed on a daily basis to implement these policies and procedures. In particular, the pricing policies describe how to determine market quotations for securities and other instruments. The Committee’s responsibilities include: 1) fair value and liquidity determinations (and oversight of any third parties to whom any responsibility for fair value and liquidity determinations is delegated), and 2) regular monitoring of the Adviser’s pricing and valuation policies and procedures and modification or enhancement of these policies and procedures (or recommendation of the modification of these policies and procedures) as the Committee believes appropriate.
The Committee is also responsible for monitoring the implementation of the pricing policies by the Adviser’s Pricing Group (the “Pricing Group”) and a third party which performs certain pricing functions in accordance with the pricing policies. The Pricing Group is responsible for the oversight of the third party on a day-to-day basis. The Committee and the
| 54 | • AB INCOME FUND |
Notes to Financial Statements
Pricing Group perform a series of activities to provide reasonable assurance of the accuracy of prices including: 1) periodic vendor due diligence meetings, review of methodologies, new developments and processes at vendors, 2) daily comparison of security valuation versus prior day for all securities that exceeded established thresholds, and 3) daily review of unpriced, stale, and variance reports with exceptions reviewed by senior management and the Committee.
In addition, several processes outside of the pricing process are used to monitor valuation issues including: 1) performance and performance attribution reports are monitored for anomalous impacts based upon benchmark performance, and 2) portfolio managers review all portfolios for performance and analytics (which are generated using the Adviser’s prices).
3. Currency Translation
Assets and liabilities denominated in foreign currencies and commitments under forward currency exchange contracts are translated into U.S. dollars at the mean of the quoted bid and ask prices of such currencies against the U.S. dollar. Purchases and sales of portfolio securities are translated into U.S. dollars at the rates of exchange prevailing when such securities were acquired or sold. Income and expenses are translated into U.S. dollars at rates of exchange prevailing when accrued.
The Fund does not isolate that portion of the results of operations resulting from changes in foreign exchange rates on investments from the fluctuations arising from changes in market prices of securities held. Such fluctuations are included with the net realized and unrealized gain or loss from investments.
Net realized gain or loss on foreign currency transactions represents foreign exchange gains and losses from sales and maturities of foreign fixed income investments, foreign currency exchange contracts, holding of foreign currencies, currency gains or losses realized between the trade and settlement dates on foreign investment transactions, and the difference between the amounts of dividends, interest and foreign withholding taxes recorded on the Fund’s books and the U.S. dollar equivalent amounts actually received or paid. Net unrealized currency gains and losses from valuing foreign currency denominated assets and liabilities at period end exchange rates are reflected as a component of net unrealized appreciation or depreciation of foreign currency denominated assets and liabilities.
4. Taxes
It is the Fund’s policy to meet the requirements of the Internal Revenue Code applicable to regulated investment companies and to distribute all of its investment company taxable income and net realized gains, if any, to shareholders. Therefore, no provisions for federal income or excise
| AB INCOME FUND • | 55 |
Notes to Financial Statements
taxes are required. The Fund may be subject to taxes imposed by countries in which it invests. Such taxes are generally based on income and/or capital gains earned or repatriated. Taxes are accrued and applied to net investment income, net realized gains and net unrealized appreciation/depreciation as such income and/or gains are earned.
In accordance with U.S. GAAP requirements regarding accounting for uncertainties in income taxes, management has analyzed the Fund’s tax positions taken or expected to be taken on federal and state income tax returns for all open tax years (the current and the prior three tax years) and has concluded that no provision for income tax is required in the Fund’s financial statements.
5. Investment Income and Investment Transactions
Dividend income is recorded on the ex-dividend date or as soon as the Fund is informed of the dividend. Interest income is accrued daily. Investment transactions are accounted for on the date the securities are purchased or sold. Investment gains or losses are determined on the identified cost basis. The Fund amortizes premiums and accretes discounts as adjustments to interest income.
6. Class Allocations
All income earned and expenses incurred by the Fund are borne on a pro-rata basis by each outstanding class of shares, based on the proportionate interest in the Fund represented by the net assets of such class, except for class specific expenses which are allocated to the respective class. Expenses of the Company are charged proportionately to each fund or based on other appropriate methods. Realized and unrealized gains and losses are allocated among the various share classes based on respective net assets.
7. Dividends and Distributions
Dividends and distributions to shareholders, if any, are recorded on the ex-dividend date. Income dividends and capital gains distributions are determined in accordance with federal tax regulations and may differ from those determined in accordance with U.S. GAAP. To the extent these differences are permanent, such amounts are reclassified within the capital accounts based on their federal tax basis treatment; temporary differences do not require such reclassification.
8. Repurchase Agreements
It is the Fund’s policy that its custodian or designated subcustodian take control of securities as collateral under repurchase agreements and to determine on a daily basis that the value of such securities are sufficient to cover the value of the repurchase agreements. If the seller defaults and the value of the collateral declines or if bankruptcy proceedings are commenced with respect to the seller of the security, realization of collateral by the Fund may be delayed or limited.
| 56 | • AB INCOME FUND |
Notes to Financial Statements
9. Redemption Fees
The Fund imposed a .75% fee on redemption and exchanges of Advisor Class shares. This fee is retained by the Fund and is included in the financials statements as a component of additional paid-in capital. The fee was effective until July 22, 2016.
10. Change of Fiscal Year End
The Predecessor Fund’s fiscal year end was December 31 and the Fund’s fiscal year end is October 31. Accordingly, the statement of operations, statement of changes in net assets, statement of cash flows and the Advisor Class financial highlights reflect the ten months from January 1, 2016 to October 31, 2016. The financial highlights for Class A and Class C reflect the period from April 21, 2016 (inception date) to October 31, 2016.
NOTE B
Advisory Fee and Other Transactions with Affiliates
Under the terms of the investment advisory agreement, the Fund pays the Adviser the Adviser an advisory fee at an annual rate of .60% of the first $2.5 billion of the Fund’s average daily net assets, .55% of the excess over $2.5 billion up to $5 billion and .50% in excess of $5 billion, of the Fund’s average daily net assets. The fee is accrued daily and paid monthly. The Adviser has agreed to waive its fees and bear certain expenses to the extent necessary to limit total operating expenses (excluding expenses associated with securities sold short, acquired fund fees and expenses other than the advisory fees of any AB Mutual Funds in which the Fund may invest, interest expense, taxes, extraordinary expenses, and brokerage commissions and other transactions cost), on an annual basis (the “Expense Caps”) to .88%, 1.63% and .63% of daily average net assets for Class A, Class C, and Advisor Class shares, respectively. Any fees waived and expenses borne by the Adviser through October 31, 2016 are subject to repayment by the Fund until October 31, 2019; such waivers that are subject to repayment amount to $990,111. In any case, no repayment will be made that would cause the Fund’s total annual operating expenses to exceed the net fee percentage set forth above. The Expense Caps may not be terminated by the Adviser before April 22, 2018. The Predecessor Fund did not have an Expense Cap. For the period ended October 31, 2016, such reimbursement/waivers amounted to $990,111. Prior to April 21, 2016, the Predecessor Fund paid the Adviser a monthly advisory fee in an amount equal to the sum of 1/12th of .30 of 1% of the Predecessor Fund’s average weekly net assets up to $250 million, 1/12th .25 of 1% of the Predecessor Fund’s average weekly net assets in excess of $250 million, and 4.75% of the Predecessor Fund’s daily gross income (i.e., income other than gains from the sale of securities and foreign currency transactions or gains realized from options, futures and swap, less interest on money borrowed by the Predecessor Fund) accrued by the Predecessor Fund during the month. However, such monthly advisory fee shall not exceed in the aggregate
| AB INCOME FUND • | 57 |
Notes to Financial Statements
1/12th of .80% of the Predecessor Fund’s average weekly net assets during the month (approximately .80% on an annual basis).
Pursuant to the investment advisory agreement, the Fund may reimburse the Adviser for certain legal and accounting services provided to the Fund by the Adviser. For the period ended October 31, 2016, the reimbursement for such services amounted to $58,970. For year ended December 31, 2015, the reimbursement for such services amounted to $63,721.
The Fund compensates AllianceBernstein Investor Services, Inc. (“ABIS”), a wholly-owned subsidiary of the Adviser, under a Transfer Agency Agreement for providing personnel and facilities to perform transfer agency services for the Fund. ABIS may make payments to intermediaries that provide omnibus account services, sub-accounting services and/or networking services. Prior to the Reorganization Computershare Trust Company, N.A. was the Transfer Agent. Such compensation retained by ABIS amounted to $273,303 for the period ended October 31, 2016.
AllianceBernstein Investments, Inc. (the “Distributor”), a wholly-owned subsidiary of the Adviser, serves as the distributor of the Fund’s shares. The Distributor has advised the Fund that it has retained front-end sales charges of $758 from the sale of Class A shares and received $0 and $0 in contingent deferred sales charges imposed upon redemptions by shareholders of Class A and Class C shares, respectively, for the period ended October 31, 2016.
The AB Fixed-Income Shares, Inc.—Government STIF Portfolio (the “Government STIF Portfolio”), prior to June 1, 2016, was offered as a cash management option to mutual funds and other institutional accounts of the Adviser, and was not available for direct purchase by members of the public. Prior to June 1, 2016, the Government STIF Portfolio paid no advisory fees but did bear its own expenses. As of June 1, 2016, the Government STIF Portfolio, which was renamed “AB Government Money Market Portfolio” (the “Government Money Market Portfolio”), has a contractual advisory fee rate of .20% and continues to bear its own expenses. In connection with the investment by the Fund in the Government Money Market Portfolio, the Adviser has agreed to waive its advisory fee from the Fund in an amount equal to the Fund’s share of the advisory fees of Government Money Market Portfolio, as borne indirectly by the Fund as an acquired fund fee and expense. For the period ended October 31, 2016, such waiver amounted to $16,967. A summary of the Fund’s transactions in shares of the Government Money Market Portfolio for the period ended October 31, 2016 is as follows:
Market Value 12/31/15 (000) | Purchases at Cost (000) | Sales Proceeds (000) | Market Value 10/31/16 (000) | Dividend Income(a) (000) | ||||||||||||
| $ 78,338 | $ | 728,587 | $ | 794,454 | $ | 12,471 | $ | 183 | ||||||||
| (a) | For the year ended December 31, 2015, the Fund received dividend income of $72,367. |
| 58 | • AB INCOME FUND |
Notes to Financial Statements
Brokerage commissions paid on investment transactions for the period ended October 31, 2016 amounted to $74,559, of which $0 and $0, respectively, was paid to Sanford C. Bernstein & Co. LLC and Sanford C. Bernstein Limited, affiliates of the Adviser.
NOTE C
Distribution Services Agreement
The Fund has adopted a Distribution Services Agreement (the “Agreement”) pursuant to Rule 12b-1 under the Investment Company Act of 1940. Under the Agreement, the Fund pay distribution and servicing fees to the Distributor at an annual rate of up to .25% of the Fund’s average daily net assets attributable to Class A shares and 1% of the Fund’s average daily net assets attributable to Class C shares. There are no distribution and servicing fees on the Advisor Class shares. The fees are accrued daily and paid monthly. The Agreement provides that the Distributor will use such payments in their entirety for distribution assistance and promotional activities. Since the commencement of the Fund’s operations, the Distributor has incurred expenses in excess of the distribution costs reimbursed by the Fund in the amount of $7,956 for Class C shares. While such costs may be recovered from the Fund in future periods so long as the Agreement is in effect, the rate of the distribution and servicing fees payable under the Agreement may not be increased without a shareholder vote. In accordance with the Agreement, there is no provision for recovery of unreimbursed distribution costs incurred by the Distributor beyond the current fiscal year for Class A shares. The Agreement also provides that the Adviser may use its own resources to finance the distribution of the Fund’s shares.
NOTE D
Investment Transactions
Purchases and sales of investment securities (excluding short-term investments) for the period ended October 31, 2016 were as follows:
| Purchases | Sales | |||||||
Investment securities (excluding | $ | 97,508,021 | $ | 361,010,664 | ||||
U.S. government securities | 193,338,883 | 1,172,352,343 | ||||||
The cost of investments for federal income tax purposes, gross unrealized appreciation and unrealized depreciation (excluding futures, foreign currency, written options and swap transactions) are as follows:
Cost | $ | 1,343,918,863 | ||
|
| |||
Gross unrealized appreciation | $ | 72,144,961 | ||
Gross unrealized depreciation | (39,000,416 | ) | ||
|
| |||
Net unrealized appreciation | $ | 33,144,545 | ||
|
|
| AB INCOME FUND • | 59 |
Notes to Financial Statements
1. Derivative Financial Instruments
The Fund may use derivatives in an effort to earn income and enhance returns, to replace more traditional direct investments, to obtain exposure to otherwise inaccessible markets (collectively, “investment purposes”), or to hedge or adjust the risk profile of its portfolio.
The principal types of derivatives utilized by the Fund, as well as the methods in which they may be used are:
| • | Futures |
The Fund may buy or sell futures for investment purposes or for the purpose of hedging its portfolio against adverse effects of potential movements in the market. The Fund bears the market risk that arises from changes in the value of these instruments and the imperfect correlation between movements in the price of the futures and movements in the price of the assets, reference rates or indices which they are designed to track. Among other things, the Fund may purchase or sell futures for foreign currencies or options thereon for non-hedging purposes as a means of making direct investment in foreign currencies, as described below under “Currency Transactions”.
At the time the Fund enters into futures, the Fund deposits and maintains as collateral an initial margin with the broker, as required by the exchange on which the transaction is effected. Such amount is shown as cash collateral due from broker on the statement of assets and liabilities. Pursuant to the contract, the Fund agrees to receive from or pay to the broker an amount of cash equal to the daily fluctuation in the value of the contract. Such receipts or payments are known as variation margin and are recorded by the Fund as unrealized gains or losses. Risks may arise from the potential inability of a counterparty to meet the terms of the contract. The credit/counterparty risk for exchange-traded futures is generally less than privately negotiated futures, since the clearinghouse, which is the issuer or counterparty to each exchange-traded future, has robust risk mitigation standards, including the requirement to provide initial and variation margin. When the contract is closed, the Fund records a realized gain or loss equal to the difference between the value of the contract at the time it was opened and the time it was closed.
Use of long futures subjects the Fund to risk of loss in excess of the amounts shown on the statement of assets and liabilities, up to the notional value of the futures. Use of short futures subjects the Fund to unlimited risk of loss. Under some circumstances, futures exchanges may establish daily limits on the amount that the price of futures can vary from the previous day’s settlement price, which could effectively prevent liquidation of unfavorable positions.
| 60 | • AB INCOME FUND |
Notes to Financial Statements
During the period ended October 31, 2016, the Fund held futures for hedging purposes.
| • | Forward Currency Exchange Contracts |
The Fund may enter into forward currency exchange contracts in order to hedge its exposure to changes in foreign currency exchange rates on its foreign portfolio holdings, to hedge certain firm purchase and sale commitments denominated in foreign currencies and for non-hedging purposes as a means of making direct investments in foreign currencies, as described below under “Currency Transactions”.
A forward currency exchange contract is a commitment to purchase or sell a foreign currency at a future date at a negotiated forward rate. The gain or loss arising from the difference between the original contract and the closing of such contract would be included in net realized gain or loss on foreign currency transactions. Fluctuations in the value of open forward currency exchange contracts are recorded for financial reporting purposes as unrealized appreciation and/or depreciation by the Fund. Risks may arise from the potential inability of a counterparty to meet the terms of a contract and from unanticipated movements in the value of a foreign currency relative to the U.S. dollar.
During the period ended October 31, 2016, the Fund held forward currency exchange contracts for hedging and non-hedging purposes.
| • | Option Transactions |
For hedging and investment purposes, the Fund may purchase and write (sell) put and call options on U.S. and foreign securities, including government securities, and foreign currencies that are traded on U.S. and foreign securities exchanges and over-the-counter markets. Among other things, the Fund may use options transactions for non-hedging purposes as a means of making direct investments in foreign currencies, as described below under “Currency Transactions” and may use options strategies involving the purchase and/or writing of various combinations of call and/or put options, for hedging and investment purposes.
The risk associated with purchasing an option is that the Fund pays a premium whether or not the option is exercised. Additionally, the Fund bears the risk of loss of the premium and change in market value should the counterparty not perform under the contract. Put and call options purchased are accounted for in the same manner as portfolio securities. The cost of securities acquired through the exercise of call options is increased by premiums paid. The proceeds from securities sold through the exercise of put options are decreased by the premiums paid.
| AB INCOME FUND • | 61 |
Notes to Financial Statements
When the Fund writes an option, the premium received by the Fund is recorded as a liability and is subsequently adjusted to the current market value of the option written. Premiums received from written options which expire unexercised are recorded by the Fund on the expiration date as realized gains from options written. The difference between the premium received and the amount paid on effecting a closing purchase transaction, including brokerage commissions, is also treated as a realized gain, or if the premium received is less than the amount paid for the closing purchase transaction, as a realized loss. If a call option is exercised, the premium received is added to the proceeds from the sale of the underlying security or currency in determining whether the Fund has realized a gain or loss. If a put option is exercised, the premium received reduces the cost basis of the security or currency purchased by the Fund. In writing an option, the Fund bears the market risk of an unfavorable change in the price of the security or currency underlying the written option. Exercise of an option written by the Fund could result in the Fund selling or buying a security or currency at a price different from the current market value.
During the period ended October 31, 2016, the Fund held purchased options for hedging and non-hedging purposes. During the period ended October 31, 2016, the Fund held written options for hedging and non-hedging purposes.
For the period ended October 31, 2016, the Fund had the following transactions in written options:
| Number of Contracts | Premiums Received | |||||||
Options written outstanding as of 12/31/15 | – 0 | – | $ | – 0 | – | |||
Options written | 5,022,942,936 | 1,250,314 | ||||||
Options assigned | (17,176,000 | ) | (25,764 | ) | ||||
Options expired | (4,881,870,936 | ) | (792,849 | ) | ||||
Options bought back | (123,896,000 | ) | (431,701 | ) | ||||
Options exercised | – 0 | – | – 0 | – | ||||
|
|
|
| |||||
Options written outstanding as of 10/31/16 | – 0 | – | $ | – 0 | – | |||
|
|
|
| |||||
| • | Swaps |
The Fund may enter into swaps to hedge its exposure to interest rates, credit risk, or currencies. The Fund may also enter into swaps for non-hedging purposes as a means of gaining market exposures, including by making direct investments in foreign currencies, as described below under “Currency Transactions”. A swap is an agreement that obligates two parties to exchange a series of cash flows at specified intervals based upon or calculated by reference to
| 62 | • AB INCOME FUND |
Notes to Financial Statements
changes in specified prices or rates for a specified amount of an underlying asset. The payment flows are usually netted against each other, with the difference being paid by one party to the other. In addition, collateral may be pledged or received by the Fund in accordance with the terms of the respective swaps to provide value and recourse to the Fund or its counterparties in the event of default, bankruptcy or insolvency by one of the parties to the swap.
Risks may arise as a result of the failure of the counterparty to the swap to comply with the terms of the swap. The loss incurred by the failure of a counterparty is generally limited to the net interim payment to be received by the Fund, and/or the termination value at the end of the contract. Therefore, the Fund considers the creditworthiness of each counterparty to a swap in evaluating potential counterparty risk. This risk is mitigated by having a netting arrangement between the Fund and the counterparty and by the posting of collateral by the counterparty to the Fund to cover the Fund’s exposure to the counterparty. Additionally, risks may arise from unanticipated movements in interest rates or in the value of the underlying securities. The Fund accrues for the interim payments on swaps on a daily basis, with the net amount recorded within unrealized appreciation/depreciation of swaps on the statement of assets and liabilities, where applicable. Once the interim payments are settled in cash, the net amount is recorded as realized gain/(loss) on swaps on the statement of operations, in addition to any realized gain/(loss) recorded upon the termination of swaps. Upfront premiums paid or received are recognized as cost or proceeds on the statement of assets and liabilities and are amortized on a straight line basis over the life of the contract. Amortized upfront premiums are included in net realized gain/(loss) from swaps on the statement of operations. Fluctuations in the value of swaps are recorded as a component of net change in unrealized appreciation/depreciation of swaps on the statement of operations.
Certain standardized swaps, including certain interest rate swaps and credit default swaps, are (or soon will be) subject to mandatory central clearing. Cleared swaps are transacted through futures commission merchants (“FCMs”) that are members of central clearinghouses, with the clearinghouse serving as central counterparty, similar to transactions in futures contracts. Centralized clearing will be required for additional categories of swaps on a phased-in basis based on requirements published by the Securities and Exchange Commission and Commodity Futures Trading Commission.
| AB INCOME FUND • | 63 |
Notes to Financial Statements
At the time the Fund enters into a centrally cleared swap, the Fund deposits and maintains as collateral an initial margin with the broker, as required by the clearinghouse on which the transaction is effected. Such amount is shown as cash collateral due from broker on the statement of assets and liabilities. Pursuant to the contract, the Fund agrees to receive from or pay to the broker an amount of cash equal to the daily fluctuation in the value of the contract. Such receipts or payments are known as variation margin and are recorded by the Fund as unrealized gains or losses. Risks may arise from the potential inability of a counterparty to meet the terms of the contract. The credit/counterparty risk for centrally cleared swaps is generally less than non-centrally cleared swaps, since the clearinghouse, which is the issuer or counterparty to each centrally cleared swap, has robust risk mitigation standards, including the requirement to provide initial and variation margin. When the contract is closed, the Fund records a realized gain or loss equal to the difference between the value of the contract at the time it was opened and the time it was closed.
Interest Rate Swaps:
The Fund is subject to interest rate risk exposure in the normal course of pursuing its investment objectives. Because the Fund holds fixed rate bonds, the value of these bonds may decrease if interest rates rise. To help hedge against this risk and to maintain its ability to generate income at prevailing market rates, the Fund may enter into interest rate swaps. Interest rate swaps are agreements between two parties to exchange cash flows based on a notional amount. The Fund may elect to pay a fixed rate and receive a floating rate, or, receive a fixed rate and pay a floating rate on a notional amount.
In addition, the Fund may also enter into interest rate swap transactions to preserve a return or spread on a particular investment or portion of its portfolio, or protecting against an increase in the price of securities the Fund anticipates purchasing at a later date. Interest rate swaps involve the exchange by a Fund with another party of their respective commitments to pay or receive interest (e.g., an exchange of floating rate payments for fixed rate payments) computed based on a contractually-based principal (or “notional”) amount. Interest rate swaps are entered into on a net basis (i.e., the two payment streams are netted out, with the Fund receiving or paying, as the case may be, only the net amount of the two payments).
During the period ended October 31, 2016, the Fund held interest rate swaps for hedging and non-hedging purposes.
| 64 | • AB INCOME FUND |
Notes to Financial Statements
Credit Default Swaps:
The Fund may enter into credit default swaps, including to manage its exposure to the market or certain sectors of the market, to reduce its risk exposure to defaults by corporate and sovereign issuers held by the Fund, or to create exposure to corporate or sovereign issuers to which it is not otherwise exposed. The Fund may purchase credit protection (“Buy Contract”) or provide credit protection (“Sale Contract”) on the referenced obligation of the credit default swap. During the term of the swap, the Fund receives/(pays) fixed payments from/(to) the respective counterparty, calculated at the agreed upon rate applied to the notional amount. If the Fund is a buyer/(seller) of protection and a credit event occurs, as defined under the terms of the swap, the Fund will either (i) receive from the seller/(pay to the buyer) of protection an amount equal to the notional amount of the swap (the “Maximum Payout Amount”) and deliver/(take delivery of) the referenced obligation or (ii) receive/(pay) a net settlement amount in the form of cash or securities equal to the notional amount of the swap less the recovery value of the referenced obligation.
In certain circumstances Maximum Payout Amounts may be partially offset by recovery values of the respective referenced obligations, upfront premium received upon entering into the agreement, or net amounts received from settlement of buy protection credit default swaps entered into by the Fund for the same reference obligation with the same counterparty. As of October 31, 2016, the Portfolio had Buy Contracts outstanding with respect to the same referenced obligation and same counterparty for its Sales Contracts which may partially offset the Maximum Payout Amount in the amount of $49,497,000.
Credit default swaps may involve greater risks than if a Fund had invested in the referenced obligation directly. Credit default swaps are subject to general market risk, liquidity risk, counterparty risk and credit risk. If the Fund is a buyer of protection and no credit event occurs, it will lose the payments it made to its counterparty. If the Fund is a seller of protection and a credit event occurs, the value of the referenced obligation received by the Fund coupled with the periodic payments previously received, may be less than the Maximum Payout Amount it pays to the buyer, resulting in a net loss to the Fund.
Implied credit spreads over U.S. Treasuries of comparable maturity utilized in determining the market value of credit default swaps on issuers as of period end are disclosed in the portfolio of investments. The implied spreads serve as an indicator of the current status of the
| AB INCOME FUND • | 65 |
Notes to Financial Statements
payment/performance risk and typically reflect the likelihood of default by the issuer of the referenced obligation. The implied credit spread of a particular reference obligation also reflects the cost of buying/selling protection and may reflect upfront payments required to be made to enter into the agreement. Widening credit spreads typically represent a deterioration of the referenced obligation’s credit soundness and greater likelihood of default or other credit event occurring as defined under the terms of the agreement. A credit spread identified as “Defaulted” indicates a credit event has occurred for the referenced obligation.
During the period ended October 31, 2016, the Fund held credit default swaps for hedging and non-hedging purposes.
The Fund typically enters into International Swaps and Derivatives Association, Inc. Master Agreements (“ISDA Master Agreement”) or similar master agreements (collectively, “Master Agreements”) with its derivative contract counterparties in order to, among other things, reduce its credit risk to counterparties. ISDA Master Agreements include provisions for general obligations, representations, collateral and events of default or termination. Under an ISDA Master Agreement, the Fund typically may offset with the counterparty certain derivative financial instrument’s payables and/or receivables with collateral held and/or posted and create one single net payment (close-out netting) in the event of default or termination.
Various Master Agreements govern the terms of certain transactions with counterparties, including transactions such as derivative transactions, repurchase and reverse repurchase agreements. These Master Agreements typically attempt to reduce the counterparty risk associated with such transactions by specifying credit protection mechanisms and providing standardization that improves legal certainty. Cross-termination provisions under Master Agreements typically provide that a default in connection with one transaction between the Fund and a counterparty gives the non-defaulting party the right to terminate any other transactions in place with the defaulting party to create one single net payment due to/due from the defaulting party. In the event of a default by a Master Agreements counterparty, the return of collateral with market value in excess of the Fund’s net liability, held by the defaulting party, may be delayed or denied.
The Fund’s Master Agreements may contain provisions for early termination of OTC derivative transactions in the event the net assets of the Fund decline below specific levels (“net asset contingent features”). If these levels are triggered, the Fund’s counterparty has the right to terminate such transaction and require the Fund to pay or receive a settlement amount in connection with the terminated transaction. For additional details, please refer to netting arrangements by counterparty tables below.
| 66 | • AB INCOME FUND |
Notes to Financial Statements
During the period ended October 31, 2016, the Fund had entered into the following derivatives:
Asset Derivatives | Liability Derivatives | |||||||||||
Derivative | Statement of Assets and Liabilities Location | Fair Value | Statement of Assets and Liabilities Location | Fair Value | ||||||||
Interest rate contracts | Receivable/Payable for variation margin on exchange-traded derivatives | $ | 12,381,323 | * | Receivable/Payable for variation margin on exchange-traded derivatives | $ | 6,031,100 | * | ||||
Credit contracts | Receivable/Payable for variation margin on exchange-traded derivatives | | 1,018,007 | * | Receivable/Payable for variation margin on exchange-traded derivatives | | 120,276 | * | ||||
Foreign exchange contracts | Unrealized appreciation on forward currency exchange contracts | | 3,933,424 | | Unrealized depreciation on forward currency exchange contracts | | 2,750,702 | | ||||
Foreign exchange contracts | Investments in securities, at value | | 422,093 | | ||||||||
Interest rate contracts | Unrealized appreciation on interest rate swaps | | 84,836 | | Unrealized depreciation on interest rate swaps | | 70,600 | | ||||
Credit contracts | Unrealized appreciation on credit default swaps | | 35,745 | | Unrealized depreciation on credit default swaps | | 2,561,563 | | ||||
|
|
|
| |||||||||
Total | $ | 17,875,428 | $ | 11,534,241 | ||||||||
|
|
|
| |||||||||
| * | Only variation margin receivable/payable at period end is reported within the statement of assets and liabilities. This amount reflects cumulative appreciation/(depreciation) of exchange-traded derivatives as reported in the portfolio of investments. |
Derivative Type | Location of Gain or (Loss) on Derivatives Within Statement of Operations | Realized Gain or (Loss) on Derivatives | Change in Unrealized Appreciation or (Depreciation) | |||||||
Interest rate contracts | Net realized gain (loss) on futures; Net change in unrealized appreciation/depreciation of futures | $ | (62,992,173 | ) | $ | 11,282,603 | ||||
| AB INCOME FUND • | 67 |
Notes to Financial Statements
Derivative Type | Location of Gain or (Loss) on Derivatives Within Statement of Operations | Realized Gain or (Loss) on Derivatives | Change in Unrealized Appreciation or (Depreciation) | |||||||
Foreign exchange contracts | Net realized gain (loss) on foreign currency transactions; Net change in unrealized appreciation/depreciation of foreign currency denominated assets and liabilities | $ | 4,048,695 | $ | (3,997,263 | ) | ||||
Foreign exchange contracts | Net realized gain (loss) on investment transactions; Net change in unrealized appreciation/depreciation of investments | – 0 | – | (130,066 | ) | |||||
Foreign exchange contracts | Net realized gain (loss) on options written; Net change in unrealized appreciation/depreciation of options written | 839,322 | – 0 | – | ||||||
Interest rate contracts | Net realized gain (loss) on swaps; Net change in unrealized appreciation/depreciation of swaps | (1,995,536 | ) | (139,881 | ) | |||||
Credit contracts | Net realized gain (loss) on swaps; Net change in unrealized appreciation/depreciation of swaps | 3,656,914 | (1,183,279 | ) | ||||||
|
|
|
| |||||||
Total | $ | (56,442,778 | ) | $ | 5,832,114 | |||||
|
|
|
| |||||||
The following table represents the average monthly volume of the Fund’s derivative transactions during the period ended October 31, 2016:
Futures: | ||||
Average original value of sale contracts | $ | 640,291,197 | ||
Forward Currency Exchange Contracts: | ||||
Average principal amount of buy contracts | $ | 177,881,794 | ||
Average principal amount of sale contracts | $ | 236,101,911 | ||
Purchased Options: | ||||
Average monthly cost | $ | 321,895 | (a) | |
Interest Rate Swaps: | ||||
Average notional amount | $ | 38,734,422 | (b) | |
| 68 | • AB INCOME FUND |
Notes to Financial Statements
Centrally Cleared Interest Rate Swaps: | ||||
Average notional amount | $ | 680,633,872 | ||
Credit Default Swaps: | ||||
Average notional amount of sale contracts | $ | 28,994,545 | ||
Centrally Cleared Credit Default Swaps: | ||||
Average notional amount of buy contracts | $ | 11,147,511 | (c) | |
Average notional amount of sale contracts | $ | 49,051,615 |
| (a) | Positions were open for two months during the period. |
| (b) | Positions were open for less than one month during the period. |
| (c) | Positions were open for seven months during the period. |
For financial reporting purposes, the Fund does not offset derivative assets and derivative liabilities that are subject to netting arrangements in the statement of assets and liabilities.
All derivatives held at period end were subject to netting arrangements. The following table presents the Fund’s derivative assets and liabilities by counterparty net of amounts available for offset under Master Agreements (“MA”) and net of the related collateral received/pledged by the Fund as of October 31, 2016:
Counterparty | Derivative Assets Subject to a MA | Derivative Available for Offset | Cash Collateral Received | Security Collateral Received | Net Amount of Derivatives Assets | |||||||||||||||
OTC Derivatives: | ||||||||||||||||||||
Bank of America, NA | $ | 912,792 | $ | (70,600 | ) | $ | – 0 | – | $ | – 0 | – | $ | 842,192 | |||||||
Barclays Bank PLC | 76,796 | (76,796 | ) | – 0 | – | – 0 | – | – 0 | – | |||||||||||
BNP Paribas SA | 988,685 | – 0 | – | – 0 | – | – 0 | – | 988,685 | ||||||||||||
Citibank, NA | 505,806 | (505,806 | ) | – 0 | – | – 0 | – | – 0 | – | |||||||||||
Credit Suisse International | 202,531 | (202,531 | ) | – 0 | – | – 0 | – | – 0 | – | |||||||||||
Goldman Sachs Bank USA | 1,023,463 | (1,023,463 | ) | – 0 | – | – 0 | – | – 0 | – | |||||||||||
JPMorgan Chase Bank, NA | 206,830 | – 0 | – | – 0 | – | – 0 | – | 206,830 | ||||||||||||
Morgan Stanley & Co., Inc. | 241,296 | (241,296 | ) | – 0 | – | – 0 | – | – 0 | – | |||||||||||
Royal Bank of Scotland PLC | 145,037 | (145,037 | ) | – 0 | – | – 0 | – | – 0 | – | |||||||||||
Standard Chartered Bank | 137,117 | (4,015 | ) | – 0 | – | – 0 | – | 133,102 | ||||||||||||
|
|
|
|
|
|
|
|
|
| |||||||||||
Total | $ | 4,440,353 | $ | (2,269,544 | ) | $ | – 0 | – | $ | – 0 | – | $ | 2,170,809 | ^ | ||||||
|
|
|
|
|
|
|
|
|
| |||||||||||
| AB INCOME FUND • | 69 |
Notes to Financial Statements
Counterparty | Derivative Liabilities Subject to a MA | Derivative Available for Offset | Cash Collateral Pledged* | Security Collateral Pledged* | Net Amount of Derivatives Liabilities | |||||||||||||||
Exchange-Traded Derivatives: | ||||||||||||||||||||
Citigroup Global Markets, Inc.** | $ | 16,499 | $ | – 0 | – | $ | (16,499 | ) | $ | – 0 | – | $ | – 0 | – | ||||||
Morgan Stanley & Co., LLC** | 869,937 | – 0 | – | – 0 | – | (869,937 | ) | – 0 | – | |||||||||||
|
|
|
|
|
|
|
|
|
| |||||||||||
Total | $ | 886,436 | $ | – 0 | – | $ | (16,499 | ) | $ | (869,937 | ) | $ | – 0 | – | ||||||
|
|
|
|
|
|
|
|
|
| |||||||||||
OTC Derivatives: | ||||||||||||||||||||
Bank of America, NA | $ | 70,600 | $ | (70,600 | ) | $ | – 0 | – | $ | – 0 | – | $ | – 0 | – | ||||||
Barclays Bank PLC | 773,591 | (76,796 | ) | – 0 | – | (696,795 | ) | – 0 | – | |||||||||||
Citibank, NA | 554,049 | (505,806 | ) | – 0 | – | – 0 | – | 48,243 | ||||||||||||
Credit Suisse International | 667,380 | (202,531 | ) | – 0 | – | (464,849 | ) | – 0 | – | |||||||||||
Goldman Sachs Bank USA/Goldman Sachs International | 4,253,535 | (1,023,463 | ) | – 0 | – | (3,218,368 | ) | 11,704 | ||||||||||||
Morgan Stanley & Co., Inc. | 681,422 | (241,296 | ) | – 0 | – | – 0 | – | 440,126 | ||||||||||||
Royal Bank of Scotland PLC | 161,342 | (145,037 | ) | – 0 | – | – 0 | – | 16,305 | ||||||||||||
Standard Chartered Bank | 4,015 | (4,015 | ) | – 0 | – | – 0 | – | – 0 | – | |||||||||||
State Street Bank & Trust Co. | 304,506 | – 0 | – | – 0 | – | – 0 | – | 304,506 | ||||||||||||
|
|
|
|
|
|
|
|
|
| |||||||||||
Total | $ | 7,470,440 | $ | (2,269,544 | ) | $ | – 0 | – | $ | (4,380,012 | ) | $ | 820,884 | ^ | ||||||
|
|
|
|
|
|
|
|
|
| |||||||||||
| * | The actual collateral received/pledged is more than the amount reported due to over-collateralization. |
| ** | Cash and securities have been posted for initial margin requirements for exchange-traded derivatives outstanding at October 31, 2016. |
| ^ | Net amount represents the net receivable/payable that would be due from/to the counterparty in the event of default or termination. The net amount from OTC financial derivative instruments can only be netted across transactions governed under the same master agreement with the same counterparty. |
| 70 | • AB INCOME FUND |
Notes to Financial Statements
2. Currency Transactions
The Fund may invest in non-U.S. Dollar-denominated securities on a currency hedged or unhedged basis. The Fund may seek investment opportunities by taking long or short positions in currencies through the use of currency-related derivatives, including forward currency exchange contracts, futures and options on futures, swaps, and other options. The Fund may enter into transactions for investment opportunities when it anticipates that a foreign currency will appreciate or depreciate in value but securities denominated in that currency are not held by the Fund and do not present attractive investment opportunities. Such transactions may also be used when the Adviser believes that it may be more efficient than a direct investment in a foreign currency-denominated security. The Fund may also conduct currency exchange contracts on a spot basis (i.e., for cash at the spot rate prevailing in the currency exchange market for buying or selling currencies).
3. TBA and Dollar Rolls
The Fund may invest in TBA mortgage-backed securities. A TBA, or “To Be Announced”, trade represents a contract for the purchase or sale of mortgage-backed securities to be delivered at a future agree-upon date; however, the specific mortgage pool numbers or the number of pools that will be delivered to fulfill the trade obligation or terms of the contract are unknown at the time of the trade. Mortgage pools (including fixed-rate or variable-rate mortgages) guaranteed by the Government National Mortgage Association, or GNMA, the Federal National Mortgage Association, or FNMA, or the Federal Home Loan Mortgage Corporation, or FHLMC, are subsequently allocated to the TBA transactions.
The Fund may enter into dollar rolls. Dollar rolls involve sales by the Fund of securities for delivery in the current month and the Fund’s simultaneously contracting to repurchase substantially similar (same type and coupon) securities on a specified future date. During the roll period, the Fund forgoes principal and interest paid on the securities. The Fund is compensated by the difference between the current sales price and the lower forward price for the future purchase (often referred to as the “drop”) as well as by the interest earned on the cash proceeds of the initial sale. Dollar rolls involve the risk that the market value of the securities the Fund is obligated to repurchase under the agreement may decline below the repurchase price. Dollar rolls are speculative techniques. During the period ended October 31, 2016, the Fund had no transactions in dollar rolls.
4. Reverse Repurchase Agreements
The Fund may enter into reverse repurchase transactions (“RVP”) in accordance with the terms of a Master Repurchase Agreement (“MRA”), under which the Fund sells securities and agrees to repurchase them at a mutually agreed upon date and price. At the time the Fund enters into a
| AB INCOME FUND • | 71 |
Notes to Financial Statements
reverse repurchase agreement, it will establish a segregated account with the custodian containing liquid assets having a value comparable to the repurchase price. Under the MRA and other Master Agreements, the Fund is permitted to offset payables and/or receivables with collateral held and/or posted to the counterparty and create one single net payment due to or from the Fund in the event of a default. In the event of a default by a MRA counterparty, the Fund may be considered an unsecured creditor with respect to any excess collateral (collateral with a market value in excess of the repurchase price) held by and/or posted to the counterparty, and as such the return of such excess collateral may be delayed or denied. For the period ended October 31, 2016, the average amount of reverse repurchase agreements outstanding was $886,671,086 and the daily weighted average interest rate was 0.45%. At October 31, 2016, the Fund had reverse repurchase agreements outstanding in the amount of $470,248,155 as reported on the statement of assets and liabilities.
The following table presents the Fund’s RVP liabilities by counterparty net of the related collateral pledged by the Fund as of October 31, 2016:
Counterparty | RVP Liabilities Subject to a MRA | Securities Collateral Pledged†* | Net Amount of RVP Liabilities | |||||||||
Barclays Capital, Inc. | $ | 961,377 | $ | 961,377 | $ | 0 | ||||||
Credit Suisse Securities (USA) LLC | 1,071,338 | 1,071,338 | 0 | |||||||||
HSBC Bank USA | 311,969,550 | 311,969,550 | 0 | |||||||||
JP Morgan Chase Bank | 156,245,890 | 156,245,890 | 0 | |||||||||
|
|
|
|
|
| |||||||
Total | $ | 470,248,155 | $ | 470,248,155 | $ | 0 | ||||||
|
|
|
|
|
| |||||||
| † | Including accrued interest. |
| * | The actual collateral pledged may be more than the amount reported due to overcollateralization. |
5. Loan Participations and Assignments
The Fund may invest in direct debt instruments which are interests in amounts owed to lenders or lending syndicates by corporate, governmental, or other borrowers, either in the form of participations at the time the loan is originated (“Participations”) or by buying an interest in the loan in the secondary market from a financial institution or institutional investor (“Assignments”). A loan is often administered by a bank or other financial institution (the “Lender”) that acts as agent for all holders. The agent administers the term of the loan as specified in the loan agreement. When investing in Participations, the Fund generally has no right to enforce compliance with the terms of the loan agreement with the borrower. In addition, when investing in Participations, the Fund has the right to receive payments of principal, interest and any fees to which it is entitled only from the Lender and only upon receipt of payments by the Lender from the borrower. As a result, the Fund may be
| 72 | • AB INCOME FUND |
Notes to Financial Statements
subject to the credit risk of both the borrower and the Lender. When the Fund purchases Assignments from Lenders, it will typically acquire direct rights against the borrower on the loan. These loans may include participations in “bridge loans”, which are loans taken out by borrowers for a short period (typically less than six months) pending arrangement of more permanent financing through, for example, the issuance of bonds, frequently high-yield bonds issued for the purpose of acquisitions. The Fund may also participate in unfunded loan commitments, which are contractual obligations for investing in future Participations, may receive a commitment fee based on the amount of the commitment. Under these arrangements, the Fund may receive a fixed rate commitment fee and, if and to the extent the borrower borrows under the facility, the Fund may receive an additional funding fee.
Unfunded loan commitments and funded loans are marked to market daily.
During the period ended October 31, 2016, the Fund had no commitments outstanding and received no commitment fees or additional funding fees.
NOTE E
Common Stock
During the years ended December 31, 2015 and December 31, 2014 the Predecessor Fund did not issue any shares in connection with the Fund’s dividend reinvestment plan.
On June 25, 2014, the Predecessor Fund announced a share repurchase program for the Predecessor Fund’s discretionary repurchase of up to 15% of its then outstanding shares of common stock (valued at up to approximately $306 million as of June 24, 2014 based on Predecessor Fund total net assets of approximately $2.04 billion) in open market transactions over a one-year period. This share repurchase program is intended to benefit long-term Predecessor Fund stockholders by the repurchase of Predecessor Fund shares at a discount to their net asset value. During the years ended December 31, 2015 and December 31, 2014, the Predecessor Fund repurchased 12,172,242 and 14,903,847 shares, respectively, at an average discount of 10.45% and 10.09%, respectively, from net asset value. The share repurchase program expired on June 25, 2015.
| AB INCOME FUND • | 73 |
Notes to Financial Statements
NOTE F
Capital Stock
Each class consists of 3,000,000,000 authorized shares. Transactions in capital shares for each class were as follows:
| Shares | Amount | |||||||||||||||
For the Period January 1, 2016 to | For the Period January 1, 2016 to | |||||||||||||||
|
| |||||||||||||||
| Class A(b) | ||||||||||||||||
Shares sold | 299,970 | $ | 2,441,972 | |||||||||||||
| ||||||||||||||||
Shares issued in reinvestment of dividends and distributions | 1,566 | 12,705 | ||||||||||||||
| ||||||||||||||||
Shares redeemed | (41,234 | ) | (334,002 | ) | ||||||||||||
| ||||||||||||||||
Net increase | 260,302 | $ | 2,120,675 | |||||||||||||
| ||||||||||||||||
Class C(b) |
| |||||||||||||||
Shares sold | 139,491 | $ | 1,134,187 | |||||||||||||
| ||||||||||||||||
Shares issued in reinvestment of dividends and distributions | 533 | 4,327 | ||||||||||||||
| ||||||||||||||||
Shares redeemed | (35 | ) | (285 | ) | ||||||||||||
| ||||||||||||||||
Net increase | 139,989 | $ | 1,138,229 | |||||||||||||
| ||||||||||||||||
Advisor Class |
| |||||||||||||||
Shares sold | 1,526,459 | $ | 12,542,792 | |||||||||||||
| ||||||||||||||||
Shares issued in reinvestment of dividends and distributions | 1,556,770 | 12,608,123 | ||||||||||||||
| ||||||||||||||||
Shares redeemed | (105,702,567 | ) | (856,758,327 | ) | ||||||||||||
| ||||||||||||||||
Net decrease | (102,619,338 | ) | $ | (831,607,412 | ) | |||||||||||
| ||||||||||||||||
| (a) | The Predecessor Fund’s fiscal year end was December 31 and the Fund’s fiscal year end is October 31. |
| (b) | Inception date of April 21, 2016. |
NOTE G
Risks Involved in Investing in the Fund
Interest Rate Risk and Credit Risk—Interest rate risk is the risk that changes in interest rates will affect the value of the Fund’s investments in fixed-income debt securities such as bonds or notes. Increases in interest rates may cause the value of the Fund’s investments to decline. Credit risk is the risk that the issuer or guarantor of a debt security, or the counterparty to a derivative contract, will be unable or unwilling to make timely principal and/or interest payments, or to otherwise honor its obligations. The degree of risk for a particular security may be reflected in its credit rating. Credit risk is greater for medium quality and lower-rated securities. Lower-rated debt securities and similar unrated securities (commonly known as “junk bonds”) have speculative elements or are predominantly speculative risks.
| 74 | • AB INCOME FUND |
Notes to Financial Statements
Below Investment Grade Securities Risk—Investments in fixed-income securities with lower ratings (often referred to as “junk bonds”) are subject to higher probability that an issuer will default or fail to meet its payment obligations. These securities may be subject to greater price volatility due to such factors as specific corporate developments, negative perceptions of the junk bond market generally and less secondary market liquidity. These securities are often able to be “called” or repurchased by the issuer prior to their maturity date, forcing the Fund to reinvest the proceeds, possibly at a lower rate of return.
Duration Risk—Duration is a measure that relates the expected price volatility of a fixed-income security to changes in interest rates. The duration of a fixed-income security may be shorter than or equal to full maturity of a fixed-income security. Fixed-income securities with longer durations have more risk and will decrease in price as interest rates rise. For example, a fixed-income security with a duration of three years will decrease in value by approximately 3% if interest rates increase by 1%.
Inflation Risk—This is the risk that the value of assets or income from investments will be less in the future as inflation decreases the value of money. As inflation increases, the value of the Fund’s assets can decline as can the real value of the Fund’s distributions. This risk is significantly greater for fixed-income securities with longer maturities.
Foreign (Non-U.S.) Risk—Investments in securities of non-U.S. issuers may involve more risk than those of U.S. issuers. These securities may fluctuate more widely in price and may be less liquid due to adverse market, economic, political, regulatory or other factors.
Emerging Market Risk—Investments in emerging market countries may have more risk because the markets are less developed and less liquid, and because these investments may be subject to increased economic, political, regulatory, or other uncertainties.
Leverage Risk—When the Fund borrows money or otherwise leverages its investments, its performance may be volatile because leverage tends to exaggerate the effect of any increase or decrease in the value of the Fund’s investments. The Fund may create leverage through the use of reverse repurchase arrangements, forward currency exchange contracts, forward commitments, dollar rolls or futures or by borrowing money. The use of derivative instruments by the Fund, such as forwards, futures, options and swaps, may also result in a form of leverage. Leverage may result in higher returns to the Fund than if the Fund were not leveraged, but may also adversely affect returns, particularly if the market is declining.
Currency Risk—Fluctuations in currency exchange rates may negatively affect the value of the Fund’s investments or reduce its returns.
| AB INCOME FUND • | 75 |
Notes to Financial Statements
Liquidity Risk—Liquidity risk occurs when certain investments become difficult to purchase or sell. Difficulty in selling less liquid securities may result in sales at disadvantageous prices affecting the value of your investment in the Fund. Causes of liquidity risk may include low trading volumes, large positions and heavy redemptions of Fund shares. Over recent years, liquidity risk has also increased because the capacity of dealers in the secondary market for fixed-income securities to make markets in these securities has decreased, even as the overall bond market has grown significantly, due to, among other things, structural changes, additional regulatory requirements and capital and risk restraints that have led to reduced inventories. Liquidity risk may be higher in a rising interest rate environment, when the value and liquidity of fixed-income securities generally decline.
Mortgage-Backed and/or Other Asset-Backed Securities Risk—Investments in mortgage-backed and other asset-backed securities are subject to certain additional risks. The value of these securities may be particularly sensitive to changes in interest rates. These risks include “extension risk”, which is the risk that, in periods of rising interest rates, issuers may delay the payment of principal, and “prepayment risk”, which is the risk that in periods of falling interest rates, issuers may pay principal sooner than expected, exposing the Fund to a lower rate of return upon reinvestment of principal. Mortgage-backed securities offered by non-governmental issuers and other asset-backed securities may be subject to other risks, such as higher rates of default in the mortgages or assets backing the securities or risks associated with the nature and servicing of mortgages or assets backing the securities.
Derivatives Risk—The Fund may enter into derivative transactions such as forwards, options, futures and swaps. Derivatives may be illiquid, difficult to price, and leveraged so that small changes may produce disproportionate losses for the Fund, and subject to counterparty risk to a greater degree than more traditional investments. Derivatives may result in significant losses, including losses that are far greater than the value of the derivatives reflected on the statement of assets and liabilities.
Indemnification Risk—In the ordinary course of business, the Fund enters into contracts that contain a variety of indemnifications. The Fund’s maximum exposure under these arrangements is unknown. However, the Fund has not had prior claims or losses pursuant to these indemnification provisions and expects the risk of loss thereunder to be remote. Therefore, the Fund has not accrued any liability in connection with these indemnification provisions.
| 76 | • AB INCOME FUND |
Notes to Financial Statements
NOTE H
Distributions to Shareholders
The tax character of distributions paid during the fiscal period ended October 31, 2016 and years ended December 31, 2015 and December 31, 2014 were as follows:
| 2016 | 2015 | 2014 | ||||||||||
Distributions paid from: | ||||||||||||
Ordinary income | $ | 53,039,602 | $ | 107,568,721 | $ | 107,988,728 | ||||||
Net long-term capital gains | – 0 | – | 3,863,457 | – 0 | – | |||||||
|
|
|
|
|
| |||||||
Total taxable distributions paid | $ | 53,039,602 | $ | 111,432,178 | $ | 107,988,728 | ||||||
|
|
|
|
|
| |||||||
As of October 31, 2016, the components of accumulated earnings/(deficit) on a tax basis were as follows:
Undistributed ordinary income | $ | 1,654,845 | ||
Accumulated capital and other losses | (63,442,858 | )(a) | ||
Unrealized appreciation/(depreciation) | 28,372,985 | (b) | ||
|
| |||
Total accumulated earnings/(deficit) | $ | (33,415,028 | )(c) | |
|
|
| (a) | As of October 31, 2016, the cumulative deferred loss on straddles was $50,419,217. As of October 31, 2016, the Fund had a net capital loss carryforward of $13,023,641. |
| (b) | The differences between book-basis and tax-basis unrealized appreciation/(depreciation) are attributable primarily to the tax deferral of losses on wash sales, the tax treatment of swaps and partnership investments, the realization for tax purposes of gains/losses on certain derivative instruments, and the tax treatment of passive foreign investment companies (PFICs). |
| (c) | The differences between book-basis and tax-basis components of accumulated earnings/ (deficit) are attributable primarily to dividends payable and the tax treatment of defaulted securities. |
For tax purposes, net realized capital losses may be carried over to offset future capital gains, if any. Funds are permitted to carry forward capital losses incurred for an indefinite period, and such losses will retain their character as either short-term or long-term capital losses. As of October 31, 2016, the Fund had a net long-term capital loss carryforward of $13,023,641, which may be carried forward for an indefinite period.
During the current fiscal year, permanent differences primarily due to the tax treatment of swaps, options and swap clearing fees, reclassifications of foreign currency and paydown gains/losses, and the redesignation of dividends resulted in a net decrease in distributions in excess of net investment income and a net increase in accumulated net realized loss on investment and foreign currency transactions. These reclassifications had no effect on net assets.
| AB INCOME FUND • | 77 |
Notes to Financial Statements
NOTE I
Reorganization
At a meeting held on August 6, 2015 the Board, on behalf of the Fund, and the Board of Directors of the Predecessor Fund, approved the Reorganization Agreement providing for the tax-free acquisition by the Fund of the assets and liabilities of the Predecessor Fund, and the Predecessor Fund shareholders approved the Reorganization Agreement at a Special Meeting of Shareholders held on March 1, 2016. The acquisition was completed at the close of business April 21, 2016. Pursuant to the Reorganization Agreement, the assets and liabilities of the Predecessor Fund’s shares were transferred in exchange for the Fund’s Advisor Class shares, in a tax-free exchange as follows:
| Shares outstanding before the Reorganization | Shares outstanding immediately after the Reorganization | Aggregate net assets before the Reorganization | Aggregate net assets immediately after the Reorganization | |||||||||||||
Predecessor Fund* | 215,833,695 | – 0 | – | $ | 1,725,148,833 | + | $ | – 0 | – | |||||||
The Fund | – 0 | – | 215,833,695 | $ | – 0 | – | $ | 1,725,148,833 | ||||||||
| * | Represents the accounting survivor. |
| + | Includes distributions in excess of net investment income of ($20,163,122) and unrealized appreciation on investments of $61,667,545, with a fair value of $2,379,923,538 and identified cost of $2,318,255,993. |
For financial reporting purposes, assets received and shares issued by the Fund were recorded at fair value; however, the cost basis of the investments received from the Predecessor Fund was carried forward to align ongoing reporting of the Fund’s realized and unrealized gains and losses with amounts distributable to shareholders for tax purposes.
NOTE J
Other
In October 2016, the U.S. Securities and Exchange Commission adopted new rules and amended existing rules (together, “final rules”) intended to modernize the reporting and disclosure of information by registered investment companies. In part, the final rules amend Regulation S-X and require standardized, enhanced disclosure about derivatives in investment company financial statements, as well as other amendments. The compliance date for the amendments to Regulation S-X is August 1, 2017. Management is currently evaluating the impact that the adoption of the amendments to Regulation S-X will have on the financial statements and related disclosures.
| 78 | • AB INCOME FUND |
Notes to Financial Statements
NOTE K
Subsequent Events
Management has evaluated subsequent events for possible recognition or disclosure in the financial statements through the date the financial statements are issued. Management has determined that there are no material events that would require disclosure in the Fund’s financial statements through this date.
| AB INCOME FUND • | 79 |
Notes to Financial Statements
FINANCIAL HIGHLIGHTS
Selected Data For A Share Of Capital Stock Outstanding Throughout Each Period
| Class A | ||||
| April 21, 2016(a) to October 31, 2016 | ||||
|
| |||
Net asset value, beginning of period | $ 7.99 | |||
|
| |||
Income From Investment Operations | ||||
Net investment income(b)(c)* | .17 | |||
Net realized and unrealized gain on investment and foreign currency transactions | .08 | |||
|
| |||
Net increase in net asset value from operations | .25 | |||
|
| |||
Less: Dividends | ||||
Dividends from net investment income | (.16 | ) | ||
|
| |||
Net asset value, end of period | $ 8.08 | |||
|
| |||
Total Return | ||||
Total investment return based on net asset value(d)* | 3.14 | % | ||
Ratios/Supplemental Data | ||||
Net assets, end of period (000’s omitted) | $2,104 | |||
Ratio to average net assets of: | ||||
Expenses, net of waivers/reimbursements(e)^ | 1.16 | % | ||
Expenses, before waivers/reimbursements(e)^ | 1.37 | % | ||
Net investment income(c)^* | 4.06 | % | ||
Portfolio turnover rate | 14 | % | ||
See footnote summary on page 83.
| 80 | • AB INCOME FUND |
Financial Highlights
Selected Data For A Share Of Capital Stock Outstanding Throughout Each Period
| Class C | ||||
| April 21, 2016(a) to October 31, 2016 | ||||
|
| |||
Net asset value, beginning of period | $ 7.99 | |||
|
| |||
Income From Investment Operations | ||||
Net investment income(b)(c)* | .14 | |||
Net realized and unrealized gain on investment and foreign currency transactions | .09 | |||
|
| |||
Net increase in net asset value from operations | .23 | |||
|
| |||
Less: Dividends | ||||
Dividends from net investment income | (.13 | ) | ||
|
| |||
Net asset value, end of period | $ 8.09 | |||
|
| |||
Total Return | ||||
Total investment return based on net asset value(d)* | 2.85 | % | ||
Ratios/Supplemental Data | ||||
Net assets, end of period (000’s omitted) | $1,133 | |||
Ratio to average net assets of: | ||||
Expenses, net of waivers/reimbursements(e)^ | 1.90 | % | ||
Expenses, before waivers/reimbursements(e)^ | 2.15 | % | ||
Net investment income(c)^* | 3.34 | % | ||
Portfolio turnover rate | 14 | % | ||
See footnote summary on page 83.
| AB INCOME FUND • | 81 |
Financial Highlights
Selected Data For A Share Of Capital Stock Outstanding Throughout Each Period
| Advisor Class | ||||||||||||||||||||||||
| January 1, 2016 to October 31, 2016(f) | Year Ended December 31, | |||||||||||||||||||||||
| 2015 | 2014 | 2013 | 2012 | 2011 | ||||||||||||||||||||
|
| |||||||||||||||||||||||
Net asset value, beginning of period | $ 7.86 | $ 8.34 | $ 8.13 | $ 8.89 | $ 8.93 | $ 8.75 | ||||||||||||||||||
|
| |||||||||||||||||||||||
Income From Investment Operations | ||||||||||||||||||||||||
Net investment income(b) | .29 | (c)* | .38 | .42 | .40 | .40 | .44 | |||||||||||||||||
Net realized and unrealized gain (loss) on investment and foreign currency transactions | .22 | (.41 | ) | .19 | (.71 | ) | .57 | .31 | ||||||||||||||||
Contributions from Affiliates | – 0 | – | – 0 | – | – 0 | – | – 0 | – | .00 | (g) | – 0 | – | ||||||||||||
|
| |||||||||||||||||||||||
Net increase (decrease) in net asset value from operations | .51 | (.03 | ) | .61 | (.31 | ) | .97 | .75 | ||||||||||||||||
|
| |||||||||||||||||||||||
Less: Dividends and Distributions | ||||||||||||||||||||||||
Dividends from net investment income | (.28 | ) | (.46 | ) | (.45 | ) | (.41 | ) | (.48 | ) | (.57 | ) | ||||||||||||
Distributions from net realized gain on investment transactions | – 0 | – | (.05 | ) | – 0 | – | (.04 | ) | (.53 | ) | – 0 | – | ||||||||||||
|
| |||||||||||||||||||||||
Total dividends and distributions | (.28 | ) | (.51 | ) | (.45 | ) | (.45 | ) | (1.01 | ) | (.57 | ) | ||||||||||||
|
| |||||||||||||||||||||||
Redemption fee | .00 | (g) | – 0 | – | – 0 | – | – 0 | – | – 0 | – | – 0 | – | ||||||||||||
Anti-Dilutive Effect of Share Repurchase Program | – 0 | – | .06 | .05 | – 0 | – | – 0 | – | – 0 | – | ||||||||||||||
|
| |||||||||||||||||||||||
Net asset value, end of period | $ 8.09 | $ 7.86 | $ 8.34 | $ 8.13 | $ 8.89 | $ 8.93 | ||||||||||||||||||
|
| |||||||||||||||||||||||
Market value, end of period | N/A | $ 7.67 | $ 7.47 | $ 7.13 | $ 8.10 | $ 8.07 | ||||||||||||||||||
|
| |||||||||||||||||||||||
Discount, end of period | N/A | (2.42 | )% | (10.43 | )% | (12.30 | )% | (8.89 | )% | (9.63 | )% | |||||||||||||
Total Return | ||||||||||||||||||||||||
Total investment return | ||||||||||||||||||||||||
Market value | N/A | 9.71 | %(h) | 11.28 | %(h) | (6.50 | )%(h) | 13.80 | %(h) | 9.36 | %(h) | |||||||||||||
Net asset value | 6.66 | %(d)* | .70 | %(h) | 8.96 | %(h) | (2.86 | )%(h) | 12.15 | %(h) | 9.67 | %(h) | ||||||||||||
Ratios/Supplemental Data | ||||||||||||||||||||||||
Net assets, end of period | $916 | $1,696 | $1,902 | $1,976 | $2,159 | $2,168 | ||||||||||||||||||
Ratio to average net assets of: | ||||||||||||||||||||||||
Expenses, net of waivers/reimbursements(e) | .88 | %^ | .75 | % | .67 | % | .63 | % | .64 | % | .64 | % | ||||||||||||
Expenses, before waivers/reimbursements(e) | .96 | %^ | .75 | % | .67 | % | .63 | % | .64 | % | .64 | % | ||||||||||||
Net investment income | 4.29 | %(c)^* | 4.57 | % | 5.02 | % | 4.74 | % | 4.34 | % | 5.00 | % | ||||||||||||
Portfolio turnover rate | 14 | % | 34 | % | 32 | % | 107 | % | 58 | % | 67 | % | ||||||||||||
See footnote summary on page 83.
| 82 | • AB INCOME FUND |
Financial Highlights
| (a) | Inception date. |
| (b) | Based on average shares outstanding. |
| (c) | Net of fees and expenses waived by the Adviser. |
| (d) | Total investment return is calculated assuming an initial investment made at the net asset value at the beginning of the period, reinvestment of all dividends and distributions at net asset value during the period, and redemption on the last day of the period. Initial sales charges or contingent deferred sales charges are not reflected in the calculation of total investment return. Total return does not reflect the deduction of taxes that a shareholder would pay on fund distributions or the redemption of fund shares. Total investment return calculated for a period of less than one year is not annualized. |
| (e) | The expense ratios, excluding interest expense are: |
| January 1, 2016 to October 31, 2016(f) | Year Ended December 31, | |||||||||||||||||||||||
| 2015 | 2014 | 2013 | 2012 | 2011 | ||||||||||||||||||||
Class A | ||||||||||||||||||||||||
Net of waivers/reimbursements | .88 | %^ | N/A | N/A | N/A | N/A | N/A | |||||||||||||||||
Before waivers/reimbursement | 1.09 | %^ | N/A | N/A | N/A | N/A | N/A | |||||||||||||||||
Class C | ||||||||||||||||||||||||
Net of waivers/reimbursements | 1.63 | %^ | N/A | N/A | N/A | N/A | N/A | |||||||||||||||||
Before waivers/reimbursements | 1.87 | %^ | N/A | N/A | N/A | N/A | N/A | |||||||||||||||||
Advisor Class | ||||||||||||||||||||||||
Net of waivers/reimbursements | .61 | %^ | .61 | % | .61 | % | .57 | % | .55 | % | .58 | % | ||||||||||||
Before waivers/reimbursements | .69 | %^ | .61 | % | .61 | % | .57 | % | .55 | % | .58 | % | ||||||||||||
| (f) | The Predecessor Fund’s fiscal year end was December 31 and the Fund’s fiscal year end is October 31. |
| (g) | Amount is less than $.005. |
| (h) | Total investment return is calculated assuming a purchase of common stock on the opening of the first day and a sale on the closing of the last day of each period reported. Dividends and distributions, if any, are assumed for purposes of this calculation, to be reinvested at prices obtained under the Fund’s dividend reinvestment plan. Generally, total investment return based on net asset value will be higher than total investment return based on market value in periods where there is an increase in the discount or a decrease in the premium of the market value to the net asset value from the beginning to the end of such periods. Conversely, total investment return based on net asset value will be lower than total investment return based on market value in periods where there is a decrease in the discount or an increase in the premium of the market value to the net asset value from the beginning to the end of such periods. Total investment return calculated for a period of less than one year is not annualized. |
| ^ | Annualized. |
| * | For the period ended October 31, 2016, the amount includes a non-recurring refund for overbilling of prior years’ custody out-of-pocket fees as follows: |
Net Investment | Net Investment | Total | ||
| $.003 | .04% | .03% |
See notes to financial statements.
| AB INCOME FUND • | 83 |
Financial Highlights
REPORT OF INDEPENDENT REGISTERED
PUBLIC ACCOUNTING FIRM
To the Board of Directors and Shareholders of
AB Income Fund, Inc.:
We have audited the accompanying statement of assets and liabilities of AB Income Fund, Inc. (the “Fund”), including the portfolio of investments, as of October 31, 2016, and the related statements of operations for the period January 1, 2016 to October 31, 2016 and the year ended December 31, 2015, the statements of changes in net assets for the period January 1, 2016 to October 31, 2016 and each of the two years in the period ended December 31, 2015, the statement of cash flows for the period January 1, 2016 to October 31, 2016 and the financial highlights for each of the periods included therein. These financial statements and financial highlights are the responsibility of the Fund’s management. Our responsibility is to express an opinion on these financial statements and financial highlights based on our audits.
We conducted our audits in accordance with the standards of the Public Company Accounting Oversight Board (United States). Those standards require that we plan and perform the audit to obtain reasonable assurance about whether the financial statements and financial highlights are free of material misstatement. We were not engaged to perform an audit of the Fund’s internal control over financial reporting. Our audits included consideration of internal control over financial reporting as a basis for designing audit procedures that are appropriate in the circumstances, but not for the purpose of expressing an opinion on the effectiveness of the Fund’s internal control over financial reporting. Accordingly, we express no such opinion. An audit also includes examining, on a test basis, evidence supporting the amounts and disclosures in the financial statements and financial highlights, assessing the accounting principles used and significant estimates made by management, and evaluating the overall financial statement presentation. Our procedures included confirmation of securities owned as of October 31, 2016, by correspondence with the custodian and others, or by other appropriate auditing procedures where replies from others were not received. We believe that our audits provide a reasonable basis for our opinion.
In our opinion, the financial statements and financial highlights referred to above present fairly, in all material respects, the financial position of AB Income Fund, Inc. at October 31, 2016, and the results of its operations for the period January 1, 2016 to October 31, 2016 and the year ended December 31, 2015, the changes in its net assets for the period January 1, 2016 to October 31, 2016 and each of the two years in the period ended December 31, 2015, its cash flows for the period January 1, 2016 to October 31, 2016 and the financial highlights for each of the periods included therein, in conformity with U.S. generally accepted accounting principles.

New York, New York
December 30, 2016
| 84 | • AB INCOME FUND |
Report of Independent Registered Public Accounting Firm
2016 FEDERAL TAX INFORMATION
(unaudited)
For Federal income tax purposes, the following information is furnished with respect to the distributions paid by the Fund during the taxable year ended October 31, 2016. For foreign shareholders, 79.20% of ordinary income dividends paid may be considered to be qualifying to be taxed as interest-related dividends.
For the taxable year ended October 31, 2016, the Fund designates $68,779 as the maximum amount that may be considered qualified dividend income for individual shareholders.
Shareholders should not use the above information to prepare their income tax returns. The information necessary to complete your income tax returns will be included with your Form 1099-DIV which will be sent to you separately in January 2017.
| AB INCOME FUND • | 85 |
BOARD OF DIRECTORS
Marshall C. Turner, Jr.(1) , Chairman John H. Dobkin(1) Michael J. Downey(1) William H. Foulk, Jr.(1) D. James Guzy(1) | Nancy P. Jacklin(1) Robert M. Keith, President and Chief Executive Officer Carol C. McMullen(1) Garry L. Moody(1) Earl D. Weiner(1) |
OFFICERS
Philip L. Kirstein, Senior Vice President and Independent Compliance Officer Paul J. DeNoon(2), Vice President Gershon M. Distenfeld(2), Douglas J. Peebles(2), Vice President | Matthew S. Sheridan(2), Vice President Emilie D. Wrapp, Secretary Joseph J. Mantineo, Treasurer and Chief Financial Officer Phyllis J. Clarke, Controller |
Custodian and Accounting Agent State Street Bank and Trust Company State Street Corporation CCB/5 1 Iron Street Boston, MA 02210
Principal Underwriter AllianceBernstein Investments, Inc. 1345 Avenue of the Americas New York, NY 10105
Transfer Agent AllianceBernstein Investor Services, Inc. P.O. Box 786003 San Antonio, TX 78278-6003 Toll-Free (800) 221-5672 | Independent Registered Public Ernst & Young LLP 5 Times Square New York, NY 10036
Legal Counsel Seward & Kissel LLP One Battery Park Plaza New York, NY 10004 |
| (1) | Member of the Audit Committee, the Governance and Nominating Committee and the Independent Directors Committee. |
| (2) | The day-to-day management of, and investment decisions for, the Fund’s portfolio are made by a team of investment professionals consisting of Messrs. DeNoon, Distenfeld, Peebles and Sheridan. |
| 86 | • AB INCOME FUND |
Board of Directors
MANAGEMENT OF THE FUND
Board of Directors Information
The business and affairs of the Fund are managed under the direction of the Board of Directors. Certain information concerning the Fund’s Directors is set forth below.
| NAME, ADDRESS*, AGE, (YEAR FIRST ELECTED**) | PRINCIPAL OCCUPATION(S) DURING PAST FIVE YEARS AND OTHER INFORMATION*** | PORTFOLIOS IN FUND COMPLEX OVERSEEN BY DIRECTOR | OTHER PUBLIC COMPANY DIRECTORSHIPS CURRENTLY HELD BY DIRECTOR | |||||
| INTERESTED DIRECTOR | ||||||||
Robert M. Keith, # 1345 Avenue of the Americas New York, NY 10105 56 (2010) | Senior Vice President of AllianceBernstein L.P. (the “Adviser”) and the head of AllianceBernstein Investments, Inc. (“ABI”) since July 2008; Director of ABI and President of the AB Mutual Funds. Previously, he served as Executive Managing Director of ABI from December 2006 to June 2008. Prior to joining ABI in 2006, Executive Managing Director of Bernstein Global Wealth Management, and prior thereto, Senior Managing Director and Global Head of Client Service and Sales of the Adviser’s institutional investment management business since 2004. Prior thereto, he was Managing Director and Head of North American Client Service and Sales in the Adviser’s institutional investment management business, with which he had been associated since prior to 2004. | 108 | None | |||||
| AB INCOME FUND • | 87 |
Management of the Fund
| NAME, ADDRESS*, AGE, (YEAR FIRST ELECTED**) | PRINCIPAL OCCUPATION(S) DURING PAST FIVE YEARS AND OTHER INFORMATION*** | PORTFOLIOS IN FUND COMPLEX OVERSEEN BY DIRECTOR | OTHER PUBLIC COMPANY DIRECTORSHIPS CURRENTLY HELD BY DIRECTOR | |||||
| DISINTERESTED DIRECTORS | ||||||||
Marshall C. Turner, Jr., ## Chairman of the Board 75 (2005) | Private Investor since prior to 2011. Former Chairman and CEO of Dupont Photomasks, Inc. (components of semi-conductor manufacturing). He has extensive operating leadership and venture capital investing experience, including five interim or full-time CEO roles, and prior service as general partner of institutional venture capital partnerships. He also has extensive non-profit board leadership experience, and currently serves on the boards of two education and science-related non-profit organizations. He has served as a director of one AB Fund since 1992, and director or trustee of multiple AB Funds since 2005. He has been Chairman of the AB Funds since January 2014, and the Chairman of the Independent Directors Committees of such AB Funds since February 2014. | 108 | Xilinx, Inc. (programmable logic semi-conductors) since 2007 | |||||
John H. Dobkin, ## 74 (1992) | Independent Consultant since prior to 2011. Formerly, President of Save Venice, Inc. (preservation organization) from 2001–2002; Senior Advisor from June 1999-June 2000 and President of Historic Hudson Valley (historic preservation) from December 1989-May 1999. Previously, Director of the National Academy of Design. He has served as a director or trustee of various AB Funds since 1992, and as Chairman of the Audit Committees of a number of such AB Funds from 2001-2008. | 108 | None | |||||
| 88 | • AB INCOME FUND |
Management of the Fund
| NAME, ADDRESS*, AGE, (YEAR FIRST ELECTED**) | PRINCIPAL OCCUPATION(S) DURING PAST FIVE YEARS AND OTHER INFORMATION*** | PORTFOLIOS IN FUND COMPLEX OVERSEEN BY DIRECTOR | OTHER PUBLIC COMPANY DIRECTORSHIPS CURRENTLY HELD BY DIRECTOR | |||||
DISINTERESTED DIRECTORS (continued) | ||||||||
Michael J. Downey, ## 72 (2005) | Private Investor since prior to 2011. Formerly, managing partner of Lexington Capital, LLC (investment advisory firm) from December 1997 until December 2003. He served as a Director of Prospect Acquisition Corp. (financial services) from 2007 until 2009. From 1987 until 1993, Chairman and CEO of Prudential Mutual Fund Management, director of the Prudential mutual funds, and member of the Executive Committee of Prudential Securities Inc. He has served as a director or trustee of the AB Funds since 2005 and is a director and Chairman of one other registered investment company. | 108 | Asia Pacific Fund, Inc. (registered investment company) since prior to 2011 | |||||
William H. Foulk, Jr., ## 84 (1990) | Investment Adviser and an Independent Consultant since prior to 2011. Previously, he was Senior Manager of Barrett Associates, Inc., a registered investment adviser. He was formerly Deputy Comptroller and Chief Investment Officer of the State of New York and, prior thereto, Chief Investment Officer of the New York Bank for Savings. He has served as a director or trustee of various AB Funds since 1983, and was Chairman of the Independent Directors Committees of the AB Funds from 2003 until early February 2014. He served as Chairman of such AB Funds from 2003 through December 2013. He is also active in a number of mutual fund related organizations and committees. | 108 | None | |||||
| AB INCOME FUND • | 89 |
Management of the Fund
| NAME, ADDRESS*, AGE, (YEAR FIRST ELECTED**) | PRINCIPAL OCCUPATION(S) DURING PAST FIVE YEARS AND OTHER INFORMATION*** | PORTFOLIOS IN FUND COMPLEX OVERSEEN BY DIRECTOR | OTHER PUBLIC COMPANY DIRECTORSHIPS CURRENTLY HELD BY DIRECTOR | |||||
DISINTERESTED DIRECTORS (continued) | ||||||||
D. James Guzy, ## 80 (2005) | Chairman of the Board of SRC Computers, Inc. (semi-conductors), with which he has been associated since prior to 2011. He served as Chairman of the Board of PLX Technology (semi-conductors) since prior to 2011 until November 2013. He was a director of Intel Corporation (semi-conductors) from 1969 until 2008, and served as Chairman of the Finance Committee of such company for several years until May 2008. He has served as a director or trustee of one or more of the AB Funds since 1982. | 108 | None | |||||
Nancy P. Jacklin, ## 68 (2006) | Private Investor since prior to 2011. Professorial Lecturer at the Johns Hopkins School of Advanced International Studies (2008-2015). U.S. Executive Director of the International Monetary Fund (which is responsible for ensuring the stability of the international monetary system), (December 2002-May 2006); Partner, Clifford Chance (1992-2002); Sector Counsel, International Banking and Finance, and Associate General Counsel, Citicorp (1985-1992); Assistant General Counsel (International), Federal Reserve Board of Governors (1982-1985); and Attorney Advisor, U.S. Department of the Treasury (1973-1982). Member of the Bar of the District of Columbia and of New York; and member of the Council on Foreign Relations. She has served as a director or trustee of the AB Funds since 2006 and has been Chairman of the Governance and Nominating Committees of the AB Funds since August 2014. | 108 | None | |||||
| 90 | • AB INCOME FUND |
Management of the Fund
| NAME, ADDRESS*, AGE, (YEAR FIRST ELECTED**) | PRINCIPAL OCCUPATION(S) DURING PAST FIVE YEARS AND OTHER INFORMATION*** | PORTFOLIOS IN FUND COMPLEX OVERSEEN BY DIRECTOR | OTHER PUBLIC COMPANY DIRECTORSHIPS CURRENTLY HELD BY DIRECTOR | |||||
DISINTERESTED DIRECTORS (continued) | ||||||||
Carol C. McMullen, ## 61 (2016) | Managing Director of Slalom Consulting (consulting) since 2014 and private investor; Director of Norfolk & Dedham Group (mutual property and casualty insurance) since 2011; and Director of Partners Community Physicians Organization (healthcare) since 2014. Formerly, Managing Director of The Crossland Group (consulting) from 2012 to 2013. She has held a number of senior positions in the asset and wealth management industries, including at Eastern Bank (where her roles included President of Eastern Wealth Management), Thomson Financial (Global Head of Sales for Investment Management), and Putnam Investments (where her roles included Head of Global Investment Research). She has served on a number of private company and nonprofit boards, and as a director or trustee of the AB Funds since June 2016. | 108 | None | |||||
| AB INCOME FUND • | 91 |
Management of the Fund
| NAME, ADDRESS*, AGE, (YEAR FIRST ELECTED**) | PRINCIPAL INFORMATION*** | PORTFOLIOS IN FUND COMPLEX OVERSEEN BY DIRECTOR | OTHER PUBLIC COMPANY DIRECTORSHIPS CURRENTLY HELD BY DIRECTOR | |||||
DISINTERESTED DIRECTORS (continued) | ||||||||
Garry L. Moody, ## 64 (2008) | Independent Consultant. Formerly, Partner, Deloitte & Touche LLP (1995-2008) where he held a number of senior positions, including Vice Chairman, and U.S. and Global Investment Management Practice Managing Partner; President, Fidelity Accounting and Custody Services Company (1993-1995), where he was responsible for accounting, pricing, custody and reporting for the Fidelity mutual funds; and Partner, Ernst & Young LLP (1975-1993), where he served as the National Director of Mutual Fund Tax Services and Managing Partner of its Chicago Office Tax department. He is a member of the Trustee Advisory Board of BoardIQ, a biweekly publication focused on issues and news affecting directors of mutual funds. He has served as a director or trustee, and as Chairman of the Audit Committees, of the AB Funds since 2008. | 108 | None | |||||
Earl D. Weiner, ## 77 (2007) | Of Counsel, and Partner prior to January 2007, of the law firm Sullivan & Cromwell LLP and is a former member of the ABA Federal Regulation of Securities Committee Task Force to draft editions of the Fund Director’s Guidebook. He also serves as a director or trustee of various non-profit organizations and has served as Chairman or Vice Chairman of a number of them. He has served as a director or trustee of the AB Funds since 2007 and served as Chairman of the Governance and Nominating Committees of the AB Funds from 2007 until August 2014. | 108 | None | |||||
| 92 | • AB INCOME FUND |
Management of the Fund
| * | The address for each of the Fund’s disinterested Directors is c/o AllianceBernstein L.P., Attention: Philip L. Kirstein, 1345 Avenue of the Americas, New York, NY 10105 |
| ** | There is no stated term of office for the Fund’s Directors. |
| *** | The information above includes each Director’s principal occupation during the last five years and other information relating to the experience, attributes, and skills relevant to each Director’s qualifications to serve as a Director, which led to the conclusion that each Director should serve as a Director for the Fund. |
| # | Mr. Keith is an “interested person” of the Fund, as defined in the 1940 Act, due to this position as a Senior Vice President of the Adviser. |
| ## | Member of the Audit Committee, the Governance and Nominating Committee and the Independent Directors Committee. |
| AB INCOME FUND • | 93 |
Management of the Fund
Officer Information
Certain information concerning the Fund’s Officers is listed below.
| NAME, ADDRESS* AND AGE | POSITION(S) HELD WITH FUND | PRINCIPAL OCCUPATION DURING PAST FIVE YEARS | ||
Robert M. Keith 56 | President and Chief Executive Officer | See biography above. | ||
Philip L. Kirstein | Senior Vice President and Independent Compliance Officer | Senior Vice President and Independent Compliance Officer of the AB Funds, with which he has been associated since October 2004. Prior thereto, he was Of Counsel to Kirkpatrick & Lockhart, LLP from October 2003 to October 2004, and General Counsel of Merrill Lynch Investment Managers, L .P. since prior to March 2003. | ||
| Paul J. DeNoon 54 | Vice President | Senior Vice President of the Adviser**, with which he has been associated since prior to 2011. | ||
| Gershon M. Distenfeld 41 | Vice President | Senior Vice President of the Adviser**, with which he has been associated since prior to 2011. | ||
| Douglas J. Peebles 51 | Vice President | Senior Vice President of the Adviser**, with which he has been associated since prior to 2011. | ||
| Matthew S. Sheridan 41 | Vice President | Senior Vice President of the Adviser**, with which he has been associated since prior to 2011. | ||
| Emilie D. Wrapp 61 | Secretary | Senior Vice President, Assistant General Counsel and Assistant Secretary of ABI**, with which she has been associated since prior to 2011. | ||
| Joseph J. Mantineo 57 | Treasurer and Chief Financial Officer | Senior Vice President of AllianceBernstein Investor Services, Inc. (“ABIS”**), with which he has been associated since prior to 2011. | ||
| Phyllis J. Clarke 55 | Controller | Vice President of ABIS**, with which she has been associated since prior to 2011. | ||
| Vincent S. Noto 52 | Chief Compliance Officer | Senior Vice President since 2015 and Mutual Fund Chief Compliance Officer of the Adviser** since 2014. Prior thereto, he was Vice President and Director of Mutual Fund Compliance of the Adviser**, since prior to 2011. |
| * | The address for each of the Fund’s Officers is 1345 Avenue of the Americas, New York, NY 10105. |
| ** | The Adviser, ABI and ABIS are affiliates of the Fund. |
| The Fund’s Statement of Additional Information (“SAI”) has additional information about the Fund’s Directors and Officers and is available without charge upon request. Contact your financial representative or AB at 1-(800)227-4618, or visit www.ABfunds.com for a free prospectus or SAI. |
| 94 | • AB INCOME FUND |
Management of the Fund
Information Regarding the Review and Approval of the Portfolio’s Advisory Agreement
The disinterested directors (the “directors”) of AB Bond Fund, Inc. (the “Fund”) unanimously approved the Fund’s Advisory Agreement with the Adviser in respect of AB Income Fund (the “Portfolio”) for an initial two-year period at a meeting held on August 4-5, 2015.
Prior to approval of the Advisory Agreement in respect of the Portfolio, the directors had requested from the Adviser, and received and evaluated, extensive materials. They reviewed the proposed Advisory Agreement with the Adviser and with experienced counsel who are independent of the Adviser, who advised on the relevant legal standards. The directors also reviewed an independent evaluation prepared by the Fund’s Senior Officer (who is also the Fund’s Independent Compliance Officer) of the reasonableness of the proposed advisory fee in the Advisory Agreement. The directors also discussed the proposed approval in private sessions with counsel and the Fund’s Senior Officer.
The directors considered their knowledge of the nature and quality of the services to be provided by the Adviser to the Portfolio gained from their experience as directors or trustees of most of the registered investment companies advised by the Adviser, including the Fund, their overall confidence in the Adviser’s integrity and competence they have gained from that experience, the Adviser’s initiative in identifying and raising potential issues with the directors and its responsiveness, frankness and attention to concerns raised by the directors in the past, including the Adviser’s willingness to consider and implement organizational and operational changes designed to improve investment results and the services provided to the AB Funds. The directors noted that they have four regular meetings each year, at each of which they receive presentations from the Adviser on the investment results of the AB Funds and review extensive materials and information presented by the Adviser.
The directors also considered all other factors they believed relevant, including the specific matters discussed below. In their deliberations, the directors did not identify any particular information that was all-important or controlling, and different directors may have attributed different weights to the various factors. The directors determined that the selection of the Adviser to manage the Portfolio and the overall arrangements between the Portfolio and the Adviser, as provided in the Advisory Agreement, including the proposed advisory fee, were fair and reasonable in light of the services to be performed, expenses to be incurred and such other matters as the directors considered relevant in the exercise of their business judgment.
| AB INCOME FUND • | 95 |
The material factors and conclusions that formed the basis for the directors’ determinations included the following:
Nature, Extent and Quality of Services to be Provided
The directors considered the scope and quality of services to be provided by the Adviser under the Advisory Agreement, including the quality of the investment research capabilities of the Adviser and the other resources it has dedicated to performing services for the AB Funds. They also noted the professional experience and qualifications of the Portfolio’s portfolio management team and other senior personnel of the Adviser. The directors also considered that the Advisory Agreement provides that the Portfolio will reimburse the Adviser for the cost to it of providing certain clerical, accounting, administrative and other services provided to the Portfolio by employees of the Adviser or its affiliates. Requests for these reimbursements will be subject to the directors’ approval on a quarterly basis and, to the extent requested and paid, result in a higher rate of total compensation from the Portfolio to the Adviser than the fee rate stated in the Advisory Agreement. The directors noted that the methodology used to determine the reimbursement amounts had been reviewed by an independent consultant retained by the Fund’s Senior Officer. The quality of administrative and other services, including the Adviser’s role in coordinating the activities of the Portfolio’s other service providers, also was considered. The directors concluded that, overall, they were satisfied with the nature, extent and quality of services to be provided to the Portfolio under the Advisory Agreement.
Costs of Services to be Provided and Profitability
Because the Portfolio had not yet commenced operations, the directors were unable to consider historical information about the profitability of the Portfolio. However, the Adviser agreed to provide the directors with profitability information in connection with future proposed continuances of the Advisory Agreement. They also considered the costs to be borne by the Adviser in providing services to the Portfolio and that the Portfolio was unlikely to be profitable to the Adviser unless it achieves a material level of net assets.
Fall-Out Benefits
The directors considered the other benefits to the Adviser and its affiliates from their proposed relationships with the Portfolio, including, but not limited, to benefits relating to soft dollar arrangements (whereby the Adviser receives brokerage and research services from brokers that execute transactions for certain clients, including the Portfolio); 12b-1 fees and sales charges to be received by the Fund’s principal underwriter (which is a wholly owned subsidiary of the Adviser) in respect of certain classes of the Portfolio’s shares; transfer agency fees to be paid by the Portfolio to a wholly owned subsidiary of the Adviser; and brokerage commissions to be paid by the Portfolio to brokers affiliated with the
| 96 | • AB INCOME FUND |
Adviser. The directors recognized that the Adviser’s future profitability would be somewhat lower without these benefits. The directors also understood that the Adviser also might derive reputational and other benefits from its association with the Portfolio.
Investment Results
Since the Portfolio had not yet commenced operations, no performance or other historical information for the Portfolio was available from the Adviser. However, it was proposed that the Portfolio would receive the assets of AllianceBernstein Income Fund, Inc. (“ABIF”) in exchange for Advisor Class shares of the Portfolio and the assumption by the Portfolio of all of the liabilities of ABIF. Shareholders of ABIF would receive Advisor Class shares of the Portfolio in connection with the reorganization. The portfolio management team of ABIF would continue to manage the assets of the Portfolio. The Adviser provided the directors with the performance returns of ABIF. The directors noted the significant differences between ABIF and the Portfolio, in particular that ABIF utilized leverage to seek incremental return for its common stockholders, which the Portfolio, as an open-end fund, could not do. Based on this information, together with the Adviser’s written and oral presentations regarding the management of the Portfolio and their general knowledge and confidence in the Adviser’s expertise in managing mutual funds, the directors concluded that they were satisfied that the Adviser was capable of providing high quality portfolio management services to the Portfolio.
Advisory Fees and Other Expenses
The directors considered the proposed advisory fee rate payable by the Portfolio and information prepared by Lipper concerning advisory fee rates paid by other funds in the same Lipper category as the Portfolio at a hypothetical common asset level of $1.0 billion. The directors recognized that it is difficult to make comparisons of advisory fees because there are variations in the services that are included in the fees paid by other funds.
The information reviewed by the directors showed that, at the Portfolio’s hypothetical size of $1.0 billion, its proposed contractual effective advisory fee rate of 60 basis points was higher than the Lipper expense group median of 56.9 basis points. The directors discussed with the Adviser, consistent with a recommendation of the Senior Officer, the reasons for ABIF’s and the Portfolio’s different fee structure and level of the advisory fee. The Adviser informed the directors that because the Portfolio is an open-end fund, instituting a similar income-based fee for the Portfolio would present a marketing impediment for a number of the Adviser’s distributing partners. The Adviser also informed the directors that the Portfolio’s asset-based fee is typical for open-end funds. The Adviser informed the directors that the Portfolio’s advisory fee rate is higher than the advisory fee rate of ABIF because the current historically low interest rate environment results in the income-based component of the fee rate
| AB INCOME FUND • | 97 |
being unusually low. The Adviser explained that the Portfolio’s ordinary fee rate is lower than the fee rate paid by ABIF in most prior periods.
The directors recognized that the Adviser’s total compensation from the Portfolio pursuant to the Advisory Agreement would be increased by amounts paid pursuant to the expense reimbursement provision in the Advisory Agreement, and that the impact of such expense reimbursement would depend on the size of the Portfolio and the extent to which the Adviser requests reimbursements pursuant to this provision.
The Adviser informed the directors that there were no institutional products managed by it that have a substantially similar investment style.
The directors noted that the Portfolio may invest in shares of exchange-traded funds (“ETFs”), subject to restrictions and limitations of the Investment Company Act of 1940 as these may be waived as a result of exemptive orders issued by the SEC. The directors also noted that ETFs pay advisory fees pursuant to their advisory contracts. The directors concluded, based on the Adviser’s explanation of how it may use ETFs when they are the most cost-effective way to obtain desired exposures or to “equitize” cash inflows pending purchases of underlying securities, that the proposed advisory fee for the Portfolio would be paid for services that would be in addition to, rather than duplicative of, the services provided under the advisory contracts of the ETFs in which the Portfolio may in the future invest.
The directors considered the anticipated total expense ratio of the Class A shares of the Portfolio assuming $1.0 billion in assets under management in comparison to the fees and expenses of funds within two comparison groups created by Lipper: an Expense Group and an Expense Universe. Lipper described an Expense Group as a representative sample of funds similar to the Portfolio and an Expense Universe as a broader group than the Expense Group, consisting of all funds in the investment classification/objective with a similar load type as the Portfolio.
The directors also considered the proposed expense limitation agreement between the Adviser and the Fund for a two-year period beginning with the Portfolio’s commencement of operations. Under the proposed expense limitation agreement the Adviser would agree to waive its fees and/or reimburse expenses of the Portfolio to the extent that total expenses exceed 0.88% for Class A shares and 0.63% for Advisor Class shares. The anticipated expense ratios for the Portfolio reflected fee waivers and/or expense reimbursement as a result of the proposed expense limitation agreement. The directors noted that it was likely that the expense ratios of some of the other funds in the Portfolio’s Lipper category also were lowered by waivers or reimbursements by those funds’ investment advisers, which in some cases might be voluntary or temporary. The directors view the expense ratio information as relevant to their
| 98 | • AB INCOME FUND |
evaluation of the Adviser’s services because the Adviser is responsible for coordinating services provided to the Portfolio by others.
The directors requested that the Adviser set the expense limitation at a lower level than the 0.90% initially proposed. The Adviser proposed a limit of 0.88% instead, and the directors considered that level acceptable. Following a recommendation of the Senior Officer, the directors discussed with the Adviser their concern that, after the two year term of the expense limitation agreement, the Portfolio’s expense ratio would increase. In response, the Adviser also agreed to review the gross expense ratio of the Portfolio with the directors in advance of the expiration of the two year term of its expense limitation agreement.
The information reviewed by the directors showed that the Portfolio’s anticipated Class A expense ratio of 88 basis points, giving effect to the proposed expense limitation agreement, was close to the Expense Group median of 86.7 basis points and the Expense Universe median of 87.4 basis points. The information also showed that the Portfolio’s anticipated Advisor Class expense ratio of 63 basis points, giving effect to the proposed expense limitation agreement, was comparable to, but higher than, ABIF’s current expense ratio of 55 basis points. The directors concluded that, under the particular circumstances of the Portfolio, the anticipated expense ratios of the Class A shares and the Advisor Class shares, taking into account the two year expense limitation, were acceptable.
Economies of Scale
The directors noted that the proposed advisory fee schedule for the Portfolio contains breakpoints that reduce the fee rates on assets above specified levels. The directors took into consideration prior presentations by an independent consultant on economies of scale in the mutual fund industry and for the AB Funds, and by the Adviser concerning certain of its views on economies of scale. The directors also had requested and received from the Adviser certain updates on economies of scale at the May 2015 meetings. The directors believe that economies of scale may be realized (if at all) by the Adviser across a variety of products and services, and not only in respect of a single fund. The directors noted that there is no established methodology for setting breakpoints that give effect to the fund-specific services provided by a fund’s adviser and to the economies of scale that an adviser may realize in its overall mutual fund business or those components of it which directly or indirectly affect a fund’s operations. The directors observed that in the mutual fund industry as a whole, as well as among funds similar to the Portfolio, there is no uniformity or pattern in the fees and asset levels at which breakpoints (if any) apply. The directors also noted that the advisory agreements for many funds do not have breakpoints at all. Having taken these factors into account, the directors concluded that the Portfolio’s shareholders would benefit from a sharing of economies of scale in the event the Portfolio’s net assets exceed a breakpoint.
| AB INCOME FUND • | 99 |
THIS PAGE IS NOT PART OF THE SHAREHOLDER REPORT OR THE FINANCIAL STATEMENTS
AB FAMILY OF FUNDS
US EQUITY
US Core
Core Opportunities Fund
Select US Equity Portfolio
US Growth
Concentrated Growth Fund
Discovery Growth Fund
Growth Fund
Large Cap Growth Fund
Small Cap Growth Portfolio
US Value
Discovery Value Fund
Equity Income Fund
Growth & Income Fund
Small Cap Value Portfolio
Value Fund
INTERNATIONAL/ GLOBAL EQUITY
International/Global Core
Global Core Equity Portfolio
Global Equity & Covered Call Strategy Fund
International Portfolio
International Strategic Core Portfolio
Sustainable Global Thematic Fund*
Tax-Managed International Portfolio
International/Global Growth
International Growth Fund
International/Global Value
Asia ex-Japan Equity Portfolio
International Value Fund
FIXED INCOME
Municipal
High Income Municipal Portfolio
Intermediate California Municipal Portfolio
Intermediate Diversified Municipal Portfolio
Intermediate New York Municipal Portfolio
FIXED INCOME (continued)
Municipal Bond Inflation Strategy
Tax-Aware Fixed Income Portfolio
National Portfolio
Arizona Portfolio
California Portfolio
Massachusetts Portfolio
Michigan Portfolio
Minnesota Portfolio
New Jersey Portfolio
New York Portfolio
Ohio Portfolio
Pennsylvania Portfolio
Virginia Portfolio
Taxable
Bond Inflation Strategy
Global Bond Fund
High Income Fund
High Yield Portfolio
Income Fund
Intermediate Bond Portfolio
Limited Duration High Income Portfolio
Short Duration Portfolio
ALTERNATIVES
All Market Real Return Portfolio
Credit Long/Short Portfolio
Global Real Estate Investment Fund
Long/Short Multi-Manager Fund
Multi-Manager Alternative Strategies Fund
Select US Long/Short Portfolio
Unconstrained Bond Fund
MULTI-ASSET
All Market Income Portfolio
Emerging Markets Multi-Asset Portfolio
Global Risk Allocation Fund
MULTI-ASSET (continued)
Target-Date
Multi-Manager Select Retirement Allocation Fund
Multi-Manager Select 2010 Fund
Multi-Manager Select 2015 Fund
Multi-Manager Select 2020 Fund
Multi-Manager Select 2025 Fund
Multi-Manager Select 2030 Fund
Multi-Manager Select 2035 Fund
Multi-Manager Select 2040 Fund
Multi-Manager Select 2045 Fund
Multi-Manager Select 2050 Fund
Multi-Manager Select 2055 Fund
Wealth Strategies
Balanced Wealth Strategy
Conservative Wealth Strategy
Wealth Appreciation Strategy
Tax-Managed Balanced Wealth Strategy
Tax-Managed Wealth Appreciation Strategy
CLOSED-END FUNDS
AB Multi-Manager Alternative Fund
Alliance California Municipal Income Fund
AllianceBernstein Global High Income Fund
AllianceBernstein National Municipal Income Fund
We also offer Government Exchange Reserves, which serves as the money market fund exchange vehicle for the AB mutual funds. An investment in Government Exchange Reserves is not a deposit in a bank and is not insured or guaranteed by the Federal Deposit Insurance Corporation or any other government agency. Although the Fund seeks to preserve the value of your investment at $1.00 per share, it is possible to lose money by investing in the Fund.
Investors should consider the investment objectives, risks, charges and expenses of the Fund carefully before investing. For copies of our prospectus or summary prospectus, which contain this and other information, visit us online at www.abfunds.com or contact your AB representative. Please read the prospectus and/or summary prospectus carefully before investing.
* Prior to November 1, 2016, the Fund was named Global Thematic Growth Fund.
| 100 | • AB INCOME FUND |
AB Family of Funds
AB INCOME FUND
1345 Avenue of the Americas
New York, NY 10105
800.221.5672
IF-0151-1016 
OCT 10.31.16

ANNUAL REPORT
AB INTERMEDIATE BOND PORTFOLIO
Investment Products Offered
•Are Not FDIC Insured •May Lose Value •Are Not Bank Guaranteed |
Investors should consider the investment objectives, risks, charges and expenses of the Fund carefully before investing. For copies of our prospectus or summary prospectus, which contain this and other information, visit us online at www.abfunds.com or contact your AB representative. Please read the prospectus and/or summary prospectus carefully before investing.
This shareholder report must be preceded or accompanied by the Fund’s prospectus for individuals who are not current shareholders of the Fund.
You may obtain a description of the Fund’s proxy voting policies and procedures, and information regarding how the Fund voted proxies relating to portfolio securities during the most recent 12-month period ended June 30, without charge. Simply visit AB’s website at www.abfunds.com, or go to the Securities and Exchange Commission’s (the “Commission”) website at www.sec.gov, or call AB at (800) 227-4618.
The Fund files its complete schedule of portfolio holdings with the Commission for the first and third quarters of each fiscal year on Form N-Q. The Fund’s Forms N-Q are available on the Commission’s website at www.sec.gov. The Fund’s Forms N-Q may also be reviewed and copied at the Commission’s Public Reference Room in Washington, DC; information on the operation of the Public Reference Room may be obtained by calling (800) SEC-0330. AB publishes full portfolio holdings for the Fund monthly at www.abfunds.com.
AllianceBernstein Investments, Inc. (ABI) is the distributor of the AB family of mutual funds. ABI is a member of FINRA and is an affiliate of AllianceBernstein L.P., the Adviser of the funds.
The [A/B] logo is a registered service mark of AllianceBernstein and AllianceBernstein® is a registered service mark used by permission of the owner, AllianceBernstein L.P.
December 13, 2016
Annual Report
This report provides management’s discussion of fund performance for AB Intermediate Bond Portfolio (the “Portfolio”) for the annual reporting period ended October 31, 2016.
Investment Objective and Policies
The Portfolio’s investment objective is to generate income and price appreciation without assuming what AllianceBernstein L.P. (the “Adviser”) considers undue risk. The Portfolio invests, under normal circumstances, at least 80% of its net assets in fixed-income securities. The Portfolio expects to invest in readily marketable fixed-income securities with a range of maturities from short- to long-term and relatively attractive yields that do not involve undue risk of loss of capital. The Portfolio expects to invest in fixed-income securities with a dollar-weighted average maturity of between three to 10 years and an average duration of three to six years. The Portfolio may invest up to 25% of its net assets in below investment-grade bonds. The Portfolio may use leverage for investment purposes.
The Portfolio may invest without limit in US dollar-denominated foreign fixed-income securities and may invest up to 25% of its assets in non-US dollar-denominated foreign fixed-income securities. These investments may include, in each case, developed- and emerging-market debt securities.
The Adviser selects securities for purchase or sale based on its assessment of the securities’ risk and return characteristics as well as the securities’ impact on the overall risk and return characteristics of the Portfolio. In making this assessment, the Adviser takes into account various factors, including the credit quality and sensitivity to interest rates of the securities under consideration and of the Portfolio’s other holdings.
The Portfolio may invest in mortgage-related and other asset-backed securities, loan participations, inflation-protected securities, structured securities, variable, floating, and inverse floating-rate instruments and preferred stock, and may use other investment techniques. The Portfolio intends, among other things, to enter into transactions such as reverse repurchase agreements and dollar rolls. The Portfolio may invest, without limit, in derivatives, such as options, futures contracts, forwards or swaps.
Investment Results
The table on page 7 shows the Portfolio’s performance compared with its benchmark, the Bloomberg Barclays US Aggregate Bond Index, for the six- and 12-month periods ended October 31, 2016.
All share classes except Class B and Class C shares outperformed the benchmark in the 12-month period, and all share classes outperformed the benchmark in the six-month period, before sales charges. Sector
| AB INTERMEDIATE BOND PORTFOLIO • | 1 |
allocation contributed most to performance, relative to the benchmark, in both periods, primarily due to exposure to collateralized mortgage obligations. An underweight position in treasuries also helped returns. Security selection within energy added to performance in both periods. Security selection within financials was beneficial in the six-month period, while selection in treasuries contributed during the 12-month period. Currency investments had a positive impact on returns in both periods. In the six-month period, underweights in the Canadian dollar and British pound (which more than offset losses from an overweight in the Mexican peso) contributed most, while in the 12-month period, an overweight position in the yen was the largest contributor. During both periods, short relative duration detracted due to falling yields, as did positioning along the intermediate part of the curve. In the 12-month period, an underweight in 20-year maturities also detracted.
During both periods, the Portfolio utilized derivatives including currency forwards and options to hedge currency risk and actively manage currency positions. Credit default swaps were utilized for hedging and investment purposes, which had an immaterial impact on absolute performance during both periods. Treasury futures and interest rate swaps were utilized to manage the duration, country exposure and yield-curve positioning of the Portfolio. Equity options were utilized to hedge market risk.
During the 12-month period, inflation swaps were utilized to gain inflation exposure and to manage inflation curve exposure.
Market Review and Investment Strategy
Bond markets generally increased in absolute terms over the 12-month period ended October 31, 2016, as global growth trends and central bank action in the world’s largest economies continued to diverge. After declining through the end of 2015 and beginning of 2016, oil prices rebounded through much of the period on the back of decreased global supply—which contributed to a rally in emerging-market debt sectors—though prices moved downward in October on the market’s rising skepticism that OPEC would reach a deal to limit crude production. Emerging-market sentiment was further boosted on positive political developments in Argentina and Brazil toward the end of the period.
In December 2015, the US Federal Reserve (the “Fed”) hiked rates for the first time in over nine years—a move that had been well-telegraphed and widely anticipated, and was generally accepted smoothly by bond investors. After some slower-than-expected US economic data through the first half of 2016, the Fed’s tone turned more hawkish in September (despite rates remaining unchanged) on the back of continued strengthening in the US labor market and growth in economic activity. In October, third quarter US GDP posted its best
| 2 | • AB INTERMEDIATE BOND PORTFOLIO |
quarterly gain in two years (largely because of a surge in agricultural exports).
Central banks around the globe cut rates during the annual period, with some, including the Bank of Japan and the European Central Bank, dipping into negative rate territory. Volatility in Europe (and globally) spiked sharply in June after the UK voted to leave the European Union, a decision that was largely a surprise to investors. While investors initially responded by selling risk-sensitive assets, markets outside Europe quickly recovered. European markets began to stabilize as well, helped by the Bank of England’s first rate cut in seven years—to an historic low—and an aggressive asset-purchase program. Elsewhere, central banks in Australia and New Zealand also moved rates to record lows, while fiscal and monetary policy developments in Japan disappointed investors, who were expecting rate cuts or additional quantitative easing.
Yields in most developed markets fell in the 12-month period, with
UK yields reaching historic lows in the months following the Brexit referendum in June. At the end of the period, trillions of dollars’ worth of government debt around the world lingered in negative territory. Developed-market treasuries generally outperformed emerging-market local-currency government bonds and investment-grade credit securities, but lagged the rally in global high yield. Energy and basics were among the top performing sectors in each period, largely due to positive oil price action, while consumer-related sectors lagged the rising market.
On November 8, 2016, Donald Trump was elected as the 45th president of the United States, and the Congressional election outcome resulted in the Republican Party maintaining control of both the House of Representatives and the Senate. The Adviser believes that it will take time before the world has a clearer picture of the short- and long-term impact of the elections on the US economy and markets in general. The Adviser continues to monitor the markets, including for potential market volatility.
| AB INTERMEDIATE BOND PORTFOLIO • | 3 |
DISCLOSURES AND RISKS
Benchmark Disclosure
The Bloomberg Barclays US Aggregate Bond Index is unmanaged and does not reflect fees and expenses associated with the active management of a mutual fund portfolio. The Bloomberg Barclays US Aggregate Bond Index represents the performance of securities within the US investment-grade fixed-rate bond market, with index components for government and corporate securities, mortgage pass-through securities, asset-backed securities, and commercial mortgage-backed securities. An investor cannot invest directly in an index, and its results are not indicative of the performance for any specific investment, including the Portfolio.
A Word About Risk
Market Risk: The value of the Portfolio’s assets will fluctuate as the stock or bond market fluctuates. The value of its investments may decline, sometimes rapidly and unpredictably, simply because of economic changes or other events that affect large portions of the market.
Interest Rate Risk: Changes in interest rates will affect the value of investments in fixed-income securities. When interest rates rise, the value of investments in fixed-income securities tends to fall and this decrease in value may not be offset by higher income from new investments. The Portfolio may be subject to a greater risk of rising interest rates as the recent period of historically low rates is beginning to end and rates have begun rising. Interest rate risk is generally greater for fixed-income securities with longer maturities or durations.
Credit Risk: An issuer or guarantor of a fixed-income security, or the counterparty to a derivatives or other contract, may be unable or unwilling to make timely payments of interest or principal, or to otherwise honor its obligations. The issuer or guarantor may default, causing a loss of the full principal amount of a security and accrued interest. The degree of risk for a particular security may be reflected in its credit rating. There is the possibility that the credit rating of a fixed-income security may be downgraded after purchase, which may adversely affect the value of the security.
Below Investment Grade Securities Risk: Investments in fixed-income securities with lower ratings (commonly known as “junk bonds”) are subject to a higher probability that an issuer will default or fail to meet its payment obligations. These securities may be subject to greater price volatility due to such factors as specific corporate developments, negative perceptions of the junk bond market generally and less secondary market liquidity.
Duration Risk: Duration is a measure that relates the expected price volatility of a fixed-income security to changes in interest rates. The
(Disclosures, Risks and Note about Historical Performance continued on next page)
| 4 | • AB INTERMEDIATE BOND PORTFOLIO |
Disclosures and Risks
DISCLOSURES AND RISKS
(continued from previous page)
duration of a fixed-income security may be shorter than or equal to full maturity of a fixed-income security. Fixed-income securities with longer durations have more risk and will decrease in price as interest rates rise. For example, a fixed-income security with a duration of three years will decrease in value by approximately 3% if interest rates increase by 1%.
Inflation Risk: This is the risk that the value of assets or income from investments will be less in the future as inflation decreases the value of money. As inflation increases, the value of the Portfolio’s assets can decline as can the value of the Portfolio’s distributions. This risk is significantly greater if the Portfolio invests a significant portion of its assets in fixed-income securities with longer maturities.
Foreign (Non-US) Risk: Investments in securities of non-US issuers may involve more risk than those of US issuers. These securities may fluctuate more widely in price and may be less liquid due to adverse market, economic, political, regulatory or other factors.
Emerging Market Risk: Investments in emerging-market countries may have more risk because the markets are less developed and less liquid, and because these investments may be subject to increased economic, political, regulatory or other uncertainties.
Currency Risk: Fluctuations in currency exchange rates may negatively affect the value of the Portfolio’s investments or reduce its returns.
Prepayment Risk: The value of mortgage-related or asset-backed securities may be particularly sensitive to changes in prevailing interest rates. Early payments of principal on some mortgage-related securities may occur during periods of falling mortgage interest rates and expose the Portfolio to a lower rate of return upon reinvestment of principal. Early payments associated with mortgage-related securities cause these securities to experience significantly greater price and yield volatility than is experienced by traditional fixed-income securities. During periods of rising interest rates, a reduction in prepayments may increase the effective life of mortgage-related securities, subjecting them to greater risk of decline in market value in response to rising interest rates. If the life of a mortgage-related security is inaccurately predicted, the Portfolio may not be able to realize the rate of return it expected.
Leverage Risk: To the extent the Portfolio uses leveraging techniques, its net asset value (“NAV”) may be more volatile because leverage tends to exaggerate the effect of changes in interest rates and any increase or decrease in the value of the Portfolio’s investments.
Derivatives Risk: Derivatives may be illiquid, difficult to price, and leveraged so that small changes may produce disproportionate losses for the Portfolio, and may be subject to counterparty risk to a greater degree than more traditional investments.
(Disclosures, Risks and Note about Historical Performance continued on next page)
| AB INTERMEDIATE BOND PORTFOLIO • | 5 |
Disclosures and Risks
DISCLOSURES AND RISKS
(continued from previous page)
Liquidity Risk: Liquidity risk occurs when certain investments become difficult to purchase or sell. Difficulty in selling less liquid securities may result in sales at disadvantageous prices affecting the value of your investment in the Portfolio. Causes of liquidity risk may include low trading volumes, large positions and heavy redemptions of Portfolio shares. Over recent years liquidity risk has also increased because the capacity of dealers in the secondary market for fixed-income securities to make markets in these securities has decreased, even as the overall bond market has grown significantly, due to, among other things, structural changes, additional regulatory requirements and capital and risk restraints that have led to reduced inventories. Liquidity risk may be higher in a rising interest rate environment, when the value and liquidity of fixed-income securities generally decline.
Management Risk: The Portfolio is subject to management risk because it is an actively managed investment fund. The Adviser will apply its investment techniques and risk analyses in making investment decisions, but there is no guarantee that its techniques will produce the intended results.
These risks are fully discussed in the Portfolio’s prospectus. As with all investments, you may lose money by investing in the Portfolio.
An Important Note About Historical Performance
The investment return and principal value of an investment in the Portfolio will fluctuate, so that shares, when redeemed, may be worth more or less than their original cost. Performance shown on the following pages represents past performance and does not guarantee future results. Current performance may be lower or higher than the performance information shown. You may obtain performance information current to the most recent month-end by visiting www.abfunds.com.
All fees and expenses related to the operation of the Portfolio have been deducted. NAV returns do not reflect sales charges; if sales charges were reflected, the Portfolio’s quoted performance would be lower. SEC returns reflect the applicable sales charges for each share class: a 4.25% maximum front-end sales charge for Class A shares; the applicable contingent deferred sales charge for Class B shares (3% year 1, 2% year 2, 1% year 3); a 1% 1-year contingent deferred sales charge for Class C shares. Returns for the different share classes will vary due to different expenses associated with each class. Performance assumes reinvestment of distributions and does not account for taxes.
| 6 | • AB INTERMEDIATE BOND PORTFOLIO |
Disclosures and Risks
HISTORICAL PERFORMANCE
| THE PORTFOLIO VS. ITS BENCHMARK PERIODS ENDED OCTOBER 31, 2016 (unaudited) | NAV Returns | |||||||||||
| 6 Months | 12 Months | |||||||||||
| AB Intermediate Bond Portfolio | ||||||||||||
Class A | 2.42% | 4.93% | ||||||||||
| ||||||||||||
Class B* | 2.03% | 4.15% | ||||||||||
| ||||||||||||
Class C | 2.04% | 4.16% | ||||||||||
| ||||||||||||
Advisor Class† | 2.64% | 5.29% | ||||||||||
| ||||||||||||
Class R† | 2.29% | 4.67% | ||||||||||
| ||||||||||||
Class K† | 2.42% | 4.93% | ||||||||||
| ||||||||||||
Class I† | 2.56% | 5.20% | ||||||||||
| ||||||||||||
Class Z† | 2.63% | 5.28% | ||||||||||
| ||||||||||||
| Bloomberg Barclays US Aggregate Bond Index | 1.51% | 4.37% | ||||||||||
| ||||||||||||
* Effective January 31, 2009, Class B shares are no longer available for purchase to new investors. Please see Note A for additional information.
† Please note that these share classes are for investors purchasing shares through accounts established under certain fee-based programs sponsored and maintained by certain broker-dealers and financial intermediaries, institutional pension plans and/or investment advisory clients of, and certain other persons associated with, the Adviser and its affiliates or the Portfolio. |
| |||||||||||
See Disclosures, Risks and Note about Historical Performance on pages 4-6.
(Historical Performance continued on next page)
| AB INTERMEDIATE BOND PORTFOLIO • | 7 |
Historical Performance
HISTORICAL PERFORMANCE
(continued from previous page)
GROWTH OF A $10,000 INVESTMENT IN THE PORTFOLIO
10/31/06 TO 10/31/16 (unaudited)
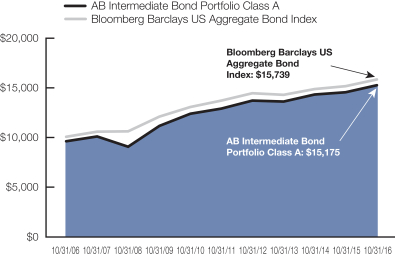
This chart illustrates the total value of an assumed $10,000 investment in AB Intermediate Bond Portfolio Class A shares (from 10/31/06 to 10/31/16) as compared to the performance of the Portfolio’s benchmark. The chart reflects the deduction of the maximum 4.25% sales charge from the initial $10,000 investment in the Portfolio and assumes the reinvestment of dividends and capital gains distributions.
See Disclosures, Risks and Note about Historical Performance on pages 4-6.
(Historical Performance continued on next page)
| 8 | • AB INTERMEDIATE BOND PORTFOLIO |
Historical Performance
HISTORICAL PERFORMANCE
(continued from previous page)
| AVERAGE ANNUAL RETURNS AS OF OCTOBER 31, 2016 (unaudited) | ||||||||||||
| NAV Returns | SEC Returns (reflects applicable sales charges) | SEC Yields* | ||||||||||
| Class A Shares | 1.82 | % | ||||||||||
1 Year | 4.93 | % | 0.48 | % | ||||||||
5 Years | 3.40 | % | 2.51 | % | ||||||||
10 Years | 4.71 | % | 4.26 | % | ||||||||
| Class B Shares | 1.36 | % | ||||||||||
1 Year | 4.15 | % | 1.15 | % | ||||||||
5 Years | 2.65 | % | 2.65 | % | ||||||||
10 Years(a) | 4.29 | % | 4.29 | % | ||||||||
| Class C Shares | 1.18 | % | ||||||||||
1 Year | 4.16 | % | 3.16 | % | ||||||||
5 Years | 2.68 | % | 2.68 | % | ||||||||
10 Years | 3.99 | % | 3.99 | % | ||||||||
| Advisor Class Shares† | 2.15 | % | ||||||||||
1 Year | 5.29 | % | 5.29 | % | ||||||||
5 Years | 3.69 | % | 3.69 | % | ||||||||
10 Years | 5.02 | % | 5.02 | % | ||||||||
| Class R Shares† | 1.54 | % | ||||||||||
1 Year | 4.67 | % | 4.67 | % | ||||||||
5 Years | 3.18 | % | 3.18 | % | ||||||||
10 Years | 4.49 | % | 4.49 | % | ||||||||
| Class K Shares† | 1.85 | % | ||||||||||
1 Year | 4.93 | % | 4.93 | % | ||||||||
5 Years | 3.44 | % | 3.44 | % | ||||||||
10 Years | 4.75 | % | 4.75 | % | ||||||||
| Class I Shares† | 2.17 | % | ||||||||||
1 Year | 5.20 | % | 5.20 | % | ||||||||
5 Years | 3.67 | % | 3.67 | % | ||||||||
10 Years | 5.02 | % | 5.02 | % | ||||||||
| Class Z Shares† | 2.27 | % | ||||||||||
1 Year | 5.28 | % | 5.28 | % | ||||||||
Since Inception‡ | 3.81 | % | 3.81 | % | ||||||||
See Disclosures, Risks and Note about Historical Performance on pages 4-6.
(Historical Performance and footnotes continued on next page)
| AB INTERMEDIATE BOND PORTFOLIO • | 9 |
Historical Performance
HISTORICAL PERFORMANCE
(continued from previous page)
The Portfolio’s prospectus fee table shows the Portfolio’s total annual operating expense ratios as 1.03%, 1.80%, 1.78%, 0.77%, 1.38%, 1.08%, 0.75% and 0.71% for Class A, Class B, Class C, Advisor Class, Class R, Class K, Class I and Class Z shares, respectively, gross of any fee waivers or expense reimbursements. Contractual fee waivers and/or expense reimbursements limit the Portfolio’s annual operating expense ratios to 0.85%, 1.60%, 1.60%, 0.60%, 1.10%, 0.85%, 0.60% and 0.60% for Class A, Class B, Class C, Advisor Class, Class R, Class K, Class I and Class Z shares, respectively. These waivers/reimbursements may not be terminated before January 31, 2017 and may be extended by the Adviser for additional one-year terms. Absent reimbursements or waivers, performance would have been lower. The Financial Highlights section of this report sets forth expense ratio data for the current reporting period; the expense ratios shown above may differ from the expense ratios in the Financial Highlights sections since they are based on different time periods.
| * | SEC yields are calculated based on SEC guidelines for the 30-day period ended October 31, 2016. |
| (a) | Assumes conversion of Class B shares into Class A shares after six years. |
| † | These share classes are offered at NAV to eligible investors and their SEC returns are the same as their NAV returns. Please note that these share classes are for investors purchasing shares through accounts established under certain fee-based programs sponsored and maintained by certain broker-dealers and financial intermediaries, institutional pension plans and/or investment advisory clients of, and certain other persons associated with, the Adviser and its affiliates or the Portfolio. |
| ‡ | Inception date: 4/25/2014. |
See Disclosures, Risks and Note about Historical Performance on pages 4-6.
(Historical Performance continued on next page)
| 10 | • AB INTERMEDIATE BOND PORTFOLIO |
Historical Performance
HISTORICAL PERFORMANCE
(continued from previous page)
| SEC AVERAGE ANNUAL RETURNS AS OF THE MOST RECENT CALENDAR QUARTER-END SEPTEMBER 30, 2016 (unaudited) | ||||
| SEC Returns (reflects applicable sales charges) | ||||
| Class A Shares | ||||
1 Year | 1.21 | % | ||
5 Years | 2.58 | % | ||
10 Years | 4.38 | % | ||
| Class B Shares | ||||
1 Year | 1.88 | % | ||
5 Years | 2.75 | % | ||
10 Years(a) | 4.42 | % | ||
| Class C Shares | ||||
1 Year | 3.90 | % | ||
5 Years | 2.75 | % | ||
10 Years | 4.10 | % | ||
| Advisor Class Shares* | ||||
1 Year | 6.03 | % | ||
5 Years | 3.77 | % | ||
10 Years | 5.14 | % | ||
| Class R Shares* | ||||
1 Year | 5.41 | % | ||
5 Years | 3.26 | % | ||
10 Years | 4.61 | % | ||
| Class K Shares* | ||||
1 Year | 5.67 | % | ||
5 Years | 3.51 | % | ||
10 Years | 4.87 | % | ||
| Class I Shares* | ||||
1 Year | 5.94 | % | ||
5 Years | 3.75 | % | ||
10 Years | 5.14 | % | ||
| Class Z Shares* | ||||
1 Year | 6.02 | % | ||
Since Inception† | 4.16 | % | ||
| (a) | Assumes conversion of Class B shares into Class A shares after six years. |
| * | Please note that these share classes are for investors purchasing shares through accounts established under certain fee-based programs sponsored and maintained by certain broker-dealers and financial intermediaries, institutional pension plans and/or investment advisory clients of, and certain other persons associated with, the Adviser and its affiliates or the Portfolio. |
| † | Inception date: 4/25/2014. |
See Disclosures, Risks and Note about Historical Performance on pages 4-6.
| AB INTERMEDIATE BOND PORTFOLIO • | 11 |
Historical Performance
EXPENSE EXAMPLE
(unaudited)
As a shareholder of the Fund, you incur two types of costs: (1) transaction costs, including sales charges (loads) on purchase payments, contingent deferred sales charges on redemptions and (2) ongoing costs, including management fees; distribution (12b-1) fees; and other Fund expenses. This example is intended to help you understand your ongoing costs (in dollars) of investing in the Fund and to compare these costs with the ongoing costs of investing in other mutual funds.
The Example is based on an investment of $1,000 invested at the beginning of the period and held for the entire period as indicated below.
Actual Expenses
The table below provides information about actual account values and actual expenses. You may use the information, together with the amount you invested, to estimate the expenses that you paid over the period. Simply divide your account value by $1,000 (for example, an $8,600 account value divided by $1,000 = 8.6), then multiply the result by the number under the heading entitled “Expenses Paid During Period” to estimate the expenses you paid on your account during this period.
Hypothetical Example for Comparison Purposes
The table below also provides information about hypothetical account values and hypothetical expenses based on the Fund’s actual expense ratio and an assumed annual rate of return of 5% before expenses, which is not the Fund’s actual return. The hypothetical account values and expenses may not be used to estimate the actual ending account balance or expenses you paid for the period. You may use this information to compare the ongoing costs of investing in the Fund and other funds by comparing this 5% hypothetical example with the 5% hypothetical examples that appear in the shareholder reports of other funds.
Please note that the expenses shown in the table are meant to highlight your ongoing costs only and do not reflect any transactional costs, such as sales charges (loads), or contingent deferred sales charges on redemptions. Therefore, the hypothetical example is useful in comparing ongoing costs only, and will not help you determine the relative total costs of owning different funds. In addition, if these transactional costs were included, your costs would have been higher.
| 12 | • AB INTERMEDIATE BOND PORTFOLIO |
Expense Example
EXPENSE EXAMPLE
(unaudited)
(continued from previous page)
| Beginning Account Value May 1, 2016 | Ending Account Value October 31, 2016 | Expenses Paid During Period* | Annualized Expense Ratio* | Effective Expenses Paid During Period+ | Effective Annualized Expense Ratio+ | |||||||||||||||||||
| Class A | ||||||||||||||||||||||||
Actual | $ | 1,000 | $ | 1,024.20 | $ | 4.27 | 0.84 | % | $ | 4.32 | 0.85 | % | ||||||||||||
Hypothetical** | $ | 1,000 | $ | 1,020.91 | $ | 4.27 | 0.84 | % | $ | 4.32 | 0.85 | % | ||||||||||||
| Class B | ||||||||||||||||||||||||
Actual | $ | 1,000 | $ | 1,020.30 | $ | 8.07 | 1.59 | % | $ | 8.13 | 1.60 | % | ||||||||||||
Hypothetical** | $ | 1,000 | $ | 1,017.14 | $ | 8.06 | 1.59 | % | $ | 8.11 | 1.60 | % | ||||||||||||
| Class C | ||||||||||||||||||||||||
Actual | $ | 1,000 | $ | 1,020.40 | $ | 8.07 | 1.59 | % | $ | 8.13 | 1.60 | % | ||||||||||||
Hypothetical** | $ | 1,000 | $ | 1,017.14 | $ | 8.06 | 1.59 | % | $ | 8.11 | 1.60 | % | ||||||||||||
| Advisor Class | ||||||||||||||||||||||||
Actual | $ | 1,000 | $ | 1,026.40 | $ | 3.01 | 0.59 | % | $ | 3.06 | 0.60 | % | ||||||||||||
Hypothetical** | $ | 1,000 | $ | 1,022.17 | $ | 3.00 | 0.59 | % | $ | 3.05 | 0.60 | % | ||||||||||||
| Class R | ||||||||||||||||||||||||
Actual | $ | 1,000 | $ | 1,022.90 | $ | 5.54 | 1.09 | % | $ | 5.59 | 1.10 | % | ||||||||||||
Hypothetical** | $ | 1,000 | $ | 1,019.66 | $ | 5.53 | 1.09 | % | $ | 5.58 | 1.10 | % | ||||||||||||
| Class K | ||||||||||||||||||||||||
Actual | $ | 1,000 | $ | 1,024.20 | $ | 4.27 | 0.84 | % | $ | 4.32 | 0.85 | % | ||||||||||||
Hypothetical** | $ | 1,000 | $ | 1,020.91 | $ | 4.27 | 0.84 | % | $ | 4.32 | 0.85 | % | ||||||||||||
| Class I | ||||||||||||||||||||||||
Actual | $ | 1,000 | $ | 1,025.60 | $ | 3.06 | 0.60 | % | $ | 3.06 | 0.60 | % | ||||||||||||
Hypothetical** | $ | 1,000 | $ | 1,022.12 | $ | 3.05 | 0.60 | % | $ | 3.05 | 0.60 | % | ||||||||||||
| Class Z | ||||||||||||||||||||||||
Actual | $ | 1,000 | $ | 1,026.30 | $ | 3.06 | 0.60 | % | $ | 3.06 | 0.60 | % | ||||||||||||
Hypothetical** | $ | 1,000 | $ | 1,022.12 | $ | 3.05 | 0.60 | % | $ | 3.05 | 0.60 | % | ||||||||||||
| * | Expenses are equal to the classes’ annualized expense ratios multiplied by the average account value over the period, multiplied by 184/366 (to reflect the one-half year period). |
| ** | Assumes 5% annual return before expenses. |
| + | The Portfolio’s investment in affiliated underlying portfolios incur no direct expenses, but bears proportionate shares of the acquired fund fees (i.e., operating, administrative and investment advisory fee) of the affiliated underlying portfolios. Currently the Adviser has voluntarily agreed to waive its investment advisory fee from the Portfolio in an amount equal to the Portfolio’s share of the advisory fees of the affiliated underlying portfolios, as borne indirectly by the Portfolio as an acquired fund fee and expense. The Portfolio’s effective expenses are equal to the classes’ annualized expense ratio plus the Portfolio’s pro-rata share of the weighted average expense ratio of the affiliated underlying portfolios in which it invests, multiplied by the average account value over the period, multiplied by 184/366 (to reflect the one-half year period). |
| AB INTERMEDIATE BOND PORTFOLIO • | 13 |
Expense Example
PORTFOLIO SUMMARY
October 31, 2016 (unaudited)
PORTFOLIO STATISTICS
Net Assets ($mil): $374.2
TOP TEN SECTORS (including derivatives)*
Governments – Treasuries(a) | 34.7 | % | ||
Corporates – Investment Grade(b) | 24.3 | |||
Mortgage Pass-Throughs | 17.9 | |||
Asset-Backed Securities | 13.1 | |||
Commercial Mortgage-Backed Securities(b) | 11.3 | |||
Collateralized Mortgage Obligations | 8.3 | |||
Inflation-Linked Securities | 5.0 | |||
Corporates – Non Investment Grade(b) | 4.3 | |||
Agencies | 2.8 | |||
Interest Rate Swaps(c) | -32.9 | |||
SECTOR BREAKDOWN (excluding derivatives)†
Corporates – Investment Grade | 21.1 | % | ||
Mortgage Pass-Throughs | 15.8 | |||
Governments – Treasuries | 12.3 | |||
Asset-Backed Securities | 11.6 | |||
Commercial Mortgage-Backed Securities | 8.5 | |||
Collateralized Mortgage Obligations | 7.3 | |||
Inflation-Linked Securities | 4.4 | |||
Corporates – Non-Investment Grade | 4.1 | |||
Agencies | 2.5 | |||
Emerging Markets – Treasuries | 0.8 | % | ||
Governments – Sovereign Agencies | 0.5 | |||
Local Governments – Municipal Bonds | 0.4 | |||
Emerging Markets – Corporate Bonds | 0.4 | |||
Short-Term | 9.6 | |||
Other | 0.7 | |||
|
| |||
| 100.0 | % | |||
|
| |||
| * | All data are as of October 31, 2016. The Portfolio’s sectors include derivative exposure and are expressed as approximate percentages of the Portfolio’s total net assets, based on the Adviser’s internal classification. The percentages will vary over time. |
| (a) | Includes Treasury Futures. |
| (b) | Includes Credit Default Swaps. |
| (c) | Represents the exposure of the Portfolio’s fixed-rate payments on the Interest Rate Swaps. Interest Rate Swaps involve the exchange by a fund with another party of payments calculated by reference to specified interest rates (e.g., an exchange of floating-rate payments for fixed-rate payments). |
| † | All data are as of October 31, 2016. The Portfolio’s sector breakdown is expressed as a percentage of total investments and may vary over time. The Portfolio also enters into derivative transactions, which may be used for hedging or investment purposes (see “Portfolio of Investments” section of the report for additional details). “Other” represents the following categories: Common Stocks, Governments – Sovereign Bonds, Options Purchased – Calls and Quasi-Sovereigns. |
| 14 | • AB INTERMEDIATE BOND PORTFOLIO |
Portfolio Summary
PORTFOLIO OF INVESTMENTS
October 31, 2016
| Principal Amount (000) | U.S. $ Value | |||||||||||
|
|
| ||||||||||
CORPORATES - INVESTMENT GRADE – 23.9% | ||||||||||||
Industrial – 16.6% | ||||||||||||
Basic – 1.3% | ||||||||||||
Barrick Gold Corp. | U.S.$ | 66 | $ | 70,949 | ||||||||
Eastman Chemical Co. | 290 | 301,690 | ||||||||||
Glencore Funding LLC | 516 | 512,130 | ||||||||||
International Paper Co. | 172 | 191,029 | ||||||||||
LyondellBasell Industries NV | 1,311 | 1,533,022 | ||||||||||
Minsur SA | 335 | 349,954 | ||||||||||
Mosaic Co. (The) | 244 | 245,640 | ||||||||||
Sociedad Quimica y Minera de Chile SA | 1,607 | 1,594,947 | ||||||||||
Vale Overseas Ltd. | 180 | 181,521 | ||||||||||
|
| |||||||||||
| 4,980,882 | ||||||||||||
|
| |||||||||||
Capital Goods – 0.1% | ||||||||||||
General Electric Co. | 187 | 198,108 | ||||||||||
Yamana Gold, Inc. | 339 | 348,153 | ||||||||||
|
| |||||||||||
| 546,261 | ||||||||||||
|
| |||||||||||
Communications - Media – 2.3% | ||||||||||||
21st Century Fox America, Inc. | 902 | 1,107,266 | ||||||||||
6.55%, 3/15/33 | 142 | 177,659 | ||||||||||
CBS Corp. | 710 | 795,762 | ||||||||||
Charter Communications Operating LLC/Charter Communications Operating Capital | 740 | 798,128 | ||||||||||
Cox Communications, Inc. | 233 | 226,262 | ||||||||||
Discovery Communications LLC | 467 | 465,931 | ||||||||||
NBCUniversal Enterprise, Inc. | 604 | 643,441 | ||||||||||
S&P Global, Inc. | 584 | 647,569 | ||||||||||
| AB INTERMEDIATE BOND PORTFOLIO • | 15 |
Portfolio of Investments
| Principal Amount (000) | U.S. $ Value | |||||||||||
|
|
| ||||||||||
TCI Communications, Inc. | U.S.$ | 670 | $ | 937,462 | ||||||||
Time Warner Cable LLC | 230 | 216,288 | ||||||||||
5.00%, 2/01/20 | 740 | 798,314 | ||||||||||
Time Warner, Inc. | 518 | 536,586 | ||||||||||
4.70%, 1/15/21 | 600 | 658,439 | ||||||||||
7.625%, 4/15/31 | 154 | 215,199 | ||||||||||
Viacom, Inc. | 240 | 263,045 | ||||||||||
|
| |||||||||||
| 8,487,351 | ||||||||||||
|
| |||||||||||
Communications - Telecommunications – 1.8% | ||||||||||||
American Tower Corp. | 1,185 | 1,304,096 | ||||||||||
AT&T, Inc. | 1,275 | 1,270,833 | ||||||||||
3.80%, 3/15/22 | 252 | 265,267 | ||||||||||
4.60%, 2/15/21 | 565 | 611,040 | ||||||||||
4.75%, 5/15/46 | 349 | 341,523 | ||||||||||
Rogers Communications, Inc. | CAD | 130 | 106,732 | |||||||||
Sprint Spectrum Co. LLC/Sprint Spectrum Co. II LLC/Sprint Spectrum Co. III LLC | U.S.$ | 400 | 401,000 | |||||||||
Telefonica Emisiones SAU | 520 | 585,670 | ||||||||||
Verizon Communications, Inc. | 1,105 | 1,151,771 | ||||||||||
3.85%, 11/01/42 | 515 | 471,323 | ||||||||||
4.862%, 8/21/46 | 413 | 437,440 | ||||||||||
|
| |||||||||||
| 6,946,695 | ||||||||||||
|
| |||||||||||
Consumer Cyclical - Automotive – 0.9% | ||||||||||||
Ford Motor Credit Co. LLC | 603 | 609,959 | ||||||||||
5.875%, 8/02/21 | 1,291 | 1,465,967 | ||||||||||
General Motors Co. | 340 | 349,069 | ||||||||||
General Motors Financial Co., Inc. | 560 | 569,845 | ||||||||||
3.25%, 5/15/18 | 43 | 43,766 | ||||||||||
4.00%, 1/15/25 | 106 | 106,465 | ||||||||||
4.30%, 7/13/25 | 135 | 138,107 | ||||||||||
|
| |||||||||||
| 3,283,178 | ||||||||||||
|
| |||||||||||
Consumer Cyclical - Retailers – 0.5% | ||||||||||||
CVS Health Corp. | 589 | 628,525 | ||||||||||
| 16 | • AB INTERMEDIATE BOND PORTFOLIO |
Portfolio of Investments
| Principal Amount (000) | U.S. $ Value | |||||||||||
|
|
| ||||||||||
Kohl’s Corp. | U.S.$ | 445 | $ | 431,628 | ||||||||
Walgreens Boots Alliance, Inc. | 885 | 930,729 | ||||||||||
|
| |||||||||||
| 1,990,882 | ||||||||||||
|
| |||||||||||
Consumer Non-Cyclical – 4.4% | ||||||||||||
AbbVie, Inc. | 1,057 | 1,077,856 | ||||||||||
Actavis Funding SCS | 1,025 | 1,063,759 | ||||||||||
3.85%, 6/15/24 | 238 | 247,569 | ||||||||||
Agilent Technologies, Inc. | 217 | 239,859 | ||||||||||
Altria Group, Inc. | 885 | 910,430 | ||||||||||
AstraZeneca PLC | 235 | 319,619 | ||||||||||
Baxalta, Inc. | 335 | 378,470 | ||||||||||
Bayer US Finance LLC | 321 | 330,184 | ||||||||||
Becton Dickinson and Co. | 388 | 413,574 | ||||||||||
Biogen, Inc. | 683 | 727,818 | ||||||||||
Bunge Ltd. Finance Corp. | 6 | 6,992 | ||||||||||
Celgene Corp. | 1,310 | 1,372,359 | ||||||||||
Gilead Sciences, Inc. | 678 | 710,708 | ||||||||||
Grupo Bimbo SAB de CV | 538 | 559,278 | ||||||||||
Kraft Heinz Foods Co. | 335 | 344,662 | ||||||||||
3.50%, 7/15/22 | 430 | 453,074 | ||||||||||
Laboratory Corp. of America Holdings | 265 | 274,081 | ||||||||||
Medtronic, Inc. | 890 | 944,359 | ||||||||||
Newell Brands, Inc. | 1,996 | 2,078,393 | ||||||||||
3.85%, 4/01/23 | 256 | 271,670 | ||||||||||
PepsiCo, Inc. | 440 | 490,875 | ||||||||||
Perrigo Finance Unlimited Co. | 217 | 224,046 | ||||||||||
3.90%, 12/15/24 | 360 | 364,114 | ||||||||||
| AB INTERMEDIATE BOND PORTFOLIO • | 17 |
Portfolio of Investments
| Principal Amount (000) | U.S. $ Value | |||||||||||
|
|
| ||||||||||
Reynolds American, Inc. | U.S.$ | 202 | $ | 251,148 | ||||||||
Teva Pharmaceutical Finance Netherlands III BV | 680 | 669,148 | ||||||||||
3.15%, 10/01/26 | 452 | 439,586 | ||||||||||
Thermo Fisher Scientific, Inc. | 383 | 412,493 | ||||||||||
Tyson Foods, Inc. | 164 | 167,651 | ||||||||||
3.95%, 8/15/24 | 541 | 574,228 | ||||||||||
|
| |||||||||||
| 16,318,003 | ||||||||||||
|
| |||||||||||
Energy – 3.5% | ||||||||||||
Encana Corp. | 415 | 419,897 | ||||||||||
Energy Transfer Partners LP | 411 | 439,629 | ||||||||||
7.50%, 7/01/38 | 772 | 903,185 | ||||||||||
EnLink Midstream Partners LP | 562 | 500,919 | ||||||||||
Enterprise Products Operating LLC | 735 | 749,618 | ||||||||||
5.20%, 9/01/20 | 235 | 261,829 | ||||||||||
Halliburton Co. | 825 | 901,352 | ||||||||||
Hess Corp. | 648 | 645,095 | ||||||||||
Kinder Morgan Energy Partners LP | 1,460 | 1,528,714 | ||||||||||
4.15%, 3/01/22 | 849 | 893,123 | ||||||||||
Noble Energy, Inc. | 463 | 476,030 | ||||||||||
8.25%, 3/01/19 | 1,232 | 1,402,056 | ||||||||||
Plains All American Pipeline LP/PAA Finance Corp. | 594 | 585,404 | ||||||||||
Regency Energy Partners LP/Regency Energy Finance Corp. | 135 | 137,889 | ||||||||||
5.75%, 9/01/20 | 420 | 460,253 | ||||||||||
Schlumberger Holdings Corp. | 845 | 903,240 | ||||||||||
TransCanada PipeLines Ltd. | 831 | 664,800 | ||||||||||
Valero Energy Corp. | 770 | 869,576 | ||||||||||
Williams Partners LP | 403 | 420,500 | ||||||||||
|
| |||||||||||
| 13,163,109 | ||||||||||||
|
| |||||||||||
| 18 | • AB INTERMEDIATE BOND PORTFOLIO |
Portfolio of Investments
| Principal Amount (000) | U.S. $ Value | |||||||||||
|
|
| ||||||||||
Services – 0.1% | ||||||||||||
eBay, Inc. | U.S.$ | 232 | $ | 246,093 | ||||||||
|
| |||||||||||
Technology – 1.7% | ||||||||||||
Diamond 1 Finance Corp./Diamond 2 Finance Corp. | 865 | 926,292 | ||||||||||
Fidelity National Information Services, Inc. | 241 | 250,926 | ||||||||||
5.00%, 10/15/25 | 3 | 3,376 | ||||||||||
Hewlett Packard Enterprise Co. | 825 | 880,980 | ||||||||||
HP, Inc. | 266 | 289,956 | ||||||||||
KLA-Tencor Corp. | 614 | 671,119 | ||||||||||
Lam Research Corp. | 269 | 273,903 | ||||||||||
Micron Technology, Inc. | 224 | 247,240 | ||||||||||
Motorola Solutions, Inc. | 400 | 400,703 | ||||||||||
7.50%, 5/15/25 | 228 | 272,032 | ||||||||||
Oracle Corp. | 510 | 514,062 | ||||||||||
Seagate HDD Cayman | 336 | 320,208 | ||||||||||
Total System Services, Inc. | 344 | 346,239 | ||||||||||
3.75%, 6/01/23 | 350 | 360,578 | ||||||||||
Western Digital Corp. | 508 | 555,625 | ||||||||||
|
| |||||||||||
| 6,313,239 | ||||||||||||
|
| |||||||||||
| 62,275,693 | ||||||||||||
|
| |||||||||||
Financial Institutions – 6.5% | ||||||||||||
Banking – 4.6% | ||||||||||||
ABN AMRO Bank NV | 200 | 210,098 | ||||||||||
Bank of America Corp. | 1,053 | 1,070,489 | ||||||||||
Barclays Bank PLC | EUR | 333 | 443,324 | |||||||||
Barclays PLC | U.S.$ | 389 | 381,932 | |||||||||
BNP Paribas SA | EUR | 345 | 374,856 | |||||||||
| AB INTERMEDIATE BOND PORTFOLIO • | 19 |
Portfolio of Investments
| Principal Amount (000) | U.S. $ Value | |||||||||||
|
|
| ||||||||||
BPCE SA | U.S.$ | 230 | $ | 249,197 | ||||||||
Compass Bank | 1,339 | 1,429,017 | ||||||||||
Cooperatieve Rabobank UA | 1,373 | 1,446,057 | ||||||||||
Credit Agricole SA | 369 | 376,613 | ||||||||||
Credit Suisse Group Funding Guernsey Ltd. | 600 | 605,822 | ||||||||||
Goldman Sachs Group, Inc. (The) | 710 | 706,209 | ||||||||||
3.75%, 5/22/25 | 254 | 264,231 | ||||||||||
3.85%, 7/08/24 | 905 | 954,929 | ||||||||||
Series D | 1,282 | 1,448,361 | ||||||||||
Lloyds Banking Group PLC | 400 | 411,545 | ||||||||||
4.65%, 3/24/26 | 366 | 376,715 | ||||||||||
Mitsubishi UFJ Financial Group, Inc. | 234 | 251,335 | ||||||||||
Mizuho Financial Group Cayman 3 Ltd. | 812 | 881,708 | ||||||||||
Morgan Stanley | 478 | 526,271 | ||||||||||
Series G | 590 | 656,920 | ||||||||||
Murray Street Investment Trust I | 125 | 126,504 | ||||||||||
Nationwide Building Society | 950 | 936,678 | ||||||||||
Santander Issuances SAU | 1,000 | 1,036,018 | ||||||||||
Santander UK PLC | 500 | 517,962 | ||||||||||
Societe Generale SA | 375 | 373,597 | ||||||||||
UBS AG/Stamford CT | 620 | 718,425 | ||||||||||
UBS Group Funding Jersey Ltd. | 436 | 454,811 | ||||||||||
|
| |||||||||||
| 17,229,624 | ||||||||||||
|
| |||||||||||
Finance – 0.3% | ||||||||||||
AerCap Aviation Solutions BV | 320 | 328,400 | ||||||||||
Aviation Capital Group Corp. | 552 | 650,346 | ||||||||||
| 20 | • AB INTERMEDIATE BOND PORTFOLIO |
Portfolio of Investments
| Principal Amount (000) | U.S. $ Value | |||||||||||
|
|
| ||||||||||
International Lease Finance Corp. | U.S.$ | 245 | $ | 263,297 | ||||||||
|
| |||||||||||
| 1,242,043 | ||||||||||||
|
| |||||||||||
Insurance – 1.4% | ||||||||||||
American International Group, Inc. | 940 | 1,259,033 | ||||||||||
Guardian Life Insurance Co. of America (The) | 542 | 751,259 | ||||||||||
Hartford Financial Services Group, Inc. (The) | 726 | 806,763 | ||||||||||
Lincoln National Corp. | 361 | 420,868 | ||||||||||
MetLife Capital Trust IV | 699 | 894,720 | ||||||||||
Nationwide Mutual Insurance Co. | 246 | 376,089 | ||||||||||
ZFS Finance USA Trust V | 538 | 541,901 | ||||||||||
|
| |||||||||||
| 5,050,633 | ||||||||||||
|
| |||||||||||
REITS – 0.2% | ||||||||||||
Host Hotels & Resorts LP | 545 | 601,825 | ||||||||||
|
| |||||||||||
| 24,124,125 | ||||||||||||
|
| |||||||||||
Utility – 0.8% | ||||||||||||
Electric – 0.7% | ||||||||||||
CMS Energy Corp. | 440 | 497,643 | ||||||||||
Constellation Energy Group, Inc. | 260 | 287,569 | ||||||||||
Entergy Corp. | 582 | 625,854 | ||||||||||
Exelon Corp. | 320 | 361,857 | ||||||||||
Exelon Generation Co. LLC | 337 | 358,709 | ||||||||||
TECO Finance, Inc. | 380 | 415,363 | ||||||||||
|
| |||||||||||
| 2,546,995 | ||||||||||||
|
| |||||||||||
Natural Gas – 0.1% | ||||||||||||
Talent Yield Investments Ltd. | 472 | 512,559 | ||||||||||
|
| |||||||||||
| 3,059,554 | ||||||||||||
|
| |||||||||||
Total Corporates – Investment Grade | 89,459,372 | |||||||||||
|
| |||||||||||
| AB INTERMEDIATE BOND PORTFOLIO • | 21 |
Portfolio of Investments
| Principal Amount (000) | U.S. $ Value | |||||||||||
|
|
| ||||||||||
MORTGAGE PASS-THROUGHS – 17.9% | ||||||||||||
Agency ARMs – 0.0% | ||||||||||||
Federal Home Loan Mortgage Corp. | U.S.$ | 54 | $ | 57,174 | ||||||||
|
| |||||||||||
Agency Fixed Rate 15-Year – 2.1% | ||||||||||||
Federal National Mortgage Association | 4,852 | 4,992,633 | ||||||||||
3.50%, 10/01/25-1/12/30 | 2,478 | 2,622,401 | ||||||||||
|
| |||||||||||
| 7,615,034 | ||||||||||||
|
| |||||||||||
Agency Fixed Rate 30-Year – 15.8% | ||||||||||||
Federal Home Loan Mortgage Corp. Gold | 910 | 973,380 | ||||||||||
Series 2007 | 42 | 47,609 | ||||||||||
Series 2005 | 308 | 350,445 | ||||||||||
Federal National Mortgage Association | 3,421 | 3,693,765 | ||||||||||
Series 2003 | 300 | 340,576 | ||||||||||
Series 2004 | 171 | 194,761 | ||||||||||
5.50%, 1/01/35 | 814 | 924,756 | ||||||||||
Series 2005 | 127 | 143,914 | ||||||||||
Series 2007 | 554 | 629,657 | ||||||||||
3.50%, 10/01/45 | 465 | 488,224 | ||||||||||
3.50%, 11/01/46, TBA | 22,173 | 23,278,187 | ||||||||||
4.00%, 11/25/46, TBA | 4,890 | 5,236,120 | ||||||||||
4.50%, 11/25/46, TBA | 13,197 | 14,423,909 | ||||||||||
Government National Mortgage Association | 4,462 | 4,727,653 | ||||||||||
3.50%, 11/01/46, TBA | 2,095 | 2,218,736 | ||||||||||
Series 1990 | – 0 | –** | 20 | |||||||||
Series 1999 | 34 | 35,649 | ||||||||||
3.00%, 11/01/46, TBA | 1,440 | 1,500,075 | ||||||||||
|
| |||||||||||
| 59,207,436 | ||||||||||||
|
| |||||||||||
Total Mortgage Pass-Throughs | 66,879,644 | |||||||||||
|
| |||||||||||
GOVERNMENTS - TREASURIES – 13.9% | ||||||||||||
United States – 13.9% | ||||||||||||
U.S. Treasury Bonds | 1,484 | 1,457,945 | ||||||||||
2.875%, 8/15/45 | 800 | 847,750 | ||||||||||
| 22 | • AB INTERMEDIATE BOND PORTFOLIO |
Portfolio of Investments
| Principal Amount (000) | U.S. $ Value | |||||||||||
|
|
| ||||||||||
3.00%, 5/15/45-11/15/45 | U.S.$ | 1,636 | $ | 1,775,987 | ||||||||
3.125%, 8/15/44 | 10,677 | 11,876,996 | ||||||||||
4.375%, 2/15/38 | 960 | 1,290,938 | ||||||||||
5.375%, 2/15/31 | 1,444 | 2,051,045 | ||||||||||
U.S. Treasury Notes | 12,834 | 12,831,125 | ||||||||||
1.125%, 9/30/21 | 2,352 | 2,329,766 | ||||||||||
1.625%, 8/31/19-5/15/26 | 11,995 | 11,858,242 | ||||||||||
1.625%, 2/15/26(d) | 418 | 411,175 | ||||||||||
2.25%, 11/15/24-11/15/25 | 5,166 | 5,360,870 | ||||||||||
|
| |||||||||||
Total Governments – Treasuries | 52,091,839 | |||||||||||
|
| |||||||||||
ASSET-BACKED SECURITIES – 13.1% | ||||||||||||
Autos - Fixed Rate – 8.8% | ||||||||||||
Ally Auto Receivables Trust | 824 | 826,019 | ||||||||||
Ally Master Owner Trust | 1,409 | 1,409,052 | ||||||||||
Series 2015-3, Class A | 1,226 | 1,229,596 | ||||||||||
Americredit Automobile Receivables Trust | 755 | 754,727 | ||||||||||
ARI Fleet Lease Trust | 48 | 47,585 | ||||||||||
Avis Budget Rental Car Funding AESOP LLC | 1,005 | 1,008,044 | ||||||||||
Series 2016-1A, Class A | 418 | 426,227 | ||||||||||
Bank of The West Auto Trust | 1,182 | 1,183,111 | ||||||||||
California Republic Auto Receivables Trust | 546 | 547,390 | ||||||||||
Series 2015-2, Class A3 | 528 | 527,620 | ||||||||||
Capital Auto Receivables Asset Trust | 220 | 220,750 | ||||||||||
CarMax Auto Owner Trust | 497 | 498,681 | ||||||||||
| AB INTERMEDIATE BOND PORTFOLIO • | 23 |
Portfolio of Investments
| Principal Amount (000) | U.S. $ Value | |||||||||||
|
|
| ||||||||||
Chrysler Capital Auto Receivables Trust | U.S.$ | 822 | $ | 825,464 | ||||||||
Series 2016-AA, Class A3 | 913 | 915,438 | ||||||||||
CPS Auto Receivables Trust | 182 | 182,192 | ||||||||||
Series 2014-B, Class A | 80 | 80,144 | ||||||||||
Series 2016-C, Class E | 600 | 624,945 | ||||||||||
Drive Auto Receivables Trust | 615 | 614,613 | ||||||||||
Enterprise Fleet Financing LLC | 49 | 48,985 | ||||||||||
Series 2015-1, Class A2 | 696 | 695,604 | ||||||||||
Exeter Automobile Receivables Trust | 270 | 287,611 | ||||||||||
Series 2016-3A, Class A | 405 | 404,580 | ||||||||||
Series 2016-3A, Class D | 350 | 348,762 | ||||||||||
Fifth Third Auto Trust | 721 | 722,989 | ||||||||||
First Investors Auto Owner Trust | 633 | 633,028 | ||||||||||
Flagship Credit Auto Trust | 350 | 372,561 | ||||||||||
Series 2016-3, Class A1 | 685 | 684,476 | ||||||||||
Series 2016-4, Class E | 565 | 564,893 | ||||||||||
Ford Credit Auto Owner Trust | 440 | 439,586 | ||||||||||
Series 2014-2, Class A | 322 | 328,409 | ||||||||||
Ford Credit Floorplan Master Owner Trust | 993 | 992,677 | ||||||||||
| 24 | • AB INTERMEDIATE BOND PORTFOLIO |
Portfolio of Investments
| Principal Amount (000) | U.S. $ Value | |||||||||||
|
|
| ||||||||||
Series 2015-2, Class A1 | U.S.$ | 906 | $ | 914,087 | ||||||||
Series 2016-1, Class A1 | 682 | 686,536 | ||||||||||
GM Financial Automobile Leasing Trust | 1,080 | 1,084,908 | ||||||||||
Series 2015-3, Class A3 | 1,155 | 1,160,390 | ||||||||||
GMF Floorplan Owner Revolving Trust | 575 | 576,451 | ||||||||||
Series 2016-1, Class A1 | 860 | 863,999 | ||||||||||
Harley-Davidson Motorcycle Trust | 494 | 494,698 | ||||||||||
Hertz Vehicle Financing LLC | 2,370 | 2,360,355 | ||||||||||
Series 2016-1A, Class A | 678 | 679,886 | ||||||||||
Hyundai Auto Lease Securitization Trust | 77 | 76,614 | ||||||||||
Series 2015-B, Class A3 | 539 | 540,360 | ||||||||||
Mercedes-Benz Auto Lease Trust | 622 | 623,165 | ||||||||||
Nissan Auto Lease Trust | 1,001 | 1,002,740 | ||||||||||
Santander Drive Auto Receivables Trust | 894 | 904,645 | ||||||||||
Series 2015-3, Class A2A | 8 | 7,789 | ||||||||||
Series 2015-4, Class A2A | 105 | 105,381 | ||||||||||
Series 2016-3, Class A2 | 675 | 674,741 | ||||||||||
TCF Auto Receivables Owner Trust | 27 | 26,809 | ||||||||||
Westlake Automobile Receivables Trust | 278 | 278,134 | ||||||||||
| AB INTERMEDIATE BOND PORTFOLIO • | 25 |
Portfolio of Investments
| Principal Amount (000) | U.S. $ Value | |||||||||||
|
|
| ||||||||||
Series 2016-2A, Class A2 | U.S.$ | 502 | $ | 503,069 | ||||||||
Wheels SPV 2 LLC | 950 | 945,578 | ||||||||||
|
| |||||||||||
| 32,956,094 | ||||||||||||
|
| |||||||||||
Credit Cards - Fixed Rate – 1.7% | ||||||||||||
American Express Credit Account Master Trust | 400 | 400,575 | ||||||||||
Barclays Dryrock Issuance Trust | 703 | 705,986 | ||||||||||
Series 2015-4, Class A | 630 | 632,859 | ||||||||||
Discover Card Execution Note Trust | 1,101 | 1,116,514 | ||||||||||
Synchrony Credit Card Master Note Trust | 1,050 | 1,066,210 | ||||||||||
Series 2015-3, Class A | 859 | 863,258 | ||||||||||
Series 2016-1, Class A | 544 | 550,418 | ||||||||||
World Financial Network Credit Card Master Trust | 570 | 572,195 | ||||||||||
Series 2016-B, Class A | 416 | 416,047 | ||||||||||
|
| |||||||||||
| 6,324,062 | ||||||||||||
|
| |||||||||||
Other ABS - Fixed Rate – 1.3% | ||||||||||||
Ascentium Equipment Receivables Trust | 265 | 265,551 | ||||||||||
CNH Equipment Trust | 616 | 622,281 | ||||||||||
Dell Equipment Finance Trust | 388 | 388,237 | ||||||||||
Series 2015-2, Class A2A | 203 | 202,768 | ||||||||||
Marlette Funding Trust | 623 | 624,270 | ||||||||||
| 26 | • AB INTERMEDIATE BOND PORTFOLIO |
Portfolio of Investments
| Principal Amount (000) | U.S. $ Value | |||||||||||
|
|
| ||||||||||
SBA Tower Trust | U.S.$ | 688 | $ | 703,824 | ||||||||
SoFi Consumer Loan Program LLC | 707 | 709,154 | ||||||||||
Series 2016-3, Class A | 755 | 754,984 | ||||||||||
Taco Bell Funding LLC | 516 | 523,097 | ||||||||||
|
| |||||||||||
| 4,794,166 | ||||||||||||
|
| |||||||||||
Autos - Floating Rate – 0.9% | ||||||||||||
BMW Floorplan Master Owner Trust | 997 | 998,755 | ||||||||||
Hertz Fleet Lease Funding LP | 214 | 213,885 | ||||||||||
Volkswagen Credit Auto Master Trust | 340 | 339,341 | ||||||||||
Wells Fargo Dealer Floorplan Master Note Trust | 537 | 537,322 | ||||||||||
Series 2015-1, Class A | 1,073 | 1,070,599 | ||||||||||
|
| |||||||||||
| 3,159,902 | ||||||||||||
|
| |||||||||||
Credit Cards - Floating Rate – 0.4% | ||||||||||||
Discover Card Execution Note Trust | 964 | 965,760 | ||||||||||
World Financial Network Credit Card Master Trust | 681 | 682,434 | ||||||||||
|
| |||||||||||
| 1,648,194 | ||||||||||||
|
| |||||||||||
Home Equity Loans - Fixed Rate – 0.0% | ||||||||||||
Credit-Based Asset Servicing and Securitization LLC | 87 | 87,808 | ||||||||||
| AB INTERMEDIATE BOND PORTFOLIO • | 27 |
Portfolio of Investments
| Principal Amount (000) | U.S. $ Value | |||||||||||
|
|
| ||||||||||
Nationstar NIM Ltd. | U.S.$ | 18 | $ | – 0 | – | |||||||
|
| |||||||||||
| 87,808 | ||||||||||||
|
| |||||||||||
Home Equity Loans - Floating Rate – 0.0% | ||||||||||||
Asset Backed Funding Certificates Trust | 44 | 42,446 | ||||||||||
|
| |||||||||||
Total Asset-Backed Securities | 49,012,672 | |||||||||||
|
| |||||||||||
COMMERCIAL MORTGAGE-BACKED SECURITIES – 9.6% | ||||||||||||
Non-Agency Fixed Rate CMBS – 8.2% | ||||||||||||
Banc of America Commercial Mortgage Trust | 411 | 420,500 | ||||||||||
Bear Stearns Commercial Mortgage Securities Trust | 101 | 101,350 | ||||||||||
Series 2006-PW14, Class A4 | 126 | 126,417 | ||||||||||
BHMS Mortgage Trust | 890 | 916,100 | ||||||||||
CGRBS Commercial Mortgage Trust | 1,305 | 1,374,958 | ||||||||||
Citigroup Commercial Mortgage Trust | 127 | 127,445 | ||||||||||
Series 2012-GC8, Class D | 633 | 592,821 | ||||||||||
Series 2013-GC17, Class D | 565 | 506,984 | ||||||||||
Series 2015-GC27, Class A5 | 698 | 722,071 | ||||||||||
Series 2016-C1, Class A4 | 1,034 | 1,072,215 | ||||||||||
COBALT CMBS Commercial Mortgage Trust | 531 | 540,652 | ||||||||||
Commercial Mortgage Trust | 684 | 685,493 | ||||||||||
| 28 | • AB INTERMEDIATE BOND PORTFOLIO |
Portfolio of Investments
| Principal Amount (000) | U.S. $ Value | |||||||||||
|
|
| ||||||||||
Series 2007-GG9, Class AM | U.S.$ | 829 | $ | 832,178 | ||||||||
Series 2013-SFS, Class A1 | 458 | 456,365 | ||||||||||
Credit Suisse Commercial Mortgage Trust | 13 | 13,114 | ||||||||||
Series 2007-C3, Class AM | 437 | 442,287 | ||||||||||
CSAIL Commercial Mortgage Trust | 914 | 983,506 | ||||||||||
DBUBS Mortgage Trust | 363 | 385,224 | ||||||||||
GS Mortgage Securities Corp. II | 1,217 | 1,242,880 | ||||||||||
GS Mortgage Securities Trust | 510 | 516,006 | ||||||||||
Series 2012-GC6, Class D | 948 | 935,100 | ||||||||||
Series 2013-G1, Class A2 | 766 | 785,955 | ||||||||||
JP Morgan Chase Commercial Mortgage Securities Trust | 274 | 272,951 | ||||||||||
Series 2006-LDP9, Class AM | 356 | 356,759 | ||||||||||
Series 2007-CB19, Class AM | 470 | 477,012 | ||||||||||
Series 2007-LD12, Class AM | 795 | 818,525 | ||||||||||
Series 2007-LDPX, Class A1A | 1,751 | 1,763,435 | ||||||||||
Series 2011-C5, Class D | 262 | 269,089 | ||||||||||
Series 2012-C6, Class E | 389 | 371,306 | ||||||||||
JPMBB Commercial Mortgage Securities Trust | 964 | 1,039,697 | ||||||||||
Series 2015-C32, Class C | 540 | 499,590 | ||||||||||
LB-UBS Commercial Mortgage Trust | 253 | 235,379 | ||||||||||
| AB INTERMEDIATE BOND PORTFOLIO • | 29 |
Portfolio of Investments
| Principal Amount (000) | U.S. $ Value | |||||||||||
|
|
| ||||||||||
LSTAR Commercial Mortgage Trust | U.S.$ | 426 | $ | 427,621 | ||||||||
Series 2015-3, Class A2 | 657 | 663,905 | ||||||||||
Series 2016-4, Class A2 | 615 | 610,581 | ||||||||||
Merrill Lynch Mortgage Trust | 24 | 24,365 | ||||||||||
ML-CFC Commercial Mortgage Trust | 201 | 201,153 | ||||||||||
Series 2007-9, Class A4 | 2,564 | 2,632,814 | ||||||||||
Morgan Stanley Capital I Trust | 365 | 369,890 | ||||||||||
Prudential Securities Secured Financing Corp. | 687 | 7 | ||||||||||
SG Commercial Mortgage Securities Trust | 721 | 730,021 | ||||||||||
UBS-Barclays Commercial Mortgage Trust | 552 | 576,539 | ||||||||||
Series 2012-C4, Class A5 | 1,098 | 1,134,766 | ||||||||||
UBS-Citigroup Commercial Mortgage Trust | 227 | 246,552 | ||||||||||
Wachovia Bank Commercial Mortgage Trust | 45 | 45,017 | ||||||||||
Series 2007-C32, Class A3 | 678 | 686,295 | ||||||||||
Wells Fargo Commercial Mortgage Trust | 600 | 589,593 | ||||||||||
WF-RBS Commercial Mortgage Trust | 323 | 315,910 | ||||||||||
Series 2013-C14, Class A5 | 1,142 | 1,209,840 | ||||||||||
Series 2014-C20, Class A2 | 546 | 564,114 | ||||||||||
|
| |||||||||||
| 30,912,347 | ||||||||||||
|
| |||||||||||
| 30 | • AB INTERMEDIATE BOND PORTFOLIO |
Portfolio of Investments
| Principal Amount (000) | U.S. $ Value | |||||||||||
|
|
| ||||||||||
Non-Agency Floating Rate CMBS – 1.4% | ||||||||||||
CGBAM Commercial Mortgage Trust | U.S.$ | 465 | $ | 465,102 | ||||||||
H/2 Asset Funding NRE | 622 | 615,553 | ||||||||||
JP Morgan Chase Commercial Mortgage Securities Trust | 902 | 900,038 | ||||||||||
Series 2015-SGP, Class A | 825 | 827,561 | ||||||||||
Morgan Stanley Capital I Trust | 229 | 227,681 | ||||||||||
Series 2015-XLF2, Class SNMA | 229 | 229,390 | ||||||||||
Resource Capital Corp., Ltd. | 194 | 192,114 | ||||||||||
Starwood Retail Property Trust | 1,179 | 1,167,401 | ||||||||||
Wells Fargo Commercial Mortgage Trust | 516 | 518,452 | ||||||||||
|
| |||||||||||
| 5,143,292 | ||||||||||||
|
| |||||||||||
Agency CMBS – 0.0% | ||||||||||||
Government National Mortgage Association | 978 | 1,878 | ||||||||||
|
| |||||||||||
Total Commercial Mortgage-Backed Securities | 36,057,517 | |||||||||||
|
| |||||||||||
COLLATERALIZED MORTGAGE OBLIGATIONS – 8.3% | ||||||||||||
Risk Share Floating Rate – 5.2% | ||||||||||||
Bellemeade Re II Ltd. | 288 | 291,732 | ||||||||||
| AB INTERMEDIATE BOND PORTFOLIO • | 31 |
Portfolio of Investments
| Principal Amount (000) | U.S. $ Value | |||||||||||
|
|
| ||||||||||
Bellemeade Re Ltd. | U.S.$ | 86 | $ | 86,839 | ||||||||
Federal Home Loan Mortgage Corp. Structured Agency Credit Risk Debt Notes | 1,040 | 1,095,007 | ||||||||||
Series 2014-DN3, Class M3 | 870 | 908,299 | ||||||||||
Series 2014-DN4, Class M3 | 300 | 317,258 | ||||||||||
Series 2014-HQ3, Class M3 | 820 | 864,238 | ||||||||||
Series 2015-DNA1, Class M3 | 265 | 271,659 | ||||||||||
Series 2015-DNA2, Class M2 | 1,017 | 1,030,784 | ||||||||||
Series 2015-DNA3, Class M3 | 280 | 294,714 | ||||||||||
Series 2015-HQ1, Class M2 | 400 | 404,563 | ||||||||||
Series 2015-HQA1, Class M2 | 735 | 747,733 | ||||||||||
Series 2015-HQA2, Class M2 | 289 | 295,929 | ||||||||||
Series 2015-HQA2, Class M3 | 500 | 530,996 | ||||||||||
Series 2016-DNA1, Class M3 | 330 | 356,170 | ||||||||||
Series 2016-DNA2, Class M3 | 307 | 320,131 | ||||||||||
Series 2016-DNA4, Class M3 | 752 | 742,834 | ||||||||||
| 32 | • AB INTERMEDIATE BOND PORTFOLIO |
Portfolio of Investments
| Principal Amount (000) | U.S. $ Value | |||||||||||
|
|
| ||||||||||
Federal National Mortgage Association Connecticut Avenue Securities | U.S.$ | 118 | $ | 118,620 | ||||||||
Series 2014-C04, Class 1M2 | 511 | 546,128 | ||||||||||
Series 2014-C04, Class 2M2 | 195 | 208,578 | ||||||||||
Series 2015-C01, Class 1M2 | 355 | 368,076 | ||||||||||
Series 2015-C01, Class 2M2 | 549 | 570,545 | ||||||||||
Series 2015-C02, Class 1M2 | 617 | 637,111 | ||||||||||
Series 2015-C02, Class 2M2 | 430 | 443,506 | ||||||||||
Series 2015-C03, Class 1M1 | 170 | 170,368 | ||||||||||
Series 2015-C03, Class 1M2 | 704 | 749,989 | ||||||||||
Series 2015-C03, Class 2M2 | 675 | 718,370 | ||||||||||
Series 2015-C04, Class 1M2 | 878 | 939,542 | ||||||||||
Series 2015-C04, Class 2M2 | 631 | 671,515 | ||||||||||
Series 2016-C01, Class 1M2 | 982 | 1,097,142 | ||||||||||
Series 2016-C01, Class 2M2 | 478 | 535,734 | ||||||||||
Series 2016-C02, Class 1M2 | 539 | 591,518 | ||||||||||
Series 2016-C03, Class 2M2 | 881 | 948,662 | ||||||||||
| AB INTERMEDIATE BOND PORTFOLIO • | 33 |
Portfolio of Investments
| Principal Amount (000) | U.S. $ Value | |||||||||||
|
|
| ||||||||||
Series 2016-C05, Class 2M2 | U.S.$ | 949 | $ | 975,750 | ||||||||
JP Morgan Madison Avenue Securities Trust | 106 | 104,594 | ||||||||||
Wells Fargo Credit Risk Transfer Securities Trust | 394 | 394,922 | ||||||||||
Series 2015-WF1, Class 2M2 | 105 | 104,556 | ||||||||||
|
| |||||||||||
| 19,454,112 | ||||||||||||
|
| |||||||||||
Non-Agency Fixed Rate – 1.2% | ||||||||||||
Alternative Loan Trust | 247 | 211,077 | ||||||||||
Series 2006-23CB, Class 1A7 | 147 | 133,929 | ||||||||||
Series 2006-24CB, Class A16 | 420 | 360,897 | ||||||||||
Series 2006-28CB, Class A14 | 290 | 239,251 | ||||||||||
Series 2006-J1, Class 1A13 | 249 | 218,181 | ||||||||||
Citigroup Mortgage Loan Trust, Inc. | 499 | 464,778 | ||||||||||
Countrywide Home Loan Mortgage Pass-Through Trust | 118 | 101,100 | ||||||||||
Series 2007-HYB2, Class 3A1 | 574 | 471,488 | ||||||||||
Credit Suisse Mortgage Trust | 409 | 336,952 | ||||||||||
First Horizon Alternative Mortgage Securities Trust | 436 | 355,486 | ||||||||||
JP Morgan Alternative Loan Trust | 808 | 666,411 | ||||||||||
RBSSP Resecuritization Trust | 536 | 455,775 | ||||||||||
| 34 | • AB INTERMEDIATE BOND PORTFOLIO |
Portfolio of Investments
| Principal Amount (000) | U.S. $ Value | |||||||||||
|
|
| ||||||||||
Structured Asset Securities Corp. Mortgage Pass-Through Certificates | U.S.$ | 540 | $ | 476,032 | ||||||||
|
| |||||||||||
| 4,491,357 | ||||||||||||
|
| |||||||||||
Agency Floating Rate – 1.2% | ||||||||||||
Federal National Mortgage Association REMICs | 2,232 | 471,672 | ||||||||||
Series 2011-63, Class SW | 1,819 | 376,137 | ||||||||||
Series 2015-48, Class SA | 2,269 | 561,983 | ||||||||||
Series 2015-66, Class AS | 2,349 | 467,042 | ||||||||||
Series 2016-11, Class SG | 2,666 | 540,288 | ||||||||||
Series 2016-22, Class ST | 2,533 | 479,032 | ||||||||||
Series 2016-79, Class JS | 2,010 | 453,417 | ||||||||||
Government National Mortgage Association | 2,571 | 525,826 | ||||||||||
Series 2016-108, Class SM | 2,157 | 587,388 | ||||||||||
|
| |||||||||||
| 4,462,785 | ||||||||||||
|
| |||||||||||
Non-Agency Floating Rate – 0.6% | ||||||||||||
Deutsche Alt-A Securities Mortgage Loan Trust | 860 | 541,607 | ||||||||||
HomeBanc Mortgage Trust | 355 | 298,848 | ||||||||||
Impac Secured Assets CMN Owner Trust | 448 | 314,912 | ||||||||||
| AB INTERMEDIATE BOND PORTFOLIO • | 35 |
Portfolio of Investments
| Principal Amount (000) | U.S. $ Value | |||||||||||
|
|
| ||||||||||
RBSSP Resecuritization Trust | U.S.$ | 501 | $ | 379,013 | ||||||||
Residential Accredit Loans, Inc. Trust | 576 | 326,755 | ||||||||||
Series 2007-QS4, Class 2A4 | 827 | 192,408 | ||||||||||
|
| |||||||||||
| 2,053,543 | ||||||||||||
|
| |||||||||||
Agency Fixed Rate – 0.1% | ||||||||||||
Federal National Mortgage Association Grantor Trust | 65 | 57,760 | ||||||||||
Federal National Mortgage Association REMICs | 2,482 | 492,601 | ||||||||||
|
| |||||||||||
| 550,361 | ||||||||||||
|
| |||||||||||
Total Collateralized Mortgage Obligations | 31,012,158 | |||||||||||
|
| |||||||||||
INFLATION-LINKED SECURITIES – 5.0% | ||||||||||||
United States – 5.0% | ||||||||||||
U.S. Treasury Inflation Index | 11,110 | 11,287,291 | ||||||||||
0.25%, 1/15/25 (TIPS) | 3,614 | 3,661,765 | ||||||||||
0.375%, 7/15/25 (TIPS) | 3,726 | 3,825,076 | ||||||||||
|
| |||||||||||
Total Inflation-Linked Securities | 18,774,132 | |||||||||||
|
| |||||||||||
CORPORATES - NON-INVESTMENT GRADE – 4.6% | ||||||||||||
Industrial – 2.9% | ||||||||||||
Capital Goods – 0.1% | ||||||||||||
SPX FLOW, Inc. | 126 | 127,732 | ||||||||||
5.875%, 8/15/26(a) | 127 | 128,905 | ||||||||||
|
| |||||||||||
| 256,637 | ||||||||||||
|
| |||||||||||
Communications - Media – 0.3% | ||||||||||||
Arqiva Broadcast Finance PLC 9.50%, 3/31/20(a) | GBP | 300 | 395,658 | |||||||||
CSC Holdings LLC | U.S.$ | 120 | 126,300 | |||||||||
| 36 | • AB INTERMEDIATE BOND PORTFOLIO |
Portfolio of Investments
| Principal Amount (000) | U.S. $ Value | |||||||||||
|
|
| ||||||||||
Ziggo Secured Finance BV | U.S.$ | 560 | $ | 553,000 | ||||||||
|
| |||||||||||
| 1,074,958 | ||||||||||||
|
| |||||||||||
Communications - Telecommunications – 0.8% | ||||||||||||
CenturyLink, Inc. | 275 | 293,562 | ||||||||||
Series Y | 243 | 253,024 | ||||||||||
SFR Group SA | EUR | 222 | 254,129 | |||||||||
Sprint Capital Corp. | U.S.$ | 970 | 1,020,925 | |||||||||
Wind Acquisition Finance SA | 700 | 729,750 | ||||||||||
Windstream Services LLC | 750 | 663,750 | ||||||||||
|
| |||||||||||
| 3,215,140 | ||||||||||||
|
| |||||||||||
Consumer Cyclical - Automotive – 0.1% | ||||||||||||
Adient Global Holdings Ltd. | 379 | 372,784 | ||||||||||
Allison Transmission, Inc. | 216 | 220,320 | ||||||||||
|
| |||||||||||
| 593,104 | ||||||||||||
|
| |||||||||||
Consumer Cyclical - Other – 0.4% | ||||||||||||
International Game Technology PLC | 360 | 381,600 | ||||||||||
6.50%, 2/15/25(a) | 520 | 562,796 | ||||||||||
KB Home | 286 | 292,435 | ||||||||||
MCE Finance Ltd. | 235 | 233,531 | ||||||||||
|
| |||||||||||
| 1,470,362 | ||||||||||||
|
| |||||||||||
Consumer Cyclical - Retailers – 0.1% | ||||||||||||
Hanesbrands, Inc. | 212 | 215,578 | ||||||||||
|
| |||||||||||
Consumer Non-Cyclical – 0.3% | ||||||||||||
First Quality Finance Co., Inc. | 475 | 476,781 | ||||||||||
Valeant Pharmaceuticals International, Inc. | 375 | 296,250 | ||||||||||
Voyage Care Bondco PLC | GBP | 320 | 393,482 | |||||||||
|
| |||||||||||
| 1,166,513 | ||||||||||||
|
| |||||||||||
| AB INTERMEDIATE BOND PORTFOLIO • | 37 |
Portfolio of Investments
| Principal Amount (000) | U.S. $ Value | |||||||||||
|
|
| ||||||||||
Energy – 0.3% | ||||||||||||
Cenovus Energy, Inc. | U.S.$ | 42 | $ | 40,822 | ||||||||
5.70%, 10/15/19 | 169 | 182,620 | ||||||||||
Diamond Offshore Drilling, Inc. | 292 | 213,902 | ||||||||||
Global Partners LP/GLP Finance Corp. | 361 | 344,755 | ||||||||||
Sabine Pass Liquefaction LLC | 482 | 490,435 | ||||||||||
SM Energy Co. | 35 | 34,825 | ||||||||||
|
| |||||||||||
| 1,307,359 | ||||||||||||
|
| |||||||||||
Other Industrial – 0.2% | ||||||||||||
General Cable Corp. | 655 | 618,975 | ||||||||||
|
| |||||||||||
Technology – 0.2% | ||||||||||||
Diamond 1 Finance Corp./Diamond 2 Finance Corp. | 350 | 383,409 | ||||||||||
NXP BV/NXP Funding LLC | 345 | 368,288 | ||||||||||
|
| |||||||||||
| 751,697 | ||||||||||||
|
| |||||||||||
Transportation - Services – 0.1% | ||||||||||||
Avis Budget Car Rental LLC/Avis Budget Finance, Inc. | 309 | 293,550 | ||||||||||
|
| |||||||||||
| 10,963,873 | ||||||||||||
|
| |||||||||||
Financial Institutions – 1.6% | ||||||||||||
Banking – 1.4% | ||||||||||||
Bank of America Corp. | 213 | 231,105 | ||||||||||
Barclays Bank PLC | 129 | 149,827 | ||||||||||
7.625%, 11/21/22 | 400 | 446,500 | ||||||||||
7.75%, 4/10/23 | 402 | 422,100 | ||||||||||
Credit Agricole SA | 235 | 253,800 | ||||||||||
Credit Suisse Group AG | 363 | 376,159 | ||||||||||
Intesa Sanpaolo SpA | 569 | 528,021 | ||||||||||
Lloyds Banking Group PLC | 402 | 414,060 | ||||||||||
Royal Bank of Scotland Group PLC | 570 | 567,150 | ||||||||||
| 38 | • AB INTERMEDIATE BOND PORTFOLIO |
Portfolio of Investments
| Principal Amount (000) | U.S. $ Value | |||||||||||
|
|
| ||||||||||
Series U | U.S.$ | 1,100 | $ | 1,067,000 | ||||||||
Royal Bank of Scotland PLC (The) | 290 | 297,472 | ||||||||||
Societe Generale SA | 130 | 131,238 | ||||||||||
Standard Chartered PLC | 400 | 388,500 | ||||||||||
|
| |||||||||||
| 5,272,932 | ||||||||||||
|
| |||||||||||
Finance – 0.2% | ||||||||||||
Navient Corp. | 440 | 443,300 | ||||||||||
7.25%, 1/25/22 | 99 | 99,990 | ||||||||||
|
| |||||||||||
| 543,290 | ||||||||||||
|
| |||||||||||
| 5,816,222 | ||||||||||||
|
| |||||||||||
Non Corporate Sectors – 0.1% | ||||||||||||
Agencies - Not Government Guaranteed – 0.1% | ||||||||||||
NOVA Chemicals Corp. | 331 | 337,206 | ||||||||||
|
| |||||||||||
Utility – 0.0% | ||||||||||||
Electric – 0.0% | ||||||||||||
NRG Energy, Inc. | 85 | 88,825 | ||||||||||
|
| |||||||||||
Total Corporates – Non-Investment Grade | 17,206,126 | |||||||||||
|
| |||||||||||
AGENCIES – 2.8% | ||||||||||||
Agency Debentures – 2.8% | ||||||||||||
Federal Home Loan Bank | 10,530 | 10,534,033 | ||||||||||
|
| |||||||||||
EMERGING MARKETS - TREASURIES – 0.9% | ||||||||||||
Brazil – 0.9% | ||||||||||||
Brazil Notas do Tesouro Nacional | BRL | 10,690 | 3,189,945 | |||||||||
|
| |||||||||||
GOVERNMENTS - SOVEREIGN AGENCIES – 0.5% | ||||||||||||
Brazil – 0.2% | ||||||||||||
Petrobras Global Finance BV | U.S.$ | 672 | 693,504 | |||||||||
|
| |||||||||||
| AB INTERMEDIATE BOND PORTFOLIO • | 39 |
Portfolio of Investments
| Principal Amount (000) | U.S. $ Value | |||||||||||
|
|
| ||||||||||
Colombia – 0.1% | ||||||||||||
Ecopetrol SA | U.S.$ | 245 | $ | 216,825 | ||||||||
|
| |||||||||||
Israel – 0.1% | ||||||||||||
Israel Electric Corp. Ltd. | 580 | 624,660 | ||||||||||
|
| |||||||||||
United Kingdom – 0.1% | ||||||||||||
Royal Bank of Scotland Group PLC | 500 | 458,750 | ||||||||||
|
| |||||||||||
Total Governments - Sovereign Agencies | 1,993,739 | |||||||||||
|
| |||||||||||
LOCAL GOVERNMENTS - MUNICIPAL BONDS – 0.4% | ||||||||||||
United States – 0.4% | ||||||||||||
State of California | 970 | 1,494,246 | ||||||||||
|
| |||||||||||
EMERGING MARKETS - CORPORATE BONDS – 0.4% | ||||||||||||
Industrial – 0.4% | ||||||||||||
Capital Goods – 0.1% | ||||||||||||
Odebrecht Finance Ltd. | 541 | 259,004 | ||||||||||
7.125%, 6/26/42(a) | 394 | 195,030 | ||||||||||
|
| |||||||||||
| 454,034 | ||||||||||||
|
| |||||||||||
Communications - Telecommunications – 0.1% | ||||||||||||
MTN Mauritius Investment Ltd. | 377 | 379,699 | ||||||||||
|
| |||||||||||
Consumer Non-Cyclical – 0.1% | ||||||||||||
Minerva Luxembourg SA | 233 | 226,825 | ||||||||||
Virgolino de Oliveira Finance SA | 660 | 46,530 | ||||||||||
|
| |||||||||||
| 273,355 | ||||||||||||
|
| |||||||||||
Energy – 0.1% | ||||||||||||
Ultrapar International SA | 379 | 384,647 | ||||||||||
|
| |||||||||||
Total Emerging Markets - Corporate Bonds | 1,491,735 | |||||||||||
|
| |||||||||||
| 40 | • AB INTERMEDIATE BOND PORTFOLIO |
Portfolio of Investments
| Principal Amount (000) | U.S. $ Value | |||||||||||
|
|
| ||||||||||
QUASI-SOVEREIGNS – 0.3% | ||||||||||||
Quasi-Sovereign Bonds – 0.3% | ||||||||||||
Chile – 0.1% | ||||||||||||
Empresa de Transporte de Pasajeros Metro SA | U.S.$ | 358 | $ | 392,084 | ||||||||
|
| |||||||||||
Mexico – 0.2% | ||||||||||||
Petroleos Mexicanos | 756 | 753,959 | ||||||||||
|
| |||||||||||
Total Quasi-Sovereigns | 1,146,043 | |||||||||||
|
| |||||||||||
| Shares | ||||||||||||
COMMON STOCKS – 0.3% | ||||||||||||
Financials – 0.3% | ||||||||||||
Insurance – 0.3% | ||||||||||||
Mt. Logan Re Ltd. (Preference Shares)(k)(l)(m)(n) | 700 | 724,647 | ||||||||||
Mt. Logan Re Ltd. (Preference Shares)(k)(l)(n)(o) | 297 | 307,458 | ||||||||||
|
| |||||||||||
Total Common Stocks | 1,032,105 | |||||||||||
|
| |||||||||||
| Principal Amount (000) | ||||||||||||
GOVERNMENTS - SOVEREIGN BONDS – 0.2% | ||||||||||||
Mexico – 0.1% | ||||||||||||
Mexico Government International Bond | U.S.$ | 208 | 229,840 | |||||||||
|
| |||||||||||
Qatar – 0.1% | ||||||||||||
Qatar Government International Bond | 593 | 595,224 | ||||||||||
|
| |||||||||||
Total Governments - Sovereign Bonds | 825,064 | |||||||||||
|
| |||||||||||
| Notional Amount (000) | ||||||||||||
OPTIONS PURCHASED - CALLS – 0.0% | ||||||||||||
Swaptions – 0.0% | ||||||||||||
IRS Swaption RTR, Citibank, NA | 8,350 | 20,207 | ||||||||||
|
| |||||||||||
| AB INTERMEDIATE BOND PORTFOLIO • | 41 |
Portfolio of Investments
| Principal Amount (000) | U.S. $ Value | |||||||||||
|
|
| ||||||||||
SHORT-TERM INVESTMENTS – 10.9% | ||||||||||||
Agency Discount Note – 4.2% | ||||||||||||
Federal Home Loan Bank | U.S.$ | 15,633 | $ | 15,610,083 | ||||||||
|
| |||||||||||
Governments - Treasuries – 3.5% | ||||||||||||
Japan – 3.5% | ||||||||||||
Japan Treasury Discount Bill | JPY | 1,380,000 | 13,167,415 | |||||||||
|
| |||||||||||
| Shares | ||||||||||||
Investment Companies – 2.2% | ||||||||||||
AB Fixed Income Shares, Inc. - Government | 8,128,880 | 8,128,880 | ||||||||||
|
| |||||||||||
| Principal Amount (000) | ||||||||||||
Certificates of Deposit – 1.0% | ||||||||||||
Bank of Montreal/Chicago Il | U.S.$ | 3,807 | 3,807,160 | |||||||||
|
| |||||||||||
Total Short-Term Investments | 40,713,538 | |||||||||||
|
| |||||||||||
Total Investments – 113.0% | 422,934,115 | |||||||||||
Other assets less liabilities – (13.0)% | (48,714,715 | ) | ||||||||||
|
| |||||||||||
Net Assets – 100.0% | $ | 374,219,400 | ||||||||||
|
| |||||||||||
FUTURES (see Note D)
| Type | Number of Contracts | Expiration Month | Original Value | Value at October 31, 2016 | Unrealized Appreciation/ (Depreciation) | |||||||||||||||
Purchased Contracts |
| |||||||||||||||||||
10 Yr Japan Bond (OSE) Futures | 29 | December 2016 | $ | 42,000,278 | $ | 41,952,799 | $ | (47,479 | ) | |||||||||||
U.S. T-Note 5 Yr (CBT) Futures | 513 | December 2016 | 62,320,825 | 61,968,797 | (352,028 | ) | ||||||||||||||
U.S. Ultra Bond (CBT) Futures | 72 | December 2016 | 13,281,116 | 12,667,500 | (613,616 | ) | ||||||||||||||
| 42 | • AB INTERMEDIATE BOND PORTFOLIO |
Portfolio of Investments
| Type | Number of Contracts | Expiration Month | Original Value | Value at October 31, 2016 | Unrealized Appreciation/ (Depreciation) | |||||||||||||||
Sold Contracts | ||||||||||||||||||||
Euro-BOBL Futures | 75 | December 2016 | $ | 10,856,432 | $ | 10,794,453 | $ | 61,979 | ||||||||||||
U.S. T-Note 2 Yr (CBT) Futures | 109 | December 2016 | 23,775,464 | 23,777,328 | (1,864 | ) | ||||||||||||||
U.S. T-Note 10 Yr (CBT) Futures | 40 | December 2016 | 5,242,123 | 5,185,000 | 57,123 | |||||||||||||||
|
| |||||||||||||||||||
| $ | (895,885 | ) | ||||||||||||||||||
|
| |||||||||||||||||||
FORWARD CURRENCY EXCHANGE CONTRACTS (see Note D)
| Counterparty | Contracts to Deliver (000) | In Exchange For (000) | Settlement Date | Unrealized Appreciation/ (Depreciation) | ||||||||||||||||||||
Citibank, NA | EUR | 3,742 | USD | 4,182 | 11/15/16 | $ | 72,466 | |||||||||||||||||
Citibank, NA | EUR | 483 | USD | 527 | 11/15/16 | (3,422 | ) | |||||||||||||||||
Citibank, NA | GBP | 2,343 | USD | 3,040 | 11/16/16 | 172,044 | ||||||||||||||||||
Citibank, NA | USD | 2,706 | MXN | 52,988 | 11/22/16 | 91,329 | ||||||||||||||||||
Citibank, NA | JPY | 1,380,976 | USD | 13,195 | 12/09/16 | 8,644 | ||||||||||||||||||
Citibank, NA | INR | 55,476 | USD | 824 | 12/15/16 | (3,132 | ) | |||||||||||||||||
Citibank, NA | USD | 1,636 | INR | 110,712 | 12/15/16 | 14,191 | ||||||||||||||||||
Credit Suisse International | MXN | 16,369 | USD | 875 | 11/22/16 | 11,100 | ||||||||||||||||||
Goldman Sachs Bank USA | BRL | 4,862 | USD | 1,057 | 1/04/17 | (437,396 | ) | |||||||||||||||||
HSBC Bank USA | USD | 2,092 | GBP | 1,699 | 11/16/16 | (12,821 | ) | |||||||||||||||||
Morgan Stanley & Co., Inc. | BRL | 2,440 | USD | 767 | 11/03/16 | 2,619 | ||||||||||||||||||
Morgan Stanley & Co., Inc. | USD | 778 | BRL | 2,440 | 11/03/16 | (13,204 | ) | |||||||||||||||||
Morgan Stanley & Co., Inc. | BRL | 2,440 | USD | 771 | 12/02/16 | 12,983 | ||||||||||||||||||
Standard Chartered Bank | BRL | 2,440 | USD | 746 | 11/03/16 | (18,405 | ) | |||||||||||||||||
Standard Chartered Bank | USD | 767 | BRL | 2,440 | 11/03/16 | (2,619 | ) | |||||||||||||||||
Standard Chartered Bank | INR | 54,249 | USD | 805 | 12/15/16 | (3,923 | ) | |||||||||||||||||
State Street Bank & Trust Co. | EUR | 348 | USD | 379 | 11/15/16 | (2,879 | ) | |||||||||||||||||
State Street Bank & Trust Co. | SGD | 5,164 | USD | 3,793 | 12/14/16 | 79,849 | ||||||||||||||||||
State Street Bank & Trust Co. | AUD | 321 | USD | 245 | 1/19/17 | 1,208 | ||||||||||||||||||
UBS AG | CAD | 6,834 | USD | 5,323 | 11/10/16 | 227,405 | ||||||||||||||||||
|
| |||||||||||||||||||||||
| $ | 196,037 | |||||||||||||||||||||||
|
| |||||||||||||||||||||||
INTEREST RATE SWAPTIONS WRITTEN (see Note D)
| Description | Index | CounterParty | Strike Rate | Expiration Date | Notional Amount (000) | Premiums | Market Value | |||||||||||||||||||
OTC – 1 Year Interest Rate Swap | 3 Month LIBOR | Citibank, NA | 2.15 | % | 1/12/17 | $ | 8,350 | $ | 15,865 | $ | (11,304 | ) | ||||||||||||||
CENTRALLY CLEARED INTEREST RATE SWAPS (see Note D)
| Rate Type | ||||||||||||||||||
| Clearing Broker/ (Exchange) | Notional Amount (000) | Termination Date | Payments made by the Fund | Payments received by the Fund | Unrealized Appreciation/ (Depreciation) | |||||||||||||
Morgan Stanley & Co., LLC/(CME Group) | NOK | 202,120 | 5/12/18 | 0.954% | 6 Month NIBOR | $ | 114,334 | |||||||||||
Morgan Stanley & Co., LLC/(CME Group) | 67,420 | 5/19/18 | 1.007% | 6 Month NIBOR | 31,605 | |||||||||||||
| AB INTERMEDIATE BOND PORTFOLIO • | 43 |
Portfolio of Investments
| Rate Type | ||||||||||||||||||||||||
| Clearing Broker/ (Exchange) | Notional Amount (000) | Termination Date | Payments made by the Fund | Payments received by the Fund | Unrealized Appreciation/ (Depreciation) | |||||||||||||||||||
Morgan Stanley & Co., LLC/(CME Group) | NZD | 47,210 | 7/28/18 | 2.050% | 3 Month BKBM | $ | (137,281 | ) | ||||||||||||||||
Morgan Stanley & Co., LLC/(CME Group) | $ | 7,830 | 8/31/21 | 1.256% | 3 Month LIBOR | 24,861 | ||||||||||||||||||
Morgan Stanley & Co., LLC/(CME Group) | 2,630 | 1/14/24 | 2.980% | 3 Month LIBOR | (284,427 | ) | ||||||||||||||||||
Morgan Stanley & Co., LLC/(CME Group) | 2,300 | 2/14/24 | 2.889% | 3 Month LIBOR | (225,884 | ) | ||||||||||||||||||
Morgan Stanley & Co., LLC/(CME Group) | 3,600 | 11/10/25 | 2.256% | 3 Month LIBOR | (213,821 | ) | ||||||||||||||||||
Morgan Stanley & Co., LLC/(CME Group) | 456 | 6/28/26 | 1.460% | 3 Month LIBOR | 8,283 | |||||||||||||||||||
Morgan Stanley & Co., LLC/(CME Group) | NZD | 5,090 | 7/28/26 | 3 Month BKBM | 2.473% | (84,260 | ) | |||||||||||||||||
Morgan Stanley & Co., LLC/(CME Group) | $ | 4,180 | 10/11/26 | 1.615% | 3 Month LIBOR | 39,959 | ||||||||||||||||||
Morgan Stanley & Co., LLC/(CME Group) | 4,170 | 10/14/26 | 1.649% | 3 Month LIBOR | 26,488 | |||||||||||||||||||
Morgan Stanley & Co., LLC/(LCH Group) | NOK | 60,680 | 8/01/18 | 0.960% | 6 Month NIBOR | 37,380 | ||||||||||||||||||
Morgan Stanley & Co., LLC/(LCH Group) | 15,730 | 8/04/18 | 1.008% | 6 Month NIBOR | 8,405 | |||||||||||||||||||
Morgan Stanley & Co., LLC/(LCH Group) | 67,430 | 8/11/18 | 1.076% | 6 Month NIBOR | 26,061 | |||||||||||||||||||
Morgan Stanley & Co., LLC/(LCH Group) | 44,950 | 8/12/18 | 1.128% | 6 Month NIBOR | 12,619 | |||||||||||||||||||
|
| |||||||||||||||||||||||
| $ | (615,678 | ) | ||||||||||||||||||||||
|
| |||||||||||||||||||||||
CREDIT DEFAULT SWAPS (see Note D)
| Swap Counterparty & Referenced Obligation | Fixed Rate (Pay) Receive | Implied Credit Spread at October 31, 2016 | Notional Amount (000) | Market Value | Upfront Premiums Paid (Received) | Unrealized Appreciation/ (Depreciation) | ||||||||||||||||||
Buy Contracts | ||||||||||||||||||||||||
Citibank, NA | ||||||||||||||||||||||||
Advanced Micro Devices, Inc., | (5.00 | )% | 1.32 | % | $ | 271 | $ | (24,529 | ) | $ | 11,544 | $ | (36,073 | ) | ||||||||||
Sprint Communications, Inc., | (5.00 | ) | 2.70 | 452 | (27,433 | ) | (14,625 | ) | (12,808 | ) | ||||||||||||||
Sprint Communications, Inc., | (5.00 | ) | 2.70 | 518 | (31,438 | ) | (17,379 | ) | (14,059 | ) | ||||||||||||||
Credit Suisse International | ||||||||||||||||||||||||
CDX-CMBX.NA.BBB Series 7, 1/17/47* | (3.00 | ) | 4.48 | 2,150 | 181,496 | 146,082 | 35,414 | |||||||||||||||||
| 44 | • AB INTERMEDIATE BOND PORTFOLIO |
Portfolio of Investments
| Swap Counterparty & Referenced Obligation | Fixed Rate (Pay) Receive | Implied Credit Spread at October 31, 2016 | Notional Amount (000) | Market Value | Upfront Premiums Paid (Received) | Unrealized Appreciation/ (Depreciation) | ||||||||||||||||||
Sale Contracts | ||||||||||||||||||||||||
Credit Suisse International | ||||||||||||||||||||||||
Anadarko Petroleum Corp., | 1.00 | % | 0.36 | % | $ | 1,360 | $ | 9,153 | $ | (8,466 | ) | $ | 17,619 | |||||||||||
CDX-CMBX.NA.BBB Series 6, 5/11/63* | 3.00 | 4.66 | 509 | (41,390 | ) | (35,313 | ) | (6,077 | ) | |||||||||||||||
CDX-CMBX.NA.BBB Series 6, 5/11/63* | 3.00 | 4.66 | 155 | (12,604 | ) | (11,493 | ) | (1,111 | ) | |||||||||||||||
CDX-CMBX.NA.BBB Series 6, 5/11/63* | 3.00 | 4.66 | 1,882 | (153,023 | ) | (82,513 | ) | (70,510 | ) | |||||||||||||||
CDX-CMBX.NA.BBB Series 6, 5/11/63* | 3.00 | 4.66 | 2,150 | (174,831 | ) | (133,440 | ) | (41,391 | ) | |||||||||||||||
Deutsche Bank AG | ||||||||||||||||||||||||
CDX-CMBX.NA.BBB Series 6, 5/11/63* | 3.00 | 4.66 | 745 | (60,581 | ) | (55,996 | ) | (4,585 | ) | |||||||||||||||
CDX-CMBX.NA.BBB Series 6, 5/11/63* | 3.00 | 4.66 | 46 | (3,741 | ) | (2,832 | ) | (909 | ) | |||||||||||||||
Goldman Sachs International | ||||||||||||||||||||||||
CDX-CMBX.NA.BBB Series 6, 5/11/63* | 3.00 | 4.66 | 1,125 | (91,481 | ) | (92,234 | ) | 753 | ||||||||||||||||
CDX-CMBX.NA.BBB Series 6, 5/11/63* | 3.00 | 4.66 | 1,469 | (119,455 | ) | (77,046 | ) | (42,409 | ) | |||||||||||||||
CDX-CMBX.NA.BBB Series 6, 5/11/63* | 3.00 | 4.66 | 760 | (61,801 | ) | (64,887 | ) | 3,086 | ||||||||||||||||
|
|
|
|
|
| |||||||||||||||||||
| $ | (611,658 | ) | $ | (438,598 | ) | $ | (173,060 | ) | ||||||||||||||||
|
|
|
|
|
| |||||||||||||||||||
| * | Termination date |
INTEREST RATE SWAPS (see Note D)
| Rate Type | ||||||||||||||||||||
| Swap Counterparty | Notional Amount (000) | Termination Date | Payments made by the Fund | Payments received by the Fund | Unrealized Appreciation/ (Depreciation) | |||||||||||||||
JPMorgan Chase Bank, NA | $ | 5,590 | 1/30/17 | 1.059% | 3 Month LIBOR | $ | (17,007 | ) | ||||||||||||
JPMorgan Chase Bank, NA | 6,230 | 2/07/22 | 2.043% | 3 Month LIBOR | (235,739 | ) | ||||||||||||||
|
| |||||||||||||||||||
| $ | (252,746 | ) | ||||||||||||||||||
|
| |||||||||||||||||||
| ** | Principal amount less than $500. |
| (a) | Security is exempt from registration under Rule 144A of the Securities Act of 1933. These securities are considered restricted, but liquid and may be resold in transactions exempt from registration, normally to qualified institutional buyers. At October 31, 2016, the aggregate market value of these securities amounted to $70,670,786 or 18.9% of net assets. |
| (b) | Securities are perpetual and, thus, do not have a predetermined maturity date. The date shown, if applicable, reflects the next call date. |
| (c) | Floating Rate Security. Stated interest/floor rate was in effect at October 31, 2016. |
| AB INTERMEDIATE BOND PORTFOLIO • | 45 |
Portfolio of Investments
| (d) | Position, or a portion thereof, has been segregated to collateralize OTC derivatives outstanding. |
| (e) | Fair valued by the Adviser. |
| (f) | Security is exempt from registration under Rule 144A of the Securities Act of 1933. These securities, which represent 0.44% of net assets as of October 31, 2016, are considered illiquid and restricted. Additional information regarding such securities follows: |
| 144A/Restricted & Illiquid Securities | Acquisition Date | Cost | Market Value | Percentage of Net Assets | ||||||||||||
Bellemeade Re II Ltd. | 4/29/16 | $ | 288,308 | $ | 291,732 | 0.08 | % | |||||||||
Bellemeade Re Ltd. | 7/27/15 | 86,461 | 86,839 | 0.02 | % | |||||||||||
H/2 Asset Funding NRE | 6/19/15 | 621,771 | 615,553 | 0.16 | % | |||||||||||
JP Morgan Madison Avenue Securities Trust | 11/06/15 | 104,242 | 104,594 | 0.03 | % | |||||||||||
Nationstar NIM Ltd. | 4/04/07 | 17,607 | – 0 | – | 0.00 | % | ||||||||||
Prudential Securities Secured Financing Corp. | 11/02/07 | 7 | 7 | 0.00 | % | |||||||||||
Virgolino de Oliveira Finance SA | 1/24/14-1/27/14 | 365,927 | 46,530 | 0.01 | % | |||||||||||
Wells Fargo Credit Risk Transfer Securities Trust | 9/28/15 | 393,586 | 394,922 | 0.11 | % | |||||||||||
Wells Fargo Credit Risk Transfer Securities Trust | 9/28/15 | 104,527 | 104,556 | 0.03 | % | |||||||||||
| (g) | IO – Interest Only. |
| (h) | Variable rate coupon, rate shown as of October 31, 2016. |
| (i) | Inverse interest only security. |
| (j) | Defaulted. |
| (k) | Non-income producing security. |
| (l) | The security is subject to a 12 month lock-up period, after which semi-annual redemptions are permitted. |
| (m) | Effective prepayment date of December 2016. |
| (n) | Restricted and illiquid security. |
| 46 | • AB INTERMEDIATE BOND PORTFOLIO |
Portfolio of Investments
| Restricted & Illiquid Securities | Acquisition Date | Cost | Market Value | Percentage of Net Assets | ||||||||||||
Mt. Logan Re Ltd. | 1/02/14 | $ | 700,000 | $ | 724,647 | 0.19 | % | |||||||||
Mt. Logan Re Ltd. | 12/30/14 | 297,000 | 307,458 | 0.08 | % | |||||||||||
| (o) | Effective prepayment date of April 2017. |
| (p) | To obtain a copy of the fund’s financial statements, please go to the Securities and Exchange Commission’s website at www.sec.gov, or call AB at (800) 227-4618. |
| (q) | Investment in affiliated money market mutual fund. The rate shown represents the 7-day yield as of period end. |
Currency Abbreviations:
AUD – Australian Dollar BRL – Brazilian Real CAD – Canadian Dollar EUR – Euro GBP – Great British Pound INR – Indian Rupee JPY – Japanese Yen MXN – Mexican Peso NOK – Norwegian Krone NZD – New Zealand Dollar SGD – Singapore Dollar USD – United States Dollar
Glossary:
ABS – Asset-Backed Securities ARMs – Adjustable Rate Mortgages BKBM – Bank Bill Benchmark (New Zealand) BOBL – Bundesobligationen CBT – Chicago Board of Trade CDX-CMBX.NA – North American Commercial Mortgage-Backed Index CMBS – Commercial Mortgage-Backed Securities CME – Chicago Mercantile Exchange IRS – Interest Rate Swaption LCH – London Clearing House LIBOR – London Interbank Offered Rates MTN – Medium Term Note NIBOR – Norwegian Interbank Offered Rate OSE – Osaka Securities Exchange REIT – Real Estate Investment Trust REMICs – Real Estate Mortgage Investment Conduits RTR – Right To Receive TBA – To Be Announced TIPS – Treasury Inflation Protected Security |
See notes to financial statements.
| AB INTERMEDIATE BOND PORTFOLIO • | 47 |
Portfolio of Investments
STATEMENT OF ASSETS & LIABILITIES
October 31, 2016
| Assets | ||||
Investments in securities, at value | ||||
Unaffiliated issuers (cost $411,803,463) | $ | 414,805,235 | ||
Affiliated issuers (cost $8,128,880) | 8,128,880 | |||
Cash | 10,969 | |||
Cash collateral due from broker | 1,855,164 | |||
Receivable for investment securities sold | 20,888,604 | |||
Interest receivable | 1,982,987 | |||
Receivable for capital stock sold | 724,430 | |||
Unrealized appreciation on forward currency exchange contracts | 693,838 | |||
Upfront premium paid on credit default swaps | 157,626 | |||
Receivable for variation margin on exchange-traded derivatives | 107,120 | |||
Unrealized appreciation on credit default swaps | 56,872 | |||
Affiliated dividends receivable | 1,593 | |||
|
| |||
Total assets | 449,413,318 | |||
|
| |||
| Liabilities | ||||
Swaptions written, at value (premiums received $15,865) | 11,304 | |||
Payable for investment securities purchased | 71,397,992 | |||
Payable for capital stock redeemed | 1,610,540 | |||
Upfront premium received on credit default swaps | 596,224 | |||
Unrealized depreciation on forward currency exchange contracts | 497,801 | |||
Unrealized depreciation on interest rate swaps | 252,746 | |||
Unrealized depreciation on credit default swaps | 229,932 | |||
Dividends payable | 159,621 | |||
Distribution fee payable | 85,746 | |||
Advisory fee payable | 75,911 | |||
Transfer Agent fee payable | 27,056 | |||
Administrative fee payable | 20,518 | |||
Payable for variation margin on exchange-traded derivatives | 10,701 | |||
Accrued expenses | 217,826 | |||
|
| |||
Total liabilities | 75,193,918 | |||
|
| |||
Net Assets | $ | 374,219,400 | ||
|
| |||
| Composition of Net Assets | ||||
Capital stock, at par | $ | 33,321 | ||
Additional paid-in capital | 371,058,022 | |||
Distributions in excess of net investment income | (123,774 | ) | ||
Accumulated net realized gain on investment and foreign currency transactions | 1,981,422 | |||
Net unrealized appreciation on investments and foreign currency denominated assets and liabilities | 1,270,409 | |||
|
| |||
| $ | 374,219,400 | |||
|
|
| 48 | • AB INTERMEDIATE BOND PORTFOLIO |
Statement of Assets & Liabilities
Net Asset Value Per Share—24 billion shares of capital stock authorized, $.001 par value
| Class | Net Assets | Shares Outstanding | Net Asset Value | |||||||||
| ||||||||||||
| A | $ | 245,682,936 | 21,875,314 | $ | 11.23 | * | ||||||
| ||||||||||||
| B | $ | 1,105,726 | 98,427 | $ | 11.23 | |||||||
| ||||||||||||
| C | $ | 41,886,541 | 3,736,641 | $ | 11.21 | |||||||
| ||||||||||||
| Advisor | $ | 56,068,436 | 4,990,423 | $ | 11.24 | |||||||
| ||||||||||||
| R | $ | 3,022,815 | 269,180 | $ | 11.23 | |||||||
| ||||||||||||
| K | $ | 5,705,562 | 507,608 | $ | 11.24 | |||||||
| ||||||||||||
| I | $ | 2,613,284 | 232,446 | $ | 11.24 | |||||||
| ||||||||||||
| Z | $ | 18,134,100 | 1,611,171 | $ | 11.26 | |||||||
| ||||||||||||
| * | The maximum offering price per share for Class A shares was $11.73 which reflects a sales charge of 4.25%. |
See notes to financial statements.
| AB INTERMEDIATE BOND PORTFOLIO • | 49 |
Statement of Assets & Liabilities
STATEMENT OF OPERATIONS
Year Ended October 31, 2016
| Investment Income | ||||||||
Interest | $ | 11,138,528 | ||||||
Dividends | ||||||||
Unaffiliated issuers | 105,007 | |||||||
Affiliated issuers | 41,473 | |||||||
Other income | 2,741 | $ | 11,287,749 | |||||
|
| |||||||
| Expenses | ||||||||
Advisory fee (see Note B) | 1,591,173 | |||||||
Distribution fee—Class A | 622,172 | |||||||
Distribution fee—Class B | 13,457 | |||||||
Distribution fee—Class C | 413,057 | |||||||
Distribution fee—Class R | 14,044 | |||||||
Distribution fee—Class K | 11,712 | |||||||
Transfer agency—Class A | 355,481 | |||||||
Transfer agency—Class B | 2,357 | |||||||
Transfer agency—Class C | 60,877 | |||||||
Transfer agency—Advisor Class | 59,501 | |||||||
Transfer agency—Class R | 6,841 | |||||||
Transfer agency—Class K | 9,370 | |||||||
Transfer agency—Class I | 1,047 | |||||||
Transfer agency—Class Z | 2,269 | |||||||
Custodian | 231,002 | |||||||
Registration fees | 110,442 | |||||||
Audit and tax | 95,797 | |||||||
Printing | 73,025 | |||||||
Administrative | 63,692 | |||||||
Legal | 43,674 | |||||||
Directors’ fees | 23,722 | |||||||
Miscellaneous | 17,474 | |||||||
|
| |||||||
Total expenses | 3,822,186 | |||||||
Less: expenses waived and reimbursed by the Adviser (see Note B) | (633,264 | ) | ||||||
|
| |||||||
Net expenses | 3,188,922 | |||||||
|
| |||||||
Net investment income | 8,098,827 | |||||||
|
| |||||||
| Realized and Unrealized Gain (Loss) on Investment and Foreign Currency Transactions | ||||||||
Net realized gain (loss) on: | ||||||||
Investment transactions | 913,756 | |||||||
Securities sold short | 20,484 | |||||||
Futures | 1,747,312 | |||||||
Options written | 20,612 | |||||||
Swaps | (132,409 | ) | ||||||
Foreign currency transactions | (841,389 | ) | ||||||
Net change in unrealized appreciation/depreciation of: | ||||||||
Investments | 7,555,494 | |||||||
Securities sold short | (6,146 | ) | ||||||
Futures | (455,799 | ) | ||||||
Options written | (6,570 | ) | ||||||
Swaptions written | 4,561 | |||||||
Swaps | (186,574 | ) | ||||||
Foreign currency denominated assets and liabilities | 168,401 | |||||||
|
| |||||||
Net gain on investment and foreign currency transactions | 8,801,733 | |||||||
|
| |||||||
Net Increase in Net Assets from Operations | $ | 16,900,560 | ||||||
|
|
| 50 | • AB INTERMEDIATE BOND PORTFOLIO |
Statement of Operations
STATEMENT OF CHANGES IN NET ASSETS
| Year Ended October 31, 2016 | Year Ended October 31, 2015 | |||||||
| Increase (Decrease) in Net Assets from Operations | ||||||||
Net investment income | $ | 8,098,827 | $ | 8,295,267 | ||||
Net realized gain on investment and foreign currency transactions | 1,728,366 | 4,943,300 | ||||||
Net change in unrealized appreciation/depreciation of investments and foreign currency denominated assets and liabilities | 7,073,367 | (8,274,910 | ) | |||||
|
|
|
| |||||
Net increase in net assets from operations | 16,900,560 | 4,963,657 | ||||||
| Dividends to Shareholders from | ||||||||
Net investment income | ||||||||
Class A | (8,196,991 | ) | (8,137,847 | ) | ||||
Class B | (35,840 | ) | (55,129 | ) | ||||
Class C | (1,044,850 | ) | (987,523 | ) | ||||
Advisor Class | (1,369,668 | ) | (793,874 | ) | ||||
Class R | (85,941 | ) | (71,771 | ) | ||||
Class K | (147,387 | ) | (140,957 | ) | ||||
Class I | (28,992 | ) | (14,707 | ) | ||||
Class Z | (398,815 | ) | (24,900 | ) | ||||
| Capital Stock Transactions | ||||||||
Net increase (decrease) | 38,117,126 | (17,247,645 | ) | |||||
|
|
|
| |||||
Total increase (decrease) | 43,709,202 | (22,510,696 | ) | |||||
| Net Assets | ||||||||
Beginning of period | 330,510,198 | 353,020,894 | ||||||
|
|
|
| |||||
End of period (including distributions in excess of net investment income of ($123,774) and undistributed net investment income of $3,040,057, respectively) | $ | 374,219,400 | $ | 330,510,198 | ||||
|
|
|
| |||||
| AB INTERMEDIATE BOND PORTFOLIO • | 51 |
Statement of Changes in Net Assets
NOTES TO FINANCIAL STATEMENTS
October 31, 2016
NOTE A
Significant Accounting Policies
AB Bond Fund, Inc. (the “Company”) is registered under the Investment Company Act of 1940 as an open-end management investment company. The Company, which is a Maryland corporation, operates as a series company comprised of ten portfolios currently in operation. Each portfolio is considered to be a separate entity for financial reporting and tax purposes. This report relates only to the AB Intermediate Bond Portfolio (the “Portfolio”), a diversified portfolio. The Portfolio offers Class A, Class B, Class C, Advisor Class, Class R, Class K, Class I, and Class Z shares. Class A shares are sold with a front-end sales charge of up to 4.25% for purchases not exceeding $1,000,000. With respect to purchases of $1,000,000 or more, Class A shares redeemed within one year of purchase may be subject to a contingent deferred sales charge of 1%. Class B shares are currently sold with a contingent deferred sales charge which declines from 3% to zero depending on the period of time the shares are held. Effective January 31, 2009, sales of Class B shares of the Portfolio to new investors were suspended. Class B shares will only be issued (i) upon the exchange of Class B shares from another AB Mutual Fund, (ii) for purposes of dividend reinvestment, (iii) through the Portfolio’s Automatic Investment Program (the “Program”) for accounts that established the Program prior to January 31, 2009, and (iv) for purchases of additional shares by Class B shareholders as of January 31, 2009. The ability to establish a new Program for accounts containing Class B shares was suspended as of January 31, 2009. Class B shares will automatically convert to Class A shares six years after the end of the calendar month of purchase. Class C shares are subject to a contingent deferred sales charge of 1% on redemptions made within the first year after purchase. Class R and Class K shares are sold without an initial or contingent deferred sales charge. Advisor Class, Class I and Class Z shares are sold without an initial or contingent deferred sales charge and are not subject to ongoing distribution expenses. All eight classes of shares have identical voting, dividend, liquidation and other rights, except that the classes bear different distribution and transfer agency expenses. Each class has exclusive voting rights with respect to its distribution plan. The financial statements have been prepared in conformity with U.S. generally accepted accounting principles (“U.S. GAAP”) which require management to make certain estimates and assumptions that affect the reported amounts of assets and liabilities in the financial statements and amounts of income and expenses during the reporting period. Actual results could differ from those estimates. The Portfolio is an investment company under U.S. GAAP and follows the accounting and reporting guidance applicable to investment companies. The following is a summary of significant accounting policies followed by the Portfolio.
| 52 | • AB INTERMEDIATE BOND PORTFOLIO |
Notes to Financial Statements
1. Security Valuation
Portfolio securities are valued at their current market value determined on the basis of market quotations or, if market quotations are not readily available or are deemed unreliable, at “fair value” as determined in accordance with procedures established by and under the general supervision of the Company’s Board of Directors (the “Board”).
In general, the market values of securities which are readily available and deemed reliable are determined as follows: securities listed on a national securities exchange (other than securities listed on the NASDAQ Stock Market, Inc. (“NASDAQ”)) or on a foreign securities exchange are valued at the last sale price at the close of the exchange or foreign securities exchange. If there has been no sale on such day, the securities are valued at the last traded price from the previous day. Securities listed on more than one exchange are valued by reference to the principal exchange on which the securities are traded; securities listed only on NASDAQ are valued in accordance with the NASDAQ Official Closing Price; listed or over the counter (“OTC”) market put or call options are valued at the mid level between the current bid and ask prices. If either a current bid or current ask price is unavailable, AllianceBernstein L.P. (the “Adviser”) will have discretion to determine the best valuation (e.g. last trade price in the case of listed options); open futures are valued using the closing settlement price or, in the absence of such a price, the most recent quoted bid price. If there are no quotations available for the day of valuation, the last available closing settlement price is used; U.S. Government securities and any other debt instruments having 60 days or less remaining until maturity are generally valued at market by an independent pricing vendor, if a market price is available. If a market price is not available, the securities are valued at amortized cost. This methodology is commonly used for short term securities that have an original maturity of 60 days or less, as well as short term securities that had an original term to maturity that exceeded 60 days. In instances when amortized cost is utilized, the Valuation Committee (the “Committee”) must reasonably conclude that the utilization of amortized cost is approximately the same as the fair value of the security. Such factors the Committee will consider include, but are not limited to, an impairment of the creditworthiness of the issuer or material changes in interest rates. Fixed-income securities, including mortgage-backed and asset-backed securities, may be valued on the basis of prices provided by a pricing service or at a price obtained from one or more of the major broker-dealers. In cases where broker-dealer quotes are obtained, the Adviser may establish procedures whereby changes in market yields or spreads are used to adjust, on a daily basis, a recently obtained quoted price on a security. Swaps and other derivatives are valued daily, primarily using independent pricing services, independent pricing models using market inputs, as well as third party
| AB INTERMEDIATE BOND PORTFOLIO • | 53 |
Notes to Financial Statements
broker-dealers or counterparties. Open end mutual funds are valued at the closing net asset value per share, while exchange traded funds are valued at the closing market price per share.
Securities for which market quotations are not readily available (including restricted securities) or are deemed unreliable are valued at fair value as deemed appropriate by the Adviser. Factors considered in making this determination may include, but are not limited to, information obtained by contacting the issuer, analysts, analysis of the issuer’s financial statements or other available documents. In addition, the Portfolio may use fair value pricing for securities primarily traded in non-U.S. markets because most foreign markets close well before the Portfolio values its securities at 4:00 p.m., Eastern Time. The earlier close of these foreign markets gives rise to the possibility that significant events, including broad market moves, may have occurred in the interim and may materially affect the value of those securities. To account for this, the Portfolio may frequently value many of its foreign equity securities using fair value prices based on third party vendor modeling tools to the extent available.
2. Fair Value Measurements
In accordance with U.S. GAAP regarding fair value measurements, fair value is defined as the price that the Portfolio would receive to sell an asset or pay to transfer a liability in an orderly transaction between market participants at the measurement date. U.S. GAAP establishes a framework for measuring fair value, and a three-level hierarchy for fair value measurements based upon the transparency of inputs to the valuation of an asset or liability (including those valued based on their market values as described in Note A.1 above). Inputs may be observable or unobservable and refer broadly to the assumptions that market participants would use in pricing the asset or liability. Observable inputs reflect the assumptions market participants would use in pricing the asset or liability based on market data obtained from sources independent of the Portfolio. Unobservable inputs reflect the Portfolio’s own assumptions about the assumptions that market participants would use in pricing the asset or liability based on the best information available in the circumstances. Each investment is assigned a level based upon the observability of the inputs which are significant to the overall valuation. The three-tier hierarchy of inputs is summarized below.
| • | Level 1—quoted prices in active markets for identical investments |
| • | Level 2—other significant observable inputs (including quoted prices for similar investments, interest rates, prepayment speeds, credit risk, etc.) |
| 54 | • AB INTERMEDIATE BOND PORTFOLIO |
Notes to Financial Statements
| • | Level 3—significant unobservable inputs (including the Portfolio’s own assumptions in determining the fair value of investments) |
The fair value of debt instruments, such as bonds, and over-the-counter derivatives is generally based on market price quotations, recently executed market transactions (where observable) or industry recognized modeling techniques and are generally classified as Level 2. Pricing vendor inputs to Level 2 valuations may include quoted prices for similar investments in active markets, interest rate curves, coupon rates, currency rates, yield curves, option adjusted spreads, default rates, credit spreads and other unique security features in order to estimate the relevant cash flows which are then discounted to calculate fair values. If these inputs are unobservable and significant to the fair value, these investments will be classified as Level 3. In addition, non-agency rated investments are classified as Level 3.
Options are valued using market-based inputs to models, broker or dealer quotations, or alternative pricing sources with reasonable levels of price transparency, where such inputs and models are available. Alternatively the values may be obtained through unobservable management determined inputs and/or management’s proprietary models. Where models are used, the selection of a particular model to value an option depends upon the contractual terms of, and specific risks inherent in, the option as well as the availability of pricing information in the market. Valuation models require a variety of inputs, including contractual terms, market prices, measures of volatility and correlations of such inputs. Exchange traded options generally will be classified as Level 2. For options that do not trade on exchange but trade in liquid markets, inputs can generally be verified and model selection does not involve significant management judgment. Options are classified within Level 2 on the fair value hierarchy when all of the significant inputs can be corroborated to market evidence. Otherwise such instruments are classified as Level 3.
Valuations of mortgage-backed or other asset-backed securities, by pricing vendors, are based on both proprietary and industry recognized models and discounted cash flow techniques. Significant inputs to the valuation of these instruments are value of the collateral, the rates and timing of delinquencies, the rates and timing of prepayments, and default and loss expectations, which are driven in part by housing prices for residential mortgages. Significant inputs are determined based on relative value analyses, which incorporate comparisons to instruments with similar collateral and risk profiles, including relevant indices. Mortgage and asset-backed securities for which management has collected current observable
| AB INTERMEDIATE BOND PORTFOLIO • | 55 |
Notes to Financial Statements
data through pricing services are generally categorized within Level 2. Those investments for which current observable data has not been provided are classified as Level 3.
Other fixed income investments, including non-U.S. government and corporate debt, are generally valued using quoted market prices, if available, which are typically impacted by current interest rates, maturity dates and any perceived credit risk of the issuer. Additionally, in the absence of quoted market prices, these inputs are used by pricing vendors to derive a valuation based upon industry or proprietary models which incorporate issuer specific data with relevant yield/spread comparisons with more widely quoted bonds with similar key characteristics. Those investments for which there are observable inputs are classified as Level 2. Where the inputs are not observable, the investments are classified as Level 3.
The following table summarizes the valuation of the Portfolio’s investments by the above fair value hierarchy levels as of October 31, 2016:
Investments in Securities: | Level 1 | Level 2 | Level 3 | Total | ||||||||||||
Assets: | ||||||||||||||||
Corporates – Investment Grade | $ | – 0 | – | $ | 89,459,372 | $ | – 0 | – | $ | 89,459,372 | ||||||
Mortgage Pass-Throughs | – 0 | – | 66,879,644 | – 0 | – | 66,879,644 | ||||||||||
Governments – Treasuries | – 0 | – | 52,091,839 | – 0 | – | 52,091,839 | ||||||||||
Asset-Backed Securities | – 0 | – | 45,567,089 | 3,445,583 | (a) | 49,012,672 | ||||||||||
Commercial Mortgage-Backed Securities | – 0 | – | 24,823,385 | 11,234,132 | 36,057,517 | |||||||||||
Collateralized Mortgage Obligations | – 0 | – | 30,180,170 | 831,988 | 31,012,158 | |||||||||||
Inflation-Linked Securities | – 0 | – | 18,774,132 | – 0 | – | 18,774,132 | ||||||||||
Corporates – Non-Investment Grade | – 0 | – | 17,206,126 | – 0 | – | 17,206,126 | ||||||||||
Agencies | – 0 | – | 10,534,033 | – 0 | – | 10,534,033 | ||||||||||
Emerging Markets – Treasuries | – 0 | – | 3,189,945 | – 0 | – | 3,189,945 | ||||||||||
Governments – Sovereign Agencies | – 0 | – | 1,993,739 | – 0 | – | 1,993,739 | ||||||||||
Local Governments – Municipal Bonds | – 0 | – | 1,494,246 | – 0 | – | 1,494,246 | ||||||||||
Emerging Markets – Corporate Bonds | – 0 | – | 1,491,735 | – 0 | – | 1,491,735 | ||||||||||
Quasi-Sovereigns | – 0 | – | 1,146,043 | – 0 | – | 1,146,043 | ||||||||||
Common Stocks | – 0 | – | – 0 | – | 1,032,105 | 1,032,105 | ||||||||||
Governments – Sovereign Bonds | – 0 | – | 825,064 | – 0 | – | 825,064 | ||||||||||
Options Purchased – Calls | – 0 | – | 20,207 | – 0 | – | 20,207 | ||||||||||
Short-Term Investments: | ||||||||||||||||
Agency Discount Notes | – 0 | – | 15,610,083 | – 0 | – | 15,610,083 | ||||||||||
Governments – Treasuries | – 0 | – | 13,167,415 | – 0 | – | 13,167,415 | ||||||||||
Investment Companies | 8,128,880 | – 0 | – | – 0 | – | 8,128,880 | ||||||||||
Certificates of Deposit | – 0 | – | 3,807,160 | – 0 | – | 3,807,160 | ||||||||||
|
|
|
|
|
|
|
| |||||||||
Total Investments in Securities | 8,128,880 | 398,261,427 | 16,543,808 | 422,934,115 | ||||||||||||
| 56 | • AB INTERMEDIATE BOND PORTFOLIO |
Notes to Financial Statements
Investments in Securities: | Level 1 | Level 2 | Level 3 | Total | ||||||||||||
Other Financial Instruments(b): |
| |||||||||||||||
Assets: | ||||||||||||||||
Futures | $ | 119,102 | $ | – 0 | – | $ | – 0 | – | $ | 119,102 | (c) | |||||
Forward Currency Exchange Contracts | – 0 | – | 693,838 | – 0 | – | 693,838 | ||||||||||
Centrally Cleared Interest Rate Swaps | – 0 | – | 329,995 | – 0 | – | 329,995 | (c) | |||||||||
Credit Default Swaps | – 0 | – | 56,872 | – 0 | – | 56,872 | ||||||||||
Liabilities: | ||||||||||||||||
Futures | (1,014,987 | ) | – 0 | – | – 0 | – | (1,014,987 | )(c) | ||||||||
Forward Currency Exchange Contracts | – 0 | – | (497,801 | ) | – 0 | – | (497,801 | ) | ||||||||
Interest Rate Swaptions Written | – 0 | – | (11,304 | ) | – 0 | – | (11,304 | ) | ||||||||
Centrally Cleared Interest Rate Swaps | – 0 | – | (945,673 | ) | – 0 | – | (945,673 | )(c) | ||||||||
Credit Default Swaps | – 0 | – | (229,932 | ) | – 0 | – | (229,932 | ) | ||||||||
Interest Rate Swaps | – 0 | – | (252,746 | ) | – 0 | – | (252,746 | ) | ||||||||
|
|
|
|
|
|
|
| |||||||||
Total(d) | $ | 7,232,995 | $ | 397,404,676 | $ | 16,543,808 | $ | 421,181,479 | ||||||||
|
|
|
|
|
|
|
| |||||||||
| (a) | The Portfolio held securities with zero market value at period end. |
| (b) | Other financial instruments are derivative instruments, such as futures, forwards and swaps, which are valued at the unrealized appreciation/(depreciation) on the instrument. Other financial instruments may also include swaptions written which are valued at market value. |
| (c) | Only variation margin receivable/payable at period end is reported within the statement of assets and liabilities. This amount reflects cumulative unrealized appreciation/(depreciation) of exchange-traded derivatives as reported in the portfolio of investments. |
| (d) | There were no transfers between Level 1 and Level 2 during the reporting period. |
The Portfolio recognizes all transfers between levels of the fair value hierarchy assuming the financial instruments were transferred at the beginning of the reporting period.
The following is a reconciliation of investments in which significant unobservable inputs (Level 3) were used in determining fair value.
| Asset- Backed Securities(a) | Commercial Mortgage- Backed Securities | Collateralized Mortgage Obligations | ||||||||||
Balance as of 10/31/15 | $ | 5,462,170 | $ | 9,612,483 | $ | 19,646,091 | ||||||
Accrued discounts/(premiums) | 1,640 | (9,167 | ) | 3,309 | ||||||||
Realized gain (loss) | (34,406 | ) | (77,986 | ) | (227,469 | ) | ||||||
Change in unrealized appreciation/depreciation | 57,390 | (139,318 | ) | 219,045 | ||||||||
Purchases/Payups | 2,924,647 | 4,730,368 | 741,725 | |||||||||
Sales/Paydowns | (3,684,928 | ) | (3,520,015 | ) | (2,880,482 | ) | ||||||
Transfers in to Level 3 | – 0 | – | 637,767 | – 0 | – | |||||||
Transfers out of Level 3 | (1,280,930 | ) | – 0 | – | (16,670,231 | ) | ||||||
|
|
|
|
|
| |||||||
Balance as of 10/31/16 | $ | 3,445,583 | $ | 11,234,132 | $ | 831,988 | ||||||
|
|
|
|
|
| |||||||
Net change in unrealized appreciation/depreciation from investments held as of 10/31/16(b) | $ | 27,358 | $ | (143,007 | ) | $ | 3,802 | |||||
|
|
|
|
|
| |||||||
| AB INTERMEDIATE BOND PORTFOLIO • | 57 |
Notes to Financial Statements
| Corporates - Non-Investment Grade | Common Stocks | Total | ||||||||||
Balance as of 10/31/15 | $ | 297,212 | $ | 1,273,763 | $ | 36,291,719 | ||||||
Accrued discounts/(premiums) | 1,385 | – 0 | – | (2,833 | ) | |||||||
Realized gain (loss) | 30,483 | (943 | ) | (310,321 | ) | |||||||
Change in unrealized appreciation/depreciation | (6,792 | ) | (38,658 | ) | 91,667 | |||||||
Purchases/Payups | – 0 | – | – 0 | – | 8,396,740 | |||||||
Sales/Paydowns | (322,288 | ) | (202,057 | ) | (10,609,770 | ) | ||||||
Transfers in to Level 3 | – 0 | – | – 0 | – | 637,767 | (c) | ||||||
Transfers out of Level 3 | – 0 | – | – 0 | – | (17,951,161 | )(d) | ||||||
|
|
|
|
|
| |||||||
Balance as of 10/31/16 | $ | – 0 | – | $ | 1,032,105 | $ | 16,543,808 | |||||
|
|
|
|
|
| |||||||
Net change in unrealized appreciation/depreciation from investments held as of 10/31/16(b) | $ | – 0 | – | $ | (38,658 | ) | $ | (150,505 | ) | |||
|
|
|
|
|
| |||||||
| (a) | The Portfolio held securities with zero market value at period end. |
| (b) | The unrealized appreciation/(depreciation) is included in net change in unrealized appreciation/(depreciation) on investments and other financial instruments in the accompanying statement of operations. |
| (c) | There were de minimis transfers from Level 2 to Level 3 during the reporting period. |
| (d) | An amount of $17,951,161 was transferred out of Level 3 into Level 2 as improved transparency of price inputs has increased the observability of such inputs during the reporting period. |
The following presents information about significant unobservable inputs related to the Portfolio’s Level 3 investments at October 31, 2016. Securities priced by third party vendors and NAV equivalent are excluded from the following table.
Quantitative Information about Level 3 Fair Value Measurements
| Fair Value at 10/31/16 | Valuation Technique | Unobservable Input | Input | |||||||
Asset-Backed Securities | $ | – 0 | – | Qualitative Assessment | $0.00 | |||||
The Adviser established the Committee to oversee the pricing and valuation of all securities held in the Portfolio. The Committee operates under pricing and valuation policies and procedures established by the Adviser and approved by the Board, including pricing policies which set forth the mechanisms and processes to be employed on a daily basis to implement these policies and procedures. In particular, the pricing policies describe how to determine market quotations for securities and other instruments. The Committee’s responsibilities include: 1) fair value and liquidity determinations (and oversight of any third parties to whom any responsibility for fair value and liquidity determinations is delegated), and
| 58 | • AB INTERMEDIATE BOND PORTFOLIO |
Notes to Financial Statements
2) regular monitoring of the Adviser’s pricing and valuation policies and procedures and modification or enhancement of these policies and procedures (or recommendation of the modification of these policies and procedures) as the Committee believes appropriate.
The Committee is also responsible for monitoring the implementation of the pricing policies by the Adviser’s Pricing Group (the “Pricing Group”) and a third party which performs certain pricing functions in accordance with the pricing policies. The Pricing Group is responsible for the oversight of the third party on a day-to-day basis. The Committee and the Pricing Group perform a series of activities to provide reasonable assurance of the accuracy of prices including: 1) periodic vendor due diligence meetings, review of methodologies, new developments and processes at vendors, 2) daily comparison of security valuation versus prior day for all securities that exceeded established thresholds, and 3) daily review of unpriced, stale, and variance reports with exceptions reviewed by senior management and the Committee.
In addition, several processes outside of the pricing process are used to monitor valuation issues including: 1) performance and performance attribution reports are monitored for anomalous impacts based upon benchmark performance, and 2) portfolio managers review all portfolios for performance and analytics (which are generated using the Adviser’s prices).
3. Currency Translation
Assets and liabilities denominated in foreign currencies and commitments under forward currency exchange contracts are translated into U.S. dollars at the mean of the quoted bid and ask prices of such currencies against the U.S. dollar. Purchases and sales of portfolio securities are translated into U.S. dollars at the rates of exchange prevailing when such securities were acquired or sold. Income and expenses are translated into U.S. dollars at rates of exchange prevailing when accrued.
The Portfolio does not isolate that portion of the results of operations resulting from changes in foreign exchange rates on investments from the fluctuations arising from changes in market prices of securities held. Such fluctuations are included with the net realized and unrealized gain or loss from investments.
Net realized gain or loss on foreign currency transactions represents foreign exchange gains and losses from sales and maturities of foreign fixed income investments, foreign currency exchange contracts, holding of foreign currencies, currency gains or losses realized between the trade and settlement dates on foreign investment transactions, and the difference between the amounts of dividends, interest and foreign withholding taxes recorded on
the Portfolio’s books and the U.S. dollar equivalent amounts actually
| AB INTERMEDIATE BOND PORTFOLIO • | 59 |
Notes to Financial Statements
received or paid. Net unrealized currency gains and losses from valuing foreign currency denominated assets and liabilities at period end exchange rates are reflected as a component of net unrealized appreciation or depreciation of foreign currency denominated assets and liabilities.
4. Taxes
It is the Portfolio’s policy to meet the requirements of the Internal Revenue Code applicable to regulated investment companies and to distribute all of its investment company taxable income and net realized gains, if any, to shareholders. Therefore, no provisions for federal income or excise taxes are required. The Portfolio may be subject to taxes imposed by countries in which it invests. Such taxes are generally based on income and/or capital gains earned or repatriated. Taxes are accrued and applied to net investment income, net realized gains and net unrealized appreciation/depreciation as such income and/or gains are earned.
In accordance with U.S. GAAP requirements regarding accounting for uncertainties in income taxes, management has analyzed the Portfolio’s tax positions taken or expected to be taken on federal and state income tax returns for all open tax years (the current and the prior three tax years) and has concluded that no provision for income tax is required in the Portfolio’s financial statements.
5. Investment Income and Investment Transactions
Dividend income (or dividend expense) is recorded on the ex-dividend date or as soon as the Portfolio is informed of the dividend. Interest income (or interest expense) is accrued daily. Investment transactions are accounted for on the date the securities are purchased or sold. Investment gains or losses are determined on the identified cost basis. The Portfolio amortizes premiums and accretes discounts as adjustments to interest income.
6. Class Allocations
All income earned and expenses incurred by the Portfolio are borne on a pro-rata basis by each outstanding class of shares, based on the proportionate interest in the Portfolio represented by the net assets of such class, except for class specific expenses which are allocated to the respective class. Expenses of the Company are charged proportionately to each portfolio or based on other appropriate methods. Realized and unrealized gains and losses are allocated among the various share classes based on respective net assets.
7. Dividends and Distributions
Dividends and distributions to shareholders, if any, are recorded on the ex-dividend date. Income dividends and capital gains distributions are determined in accordance with federal tax regulations and may differ
| 60 | • AB INTERMEDIATE BOND PORTFOLIO |
Notes to Financial Statements
from those determined in accordance with U.S. GAAP. To the extent these differences are permanent, such amounts are reclassified within the capital accounts based on their federal tax basis treatment; temporary differences do not require such reclassification.
NOTE B
Advisory Fee and Other Transactions with Affiliates
Under the terms of the investment advisory agreement, the Portfolio pays the Adviser an advisory fee at an annual rate of .45% of the first $2.5 billion, .40% of the next $2.5 billion and .35% in excess of $5 billion, of the Portfolio’s average daily net assets. The fee is accrued daily and paid monthly. Effective February 1, 2013 (effective April 28, 2014 for Class Z shares), the Adviser has agreed to waive its fees and bear certain expenses to the extent necessary to limit total operating expenses on an annual basis (the “Expense Caps”) to .85%, 1.60%, 1.60%, .60%, 1.10%, .85%, .60%, and .60% of the daily average net assets for the Class A, Class B, Class C, Advisor Class, Class R, Class K, Class I, and Class Z shares, respectively. Prior to June 1, 2015, the Expense Cap was .90% of the daily average net assets for Class A. This waiver extends through January 31, 2017 and then may be extended by the Adviser for additional one year terms. For the year ended October 31, 2016, such reimbursements/waivers amounted to $625,527.
Pursuant to the investment advisory agreement, the Portfolio may reimburse the Adviser for certain legal and accounting services provided to the Portfolio by the Adviser. For the year ended October 31, 2016, the reimbursement for such services amounted to $63,692.
The Portfolio compensates AllianceBernstein Investor Services, Inc. (“ABIS”), a wholly-owned subsidiary of the Adviser, under a Transfer Agency Agreement for providing personnel and facilities to perform transfer agency services for the Portfolio. ABIS may make payments to intermediaries that provide omnibus account services, sub-accounting services and/or networking services. Such compensation retained by ABIS amounted to $223,586 for the year ended October 31, 2016.
AllianceBernstein Investments, Inc. (the “Distributor”), a wholly-owned subsidiary of the Adviser, serves as the distributor of the Portfolio’s shares. The Distributor has advised the Portfolio that it has retained front-end sales charges of $8,908 from the sale of Class A shares and received $2,821, $826 and $702 in contingent deferred sales charges imposed upon redemptions by shareholders of Class A, Class B and Class C shares, respectively, for the year ended October 31, 2016.
The AB Fixed-Income Shares, Inc.—Government STIF Portfolio (the “Government STIF Portfolio”), prior to June 1, 2016, was offered as a
| AB INTERMEDIATE BOND PORTFOLIO • | 61 |
Notes to Financial Statements
cash management option to mutual funds and other institutional accounts of the Adviser, and was not available for direct purchase by members of the public. Prior to June 1, 2016, the Government STIF Portfolio paid no advisory fees but did bear its own expenses. As of June 1, 2016, the Government STIF Portfolio, which was renamed “AB Government Money Market Portfolio” (the “Government Money Market Portfolio”), has a contractual advisory fee rate of .20% and continues to bear its own expenses. In connection with the investment by the Portfolio in the Government Money Market Portfolio, the Adviser has agreed to waive its advisory fee from the Portfolio in an amount equal to the Portfolio’s share of the advisory fees of Government Money Market Portfolio, as borne indirectly by the Portfolio as an acquired fund fee and expense. For the year ended October 31, 2016, such waiver amounted to $7,737. A summary of the Portfolio’s transactions in shares of the Government Money Market Portfolio for the year ended October 31, 2016 is as follows:
Market Value | Purchases at Cost (000) | Sales Proceeds (000) | Market Value 10/31/16 (000) | Dividend Income (000) | ||||||||||||
| $ 6,763 | $ | 185,984 | $ | 184,618 | $ | 8,129 | $ | 41 | ||||||||
Brokerage commissions paid on investment transactions for the year ended October 31, 2016 amounted to $12,026, of which $0 and $0, respectively, was paid to Sanford C. Bernstein & Co. LLC and Sanford C. Bernstein Limited, affiliates of the Adviser.
NOTE C
Distribution Services Agreement
The Portfolio has adopted a Distribution Services Agreement (the “Agreement”) pursuant to Rule 12b-1 under the Investment Company Act of 1940. Under the Agreement, the Portfolio pays distribution and servicing fees to the Distributor at an annual rate of up to .30% of the Portfolio’s average daily net assets attributable to Class A shares, 1% of the Portfolio’s average daily net assets attributable to both Class B and Class C shares, .50% of the Portfolio’s average daily net assets attributable to Class R shares and .25% of the Portfolio’s average daily net assets attributable to Class K shares. Effective June 1, 2015, payments under the Agreement in respect of Class A shares are limited to an annual rate of .25% of Class A shares’ average daily net assets. There are no distribution and servicing fees on the Advisor Class, Class I and Class Z shares. The fees are accrued daily and paid monthly. The Agreement provides that the Distributor will use such payments in their entirety for distribution assistance and promotional activities. Since the commencement of the Portfolio’s operations, the Distributor has incurred expenses in excess of the distribution costs reimbursed by the Portfolio in the amounts of $0, $1,166,174, $132,716 and $51,876 for Class B, Class C,
| 62 | • AB INTERMEDIATE BOND PORTFOLIO |
Notes to Financial Statements
Class R and Class K shares, respectively. While such costs may be recovered from the Portfolio in future periods so long as the Agreement is in effect, the rate of the distribution and servicing fees payable under the Agreement may not be increased without a shareholder vote. In accordance with the Agreement, there is no provision for recovery of unreimbursed distribution costs incurred by the Distributor beyond the current fiscal year for Class A shares. The Agreement also provides that the Adviser may use its own resources to finance the distribution of the Portfolio’s shares.
NOTE D
Investment Transactions
Purchases and sales of investment securities (excluding short-term investments) for the year ended October 31, 2016 were as follows:
| Purchases | Sales | |||||||
Investment securities (excluding U.S. government securities) | $ | 77,110,340 | $ | 68,499,017 | ||||
U.S. government securities | 419,488,585 | 373,387,398 | ||||||
The cost of investments for federal income tax purposes, gross unrealized appreciation and unrealized depreciation (excluding futures, foreign currency and swap transactions) are as follows:
Cost | $ | 419,993,432 | ||
Gross unrealized appreciation | $ | 7,209,829 | ||
Gross unrealized depreciation | (4,269,146 | ) | ||
|
| |||
Net unrealized appreciation | $ | 2,940,683 | ||
|
|
1. Derivative Financial Instruments
The Portfolio may use derivatives in an effort to earn income and enhance returns, to replace more traditional direct investments, to obtain exposure to otherwise inaccessible markets (collectively, “investment purposes”), or to hedge or adjust the risk profile of its portfolio.
The principal types of derivatives utilized by the Portfolio, as well as the methods in which they may be used are:
| • | Futures |
The Portfolio may buy or sell futures for investment purposes or for the purpose of hedging its portfolio against adverse effects of potential movements in the market. The Portfolio bears the market risk that arises from changes in the value of these instruments and the imperfect correlation between movements in the price of the futures and movements in the price of the assets, reference rates or indices which they are designed to track. Among other things, the Portfolio may purchase or sell futures for foreign currencies or options thereon for non-hedging purposes as a means of making direct investment in foreign currencies, as described below under “Currency Transactions”.
| AB INTERMEDIATE BOND PORTFOLIO • | 63 |
Notes to Financial Statements
At the time the Portfolio enters into futures, the Portfolio deposits and maintains as collateral an initial margin with the broker, as required by the exchange on which the transaction is effected. Such amount is shown as cash collateral due from broker on the statement of assets and liabilities. Pursuant to the contract, the Portfolio agrees to receive from or pay to the broker an amount of cash equal to the daily fluctuation in the value of the contract. Such receipts or payments are known as variation margin and are recorded by the Portfolio as unrealized gains or losses. Risks may arise from the potential inability of a counterparty to meet the terms of the contract. The credit/counterparty risk for exchange-traded futures is generally less than privately negotiated futures, since the clearinghouse, which is the issuer or counterparty to each exchange-traded future, has robust risk mitigation standards, including the requirement to provide initial and variation margin. When the contract is closed, the Portfolio records a realized gain or loss equal to the difference between the value of the contract at the time it was opened and the time it was closed.
Use of long futures subjects the Portfolio to risk of loss in excess of the amounts shown on the statement of assets and liabilities, up to the notional value of the futures. Use of short futures subjects the Portfolio to unlimited risk of loss. Under some circumstances, futures exchanges may establish daily limits on the amount that the price of futures can vary from the previous day’s settlement price, which could effectively prevent liquidation of unfavorable positions.
During the year ended October 31, 2016, the Portfolio held futures for hedging and non-hedging purposes.
| • | Forward Currency Exchange Contracts |
The Portfolio may enter into forward currency exchange contracts in order to hedge its exposure to changes in foreign currency exchange rates on its foreign portfolio holdings, to hedge certain firm purchase and sale commitments denominated in foreign currencies and for non-hedging purposes as a means of making direct investments in foreign currencies, as described below under “Currency Transactions”.
A forward currency exchange contract is a commitment to purchase or sell a foreign currency at a future date at a negotiated forward rate. The gain or loss arising from the difference between the original contract and the closing of such contract would be included in net realized gain or loss on foreign currency transactions. Fluctuations in the value of open forward currency exchange contracts are recorded for financial reporting purposes as
| 64 | • AB INTERMEDIATE BOND PORTFOLIO |
Notes to Financial Statements
unrealized appreciation and/or depreciation by the Portfolio. Risks may arise from the potential inability of a counterparty to meet the terms of a contract and from unanticipated movements in the value of a foreign currency relative to the U.S. dollar.
During the year ended October 31, 2016, the Portfolio held forward currency exchange contracts for hedging and non-hedging purposes.
| • | Option Transactions |
For hedging and investment purposes, the Portfolio may purchase and write (sell) put and call options on U.S. and foreign securities, including government securities, and foreign currencies that are traded on U.S. and foreign securities exchanges and over-the-counter markets. Among other things, the Portfolio may use options transactions for non-hedging purposes as a means of making direct investments in foreign currencies, as described below under “Currency Transactions” and may use options strategies involving the purchase and/or writing of various combinations of call and/or put options, for hedging and investment purposes.
The risk associated with purchasing an option is that the Portfolio pays a premium whether or not the option is exercised. Additionally, the Portfolio bears the risk of loss of the premium and change in market value should the counterparty not perform under the contract. Put and call options purchased are accounted for in the same manner as portfolio securities. The cost of securities acquired through the exercise of call options is increased by premiums paid. The proceeds from securities sold through the exercise of put options are decreased by the premiums paid.
When the Portfolio writes an option, the premium received by the Portfolio is recorded as a liability and is subsequently adjusted to the current market value of the option written. Premiums received from written options which expire unexercised are recorded by the Portfolio on the expiration date as realized gains from options written. The difference between the premium received and the amount paid on effecting a closing purchase transaction, including brokerage commissions, is also treated as a realized gain, or if the premium received is less than the amount paid for the closing purchase transaction, as a realized loss. If a call option is exercised, the premium received is added to the proceeds from the sale of the underlying security or currency in determining whether the Portfolio has realized a gain or loss. If a put option is exercised, the premium received reduces the cost basis of the security or currency purchased by the Portfolio. In writing an option, the Portfolio bears the market risk of an unfavorable change in the price of the
| AB INTERMEDIATE BOND PORTFOLIO • | 65 |
Notes to Financial Statements
security or currency underlying the written option. Exercise of an option written by the Portfolio could result in the Portfolio selling or buying a security or currency at a price different from the current market value.
The Portfolio may also invest in options on swap agreements, also called “swaptions”. A swaption is an option that gives the buyer the right, but not the obligation, to enter into a swap on a future date in exchange for paying a market-based “premium”. A receiver swaption gives the owner the right to receive the total return of a specified asset, reference rate, or index. A payer swaption gives the owner the right to pay the total return on a specified asset, reference rate, or index. Swaptions also include options that allow an existing swap to be terminated or extended by one of the counterparties.
During the year ended October 31, 2016, the Portfolio held purchased options for hedging purposes. During the year ended October 31, 2016, the Portfolio held written options for hedging purposes.
During the year ended October 31, 2016, the Portfolio held written swaptions for hedging purposes.
For the year ended October 31, 2016, the Portfolio had the following transactions in written options:
| Number of Contracts | Premiums Received | |||||||
Options written outstanding as of 10/31/15 | 495,095,000 | $ | 9,815 | |||||
Options written | 292,977,600 | 41,690 | ||||||
Options assigned | (292,974,000 | ) | (13,070 | ) | ||||
Options expired | (495,096,800 | ) | (24,935 | ) | ||||
Options bought back | (1,800 | ) | (13,500 | ) | ||||
Options exercised | – 0 | – | – 0 | – | ||||
|
|
|
| |||||
Options written outstanding as of 10/31/16 | – 0 | – | $ | – 0 | – | |||
|
|
|
| |||||
| Notional Amount | Premiums Received | |||||||
Swaptions written outstanding as of 10/31/15 | $ | – 0 | – | $ | – 0 | – | ||
Swaptions written | 8,350,000 | 15,865 | ||||||
Swaptions expired | – 0 | – | – 0 | – | ||||
Swaptions bought back | – 0 | – | – 0 | – | ||||
Swaptions exercised | – 0 | – | – 0 | – | ||||
|
|
|
| |||||
Swaptions written outstanding as of 10/31/16 | $ | 8,350,000 | $ | 15,865 | ||||
|
|
|
| |||||
| 66 | • AB INTERMEDIATE BOND PORTFOLIO |
Notes to Financial Statements
| • | Swaps |
The Portfolio may enter into swaps to hedge its exposure to interest rates or credit risk. The Portfolio may also enter into swaps for non-hedging purposes as a means of gaining market exposures, including by making direct investments in foreign currencies, as described below under “Currency Transactions”. A swap is an agreement that obligates two parties to exchange a series of cash flows at specified intervals based upon or calculated by reference to changes in specified prices or rates for a specified amount of an underlying asset. The payment flows are usually netted against each other, with the difference being paid by one party to the other. In addition, collateral may be pledged or received by the Portfolio in accordance with the terms of the respective swaps to provide value and recourse to the Portfolio or its counterparties in the event of default, bankruptcy or insolvency by one of the parties to the swap.
Risks may arise as a result of the failure of the counterparty to the swap to comply with the terms of the swap. The loss incurred by the failure of a counterparty is generally limited to the net interim payment to be received by the Portfolio, and/or the termination value at the end of the contract. Therefore, the Portfolio considers the creditworthiness of each counterparty to a swap in evaluating potential counterparty risk. This risk is mitigated by having a netting arrangement between the Portfolio and the counterparty and by the posting of collateral by the counterparty to the Portfolio to cover the Portfolio’s exposure to the counterparty. Additionally, risks may arise from unanticipated movements in interest rates or in the value of the underlying securities. The Portfolio accrues for the interim payments on swaps on a daily basis, with the net amount recorded within unrealized appreciation/depreciation of swaps on the statement of assets and liabilities, where applicable. Once the interim payments are settled in cash, the net amount is recorded as realized gain/(loss) on swaps on the statement of operations, in addition to any realized gain/(loss) recorded upon the termination of swaps. Upfront premiums paid or received are recognized as cost or proceeds on the statement of assets and liabilities and are amortized on a straight line basis over the life of the contract. Amortized upfront premiums are included in net realized gain/(loss) from swaps on the statement of operations. Fluctuations in the value of swaps are recorded as a component of net change in unrealized appreciation/depreciation of swaps on the statement of operations.
Certain standardized swaps, including certain interest rate swaps and credit default swaps, are (or soon will be) subject to
| AB INTERMEDIATE BOND PORTFOLIO • | 67 |
Notes to Financial Statements
mandatory central clearing. Cleared swaps are transacted through futures commission merchants (“FCMs”) that are members of central clearinghouses, with the clearinghouse serving as central counterparty, similar to transactions in futures contracts. Centralized clearing will be required for additional categories of swaps on a phased-in basis based on requirements published by the Securities and Exchange Commission and Commodity Futures Trading Commission.
At the time the Portfolio enters into a centrally cleared swap, the Portfolio deposits and maintains as collateral an initial margin with the broker, as required by the clearinghouse on which the transaction is effected. Such amount is shown as cash collateral due from broker on the statement of assets and liabilities. Pursuant to the contract, the Portfolio agrees to receive from or pay to the broker an amount of cash equal to the daily fluctuation in the value of the contract. Such receipts or payments are known as variation margin and are recorded by the Portfolio as unrealized gains or losses. Risks may arise from the potential of a counterparty to meet the terms of the contract. The credit/counterparty risk for centrally cleared swaps is generally less than non-centrally cleared swaps, since the clearinghouse, which is the issuer or counterparty to each centrally cleared swap, has robust risk mitigation standards, including the requirement to provide initial and variation margin. When the contract is closed, the Portfolio records a realized gain or loss equal to the difference between the value of the contract at the time it was opened and the time it was closed.
Interest Rate Swaps:
The Portfolio is subject to interest rate risk exposure in the normal course of pursuing its investment objectives. Because the Portfolio holds fixed rate bonds, the value of these bonds may decrease if interest rates rise. To help hedge against this risk and to maintain its ability to generate income at prevailing market rates, the Portfolio may enter into interest rate swaps. Interest rate swaps are agreements between two parties to exchange cash flows based on a notional amount. The Portfolio may elect to pay a fixed rate and receive a floating rate, or, receive a fixed rate and pay a floating rate on a notional amount.
In addition, the Portfolio may also enter into interest rate swap transactions to preserve a return or spread on a particular investment or portion of its portfolio, or protecting against an increase in the price of securities the Portfolio anticipates purchasing at a later date. Interest rate swaps involve the exchange by a Portfolio with another party of their respective commitments to pay or receive interest (e.g., an exchange of floating rate
| 68 | • AB INTERMEDIATE BOND PORTFOLIO |
Notes to Financial Statements
payments for fixed rate payments) computed based on a contractually-based principal (or “notional”) amount. Interest rate swaps are entered into on a net basis (i.e., the two payment streams are netted out, with the Portfolio receiving or paying, as the case may be, only the net amount of the two payments).
During the year ended October 31, 2016, the Portfolio held interest rate swaps for hedging and non-hedging purposes.
Inflation (CPI) Swaps:
Inflation swaps are contracts in which one party agrees to pay the cumulative percentage increase in a price index (the Consumer Price Index with respect to CPI swaps) over the term of the swap (with some lag on the inflation index), and the other pays a compounded fixed rate. Inflation swaps may be used to protect the net asset value, or NAV, of a Portfolio against an unexpected change in the rate of inflation measured by an inflation index since the value of these agreements is expected to increase if unexpected inflation increases.
During the year ended October 31, 2016, the Portfolio held inflation (CPI) swaps for hedging and non-hedging purposes.
Credit Default Swaps:
The Portfolio may enter into credit default swaps, including to manage its exposure to the market or certain sectors of the market, to reduce its risk exposure to defaults by corporate and sovereign issuers held by the Portfolio, or to create exposure to corporate or sovereign issuers to which it is not otherwise exposed. The Portfolio may purchase credit protection (“Buy Contract”) or provide credit protection (“Sale Contract”) on the referenced obligation of the credit default swap. During the term of the swap, the Portfolio receives/(pays) fixed payments from/(to) the respective counterparty, calculated at the agreed upon rate applied to the notional amount. If the Portfolio is a buyer/(seller) of protection and a credit event occurs, as defined under the terms of the swap, the Portfolio will either (i) receive from the seller/(pay to the buyer) of protection an amount equal to the notional amount of the swap (the “Maximum Payout Amount”) and deliver/(take delivery of) the referenced obligation or (ii) receive/(pay) a net settlement amount in the form of cash or securities equal to the notional amount of the swap less the recovery value of the referenced obligation.
In certain circumstances Maximum Payout Amounts may be partially offset by recovery values of the respective referenced obligations, upfront premium received upon entering into the agreement, or net amounts received from settlement of buy
| AB INTERMEDIATE BOND PORTFOLIO • | 69 |
Notes to Financial Statements
protection credit default swaps entered into by the Portfolio for the same reference obligation with the same counterparty. As of October 31, 2016, the Portfolio had Buy Contracts outstanding with respect to the same referenced obligation and same counterparty for its Sales Contracts which may partially offset the Maximum Payout Amount in the amount of $2,150,000.
Credit default swaps may involve greater risks than if a Portfolio had invested in the referenced obligation directly. Credit default swaps are subject to general market risk, liquidity risk, counterparty risk and credit risk. If the Portfolio is a buyer of protection and no credit event occurs, it will lose the payments it made to its counterparty. If the Portfolio is a seller of protection and a credit event occurs, the value of the referenced obligation received by the Portfolio coupled with the periodic payments previously received, may be less than the Maximum Payout Amount it pays to the buyer, resulting in a net loss to the Portfolio.
Implied credit spreads over U.S. Treasuries of comparable maturity utilized in determining the market value of credit default swaps on issuers as of period end are disclosed in the portfolio of investments. The implied spreads serve as an indicator of the current status of the payment/performance risk and typically reflect the likelihood of default by the issuer of the referenced obligation. The implied credit spread of a particular reference obligation also reflects the cost of buying/selling protection and may reflect upfront payments required to be made to enter into the agreement. Widening credit spreads typically represent a deterioration of the referenced obligation’s credit soundness and greater likelihood of default or other credit event occurring as defined under the terms of the agreement. A credit spread identified as “Defaulted” indicates a credit event has occurred for the referenced obligation.
During the year ended October 31, 2016, the Portfolio held credit default swaps for hedging and non-hedging purposes.
The Portfolio typically enters into International Swaps and Derivatives Association, Inc. Master Agreements (“ISDA Master Agreement”) or similar master agreements (collectively, “Master Agreements”) with its derivative contract counterparties in order to, among other things, reduce its credit risk to counterparties. ISDA Master Agreements include provisions for general obligations, representations, collateral and events of default or termination. Under an ISDA Master Agreement, the Portfolio typically may offset with the counterparty certain derivative financial instrument’s payables and/or receivables with collateral held
| 70 | • AB INTERMEDIATE BOND PORTFOLIO |
Notes to Financial Statements
and/or posted and create one single net payment (close-out netting) in the event of default or termination.
Various Master Agreements govern the terms of certain transactions with counterparties, including transactions such as derivative transactions, repurchase and reverse repurchase agreements. These Master Agreements typically attempt to reduce the counterparty risk associated with such transactions by specifying credit protection mechanisms and providing standardization that improves legal certainty. Cross-termination provisions under Master Agreements typically provide that a default in connection with one transaction between the Portfolio and a counterparty gives the non-defaulting party the right to terminate any other transactions in place with the defaulting party to create one single net payment due to/due from the defaulting party. In the event of a default by a Master Agreements counterparty, the return of collateral with market value in excess of the Portfolio’s net liability, held by the defaulting party, may be delayed or denied.
The Portfolio’s Master Agreements may contain provisions for early termination of OTC derivative transactions in the event the net assets of the Portfolio decline below specific levels (“net asset contingent features”). If these levels are triggered, the Portfolio’s counterparty has the right to terminate such transaction and require the Portfolio to pay or receive a settlement amount in connection with the terminated transaction. For additional details, please refer to netting arrangements by counterparty tables below.
During the year ended October 31, 2016, the Portfolio had entered into the following derivatives:
Asset Derivatives | Liability Derivatives | |||||||||||
Derivative Type | Statement of | Fair Value | Statement of | Fair Value | ||||||||
Interest rate contracts | Receivable/Payable for variation margin on exchange-traded derivatives | $ | 449,097 | * | Receivable/Payable for variation margin on exchange-traded derivatives | $ | 1,960,660 | * | ||||
Foreign exchange contracts | Unrealized appreciation on forward currency exchange contracts |
| 693,838 |
| Unrealized depreciation on forward currency exchange contracts |
| 497,801 |
| ||||
Interest rate contracts | Investments in securities, at value |
| 20,207 |
| ||||||||
| AB INTERMEDIATE BOND PORTFOLIO • | 71 |
Notes to Financial Statements
Asset Derivatives | Liability Derivatives | |||||||||||
Derivative Type | Statement of | Fair Value | Statement of | Fair Value | ||||||||
Interest rate contracts | Swaptions written, at value | $ | 11,304 |
| ||||||||
Interest rate contracts | Unrealized depreciation on interest rate swaps |
| 252,746 |
| ||||||||
Credit contracts | Unrealized appreciation on credit default swaps | $ | 56,872 | Unrealized depreciation on credit default swaps | 229,932 | |||||||
|
|
|
| |||||||||
Total | $ | 1,220,014 | $ | 2,952,443 | ||||||||
|
|
|
| |||||||||
| * | Only variation margin receivable/payable at period end is reported within the statement of assets and liabilities. This amount reflects cumulative appreciation/(depreciation) of exchange-traded derivatives as reported in the portfolio of investments. |
Derivative Type | Location of Gain | Realized Gain or (Loss) on Derivatives | Change in Unrealized Appreciation or (Depreciation) | |||||||
Interest rate contracts | Net realized gain (loss) on futures; Net change in unrealized appreciation/depreciation of futures | $ | 1,747,312 | $ | (455,799 | ) | ||||
Foreign exchange contracts | Net realized gain (loss) on foreign currency transactions; Net change in unrealized appreciation/depreciation of foreign currency denominated assets and liabilities | (469,685 | ) | 121,472 | ||||||
Interest rate contracts | Net realized gain (loss) on investment transactions; Net change in unrealized appreciation/depreciation of investments | (18,829 | ) | |||||||
Equity contracts | Net realized gain (loss) on investment transactions; Net change in unrealized appreciation/depreciation of investments | (24,300 | ) | |||||||
| 72 | • AB INTERMEDIATE BOND PORTFOLIO |
Notes to Financial Statements
Derivative Type | Location of Gain | Realized Gain or (Loss) on Derivatives | Change in Unrealized Appreciation or (Depreciation) | |||||||
Interest rate contracts | Net realized gain (loss) on swaptions written; Net change in unrealized appreciation/depreciation of swaptions written | $ | 4,561 | |||||||
Foreign exchange contracts | Net realized gain (loss) on options written; Net change in unrealized appreciation/depreciation of options written | $ | 9,632 | (6,570 | ) | |||||
Equity contracts | Net realized gain (loss) on options written; Net change in unrealized appreciation/depreciation of options written | 10,980 | ||||||||
Interest rate contracts | Net realized gain (loss) on swaps; Net change in unrealized appreciation/depreciation of swaps | (79,508 | ) | 66,482 | ||||||
Credit contracts | Net realized gain (loss) on swaps; Net change in unrealized appreciation/depreciation of swaps | (52,901 | ) | (253,056 | ) | |||||
|
|
|
| |||||||
Total | $ | 1,141,530 | $ | (541,739 | ) | |||||
|
|
|
| |||||||
The following table represents the average monthly volume of the Portfolio’s derivative transactions during the year ended October 31, 2016:
Futures: | ||||
Average original value of buy contracts | $ | 78,509,858 | ||
Average original value of sale contracts | $ | 24,038,334 | ||
Forward Currency Exchange Contracts: | ||||
Average principal amount of buy contracts | $ | 9,409,876 | ||
Average principal amount of sale contracts | $ | 33,916,163 | ||
Purchased Options: | ||||
Average monthly cost | $ | 41,208 | (a) | |
Interest Rate Swaps: | ||||
Average notional amount | $ | 11,820,000 | ||
Inflation Swaps: | ||||
Average notional amount | $ | 5,210,000 | (b) | |
| AB INTERMEDIATE BOND PORTFOLIO • | 73 |
Notes to Financial Statements
Centrally Cleared Interest Rate Swaps: | ||||
Average notional amount | $ | 123,489,221 | ||
Credit Default Swaps: | ||||
Average notional amount of buy contracts | $ | 1,737,154 | ||
Average notional amount of sale contracts | $ | 3,663,712 | ||
Centrally Cleared Credit Default Swaps: | ||||
Average notional amount of buy contracts | $ | 1,746,000 | (b) |
| (a) | Positions were open for two months during the year. |
| (b) | Positions were open for four months during the year. |
For financial reporting purposes, the Portfolio does not offset derivative assets and derivative liabilities that are subject to netting arrangements in the statement of assets and liabilities.
All derivatives held at period end were subject to netting arrangements. The following table presents the Portfolio’s derivative assets and liabilities by counterparty net of amounts available for offset under Master Agreements (“MA”) and net of the related collateral received/pledged by the Portfolio as of October 31, 2016:
Counterparty | Derivative Assets Subject to a MA | Derivative Available for Offset | Cash Collateral Received | Security Collateral Received | Net Amount of Derivatives Assets | |||||||||||||||
Exchange-Traded Derivatives: | ||||||||||||||||||||
Morgan Stanley & Co., Inc./Morgan Stanley & Co., LLC* | $ | 107,120 | $ | (10,701 | ) | $ | – 0 | – | $ | – 0 | – | $ | 96,419 | |||||||
|
|
|
|
|
|
|
|
|
| |||||||||||
Total | $ | 107,120 | $ | (10,701 | ) | $ | – 0 | – | $ | – 0 | – | $ | 96,419 | |||||||
|
|
|
|
|
|
|
|
|
| |||||||||||
OTC Derivatives: | ||||||||||||||||||||
Citibank, NA | $ | 378,881 | $ | (101,258 | ) | $ | – 0 | – | $ | – 0 | – | $ | 277,623 | |||||||
Credit Suisse International | 201,749 | (201,749 | ) | – 0 | – | – 0 | – | – 0 | – | |||||||||||
Morgan Stanley & Co., Inc. | 15,602 | (13,204 | ) | – 0 | – | – 0 | – | 2,398 | ||||||||||||
State Street Bank & Trust Co. | 81,057 | (2,879 | ) | – 0 | – | – 0 | – | 78,178 | ||||||||||||
UBS AG | 227,405 | – 0 | – | – 0 | – | – 0 | – | 227,405 | ||||||||||||
|
|
|
|
|
|
|
|
|
| |||||||||||
Total | $ | 904,694 | $ | (319,090 | ) | $ | – 0 | – | $ | – 0 | – | $ | 585,604 | ^ | ||||||
|
|
|
|
|
|
|
|
|
| |||||||||||
Counterparty | Derivative Liabilities Subject to a MA | Derivative Available for Offset | Cash Collateral Pledged | Security Collateral Pledged** | Net Amount of Derivatives Liabilities | |||||||||||||||
Exchange-Traded Derivatives: | ||||||||||||||||||||
Morgan Stanley & Co., Inc./Morgan Stanley & Co., LLC* | $ | 10,701 | $ | (10,701 | ) | $ | – 0 | – | $ | – 0 | – | $ | – 0 | – | ||||||
|
|
|
|
|
|
|
|
|
| |||||||||||
Total | $ | 10,701 | $ | (10,701 | ) | $ | – 0 | – | $ | – 0 | – | $ | – 0 | – | ||||||
|
|
|
|
|
|
|
|
|
| |||||||||||
| 74 | • AB INTERMEDIATE BOND PORTFOLIO |
Notes to Financial Statements
Counterparty | Derivative Liabilities Subject to a MA | Derivative Available for Offset | Cash Collateral Pledged | Security Collateral Pledged** | Net Amount of Derivatives Liabilities | |||||||||||||||
OTC Derivatives: | ||||||||||||||||||||
Citibank, NA | $ | 101,258 | $ | (101,258 | ) | $ | – 0 | – | $ | – 0 | – | $ | – 0 | – | ||||||
Credit Suisse International | 381,848 | (201,749 | ) | – 0 | – | (180,099 | ) | – 0 | – | |||||||||||
Deutsche Bank AG | 64,322 | – 0 | – | – 0 | – | – 0 | – | 64,322 | ||||||||||||
Goldman Sachs Bank USA/Goldman Sachs International | 710,133 | – 0 | – | – 0 | – | – 0 | – | 710,133 | ||||||||||||
HSBC Bank USA | 12,821 | – 0 | – | – 0 | – | – 0 | – | 12,821 | ||||||||||||
JPMorgan Chase Bank, NA | 252,746 | – 0 | – | – 0 | – | – 0 | – | 252,746 | ||||||||||||
Morgan Stanley & Co., Inc. | 13,204 | (13,204 | ) | – 0 | – | – 0 | – | 0 | ||||||||||||
Standard Chartered Bank | 24,947 | – 0 | – | – 0 | – | – 0 | – | 24,947 | ||||||||||||
State Street Bank & Trust Co. | 2,879 | (2,879 | ) | – 0 | – | – 0 | – | – 0 | – | |||||||||||
|
|
|
|
|
|
|
|
|
| |||||||||||
Total | $ | 1,564,158 | $ | (319,090 | ) | $ | – 0 | – | $ | (180,099 | ) | $ | 1,064,969^ | |||||||
|
|
|
|
|
|
|
|
|
| |||||||||||
| * | Cash has been posted for initial margin requirements for exchange-traded derivatives outstanding at October 31, 2016. |
| ** | The actual collateral received/pledged is more than the amount reported due to over-collateralization. |
| ^ | Net amount represents the net receivable/payable that would be due from/to the counterparty in the event of default or termination. The net amount from OTC financial derivative instruments can only be netted across transactions governed under the same master agreement with the same counterparty. |
2. Currency Transactions
The Portfolio may invest in non-U.S. Dollar-denominated securities on a currency hedged or unhedged basis. The Portfolio may seek investment opportunities by taking long or short positions in currencies through the use of currency-related derivatives, including forward currency exchange contracts, futures and options on futures, swaps, and other options. The Portfolio may enter into transactions for investment opportunities when it anticipates that a foreign currency will appreciate or depreciate in value but securities denominated in that currency are not held by the Portfolio and do not present attractive investment opportunities. Such transactions may also be used when the Adviser believes that it may be more efficient than a direct investment in a foreign currency-denominated security. The Portfolio may also conduct currency exchange contracts on a spot basis (i.e., for cash at the spot rate prevailing in the currency exchange market for buying or selling currencies).
| AB INTERMEDIATE BOND PORTFOLIO • | 75 |
Notes to Financial Statements
3. Short Sales
The Portfolio may sell securities short. A short sale is a transaction in which the Portfolio sells securities it does not own, but has borrowed, in anticipation of a decline in the market price of the securities. The Portfolio is obligated to replace the borrowed securities at their market price at the time of settlement. The Portfolio’s obligation to replace the securities borrowed in connection with a short sale will be fully secured by collateral deposited with the broker. The Portfolio is liable to the buyer for any dividends/interest payable on securities while those securities are in a short position. These dividends/interest are recorded as an expense of the Portfolio. Short sales by the Portfolio involve certain risks and special considerations. Possible losses from short sales differ from losses that could be incurred from a purchase of a security because losses from short sales may be unlimited, whereas losses from purchases cannot exceed the total amount invested.
4. TBA and Dollar Rolls
The Portfolio may invest in TBA mortgage-backed securities. A TBA, or “To Be Announced”, trade represents a contract for the purchase or sale of mortgage-backed securities to be delivered at a future agree-upon date; however, the specific mortgage pool numbers or the number of pools that will be delivered to fulfill the trade obligation or terms of the contract are unknown at the time of the trade. Mortgage pools (including fixed-rate or variable-rate mortgages) guaranteed by the Government National Mortgage Association, or GNMA, the Federal National Mortgage Association, or FNMA, or the Federal Home Loan Mortgage Corporation, or FHLMC, are subsequently allocated to the TBA transactions.
The Portfolio may enter into dollar rolls. Dollar rolls involve sales by the Portfolio of securities for delivery in the current month and the Portfolio’s simultaneously contracting to repurchase substantially similar (same type and coupon) securities on a specified future date. During the roll period, the Portfolio forgoes principal and interest paid on the securities. The Portfolio is compensated by the difference between the current sales price and the lower forward price for the future purchase (often referred to as the “drop”) as well as by the interest earned on the cash proceeds of the initial sale. Dollar rolls involve the risk that the market value of the securities the Portfolio is obligated to repurchase under the agreement may decline below the repurchase price. Dollar rolls are speculative techniques. For the year ended October 31, 2016, the Portfolio earned drop income of $353,026 which is included in interest income in the accompanying statement of operations.
| 76 | • AB INTERMEDIATE BOND PORTFOLIO |
Notes to Financial Statements
NOTE E
Capital Stock
Each class consists of 3,000,000,000 authorized shares. Transactions in capital shares for each class were as follows:
| Shares | Amount | |||||||||||||||||||||||
| Year Ended October 31, 2016 | Year Ended October 31, 2015 | Year Ended October 31, 2016 | Year Ended October 31, 2015 | |||||||||||||||||||||
|
| |||||||||||||||||||||||
| Class A | ||||||||||||||||||||||||
Shares sold | 2,201,706 | 1,280,374 | $ | 24,368,945 | $ | 14,319,956 | ||||||||||||||||||
| ||||||||||||||||||||||||
Shares issued in reinvestment of dividends | 527,574 | 530,134 | 5,831,973 | 5,929,136 | ||||||||||||||||||||
| ||||||||||||||||||||||||
Shares converted from Class B | 49,298 | 123,507 | 546,216 | 1,384,960 | ||||||||||||||||||||
| ||||||||||||||||||||||||
Shares redeemed | (3,778,000 | ) | (3,441,024 | ) | (41,905,564 | ) | (38,513,706 | ) | ||||||||||||||||
| ||||||||||||||||||||||||
Net decrease | (999,422 | ) | (1,507,009 | ) | $ | (11,158,430 | ) | $ | (16,879,654 | ) | ||||||||||||||
| ||||||||||||||||||||||||
| Class B | ||||||||||||||||||||||||
Shares sold | 12,222 | 29,802 | $ | 135,425 | $ | 334,102 | ||||||||||||||||||
| ||||||||||||||||||||||||
Shares issued in reinvestment of dividends | 2,880 | 4,566 | 31,751 | 51,110 | ||||||||||||||||||||
| ||||||||||||||||||||||||
Shares converted to Class A | (49,288 | ) | (123,462 | ) | (546,216 | ) | (1,384,960 | ) | ||||||||||||||||
| ||||||||||||||||||||||||
Shares redeemed | (20,383 | ) | (26,313 | ) | (225,858 | ) | (293,711 | ) | ||||||||||||||||
| ||||||||||||||||||||||||
Net decrease | (54,569 | ) | (115,407 | ) | $ | (604,898 | ) | $ | (1,293,459 | ) | ||||||||||||||
| ||||||||||||||||||||||||
| Class C | ||||||||||||||||||||||||
Shares sold | 707,843 | 452,832 | $ | 7,817,124 | $ | 5,052,767 | ||||||||||||||||||
| ||||||||||||||||||||||||
Shares issued in reinvestment of dividends | 67,345 | 68,581 | 742,400 | 765,443 | ||||||||||||||||||||
| ||||||||||||||||||||||||
Shares redeemed | (746,536 | ) | (619,884 | ) | (8,256,301 | ) | (6,918,148 | ) | ||||||||||||||||
| ||||||||||||||||||||||||
Net increase (decrease) | 28,652 | (98,471 | ) | $ | 303,223 | $ | (1,099,938 | ) | ||||||||||||||||
| ||||||||||||||||||||||||
| Advisor Class | ||||||||||||||||||||||||
Shares sold | 4,427,579 | 1,211,759 | $ | 49,003,433 | $ | 13,604,515 | ||||||||||||||||||
| ||||||||||||||||||||||||
Shares issued in reinvestment of dividends | 74,968 | 42,501 | 831,653 | 475,348 | ||||||||||||||||||||
| ||||||||||||||||||||||||
Shares redeemed | (1,564,156 | ) | (1,546,249 | ) | (17,378,185 | ) | (17,411,766 | ) | ||||||||||||||||
| ||||||||||||||||||||||||
Net increase (decrease) | 2,938,391 | (291,989 | ) | $ | 32,456,901 | $ | (3,331,903 | ) | ||||||||||||||||
| ||||||||||||||||||||||||
| AB INTERMEDIATE BOND PORTFOLIO • | 77 |
Notes to Financial Statements
| Shares | Amount | |||||||||||||||||||||||
| Year Ended October 31, 2016 | Year Ended October 31, 2015 | Year Ended October 31, 2016 | Year Ended October 31, 2015 | |||||||||||||||||||||
|
| |||||||||||||||||||||||
| Class R | ||||||||||||||||||||||||
Shares sold | 49,530 | 80,356 | $ | 550,840 | $ | 897,105 | ||||||||||||||||||
| ||||||||||||||||||||||||
Shares issued in reinvestment of dividends | 7,524 | 6,409 | 83,149 | 71,629 | ||||||||||||||||||||
| ||||||||||||||||||||||||
Shares redeemed | (53,430 | ) | (31,961 | ) | (585,664 | ) | (358,491 | ) | ||||||||||||||||
| ||||||||||||||||||||||||
Net increase | 3,624 | 54,804 | $ | 48,325 | $ | 610,243 | ||||||||||||||||||
| ||||||||||||||||||||||||
| Class K | ||||||||||||||||||||||||
Shares sold | 186,805 | 128,694 | $ | 2,068,640 | $ | 1,445,071 | ||||||||||||||||||
| ||||||||||||||||||||||||
Shares issued in reinvestment of dividends | 13,274 | 12,526 | 147,054 | 140,230 | ||||||||||||||||||||
| ||||||||||||||||||||||||
Shares redeemed | (46,817 | ) | (188,432 | ) | (517,323 | ) | (2,103,890 | ) | ||||||||||||||||
| ||||||||||||||||||||||||
Net increase (decrease) | 153,262 | (47,212 | ) | $ | 1,698,371 | $ | (518,589 | ) | ||||||||||||||||
| ||||||||||||||||||||||||
| Class I | ||||||||||||||||||||||||
Shares sold | 196,134 | 70,818 | $ | 2,200,619 | $ | 799,450 | ||||||||||||||||||
| ||||||||||||||||||||||||
Shares issued in reinvestment of dividends | 2,550 | 1,250 | 28,431 | 13,996 | ||||||||||||||||||||
| ||||||||||||||||||||||||
Shares redeemed | (12,405 | ) | (35,363 | ) | (137,850 | ) | (398,713 | ) | ||||||||||||||||
| ||||||||||||||||||||||||
Net increase | 186,279 | 36,705 | $ | 2,091,200 | $ | 414,733 | ||||||||||||||||||
| ||||||||||||||||||||||||
| Class Z | ||||||||||||||||||||||||
Shares sold | 2,295,097 | 529,910 | $ | 25,699,685 | $ | 5,886,008 | ||||||||||||||||||
| ||||||||||||||||||||||||
Shares issued in reinvestment of dividends | 34,717 | 2,243 | 385,137 | 24,944 | ||||||||||||||||||||
| ||||||||||||||||||||||||
Shares redeemed | (1,156,346 | ) | (95,347 | ) | (12,802,388 | ) | (1,060,030 | ) | ||||||||||||||||
| ||||||||||||||||||||||||
Net increase | 1,173,468 | 436,806 | $ | 13,282,434 | $ | 4,850,922 | ||||||||||||||||||
| ||||||||||||||||||||||||
NOTE F
Risks Involved in Investing in the Portfolio
Interest Rate Risk and Credit Risk—Interest rate risk is the risk that changes in interest rates will affect the value of the Portfolio’s investments in fixed-income debt securities such as bonds or notes. Increases in interest rates may cause the value of the Portfolio’s investments to decline. Credit risk is the risk that the issuer or guarantor of a debt security, or the counterparty to a derivative contract, will be unable or unwilling to make timely principal and/or interest payments, or to otherwise honor its obligations. The degree of risk for a particular security may be reflected in its credit rating. Credit risk is greater for medium quality and lower-rated securities. Lower-rated debt securities and similar unrated securities (commonly known as “junk bonds”) have speculative elements or are predominantly speculative risks.
| 78 | • AB INTERMEDIATE BOND PORTFOLIO |
Notes to Financial Statements
Below Investment Grade Securities Risk—Investments in fixed-income securities with lower ratings (commonly known as “junk bonds”) are subject to a higher probability that an issuer will default or fail to meet its payment obligations. These securities may be subject to greater price volatility due to such factors as specific corporate developments, negative perceptions of the junk bond market generally and less secondary market liquidity.
Duration Risk—Duration is a measure that relates the expected price volatility of a fixed-income security to changes in interest rates. The duration of a fixed-income security may be shorter than or equal to full maturity of a fixed-income security. Fixed-income securities with longer durations have more risk and will decrease in price as interest rates rise. For example, a fixed-income security with a duration of three years will decrease in value by approximately 3% if interest rates increase by 1%.
Inflation Risk—This is the risk that the value of assets or income from investments will be less in the future as inflation decreases the value of money. As inflation increases, the value of the Portfolio’s assets can decline as can the value of the Portfolio’s distributions. This risk is significantly greater for fixed-income securities with longer maturities.
Foreign (Non-U.S.) Risk—Investments in securities of non-U.S. issuers may involve more risk than those of U.S. issuers. These securities may fluctuate more widely in price and may be less liquid due to adverse market, economic, political, regulatory or other factors.
Emerging Market Risk—Investments in emerging market countries may have more risk because the markets are less developed and less liquid, and because these investments may be subject to increased economic, political, regulatory or other uncertainties.
Currency Risk—Fluctuations in currency exchange rates may negatively affect the value of the Portfolio’s investments or reduce its returns.
Prepayment Risk—The value of mortgage-related or asset-backed securities may be particularly sensitive to changes in prevailing interest rates. Early payments of principal on some mortgage-related securities may occur during periods of falling mortgage interest rates and expose the Portfolio to a lower rate of return upon reinvestment of principal. Early payments associated with mortgage-related securities cause these securities to experience significantly greater price and yield volatility than is experienced by traditional fixed-income securities. During periods of rising interest rates, a reduction in prepayments may increase the effective life of mortgage-related securities, subjecting them to greater risk of decline in market value in response to rising interest rates. If the life of a
| AB INTERMEDIATE BOND PORTFOLIO • | 79 |
Notes to Financial Statements
mortgage-related security is inaccurately predicted, the Portfolio may not be able to realize the rate of return it expected.
Leverage Risk—When the Portfolio borrows money or otherwise leverages its investments, its performance may be volatile because leverage tends to exaggerate the effect of any increase or decrease in the value of the Portfolio’s investments. The Portfolio may create leverage through the use of reverse repurchase arrangements, forward currency exchange contracts, forward commitments, dollar rolls or futures or by borrowing money. The use of derivative instruments by the Portfolio, such as forwards, futures, options and swaps, may also result in a form of leverage. Leverage may result in higher returns to the Portfolio than if the Portfolio were not leveraged, but may also adversely affect returns, particularly if the market is declining.
Derivatives Risk—The Portfolio may enter into derivative transactions such as forwards, options, futures and swaps. Derivatives may be illiquid, difficult to price, and leveraged so that small changes may produce disproportionate losses for the Portfolio, and subject to counterparty risk to a greater degree than more traditional investments. Derivatives may result in significant losses, including losses that are far greater than the value of the derivatives reflected on the statement of assets and liabilities.
Liquidity Risk—Liquidity risk occurs when certain investments become difficult to purchase or sell. Difficulty in selling less liquid securities may result in sales at disadvantageous prices affecting the value of your investment in the Portfolio. Causes of liquidity risk may include low trading volumes, large positions and heavy redemptions of fund shares. Over recent years, liquidity risk has also increased because the capacity of dealers in the secondary market for fixed-income securities to make markets in these securities has decreased, even as the overall bond market has grown significantly, due to, among other things, structural changes, additional regulatory requirements and capital and risk restraints that have led to reduced inventories. Liquidity risk may be higher in a rising interest rate environment, when the value and liquidity of fixed-income securities generally decline.
Indemnification Risk—In the ordinary course of business, the Portfolio enters into contracts that contain a variety of indemnifications. The Portfolio’s maximum exposure under these arrangements is unknown. However, the Portfolio has not had prior claims or losses pursuant to these indemnification provisions and expects the risk of loss thereunder to be remote. Therefore, the Portfolio has not accrued any liability in connection with these indemnification provisions.
| 80 | • AB INTERMEDIATE BOND PORTFOLIO |
Notes to Financial Statements
NOTE G
Joint Credit Facility
A number of open-end mutual funds managed by the Adviser, including the Portfolio, participate in a $280 million revolving credit facility (the “Facility”) intended to provide short-term financing, if necessary, subject to certain restrictions in connection with abnormal redemption activity. Commitment fees related to the Facility are paid by the participating funds and are included in miscellaneous expenses in the statement of operations. The Portfolio did not utilize the Facility during the year ended October 31, 2016.
NOTE H
Distributions to Shareholders
The tax character of distributions paid during the fiscal years ended October 31, 2016 and October 31, 2015 were as follows:
| 2016 | 2015 | |||||||
Distributions paid from: | ||||||||
Ordinary income | $ | 11,308,484 | $ | 10,226,708 | ||||
|
|
|
| |||||
Total taxable distributions | $ | 11,308,484 | $ | 10,226,708 | ||||
|
|
|
| |||||
As of October 31, 2016, the components of accumulated earnings/(deficit) on a tax basis were as follows:
Undistributed ordinary income | $ | 1,118,392 | ||
Undistributed capital gains | 181,353 | |||
Accumulated capital and other losses | (141,264 | )(a) | ||
Unrealized appreciation/(depreciation) | 2,330,984 | (b) | ||
|
| |||
Total accumulated earnings/(deficit) | $ | 3,489,465 | (c) | |
|
|
| (a) | As of October 31, 2016, the cumulative deferred loss on straddles was $141,264. |
| (b) | The differences between book-basis and tax-basis unrealized appreciation and (depreciation) are attributable primarily to the tax deferral of losses on wash sales, the tax treatment of passive foreign investment companies (PFICs), the difference between book and tax amortization methods for premium, the tax treatment of swaps, and the realization for tax purposes of gains/losses on certain derivative instruments. |
| (c) | The differences between book-basis and tax-basis components of accumulated earnings/ (deficit) are attributable primarily to dividends payable and the tax treatment of defaulted securities. |
For tax purposes, net realized capital losses may be carried over to offset future capital gains, if any. Funds are permitted to carry forward capital losses for an indefinite period, and such losses will retain their character as either short-term or long-term capital losses. As of October 31, 2016, the Fund did not have any capital loss carryforwards.
During the current fiscal year, permanent differences primarily due to the tax treatment of swaps, options and swap clearing fees, reclassifications of foreign currency and paydown gains/losses, and the redesignation of
| AB INTERMEDIATE BOND PORTFOLIO • | 81 |
Notes to Financial Statements
dividends resulted in a net decrease in distributions in excess of net investment income and a net decrease in accumulated net realized gain on investment and foreign currency transactions. These reclassifications had no effect on net assets.
NOTE I
New Accounting Pronouncements
In May 2015, the Financial Accounting Standards Board issued an Accounting Standards Update, ASU 2015-07 (the “ASU”) which removes the requirement to categorize within the fair value hierarchy all investments for which fair value is measured using the net asset value per share practical expedient. The ASU also removes the requirement to make certain disclosures for investments that are eligible to be measured at fair value using the net asset value per share practical expedient but do not utilize that practical expedient. The ASU is effective for annual periods beginning after December 15, 2015 and interim periods within those annual periods. Management has evaluated the implications of these changes and there will be no impact to the financial statements.
NOTE J
Other
In October 2016, the U.S. Securities and Exchange Commission adopted new rules and amended existing rules (together, “final rules”) intended to modernize the reporting and disclosure of information by registered investment companies. In part, the final rules amend Regulation S-X and require standardized, enhanced disclosure about derivatives in investment company financial statements, as well as other amendments. The compliance date for the amendments to Regulation S-X is August 1, 2017. Management is currently evaluating the impact that the adoption of the amendments to Regulation S-X will have on the financial statements and related disclosures.
NOTE K
Subsequent Events
Management has evaluated subsequent events for possible recognition or disclosure in the financial statements through the date the financial statements are issued. Management has determined that there are no material events that would require disclosure in the Portfolio’s financial statements through this date.
| 82 | • AB INTERMEDIATE BOND PORTFOLIO |
Notes to Financial Statements
FINANCIAL HIGHLIGHTS
Selected Data For A Share Of Capital Stock Outstanding Throughout Each Period
| Class A | ||||||||||||||||||||
| Year Ended October 31, | ||||||||||||||||||||
| 2016 | 2015 | 2014 | 2013 | 2012 | ||||||||||||||||
|
| |||||||||||||||||||
Net asset value, beginning of period | $ 11.06 | $ 11.24 | $ 11.00 | $ 11.40 | $ 11.04 | |||||||||||||||
|
| |||||||||||||||||||
Income From Investment Operations | ||||||||||||||||||||
Net investment income(a)(b) | .26 | .28 | .35 | .26 | .26 | |||||||||||||||
Net realized and unrealized gain (loss) on investment and foreign currency transactions | .27 | (.12 | ) | .23 | (.35 | ) | .41 | # | ||||||||||||
Contributions from Affiliates | – 0 | – | – 0 | – | – 0 | – | – 0 | – | .01 | # | ||||||||||
|
| |||||||||||||||||||
Net increase (decrease) in net asset value from operations | .53 | .16 | .58 | (.09 | ) | .68 | ||||||||||||||
|
| |||||||||||||||||||
Less: Dividends | ||||||||||||||||||||
Dividends from net investment income | (.36 | ) | (.34 | ) | (.34 | ) | (.31 | ) | (.32 | ) | ||||||||||
|
| |||||||||||||||||||
Net asset value, end of period | $ 11.23 | $ 11.06 | $ 11.24 | $ 11.00 | $ 11.40 | |||||||||||||||
|
| |||||||||||||||||||
Total Return | ||||||||||||||||||||
Total investment return based on net asset value(c) | 4.93 | % | 1.45 | % | 5.34 | %* | (.81 | )%† | 6.27 | % | ||||||||||
Ratios/Supplemental Data | ||||||||||||||||||||
Net assets, end of period (000’s omitted) | $245,683 | $252,965 | $273,962 | $301,764 | $370,672 | |||||||||||||||
Ratio to average net assets of: | ||||||||||||||||||||
Expenses, net of waivers/reimbursements | .85 | % | .88 | % | .90 | % | .89 | % | .85 | % | ||||||||||
Expenses, before waivers/reimbursements | 1.03 | % | 1.06 | % | 1.06 | % | 1.02 | % | .99 | % | ||||||||||
Net investment income(b) | 2.35 | % | 2.51 | % | 3.15 | % | 2.32 | % | 2.29 | % | ||||||||||
Portfolio turnover rate** | 128 | % | 198 | % | 221 | % | 189 | % | 110 | % | ||||||||||
See footnote summary on page 90.
| AB INTERMEDIATE BOND PORTFOLIO • | 83 |
Financial Highlights
Selected Data For A Share Of Capital Stock Outstanding Throughout Each Period
| Class B | ||||||||||||||||||||
| Year Ended October 31, | ||||||||||||||||||||
| 2016 | 2015 | 2014 | 2013 | 2012 | ||||||||||||||||
|
| |||||||||||||||||||
Net asset value, beginning of period | $ 11.06 | $ 11.24 | $ 11.00 | $ 11.41 | $ 11.05 | |||||||||||||||
|
| |||||||||||||||||||
Income From Investment Operations | ||||||||||||||||||||
Net investment income(a)(b) | .18 | .20 | .28 | .18 | .18 | |||||||||||||||
Net realized and unrealized gain (loss) on investment and foreign currency transactions | .27 | (.12 | ) | .22 | (.36 | ) | .42 | # | ||||||||||||
Contributions from Affiliates | – 0 | – | – 0 | – | – 0 | – | – 0 | – | .01 | # | ||||||||||
|
| |||||||||||||||||||
Net increase (decrease) in net asset value from operations | .45 | .08 | .50 | (.18 | ) | .61 | ||||||||||||||
|
| |||||||||||||||||||
Less: Dividends | ||||||||||||||||||||
Dividends from net investment income | (.28 | ) | (.26 | ) | (.26 | ) | (.23 | ) | (.25 | ) | ||||||||||
|
| |||||||||||||||||||
Net asset value, end of period | $ 11.23 | $ 11.06 | $ 11.24 | $ 11.00 | $ 11.41 | |||||||||||||||
|
| |||||||||||||||||||
Total Return | ||||||||||||||||||||
Total investment return based on net asset value(c) | 4.15 | % | .72 | % | 4.61 | %* | (1.59 | )%† | 5.56 | % | ||||||||||
Ratios/Supplemental Data | ||||||||||||||||||||
Net assets, end of period (000’s omitted) | $1,106 | $1,692 | $3,017 | $5,348 | $9,089 | |||||||||||||||
Ratio to average net assets of: | ||||||||||||||||||||
Expenses, net of waivers/reimbursements | 1.60 | % | 1.60 | % | 1.60 | % | 1.58 | % | 1.55 | % | ||||||||||
Expenses, before waivers/reimbursements | 1.81 | % | 1.80 | % | 1.78 | % | 1.74 | % | 1.74 | % | ||||||||||
Net investment income(b) | 1.59 | % | 1.77 | % | 2.48 | % | 1.59 | % | 1.59 | % | ||||||||||
Portfolio turnover rate** | 128 | % | 198 | % | 221 | % | 189 | % | 110 | % | ||||||||||
See footnote summary on page 90.
| 84 | • AB INTERMEDIATE BOND PORTFOLIO |
Financial Highlights
Selected Data For A Share Of Capital Stock Outstanding Throughout Each Period
| Class C | ||||||||||||||||||||
| Year Ended October 31, | ||||||||||||||||||||
| 2016 | 2015 | 2014 | 2013 | 2012 | ||||||||||||||||
|
| |||||||||||||||||||
Net asset value, beginning of period | $ 11.04 | $ 11.22 | $ 10.98 | $ 11.38 | $ 11.02 | |||||||||||||||
|
| |||||||||||||||||||
Income From Investment Operations | ||||||||||||||||||||
Net investment income(a)(b) | .18 | .20 | .27 | .18 | .18 | |||||||||||||||
Net realized and unrealized gain (loss) on investment and foreign currency transactions | .27 | (.12 | ) | .23 | (.35 | ) | .41 | # | ||||||||||||
Contributions from Affiliates | – 0 | – | – 0 | – | – 0 | – | – 0 | – | .01 | # | ||||||||||
|
| |||||||||||||||||||
Net increase (decrease) in net asset value from operations | .45 | .08 | .50 | (.17 | ) | .60 | ||||||||||||||
|
| |||||||||||||||||||
Less: Dividends | ||||||||||||||||||||
Dividends from net investment income | (.28 | ) | (.26 | ) | (.26 | ) | (.23 | ) | (.24 | ) | ||||||||||
|
| |||||||||||||||||||
Net asset value, end of period | $ 11.21 | $ 11.04 | $ 11.22 | $ 10.98 | $ 11.38 | |||||||||||||||
|
| |||||||||||||||||||
Total Return | ||||||||||||||||||||
Total investment return based on net asset value(c) | 4.16 | % | .73 | % | 4.63 | %* | (1.51 | )%† | 5.55 | % | ||||||||||
Ratios/Supplemental Data | ||||||||||||||||||||
Net assets, end of period (000’s omitted) | $41,886 | $40,928 | $42,690 | $47,530 | $61,224 | |||||||||||||||
Ratio to average net assets of: | ||||||||||||||||||||
Expenses, net of waivers/reimbursements | 1.60 | % | 1.60 | % | 1.60 | % | 1.59 | % | 1.55 | % | ||||||||||
Expenses, before waivers/reimbursements | 1.78 | % | 1.78 | % | 1.77 | % | 1.73 | % | 1.70 | % | ||||||||||
Net investment income(b) | 1.60 | % | 1.79 | % | 2.46 | % | 1.62 | % | 1.60 | % | ||||||||||
Portfolio turnover rate** | 128 | % | 198 | % | 221 | % | 189 | % | 110 | % | ||||||||||
See footnote summary on page 90.
| AB INTERMEDIATE BOND PORTFOLIO • | 85 |
Financial Highlights
Selected Data For A Share Of Capital Stock Outstanding Throughout Each Period
| Advisor Class | ||||||||||||||||||||
| Year Ended October 31, | ||||||||||||||||||||
| 2016 | 2015 | 2014 | 2013 | 2012 | ||||||||||||||||
|
| |||||||||||||||||||
Net asset value, beginning of period | $ 11.06 | $ 11.24 | $ 11.00 | $ 11.41 | $ 11.05 | |||||||||||||||
|
| |||||||||||||||||||
Income From Investment Operations | ||||||||||||||||||||
Net investment income(a)(b) | .29 | .31 | .39 | .29 | .29 | |||||||||||||||
Net realized and unrealized gain (loss) on investment and foreign currency transactions | .28 | (.12 | ) | .22 | (.36 | ) | .41 | # | ||||||||||||
Contributions from Affiliates | – 0 | – | – 0 | – | – 0 | – | – 0 | – | .01 | # | ||||||||||
|
| |||||||||||||||||||
Net increase (decrease) in net asset value from operations | .57 | .19 | .61 | (.07 | ) | .71 | ||||||||||||||
|
| |||||||||||||||||||
Less: Dividends | ||||||||||||||||||||
Dividends from net investment income | (.39 | ) | (.37 | ) | (.37 | ) | (.34 | ) | (.35 | ) | ||||||||||
|
| |||||||||||||||||||
Net asset value, end of period | $ 11.24 | $ 11.06 | $ 11.24 | $ 11.00 | $ 11.41 | |||||||||||||||
|
| |||||||||||||||||||
Total Return | ||||||||||||||||||||
Total investment return based on net asset value(c) | 5.29 | % | 1.73 | % | 5.65 | %* | (.61 | )%† | 6.59 | % | ||||||||||
Ratios/Supplemental Data | ||||||||||||||||||||
Net assets, end of period (000’s omitted) | $56,068 | $22,705 | $26,352 | $73,445 | $94,584 | |||||||||||||||
Ratio to average net assets of: | ||||||||||||||||||||
Expenses, net of waivers/reimbursements | .60 | % | .60 | % | .60 | % | .59 | % | .55 | % | ||||||||||
Expenses, before waivers/reimbursements | .78 | % | .77 | % | .75 | % | .72 | % | .69 | % | ||||||||||
Net investment income(b) | 2.60 | % | 2.78 | % | 3.51 | % | 2.60 | % | 2.59 | % | ||||||||||
Portfolio turnover rate** | 128 | % | 198 | % | 221 | % | 189 | % | 110 | % | ||||||||||
See footnote summary on page 90.
| 86 | • AB INTERMEDIATE BOND PORTFOLIO |
Financial Highlights
Selected Data For A Share Of Capital Stock Outstanding Throughout Each Period
| Class R | ||||||||||||||||||||
| Year Ended October 31, | ||||||||||||||||||||
| 2016 | 2015 | 2014 | 2013 | 2012 | ||||||||||||||||
|
| |||||||||||||||||||
Net asset value, beginning of period | $ 11.06 | $ 11.24 | $ 11.00 | $ 11.40 | $ 11.04 | |||||||||||||||
|
| |||||||||||||||||||
Income From Investment Operations | ||||||||||||||||||||
Net investment income(a)(b) | .23 | .26 | .33 | .24 | .23 | |||||||||||||||
Net realized and unrealized gain (loss) on investment and foreign currency transactions | .28 | (.12 | ) | .23 | (.36 | ) | .42 | # | ||||||||||||
Contributions from Affiliates | – 0 | – | – 0 | – | – 0 | – | – 0 | – | .01 | # | ||||||||||
|
| |||||||||||||||||||
Net increase (decrease) in net asset value from operations | .51 | .14 | .56 | (.12 | ) | .66 | ||||||||||||||
|
| |||||||||||||||||||
Less: Dividends | ||||||||||||||||||||
Dividends from net investment income | (.34 | ) | (.32 | ) | (.32 | ) | (.28 | ) | (.30 | ) | ||||||||||
|
| |||||||||||||||||||
Net asset value, end of period | $ 11.23 | $ 11.06 | $ 11.24 | $ 11.00 | $ 11.40 | |||||||||||||||
|
| |||||||||||||||||||
Total Return | ||||||||||||||||||||
Total investment return based on net asset value(c) | 4.67 | % | 1.23 | % | 5.13 | %* | (1.01 | )%† | 6.05 | % | ||||||||||
Ratios/Supplemental Data | ||||||||||||||||||||
Net assets, end of period (000’s omitted) | $3,023 | $2,936 | $2,368 | $2,241 | $1,568 | |||||||||||||||
Ratio to average net assets of: | ||||||||||||||||||||
Expenses, net of waivers/reimbursements | 1.10 | % | 1.10 | % | 1.10 | % | 1.09 | % | 1.05 | % | ||||||||||
Expenses, before waivers/reimbursements | 1.38 | % | 1.38 | % | 1.36 | % | 1.31 | % | 1.29 | % | ||||||||||
Net investment income(b) | 2.10 | % | 2.29 | % | 2.94 | % | 2.13 | % | 2.07 | % | ||||||||||
Portfolio turnover rate** | 128 | % | 198 | % | 221 | % | 189 | % | 110 | % | ||||||||||
See footnote summary on page 90.
| AB INTERMEDIATE BOND PORTFOLIO • | 87 |
Financial Highlights
Selected Data For A Share Of Capital Stock Outstanding Throughout Each Period
| Class K | ||||||||||||||||||||
| Year Ended October 31, | ||||||||||||||||||||
| 2016 | 2015 | 2014 | 2013 | 2012 | ||||||||||||||||
|
| |||||||||||||||||||
Net asset value, beginning of period | $ 11.07 | $ 11.24 | $ 11.01 | $ 11.41 | $ 11.05 | |||||||||||||||
|
| |||||||||||||||||||
Income From Investment Operations | ||||||||||||||||||||
Net investment income(a)(b) | .26 | .28 | .35 | .27 | .26 | |||||||||||||||
Net realized and unrealized gain (loss) on investment and foreign currency transactions | .27 | (.10 | ) | .22 | (.36 | ) | .42 | # | ||||||||||||
Contributions from Affiliates | – 0 | – | – 0 | – | – 0 | – | – 0 | – | .01 | # | ||||||||||
|
| |||||||||||||||||||
Net increase (decrease) in net asset value from operations | .53 | .18 | .57 | (.09 | ) | .69 | ||||||||||||||
|
| |||||||||||||||||||
Less: Dividends | ||||||||||||||||||||
Dividends from net investment income | (.36 | ) | (.35 | ) | (.34 | ) | (.31 | ) | (.33 | ) | ||||||||||
|
| |||||||||||||||||||
Net asset value, end of period | $ 11.24 | $ 11.07 | $ 11.24 | $ 11.01 | $ 11.41 | |||||||||||||||
|
| |||||||||||||||||||
Total Return | ||||||||||||||||||||
Total investment return based on net asset value(c) | 4.93 | % | 1.57 | % | 5.30 | %* | (.76 | )%† | 6.32 | % | ||||||||||
Ratios/Supplemental Data | ||||||||||||||||||||
Net assets, end of period (000’s omitted) | $5,706 | $3,922 | $4,515 | $3,459 | $3,823 | |||||||||||||||
Ratio to average net assets of: | ||||||||||||||||||||
Expenses, net of waivers/reimbursements | .85 | % | .85 | % | .85 | % | .84 | % | .80 | % | ||||||||||
Expenses, before waivers/reimbursements | 1.09 | % | 1.08 | % | 1.03 | % | .93 | % | .99 | % | ||||||||||
Net investment income(b) | 2.34 | % | 2.53 | % | 3.17 | % | 2.38 | % | 2.34 | % | ||||||||||
Portfolio turnover rate** | 128 | % | 198 | % | 221 | % | 189 | % | 110 | % | ||||||||||
See footnote summary on page 90.
| 88 | • AB INTERMEDIATE BOND PORTFOLIO |
Financial Highlights
Selected Data For A Share Of Capital Stock Outstanding Throughout Each Period
| Class I | ||||||||||||||||||||
| Year Ended October 31, | ||||||||||||||||||||
| 2016 | 2015 | 2014 | 2013 | 2012 | ||||||||||||||||
|
| |||||||||||||||||||
Net asset value, beginning of period | $ 11.07 | $ 11.25 | $ 11.01 | $ 11.42 | $ 11.06 | |||||||||||||||
|
| |||||||||||||||||||
Income From Investment Operations | ||||||||||||||||||||
Net investment income(a)(b) | .28 | .31 | .36 | .18 | .29 | |||||||||||||||
Net realized and unrealized gain (loss) on investment and foreign currency transactions | .28 | (.12 | ) | .25 | (.25 | ) | .41 | # | ||||||||||||
Contributions from Affiliates | – 0 | – | – 0 | – | – 0 | – | – 0 | – | .01 | # | ||||||||||
|
| |||||||||||||||||||
Net increase (decrease) in net asset value from operations | .56 | .19 | .61 | (.07 | ) | .71 | ||||||||||||||
|
| |||||||||||||||||||
Less: Dividends | ||||||||||||||||||||
Dividends from net investment income | (.39 | ) | (.37 | ) | (.37 | ) | (.34 | ) | (.35 | ) | ||||||||||
|
| |||||||||||||||||||
Net asset value, end of period | $ 11.24 | $ 11.07 | $ 11.25 | $ 11.01 | $ 11.42 | |||||||||||||||
|
| |||||||||||||||||||
Total Return | ||||||||||||||||||||
Total investment return based on net asset value(c) | 5.20 | % | 1.73 | % | 5.65 | %* | (.62 | )%† | 6.58 | % | ||||||||||
Ratios/Supplemental Data | ||||||||||||||||||||
Net assets, end of period (000’s omitted) | $2,613 | $511 | $107 | $14 | $814 | |||||||||||||||
Ratio to average net assets of: | ||||||||||||||||||||
Expenses, net of waivers/reimbursements | .60 | % | .60 | % | .60 | % | .56 | % | .55 | % | ||||||||||
Expenses, before waivers/reimbursements | .76 | % | .75 | % | .75 | % | .67 | % | .66 | % | ||||||||||
Net investment income(b) | 2.56 | % | 2.74 | % | 3.22 | % | 2.46 | % | 2.59 | % | ||||||||||
Portfolio turnover rate** | 128 | % | 198 | % | 221 | % | 189 | % | 110 | % | ||||||||||
See footnote summary on page 90.
| AB INTERMEDIATE BOND PORTFOLIO • | 89 |
Financial Highlights
Selected Data For A Share Of Capital Stock Outstanding Throughout Each Period
| Class Z | ||||||||||||
| Year Ended October 31, | April 28, 2014 | |||||||||||
| 2016 | 2015 | |||||||||||
|
| |||||||||||
Net asset value, beginning of period | $ 11.08 | $ 11.26 | $ 11.15 | |||||||||
|
| |||||||||||
Income From Investment Operations | ||||||||||||
Net investment income(a)(b) | .28 | .32 | .19 | |||||||||
Net realized and unrealized gain (loss) on investment and foreign currency transactions | .29 | (.13 | ) | .10 | ||||||||
|
| |||||||||||
Net increase in net asset value from operations | .57 | .19 | .29 | |||||||||
|
| |||||||||||
Less: Dividends | ||||||||||||
Dividends from net investment income | (.39 | ) | (.37 | ) | (.18 | ) | ||||||
|
| |||||||||||
Net asset value, end of period | $ 11.26 | $ 11.08 | $ 11.26 | |||||||||
|
| |||||||||||
Total Return | ||||||||||||
Total investment return based on net asset value(c) | 5.28 | % | 1.72 | % | 2.61 | % | ||||||
Ratios/Supplemental Data | ||||||||||||
Net assets, end of period (000’s omitted) | $18,134 | $4,851 | $10 | |||||||||
Ratio to average net assets of: | ||||||||||||
Expenses, net of waivers/reimbursements | .60 | % | .60 | % | .60 | %^ | ||||||
Expenses, before waivers/reimbursements | .66 | % | .71 | % | .66 | %^ | ||||||
Net investment income(b) | 2.52 | % | 2.91 | % | 3.29 | %^ | ||||||
Portfolio turnover rate** | 128 | % | 198 | % | 221 | % | ||||||
| (a) | Based on average shares outstanding. |
| (b) | Net of fees waived and expenses reimbursed by the Adviser. |
| (c) | Total investment return is calculated assuming an initial investment made at the net asset value at the beginning of the period, reinvestment of all dividends and distributions at net asset value during the period, and redemption on the last day of the period. Initial sales charges or contingent deferred sales charges are not reflected in the calculation of total investment return. Total return does not reflect the deduction of taxes that a shareholder would pay on portfolio distributions or the redemption of portfolio shares. Total investment return calculated for a period of less than one year is not annualized. |
| (d) | Commencement of operations. |
| # | Amount reclassified from realized gain (loss) on investment transactions. |
| * | Includes the impact of proceeds received and credited to the Portfolio resulting from class action settlements, which enhanced the Portfolio’s performance for the year ended October 31, 2014 by 0.01%. |
| † | Includes the impact of proceeds received and credited to the Portfolio resulting from third party regulatory settlements, which enhanced the Portfolio’s performance for the year ended October 31, 2013 by 0.14%. |
| Includes the Adviser’s reimbursement in respect of the Lehman Bankruptcy Claim which contributed to the Portfolio’s performance by 0.07% for the year-ended October 31, 2012. |
| ** | The Portfolio accounts for dollar roll transactions as purchases and sales. |
| ^ | Annualized. |
See notes to financial statements.
| 90 | • AB INTERMEDIATE BOND PORTFOLIO |
Financial Highlights
REPORT OF INDEPENDENT REGISTERED
PUBLIC ACCOUNTING FIRM
To the Board of Directors and Shareholders
of AB Intermediate Bond Portfolio
We have audited the accompanying statement of assets and liabilities, including the portfolio of investments, of AB Intermediate Bond Portfolio (the “Fund”), one of the portfolios constituting the AB Bond Fund, Inc., as of October 31, 2016, and the related statement of operations for the year then ended, the statements of changes in net assets for each of the two years in the period then ended, and the financial highlights for each of the periods presented therein. These financial statements and financial highlights are the responsibility of the Fund’s management. Our responsibility is to express an opinion on these financial statements and financial highlights based on our audits.
We conducted our audits in accordance with the standards of the Public Company Accounting Oversight Board (United States). Those standards require that we plan and perform the audit to obtain reasonable assurance about whether the financial statements and financial highlights are free of material misstatement. We were not engaged to perform an audit of the Fund’s internal control over financial reporting. Our audits included consideration of internal control over financial reporting as a basis for designing audit procedures that are appropriate in the circumstances, but not for the purpose of expressing an opinion on the effectiveness of the Fund’s internal control over financial reporting. Accordingly, we express no such opinion. An audit also includes examining, on a test basis, evidence supporting the amounts and disclosures in the financial statements and financial highlights, assessing the accounting principles used and significant estimates made by management, and evaluating the overall financial statement presentation. Our procedures included confirmation of securities owned as of October 31, 2016, by correspondence with the custodian and others, or by other appropriate auditing procedures where replies from others were not received. We believe that our audits provide a reasonable basis for our opinion.
In our opinion, the financial statements and financial highlights referred to above present fairly, in all material respects, the financial position of AB Intermediate Bond Portfolio (one of the portfolios constituting the AB Bond Fund, Inc.) at October 31, 2016, the results of its operations for the year then ended, the changes in its net assets for each of the two years in the period then ended, and the financial highlights for each of the periods presented therein, in conformity with U.S. generally accepted accounting principles.

New York, New York
December 29, 2016
| AB INTERMEDIATE BOND PORTFOLIO • | 91 |
Report of Independent Registered Public Accounting Firm
2016 FEDERAL TAX INFORMATION
(unaudited)
For Federal income tax purposes, the following information is furnished with respect to the distributions paid by the Portfolio during the taxable year ended October 31, 2016. For foreign shareholders, 72.15% of ordinary income dividends paid may be considered to be qualifying to be taxed as interest-related dividends.
For the taxable year ended October 31, 2016, the Portfolio designates $88,903 as the maximum amount that may be considered qualified dividend income for individual shareholders.
Shareholders should not use the above information to prepare their income tax returns. The information necessary to complete your income tax returns will be included with your Form 1099-DIV which will be sent to you separately in January 2017.
| 92 | • AB INTERMEDIATE BOND PORTFOLIO |
BOARD OF DIRECTORS
Marshall C. Turner, Jr.(1), Chairman John H. Dobkin(1) Michael J. Downey(1) William H. Foulk, Jr.(1) D. James Guzy(1) | Nancy P. Jacklin(1) Robert M. Keith, President and Chief Executive Officer Carol C. McMullen(1) Garry L. Moody(1) Earl D. Weiner(1) |
OFFICERS
Philip L. Kirstein, Senior Vice President and Independent Compliance Officer Paul J. DeNoon(2), Vice President Shawn E. Keegan(2) , Vice President Douglas J. Peebles(2) , Vice President | Greg J. Wilensky(2), Vice President Michael S. Canter(2), Vice President Emilie D. Wrapp, Secretary Joseph J. Mantineo, Treasurer and Chief Financial Officer Phyllis J. Clarke, Controller Vincent S. Noto, Chief Compliance Officer |
Custodian and Accounting Agent State Street Bank and Trust Company State Street Corporation CCB/5 1 Iron Street Boston, MA 02210
Principal Underwriter AllianceBernstein Investments, Inc. 1345 Avenue of the Americas New York, NY 10105
Transfer Agent AllianceBernstein Investor Services, Inc. P.O. Box 786003 San Antonio, TX 78278-6003 Toll-Free (800) 221-5672 | Independent Registered Public Ernst & Young LLP 5 Times Square New York, NY 10036
Legal Counsel Seward & Kissel LLP One Battery Park Plaza New York, NY 10004 |
| (1) | Member of the Audit Committee, the Governance and Nominating Committee, and the Independent Directors Committee. |
| (2) | The day-to-day management of, and investment decisions for, the Fund’s portfolio are made by the Adviser’s U.S. Investment Grade Core Fixed Income Team. Mr. Paul J. DeNoon, Mr. Shawn E. Keegan, Mr. Douglas J. Peebles, Mr. Greg J. Wilensky and Mr. Michael S. Canter are the investment professionals with the most significant responsibility for the day-to-day management of the Fund’s portfolio. |
| AB INTERMEDIATE BOND PORTFOLIO • | 93 |
Board of Directors
MANAGEMENT OF THE FUND
Board of Directors Information
The business and affairs of the Fund are managed under the direction of the Board of Directors. Certain information concerning the Fund’s Directors is set forth below.
NAME, ADDRESS* AND AGE (YEAR FIRST ELECTED**) | PRINCIPAL DURING PAST FIVE YEARS | PORTFOLIOS IN FUND COMPLEX OVERSEEN BY DIRECTOR | OTHER PUBLIC COMPANY DIRECTORSHIPS CURRENTLY HELD BY DIRECTOR | |||||
| INTERESTED DIRECTOR | ||||||||
Robert M. Keith, + 1345 Avenue of the Americas New York, NY 10105 56 (2010) | Senior Vice President of AllianceBernstein L.P. (the “Adviser”) and head of AllianceBernstein Investments, Inc. (“ABI”) since July 2008; Director of ABI and President of the AB Mutual Funds. Previously, he served as Executive Managing Director of ABI from December 2006 to June 2008. Prior to joining ABI in 2006, Executive Managing Director of Bernstein Global Wealth Management, and prior thereto, Senior Managing Director and Global Head of Client Service and Sales of the Adviser’s institutional investment management business since 2004. Prior thereto, he was Managing Director and Head of North American Client Service and Sales in the Adviser’s institutional investment management business, with which he had been associated since prior to 2004. | 108 | None | |||||
| 94 | • AB INTERMEDIATE BOND PORTFOLIO |
Management of the Fund
NAME, ADDRESS* AND AGE (YEAR FIRST ELECTED**) | PRINCIPAL DURING PAST FIVE YEARS | PORTFOLIOS IN FUND COMPLEX OVERSEEN BY DIRECTOR | OTHER PUBLIC COMPANY DIRECTORSHIPS CURRENTLY HELD BY DIRECTOR | |||||
| DISINTERESTED DIRECTORS | ||||||||
Marshall C. Turner, Jr., # Chairman of the Board 75 (2005) | Private Investor since prior to 2011. Former Chairman and CEO of Dupont Photomasks, Inc. (components of semi-conductor manufacturing). He has extensive operating leadership and venture capital investing experience, including five interim or full-time CEO roles, and prior service as general partner of institutional venture capital partnerships. He also has extensive non-profit board leadership experience, and currently serves on the boards of two education and science-related non-profit organizations. He has served as a director of one AB Fund since 1992, and director or trustee of multiple AB Funds since 2005. He has been Chairman of the AB Funds since January 2014, and the Chairman of the Independent Directors Committees of such AB Funds since February 2014. | 108 | Xilinx, Inc. (programmable logic semi-conductors) since 2007 | |||||
John H. Dobkin, # 74 (1998) | Independent Consultant since prior to 2011. Formerly, President of Save Venice, Inc. (preservation organization) from 2001-2002; Senior Advisor from June 1999-June 2000 and President of Historic Hudson Valley (historic preservation) from December 1989-May 1999. Previously, Director of the National Academy of Design. He has served as a director or trustee of various AB Funds since 1992, and as Chairman of the Audit Committees of a number of such AB Funds from 2001-2008. | 108 | None | |||||
| AB INTERMEDIATE BOND PORTFOLIO • | 95 |
Management of the Fund
NAME, ADDRESS* AND AGE (YEAR FIRST ELECTED**) | PRINCIPAL DURING PAST FIVE YEARS | PORTFOLIOS IN FUND COMPLEX OVERSEEN BY DIRECTOR | OTHER PUBLIC COMPANY DIRECTORSHIPS CURRENTLY HELD BY DIRECTOR | |||||
| DISINTERESTED DIRECTORS (continued) | ||||||||
Michael J. Downey, # 72 (2005) | Private Investor since prior to 2011. Formerly, managing partner of Lexington Capital, LLC (investment advisory firm) from December 1997 until December 2003. He served as a Director of Prospect Acquisition Corp. (financial services) from 2007 until 2009. From 1987 until 1993, Chairman and CEO of Prudential Mutual Fund Management, director of the Prudential mutual funds, and member of the Executive Committee of Prudential Securities Inc. He has served as a director or trustee of the AB Funds since 2005 and is a director and Chairman of one other registered investment company. | 108 | Asia Pacific Fund, Inc. (registered investment company) since prior to 2011 | |||||
William H. Foulk, Jr., # 84 (1998) | Investment Adviser and an Independent Consultant since prior to 2011. Previously, he was Senior Manager of Barrett Associates, Inc., a registered investment adviser. He was formerly Deputy Comptroller and Chief Investment Officer of the State of New York and, prior thereto, Chief Investment Officer of the New York Bank for Savings. He has served as a director or trustee of various AB Funds since 1983, and was Chairman of the Independent Directors Committees of the AB Funds from 2003 until early February 2014. He served as Chairman of such AB Funds from 2003 through December 2013. He is also active in a number of mutual fund related organizations and committees. | 108 | None | |||||
| 96 | • AB INTERMEDIATE BOND PORTFOLIO |
Management of the Fund
NAME, ADDRESS* AND AGE (YEAR FIRST ELECTED**) | PRINCIPAL DURING PAST FIVE YEARS | PORTFOLIOS IN FUND COMPLEX OVERSEEN BY DIRECTOR | OTHER PUBLIC COMPANY DIRECTORSHIPS CURRENTLY HELD BY DIRECTOR | |||||
| DISINTERESTED DIRECTORS (continued) | ||||||||
D. James Guzy, # 80 (2005) | Chairman of the Board of SRC Computers, Inc. (semi-conductors), with which he has been associated since prior to 2011. He served as Chairman of the Board of PLX Technology (semi-conductors) since prior to 2011 until November 2013. He was a Director of Intel Corporation (semi-conductors) from 1969 until 2008, and served as Chairman of the Finance Committee of such company for several years until May 2008. He has served as a director or trustee of one or more of the AB Funds since 1982. | 108 | None | |||||
Nancy P. Jacklin, # 68 (2006) | Private Investor since prior to 2011. Professorial Lecturer at the Johns Hopkins School of Advanced International Studies (2008-2015). U.S. Executive Director of the International Monetary Fund (which is responsible for ensuring the stability of the international monetary system), (December 2002-May 2006); Partner, Clifford Chance (1992-2002); Sector Counsel, International Banking and Finance, and Associate General Counsel, Citicorp (1985-1992); Assistant General Counsel (International), Federal Reserve Board of Governors (1982-1985); and Attorney Advisor, U.S. Department of the Treasury (1973-1982). Member of the Bar of the District of Columbia and of New York; and member of the Council on Foreign Relations. She has served as a director or trustee of the AB Funds since 2006 and has been Chairman of the Governance and Nominating Committees of the AB Funds since August 2014. | 108 | None | |||||
| AB INTERMEDIATE BOND PORTFOLIO • | 97 |
Management of the Fund
NAME, ADDRESS* AND AGE (YEAR FIRST ELECTED**) | PRINCIPAL DURING PAST FIVE YEARS | PORTFOLIOS IN FUND COMPLEX OVERSEEN BY DIRECTOR | OTHER PUBLIC COMPANY DIRECTORSHIPS CURRENTLY HELD BY DIRECTOR | |||||
| DISINTERESTED DIRECTORS (continued) | ||||||||
Carol C. McMullen, # 61 (2016) | Managing Director of Slalom Consulting (consulting) since 2014 and private investor; Director of Norfolk & Dedham Group (mutual property and casualty insurance) since 2011; and Director of Partners Community Physicians Organization (healthcare) since 2014. Formerly, Managing Director of The Crossland Group (consulting) from 2012 to 2013. She has held a number of senior positions in the asset and wealth management industries, including at Eastern Bank (where her roles included President of Eastern Wealth Management), Thomson Financial (Global Head of Sales for Investment Management), and Putnam Investments (where her roles included Head of Global Investment Research). She has served on a number of private company and nonprofit boards, and as a director or trustee of the AB Funds since June 2016. | 108 | None | |||||
| 98 | • AB INTERMEDIATE BOND PORTFOLIO |
Management of the Fund
NAME, ADDRESS* AND AGE (YEAR FIRST ELECTED**) | PRINCIPAL DURING PAST FIVE YEARS | PORTFOLIOS IN FUND COMPLEX OVERSEEN BY DIRECTOR | OTHER PUBLIC COMPANY DIRECTORSHIPS CURRENTLY HELD BY DIRECTOR | |||||
| DISINTERESTED DIRECTORS (continued) | ||||||||
Garry L. Moody, # 64 (2008) | Independent Consultant. Formerly, Partner, Deloitte & Touche LLP (1995-2008) where he held a number of senior positions, including Vice Chairman, and U.S. and Global Investment Management Practice Managing Partner; President, Fidelity Accounting and Custody Services Company (1993-1995), where he was responsible for accounting, pricing, custody and reporting for the Fidelity mutual funds; and Partner, Ernst & Young LLP (1975-1993), where he served as the National Director of Mutual Fund Tax Services and Managing Partner of its Chicago Office Tax department. He is a member of the Trustee Advisory Board of BoardIQ, a biweekly publication focused on issues and news affecting directors of mutual funds. He has served as a director or trustee and as Chairman of the Audit Committees of the AB Funds since 2008. | 108 | None | |||||
Earl D. Weiner, # 77 (2007) | Of Counsel, and Partner prior to January 2007, of the law firm Sullivan & Cromwell LLP and is a former member of the ABA Federal Regulation of Securities Committee Task Force to draft editions of the Fund Director’s Guidebook. He also serves as a director or trustee of various non-profit organizations and has served as Chairman or Vice Chairman of a number of them. He has served as a director or trustee of the AB Funds since 2007 and served as Chairman of the Governance and Nominating Committees of the AB Funds from 2007 until August 2014. | 108 | None | |||||
| AB INTERMEDIATE BOND PORTFOLIO • | 99 |
Management of the Fund
| * | The address for each of the Fund’s disinterested Directors is c/o AllianceBernstein L.P., Attention: Philip L. Kirstein, 1345 Avenue of the Americas, New York, NY 10105. |
| ** | There is no stated term of office for the Fund’s Directors. |
| *** | The information above includes each Director’s principal occupation during the last five years and other information relating to the experience, attributes and skills relevant to each Director’s qualifications to serve as a Director, which led to the conclusion that each Director should serve as a Director for the Fund. |
| + | Mr. Keith is an “interested person” of the Fund as defined in the “40 Act”, due to his position as a Senior Vice President of the Adviser. |
| # | Member of the Audit Committee, the Governance and Nominating Committee and the Independent Directors Committee. |
| 100 | • AB INTERMEDIATE BOND PORTFOLIO |
Management of the Fund
Officer Information
Certain information concerning the Fund’s Officers is set forth below.
| NAME, ADDRESS* AND AGE | PRINCIPAL POSITION(S) HELD WITH FUND | PRINCIPAL OCCUPATION DURING PAST 5 YEARS | ||
Robert M. Keith 56 | President and Chief Executive Officer | See biography above. | ||
| Philip L. Kirstein 71 | Senior Vice President and Independent Compliance Officer | Senior Vice President and Independent Compliance Officer of the AB Funds, with which he has been associated since October 2004. Prior thereto, he was Of Counsel to Kirkpatrick & Lockhart, LLP from October 2003 to October 2004, and General Counsel of Merrill Lynch Investment Managers, L.P. since prior to March 2003. | ||
| Paul J. DeNoon 54 | Vice President | Senior Vice President of the Adviser**, with which he has been associated since prior to 2011. | ||
| Shawn E. Keegan 45 | Vice President | Vice President of the Adviser**, with which he has been associated since prior to 2011. | ||
| Douglas J. Peebles 51 | Vice President | Senior Vice President of the Adviser**, with which he has been associated since prior to 2011. | ||
| Greg J. Wilensky 49 | Vice President | Senior Vice President of the Adviser**, with which he has been associated since prior to 2011. | ||
| Michael S. Canter 47 | Vice President | Senior Vice President of the Adviser**, with which he has been associated since prior to 2011. | ||
| Emilie D. Wrapp 61 | Secretary | Senior Vice President, Assistant General Counsel and Assistant Secretary of ABI**, with which she has been associated since prior to 2011. | ||
| Joseph J. Mantineo 57 | Treasurer and Chief Financial Officer | Senior Vice President of AllianceBernstein Investor Services, Inc. (“ABIS”)**, with which he has been associated since prior to 2011. | ||
| Phyllis J. Clarke 55 | Controller | Vice President of ABIS**, with which she has been associated since prior to 2011. | ||
Vincent S. Noto 52 | Chief Compliance Officer | Senior Vice President since 2015 and Mutual Fund Chief Compliance Officer of the Adviser ** since 2014. Prior thereto, he was Vice President and Director of Mutual Fund Compliance of the Adviser** since 2011. |
| * | The address for each of the Fund’s Officers is 1345 Avenue of the Americas, New York, NY 10105. |
| ** | The Adviser, ABI and ABIS are affiliates of the Fund. |
| The Fund’s Statement of Additional Information (“SAI”) has additional information about the Fund’s Directors and Officers and is available without charge upon request. Contact your financial representative or AB at 1-800-227-4618, or visit www.ABfunds.com, for a free prospectus or SAI. |
| AB INTERMEDIATE BOND PORTFOLIO • | 101 |
Management of the Fund
Information Regarding the Review and Approval of the Portfolio’s Investment Advisory Contract
The disinterested directors (the “directors”) of AB Bond Fund, Inc. (the “Fund”) unanimously approved the continuance of the Fund’s Investment Advisory Contract (the “Advisory Agreement”) with the Adviser in respect of AB Intermediate Bond Portfolio (the “Portfolio”) at a meeting held on November 3-5, 2015.
Prior to approval of the continuance of the Advisory Agreement in respect of the Portfolio, the directors had requested from the Adviser, and received and evaluated, extensive materials. They reviewed the proposed continuance of the Advisory Agreement with the Adviser and with experienced counsel who are independent of the Adviser, who advised on the relevant legal standards. The directors also reviewed an independent evaluation prepared by the Fund’s Senior Officer (who is also the Fund’s Independent Compliance Officer) of the reasonableness of the advisory fee, in which the Senior Officer concluded that the contractual fee for the Portfolio was reasonable. The directors also discussed the proposed continuance in private sessions with counsel and the Fund’s Senior Officer.
The directors considered their knowledge of the nature and quality of the services provided by the Adviser to the Portfolio gained from their experience as directors or trustees of most of the registered investment companies advised by the Adviser, their overall confidence in the Adviser’s integrity and competence they have gained from that experience, the Adviser’s initiative in identifying and raising potential issues with the directors and its responsiveness, frankness and attention to concerns raised by the directors in the past, including the Adviser’s willingness to consider and implement organizational and operational changes designed to improve investment results and the services provided to the AB Funds. The directors noted that they have four regular meetings each year, at each of which they receive presentations from the Adviser on the investment results of the Portfolio and review extensive materials and information presented by the Adviser.
The directors also considered all other factors they believed relevant, including the specific matters discussed below. In their deliberations, the directors did not identify any particular information that was all-important or controlling, and different directors may have attributed different weights to the various factors. The directors determined that the selection of the Adviser to manage the Portfolio and the overall arrangements between the Portfolio and the Adviser, as provided in the Advisory Agreement, including the advisory fee, were fair and reasonable in light of the services performed, expenses incurred and such other matters as the directors considered relevant in the exercise of their
| 102 | • AB INTERMEDIATE BOND PORTFOLIO |
business judgment. The material factors and conclusions that formed the basis for the directors’ determinations included the following:
Nature, Extent and Quality of Services Provided
The directors considered the scope and quality of services provided by the Adviser under the Advisory Agreement, including the quality of the investment research capabilities of the Adviser and the other resources it has dedicated to performing services for the Portfolio. They noted the professional experience and qualifications of the Portfolio’s portfolio management team and other senior personnel of the Adviser. The directors also considered that the Advisory Agreement provides that the Portfolio will reimburse the Adviser for the cost to it of providing certain clerical, accounting, administrative and other services to the Portfolio by employees of the Adviser or its affiliates. Requests for these reimbursements are made on a quarterly basis and subject to approval by the directors. Reimbursements, to the extent requested and paid, result in a higher rate of total compensation from the Portfolio to the Adviser than the fee rate stated in the Portfolio’s Advisory Agreement. The directors noted that the methodology used to determine the reimbursement amounts had been reviewed by an independent consultant retained by the Fund’s Senior Officer. The quality of administrative and other services, including the Adviser’s role in coordinating the activities of the Portfolio’s other service providers, also was considered. The directors concluded that, overall, they were satisfied with the nature, extent and quality of services provided to the Portfolio under the Advisory Agreement.
Costs of Services Provided and Profitability
The directors reviewed a schedule of the revenues, expenses and related notes indicating the profitability of the Portfolio to the Adviser for calendar years 2013 and 2014 that had been prepared with an expense allocation methodology arrived at in consultation with an independent consultant retained by the Fund’s Senior Officer. The directors noted the assumptions and methods of allocation used by the Adviser in preparing fund-specific profitability data and understood that there are a number of potentially acceptable allocation methodologies for information of this type. The directors noted that the profitability information reflected all revenues and expenses of the Adviser’s relationship with the Portfolio, including those relating to its subsidiaries that provide transfer agency and distribution services to the Portfolio. The directors recognized that it is difficult to make comparisons of the profitability of the Advisory Agreement with the profitability of advisory contracts for unaffiliated funds because comparative information is not generally publicly available and is affected by numerous factors. The directors focused on the
| AB INTERMEDIATE BOND PORTFOLIO • | 103 |
profitability of the Adviser’s relationship with the Portfolio before taxes and distribution expenses. The directors were satisfied that the Adviser’s level of profitability from its relationship with the Portfolio was not unreasonable.
Fall-Out Benefits
The directors considered the other benefits to the Adviser and its affiliates from their relationships with the Portfolio, including, but not limited to, benefits relating to 12b-1 fees and sales charges received by the Fund’s principal underwriter (which is a wholly owned subsidiary of the Adviser) in respect of certain classes of the Portfolio’s shares and transfer agency fees paid by the Portfolio to a wholly owned subsidiary of the Adviser. The directors recognized that the Adviser’s profitability would be somewhat lower without these benefits. The directors understood that the Adviser also might derive reputational and other benefits from its association with the Portfolio.
Investment Results
In addition to the information reviewed by the directors in connection with the meeting, the directors receive detailed performance information for the Portfolio at each regular Board meeting during the year. At the November 2015 meeting, the directors reviewed information prepared by Broadridge showing the performance of the Class A Shares of the Portfolio as compared with that of a group of similar funds selected by Broadridge (the “Performance Group”) and as compared with that of a broad array of funds selected by Broadridge (the “Performance Universe”), and information prepared by the Adviser showing performance of the Class A Shares as compared with the Barclays U.S. Aggregate Bond Index (the “Index”), in each case for the 1-, 3-, 5- and 10-year periods ended July 31, 2015 and (in the case of comparisons with the Index) the period since inception (July 1999 inception). The directors noted that the Portfolio was in the 1st quintile of the Performance Group and 2nd quintile of the Performance Universe for the 1- and 5-year periods, in the 1st quintile of the Performance Group and the Performance Universe for the 3-year period, and in the 3rd quintile of the Performance Group and 2nd quintile of the Performance Universe for the 10-year period. It outperformed the Index in the 3- and 5-year periods and lagged it in all other periods. Based on their review, the directors concluded that the Portfolio’s performance was satisfactory.
Advisory Fees and Other Expenses
The directors considered the advisory fee rate paid by the Portfolio to the Adviser and information prepared by Broadridge concerning advisory fee rates paid by other funds in the same Broadridge category as the Portfolio at a common asset level. The directors recognized that it is difficult to
| 104 | • AB INTERMEDIATE BOND PORTFOLIO |
make comparisons of advisory fees because there are variations in the services that are included in the fees paid by other funds. The directors noted that, at the Portfolio’s current size, its contractual effective advisory fee rate of 45 basis points was lower than the Expense Group median. The directors noted that the administrative expense reimbursement was 1.5 basis points in the Portfolio’s latest fiscal year, and that as a result the rate of total compensation received by the Adviser pursuant to the Advisory Agreement was more than the Expense Group median.
The directors also considered the Adviser’s fee schedule for non-fund clients pursuing a similar investment style. For this purpose, they reviewed the relevant advisory fee information from the Adviser’s Form ADV and the evaluation from the Fund’s Senior Officer. The directors noted that the institutional fee schedule started at a rate higher than the Portfolio’s fee schedule and had breakpoints at lower asset levels. The application of the institutional fee schedule to the Portfolio’s net assets would result in a fee rate lower than the rate at the same asset level provided in the Portfolio’s Advisory Agreement. The directors noted that the Adviser may, in some cases, agree to fee rates with large institutional clients that are lower than those reviewed by the directors and that they had previously discussed with the Adviser its policies in respect of such arrangements. The directors also reviewed information that indicated that the Portfolio’s fee rate is higher than the sub-advisory fee rate earned by the Adviser for sub-advising a registered investment company with a similar investment style. The directors also noted that the Adviser advises a portfolio of another AB Fund with a substantially similar investment style for the same fee schedule as the Portfolio.
The Adviser reviewed with the directors the significantly greater scope of the services it provides to the Portfolio relative to institutional clients and sub-advised funds. The Adviser also noted that because mutual funds are constantly issuing and redeeming shares, they are more difficult to manage than an institutional account, where the assets tend to be relatively stable. In light of the substantial differences in services rendered by the Adviser to institutional clients as compared to funds such as the Portfolio, the directors considered these fee comparisons inapt and did not place significant weight on them in their deliberations.
The directors also considered the total expense ratio of the Class A shares of the Portfolio in comparison to the fees and expenses of funds within two comparison groups created by Broadridge: an Expense Group and an Expense Universe. Broadridge described an Expense Group as a representative sample of funds similar to the Portfolio and an Expense Universe as a broader group than the Expense Group, consisting of all funds in the investment classification/objective with a similar load type as the Portfolio. The Class A expense ratio of the Portfolio was based on the
| AB INTERMEDIATE BOND PORTFOLIO • | 105 |
Portfolio’s latest fiscal year and the information included the pro forma expense ratio to reflect a reduction in the 12b-1 fee effective June 1, 2015. The pro forma expense ratio of the Portfolio reflected fee waivers and/or expense reimbursements as a result of an undertaking by the Adviser. The directors noted that it was likely that the expense ratios of some of the other funds in the Portfolio’s Broadridge category also were lowered by waivers or reimbursements by those funds’ investment advisers, which in some cases might be voluntary or temporary. The directors view the expense ratio information as relevant to their evaluation of the Adviser’s services because the Adviser is responsible for coordinating services provided to the Portfolio by others.
The directors noted that the Portfolio’s pro forma total expense ratio, giving effect to a cap by the Adviser, was lower than the Expense Group median and close to the Expense Universe median. The directors concluded that the Portfolio’s pro forma expense ratio was satisfactory.
Economies of Scale
The directors noted that the advisory fee schedule for the Portfolio contains breakpoints that reduce the fee rates on assets above specified levels. The directors took into consideration prior presentations by an independent consultant on economies of scale in the mutual fund industry and for the AB Funds, and by the Adviser concerning certain of its views on economies of scale. The directors also had requested and received from the Adviser certain updates on economies of scale at the May 2015 meetings. The directors believe that economies of scale may be realized (if at all) by the Adviser across a variety of products and services, and not only in respect of a single fund. The directors noted that there is no established methodology for setting breakpoints that give effect to fund-specific services provided by a fund’s adviser and to the economies of scale that an adviser may realize in its overall mutual fund business or those components of it which directly or indirectly affect a fund’s operations. The directors observed that in the mutual fund industry as a whole, as well as among funds similar to the Portfolio, there is no uniformity or pattern in the fees and asset levels at which breakpoints (if any) apply. The directors also noted that the advisory agreements for many funds do not have breakpoints at all. Having taken these factors into account, the directors concluded that the Portfolio’s shareholders would benefit from a sharing of economies of scale in the event the Portfolio’s net assets exceed a breakpoint in the future.
| 106 | • AB INTERMEDIATE BOND PORTFOLIO |
THIS PAGE IS NOT PART OF THE SHAREHOLDER REPORT OR THE FINANCIAL STATEMENTS
AB FAMILY OF FUNDS
US EQUITY
US Core
Core Opportunities Fund
Select US Equity Portfolio
US Growth
Concentrated Growth Fund
Discovery Growth Fund
Growth Fund
Large Cap Growth Fund
Small Cap Growth Portfolio
US Value
Discovery Value Fund
Equity Income Fund
Growth & Income Fund
Small Cap Value Portfolio
Value Fund
INTERNATIONAL/ GLOBAL EQUITY
International/Global Core
Global Core Equity Portfolio
Global Equity & Covered Call Strategy Fund
International Portfolio
International Strategic Core Portfolio
Sustainable Global Thematic Fund*
Tax-Managed International Portfolio
International/Global Growth
International Growth Fund
International/Global Value
Asia ex-Japan Equity Portfolio
International Value Fund
FIXED INCOME
Municipal
High Income Municipal Portfolio
Intermediate California Municipal Portfolio
Intermediate Diversified Municipal Portfolio
Intermediate New York Municipal Portfolio
FIXED INCOME (continued)
Municipal Bond Inflation Strategy
Tax-Aware Fixed Income Portfolio
National Portfolio
Arizona Portfolio
California Portfolio
Massachusetts Portfolio
Michigan Portfolio
Minnesota Portfolio
New Jersey Portfolio
New York Portfolio
Ohio Portfolio
Pennsylvania Portfolio
Virginia Portfolio
Taxable
Bond Inflation Strategy
Global Bond Fund
High Income Fund
High Yield Portfolio
Income Fund
Intermediate Bond Portfolio
Limited Duration High Income Portfolio
Short Duration Portfolio
ALTERNATIVES
All Market Real Return Portfolio
Credit Long/Short Portfolio
Global Real Estate Investment Fund
Long/Short Multi-Manager Fund
Multi-Manager Alternative Strategies Fund
Select US Long/Short Portfolio
Unconstrained Bond Fund
MULTI-ASSET
All Market Income Portfolio
Emerging Markets Multi-Asset Portfolio
Global Risk Allocation Fund
MULTI-ASSET (continued)
Target-Date
Multi-Manager Select Retirement Allocation Fund
Multi-Manager Select 2010 Fund
Multi-Manager Select 2015 Fund
Multi-Manager Select 2020 Fund
Multi-Manager Select 2025 Fund
Multi-Manager Select 2030 Fund
Multi-Manager Select 2035 Fund
Multi-Manager Select 2040 Fund
Multi-Manager Select 2045 Fund
Multi-Manager Select 2050 Fund
Multi-Manager Select 2055 Fund
Wealth Strategies
Balanced Wealth Strategy
Conservative Wealth Strategy
Wealth Appreciation Strategy
Tax-Managed Balanced Wealth Strategy
Tax-Managed Wealth Appreciation Strategy
CLOSED-END FUNDS
AB Multi-Manager Alternative Fund
Alliance California Municipal Income Fund
AllianceBernstein Global High Income Fund
AllianceBernstein National Municipal Income Fund
We also offer Government Exchange Reserves, which serves as the money market fund exchange vehicle for the AB mutual funds. An investment in Government Exchange Reserves is not a deposit in a bank and is not insured or guaranteed by the Federal Deposit Insurance Corporation or any other government agency. Although the Fund seeks to preserve the value of your investment at $1.00 per share, it is possible to lose money by investing in the Fund.
Investors should consider the investment objectives, risks, charges and expenses of the Fund carefully before investing. For copies of our prospectus or summary prospectus, which contain this and other information, visit us online at www.abfunds.com or contact your AB representative. Please read the prospectus and/or summary prospectus carefully before investing.
* Prior to November 1, 2016, the Fund was named Global Thematic Growth Fund.
| AB INTERMEDIATE BOND PORTFOLIO • | 107 |
AB Family of Funds
NOTES
| AB INTERMEDIATE BOND PORTFOLIO • | 108 |
AB INTERMEDIATE BOND PORTFOLIO
1345 Avenue of the Americas
New York, NY 10105
800.221.5672
IB-0151-1016 
OCT 10.31.16

ANNUAL REPORT
AB MUNICIPAL BOND INFLATION STRATEGY
Investment Products Offered
•Are Not FDIC Insured •May Lose Value •Are Not Bank Guaranteed |
Investors should consider the investment objectives, risks, charges and expenses of the Fund carefully before investing. For copies of our prospectus or summary prospectus, which contain this and other information, visit us online at www.abfunds.com or contact your AB representative. Please read the prospectus and/or summary prospectus carefully before investing.
This shareholder report must be preceded or accompanied by the Fund’s prospectus for individuals who are not current shareholders of the Fund.
You may obtain a description of the Fund’s proxy voting policies and procedures, and information regarding how the Fund voted proxies relating to portfolio securities during the most recent 12-month period ended June 30, without charge. Simply visit AB’s website at www.abfunds.com, or go to the Securities and Exchange Commission’s (the “Commission”) website at www.sec.gov, or call AB at (800) 227-4618.
The Fund files its complete schedule of portfolio holdings with the Commission for the first and third quarters of each fiscal year on Form N-Q. The Fund’s Forms N-Q are available on the Commission’s website at www.sec.gov. The Fund’s Forms N-Q may also be reviewed and copied at the Commission’s Public Reference Room in Washington, DC; information on the operation of the Public Reference Room may be obtained by calling (800) SEC-0330. AB publishes full portfolio holdings for the Fund monthly at www.abfunds.com.
AllianceBernstein Investments, Inc. (ABI) is the distributor of the AB family of mutual funds. ABI is a member of FINRA and is an affiliate of AllianceBernstein L.P., the Adviser of the funds.
The [A/B] logo is a registered service mark of AllianceBernstein and AllianceBernstein® is a registered service mark used by permission of the owner, AllianceBernstein L.P.
December 15, 2016
Annual Report
This report provides management’s discussion of fund performance for AB Municipal Bond Inflation Strategy (the “Strategy”) for the annual period ended October 31, 2016.
Investment Objectives and Policies
The Strategy seeks to maximize real after-tax return for investors subject to federal income taxes, without undue risk to principal. Real return is the rate of return after adjusting for inflation. The Strategy pursues its objective by investing principally in high-quality, predominantly investment-grade, municipal securities that pay interest exempt from federal taxation. As a fundamental policy, the Strategy will invest at least 80% of its net assets in municipal securities. These securities may be subject to the federal alternative minimum tax for some taxpayers.
The Strategy will invest at least 80% of its total assets in fixed-income securities rated A or better or the equivalent by one or more national rating agencies or deemed to be of comparable credit quality by AllianceBernstein L.P. (“the Adviser”). In deciding whether to take direct or indirect exposure, the Strategy may invest up to 20% of its total assets in fixed-income securities rated BB or B or the equivalent by one or more national rating agencies (or deemed to be of comparable credit quality by the Adviser), which are not investment grade (“junk bonds”). If the rating
of a fixed-income security falls below investment grade, the Strategy will not be obligated to sell the security and may continue to hold it if, in the Adviser’s opinion, the investment is appropriate under the circumstances.
The Strategy may invest in fixed-income securities with any maturity and duration.
To provide inflation protection, the Strategy will typically enter into inflation swaps. The Strategy may use other inflation-indexed instruments. Payments to the Strategy pursuant to swaps will result in taxable income, either ordinary income or capital gains, rather than income exempt from federal income taxation. It is expected that the Strategy’s primary use of derivatives will be for the purpose of inflation protection.
The Strategy may also invest in forward commitments; zero-coupon municipal securities and variable, floating and inverse floating-rate municipal securities; certain types of mortgage-related securities; and derivatives, such as options, futures contracts, forwards and swaps.
The Strategy may utilize leverage for investment purposes through the use of tender option bond transactions (“TOBs”). The Adviser will consider the impact of TOBs, swaps and other derivatives in making its assessments of the Strategy’s risks. The resulting exposures to markets, sectors, issuers or specific securities will be continuously monitored by the Adviser.
| AB MUNICIPAL BOND INFLATION STRATEGY • | 1 |
Investment Results
The table on page 7 shows the Strategy’s performance for the six- and 12-month periods ended October 31, 2016, compared to its benchmark, the Bloomberg Barclays 1-10 Year Treasury Inflation-Protected Securities (“TIPS”) Index and to the Lipper Intermediate Municipal Debt Funds Average (the “Lipper Average”). Funds in the Lipper Average have generally similar investment objectives to the Strategy, although some may have different investment policies and sales and management fees and fund expenses.
In order to pursue the investment objective of after-tax returns net of inflation, the Strategy invests in municipal bonds and uses derivatives for inflation protection. During both periods, all share classes of the Strategy underperformed the benchmark, before sales charges. During both periods, all share classes except Class C shares outperformed the Lipper Average.
Over the 12-month period, underperformance relative to the benchmark was driven by the Strategy’s lower interest rate risk as yields fell. In addition, the Strategy’s municipal bond exposure detracted, as taxable bonds outperformed municipal bonds. An overweight in credit contributed to performance as credit spreads narrowed. Achieving inflation protection through consumer price index (“CPI”) hedges detracted for the 12-month period. Interest
rate swaps were used for hedging purposes and had no material impact on performance.
For the six-month period, underperformance relative to the benchmark was driven by the Strategy’s investment in municipal bonds, which underperformed US Treasuries. The Strategy’s lower interest rate risk relative to the benchmark added to performance as interest rates rose. Furthermore, achieving inflation protection through CPI hedges added to performance, both on an absolute basis and relative to TIPS.
Versus the Lipper Average, over the 12-month period, CPI hedges added to performance while the lower interest rate risk relative to the Lipper Average detracted as interest rates fell. CPI hedges were the primary driver of performance as they gained in value over the six-month period. The Strategy’s lower interest rate risk relative to the peer group also contributed as interest rates rose.
Market Review and Investment Strategy
After generally declining for the first half of the 12-month period, municipal bond yields for most maturities rose over the latter half. During the six-month period ended October 31, 2016, yields rose the most for short-maturity bonds as markets reflected a higher probability of the US Federal Reserve raising its target for the Federal Funds rate, and as a change in regulations
| 2 | • AB MUNICIPAL BOND INFLATION STRATEGY |
for money market funds led to a reduced demand for very short-term instruments. As a result, over the course of the 12-month period, yields were lower by 0.25% to 0.50% for bonds maturing beyond seven years, and those shorter in duration were little changed or increased in yield by up to 0.50%. Given the low level of yields and investors’ strong demand for income, lower-rated bonds performed well and credit spreads generally tightened over both periods. Municipal credit fundamentals remained consistent with continued slow economic growth as tax revenues continued to increase, though in some cases at a slower rate, and default rates remained low across the broad municipal market.
On November 8, 2016, Donald Trump was elected as the 45th president of the United States, and the Congressional election outcome resulted in the Republican Party maintaining control of both the House of Representatives and the Senate. The Adviser believes that it will take time before the world has a clearer picture of the short- and long-term impact of the elections on the US economy and markets in general. The Adviser
continues to monitor the markets, including for potential market volatility.
The Strategy may purchase municipal securities that are insured under policies issued by certain insurance companies. Historically, insured municipal securities typically received a higher credit rating, which meant that the issuer of the securities paid a lower interest rate. As a result of declines in the credit quality and associated downgrades of most fund insurers, insurance has less value than it did in the past. The market now values insured municipal securities primarily based on the credit quality of the issuer of the security with little value given to the insurance feature. In purchasing such insured securities, the Adviser evaluates the risk and return of municipal securities through its own research. If an insurance company’s rating is downgraded or the company becomes insolvent, the prices of municipal securities insured by the insurance company may decline. As of October 31, 2016, the Strategy’s percentages of investments in municipal bonds that are insured and in insured municipal bonds that have been pre-refunded or escrowed to maturity were 7.4% and 0.1%, respectively.
| AB MUNICIPAL BOND INFLATION STRATEGY • | 3 |
DISCLOSURES AND RISKS
Benchmark Disclosure
The Bloomberg Barclays 1-10 Year TIPS Index is unmanaged and does not reflect fees and expenses associated with the active management of a mutual fund portfolio. The Bloomberg Barclays 1-10 Year TIPS Index represents the performance of inflation-protected securities issued by the US Treasury. An investor cannot invest directly in an index, and its results are not indicative of the performance for any specific investment, including the Strategy.
A Word About Risk
Market Risk: The value of the Strategy’s assets will fluctuate as the bond market fluctuates. The value of the Strategy’s investments may decline, sometimes rapidly and unpredictably, simply because of economic changes or other events that affect large portions of the market.
Credit Risk: An issuer or guarantor of a fixed-income security, or the counterparty to a derivatives or other contract, may be unable or unwilling to make timely payments of interest or principal, or to otherwise honor its obligations. The issuer or guarantor may default, causing a loss of the full principal amount of a security. The degree of risk for a particular security may be reflected in its credit rating. There is the possibility that the credit rating of a fixed-income security may be downgraded after purchase, which may adversely affect the value of the security. Investments in fixed-income securities with lower ratings tend to have a higher probability that an issuer will default or fail to meet its payment obligations.
Municipal Market Risk: This is the risk that special factors may adversely affect the value of municipal securities and have a significant effect on the yield or value of the Strategy’s investments in municipal securities. These factors include economic conditions, political or legislative changes, uncertainties related to the tax status of municipal securities, or the rights of investors in these securities. To the extent that the Strategy invests more of its assets in a particular state’s municipal securities, the Strategy is vulnerable to events adversely affecting that state, including economic, political and regulatory occurrences, court decisions, terrorism and catastrophic natural disasters. The Strategy’s investments in certain municipal securities with principal and interest payments that are made from the revenues of a specific project or facility, and not general tax revenues, may have increased risks. Factors affecting the project or facility, such as local business or economic conditions, could have a significant effect on the project’s ability to make payments of principal and interest on these securities.
Interest Rate Risk: Changes in interest rates will affect the value of investments in fixed-income securities. When interest rates rise, the value of investments in fixed-income securities tends to fall and this decrease in
value may not be offset by higher income from new investments. The
(Disclosures, Risks and Note about Historical Performance continued on next page)
| 4 | • AB MUNICIPAL BOND INFLATION STRATEGY |
Disclosures and Risks
DISCLOSURES AND RISKS
(continued from previous page)
Strategy may be subject to a heightened risk of rising interest rates as the current period of historically low rates is beginning to end and rates have begun rising. Interest rate risk is generally greater for fixed-income securities with longer maturities or durations.
Duration Risk: Duration is a measure that relates the expected price volatility of a fixed-income security to changes in interest rates. The duration of a fixed-income security may be shorter than or equal to full maturity of a fixed-income security. Fixed-income securities with longer durations have more risk and will decrease in price as interest rates rise. For example, a fixed-income security with a duration of three years will decrease in value by approximately 3% if interest rates increase by 1%.
Inflation Risk: This is the risk that the value of assets or income from investments will be less in the future as inflation decreases the value of money. As inflation increases, the value of the Strategy’s assets can decline as can the value of the Strategy’s distributions. This risk is significantly greater for fixed-income securities with longer maturities.
Derivatives Risk: Derivatives may be illiquid, difficult to price, and leveraged so that small changes may produce disproportionate losses for the Strategy, and may be subject to counterparty risk to a greater degree than more traditional investments.
Leverage Risk: To the extent the Strategy uses leveraging techniques, such as TOBs, its net asset value (“NAV”) may be more volatile because leverage tends to exaggerate the effect of changes in interest rates and any increase or decrease in the value of the Strategy’s investments.
Liquidity Risk: Liquidity risk occurs when certain investments become difficult to purchase or sell. Difficulty in selling less liquid securities may result in sales at disadvantageous prices affecting the value of your investment in the Strategy. Causes of liquidity risk may include low trading volumes, large positions and heavy redemptions of Strategy shares. Over recent years liquidity risk has also increased because the capacity of dealers in the secondary market for fixed-income securities to make markets in these securities has decreased, even as the overall bond market has grown significantly, due to, among other things, structural changes, additional regulatory requirements and capital and risk restraints that have led to reduced inventories. Liquidity risk may be higher in a rising interest rate environment, when the value and liquidity of fixed-income securities generally go down.
Management Risk: The Strategy is subject to management risk because it is an actively managed investment fund. The Adviser will apply its investment techniques and risk analyses in making investment decisions, but there is no guarantee that its techniques will produce the intended results.
(Disclosures, Risks and Note about Historical Performance continued on next page)
| AB MUNICIPAL BOND INFLATION STRATEGY • | 5 |
Disclosures and Risks
DISCLOSURES AND RISKS
(continued from previous page)
These risks are fully discussed in the Strategy’s prospectus. As with all investments, you may lose money by investing in the Strategy.
An Important Note About Historical Performance
The investment return and principal value of an investment in the Strategy will fluctuate, so that shares, when redeemed, may be worth more or less than their original cost. Performance shown on the following pages represents past performance and does not guarantee future results. Current performance may be lower or higher than the performance information shown. You may obtain performance information current to the most recent month-end by visiting www.abfunds.com. For Class 1 shares click on “Private Clients”, then “Investments”, then “Stocks” or “Bonds”, then “Mutual Fund Performance at a Glance”.
All fees and expenses related to the operation of the Strategy have been deducted. NAV returns do not reflect sales charges; if sales charges were reflected, the Strategy’s quoted performance would be lower. SEC returns reflect the applicable sales charges for each share class: a 3.00% maximum front-end sales charge for Class A shares; and a 1% 1-year contingent deferred sales charge for Class C shares. Class 1 and 2 shares do not carry sales charges. Returns for the different share classes will vary due to different expenses associated with each class. Performance assumes reinvestment of distributions and does not account for taxes.
| 6 | • AB MUNICIPAL BOND INFLATION STRATEGY |
Disclosures and Risks
HISTORICAL PERFORMANCE
THE STRATEGY VS. ITS BENCHMARK PERIODS ENDED OCTOBER 31, 2016 (unaudited) | NAV Returns | |||||||||||
| 6 Months | 12 Months | |||||||||||
| AB Municipal Bond Inflation Strategy | ||||||||||||
Class 1* | 0.68% | 3.58% | ||||||||||
| ||||||||||||
Class 2* | 0.74% | 3.58% | ||||||||||
| ||||||||||||
Class A | 0.60% | 3.38% | ||||||||||
| ||||||||||||
Class C | 0.22% | 2.61% | ||||||||||
| ||||||||||||
Advisor Class Shares† | 0.82% | 3.74% | ||||||||||
| ||||||||||||
| Bloomberg Barclays 1-10 Year TIPS Index | 1.51% | 4.67% | ||||||||||
| ||||||||||||
| Lipper Intermediate Municipal Debt Funds Average | 0.39% | 3.33% | ||||||||||
| ||||||||||||
* Class 1 shares are only available to Bernstein Global Wealth Management private client accounts. Class 2 shares are only available to large Bernstein Global Wealth Management private client accounts and the Adviser’s institutional clients or through other limited arrangements.
† Please note that Advisor Class shares are for investors purchasing shares through accounts established under certain fee-based programs sponsored and maintained by certain broker-dealers and financial intermediaries, institutional pension plans and/or investment advisory clients of, and certain other persons associated with, the Adviser and its affiliates or the Strategy. |
| |||||||||||
See Disclosures, Risks and Note about Historical Performance on pages 4-6.
(Historical Performance continued on next page)
| AB MUNICIPAL BOND INFLATION STRATEGY • | 7 |
Historical Performance
HISTORICAL PERFORMANCE
(continued from previous page)
GROWTH OF A $10,000 INVESTMENT IN THE STRATEGY 1/26/10* TO 10/31/16 (unaudited)
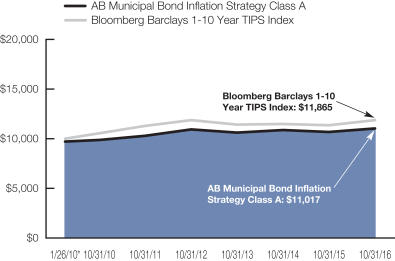
This chart illustrates the total value of an assumed $10,000 investment in AB Municipal Bond Inflation Strategy Class A shares (from 1/26/10* to 10/31/16) as compared to the performance of its benchmark. The chart reflects the deduction of the maximum 3.00% sales charge from the initial $10,000 investment in the Strategy and assumes the reinvestment of dividends and capital gains distributions.
| * | Inception date: 1/26/2010. |
See Disclosures, Risks and Note about Historical Performance on pages 4-6.
(Historical Performance continued on next page)
| 8 | • AB MUNICIPAL BOND INFLATION STRATEGY |
Historical Performance
HISTORICAL PERFORMANCE
(continued from previous page)
| AVERAGE ANNUAL RETURNS AS OF OCTOBER 31, 2016 (unaudited) | ||||||||||||
| NAV Returns | SEC Returns (reflects applicable sales charges) | SEC Yields* | ||||||||||
| Class 1 Shares† | 0.96 | % | ||||||||||
1 Year | 3.58 | % | 3.58 | % | ||||||||
5 Years | 1.59 | % | 1.59 | % | ||||||||
Since Inception‡ | 2.09 | % | 2.09 | % | ||||||||
| Class 2 Shares† | 1.06 | % | ||||||||||
1 Year | 3.58 | % | 3.58 | % | ||||||||
5 Years | 1.67 | % | 1.67 | % | ||||||||
Since Inception‡ | 2.18 | % | 2.18 | % | ||||||||
| Class A Shares | 0.78 | % | ||||||||||
1 Year | 3.38 | % | 0.31 | % | ||||||||
5 Years | 1.39 | % | 0.77 | % | ||||||||
Since Inception‡ | 1.90 | % | 1.44 | % | ||||||||
| Class C Shares | 0.07 | % | ||||||||||
1 Year | 2.61 | % | 1.61 | % | ||||||||
5 Years | 0.66 | % | 0.66 | % | ||||||||
Since Inception‡ | 1.18 | % | 1.18 | % | ||||||||
| Advisor Class Shares^ | 1.05 | % | ||||||||||
1 Year | 3.74 | % | 3.74 | % | ||||||||
5 Years | 1.70 | % | 1.70 | % | ||||||||
Since Inception‡ | 2.20 | % | 2.20 | % | ||||||||
The Strategy’s current prospectus fee table shows the Strategy’s total annual operating expense ratios as 0.67%, 0.57%, 0.87%, 1.61% and 0.61% for Class 1, Class 2, Class A, Class C and Advisor Class shares, respectively, gross of any fee waivers or expense reimbursements. Contractual fee waivers and/or expense reimbursements limit the Strategy’s annual operating expense ratios to 0.60%, 0.50%, 0.75%, 1.50% and 0.50% for Class 1, Class 2, Class A, Class C and Advisor Class shares, respectively. These waivers/reimbursements may not be terminated prior to January 29, 2017 and may be extended by the Adviser for additional one-year terms. Absent reimbursements or waivers, performance would have been lower. The Financial Highlights section of this report sets forth expense ratio data for the current reporting period; the expense ratios shown above may differ from the expense ratios in the Financial Highlights sections since they are based on different time periods.
| * | SEC yields are calculated based on SEC guidelines for the 30-day period ended October 31, 2016. |
| † | Class 1 shares are only available to Bernstein Global Wealth Management private client accounts. Class 2 shares are only available to large Bernstein Global Wealth Management private client accounts and the Adviser’s institutional clients or through other limited arrangements. |
| ‡ | Inception date: 1/26/2010. |
| ^ | Advisor Class shares are offered at NAV to eligible investors and their SEC returns are the same as their NAV returns. Please note that Advisor Class shares are for investors purchasing shares through accounts established under certain fee-based programs sponsored and maintained by certain broker-dealers and financial intermediaries, institutional pension plans and/or investment advisory clients of, and certain other persons associated with, the Adviser and its affiliates or the Strategy. |
See Disclosures, Risks and Note about Historical Performance on pages 4-6.
(Historical Performance continued on next page)
| AB MUNICIPAL BOND INFLATION STRATEGY • | 9 |
Historical Performance
HISTORICAL PERFORMANCE
(continued from previous page)
SEC AVERAGE ANNUAL RETURNS AS OF THE MOST RECENT CALENDAR QUARTER-END SEPTEMBER 30, 2016 (unaudited) | ||||
| SEC Returns (reflects applicable sales charges) | ||||
| Class 1 Shares* | ||||
1 Year | 4.29 | % | ||
5 Years | 1.54 | % | ||
Since Inception† | 2.07 | % | ||
| Class 2 Shares* | ||||
1 Year | 4.40 | % | ||
5 Years | 1.65 | % | ||
Since Inception† | 2.17 | % | ||
| Class A Shares | ||||
1 Year | 1.07 | % | ||
5 Years | 0.75 | % | ||
Since Inception† | 1.43 | % | ||
| Class C Shares | ||||
1 Year | 2.41 | % | ||
5 Years | 0.64 | % | ||
Since Inception† | 1.17 | % | ||
| Advisor Class Shares‡ | ||||
1 Year | 4.35 | % | ||
5 Years | 1.63 | % | ||
Since Inception† | 2.17 | % | ||
| * | Class 1 shares are only available to Bernstein Global Wealth Management private client accounts. Class 2 shares are only available to large Bernstein Global Wealth Management private client accounts and the Adviser’s institutional clients or through other limited arrangements. |
| † | Inception date: 1/26/2010. |
| ‡ | Advisor Class shares are offered at NAV to eligible investors and their SEC returns are the same as their NAV returns. Please note that Advisor Class shares are for investors purchasing shares through accounts established under certain fee-based programs sponsored and maintained by certain broker-dealers and financial intermediaries, institutional pension plans and/or investment advisory clients of, and certain other persons associated with, the Adviser and its affiliates or the Strategy. |
See Disclosures, Risks and Note about Historical Performance on pages 4-6.
| 10 | • AB MUNICIPAL BOND INFLATION STRATEGY |
Historical Performance
FUND EXPENSES
(unaudited)
As a shareholder of a mutual fund, you may incur two types of costs: (1) transaction costs, including sales charges (loads) on purchase payments, contingent deferred sales charges on redemptions and (2) ongoing costs, including management fees; distribution (12b-1) fees; and other fund expenses. This example is intended to help you understand your ongoing costs (in dollars) of investing in the Fund and to compare these costs with the ongoing costs of investing in other mutual funds.
The Example is based on an investment of $1,000 invested at the beginning of the period and held for the entire period as indicated below.
Actual Expenses
The table below provides information about actual account values and actual expenses. You may use the information in this line, together with the amount you invested, to estimate the expenses that you paid over the period. Simply divide your account value by $1,000 (for example, an $8,600 account value divided by $1,000 = 8.6), then multiply the result by the number in the first line under the heading entitled “Expenses Paid During Period” to estimate the expenses you paid on your account during this period.
Hypothetical Example for Comparison Purposes
The table below provides information about hypothetical account values and hypothetical expenses based on the Fund’s actual expense ratio and an assumed annual rate of return of 5% before expenses, which is not the Fund’s actual return. The hypothetical account values and expenses may not be used to estimate the actual ending account balance or expenses you paid for the period. You may use this information to compare the ongoing costs of investing in the Fund and other funds by comparing this 5% hypothetical example with the 5% hypothetical examples that appear in the shareholder reports of other funds.
Please note that the expenses shown in the table are meant to highlight your ongoing costs only and do not reflect any transactional costs, such as sales charges (loads), or contingent deferred sales charges on redemptions. Therefore, the hypothetical example is useful in comparing ongoing costs only, and will not help you determine the relative total costs of owning different funds. In addition, if these transactional costs were included, your costs would have been higher.
| AB MUNICIPAL BOND INFLATION STRATEGY • | 11 |
Fund Expenses
FUND EXPENSES
(unaudited)
| Beginning Account Value May 1, 2016 | Ending Account Value October 31, 2016 | Expenses Paid During Period* | Annualized Expense Ratio* | |||||||||||||
| Class A | ||||||||||||||||
Actual | $ | 1,000 | $ | 1,006.00 | $ | 3.78 | 0.75 | % | ||||||||
Hypothetical** | $ | 1,000 | $ | 1,021.37 | $ | 3.81 | 0.75 | % | ||||||||
| Class C | ||||||||||||||||
Actual | $ | 1,000 | $ | 1,002.20 | $ | 7.55 | 1.50 | % | ||||||||
Hypothetical** | $ | 1,000 | $ | 1,017.60 | $ | 7.61 | 1.50 | % | ||||||||
| Advisor Class | ||||||||||||||||
Actual | $ | 1,000 | $ | 1,008.20 | $ | 2.52 | 0.50 | % | ||||||||
Hypothetical** | $ | 1,000 | $ | 1,022.62 | $ | 2.54 | 0.50 | % | ||||||||
| Class 1 | ||||||||||||||||
Actual | $ | 1,000 | $ | 1,006.80 | $ | 3.03 | 0.60 | % | ||||||||
Hypothetical** | $ | 1,000 | $ | 1,022.12 | $ | 3.05 | 0.60 | % | ||||||||
| Class 2 | ||||||||||||||||
Actual | $ | 1,000 | $ | 1,007.40 | $ | 2.52 | 0.50 | % | ||||||||
Hypothetical** | $ | 1,000 | $ | 1,022.62 | $ | 2.54 | 0.50 | % | ||||||||
| * | Expenses are equal to the classes’ annualized expense ratios multiplied by the average account value over the period, multiplied by 184/366 (to reflect the one-half year period). |
| ** | Assumes 5% annual return before expenses. |
| 12 | • AB MUNICIPAL BOND INFLATION STRATEGY |
Fund Expenses
PORTFOLIO SUMMARY
October 31, 2016 (unaudited)
PORTFOLIO STATISTICS
Net Assets ($mil): $703.9
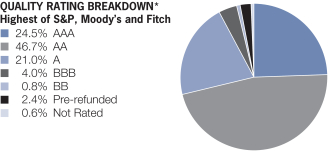
| * | All data are as of October 31, 2016. The Strategy’s quality rating breakdown is expressed as a percentage of the Strategy’s total investments in municipal securities and may vary over time. The Strategy also enters into derivative transactions, which may be used for hedging or investment purposes (see “Portfolio of Investments” section of the report for additional details). The quality ratings are determined by using the Standard & Poor’s Ratings Services (“S&P”), Moody’s Investors Services, Inc. (“Moody’s”) and Fitch Ratings, Ltd. (“Fitch”). The Strategy considers the credit ratings issued by S&P, Moody’s and Fitch and uses the highest rating issued by the agencies, including when there is a split rating. These ratings are a measure of the quality and safety of a bond or portfolio, based on the issuer’s financial condition. AAA is the highest (best) and D is the lowest (worst). If applicable, the Pre-refunded category includes bonds which are secured by US government securities and therefore are deemed high-quality investment-grade by the Adviser. If applicable, the Not Rated category includes bonds that are not rated by a nationally recognized statistical rating organization. The Adviser evaluates the creditworthiness of non-rated securities based on a number of factors including, but not limited to, cash flows, enterprise value and economic environment. |
| AB MUNICIPAL BOND INFLATION STRATEGY • | 13 |
Portfolio Summary
PORTFOLIO OF INVESTMENTS
October 31, 2016
| Principal Amount (000) | U.S. $ Value | |||||||
| ||||||||
MUNICIPAL OBLIGATIONS – 101.6% | ||||||||
Long-Term Municipal Bonds – 101.6% | ||||||||
Alabama – 1.3% | ||||||||
Alabama Special Care Facilities Financing Authority-Birmingham AL | $ | 3,905 | $ | 4,657,767 | ||||
County of Jefferson AL Sewer Revenue | 1,825 | 1,926,069 | ||||||
Infirmary Health System Special Care Facilities Financing Authority of Mobile | 2,110 | 2,519,804 | ||||||
|
| |||||||
| 9,103,640 | ||||||||
|
| |||||||
Alaska – 0.1% | ||||||||
Alaska Industrial Development & Export Authority | 400 | 406,712 | ||||||
|
| |||||||
Arizona – 2.7% | ||||||||
Arizona State University COP | 8,345 | 9,700,248 | ||||||
City of Phoenix Civic Improvement Corp. | 3,330 | 3,865,764 | ||||||
County of Pima AZ Sewer System Revenue AGM Series 2010 | 630 | 716,701 | ||||||
5.00%, 7/01/21 | 1,135 | 1,293,832 | ||||||
Salt River Project Agricultural Improvement & Power District | 3,140 | 3,719,236 | ||||||
|
| |||||||
| 19,295,781 | ||||||||
|
| |||||||
Arkansas – 0.0% | ||||||||
City of Fort Smith AR Sales & Use Tax Revenue | 25 | 25,000 | ||||||
|
| |||||||
| 14 | • AB MUNICIPAL BOND INFLATION STRATEGY |
Portfolio of Investments
| Principal Amount (000) | U.S. $ Value | |||||||
| ||||||||
California – 3.2% | ||||||||
San Francisco City & County Airport Comm-San Francisco International Airport | $ | 450 | $ | 494,820 | ||||
NATL Series 2006-32F | 290 | 308,954 | ||||||
State of California | 5,000 | 5,746,500 | ||||||
Series 2012 | 9,305 | 10,665,205 | ||||||
Series 2014 | 4,250 | 5,204,147 | ||||||
|
| |||||||
| 22,419,626 | ||||||||
|
| |||||||
Colorado – 4.3% | ||||||||
City & County of Denver CO Airport System Revenue | 375 | 430,620 | ||||||
Series 2012A | 10,395 | 12,243,127 | ||||||
5.00%, 11/15/25 | 3,000 | 3,514,680 | ||||||
Denver City & County School District No 1 | 4,730 | 5,837,671 | ||||||
Denver Urban Renewal Authority | 5,655 | 6,470,132 | ||||||
Plaza Metropolitan District No 1 | 1,310 | 1,444,485 | ||||||
Regional Transportation District | 440 | 484,783 | ||||||
|
| |||||||
| 30,425,498 | ||||||||
|
| |||||||
Connecticut – 0.8% | ||||||||
State of Connecticut | 4,360 | 5,292,517 | ||||||
|
| |||||||
| AB MUNICIPAL BOND INFLATION STRATEGY • | 15 |
Portfolio of Investments
| Principal Amount (000) | U.S. $ Value | |||||||
| ||||||||
Florida – 9.4% | ||||||||
Citizens Property Insurance Corp. | $ | 7,315 | $ | 8,654,157 | ||||
City of Jacksonville FL | 1,720 | 1,959,785 | ||||||
City of Jacksonville FL | 10,190 | 12,105,289 | ||||||
City of Tampa FL Water & Wastewater System Revenue | 1,565 | 1,833,100 | ||||||
County of Miami-Dade FL | 18,500 | 22,405,826 | ||||||
County of Miami-Dade FL Spl Tax | 1,500 | 1,746,045 | ||||||
Florida Department of Environmental Protection | 3,775 | 4,284,361 | ||||||
Series 2013A | 3,905 | 4,238,831 | ||||||
Florida Municipal Power Agency | 2,890 | 3,379,075 | ||||||
Series 2015B | 1,500 | 1,820,370 | ||||||
Florida State Board of Education | 1,725 | 2,016,956 | ||||||
Martin County Industrial Development Authority | 1,900 | 1,983,505 | ||||||
|
| |||||||
| 66,427,300 | ||||||||
|
| |||||||
Georgia – 1.0% | ||||||||
Cherokee County Board of Education | 1,000 | 1,141,480 | ||||||
| 16 | • AB MUNICIPAL BOND INFLATION STRATEGY |
Portfolio of Investments
| Principal Amount (000) | U.S. $ Value | |||||||
| ||||||||
City of Atlanta Department of Aviation | $ | 2,500 | $ | 2,619,600 | ||||
Municipal Electric Authority of Georgia | 3,045 | 3,502,542 | ||||||
|
| |||||||
| 7,263,622 | ||||||||
|
| |||||||
Illinois – 4.9% | ||||||||
Chicago O’Hare International Airport | 1,930 | 1,943,221 | ||||||
Series 2015B | 5,000 | 5,933,700 | ||||||
Chicago O’Hare International Airport | 2,500 | 2,926,025 | ||||||
5.50%, 1/01/25 | 2,250 | 2,635,942 | ||||||
Illinois Finance Authority | 6,355 | 6,997,417 | ||||||
Springfield Metropolitan Sanitation District | 2,170 | 2,438,798 | ||||||
State of Illinois | 1,040 | 1,099,686 | ||||||
Series 2010 | 500 | 515,540 | ||||||
Series 2013A | 4,030 | 4,315,082 | ||||||
Series 2014 | 4,180 | 4,490,365 | ||||||
State of Illinois | 1,450 | 1,486,743 | ||||||
|
| |||||||
| 34,782,519 | ||||||||
|
| |||||||
Indiana – 0.8% | ||||||||
Indiana Municipal Power Agency | 4,965 | 5,623,070 | ||||||
|
| |||||||
| AB MUNICIPAL BOND INFLATION STRATEGY • | 17 |
Portfolio of Investments
| Principal Amount (000) | U.S. $ Value | |||||||
| ||||||||
Kentucky – 1.2% | ||||||||
Kentucky Municipal Power Agency | $ | 4,875 | $ | 5,713,279 | ||||
Kentucky Turnpike Authority | 2,275 | 2,683,908 | ||||||
|
| |||||||
| 8,397,187 | ||||||||
|
| |||||||
Louisiana – 1.5% | ||||||||
State of Louisiana Gasoline & Fuels Tax Revenue | 9,085 | 10,695,407 | ||||||
|
| |||||||
Maryland – 6.1% | ||||||||
State of Maryland | 10,165 | 11,627,235 | ||||||
5.00%, 8/01/21(a) | 26,600 | 31,287,984 | ||||||
|
| |||||||
| 42,915,219 | ||||||||
|
| |||||||
Massachusetts – 4.7% | ||||||||
Commonwealth of Massachusetts | 9,575 | 9,661,941 | ||||||
NATL Series 2000E | 4,525 | 4,085,066 | ||||||
Commonwealth of Massachusetts | 3,000 | 3,116,970 | ||||||
Massachusetts Bay Transportation Authority | 3,330 | 3,946,183 | ||||||
Massachusetts Clean Water Trust (The) | 3,240 | 3,360,528 | ||||||
Massachusetts School Building Authority | 2,475 | 2,974,381 | ||||||
| 18 | • AB MUNICIPAL BOND INFLATION STRATEGY |
Portfolio of Investments
| Principal Amount (000) | U.S. $ Value | |||||||
| ||||||||
Metropolitan Boston Transit Parking Corp. | $ | 5,025 | $ | 5,861,704 | ||||
|
| |||||||
| 33,006,773 | ||||||||
|
| |||||||
Michigan – 3.2% | ||||||||
City of Detroit MI Sewage Disposal System Revenue | 3,750 | 4,269,713 | ||||||
Michigan Finance Authority | 2,735 | 3,274,874 | ||||||
Michigan Finance Authority | 10,545 | 12,673,508 | ||||||
Michigan Finance Authority | 1,785 | 2,094,001 | ||||||
|
| |||||||
| 22,312,096 | ||||||||
|
| |||||||
Minnesota – 1.2% | ||||||||
Minnesota Higher Education Facilities Authority | 1,295 | 1,426,741 | ||||||
State of Minnesota | 6,715 | 7,192,772 | ||||||
|
| |||||||
| 8,619,513 | ||||||||
|
| |||||||
Mississippi – 0.6% | ||||||||
Mississippi Development Bank | 1,500 | 1,626,930 | ||||||
Series 2013A | 1,000 | 1,084,620 | ||||||
Mississippi Hospital Equipment & Facilities Authority | 1,500 | 1,701,690 | ||||||
|
| |||||||
| 4,413,240 | ||||||||
|
| |||||||
| AB MUNICIPAL BOND INFLATION STRATEGY • | 19 |
Portfolio of Investments
| Principal Amount (000) | U.S. $ Value | |||||||
| ||||||||
Missouri – 0.5% | ||||||||
City of Springfield MO Public Utility Revenue | $ | 1,390 | $ | 1,453,287 | ||||
Lees Summit Industrial Development Authority | 1,675 | 1,751,279 | ||||||
|
| |||||||
| 3,204,566 | ||||||||
|
| |||||||
Nevada – 1.6% | ||||||||
City of Reno NV | 1,000 | 1,093,490 | ||||||
Series 2013B | 2,210 | 2,416,613 | ||||||
County of Clark Department of Aviation | 775 | 866,450 | ||||||
Las Vegas Valley Water District | 1,500 | 1,700,145 | ||||||
Series 2015B | 4,250 | 4,890,772 | ||||||
|
| |||||||
| 10,967,470 | ||||||||
|
| |||||||
New Jersey – 3.6% | ||||||||
Morris-Union Jointure Commission COP | 2,340 | 2,405,848 | ||||||
New Jersey Economic Development Authority | 460 | 481,275 | ||||||
New Jersey Economic Development Authority | 20 | 20,840 | ||||||
New Jersey Transportation Trust Fund Authority | 1,375 | 1,534,995 | ||||||
New Jersey Transportation Trust Fund Authority | 10,000 | 10,935,200 | ||||||
| 20 | • AB MUNICIPAL BOND INFLATION STRATEGY |
Portfolio of Investments
| Principal Amount (000) | U.S. $ Value | |||||||
| ||||||||
New Jersey Turnpike Authority | $ | 1,800 | $ | 2,161,188 | ||||
Series 2014A | 4,785 | 5,807,411 | ||||||
Series 2014C | 1,590 | 1,909,049 | ||||||
|
| |||||||
| 25,255,806 | ||||||||
|
| |||||||
New York – 18.1% | ||||||||
City of New York NY | 4,250 | 4,964,765 | ||||||
Series 2014J | 6,100 | 7,122,848 | ||||||
Metropolitan Transportation Authority | 9,065 | 10,881,009 | ||||||
Series 2012F | 3,635 | 4,352,331 | ||||||
Series 2013A | 2,300 | 2,747,028 | ||||||
Series 2013E | 8,510 | 10,288,930 | ||||||
New York City Municipal Water Finance Authority | 3,875 | 4,528,635 | ||||||
New York City Transitional Finance Authority Future Tax Secured Revenue | 6,830 | 8,212,938 | ||||||
New York State Dormitory Authority | 3,000 | 3,496,050 | ||||||
Series 2012A | 14,610 | 17,654,140 | ||||||
Series 2012B | 7,900 | 8,904,248 | ||||||
Series 2014A | 6,565 | 7,997,877 | ||||||
New York State Energy Research & Development Authority | 3,500 | 3,199,112 | ||||||
| AB MUNICIPAL BOND INFLATION STRATEGY • | 21 |
Portfolio of Investments
| Principal Amount (000) | U.S. $ Value | |||||||
| ||||||||
New York State Environmental Facilities Corp. | $ | 3,000 | $ | 3,523,740 | ||||
New York State Thruway Authority | 17,025 | 19,820,165 | ||||||
Triborough Bridge & Tunnel Authority | 4,360 | 4,872,823 | ||||||
Series 2013B | 4,100 | 4,718,608 | ||||||
|
| |||||||
| 127,285,247 | ||||||||
|
| |||||||
North Carolina – 2.3% | ||||||||
North Carolina Eastern Municipal Power Agency | 6,700 | 7,762,821 | ||||||
State of North Carolina | 6,710 | 8,195,124 | ||||||
|
| |||||||
| 15,957,945 | ||||||||
|
| |||||||
Ohio – 1.4% | ||||||||
American Municipal Power, Inc. | 5,000 | 5,813,600 | ||||||
City of Cleveland OH Airport System Revenue | 2,585 | 3,078,219 | ||||||
City of Cleveland OH COP | 700 | 728,196 | ||||||
|
| |||||||
| 9,620,015 | ||||||||
|
| |||||||
Oregon – 1.7% | ||||||||
Deschutes County Administrative School District No 1 Bend-La Pine | 5,180 | 5,900,227 | ||||||
Deschutes County Hospital Facilities Authority | 1,000 | 1,085,390 | ||||||
| 22 | • AB MUNICIPAL BOND INFLATION STRATEGY |
Portfolio of Investments
| Principal Amount (000) | U.S. $ Value | |||||||
| ||||||||
Tri-County Metropolitan Transportation District of Oregon | $ | 4,605 | $ | 5,329,827 | ||||
|
| |||||||
| 12,315,444 | ||||||||
|
| |||||||
Pennsylvania – 5.0% | ||||||||
Allegheny County Sanitary Authority | 2,250 | 2,465,753 | ||||||
City of Philadelphia PA Water & Wastewater Revenue | 550 | 585,277 | ||||||
Commonwealth of Pennsylvania | 5,000 | 5,141,200 | ||||||
Montgomery County Industrial Development Authority/PA | 475 | 525,754 | ||||||
Moon Industrial Development Authority | 2,060 | 2,272,530 | ||||||
Pennsylvania Economic Development Financing Authority | 3,085 | 3,352,284 | ||||||
Series 2012B | 7,550 | 7,908,474 | ||||||
School District of Philadelphia (The) | 1,800 | 1,993,446 | ||||||
Series 2016F | 5,000 | 5,529,600 | ||||||
State Public School Building Authority | 5,150 | 5,726,827 | ||||||
|
| |||||||
| 35,501,145 | ||||||||
|
| |||||||
Puerto Rico – 0.5% | ||||||||
Puerto Rico Electric Power Authority | 3,400 | 3,600,260 | ||||||
|
| |||||||
| AB MUNICIPAL BOND INFLATION STRATEGY • | 23 |
Portfolio of Investments
| Principal Amount (000) | U.S. $ Value | |||||||
| ||||||||
South Carolina – 0.4% | ||||||||
Renewable Water Resources | $ | 2,570 | $ | 3,013,685 | ||||
|
| |||||||
Tennessee – 0.4% | ||||||||
Metropolitan Government of Nashville & Davidson County TN | 455 | 545,213 | ||||||
5.00%, 7/01/23 | 1,930 | 2,310,326 | ||||||
|
| |||||||
| 2,855,539 | ||||||||
|
| |||||||
Texas – 7.6% | ||||||||
Austin Community College District Public Facility Corp. | 1,000 | 1,099,700 | ||||||
Birdville Independent School District | 3,825 | 4,538,822 | ||||||
Central Texas Regional Mobility Authority | 2,085 | 2,311,723 | ||||||
City of Corpus Christi TX Utility System Revenue | 5,675 | 6,589,810 | ||||||
City of Garland TX | 500 | 560,270 | ||||||
City of Houston TX Airport System Revenue | 2,105 | 2,301,649 | ||||||
City of Houston TX Combined Utility System Revenue | 2,735 | 3,203,177 | ||||||
City of Lubbock TX | 1,740 | 1,895,051 | ||||||
Conroe Independent School District | 6,240 | 7,014,803 | ||||||
Harris County-Houston Sports Authority | 4,220 | 4,951,368 | ||||||
New Hope Cultural Education Facilities Finance Corp. | 1,000 | 1,114,890 | ||||||
| 24 | • AB MUNICIPAL BOND INFLATION STRATEGY |
Portfolio of Investments
| Principal Amount (000) | U.S. $ Value | |||||||
| ||||||||
New Hope Cultural Education Facilities Finance Corp. | $ | 800 | $ | 799,528 | ||||
New Hope Cultural Education Facilities Finance Corp. | 1,000 | 1,124,950 | ||||||
North Texas Tollway Authority | 3,625 | 4,274,238 | ||||||
Rockwall Independent School District | 3,280 | 3,574,610 | ||||||
San Antonio Independent School District/TX | 1,710 | 1,971,972 | ||||||
Spring Branch Independent School District | 3,485 | 4,040,753 | ||||||
Tarrant County Cultural Education Facilities Finance Corp. | 900 | 985,293 | ||||||
University of Texas System (The) | 1,070 | 1,203,814 | ||||||
|
| |||||||
| 53,556,421 | ||||||||
|
| |||||||
Virginia – 1.0% | ||||||||
Fairfax County Economic Development Authority | 2,000 | 2,261,860 | ||||||
5.00%, 4/01/26 (Pre-refunded/ETM) | 4,000 | 4,523,720 | ||||||
|
| |||||||
| 6,785,580 | ||||||||
|
| |||||||
Washington – 8.4% | ||||||||
Central Puget Sound Regional Transit Authority | 7,815 | 9,298,363 | ||||||
| AB MUNICIPAL BOND INFLATION STRATEGY • | 25 |
Portfolio of Investments
| Principal Amount (000) | U.S. $ Value | |||||||
| ||||||||
Chelan County Public Utility District No 1 | $ | 3,305 | $ | 3,868,668 | ||||
City of Seattle WA | 9,770 | 10,775,138 | ||||||
City of Seattle WA Municipal Light & Power Revenue | 2,070 | 2,197,947 | ||||||
City of Tacoma WA Electric System Revenue | 4,000 | 4,423,850 | ||||||
Energy Northwest | 680 | 726,322 | ||||||
Series 2012A | 4,200 | 4,642,386 | ||||||
Port of Seattle WA | 4,820 | 5,760,623 | ||||||
State of Washington | 710 | 795,782 | ||||||
Series 2015R | 13,325 | 16,422,529 | ||||||
|
| |||||||
| 58,911,608 | ||||||||
|
| |||||||
Wisconsin – 2.1% | ||||||||
Wisconsin Department of Transportation | 12,000 | 14,676,860 | ||||||
|
| |||||||
Total Municipal Obligations | 714,932,311 | |||||||
|
| |||||||
GOVERNMENTS – TREASURIES – 1.8% | ||||||||
United States – 1.8% | ||||||||
U.S. Treasury Notes | 6,200 | 6,197,092 | ||||||
1.625%, 11/30/20(a) | 6,632 | 6,736,142 | ||||||
|
| |||||||
Total Governments – Treasuries | 12,933,234 | |||||||
|
| |||||||
| 26 | • AB MUNICIPAL BOND INFLATION STRATEGY |
Portfolio of Investments
| Principal Amount (000) | U.S. $ Value | |||||||
| ||||||||
CORPORATES – INVESTMENT | ||||||||
Financial Institutions – 1.8% | ||||||||
Banking – 1.8% | ||||||||
Capital One Bank USA NA | $ | 8,300 | $ | 8,299,303 | ||||
Morgan Stanley | 4,030 | 4,062,868 | ||||||
|
| |||||||
Total Corporates – Investment Grade | 12,362,171 | |||||||
|
| |||||||
| Shares | ||||||||
SHORT-TERM INVESTMENTS – 2.1% | ||||||||
Investment Companies – 2.1% | ||||||||
AB Fixed Income Shares, Inc. – | 14,944,940 | 14,944,940 | ||||||
|
| |||||||
Total Investments – 107.3% | 755,172,656 | |||||||
Other assets less liabilities – (7.3)% | (51,281,327 | ) | ||||||
|
| |||||||
Net Assets – 100.0% | $ | 703,891,329 | ||||||
|
| |||||||
INFLATION (CPI) SWAPS (see Note D)
| Rate Type | ||||||||||||||||
| Swap Counterparty | Notional Amount (000) | Termination Date | Payments made by the Fund | Payments received by the Fund | Unrealized Appreciation/ (Depreciation) | |||||||||||
Bank of America, NA | $ | 25,000 | 9/02/20 | 1.548% | CPI# | $ | 179,554 | |||||||||
Barclays Bank PLC | 6,000 | 2/26/17 | 2.370% | CPI# | (398,237 | ) | ||||||||||
Barclays Bank PLC | 3,000 | 7/19/17 | 2.038% | CPI# | (91,678 | ) | ||||||||||
Barclays Bank PLC | 37,000 | 8/07/17 | 2.124% | CPI# | (1,318,516 | ) | ||||||||||
Barclays Bank PLC | 5,500 | 6/02/19 | 2.580% | CPI# | (516,834 | ) | ||||||||||
Barclays Bank PLC | 4,000 | 6/15/20 | 2.480% | CPI# | (367,693 | ) | ||||||||||
Barclays Bank PLC | 35,000 | 7/02/20 | 2.256% | CPI# | (2,014,371 | ) | ||||||||||
Barclays Bank PLC | 1,500 | 8/04/20 | 2.308% | CPI# | (100,957 | ) | ||||||||||
Barclays Bank PLC | 2,000 | 11/10/20 | 2.500% | CPI# | (172,244 | ) | ||||||||||
Barclays Bank PLC | 1,000 | 5/04/21 | 2.845% | CPI# | (140,930 | ) | ||||||||||
Barclays Bank PLC | 3,000 | 5/12/21 | 2.815% | CPI# | (414,525 | ) | ||||||||||
Barclays Bank PLC | 14,000 | 4/03/22 | 2.663% | CPI# | (1,781,288 | ) | ||||||||||
Barclays Bank PLC | 16,700 | 10/05/22 | 2.765% | CPI# | (2,163,258 | ) | ||||||||||
Barclays Bank PLC | 25,000 | 8/07/24 | 2.573% | CPI# | (2,544,273 | ) | ||||||||||
Barclays Bank PLC | 19,000 | 5/05/25 | 2.125% | CPI# | (492,183 | ) | ||||||||||
Barclays Bank PLC | 5,400 | 3/06/27 | 2.695% | CPI# | (876,247 | ) | ||||||||||
Citibank, NA | 14,000 | 5/30/17 | 2.125% | CPI# | (699,177 | ) | ||||||||||
| AB MUNICIPAL BOND INFLATION STRATEGY • | 27 |
Portfolio of Investments
| Rate Type | ||||||||||||||||
| Swap Counterparty | Notional Amount (000) | Termination Date | Payments made by the Fund | Payments received by the Fund | Unrealized Appreciation/ (Depreciation) | |||||||||||
Citibank, NA | $ | 11,500 | 6/21/17 | 2.153% | CPI# | $ | (593,755 | ) | ||||||||
Citibank, NA | 22,000 | 7/02/18 | 2.084% | CPI# | (850,583 | ) | ||||||||||
Citibank, NA | 15,600 | 12/14/20 | 1.548% | CPI# | 209,722 | |||||||||||
Citibank, NA | 9,000 | 6/29/22 | 2.398% | CPI# | (872,959 | ) | ||||||||||
Citibank, NA | 5,400 | 7/19/22 | 2.400% | CPI# | (509,630 | ) | ||||||||||
Citibank, NA | 4,000 | 8/10/22 | 2.550% | CPI# | (434,192 | ) | ||||||||||
Citibank, NA | 15,500 | 12/07/22 | 2.748% | CPI# | (2,069,508 | ) | ||||||||||
Citibank, NA | 47,000 | 5/24/23 | 2.533% | CPI# | (4,977,291 | ) | ||||||||||
Citibank, NA | 30,000 | 10/29/23 | 2.524% | CPI# | (2,907,036 | ) | ||||||||||
Citibank, NA | 15,800 | 2/08/28 | 2.940% | CPI# | (3,157,918 | ) | ||||||||||
Deutsche Bank AG | 11,000 | 6/20/21 | 2.655% | CPI# | (1,361,801 | ) | ||||||||||
Deutsche Bank AG | 9,800 | 9/07/21 | 2.400% | CPI# | (906,878 | ) | ||||||||||
Deutsche Bank AG | 25,000 | 9/02/25 | 1.880% | CPI# | (9,782 | ) | ||||||||||
JPMorgan Chase Bank, NA | 1,000 | 7/29/20 | 2.305% | CPI# | (67,667 | ) | ||||||||||
JPMorgan Chase Bank, NA | 19,000 | 8/17/22 | 2.523% | CPI# | (1,981,277 | ) | ||||||||||
JPMorgan Chase Bank, NA | 1,400 | 6/30/26 | 2.890% | CPI# | (286,882 | ) | ||||||||||
JPMorgan Chase Bank, NA | 3,300 | 7/21/26 | 2.935% | CPI# | (707,750 | ) | ||||||||||
JPMorgan Chase Bank, NA | 2,400 | 10/03/26 | 2.485% | CPI# | (298,196 | ) | ||||||||||
JPMorgan Chase Bank, NA | 5,400 | 11/14/26 | 2.488% | CPI# | (673,428 | ) | ||||||||||
JPMorgan Chase Bank, NA | 4,850 | 12/23/26 | 2.484% | CPI# | (594,138 | ) | ||||||||||
JPMorgan Chase Bank, NA | 21,350 | 2/20/28 | 2.899% | CPI# | (4,093,383 | ) | ||||||||||
JPMorgan Chase Bank, NA | 12,000 | 3/26/28 | 2.880% | CPI# | (2,253,490 | ) | ||||||||||
Morgan Stanley Capital Services LLC | 50,000 | 4/16/18 | 2.395% | CPI# | (3,067,280 | ) | ||||||||||
Morgan Stanley Capital Services LLC | 2,000 | 10/14/20 | 2.370% | CPI# | (142,580 | ) | ||||||||||
Morgan Stanley Capital Services LLC | 13,000 | 5/23/21 | 2.680% | CPI# | (1,595,305 | ) | ||||||||||
Morgan Stanley Capital Services LLC | 10,000 | 4/16/23 | 2.690% | CPI# | (1,257,750 | ) | ||||||||||
Morgan Stanley Capital Services LLC | 5,000 | 8/15/26 | 2.885% | CPI# | (1,012,579 | ) | ||||||||||
|
| |||||||||||||||
| $ | (50,386,173 | ) | ||||||||||||||
|
| |||||||||||||||
| # | Variable interest rate based on the rate of inflation as determined by the Consumer Price Index (CPI). |
INTEREST RATE SWAPS (see Note D)
| Rate Type | ||||||||||||||||
| Swap Counterparty | Notional Amount (000) | Termination Date | Payments made by the Fund | Payments received by the Fund | Unrealized Appreciation/ (Depreciation) | |||||||||||
JPMorgan Chase Bank, NA | $ | 12,700 | 10/26/22 | 1.123% | SIFMA* | $ | (47,244 | ) | ||||||||
| * | Variable interest rate based on the Securities Industry & Financial Markets Association (SIFMA) Municipal Swap Index. |
| 28 | • AB MUNICIPAL BOND INFLATION STRATEGY |
Portfolio of Investments
| (a) | Position, or a portion thereof, has been segregated to collateralize OTC derivatives outstanding. |
| (b) | Security is exempt from registration under Rule 144A of the Securities Act of 1933. This security is considered restricted, but liquid and may be resold in transactions exempt from registration, normally to qualified institutional buyers. At October 31, 2016, the market value of this security amounted to $1,444,485 or 0.2% of net assets. |
| (c) | Variable rate coupon, rate shown as of October 31, 2016. |
| (d) | An auction rate security whose interest rate resets at each auction date. Auctions are typically held every week or month. The rate shown is as of October 31, 2016 and the aggregate market value of these securities amounted to $7,284,178 or 1.03% of net assets. |
| (e) | When-Issued or delayed delivery security. |
| (f) | Investment in affiliated money market mutual fund. The rate shown represents the 7-day yield as of period end. |
| (g) | To obtain a copy of the fund’s financial statements, please go to the Securities and Exchange Commission’s website at www.sec.gov, or call AB at (800) 227-4618. |
As of October 31, 2016, the Strategy’s percentages of investments in municipal bonds that are insured and in insured municipal bonds that have been pre-refunded or escrowed to maturity are 7.4% and 0.1%, respectively.
Glossary:
| AGM – Assured Guaranty Municipal |
| AMBAC – Ambac Assurance Corporation |
| COP – Certificate of Participation |
| DOT – Department of Transportation |
| ETM – Escrowed to Maturity |
| NATL – National Interstate Corporation |
| SRF – State Revolving Fund |
See notes to financial statements.
| AB MUNICIPAL BOND INFLATION STRATEGY • | 29 |
Portfolio of Investments
STATEMENT OF ASSETS & LIABILITIES
October 31, 2016
| Assets | ||||
Investments in securities, at value | ||||
Unaffiliated issuers (cost $706,965,210) | $ | 740,227,716 | ||
Affiliated issuers (cost $14,944,940) | 14,944,940 | |||
Interest receivable | 9,043,797 | |||
Receivable for capital stock sold | 1,047,604 | |||
Unrealized appreciation on inflation swaps | 389,276 | |||
Affiliated dividends receivable | 1,425 | |||
|
| |||
Total assets | 765,654,758 | |||
|
| |||
| Liabilities | ||||
Unrealized depreciation on inflation swaps | 50,775,449 | |||
Payable for investment securities purchased | 9,592,549 | |||
Payable for capital stock redeemed | 869,357 | |||
Advisory fee payable | 240,046 | |||
Unrealized depreciation on interest rate swaps | 47,244 | |||
Distribution fee payable | 42,321 | |||
Administrative fee payable | 17,721 | |||
Transfer Agent fee payable | 10,430 | |||
Accrued expenses | 168,312 | |||
|
| |||
Total liabilities | 61,763,429 | |||
|
| |||
Net Assets | $ | 703,891,329 | ||
|
| |||
| Composition of Net Assets | ||||
Capital stock, at par | $ | 68,543 | ||
Additional paid-in capital | 726,669,565 | |||
Undistributed net investment income | 70,756 | |||
Accumulated net realized loss on investment transactions | (5,746,624 | ) | ||
Net unrealized depreciation on investments | (17,170,911 | ) | ||
|
| |||
| $ | 703,891,329 | |||
|
| |||
Net Asset Value Per Share—27 billion shares of capital stock authorized, $.001 par value
| Class | Net Assets | Shares Outstanding | Net Asset Value | |||||||||
| ||||||||||||
| A | $ | 37,345,066 | 3,628,876 | $ | 10.29 | * | ||||||
| ||||||||||||
| C | $ | 10,804,880 | 1,051,995 | $ | 10.27 | |||||||
| ||||||||||||
| Advisor | $ | 152,275,581 | 14,789,931 | $ | 10.30 | |||||||
| ||||||||||||
| 1 | $ | 333,310,984 | 32,493,872 | $ | 10.26 | |||||||
| ||||||||||||
| 2 | $ | 170,154,818 | 16,578,378 | $ | 10.26 | |||||||
| ||||||||||||
| * | The maximum offering price per share for Class A shares was $10.61 which reflects a sales charge of 3.00%. |
See notes to financial statements.
| 30 | • AB MUNICIPAL BOND INFLATION STRATEGY |
Statement of Assets & Liabilities
STATEMENT OF OPERATIONS
Year Ended October 31, 2016
| Investment Income | ||||||||
Interest | $ | 18,553,555 | ||||||
Dividends—Affiliated issuers | 11,427 | $ | 18,564,982 | |||||
|
| |||||||
| Expenses | ||||||||
Advisory fee (see Note B) | 3,670,729 | |||||||
Distribution fee—Class A | 93,116 | |||||||
Distribution fee—Class C | 116,813 | |||||||
Distribution fee—Class 1 | 355,826 | |||||||
Transfer agency—Class A | 11,805 | |||||||
Transfer agency—Class C | 3,809 | |||||||
Transfer agency—Advisor Class | 51,178 | |||||||
Transfer agency—Class 1 | 21,643 | |||||||
Transfer agency—Class 2 | 10,319 | |||||||
Custodian | 179,441 | |||||||
Audit and tax | 85,840 | |||||||
Registration fees | 81,576 | |||||||
Administrative | 54,517 | |||||||
Legal | 47,208 | |||||||
Printing | 44,249 | |||||||
Directors’ fees | 25,464 | |||||||
Miscellaneous | 25,935 | |||||||
|
| |||||||
Total expenses | 4,879,468 | |||||||
Less: expenses waived and reimbursed by the Adviser (see Note B) | (644,698 | ) | ||||||
|
| |||||||
Net expenses | 4,234,770 | |||||||
|
| |||||||
Net investment income | 14,330,212 | |||||||
|
| |||||||
| Realized and Unrealized Gain (Loss) on Investment Transactions | ||||||||
Net realized gain (loss) on: | ||||||||
Investment transactions | 846,269 | |||||||
Swaps | (2,139,458 | ) | ||||||
Net change in unrealized appreciation/depreciation of: | ||||||||
Investments | 6,523,473 | |||||||
Swaps | 6,256,263 | |||||||
|
| |||||||
Net gain on investment transactions | 11,486,547 | |||||||
|
| |||||||
Net Increase in Net Assets from Operations | $ | 25,816,759 | ||||||
|
|
See notes to financial statements.
| AB MUNICIPAL BOND INFLATION STRATEGY • | 31 |
Statement of Operations
STATEMENT OF CHANGES IN NET ASSETS
| Year Ended October 31, 2016 | Year Ended October 31, 2015 | |||||||
| Increase (Decrease) in Net Assets from Operations | ||||||||
Net investment income | $ | 14,330,212 | $ | 13,923,366 | ||||
Net realized loss on investment transactions | (1,293,189 | ) | (1,449,266 | ) | ||||
Net change in unrealized appreciation/depreciation of investments | 12,779,736 | (26,751,917 | ) | |||||
|
|
|
| |||||
Net increase (decrease) in net assets from operations | 25,816,759 | (14,277,817 | ) | |||||
| Dividends to Shareholders from | ||||||||
Net investment income | ||||||||
Class A | (695,439 | ) | (729,938 | ) | ||||
Class C | (129,987 | ) | (119,694 | ) | ||||
Advisor Class | (3,429,320 | ) | (3,103,460 | ) | ||||
Class 1 | (7,315,833 | ) | (6,702,371 | ) | ||||
Class 2 | (3,595,101 | ) | (3,244,378 | ) | ||||
| Capital Stock Transactions | ||||||||
Net decrease | (95,338,279 | ) | (43,450,132 | ) | ||||
|
|
|
| |||||
Total decrease | (84,687,200 | ) | (71,627,790 | ) | ||||
| Net Assets | ||||||||
Beginning of period | 788,578,529 | 860,206,319 | ||||||
|
|
|
| |||||
End of period (including undistributed net investment income of $70,756 and $1,091,678, respectively) | $ | 703,891,329 | $ | 788,578,529 | ||||
|
|
|
| |||||
See notes to financial statements.
| 32 | • AB MUNICIPAL BOND INFLATION STRATEGY |
Statement of Changes in Net Assets
NOTES TO FINANCIAL STATEMENTS
October 31, 2016
NOTE A
Significant Accounting Policies
AB Bond Fund, Inc. (the “Company”) is registered under the Investment Company Act of 1940 as an open-end management investment company. The Company, which is a Maryland corporation, operates as a series company comprised of ten portfolios currently in operation. Each portfolio is considered to be a separate entity for financial reporting and tax purposes. This report relates only to the AB Municipal Bond Inflation Strategy Portfolio (the “Strategy”), a diversified portfolio. The Strategy offers Class A, Class C, Advisor Class, Class 1 and Class 2 shares. Class 1 shares are sold only to the private clients of Sanford C. Bernstein & Co. LLC by its registered representatives. Class B, Class R, Class K and Class I shares have been authorized by the Strategy but are not currently being offered. Class A shares are sold with a front-end sales charge of up to 3.0% for purchases not exceeding $500,000. With respect to purchases of $500,000 or more, Class A shares redeemed within one year of purchase may be subject to a contingent deferred sales charge of 1%. Class C shares are subject to a contingent deferred sales charge of 1% on redemptions made within the first year after purchase. Advisor Class, Class I, and Class 2 shares are sold without an initial or contingent deferred sales charge and are not subject to ongoing distribution expenses. Class 1 shares are sold without an initial or contingent deferred sales charge, but are subject to ongoing distribution expenses. All nine classes of shares have identical voting, dividend, liquidation and other rights, except that the classes bear different distribution and transfer agency expenses. Each class has exclusive voting rights with respect to its distribution plan. The financial statements have been prepared in conformity with U.S. generally accepted accounting principles (“U.S. GAAP”) which require management to make certain estimates and assumptions that affect the reported amounts of assets and liabilities in the financial statements and amounts of income and expenses during the reporting period. Actual results could differ from those estimates. The Strategy is an investment company under U.S. GAAP and follows the accounting and reporting guidance applicable to investment companies. The following is a summary of significant accounting policies followed by the Strategy.
1. Security Valuation
Portfolio securities are valued at their current market value determined on the basis of market quotations or, if market quotations are not readily available or are deemed unreliable, at “fair value” as determined in accordance with procedures established by and under the general supervision of the Company’s Board of Directors (the “Board”).
| AB MUNICIPAL BOND INFLATION STRATEGY • | 33 |
Notes to Financial Statements
In general, the market values of securities which are readily available and deemed reliable are determined as follows: securities listed on a national securities exchange (other than securities listed on the NASDAQ Stock Market, Inc. (“NASDAQ”)) or on a foreign securities exchange are valued at the last sale price at the close of the exchange or foreign securities exchange. If there has been no sale on such day, the securities are valued at the last traded price from the previous day. Securities listed on more than one exchange are valued by reference to the principal exchange on which the securities are traded; securities listed only on NASDAQ are valued in accordance with the NASDAQ Official Closing Price; listed or over the counter (“OTC”) market put or call options are valued at the mid level between the current bid and ask prices. If either a current bid or current ask price is unavailable, AllianceBernstein L.P. (the “Adviser”) will have discretion to determine the best valuation (e.g. last trade price in the case of listed options); open futures are valued using the closing settlement price or, in the absence of such a price, the most recent quoted bid price. If there are no quotations available for the day of valuation, the last available closing settlement price is used; U.S. Government securities and any other debt instruments having 60 days or less remaining until maturity are generally valued at market by an independent pricing vendor, if a market price is available. If a market price is not available, the securities are valued at amortized cost. This methodology is commonly used for short term securities that have an original maturity of 60 days or less, as well as short term securities that had an original term to maturity that exceeded 60 days. In instances when amortized cost is utilized, the Valuation Committee (the “Committee”) must reasonably conclude that the utilization of amortized cost is approximately the same as the fair value of the security. Such factors the Committee will consider include, but are not limited to, an impairment of the creditworthiness of the issuer or material changes in interest rates. Fixed-income securities, including mortgage-backed and asset-backed securities, may be valued on the basis of prices provided by a pricing service or at a price obtained from one or more of the major broker-dealers. In cases where broker-dealer quotes are obtained, the Adviser may establish procedures whereby changes in market yields or spreads are used to adjust, on a daily basis, a recently obtained quoted price on a security. Swaps and other derivatives are valued daily, primarily using independent pricing services, independent pricing models using market inputs, as well as third party broker-dealers or counterparties. Open end mutual funds are valued at the closing net asset value per share, while exchange traded funds are valued at the closing market price per share.
Securities for which market quotations are not readily available (including restricted securities) or are deemed unreliable are valued at fair value as deemed appropriate by the Adviser. Factors considered in making this
| 34 | • AB MUNICIPAL BOND INFLATION STRATEGY |
Notes to Financial Statements
determination may include, but are not limited to, information obtained by contacting the issuer, analysts, analysis of the issuer’s financial statements or other available documents. In addition, the Strategy may use fair value pricing for securities primarily traded in non-U.S. markets because most foreign markets close well before the Strategy values its securities at 4:00 p.m., Eastern Time. The earlier close of these foreign markets gives rise to the possibility that significant events, including broad market moves, may have occurred in the interim and may materially affect the value of those securities. To account for this, the Strategy may frequently value many of its foreign equity securities using fair value prices based on third party vendor modeling tools to the extent available.
2. Fair Value Measurements
In accordance with U.S. GAAP regarding fair value measurements, fair value is defined as the price that the Strategy would receive to sell an asset or pay to transfer a liability in an orderly transaction between market participants at the measurement date. U.S. GAAP establishes a framework for measuring fair value, and a three-level hierarchy for fair value measurements based upon the transparency of inputs to the valuation of an asset or liability (including those valued based on their market values as described in Note A.1 above). Inputs may be observable or unobservable and refer broadly to the assumptions that market participants would use in pricing the asset or liability. Observable inputs reflect the assumptions market participants would use in pricing the asset or liability based on market data obtained from sources independent of the Strategy. Unobservable inputs reflect the Strategy’s own assumptions about the assumptions that market participants would use in pricing the asset or liability based on the best information available in the circumstances. Each investment is assigned a level based upon the observability of the inputs which are significant to the overall valuation. The three-tier hierarchy of inputs is summarized below.
| • | Level 1—quoted prices in active markets for identical investments |
| • | Level 2—other significant observable inputs (including quoted prices for similar investments, interest rates, prepayment speeds, credit risk, etc.) |
| • | Level 3—significant unobservable inputs (including the Strategy’s own assumptions in determining the fair value of investments) |
The fair value of debt instruments, such as bonds, and over-the-counter derivatives is generally based on market price quotations, recently executed market transactions (where observable) or industry recognized modeling techniques and are generally classified as Level 2. Pricing vendor inputs to Level 2 valuations may include quoted prices for similar investments in
| AB MUNICIPAL BOND INFLATION STRATEGY • | 35 |
Notes to Financial Statements
active markets, interest rates, coupon rates, yield curves, option adjusted spreads, default rates, credit spreads and other unique security features in order to estimate the relevant cash flows which is then discounted to calculate fair values. If these inputs are unobservable and significant to the fair value, these investments will be classified as Level 3. In addition, non-agency rated investments are classified as Level 3.
Other fixed income investments, including non-U.S. government and corporate debt, are generally valued using quoted market prices, if available, which are typically impacted by current interest rates, maturity dates and any perceived credit risk of the issuer. Additionally, in the absence of quoted market prices, these inputs are used by pricing vendors to derive a valuation based upon industry or proprietary models which incorporate issuer specific data with relevant yield/spread comparisons with more widely quoted bonds with similar key characteristics. Those investments for which there are observable inputs are classified as Level 2. Where the inputs are not observable, the investments are classified as Level 3.
The following table summarizes the valuation of the Strategy’s investments by the above fair value hierarchy levels as of October 31, 2016:
Investments in Securities: | Level 1 | Level 2 | Level 3 | Total | ||||||||||||
Assets: | ||||||||||||||||
Long-Term Municipal Bonds | $ | – 0 | – | $ | 708,863,526 | $ | 6,068,785 | $ | 714,932,311 | |||||||
Governments – Treasuries | – 0 | – | 12,933,234 | – 0 | – | 12,933,234 | ||||||||||
Corporates – Investment Grade | – 0 | – | 12,362,171 | – 0 | – | 12,362,171 | ||||||||||
Short-Term Investments | 14,944,940 | – 0 | – | – 0 | – | 14,944,940 | ||||||||||
|
|
|
|
|
|
|
| |||||||||
Total Investments in Securities | 14,944,940 | 734,158,931 | 6,068,785 | 755,172,656 | ||||||||||||
Other Financial Instruments(a): | ||||||||||||||||
Assets: | ||||||||||||||||
Inflation (CPI) Swaps | – 0 | – | 389,276 | – 0 | – | 389,276 | ||||||||||
Liabilities: | ||||||||||||||||
Inflation (CPI) Swaps | – 0 | – | (50,775,449 | ) | – 0 | – | (50,775,449 | ) | ||||||||
Interest Rate Swaps | – 0 | – | (47,244 | ) | – 0 | – | (47,244 | ) | ||||||||
|
|
|
|
|
|
|
| |||||||||
Total(b) | $ | 14,944,940 | $ | 683,725,514 | $ | 6,068,785 | $ | 704,739,239 | ||||||||
|
|
|
|
|
|
|
| |||||||||
| (a) | Other financial instruments are derivative instruments, such as futures, forwards and swaps, which are valued at the unrealized appreciation/depreciation on the instrument. |
| (b) | There were no transfers between Level 1 and Level 2 during the reporting period. |
The Strategy recognizes all transfers between levels of the fair value hierarchy assuming the financial instruments were transferred at the beginning of the reporting period.
| 36 | • AB MUNICIPAL BOND INFLATION STRATEGY |
Notes to Financial Statements
The following is a reconciliation of investments in which significant unobservable inputs (Level 3) were used in determining fair value.
| Long-Term Municipal Bonds | Total | |||||||
Balance as of 10/31/15 | $ | 11,790,811 | $ | 11,790,811 | ||||
Accrued discounts/(premiums) | (31,925 | ) | (31,925 | ) | ||||
Realized gain (loss) | 21,875 | 21,875 | ||||||
Change in unrealized appreciation/depreciation | 216,163 | 216,163 | ||||||
Purchases | 1,323,569 | 1,323,569 | ||||||
Sales | (7,796,875 | ) | (7,796,875 | ) | ||||
Transfers in to Level 3 | 545,167 | 545,167 | ||||||
Transfers out of Level 3 | – 0 | – | – 0 | – | ||||
|
|
|
| |||||
Balance as of 10/31/16 | $ | 6,068,785 | $ | 6,068,785 | (a) | |||
|
|
|
| |||||
Net change in unrealized appreciation/depreciation from investments held as of 10/31/16(b) | $ | 241,859 | $ | 241,859 | ||||
|
|
|
| |||||
| (a) | There were de minimis transfers under 1% of net assets during the reporting period. |
| (b) | The unrealized appreciation/depreciation is included in net change in unrealized appreciation/depreciation on investments and other financial instruments in the accompanying statement of operations. |
The Adviser established the Committee to oversee the pricing and valuation of all securities held in the Strategy. The Committee operates under pricing and valuation policies and procedures established by the Adviser and approved by the Board, including pricing policies which set forth the mechanisms and processes to be employed on a daily basis to implement these policies and procedures. In particular, the pricing policies describe how to determine market quotations for securities and other instruments. The Committee’s responsibilities include: 1) fair value and liquidity determinations (and oversight of any third parties to whom any responsibility for fair value and liquidity determinations is delegated), and 2) regular monitoring of the Adviser’s pricing and valuation policies and procedures and modification or enhancement of these policies and procedures (or recommendation of the modification of these policies and procedures) as the Committee believes appropriate.
The Committee is also responsible for monitoring the implementation of the pricing policies by the Adviser’s Pricing Group (the “Pricing Group”) and a third party which performs certain pricing functions in accordance with the pricing policies. The Pricing Group is responsible for the oversight of the third party on a day-to-day basis. The Committee and the Pricing Group perform a series of activities to provide reasonable assurance of the accuracy of prices including: 1) periodic vendor due diligence meetings, review of methodologies, new developments and processes at vendors, 2) daily comparison of security valuation versus prior day for all securities that exceeded established thresholds, and 3) daily review of unpriced, stale, and variance reports with exceptions reviewed by senior management and the Committee.
| AB MUNICIPAL BOND INFLATION STRATEGY • | 37 |
Notes to Financial Statements
In addition, several processes outside of the pricing process are used to monitor valuation issues including: 1) performance and performance attribution reports are monitored for anomalous impacts based upon benchmark performance, and 2) portfolio managers review all portfolios for performance and analytics (which are generated using the Adviser’s prices).
3. Taxes
It is the Strategy’s policy to meet the requirements of the Internal Revenue Code applicable to regulated investment companies and to distribute all of its investment company taxable income and net realized gains, if any, to shareholders. Therefore, no provisions for federal income or excise taxes are required.
In accordance with U.S. GAAP requirements regarding accounting for uncertainties in income taxes, management has analyzed the Strategy’s tax positions taken or expected to be taken on federal and state income tax returns for all open tax years (the current and the prior three tax years) and has concluded that no provision for income tax is required in the Strategy’s financial statements.
4. Investment Income and Investment Transactions
Dividend income is recorded on the ex-dividend date or as soon as the Strategy is informed of the dividend. Interest income is accrued daily. Investment transactions are accounted for on the date the securities are purchased or sold. Investment gains or losses are determined on the identified cost basis. The Strategy amortizes premiums and accretes original issue discounts and market discounts as adjustments to interest income.
5. Class Allocations
All income earned and expenses incurred by the Strategy are borne on a pro-rata basis by each outstanding class of shares, based on the proportionate interest in the Strategy represented by the net assets of such class, except for class specific expenses which are allocated to the respective class. Expenses of the Company are charged proportionately to each portfolio or based on other appropriate methods. Realized and unrealized gains and losses are allocated among the various share classes based on respective net assets.
6. Dividends and Distributions
Dividends and distributions to shareholders, if any, are recorded on the ex-dividend date. Income dividends and capital gains distributions are determined in accordance with federal tax regulations and may differ from those determined in accordance with U.S. GAAP. To the extent these differences are permanent, such amounts are reclassified within the capital accounts based on their federal tax basis treatment; temporary differences do not require such reclassification.
| 38 | • AB MUNICIPAL BOND INFLATION STRATEGY |
Notes to Financial Statements
NOTE B
Advisory Fee and Other Transactions with Affiliates
Under the terms of the investment advisory agreement, the Strategy pays the Adviser an advisory fee at an annual rate of .50% of the first $2.5 billion, .45% of the next $2.5 billion and .40% in excess of $5 billion, of the Strategy’s average daily net assets. The fee is accrued daily and paid monthly. The Adviser has agreed to waive its fees and bear certain expenses to the extent necessary to limit total operating expenses on an annual basis (the “Expense Caps”) to .75% (.80% prior to January 30, 2015), 1.50%, .50%, .60% and .50% of the daily average net assets for the Class A, Class C, Advisor Class, Class 1 and Class 2 shares, respectively. This fee waiver and/or expense reimbursement agreement will remain in effect until January 29, 2017 and then may be extended by the Adviser for additional one-year terms. For the year ended October 31, 2016, such reimbursement/waivers amounted to $639,269.
Pursuant to the investment advisory agreement, the Strategy may reimburse the Adviser for certain legal and accounting services provided to the Strategy by the Adviser. For the year ended October 31, 2016, the reimbursement for such services amounted to $54,517.
The Strategy compensates AllianceBernstein Investor Services, Inc. (“ABIS”), a wholly-owned subsidiary of the Adviser, under a Transfer Agency Agreement for providing personnel and facilities to perform transfer agency services for the Strategy. ABIS may make payments to intermediaries that provide omnibus account services, sub-accounting services and/or networking services. Such compensation retained by ABIS amounted to $49,871 for the year ended October 31, 2016.
AllianceBernstein Investments, Inc. (the “Distributor”), a wholly-owned subsidiary of the Adviser, serves as the distributor of the Strategy’s shares. The Distributor has advised the Strategy that it has retained front-end sales charges of $39 from the sale of Class A shares and received $816 and $0 in contingent deferred sales charges imposed upon redemptions by shareholders of Class A and Class C shares, respectively, for the year ended October 31, 2016.
The AB Fixed-Income Shares, Inc.—Government STIF Portfolio (the “Government STIF Portfolio”), prior to June 1, 2016, was offered as a cash management option to mutual funds and other institutional accounts of the Adviser, and was not available for direct purchase by members of the public. Prior to June 1, 2016, the Government STIF Portfolio paid no advisory fees but did bear its own expenses. As of June 1, 2016, the Government STIF Portfolio, which was renamed “AB Government Money Market Portfolio” (the “Government Money Market Portfolio”), has a contractual advisory fee rate of .20% and continues
| AB MUNICIPAL BOND INFLATION STRATEGY • | 39 |
Notes to Financial Statements
to bear its own expenses. In connection with the investment by the Strategy in the Government Money Market Portfolio, the Adviser has agreed to waive its advisory fee from the Strategy in an amount equal to the Strategy’s share of the advisory fees of Government Money Market Portfolio, as borne indirectly by the Strategy as an acquired fund fee and expense. For the year ended October 31, 2016, such waiver amounted to $5,429. A summary of the Strategy’s transactions in shares of the Government Money Market Portfolio for the year ended October 31, 2016 is as follows:
Market Value 10/31/15 (000) | Purchases at Cost (000) | Sales Proceeds (000) | Market Value 10/31/16 (000) | Dividend Income (000) | ||||||||||||||
| $ | – 0 | – | $ | 153,107 | $ | 138,162 | $ | 14,945 | $ | 11 | ||||||||
NOTE C
Distribution Services Agreement
The Strategy has adopted a Distribution Services Agreement (the “Agreement”) pursuant to Rule 12b-1 under the Investment Company Act of 1940. Under the Agreement, the Strategy pays distribution and servicing fees to the Distributor at an annual rate of up to .30% of the Strategy’s average daily net assets attributable to Class A shares, 1% of the Strategy’s average daily net assets attributable to Class C shares and .10% of the Strategy’s average daily net assets attributable to Class 1 shares. There are no distribution and servicing fees on the Advisor Class and Class 2 shares. Effective January 30, 2015, payments under the Agreement in respect of Class A shares are limited to an annual rate of .25% of Class A shares’ average daily net assets. The fees are accrued daily and paid monthly. The Agreement provides that the Distributor will use such payments in their entirety for distribution assistance and promotional activities. Since the commencement of the Strategy’s operations, the Distributor has incurred expenses in excess of the distribution costs reimbursed by the Strategy in the amount of $353,773 and $1,637,966 for Class C and Class 1 shares, respectively. While such costs may be recovered from the Strategy in future periods so long as the Agreement is in effect, the rate of the distribution and servicing fees payable under the Agreement may not be increased without a shareholder vote. In accordance with the Agreement, there is no provision for recovery of unreimbursed distribution costs incurred by the Distributor beyond the current fiscal year for Class A shares. The Agreement also provides that the Adviser may use its own resources to finance the distribution of the Strategy’s shares.
| 40 | • AB MUNICIPAL BOND INFLATION STRATEGY |
Notes to Financial Statements
NOTE D
Investment Transactions
Purchases and sales of investment securities (excluding short-term investments) for the year ended October 31, 2016 were as follows:
| Purchases | Sales | |||||||
Investment securities (excluding | $ | 48,937,797 | $ | 107,557,167 | ||||
U.S. government securities | 19,184,238 | 12,501,589 | ||||||
The cost of investments for federal income tax purposes, gross unrealized appreciation and unrealized depreciation (excluding swap transactions) are as follows:
Cost | $ | 721,910,150 | ||
|
| |||
Gross unrealized appreciation | $ | 34,103,336 | ||
Gross unrealized depreciation | (840,830 | ) | ||
|
| |||
Net unrealized appreciation | $ | 33,262,506 | ||
|
|
1. Derivative Financial Instruments
The Strategy may use derivatives in an effort to earn income and enhance returns, to replace more traditional direct investments, to obtain exposure to otherwise inaccessible markets (collectively, “investment purposes”), or to hedge or adjust the risk profile of its portfolio.
The principal type of derivative utilized by the Strategy, as well as the methods in which they may be used are:
| • | Swaps |
The Strategy may enter into swaps to hedge its exposure to interest rates or credit risk. A swap is an agreement that obligates two parties to exchange a series of cash flows at specified intervals based upon or calculated by reference to changes in specified prices or rates for a specified amount of an underlying asset. The payment flows are usually netted against each other, with the difference being paid by one party to the other. In addition, collateral may be pledged or received by the Strategy in accordance with the terms of the respective swaps to provide value and recourse to the Strategy or its counterparties in the event of default, bankruptcy or insolvency by one of the parties to the swap.
Risks may arise as a result of the failure of the counterparty to the swap to comply with the terms of the swap. The loss incurred by the failure of a counterparty is generally limited to the net interim payment to be received by the Strategy, and/or the termination value at the end of the contract. Therefore, the Strategy considers the creditworthiness of each counterparty to a swap in evaluating
| AB MUNICIPAL BOND INFLATION STRATEGY • | 41 |
Notes to Financial Statements
potential counterparty risk. This risk is mitigated by having a netting arrangement between the Strategy and the counterparty and by the posting of collateral by the counterparty to the Strategy to cover the Strategy’s exposure to the counterparty. Additionally, risks may arise from unanticipated movements in interest rates or in the value of the underlying securities. The Strategy accrues for the interim payments on swaps on a daily basis, with the net amount recorded within unrealized appreciation/depreciation of swaps on the statement of assets and liabilities, where applicable. Once the interim payments are settled in cash, the net amount is recorded as realized gain/(loss) on swaps on the statement of operations, in addition to any realized gain/(loss) recorded upon the termination of swaps. Upfront premiums paid or received are recognized as cost or proceeds on the statement of assets and liabilities and are amortized on a straight line basis over the life of the contract. Amortized upfront premiums are included in net realized gain/(loss) from swaps on the statement of operations. Fluctuations in the value of swaps are recorded as a component of net change in unrealized appreciation/depreciation of swaps on the statement of operations.
Inflation (CPI) Swaps:
Inflation swaps are contracts in which one party agrees to pay the cumulative percentage increase in a price index (the Consumer Price Index with respect to CPI swaps) over the term of the swap (with some lag on the inflation index), and the other pays a compounded fixed rate. Inflation swaps may be used to protect the net asset value, or NAV, of the Strategy against an unexpected change in the rate of inflation measured by an inflation index since the value of these agreements is expected to increase if unexpected inflation increases.
During the year ended October 31, 2016, the Strategy held inflation (CPI) swaps for hedging purposes.
Interest Rate Swaps:
The Strategy is subject to interest rate risk exposure in the normal course of pursuing its investment objectives. Because the Strategy holds fixed rate bonds, the value of these bonds may decrease if interest rates rise. To help hedge against this risk and to maintain its ability to generate income at prevailing market rates, the Strategy may enter into interest rate swaps. Interest rate swaps are agreements between two parties to exchange cash flows based on a notional amount. The Strategy may elect to pay a fixed rate and receive a floating rate, or, receive a fixed rate and pay a floating rate on a notional amount.
| 42 | • AB MUNICIPAL BOND INFLATION STRATEGY |
Notes to Financial Statements
In addition, the Strategy may also enter into interest rate swap transactions to preserve a return or spread on a particular investment or portion of its portfolio, or protecting against an increase in the price of securities the Strategy anticipates purchasing at a later date. Interest rate swaps involve the exchange by a Strategy with another party of their respective commitments to pay or receive interest (e.g., an exchange of floating rate payments for fixed rate payments) computed based on a contractually-based principal (or “notional”) amount. Interest rate swaps are entered into on a net basis (i.e., the two payment streams are netted out, with the Strategy receiving or paying, as the case may be, only the net amount of the two payments).
During the year ended October 31, 2016, the Strategy held interest rate swaps for hedging purposes.
The Strategy typically enters into International Swaps and Derivatives Association, Inc. Master Agreements (“ISDA Master Agreement”) or similar master agreements (collectively, “Master Agreements”) with its derivative contract counterparties in order to, among other things, reduce its credit risk to counterparties. ISDA Master Agreements include provisions for general obligations, representations, collateral and events of default or termination. Under an ISDA Master Agreement, the Strategy typically may offset with the counterparty certain derivative financial instrument’s payables and/or receivables with collateral held and/or posted and create one single net payment (close-out netting) in the event of default or termination.
Various Master Agreements govern the terms of certain transactions with counterparties, including transactions such as derivative transactions, repurchase and reverse repurchase agreements. These Master Agreements typically attempt to reduce the counterparty risk associated with such transactions by specifying credit protection mechanisms and providing standardization that improves legal certainty. Cross-termination provisions under Master Agreements typically provide that a default in connection with one transaction between the Strategy and a counterparty gives the non-defaulting party the right to terminate any other transactions in place with the defaulting party to create one single net payment due to/due from the defaulting party. In the event of a default by a Master Agreements counterparty, the return of collateral with market value in excess of the Strategy’s net liability, held by the defaulting party, may be delayed or denied.
The Strategy’s Master Agreements may contain provisions for early termination of OTC derivative transactions in the event the net assets of the Strategy decline below specific levels (“net asset contingent features”). If
| AB MUNICIPAL BOND INFLATION STRATEGY • | 43 |
Notes to Financial Statements
these levels are triggered, the Strategy’s counterparty has the right to terminate such transaction and require the Strategy to pay or receive a settlement amount in connection with the terminated transaction. For additional details, please refer to netting arrangements by counterparty tables below.
During the year ended October 31, 2016, the Strategy had entered into the following derivatives:
Asset Derivatives | Liability Derivatives | |||||||||||
Derivative Type | Statement of | Fair Value | Statement of | Fair Value | ||||||||
Interest rate contracts | Unrealized depreciation on interest rate swaps | $ | 47,244 |
| ||||||||
Interest rate contracts | Unrealized appreciation on inflation swaps | $ | 389,276 |
| Unrealized depreciation on inflation swaps |
| 50,775,449 |
| ||||
|
|
|
| |||||||||
Total | $ | 389,276 | $ | 50,822,693 | ||||||||
|
|
|
| |||||||||
Derivative Type | Location of Gain | Realized Gain or (Loss) on Derivatives | Change in Unrealized Appreciation or (Depreciation) | |||||||||
Interest rate contracts | Net realized gain (loss) on swaps; Net change in unrealized appreciation/depreciation of swaps | $ | (2,139,458 | ) | $ | 6,256,263 | ||||||
|
|
|
| |||||||||
Total | $ | (2,139,458 | ) | $ | 6,256,263 | |||||||
|
|
|
| |||||||||
The following table represents the average monthly volume of the Strategy’s derivative transactions during the year ended October 31, 2016:
Interest Rate Swaps: | ||||
Average notional amount | $ | 19,807,692 | ||
Inflation Swaps: |
| |||
Average notional amount | $ | 605,061,538 | ||
For financial reporting purposes, the Strategy does not offset derivative assets and derivative liabilities that are subject to netting arrangements in the statement of assets and liabilities.
| 44 | • AB MUNICIPAL BOND INFLATION STRATEGY |
Notes to Financial Statements
All derivatives held at period end were subject to netting arrangements. The following table presents the Strategy’s derivative assets and liabilities by counterparty net of amounts available for offset under Master Agreements (“MA”) and net of the related collateral received/pledged by the Strategy as of October 31, 2016:
Counterparty | Derivative Assets Subject to a MA | Derivative Available for Offset | Cash Collateral Received | Security Collateral Received | Net Amount of Derivatives Assets | |||||||||||||||
OTC Derivatives: |
| |||||||||||||||||||
Bank of America, NA | $ | 179,554 | $ | – 0 | – | $ | – 0 | – | $ | – 0 | – | $ | 179,554 | |||||||
Citibank, NA | 209,722 | (209,722 | ) | – 0 | – | – 0 | – | – 0 | – | |||||||||||
|
|
|
|
|
|
|
|
|
| |||||||||||
Total | $ | 389,276 | $ | (209,722 | ) | $ | – 0 | – | $ | – 0 | – | $ | 179,554 | ^ | ||||||
|
|
|
|
|
|
|
|
|
| |||||||||||
Counterparty | Derivative Liabilities Subject to a MA | Derivative Available for Offset | Cash Collateral Pledged | Security Collateral Pledged* | Net Amount of Derivatives Liabilities | |||||||||||||||
OTC Derivatives: |
| |||||||||||||||||||
Barclays Bank PLC | $ | 13,393,234 | $ | – 0 | – | $ | – 0 | – | $ | (13,393,234 | ) | $ | – 0 | – | ||||||
Citibank, NA | 17,072,049 | (209,722 | ) | – 0 | – | (16,862,327 | ) | – 0 | – | |||||||||||
Deutsche Bank AG | 2,278,461 | – 0 | – | – 0 | – | (2,278,461 | ) | – 0 | – | |||||||||||
JPMorgan Chase Bank, NA | 11,003,455 | – 0 | – | – 0 | – | (11,003,455 | ) | – 0 | – | |||||||||||
Morgan Stanley Capital Services LLC | 7,075,494 | – 0 | – | – 0 | – | (7,075,494 | ) | – 0 | – | |||||||||||
|
|
|
|
|
|
|
|
|
| |||||||||||
Total | $ | 50,822,693 | $ | (209,722 | ) | $ | – 0 | – | $ | (50,612,971 | ) | $ | – 0 | –^ | ||||||
|
|
|
|
|
|
|
|
|
| |||||||||||
| * | The actual collateral received/pledged is more than the amount reported due to over-collateralization. |
| ^ | Net amount represents the net receivable/payable that would be due from/to the counterparty in the event of default or termination. The net amount from OTC financial derivative instruments can only be netted across transactions governed under the same master agreement with the same counterparty. |
| AB MUNICIPAL BOND INFLATION STRATEGY • | 45 |
Notes to Financial Statements
NOTE E
Capital Stock
Each class consists of 3,000,000,000 authorized shares. Transactions in capital shares for Class A, Class C, Advisor Class, Class 1 and Class 2 were as follows:
| Shares | Amount | |||||||||||||||||||||||
| Year Ended October 31, 2016 | Year Ended October 31, 2015 | Year Ended October 31, 2016 | Year Ended October 31, 2015 | |||||||||||||||||||||
|
| |||||||||||||||||||||||
| Class A | ||||||||||||||||||||||||
Shares sold | 612,904 | 574,262 | $ | 6,270,343 | $ | 5,854,217 | ||||||||||||||||||
| ||||||||||||||||||||||||
Shares issued in reinvestment of dividends and distributions | 47,816 | 50,831 | 487,459 | 519,144 | ||||||||||||||||||||
| ||||||||||||||||||||||||
Shares redeemed | (1,087,170 | ) | (2,298,134 | ) | (11,086,129 | ) | (23,438,197 | ) | ||||||||||||||||
| ||||||||||||||||||||||||
Net decrease | (426,450 | ) | (1,673,041 | ) | $ | (4,328,327 | ) | $ | (17,064,836 | ) | ||||||||||||||
| ||||||||||||||||||||||||
| Class C | ||||||||||||||||||||||||
Shares sold | 74,599 | 72,666 | $ | 760,864 | $ | 748,781 | ||||||||||||||||||
| ||||||||||||||||||||||||
Shares issued in reinvestment of dividends and distributions | 9,167 | 9,189 | 93,308 | 93,690 | ||||||||||||||||||||
| ||||||||||||||||||||||||
Shares redeemed | (331,629 | ) | (778,319 | ) | (3,381,118 | ) | (7,932,614 | ) | ||||||||||||||||
| ||||||||||||||||||||||||
Net decrease | (247,863 | ) | (696,464 | ) | $ | (2,526,946 | ) | $ | (7,090,143 | ) | ||||||||||||||
| ||||||||||||||||||||||||
| Advisor Class | ||||||||||||||||||||||||
Shares sold | 1,850,768 | 5,702,013 | $ | 18,907,336 | $ | 58,371,560 | ||||||||||||||||||
| ||||||||||||||||||||||||
Shares issued in reinvestment of dividends and distributions | 235,187 | 206,101 | 2,399,197 | 2,103,606 | ||||||||||||||||||||
| ||||||||||||||||||||||||
Shares redeemed | (4,229,484 | ) | (6,633,298 | ) | (43,229,628 | ) | (67,756,331 | ) | ||||||||||||||||
| ||||||||||||||||||||||||
Net decrease | (2,143,529 | ) | (725,184 | ) | $ | (21,923,095 | ) | $ | (7,281,165 | ) | ||||||||||||||
| ||||||||||||||||||||||||
| Class 1 | ||||||||||||||||||||||||
Shares sold | 3,544,601 | 6,726,352 | $ | 36,078,979 | $ | 68,580,370 | ||||||||||||||||||
| ||||||||||||||||||||||||
Shares issued in reinvestment of dividends and distributions | 565,721 | 508,639 | 5,749,029 | 5,176,475 | ||||||||||||||||||||
| ||||||||||||||||||||||||
Shares redeemed | (9,837,890 | ) | (8,073,275 | ) | (100,065,872 | ) | (82,131,654 | ) | ||||||||||||||||
| ||||||||||||||||||||||||
Net decrease | (5,727,568 | ) | (838,284 | ) | $ | (58,237,864 | ) | $ | (8,374,809 | ) | ||||||||||||||
| ||||||||||||||||||||||||
| 46 | • AB MUNICIPAL BOND INFLATION STRATEGY |
Notes to Financial Statements
| Shares | Amount | |||||||||||||||||||||||
| Year Ended October 31, 2016 | Year Ended October 31, 2015 | Year Ended October 31, 2016 | Year Ended October 31, 2015 | |||||||||||||||||||||
|
| |||||||||||||||||||||||
| Class 2 | ||||||||||||||||||||||||
Shares sold | 2,818,891 | 3,789,659 | $ | 28,753,538 | $ | 38,748,186 | ||||||||||||||||||
| ||||||||||||||||||||||||
Shares issued in reinvestment of dividends and distributions | 246,291 | 221,546 | 2,505,442 | 2,255,832 | ||||||||||||||||||||
| ||||||||||||||||||||||||
Shares redeemed | (3,889,115 | ) | (4,381,725 | ) | (39,581,027 | ) | (44,643,197 | ) | ||||||||||||||||
| ||||||||||||||||||||||||
Net decrease | (823,933 | ) | (370,520 | ) | $ | (8,322,047 | ) | $ | (3,639,179 | ) | ||||||||||||||
| ||||||||||||||||||||||||
NOTE F
Risks Involved in Investing in the Strategy
Credit Risk—An issuer or guarantor of a fixed-income security, or the counterparty to a derivatives or other contract, may be unable or unwilling to make timely payments of interest or principal, or to otherwise honor its obligations. The issuer or guarantor may default, causing a loss of the full principal amount of a security. The degree of risk for a particular security may be reflected in its credit rating. There is the possibility that the credit rating of a fixed-income security may be downgraded after purchase, which may adversely affect the value of the security. Investments in fixed-income securities with lower ratings tend to have a higher probability that an issuer will default or fail to meet its payment obligations.
Municipal Market Risk—This is the risk that special factors may adversely affect the value of municipal securities and have a significant effect on the yield or value of the Strategy’s investments in municipal securities. These factors include economic conditions, political or legislative changes, uncertainties related to the tax status of municipal securities, or the rights of investors in these securities. To the extent that the Strategy invests more of its assets in a particular state’s municipal securities, the Strategy may be vulnerable to events adversely affecting that state, including economic, political and regulatory occurrences, court decisions, terrorism and catastrophic natural disasters. The Strategy’s investments in certain municipal securities with principal and interest payments that are made from the revenues of a specific project or facility, and not general tax revenues, may have increased risks. Factors affecting the project or facility, such as local business or economic conditions, could have a significant effect on the project’s ability to make payments of principal and interest on these securities.
The Strategy may invest in the municipal securities of Puerto Rico and other U.S. territories and their governmental agencies and municipalities, which are exempt from federal, state, and, where applicable, local income
| AB MUNICIPAL BOND INFLATION STRATEGY • | 47 |
Notes to Financial Statements
taxes. These municipal securities may have more risks than those of other U.S. issuers of municipal securities. Like many U.S. states and municipalities, Puerto Rico experienced a significant downturn during the recession. Puerto Rico’s downturn was particularly severe, and Puerto Rico continues to face a very challenging economic and fiscal environment. Municipal securities issued by Puerto Rico issuers have extremely low ratings by the credit rating organizations. More recently Puerto Rico has defaulted on its debt payments, and if the general economic situation in Puerto Rico persists, the volatility and credit quality of Puerto Rican municipal securities will continue to be adversely affected, and the market for such securities may experience continued volatility. In addition, Puerto Rico’s difficulties have resulted in increased volatility in portions of the broader municipal securities market from time to time, and this may recur in the future.
Interest Rate Risk—Changes in interest rates will affect the value of investments in fixed-income securities. When interest rates rise, the value of investments in fixed-income securities tends to fall and this decrease in value may not be offset by higher income from new investments. The Strategy may be subject to a heightened risk of rising interest rates as the current period of historically low rates is beginning to end and rates have begun rising. Interest rate risk is generally greater for fixed-income securities with longer maturities or durations.
Duration Risk—Duration is a measure that relates the expected price volatility of a fixed-income security to changes in interest rates. The duration of a fixed-income security may be shorter than or equal to full maturity of a fixed-income security. Fixed-income securities with longer durations have more risk and will decrease in price as interest rates rise. For example, a fixed-income security with a duration of three years will decrease in value by approximately 3% if interest rates increase by 1%.
Inflation Risk—This is the risk that the value of assets or income from investments will be less in the future as inflation decreases the value of money. As inflation increases, the value of the Strategy’s assets can decline as can the value of the Strategy’s distributions. This risk is significantly greater for fixed-income securities with longer maturities.
Derivatives Risk—The Strategy may enter into derivative transactions such as forwards, options, futures and swaps. Derivatives may be illiquid, difficult to price, and leveraged so that small changes may produce disproportionate losses for the Strategy, and subject to counterparty risk to a greater degree than more traditional investments. Derivatives may result in significant losses, including losses that are far greater than the value of the derivatives reflected on the statement of assets and liabilities.
| 48 | • AB MUNICIPAL BOND INFLATION STRATEGY |
Notes to Financial Statements
Leverage Risk—When the Strategy borrows money or otherwise leverages its investments, its performance may be volatile because leverage tends to exaggerate the effect of any increase or decrease in the value of the Strategy’s investments. The Strategy may create leverage through the use of reverse repurchase arrangements, forward currency exchange contracts, forward commitments, dollar rolls or futures or by borrowing money. The use of derivative instruments by the Strategy, such as forwards, futures, options and swaps, may also result in a form of leverage. Leverage may result in higher returns to the Strategy than if the Strategy were not leveraged, but may also adversely affect returns, particularly if the market is declining.
Liquidity Risk—Liquidity risk occurs when certain investments become difficult to purchase or sell. Difficulty in selling less liquid securities may result in sales at disadvantageous prices affecting the value of your investment in the Strategy. Causes of liquidity risk may include low trading volumes, large positions and heavy redemptions of fund shares. Over recent years liquidity risk has also increased because the capacity of dealers in the secondary market for fixed-income securities to make markets in these securities has decreased, even as the overall bond market has grown significantly, due to, among other things, structural changes, additional regulatory requirements and capital and risk restraints that have led to reduced inventories. Liquidity risk may be higher in a rising interest rate environment, when the value and liquidity of fixed-income securities generally go down.
Indemnification Risk—In the ordinary course of business, the Strategy enters into contracts that contain a variety of indemnifications. The Strategy’s maximum exposure under these arrangements is unknown. However, the Strategy has not had prior claims or losses pursuant to these indemnification provisions and expects the risk of loss thereunder to be remote. Therefore, the Strategy has not accrued any liability in connection with these indemnification provisions.
NOTE G
Joint Credit Facility
A number of open-end mutual funds managed by the Adviser, including the Strategy, participate in a $280 million revolving credit facility (the “Facility”) intended to provide short-term financing, if necessary, subject to certain restrictions in connection with abnormal redemption activity. Commitment fees related to the Facility are paid by the participating funds and are included in miscellaneous expenses in the statement of operations. The Strategy did not utilize the Facility during the year ended October 31, 2016.
| AB MUNICIPAL BOND INFLATION STRATEGY • | 49 |
Notes to Financial Statements
NOTE H
Distributions to Shareholders
The tax character of distributions paid during the fiscal years ended October 31, 2016 and October 31, 2015 were as follows:
| 2016 | 2015 | |||||||
Distributions paid from: | ||||||||
Ordinary income | $ | 423,254 | $ | 456,565 | ||||
Long-term capital gains | – 0 | – | – 0 | – | ||||
|
|
|
| |||||
Total taxable distributions | 423,254 | 456,565 | ||||||
Tax-exempt distributions | 14,742,426 | 13,443,276 | ||||||
|
|
|
| |||||
Total distributions paid | $ | 15,165,680 | $ | 13,899,841 | ||||
|
|
|
| |||||
As of October 31, 2016, the components of accumulated earnings/(deficit) on a tax basis were as follows:
Undistributed tax-exempt income | $ | 70,147 | ||
Accumulated capital and other losses | (5,746,624 | )(a) | ||
Unrealized appreciation/(depreciation) | (17,170,302 | )(b) | ||
|
| |||
Total accumulated earnings/(deficit) | $ | (22,846,779 | ) | |
|
|
| (a) | As of October 31, 2016, the Strategy had a net capital loss carryforward of $5,746,624. |
| (b) | The difference between book-basis and tax-basis unrealized appreciation/(depreciation) is attributable primarily to the tax treatment of swaps. |
For tax purposes, net realized capital losses may be carried over to offset future capital gains, if any. Funds are permitted to carry forward capital losses for an indefinite period, and such losses will retain their character as either short-term or long-term capital losses. As of October 31, 2016, the Strategy had a net short-term capital loss carryforward of $344,563 and a net long-term capital loss carryforward of $5,402,061 which may be carried forward for an indefinite period.
During the current fiscal year, permanent differences primarily due to the tax treatment of swaps, resulted in a net decrease in undistributed net investment income and a net decrease in accumulated net realized loss on investment and foreign currency transactions. These reclassifications had no effect on net assets.
NOTE I
New Accounting Pronouncements
In May 2015, the Financial Accounting Standards Board issued an Accounting Standards Update, ASU 2015-07 (the “ASU”) which removes the requirement to categorize within the fair value hierarchy all investments for which fair value is measured using the net asset value per share practical expedient. The ASU also removes the requirement to
| 50 | • AB MUNICIPAL BOND INFLATION STRATEGY |
Notes to Financial Statements
make certain disclosures for investments that are eligible to be measured at fair value using the net asset value per share practical expedient but do not utilize that practical expedient. The ASU is effective for annual periods beginning after December 15, 2015 and interim periods within those annual periods. Management has evaluated the implications of these changes and there will be no impact to the financial statements.
NOTE J
Other
In October 2016, the U.S. Securities and Exchange Commission adopted new rules and amended existing rules (together, “final rules”) intended to modernize the reporting and disclosure of information by registered investment companies. In part, the final rules amend Regulation S-X and require standardized, enhanced disclosure about derivatives in investment company financial statements, as well as other amendments. The compliance date for the amendments to Regulation S-X is August 1, 2017. Management is currently evaluating the impact that the adoption of the amendments to Regulation S-X will have on the financial statements and related disclosures.
NOTE K
Subsequent Events
Management has evaluated subsequent events for possible recognition or disclosure in the financial statements through the date the financial statements are issued. Management has determined that there are no material events that would require disclosure in the Strategy’s financial statements through this date.
| AB MUNICIPAL BOND INFLATION STRATEGY • | 51 |
Notes to Financial Statements
FINANCIAL HIGHLIGHTS
Selected Data For A Share Of Capital Stock Outstanding Throughout Each Period
| Class A | ||||||||||||||||||||
| Year Ended October 31, | ||||||||||||||||||||
| 2016 | 2015 | 2014 | 2013 | 2012 | ||||||||||||||||
|
| |||||||||||||||||||
Net asset value, beginning of period | $ 10.14 | $ 10.48 | $ 10.35 | $ 10.80 | $ 10.32 | |||||||||||||||
|
| |||||||||||||||||||
Income From Investment Operations | ||||||||||||||||||||
Net investment income(a)(b) | .18 | .15 | .13 | .12 | .14 | |||||||||||||||
Net realized and unrealized gain (loss) on investment transactions | .16 | (.34 | ) | .12 | (.44 | ) | .50 | |||||||||||||
|
| |||||||||||||||||||
Net increase (decrease) in net asset value from operations | .34 | (.19 | ) | .25 | (.32 | ) | .64 | |||||||||||||
|
| |||||||||||||||||||
Less: Dividends and Distributions | ||||||||||||||||||||
Dividends from net investment income | (.19 | ) | (.15 | ) | (.12 | ) | (.11 | ) | (.14 | ) | ||||||||||
Distributions from net realized gain on investment transactions | – 0 | – | – 0 | – | (.00 | )(c) | (.02 | ) | (.02 | ) | ||||||||||
|
| |||||||||||||||||||
Total dividends and distributions | (.19 | ) | (.15 | ) | (.12 | ) | (.13 | ) | (.16 | ) | ||||||||||
|
| |||||||||||||||||||
Net asset value, end of period | $ 10.29 | $ 10.14 | $ 10.48 | $ 10.35 | $ 10.80 | |||||||||||||||
|
| |||||||||||||||||||
Total Return | ||||||||||||||||||||
Total investment return based on net asset value(d) | 3.38 | % | (1.83 | )% | 2.44 | % | (2.98 | )% | 6.22 | % | ||||||||||
Ratios/Supplemental Data | ||||||||||||||||||||
Net assets, end of period (000’s omitted) | $37,345 | $41,122 | $60,016 | $95,466 | $79,735 | |||||||||||||||
Ratio to average net assets of: | ||||||||||||||||||||
Expenses, net of waivers/reimbursements | .75 | % | .76 | % | .80 | % | .80 | % | .80 | % | ||||||||||
Expenses, before waivers/reimbursements | .86 | % | .87 | % | .90 | % | .91 | % | .95 | % | ||||||||||
Net investment income(a) | 1.78 | % | 1.49 | % | 1.24 | % | 1.10 | % | 1.34 | % | ||||||||||
Portfolio turnover rate | 9 | % | 17 | % | 18 | % | 15 | % | 10 | % | ||||||||||
See footnote summary on page 57.
| 52 | • AB MUNICIPAL BOND INFLATION STRATEGY |
Financial Highlights
Selected Data For A Share Of Capital Stock Outstanding Throughout Each Period
| Class C | ||||||||||||||||||||
| Year Ended October 31, | ||||||||||||||||||||
| 2016 | 2015 | 2014 | 2013 | 2012 | ||||||||||||||||
|
| |||||||||||||||||||
Net asset value, beginning of period | $ 10.12 | $ 10.46 | $ 10.33 | $ 10.78 | $ 10.30 | |||||||||||||||
|
| |||||||||||||||||||
Income From Investment Operations | ||||||||||||||||||||
Net investment income(a)(b) | .10 | .08 | .06 | .04 | .07 | |||||||||||||||
Net realized and unrealized gain (loss) on investment transactions | .16 | (.35 | ) | .12 | (.43 | ) | .50 | |||||||||||||
|
| |||||||||||||||||||
Net increase (decrease) in net asset value from operations | .26 | (.27 | ) | .18 | (.39 | ) | .57 | |||||||||||||
|
| |||||||||||||||||||
Less: Dividends and Distributions | ||||||||||||||||||||
Dividends from net investment income | (.11 | ) | (.07 | ) | (.05 | ) | (.04 | ) | (.07 | ) | ||||||||||
Distributions from net realized gain on investment transactions | – 0 | – | – 0 | – | (.00 | )(c) | (.02 | ) | (.02 | ) | ||||||||||
|
| |||||||||||||||||||
Total dividends and distributions | (.11 | ) | (.07 | ) | (.05 | ) | (.06 | ) | (.09 | ) | ||||||||||
|
| |||||||||||||||||||
Net asset value, end of period | $ 10.27 | $ 10.12 | $ 10.46 | $ 10.33 | $ 10.78 | |||||||||||||||
|
| |||||||||||||||||||
Total Return | ||||||||||||||||||||
Total investment return based on net asset value(d) | 2.61 | % | (2.56 | )% | 1.72 | % | (3.67 | )% | 5.51 | % | ||||||||||
Ratios/Supplemental Data | ||||||||||||||||||||
Net assets, end of period (000’s omitted) | $10,805 | $13,154 | $20,873 | $29,748 | $35,436 | |||||||||||||||
Ratio to average net assets of: | ||||||||||||||||||||
Expenses, net of waivers/reimbursements | 1.50 | % | 1.50 | % | 1.50 | % | 1.50 | % | 1.50 | % | ||||||||||
Expenses, before waivers/reimbursements | 1.61 | % | 1.61 | % | 1.60 | % | 1.61 | % | 1.65 | % | ||||||||||
Net investment income(a) | 1.03 | % | .75 | % | .54 | % | .41 | % | .64 | % | ||||||||||
Portfolio turnover rate | 9 | % | 17 | % | 18 | % | 15 | % | 10 | % | ||||||||||
See footnote summary on page 57.
| AB MUNICIPAL BOND INFLATION STRATEGY • | 53 |
Financial Highlights
Selected Data For A Share Of Capital Stock Outstanding Throughout Each Period
| Advisor Class | ||||||||||||||||||||
| Year Ended October 31, | ||||||||||||||||||||
| 2016 | 2015 | 2014 | 2013 | 2012 | ||||||||||||||||
|
| |||||||||||||||||||
Net asset value, beginning of period | $ 10.14 | $ 10.48 | $ 10.35 | $ 10.81 | $ 10.32 | |||||||||||||||
|
| |||||||||||||||||||
Income From Investment Operations | ||||||||||||||||||||
Net investment income(a)(b) | .21 | .18 | .16 | .15 | .17 | |||||||||||||||
Net realized and unrealized gain (loss) on investment transactions | .17 | (.34 | ) | .12 | (.45 | ) | .51 | |||||||||||||
|
| |||||||||||||||||||
Net increase (decrease) in net asset value from operations | .38 | (.16 | ) | .28 | (.30 | ) | .68 | |||||||||||||
|
| |||||||||||||||||||
Less: Dividends and Distributions | ||||||||||||||||||||
Dividends from net investment income | (.22 | ) | (.18 | ) | (.15 | ) | (.14 | ) | (.17 | ) | ||||||||||
Distributions from net realized gain on investment transactions | – 0 | – | – 0 | – | (.00 | )(c) | (.02 | ) | (.02 | ) | ||||||||||
|
| |||||||||||||||||||
Total dividends and distributions | (.22 | ) | (.18 | ) | (.15 | ) | (.16 | ) | (.19 | ) | ||||||||||
|
| |||||||||||||||||||
Net asset value, end of period | $ 10.30 | $ 10.14 | $ 10.48 | $ 10.35 | $ 10.81 | |||||||||||||||
|
| |||||||||||||||||||
Total Return | ||||||||||||||||||||
Total investment return based on net asset value(d) | 3.74 | % | (1.56 | )% | 2.75 | % | (2.78 | )% | 6.64 | % | ||||||||||
Ratios/Supplemental Data | ||||||||||||||||||||
Net assets, end of period | $152,275 | $171,789 | $185,106 | $179,620 | $85,781 | |||||||||||||||
Ratio to average net assets of: | ||||||||||||||||||||
Expenses, net of waivers/reimbursements | .50 | % | .50 | % | .50 | % | .50 | % | .50 | % | ||||||||||
Expenses, before waivers/reimbursements | .61 | % | .61 | % | .60 | % | .61 | % | .65 | % | ||||||||||
Net investment income(a) | 2.03 | % | 1.76 | % | 1.55 | % | 1.39 | % | 1.63 | % | ||||||||||
Portfolio turnover rate | 9 | % | 17 | % | 18 | % | 15 | % | 10 | % | ||||||||||
See footnote summary on page 57.
| 54 | • AB MUNICIPAL BOND INFLATION STRATEGY |
Financial Highlights
Selected Data For A Share Of Capital Stock Outstanding Throughout Each Period
| Class 1 | ||||||||||||||||||||
| Year Ended October 31, | ||||||||||||||||||||
| 2016 | 2015 | 2014 | 2013 | 2012 | ||||||||||||||||
|
| |||||||||||||||||||
Net asset value, beginning of period | $ 10.11 | $ 10.45 | $ 10.33 | $ 10.78 | $ 10.30 | |||||||||||||||
|
| |||||||||||||||||||
Income From Investment Operations | ||||||||||||||||||||
Net investment income(a)(b) | .20 | .17 | .15 | .14 | .16 | |||||||||||||||
Net realized and unrealized gain (loss) on investment transactions | .16 | (.34 | ) | .12 | (.43 | ) | .50 | |||||||||||||
|
| |||||||||||||||||||
Net increase (decrease) in net asset value from operations | .36 | (.17 | ) | .27 | (.29 | ) | .66 | |||||||||||||
|
| |||||||||||||||||||
Less: Dividends and Distributions | ||||||||||||||||||||
Dividends from net investment income | (.21 | ) | (.17 | ) | (.15 | ) | (.14 | ) | (.16 | ) | ||||||||||
Distributions from net realized gain on investment transactions | – 0 | – | – 0 | – | (.00 | )(c) | (.02 | ) | (.02 | ) | ||||||||||
|
| |||||||||||||||||||
Total dividends and distributions | (.21 | ) | (.17 | ) | (.15 | ) | (.16 | ) | (.18 | ) | ||||||||||
|
| |||||||||||||||||||
Net asset value, end of period | $ 10.26 | $ 10.11 | $ 10.45 | $ 10.33 | $ 10.78 | |||||||||||||||
|
| |||||||||||||||||||
Total Return | ||||||||||||||||||||
Total investment return based on net asset value(d) | 3.58 | % | (1.62 | )% | 2.60 | % | (2.76 | )% | 6.45 | % | ||||||||||
Ratios/Supplemental Data | ||||||||||||||||||||
Net assets, end of period (000’s omitted) | $333,311 | $386,448 | $408,307 | $419,573 | $236,285 | |||||||||||||||
Ratio to average net assets of: | ||||||||||||||||||||
Expenses, net of waivers/reimbursements | .60 | % | .60 | % | .60 | % | .60 | % | .60 | % | ||||||||||
Expenses, before waivers/reimbursements | .68 | % | .67 | % | .66 | % | .67 | % | .74 | % | ||||||||||
Net investment income(a) | 1.93 | % | 1.66 | % | 1.44 | % | 1.30 | % | 1.54 | % | ||||||||||
Portfolio turnover rate | 9 | % | 17 | % | 18 | % | 15 | % | 10 | % | ||||||||||
See footnote summary on page 57.
| AB MUNICIPAL BOND INFLATION STRATEGY • | 55 |
Financial Highlights
Selected Data For A Share Of Capital Stock Outstanding Throughout Each Period
| Class 2 | ||||||||||||||||||||
| Year Ended October 31, | ||||||||||||||||||||
| 2016 | 2015 | 2014 | 2013 | 2012 | ||||||||||||||||
|
| |||||||||||||||||||
Net asset value, beginning of period | $ 10.12 | $ 10.46 | $ 10.33 | $ 10.79 | $ 10.31 | |||||||||||||||
|
| |||||||||||||||||||
Income From Investment Operations | ||||||||||||||||||||
Net investment income(a)(b) | .21 | .18 | .16 | .15 | .17 | |||||||||||||||
Net realized and unrealized gain (loss) on investment transactions | .15 | (.34 | ) | .13 | (.44 | ) | .50 | |||||||||||||
|
| |||||||||||||||||||
Net increase (decrease) in net asset value from operations | .36 | (.16 | ) | .29 | (.29 | ) | .67 | |||||||||||||
|
| |||||||||||||||||||
Less: Dividends and Distributions | ||||||||||||||||||||
Dividends from net investment income | (.22 | ) | (.18 | ) | (.16 | ) | (.15 | ) | (.17 | ) | ||||||||||
Distributions from net realized gain on investment transactions | – 0 | – | – 0 | – | (.00 | )(c) | (.02 | ) | (.02 | ) | ||||||||||
|
| |||||||||||||||||||
Total dividends and distributions | (.22 | ) | (.18 | ) | (.16 | ) | (.17 | ) | (.19 | ) | ||||||||||
|
| |||||||||||||||||||
Net asset value, end of period | $ 10.26 | $ 10.12 | $ 10.46 | $ 10.33 | $ 10.79 | |||||||||||||||
|
| |||||||||||||||||||
Total Return | ||||||||||||||||||||
Total investment return based on net asset value(d) | 3.58 | % | (1.52 | )% | 2.79 | % | (2.75 | )% | 6.54 | % | ||||||||||
Ratios/Supplemental Data | ||||||||||||||||||||
Net assets, end of period (000’s omitted) | $170,155 | $176,066 | $185,904 | $183,237 | $92,507 | |||||||||||||||
Ratio to average net assets of: | ||||||||||||||||||||
Expenses, net of waivers | .50 | % | .50 | % | .50 | % | .50 | % | .50 | % | ||||||||||
Expenses, before waivers | .58 | % | .57 | % | .56 | % | .57 | % | .64 | % | ||||||||||
Net investment income(a) | 2.03 | % | 1.76 | % | 1.54 | % | 1.39 | % | 1.64 | % | ||||||||||
Portfolio turnover rate | 9 | % | 17 | % | 18 | % | 15 | % | 10 | % | ||||||||||
See footnote summary on page 57.
| 56 | • AB MUNICIPAL BOND INFLATION STRATEGY |
Financial Highlights
| (a) | Net of fees waived and expenses reimbursed by the Adviser. |
| (b) | Based on average shares outstanding. |
| (c) | Amount is less than $.005. |
| (d) | Total investment return is calculated assuming an initial investment made at the net asset value at the beginning of the period, reinvestment of all dividends and distributions at net asset value during the period, and redemption on the last day of the period. Initial sales charges or contingent deferred sales charges are not reflected in the calculation of total investment return. Total return does not reflect the deduction of taxes that a shareholder would pay on portfolio distributions or the redemption of portfolio shares. Total investment return calculated for a period of less than one year is not annualized. |
See notes to financial statements.
| AB MUNICIPAL BOND INFLATION STRATEGY • | 57 |
Financial Highlights
REPORT OF INDEPENDENT REGISTERED
PUBLIC ACCOUNTING FIRM
To the Board of Directors and Shareholders of AB Municipal Bond Inflation Strategy Portfolio
We have audited the accompanying statement of assets and liabilities, including the portfolio of investments, of AB Municipal Bond Inflation Strategy Portfolio (the “Strategy”), one of the portfolios constituting the AB Bond Fund, Inc., as of October 31, 2016, and the related statement of operations for the year then ended, the statements of changes in net assets for each of the two years in the period then ended, and the financial highlights for each of the five years in the period then ended. These financial statements and financial highlights are the responsibility of the Strategy’s management. Our responsibility is to express an opinion on these financial statements and financial highlights based on our audits.
We conducted our audits in accordance with the standards of the Public Company Accounting Oversight Board (United States). Those standards require that we plan and perform the audit to obtain reasonable assurance about whether the financial statements and financial highlights are free of material misstatement. We were not engaged to perform an audit of the Strategy’s internal control over financial reporting. Our audits included consideration of internal control over financial reporting as a basis for designing audit procedures that are appropriate in the circumstances, but not for the purpose of expressing an opinion on the effectiveness of the Strategy’s internal control over financial reporting. Accordingly, we express no such opinion. An audit also includes examining, on a test basis, evidence supporting the amounts and disclosures in the financial statements and financial highlights, assessing the accounting principles used and significant estimates made by management, and evaluating the overall financial statement presentation. Our procedures included confirmation of securities owned as of October 31, 2016, by correspondence with the custodian and others, or by other appropriate auditing procedures where replies from others were not received. We believe that our audits provide a reasonable basis for our opinion.
In our opinion, the financial statements and financial highlights referred to above present fairly, in all material respects, the financial position of the AB Municipal Bond Inflation Strategy Portfolio, one of the portfolios constituting the AB Bond Fund, Inc., at October 31, 2016, the results of its operations for the year then ended, the changes in its net assets for each of the two years in the period then ended and the financial highlights for each of five years in the period then ended, in conformity with U.S. generally accepted accounting principles.

New York, New York
December 29, 2016
| 58 | • AB MUNICIPAL BOND INFLATION STRATEGY |
Report of Independent Registered Public Accounting Firm
BOARD OF DIRECTORS
Marshall C. Turner, Jr.(1), Chairman John H. Dobkin(1) Michael J. Downey(1) William H. Foulk, Jr.(1) D. James Guzy(1) | Nancy P. Jacklin(1) Robert M. Keith, President and Chief Executive Officer Carol C. McMullen(1) Garry L. Moody(1) Earl D. Weiner(1) |
OFFICERS
Philip L. Kirstein, Robert (“Guy”) B. Davidson III(2), Vice President Terrance T. Hults(2), Vice President Matthew J. Norton(2), Vice President | Emilie D. Wrapp, Secretary Joseph J. Mantineo, Treasurer and Chief Financial Officer Phyllis J. Clarke, Controller Vincent S. Noto, Chief Compliance Officer |
Custodian and Accounting Agent State Street Bank and Trust Company State Street Corporation CCB/5 1 Iron Street Boston, MA 02210
Principal Underwriter AllianceBernstein Investments, Inc. 1345 Avenue of the Americas New York, NY 10105
Transfer Agent AllianceBernstein Investor Services, Inc. P.O. Box 786003 San Antonio, TX 78278-6003 Toll-Free (800) 221-5672 | Independent Registered Public Ernst & Young LLP 5 Times Square New York, NY 10036
Legal Counsel Seward & Kissel LLP One Battery Park Plaza New York, NY 10004 |
| (1) | Member of the Audit Committee, the Governance and Nominating Committee and the Independent Directors Committee. |
| (2) | The day-to-day management of, and investment decisions for, the Strategy’s portfolio are made by the Adviser’s Municipal Bond Investment Team. Messrs. Robert “Guy” B. Davidson III, Terrance T. Hults and Matthew Norton are the investment professionals with the most significant responsibility for the day-to-day management of the Strategy’s portfolio. |
| AB MUNICIPAL BOND INFLATION STRATEGY • | 59 |
Board of Directors
MANAGEMENT OF THE FUND
Board of Directors Information
The business and affairs of the Strategy are managed under the direction of the Board of Directors. Certain information concerning the Strategy’s Directors is set forth below.
| NAME, ADDRESS*, AGE, (YEAR FIRST ELECTED**) | PRINCIPAL OCCUPATION(S) DURING PAST FIVE YEARS AND OTHER INFORMATION*** | PORTFOLIOS IN FUND COMPLEX OVERSEEN BY DIRECTOR | OTHER PUBLIC COMPANY DIRECTORSHIPS CURRENTLY HELD BY DIRECTOR | |||||
| INTERESTED DIRECTOR | ||||||||
Robert M. Keith, # 1345 Avenue of the Americas New York, NY 10105 56 (2010) | Senior Vice President of AllianceBernstein L.P. (the “Adviser”) and the head of AllianceBernstein Investments, Inc. (“ABI”) since July 2008; Director of ABI and President of the AB Mutual Funds. Previously, he served as Executive Managing Director of ABI from December 2006 to June 2008. Prior to joining ABI in 2006, Executive Managing Director of Bernstein Global Wealth Management, and prior thereto, Senior Managing Director and Global Head of Client Service and Sales of the Adviser’s institutional investment management business since 2004. Prior thereto, he was Managing Director and Head of North American Client Service and Sales in the Adviser’s institutional investment management business, with which he had been associated since prior to 2004. | 108 | None | |||||
| 60 | • AB MUNICIPAL BOND INFLATION STRATEGY |
Management of the Fund
| NAME, ADDRESS*, AGE, (YEAR FIRST ELECTED**) | PRINCIPAL OCCUPATION(S) DURING PAST FIVE YEARS AND OTHER INFORMATION*** | PORTFOLIOS IN FUND COMPLEX OVERSEEN BY DIRECTOR | OTHER PUBLIC COMPANY DIRECTORSHIPS CURRENTLY HELD BY DIRECTOR | |||||
| DISINTERESTED DIRECTORS | ||||||||
Marshall C. Turner, Jr., ## Chairman of the Board 75 (2005) | Private Investor since prior to 2011. Former Chairman and CEO of Dupont Photomasks, Inc. (components of semi-conductor manufacturing). He has extensive operating leadership, and venture capital investing experience, including five interim or full-time CEO roles, and prior service as general partner of institutional venture capital partnerships. He also has extensive non-profit board leadership experience, and currently serves on the boards of two education and science-related non-profit organizations. He has served as a director of one AB Fund since 1992, and director or trustee of multiple AB Funds since 2005. He has been Chairman of the AB Funds since January 2014, and the Chairman of the Independent Directors Committees of such AB Funds since February 2014. | 108 | Xilinx, Inc. (programmable logic semi-conductors) since 2007 | |||||
John H. Dobkin, ## 74 (1998) | Independent Consultant since prior to 2011. Formerly, President of Save Venice, Inc. (preservation organization) from 2001-2002; Senior Advisor from June 1999-June 2000 and President of Historic Hudson Valley (historic preservation) from December 1989-May 1999. Previously, Director of the National Academy of Design. He has served as a director or trustee of various AB Funds since 1992 and as Chairman of the Audit Committees of a number of such AB Funds from 2001-2008. | 108 | None | |||||
| AB MUNICIPAL BOND INFLATION STRATEGY • | 61 |
Management of the Fund
| NAME, ADDRESS*, AGE, (YEAR FIRST ELECTED**) | PRINCIPAL OCCUPATION(S) DURING PAST FIVE YEARS AND OTHER INFORMATION*** | PORTFOLIOS IN FUND COMPLEX OVERSEEN BY DIRECTOR | OTHER PUBLIC COMPANY DIRECTORSHIPS CURRENTLY HELD BY DIRECTOR | |||||
| DISINTERESTED DIRECTORS (continued) | ||||||||
Michael J. Downey, ## 72 (2005) | Private Investor since prior to 2011. Formerly, managing partner of Lexington Capital, LLC (investment advisory firm) from December 1997 until December 2003. He served as a Director of Prospect Acquisition Corp. (financial services) from 2007 until 2009. From 1987 until 1993, Chairman and CEO of Prudential Mutual Fund Management, director of the Prudential mutual funds, and member of the Executive Committee of Prudential Securities Inc. He has served as a director or trustee of the AB Funds since 2005 and is a director and Chairman of one other registered investment company. | 108 | Asia Pacific Fund, Inc. (registered investment company) since prior to 2011 | |||||
William H. Foulk, Jr., ## 84 (1998) | Investment Adviser and an Independent Consultant since prior to 2011. Previously, he was Senior Manager of Barrett Associates, Inc., a registered investment adviser. He was formerly Deputy Comptroller and Chief Investment Officer of the State of New York and, prior thereto, Chief Investment Officer of the New York Bank for Savings. He has served as a director or trustee of various AB Funds since 1983, and was Chairman of the Independent Directors Committees of the AB Funds from 2003 until early February 2014. He served as Chairman of such AB Funds from 2003 through December 2013. He is also active in a number of mutual fund related organizations and committees. | 108 | None | |||||
| 62 | • AB MUNICIPAL BOND INFLATION STRATEGY |
Management of the Fund
| NAME, ADDRESS*, AGE, (YEAR FIRST ELECTED**) | PRINCIPAL OCCUPATION(S) DURING PAST FIVE YEARS AND OTHER INFORMATION*** | PORTFOLIOS IN FUND COMPLEX OVERSEEN BY DIRECTOR | OTHER PUBLIC COMPANY DIRECTORSHIPS CURRENTLY HELD BY DIRECTOR | |||||
| DISINTERESTED DIRECTORS (continued) | ||||||||
D. James Guzy, ## 80 (2005) | Chairman of the Board of SRC Computers, Inc. (semi-conductors), with which he has been associated since prior to 2011. He served as Chairman of the Board of PLX Technology (semi-conductors) since prior to 2011 until November 2013. He was a Director of Intel Corporation (semi-conductors) from 1969 until 2008, and served as Chairman of the Finance Committee of such company for several years until May 2008. He has served as a director or trustee of one or more of the AB Funds since 1982. | 108 | None | |||||
Nancy P. Jacklin, ## 68 (2006) | Private Investor since prior to 2011. Professorial Lecturer at the Johns Hopkins School of Advanced International Studies (2008-2015); U.S. Executive Director of the International Monetary Fund (which is responsible for ensuring the stability of the international monetary system), (December 2002-May 2006); Partner, Clifford Chance (1992-2002); Sector Counsel, International Banking and Finance, and Associate General Counsel, Citicorp (1985-1992); Assistant General Counsel (International), Federal Reserve Board of Governors (1982-1985); and Attorney Advisor, U.S. Department of the Treasury (1973-1982). Member of the Bar of the District of Columbia and of New York; and member of the Council on Foreign Relations. She has served as a director or trustee of the AB Funds since 2006 and has been Chairman of the Governance and Nominating Committees of the AB Funds since August 2014. | 108 | None | |||||
| AB MUNICIPAL BOND INFLATION STRATEGY • | 63 |
Management of the Fund
| NAME, ADDRESS*, AGE, (YEAR FIRST ELECTED**) | PRINCIPAL OCCUPATION(S) DURING PAST FIVE YEARS AND OTHER INFORMATION*** | PORTFOLIOS IN FUND COMPLEX OVERSEEN BY DIRECTOR | OTHER PUBLIC COMPANY DIRECTORSHIPS CURRENTLY HELD BY DIRECTOR | |||||
| DISINTERESTED DIRECTORS (continued) | ||||||||
Carol C. McMullen, ## 61 (2016) | Managing Director of Slalom Consulting (consulting) since 2014 and private investor; Director of Norfolk & Dedham Group (mutual property and casualty insurance) since 2011; and Director of Partners Community Physicians Organization (healthcare) since 2014. Formerly, Managing Director of The Crossland Group (consulting) from 2012 to 2013. She has held a number of senior positions in the asset and wealth management industries, including at Eastern Bank (where her roles included President of Eastern Wealth Management), Thomson Financial (Global Head of Sales for Investment Management), and Putnam Investments (where her roles included Head of Global Investment Research). She has served on a number of private company and nonprofit boards, and as a director or trustee of the AB Funds since June 2016. | 108 | None | |||||
| 64 | • AB MUNICIPAL BOND INFLATION STRATEGY |
Management of the Fund
| NAME, ADDRESS*, AGE, (YEAR FIRST ELECTED**) | PRINCIPAL OCCUPATION(S) DURING PAST FIVE YEARS AND OTHER INFORMATION*** | PORTFOLIOS IN FUND COMPLEX OVERSEEN BY DIRECTOR | OTHER PUBLIC COMPANY DIRECTORSHIPS CURRENTLY HELD BY DIRECTOR | |||||
| DISINTERESTED DIRECTORS (continued) | ||||||||
Garry L. Moody, ## 64 (2008) | Independent Consultant. Formerly, Partner, Deloitte & Touche LLP (1995-2008) where he held a number of senior positions, including Vice Chairman, and U.S. and Global Investment Management Practice Managing Partner; President, Fidelity Accounting and Custody Services Company (1993-1995), where he was responsible for accounting, pricing, custody and reporting for the Fidelity mutual funds; and Partner, Ernst & Young LLP (1975-1993), where he served as the National Director of Mutual Fund Tax Services and Managing Partner of its Chicago Office Tax department. He is a member of the Trustee Advisory Board of BoardIQ, a biweekly publication focused on issues and news affecting directors of mutual funds. He has served as a director or trustee, and as Chairman of the Audit Committees of the AB Funds since 2008. | 108 | None | |||||
Earl D. Weiner, ## 77 (2007) | Of Counsel, and Partner prior to January 2007, of the law firm Sullivan & Cromwell LLP, and is a former member of the ABA Federal Regulation of Securities Committee Task Force to draft editions of the Fund Director’s Guidebook. He also serves as a director or trustee of various non-profit organizations and has served as Chairman or Vice Chairman of a number of them. He has served as a director or trustee of the AB Funds since 2007 and served as Chairman of the Governance and Nominating Committees of the AB Funds from 2007 until August 2014. | 108 | None | |||||
| AB MUNICIPAL BOND INFLATION STRATEGY • | 65 |
Management of the Fund
| * | The address for each of the Strategy’s disinterested Directors is c/o AllianceBernstein L.P., Attention: Philip L. Kirstein, 1345 Avenue of the Americas, New York, NY 10105. |
| ** | There is no stated term of office for the Strategy’s Directors. |
| *** | The information above includes each Director’s principal occupation during the last five years and other information relating to the experience, attributes and skills relevant to each Director’s qualifications to serve as a Director, which led to the conclusion that each Director should serve as a Director for the Strategy. |
| # | Mr. Keith is an “interested person” of the Strategy as defined in the “40 Act,” due to his position as a Senior Vice President of the Adviser. |
| ## | Member of the Audit Committee, the Governance and Nominating Committee and the Independent Directors Committee. |
| 66 | • AB MUNICIPAL BOND INFLATION STRATEGY |
Management of the Fund
Officer Information
Certain information concerning the Strategy’s Officers is listed below.
| NAME, ADDRESS* AND AGE | PRINCIPAL POSITION(S) HELD WITH FUND | PRINCIPAL OCCUPATION DURING PAST 5 YEARS | ||
| Robert M. Keith 56 | President and Chief Executive Officer | See biography above. | ||
| Philip L. Kirstein 71 | Senior Vice President and Independent Compliance Officer | Senior Vice President and Independent Compliance Officer of the AB Funds, with which he has been associated since October 2004. Prior thereto, he was Of Counsel to Kirkpatrick & Lockhart, LLP from October 2003 to October 2004, and General Counsel of Merrill Lynch Investment Managers, L.P. since prior to March 2003. | ||
| Robert “Guy” B. Davidson III 55 | Vice President | Senior Vice President of the Adviser,** with which he has been associated since prior to 2011. | ||
| Terrance T. Hults 50 | Vice President | Senior Vice President of the Adviser,** with which he has been associated since prior to 2011. | ||
| Matthew J. Norton 33 | Vice President | Vice President of the Adviser,**, with which he has been associated since prior to 2011. | ||
| Emilie D. Wrapp 61 | Secretary | Senior Vice President, Assistant General Counsel and Assistant Secretary of ABI,** with which she has been associated since prior to 2011. | ||
| Joseph J. Mantineo 57 | Treasurer and Chief Financial Officer | Senior Vice President of AllianceBernstein Investor Services, Inc. (“ABIS”),** with which he has been associated since prior to 2011. | ||
| Phyllis J. Clarke 55 | Controller | Vice President of ABIS,** with which she has been associated since prior to 2011. | ||
| Vincent S. Noto 52 | Chief Compliance Officer | Senior Vice President since 2015 and Mutual Fund Chief Compliance Officer of the Adviser** since 2014. Prior thereto, he was Vice President and Director of Mutual Fund Compliance of the Adviser** since 2011. |
| * | The address for each of the Fund’s Officers is 1345 Avenue of the Americas, New York, NY 10105. |
| ** | The Adviser, ABI and ABIS are affiliates of the Strategy. |
| The Fund’s Statement of Additional Information (“SAI”) has additional information about the Strategy’s Directors and Officers and is available without charge upon request. Contact your financial representative or AB at 1-800-227-4618, or visit www.abfunds.com, for a free prospectus or SAI. |
| AB MUNICIPAL BOND INFLATION STRATEGY • | 67 |
Management of the Fund
Information Regarding the Review and Approval of the Portfolio’s Investment Advisory Contract
The disinterested directors (the “directors”) of AB Bond Fund, Inc. (the “Fund”) unanimously approved the continuance of the Fund’s Investment Advisory Contract (the “Advisory Agreement”) with the Adviser in respect of AB Municipal Bond Inflation Strategy (the “Portfolio”) at a meeting held on November 3-5, 2015.
Prior to approval of the continuance of the Advisory Agreement in respect of the Portfolio, the directors had requested from the Adviser, and received and evaluated, extensive materials. They reviewed the continuance of the Advisory Agreement with the Adviser and with experienced counsel who are independent of the Adviser, who advised on the relevant legal standards. The directors also reviewed an independent evaluation prepared by the Fund’s Senior Officer (who is also the Fund’s Independent Compliance Officer) of the reasonableness of the advisory fee, in which the Senior Officer concluded that the contractual fee for the Portfolio was reasonable. The directors also discussed the proposed continuance in private sessions with counsel and the Fund’s Senior Officer.
The directors considered their knowledge of the nature and quality of the services provided by the Adviser to the Portfolio gained from their experience as directors or trustees of most of the registered investment companies advised by the Adviser, their overall confidence in the Adviser’s integrity and competence they have gained from that experience, the Adviser’s initiative in identifying and raising potential issues with the directors and its responsiveness, frankness and attention to concerns raised by the directors in the past, including the Adviser’s willingness to consider and implement organizational and operational changes designed to improve investment results and the services provided to the AB Funds. The directors noted that they have four regular meetings each year, at each of which they receive presentations from the Adviser on the investment results of the Portfolio and review extensive materials and information presented by the Adviser.
The directors also considered all other factors they believed relevant, including the specific matters discussed below. In their deliberations, the directors did not identify any particular information that was all-important or controlling, and different directors may have attributed different weights to the various factors. The directors determined that the selection of the Adviser to manage the Portfolio and the overall arrangements between the Portfolio and the Adviser, as provided in the Advisory Agreement, including the advisory fee, were fair and reasonable in light of the services performed, expenses incurred and such other matters as the directors considered relevant in the exercise of their business judgment. The material
| 68 | • AB MUNICIPAL BOND INFLATION STRATEGY |
factors and conclusions that formed the basis for the directors’ determinations included the following:
Nature, Extent and Quality of Services Provided
The directors considered the scope and quality of services provided by the Adviser under the Advisory Agreement, including the quality of the investment research capabilities of the Adviser and the other resources it has dedicated to performing services for the Portfolio. They noted the professional experience and qualifications of the Portfolio’s portfolio management team and other senior personnel of the Adviser. The directors also considered that the Advisory Agreement provides that the Portfolio will reimburse the Adviser for the cost to it of providing certain clerical, accounting, administrative and other services to the Portfolio by employees of the Adviser or its affiliates. Requests for these reimbursements are made on a quarterly basis and subject to approval by the directors. Reimbursements, to the extent requested and paid, result in a higher rate of total compensation from the Portfolio to the Adviser than the fee rate stated in the Portfolio’s Advisory Agreement. The directors noted that the methodology used to determine the reimbursement amounts had been reviewed by an independent consultant retained by the Fund’s Senior Officer. The quality of administrative and other services, including the Adviser’s role in coordinating the activities of the Portfolio’s other service providers, also was considered. The directors concluded that, overall, they were satisfied with the nature, extent and quality of services provided to the Portfolio under the Advisory Agreement.
Costs of Services Provided and Profitability
The directors reviewed a schedule of the revenues, expenses and related notes indicating the profitability of the Portfolio to the Adviser for calendar years 2013 and 2014 that had been prepared with an expense allocation methodology arrived at in consultation with an independent consultant retained by the Fund’s Senior Officer. The directors noted the assumptions and methods of allocation used by the Adviser in preparing fund-specific profitability data and understood that there are a number of potentially acceptable allocation methodologies for information of this type. The directors noted that the profitability information reflected all revenues and expenses of the Adviser’s relationship with the Portfolio, including those relating to its subsidiaries that provide transfer agency and distribution services to the Portfolio. The directors recognized that it is difficult to make comparisons of the profitability of the Advisory Agreement with the profitability of advisory contracts for unaffiliated funds because comparative information is not generally publicly available and is affected by numerous factors. The directors focused on the profitability of the Adviser’s relationship with the Portfolio before taxes and distribution expenses. The directors were satisfied that the Adviser’s level of profitability from its relationship with the Portfolio was not unreasonable.
| AB MUNICIPAL BOND INFLATION STRATEGY • | 69 |
Fall-Out Benefits
The directors considered the other benefits to the Adviser and its affiliates from their relationships with the Portfolio, including, but not limited to, benefits relating to 12b-1 fees and sales charges received by the Fund’s principal underwriter (which is a wholly owned subsidiary of the Adviser) in respect of certain classes of the Portfolio’s shares and transfer agency fees paid by the Portfolio to a wholly owned subsidiary of the Adviser. The directors recognized that the Adviser’s profitability would be somewhat lower without these benefits. The directors understood that the Adviser also might derive reputational and other benefits from its association with the Portfolio.
Investment Results
In addition to the information reviewed by the directors in connection with the meeting, the directors receive detailed performance information for the Portfolio at each regular Board meeting during the year. At the November 2015 meeting, the directors reviewed information prepared by Broadridge showing the performance of the Class A Shares of the Portfolio as compared with that of a group of similar funds selected by Broadridge (the “Performance Group”) and as compared with that of a broad array of funds selected by Broadridge (the “Performance Universe”), and information prepared by the Adviser showing performance of the Class A Shares as compared with the Barclays 1-10 Year Treasury Inflation Protected Securities (TIPS) Index (the “Index”), in each case for the 1-, 3- and 5-year periods ended July 31, 2015 and (in the case of comparisons with the Index) the period since inception (January 2010 inception). The directors noted that the Portfolio was in the 5th quintile of the Performance Group and the Performance Universe in all periods. The Portfolio outperformed the Index in the 3-year period and lagged it in all other periods. Based on their review and their discussion with the Adviser of the reasons for the Portfolio’s performance, the directors retained confidence in the Adviser’s ability to manage the Portfolio’s assets.
Advisory Fees and Other Expenses
The directors considered the advisory fee rate paid by the Portfolio to the Adviser and information prepared by Broadridge concerning advisory fee rates paid by other funds in the same Broadridge category as the Portfolio at a common asset level. The directors recognized that it is difficult to make comparisons of advisory fees because there are variations in the services that are included in the fees paid by other funds. The directors noted that, at the Portfolio’s current size, its contractual effective advisory fee rate of 50 basis points was lower than the Expense Group median. The directors noted that the administrative expense reimbursement was 0.7 basis points in the Portfolio’s latest fiscal year, and as a
| 70 | • AB MUNICIPAL BOND INFLATION STRATEGY |
result the rate of compensation received by the Adviser from the Portfolio pursuant to the Advisory Agreement was essentially the same as the Expense Group median.
The Adviser informed the directors that there were no institutional products managed by it that have a substantially similar investment style. The directors reviewed the relevant advisory fee information from the Adviser’s Form ADV and the evaluation from the Fund’s Senior Officer, and noted that the Adviser charged institutional clients lower fees for advising comparably sized institutional accounts using strategies that differ from those of the Portfolio but which invest in fixed income securities.
The Adviser reviewed with the directors the significantly greater scope of the services it provides to the Portfolio relative to institutional clients. The Adviser also noted that because mutual funds are constantly issuing and redeeming shares, they are more difficult to manage than an institutional account, where the assets tend to be relatively stable. In light of the substantial differences in services rendered by the Adviser to institutional clients as compared to funds such as the Portfolio, the directors considered these fee comparisons inapt and did not place significant weight on them in their deliberations.
The directors also considered the total expense ratio of the Class A shares of the Portfolio in comparison to the fees and expenses of funds within two comparison groups created by Broadridge: an Expense Group and an Expense Universe. Broadridge described an Expense Group as a representative sample of funds similar to the Portfolio and an Expense Universe as a broader group than the Expense Group, consisting of all funds in the investment classification/objective with a similar load type as the Portfolio. The Class A expense ratio of the Portfolio was based on the Portfolio’s latest fiscal year and the information included the pro forma expense ratio to reflect a reduction in the 12b-1 fee effective January 30, 2015. The pro forma expense ratio of the Portfolio reflected fee waivers and/or expense reimbursements as a result of an undertaking by the Adviser. The directors noted that it was likely that the expense ratios of some of the other funds in the Portfolio’s Broadridge category also were lowered by waivers or reimbursements by those funds’ investment advisers, which in some cases might be voluntary or temporary. The directors view the expense ratio information as relevant to their evaluation of the Adviser’s services because the Adviser is responsible for coordinating services provided to the Portfolio by others.
The directors noted that the Portfolio’s pro forma total expense ratio, giving effect to a cap by the Adviser, was lower than the Expense Group median and close to the Expense Universe median. The directors concluded that the Portfolio’s pro forma expense ratio was satisfactory.
| AB MUNICIPAL BOND INFLATION STRATEGY • | 71 |
Economies of Scale
The directors noted that the advisory fee schedule for the Portfolio contains breakpoints that reduce the fee rates on assets above specified levels. The directors took into consideration prior presentations by an independent consultant on economies of scale in the mutual fund industry and for the AB Funds, and by the Adviser concerning certain of its views on economies of scale. The directors also had requested and received from the Adviser certain updates on economies of scale at the May 2015 meetings. The directors believe that economies of scale may be realized (if at all) by the Adviser across a variety of products and services, and not only in respect of a single fund. The directors noted that there is no established methodology for setting breakpoints that give effect to fund-specific services provided by a fund’s adviser and to the economies of scale that an adviser may realize in its overall mutual fund business or those components of it which directly or indirectly affect a fund’s operations. The directors observed that in the mutual fund industry as a whole, as well as among funds similar to the Portfolio, there is no uniformity or pattern in the fees and asset levels at which breakpoints (if any) apply. The directors also noted that the advisory agreements for many funds do not have breakpoints at all. Having taken these factors into account, the directors concluded that the Portfolio’s shareholders would benefit from a sharing of economies of scale in the event the Portfolio’s net assets exceed a breakpoint in the future.
| 72 | • AB MUNICIPAL BOND INFLATION STRATEGY |
THIS PAGE IS NOT PART OF THE SHAREHOLDER REPORT OR THE FINANCIAL STATEMENTS
AB FAMILY OF FUNDS
US EQUITY
US Core
Core Opportunities Fund
Select US Equity Portfolio
US Growth
Concentrated Growth Fund
Discovery Growth Fund
Growth Fund
Large Cap Growth Fund
Small Cap Growth Portfolio
US Value
Discovery Value Fund
Equity Income Fund
Growth & Income Fund
Small Cap Value Portfolio
Value Fund
INTERNATIONAL/ GLOBAL EQUITY
International/Global Core
Global Core Equity Portfolio
Global Equity & Covered Call Strategy Fund
International Portfolio
International Strategic Core Portfolio
Sustainable Global Thematic Fund*
Tax-Managed International Portfolio
International/Global Growth
International Growth Fund
International/Global Value
Asia ex-Japan Equity Portfolio
International Value Fund
FIXED INCOME
Municipal
High Income Municipal Portfolio
Intermediate California Municipal Portfolio
Intermediate Diversified Municipal Portfolio
Intermediate New York Municipal Portfolio
FIXED INCOME (continued)
Municipal Bond Inflation Strategy
Tax-Aware Fixed Income Portfolio
National Portfolio
Arizona Portfolio
California Portfolio
Massachusetts Portfolio
Michigan Portfolio
Minnesota Portfolio
New Jersey Portfolio
New York Portfolio
Ohio Portfolio
Pennsylvania Portfolio
Virginia Portfolio
Taxable
Bond Inflation Strategy
Global Bond Fund
High Income Fund
High Yield Portfolio
Income Fund
Intermediate Bond Portfolio
Limited Duration High Income Portfolio
Short Duration Portfolio
ALTERNATIVES
All Market Real Return Portfolio
Credit Long/Short Portfolio
Global Real Estate Investment Fund
Long/Short Multi-Manager Fund
Multi-Manager Alternative Strategies Fund
Select US Long/Short Portfolio
Unconstrained Bond Fund
MULTI-ASSET
All Market Income Portfolio
Emerging Markets Multi-Asset Portfolio
Global Risk Allocation Fund
MULTI-ASSET (continued)
Target-Date
Multi-Manager Select Retirement Allocation Fund
Multi-Manager Select 2010 Fund
Multi-Manager Select 2015 Fund
Multi-Manager Select 2020 Fund
Multi-Manager Select 2025 Fund
Multi-Manager Select 2030 Fund
Multi-Manager Select 2035 Fund
Multi-Manager Select 2040 Fund
Multi-Manager Select 2045 Fund
Multi-Manager Select 2050 Fund
Multi-Manager Select 2055 Fund
Wealth Strategies
Balanced Wealth Strategy
Conservative Wealth Strategy
Wealth Appreciation Strategy
Tax-Managed Balanced Wealth Strategy
Tax-Managed Wealth Appreciation Strategy
CLOSED-END FUNDS
AB Multi-Manager Alternative Fund
Alliance California Municipal Income Fund
AllianceBernstein Global High Income Fund
AllianceBernstein National Municipal Income Fund
We also offer Government Exchange Reserves, which serves as the money market fund exchange vehicle for the AB mutual funds. An investment in Government Exchange Reserves is not a deposit in a bank and is not insured or guaranteed by the Federal Deposit Insurance Corporation or any other government agency. Although the Fund seeks to preserve the value of your investment at $1.00 per share, it is possible to lose money by investing in the Fund.
Investors should consider the investment objectives, risks, charges and expenses of the Fund carefully before investing. For copies of our prospectus or summary prospectus, which contain this and other information, visit us online at www.abfunds.com or contact your AB representative. Please read the prospectus and/or summary prospectus carefully before investing.
* Prior to November 1, 2016, the Fund was named Global Thematic Growth Fund.
| AB MUNICIPAL BOND INFLATION STRATEGY • | 73 |
AB Family of Funds
NOTES
| 74 | • AB MUNICIPAL BOND INFLATION STRATEGY |
NOTES
| AB MUNICIPAL BOND INFLATION STRATEGY • | 75 |
NOTES
| 76 | • AB MUNICIPAL BOND INFLATION STRATEGY |
AB MUNICIPAL BOND INFLATION STRATEGY
1345 Avenue of the Americas
New York, NY 10105
800.221.5672
MBIS-0151-1016 
OCT 10.31.16

ANNUAL REPORT
AB TAX-AWARE FIXED INCOME PORTFOLIO
Investment Products Offered
•Are Not FDIC Insured •May Lose Value •Are Not Bank Guaranteed |
Investors should consider the investment objectives, risks, charges and expenses of the Fund carefully before investing. For copies of our prospectus or summary prospectus, which contain this and other information, visit us online at www.abfunds.com or contact your AB representative. Please read the prospectus and/or summary prospectus carefully before investing.
This shareholder report must be preceded or accompanied by the Fund’s prospectus for individuals who are not current shareholders of the Fund.
You may obtain a description of the Fund’s proxy voting policies and procedures, and information regarding how the Fund voted proxies relating to portfolio securities during the most recent 12-month period ended June 30, without charge. Simply visit AB’s website at www.abfunds.com, or go to the Securities and Exchange Commission’s (the “Commission”) website at www.sec.gov, or call AB at (800) 227-4618.
The Fund files its complete schedule of portfolio holdings with the Commission for the first and third quarters of each fiscal year on Form N-Q. The Fund’s Forms N-Q are available on the Commission’s website at www.sec.gov. The Fund’s Forms N-Q may also be reviewed and copied at the Commission’s Public Reference Room in Washington, DC; information on the operation of the Public Reference Room may be obtained by calling (800) SEC-0330. AB publishes full portfolio holdings for the Fund monthly at www.abfunds.com.
AllianceBernstein Investments, Inc. (ABI) is the distributor of the AB family of mutual funds. ABI is a member of FINRA and is an affiliate of AllianceBernstein L.P., the Adviser of the funds.
The [A/B] logo is a registered service mark of AllianceBernstein and AllianceBernstein® is a registered service mark used by permission of the owner, AllianceBernstein L.P.
December 15, 2016
Annual Report
This report provides management’s discussion of fund performance for AB Tax-Aware Fixed Income Portfolio (the “Fund”) for the annual reporting period ended October 31, 2016.
Investment Objectives and Policies
The investment objective of the Fund is to maximize after-tax return and income. The Fund pursues its objective by investing principally in a national portfolio of both municipal and taxable fixed-income securities. The Fund invests, under normal circumstances, at least 80% of its net assets in fixed-income securities. The Fund also invests, under normal circumstances, at least 65% of its total assets in municipal securities that pay interest that is exempt from federal income tax. These securities may pay interest that is subject to the federal alternative minimum tax for certain taxpayers. The income earned and distributed to shareholders on non-municipal securities would not be exempt from federal income tax. The Fund may invest in fixed-income securities rated below investment grade (commonly known as “junk bonds”), although such securities are not expected to be the Fund’s primary focus.
AllianceBernstein L.P. (the “Adviser”) selects securities for the Fund based on a variety of factors, including credit quality, maturity, diversification benefits, and the relative expected after-tax returns of taxable and municipal securities (considering federal tax rates
and without regard to state and local income taxes). As the objective is to increase the after-tax return of the Fund, an investor in the Fund may incur a tax liability that will generally be greater than the same investor would have in a fund investing exclusively in municipal securities, and that will be higher if the investor is in a higher tax bracket. In addition, the tax implications of the Fund’s trading activity, such as realizing taxable gains, are considered in making purchase and sale decisions for the Fund. The Fund may invest in fixed-income securities of any maturity from short- to long-term.
The Fund may also invest in forward commitments, zero-coupon municipal securities and variable, floating and inverse floating-rate municipal securities.
The Fund may use derivatives, such as swaps, options, futures contracts and forwards, to achieve its investment strategies. For example, the Fund may enter into credit default and interest rate swaps relating to municipal and taxable fixed-income securities or securities indices. Derivatives may provide more efficient and economical exposure to fixed-income securities markets than direct investments.
Investment Results
The table on page 8 shows the Fund’s performance compared to its benchmark, the Bloomberg Barclays Municipal Bond Index, for the six- and 12-month periods ended October 31, 2016.
| AB TAX-AWARE FIXED INCOME PORTFOLIO • | 1 |
Class A and Advisor Class shares of the Fund outperformed the benchmark, while Class C shares underperformed, for both the six- and 12-month periods, before sales charges. For the 12-month period, security selection within the health care sector contributed the most to relative performance, and also benefited from security selection in the transportation, education and special tax sectors. Security selection within the industrials sector detracted from returns. For the six-month period, security selection within the health care sector contributed most to performance, followed by security selection in the local general obligation, state general obligation, special tax and education sectors. An overweight in Treasuries detracted from performance.
The Fund used derivatives during both periods, which had no material impact on absolute performance. Interest rate swaps and inflation swaps were used for hedging purposes; credit default swaps were used for investment purposes.
Market Review and Investment Strategy
After generally declining for the first half of the 12-month period, municipal bond yields for most maturities rose over the latter half. During the six-month period ended October 31, 2016, yields rose the most for short-maturity bonds as markets reflected a higher probability of the US Federal Reserve raising its target for the Federal Funds rate, and as a change in regulations for money
market funds led to a reduced demand for very short-term instruments. As a result, over the course of the 12-month period, yields were lower by 0.25% to 0.50% for bonds maturing beyond seven years, and those shorter in duration were little changed or increased in yield by up to 0.50%. Given the low level of yields and investors’ strong demand for income, lower-rated bonds performed well and credit spreads generally tightened over both the six- and 12-month periods. Municipal credit fundamentals remained consistent with continued slow economic growth as tax revenues continued to increase, though in some cases at a slower rate, and default rates remained low across the broad municipal market.
On November 8, 2016, Donald Trump was elected as the 45th president of the United States, and the Congressional election outcome resulted in the Republican Party maintaining control of both the House of Representatives and the Senate. The Adviser believes that it will take time before the world has a clearer picture of the short- and long-term impact of the elections on the US economy and markets in general. The Adviser continues to monitor the markets, including for potential market volatility.
The Fund may purchase municipal securities that are insured under policies issued by certain insurance companies. Historically, insured municipal securities typically received a higher credit rating, which meant
| 2 | • AB TAX-AWARE FIXED INCOME PORTFOLIO |
that the issuer of the securities paid a lower interest rate. As a result of declines in the credit quality and associated downgrades of most fund insurers, insurance has less value than it did in the past. The market now values insured municipal securities primarily based on the credit quality of the issuer of the security with little value given to the insurance feature. In purchasing such insured securities, the Adviser evaluates the risk and return of municipal securities through
its own research. If an insurance company’s rating is downgraded or the company becomes insolvent, the prices of municipal securities insured by the insurance company may decline. As of October 31, 2016, the Fund’s percentages of investments in municipal bonds that are insured and in insured municipal bonds that have been pre-refunded or escrowed to maturity were 5.70% and 0.00%, respectively.
| AB TAX-AWARE FIXED INCOME PORTFOLIO • | 3 |
DISCLOSURES AND RISKS
Benchmark Disclosure
The Bloomberg Barclays Municipal Bond Index is unmanaged and does not reflect fees and expenses associated with the active management of a mutual fund portfolio. The Bloomberg Barclays Municipal Bond Index represents the performance of the long-term tax-exempt bond market consisting of investment-grade bonds. An investor cannot invest directly in an index, and its results are not indicative of the performance for any specific investment, including the Fund.
A Word About Risk
Market Risk: The value of the Fund’s assets will fluctuate as the bond market fluctuates. The value of its investments may decline, sometimes rapidly and unpredictably, simply because of economic changes or other events that affect large portions of the market.
Credit Risk: An issuer or guarantor of a fixed-income security, or the counterparty to a derivatives or other contract, may be unable or unwilling to make timely payments of interest or principal, or to otherwise honor its obligations. The issuer or guarantor may default, causing a loss of the full principal amount of a security and accrued interest. The degree of risk for a particular security may be reflected in its credit rating. There is the possibility that the credit rating of a fixed-income security may be downgraded after purchase, which may adversely affect the value of the security.
Below Investment Grade Securities Risk: Investments in fixed-income securities with lower ratings (commonly known as “junk bonds”) are subject to a higher probability that an issuer will default or fail to meet its payment obligations. These securities may be subject to greater price volatility due to such factors as specific municipal or corporate developments, negative performance of the junk bond market generally and less secondary market liquidity.
Municipal Market Risk: This is the risk that special factors may adversely affect the value of municipal securities and have a significant effect on the yield or value of the Fund’s investments in municipal securities. These factors include economic conditions, political or legislative changes, uncertainties related to the tax status of municipal securities, or the rights of investors in these securities. To the extent that the Fund invests more of its assets in a particular state’s municipal securities, the Fund may be vulnerable to events adversely affecting that state, including economic, political and regulatory occurrences, court decisions, terrorism and catastrophic natural disasters, such as hurricanes or earthquakes. The Fund’s investments in certain municipal securities with principal and interest payments that are made from the revenues of a specific project or facility, and not general tax revenues, may have increased risks. Factors
(Disclosures, Risks and Note about Historical Performance continued on next page)
| 4 | • AB TAX-AWARE FIXED INCOME PORTFOLIO |
Disclosures and Risks
DISCLOSURES AND RISKS
(continued from previous page)
affecting the project or facility, such as local business or economic conditions, could have a significant effect on the project’s ability to make payments of principal and interest on these securities.
The Fund may invest in municipal securities of issuers in Puerto Rico or other US territories, which are exempt from federal, state, and, where applicable, local income taxes. These municipal securities may have more risks than those of most other US issuers of tax-exempt securities. Like many US states and municipalities, Puerto Rico experienced a significant downturn during the recent recession. Puerto Rico’s downturn was particularly severe, and it continues to face a very challenging economic and fiscal environment. As a result, securities issued by many Puerto Rican issuers have low credit ratings or are on “negative watch” by credit rating organizations, and markets in such securities have been volatile. Some Puerto Rico issuers are in default on principal and interest payments. If the economic situation in Puerto Rico persists or worsens, the volatility and credit quality of Puerto Rican municipal securities could be adversely affected, and the market for such securities may experience continued volatility.
Tax Risk: From time to time, the US government and the US Congress consider changes in federal tax law that could limit or eliminate the federal tax exemption for municipal bond income, which would in effect reduce the income received by shareholders from the Fund by increasing taxes on that income. In such event, the Fund’s net asset value (“NAV”) could also decline as yields on municipal bonds, which are typically lower than those on taxable bonds, would be expected to increase to approximately the yield of comparable taxable bonds. Actions or anticipated actions affecting the tax exempt status of municipal bonds could also result in significant shareholder redemptions of Fund shares as investors anticipate adverse effects on the Fund or seek higher yields to offset the potential loss of the tax deduction. As a result, the Fund would be required to maintain higher levels of cash to meet the redemptions, which would negatively affect the Fund’s yield.
Interest Rate Risk: Changes in interest rates will affect the value of investments in fixed-income securities. When interest rates rise, the value of investments in fixed-income securities tends to fall and this decrease in value may not be offset by higher income from new investments. The Fund may be subject to a greater risk of rising interest rates as the recent period of historically low rates is beginning to end and rates have begun rising. Interest rate risk is generally greater for fixed-income securities with longer maturities or durations.
Duration Risk: Duration is a measure that relates the expected price volatility of a fixed-income security to changes in interest rates. The duration of a fixed-income security may be shorter than or equal to full
(Disclosures, Risks and Note about Historical Performance continued on next page)
| AB TAX-AWARE FIXED INCOME PORTFOLIO • | 5 |
Disclosures and Risks
DISCLOSURES AND RISKS
(continued from previous page)
maturity of a fixed-income security. Fixed-income securities with longer durations have more risk and will decrease in price as interest rates rise. For example, a fixed-income security with a duration of three years will decrease in value by approximately 3% if interest rates increase by 1%.
Inflation Risk: This is the risk that the value of assets or income from investments will be less in the future as inflation decreases the value of money. As inflation increases, the value of the Fund’s assets can decline as can the value of the Fund’s distributions. This risk is significantly greater for fixed-income securities with longer maturities.
Liquidity Risk: Liquidity risk occurs when certain investments become difficult to purchase or sell. Difficulty in selling less liquid securities may result in sales at disadvantageous prices affecting the value of your investment in the Fund. Causes of liquidity risk may include low trading volumes and large positions. Municipal securities may have more liquidity risk than other fixed-income securities because they trade less frequently and the market for municipal securities is generally smaller than many other markets.
Leverage Risk: To the extent the Fund uses leveraging techniques, its NAV may be more volatile because leverage tends to exaggerate the effect of changes in interest rates and any increase or decrease in the value of the Fund’s investments.
Derivatives Risk: Derivatives may be illiquid, difficult to price, and leveraged so that small changes may produce disproportionate losses for the Fund, and may be subject to counterparty risk to a greater degree than more traditional investments.
Management Risk: The Fund is subject to management risk because it is an actively managed investment fund. The Adviser will apply its investment techniques and risk analyses in making investment decisions, but there is no guarantee that its techniques will produce the intended results.
These and other risks are more fully discussed in the Fund’s prospectus. As with all investments, you may lose money by investing in the Fund.
An Important Note About Historical Performance
The investment return and principal value of an investment in the Fund will fluctuate, so that shares, when redeemed, may be worth more or less than their original cost. Performance shown on the following pages represents past performance and does not guarantee future results. Current performance may be lower or higher than the performance information shown. You may obtain performance information current to the most recent month-end by visiting www.abfunds.com.
(Disclosures, Risks and Note about Historical Performance continued on next page)
| 6 | • AB TAX-AWARE FIXED INCOME PORTFOLIO |
Disclosures and Risks
DISCLOSURES AND RISKS
(continued from previous page)
All fees and expenses related to the operation of the Fund have been deducted. NAV returns do not reflect sales charges; if sales charges were reflected, the Fund’s quoted performance would be lower. SEC returns and the Fund’s returns shown in the line graphs reflect the applicable sales charges for each share class: a 3% maximum front-end sales charge for Class A shares; a 1% 1-year contingent deferred sales charge for Class C shares. Returns for the different share classes will vary due to their different expenses associated with each class. Performance assumes reinvestment of distributions and does not account for taxes.
| AB TAX-AWARE FIXED INCOME PORTFOLIO • | 7 |
Disclosures and Risks
HISTORICAL PERFORMANCE
THE FUND VS. ITS BENCHMARK | NAV Returns | |||||||||||
| 6 Months | 12 Months | |||||||||||
| AB Tax-Aware Fixed Income Portfolio | ||||||||||||
Class A | 0.73% | 4.69% | ||||||||||
| ||||||||||||
Class C | 0.35% | 3.91% | ||||||||||
| ||||||||||||
Advisor Class* | 0.86% | 4.96% | ||||||||||
| ||||||||||||
| Bloomberg Barclays Municipal Bond Index | 0.49% | 4.06% | ||||||||||
| ||||||||||||
* Please note that Advisor Class shares are for investors purchasing shares through accounts established under certain fee-based programs sponsored and maintained by certain broker-dealers and financial intermediaries, institutional pension plans and/or investment advisory clients of, and certain other persons associated with, the Adviser and its affiliates or the Fund. |
| |||||||||||
GROWTH OF A $10,000 INVESTMENT IN THE FUND 12/11/2013* TO 10/31/2016 (unaudited)
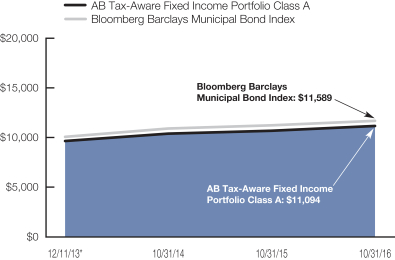
This chart illustrates the total value of an assumed $10,000 investment in AB Tax-Aware Fixed Income Portfolio (from 12/11/2013* to 10/31/2016) as compared to the performance of its benchmark. The chart reflects the deduction of the maximum 4.25% sales charge from the initial $10,000 investment in the Fund and assumes the reinvestment of dividends and capital gains distributions.
| * | Inception date: 12/11/2013. |
See Disclosures, Risks and Note about Historical Performance on pages 4-7.
(Historical Performance continued on next page)
| 8 | • AB TAX-AWARE FIXED INCOME PORTFOLIO |
Historical Performance
HISTORICAL PERFORMANCE
(continued from previous page)
| AVERAGE ANNUAL RETURNS AS OF OCTOBER 31, 2016 (unaudited) | ||||||||
| NAV Returns | SEC Returns (reflects applicable sales charges) | |||||||
| Class A | ||||||||
1 Year | 4.69 | % | 1.53 | % | ||||
Since Inception* | 4.76 | % | 3.66 | % | ||||
| Class C | ||||||||
1 Year | 3.91 | % | 2.91 | % | ||||
Since Inception* | 4.01 | % | 4.01 | % | ||||
| Advisor Class† | ||||||||
1 Year | 4.96 | % | 4.96 | % | ||||
Since Inception* | 5.05 | % | 5.05 | % | ||||
| SEC AVERAGE ANNUAL RETURNS AS OF THE MOST RECENT CALENDAR QUARTER-END SEPTEMBER 30, 2016 (unaudited) | ||||||||
| Class A | ||||||||
1 Year | 3.02 | % | ||||||
Since Inception* | 4.12 | % | ||||||
| Class C | ||||||||
1 Year | 4.35 | % | ||||||
Since Inception* | 4.50 | % | ||||||
| Advisor Class† | ||||||||
1 Year | 6.41 | % | ||||||
Since Inception* | 5.55 | % | ||||||
The Fund’s current prospectus fee table shows the Fund’s total annual operating expense ratios as 2.18%, 2.85% and 1.92% for Class A, Class C and Advisor Class shares, respectively, gross of any fee waivers or expense reimbursements. Contractual fee waivers and/or expense reimbursements limit the Fund’s annual operating expense ratios exclusive of interest expense, taxes, dividend expense, borrowing costs and brokerage expense on securities sold short to 0.80%, 1.55% and 0.55% for Class A, Class C and Advisor Class shares, respectively. These waivers/reimbursements may not be terminated prior to January 31, 2017 and may be extended by the Adviser for additional one-year terms. Any fees waived and expenses borne by the Adviser through December 11, 2014 may be reimbursed by the Fund until December 11, 2016, provided that no reimbursement payment will be made that would cause the Fund’s total annual fund operating expenses to exceed the expense limitations or cause the total of the payments to exceed the Fund’s total initial offering expenses. Absent reimbursements or waivers, performance would have been lower. The Financial Highlights section of this report sets forth expense ratio data for the current reporting period; the expense ratios shown above may differ from the expense ratios in the Financial Highlights section since they are based on different time periods.
| * | Inception date: 12/11/2013. |
| † | Please note that Advisor Class shares are for investors purchasing shares through accounts established under certain fee-based programs sponsored and maintained by certain broker-dealers and financial intermediaries, institutional pension plans and/or investment advisory clients of, and certain other persons associated with, the Adviser and its affiliates or the Fund. |
See Disclosures, Risks and Note about Historical Performance on pages 4-7.
| AB TAX-AWARE FIXED INCOME PORTFOLIO • | 9 |
Historical Performance
EXPENSE EXAMPLE
(unaudited)
As a shareholder of the Fund, you incur two types of costs: (1) transaction costs, including sales charges (loads) on purchase payments, contingent deferred sales charges on redemptions and (2) ongoing costs, including management fees; distribution (12b-1) fees; and other Fund expenses. This example is intended to help you understand your ongoing costs (in dollars) of investing in the Fund and to compare these costs with the ongoing costs of investing in other mutual funds.
The Example is based on an investment of $1,000 invested at the beginning of the period and held for the entire period as indicated below.
Actual Expenses
The table below provides information about actual account values and actual expenses. You may use the information, together with the amount you invested, to estimate the expenses that you paid over the period. Simply divide your account value by $1,000 (for example, an $8,600 account value divided by $1,000 = 8.6), then multiply the result by the number under the heading entitled “Expenses Paid During Period” to estimate the expenses you paid on your account during this period.
Hypothetical Example for Comparison Purposes
The table below also provides information about hypothetical account values and hypothetical expenses based on the Fund’s actual expense ratio and an assumed annual rate of return of 5% before expenses, which is not the Fund’s actual return. The hypothetical account values and expenses may not be used to estimate the actual ending account balance or expenses you paid for the period. You may use this information to compare the ongoing costs of investing in the Fund and other funds by comparing this 5% hypothetical example with the 5% hypothetical examples that appear in the shareholder reports of other funds.
Please note that the expenses shown in the table are meant to highlight your ongoing costs only and do not reflect any transactional costs, such as sales charges (loads), or contingent deferred sales charges on redemptions. Therefore, the hypothetical example is useful in comparing ongoing costs only, and will not help you determine the relative total costs of owning different funds. In addition, if these transactional costs were included, your costs would have been higher.
| 10 | • AB TAX-AWARE FIXED INCOME PORTFOLIO |
Expense Example
| Beginning Account Value 5/1/2016 | Ending Account Value 10/31/2016 | Expenses Paid During Period* | Annualized Expense Ratio* | Effective Expenses Paid During Period+ | Effective Annualized Expense Ratio+ | |||||||||||||||||||
| Class A | ||||||||||||||||||||||||
Actual | $ | 1,000 | $ | 1,007.30 | $ | 3.99 | 0.79 | % | $ | 4.04 | 0.80 | % | ||||||||||||
Hypothetical** | $ | 1,000 | $ | 1,021.17 | $ | 4.01 | 0.79 | % | $ | 4.06 | 0.80 | % | ||||||||||||
| Class C | ||||||||||||||||||||||||
Actual | $ | 1,000 | $ | 1,003.50 | $ | 7.76 | 1.54 | % | $ | 7.81 | 1.55 | % | ||||||||||||
Hypothetical** | $ | 1,000 | $ | 1,017.39 | $ | 7.81 | 1.54 | % | $ | 7.86 | 1.55 | % | ||||||||||||
| Advisor Class | ||||||||||||||||||||||||
Actual | $ | 1,000 | $ | 1,008.60 | $ | 2.73 | 0.54 | % | $ | 2.78 | 0.55 | % | ||||||||||||
Hypothetical** | $ | 1,000 | $ | 1,022.42 | $ | 2.75 | 0.54 | % | $ | 2.80 | 0.55 | % | ||||||||||||
| * | Expenses are equal to the classes’ annualized expense ratios multiplied by the average account value over the period, multiplied by 184/366 (to reflect the one-half year period). |
| ** | Assumes 5% annual return before expenses. |
| + | The Portfolio’s investments in affiliated/unaffiliated underlying portfolios incur no direct expenses, but bears proportionate shares of the acquired fund fees (i.e., operating, administrative and investment advisory fee) of the affiliated/unaffiliated underlying portfolios. Currently the Adviser has voluntarily agreed to waive its investment advisory fee from the Portfolio in an amount equal to the Portfolio’s share of the advisory fees of the affiliated underlying portfolios, as borne indirectly by the Portfolio as an acquired fund fee and expense. The Portfolio’s effective expenses are equal to the classes’ annualized expense ratio plus the Portfolio’s pro-rata share of the weighted average expense ratio of the affiliated/unaffiliated underlying portfolios in which it invests, multiplied by the average account value over the period, multiplied by 184/366 (to reflect the one-half year period). |
| AB TAX-AWARE FIXED INCOME PORTFOLIO • | 11 |
Expense Example
PORTFOLIO SUMMARY
October 31, 2016 (unaudited)
PORTFOLIO STATISTICS
Net Assets ($mil): $42.1
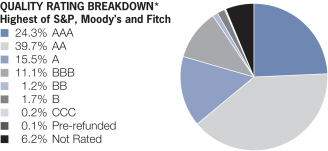
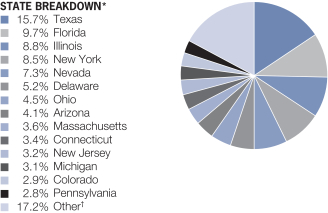
| * | All data are as of October 31, 2016. The Fund’s quality rating and state breakdowns are expressed as a percentage of the Fund’s total investments in municipal securities and may vary over time. The Fund also enters into derivative transactions, which may be used for hedging or investment purposes (see “Portfolio of Investments” section of the report for additional details). The quality ratings are determined by using the Standard & Poor’s Ratings Services (“S&P”), Moody’s Investors Services, Inc. (“Moody’s”) and Fitch Ratings, Ltd. (“Fitch”). The Fund considers the credit ratings issued by S&P, Moody’s and Fitch and uses the highest rating issued by the agencies. These ratings are a measure of the quality and safety of a bond or portfolio, based on the issuer’s financial condition. AAA is the highest (best) and D is the lowest (worst). If applicable, the pre-refunded category includes bonds which are secured by U.S. Government securities and therefore are deemed high-quality investment grade by the Adviser. If applicable, Not Applicable (N/A) includes non-creditworthy investments; such as, equities, currency contracts, futures and options. If applicable, the Not Rated category includes bonds that are not rated by a nationally recognized statistical rating organization. The Adviser evaluates the creditworthiness of non-rated securities based on a number of factors including, but not limited to, cash flows, enterprise value and economic environment. |
| † | “Other” represents less than 2.5% in 20 different states, District of Columbia and Puerto Rico. |
| 12 | • AB TAX-AWARE FIXED INCOME PORTFOLIO |
Portfolio Summary
PORTFOLIO OF INVESTMENTS
October 31, 2016
| Principal Amount (000) | U.S. $ Value | |||||||
| ||||||||
MUNICIPAL OBLIGATIONS – 91.2% | ||||||||
Long-Term Municipal Bonds – 91.2% | ||||||||
Alabama – 2.3% | ||||||||
County of Jefferson AL Sewer Revenue | $ | 110 | $ | 130,848 | ||||
Water Works Board of the City of Birmingham | 700 | 827,190 | ||||||
|
| |||||||
| 958,038 | ||||||||
|
| |||||||
Arizona – 3.7% | ||||||||
Arizona Health Facilities Authority | 110 | 110,140 | ||||||
City of Peoria AZ | 1,000 | 1,221,570 | ||||||
Industrial Development Authority of the City of Phoenix (The)) | 100 | 111,278 | ||||||
Salt Verde Financial Corp. | 100 | 119,728 | ||||||
|
| |||||||
| 1,562,716 | ||||||||
|
| |||||||
California – 0.7% | ||||||||
California Pollution Control Financing Authority | 250 | 277,770 | ||||||
|
| |||||||
Colorado – 2.7% | ||||||||
Colorado Health Facilities Authority | 170 | 190,855 | ||||||
Colorado Health Facilities Authority | 200 | 236,426 | ||||||
Denver City & County School District No 1 | 560 | 691,141 | ||||||
|
| |||||||
| 1,118,422 | ||||||||
|
| |||||||
| AB TAX-AWARE FIXED INCOME PORTFOLIO • | 13 |
Portfolio of Investments
| Principal Amount (000) | U.S. $ Value | |||||||
| ||||||||
Connecticut – 3.2% | ||||||||
Connecticut State Health & Educational Facility Authority | $ | 100 | $ | 106,880 | ||||
State of Connecticut | 1,000 | 1,219,090 | ||||||
|
| |||||||
| 1,325,970 | ||||||||
|
| |||||||
Delaware – 4.7% | ||||||||
State of Delaware | 1,650 | 1,990,131 | ||||||
|
| |||||||
District of Columbia – 0.3% | ||||||||
District of Columbia | 100 | 112,896 | ||||||
|
| |||||||
Florida – 8.8% | ||||||||
Bexley Community Development District | 100 | 97,140 | ||||||
Brevard County School District COP | 290 | 355,244 | ||||||
Capital Trust Agency, Inc. | 100 | 88,798 | ||||||
Citizens Property Insurance Corp. | 560 | 639,438 | ||||||
Collier County Industrial Development Authority | 100 | 117,289 | ||||||
County of Miami-Dade FL | 780 | 938,371 | ||||||
County of Miami-Dade FL Aviation Revenue | 265 | 306,391 | ||||||
County of Orange FL Tourist Development Tax Revenue | 435 | 509,746 | ||||||
| 14 | • AB TAX-AWARE FIXED INCOME PORTFOLIO |
Portfolio of Investments
| Principal Amount (000) | U.S. $ Value | |||||||
| ||||||||
Florida Development Finance Corp. | $ | 100 | $ | 103,137 | ||||
Florida Development Finance Corp. | 100 | 107,315 | ||||||
School District of Broward County/FL | 365 | 452,330 | ||||||
|
| |||||||
| 3,715,199 | ||||||||
|
| |||||||
Georgia – 0.8% | ||||||||
City of Atlanta Department of Aviation | 310 | 355,874 | ||||||
|
| |||||||
Hawaii – 1.3% | ||||||||
State of Hawaii | 460 | 565,653 | ||||||
|
| |||||||
Idaho – 0.3% | ||||||||
Idaho Health Facilities Authority | 100 | 110,981 | ||||||
|
| |||||||
Illinois – 8.1% | ||||||||
Chicago Board of Education | 140 | 122,486 | ||||||
Chicago O’Hare International Airport | 335 | 378,764 | ||||||
City of Chicago IL | 100 | 103,176 | ||||||
City of Chicago IL | 100 | 100,226 | ||||||
Illinois Finance Authority | 50 | 34,402 | ||||||
| AB TAX-AWARE FIXED INCOME PORTFOLIO • | 15 |
Portfolio of Investments
| Principal Amount (000) | U.S. $ Value | |||||||
| ||||||||
Illinois Finance Authority | $ | 85 | $ | 85,626 | ||||
Series 2016C | 15 | 645 | ||||||
Illinois Finance Authority | 100 | 109,036 | ||||||
Illinois Finance Authority | 250 | 287,928 | ||||||
Illinois Municipal Electric Agency | 465 | 543,706 | ||||||
Metropolitan Pier & Exposition Authority | 600 | 659,382 | ||||||
State of Illinois | 100 | 105,635 | ||||||
Series 2013 | 270 | 304,214 | ||||||
Series 2014 | 130 | 137,141 | ||||||
Series 2016 | 375 | 413,220 | ||||||
|
| |||||||
| 3,385,587 | ||||||||
|
| |||||||
Indiana – 1.2% | ||||||||
Indiana Finance Authority | 160 | 175,520 | ||||||
Indiana Finance Authority | 190 | 211,151 | ||||||
Indiana Finance Authority | 100 | 112,504 | ||||||
|
| |||||||
| 499,175 | ||||||||
|
| |||||||
| 16 | • AB TAX-AWARE FIXED INCOME PORTFOLIO |
Portfolio of Investments
| Principal Amount (000) | U.S. $ Value | |||||||
| ||||||||
Kentucky – 0.8% | ||||||||
Kentucky Economic Development Finance Authority | $ | 65 | $ | 66,936 | ||||
Louisville/Jefferson County Metropolitan Government | 225 | 268,223 | ||||||
|
| |||||||
| 335,159 | ||||||||
|
| |||||||
Louisiana – 0.6% | ||||||||
City of New Orleans LA Water Revenue | 100 | 114,019 | ||||||
Louisiana Public Facilities Authority | 250 | 144,375 | ||||||
|
| |||||||
| 258,394 | ||||||||
|
| |||||||
Maine – 0.5% | ||||||||
Maine Health & Higher Educational Facilities Authority | 165 | 194,937 | ||||||
|
| |||||||
Maryland – 0.9% | ||||||||
University System of Maryland | 365 | 386,411 | ||||||
|
| |||||||
Massachusetts – 3.3% | ||||||||
Commonwealth of Massachusetts | 1,000 | 1,265,000 | ||||||
NATL Series 2000E | 125 | 112,847 | ||||||
|
| |||||||
| 1,377,847 | ||||||||
|
| |||||||
Michigan – 2.8% | ||||||||
City of Detroit MI Sewage Disposal System Revenue | 115 | 133,576 | ||||||
| AB TAX-AWARE FIXED INCOME PORTFOLIO • | 17 |
Portfolio of Investments
| Principal Amount (000) | U.S. $ Value | |||||||
| ||||||||
Michigan Finance Authority | $ | 735 | $ | 784,943 | ||||
Michigan Finance Authority | 235 | 270,156 | ||||||
|
| |||||||
| 1,188,675 | ||||||||
|
| |||||||
Minnesota – 0.6% | ||||||||
City of Minneapolis MN | 200 | 234,032 | ||||||
|
| |||||||
Missouri – 0.2% | ||||||||
Kansas City Industrial Development Authority | 100 | 101,973 | ||||||
|
| |||||||
Nebraska – 0.3% | ||||||||
Central Plains Energy Project | 100 | 110,617 | ||||||
|
| |||||||
Nevada – 6.7% | ||||||||
Clark County Water Reclamation District | 1,305 | 1,561,380 | ||||||
County of Clark NV | 1,000 | 1,241,480 | ||||||
|
| |||||||
| 2,802,860 | ||||||||
|
| |||||||
New Hampshire – 0.3% | ||||||||
New Hampshire Health and Education Facilities Authority Act | 115 | 129,549 | ||||||
|
| |||||||
New Jersey – 2.9% | ||||||||
New Jersey Economic Development Authority | 30 | 33,582 | ||||||
New Jersey Economic Development Authority (New Jersey Economic Development Authority State Lease) | 260 | 283,228 | ||||||
| 18 | • AB TAX-AWARE FIXED INCOME PORTFOLIO |
Portfolio of Investments
| Principal Amount (000) | U.S. $ Value | |||||||
| ||||||||
New Jersey Economic Development Authority (United Airlines, Inc.) | $ | 85 | $ | 94,119 | ||||
New Jersey Transportation Trust Fund Authority (New Jersey Transportation Trust Fund Authority State Lease) | 240 | 262,445 | ||||||
New Jersey Turnpike Authority | 315 | 370,314 | ||||||
Tobacco Settlement Financing Corp./NJ | 185 | 172,370 | ||||||
|
| |||||||
| 1,216,058 | ||||||||
|
| |||||||
New York – 7.7% | ||||||||
City of New York NY | 340 | 397,011 | ||||||
Metropolitan Transportation Authority | 315 | 372,182 | ||||||
New York State Dormitory Authority | 425 | 517,760 | ||||||
New York State Energy Research & Development Authority | 200 | 184,222 | ||||||
New York State Thruway Authority | 365 | 432,197 | ||||||
New York State Urban Development Corp. | 1,000 | 1,229,120 | ||||||
Ulster County Industrial Development Agency (Kingston Regional Senior Living Corp.) | 120 | 121,792 | ||||||
|
| |||||||
| 3,254,284 | ||||||||
|
| |||||||
Ohio – 4.1% | ||||||||
Buckeye Tobacco Settlement Financing Authority | 170 | 159,370 | ||||||
| AB TAX-AWARE FIXED INCOME PORTFOLIO • | 19 |
Portfolio of Investments
| Principal Amount (000) | U.S. $ Value | |||||||
| ||||||||
City of Akron OH | $ | 445 | $ | 521,015 | ||||
City of Columbus OH | 225 | 227,810 | ||||||
Series 2014A | 110 | 127,999 | ||||||
County of Cuyahoga OH | 365 | 431,222 | ||||||
Dayton-Montgomery County Port Authority (StoryPoint Troy Project) | 100 | 102,743 | ||||||
Ohio Air Quality Development Authority | 145 | 142,641 | ||||||
|
| |||||||
| 1,712,800 | ||||||||
|
| |||||||
Pennsylvania – 2.5% | ||||||||
Montour School District | 450 | 521,050 | ||||||
Moon Industrial Development Authority | 100 | 109,554 | ||||||
Pennsylvania Economic Development Financing Authority | 100 | 102,851 | ||||||
Pennsylvania Economic Development Financing Authority | 300 | 332,445 | ||||||
|
| |||||||
| 1,065,900 | ||||||||
|
| |||||||
Puerto Rico – 0.2% | ||||||||
Puerto Rico Industrial Tourist Educational Medical & Envirml Ctl Facs Fing Auth | 100 | 97,000 | ||||||
|
| |||||||
| 20 | • AB TAX-AWARE FIXED INCOME PORTFOLIO |
Portfolio of Investments
| Principal Amount (000) | U.S. $ Value | |||||||
| ||||||||
South Carolina – 0.7% | ||||||||
Spartanburg County School District No 1/SC | $ | 250 | $ | 297,035 | ||||
|
| |||||||
Tennessee – 0.6% | ||||||||
Metropolitan Government Nashville & Davidson County Health & Educational Facs Bd | 215 | 252,679 | ||||||
|
| |||||||
Texas – 14.3% | ||||||||
Central Texas Regional Mobility Authority | 100 | 111,230 | ||||||
City of Houston TX | 260 | 303,730 | ||||||
Series 2015 | 160 | 186,910 | ||||||
Dallas Area Rapid Transit | 580 | 718,945 | ||||||
Dallas County Flood Control District No 1 | 100 | 106,534 | ||||||
Love Field Airport Modernization Corp. | 500 | 577,040 | ||||||
New Hope Cultural Education Facilities Finance Corp. | 100 | 105,226 | ||||||
North Texas Tollway Authority | 250 | 291,855 | ||||||
Tarrant County Cultural Education Facilities Finance Corp. | 100 | 107,873 | ||||||
Tarrant County Cultural Education Facilities Finance Corp. | 100 | 109,849 | ||||||
| AB TAX-AWARE FIXED INCOME PORTFOLIO • | 21 |
Portfolio of Investments
| Principal Amount (000) | U.S. $ Value | |||||||
| ||||||||
Tarrant Regional Water District | $ | 325 | $ | 393,416 | ||||
Texas Transportation Commission State Highway Fund | 1,300 | 1,468,805 | ||||||
Travis County Cultural Education Facilities Finance Corp. | 160 | 168,547 | ||||||
Travis County Health Facilities Development Corp. | 55 | 61,703 | ||||||
Trinity River Authority Central Regional Wastewater System Revenue | 795 | 918,721 | ||||||
Trinity River Authority LLC | 335 | 386,466 | ||||||
|
| |||||||
| 6,016,850 | ||||||||
|
| |||||||
Virginia – 0.2% | ||||||||
Tobacco Settlement Financing Corp./VA | 100 | 92,357 | ||||||
|
| |||||||
Washington – 1.9% | ||||||||
Port of Seattle WA | 510 | 583,277 | ||||||
Washington State Housing Finance Commission | 100 | 111,669 | ||||||
Washington State Housing Finance Commission | 100 | 116,032 | ||||||
|
| |||||||
| 810,978 | ||||||||
|
| |||||||
West Virginia – 0.2% | ||||||||
West Virginia Hospital Finance Authority | 100 | 88,942 | ||||||
|
| |||||||
| 22 | • AB TAX-AWARE FIXED INCOME PORTFOLIO |
Portfolio of Investments
| Principal Amount (000) | U.S. $ Value | |||||||
| ||||||||
Wisconsin – 0.8% | ||||||||
Wisconsin Public Finance Authority | $ | 100 | $ | 106,498 | ||||
Wisconsin Public Finance Authority | 250 | 244,170 | ||||||
|
| |||||||
| 350,668 | ||||||||
|
| |||||||
Total Municipal Obligations | 38,354,417 | |||||||
|
| |||||||
GOVERNMENTS – TREASURIES – 3.9% | ||||||||
United States – 3.9% | ||||||||
U.S. Treasury Bonds | 1,200 | 1,116,047 | ||||||
U.S. Treasury Notes | 550 | 541,836 | ||||||
|
| |||||||
Total Governments – Treasuries | 1,657,883 | |||||||
|
| |||||||
ASSET-BACKED SECURITIES – 1.6% | ||||||||
Autos - Fixed Rate – 1.1% | ||||||||
Ally Auto Receivables Trust | 100 | 99,850 | ||||||
Ford Credit Floorplan Master Owner Trust | 100 | 100,665 | ||||||
Hertz Vehicle Financing LLC | 100 | 100,278 | ||||||
Hyundai Auto Lease Securitization Trust | 9 | 9,208 | ||||||
Mercedes-Benz Auto Lease Trust | 100 | 100,310 | ||||||
Volkswagen Auto Loan Enhanced Trust | 51 | 51,111 | ||||||
|
| |||||||
Total Autos – Fixed Rate | 461,422 | |||||||
|
| |||||||
Credit Cards - Fixed Rate – 0.3% | ||||||||
Synchrony Credit Card Master Note Trust | 100 | 101,180 | ||||||
|
| |||||||
| AB TAX-AWARE FIXED INCOME PORTFOLIO • | 23 |
Portfolio of Investments
| Principal Amount (000) | U.S. $ Value | |||||||
| ||||||||
Credit Cards - Floating Rate – 0.2% | ||||||||
Cabela’s Credit Card Master Note Trust | $ | 100 | $ | 99,967 | ||||
|
| |||||||
Total Asset-Backed Securities | 662,569 | |||||||
|
| |||||||
CORPORATES – INVESTMENT GRADE – 0.8% |
| |||||||
Financial Institutions – 0.4% | ||||||||
Banking – 0.4% | ||||||||
Bank of America Corp. | 165 | 181,689 | ||||||
|
| |||||||
Industrial – 0.4% | ||||||||
Consumer Cyclical - Automotive – 0.3% | ||||||||
General Motors Financial Co., Inc. | 100 | 101,758 | ||||||
|
| |||||||
Consumer Non-Cyclical – 0.1% | ||||||||
Newell Brands, Inc. | 50 | 51,008 | ||||||
|
| |||||||
| 152,766 | ||||||||
|
| |||||||
Total Corporates – Investment Grade | 334,455 | |||||||
|
| |||||||
COLLATERALIZED MORTGAGE OBLIGATIONS – 0.3% | ||||||||
Risk Share Floating Rate – 0.3% | ||||||||
Federal National Mortgage Association Connecticut Avenue Securities | 47 | 47,253 | ||||||
Series 2014-C02, Class 1M1 | 48 | 47,808 | ||||||
Series 2014-C02, Class 2M1 | 30 | 29,902 | ||||||
|
| |||||||
Total Collateralized Mortgage Obligations | 124,963 | |||||||
|
| |||||||
COMMERCIAL MORTGAGE-BACKED SECURITY – 0.2% | ||||||||
Non-Agency Fixed Rate CMBS – 0.2% | ||||||||
Citigroup Commercial Mortgage Trust | 100 | 102,518 | ||||||
|
| |||||||
| 24 | • AB TAX-AWARE FIXED INCOME PORTFOLIO |
Portfolio of Investments
| Shares | U.S. $ Value | |||||||
| ||||||||
SHORT-TERM INVESTMENTS – 2.4% | ||||||||
Investment Companies – 2.4% | ||||||||
AB Fixed Income Shares, Inc. – Government Money Market Portfolio – Class AB, 0.26%(j)(k) | 1,026,359 | $ | 1,026,359 | |||||
|
| |||||||
Total Investments – 100.4% | 42,263,164 | |||||||
Other assets less liabilities – (0.4)% | (188,865 | ) | ||||||
|
| |||||||
Net Assets – 100.0% | $ | 42,074,299 | ||||||
|
| |||||||
CENTRALLY CLEARED INTEREST RATE SWAPS (see Note D)
| Rate Type | ||||||||||||||||||||
| Clearing Broker/ (Exchange) | Notional Amount (000) | Termination Date | Payments made by the Fund | Payments received by the Fund | Unrealized Appreciation/ (Depreciation) | |||||||||||||||
Morgan Stanley & Co. LLC/(CME) | $ | 4,530 | 10/23/51 | 1.859% | 3 Month LIBOR | $ | 325,415 | |||||||||||||
Morgan Stanley & Co. LLC/(CME) | 4,930 | 10/23/46 | 3 Month LIBOR | 2.156 | 25,740 | |||||||||||||||
|
| |||||||||||||||||||
| $ | 351,155 | |||||||||||||||||||
|
| |||||||||||||||||||
INFLATION (CPI) SWAPS (see Note D)
| Rate Type | ||||||||||||||||||||
Swap Counterparty | Notional Amount (000) | Termination Date | Payments made by the Fund | Payments received by the Fund | Unrealized Appreciation/ (Depreciation) | |||||||||||||||
Citibank, NA | $ | 400 | 12/14/20 | 1.548% | CPI# | $ | 5,377 | |||||||||||||
Citibank, NA | 1,000 | 8/09/21 | 1.540% | CPI# | 17,014 | |||||||||||||||
|
| |||||||||||||||||||
| $ | 22,391 | |||||||||||||||||||
|
| |||||||||||||||||||
| # | Variable interest rate based on the rate of inflation as determined by the Consumer Price Index (CPI). |
| AB TAX-AWARE FIXED INCOME PORTFOLIO • | 25 |
Portfolio of Investments
INTEREST RATE SWAPS (see Note D)
| Rate Type | ||||||||||||||||||||
Swap Counterparty | Notional Amount (000) | Termination Date | Payments made by the Fund | Payments received by the Fund | Unrealized Appreciation/ (Depreciation) | |||||||||||||||
Citibank, NA | $ | 400 | 8/25/23 | 0.880% | SIFMA* | $ | 6,152 | |||||||||||||
JPMorgan Chase Bank, NA | 500 | 6/07/22 | 0.906% | SIFMA* | 3,323 | |||||||||||||||
JPMorgan Chase Bank, NA | 1,870 | 9/22/46 | 1.620% | SIFMA* | 36,765 | |||||||||||||||
|
| |||||||||||||||||||
| $ | 46,240 | |||||||||||||||||||
|
| |||||||||||||||||||
| * | Variable interest rate based on the Securities Industry & Financial Markets Association (SIFMA) Municipal Swap Index. |
| + | Non-income producing security. |
| (a) | Security is exempt from registration under Rule 144A of the Securities Act of 1933. These securities are considered restricted, but liquid and may be resold in transactions exempt from registration, normally to qualified institutional buyers. At October 31, 2016, the aggregate market value of these securities amounted to $1,490,553 or 3.5% of net assets. |
| (b) | Restricted and illiquid security. |
| Restricted & Illiquid Securities | Acquisition Date | Cost | Market Value | Percentage of Net Assets | ||||||||||||
Capital Trust Agency, Inc. | 12/19/14 | $ | 95,296 | $ | 88,798 | 0.21 | % | |||||||||
Illinois Finance Authority | 12/18/13 | 48,104 | 34,402 | 0.08 | % | |||||||||||
Louisiana Public Facilities Authority | 7/31/14 | 250,000 | 144,375 | 0.34 | % | |||||||||||
| (c) | Coupon rate adjusts periodically based upon a predetermined schedule. Stated interest rate in effect at October 31, 2016. |
| (d) | Security is exempt from registration under Rule 144A of the Securities Act of 1933. These securities, which represent 0.24% of net assets as of October 31, 2016, are considered illiquid and restricted. Additional information regarding such securities follows: |
| 144A/Restricted & Illiquid Securities | Acquisition Date | Cost | Market Value | Percentage of Net Assets | ||||||||||||
City of Chicago IL | 5/27/15 | $ | 100,000 | $ | 100,226 | 0.24 | % | |||||||||
| (e) | Illiquid security. |
| (f) | When-Issued or delayed delivery security. |
| (g) | Defaulted. |
| (h) | An auction rate security whose interest rate resets at each auction date. Auctions are typically held every week or month. The rate shown is as of October 31, 2016 and the aggregate market value of these securities amounted to $386,011 or 0.92% of net assets. |
| 26 | • AB TAX-AWARE FIXED INCOME PORTFOLIO |
Portfolio of Investments
| (i) | Floating Rate Security. Stated interest/floor rate was in effect at October 31, 2016. |
| (j) | Investment in affiliated money market mutual fund. The rate shown represents the 7-day yield as of period end. |
| (k) | To obtain a copy of the fund’s financial statements, please go to the Securities and Exchange Commission’s website at www.sec.gov, or call AB at (800) 227-4618. |
As of October 31, 2016, the Fund’s percentages of investments in municipal bonds that are insured and in insured municipal bonds that have been pre-refunded or escrowed to maturity are 5.7% and 0.0%, respectively.
Glossary:
AGM – Assured Guaranty Municipal
CMBS – Commercial Mortgage-Backed Securities
CME – Chicago Mercantile Exchange
COP – Certificate of Participation
ETM – Escrowed to Maturity
LIBOR – London Interbank Offered Rates
NATL – National Interstate Corporation
XLCA – XL Capital Assurance Inc.
See notes to financial statements.
| AB TAX-AWARE FIXED INCOME PORTFOLIO • | 27 |
Portfolio of Investments
STATEMENT OF ASSETS & LIABILITIES
October 31, 2016
| Assets | ||||
Investments in securities, at value | ||||
Unaffiliated issuers (cost $39,782,476) | $ | 41,236,805 | ||
Affiliated issuers (cost $1,026,359) | 1,026,359 | |||
Cash collateral due from broker | 78,932 | |||
Interest receivable | 489,016 | |||
Receivable for capital stock sold | 207,000 | |||
Unrealized appreciation on interest rate swaps | 46,240 | |||
Unrealized appreciation on inflation swaps | 22,391 | |||
Receivable due from Adviser | 8,540 | |||
Receivable for variation margin on exchange-traded derivatives | 2,180 | |||
Affiliated dividends receivable | 103 | |||
|
| |||
Total assets | 43,117,566 | |||
|
| |||
| Liabilities | ||||
Due to custodian | 228,000 | |||
Payable for investment securities purchased | 413,741 | |||
Payable for capital stock redeemed | 267,739 | |||
Audit and tax fee payable | 55,681 | |||
Dividends payable | 21,315 | |||
Distribution fee payable | 3,094 | |||
Transfer Agent fee payable | 1,526 | |||
Accrued expenses | 52,171 | |||
|
| |||
Total liabilities | 1,043,267 | |||
|
| |||
Net Assets | $ | 42,074,299 | ||
|
| |||
| Composition of Net Assets | ||||
Capital stock, at par | $ | 3,871 | ||
Additional paid-in capital | 40,366,499 | |||
Undistributed net investment income | 14,960 | |||
Accumulated net realized loss on investment transactions | (185,146 | ) | ||
Net unrealized appreciation on investments | 1,874,115 | |||
|
| |||
| $ | 42,074,299 | |||
|
|
Net Asset Value Per Share—18 billion shares of capital stock authorized, $.001 par value
| Class | Net Assets | Shares Outstanding | Net Asset Value | |||||||||
| ||||||||||||
| A | $ | 6,385,257 | 587,587 | $ | 10.87 | * | ||||||
| ||||||||||||
| C | $ | 2,021,614 | 186,003 | $ | 10.87 | |||||||
| ||||||||||||
| Advisor | $ | 33,667,428 | 3,097,700 | $ | 10.87 | |||||||
| ||||||||||||
| * | The maximum offering price per share for Class A shares was $11.21 which reflects a sales charge of 3.00%. |
See notes to financial statements.
| 28 | • AB TAX-AWARE FIXED INCOME PORTFOLIO |
Statement of Assets & Liabilities
STATEMENT OF OPERATIONS
Year Ended October 31, 2016
| Investment Income | ||||||||
Interest | $ | 1,093,420 | ||||||
Dividends—Affiliated issuers | 3,100 | $ | 1,096,520 | |||||
|
| |||||||
| Expenses | ||||||||
Advisory fee (see Note B) | 196,813 | |||||||
Distribution fee—Class A | 16,151 | |||||||
Distribution fee—Class C | 19,690 | |||||||
Transfer agency—Class A | 4,780 | |||||||
Transfer agency—Class C | 1,494 | |||||||
Transfer agency—Advisor Class | 23,087 | |||||||
Custodian | 96,642 | |||||||
Audit and tax | 61,192 | |||||||
Administrative | 53,318 | |||||||
Registration fees | 52,765 | |||||||
Legal | 44,096 | |||||||
Directors’ fees | 25,301 | |||||||
Printing | 10,559 | |||||||
Miscellaneous | 7,852 | |||||||
|
| |||||||
Total expenses | 613,740 | |||||||
Less: expenses waived and reimbursed by the Adviser (see Note B) | (362,421 | ) | ||||||
|
| |||||||
Net expenses | 251,319 | |||||||
|
| |||||||
Net investment income | 845,201 | |||||||
|
| |||||||
| Realized and Unrealized Gain (Loss) on Investment Transactions | ||||||||
Net realized gain (loss) on: | ||||||||
Investment transactions | 219,272 | |||||||
Swaps | (367,773 | ) | ||||||
Net change in unrealized appreciation/depreciation of: | ||||||||
Investments | 638,375 | |||||||
Swaps | 418,938 | |||||||
|
| |||||||
Net gain on investment transactions | 908,812 | |||||||
|
| |||||||
Net Increase in Net Assets from Operations | $ | 1,754,013 | ||||||
|
|
See notes to financial statements.
| AB TAX-AWARE FIXED INCOME PORTFOLIO • | 29 |
Statement of Operations
STATEMENT OF CHANGES IN NET ASSETS
| Year Ended October 31, 2016 | Year Ended October 31, 2015 | |||||||
| Increase (Decrease) in Net Assets from Operations | ||||||||
Net investment income | $ | 845,201 | $ | 489,639 | ||||
Net realized loss on investment transactions | (148,501 | ) | (36,858 | ) | ||||
Net change in unrealized appreciation/depreciation of investments | 1,057,313 | 228,333 | ||||||
|
|
|
| |||||
Net increase in net assets from operations | 1,754,013 | 681,114 | ||||||
| Dividends and Distributions to Shareholders from | ||||||||
Net investment income | ||||||||
Class A | (127,309 | ) | (51,320 | ) | ||||
Class C | (23,951 | ) | (11,889 | ) | ||||
Advisor Class | (688,508 | ) | (426,246 | ) | ||||
Net realized gain on investment transactions | ||||||||
Class A | – 0 | – | (2,414 | ) | ||||
Class C | – 0 | – | (440 | ) | ||||
Advisor Class | – 0 | – | (19,264 | ) | ||||
| Capital Stock Transactions | ||||||||
Net increase | 8,526,502 | 15,557,455 | ||||||
|
|
|
| |||||
Total increase | 9,440,747 | 15,726,996 | ||||||
| Net Assets | ||||||||
Beginning of period | 32,633,552 | 16,906,556 | ||||||
|
|
|
| |||||
End of period (including undistributed net investment income of $14,960 and $13,754, respectively) | $ | 42,074,299 | $ | 32,633,552 | ||||
|
|
|
| |||||
See notes to financial statements.
| 30 | • AB TAX-AWARE FIXED INCOME PORTFOLIO |
Statement of Changes in Net Assets
NOTES TO FINANCIAL STATEMENTS
October 31, 2016
NOTE A
Significant Accounting Policies
AB Bond Fund, Inc. (the “Company”) is registered under the Investment Company Act of 1940 as an open-end management investment company. The Company, which is a Maryland corporation, operates as a series company comprised of ten portfolios currently in operation. Each portfolio is considered to be a separate entity for financial reporting and tax purposes. This report relates only to the AB Tax-Aware Fixed Income Portfolio (the “Portfolio”), a diversified portfolio. The Portfolio has authorized the issuance of Class A, Class B, Class C, Advisor Class, Class 1 and Class 2 shares. Class B, Class 1 and Class 2 shares are not currently being offered. Class A shares are sold with a front-end sales charge of up to 3.0% for purchases not exceeding $500,000. With respect to purchases of $500,000 or more, Class A shares redeemed within one year of purchase may be subject to a contingent deferred sales charge of 1%. Class C shares are subject to a contingent deferred sales charge of 1% on redemptions made within the first year after purchase. Advisor Class shares are sold without any initial or contingent deferred sales charge and are not subject to ongoing distribution expenses. All six classes of shares have identical voting, dividend, liquidation and other rights, except that the classes bear different distribution and transfer agency expenses. Each class has exclusive voting rights with respect to its distribution plan. The financial statements have been prepared in conformity with U.S. generally accepted accounting principles (“U.S. GAAP”) which require management to make certain estimates and assumptions that affect the reported amounts of assets and liabilities in the financial statements and amounts of income and expenses during the reporting period. Actual results could differ from those estimates. The Portfolio is an investment company under U.S. GAAP and follows the accounting and reporting guidance applicable to investment companies. The following is a summary of significant accounting policies followed by the Portfolio.
1. Security Valuation
Portfolio securities are valued at their current market value determined on the basis of market quotations or, if market quotations are not readily available or are deemed unreliable, at “fair value” as determined in accordance with procedures established by and under the general supervision of the Company’s Board of Directors (the “Board”).
In general, the market values of securities which are readily available and deemed reliable are determined as follows: securities listed on a national securities exchange (other than securities listed on the NASDAQ Stock Market, Inc. (“NASDAQ”)) or on a foreign securities exchange are valued at the last sale price at the close of the exchange or foreign securities exchange. If there has been no sale on such day, the securities are valued
| AB TAX-AWARE FIXED INCOME PORTFOLIO • | 31 |
Notes to Financial Statements
at the last traded price from the previous day. Securities listed on more than one exchange are valued by reference to the principal exchange on which the securities are traded; securities listed only on NASDAQ are valued in accordance with the NASDAQ Official Closing Price; listed or over the counter (“OTC”) market put or call options are valued at the mid level between the current bid and ask prices. If either a current bid or current ask price is unavailable, AllianceBernstein L.P. (the “Adviser”) will have discretion to determine the best valuation (e.g. last trade price in the case of listed options); open futures are valued using the closing settlement price or, in the absence of such a price, the most recent quoted bid price. If there are no quotations available for the day of valuation, the last available closing settlement price is used; U.S. Government securities and any other debt instruments having 60 days or less remaining until maturity are generally valued at market by an independent pricing vendor, if a market price is available. If a market price is not available, the securities are valued at amortized cost. This methodology is commonly used for short term securities that have an original maturity of 60 days or less, as well as short term securities that had an original term to maturity that exceeded 60 days. In instances when amortized cost is utilized, the Valuation Committee (the “Committee”) must reasonably conclude that the utilization of amortized cost is approximately the same as the fair value of the security. Such factors the Committee will consider include, but are not limited to, an impairment of the creditworthiness of the issuer or material changes in interest rates. Fixed-income securities, including mortgage-backed and asset-backed securities, may be valued on the basis of prices provided by a pricing service or at a price obtained from one or more of the major broker-dealers. In cases where broker-dealer quotes are obtained, the Adviser may establish procedures whereby changes in market yields or spreads are used to adjust, on a daily basis, a recently obtained quoted price on a security. Swaps and other derivatives are valued daily, primarily using independent pricing services, independent pricing models using market inputs, as well as third party broker-dealers or counterparties. Open end mutual funds are valued at the closing net asset value per share, while exchange traded funds are valued at the closing market price per share.
Securities for which market quotations are not readily available (including restricted securities) or are deemed unreliable are valued at fair value as deemed appropriate by the Adviser. Factors considered in making this determination may include, but are not limited to, information obtained by contacting the issuer, analysts, analysis of the issuer’s financial statements or other available documents. In addition, the Portfolio may use fair value pricing for securities primarily traded in non-U.S. markets because most foreign markets close well before the Portfolio values its securities at 4:00 p.m., Eastern Time. The earlier close of these foreign markets gives rise to the possibility that significant events, including
| 32 | • AB TAX-AWARE FIXED INCOME PORTFOLIO |
Notes to Financial Statements
broad market moves, may have occurred in the interim and may materially affect the value of those securities. To account for this, the Portfolio may frequently value many of its foreign equity securities using fair value prices based on third party vendor modeling tools to the extent available.
2. Fair Value Measurements
In accordance with U.S. GAAP regarding fair value measurements, fair value is defined as the price that the Portfolio would receive to sell an asset or pay to transfer a liability in an orderly transaction between market participants at the measurement date. U.S. GAAP establishes a framework for measuring fair value, and a three-level hierarchy for fair value measurements based upon the transparency of inputs to the valuation of an asset or liability (including those valued based on their market values as described in Note A.1 above). Inputs may be observable or unobservable and refer broadly to the assumptions that market participants would use in pricing the asset or liability. Observable inputs reflect the assumptions market participants would use in pricing the asset or liability based on market data obtained from sources independent of the Portfolio. Unobservable inputs reflect the Portfolio’s own assumptions about the assumptions that market participants would use in pricing the asset or liability based on the best information available in the circumstances. Each investment is assigned a level based upon the observability of the inputs which are significant to the overall valuation. The three-tier hierarchy of inputs is summarized below.
| • | Level 1—quoted prices in active markets for identical investments |
| • | Level 2—other significant observable inputs (including quoted prices for similar investments, interest rates, prepayment speeds, credit risk, etc.) |
| • | Level 3—significant unobservable inputs (including the Portfolio’s own assumptions in determining the fair value of investments) |
The fair value of debt instruments, such as bonds, and over-the-counter derivatives is generally based on market price quotations, recently executed market transactions (where observable) or industry recognized modeling techniques and are generally classified as Level 2. Pricing vendor inputs to Level 2 valuations may include quoted prices for similar investments in active markets, interest rate curves, coupon rates, currency rates, yield curves, option adjusted spreads, default rates, credit spreads and other unique security features in order to estimate the relevant cash flows which are then discounted to calculate fair values. If these inputs are unobservable and significant to the fair value, these investments will be classified as Level 3. In addition, non-agency rated investments are classified as Level 3.
Valuations of mortgage-backed or other asset-backed securities, by pricing vendors, are based on both proprietary and industry recognized models and discounted cash flow techniques. Significant inputs to the valuation of
| AB TAX-AWARE FIXED INCOME PORTFOLIO • | 33 |
Notes to Financial Statements
these instruments are value of the collateral, the rates and timing of delinquencies, the rates and timing of prepayments, and default and loss expectations, which are driven in part by housing prices for residential mortgages. Significant inputs are determined based on relative value analyses, which incorporate comparisons to instruments with similar collateral and risk profiles, including relevant indices. Mortgage and asset-backed securities for which management has collected current observable data through pricing services are generally categorized within Level 2. Those investments for which current observable data has not been provided are classified as Level 3.
Other fixed income investments, including non-U.S. government and corporate debt, are generally valued using quoted market prices, if available, which are typically impacted by current interest rates, maturity dates and any perceived credit risk of the issuer. Additionally, in the absence of quoted market prices, these inputs are used by pricing vendors to derive a valuation based upon industry or proprietary models which incorporate issuer specific data with relevant yield/spread comparisons with more widely quoted bonds with similar key characteristics. Those investments for which there are observable inputs are classified as Level 2. Where the inputs are not observable, the investments are classified as Level 3.
The following table summarizes the valuation of the Portfolio’s investments by the above fair value hierarchy levels as of October 31, 2016:
Investments in Securities: | Level 1 | Level 2 | Level 3 | Total | ||||||||||||
Assets: | ||||||||||||||||
Long-Term Municipal Bonds | $ | – 0 | – | $ | 35,953,354 | $ | 2,401,063 | $ | 38,354,417 | |||||||
Governments — Treasuries | – 0 | – | 1,657,883 | – 0 | – | 1,657,883 | ||||||||||
Asset-Backed Securities | – 0 | – | 662,569 | – 0 | – | 662,569 | ||||||||||
Corporates — Investment Grade | – 0 | – | 334,455 | – 0 | – | 334,455 | ||||||||||
Collateralized Mortgage Obligations | – 0 | – | 124,963 | – 0 | – | 124,963 | ||||||||||
Commercial Mortgage-Backed Securities | – 0 | – | 102,518 | – 0 | – | 102,518 | ||||||||||
Short-Term Investments | 1,026,359 | – 0 | – | – 0 | – | 1,026,359 | ||||||||||
|
|
|
|
|
|
|
| |||||||||
Total Investments in Securities | 1,026,359 | 38,835,742 | 2,401,063 | 42,263,164 | ||||||||||||
Other Financial Instruments(a): | ||||||||||||||||
Assets: | ||||||||||||||||
Centrally Cleared Interest Rate Swaps | – 0 | – | 351,155 | – 0 | – | 351,155 | (b) | |||||||||
Inflation (CPI) Swaps | – 0 | – | 22,391 | – 0 | – | 22,391 | ||||||||||
Interest Rate Swaps | – 0 | – | 46,240 | – 0 | – | 46,240 | ||||||||||
Liabilities | – 0 | – | – 0 | – | – 0 | – | – 0 | – | ||||||||
|
|
|
|
|
|
|
| |||||||||
Total(c) | $ | 1,026,359 | $ | 39,255,528 | $ | 2,401,063 | $ | 42,682,950 | ||||||||
|
|
|
|
|
|
|
| |||||||||
| (a) | Other financial instruments are derivative instruments, such as futures, forwards and swaps, which are valued at the unrealized appreciation/depreciation on the instrument. |
| (b) | Only variation margin receivable/payable at period end is reported within the statement of assets and liabilities. This amount reflects cumulative unrealized appreciation/(depreciation) of exchange-traded derivatives as reported in the portfolio of investments. |
| (c) | There were no transfers between any levels during the reporting period. |
| 34 | • AB TAX-AWARE FIXED INCOME PORTFOLIO |
Notes to Financial Statements
The Portfolio recognizes all transfers between levels of the fair value hierarchy assuming the financial instruments were transferred at the beginning of the reporting period.
The following is a reconciliation of investments in which significant unobservable inputs (Level 3) were used in determining fair value.
| Long-Term Municipal Bonds | Total | |||||||
Balance as of 10/31/15 | $ | 1,840,984 | $ | 1,840,984 | ||||
Accrued discounts/(premiums) | (907 | ) | (907 | ) | ||||
Realized gain (loss) | 5,689 | 5,689 | ||||||
Change in unrealized appreciation/depreciation | (55,580 | ) | (55,580 | ) | ||||
Purchases | 822,609 | 822,609 | ||||||
Sales | (211,732 | ) | (211,732 | ) | ||||
Transfers in to Level 3 | – 0 | – | – 0 | – | ||||
Transfers out of Level 3 | – 0 | – | – 0 | – | ||||
|
|
|
| |||||
Balance as of 10/31/16 | $ | 2,401,063 | $ | 2,401,063 | ||||
|
|
|
| |||||
Net change in unrealized appreciation/depreciation from investments held as of 10/31/16(a) | $ | (59,176 | ) | $ | (59,176 | ) | ||
|
|
|
| |||||
| (a) | The unrealized appreciation/depreciation is included in net change in unrealized appreciation/depreciation on investments and other financial instruments in the accompanying statement of operations. |
As of October 31, 2016, all Level 3 securities were priced by third party vendors.
The Adviser established the Committee to oversee the pricing and valuation of all securities held in the Portfolio. The Committee operates under pricing and valuation policies and procedures established by the Adviser and approved by the Board, including pricing policies which set forth the mechanisms and processes to be employed on a daily basis to implement these policies and procedures. In particular, the pricing policies describe how to determine market quotations for securities and other instruments. The Committee’s responsibilities include: 1) fair value and liquidity determinations (and oversight of any third parties to whom any responsibility for fair value and liquidity determinations is delegated), and 2) regular monitoring of the Adviser’s pricing and valuation policies and procedures and modification or enhancement of these policies and procedures (or recommendation of the modification of these policies and procedures) as the Committee believes appropriate.
The Committee is also responsible for monitoring the implementation of the pricing policies by the Adviser’s Pricing Group (the “Pricing Group”) and a third party which performs certain pricing functions in accordance with the pricing policies. The Pricing Group is responsible for the oversight of the third party on a day-to-day basis. The Committee and the
| AB TAX-AWARE FIXED INCOME PORTFOLIO • | 35 |
Notes to Financial Statements
Pricing Group perform a series of activities to provide reasonable assurance of the accuracy of prices including: 1) periodic vendor due diligence meetings, review of methodologies, new developments and processes at vendors, 2) daily comparison of security valuation versus prior day for all securities that exceeded established thresholds, and 3) daily review of unpriced, stale, and variance reports with exceptions reviewed by senior management and the Committee.
In addition, several processes outside of the pricing process are used to monitor valuation issues including: 1) performance and performance attribution reports are monitored for anomalous impacts based upon benchmark performance, and 2) portfolio managers review all portfolios for performance and analytics (which are generated using the Adviser’s prices).
3. Currency Translation
Assets and liabilities denominated in foreign currencies and commitments under forward currency exchange contracts are translated into U.S. dollars at the mean of the quoted bid and ask prices of such currencies against the U.S. dollar. Purchases and sales of portfolio securities are translated into U.S. dollars at the rates of exchange prevailing when such securities were acquired or sold. Income and expenses are translated into U.S. dollars at rates of exchange prevailing when accrued.
The Portfolio does not isolate that portion of the results of operations resulting from changes in foreign exchange rates on investments from the fluctuations arising from changes in market prices of securities held. Such fluctuations are included with the net realized and unrealized gain or loss from investments.
Net realized gain or loss on foreign currency transactions represents foreign exchange gains and losses from sales and maturities of foreign fixed income investments, foreign currency exchange contracts, holding of foreign currencies, currency gains or losses realized between the trade and settlement dates on foreign investment transactions, and the difference between the amounts of dividends, interest and foreign withholding taxes recorded on the Portfolio’s books and the U.S. dollar equivalent amounts actually received or paid. Net unrealized currency gains and losses from valuing foreign currency denominated assets and liabilities at period end exchange rates are reflected as a component of net unrealized appreciation or depreciation of foreign currency denominated assets and liabilities.
4. Taxes
It is the Portfolio’s policy to meet the requirements of the Internal Revenue Code applicable to regulated investment companies and to distribute all of its investment company taxable income and net realized gains, if any, to shareholders. Therefore, no provisions for federal income or excise taxes are required. The Portfolio may be subject to taxes imposed by countries in which it invests. Such taxes are generally based on income
| 36 | • AB TAX-AWARE FIXED INCOME PORTFOLIO |
Notes to Financial Statements
and/or capital gains earned or repatriated. Taxes are accrued and applied to net investment income, net realized gains and net unrealized appreciation/depreciation as such income and/or gains are earned.
In accordance with U.S. GAAP requirements regarding accounting for uncertainties in income taxes, management has analyzed the Portfolio’s tax positions taken or expected to be taken on federal and state income tax returns for all open tax years (the current and the prior tax years) and has concluded that no provision for income tax is required in the Portfolio’s financial statements.
5. Investment Income and Investment Transactions
Dividend income is recorded on the ex-dividend date or as soon as the Portfolio is informed of the dividend. Interest income is accrued daily. Investment transactions are accounted for on the date the securities are purchased or sold. Investment gains or losses are determined on the identified cost basis. The Portfolio amortizes premiums and accretes discounts as adjustments to interest income.
6. Class Allocations
All income earned and expenses incurred by the Portfolio are borne on a pro-rata basis by each outstanding class of shares, based on the proportionate interest in the Portfolio represented by the net assets of such class, except for class specific expenses which are allocated to the respective class. Expenses of the Company are charged proportionately to each portfolio or based on other appropriate methods. Realized and unrealized gains and losses are allocated among the various share classes based on respective net assets.
7. Dividends and Distributions
Dividends and distributions to shareholders, if any, are recorded on the ex-dividend date. Income dividends and capital gains distributions are determined in accordance with federal tax regulations and may differ from those determined in accordance with U.S. GAAP. To the extent these differences are permanent, such amounts are reclassified within the capital accounts based on their federal tax basis treatment; temporary differences do not require such reclassification.
NOTE B
Advisory Fee and Other Transactions with Affiliates
Under the terms of the investment advisory agreement, the Portfolio pays the Adviser a management fee at an annual rate of 0.50% of the Portfolio’s average daily net assets. The Adviser has agreed to waive its fees and bear certain expenses to the extent necessary to limit total operating expenses (excluding expenses associated with securities sold short, acquired fund fees and expenses other than the advisory fees of any AB Mutual Funds in which the Fund may invest, interest expense, taxes, extraordinary expenses, and brokerage commissions and other transaction
| AB TAX-AWARE FIXED INCOME PORTFOLIO • | 37 |
Notes to Financial Statements
costs), on an annual basis (the “Expense Caps”) to 0.80% (0.85% prior to January 30, 2015), 1.55% and 0.55%, of average daily net assets for Class A, Class C and Advisor Class shares, respectively. Any fees waived and expenses borne by the Adviser through December 11, 2014 are subject to repayment by the Portfolio until December 11, 2016; such waivers that are subject to repayment amounted to $364,198. No repayment will be made that would cause the Portfolio’s total annualized operating expenses to exceed the net fee percentage set forth above or would exceed the amount of offering expenses as recorded by the Fund on or before December 11, 2014. The Expense Caps may not be terminated before January 30, 2017. For the year ended October 31, 2016, such reimbursements/waivers amounted to $308,027.
Pursuant to the investment advisory agreement, the Portfolio may reimburse the Adviser for certain legal and accounting services provided to the Portfolio by the Adviser. For the year ended October 31, 2016, the Adviser voluntarily agreed to waive such fees amounting to $53,318.
The Portfolio compensates AllianceBernstein Investor Services, Inc. (“ABIS”), a wholly-owned subsidiary of the Adviser, under a Transfer Agency Agreement for providing personnel and facilities to perform transfer agency services for the Portfolio. ABIS may make payments to intermediaries that provide omnibus account services, sub-accounting services and/or networking services. Such compensation retained by ABIS amounted to $17,843 for the year ended October 31, 2016.
AllianceBernstein Investments, Inc. (the “Distributor”), a wholly-owned subsidiary of the Adviser, serves as the distributor of the Portfolio’s shares. The Distributor has advised the Portfolio that it has retained front-end sales charges of $0 from the sale of Class A shares and received $0 and $1,399 in contingent deferred sales charges imposed upon redemptions by shareholders of Class A and Class C shares, respectively, for the year ended October 31, 2016.
The AB Fixed-Income Shares, Inc.—Government STIF Portfolio (the “Government STIF Portfolio”), prior to June 1, 2016, was offered as a cash management option to mutual funds and other institutional accounts of the Adviser, and was not available for direct purchase by members of the public. Prior to June 1, 2016, the Government STIF Portfolio paid no advisory fees but did bear its own expenses. As of June 1, 2016, the Government STIF Portfolio, which was renamed “AB Government Money Market Portfolio” (the “Government Money Market Portfolio”), has a contractual advisory fee rate of .20% and continues to bear its own expenses. In connection with the investment by the Portfolio in the Government Money Market Portfolio, the Adviser has agreed to waive its advisory fee from the Portfolio in an amount equal to the Portfolio’s share of the advisory fees of Government Money Market Portfolio, as borne indirectly by the Portfolio as an acquired fund fee and expense. For the
| 38 | • AB TAX-AWARE FIXED INCOME PORTFOLIO |
Notes to Financial Statements
year ended October 31, 2016, such waiver amounted to $1,076. A summary of the Portfolio’s transactions in shares of the Government Money Market Portfolio for the year ended October 31, 2016 is as follows:
Market Value 10/31/15 (000) | Purchases at Cost (000) | Sales Proceeds (000) | Market Value 10/31/16 (000) | Dividend Income (000) | ||||||||||||||
| $ | 2,386 | $ | 23,494 | $ | 24,854 | $ | 1,026 | $ | 3 | |||||||||
Brokerage commissions paid on investment transactions for the year ended October 31, 2016 amounted to $0, of which $0 and $0, respectively, was paid to Sanford C. Bernstein & Co. LLC and Sanford C. Bernstein Limited, affiliates of the Adviser.
NOTE C
Distribution Services Agreement
The Portfolio has adopted a Distribution Services Agreement (the “Agreement”) pursuant to Rule 12b-1 under the Investment Company Act of 1940. Under the Agreement, the Portfolio pays distribution and servicing fees to the Distributor at an annual rate of up to 0.30% of the Portfolio’s average daily net assets attributable to Class A shares and 1% of the Portfolio’s average daily net assets attributable to Class C shares. Effective January 30, 2015, payments under the Agreement in respect of Class A shares are limited to an annual rate of 0.25% of Class A Shares’ average daily net assets. The fees are accrued daily and paid monthly. The Agreement provides that the Distributor will use such payments in their entirety for distribution assistance and promotional activities. Since the commencement of the Portfolio’s operations, the Distributor has incurred expenses in excess of the distribution costs reimbursed by the Portfolio in the amount of $12,038 for Class C shares. While such costs may be recovered from the Portfolio in future periods so long as the Agreement is in effect, the rate of the distribution and servicing fees payable under the Agreement may not be increased without a shareholder vote. In accordance with the Agreement, there is no provision for recovery of unreimbursed distribution costs incurred by the Distributor beyond the current fiscal year for Class A shares. The Agreement also provides that the Adviser may use its own resources to finance the distribution of the Portfolio’s shares.
NOTE D
Investment Transactions
Purchases and sales of investment securities (excluding short-term investments) for the year ended October 31, 2016 were as follows:
| Purchases | Sales | |||||||
Investment securities (excluding | $ | 18,987,938 | $ | 8,861,303 | ||||
U.S. government securities | 6,388,238 | 4,717,166 | ||||||
| AB TAX-AWARE FIXED INCOME PORTFOLIO • | 39 |
Notes to Financial Statements
The cost of investments for federal income tax purposes, gross unrealized appreciation and unrealized depreciation are as follows:
Cost | $ | 40,808,835 | ||
|
| |||
Gross unrealized appreciation | $ | 1,709,140 | ||
Gross unrealized depreciation | (254,811 | ) | ||
|
| |||
Net unrealized appreciation | $ | 1,454,329 | ||
|
|
1. Derivative Financial Instruments
The Portfolio may use derivatives in an effort to earn income and enhance returns, to replace more traditional direct investments, to obtain exposure to otherwise inaccessible markets (collectively, “investment purposes”), or to hedge or adjust the risk profile of its portfolio.
The principal types of derivatives utilized by the Portfolio, as well as the methods in which they may be used are:
| • | Swaps |
The Portfolio may enter into swaps to hedge its exposure to interest rates or credit risk. A swap is an agreement that obligates two parties to exchange a series of cash flows at specified intervals based upon or calculated by reference to changes in specified prices or rates for a specified amount of an underlying asset. The payment flows are usually netted against each other, with the difference being paid by one party to the other. In addition, collateral may be pledged or received by the Portfolio in accordance with the terms of the respective swaps to provide value and recourse to the Portfolio or its counterparties in the event of default, bankruptcy or insolvency by one of the parties to the swap.
Risks may arise as a result of the failure of the counterparty to the swap to comply with the terms of the swap. The loss incurred by the failure of a counterparty is generally limited to the net interim payment to be received by the Portfolio, and/or the termination value at the end of the contract. Therefore, the Portfolio considers the creditworthiness of each counterparty to a swap in evaluating potential counterparty risk. This risk is mitigated by having a netting arrangement between the Portfolio and the counterparty and by the posting of collateral by the counterparty to the Portfolio to cover the Portfolio’s exposure to the counterparty. Additionally, risks may arise from unanticipated movements in interest rates or in the value of the underlying securities. The Portfolio accrues for the interim payments on swaps on a daily basis, with the net amount recorded within unrealized appreciation/depreciation of swaps on the statement of assets and liabilities, where applicable. Once the interim payments are settled
| 40 | • AB TAX-AWARE FIXED INCOME PORTFOLIO |
Notes to Financial Statements
in cash, the net amount is recorded as realized gain/(loss) on swaps on the statement of operations, in addition to any realized gain/(loss) recorded upon the termination of swaps. Upfront premiums paid or received are recognized as cost or proceeds on the statement of assets and liabilities and are amortized on a straight line basis over the life of the contract. Amortized upfront premiums are included in net realized gain/(loss) from swaps on the statement of operations. Fluctuations in the value of swaps are recorded as a component of net change in unrealized appreciation/depreciation of swaps on the statement of operations.
Certain standardized swaps, including certain interest rate swaps and credit default swaps, are (or soon will be) subject to mandatory central clearing. Cleared swaps are transacted through futures commission merchants (“FCMs”) that are members of central clearinghouses, with the clearinghouse serving as central counterparty, similar to transactions in futures contracts. Centralized clearing will be required for additional categories of swaps on a phased-in basis based on requirements published by the Securities and Exchange Commission and Commodity Futures Trading Commission.
At the time the Portfolio enters into a centrally cleared swap, the Portfolio deposits and maintains as collateral an initial margin with the broker, as required by the clearinghouse on which the transaction is effected. Such amount is shown as cash collateral due from broker on the statement of assets and liabilities. Pursuant to the contract, the Portfolio agrees to receive from or pay to the broker an amount of cash equal to the daily fluctuation in the value of the contract. Such receipts or payments are known as variation margin and are recorded by the Portfolio as unrealized gains or losses. Risks may arise from the potential of a counterparty to meet the terms of the contract. The credit/counterparty risk for centrally cleared swaps is generally less than non-centrally cleared swaps, since the clearinghouse, which is the issuer or counterparty to each centrally cleared swap, has robust risk mitigation standards, including the requirement to provide initial and variation margin. When the contract is closed, the Portfolio records a realized gain or loss equal to the difference between the value of the contract at the time it was opened and the time it was closed.
Interest Rate Swaps:
The Portfolio is subject to interest rate risk exposure in the normal course of pursuing its investment objectives. Because the Portfolio holds fixed rate bonds, the value of these bonds may decrease if interest rates rise. To help hedge against this risk and to maintain its ability to generate income at prevailing market rates, the
| AB TAX-AWARE FIXED INCOME PORTFOLIO • | 41 |
Notes to Financial Statements
Portfolio may enter into interest rate swaps. Interest rate swaps are agreements between two parties to exchange cash flows based on a notional amount. The Portfolio may elect to pay a fixed rate and receive a floating rate, or, receive a fixed rate and pay a floating rate on a notional amount.
In addition, the Portfolio may also enter into interest rate swap transactions to preserve a return or spread on a particular investment or portion of its portfolio, or protecting against an increase in the price of securities the Portfolio anticipates purchasing at a later date. Interest rate swaps involve the exchange by a Portfolio with another party of their respective commitments to pay or receive interest (e.g., an exchange of floating rate payments for fixed rate payments) computed based on a contractually-based principal (or “notional”) amount. Interest rate swaps are entered into on a net basis (i.e., the two payment streams are netted out, with the Portfolio receiving or paying, as the case may be, only the net amount of the two payments).
During the year ended October 31, 2016, the Portfolio held interest rate swaps for hedging purposes.
Inflation (CPI) Swaps:
Inflation swaps are contracts in which one party agrees to pay the cumulative percentage increase in a price index (the Consumer Price Index with respect to CPI swaps) over the term of the swap (with some lag on the inflation index), and the other pays a compounded fixed rate. Inflation swaps may be used to protect the net asset value, or NAV, of a Portfolio against an unexpected change in the rate of inflation measured by an inflation index since the value of these agreements is expected to increase if unexpected inflation increases.
During the year ended October 31, 2016, the Portfolio held inflation (CPI) swaps for hedging purposes.
Credit Default Swaps:
The Portfolio may enter into credit default swaps, including to manage its exposure to the market or certain sectors of the market, to reduce its risk exposure to defaults by corporate and sovereign issuers held by the Portfolio, or to create exposure to corporate or sovereign issuers to which it is not otherwise exposed. The Portfolio may purchase credit protection (“Buy Contract”) or provide credit protection (“Sale Contract”) on the referenced obligation of the credit default swap. During the term of the swap, the Portfolio receives/(pays) fixed payments from/(to) the respective counterparty, calculated at the agreed upon rate applied to the notional amount. If the Portfolio is a buyer/(seller) of
| 42 | • AB TAX-AWARE FIXED INCOME PORTFOLIO |
Notes to Financial Statements
protection and a credit event occurs, as defined under the terms of the swap, the Portfolio will either (i) receive from the seller/(pay to the buyer) of protection an amount equal to the notional amount of the swap (the “Maximum Payout Amount”) and deliver/(take delivery of) the referenced obligation or (ii) receive/(pay) a net settlement amount in the form of cash or securities equal to the notional amount of the swap less the recovery value of the referenced obligation.
In certain circumstances Maximum Payout Amounts may be partially offset by recovery values of the respective referenced obligations, upfront premium received upon entering into the agreement, or net amounts received from settlement of buy protection credit default swaps entered into by the Portfolio for the same reference obligation with the same counterparty. As of October 31, 2016, the Portfolio did not have Buy or Sale Contracts outstanding.
Credit default swaps may involve greater risks than if a Portfolio had invested in the referenced obligation directly. Credit default swaps are subject to general market risk, liquidity risk, counterparty risk and credit risk. If the Portfolio is a buyer of protection and no credit event occurs, it will lose the payments it made to its counterparty. If the Portfolio is a seller of protection and a credit event occurs, the value of the referenced obligation received by the Portfolio coupled with the periodic payments previously received, may be less than the Maximum Payout Amount it pays to the buyer, resulting in a net loss to the Portfolio.
Implied credit spreads over U.S. Treasuries of comparable maturity utilized in determining the market value of credit default swaps on issuers as of period end are disclosed in the portfolio of investments. The implied spreads serve as an indicator of the current status of the payment/performance risk and typically reflect the likelihood of default by the issuer of the referenced obligation. The implied credit spread of a particular reference obligation also reflects the cost of buying/selling protection and may reflect upfront payments required to be made to enter into the agreement. Widening credit spreads typically represent a deterioration of the referenced obligation’s credit soundness and greater likelihood of default or other credit event occurring as defined under the terms of the agreement. A credit spread identified as “Defaulted” indicates a credit event has occurred for the referenced obligation.
During the year ended October 31, 2016, the Portfolio held credit default swaps for non-hedging purposes.
| AB TAX-AWARE FIXED INCOME PORTFOLIO • | 43 |
Notes to Financial Statements
The Portfolio typically enters into International Swaps and Derivatives Association, Inc. Master Agreements (“ISDA Master Agreement”) or similar master agreements (collectively, “Master Agreements”) with its derivative contract counterparties in order to, among other things, reduce its credit risk to counterparties. ISDA Master Agreements include provisions for general obligations, representations, collateral and events of default or termination. Under an ISDA Master Agreement, the Portfolio typically may offset with the counterparty certain derivative financial instrument’s payables and/or receivables with collateral held and/or posted and create one single net payment (close-out netting) in the event of default or termination.
Various Master Agreements govern the terms of certain transactions with counterparties, including transactions such as derivative transactions, repurchase and reverse repurchase agreements. These Master Agreements typically attempt to reduce the counterparty risk associated with such transactions by specifying credit protection mechanisms and providing standardization that improves legal certainty. Cross-termination provisions under Master Agreements typically provide that a default in connection with one transaction between the Portfolio and a counterparty gives the non-defaulting party the right to terminate any other transactions in place with the defaulting party to create one single net payment due to/due from the defaulting party. In the event of a default by a Master Agreements counterparty, the return of collateral with market value in excess of the Portfolio’s net liability, held by the defaulting party, may be delayed or denied.
The Portfolio’s Master Agreements may contain provisions for early termination of OTC derivative transactions in the event the net assets of the Portfolio decline below specific levels (“net asset contingent features”). If these levels are triggered, the Portfolio’s counterparty has the right to terminate such transaction and require the Portfolio to pay or receive a settlement amount in connection with the terminated transaction. For additional details, please refer to netting arrangements by counterparty tables below.
During the year ended October 31, 2016, the Portfolio had entered into the following derivatives:
Asset Derivatives | Liability Derivatives | |||||||||||
Derivative Type | Statement of Location | Fair Value | Statement of Location | Fair Value | ||||||||
Interest rate contracts | Receivable/Payable for variation margin on exchange-traded derivatives | $ | 351,155 | * | ||||||||
| 44 | • AB TAX-AWARE FIXED INCOME PORTFOLIO |
Notes to Financial Statements
Asset Derivatives | Liability Derivatives | |||||||||||
Derivative Type | Statement of Location | Fair Value | Statement of Location | Fair Value | ||||||||
Interest rate contracts | Unrealized appreciation on interest rate swaps | $ | 46,240 | |||||||||
Interest rate contracts | Unrealized appreciation on inflation swaps | 22,391 | ||||||||||
|
| |||||||||||
Total | $ | 419,786 | ||||||||||
|
| |||||||||||
| * | Only variation margin receivable/payable at period end is reported within the statement of assets and liabilities. This amount reflects cumulative appreciation/(depreciation) of exchange-traded derivatives as reported in the portfolio of investments. |
Derivative Type | Location of Gain or (Loss) on | Realized Gain or (Loss) on Derivatives | Change in Unrealized Appreciation or (Depreciation) | |||||||
Interest rate contracts | Net realized gain (loss) on swaps; Net change in unrealized appreciation/depreciation of swaps | $ | (398,041 | ) | $ | 418,938 | ||||
Credit contracts | Net realized gain (loss) on swaps; Net change in unrealized appreciation/depreciation of swaps | 30,268 | – 0 | – | ||||||
|
|
|
| |||||||
Total | $ | (367,773 | ) | $ | 418,938 | |||||
|
|
|
| |||||||
The following table represents the average monthly volume of the Portfolio’s derivative transactions during the year ended October 31, 2016:
Interest Rate Swaps: | ||||
Average notional amount | $ | 1,449,231 | ||
Inflation Swaps: | ||||
Average notional amount | $ | 1,007,692 | ||
Centrally Cleared Interest Rate Swaps: | ||||
Average notional amount | $ | 9,875,000 | (a) | |
Centrally Cleared Credit Default Swaps: | ||||
Average notional amount of sale contracts | $ | 395,000 | (b) |
| (a) | Positions were open for two months during the year. |
| (b) | Positions were open for six months during the year. |
For financial reporting purposes, the Portfolio does not offset derivative assets and derivative liabilities that are subject to netting arrangements in the statement of assets and liabilities.
| AB TAX-AWARE FIXED INCOME PORTFOLIO • | 45 |
Notes to Financial Statements
All derivatives held at period end were subject to netting arrangements. The following table presents the Portfolio’s derivative assets and liabilities by counterparty net of amounts available for offset under Master Agreements (“MA”) and net of the related collateral received/pledged by the Portfolio as of October 31, 2016:
Counterparty | Derivative Assets Subject to a MA | Derivative Available for Offset | Cash Collateral Received | Security Collateral Received | Net Amount of Derivatives Assets | |||||||||||||||
Exchange-Traded Derivatives: | ||||||||||||||||||||
Morgan Stanley & | $ | 2,180 | $ | – 0 | – | $ | – 0 | – | $ | – 0 | – | $ | 2,180 | |||||||
|
|
|
|
|
|
|
|
|
| |||||||||||
Total | $ 2,180 | $ | – 0 | – | $ | – 0 | – | $ | – 0 | – | $ | 2,180 | ||||||||
|
|
|
|
|
|
|
|
|
| |||||||||||
OTC Derivatives: | ||||||||||||||||||||
Citibank, NA | $ | 28,543 | $ | – 0 | – | $ | – 0 | – | $ | – 0 | – | $ | 28,543 | |||||||
JPMorgan Chase Bank, NA | 40,088 | – 0 | – | – 0 | – | – 0 | – | 40,088 | ||||||||||||
|
|
|
|
|
|
|
|
|
| |||||||||||
Total | $ | 68,631 | $ | – 0 | – | $ | – 0 | – | $ | – 0 | – | $ | 68,631 | ^ | ||||||
|
|
|
|
|
|
|
|
|
| |||||||||||
| * | The actual collateral received/pledged is more than the amount reported due to over-collateralization. |
| ^ | Net amount represents the net receivable/payable that would be due from/to the counterparty in the event of default or termination. The net amount from OTC financial derivative instruments can only be netted across transactions governed under the same master agreement with the same counterparty. |
NOTE E
Capital Stock
Each class consists of 3,000,000,000 authorized shares. Transactions in capital shares for each class were as follows:
| Shares | Amount | |||||||||||||||||||||||
| Year Ended October 31, 2016 | Year Ended October 31, 2015 | Year Ended October 31, 2016 | Year Ended October 31, 2015 | |||||||||||||||||||||
|
| |||||||||||||||||||||||
| Class A | ||||||||||||||||||||||||
Shares sold | 419,502 | 282,686 | $ | 4,523,103 | $ | 2,977,235 | ||||||||||||||||||
| ||||||||||||||||||||||||
Shares issued in reinvestment of dividends and distributions | 5,728 | 1,770 | 62,365 | 18,635 | ||||||||||||||||||||
| ||||||||||||||||||||||||
Shares redeemed | (289,428 | ) | (18,562 | ) | (3,149,530 | ) | (194,825 | ) | ||||||||||||||||
| ||||||||||||||||||||||||
Net increase | 135,802 | 265,894 | $ | 1,435,938 | $ | 2,801,045 | ||||||||||||||||||
| ||||||||||||||||||||||||
| 46 | • AB TAX-AWARE FIXED INCOME PORTFOLIO |
Notes to Financial Statements
| Shares | Amount | |||||||||||||||||||||||
| Year Ended October 31, 2016 | Year Ended October 31, 2015 | Year Ended October 31, 2016 | Year Ended October 31, 2015 | |||||||||||||||||||||
| Class C | ||||||||||||||||||||||||
Shares sold | 131,822 | 142,063 | $ | 1,433,498 | $ | 1,504,726 | ||||||||||||||||||
| ||||||||||||||||||||||||
Shares issued in reinvestment of dividends and distributions | 1,590 | 840 | 17,323 | 8,846 | ||||||||||||||||||||
| ||||||||||||||||||||||||
Shares redeemed | (90,740 | ) | (34,616 | ) | (983,319 | ) | (365,493 | ) | ||||||||||||||||
| ||||||||||||||||||||||||
Net increase | 42,672 | 108,287 | $ | 467,502 | $ | 1,148,079 | ||||||||||||||||||
| ||||||||||||||||||||||||
| Advisor Class | ||||||||||||||||||||||||
Shares sold | 1,397,419 | 1,829,437 | $ | 15,152,409 | $ | 19,266,170 | ||||||||||||||||||
| ||||||||||||||||||||||||
Shares issued in reinvestment of dividends and distributions | 26,897 | 16,538 | 292,728 | 174,157 | ||||||||||||||||||||
| ||||||||||||||||||||||||
Shares redeemed | (813,451 | ) | (745,995 | ) | (8,822,075 | ) | (7,831,996 | ) | ||||||||||||||||
| ||||||||||||||||||||||||
Net increase | 610,865 | 1,099,980 | $ | 6,623,062 | $ | 11,608,331 | ||||||||||||||||||
| ||||||||||||||||||||||||
NOTE F
Risks Involved in Investing in the Portfolio
Credit Risk—An issuer or guarantor of a fixed-income security, or the counterparty to a derivatives or other contract, may be unable or unwilling to make timely payments of interest or principal, or to otherwise honor its obligations. The issuer or guarantor may default, causing a loss of the full principal amount of a security. The degree of risk for a particular security may be reflected in its credit rating. There is the possibility that the credit rating of a fixed-income security may be downgraded after purchase, which may adversely affect the value of the security.
Below Investment Grade Securities Risk—Investments in fixed-income securities with lower ratings (commonly known as “junk bonds”) tend to have a higher probability that an issuer will default or fail to meet its payment obligations. These securities may be subject to greater price volatility due to such factors as specific corporate developments, interest rate sensitivity, negative perceptions of the junk bond market generally and less secondary market liquidity.
Municipal Market Risk—This is the risk that special factors may adversely affect the value of municipal securities and have a significant effect on the yield or value of the Portfolio’s investments in municipal securities. These factors include economic conditions, political or legislative changes, uncertainties related to the tax status of municipal securities, or the rights of investors in these securities. To the extent that the Portfolio invests more of its assets in a particular state’s municipal securities, the Portfolio’s may be vulnerable to events adversely affecting that state, including
| AB TAX-AWARE FIXED INCOME PORTFOLIO • | 47 |
Notes to Financial Statements
economic, political and regulatory occurrences, court decisions, terrorism and catastrophic natural disasters, such as hurricanes or earthquakes. The Portfolio’s investments in certain municipal securities with principal and interest payments that are made from the revenues of a specific project or facility, and not general tax revenues, may have increased risks. Factors affecting the project or facility, such as local business or economic conditions, could have a significant effect on the project’s ability to make payments of principal and interest on these securities.
The Portfolio may invest in the municipal securities of Puerto Rico and other U.S. territories and their governmental agencies and municipalities, which are exempt from federal, state, and, where applicable, local income taxes. These municipal securities may have more risks than those of other U.S. issuers of municipal securities. Like many U.S. states and municipalities, Puerto Rico experienced a significant downturn during the recession. Puerto Rico’s downturn was particularly severe, and Puerto Rico continues to face a very challenging economic and fiscal environment. Municipal securities issued by Puerto Rico issuers have extremely low ratings by the credit rating organizations. More recently Puerto Rico has defaulted on its debt payments, and if the general economic situation in Puerto Rico persists, the volatility and credit quality of Puerto Rican municipal securities will continue to be adversely affected, and the market for such securities may experience continued volatility. In addition, Puerto Rico’s difficulties have resulted in increased volatility in portions of the broader municipal securities market from time to time, and this may recur in the future.
Tax Risk—From time to time, the U.S. Government and the U.S. Congress consider changes in federal tax law that could limit or eliminate the federal tax exemption for municipal bond income, which would in effect reduce the net income received by shareholders from the Portfolio by increasing taxes on that income. In such event, the Portfolio’s NAV could also decline as yields on municipal bonds, which are typically lower than those on taxable bonds, would be expected to increase to approximately the yield of comparable taxable bonds. Actions or anticipated actions affecting the tax exempt status of municipal bonds could also result in significant shareholder redemptions of Portfolio shares as investors anticipate adverse effects on the Portfolio or seek higher yields to offset the potential loss of the tax deduction. As a result, the Portfolio would be required to maintain higher levels of cash to meet the redemptions, which would negatively affect the Portfolio’s yield.
Interest Rate Risk—Changes in interest rates will affect the value of investments in fixed-income securities. When interest rates rise, the value of investments in fixed-income securities tends to fall and this
| 48 | • AB TAX-AWARE FIXED INCOME PORTFOLIO |
Notes to Financial Statements
decrease in value may not be offset by higher income from new investments. The Portfolio may be subject to a heightened risk of rising interest rates as the current period of historically low rates is expected to end, and rates are expected to begin rising in the near future. Interest rate risk is generally greater for fixed-income securities with longer maturities or durations.
Duration Risk—Duration is a measure that relates the expected price volatility of a fixed-income security to changes in interest rates. The duration of a fixed-income security may be shorter than or equal to full maturity of a fixed-income security. Fixed-income securities with longer durations have more risk and will decrease in price as interest rates rise. For example, a fixed-income security with a duration of three years will decrease in value by approximately 3% if interest rates increase by 1%.
Inflation Risk—This is the risk that the value of assets or income from investments will be less in the future as inflation decreases the value of money. As inflation increases, the value of the Portfolio’s assets can decline as can the value of the Portfolio’s distributions. This risk is significantly greater for fixed-income securities with longer maturities.
Liquidity Risk—Liquidity risk exists when particular investments are difficult to purchase or sell, possibly preventing the Portfolio from selling out of these securities at an advantageous price. Derivatives and securities involving substantial market and credit risk tend to involve greater liquidity risk. The Portfolio is subject to liquidity risk because the market for municipal securities is generally smaller than many other markets.
Leverage Risk—To the extent the Portfolio uses leveraging techniques, its NAV may be more volatile because leverage tends to exaggerate the effect of changes in interest rates and any increase or decrease in the value of the Portfolio’s investments.
Derivatives Risk—The Portfolio may enter into derivative transactions such as forwards, options, futures and swaps. Derivatives may be illiquid, difficult to price, and leveraged so that small changes may produce disproportionate losses for the Portfolio, and subject to counterparty risk to a greater degree than more traditional investments. Derivatives may result in significant losses, including losses that are far greater than the value of the derivatives reflected on the statement of assets and liabilities.
Indemnification Risk—In the ordinary course of business, the Portfolio enters into contracts that contain a variety of indemnifications. The Portfolio’s maximum exposure under these arrangements is unknown.
| AB TAX-AWARE FIXED INCOME PORTFOLIO • | 49 |
Notes to Financial Statements
However, the Portfolio has not had prior claims or losses pursuant to these indemnification provisions and expects the risk of loss thereunder to be remote. Therefore, the Portfolio has not accrued any liability in connection with these indemnification provisions.
NOTE G
Joint Credit Facility
A number of open-end mutual funds managed by the Adviser, including the Portfolio, participate in a $280 million revolving credit facility (the “Facility”) intended to provide short-term financing, if necessary, subject to certain restrictions in connection with abnormal redemption activity. Commitment fees related to the Facility are paid by the participating funds and are included in miscellaneous expenses in the statement of operations. The Portfolio did not utilize the Facility during the year ended October 31, 2016.
NOTE H
Distributions to Shareholders
The tax character of distributions paid during the fiscal years ended October 31, 2016 and October 31, 2015 were as follows:
| 2016 | 2015 | |||||||
Distributions paid from: | ||||||||
Ordinary income | $ | 67,221 | $ | 42,656 | ||||
|
|
|
| |||||
Total taxable distributions | 67,221 | 42,656 | ||||||
Tax exempt distributions | 772,547 | 468,917 | ||||||
|
|
|
| |||||
Total distributions paid | $ | 839,768 | $ | 511,573 | ||||
|
|
|
| |||||
As of October 31, 2016, the components of accumulated earnings/(deficit) on a tax basis were as follows:
Undistributed tax-exempt income | $ | 50,595 | ||
Accumulated capital and other losses | (185,146 | )(a) | ||
Unrealized appreciation/(depreciation) | 1,875,836 | (b) | ||
|
| |||
Total accumulated earnings/(deficit) | $ | 1,741,285 | (c) | |
|
|
| (a) | As of October 31, 2016, the Portfolio had a net capital loss carryforward of $185,146. |
| (b) | The difference between book-basis and tax-basis unrealized appreciation/(depreciation) is attributable primarily to the tax treatment of swaps. |
| (c) | The difference between book-basis and tax-basis components of accumulated earnings/(deficit) is attributable primarily to the dividends payable and the tax treatment of defaulted securities. |
For tax purposes, net realized capital losses may be carried over to offset future capital gains, if any. Funds are permitted to carry forward capital losses incurred for an indefinite period, and such losses will retain their character as either short-term or long-term capital losses. As of
| 50 | • AB TAX-AWARE FIXED INCOME PORTFOLIO |
Notes to Financial Statements
October 31, 2016, the Portfolio had a net short-term capital loss carryforward of $185,146 which may be carried forward for an indefinite period.
During the current fiscal year, permanent differences primarily due to the tax treatment of swaps and swap clearing fees resulted in a net decrease in undistributed net investment income, a net decrease in accumulated net realized loss on investment transactions. These reclassifications had no effect on net assets.
NOTE I
New Accounting Pronouncements
In May 2015, the Financial Accounting Standards Board issued an Accounting Standards Update, ASU 2015-07 (the “ASU”) which removes the requirement to categorize within the fair value hierarchy all investments for which fair value is measured using the net asset value per share practical expedient. The ASU also removes the requirement to make certain disclosures for investments that are eligible to be measured at fair value using the net asset value per share practical expedient but do not utilize that practical expedient. The ASU is effective for annual periods beginning after December 15, 2015 and interim periods within those annual periods. Management has evaluated the implications of these changes and there will be no impact to the financial statements.
NOTE J
Other
In October 2016, the U.S. Securities and Exchange Commission adopted new rules and amended existing rules (together, “final rules”) intended to modernize the reporting and disclosure of information by registered investment companies. In part, the final rules amend Regulation S-X and require standardized, enhanced disclosure about derivatives in investment company financial statements, as well as other amendments. The compliance date for the amendments to Regulation S-X is August 1, 2017. Management is currently evaluating the impact that the adoption of the amendments to Regulation S-X will have on the financial statements and related disclosures.
NOTE K
Subsequent Event
Management has evaluated subsequent events for possible recognition or disclosure in the financial statements through the date the financial statements are issued. Management has determined that there are no material events that would require disclosure in the Portfolio’s financial statements through this date.
| AB TAX-AWARE FIXED INCOME PORTFOLIO • | 51 |
Notes to Financial Statements
FINANCIAL HIGHLIGHTS
Selected Data For A Share Of Capital Stock Outstanding Throughout Each Period
| Class A | ||||||||||||
| December 11, 2013(a) to October 31, 2014 | ||||||||||||
| Year Ended October 31, | ||||||||||||
| 2016 | 2015 | |||||||||||
|
| |||||||||||
Net asset value, beginning of period | $ 10.59 | $ 10.51 | $ 10.00 | |||||||||
|
| |||||||||||
Income From Investment Operations | ||||||||||||
Net investment income(b)(c) | .22 | .18 | .14 | |||||||||
Net realized and unrealized gain on investment transactions | .28 | .09 | .50 | |||||||||
|
| |||||||||||
Net increase in net asset value from operations | .50 | .27 | .64 | |||||||||
|
| |||||||||||
Less: Dividends and Distributions | ||||||||||||
Dividends from net investment income | (.22 | ) | (.18 | ) | (.13 | ) | ||||||
Distributions from net realized gain on investment transactions | – 0 | – | (.01 | ) | – 0 | – | ||||||
|
| |||||||||||
Total dividends and distributions | (.22 | ) | (.19 | ) | (.13 | ) | ||||||
|
| |||||||||||
Net asset value, end of period | $ 10.87 | $ 10.59 | $ 10.51 | |||||||||
|
| |||||||||||
Total Return | ||||||||||||
Total investment return based on net asset value(d) | 4.69 | % | 2.64 | % | 6.44 | % | ||||||
Ratios/Supplemental Data | ||||||||||||
Net assets, end of period (000’s omitted) | $6,385 | $4,783 | $1,954 | |||||||||
Ratio to average net assets of: | ||||||||||||
Expenses, net of waivers/reimbursements | .80 | % | .81 | % | .85 | %^ | ||||||
Expenses, before waivers/reimbursements | 1.72 | % | 2.19 | % | 3.59 | %^ | ||||||
Net investment income(c) | 1.98 | % | 1.75 | % | 1.57 | %^ | ||||||
Portfolio turnover rate | 36 | % | 35 | % | 42 | % | ||||||
See footnote summary on page 54.
| 52 | • AB TAX-AWARE FIXED INCOME PORTFOLIO |
Financial Highlights
Selected Data For A Share Of Capital Stock Outstanding Throughout Each Period
| Class C | ||||||||||||
| December 11, 2013(a) to October 31, 2014 | ||||||||||||
| Year Ended October 31, | ||||||||||||
| 2016 | 2015 | |||||||||||
|
| |||||||||||
Net asset value, beginning of period | $ 10.59 | $ 10.52 | $ 10.00 | |||||||||
|
| |||||||||||
Income From Investment Operations | ||||||||||||
Net investment income(b)(c) | .13 | .10 | .07 | |||||||||
Net realized and unrealized gain on investment transactions | .28 | .09 | .52 | |||||||||
|
| |||||||||||
Net increase in net asset value from operations | .41 | .19 | .59 | |||||||||
|
| |||||||||||
Less: Dividends and Distributions | ||||||||||||
Dividends from net investment income | (.13 | ) | (.11 | ) | (.07 | ) | ||||||
Distributions from net realized gain on investment transactions | – 0 | – | (.01 | ) | – 0 | – | ||||||
|
| |||||||||||
Total dividends and distributions | (.13 | ) | (.12 | ) | (.07 | ) | ||||||
|
| |||||||||||
Net asset value, end of period | $ 10.87 | $ 10.59 | $ 10.52 | |||||||||
|
| |||||||||||
Total Return | ||||||||||||
Total investment return based on net asset value(d) | 3.91 | % | 1.78 | % | 5.92 | % | ||||||
Ratios/Supplemental Data | ||||||||||||
Net assets, end of period (000’s omitted) | $2,022 | $1,518 | $369 | |||||||||
Ratio to average net assets of: | ||||||||||||
Expenses, net of waivers/reimbursements | 1.55 | % | 1.55 | % | 1.55 | %^ | ||||||
Expenses, before waivers/reimbursements | 2.47 | % | 2.85 | % | 4.33 | %^ | ||||||
Net investment income(c) | 1.23 | % | .99 | % | .82 | %^ | ||||||
Portfolio turnover rate | 36 | % | 35 | % | 42 | % | ||||||
See footnote summary on page 54.
| AB TAX-AWARE FIXED INCOME PORTFOLIO • | 53 |
Financial Highlights
Selected Data For A Share Of Capital Stock Outstanding Throughout Each Period
| Advisor Class | ||||||||||||
| December 11, 2013(a) to October 31, 2014 | ||||||||||||
| Year Ended October 31, | ||||||||||||
| 2016 | 2015 | |||||||||||
|
| |||||||||||
Net asset value, beginning of period | $ 10.59 | $ 10.52 | $ 10.00 | |||||||||
|
| |||||||||||
Income From Investment Operations | ||||||||||||
Net investment income(b)(c) | .24 | .21 | .16 | |||||||||
Net realized and unrealized gain on investment transactions | .28 | .08 | .52 | |||||||||
|
| |||||||||||
Net increase in net asset value from operations | .52 | .29 | .68 | |||||||||
|
| |||||||||||
Less: Dividends and Distributions | ||||||||||||
Dividends from net investment income | (.24 | ) | (.21 | ) | (.16 | ) | ||||||
Distributions from net realized gain on investment transactions | – 0 | – | (.01 | ) | – 0 | – | ||||||
|
| |||||||||||
Total dividends and distributions | (.24 | ) | (.22 | ) | (.16 | ) | ||||||
|
| |||||||||||
Net asset value, end of period | $ 10.87 | $ 10.59 | $ 10.52 | |||||||||
|
| |||||||||||
Total Return | ||||||||||||
Total investment return based on net asset value(d) | 4.96 | % | 2.81 | % | 6.84 | % | ||||||
Ratios/Supplemental Data | ||||||||||||
Net assets, end of period (000’s omitted) | $33,667 | $26,333 | $14,584 | |||||||||
Ratio to average net assets of: | ||||||||||||
Expenses, net of waivers/reimbursements | .55 | % | .55 | % | .55 | %^ | ||||||
Expenses, before waivers/reimbursements | 1.47 | % | 1.92 | % | 3.82 | %^ | ||||||
Net investment income(c) | 2.24 | % | 1.99 | % | 1.76 | %^ | ||||||
Portfolio turnover rate | 36 | % | 35 | % | 42 | % | ||||||
| (a) | Commencement of operations. |
| (b) | Based on average shares outstanding. |
| (c) | Net of fees and expenses waived/reimbursed by the Adviser. |
| (d) | Total investment return is calculated assuming an initial investment made at the net asset value at the beginning of the period, reinvestment of all dividends and distributions at net asset value during the period, and redemption on the last day of the period. Initial sales charges or contingent deferred sales charges are not reflected in the calculation of total investment return. Total return does not reflect the deduction of taxes that a shareholder would pay on fund distributions or the redemption of fund shares. Total investment return calculated for a period of less than one year is not annualized. |
| ^ | Annualized. |
See notes to financial statements.
| 54 | • AB TAX-AWARE FIXED INCOME PORTFOLIO |
Financial Highlights
REPORT OF INDEPENDENT REGISTERED
PUBLIC ACCOUNTING FIRM
To the Board of Directors and Shareholders of the AB Tax-Aware Fixed Income Portfolio
We have audited the accompanying statement of assets and liabilities, including the portfolio of investments, of AB Tax-Aware Fixed Income Portfolio (the “Portfolio”), one of the portfolios constituting the AB Bond Fund, Inc., as of October 31, 2016, and the related statement of operations for the year then ended, the statements of changes in net assets for each of the two years in the period then ended, and the financial highlights for each of the two years in the period then ended and for the period of December 11, 2013 (commencement of operations) through October 31, 2014. These financial statements and financial highlights are the responsibility of the Portfolio’s management. Our responsibility is to express an opinion on these financial statements and financial highlights based on our audits.
We conducted our audits in accordance with the standards of the Public Company Accounting Oversight Board (United States). Those standards require that we plan and perform the audit to obtain reasonable assurance about whether the financial statements and financial highlights are free of material misstatement. We were not engaged to perform an audit of the Portfolio’s internal control over financial reporting. Our audits included consideration of internal control over financial reporting as a basis for designing audit procedures that are appropriate in the circumstances, but not for the purpose of expressing an opinion on the effectiveness of the Portfolio’s internal control over financial reporting. Accordingly, we express no such opinion. An audit also includes examining, on a test basis, evidence supporting the amounts and disclosures in the financial statements and financial highlights, assessing the accounting principles used and significant estimates made by management, and evaluating the overall financial statement presentation. Our procedures included confirmation of securities owned as of October 31, 2016, by correspondence with the custodian and others, or by other appropriate auditing procedures where replies from others were not received. We believe that our audits provide a reasonable basis for our opinion.
In our opinion, the financial statements and financial highlights referred to above present fairly, in all material respects, the financial position of AB Tax-Aware Fixed Income Portfolio, one of the portfolios constituting the AB Bond Fund, Inc., at October 31, 2016, the results of its operations for the year then ended, the changes in its net assets for each of the two years in the period then ended, and financial highlights for each of the two years in the period then ended and for the period of December 11, 2013 (commencement of operations) through October 31, 2014, in conformity with U.S. generally accepted accounting principles.

New York, New York
December 29, 2016
| AB TAX-AWARE FIXED INCOME PORTFOLIO • | 55 |
Report of Independent Registered Public Accounting Firm
BOARD OF DIRECTORS
Marshall C. Turner, Jr.(1) , Chairman John H. Dobkin(1) Michael J. Downey(1) William H. Foulk, Jr.(1) D. James Guzy(1) Nancy P. Jacklin(1) | Robert M. Keith, President and Chief Executive Officer Carol C. McMullen(1) Garry L. Moody(1) Earl D. Weiner(1) |
OFFICERS
Philip L. Kirstein, Senior Vice President and Independent Compliance Officer Robert “Guy” B. Davidson III(2), Vice President Terrance T. Hults(2), Vice President Shawn E. Keegan(2), Vice President | Emilie D. Wrapp, Secretary Joseph J. Mantineo, Treasurer and Chief Financial Officer Phyllis J. Clarke, Controller Vincent S. Noto, Chief Compliance Officer |
Custodian and Accounting Agent State Street Bank and Trust Company State Street Corporation CCB/5 1 Iron Street Boston, MA 02210
Principal Underwriter AllianceBernstein Investments, Inc. 1345 Avenue of the Americas New York, NY 10105
Transfer Agent AllianceBernstein Investor Services, Inc. P.O. Box 786003 San Antonio, TX 78278-6003 Toll-Free (800) 221-5672 | Independent Registered Public Accounting Firm Ernst & Young LLP 5 Times Square New York, NY 10036
Legal Counsel Seward & Kissel LLP One Battery Park Plaza New York, NY 10004 |
| (1) | Member of the Audit Committee, the Governance and Nominating Committee and the Independent Directors Committee. |
| (2) | The day-to-day management of, and investment decisions for, the Fund are made by its senior investment management team. Messrs. Davidson, Hults and Keegan are the investment professionals with the most significant responsibility for the day-to-day management of the Fund’s portfolio. |
| 56 | • AB TAX-AWARE FIXED INCOME PORTFOLIO |
Board of Directors
MANAGEMENT OF THE FUND
Board of Directors Information
The business and affairs of the Fund are managed under the direction of the Board of Directors. Certain information concerning the Fund’s Directors is set forth below.
NAME, ADDRESS*, AGE, (YEAR FIRST ELECTED**) | PRINCIPAL OCCUPATION(S) DURING PAST FIVE YEARS AND INFORMATION*** | PORTFOLIOS IN FUND COMPLEX OVERSEEN BY DIRECTOR | OTHER PUBLIC COMPANY DIRECTORSHIPS CURRENTLY HELD | |||||
| INTERESTED DIRECTOR | ||||||||
Robert M. Keith, # 1345 Avenue of the Americas New York, NY 10105 56 (2013) | Senior Vice President of AllianceBernstein L.P. (the “Adviser”) and the head of AllianceBernstein Investments, Inc. (“ABI”) since July 2008; Director of ABI and President of the AB Mutual Funds. Previously, he served as Executive Managing Director of ABI from December 2006 to June 2008. Prior to joining ABI in 2006, Executive Managing Director of Bernstein Global Wealth Management, and prior thereto, Senior Managing Director and Global Head of Client Service and Sales of the Adviser’s institutional investment management business since 2004. Prior thereto, he was Managing Director and Head of North American Client Service and Sales in the Adviser’s institutional investment management business, with which he had been associated since prior to 2004. | 108 | None | |||||
| AB TAX-AWARE FIXED INCOME PORTFOLIO • | 57 |
Management of the Fund
NAME, ADDRESS*, AGE, (YEAR FIRST ELECTED**) | PRINCIPAL OCCUPATION(S) DURING PAST FIVE YEARS AND INFORMATION*** | PORTFOLIOS IN FUND COMPLEX OVERSEEN BY DIRECTOR | OTHER PUBLIC COMPANY DIRECTORSHIPS CURRENTLY HELD | |||||
| DISINTERESTED DIRECTORS | ||||||||
Marshall C. Turner, Jr., ## Chairman of the Board 75 (2013) | Private Investor since prior to 2011. Former Chairman and CEO of Dupont Photomasks, Inc. (components of semi-conductor manufacturing). He has extensive operating leadership, and venture capital investing experience, including five interim or full-time CEO roles, and prior service as general partner of institutional venture capital partnerships. He also has extensive non-profit board leadership experience, and currently serves on the boards of two education and science-related non-profit organizations. He has served as a director of one AB Fund since 1992, and director or trustee of multiple AB Funds since 2005. He has been Chairman of the AB Funds since January 2014, and the Chairman of the Independent Directors Committees of such AB Funds since February 2014. | 108 | Xilinx, Inc. (programmable logic semi-conductors) since 2007 | |||||
John H. Dobkin, ## 74 (2013) | Independent Consultant since prior to 2011. Formerly, President of Save Venice, Inc. (preservation organization) from 2001-2002; Senior Advisor from June 1999-June 2000 and President of Historic Hudson Valley (historic preservation) from December 1989-May 1999. Previously, Director of the National Academy of Design. He has served as a director or trustee of various AB Funds since 1992 and as Chairman of the Audit Committees of a number of such AB Funds from 2001-2008. | 108 | None | |||||
| 58 | • AB TAX-AWARE FIXED INCOME PORTFOLIO |
Management of the Fund
NAME, ADDRESS*, AGE, (YEAR FIRST ELECTED**) | PRINCIPAL OCCUPATION(S) DURING PAST FIVE YEARS AND INFORMATION*** | PORTFOLIOS IN FUND COMPLEX OVERSEEN BY DIRECTOR | OTHER PUBLIC COMPANY DIRECTORSHIPS CURRENTLY HELD | |||||
| DISINTERESTED DIRECTORS (continued) | ||||||||
Michael J. Downey, ## 72 (2013) | Private Investor since prior to 2011. Formerly, managing partner of Lexington Capital, LLC (investment advisory firm) from December 1997 until December 2003. He served as a Director of Prospect Acquisition Corp. (financial services) from 2007 until 2009. From 1987 until 1993, Chairman and CEO of Prudential Mutual Fund Management, director of the Prudential mutual funds, and member of the Executive Committee of Prudential Securities Inc. He has served as a director or trustee of the AB Funds since 2005 and is a director and Chairman of one other registered investment company. | 108 | Asia Pacific Fund, Inc. (registered investment company) since prior to 2011 | |||||
William H. Foulk, Jr., ## 84 (2013) | Investment Adviser and an Independent Consultant since prior to 2011. Previously, he was Senior Manager of Barrett Associates, Inc., a registered investment adviser. He was formerly Deputy Comptroller and Chief Investment Officer of the State of New York and, prior thereto, Chief Investment Officer of the New York Bank for Savings. He has served as a director or trustee of various AB Funds since 1983, and was Chairman of the Independent Directors Committees of the AB Funds from 2003 until early February 2014. He served as Chairman of such AB Funds from 2003 through December 2013. He is also active in a number of mutual fund related organizations and committees. | 108 | None | |||||
| AB TAX-AWARE FIXED INCOME PORTFOLIO • | 59 |
Management of the Fund
NAME, ADDRESS*, AGE, (YEAR FIRST ELECTED**) | PRINCIPAL OCCUPATION(S) DURING PAST FIVE YEARS AND INFORMATION*** | PORTFOLIOS IN FUND COMPLEX OVERSEEN BY DIRECTOR | OTHER PUBLIC COMPANY DIRECTORSHIPS CURRENTLY HELD | |||||
| DISINTERESTED DIRECTORS (continued) | ||||||||
D. James Guzy, ## 80 (2013) | Chairman of the Board of SRC Computers, Inc. (semi-conductors), with which he has been associated since prior to 2011. He served as Chairman of the Board of PLX Technology (semi-conductors) since prior to 2011 until November 2013. He was a Director of Intel Corporation (semi-conductors) from 1969 until 2008, and served as Chairman of the Finance Committee of such company for several years until May 2008. He has served as a director or trustee of one or more of the AB Funds since 1982. | 108 | None | |||||
Nancy P. Jacklin, ## 68 (2013) | Private Investor since prior to 2011. Professorial Lecturer at the Johns Hopkins School of Advanced International Studies (2008-2015); U.S. Executive Director of the International Monetary Fund (which is responsible for ensuring the stability of the international monetary system), (December 2002-May 2006); Partner, Clifford Chance (1992-2002); Sector Counsel, International Banking and Finance, and Associate General Counsel, Citicorp (1985-1992); Assistant General Counsel (International), Federal Reserve Board of Governors (1982-1985); and Attorney Advisor, U.S. Department of the Treasury (1973-1982). Member of the Bar of the District of Columbia and of New York; and member of the Council on Foreign Relations. She has served as a director or trustee of the AB Funds since 2006 and has been Chairman of the Governance and Nominating Committees of the AB Funds since August 2014. | 108 | None | |||||
| 60 | • AB TAX-AWARE FIXED INCOME PORTFOLIO |
Management of the Fund
NAME, ADDRESS*, AGE, (YEAR FIRST ELECTED**) | PRINCIPAL OCCUPATION(S) DURING PAST FIVE YEARS AND INFORMATION*** | PORTFOLIOS IN FUND COMPLEX OVERSEEN BY DIRECTOR | OTHER PUBLIC COMPANY DIRECTORSHIPS CURRENTLY HELD | |||||
| DISINTERESTED DIRECTORS (continued) | ||||||||
Carol C. McMullen, ## 61 (2016) | Managing Director of Slalom Consulting (consulting) since 2014 and private investor; Director of Norfolk & Dedham Group (mutual property and casualty insurance) since 2011; and Director of Partners Community Physicians Organization (healthcare) since 2014. Formerly, Managing Director of The Crossland Group (consulting) from 2012 to 2013. She has held a number of senior positions in the asset and wealth management industries, including at Eastern Bank (where her roles included President of Eastern Wealth Management), Thomson Financial (Global Head of Sales for Investment Management), and Putnam Investments (where her roles included Head of Global Investment Research). She has served on a number of private company and nonprofit boards, and as a director or trustee of the AB Funds since June 2016. | 108 | None | |||||
| AB TAX-AWARE FIXED INCOME PORTFOLIO • | 61 |
Management of the Fund
NAME, ADDRESS*, AGE, (YEAR FIRST ELECTED**) | PRINCIPAL OCCUPATION(S) DURING PAST FIVE YEARS AND INFORMATION*** | PORTFOLIOS IN FUND COMPLEX OVERSEEN BY DIRECTOR | OTHER PUBLIC COMPANY DIRECTORSHIPS CURRENTLY HELD | |||||
| DISINTERESTED DIRECTORS (continued) | ||||||||
Garry L. Moody, ## 64 (2013) | Independent Consultant. Formerly, Partner, Deloitte & Touche LLP (1995-2008) where he held a number of senior positions, including Vice Chairman, and U.S. and Global Investment Management Practice Managing Partner; President, Fidelity Accounting and Custody Services Company (1993-1995), where he was responsible for accounting, pricing, custody and reporting for the Fidelity mutual funds; and Partner, Ernst & Young LLP (1975-1993), where he served as the National Director of Mutual Fund Tax Services and Managing Partner of its Chicago Office Tax department. He is a member of the Trustee Advisory Board of BoardIQ, a biweekly publication focused on issues and news affecting directors of mutual funds. He has served as a director or trustee, and as Chairman of the Audit Committees of the AB Funds since 2008. | 108 | None | |||||
Earl D. Weiner, ## 77 (2013) | Of Counsel, and Partner prior to January 2007, of the law firm Sullivan & Cromwell LLP, and is a former member of the ABA Federal Regulation of Securities Committee Task Force to draft editions of the Fund Director’s Guidebook. He also serves as a director or trustee of various non-profit organizations and has served as Chairman or Vice Chairman of a number of them. He has served as a director or trustee of the AB Funds since 2007 and served as Chairman of the Governance and Nominating Committees of the AB Funds from 2007 until August 2014. | 108 | None | |||||
| 62 | • AB TAX-AWARE FIXED INCOME PORTFOLIO |
Management of the Fund
| * | The address for each of the Fund’s disinterested Directors is c/o AllianceBernstein L.P., Attention: Philip L. Kirstein, 1345 Avenue of the Americas, New York, NY 10105. |
| ** | There is no stated term of office for the Fund’s Directors. |
| *** | The information above includes each Director’s principal occupation during the last five years and other information relating to the experience, attributes and skills relevant to each Director’s qualifications to serve as a Director, which led to the conclusion that each Director should serve as a Director for the Fund. |
| # | Mr. Keith is an “interested person” of the Fund, as defined in the 1940 Act, due to his position as a Senior Vice President of the Adviser. |
| ## | Member of the Audit Committee, the Governance and Nominating Committee and the Independent Directors Committee. |
| AB TAX-AWARE FIXED INCOME PORTFOLIO • | 63 |
Management of the Fund
Officer Information
Certain information concerning the Fund’s Officers is listed below.
| NAME, ADDRESS* AND AGE | POSITION(S) HELD WITH FUND | PRINCIPAL OCCUPATION DURING PAST 5 YEARS | ||
Robert M. Keith 56 | President and Chief Executive Officer | See biography above. | ||
Philip L. Kirstein 71 | Senior Vice President and Independent Compliance Officer | Senior Vice President and Independent Compliance Officer of the AB Funds, with which he has been associated since October 2004. Prior thereto, he was Of Counsel to Kirkpatrick & Lockhart, LLP from October 2003 to October 2004, and General Counsel of Merrill Lynch Investment Managers, L.P. since prior to March 2003. | ||
Robert “Guy” 55 | Vice President | Senior Vice President of the Adviser,** with which he has been associated since prior to 2011. | ||
Terrance T. Hults 50 | Vice President | Senior Vice President of the Adviser,** with which he has been associated since prior to 2011. | ||
Shawn E. Keegan 45 | Vice President | Senior Vice President of the Adviser,** with which he has been associated since prior to 2011. | ||
Emilie D. Wrapp 61 | Secretary | Senior Vice President, Assistant General Counsel and Assistant Secretary of ABI,** with which she has been associated since prior to 2011. | ||
Joseph J. Mantineo 57 | Treasurer and Chief Financial Officer | Senior Vice President of AllianceBernstein Investor Services, Inc. (“ABIS”),** with which he has been associated since prior to 2011. | ||
Phyllis J. Clarke 55 | Controller | Vice President of ABIS,** with which she has been associated since prior to 2011. | ||
Vincent S. Noto 52 | Chief Compliance Officer | Senior Vice President since 2015 and Mutual Fund Chief Compliance Officer of the Adviser** since 2014. Prior thereto, he was Vice President and Director of Mutual Fund Compliance of the Adviser** since prior to 2011. |
| * | The address for the Fund’s Officers is 1345 Avenue of the Americas, New York, NY 10105. |
| ** | The Adviser, ABI and ABIS are affiliates of the Fund. |
| The Fund’s Statement of Additional Information (“SAI”) has additional information about the Fund’s Directors and Officers and is available without charge upon request. Contact your financial representative or AB at 1-800-227-4618, or visit www.abfunds.com, for a free prospectus of SAI. |
| 64 | • AB TAX-AWARE FIXED INCOME PORTFOLIO |
Management of the Fund
Information Regarding the Review and Approval of the Portfolio’s Investment Advisory Contract
The disinterested directors (the “directors”) of AB Bond Fund, Inc. (the “Fund”) unanimously approved the continuance of the Fund’s Investment Advisory Contract (the “Advisory Agreement”) with the Adviser in respect of AB Tax-Aware Fixed Income Portfolio (the “Portfolio”) at a meeting held on November 3-5, 2015.
Prior to approval of the continuance of the Advisory Agreement in respect of the Portfolio, the directors had requested from the Adviser, and received and evaluated, extensive materials. They reviewed the proposed continuance of the Advisory Agreement with the Adviser and with experienced counsel who are independent of the Adviser, who advised on the relevant legal standards. The directors also reviewed an independent evaluation prepared by the Fund’s Senior Officer (who is also the Fund’s Independent Compliance Officer) of the reasonableness of the advisory fee, in which the Senior Officer concluded that the contractual fee for the Portfolio was reasonable. The directors also discussed the proposed continuance in private sessions with counsel and the Fund’s Senior Officer.
The directors considered their knowledge of the nature and quality of the services provided by the Adviser to the Portfolio gained from their experience as directors or trustees of most of the registered investment companies advised by the Adviser, their overall confidence in the Adviser’s integrity and competence they have gained from that experience, the Adviser’s initiative in identifying and raising potential issues with the directors and its responsiveness, frankness and attention to concerns raised by the directors in the past, including the Adviser’s willingness to consider and implement organizational and operational changes designed to improve investment results and the services provided to the AB Funds. The directors noted that they have four regular meetings each year, at each of which they receive presentations from the Adviser on the investment results of the Portfolio and review extensive materials and information presented by the Adviser.
The directors also considered all other factors they believed relevant, including the specific matters discussed below. In their deliberations, the directors did not identify any particular information that was all-important or controlling, and different directors may have attributed different weights to the various factors. The directors determined that the selection of the Adviser to manage the Portfolio, and the overall arrangements between the Portfolio and the Adviser, as provided in the Advisory Agreement, including the advisory fee, were fair and reasonable in light of the services performed, expenses incurred and such other matters as the directors considered relevant in the exercise of their
| AB TAX-AWARE FIXED INCOME PORTFOLIO • | 65 |
business judgment. The material factors and conclusions that formed the basis for the directors’ determinations included the following:
Nature, Extent and Quality of Services Provided
The directors considered the scope and quality of services provided by the Adviser under the Advisory Agreement, including the quality of the investment research capabilities of the Adviser and the other resources it has dedicated to performing services for the Portfolio. They also noted the professional experience and qualifications of the Portfolio’s portfolio management team and other senior personnel of the Adviser. The directors also considered that the Advisory Agreement provides that the Portfolio will reimburse the Adviser for the cost to it of providing certain clerical, accounting, administrative and other services to the Portfolio by employees of the Adviser or its affiliates. Requests for these reimbursements are made on a quarterly basis and subject to approval by the directors. Reimbursements, to the extent requested and paid, result in a higher rate of total compensation from the Portfolio to the Adviser than the fee rate stated in the Portfolio’s Advisory Agreement. The directors noted that the methodology used to determine the reimbursement amounts had been reviewed by an independent consultant retained by the Fund’s Senior Officer. The quality of administrative and other services, including the Adviser’s role in coordinating the activities of the Portfolio’s other service providers, also was considered. The directors concluded that, overall, they were satisfied with the nature, extent and quality of services provided to the Portfolio under the Advisory Agreement.
Costs of Services Provided and Profitability
The directors reviewed a schedule of the revenues, expenses and related notes indicating the profitability of the Portfolio to the Adviser for the period ended December 31, 2013 and calendar year 2014 that had been prepared with an expense limitation methodology arrived at in consultation with an independent consultant retained by the Fund’s Senior Officer. The directors noted the assumptions and methods of allocation used by the Adviser in preparing fund-specific profitability data and understood that there are a number of potentially acceptable allocation methodologies for information of this type. The directors noted that the profitability information reflected all revenues and expenses of the Adviser’s relationship with the Portfolio, including those relating to its subsidiaries that provide transfer agency and distribution services to the Portfolio. The directors recognized that it is difficult to make comparisons of the profitability of the Advisory Agreement with the profitability of advisory contracts for unaffiliated funds because comparative information is not generally publicly available and is affected by numerous factors. The directors focused on the profitability of the Adviser’s relationship with the Portfolio before taxes and distribution expenses.
| 66 | • AB TAX-AWARE FIXED INCOME PORTFOLIO |
The directors noted that the Adviser’s relationship with the Portfolio was not profitable to it in 2013 or 2014.
Fall-Out Benefits
The directors considered the other benefits to the Adviser and its affiliates from their relationships with the Portfolio, including, but not limited to, benefits relating to 12b-1 fees and sales charges received by the Fund’s principal underwriter (which is a wholly owned subsidiary of the Adviser) in respect of certain classes of the Portfolio’s shares and transfer agency fees paid by the Portfolio to a wholly owned subsidiary of the Adviser. The directors recognized that the Portfolio’s unprofitability to the Adviser would be exacerbated without these benefits. The directors also understood that the Adviser also might derive reputational and other benefits from its association with the Portfolio.
Investment Results
In addition to the information reviewed by the directors in connection with the meeting, the directors receive detailed performance information for the Portfolio at each regular Board meeting during the year. At the November 2015 meeting, the directors reviewed information prepared by Broadridge showing the performance of the Class A Shares of the Portfolio as compared with that of a group of similar funds selected by Broadridge (the “Performance Group”) and as compared with that of a broad array of funds selected by Broadridge (the “Performance Universe”), and information prepared by the Adviser showing the performance of the Class A Shares as compared with the Barclays Municipal Bond Index (the “Index”), in each case for the 1-year period ended July 31, 2015 and (in the case of comparisons with the Index) the period since inception (December 2013 inception). The directors noted that the Portfolio was in the 4th quintile of the Performance Group and 5th quintile of the Performance Universe for the 1-year period. The Portfolio lagged the Index in the 1-year period and the period since inception. Based on their review, the directors concluded that the Portfolio’s performance was acceptable.
Advisory Fees and Other Expenses
The directors considered the advisory fee rate paid by the Portfolio to the Adviser and information prepared by Broadridge concerning advisory fee rates paid by other funds in the same Broadridge category as the Portfolio at a common asset level. The directors recognized that it is difficult to make comparisons of advisory fees because there are variations in the services that are included in the fees paid by other funds. The directors noted that, in the Portfolio’s latest fiscal year, the administrative expense reimbursement of 43.4 basis points had been waived by the Adviser. The directors noted that, at the Portfolio’s current size, its contractual advisory fee rate of 50 basis points was lower than the Expense Group median.
| AB TAX-AWARE FIXED INCOME PORTFOLIO • | 67 |
The Adviser informed the directors that there were no institutional products managed by it that have an investment style substantially similar to that of the Portfolio. The directors reviewed the relevant fee information from the Adviser’s Form ADV and the evaluation from the Fund’s Senior Officer and noted that the Adviser charged institutional clients lower fees for advising comparably sized accounts using strategies that differ from those of the Portfolio but which involved investments in municipal and taxable fixed income securities.
The Adviser reviewed with the directors the significantly greater scope of the services it provides to the Portfolio relative to institutional clients. The Adviser also noted that because mutual funds are constantly issuing and redeeming shares, they are more difficult to manage than an institutional account, where the assets tend to be relatively stable. In light of the substantial differences in services rendered by the Adviser to institutional clients as compared to funds such as the Portfolio, as well as the difference in fee structure, the directors considered these fee comparisons inapt and did not place significant weight on them in their deliberations.
The directors noted that the Portfolio may invest in shares of exchange-traded funds (“ETFs”), subject to the restrictions and limitations of the Investment Company Act of 1940 as these may be varied as a result of exemptive orders issued by the SEC. The directors also noted that ETFs pay advisory fees pursuant to their advisory contracts. The directors concluded, based on the Adviser’s explanation of how it may use ETFs when they are the most cost-effective way to obtain desired exposures for a fund or to temporarily “equitize” cash inflows pending purchases of underlying securities, that the advisory fee for the Portfolio would be paid for services that would be in addition to, rather than duplicative of, the services to be provided under the advisory contracts of the ETFs.
The directors also considered the total expense ratio of the Class A shares of the Portfolio in comparison to the fees and expenses of funds within two comparison groups created by Broadridge: an Expense Group and an Expense Universe. Broadridge described an Expense Group as a representative sample of funds similar to the Portfolio and an Expense Universe as a broader group than the Expense Group, consisting of all funds in the investment classification/objective with a similar load type as the Portfolio. The Class A expense ratio of the Portfolio was based on the Portfolio’s latest fiscal year and the information included the pro forma expense ratio to reflect a reduction in the 12b-1 fee effective January 30, 2015. The pro forma expense ratio of the Portfolio reflected fee waivers and/or expense reimbursements as a result of an undertaking by the Adviser. The directors noted that it was likely that the expense ratios of some of the other funds in the Portfolio’s Broadridge category also were lowered by waivers or reimbursements by those funds’ investment
| 68 | • AB TAX-AWARE FIXED INCOME PORTFOLIO |
advisers, which in some cases might be voluntary or temporary. The directors view the expense ratio information as relevant to their evaluation of the Adviser’s services because the Adviser is responsible for coordinating services provided to the Portfolio by others.
The directors noted that the Portfolio’s total pro forma expense ratio, giving effect to a cap by the Adviser, was lower than the Expense Group median and close to the Expense Universe median. The directors concluded that the Portfolio’s pro forma expense ratio was satisfactory.
Economies of Scale
The directors noted that the advisory fee schedule for the Portfolio does not contain breakpoints and that they had discussed their strong preference, and that of the Senior Officer, for breakpoints in advisory contracts with the Adviser. The directors took into consideration prior presentations by an independent consultant on economies of scale in the mutual fund industry and for the AB Funds, and by the Adviser concerning certain of its views on economies of scale. The directors also had requested and received from the Adviser certain updates on economies of scale at the May 2015 meetings. The directors believe that economies of scale may be realized (if at all) by the Adviser across a variety of products and services, and not only in respect of a single fund. The directors noted that there is no established methodology for setting breakpoints that give effect to the fund-specific services provided by a fund’s adviser and to the economies of scale that an adviser may realize in its overall mutual fund business or those components of it which directly or indirectly affect a fund’s operations. The directors observed that in the mutual fund industry as a whole, as well as among funds similar to the Portfolio, there is no uniformity or pattern in the fees and asset levels at which breakpoints (if any) apply. The directors also noted that the advisory agreements for many funds do not have breakpoints at all. The directors informed the Adviser that they would monitor the Portfolio’s assets (which were well below the level at which they would anticipate adding an initial breakpoint) and its profitability to the Adviser (currently unprofitable) and anticipated revisiting the question of breakpoints in the future if circumstances warranted doing so.
| AB TAX-AWARE FIXED INCOME PORTFOLIO • | 69 |
THIS PAGE IS NOT PART OF THE SHAREHOLDER REPORT OR THE FINANCIAL STATEMENTS
AB FAMILY OF FUNDS
US EQUITY
US Core
Core Opportunities Fund
Select US Equity Portfolio
US Growth
Concentrated Growth Fund
Discovery Growth Fund
Growth Fund
Large Cap Growth Fund
Small Cap Growth Portfolio
US Value
Discovery Value Fund
Equity Income Fund
Growth & Income Fund
Small Cap Value Portfolio
Value Fund
INTERNATIONAL/ GLOBAL EQUITY
International/Global Core
Global Core Equity Portfolio
Global Equity & Covered Call Strategy Fund
International Portfolio
International Strategic Core Portfolio
Sustainable Global Thematic Fund*
Tax-Managed International Portfolio
International/Global Growth
International Growth Fund
International/Global Value
Asia ex-Japan Equity Portfolio
International Value Fund
FIXED INCOME
Municipal
High Income Municipal Portfolio
Intermediate California Municipal Portfolio
Intermediate Diversified Municipal Portfolio
Intermediate New York Municipal Portfolio
FIXED INCOME (continued)
Municipal Bond Inflation Strategy
Tax-Aware Fixed Income Portfolio
National Portfolio
Arizona Portfolio
California Portfolio
Massachusetts Portfolio
Michigan Portfolio
Minnesota Portfolio
New Jersey Portfolio
New York Portfolio
Ohio Portfolio
Pennsylvania Portfolio
Virginia Portfolio
Taxable
Bond Inflation Strategy
Global Bond Fund
High Income Fund
High Yield Portfolio
Income Fund
Intermediate Bond Portfolio
Limited Duration High Income Portfolio
Short Duration Portfolio
ALTERNATIVES
All Market Real Return Portfolio
Credit Long/Short Portfolio
Global Real Estate Investment Fund
Long/Short Multi-Manager Fund
Multi-Manager Alternative Strategies Fund
Select US Long/Short Portfolio
Unconstrained Bond Fund
MULTI-ASSET
All Market Income Portfolio
Emerging Markets Multi-Asset Portfolio
Global Risk Allocation Fund
MULTI-ASSET (continued)
Target-Date
Multi-Manager Select Retirement Allocation Fund
Multi-Manager Select 2010 Fund
Multi-Manager Select 2015 Fund
Multi-Manager Select 2020 Fund
Multi-Manager Select 2025 Fund
Multi-Manager Select 2030 Fund
Multi-Manager Select 2035 Fund
Multi-Manager Select 2040 Fund
Multi-Manager Select 2045 Fund
Multi-Manager Select 2050 Fund
Multi-Manager Select 2055 Fund
Wealth Strategies
Balanced Wealth Strategy
Conservative Wealth Strategy
Wealth Appreciation Strategy
Tax-Managed Balanced Wealth Strategy
Tax-Managed Wealth Appreciation Strategy
CLOSED-END FUNDS
AB Multi-Manager Alternative Fund
Alliance California Municipal Income Fund
AllianceBernstein Global High Income Fund
AllianceBernstein National Municipal Income Fund
We also offer Government Exchange Reserves, which serves as the money market fund exchange vehicle for the AB mutual funds. An investment in Government Exchange Reserves is not a deposit in a bank and is not insured or guaranteed by the Federal Deposit Insurance Corporation or any other government agency. Although the Fund seeks to preserve the value of your investment at $1.00 per share, it is possible to lose money by investing in the Fund.
Investors should consider the investment objectives, risks, charges and expenses of the Fund carefully before investing. For copies of our prospectus or summary prospectus, which contain this and other information, visit us online at www.abfunds.com or contact your AB representative. Please read the prospectus and/or summary prospectus carefully before investing.
* Prior to November 1, 2016, the Fund was named Global Thematic Growth Fund.
| 70 | • AB TAX-AWARE FIXED INCOME PORTFOLIO |
AB Family of Funds
NOTES
| AB TAX-AWARE FIXED INCOME PORTFOLIO • | 71 |
NOTES
| 72 | • AB TAX-AWARE FIXED INCOME PORTFOLIO |
NOTES
| AB TAX-AWARE FIXED INCOME PORTFOLIO • | 73 |
NOTES
| 74 | • AB TAX-AWARE FIXED INCOME PORTFOLIO |
NOTES
| AB TAX-AWARE FIXED INCOME PORTFOLIO • | 75 |
NOTES
| 76 | • AB TAX-AWARE FIXED INCOME PORTFOLIO |
AB TAX-AWARE FIXED INCOME PORTFOLIO
1345 Avenue of the Americas
New York, NY 10105
800.221.5672
TAFI-0151-1016 
| ITEM 2. | CODE OF ETHICS. |
(a) The registrant has adopted a code of ethics that applies to its principal executive officer, principal financial officer and principal accounting officer. A copy of the registrant’s code of ethics is filed herewith as Exhibit 12(a)(1).
(b) During the period covered by this report, no material amendments were made to the provisions of the code of ethics adopted in 2(a) above.
(c) During the period covered by this report, no implicit or explicit waivers to the provisions of the code of ethics adopted in 2(a) above were granted.
| ITEM 3. | AUDIT COMMITTEE FINANCIAL EXPERT. |
The registrant’s Board of Directors has determined that independent directors Garry L. Moody, William H. Foulk, Jr. and Marshall C. Turner, Jr. qualify as audit committee financial experts.
| ITEM 4. | PRINCIPAL ACCOUNTANT FEES AND SERVICES. |
(a) - (c) The following table sets forth the aggregate fees billed by the independent registered public accounting firm Ernst & Young LLP, for the Fund’s last two fiscal years for professional services rendered for: (i) the audit of the Fund’s annual financial statements included in the Fund’s annual report to stockholders; (ii) assurance and related services that are reasonably related to the performance of the audit of the Fund’s financial statements and are not reported under (i), which include advice and education related to accounting and auditing issues and quarterly press release review (for those Funds which issue press releases), and preferred stock maintenance testing (for those Funds that issue preferred stock); and (iii) tax compliance, tax advice and tax return preparation.
| Audit Fees | Audit-Related Fees | Tax Fees | ||||||||||||||
AB Intermediate Bond | 2015 | $ | 67,775 | $ | — | $ | 20,261 | |||||||||
| 2016 | $ | 75,281 | $ | 17 | $ | 18,753 | ||||||||||
AB Bond Inflation Strategy | 2015 | $ | 69,976 | $ | — | $ | 19,285 | |||||||||
| 2016 | $ | 86,472 | $ | 16 | $ | 18,359 | ||||||||||
AB Municipal Bond Inflation Strategy | 2015 | $ | 64,315 | $ | — | $ | 17,713 | |||||||||
| 2016 | $ | 66,207 | $ | 36 | $ | 18,042 | ||||||||||
AB All Market Real Return | 2015 | $ | 77,210 | $ | — | $ | 37,241 | |||||||||
| 2016 | $ | 79,481 | $ | 28 | $ | 38,778 | ||||||||||
AB Credit Long/Short | 2015 | $ | 87,576 | $ | — | $ | 25,575 | |||||||||
| 2016 | $ | 96,890 | $ | — | $ | 28,523 | ||||||||||
AB High Yield | 2015 | $ | 92,727 | $ | — | $ | 22,832 | |||||||||
| 2016 | * | $ | 114,070 | $ | — | $ | 30,973 | |||||||||
| 2016 | ** | $ | 96,960 | $ | 11,000 | $ | 32,648 | |||||||||
AB Tax Aware Fixed Income | 2015 | $ | 35,030 | $ | — | $ | 21,073 | |||||||||
| 2016 | $ | 36,060 | $ | — | $ | 23,493 | ||||||||||
AB Income*** | 2015 | $ | 106,065 | $ | 11,000 | $ | 28,216 | |||||||||
| 2016 | $ | 111,185 | $ | 3,165 | $ | 32,435 | ||||||||||
| * | For fiscal year end August 31, 2016 |
| ** | For fiscal year end October 31, 2016 |
| *** | Fiscal year 2015 ran from January 1, 2015 to December 31, 2015 and fiscal year 2016 from January 1, 2016 to October 31, 2016. |
(d) Not applicable.
(e) (1) Beginning with audit and non-audit service contracts entered into on or after May 6, 2003, the Fund’s Audit Committee policies and procedures require the pre-approval of all audit and non-audit services provided to the Fund by the Fund’s independent registered public accounting firm. The Fund’s Audit Committee policies and procedures also require pre-approval of all audit and non-audit services provided to the Adviser and Service Affiliates to the extent that these services are directly related to the operations or financial reporting of the Fund.
(e) (2) All of the amounts for Audit Fees, Audit-Related Fees and Tax Fees in the table under Item 4 (a) – (c) are for services pre-approved by the Fund’s Audit Committee.
(f) Not applicable.
(g) The following table sets forth the aggregate non-audit services provided to the Fund, the Fund’s Adviser and entities that control, are controlled by or under common control with the Adviser that provide ongoing services to the Fund:
| All Fees for Non-Audit Services Provided to the Portfolio, the Adviser and Service Affiliates | Total Amount of Foregoing Column Pre- approved by the Audit Committee (Portion Comprised of Audit Related Fees) (Portion Comprised of Tax Fees) | |||||||||||
AB Intermediate Bond | 2015 | $ | 438,336 | $ | 20,261 | |||||||
| $ | — | |||||||||||
| $ | (20,261 | ) | ||||||||||
| 2016 | $ | 454,590 | $ | 18,770 | ||||||||
| $ | (17 | ) | ||||||||||
| $ | (18,753 | ) | ||||||||||
AB Bond Inflation Strategy | 2015 | $ | 437,360 | $ | 19,285 | |||||||
| $ | — | |||||||||||
| $ | (19,285 | ) | ||||||||||
| 2016 | $ | 454,195 | $ | 18,375 | ||||||||
| $ | (16 | ) | ||||||||||
| $ | (18,359 | ) | ||||||||||
AB Municipal Bond Inflation Strategy | 2015 | $ | 435,788 | $ | 17,713 | |||||||
| $ | — | |||||||||||
| $ | (17,713 | ) | ||||||||||
| 2016 | $ | 453,898 | $ | 18,078 | ||||||||
| $ | (36 | ) | ||||||||||
| $ | (18,042 | ) | ||||||||||
AB All Market Real Return | 2015 | $ | 455,316 | $ | 37,241 | |||||||
| $ | — | |||||||||||
| $ | (37,241 | ) | ||||||||||
| 2016 | $ | 474,626 | $ | 38,806 | ||||||||
| $ | (28 | ) | ||||||||||
| $ | (38,778 | ) | ||||||||||
AB Credit Long/Short | 2015 | $ | 443,650 | $ | 25,575 | |||||||
| $ | — | |||||||||||
| $ | (25,575 | ) | ||||||||||
| 2016 | $ | 464,343 | $ | 28,523 | ||||||||
| $ | — | |||||||||||
| $ | (28,523 | ) | ||||||||||
AB High Yield | 2015 | $ | 440,907 | $ | 22,832 | |||||||
| $ | — | |||||||||||
| $ | (22,832 | ) | ||||||||||
| 2016 | * | $ | 288,518 | $ | 30,973 | |||||||
| $ | — | |||||||||||
| $ | (30,973 | ) | ||||||||||
| 2016 | ** | $ | 479,468 | $ | 43,648 | |||||||
| $ | (11,000 | ) | ||||||||||
| $ | (32,648 | ) | ||||||||||
AB Tax Aware Fixed Income | 2015 | $ | 439,148 | $ | 21,073 | |||||||
| $ | — | |||||||||||
| $ | (21,073 | ) | ||||||||||
| 2016 | $ | 459,313 | $ | 23,493 | ||||||||
| $ | — | |||||||||||
| $ | (23,493 | ) | ||||||||||
AB Income*** | 2015 | $ | 454,461 | $ | 39,216 | |||||||
| $ | (11,000 | ) | ||||||||||
| $ | (28,216 | ) | ||||||||||
| 2016 | $ | 471,420 | $ | 35,600 | ||||||||
| $ | (3,165 | ) | ||||||||||
| $ | (32,435 | ) | ||||||||||
| * | For fiscal year end August 31, 2016 |
| ** | For fiscal year end October 31, 2016 |
| *** | Fiscal year 2015 ran from January 1, 2015 to December 31, 2015 and fiscal year 2016 is from January 1, 2016 to October 31, 2016. |
(h) The Audit Committee of the Fund has considered whether the provision of any non-audit services not pre-approved by the Audit Committee provided by the Fund’s independent registered public accounting firm to the Adviser and Service Affiliates is compatible with maintaining the auditor’s independence.
| ITEM 5. | AUDIT COMMITTEE OF LISTED REGISTRANTS. |
Not applicable to the registrant.
| ITEM 6. | SCHEDULE OF INVESTMENTS. |
Please see Schedule of Investments contained in the Report to Shareholders included under Item 1 of this Form N-CSR.
ITEM 7. DISCLOSURE OF PROXY VOTING POLICIES AND PROCEDURES FOR CLOSED-END MANAGEMENT INVESTMENT COMPANIES.
Not applicable to the registrant.
ITEM 8. PORTFOLIO MANAGERS OF CLOSED-END MANAGEMENT INVESTMENT COMPANIES.
Not applicable to the registrant.
ITEM 9. PURCHASES OF EQUITY SECURITIES BY CLOSED-END MANAGEMENT INVESTMENT COMPANY AND AFFILIATED PURCHASERS.
Not applicable to the registrant.
ITEM 10. SUBMISSION OF MATTERS TO A VOTE OF SECURITY HOLDERS.
There have been no material changes to the procedures by which shareholders may recommend nominees to the Fund’s Board of Directors since the Fund last provided disclosure in response to this item.
| ITEM 11. | CONTROLS AND PROCEDURES. |
(a) The registrant’s principal executive officer and principal financial officer have concluded that the registrant’s disclosure controls and procedures (as defined in Rule 30a-3 (c) under the Investment Company Act of 1940, as amended) are effective at the reasonable assurance level based on their evaluation of these controls and procedures as of a date within 90 days of the filing date of this document.
(b) There were no changes in the registrant’s internal controls over financial reporting that occurred during the second fiscal quarter of the period that has materially affected, or is reasonably likely to materially affect, the registrant’s internal control over financial reporting.
ITEM 12. EXHIBITS.
The following exhibits are attached to this Form N-CSR:
EXHIBIT | DESCRIPTION OF EXHIBIT | |
| 12 (a) (1) | Code of Ethics that is subject to the disclosure of Item 2 hereof | |
| 12 (b) (1) | Certification of Principal Executive Officer Pursuant to Section 302 of the Sarbanes-Oxley Act of 2002 | |
| 12 (b) (2) | Certification of Principal Financial Officer Pursuant to Section 302 of the Sarbanes-Oxley Act of 2002 | |
| 12 (c) | Certification of Principal Executive Officer and Principal Financial Officer Pursuant to Section 906 of the Sarbanes-Oxley Act of 2002 | |
SIGNATURES
Pursuant to the requirements of the Securities Exchange Act of 1934 and the Investment Company Act of 1940, the registrant has duly caused this report to be signed on its behalf by the undersigned, thereunto duly authorized.
(Registrant): AB Bond Fund, Inc.
| By: | /s/ Robert M. Keith | |
| Robert M. Keith | ||
| President | ||
| Date: | December 30, 2016 | |
Pursuant to the requirements of the Securities Exchange Act of 1934 and the Investment Company Act of 1940, this report has been signed below by the following persons on behalf of the registrant and in the capacities and on the dates indicated.
| By: | /s/ Robert M. Keith | |
| Robert M. Keith | ||
| President | ||
| Date: | December 30, 2016 | |
| By: | /s/ Joseph J. Mantineo | |
| Joseph J. Mantineo | ||
| Treasurer and Chief Financial Officer | ||
| Date: | December 30, 2016 | |